Attached files
| file | filename |
|---|---|
| 8-K - 8-K - Professional Holding Corp. | tmb-20210505x8k.htm |
| EX-99.3 - EX-99.3 - Professional Holding Corp. | tmb-20210505xex99d3.htm |
| EX-99.1 - EX-99.1 - Professional Holding Corp. | tmb-20210505xex99d1.htm |
Exhibit 99.2
| EARNINGS PRESENTATION FIRST QUARTER 2021 NASDAQ:PFHD FOURTH QUARTER 2020 EARNINGS PRESENTATION PAGE 1 |

| FORWARD LOOKING STATEMENTS 8 This communication contains forward-looking statements within the meaning of the Private Securities Litigation Reform Act of 1995. Any statements contained in this presentation that are not statements of historical fact may be deemed to be forward-looking statements, including, without limitation, statements preceded by, followed by or including words such as “anticipate,” “intend,” “believe,”“estimate,” “plan,” “seek,”“project” or “expect,”“may,”“will,”“would,” “could” or “should” expressions.Forward-looking statements represent the Company’scurrent expectations,plansor forecasts significant risks and uncertainties. Several important factors could cause actual results to differ materially f rom and similar and involve those in the forward-looking statements. Those factors include, without limitation, current and future economic and market conditions, including those that could impact credit quality and the ability to generate loans and gather deposits; the duration, extent and impact of the COVID-19 pandemic, including the governments’ responses to the pandemic, on our and our customers’ operations, personnel, and business activity (including developments and volatility), as well as COVID-19’s impact on the credit quality of our loan portfolio and financial markets and general economic conditions; the effects of our lack of a diversified loan portfolio and concentration in the South Florida market; the impact of current and future interest rates and expectations concerning the actual timing and amount of interest rate movements; competition; our ability to execute business plans; geopolitical developments; legislative and regulatory developments; inflation or deflation; market fluctuations; natural disasters (including pandemics such as COVID-19); potential business uncertainties related to the integration of Marquis Bancorp (MBI), including into our operations critical accounting estimates; and other factors described in our Form 10-K for the year ended December 31, 2020 and other filings with the Securities and Exchange Commission. The Company disclaims any obligation to update any of the forward-looking statements included herein to reflect future events or developments or changes in expectations, except as may be required by law. FIRST QUARTER 2021 EARNINGS PRESENTATION PAGE 2 |
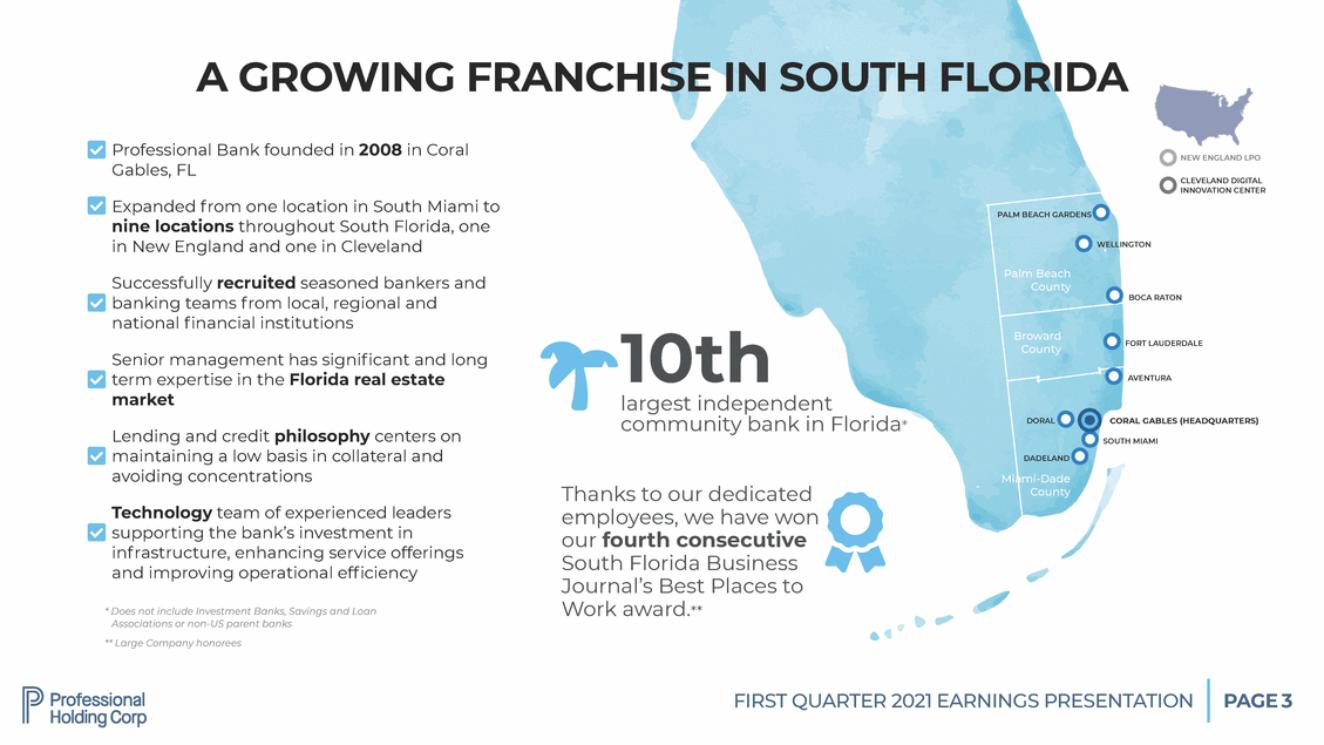
| A GROWING FRANCHISE IN SOUTH FLORIDA m Professional Bank founded in 2008 in Coral Gables, FL NEW ENGLAND LPO CLEVELAND DIGITAL INNOVATION CENTER m Expanded f rom one location in South Miami to PALM BEACH GARDENS nine locations throughout South Florida, one in New England and one in Cleveland WELLINGTON Palm Beach County Successfully recruited seasoned bankers banking teams f rom local, regional and national financial institutions and m BOCA RATON 'r10th Broward County FORT LAUDERDALE Senior management has significant and long term expertise in the Florida real estate market m AVENTURA largest independent community bank in Florida* DORAL CORAL GABLES (HEADQUARTERS) Lending and credit philosophy centers on SOUTH MIAMI m maintaining a low basis in avoiding concentrations collateral and DADELAND Miami-Dade County Thanks to our dedicated employees, we have won our fourth consecutive South Florida Business Journal’s Best Places to Work award.** Technology team of experienced leaders m supporting the bank’s investment in inf rastructure, enhancing service offerings and improving operational eff iciency * Does not include Investment Banks, Savings and Loan Associations or non-US parent banks ** Large Company honorees FIRST QUARTER 2021 EARNINGS PRESENTATION PAGE 3 |
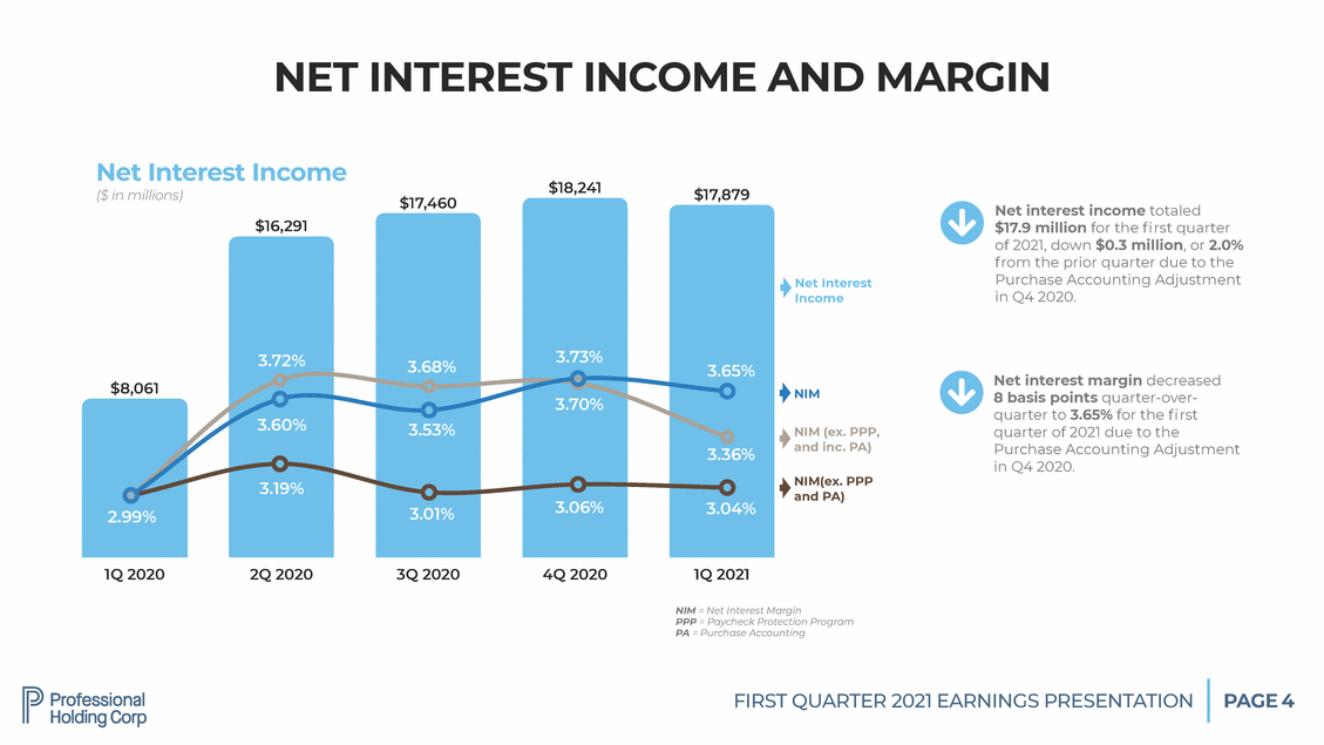
| NET INTEREST INCOME AND MARGIN Net Interest ($ in millions) Income $18,241 $17,879 $17,460 0 Net interest income totaled $17.9 million for the fi rst quarter of 2021, down $0.3 million, or 2.0% f rom the prior quarter due to the Purchase Accounting Adjustment in Q4 2020. $16,291 Net Interest Income 0 Net interest margin decreased 8 basis points quarter-over-quarter to 3.65% for the fi rst quarter of 2021 due to the Purchase Accounting Adjustment in Q4 2020. $8,061 NIM NIM (ex. PPP, and inc. PA) NIM(ex. PPP and PA) 1Q 2020 2Q 2020 3Q 2020 4Q 2020 1Q 2021 NIM = Net Interest Margin PPP = Paycheck Protection Program PA = Purchase Accounting FIRST QUARTER 2021 EARNINGS PRESENTATION PAGE 4 2.99% 3.72% 3.60% 3.19% 3.68% 3.53% 3.01% 3.65% 3.36% 3.04% 3.73% 3.70% 3.06% |
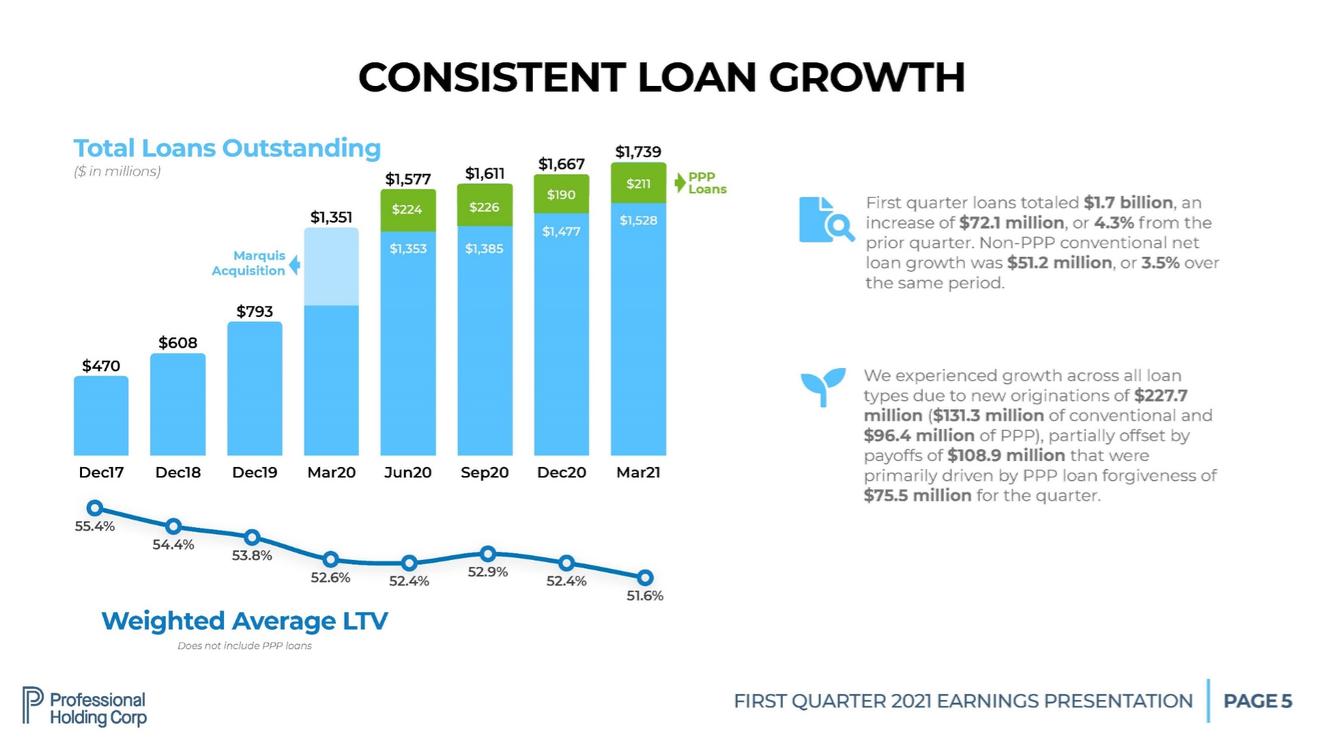
| CONSISTENT LOAN GROWTH Total Loans ($ in millions) Outstanding $1,739 $1,667 $1,611 PPP Loans $1,577 First quarter loans totaled $1.7 billion, an increase of $72.1 million, or 4.3% f rom the prior quarter. Non-PPP conventional net loan growth was $51.2 million, or 3.5% over the same period. I $1,351 Marquis Acquisition $793 $608 $470 * We experienced growth across all loan types due to new originations of $227.7 million ($131.3 million of conventional and $96.4 million of PPP), partially offset by payoffs of $108.9 million that were Dec17 Dec18 Dec19 Mar20 Jun20 Sep20 Dec20 Mar21 primarily driven by PPP loan forgiveness $75.5 million for the quarter. of 55.4% 54.4% 53.8% 52.9% 52.6% 52.4% 52.4% 51.6% Weighted Average LTV Does not include PPP loans FIRST QUARTER 2021 EARNINGS PRESENTATION PAGE 5 $224 $1,353 $226 $1,385 $190 $1,477 $211 $1,528 |
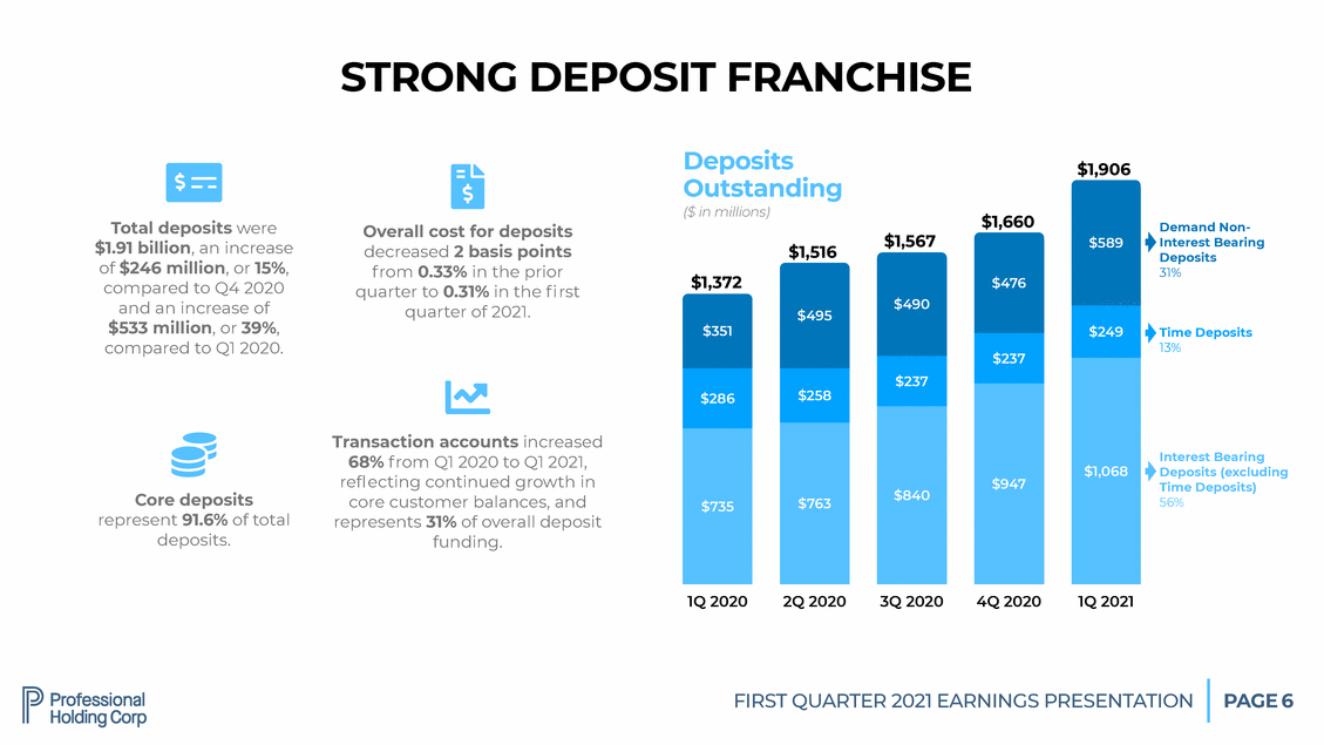
| STRONG DEPOSIT FRANCHISE Deposits Outstanding ($ in millions) lli Total deposits were $1.91 billion, an increase of $246 million, or 15%, compared to Q4 2020 and an increase of $533 million, or 39%, $1,906 $1,660 Demand Non-Interest Bearing Deposits 31% Overall cost for deposits $1,567 decreased 2 basis points f rom 0.33% in the prior $1,516 $1,372 quarter to 0.31% in the fi rst quarter of 2021. Time Deposits 13% compared to Q1 2020. � Transaction accounts increased 68% f rom Q1 2020 to Q1 2021, refl ecting continued growth in core customer balances, and represents 31% of overall deposit funding. � Core deposits represent 91.6% of total deposits. Interest Bearing Deposits (excluding Time Deposits) 56% 1Q 2020 2Q 2020 3Q 2020 4Q 2020 1Q 2021 FIRST QUARTER 2021 EARNINGS PRESENTATION PAGE 6 $351 $286 $735 $495 $258 $763 $490 $237 $840 $476 $237 $947 $589 $249 $1,068 |
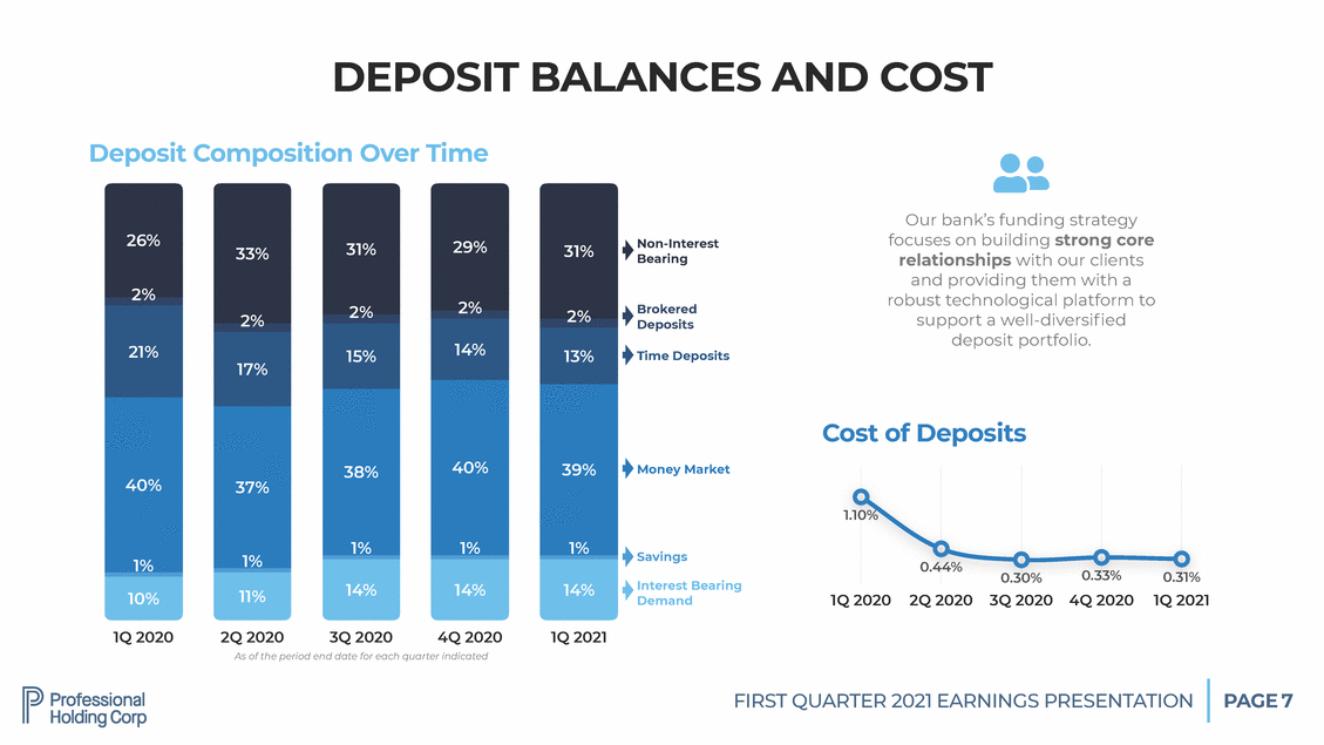
| DEPOSIT BALANCES AND COST Deposit Composition Over Time - Our bank’s funding strategy focuses on building strong core relationships with our clients and providing them with a Non-Interest Bearing robust technological platform support a well-diversified deposit portfolio. to Brokered Deposits Time Deposits Cost of Deposits Money Market 1.10% Savings 0.44% 0.33% 0.31% 0.30% Interest Bearing Demand 1Q 2020 2Q 2020 3Q 2020 4Q 2020 1Q 2021 1Q 2020 2Q 2020 3Q 2020 4Q 2020 1Q 2021 As of the period end date for each quarter indicated FIRST QUARTER 2021 EARNINGS PRESENTATION PAGE 7 10% 11% 14% 14% 14% 33% 17% 37% 1% 31% 13% 39% 1% 29% 14% 40% 1% 31% 15% 38% 1% 26% 21% 40% 1% |
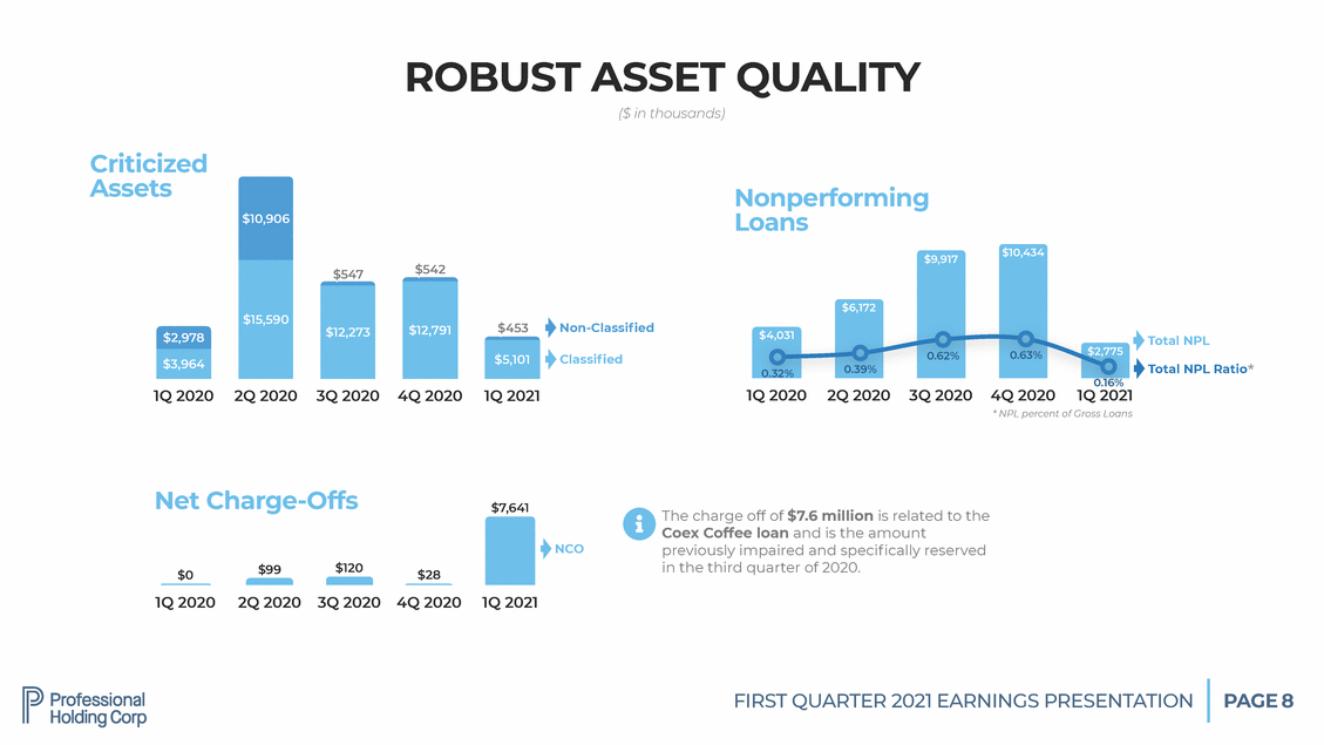
| ROBUST ASSET ($ in thousands) QUALITY Criticized Assets Nonperforming Loans $542 $547 $453 Non-Classified $4,031 Total NPL $2,775 Classified Total NPL Ratio* 0.32% 0.16% 1Q 2020 2Q 2020 3Q 2020 4Q 2020 1Q 2021 1Q 2020 2Q 2020 3Q 2020 4Q 2020 1Q 2021 * NPL percent of Gross Loans Net Charge-Offs $7,641 8 The charge off of $7.6 million is related to the Coex Coffee loan and is the amount previously impaired and specifically reserved in the third quarter of 2020. NCO $120 $99 $0 $28 1Q 2020 2Q 2020 3Q 2020 4Q 2020 1Q 2021 FIRST QUARTER 2021 EARNINGS PRESENTATION PAGE 8 $5,101 $2,978 $3,964 $6,172 0.39% $12,273 $12,791 $9,917 0.62% $10,434 0.63% $10,906 $15,590 |
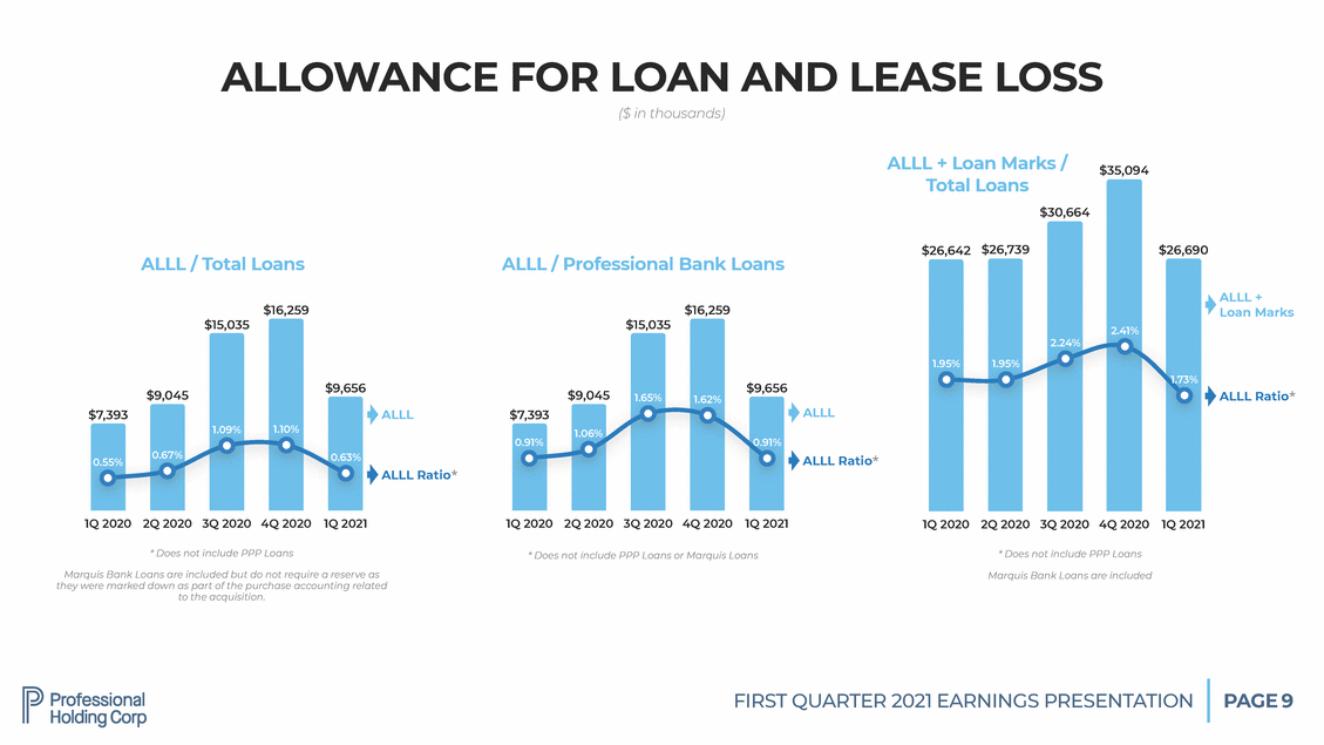
| ALLOWANCE FOR LOAN ($ in thousands) AND LEASE LOSS ALLL + Loan Marks / $35,094 Total Loans $30,664 $26,739 $26,642 $26,690 ALLL / Total Loans ALLL / Professional Bank Loans ALLL + Loan Marks $16,259 $16,259 $15,035 $15,035 $9,656 $9,656 $9,045 $9,045 ALLL Ratio* ALLL $7,393 ALLL $7,393 ALLL Ratio* ALLL Ratio* 1Q 2020 2Q 2020 3Q 2020 4Q 2020 1Q 2021 1Q 2020 2Q 2020 3Q 2020 4Q 2020 1Q 2021 1Q 2020 2Q 2020 3Q 2020 4Q 2020 1Q 2021 * Does not include PPP Loans * Does not include PPP Loans * Does not include PPP Loans or Marquis Loans Marquis Bank Loans are included but do not require a reserve as they were marked down as part of the purchase accounting related to the acquisition. Marquis Bank Loans are included FIRST QUARTER 2021 EARNINGS PRESENTATION PAGE 9 0.91% 0.55% 1.06% 0.67% 0.91% 0.63% 1.65% 1.09% 1.62% 1.10% 1.73% 1.95% 1.95% 2.24% 2.41% |
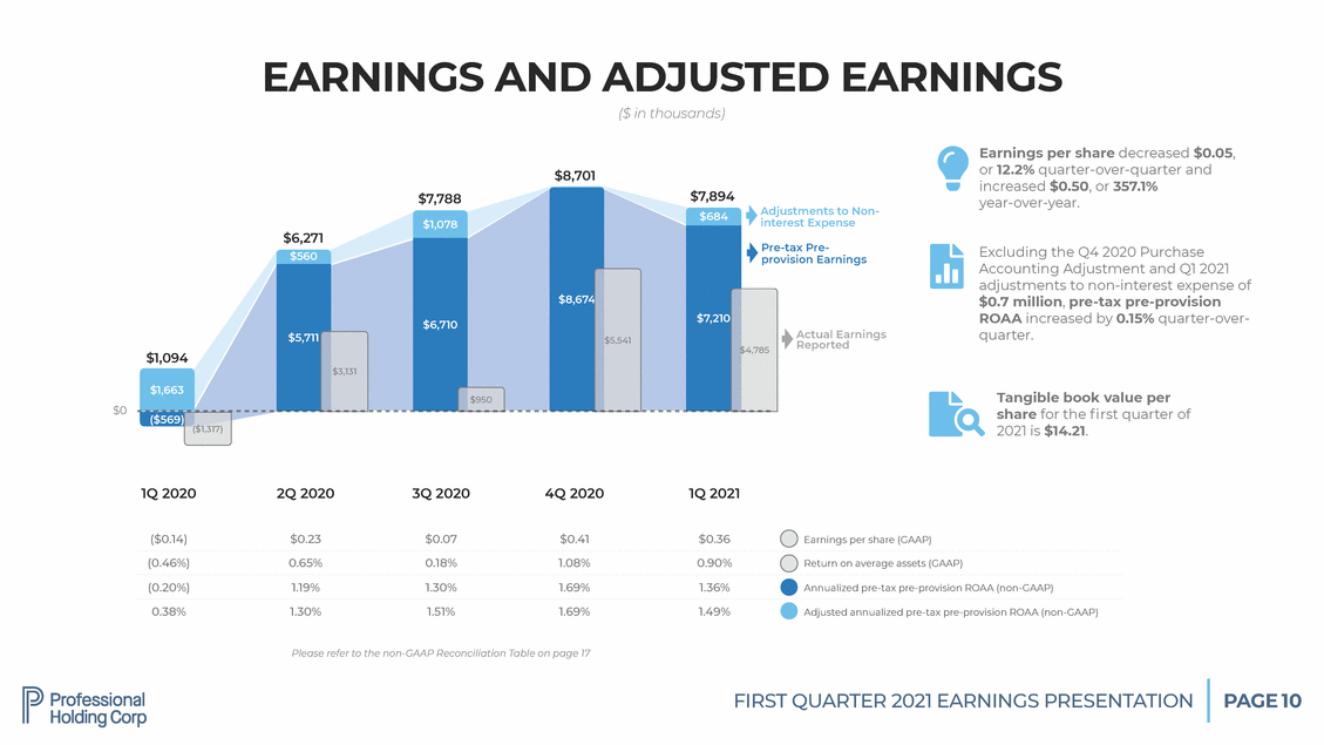
| EARNINGS AND ADJUSTED ($ in thousands) EARNINGS ! Earnings per share decreased $0.05, or 12.2% quarter-over-quarter and increased $0.50, or 357.1% year-over-year. $8,701 djustments to Non-erest Expense e-tax Pre-ovision Earnings r8 Excluding the Q4 2020 Purchase Accounting Adjustment and Q1 2021 adjustments to non-interest expense of $0.7 million, pre-tax pre-provision ROAA increased by 0.15% quarter-over-quarter. Actual Earnings Reported $4,785 Tangible book value per share for the fi rst quarter of 2021 is $14.21. I $0 ($1,317) Please refer to the non-GAAP Reconciliation Table on page 17 FIRST QUARTER 2021 EARNINGS PRESENTATION PAGE 10 1Q 2020 2Q 2020 3Q 2020 4Q 2020 1Q 2021 ($0.14) $0.23 $0.07 $0.41 $0.36 Earnings per share (GAAP) (0.46%) 0.65% 0.18% 1.08% 0.90% Return on average assets (GAAP) (0.20%) 1.19% 1.30% 1.69% 1.36% Annualized pre-tax pre-provision ROAA (non-GAAP) 0.38% 1.30% 1.51% 1.69% 1.49% Adjusted annualized pre-tax pre-provision ROAA (non-GAAP) $7,788 $7,894 $684 A int Pr pr $6,271 $1,078 $6,710 $1,094 $560 $8,674 $5,541 $7,210 $5,711 $3,131 $1,663 $950 ($569) |
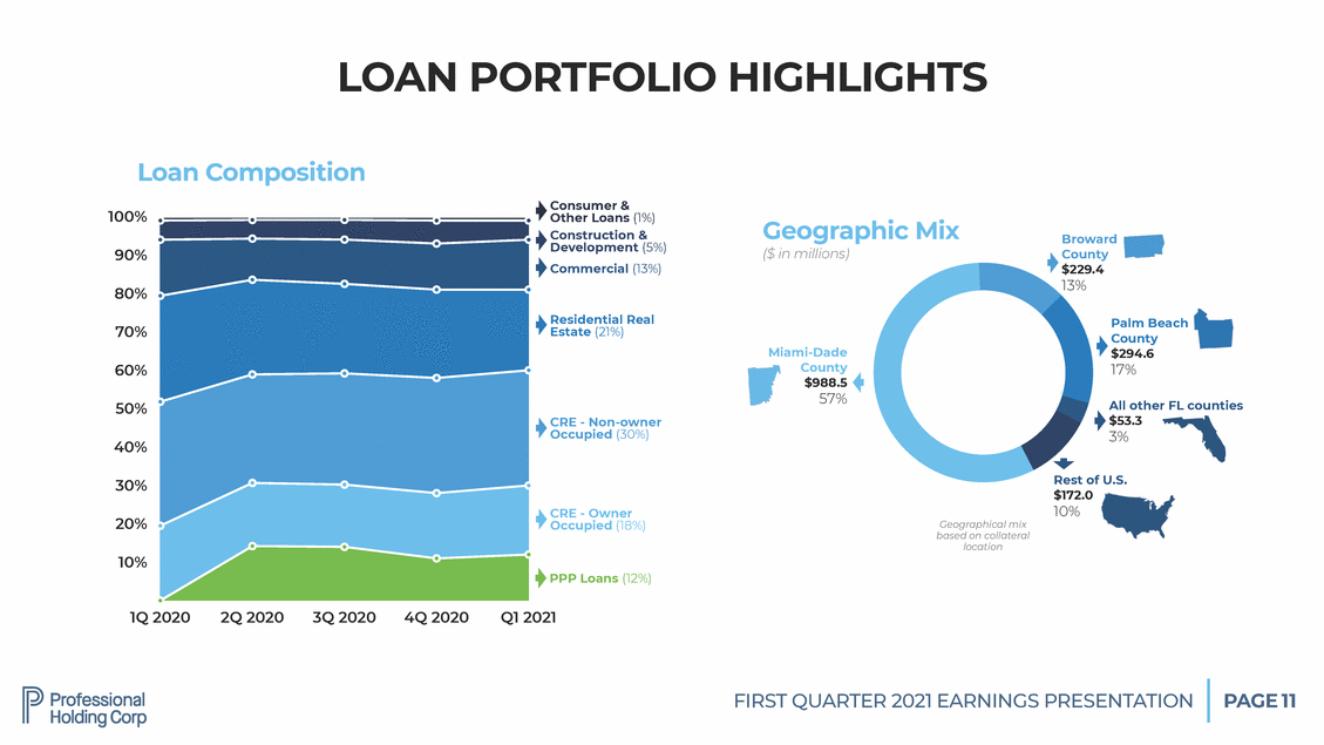
| LOAN PORTFOLIO HIGHLIGHTS Loan Composition Consumer & Other Loans (1%) 100% Geographic ($ in millions) Mix Construction & Development (5%) Commercial (13%) Broward County 90% .4 80% Residential Real Estate (21%) Palm Beach County $294.6 17% 70% Miami-Dade County $988.5 57% 60% All other FL counties $53.3 3% 50% CRE - Non-owner Occupied (30%) 40% Rest of U.S. 30% $172.0 10% CRE - Owner Occupied (18%) 20% Geographical mix based on collateral location 10% PPP Loans (12%) 1Q 2020 2Q 2020 3Q 2020 4Q 2020 Q1 2021 FIRST QUARTER 2021 EARNINGS PRESENTATION PAGE 11 $229 13% |
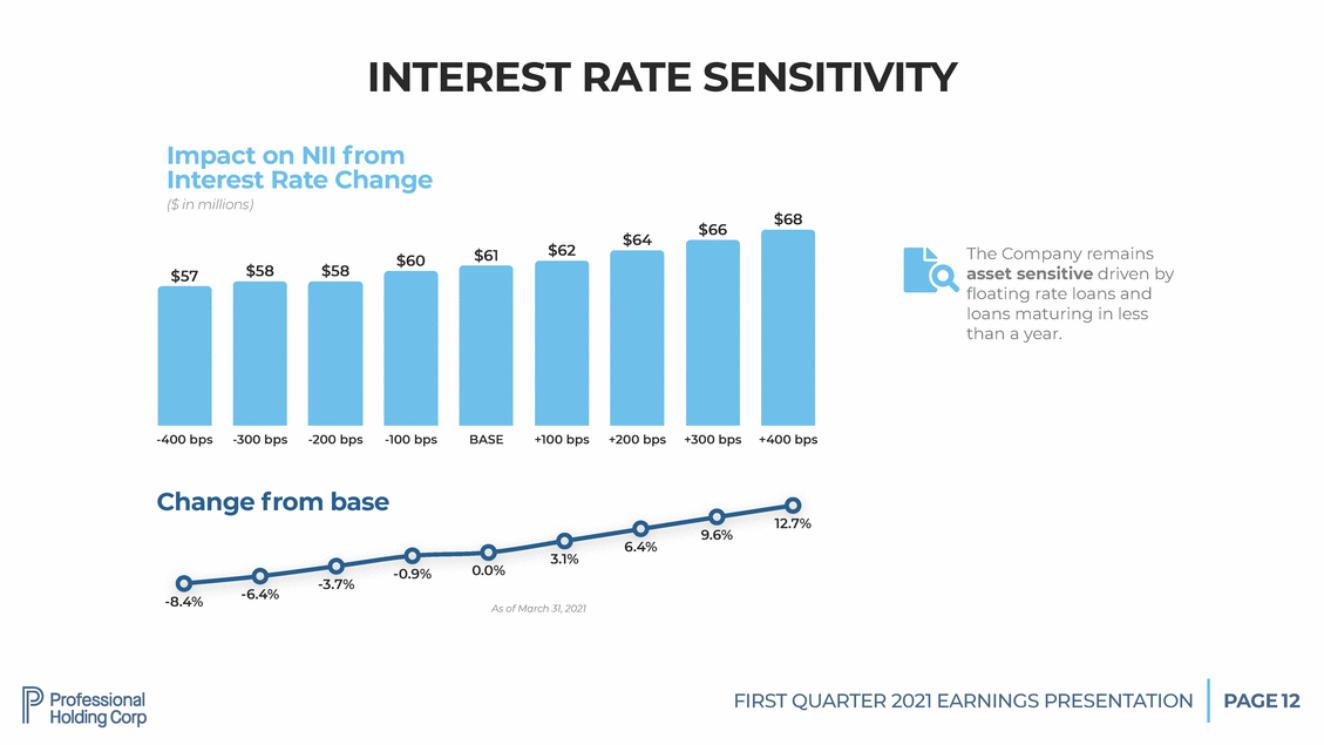
| INTEREST RATE SENSITIVITY Impact on NII from Interest Rate Change ($ in millions) $68 $66 $64 $62 The Company remains asset sensitive driven by floating rate loans and I $61 $60 $58 $58 $57 loans maturing in less than a year. -400 bps -300 bps -200 bps -100 bps BASE +100 bps +200 bps +300 bps +400 bps Change from base 12.7% 9.6% 6.4% 3.1% 0.0% -0.9% -3.7% -6.4% -8.4% As of March 31, 2021 FIRST QUARTER 2021 EARNINGS PRESENTATION PAGE 12 |
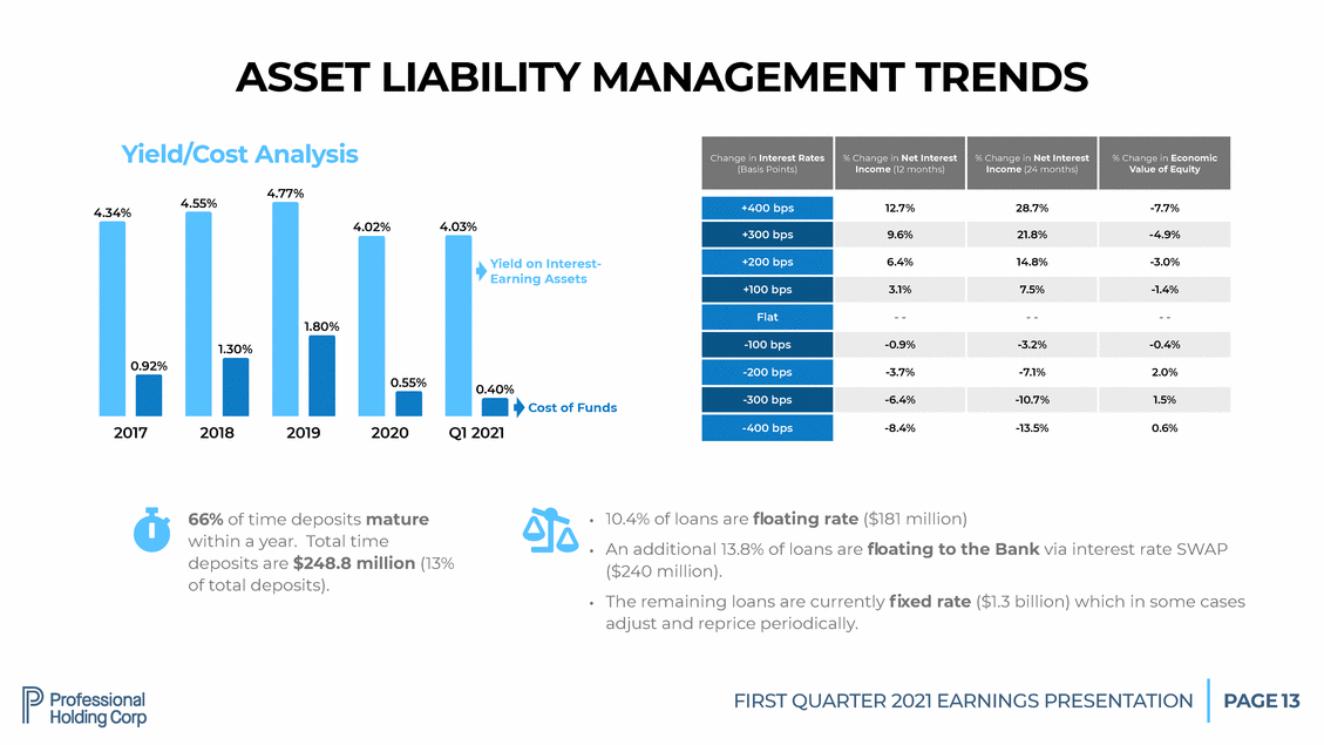
| ASSET LIABILITY MANAGEMENT TRENDS Yield/Cost Analysis 4.77% 4.55% -7.7% 4.34% 4.02% 4.03% Yield on Interest-Earning Assets 1.80% 1.30% 0.92% 0.55% 0.40% Cost of Funds 2017 2018 2019 2020 Q1 2021 G � • • 66% of time deposits mature 10.4% of loans are floating rate ($181 million) within a year.Total time deposits are $248.8 million (13% of total deposits). An additional 13.8% of loans are floating to the Bank via interest ($240 million). rate SWAP • The remaining loans are currently fixed rate ($1.3 billion) which in some cases adjust and reprice periodically. FIRST QUARTER 2021 EARNINGS PRESENTATION PAGE 13 +400 bps 12.7% 28.7% +300 bps 9.6% 21.8% -4.9% +200 bps 6.4% 14.8% -3.0% +100 bps 3.1% 7.5% -1.4% Flat - - - - - - -100 bps -0.9% -3.2% -0.4% -200 bps -3.7% -7.1% 2.0% -300 bps -6.4% -10.7% 1.5% -400 bps -8.4% -13.5% 0.6% Change in Interest Rates (Basis Points) % Change in Net Interest Income (12 months) % Change in Net Interest Income (24 months) % Change in Economic Value of Equity |
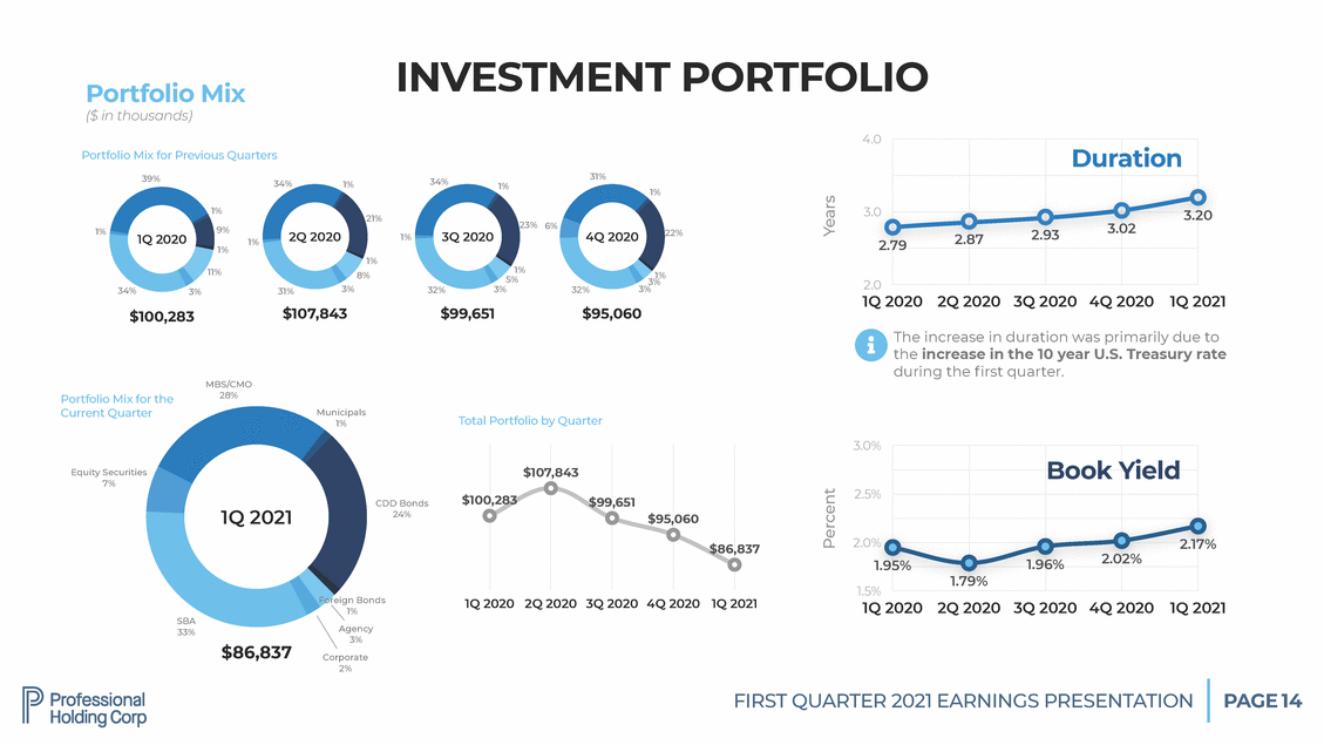
| INVESTMENT PORTFOLIO Portfolio Mix ($ in thousands) 4.0 ation Portfolio Mix for Previous Quarters 3.0 20 3.02 2.93 87 2.79 2.0 3% 32% 1Q 2020 2Q 2020 3Q 2020 4Q 2020 1Q 2021 99,651 $95,060 8 The increase in duration was primarily due to the increase in the 10 year U.S. Treasury rate during the first quarter. Total Portfolio by Quarter 3.0% Book Yield 2.5% $100,283 $99,651 060 2.0% 2.17% $86,837 2.02% 1.96% 1.95% 79% 1.5% 20 1Q 2021 1Q 2020 2Q 2020 3Q 2020 4Q 2020 1Q 2021 Agency 33% FIRST QUARTER 2021 EARNINGS PRESENTATION PAGE 14 Percent Years 1. 39% 1% 1%1Q 2020 9% 1% 11% 34% 3% 34% 1% 21% 2Q 2020 1% 8% 31%3% 1% 34% 1% 23% 1%3Q 2020 1% 5% 32% 3% 31% 1% 6% 4Q 2020 22% 1% 3% $100,283 $107,843 $ MBS/CMO Portfolio Mix for the 28% Current QuarterMunicipals 1% Equity Securities 7% CDD Bonds 1Q 202124% Foreign Bonds 1% SBA 3% $86,837 Corporate 2% $107,843 $95, 1Q 2020 2Q 2020 3Q 2020 4Q 20 Dur 2. 3. |
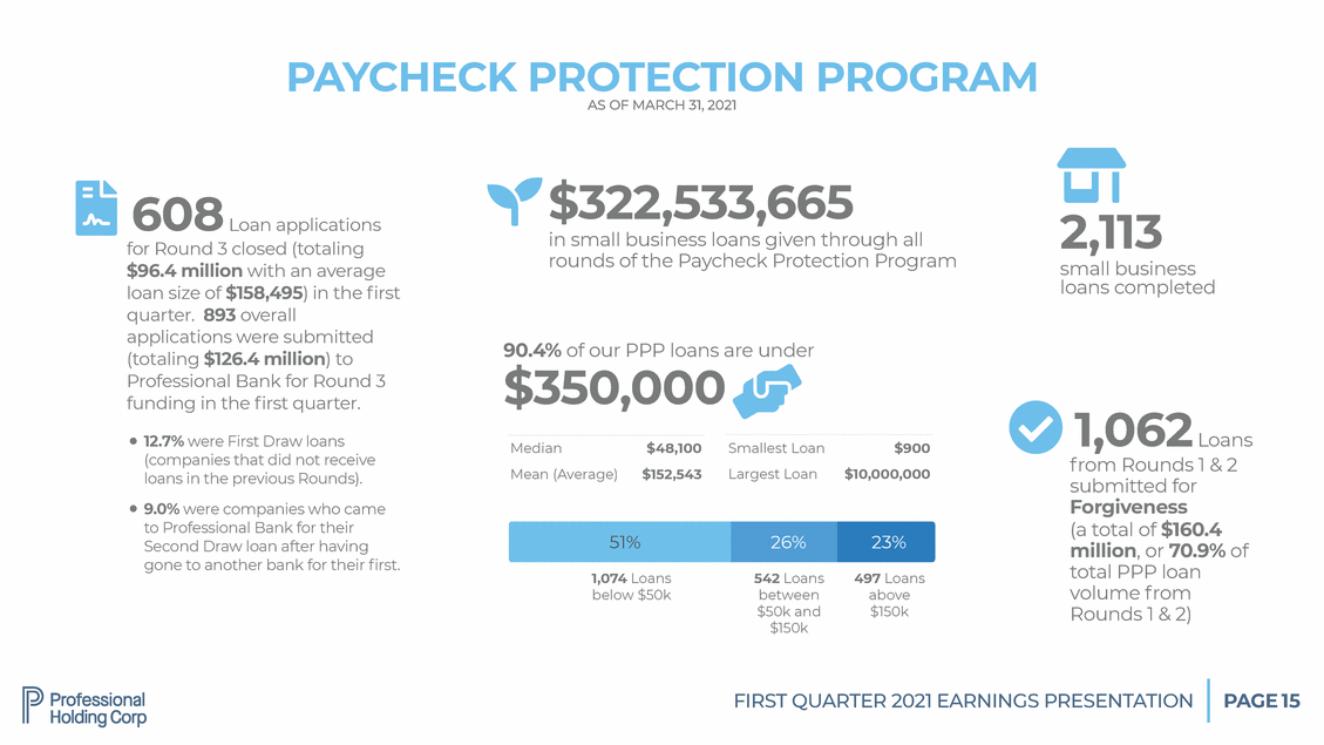
| PAYCHECK PROTECTION AS OF MARCH 31, 2021 PROGRAM 'Ct 2,113 * 1! $322,533,665 in small business loans given through all 608 Loan applications for Round 3 closed (totaling $96.4 million with an average loan size of $158,495) in the first quarter. 893 overall applications were submitted (totaling $126.4 million) to Professional Bank for Round 3 funding in the first quarter. rounds of the Paycheck Protection Program small business loans completed 90.4% of our PPP loans are under ., $350,000 � 1,062 Loans from Rounds 1 & 2 submitted for Forgiveness (a total of $160.4 million, or 70.9% of total PPP loan volume from Rounds 1 & 2) • 12.7% were First Draw loans Median Mean (Average) $48,100 $152,543 Smallest Loan Largest Loan $900 $10,000,000 (companies that did not receive loans in the previous Rounds). • 9.0% were companies who came to Professional Bank for their Second Draw loan after having gone to another bank for their first. 1,074 Loans below $50k 542 Loans between $50k and $150k 497 Loans above $150k FIRST QUARTER 2021 EARNINGS PRESENTATION PAGE 15 51% 26% 23% |
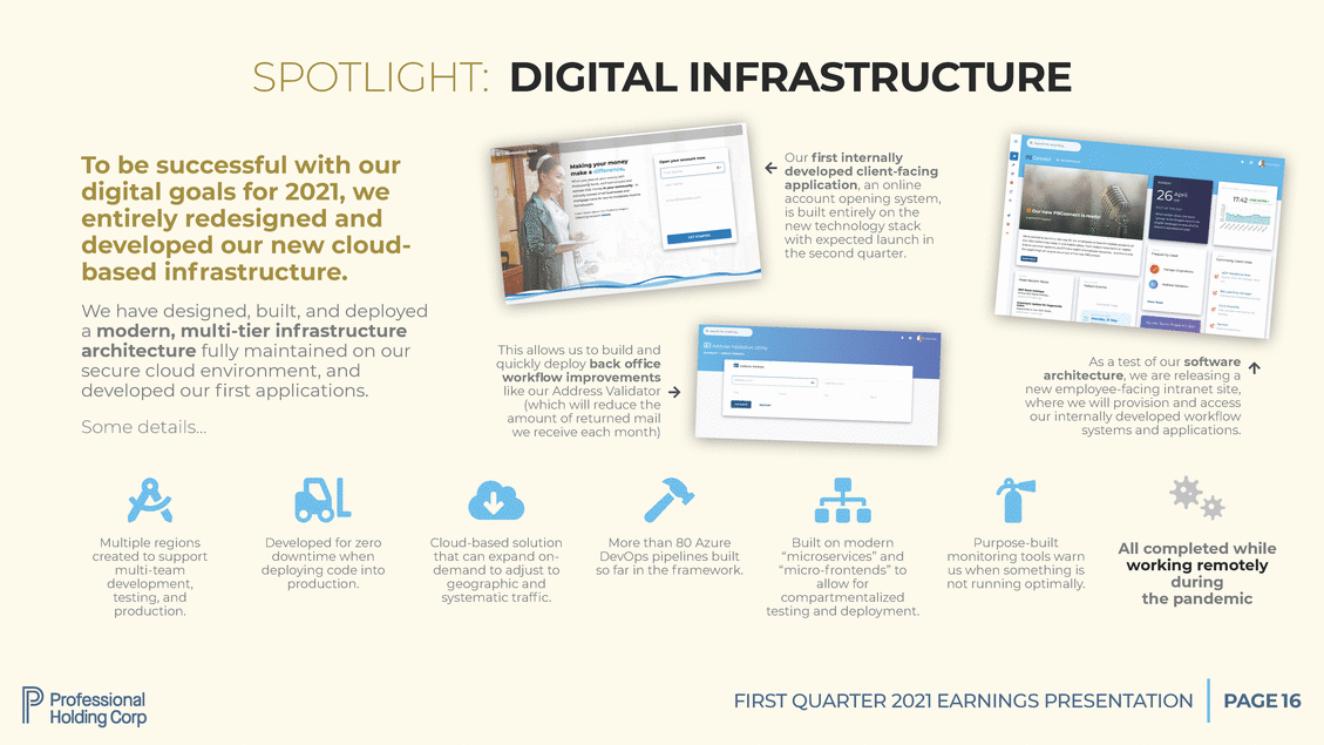
| SPOTLIGHT: DIGITAL INFRASTRUCTURE Our first internally developed client-facing application, an online account opening system, is built entirely on the new technology stack with expected launch in the second quarter. To be successful with our digital goals for 2021, we entirely redesigned and developed our new cloud-based inf rastructure. We have designed, built, and deployed a modern, multi-tier inf rastructure architecture fully maintained on secure cloud environment, and our This allows us to build and quickly deploy back office workflow improvements like our Address Validator (which will reduce the amount of returned mail we receive each month) As a test of our software architecture, we are releasing a new employee-facing intranet site, where we will provision and access our internally developed workflow systems and applications. developed our Some details… first applications. � 略 All completed while working remotely during the pandemic Multiple regions created to support multi-team development, testing, and production. Developed for zero downtime when deploying code into production. Cloud-based solution that can expand on-demand to adjust to geographic and systematic traffic. More than 80 Azure DevOps pipelines built so far in the f ramework. Built on modern “microservices” and “micro-f rontends” to allow for compartmentalized testing and deployment. Purpose-built monitoring tools warn us when something is not running optimally. FIRST QUARTER 2021 EARNINGS PRESENTATION PAGE 16 |
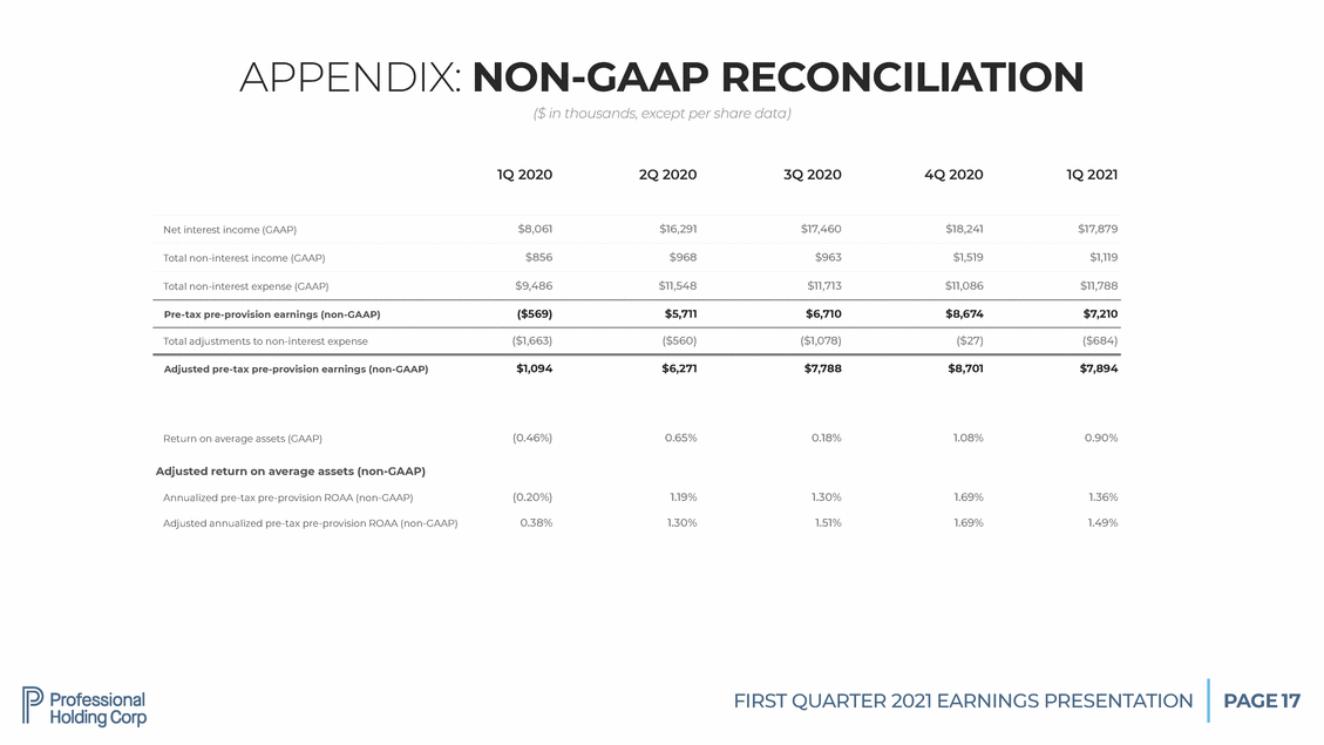
| APPENDIX: NON-GAAP RECONCILIATION ($ in thousands, except per share data) FIRST QUARTER 2021 EARNINGS PRESENTATION PAGE 17 1Q 2020 2Q 2020 3Q 2020 4Q 2020 1Q 2021 Net interest income (GAAP) $8,061 $16,291 $17,460 $18,241 $17,879 Total non-interest income (GAAP) $856 $968 $963 $1,519 $1,119 Total non-interest expense (GAAP) $9,486 $11,548 $11,713 $11,086 $11,788 Pre-tax pre-provision earnings (non-GAAP)($569) $5,711 $6,710 $8,674 $7,210 Total adjustments to non-interest expense($1,663) ($560) ($1,078) ($27) ($684) Adjusted pre-tax pre-provision earnings (non-GAAP)$1,094 $6,271 $7,788 $8,701 $7,894 Return on average assets (GAAP) (0.46%) 0.65% 0.18% 1.08% 0.90% Adjusted return on average assets (non-GAAP) Annualized pre-tax pre-provision ROAA (non-GAAP) (0.20%) Adjusted annualized pre-tax pre-provision ROAA (non-GAAP) 0.38% 1.19% 1.30% 1.30% 1.51% 1.69% 1.69% 1.36% 1.49% |