Attached files
| file | filename |
|---|---|
| 8-K - 8-K - Kraton Corp | kra-20210429.htm |

April 29, 2021 Kraton Corporation First Quarter 2021 Earnings Presentation

Kraton First Quarter 2021 Earnings Call 2 Disclaimers CAUTIONARY STATEMENT REGARDING FORWARD-LOOKING INFORMATION Some of the written and oral statements and information in this presentation contain forward-looking statements within the meaning of the Private Securities Litigation Reform Act of 1995. Forward-looking statements are often characterized by the use of words such as “outlook,” “believes,” “target,” “estimates,” “expects,” “projects,” “may,” “intends,” “plans,” “on track”, “forsees”, “future,” or “anticipates,” or by discussions of strategy, plans, or intentions. The statements in this presentation that are not historical statements, including, but not limited to, statements regarding our expectations as to the continued impact of the COVID-19 pandemic (including governmental and regulatory actions) on demand for our products, on the economy and on our customers, suppliers, employees, business and results of operations, our expectations for our business demand and growth in 2021, market factors and transportation and logistics trends, our 2021 Adjusted EBITDA, the timing of the incurrence of costs associated with our Berre, France, turnaround, the impact of our diversified portfolio and broad geographic exposure, the impact of and expected realization of announced price increases, our expectations of the role that BiaXam can play in mitigating exposure to infectious pathogens, the effectiveness of BiaXam, expectations about the possibility of bringing BiaXam to market (including additional receipt of regulatory approvals or the timing thereof) and expectations regarding the potential applications and development partner opportunities, and the information and the matters described under the caption “Business Outlook by Geography and End Use Application,” are forward looking statements. Forward-looking statements involve known and unknown risks, uncertainties, assumptions, and other important factors that could cause the actual results, performance or our achievements, or industry results, to differ materially from historical results, any future results, or performance or achievements expressed or implied by such forward-looking statements. There are a number of risks and uncertainties that could cause our actual results to differ materially from the forward-looking statements contained in this presentation. Important factors that could cause our actual results to differ materially from those expressed as forward-looking statements include, but are not limited to the factors set forth in this presentation, in our latest Annual Report on Form 10-K, including but not limited to “Part I, Item 1A. Risk Factors” and “Part II, Item 7. Management’s Discussion and Analysis of Financial Condition and Results of Operations” therein, and in our other filings with the Securities and Exchange Commission (the “SEC”). Many of these risks and uncertainties are currently amplified by and will continue to be amplified by, or in the future may be amplified by, the COVID-19 pandemic. There may be other factors of which we are currently unaware or deem immaterial that may cause our actual results to differ materially from the forward- looking statements. In addition, to the extent any inconsistency or conflict exists between the information included in this presentation and the information included in our prior presentations and other filings with the SEC, the information contained in this presentation updates and supersedes such information. Forward-looking statements are based on current plans, estimates, assumptions and projections, and, therefore, you should not place undue reliance on them. Forward-looking statements speak only as of the date they are made, and we undertake no obligation to update them in light of new information or future events. With respect to BiaXam, there is no assurance that any planned corporate activity, scientific research or study, additional regulatory approval, developing, marketing, licensing or selling of products, patent application, allowance or consumer study, to the extent pursued, will be successful or will succeed as currently planned or expected. There is no assurance that any of BiaXam's postulated uses, benefits, or advantages will in fact be realized in any manner or in any part.
Kraton First Quarter 2021 Earnings Call 3 GAAP Disclaimer This presentation includes the use of both GAAP and non-GAAP financial measures. The non-GAAP financial measures are defined below. Tables included in this earnings release reconcile each of these non-GAAP financial measures with the most directly comparable U.S. GAAP financial measure. For additional information on the impact of the spread between first-in-first-out (“FIFO”) and Estimated Current Replacement Cost (“ECRC”), see Management’s Discussion and Analysis of Financial Condition and Results of Operations in our Annual Report on Form 10-K for the fiscal year ended December 31, 2020. We consider these non-GAAP financial measures to be important supplemental measures of our performance and believe they are frequently used by investors, securities analysts, and other interested parties in the evaluation of our performance including period-to-period comparisons and/or that of other companies in our industry. Further, management uses these measures to evaluate operating performance, and our incentive compensation plan based incentive compensation payments on our Adjusted EBITDA performance and attainment of net debt reduction, along with other factors. These non-GAAP financial measures have limitations as analytical tools and in some cases can vary substantially from other measures of our performance. You should not consider them in isolation, or as a substitute for analysis of our results under U.S. GAAP in the United States. EBITDA, Adjusted EBITDA, Adjusted EBITDA excluding Cariflex, and Adjusted EBITDA Margin: For our consolidated results, EBITDA represents net income (loss) before interest, taxes, depreciation, and amortization. For each reporting segment, EBITDA represents operating income (loss) before depreciation and amortization, and earnings of unconsolidated joint ventures. Among other limitations EBITDA does not: reflect the significant interest expense on our debt or reflect the significant depreciation and amortization expense associated with our long-lived assets; and EBITDA included herein should not be used for purposes of assessing compliance or non-compliance with financial covenants under our debt agreements, which can vary from the terms used herein. The calculation of EBITDA in our debt agreements includes adjustments, such as extraordinary, non- recurring or one-time charges, proforma cost savings, certain non-cash items, turnaround costs, and other items included in the definition of EBITDA in the debt agreements. Other companies in our industry may calculate EBITDA differently than we do, limiting its usefulness as a comparative measure. As an analytical tool, Adjusted EBITDA is subject to all the limitations applicable to EBITDA. We prepare Adjusted EBITDA by eliminating from EBITDA the impact of a number of items we do not consider indicative of our on-going performance, including the spread between FIFO and ECRC, but you should be aware that in the future we may incur expenses similar to the adjustments in this presentation. Our presentation of Adjusted EBITDA should not be construed as an inference that our future results will be unaffected by unusual or non-recurring items. In addition, due to volatility in raw material prices, Adjusted EBITDA may, and often does, vary substantially from EBITDA and other performance measures, including net income calculated in accordance with U.S. GAAP. We prepare Adjusted EBITDA excluding Cariflex by eliminating from Adjusted EBITDA Cariflex sales, cost of sales, and direct specific fixed costs incurred from January 1, 2020 through March 6, 2020. We define Adjusted EBITDA Margin as Adjusted EBITDA as a percentage of revenue (for each reporting segment or on a consolidated basis, if applicable). Because of these and other limitations, EBITDA and Adjusted EBITDA should not be considered as a measure of discretionary cash available to us to invest in the growth of our business. Adjusted Gross Profit and Adjusted Gross Profit Per Ton: We define Adjusted Gross Profit Per Ton as Adjusted Gross Profit divided by total sales volume (for each reporting segment or on a consolidated basis, as applicable). We define Adjusted Gross Profit as gross profit excluding certain charges and expenses. Adjusted Gross Profit is limited because it often varies substantially from gross profit calculated in accordance with U.S. GAAP due to volatility in raw material prices. Adjusted Diluted Earnings Per Share: We prepare Adjusted Diluted Earnings per Share by eliminating from Diluted Earnings per Share the impact of a number of non-recurring items we do not consider indicative of our on-going performance, including the spread between FIFO and ECRC. Consolidated Net Debt and Consolidated Net Debt excluding the effect of foreign currency: We define Consolidated Net Debt as total consolidated debt (including debt of KFPC) less consolidated cash and cash equivalents. Management uses Consolidated Net Debt to determine our outstanding debt obligations that would not readily be satisfied by its cash and cash equivalents on hand. Management believes that using Consolidated Net Debt is useful to investors in determining our leverage since we could choose to use cash and cash equivalents to retire debt. We also present Consolidated Net Debt, as adjusted for foreign exchange impact accounts for the foreign exchange effect on our foreign currency denominated debt agreements. Disclaimers

Kraton First Quarter 2021 Earnings Call 4 First Quarter 2021 Highlights

Kraton First Quarter 2021 Earnings Call 5 First Quarter 2021 Financial Highlights ▪ Consolidated net income of $34.6 million ▪ Polymer segment operating income of $39.9 million ▪ Chemical segment operating income of $13.5 million ▪ Consolidated debt of $943.1 million at 3/31/2021 vs. $950.1 million at 12/31/2020 Consolidated Results ▪ Q1 2021 Adjusted EBITDA(1) of $67.7 million, down $10.2 million vs. Q1 2020 ▪ Adjusted EBITDA excluding Cariflex(1) would have been up $0.2 million ▪ Adjusted EBITDA margin(2) of 15.5% vs. 18.2% in Q1 2020 ▪ Revenue of $437.3 million, up $10.0 million vs. Q1 2020 GAAP Results Debt Reduction & Liquidity ▪ Consolidated debt decreased $7.0 million ▪ Consolidated Net Debt(1) increased $18.1 million, reflecting seasonal inventory build in advance of paving and roofing season ▪ Substantial financial flexibility supported by $60.8 million of cash and $200.8 million of available borrowing base under $300 million ABL Facility (1) See non-GAAP reconciliations included in the accompanying financial tables for the reconciliation of each non-GAAP measure to its most directly comparable GAAP measure. (2) Defined as Adjusted EBITDA as a percentage of revenue.

Kraton First Quarter 2021 Earnings Call 6 Polymer Segment - Q1 2021 Results (1) See non-GAAP reconciliations included in the accompanying financial tables for the reconciliation of each non-GAAP measure to its most directly comparable GAAP measure. (2) Defined as Adjusted EBITDA as a percentage of revenue. Three Months Ended March 31, 2021 2020 Change ($ In millions) Volume (kT) 74.8 70.8 4.0 Revenue $ 241.2 $ 240.4 $ 0.8 Operating income $ 39.9 $ 17.9 $ 21.9 Adjusted EBITDA(1) $ 37.5 $ 51.2 $ (13.7) Adjusted EBITDA margin(2) 15.5 % 21.3 % (580 bps) Note: May not foot due to rounding. ▪ Adjusted EBITDA(1) down $13.7 million vs. Q1'20. Adjusted EBITDA excluding Cariflex(1) would have been down $3.4 million, with the decrease largely associated with the statutory turnaround costs at our Berre, France, location and the impact to fixed costs associated with inventory liquidation. ▪ Sales volume up 5.6% compared to Q1'20. Excluding Cariflex, sales volume would have increased 13.1% ▪ Specialty Polymer sales volume up 24.5%, primarily due to demand recovery in all regions, particularly in consumer durable applications in China and broader Asia, and automotive applications in North America and Europe. ▪ Performance Products sales volume up 6.5%, on higher paving and roofing sales in Europe. ▪ Gross Profit of $82.0 million and Adjusted Gross Profit(1) of $819 per ton, compared to Adjusted Gross Profit(1) of $1,070 per ton in Q1'20. The decrease in Adjusted Gross Profit(1) per ton vs. Q1'20 reflects factors that include the sale of Cariflex, higher fixed costs associated with the turnaround at our Berre, France, location and the timing associated with realization of price increases in response to increasing raw material costs in Q1'21. Q1'21 vs. Q1'20

Kraton First Quarter 2021 Earnings Call 7 Chemical Segment - Q1 2021 Results (1) See non-GAAP reconciliations included in the accompanying financial tables for the reconciliation of each non-GAAP measure to its most directly comparable GAAP measure. (2) Defined as Adjusted EBITDA as a percentage of revenue. Three Months Ended March 31, 2021 2020 Change ($ In millions) Volume (kT) 111.6 110.1 1.5 Revenue $ 196.1 $ 186.9 $ 9.2 Operating income $ 13.5 $ 10.3 $ 3.2 Adjusted EBITDA(1) $ 30.3 $ 26.7 $ 3.5 Adjusted EBITDA margin(2) 15.4 % 14.3 % 110 bps Note: May not foot due to rounding. ▪ Adjusted EBITDA(1) up 13.3%, primarily driven by higher core volumes associated with improved market fundamentals, particularly for Rosin Esters, TOFA and TOFA derivatives, and lower overall fixed costs resulting from improved refinery operating rates, partially offset by higher raw material and energy costs. ▪ Sales volume increased 1.3% vs. Q1'20 ▪ Performance Chemicals volume down 3.5%, with higher sales of TOFA and TOFA derivatives offset by lower opportunistic sales of raw materials. ▪ Adhesives volume up 10.8%, driven by strong Rosin Ester demand associated with favorable adhesive demand fundamentals. ▪ Tires volume up 14.9% on improved demand and higher innovation- based sales. Q1'21 vs. Q1'20
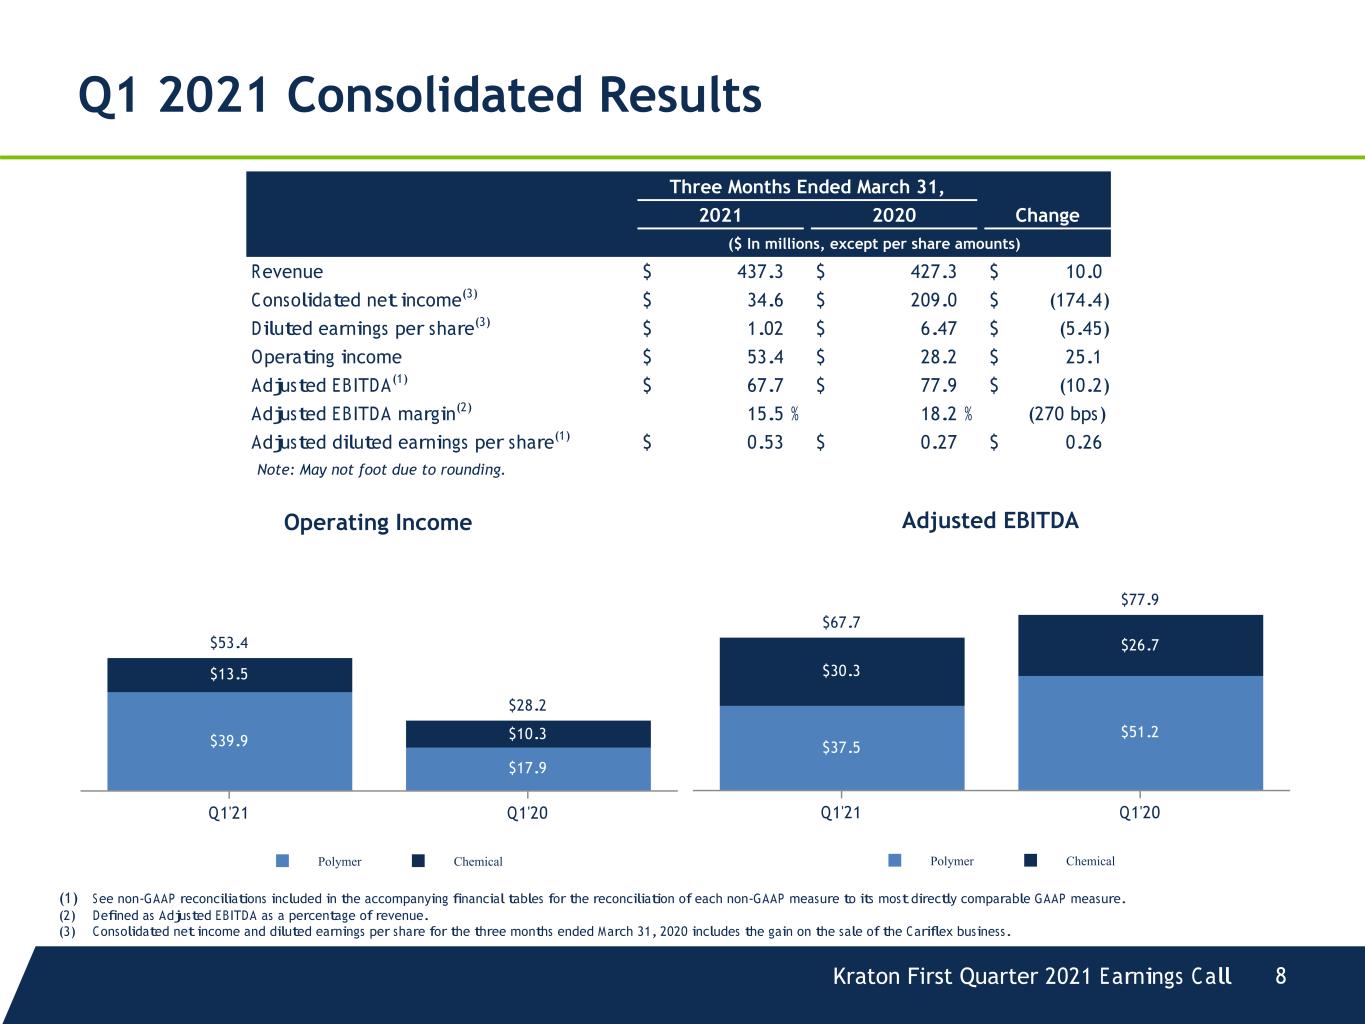
Kraton First Quarter 2021 Earnings Call 8 Operating Income $53.4 $28.2 $39.9 $17.9 $13.5 $10.3 Polymer Chemical Q1'21 Q1'20 Adjusted EBITDA $67.7 $77.9 $37.5 $51.2 $30.3 $26.7 Polymer Chemical Q1'21 Q1'20 Three Months Ended March 31, 2021 2020 Change ($ In millions, except per share amounts) Revenue $ 437.3 $ 427.3 $ 10.0 Consolidated net income(3) $ 34.6 $ 209.0 $ (174.4) Diluted earnings per share(3) $ 1.02 $ 6.47 $ (5.45) Operating income $ 53.4 $ 28.2 $ 25.1 Adjusted EBITDA(1) $ 67.7 $ 77.9 $ (10.2) Adjusted EBITDA margin(2) 15.5 % 18.2 % (270 bps) Adjusted diluted earnings per share(1) $ 0.53 $ 0.27 $ 0.26 (1) See non-GAAP reconciliations included in the accompanying financial tables for the reconciliation of each non-GAAP measure to its most directly comparable GAAP measure. (2) Defined as Adjusted EBITDA as a percentage of revenue. (3) Consolidated net income and diluted earnings per share for the three months ended March 31, 2020 includes the gain on the sale of the Cariflex business. Q1 2021 Consolidated Results Note: May not foot due to rounding.
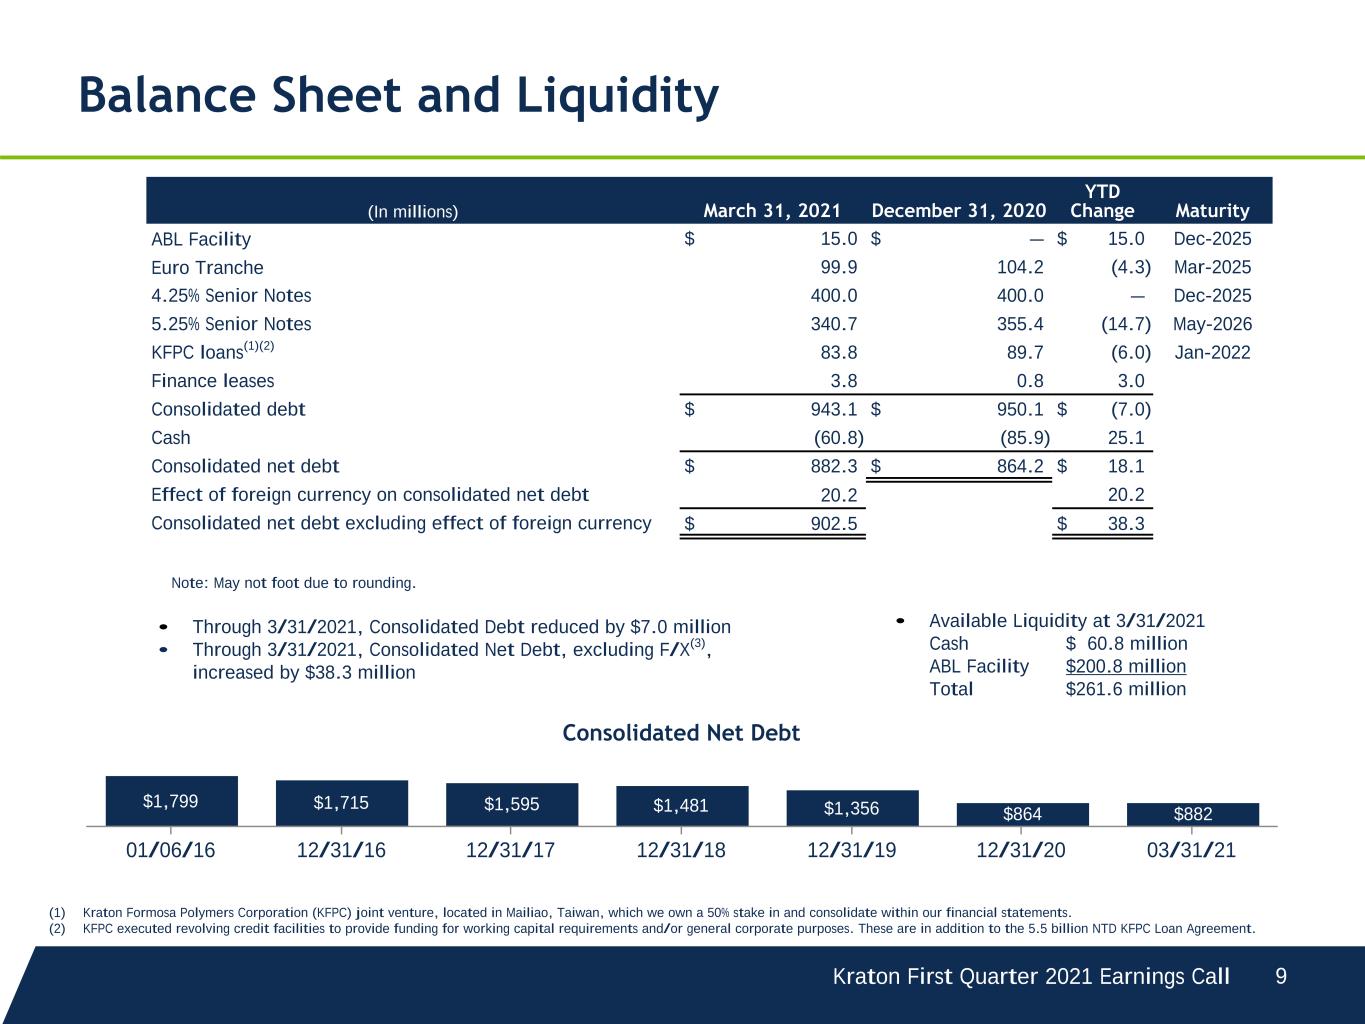
Kraton First Quarter 2021 Earnings Call 9 (In millions) March 31, 2021 December 31, 2020 YTD Change Maturity ABL Facility $ 15.0 $ — $ 15.0 Dec-2025 Euro Tranche 99.9 104.2 (4.3) Mar-2025 4.25% Senior Notes 400.0 400.0 — Dec-2025 5.25% Senior Notes 340.7 355.4 (14.7) May-2026 KFPC loans(1)(2) 83.8 89.7 (6.0) Jan-2022 Finance leases 3.8 0.8 3.0 Consolidated debt $ 943.1 $ 950.1 $ (7.0) Cash (60.8) (85.9) 25.1 Consolidated net debt $ 882.3 $ 864.2 $ 18.1 Effect of foreign currency on consolidated net debt 20.2 20.2 Consolidated net debt excluding effect of foreign currency $ 902.5 $ 38.3 Balance Sheet and Liquidity (1) Kraton Formosa Polymers Corporation (KFPC) joint venture, located in Mailiao, Taiwan, which we own a 50% stake in and consolidate within our financial statements. (2) KFPC executed revolving credit facilities to provide funding for working capital requirements and/or general corporate purposes. These are in addition to the 5.5 billion NTD KFPC Loan Agreement. • Through 3/31/2021, Consolidated Debt reduced by $7.0 million • Through 3/31/2021, Consolidated Net Debt, excluding F/X(3), increased by $38.3 million Note: May not foot due to rounding. Consolidated Net Debt $1,799 $1,715 $1,595 $1,481 $1,356 $864 $882 01/06/16 12/31/16 12/31/17 12/31/18 12/31/19 12/31/20 03/31/21 • Available Liquidity at 3/31/2021 Cash $ 60.8 million ABL Facility $200.8 million Total $261.6 million
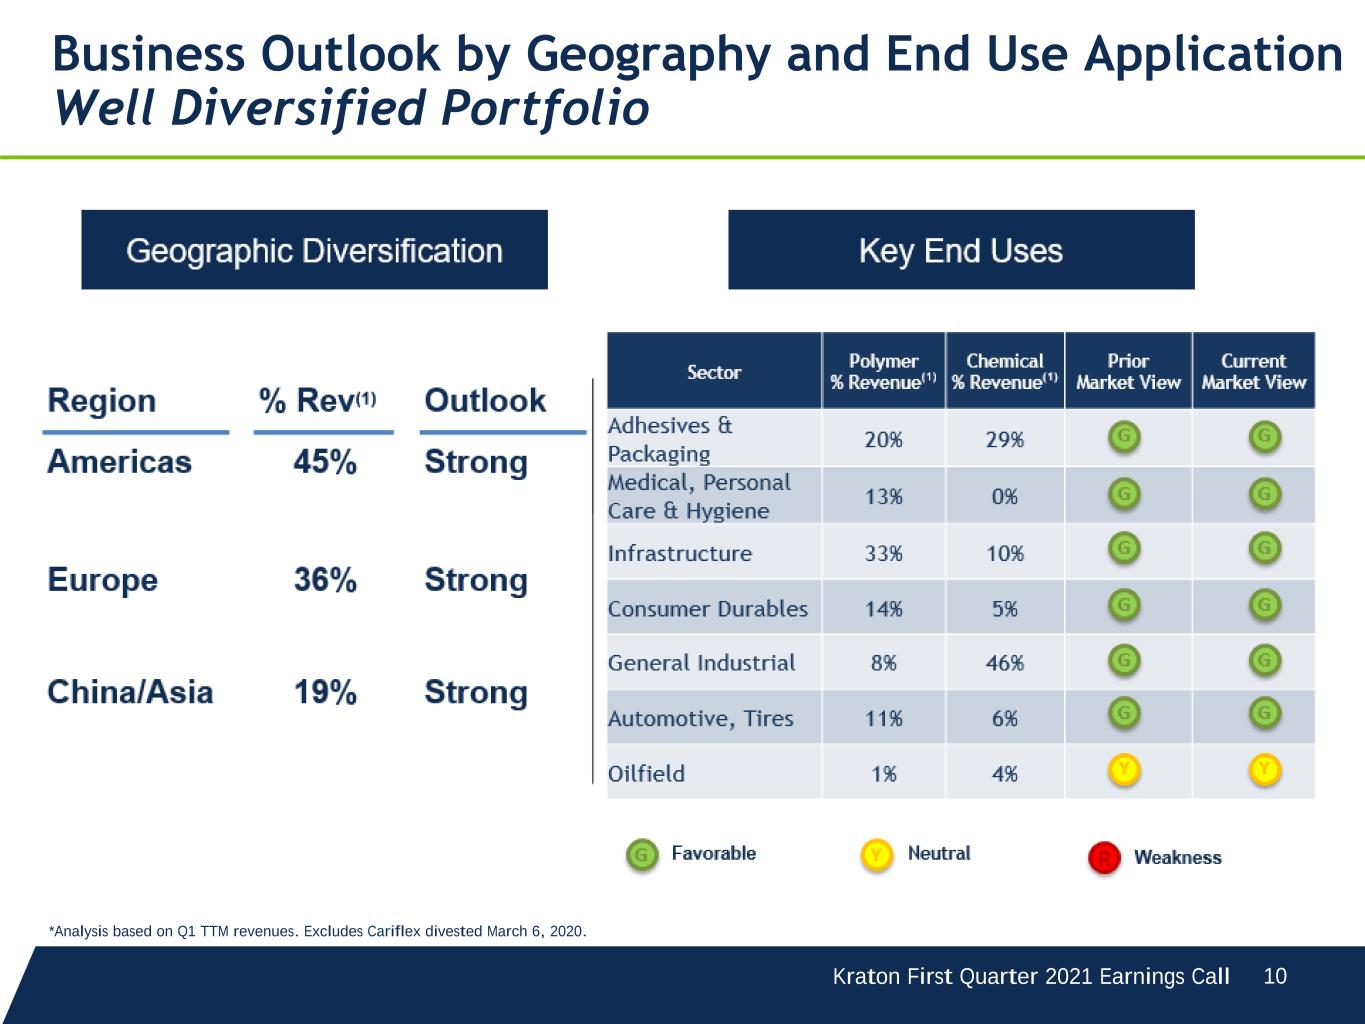
Kraton First Quarter 2021 Earnings Call 10 Business Outlook by Geography and End Use Application Well Diversified Portfolio *Analysis based on Q1 TTM revenues. Excludes Cariflex divested March 6, 2020.

Kraton First Quarter 2021 Earnings Call 11 Advancing our Sustainability Objectives

Appendix

Kraton First Quarter 2021 Earnings Call 13 Polymer – Revenue by Geography and End Use TTM March 31, 2021 Segment Revenue by Geography Segment Revenue by End Use Americas 47% EMEA 31% Asia Pacific 22% Industrial 7% Adhsv & Pkg 19% Consumer 21% Healthcare 4% Energy & Fuels 1% Automotive & Tires 10% Isoprene Rubber 6% Paving & Roofing 29% Other 2%

Kraton First Quarter 2021 Earnings Call 14 Polymer – Revenue by Geography and Product Group TTM March 31, 2021 IRSA PERFORMANCE PRODUCTSSPECIALTY POLYMERS R e ve n u e b y G e o gr ap h y R e ve n u e b y P ro d u ct G ro u p Asia Pacific 54% Americas 46% Asia Pacific 36% EMEA 24% Americas 40% Asia Pacific 9% EMEA 40% Americas 51% Isoprene Rubber 96% Other 4% Other 4% Automotive & Tires 25% Paving & Roofing 1% Industrial 14% Healthcare 11% Energy & Fuels 2% Adhsv & Packaging 2% Consumer 41% Paving & Roofing 53% Industrial 3% Energy & Fuels 1% Adhsv & Pkg 33% Consumer 9% Other 1%

Kraton First Quarter 2021 Earnings Call 15 Chemical – Revenue by Geography and Product Group TTM March 31, 2021 ADHESIVES 37% of TTM Revenue TIRES 6% of TTM Revenue Chemical Segment Revenue PERFORMANCE CHEMICALS 57% of TTM Revenue Americas 46% EMEA 38% Asia Pacific 16% Americas 18% EMEA 48% Asia Pacific 34% Americas 41% EMEA 42% Asia Pacific 17% Americas 41% EMEA 44% Asia Pacific 15%

Kraton First Quarter 2021 Earnings Call 16 Three Months Ended March 31, 2021 2020 (In thousands) Gross profit $ 81,985 $ 68,731 Add (deduct): Transaction, acquisition related costs, restructuring, and other costs — 130 Non-cash compensation expense 146 171 Spread between FIFO and ECRC (20,875) 6,745 Adjusted gross profit (non-GAAP) $ 61,256 $ 75,777 Sales volume (kilotons) 74.8 70.8 Adjusted gross profit per ton $ 819 $ 1,070 Polymer Segment Reconciliation of Gross Profit to Non-GAAP Financial Measures

Kraton First Quarter 2021 Earnings Call 17 Reconciliation of Net Income to Operating Income to Non-GAAP Financial Measures Three Months Ended March 31, 2021 Three Months Ended March 31, 2020 Polymer Chemical Total Polymer Chemical Total (In thousands) Net income attributable to Kraton $ 33,229 $ 208,086 Net income attributable to noncontrolling interest 1,364 934 Consolidated net income 34,593 209,020 Add (deduct): Income tax (benefit) expense 8,761 (36,552) Interest expense, net 10,947 17,461 Earnings of unconsolidated joint venture (120) (101) Loss on extinguishment of debt — 13,954 Other income (808) (327) Disposition and exit of business activities — (175,214) Operating income $ 39,859 $ 13,514 53,373 $ 17,925 $ 10,316 28,241 Add (deduct): Depreciation and amortization 12,824 18,733 31,557 13,347 17,826 31,173 Disposition and exit of business activities — — — 175,214 — 175,214 Other income 282 526 808 55 272 327 Loss on extinguishment of debt — — — (13,954) — (13,954) Earnings of unconsolidated joint venture 120 — 120 101 — 101 EBITDA (a) 53,085 32,773 85,858 192,688 28,414 221,102 Add (deduct): Transaction, acquisition related costs, restructuring, and other costs (b) 2,332 1,972 4,304 10,148 762 10,910 Disposition and exit of business activities — — — (175,214) — (175,214) Loss on extinguishment of debt — — — 13,954 — 13,954 Non-cash compensation expense 2,924 — 2,924 2,848 — 2,848 Spread between FIFO and ECRC (20,875) (4,491) (25,366) 6,745 (2,466) 4,279 Adjusted EBITDA $ 37,466 $ 30,254 $ 67,720 $ 51,169 $ 26,710 $ 77,879 Adjusted EBITDA excluding Cariflex $ 37,466 $ 30,254 $ 67,720 $ 40,825 $ 26,710 $ 67,535 (a) Included in EBITDA are Isoprene Rubber sales to Daelim under the IRSA. Sales under the IRSA are transacted at cost. Included in Adjusted EBITDA is the amortization of non-cash deferred income of $7.6 million and $3.4 million for the three months ended March 31, 2021 and 2020, respectively, which represents revenue deferred until the products are sold under the IRSA. (b) Charges related to the evaluation of acquisition transactions, severance expenses, and other restructuring related charges.
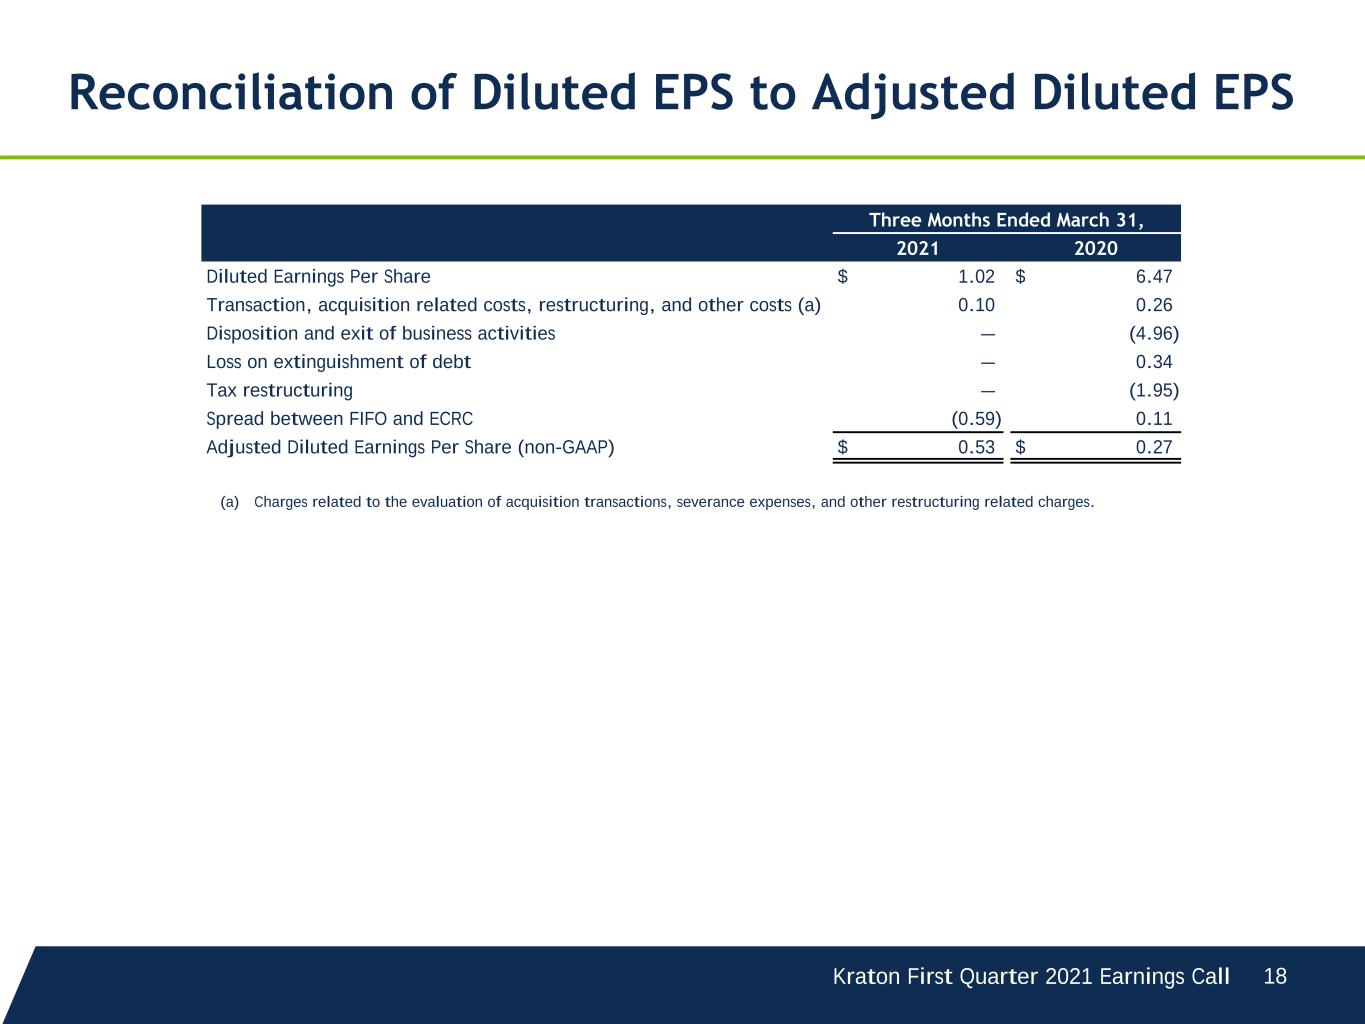
Kraton First Quarter 2021 Earnings Call 18 Three Months Ended March 31, 2021 2020 Diluted Earnings Per Share $ 1.02 $ 6.47 Transaction, acquisition related costs, restructuring, and other costs (a) 0.10 0.26 Disposition and exit of business activities — (4.96) Loss on extinguishment of debt — 0.34 Tax restructuring — (1.95) Spread between FIFO and ECRC (0.59) 0.11 Adjusted Diluted Earnings Per Share (non-GAAP) $ 0.53 $ 0.27 Reconciliation of Diluted EPS to Adjusted Diluted EPS (a) Charges related to the evaluation of acquisition transactions, severance expenses, and other restructuring related charges.
