Attached files
Table of Contents
UNITED STATES
SECURITIES AND EXCHANGE COMMISSION
Washington, D.C. 20549
FORM 10-K
| x | ANNUAL REPORT PURSUANT TO SECTION 13 OR 15(d) OF THE SECURITIES EXCHANGE ACT OF 1934 |
For the fiscal year ended December 31, 2010
or
| ¨ | TRANSITION REPORT PURSUANT TO SECTION 13 OR 15(d) OF THE SECURITIES EXCHANGE ACT OF 1934 |
Commission file number
| Kraton Performance Polymers, Inc. | 001-34581 |
KRATON PERFORMANCE POLYMERS, INC.
(Exact Name of Registrant as Specified in its Charter)
| Kraton Performance Polymers, Inc. | Delaware | 20-0411521 | ||
| (State or other jurisdiction of incorporation or organization) |
(I.R.S. Employer Identification No.) | |||
| 15710 John F. Kennedy Blvd, Suite 300 Houston, TX 77032 |
281-504-4700 | |||
| (Address of principal executive offices, including zip code) | (Registrant’s telephone number, including area code) |
Securities registered pursuant to Section 12(b) of the Act:
| Title of Each Class |
Name of Each Exchange on Which Registered | |
| Kraton Performance Polymers, Inc. Common Stock, par value $0.01 |
New York Stock Exchange |
Securities registered pursuant to Section 12(g) of the Act:
None
Indicate by check mark if the registrant is a well-known seasoned issuer, as defined in Rule 405 of the Securities Act. YES ¨ NO x
Indicate by check mark if the registrant is not required to file reports pursuant to Section 13 or Section 15(d) of the Act. YES ¨ NO x
Indicate by check mark whether the registrant (1) has filed all reports required to be filed by Section 13 or 15(d) of the Securities Exchange Act of 1934 during the preceding 12 months (or for such shorter period that the registrant was required to file such reports), and (2) has been subject to such filing requirements for the past 90 days. YES x NO ¨
Indicate by check mark whether the registrant has submitted electronically and posted on its corporate Web site, if any, every Interactive Data File required to be submitted and posted pursuant to Rule 405 of Regulation S-T (§232.405 of this chapter) during the preceding 12 months (or for such shorter period that the registrant was required to submit and post such files). YES ¨ NO ¨
Indicate by check mark if disclosure of delinquent filers pursuant to Item 405 of Regulation S-K is not contained herein, and will not be contained, to the best of the registrant’s knowledge, in definitive proxy or information statements incorporated by reference in Part III of this Form 10-K or any amendment to this Form 10-K. x
Indicate by check mark whether the registrant is a large accelerated filer, an accelerated filer, a non-accelerated filer or a smaller reporting company. See definitions of “large accelerated filer”, “accelerated filer” and “smaller reporting company” in Rule 12b-2 of the Securities Exchange Act. (Check one):
| Large accelerated filer: ¨ | Accelerated filer: x | Non-accelerated filer: ¨ | Smaller reporting company: ¨ |
Indicate by check mark whether the registrant is a shell company (as defined in Rule 12b-2 of the Act). YES ¨ NO x
Estimated aggregate market value of the common equity held by nonaffiliates of Kraton Performance Polymers, Inc. at June 30, 2010: $214,961,640. Number of shares of Kraton Performance Polymers, Inc. Common Stock, $0.01 par value, outstanding at February 28, 2011: 31,736,514.
DOCUMENTS INCORPORATED BY REFERENCE
Portions of Kraton Performance Polymers, Inc.’s proxy statement for the 2011 Annual Meeting of Shareholders are incorporated by reference in Part III.
Table of Contents
on Form 10-K for
Year Ended December 31, 2010
| PAGE | ||||||
| PART I | ||||||
| Item 1. | 4 | |||||
| Item 1A. | 21 | |||||
| Item 1B. | 34 | |||||
| Item 2. | 34 | |||||
| Item 3. | 36 | |||||
| Item 4. | 36 | |||||
| PART II | ||||||
| Item 5. | 37 | |||||
| Item 6. | 39 | |||||
| Item 7. | Management’s Discussion and Analysis of Financial Condition and Results of Operations |
42 | ||||
| Item 7A. | 62 | |||||
| Item 8. | 63 | |||||
| Item 9. | Changes in and Disagreements with Accountants on Accounting and Financial Disclosure |
63 | ||||
| Item 9A. | 63 | |||||
| Item 9B. | 64 | |||||
| PART III | ||||||
| Item 10. | 65 | |||||
| Item 11. | 65 | |||||
| Item 12. | Security Ownership of Certain Beneficial Owners and Management and Related Stockholder Matters |
65 | ||||
| Item 13. | Certain Relationships and Related Transactions, and Director Independence |
65 | ||||
| Item 14. | 65 | |||||
| PART IV | ||||||
| Item 15. | 66 | |||||
2
Table of Contents
CAUTIONARY STATEMENT REGARDING FORWARD-LOOKING INFORMATION
Some of the statements in this Annual Report on Form 10-K under the headings “Business,” “Risk Factors,” “Selected Financial Data,” “Management’s Discussion and Analysis of Financial Condition and Results of Operations,” “Financial Statements and Supplementary Data” and elsewhere contain forward-looking statements within the meaning of the Private Securities Litigation Reform Act of 1995. We may also make written or oral forward-looking statements in our periodic reports on Forms 10-Q and 8-K, in press releases and other written materials and in oral statements made by our officers, directors or employees to third parties. Statements that are not historical facts, including statements about our beliefs and expectations, are forward-looking statements. Forward-looking statements are often characterized by the use of words such as “believes,” “estimates,” “expects,” “projects,” “may,” “intends,” “plans” or “anticipates,” or by discussions of strategy, plans or intentions. Such forward-looking statements involve known and unknown risks, uncertainties and other important factors that could cause the actual results, performance or our achievements, or industry results, to differ materially from historical results, any future results, or performance or achievements expressed or implied by such forward-looking statements. There are a number of risks and uncertainties that could cause our actual results to differ materially from the forward-looking statements contained in this report. Important factors that could cause our actual results to differ materially from those expressed as forward-looking statements are set forth in this report, including but not limited to those under the heading “Risk Factors.” There may be other factors of which we are currently unaware or deem immaterial that may cause our actual results to differ materially from the forward-looking statements.
Forward-looking statements are based on current plans, estimates and projections, and, therefore, you should not place undue reliance on them. Forward-looking statements speak only as of the date they are made, and we undertake no obligation to update them publicly in light of new information or future events.
Presentation of Financial Statements.
The terms “Kraton,” “our company,” “we,” “our,” “ours” and “us” as used in this report refer collectively to Kraton Performance Polymers, Inc. and its consolidated subsidiaries.
This Form 10-K includes financial statements and related notes that present the consolidated financial position, results of operations and cash flows of Kraton, and its subsidiaries. Kraton is a holding company whose only material asset is its investment in Kraton Polymers LLC, which is its wholly owned subsidiary. Kraton Polymers LLC and its subsidiaries own all of the consolidated operating assets.
3
Table of Contents
PART I
| Item 1. | Business. |
General
Our Company
We believe we are the world’s leading producer of styrenic block copolymers (“SBCs”) as measured by 2010 sales revenue. We market our products under the widely recognized KRATON® brand. SBCs are highly-engineered synthetic elastomers that we invented and commercialized almost 50 years ago, which enhance the performance of numerous end use products, imparting greater flexibility, resilience, strength, durability and processability. We focus on the end use markets we believe offer the highest growth potential and greatest opportunity to differentiate our products from competing products. Within these end use markets, we believe that we provide our customers with a broad portfolio of highly-engineered and value-enhancing polymers that are critical to the performance of our customers’ products. We seek to maximize the value of our product portfolio by introducing innovations that command premium pricing and by consistently upgrading from lower margin products. As the industry leader, we believe we maintain significant competitive advantages, including an almost 50-year proven track record of innovation; world-class technical expertise; customer, geographical and end use market diversity; and industry-leading customer service capabilities. These advantages are supported by a global infrastructure and a long history of successful capital investments and operational excellence.
Our SBC products are found in many everyday applications, including disposable baby diapers, the rubberized grips of toothbrushes, razor blades, power tools and in asphalt formulations used to pave roads. We believe that there are many untapped uses for our products, and we will continue to develop new applications for SBCs. We also develop, manufacture and market niche, non-SBC products that we believe have high growth potential, such as isoprene rubber latex (“IRL”). IRL is a highly-engineered, reliable synthetic substitute for natural rubber latex. We believe the versatility of IRL offers significant opportunities for new, high-margin applications. Our IRL products, which are used in applications such as surgical gloves and condoms, have not been found to contain the proteins present in natural latex and are, therefore, not known to cause allergies. We believe we produce the highest purity IRL globally and that we are the only significant third-party supplier of the product. Our IRL business has grown at a compound annual growth rate of 36%, based on revenues, from 2008 to the end of 2010.
We currently offer approximately 800 products to more than 700 customers in over 60 countries worldwide, and we manufacture our polymers at five manufacturing facilities on four continents, including our flagship plant in Belpre, Ohio, the most diversified SBC plant in the world. Our facility in Japan is operated by an unconsolidated manufacturing joint venture. Our products are typically developed using our proprietary, and in many cases patent-protected, technology and require significant engineering, testing and certification. In 2010, we were awarded 81 patents for new products or applications and at December 31, 2010, we had approximately 1,053 granted patents and approximately 349 pending patent applications. We are widely regarded as the industry’s leading innovator and cost-efficient manufacturer in our end use markets. We work closely with our customers to design products that meet application-specific performance and quality requirements. We expect these innovations to drive our organic growth, sustain our leadership position, expand our market share, improve our margins and produce a high return on invested capital.
Over the past several years, we have implemented a range of strategic initiatives designed to enhance our profitability and end use market position. These include fixed asset investments to expand our capacity in high value products, to enhance productivity at our existing facilities and to significantly reduce our fixed cost structure through headcount reductions, production line closures at our Pernis, the Netherlands, facility (“Pernis”) and system upgrades. During this period, we have shifted our portfolio to higher-margin products, substantially exited low-margin businesses such as footwear and implemented smart pricing strategies that have improved our
4
Table of Contents
overall margins and return on invested capital. We believe these initiatives provide us with a strong platform to drive growth, create significant operating leverage and position us to benefit from volume recovery in our end use markets.
We believe that starting in late 2008 the global economic downturn and associated reduction in customer and end user inventory levels, caused an unprecedented slowdown across the industry. We experienced a decline in sales volume across all of our end use markets, including the traditionally more stable consumer and medical applications. We believe that a significant factor in this decline was inventory de-stocking. Our first and second quarter 2009 sales volumes were 39% and 24%, respectively, less than our sales volumes in the comparable 2008 quarters. The trend began to reverse itself in June 2009, as demand patterns began to shift towards recovery such that our third quarter 2009 sales volume was 10% less than the sales volume in the third quarter of 2008 and our fourth quarter 2009 sales volume was 16% above the sales volume in the fourth quarter of 2008. More recently, we have seen demand returning to more normal levels with 2010 sales volume up 18% compared to 2009.
Corporate History
Prior to our initial public offering and related reorganization transactions in December 2009, we were an indirect wholly-owned subsidiary of TJ Chemical Holdings LLC and were indirectly owned by certain affiliates of TPG Capital, L.P., which we refer to collectively as “TPG,” and certain affiliates of J.P. Morgan Partners, LLC, which we refer to collectively as “JPMP,” and certain members of our management. We conduct our business through Kraton Polymers LLC and its consolidated subsidiaries. Prior to our initial public offering (“IPO”), Kraton Polymers LLC’s parent company was Polymer Holdings LLC, a Delaware limited liability company. On December 16, 2009, Polymer Holdings LLC was converted from a Delaware limited liability company to a Delaware corporation and renamed Kraton Performance Polymers, Inc., which remains Kraton Polymers LLC’s parent company. In addition, prior to the closing of the initial public offering, TJ Chemical was merged into (and did not survive the merger with) Kraton Polymers LLC. Trading in our common stock on the New York Stock Exchange commenced on December 17, 2009 under the symbol “KRA.” The IPO was completed on December 22, 2009.
Our Competitive Strengths
We believe the following competitive strengths help us to sustain our market leadership position and contribute to our ability to generate superior margins and strong cash flow. We expect these strengths to support our growth in the future:
The Market Leader in SBCs
We believe we hold the number one global market position, based on 2010 sales revenue, in each of our four core end use markets, with sales of approximately $1,228 million and sales volumes of approximately 307 kilotons for the year ended December 31, 2010. We generated approximately 98% of our 2010 product sales in our core end use markets. Our Belpre, Ohio facility is the most product-diversified SBC plant in the world, and we believe our Wesseling, Germany facility is world scale and cost efficient. As the pioneer of SBCs almost 50 years ago, we believe our KRATON® brand is widely recognized for our industry leadership, and we are particularly well regarded for our process technology expertise and long track record of market-driven innovation.
Growth Through Innovation and Technological Know-How
SBC production and product development requires complex and specific expertise, which we believe many of our competitors are currently unable to replicate. As the industry pioneer, Kraton maintains a constant focus on enhancing the value-added attributes of our products and on developing new applications for SBCs. At December 31, 2010, we had approximately 1,053 granted patents and approximately 349 pending patent applications. Our “Vision 20/20” program targets generating 20% of sales revenues from new products or
5
Table of Contents
applications introduced in the prior five years. In 2010, we generated 13% of our sales from innovation driven revenue. We believe that our new product innovation will allow us to drive increases in our volume, expand unit contribution margins (the excess of the sale price of a unit of product over the variable cost to produce that unit) and increase our customers’ reliance on Kraton’s products and technical expertise. For example, for the year ended December 31, 2010, our Emerging Businesses end use market, which includes isoprene rubber (“IR”) and IRL, represented 7% of sales revenues. Furthermore, our IRL business has grown, on a revenue basis, at a compound annual growth rate of 36% from 2008 to the end of 2010 and is earning a unit contribution margin in excess of the company’s as a whole. In addition to IRL, we believe we have a robust portfolio of innovations at various stages of development and commercialization that we believe will fuel our future growth. Examples include, PVC alternatives for wire & cable and medical applications, and polymers used in slush molding for automotive applications, and our Nexar™ family of membrane polymers for water filtration and breathable fabrics.
Diverse Global Manufacturing Capabilities and End Use Market Exposures
We manufacture our polymers at five manufacturing facilities on four continents (North America, Europe, South America and Asia) producing what we believe to be the highest quality grades available of unhydrogenated SBCs (“USBCs,”) hydrogenated SBCs (“HSBCs,”) and high purity IRL. We believe we are the only SBC producer with this breadth of technical capabilities and global footprint, selling approximately 800 products to more than 700 customers in over 60 countries. Since 2003, we have successfully completed plant expansions totaling 60 kilotons of capacity at a total cost of less than $50 million, giving us a total capacity of 420 kilotons. Our manufacturing and product footprint allow revenue diversity, both geographically and by end use market. We believe our scale and footprint make us an attractive customer for our monomer suppliers, which, in turn, allows us to offer a high degree of supply security to customers.
Long-Standing, Strong Customer Relationships Supported by Leading Service-Offering
We sell our products to over 700 customers, many of which we have had relationships with for 15 years or more. Our customers are broad-based, with no single customer accounting for more than 5% of our sales revenue in 2010 (our top 10 customers together represented 29% of sales in 2010). Our customers’ manufacturing processes are typically calibrated to the performance specifications of our products. Given the technical expertise and investment required to develop these formulations and the lead times required to replace them, we believe our customers face high switching costs. We believe our customers view our products as being high value-added, even though our products generally represent a small proportion of the overall cost of the finished product. Leveraging our global infrastructure, we believe we offer our customers a best-in-class service level that aligns us to their respective business models through “on demand” order delivery and product development specifically designed for each customer’s needs.
6
Table of Contents
Experienced Management Team with a Track Record of Growth and Productivity Improvements
Our senior management team has an average industry experience of approximately 25 years, most of which has been with some of the world’s leading companies, including Koch Industries, Hoechst AG and Chevron Phillips Chemical. Since early 2008, when the majority of the current executive team was put in place, we have instituted a number of strategic initiatives designed to enhance productivity, reduce costs and capital intensity, expand margins and drive innovation-led growth.
Our Business Strategy
Building on these competitive strengths, we are focused on achieving profitable top-line growth and improving margins through the introduction of highly-engineered, high value-added products to drive strong and sustainable cash flow.
Drive Growth and Margin Expansion Through Innovation
We have an almost 50-year track record of innovation dating back to our development of the first SBCs. Our research and development effort is focused on end use markets and new product developments that we believe offer high growth as well as opportunities to develop highly-differentiated products for our customers, thus yielding higher margin potential. We work very closely with our longstanding customer base to produce products that solve their specific technical requirements. For example, to address an industry trend to provide an alternative to PVC in applications such as medical packaging and wire and cable, we have developed and commercialized a series of custom-designed polymers and compounds. In addition to this innovation-led growth, we believe that there are a number of end use market dynamics that will also drive growth in our business, such as the general demand by customers for higher value-added product performance characteristics.
Pursue “Smart Pricing”
In late 2007, we undertook a comprehensive review of our entire product portfolio, including both product-specific and customer-specific profitability analysis. As a result, we took a variety of actions including reducing or eliminating our exposure to lower margin business and increasing our prices to reflect the significant value-added benefits of our products to our customers’ products. Since the end of 2007, we have increased our unit contribution margins by more than 50%. We will continue to pursue pricing strategies that reflect the contribution to the end product of our high value and complex product offerings for which limited substitutes exist.
Invest in Key Growth Initiatives
For the year ended December 31, 2010, capital expenditures were approximately $56 million. We currently expect 2011 capital expenditures will be approximately $80 million to $85 million. Our minimum annual capital expenditure levels to maintain and achieve required improvements in our facilities in each of the next three to five years are expected to be approximately $16 million to $22 million. Included in our 2011 capital expenditure estimate is $13 million for engineering related to our ongoing assessment of a possible HSBC manufacturing facility in Asia, $11 million to replace IR production from the closure of our Pernis facility, $6 million for the multi-year systems and control upgrades, approximately $3 million to upgrade or replace our coal-burning boilers at our Belpre, Ohio, facility, and $3 million for IRL expansion at our Paulinia facility.
Continue to Pursue Operational Efficiencies
We have a history of implementing continuous process and cost improvement plans that have resulted in a significant reduction in our cost position and an improvement in the way we run our business. Since the beginning of 2008, we have implemented cost saving initiatives that have reduced costs by over $50 million, on an annual basis. These initiatives include:
| • | approximately $25 million for programs to streamline our operations and lower staffing levels, |
7
Table of Contents
| • | approximately $10 million associated with the shutdown of SIS production in our Pernis facility in 2008; |
| • | approximately $5 million in cost reductions related to the implementation of our new Enterprise Resource Planning (“ERP”) system in 2009; and |
| • | approximately $12 million in ongoing cost reductions related to the shutdown of IR production in our Pernis facility. |
Through these actions, we have created substantial operating leverage in our business and we continue to pursue initiatives to lower our cost structure and improve operational efficiencies.
New Innovations
Consistent with our strategy, we believe that we continue to lead SBC innovation as evidenced by numerous developments announced across several of our core end use markets throughout 2010. Below are our most recently announced product innovations.
In May 2010, we announced we commercialized DX405 as a new functional polymer to our product line of polymers for Adhesives, Sealants, and Coatings. This technology will allow our customers to more efficiently and expediently manufacture products that are stronger and softer. DX405 has a low styrene content, which promotes ease of processing, low viscosity, and the attainment of lower application temperatures. This adds efficiency and simplification to the manufacturing process, which shortens batch times, increases extrusion rates and improves productivity. DX405 has a wide formulation window and its versatility makes it suitable for solvent-based compositions, hot melt adhesives, and sealant applications. It can be formulated with other polymers, resins, fillers, pigments, oils, thickeners, waxes and stabilizers to obtain a desired balance of properties.
In July 2010, we announced the addition of Kraton D1183 BT, a new SIS grade, to our line of polymers for use in applications where softness, ease-in-processing, and high temperature resistance are essential. Kraton D1183 BT is suitable for use in many adhesive applications including thermal printing labels, high temperature resistant labels, elastic labels and diaper tabs. It is an excellent choice for adhesives in hygiene applications and its shear strength is particularly good at body temperature. Moreover, it offers economically attractive adhesive formulations, and gives formulators the ability to dilute it further to obtain equivalent performance levels of competing products, which can result in cost-savings. It can also achieve significantly higher cohesive strength and higher temperature resistance without the use of expensive endblock resins. Therefore, Kraton D1183 BT is not only economically attractive, but also substantially stronger and offers a wider formulating space than products currently on the market. Prior to the commercialization of Kraton D1183 BT, innovators used low-coupled SIS block copolymers to impart softness to end-products. Although they offered improved adhesion on open and porous substrates and good label die-cutting performance, they often lacked cohesion, which hampered their use in applications where higher shear and temperature resistance was required. In comparison, Kraton D1183 BT is a 40% diblock SIS, which shows superior performance to low-coupled SIS block copolymers and, we believe, is therefore the polymer of choice for these applications.
In August 2010, we announced that our roof coating formulation containing Kraton G1643 exceeds requirements in the ASTM International D6083 standard specification recognized in the elastomeric roof coating market. ASTM D6083 is an industry standard that establishes minimum performance levels in the following areas: viscosity, weight and volume solids; mechanical properties; adhesion; low temperature flexibility after accelerated weathering; tear resistance; permeation and water swelling; and fungi resistance. This gives innovators an opportunity to more effectively compare polymer-to-polymer for roof coating formulations. This SBC-based polymer has a proven track record of improving the performance of roof coatings because it adds superior water resistance, improved adhesion, and increased elongation to formulations. In December 2010, elastomeric roof coating formulation containing Kraton G1643 completed a major milestone towards achieving the ENERGY STAR rating, the trusted, government-backed symbol for products that are energy efficient,
8
Table of Contents
cost-effective and sustainable. We tested the reflectance and emittance of our G1643 elastomeric roof coating formulation using ASTM C1549 and ASTM C1371 standards. The results indicated reflectance of 0.89, and emittance of 0.88, respectively, which are considered best in class when compared to other roof coatings formulations in the market today. Reflectance and emittance properties are measured on a scale of 0 - 1.0 where 1.0 is the most reflective or emissive according to the Cool Roof Rating Council (CRRC). The ENERGY STAR program also uses these standards to evaluate the energy efficiency of elastomeric roof coatings. Roof coating formulations containing Kraton G1643 can reduce the total cost of installation and offer a fast cure coating that works better in cold, humid, or wet conditions. They can withstand ponding water, provide excellent adhesion to all types of roofing substrates, are ideal for low slope roofs (or high traffic areas), deliver excellent reflectance to reduce energy costs, and extend the life of a roof. It can be used to help lower volatile organic compounds (VOCs) in a solvented formulation, which have significant vapor pressures that can affect the environment and human health. In addition, our tested formulation can be used under the EPA’s regulation for thermoplastic rubber coatings and mastic.
In October 2010, we announced the development of a new SBC-based alternative for slush molded interior soft skins. Slush molding is a specialized processing operation traditionally designed for polyvinyl chloride (PVC) based compounds to produce the interior surface of automobiles such as instrument panel skins, door panels, airbags and consoles. Kraton Performance Polymers and SO.F.TER. SPA formed a strategic alliance to leverage the leading innovation and scientific capabilities of both companies. This resulted in the development of a superior and more environmentally-friendly alternative to PVC and thermoplastic polyurethanes (TPU) which provides a major technology and performance leap for the automotive industry. Manufacturers can achieve significant improvements in low-temperature performance, fogging, and recyclability while still using existing slush molding equipment and standard processing conditions. An additional benefit is lowered manufacturing costs due to reduced service temperatures and decreased processing time. Our new product provides a 30% to 40% reduction in material weight, better aging properties, and improved soft touch compared to existing materials. These benefits help automotive manufacturers reduce the weight of vehicle components, while enhancing aesthetics and performance.
Products
Our Kraton polymer products are high performance elastomers, which are engineered for a wide range of end use applications. Our products possess a combination of high strength and low viscosity, which facilitates ease of processing at elevated temperatures and high processing speeds. Our products can be processed in a variety of manufacturing applications, including injection molding, blow molding, compression molding, extrusion, hot melt and solution applied coatings.
We offer our customers a broad portfolio of products that includes approximately 250 core commercial grades of SBCs. We believe that the diversity and depth of our product portfolio is unmatched in the industry, serving the widest set of applications within each end use.
While we organize our commercial activities around our four core end uses, we manufacture our products along five primary product lines based upon polymer chemistry and process technologies: (1) USBCs; (2) HSBCs; (3) IR; (4) IRL; and (5) Compounds. The majority of worldwide SBC capacity is dedicated to the production of USBCs, which are primarily used in the Paving and Roofing, Adhesives, Sealants and Coatings and Footwear end use applications. HSBCs, which are significantly more complex and capital-intensive to manufacture than USBCs, are primarily used in higher value-added end uses, including soft touch and flexible materials, personal hygiene products, medical products, automotive components and certain adhesives and sealant applications. The following product summaries highlight our portfolio of product grades, their key performance characteristics and selected applications:
HSBCs. We developed the first HSBC polymers in the late 1960s for use in production of soft, strong compounds for handles and grips and elastic components in diapers. As of December 31, 2010, our HSBC product portfolio includes 106 core commercial grades of products. Our technical expertise in HSBC
9
Table of Contents
manufacturing and our history of HSBC innovation have led to what we believe is a number one market share of HSBC sales in terms of industry sales revenue. HSBC products are significantly more complex to produce than USBC products and, as a result, generally command selling prices that are significantly higher than those for USBCs and generate higher margins. Sales of HSBC products comprised approximately 33%, 34%, and 31% of our total sales revenue (which excludes by-product sales) in 2010, 2009 and 2008, respectively.
HSBC products impart higher performance characteristics than USBC products including: color range and stability, including resistance to ultraviolet light; processing stability and viscosity; and elevated temperature resistance. HSBCs are primarily used in our Advanced Materials and our Adhesives, Sealants and Coatings end use markets to impart improved performance characteristics such as: (1) stretch properties in disposable diapers and adult incontinence products; (2) soft feel in numerous consumer products such as razor blades, power tools, and automobile internals; (3) impact resistance for demanding engineering plastic applications; (4) flexibility for wire and cable plastic outer layers; and (5) improved flow characteristics for many industrial and consumer sealants lubricating fluids.
USBCs. We developed the first USBC polymers in 1964. Our flagship Belpre, Ohio, site, the first dedicated block copolymer plant, was built in 1971. As of December 31, 2010, our USBC product portfolio includes 146 core commercial grades of products. We believe we hold the number one market share of USBC sales in terms of industry sales revenue, excluding Footwear. Sales of USBC products comprised approximately 67%, 66%, and 69% of our total sales revenue (which excludes by-product sales) in 2010, 2009 and 2008, respectively.
USBCs are used in all our end use markets in a range of products to impart desirable characteristics, such as: (1) resistance to temperature and weather extremes in roads and roofing; (2) resistance to cracking, reduced sound transmission and better drainage in porous road surfaces; (3) impact resistance for consumer plastics; and (4) increased processing flexibility in adhesive applications, such as packaging tapes and labels, and materials used in disposable diapers. As with SBCs in general, USBCs are most often blended with substrates to impart the aforementioned performance enhancements. We made the strategic decision to largely exit the less attractive footwear market and focus our resources on the greater value proposition offered by the remaining end uses for our USBC products.
IR. Isoprene Rubber (formed from polymerizing isoprene) is a line of high purity isoprene rubber products and is a non-SBC product. These products combine the key qualities of natural rubber, such as good mechanical properties and hysteresis, with superior features such as high purity, excellent clarity, good flow, low gel content, no nitrosamines and no natural rubber proteins. Our IR polymers are available as bales of rubber or as latex. IR polymers are useful in the production of medical products, adhesives, tackifiers, paints, coatings and photo-resistors. We include IR in our USBC product line.
IRL. Isoprene Rubber Latex (emulsion of IR in water) is a substitute for natural rubber latex, particularly in applications with high purity requirements, such as medical, healthcare, personal care and food contact operations. Our IRL is unique polyisoprene latex with controlled structure and low chemical impurity levels manufactured through an anionic polymerization process followed by a proprietary latex processing step, both of which were developed by us. IRL is durable, tear resistant, soft, transparent and odorless. In addition, the synthetic material has unparalleled consistency, and it is non-allergenic, providing a distinct property advantage over natural rubber latex. We include IRL in our USBC product line.
Compounds. Our Compounds are a mixture of Kraton polymers and other polymers, resins, oils or fillers to enhance the final properties for processing. Compounds cover a wide range of polymers tailored to meet specific customer needs in consumer and industrial applications. Compounds can be formulated so that they can be extruded, injection molded, foamed, etc. to meet the final application requirements. These products are primarily used in soft-touch grips, sporting equipment, automotive components and personal care products. Compounds comprised approximately 2%, 3%, and 3% of our total sales revenue in 2010, 2009 and 2008, respectively. Compounds are included in our USBC and HSBC product lines, as appropriate.
10
Table of Contents
Our End Use Markets
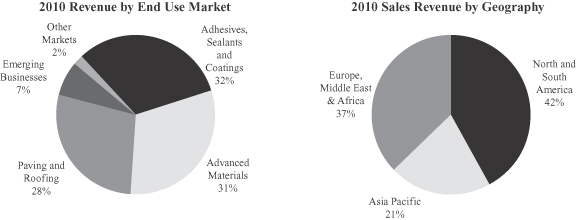
We have aligned our commercial activities to serve four core end use markets that we believe have the highest growth and profitability potential: (1) Advanced Materials; (2) Adhesives, Sealants and Coatings; (3) Paving and Roofing; and (4) Emerging Businesses. The following table describes our four core end use markets and other end use markets, and their approximate relative sizes:
| Revenue Mix (1) | ||||||||||||||
| End Use Markets |
2010 | 2009 | 2008 | Selected Applications/Products | ||||||||||
| Advanced Materials |
31 | % | 31 | % | 30 | % | • Soft touch for consumer products (tooth brushes and razor blades) and power tools • Impact resistant engineering plastics • Impact resistant for polyolefin based totes and bins • Automotive components • Elastic films for disposable diapers and adult incontinence branded products • Skin care products and lotions • Disposable food packaging • Medical packaging films and tubing, often as alternative to PVC • Wire & cable insulation/jacketing, alternative to PVC | |||||||
| Adhesives, Sealants and Coatings |
32 | % | 32 | % | 32 | % | • Tapes and labels • Non-woven and industrial adhesives • Industrial and consumer weather sealants | |||||||
| Paving and Roofing |
28 | % | 26 | % | 31 | % | • Asphalt modification for performance roadways, bridges and airports • Asphalt modification for roofing felts and shingles | |||||||
| Emerging Businesses |
7 | % | 7 | % | 3 | % | • Surgical gloves • Condoms | |||||||
| Other Markets |
2 | % | 4 | % | 4 | % | • Lubricants and fuel additives • High styrenics’ packaging • Footwear | |||||||
| (1) | Based on 2010, 2009 and 2008 sales of $1,228 million, $920 million and $1,171 million (excludes by-product sales, which are reported as other revenues). |
Advanced Materials. Through sales of HSBC, USBC and IR products, as well as certain Compounds, we maintained a leading position in the global Advanced Materials end use market.
In the Advanced Materials end use market, our products compete against a wide variety of chemical and non-chemical alternatives, including thermoplastic vulcanizates, ethylene propylene diene monomer rubber, known as EPDM, thermoplastic polyolefin elastomers and thermoplastic polyurethanes, known as TPUs. The choice between these materials is influenced by performance characteristics, ease of use, desired aesthetics and total end-product cost. In addition, competing materials include spandex, natural rubber, polyvinyl chloride polymers and compounds, polyolefins, polyethylene terephthalate, known as PET, nylon and polycarbonate, based on performance, ease of use, desired aesthetics and total end-product cost.
Advanced Materials polymers and compounds from Kraton are used in a range of diverse applications, many of which require customized formulations, product testing with long lead time approvals, and production
11
Table of Contents
evaluations for specific end use customers and applications. As such, customer loyalty tends to be strongest in this end use market, helped in part by the fact that many of the applications are patent protected. The degree of complexity in the manufacturing of these products and the attractive value proposition for our customers drives higher sustainable margins for this end use market.
We believe our Advanced Materials’ growth is driven by customers’ desire for improved product flexibility and resilience, impact resistance, moisture resistance and aesthetics (clarity and feel) in consumer products, medical products, packaging and automotive components. In addition, due to health and environmental concerns, one trend that is particularly a focus for our company is in providing alternative solutions to PVC in a number of demanding medical (blood and intravenous bags, tubes and stoppers) and electronic (wire and cable outer layer) applications.
A differentiating driver for our expected Advanced Materials’ growth is our unique ability to design and manufacture certain custom compound formulations. One specific example is Kraton compounds that provide critical stretch performance for the infant care (diaper) and adult incontinence markets.
Revenue from Advanced Materials represented approximately 31%, 31%, and 30% of total sales revenue (which excludes by-product sales) in 2010, 2009 and 2008, respectively.
Adhesives, Sealants and Coatings. Through sales of HSBC, USBC and certain IR products, we have continued our tradition of holding a leading position in the global Adhesives, Sealants and Coatings end use market.
In the Adhesives, Sealants and Coatings end use market, SBC products primarily compete with acrylics, silicones, solvent-based rubber systems and thermoplastic polyolefin elastomers. The choice between these materials is influenced by bond strength, specific adhesion, consistent performance to specification, processing speed, hot-melt application, resistance to water and total end-product cost.
Our Adhesives, Sealants and Coatings polymers are used in a number of demanding applications such as: adhesives for diapers and hygiene products; sealants for construction and automotive applications; and adhesives for tapes and labels. Our coatings polymers have expanded into the high growth market of elastomeric white roof coatings. The coating provides not only weather resistance, but improved energy efficiency, reducing solar absorption on bitumen based industrial roofs. We expect our growth to be supported by the continuing substitution of adhesives for mechanical fastening systems and the growing demand within developing countries for disposable hygiene products that contain adhesives and sealants.
Another significant growth application for our SBCs is for tapes and labels. In both solvent-based and hot-melt forms, Kraton SBCs impart water resistance, color stability, strong bonding characteristics, high cohesive strength, good ultraviolet light resistance, heat stability and long shelf life. Specifically, the pressure sensitive label market continues to expand using SBC technology at the expense of paper labels, driven by cost reduction and higher consumer market appeal. In addition, our SBCs’ compatibility with many other formulating ingredients and their suitability for hot-melt systems are major factors in demand growth. Furthermore, we believe use of our styrene-isoprene-butadiene-styrene (SIBS) with rosin esters, C9 & C5/C9 based hydrocarbon resins can produce a tape with properties similar to a traditional styrene-isoprene-styrene (SIS) hydrocarbon resin formulation but lower use of hydrocarbon resins which are in tight supply. We have expanded our offering of formulated compounds for adhesive films that protect LCD panels and consumer appliances providing improved adhesive performance with no residue or haze after removal. Both applications are growing rapidly in Asia as SBC based technology penetrates preferentially versus acrylic based films. In 2008, we largely exited the increasingly commoditized portions of the tape and label business, choosing to refocus our development and manufacturing capacity on higher value-added and more proprietary products. Our history of innovation in the Adhesives, Sealants and Coatings end use market has allowed us to capitalize on our unique product offerings, significantly enhancing the value of this end use market to the business.
12
Table of Contents
Revenue from Adhesives, Sealants and Coatings represented approximately 32%, 32%, and 32% of total sales revenue (which excludes by-product sales) in 2010, 2009 and 2008, respectively.
Paving and Roofing. In 2010, we maintained a leading market position in the global asphalt modification SBC industry, primarily through sales of USBC products.
We believe that our sales into the Paving and Roofing end use market will see meaningful growth driven by an overall volume recovery to a level more in line with historical norms, improvement in roofing demand including re-stocking of depleted roofing supply chains, and continued penetration globally of polymer modified road surfaces.
The addition of our SBS in asphalt greatly improves the strength and elasticity of asphalt-based paving compositions over an extended temperature range, thus increasing resistance to wear, rutting and cracking. In roofing applications, SBS-modified asphalt produces stronger and more durable felts and shingles, thus reducing the possibility of damage from weather, ice and water build-up and again extending service life.
We believe our growth in the Paving and Roofing end use market will benefit from new products we have recently introduced, and those that are currently under development, to respond to industry trends for elevated polymer content roads and surfaces, over-lay compatibility with concrete systems, and general environmental awareness (for example, road construction emissions).
Revenue from Paving and Roofing represented approximately 28%, 26%, and 31% of total sales revenue (which excludes by-product sales) in 2010, 2009 and 2008, respectively.
Emerging Businesses. In this end use, we commercialize and manage innovations that are outside of our other three primary end use markets. Currently, Emerging Businesses includes our IR and IRL businesses. IR is a line of high purity isoprene rubber products that combines the key qualities of natural rubber, such as good mechanical properties and hysteresis, with superior features such as high purity, excellent clarity, good flow, low gel content, no nitrosamines and no natural rubber proteins. IR polymers in general are used in high volume, lower value-added applications such as tire rubber. However, we focus our unique IR polymers, produced using state-of-the-art nanotechnology, in more demanding applications such as medical products, adhesives and tackifiers, paints, coatings and photo-resistors. Approximately half of our current IR production is converted into IRL (emulsion of IR in water), a substitute for natural rubber latex, particularly in applications with high purity requirements, such as medical, healthcare, personal care and food contact applications. IRL is durable, tear resistant, soft, transparent and odorless. Most importantly, IRL is non-allergenic for both doctor and patient, providing a distinct property advantage over natural rubber latex.
IRL is predominately used in the synthetic surgical gloves and condoms markets. Our IRL business has grown, on a revenue basis, at a compound annual growth rate of 36% from 2008 to the end 2010. The combination of increasing demand, favorable market dynamics and competitive differentiation make this a key product offering for us. We currently anticipate growth to continue for the foreseeable future, and will likely need to continue adding capacity to our global supply system.
Revenue from Emerging Businesses represented approximately 7%, 7%, and 3% of total sales revenue (which excludes by-product sales) in 2010, 2009 and 2008, respectively.
Research, Development and Technology
Our research and development program is designed to develop new products and applications, provide technical service to customers, develop and optimize process technology and assist in marketing new products. We spent $24 million, $21 million, and $27 million for research and development for the years ended
13
Table of Contents
December 31, 2010, 2009 and 2008, respectively. From time to time, we also engage in customer-sponsored research projects, with spending of approximately $1 million a year for the three-year period ended December 31, 2010. As of December 31, 2010, 103 personnel are dedicated to this critical business activity.
Our research and development activities are primarily conducted in laboratories in Houston, Texas, and Amsterdam, the Netherlands. We also own a laboratory in Paulinia, Brazil, that provides technical services to our South American customers. Our application and technical service laboratories in Shanghai, China and Tsukuba, Japan provide support to our Asian customers. In addition, we have technical service staff located in Mont St. Guibert, Belgium.
Our experienced, knowledgeable professionals perform research using extensive scientific application equipment located at our Houston and Amsterdam research and development facilities. At both of our major research and development facilities, we produce new Kraton product samples for our customers and provide guidance to our manufacturing organization. Application equipment is used to evaluate polymers and compounds to determine optimal formulations. Our Houston facility also includes a comprehensive pilot plant to test new raw materials and new process technologies in order to improve the manufacturing performance of our products.
Since the introduction of SBCs in the mid-1960s, we have experienced strong demand for the development of new products that utilize the enhancing properties offered by our polymers. We believe we have a strong new product pipeline to take advantage of many new opportunities. As a proven product innovator, we will continue to employ our product knowledge and technical expertise to provide application-based solutions for our customers’ highly specialized needs. This can include modifications to current products as well as significant new innovations aimed at displacing more expensive, less efficient product solutions in the marketplace.
Sales and Marketing
Our business is predominantly based on a short sales cycle. We sell our products through a number of channels including a direct sales force, marketing representatives and distributors. The majority of our products are sold through our direct sales force. In countries where we generate substantial revenues, our sales force is organized by end use market in order to meet the specific needs of our customers. In geographic areas where it is not efficient for us to organize our sales force by end use market, we may use one sales team to service all end use markets.
In smaller markets, we often utilize marketing representatives who act as independent contractors to sell our products. In addition, we utilize distributors to service our smaller customers in all regions. Distributors sell a wide variety of products, which allows smaller customers to obtain multiple products from one source. In addition to our long-term relationships with distributors in North America and Europe, we have established relationships with a wide network of distributors in Latin America and the Asia Pacific region.
Our sales force, distributors and agents interact with our customers to provide both product advice and technical assistance. In general, they arrange and coordinate contact between our customers and our research and development personnel to provide quality control and new product solutions. Our close interaction with our customers has allowed us to develop and maintain strong customer relationships. In addition, we focus our sales efforts on those customers who value the quality of our products, service and technical support.
Total operating revenues from our operations outside the United States were approximately 66%, 67%, and 66% of our total operating revenues in the years ended December 31, 2010, 2009 and 2008, respectively. Direct sales we make outside of the United States are generally priced in local currencies and can be subject to currency exchange fluctuations when reported in our consolidated financial statements, which are maintained in U.S. dollars in accordance with U.S. Generally Accepted Accounting Principles (GAAP). For geographic reporting, revenues are attributed to the geographic location in which the customers’ facilities are located. We generated
14
Table of Contents
approximately 42% of our 2010 sales from customers located in the Americas, 37% in Europe, the Middle East and Africa and 21% in the Asia Pacific region. See Note 12 to our Consolidated Financial Statements for geographic reporting for total operating revenues and long-lived assets as of and for the years ended December 31, 2010, 2009 and 2008.
Sources and Availability of Raw Materials
We use three monomers as our primary raw materials in the manufacture of our products: styrene, butadiene and isoprene. For the years ended December 31, 2010, 2009, and 2008, these monomers together represented approximately 56%, 43%, and 49% of our total cost of goods sold, respectively. The cost of these monomers has generally correlated with changes in crude oil prices. Prices have fluctuated significantly due to global supply and demand and global economic conditions. During 2009, styrene pricing increased from lows in the first quarter of 2009 trending higher through the second half of 2009. Styrene pricing remained volatile in 2010 with prices up in the first half of 2010, declining in the third quarter, then rising to a higher level in the fourth quarter. Butadiene pricing also increased from the lows of the first quarter of 2009 and stabilized during the third quarter of 2009. During 2010, butadiene pricing increased into the third quarter before declining in the fourth quarter. In 2009, spot isoprene prices were volatile in the first half of the year, but prices stabilized during the third quarter of 2009 before trending higher in late 2009. Spot isoprene pricing continued to increase through the first half of 2010 before declining in the second half due to improved supply/demand. Overall, monomer pricing in the fourth quarter of 2010 was comparable to the third quarter of 2010, and average monomer costs in 2010 were up significantly compared to 2009. Styrene, butadiene and isoprene used by our U.S. and European facilities are predominantly supplied by a portfolio of suppliers under long-term supply contracts and arrangements with various expiration dates. For our U.S. facilities, we also procure a substantial amount of isoprene from a variety of suppliers from Russia, China and Japan. These purchases include both spot and contract arrangements. We generally contract with these suppliers on a short-term basis, and the number of such contracts has been increasing since 2008. We have increased the number of these contracts since 2008 to ensure the availability of our isoprene supply.
In Japan, butadiene and isoprene supplies for our joint venture plant are supplied under our joint venture agreement, where our partner supplies our necessary requirements. Styrene in Japan is sourced from local third-party suppliers. Our facility in Paulinia, Brazil, generally purchases all of its raw materials from local third-party suppliers.
We believe our contractual and other arrangements with suppliers of styrene, butadiene and isoprene provide an adequate supply of raw materials at competitive, market-based prices. We can provide no assurances that contract suppliers will not terminate these contracts at the expiration of their contract terms, that we will be able to obtain substitute arrangements on comparable terms, or that we generally will be able to source raw materials on an economic basis in the future.
Styrene. Styrene is available on the global petrochemical market with approximately 11 producers located in the Americas, 13 producers located in Europe and 49 producers located in Asia. The top five producers worldwide are: Shell Chemicals, LyondellBasell, BASF, Total and Ineos, which collectively account for approximately 29% of global capacity. Styrene prices are primarily driven by worldwide supply and demand and the cost of ethylene and benzene and are influenced by prevailing crude oil and natural gas prices.
We satisfy our styrene requirements in the United States pursuant to several purchase agreements with maturities up to the end of 2011, subject to renewal conditions. Our contracts that satisfied our styrene requirements in Europe expired on February 28, 2010 and we have executed one supply agreement with a vendor that will cover a portion of our requirements and are finalizing a second supply agreement with another vendor that we anticipate will satisfy our remaining needs for styrene through February 2013. In Japan and Brazil, styrene is sourced from local third-party suppliers. As contracts expire, we cannot give assurances that we will obtain new long-term supply agreements or that the terms of any such agreements will be on terms favorable to us, and consequently our future acquisition costs for styrene may therefore increase.
15
Table of Contents
For our agreements covering our manufacturing facility in the United States, the price we pay for styrene varies with the published prices of styrene and/or the raw materials used to produce styrene. The price we pay for styrene under our agreements covering France and Germany reflects market conditions and varies with factors including the published prices for styrene.
Butadiene. Butadiene is available on the global petrochemical market with approximately 7 producers in the Americas, 20 producers in Western Europe and 37 producers located in Asia. Prices for butadiene reflect worldwide supply and demand and prevailing crude oil and ethylene prices. We believe our contractual and other arrangements with our suppliers will generally provide adequate supplies of butadiene at competitive prices to support our current sales levels. Growth in the production of our products that require butadiene could be limited by our ability to source additional butadiene at competitive prices.
We currently source butadiene in the United States pursuant to contractual arrangements with maturities up to the end of 2012, subject to renewal conditions. Prices for U.S. butadiene purchases vary with the published prices for butadiene on world markets. Due to political unrest in Libya and U.S. sanctions recently imposed upon the Libyan government and certain members of the Qadhafi family, crude C4 exports to the United States from Libya could be interrupted, which could affect our ability to obtain butadiene in the United States in the quantities or at the prices we require. We have supplemented our requirements by purchasing spot supply as needed. No assurances can be given that any other agreement(s) will be entered into or as to the volumes or terms of any such agreement(s).
We currently source our butadiene in Europe pursuant to contracts and arrangements with LyondellBasell. The contract covering Germany will expire on December 31, 2040, and will be renewed automatically at the conclusion of the current term unless terminated with prior written notice by either party. The contract covering France expired effective December 31, 2008. We are presently acquiring butadiene in France from LyondellBasell under interim arrangements, pending resolution of an agreed arbitration between the parties to determine, among other matters, the effect of a term sheet previously reached between the parties that had been governing Butadiene purchases by us from LyondellBasell at Berre from January 2009 until September 2010. In this regard, we can provide no assurance as to the nature of any final arrangement whereby we will continue to purchase butadiene from LyondellBasell at Berre, including, without limitation, the volumes, prices or terms of sale that would be applicable to any such final arrangement. The price we pay for butadiene under our arrangements or agreements covering France and Germany vary based upon the published price for butadiene, the amount of butadiene purchased during the preceding calendar year and/or the cost of butadiene manufactured.
In Brazil, butadiene is obtained from a local third-party source. In Kashima, Japan, a majority of our butadiene needs are sourced from JSR Corporation (“JSR”) on a commercial supply basis. As contracts expire, we cannot give assurances that we will obtain new long-term supply agreements, or that the terms of any such agreements will be on terms favorable to us, and as a consequence, our future acquisition costs for butadiene may therefore increase.
Isoprene. Isoprene is primarily produced and consumed captively by manufacturers for the production of IR, which is primarily used in the manufacture of rubber tires. As a result, there is limited non-captive isoprene available in the market place. Prices for isoprene are determined by the supply and prices of natural and synthetic rubber, crude oil and natural gas prices, and existing supply and demand in the market.
We source our global isoprene requirements through several contractual arrangements. We also purchase additional supplies of isoprene from various suppliers at prevailing market prices. In Kashima, Japan, the majority of our isoprene needs are sourced from JSR on a commercial supply basis and from alternative suppliers as needed. As contracts expire, we may not be able to obtain new long-term supply agreements and the terms of any such agreement may not be on terms favorable to us.
We have historically had adequate supplies of isoprene. However, we have periodically experienced periods of limited supply due to operational problems at key producers, or as was the case during 2008, due to limited availability of crude raw materials for the isoprene extraction units. During these periods, we are normally able to
16
Table of Contents
meet most of our needs by acquiring relatively expensive isoprene from other suppliers. After an initial improvement in supply availability in 2008, isoprene availability was reduced for most of 2008. In response, we were forced to allocate SIS supplies. Similarly, supply constraints in 2009 limited isoprene purchases under some of our existing contracts. We satisfied our requirements by supplementing purchases from a variety of other suppliers. Going forward, we believe our contractual arrangements with several suppliers as well as spot arrangements and longstanding relationships with other third-party suppliers of isoprene will generally provide adequate future supplies of isoprene at competitive prices to support our current sales levels. Growth in the production of our products that require isoprene could be limited by our ability to source additional isoprene at competitive prices, and we can provide no assurances in this regard.
Competition
We compete with other SBC product and non-SBC product producers primarily on the basis of price, breadth of product availability, product quality and speed of service from order to delivery. We believe our customers also base their supply decisions on the supplier’s ability to design and produce custom products and the availability of technical support.
SBC Industry. Our most significant competitors in the SBC industry are: Asahi Chemical, Chi Mei, Dexco Polymers, Dynasol Elastomers, Kuraray, Korea Kumho P.C., Lee Chang Yung, LG Chemical, Polimeri Europa, Sinopec, Taiwan Synthetic Rubber Corporation and Zeon Corporation. Generally, however, individual competitors do not compete in all of our end use markets. Rather, there are different competitors in each of our end use markets, which is indicative of the depth and breadth of our product offerings.
Product Substitution. We also compete against a broad range of alternative, non-SBC products within each end use market.
In the Advanced Materials end use market, our products compete against a wide variety of chemical and non-chemical alternatives, including thermoplastic vulcanizates, ethylene propylene diene monomer rubber, known as EPDM, thermoplastic polyolefin elastomers and thermoplastic polyurethanes, known as TPUs. The choice between these materials is influenced by performance characteristics, ease of use, desired aesthetics and total end-product cost. In addition, competing materials include spandex, natural rubber, polyvinyl chloride polymers and compounds, polyolefins, polyethylene terephthalate, known as PET, nylon and polycarbonate, based on performance, ease of use, desired aesthetics and total end-product cost.
In the Adhesives, Sealants and Coatings end use market, the primary product alternatives include acrylic polymers, silicones, solvent-based natural rubber systems and metallocene polyolefins.
In the Paving and Roofing end use market, the primary product substitute for roofing is atactic polypropylene, whereas for road surfaces it is styrene butadiene rubber, or SBR. Customers also have a choice to use unmodified asphalts.
Operating and Other Agreements
Operating Agreements. Shell Nederland Refinery operated our manufacturing facility located in Pernis, the Netherlands until December 31, 2009 when we ceased production at Pernis and completed the exit of the location and terminated the relevant operating agreements effective March 31, 2010.
LyondellBasell operates our manufacturing facility located in Berre, France. This facility is situated on a major LyondellBasell refinery and petrochemical site at which other third party tenants also own facilities. LyondellBasell charges us fees based on certain costs incurred in connection with operating and maintaining this facility, including the direct and indirect costs of employees and subcontractors, reasonable insurance costs, certain taxes imposed on LyondellBasell (other than income taxes) and depreciation and capital charges on certain assets. Pursuant to the agreement, LyondellBasell employs and provides all staff, other than certain plant
17
Table of Contents
managers, assistant plant managers and technical personnel whom we may appoint. The agreement has an initial term of 20 years, beginning in February 2001, and thereafter will automatically renew indefinitely for consecutive five-year periods. Either party may terminate the agreement (totally or partially) under various circumstances, including if such party ceases its operations at the facility and provides 18 months prior written notice; or if any of the services, utilities, materials and facilities agreements have been terminated, and the terminating party provides notice as required by such agreement.
Pursuant to an agreement dated March 31, 2000, LyondellBasell operates and provides certain services, materials and utilities required to operate our manufacturing facility in Wesseling, Germany. We pay LyondellBasell a monthly fee, as well as costs incurred by LyondellBasell in providing the various services, even if the facility fails to produce any output (whether or not due to events within LyondellBasell’s control), and even if we reject some or all output. This agreement has an initial term of 40 years and will automatically renew subject to five years prior written notice of non-renewal. This agreement will terminate at any earlier date as of which the facility can no longer operate in a safe and efficient manner.
Site Services, Utilities, Materials and Facilities Agreements. LyondellBasell, through local operating affiliates, provides various site services, utilities, materials and facilities for the Berre, France, and Wesseling, Germany, manufacturing sites. Generally, these services, utilities, materials and facilities are provided by LyondellBasell on either a long-term basis, short-term basis or a sole-supplier basis. Items provided on a sole-supplier basis may not be terminated except upon termination of the applicable agreement in its entirety. Items provided on a long-term or short-term basis may be terminated individually under certain circumstances.
Information Systems
In 2009 and 2010, we upgraded our ERP software systems to support each of our facilities worldwide. In addition to providing increased reliability and functionality, we expect annual cost savings of approximately $5.0 million will be achieved as a result of the new ERP system. The ERP system is supported by internal resources. We also have in place a laboratory quality assurance system, including bar code based material management systems and manufacturing systems. An annual disaster recovery exercise is performed on critical systems utilizing third-party data centers.
Patents, Trademarks, Copyrights and Other Intellectual Property Rights
We rely on a variety of intellectual property rights to conduct our business, including patents, trademarks and trade secrets. As of December 31, 2010, approximately one-third of our patent portfolio (349 of 1,053) consisted of patent applications (the majority of which were filed after 2003). In light of the fact that patents are generally in effect for a period of 20 years as of the filing date, this means that a significant portion of the portfolio would remain in effect for a long period (assuming most of these applications will be granted). The granted patents and the applications cover both the United States and foreign countries. We do not expect that the expiration of any single patent or specific group of patents would have a material impact on our business. Our material trademarks will remain in effect unless we decide to abandon any of them, subject to possible third-party claims challenging our rights. Similarly, our trade secrets will preserve their status as such for as long as they are the subject of reasonable efforts, on our part, to maintain their secrecy. Since January 2003, we have filed 112 new patent applications with filings in the United States and many foreign countries. A significant number of patents in our patent portfolio were acquired from Shell Chemicals. Shell Chemicals retained for itself fully-transferable and exclusive licenses for their use outside of the elastomers field, as well as fully-transferable, non-exclusive licenses within the field of elastomers for certain limited uses in non-competing activities. Shell Chemicals is permitted to sublicense these rights. Shell Chemicals also retains the right to enforce these patents outside the elastomers field and recover any damages resulting from these actions. Shell Chemicals may engage in or be the owner of a business that manufactures and/or sells elastomers in the elastomers field, so long as they do not use patent rights or technical knowledge exclusively licensed to us.
18
Table of Contents
As a general matter, our trade names are protected by trademark laws. Our SBC products are marketed under the trademark “Kraton”, “Elexar”, and “Giving Innovators Their Edge”, which are registered, and “Nexar” and “Cariflex”, for which registration is pending in the United States and in many other countries.
In our almost 50 years in the SBC business, we have accumulated a substantial amount of technical and business expertise. Our expertise includes: product development, design and formulation, information relating to the applications in which our products are used, process and manufacturing technology, including the process and design information used in the operation, maintenance and debottlenecking of our manufacturing facilities, and the technical service that we provide to our customers. We hold extensive discussions with customers and potential customers to define their market needs and product application opportunities. Where necessary, we have implemented trade secret protection for our technical knowledge through non-analysis, secrecy and related agreements.
Employees
We had 884 full-time employees at December 31, 2010. In addition, 175 LyondellBasell manufacturing employees operate our manufacturing facilities and provide maintenance services in Europe under various operating and services arrangements. See “—Operating and Other Agreements.” None of our employees in the United States are subject to collective bargaining agreements. In Europe, Brazil and Japan, a significant number of our employees are in arrangements similar to collective bargaining arrangements. We believe our relationships with our employees continue to be good.
Environmental Regulation
Our operations in the United States and abroad are subject to a wide range of environmental laws and regulations at the national, state and local levels. These laws and regulations govern, among other things, air emissions, wastewater discharges, solid and hazardous waste management, site remediation programs and chemical use and management.
Pursuant to these laws and regulations, our facilities are required to obtain and comply with a wide variety of environmental permits for different aspects of their operations. Generally, many of these environmental laws and regulations are becoming increasingly stringent and the cost of compliance with these various requirements can be expected to increase over time.
On February 21, 2011, U.S. Environmental Protection Agency Regulations were promulgated and are awaiting publication in the Federal Register. If ultimately implemented as promulgated, these new regulations would require us to incur capital investments and asset retirement obligations (“ARO”) related to upgrading or replacing our coal-burning boilers at our Belpre, Ohio, facility. Preliminary capital expenditure and ARO requirements are estimated to be $20 million to $25 million and $5 million to $7 million, respectively, of which approximately $3 million may be spent in 2011 and the balance to be incurred between 2012 and 2014.
Environmental laws and regulations in various jurisdictions also establish programs and, in some instances, obligations to clean up contamination from current or historic operations. Under some circumstances, the current owner or operator of a site can be held responsible for remediation of past contamination regardless of fault and regardless of whether the activity was legal at the time that it occurred. Evaluating and estimating the potential liability related to site remediation projects is a difficult undertaking, and several of our facilities have been affected by contamination from historic operations.
Our Belpre, Ohio, facility is the subject of a site investigation and remediation program administered by the Environmental Protection Agency pursuant to the Resource Conservation and Recovery Act. In March 1997, Shell Chemicals entered into a consent order to investigate and remediate areas of contamination on and adjacent to the site. In March 2003, we joined Shell Chemicals in signing a new consent order that required additional remediation and assessment of various areas of contamination and continues to require groundwater-monitoring and reporting. Shell Chemicals continues to take the lead in this program, has posted financial assurance of
19
Table of Contents
$5 million for the work required under the consent order and has also indemnified us for the work required under this program, subject to the condition that we provide notice of any claims on or prior to February 28, 2021. In turn, we have agreed with Shell Chemicals that we will, for a fee, provide certain services related to the remediation program. We have agreed with Shell Chemicals that we will pay up to $100,000 per year for the groundwater monitoring associated with the 2003 consent order.
Our Brazilian facility has also been affected by prior Shell Chemicals operations. A Shell Chemicals pesticide manufacturing operation previously was located on a tract of land adjacent to our Brazilian facility. In addition, areas of our facility were used by Shell Chemicals as part of its crop protection business. Shell Chemicals has retained responsibility for remediating a former manufacturing facility located on our site and has also indemnified us for a number of the identified waste management areas used in prior operations. The indemnity from Shell Chemicals expired in 2004 for the following categories of claims to the extent notice was not previously provided by us: (1) remediation activity required by applicable environmental laws or third-party claims, (2) third-party claims for exposure to hazardous substances and (3) violations of environmental law. The indemnity for remediation relating directly to the plant for the previous pesticide manufacturing operations and for disposal activity related to that plant and for third-party claims regarding hazardous substance disposal requires us to give notice of any claims on or prior to February 28, 2021. Shell Chemicals has installed a hydraulic barrier to prevent migration of ground water contamination and has completed other cleanup actions on the site.
Shell Chemicals agreed to indemnify us for specific categories of environmental claims brought with respect to matters occurring before our separation from Shell Chemicals in February 2001. Coverage under the indemnity also varies depending upon the nature of the environmental claim, the location giving rise to the claim and the manner in which the claim is triggered. The indemnity from Shell Chemicals expired in 2004 for the following categories of claims to the extent notice was not previously provided by us: (1) site clean-up other than those matters specifically agreed with Shell Chemicals, (2) third-party claims for exposure to hazardous substances and (3) violations of environmental law. The indemnity for site clean-up matters specifically agreed with Shell Chemicals and for third-party claims regarding hazardous substance disposal requires us to give notice on or prior to February 28, 2021. Hence, if claims arise in the future related to past operations, we cannot give assurances that those claims will be covered by the Shell Chemicals’ indemnity and also cannot be certain that any amounts recoverable will be sufficient to satisfy claims against us.
In addition, we may in the future be subject to claims that arise solely from events or circumstances occurring after February 2001 that would not, in any event, be covered by the Shell Chemicals’ indemnity. While we recognize that we may, in the future, be held liable with respect to remediation activities beyond those identified to date, at present we are not aware of any circumstances that are reasonably expected to give rise to remediation claims that would have a material adverse effect on our results of operations or cause us to exceed our projected level of anticipated capital expenditures.
Insurance
We have customary levels of insurance for a company of our size in our industry. Our insurance policies are subject to customary deductibles and limits.
Seasonality
Seasonal changes and weather conditions, although difficult to predict, typically affect the Paving and Roofing end use market resulting in higher sales volumes into this end use market in the second and third quarters of the calendar year versus the first and fourth quarters of the calendar year. Our other end use markets tend to show relatively little seasonality.
20
Table of Contents
Available Information
We electronically file reports with the Securities and Exchange Commission (SEC), including annual reports on Form 10-K, quarterly reports on Form 10-Q, current reports on Form 8-K and amendments to such reports. The public may read and copy any materials that we file with the SEC at the SEC’s Public Reference Room at 100 F Street, N.E., Washington, D.C. 20549. The public may obtain information on the operation of the Public Reference Room by calling the SEC at 1-800-SEC-0330. The SEC also maintains an internet site that contains reports and information statements, and other information regarding issuers that file electronically with the SEC at http://www.sec.gov. Additionally, information about us, including our reports filed with the SEC, is available through our web site at http://www.kraton.com. Such reports are accessible at no charge through our web site and are made available as soon as reasonably practicable after such material is filed with or furnished to the SEC. Our website and the information contained on that site, or connected to that site, are not incorporated by reference into this report.
| Item 1A. | Risk Factors. |
Conditions in the global economy and capital markets may adversely affect the company’s results of operations, financial condition and cash flows.
Our products are sold in markets that are sensitive to changes in general economic conditions, such as automotive and construction products. Downturns in general economic conditions can cause fluctuations in demand for our products, product prices, volumes and margins. A decline in the demand for our products or a shift to lower-margin products due to deteriorating economic conditions could adversely affect sales of our products and our profitability and could also result in impairments of certain of our assets.
Our business and operating results have been affected by the global recession, dislocations in the housing and commercial real estate markets, fluctuating commodity prices, volatile exchange rates and other challenges currently affecting the global economy and our customers. There can be no assurance that the effects of the global recession on our business will continue to ease. If the global recession continues for significant future periods or significantly worsens, our results of operations, financial condition and cash flows could be materially adversely affected.
LyondellBasell Industries provides significant operating and other services under agreements that are important to our business. The failure of LyondellBasell to perform its obligations, or the termination of these agreements, could adversely affect our operations.
We have operating and service agreements with LyondellBasell Industries, or LyondellBasell, that are important to our business. We are a party to:
| • | operating agreements pursuant to which LyondellBasell (in Berre, France, and Wesseling, Germany) operates and maintains our European manufacturing facilities and employs and provides almost all of the staff for those facilities; |
| • | site services, utilities, materials and facilities agreements pursuant to which LyondellBasell provides utilities and site services to our European manufacturing facilities; and |
| • | lease agreements pursuant to which we lease our European manufacturing sites from LyondellBasell. |
Under the terms of the above agreements, either party is permitted to terminate the applicable agreement in a variety of situations. Should LyondellBasell fail to provide these services or should any operating agreement be terminated, we would be forced to obtain these services from third parties or provide them ourselves. Similarly, if in connection with or independent from the termination of an operating agreement, LyondellBasell terminates a facility lease, we would be forced to relocate our manufacturing facility. From time to time, as part of our ongoing business operations, we discuss potential changes in the terms of our various agreements with LyondellBasell, based upon changes in market conditions or other factors. Any agreed changes to any of these
21
Table of Contents
contractual arrangements are not effective until implemented by the parties. The failure of LyondellBasell to perform its obligations under, or the termination of, any of these agreements could adversely affect our operations and, depending on market conditions at the time of any such termination, we may not be able to enter into substitute arrangements in a timely manner, or on terms as favorable to us.
Under certain of these agreements, we are required to indemnify LyondellBasell in certain circumstances, including in certain circumstances for loss and damages resulting from LyondellBasell’s negligence in performing their obligations.
The failure of our raw materials suppliers to perform their obligations under long-term supply agreements, or our inability to replace or renew these agreements when they expire, could increase our cost for these materials, interrupt production or otherwise adversely affect our results of operations.
Our manufacturing processes use three primary raw materials: styrene, butadiene and isoprene. We use styrene in the production of most of our polymer products. We use butadiene in the production of SBS (styrene-butadiene-styrene) grades of USBCs and SEBS (styrene-ethylene-butylene-styrene) grades of HSBCs. We use isoprene in the production of SIS (styrene-isoprene-styrene) grades of USBCs, SEPS (styrene-ethylene-propylene-styrene) grades of HSBCs and polyisoprene rubber, or IR. We have entered into long-term supply agreements with Shell Chemicals, LyondellBasell and others to supply our raw material needs in the United States and Europe. As these contracts expire, we may be unable to renew these contracts or obtain new long-term supply agreements on terms favorable to us, which may significantly impact our operations.
Isoprene is primarily produced and consumed by manufacturers captively for the production of IR, which is primarily used in the manufacture of rubber tires. As a result, there is limited non-captive isoprene available for purchase in the markets in which we operate. Future isoprene requirements for our IR products will be met by our overall isoprene sourcing strategies. We may not be able to obtain isoprene required for our operations on terms favorable to us or at all.
In addition, most of our long-term contracts contain provisions that allow our suppliers to limit the amount of raw materials shipped to us below the contracted amount in certain circumstances. If we are required to obtain alternate sources for raw materials because a supplier is unwilling or unable to perform under raw material supply agreements or if a supplier terminates its agreements with us, we may not be able to obtain these raw materials from alternative suppliers in a timely manner or be able to enter into long-term supply agreements on terms as favorable to us. A lack of availability of raw materials could have an adverse effect on our results of operations.
If the availability of isoprene is limited, we may be unable to produce some of our products in quantities demanded by our customers, which could have an adverse effect on our sales of products requiring isoprene.
Isoprene is not widely available, and the few isoprene producers tend to use their production for captive manufacturing purposes or sell only limited quantities into the world chemicals market. The major producers of isoprene are Goodyear, Shell Chemicals, Nippon Zeon, Braskem, several Chinese producers and various Russian manufacturers. Currently, we source our isoprene requirements for the United States and Europe from a portfolio of suppliers. In Japan, we obtain the majority of our isoprene requirements from JSR, on a commercial supply basis and from alternative suppliers as needed. In Brazil, isoprene is obtained from a local third party supplier. These suppliers may not be able to meet our isoprene requirements, and we may not be able to obtain substitute supplies of isoprene from alternative suppliers in a timely manner or on favorable terms.
Because there is limited non-captive isoprene availability, the market for isoprene is thin and prices are particularly volatile. Prices for isoprene are determined by the supply and prices of natural and synthetic rubber, crude oil and natural gas prices and existing supply and demand in the market. Significant increases in the cost of isoprene could have a material impact on our results of operations. In addition, in the past, tight supply in the
22
Table of Contents
isoprene market has been exacerbated by operational problems of some key producers and reduced availability of crude C5 inputs for the extraction units. A lack of availability of isoprene could have an adverse effect on our results of operations if we are unable to produce products containing isoprene.
If the availability of butadiene is limited, we may be unable to produce some of our products in quantities demanded by our customers, which could have an adverse effect on plant utilization and our sales of products requiring butadiene.
The North American market is structurally short of butadiene and has relied on imports of crude C4 and/or butadiene to balance demand. Due to political unrest in Libya and U.S. sanctions recently imposed upon the Libyan government and certain members of the Qadhafi family, crude C4 exports to the United States from Libya could be interrupted, which could affect our ability to obtain butadiene in the United States in the quantities or at the prices we require. Historically, the European market has been better balanced and provided exports to North America. Currently, our butadiene requirements in the United States are satisfied by several suppliers, and LyondellBasell is our major butadiene supplier in Europe. In general, the quantity of butadiene available in any one region is dependent on the cracking inputs of olefins plants, ethylene demand, inter-regional demand for butadiene and demand for other oil derivatives. Suppliers may not be able to meet our butadiene requirements, and we may not be able to obtain substitute supplies of butadiene from alternative suppliers in a timely manner or on favorable terms.
Increases in the costs of our raw materials could have an adverse effect on our financial condition and results of operations if those costs cannot be passed onto our customers.
Our results of operations are directly affected by the cost of our raw materials. Our three principal raw materials (styrene, butadiene, and isoprene) together represented approximately 56% and 43% of our total cost of goods sold in fiscal year 2010 and 2009, respectively. In general, increases in the prices of crude oil have led to increases in the costs of butadiene and styrene, which would lead to increases in the cost of our raw materials. Political unrest in the Middle East and market dislocation resulting from U.S. sanctions relating thereto could lead to increases in the price of crude oil. Because of the significant portion of our cost of goods sold represented by these three monomers, our gross profit and margins could be adversely affected by changes in the cost of these raw materials if we are unable to pass the increases on to our customers.
Our end use markets are highly competitive, and we may lose market share to other producers of styrenic block copolymers or to producers of other products that can be substituted for our products.
Our industry is highly competitive and we face significant competition from large international producers, as well as from smaller regional competitors. Our competitors may improve their competitive position in our core end use markets by successfully introducing new products, improving their manufacturing processes or expanding their capacity or manufacturing facilities. If we are unable to keep pace with our competitors’ product and manufacturing process innovations, our financial condition and results of operations could be materially adversely affected.
Our most significant competitors are Asahi Chemical, Chi Mei, Dexco Polymers, Dynasol Elastomers, Korea Kumho P.C., Kuraray Company, Lee Chang Yung, LG Chemical, Polimeri Europa, Sinopec, Taiwan Synthetic Rubber Corporation and Zeon Corporation. Kuraray Company, Dynasol Elastomers, Korea Kumho P.C. and Sinopec have all expanded HSBC capacity over the last three years. Several competitors, including Dynasol, Lee Chang Yung and Sinopec, have expanded USBC capacity over the last three years.
In addition, competition between styrenic block copolymers and other products within the end use markets in which we compete is intense. Increased competition from existing or newly developed non-SBC products may reduce demand for our products in the future and our customers may decide on alternate sources to meet their requirements.
| • | In the Advanced Materials end use market, our products compete against a wide variety of chemical and non-chemical alternatives, including thermoplastic vulcanizates, ethylene propylene diene monomer rubber, known as EPDM, thermoplastic polyolefin elastomers and thermoplastic polyurethanes, known as TPUs. The choice between these materials is influenced by performance |
23
Table of Contents
| characteristics, ease of use, desired aesthetics and total end-product cost. In addition, competing materials include spandex, natural rubber, polyvinyl chloride polymers and compounds, polyolefins, polyethylene terephthalate, known as PET, nylon and polycarbonate, based on performance, ease of use, desired aesthetics and total end-product cost. |
| • | In the Adhesives, Sealants and Coatings end use market, SBC products primarily compete with acrylics, silicones, solvent-based rubber systems and thermoplastic polyolefin elastomers. The choice between these materials is influenced by bond strength, specific adhesion, consistent performance to specification, processing speed, hot-melt application, resistance to water and total end-product cost. |
| • | In the Paving and Roofing end use market, our products primarily compete with atactic polypropylene, styrene butadiene rubber and unmodified asphalts. The choice between these materials is influenced by total end-product performance, cost and ease of use. |
If we are unable to successfully compete with other producers of styrenic block copolymers or if other products can be successfully substituted for our products, our sales may decline.
If we are not able to continue the technological innovation and successful commercial introduction of new products, our customers may turn to other producers to meet their requirements.
Our industry and the end use markets into which we sell our products experience periodic technological change and ongoing product improvements. In addition, our customers may introduce new generations of their own products or require new technological and increased performance specifications that would require us to develop customized products. Innovation or other changes in our customers’ product performance requirements may also adversely affect the demand for our products. Our future growth will depend on our ability to gauge the direction of the commercial and technological progress in all key end use markets, and upon our ability to successfully develop, manufacture and market products in such changing end use markets. We need to continue to identify, develop and market innovative products on a timely basis to replace existing products in order to maintain our profit margins and our competitive position. We may not be successful in developing new products and technology that successfully compete with such materials and our customers may not accept any of our new products. If we fail to keep pace with evolving technological innovations or fail to modify our products in response to our customers’ needs, then our business, financial condition and results of operations could be adversely affected as a result of reduced sales of our products.
Our business relies on intellectual property and other proprietary information, and our failure to protect our rights could harm our competitive advantages with respect to the manufacturing of some of our products.
Our success depends to a significant degree upon our ability to protect and preserve our intellectual property and other proprietary information relating to our business. However, we may be unable to prevent third parties from using our intellectual property and other proprietary information without our authorization or independently developing intellectual property and other proprietary information that is similar to ours, particularly in those countries where the laws do not protect our proprietary rights to the same degree as in the United States. The use of our intellectual property and other proprietary information by others could reduce or eliminate any competitive advantage we have developed, cause us to lose sales or otherwise harm our business. If it becomes necessary for us to litigate to protect these rights, any proceedings could be burdensome and costly, and we may not prevail.
In addition, we acquired a significant number of patents from Shell Chemicals. Pursuant to the agreements with Shell Chemicals relating to their contribution of these patents to us and our ownership of these patents, Shell Chemicals retained for itself fully-transferable and exclusive licenses to their use outside of the elastomers business, as well as fully-transferable non-exclusive licenses within the field of elastomers for certain limited uses in non-competing activities. Shell Chemicals is permitted to sublicense these rights. Shell Chemicals also
24
Table of Contents
retains the right to enforce these patents outside the elastomers field and recover any damages resulting from these actions.
Any patents, issued or applied for, may not provide us with any competitive advantage and may be challenged by third parties. Our competitors also may attempt to design around our patents or copy or otherwise obtain and use our intellectual property and other proprietary information. Moreover, our competitors may already hold or have applied for patents in the United States or abroad that, if enforced or issued, could possibly prevail over our patent rights or otherwise limit our ability to manufacture or sell one or more of our products in the United States or abroad. From time to time, we oppose the issuance of patent applications in the United States and other jurisdictions that we consider overbroad or otherwise invalid in order to maintain the necessary freedom to operate fully in our various business lines without the risk of being sued for patent infringement. In general, competitors or other parties may, from time to time, assert issued patents or other intellectual property rights against us. If we are legally determined, at some future date, to infringe or violate the intellectual property rights of another party, we may have to pay damages, stop the infringing use, or attempt to obtain a license agreement with the owner of such intellectual property. With respect to our pending patent applications, we may not be successful in securing patents for these claims. Our failure to secure these patents may limit our ability to protect inventions that these applications were intended to cover. In addition, the expiration of a patent can result in increased competition with consequent erosion of profit margins.
It is our policy to enter into confidentiality agreements with our employees and third parties to protect our unpatented proprietary manufacturing expertise, continuing technological innovation and other trade secrets, but our confidentiality agreements could be breached or may not provide meaningful protection for our trade secrets or proprietary manufacturing expertise. Adequate remedies may not be available in the event of an unauthorized use or disclosure of our trade secrets and manufacturing expertise. Violations by others of our confidentiality agreements and the loss of employees who have specialized knowledge and expertise could harm our competitive position and cause our sales and operating results to decline as a result of increased competition. In addition, others may obtain knowledge of our trade secrets through independent development or other access by legal means.
The applicable governmental authorities may not approve our pending service mark and trademark applications. A failure to obtain trademark registrations in the United States and in other countries could limit our ability to obtain and retain our trademarks and impede our marketing efforts in those jurisdictions. Moreover, third parties may seek to oppose our applications or otherwise challenge the resulting registrations. In the event that our trademarks are successfully challenged, we could be forced to rebrand our products, which could result in loss of brand recognition and could require us to devote resources to advertising and marketing new brands.
The failure of our patents, trademarks or confidentiality agreements to protect our intellectual property and other proprietary information, including our processes, apparatuses, technology, trade secrets, trade names and proprietary manufacturing expertise, methods and compounds, could have a material adverse effect on our competitive advantages over other producers.
Our products may infringe the intellectual property rights of others, which may cause us to incur unexpected costs or prevent us from selling our products.
Many of our competitors have a substantial amount of intellectual property that we must continually monitor to avoid infringement. We cannot guarantee that our processes and products do not and will not infringe issued patents (whether present or future) or other intellectual property rights belonging to others, including, without limitation, situations in which our products, processes or technologies may be covered by patent applications filed by other parties in the United States or abroad. From time to time, we oppose patent applications that we consider overbroad or otherwise invalid in order to maintain the necessary freedom to operate fully in our various business lines without the risk of being sued for patent infringement. If, however, patents are subsequently issued on any such applications by other parties, or if patents belonging to others
25
Table of Contents
already exist that cover our products, processes or technologies, we could, possibly, be liable for infringement or have to take other remedial or curative actions to continue our manufacturing and sales activities with respect to one or more products. We may also be subject to legal proceedings and claims in the ordinary course of our business, including claims of alleged infringement of the patents, trademarks and other intellectual property rights of third parties by us or our licensees in connection with their use of our products. Intellectual property litigation is expensive and time-consuming, regardless of the merits of any claim, and could divert our management’s attention from operating our business. If we were to discover that our processes, technologies or products infringe the valid intellectual property rights of others, we might need to obtain licenses from these parties or substantially re-engineer our products in order to avoid infringement. We may not be able to obtain the necessary licenses on acceptable terms, or at all, or be able to re-engineer our products successfully. Moreover, if we are sued for infringement and lose, we could be required to pay substantial damages and/or be enjoined from using or selling the infringing products or technology. Any of the foregoing could cause us to incur significant costs and prevent us from selling our products.
Our business is subject to seasonality that may affect our quarterly operating results and impact the market price of our common stock.
Seasonal changes and weather conditions typically affect our Paving and Roofing end use market. In particular, sales volumes for paving products generally rise in the warmer months and generally decline during the colder months of fall and winter. Roofing product sales volumes tend to be more consistent throughout the year. Abnormally cold or wet seasons may cause reduced purchases from our Paving and Roofing customers. However, because seasonal weather patterns are difficult to predict, we cannot accurately estimate fluctuations in our quarterly Paving and Roofing sales in any given year. If Paving and Roofing results cause our operating results to fall below the periodic expectations of financial analysts or investors, the market price of our common stock may decline.
Our substantial level of indebtedness could adversely affect our financial condition and prevent us from fulfilling our obligations under the senior secured credit facility and the senior notes.
We have substantial indebtedness. We have recently consummated refinancing transactions, after which we have $400 million of indebtedness outstanding in addition to availability under the revolving portion of our new senior secured credit facility. Our indebtedness consists of:
| • | $150 million of senior secured debt under our new senior secured credit facility; |
| • | $250 million of senior unsecured indebtedness under the new senior notes; |
| • | $200 million under the revolving portion of the new senior secured credit facility, which, if borrowed, would be senior secured indebtedness; and |
| • | subject to our compliance with certain covenants and other conditions, the option to raise up to $125 million of incremental term loans or increased revolving credit commitments without satisfying any additional financial tests under the indentures governing the senior notes, which, if borrowed, would be senior secured indebtedness. |
Although the terms of our new senior secured credit facility and the indentures governing the senior notes contain restrictions on the incurrence of additional indebtedness, these restrictions are subject to a number of important exceptions, and indebtedness incurred in compliance with these restrictions could be substantial. If we and our restricted subsidiaries incur significant additional indebtedness, the related risks that we face could increase.
Our substantial amount of indebtedness could:
| • | make it more difficult for us to satisfy our obligations with respect to the senior notes; |
| • | increase our vulnerability to adverse economic and industry conditions; |
26
Table of Contents
| • | require us to dedicate a substantial portion of our cash flow from operations to make payments on our indebtedness and leases, thereby reducing the availability of our cash flow to fund working capital, capital expenditures and other general corporate purposes; |
| • | limit our flexibility in planning for, or reacting to, changes in the business and industry in which we operate; |
| • | restrict us from exploiting business opportunities; |
| • | make it more difficult to satisfy our financial obligations, including payments on the notes; |
| • | place us at a disadvantage compared to our competitors that have less debt and lease obligations; and |
| • | limit our ability to borrow additional funds for working capital, capital expenditures, acquisitions, debt service requirements, execution of our business strategy and other general corporate purposes or to refinance our existing debt. |
The ability for us to pay principal of and interest on indebtedness, fund working capital, and make anticipated capital expenditures depends on our future performance, which is subject to general economic conditions and other factors, some of which are beyond our control. There can be no assurance that our business will generate sufficient cash flow from operations or that future borrowings will be available under the senior secured revolving credit facility to fund liquidity needs in an amount sufficient to enable us to service indebtedness. Furthermore, if we decide to undertake additional investments in existing or new facilities, this will likely require additional capital, and there can be no assurance that this capital will be available.
See Note 16 Subsequent Events to the Consolidated Financial Statements for further discussion.
Our debt instruments, including the senior secured credit facility and the indenture governing the senior notes, impose significant operating and financial restrictions on us.
The senior secured credit facility and the indenture governing the senior notes contain, and any future indebtedness may contain, a number of restrictive covenants that impose significant operating and financial restrictions on us, including restrictions on our ability to, among other things:
| • | place liens on our or our subsidiaries’ assets; |
| • | make investments other than permitted investments; |
| • | incur additional indebtedness; |
| • | merge, consolidate or dissolve; |
| • | sell assets; |
| • | engage in transactions with affiliates; |
| • | change the nature of our business; |
| • | change our or our subsidiaries’ fiscal year or organizational documents; and |
| • | make restricted payments (including certain equity issuances). |
A failure by us or our subsidiaries to comply with the covenants or to maintain the required financial ratios contained in the agreements governing our indebtedness could result in an event of default under such indebtedness, which could adversely affect our ability to respond to changes in our business and manage our operations. Upon the occurrence of an event of default under any of the agreements governing our indebtedness, the lenders could elect to declare all amounts outstanding to be due and payable and exercise other remedies as set forth in the agreements. If any of our indebtedness were to be accelerated, there can be no assurance that our assets would be sufficient to repay this indebtedness in full, which could have a material adverse effect on our ability to continue to operate as a going concern.
27
Table of Contents
Chemical manufacturing is inherently hazardous, which could result in accidents that disrupt our operations or expose us to significant losses or liabilities.
The hazards associated with chemical manufacturing and the related storage and transportation of raw materials, products and wastes exist in our operations and the operations of other occupants with whom we share manufacturing sites. These hazards could lead to an interruption or suspension of operations and have an adverse effect on the productivity and profitability of a particular manufacturing facility or on us as a whole. These potential risks include, but are not necessarily limited to:
| • | pipeline and storage tank leaks and ruptures; |
| • | explosions and fires; |
| • | inclement weather and natural disasters; |
| • | terrorist attacks; |
| • | mechanical failure; and |
| • | chemical spills and other discharges or releases of toxic or hazardous substances or gases. |
These hazards may result in personal injury and loss of life, damage to property and contamination of the environment, which may result in a suspension of operations and the imposition of civil or criminal penalties, including governmental fines, expenses for remediation and claims brought by governmental entities or third parties. The loss or shutdown of operations over an extended period at our Belpre facility, which is our largest manufacturing facility, or any of our other major operating facilities could have a material adverse effect on our financial condition and results of operations. Our property, business interruption and casualty insurance may not fully insure us against all potential hazards incidental to our business.
We may be liable for damages based on product liability claims brought against our customers in our end use markets.
Many of our products provide critical performance attributes to our customers’ products that are sold to consumers who could potentially bring product liability suits in which we could be named as a defendant. The sale of these products entails the risk of product liability claims. If a person were to bring a product liability suit against one of our customers, this customer may attempt to seek contribution from us. A person may also bring a product liability claim directly against us. A successful product liability claim or series of claims against us in excess of our insurance coverage for payments, for which we are not otherwise indemnified, could have a material adverse effect on our financial condition or results of operations. There can be no assurance that our efforts to protect ourselves from product liability claims in this regard will ultimately protect us from any such claims.
As a global business, we are exposed to local business risks in different countries, which could have a material adverse effect on our financial condition or results of operations.
We have significant operations in foreign countries, including manufacturing facilities, research and development facilities, sales personnel and customer support operations. Currently, we operate, or others operate on our behalf, facilities in Brazil, Germany, France and Japan, in addition to our operations in the United States. Our offshore operations are subject to risks inherent in doing business in foreign countries, including, but not necessarily limited to:
| • | new and different legal and regulatory requirements in local jurisdictions; |
| • | export duties or import quotas; |
| • | domestic and foreign customs and tariffs or other trade barriers; |
| • | potential staffing difficulties and labor disputes; |
28
Table of Contents
| • | managing and obtaining support and distribution for local operations; |
| • | increased costs of transportation or shipping; |
| • | credit risk and financial conditions of local customers and distributors; |
| • | potential difficulties in protecting intellectual property; |
| • | risk of nationalization of private enterprises by foreign governments; |
| • | potential imposition of restrictions on investments; |
| • | potentially adverse tax consequences, including imposition or increase of withholding and other taxes on remittances and other payments by subsidiaries; |
| • | foreign currency exchange restrictions and fluctuations; |
| • | local political and social conditions, including the possibility of hyperinflationary conditions and political instability in certain countries; and |
| • | civil unrest, including labor unrest, in response to local political conditions. |
We may not be successful in developing and implementing policies and strategies to address the foregoing factors in a timely and effective manner at each location where we do business. Consequently, the occurrence of one or more of the foregoing factors could have a material adverse effect on our international operations or upon our financial condition and results of operations.
Compliance with extensive environmental, health and safety laws could require material expenditures, changes in our operations or site remediation.
Materials such as styrene, butadiene and isoprene, which are used in the manufacture of our products, can represent potentially significant health and safety concerns. Our products are also used in a variety of end uses that have specific regulatory requirements such as those relating to products that have contact with food or medical end uses.
We use large quantities of hazardous substances and generate hazardous wastes in our manufacturing operations. Consequently, our operations are subject to extensive environmental, health and safety laws and regulations at both the national and local level in multiple jurisdictions. These laws and regulations govern, among other things, air emissions, wastewater discharges, solid and hazardous waste management, site remediation programs and chemical use and management. Many of these laws and regulations have become more stringent over time and the costs of compliance with these requirements may increase, including costs associated with any necessary capital investments. In addition, our production facilities require operating permits that are subject to renewal and, in some circumstances, revocation. The necessary permits may not be issued or continue in effect, and any issued permits may contain significant new requirements. The nature of the chemical industry exposes us to risks of liability due to the use, production, management, storage, transportation and sale of materials that are heavily regulated or hazardous and can cause contamination or personal injury or damage if released into the environment.
Because of the nature of our operations, we could be subject to legislation and regulation affecting the emission of greenhouse gases. We may be required to incur capital investments to upgrade our operations to comply with any future greenhouse gas emissions controls. While the impact of any such legislation or regulation is currently speculative, any such legislation or regulation, if enacted, may have an adverse effect on our operations or financial condition.
We have health and safety management programs in place to help assure compliance with applicable regulatory requirements and with internal policies and procedures, as appropriate. Each facility has developed and implemented specific critical occupational health, safety, environmental and loss control programs.
29
Table of Contents
Compliance with environmental laws and regulations generally increases the costs of transportation and storage of raw materials and finished products, as well as the costs of storage and disposal of wastes. We may incur substantial costs, including fines, damages, criminal or civil sanctions and remediation costs, or experience interruptions in our operations for violations arising under environmental laws, regulations or permit requirements.
Management at our facility at Belpre, Ohio has identified several occupied buildings that are closer to the manufacturing process than would be consistent with industry guidelines. A $7 million project to relocate the buildings with the highest risk was completed in the fourth quarter of 2010. A second project to relocate the remaining buildings is expected to be complete in 2012. We currently estimate the cost to be $7 million which is included in our projected future capital expenditures. However, such costs may vary with changes in regulations or risk management strategy.
Regulation of our employees’ exposure to butadiene could require material expenditures or changes in our operations.
Butadiene is a known carcinogen in laboratory animals at high doses and is being studied for its potential adverse health effects. The Occupational Safety and Health Administration limits the permissible employee exposure to butadiene. Future studies on the health effects of butadiene may result in additional regulations or new regulations in Europe that further restrict or prohibit the use of, and exposure to, butadiene. Additional regulation of butadiene could require us to change our operations, and these changes could affect the quality of our products and materially increase our costs.
We may be subject to losses due to lawsuits arising out of environmental damage or personal injuries associated with chemical manufacturing.
We face the risk that individuals could, in the future, seek damages for personal injury due to exposure to chemicals at our facilities or to chemicals otherwise owned or controlled by us. We may be subject to future claims with respect to workplace exposure, workers’ compensation and other matters that are filed after the date of our acquisition of Shell Chemicals’ elastomers business. While Shell Chemicals has agreed to indemnify us for certain claims brought with respect to matters occurring before our separation from Shell Chemicals in February 2001, those indemnity obligations are subject to limitations, and we cannot be certain that those indemnities will be sufficient to satisfy claims against us. In addition, we face the risk that future claims would fall outside of the scope of the indemnity due either to the limitations on the indemnity or to their arising from events and circumstances occurring after February 2001.
Some environmental laws could impose on us the entire cost of clean-up of contamination present at a facility even though we did not cause the contamination. These laws often identify the site owner as one of the parties that can be jointly and severally liable for on-site remediation, regardless of fault or whether the original activity was legal at the time it occurred. For example, our Belpre, Ohio, facility is the subject of a required remediation program to clean up past contamination at the site and at an adjacent creek and we are a party to that site clean-up order. While Shell Chemicals has posted financial assurance of $5.2 million for this program and has taken the lead in implementing the program, we may incur costs and be required to take action under this program. Similarly, the Shell Chemicals indemnity for remediation at the Belpre facility may not cover all claims that might be brought against us.
Our Paulinia, Brazil, facility also has on-site contamination resulting from past operations of Shell Chemicals. The indemnity from Shell Chemicals covers claims related to certain specified areas within the plant, and we may be required to undertake and pay for remediation of these and other areas. The indemnity coverage from Shell Chemicals is limited in time and amount and we cannot rely upon it to cover possible future claims for on-site contamination separate from the areas specified in the indemnity. The Paulinia facility is also adjacent to a former Shell Chemicals site where we believe past manufacturing of hydrocarbons resulted in significant contamination of soil and groundwater and required relocation of nearby residents. It is our understanding that
30
Table of Contents
the Shell Chemicals portion of the site has changed ownership several times, which may impact financial responsibility for contamination on the site. While we are not aware of any significant contamination at our Paulinia facility, we could potentially be the subject of claims related to pesticide contamination and effects at some point in the future.
In general, there is always the possibility that a third-party plaintiff or claimant, or governmental or regulatory authority, could seek to include us in an action or claim for damages, clean-up, or remediation pertaining to events or circumstances occurring or existing at one or more of our sites prior to the time of our ownership or occupation of the applicable site. In the event that any of these actions or claims were asserted against us, our results of operations could be adversely affected.
Regulatory and statutory changes applicable to us or our customers could adversely affect our financial condition and results of operations.
We and many of the applications for the products in the end use markets in which we sell our products are regulated by various national and local rules, laws and regulations. Changes in any of these areas could result in additional compliance costs, seizures, confiscations, recall or monetary fines, any of which could prevent or inhibit the development, distribution and sale of our products. For example, changes in environmental regulations restricting the use of disposable diapers could cause a decline in sales to producers of that product. In addition, we benefit from certain trade protections, including anti-dumping protection. If we were to lose these protections, our results of operations could be adversely affected.
We are subject to customs, international trade, export control, antitrust, zoning and occupancy and labor and employment laws that could require us to modify our current business practices and incur increased costs.
We are subject to numerous regulations, including customs and international trade laws, export control, antitrust laws and zoning and occupancy laws that regulate manufacturers generally and/or govern the importation, promotion and sale of our products, the operation of factories and warehouse facilities and our relationship with our customers, suppliers and competitors. If these regulations were to change or were violated by our management, employees, suppliers, buying agents or trading companies, the costs of certain goods could increase, or we could experience delays in shipments of our goods, be subject to fines or penalties, or suffer reputational harm, which could reduce demand for our products and hurt our business and negatively impact results of operations. In addition, changes in federal and state minimum wage laws and other laws relating to employee benefits could cause us to incur additional wage and benefits costs, which could negatively impact our profitability.
Legal requirements are frequently changed and subject to interpretation, and we are unable to predict the ultimate cost of compliance with these requirements or their effects on our operations. We may be required to make significant expenditures or modify our business practices to comply with existing or future laws and regulations, which may increase our costs and materially limit our ability to operate our business.
Fluctuations in currency exchange rates may significantly impact our results of operations and may significantly affect the comparability of our results between financial periods.
Our operations are conducted by subsidiaries in many countries. The results of the operations and the financial position of these subsidiaries are reported in the relevant foreign currencies and then translated into U.S. dollars at the applicable exchange rates for inclusion in our consolidated financial statements. The main currencies to which we are exposed, besides the U.S. dollar, are the Euro, Japanese Yen and Brazilian Real. The exchange rates between these currencies and the U.S. dollar in recent years have fluctuated significantly and may continue to do so in the future. A depreciation of these currencies against the U.S. dollar will decrease the U.S. dollar equivalent of the amounts derived from these operations reported in our consolidated financial statements and an appreciation of these currencies will result in a corresponding increase in such amounts. Because many of
31
Table of Contents
our raw material costs are determined with respect to the U.S. dollar rather than these currencies, depreciation of these currencies may have an adverse effect on our profit margins or our reported results of operations. Conversely, to the extent that we are required to pay for goods or services in foreign currencies, the appreciation of such currencies against the U.S. dollar will tend to negatively impact our results of operations. In addition, currency fluctuations may affect the comparability of our results of operations between financial periods.
We incur currency transaction risk whenever we enter into either a purchase or sale transaction using a currency other than the local currency of the transacting entity. We employ hedging strategies to minimize our exposure to certain foreign currency fluctuations. Given the volatility of exchange rates, there can be no assurance that we will be able to effectively manage our currency transaction risks, that our hedging activities will be effective or that any volatility in currency exchange rates will not have a material adverse effect on our financial condition or results of operations.
Our relationship with our employees could deteriorate, which could adversely affect our operations.
As a manufacturing company, we rely on our employees and good relations with our employees to produce our products and maintain our production processes and productivity. As of December 31, 2010, we employed approximately 884 full-time employees. A significant number of our non-U.S. employees are subject to arrangements similar to collective bargaining arrangements. With respect to these employees, we may not be able to negotiate labor agreements on satisfactory terms, and actions by our employees may disrupt our business. If these workers were to engage in a strike, work stoppage or other slowdown, our operations could be disrupted or we could experience higher labor costs. In addition, if our other employees were to become unionized, in particular our employees at our Belpre, Ohio, facility, we could experience significant operating disruptions and higher ongoing labor costs, which could adversely affect our business and financial condition and results of operations. Because many of the personnel who operate our European facilities are employees of LyondellBasell, relations between LyondellBasell and its employees may also adversely affect our business and financial condition and results of operations.
Loss of key personnel or our inability to attract and retain new qualified personnel could hurt our business and inhibit our ability to operate and grow successfully.
Our success in the highly competitive markets in which we operate will continue to depend to a significant extent on our key employees. We are dependent on the expertise of our executive officers. Loss of the services of any of our executive officers could have an adverse effect on our prospects. We may not be able to retain our key employees or to recruit qualified individuals to join our company. The loss of key employees could result in high transition costs and could disrupt our operations.
We generally do not have long-term contracts with our customers, and the loss of customers could adversely affect our sales and profitability.
With some exceptions, our business is based primarily upon individual sales orders with our customers. As such, our customers could cease buying our products from us at any time, for any reason, with little or no recourse. If multiple customers elected not to purchase products from us, our business prospects, financial condition and results of operations could be adversely affected.
A decrease in the fair value of pension assets could materially increase future funding requirements of the pension plan.
We sponsor a defined benefit pension plan. The total projected benefit obligation of our defined benefit pension plan exceeded the fair value of the plan assets by approximately $33.1 million at December 31, 2010. We contributed $3.3 million to the pension plan in 2010 and, based on the actuarial assumptions used in our consolidated financial statements, are forecasting contributions of approximately $7.4 million and $9.8 million in calendar years 2011 and 2012, respectively. Among the key assumptions inherent in the actuarially calculated
32
Table of Contents
pension plan obligation and pension plan expense are the discount rate and the expected rate of return on plan assets. If interest rates and actual rates of return on invested plan assets were to decrease significantly, the pension plan obligation could increase materially. The size of future required pension contributions could result in our dedicating a substantial portion of our cash flow from operations to making the contributions, which could materially adversely affect our business, financial condition and results of operations.
Concentration of ownership among our principal stockholders may prevent new investors from influencing significant corporate decisions.
TPG and JPMP own a significant percentage of our common stock. Pursuant to a registration rights and shareholders’ agreement entered into by TPG, JPMP and the company, TPG and JPMP each has the right to participate in certain dispositions by the other party. TPG and JPMP are also restricted from transferring common stock without the consent of the other party. Furthermore, each of TPG and JPMP has the right to elect two directors to the board of directors of the company so long as it owns 10% or more of the outstanding common stock and one director so long as it owns 2% or more of the common stock. As our largest stockholders, TPG and JPMP together are able to exercise significant influence over all matters requiring stockholder approval, including the election of directors, amendment of our certificate of incorporation and approval of significant corporate transactions and have significant control over our management and policies. The interests of these stockholders may not be consistent with the interests of other stockholders. The existence of significant stockholders may also have the effect of deterring hostile takeovers, delaying or preventing changes in control or changes in management, or limiting the ability of our other stockholders to approve transactions that they may deem to be in the best interests of our company.
Future sales of our shares could adversely affect the market price of our common stock.
Future sales of substantial amounts of our common stock in the public market, whether by us or our existing stockholders, or the perception that such sales could occur, may adversely affect the market price of our common stock, which could decline significantly. Sales by our existing stockholders might also make it more difficult for us to raise equity capital by selling new common stock at a time and price that we deem appropriate.
Delaware law and some provisions of our organizational documents make a takeover of our company more difficult.
Provisions of our charter and bylaws may have the effect of delaying, deferring or preventing a change in control of our company. A change of control could be proposed in the form of a tender offer or takeover proposal that might result in a premium over the market price for our common stock. In addition, these provisions could make it more difficult to bring about a change in the composition of our board of directors, which could result in entrenchment of current management. For example, our charter and bylaws:
| • | establish a classified board of directors so that not all members of our board of directors are elected at one time; |
| • | require that the number of directors be determined, and any vacancy or new board seat be filled, only by the board; |
| • | do not permit stockholders to act by written consent; |
| • | do not permit stockholders to call a special meeting; |
| • | permit the bylaws to be amended by a majority of the board without shareholder approval, and require that a bylaw amendment proposed by stockholders be approved by two-thirds of all outstanding shares; |
| • | establish advance notice requirements for nominations for elections to our board of directors or for proposing matters that can be acted upon by stockholders at stockholder meetings; and |
| • | authorize the issuance of undesignated preferred stock, or “blank check” preferred stock, by our board of directors without shareholder approval. |
33
Table of Contents
In addition, our certificate of incorporation provides that the provisions of Section 203 of the Delaware General Corporation Law (“DGCL”), which relate to business combinations with interested stockholders, do not apply to us. Many of our employment agreements, plans and equity arrangements with our executive officers also contain change in control provisions. Under the terms of these arrangements, the executive officers are entitled to receive significant cash payments, immediate vesting of options, restricted shares and notional shares, and continued medical benefits in the event their employment is terminated under certain circumstances within one year following a change in control, and with respect to certain equity awards, within two years following a change in control. Any Supplemental Pension Benefits a participant may have accrued under the Kraton Polymers U.S. LLC Pension Benefit Restoration Plan also vests immediately on a change of control and any amounts accrued under the Kraton Polymers LLC Executive Deferred Compensation Plan are immediately payable upon a change of control. See “Executive Compensation,” for disclosure regarding potential payments to named executive officers following a change in control.
These and other provisions of our organizational documents and Delaware law may have the effect of delaying, deferring or preventing changes of control or changes in management of our company, even if such transactions or changes would have significant benefits for our stockholders. As a result, these provisions could limit the price some investors might be willing to pay in the future for shares of our common stock.
| Item 1B. | Unresolved Staff Comments. |
None.
| Item 2. | Properties. |
Our principal executive offices are located at 15710 John F. Kennedy Boulevard, Suite 300, Houston, Texas 77032.
We believe that our properties and equipment are generally in good operating condition and are adequate for our present needs. Production capacity at our sites can vary depending upon feedstock, product mix and operating conditions.
The following table sets forth our principal facilities:
| Location |
Acres | Approximate Square Footage |
Use | Owned/Leased | ||||||||
| Belpre, Ohio |
350 | 3,600,000 | Manufacturing | Owned | (1) | |||||||
| Wesseling, Germany |
8.1 | 354,000 | Manufacturing | Leased | (2) | |||||||
| Berre, France |
9.0 | 392,000 | Manufacturing | Owned | (3) | |||||||
| Paulinia, Brazil |
179 | 2,220,000 | Manufacturing | Owned | ||||||||
| Kashima, Japan |
11.6 | 395,000 | Manufacturing | Owned | (4) | |||||||
| Houston, Texas |
N/A | 105,500 | R&D | Leased | (5) | |||||||
| Amsterdam, the Netherlands |
N/A | 32,015 | R&D | Leased | (5) | |||||||
| Tsukuba, Japan |
4.5 | 23,327 | R&D | Leased | ||||||||
| (1) | A portion of the HSBC capacity at the Belpre facility is owned by Infineum USA, a joint venture between Shell Chemicals and ExxonMobil. |
| (2) | We lease the land and the manufacturing facility, but own the production equipment. |
| (3) | We lease the land, but own the manufacturing facility and production equipment. |
| (4) | The Kashima, Japan, facility is owned by our 50%-50% joint venture with JSR. |
| (5) | We lease the facility, but own the equipment. |
Belpre, Ohio. Our Belpre site is our largest manufacturing facility, with connections to barge, rail and truck shipping and receiving facilities. The Belpre site has approximately 189 kilotons of production capacity to which we are entitled. It has the largest dedicated SBC production capacity of any SBC facility in the world. The Belpre
34
Table of Contents
facility currently produces USBC and HSBC products. We commenced plant modifications and upgrades at our Belpre facility that will enable production of Poly-Isoprene Rubber, for use in production of Isoprene Latex by our Emerging Business end use. We expect to complete this project by mid-2011.
A portion of the HSBC capacity at Belpre is owned by Infineum USA. Infineum is a joint venture between Shell Chemicals and ExxonMobil that makes products for the lubricating oil additives business. Under a facility sharing agreement that terminates in 2030, we operate Infineum’s share of the HSBC assets to manufacture a line of products for Infineum, and Infineum is entitled to a portion of the HSBC capacity at Belpre. Other than those assets owned by Infineum, we own the Belpre plant and the land on which it is located.
Wesseling, Germany. Our Wesseling manufacturing site is located on the premises of LyondellBasell. The site has direct access to major highways and extensive railway connections. Production capacity is approximately 96 kilotons. LyondellBasell owns the land and buildings on the premises and leases them to us. All leased property is required to be used in connection with our elastomers business. The lease is for a term of 30 years, beginning from March 31, 2000 and is extended automatically for a successive period of 10 years unless terminated upon one-year’s written notice by either party. We own the SBC production equipment in the manufacturing facility. The Wesseling facility currently produces USBC products. LyondellBasell provides us operating and site services, utilities, materials and facilities under a long-term production agreement. LyondellBasell has the right to approve any expansion of our facility at Wesseling although its consent may only be withheld if an expansion would be detrimental to the site.
Berre, France. Our Berre site is located in southeastern France. The facility has direct access to sea, rail and road transport and has a production capacity of approximately 87 kilotons. The Berre site is leased to us by LyondellBasell, which operates the site and with which our lease exists under a long-term lease due to expire in 2030. We own the SBC manufacturing facility and production equipment at Berre. We currently produce USBC and HSBC products there. We have an operating agreement with LyondellBasell for various site services, utilities and facilities under a long-term agreement.
Paulinia, Brazil. Our Paulinia site is located with access to major highways. The facility currently has a production capacity of approximately 28 kilotons of USBC. The plant was built to meet demand for IRL products for hypoallergenic and medical applications, including surgical gloves and condoms. We own the plant at Paulinia as well as the land on which our plant sits. BASF owns the adjacent site and shares title to facilities that are common to the two companies such as the administration building, cafeteria and maintenance facilities. We commenced the IRL debottleneck and expansion project at our Paulinia, Brazil plant in the third quarter of 2010, which we expect to be complete by mid-2011.
Kashima, Japan. Our Kashima site is operated by a manufacturing joint venture named Kraton JSR Elastomers K.K., or KJE, between us and JSR. The Kashima site is located northeast of Tokyo on the main island of Honshu at a JSR site that includes several synthetic rubber plants and butadiene and isoprene extraction units. This site is serviced by rail, barge and truck connections. Production capacity is approximately 42 kilotons of USBC products, and we are generally entitled to 50% of this production pursuant to our joint venture agreement. The SBC manufacturing facility is leased to KJE.
JSR markets its portion of the production under its own trademarks, and we market our portion of the production under the KRATON® brand name although this amount may vary from time to time based on the economic interest of the joint venture. We and JSR each have a right of first refusal on the transfer of the joint venture interests of the other.
Research, Development and Technical Service Facilities. Our research and development activities are primarily conducted in laboratories in Houston, Texas, and Amsterdam, the Netherlands. We support our customers via a technical service network of laboratories around the globe. Our technical service laboratories are located in Shanghai, China, Tsukuba, Japan, and Paulina, Brazil. In addition we have a technical service office in Mont St. Guibert, Belgium.
35
Table of Contents
We perform application development and technical service support in all locations. In addition, our research and development centers in Houston and Amsterdam carry out polymer and process development. We are operating pilot lines in our Houston facility to provide scale up support to our manufacturing sites as well as our customers.
As a result of growth in Kraton’s differentiated grades of HSBCs globally, we see the need for additional manufacturing capacity. We believe expansion of HSBC capacity is the next step to grow our position in the Asia Pacific region, and we are exploring options to build a 30 kiloton HSBC manufacturing facility that would employ Kraton’s latest state-of-the-art technology for producing HSBCs. Our site-selection team is continuing to explore alternatives and we now expect its recommendation to management in the second quarter of 2011, at which time we will be in a better position to render a final project decision. While it is too early to estimate the expected cost of the new facility, we anticipate that construction could commence in the first half of 2012 with start-up occurring as early as the second half of 2013.
| Item 3. | Legal Proceedings. |
We and certain of our subsidiaries are parties to various legal proceedings that have arisen in the ordinary course of business. While the outcome of these proceedings cannot be predicted with certainty, management does not expect these matters, individually or in the aggregate, to have a material adverse effect upon our financial position, results of operations or cash flows. Furthermore, Shell Chemicals has agreed, subject to certain limitations, to indemnify us for certain claims brought with respect to matters occurring before February 28, 2001. As of the date of this Form 10-K, we have not been named as parties in any of these claims. Our right to indemnification from Shell Chemicals is subject to certain time limitations disclosed under “Part 1, Item 1. Business—Environmental Regulation.”
Kraton and LyondellBasell have negotiated and concluded the terms of an agreed arbitration proceeding (to take place in London, England) to determine the ongoing effect of a multi-year term sheet that had been reached between the parties and put into effect in January 2009, covering certain terms and conditions applicable to operations and butadiene sales by LyondellBasell (for and to Kraton) at Berre, France, and Wesseling, Germany. The parties had been dealing with one another in accordance with said term sheet from January 2009 until LyondellBasell notified Kraton on September 9, 2010 that LyondellBasell would no longer follow same. Since receiving the September 9 notice, Kraton has been paying an increased net amount to LyondellBasell on a monthly basis (under protest) to reflect the pre-term sheet circumstances between the parties.
The outcome of the arbitration cannot be predicted with accuracy at this time. However, we do not believe it is probable that LyondellBasell will prevail in the arbitration, and we do not expect the final resolution of this matter to have a material impact on our ongoing business or operations. Until resolution of this matter, we are recognizing a charge to current operations for the net excess payments to LyondellBasell, currently estimated to be between $2.0 million and $5.0 million per annum on a pre-tax basis. In 2010, we recognized a net pre-tax charge of $0.9 million associated with this matter.
For information regarding legal proceedings, including environmental matters, see “Part I, Item 1. Business—Environmental Regulation” and Note 9 Commitments and Contingencies to the Consolidated Financial Statements for further discussion.
| Item 4. | Removed and Reserved. |
36
Table of Contents
PART II
| Item 5. | Market for Registrant’s Common Equity, Related Stockholder Matters and Issuer Purchases of Equity Securities. |
Our common stock has been listed on the New York Stock Exchange (NYSE) under the symbol “KRA” since December 17, 2009. Prior to that date, our equity securities were not listed on any exchange in each period indicated or traded on any public trading market. The following table sets forth the high and low sales prices of our common stock per share, as reported by the New York Stock Exchange.
| Stock Price Range | ||||||||
| High | Low | |||||||
| 2010 |
||||||||
| Fourth Quarter |
$ | 34.85 | $ | 24.62 | ||||
| Third Quarter |
$ | 30.00 | $ | 18.28 | ||||
| Second Quarter |
$ | 21.56 | $ | 17.57 | ||||
| First Quarter |
$ | 18.49 | $ | 12.91 | ||||
| 2009 |
||||||||
| Fourth Quarter (beginning December 17) |
$ | 13.84 | $ | 13.21 | ||||
We have not previously declared or paid any dividends or distributions on our common stock. As of February 28, 2011, we had approximately 33 shareholders of record of our common stock and approximately 7,200 beneficial owners.
Stock Performance Graph
The following graph reflects the comparative changes in the value from December 17, 2009, the first trading day of our common stock on the NYSE, through December 31, 2010, assuming an initial investment of $100 and the reinvestment of dividends, if any, in (1) our common stock, (2) the S&P SmallCap 600 Index, and (3) the Dow Jones U.S. Specialty Chemicals Index. Historical performance should not be considered indicative of future stockholder returns.
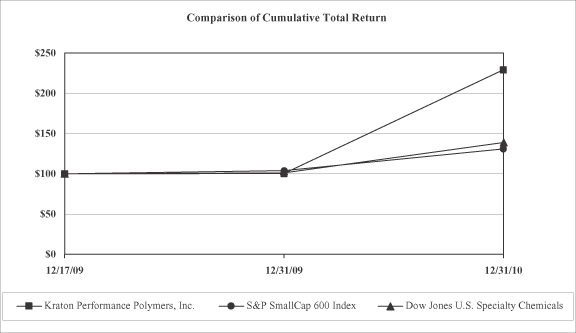
37
Table of Contents
Total Return To Shareholders
(Includes reinvestment of dividends)
| Annual Return Percentage, Year Ending |
||||||||||||
| Company Name / Index | 12/31/09 | 12/31/10 | ||||||||||
| Kraton Performance Polymers, Inc. |
0.37 | % | 128.24 | % | ||||||||
| S&P SmallCap 600 Index |
3.68 | % | 26.31 | % | ||||||||
| Dow Jones U.S. Specialty Chemicals |
1.04 | % | 37.19 | % | ||||||||
| Cumulative Value of $100 Investment, through December 31, 2010 |
||||||||||||
| Company Name / Index | Base Period 12/17/09 |
12/31/09 | 12/31/10 | |||||||||
| Kraton Performance Polymers, Inc. |
$ | 100.00 | $ | 100.37 | $ | 229.09 | ||||||
| S&P SmallCap 600 Index |
$ | 100.00 | $ | 103.68 | $ | 130.95 | ||||||
| Dow Jones U.S. Specialty Chemicals |
$ | 100.00 | $ | 101.04 | $ | 138.62 | ||||||
Dividends
We have not previously declared or paid any dividends or distributions on our common stock. We currently intend to retain all available funds and any future earnings to fund the development and growth of our business, and we do not anticipate paying any cash dividends in the foreseeable future. We are currently restricted in our ability to pay cash dividends on our common stock by the covenants in the senior secured credit facility and may be further restricted by the terms of any of our future debt or preferred securities. In addition, because we are a holding company, our ability to pay dividends depends on our receipt of cash dividends and distributions from our subsidiaries. The terms of the new senior subordinated notes also restrict our ability and the ability of our subsidiaries to pay dividends. For more information about these restrictions, see Note 16 Subsequent Events to the Consolidated Financial Statements.
Any future determination to pay dividends will be at the discretion of our board of directors and will depend on our financial condition, results of operations, capital expenditure requirements, restrictions contained in current and future financing instruments and other factors that our board of directors deems relevant.
Kraton Polymers LLC
As of December 31, 2010, Kraton Polymers LLC was party to a senior secured term loan and an indenture with respect to our 8.125% senior subordinated notes due 2014 (“the 8.125% Notes”), each of which imposes restrictions on its ability to pay dividends or certain other distributions to the holders of its equity interests. On February 11, 2011, we refinanced our existing indebtedness. The terms of the new senior subordinated notes also restrict our ability and the ability of our subsidiaries to pay dividends. See Note 16 Subsequent Events to the Consolidated Financial Statements for further discussion.
38
Table of Contents
| Item 6. | Selected Financial Data. |
The selected financial data below should be read in conjunction with “Management’s Discussion and Analysis of Financial Condition and Results of Operations” included under Item 7 of this Form 10-K as well as the consolidated financial statements and the related notes.
| Years ended December 31, | ||||||||||||||||||||
| 2010 | 2009 | 2008 | 2007 | 2006 | ||||||||||||||||
| (In thousands, except per share data) | ||||||||||||||||||||
| Consolidated Statements of Operations Data: |
||||||||||||||||||||
| Operating Revenues |
||||||||||||||||||||
| Sales |
$ | 1,228,425 | $ | 920,362 | $ | 1,171,253 | $ | 1,066,044 | $ | 1,015,766 | ||||||||||
| Other(1) |
— | 47,642 | 54,780 | 23,543 | 32,355 | |||||||||||||||
| Total operating revenues |
1,228,425 | 968,004 | 1,226,033 | 1,089,587 | 1,048,121 | |||||||||||||||
| Cost of Goods Sold |
927,932 | 792,472 | 971,283 | 938,556 | 843,726 | |||||||||||||||
| Gross Profit |
300,493 | 175,532 | 254,750 | 151,031 | 204,395 | |||||||||||||||
| Operating Expenses |
||||||||||||||||||||
| Research and development |
23,628 | 21,212 | 27,049 | 24,865 | 24,598 | |||||||||||||||
| Selling, general and administrative |
92,305 | 79,504 | 101,431 | 69,020 | 73,776 | |||||||||||||||
| Depreciation and amortization of identifiable intangibles |
49,220 | 66,751 | 53,162 | 51,917 | 43,574 | |||||||||||||||
| Total operating expenses |
165,153 | 167,467 | 181,642 | 145,802 | 141,948 | |||||||||||||||
| Gain on Extinguishment of Debt |
— | 23,831 | — | — | — | |||||||||||||||
| Earnings of Unconsolidated Joint Venture(2) |
487 | 403 | 437 | 626 | 168 | |||||||||||||||
| Interest Expense, Net |
23,969 | 33,956 | 36,695 | 43,484 | 66,637 | |||||||||||||||
| Income (Loss) Before Income Taxes |
111,858 | (1,657 | ) | 36,850 | (37,629 | ) | (4,022 | ) | ||||||||||||
| Income Tax Expense (Benefit) |
15,133 | (1,367 | ) | 8,431 | 6,120 | 29,814 | ||||||||||||||
| Net Income (Loss) |
$ | 96,725 | $ | (290 | ) | $ | 28,419 | $ | (43,749 | ) | $ | (33,836 | ) | |||||||
| Earnings (Loss) per common share |
||||||||||||||||||||
| Basic |
$ | 3.13 | $ | (0.01 | ) | $ | 1.46 | $ | (2.26 | ) | n/a | |||||||||
| Diluted |
$ | 3.07 | $ | (0.01 | ) | $ | 1.46 | $ | (2.26 | ) | n/a | |||||||||
| Weighted average common shares outstanding |
||||||||||||||||||||
| Basic |
30,825 | 19,808 | 19,387 | 19,375 | n/a | |||||||||||||||
| Diluted |
31,379 | 19,808 | 19,464 | 19,375 | n/a | |||||||||||||||
| (1) | Other revenues include the sale of by-products generated in the production of IR and SIS. |
| (2) | Represents our 50% joint venture interest in Kraton JSR Elastomers K.K., which is accounted for using the equity method of accounting. |
| As of December 31, | ||||||||||||||||||||
| 2010 | 2009 | 2008 | 2007 | 2006 | ||||||||||||||||
| (In thousands) | ||||||||||||||||||||
| Balance Sheet Data |
||||||||||||||||||||
| Cash and cash equivalents |
$ | 92,750 | $ | 69,291 | $ | 101,396 | $ | 48,277 | $ | 43,601 | ||||||||||
| Total assets |
1,080,723 | 974,499 | 1,031,874 | 984,894 | 989,153 | |||||||||||||||
| Total debt |
$ | 382,675 | $ | 384,979 | $ | 575,316 | $ | 538,686 | $ | 582,310 | ||||||||||
| 2010 | 2009 | 2008 | 2007 | 2006 | ||||||||||||||||
| Other Data: |
||||||||||||||||||||
| Ratio of Earnings to Fixed Charges |
5.1:1.0 | 1.0:1.0 | 1.9:1.0 | 0.2:1.0 | 1.0:1.0 | |||||||||||||||
39
Table of Contents
Our earnings were insufficient to cover our fixed charges for the year ended December 31, 2009 by approximately $1.6 million, for the year ended December 31, 2007 by approximately $38.1 million and for the year ended December 31, 2006 by approximately $2.9 million.
We consider EBITDA and Adjusted EBITDA important supplemental measures of our performance and believe they are frequently used by investors and other interested parties in the evaluation of companies in our industry. EBITDA and Adjusted EBITDA have limitations as an analytical tool, and you should not consider them in isolation, or as substitutes for analysis of our results under generally accepted accounting principles (“GAAP”) in the United States.
| Years ended December 31, | ||||||||||||
| 2010 | 2009 | 2008 | ||||||||||
| (In thousands) | ||||||||||||
| Other Data |
||||||||||||
| EBITDA(1)(3) |
$ | 185,047 | $ | 99,050 | $ | 126,707 | ||||||
| Adjusted EBITDA(2)(3) |
194,906 | 91,359 | 152,048 | |||||||||
| (1) | EBITDA represents net income before interest, taxes, depreciation and amortization. We present EBITDA because it is used by management to evaluate operating performance. We consider EBITDA an important supplemental measure of our performance and believe it is frequently used by investors and other interested parties in the evaluation of companies in our industry. |
We also use EBITDA for the following purposes: our executive compensation plan bases incentive compensation payments on our EBITDA performance; and the senior secured credit facilities and the senior subordinated notes use EBITDA (with additional adjustments) to measure our compliance with covenants such as leverage and interest coverage.
EBITDA has limitations as an analytical tool, and you should not consider it in isolation, or as a substitute for analysis of our results as reported under GAAP. Some of these limitations are:
| • | EBITDA does not reflect our cash expenditures, or future requirements for capital expenditures or contractual commitments; |
| • | EBITDA does not reflect changes in, or cash requirements for, our working capital needs; |
| • | EBITDA does not reflect the significant interest expense, or the cash requirements necessary to service interest or principal payments, on our debts; |
| • | although depreciation and amortization are non-cash charges, the assets being depreciated and amortized will often have to be replaced in the future, and EBITDA does not reflect any cash requirements for such replacements; and |
| • | other companies in our industry may calculate EBITDA differently than we do, limiting its usefulness as a comparative measure. |
Because of these and other limitations, EBITDA should not be considered as a measure of discretionary cash available to us to invest in the growth of our business. We compensate for these limitations by relying primarily on our GAAP results and using EBITDA and Adjusted EBITDA only as supplemental measures. See the Consolidated Statements of Cash Flows included in our financial statements included elsewhere in this Form 10-K.
| (2) | We present Adjusted EBITDA as a further supplemental measure of our performance and because we believe these additional adjustments provide helpful information to securities analysts, investors and other interested parties evaluating our performance. We prepare Adjusted EBITDA by adjusting EBITDA to eliminate the impact of a number of items we do not consider indicative of our ongoing operating performance. We explain how each adjustment is derived and why we believe it is helpful and appropriate in the subsequent footnote. You are encouraged to evaluate each adjustment and the reasons we consider it |
40
Table of Contents
| appropriate for supplemental analysis. As an analytical tool, Adjusted EBITDA is subject to all the limitations applicable to EBITDA. In addition, in evaluating Adjusted EBITDA, you should be aware that in the future we may incur expenses similar to the adjustments in this presentation. Our presentation of Adjusted EBITDA should not be construed as an inference that our future results will be unaffected by unusual or non-recurring items. |
| (3) | We reconcile Net Income/(Net Loss) to EBITDA and Adjusted EBITDA as follows: |
| Years ended December 31, | ||||||||||||
| 2010 | 2009 | 2008 | ||||||||||
| (In thousands) | ||||||||||||
| Net Income/(Net Loss) |
$ | 96,725 | $ | (290 | ) | $ | 28,419 | |||||
| Plus |
||||||||||||
| Interest expense, Net |
23,969 | 33,956 | 36,695 | |||||||||
| Income tax expense (benefit) |
15,133 | (1,367 | ) | 8,431 | ||||||||
| Depreciation and amortization expenses |
49,220 | 66,751 | 53,162 | |||||||||
| EBITDA (a) |
$ | 185,047 | $ | 99,050 | $ | 126,707 | ||||||
| Add (deduct): |
||||||||||||
| Management fees and expenses |
— | 2,000 | 2,000 | |||||||||
| Restructuring and related charges(b) |
6,387 | 9,677 | 13,671 | |||||||||
| Other non-cash expenses(c) |
3,472 | 4,463 | 9,670 | |||||||||
| Gain on extinguishment of debt(d) |
— | (23,831 | ) | — | ||||||||
| Adjusted EBITDA(a) |
$ | 194,906 | $ | 91,359 | $ | 152,048 | ||||||
| (a) | EBITDA and Adjusted EBITDA are impacted by the spread between the first-in, first-out (FIFO) basis of accounting and the last-in, first-out (LIFO) basis of accounting. The spread between the LIFO and FIFO basis resulted in a positive impact to EBITDA and Adjusted EBITDA of approximately $12.1 million and $37.1 million for the years ended December 31, 2010 and 2008, respectively. Conversely, EBITDA and Adjusted EBITDA, as reflected above, were negatively impacted by approximately $17.6 million for the year ended December 31, 2009. |
| (b) | 2010 restructuring and related charges consisted primarily of consulting fees, severance expenses, and other charges associated with the restructuring of our European organization as well as expenses associated with our secondary public offering. 2009 charges consisted primarily of costs associated with the exit of the Pernis facility. 2008 charges consisted primarily of severance and retention costs associated with the restructuring of our Westhollow Technical Center and our research and technical services organizations, senior management changes in the first quarter and workforce reductions in the fourth quarter. All periods also reflect charges associated with evaluating merger and acquisition transactions and potential debt refinancing. |
| (c) | For all periods, consists primarily of non-cash compensation. For 2008 and 2009, also reflects the non-cash inventory impairment to lower inventory from FIFO cost to market value and losses on the sale of fixed assets. |
| (d) | In 2009, reflects the non-recurring cash gain related to bond repurchases. |
Restructuring and related charges discussed above were recorded in the Consolidated Statements of Operations, as follows:
| Years ended December 31, | ||||||||||||
| 2010 | 2009 | 2008 | ||||||||||
| (In thousands) | ||||||||||||
| Cost of goods sold |
$ | — | $ | 6,747 | $ | 355 | ||||||
| Research and development |
— | — | 2,430 | |||||||||
| Selling, general and administrative |
6,387 | 2,930 | 10,886 | |||||||||
| Total restructuring and related charges |
$ | 6,387 | $ | 9,677 | $ | 13,671 | ||||||
41
Table of Contents
| Item 7. | Management’s Discussion and Analysis of Financial Condition and Results of Operations |
INTRODUCTION
Management’s Discussion and Analysis of Financial Condition and Results of Operations should be read in conjunction with the Item 8. Financial Statements and Supplementary Data. This discussion contains forward-looking statements and involves numerous risks and uncertainties, including, but not limited to those described in the Item 1A. Risk Factors. Actual results may differ materially from those contained in any forward-looking statements.
OVERVIEW
Kraton Performance Polymers, Inc. is a global producer of styrenic block copolymers (“SBCs,”) a family of performance polymer products whose chemistry we pioneered almost 50 years ago. SBCs are highly-engineered synthetic elastomers which enhance the performance of numerous products by delivering a variety of performance-enhancing characteristics, including greater flexibility, resilience, strength, durability and processability, and are a fast growing subset of the elastomers industry. Our polymers are typically formulated or compounded with other products to achieve improved, customer specific performance characteristics in a variety of applications.
We offer our customers a broad portfolio of products that includes 252 core commercial grades of SBCs. We manufacture our products along five primary product lines based upon polymer chemistry and process technologies:
| • | unhydrogenated SBCs (“USBCs;”) |
| • | hydrogenated SBCs (“HSBCs;”) |
| • | isoprene rubber (“IR;”) |
| • | isoprene rubber latex (“IRL;”) and |
| • | Compounds. |
We include IR and IRL in our USBC product line. USBCs and HSBCs represented approximately 67.1% and 32.9% of sales revenue for the year ended December 31, 2010, respectively, and 66.4% and 33.6% for the year ended December 31, 2009, respectively. The majority of worldwide SBC capacity is dedicated to the production of USBCs, which are primarily used in the Paving and Roofing, Adhesives, Sealants and Coatings and Footwear end use applications. HSBCs, which are significantly more complex and capital-intensive to manufacture than USBCs, are primarily used in higher value-added end uses, including soft touch and flexible materials, personal hygiene products, medical products, automotive components and certain adhesives and sealant applications.
We believe that the diversity and depth of our product portfolio is unmatched in the industry, serving the widest set of applications within each of our four end use markets:
| • | Advanced Materials, which represented approximately 30.5% and 30.6% of 2010 and 2009 sales revenue, respectively; |
| • | Adhesives, Sealants and Coatings, which represented approximately 32.4% and 32.3% of 2010 and 2009 sales revenue, respectively; |
| • | Paving and Roofing, which represented approximately 28.0% and 26.4% of 2010 and 2009 sales revenue, respectively; and |
| • | Emerging Businesses, which includes our IR and IRL activity, and represented approximately 6.5% and 6.6% of 2010 and 2009 sales revenue, respectively. |
42
Table of Contents
2010 Financial Highlights
| • | Operating revenues increased by 26.9% from 2009 due to increased sales volumes and increases in global product sales prices primarily in response to higher raw material costs and increased demand for our products. |
| • | Gross profit amounted to 24.5% of operating revenue in 2010 compared to 18.1% in 2009. |
| • | Net income improved by $97.0 million to $96.7 million, or $3.07 per diluted share, compared to a net loss of $0.3 million, or $(0.01) per diluted share in 2009. |
| • | Adjusted EBITDA improved by $103.5 million to $194.9 million compared to 2009, reflecting a margin of 15.9% of revenues. |
| • | Cash provided by operating activities amounted to $55.4 million in 2010 compared to $72.8 million in 2009. Capital expenditures were $55.7 million in 2010 compared to $53.4 million in 2009. |
Results of Operations
Factors Affecting Our Results of Operations
Raw Materials. Our results of operations are directly affected by the cost of raw materials. We use three monomers as our primary raw materials in the manufacture of our products: styrene, butadiene, and isoprene. These monomers together represented approximately 56%, 43%, and 49% of our total cost of goods sold for the years ended December 31, 2010, 2009 and 2008, respectively. The cost of these monomers has generally correlated with changes in crude oil prices. Prices have fluctuated significantly due to global supply and demand and global economic conditions. During 2009, styrene pricing increased from lows in the first quarter of 2009 trending higher through the second half of 2009. Styrene pricing remained volatile in 2010 with prices up in the first half of 2010, declining in the third quarter, then rising to a higher level in the fourth quarter. Butadiene pricing also increased from the lows of the first quarter of 2009 and stabilized during the third quarter of 2009. During 2010, butadiene pricing increased into the third quarter before declining in the fourth quarter. In 2009, spot isoprene prices were volatile in the first half of the year, but prices stabilized during the third quarter of 2009 before trending higher in late 2009. Spot isoprene pricing continued to increase through the first half of 2010 before declining in the second half due to improved supply/demand. Overall, monomer pricing in the fourth quarter of 2010 was comparable to the third quarter of 2010, and average monomer costs in 2010 were up significantly compared to 2009.
Styrene, butadiene and isoprene used by our U.S. and European facilities are predominantly supplied by a portfolio of suppliers under long-term supply contracts and arrangements with various expiration dates. For our U.S. facilities, we also procure a substantial amount of isoprene from a variety of suppliers from Russia, China and Japan. These purchases include both spot and contract arrangements. We generally contract with these suppliers on a short-term basis, and the number of such contracts has been increasing since 2008. We have increased the number of these contracts since 2008 to ensure the availability of our isoprene supply.
In Japan, butadiene and isoprene are supplied under our joint venture agreement by our joint venture partner. Styrene in Japan is sourced from local third-party suppliers. Our facility in Paulinia, Brazil, generally purchases all of its raw materials from local third-party suppliers.
We believe our contractual and other arrangements with suppliers of styrene, butadiene and isoprene provide an adequate supply of raw materials at competitive, market-based prices. We can provide no assurances that contract suppliers will not terminate these contracts at the expiration of their contract terms, that we will be able to obtain substitute arrangements on comparable terms, or that we generally will be able to source raw materials on an economic basis in the future.
International Operations and Currency Fluctuations. We operate a geographically diverse business serving customers in approximately 60 countries from five manufacturing facilities on four continents. For the year ended December 31, 2010, approximately 42% of total operating revenues were generated from customers
43
Table of Contents
located in the Americas, 37% in Europe and 21% in the Asia Pacific region. Although we sell and manufacture our products in many countries, our sales and production costs are mainly denominated in U.S. dollars, Euros, Japanese Yen and Brazilian Real. From time to time, we use hedging strategies to reduce our exposure to currency fluctuations.
Our financial results are subject to gains and losses on currency translations, which occur when the financial statements of foreign operations are translated into U.S. dollars. The financial statements of operations outside the United States where the local currency is considered to be the functional currency are translated into U.S. dollars using the exchange rate at each balance sheet date for assets and liabilities and the average exchange rate for each period for revenues, expenses, gains and losses and cash flows. The effect of translating the balance sheet into U.S. dollars is included as a component of other comprehensive income (loss) in stockholders’ equity on the consolidated balance sheets. Any appreciation of the functional currencies against the U.S. dollar will increase the U.S. dollar equivalent of amounts of revenues, expenses, gains and losses and cash flows, and any depreciation of the functional currencies will decrease the U.S. dollar amounts reported.
For the years ended December 31, 2010, 2009 and 2008, the estimated pre-tax income/loss from currency fluctuations, including the cost of hedging strategies amounted to $5.5 million loss, $3.3 million loss, and $4.5 million income.
Seasonality. Seasonal changes and weather conditions, although difficult to predict, typically affect the Paving and Roofing end use market resulting in higher sales volumes into this end use market in the second and third quarters of the calendar year versus the first and fourth quarters of the calendar year. Our other end use markets tend to show relatively little seasonality.
Recent Developments
Refinancing of Our Existing Indebtedness. On February 11, 2011, we refinanced our existing indebtedness by completing an offering of $250.0 million in aggregate principal amount of 6.75% Senior Notes due 2019 through an institutional private placement and entering into a new $350.0 million senior secured credit agreement. The new credit agreement provides for senior secured financing consisting of:
| • | a $200.0 million senior secured revolving credit facility. The new revolver, which was undrawn at close, replaces our previous $80.0 million facility; |
| • | a $150.0 million senior secured term loan facility; and |
| • | an option to raise up to $125.0 million of incremental term loans or incremental revolving credit commitments. |
Project Assessment Underway for Additional HSBC Capacity in Asia. As a result of growth in Kraton’s differentiated grades of HSBC’s globally, we see the need for additional manufacturing capacity. We are continuing to expand and strengthen our presence in Asia, and thus, we believe Kraton’s regional, and global, business would benefit from such increased manufacturing capacity in the Asia-Pacific region. We believe expansion of HSBC capacity is the next step to grow our position in the Asia Pacific region, supporting application and technology developments for Kraton’s leading, proprietary, styrenic block copolymer formulations. We are exploring options to build a 30 kiloton HSBC manufacturing facility that would employ Kraton’s latest state-of-the-art technology for producing HSBC’s and, we believe, will set a new global standard for manufacturing cost and product quality, demonstrating further our commitment to growing our business and to the region. Our site-selection team is continuing to explore alternatives and we now expect its recommendation to management in the second quarter of 2011, at which time we will be in a better position to render a final project decision. While it is too early to estimate the expected cost of the new facility, we anticipate that construction could commence in the first half of 2012 with start-up occurring as early as the second half of 2013. Although no firm commitments have been made, we have reserved approximately $13.0 million in our 2011 capital expenditure plan for engineering related to this potential new capacity.
44
Table of Contents
New Innovation. In May 2010, we announced we commercialized DX405 as a new functional polymer to our product line of polymers for Adhesives, Sealants, and Coatings. This technology will allow our customers to more efficiently and expediently manufacture products that are stronger and softer. DX405 has a low styrene content, which promotes ease of processing, low viscosity, and the attainment of lower application temperatures. This adds efficiency and simplification to the manufacturing process, which shortens batch times, increases extrusion rates and improves productivity. DX405 has a wide formulation window and its versatility makes it suitable for solvent-based compositions, hot melt adhesives, and sealant applications. It can be formulated with other polymers, resins, fillers, pigments, oils, thickeners, waxes and stabilizers to obtain a desired balance of properties.
In July 2010, we announced the addition of Kraton D1183 BT, a new SIS grade, to our line of polymers for use in applications where softness, ease-in-processing, and high temperature resistance are essential. Kraton D1183 BT is suitable for use in many adhesive applications including thermal printing labels, high temperature resistant labels, elastic labels and diaper tabs. It is an excellent choice for adhesives in hygiene applications and its shear strength is particularly good at body temperature. Moreover, it offers economically attractive adhesive formulations, and gives formulators the ability to dilute it further to obtain equivalent performance levels of competing products, which can result in cost-savings. It can also achieve significantly higher cohesive strength and higher temperature resistance without the use of expensive endblock resins. Therefore, Kraton D1183 BT is not only economically attractive, but also substantially stronger and offers a wider formulating space. Prior to the commercialization of Kraton D1183 BT, innovators used low-coupled SIS block copolymers to impart softness to end-products. Although they offered improved adhesion on open and porous substrates and good label die-cutting performance, they often lacked cohesion, which hampered their use in applications where higher shear and temperature resistance was required. In comparison, Kraton D1183 BT is a 40% diblock SIS, which shows superior performance to low-coupled SIS block copolymers and is therefore the polymer of choice for these applications.
In August 2010, we announced that our roof coating formulation containing Kraton G1643 exceeds requirements in the ASTM International D6083 standard specification recognized in the elastomeric roof coating market. ASTM D6083 is an industry standard that establishes minimum performance levels in the following areas: viscosity, weight and volume solids; mechanical properties; adhesion; low temperature flexibility after accelerated weathering; tear resistance; permeation and water swelling; and fungi resistance. This gives innovators an opportunity to more effectively compare polymer-to-polymer for roof coating formulations. This SBC-based polymer has a proven track record of improving the performance of roof coatings because it adds superior water resistance, improved adhesion, and increased elongation to formulations. In December 2010, elastomeric roof coating formulation containing Kraton G1643 completed a major milestone towards achieving the ENERGY STAR rating, the trusted, government-backed symbol for products that are energy efficient, cost-effective and sustainable. We tested the reflectance and emittance of our G1643 elastomeric roof coating formulation using ASTM C1549 and ASTM C1371 standards. The results indicated reflectance of 0.89, and emittance of 0.88, respectively, which are considered best in class when compared to other roof coatings formulations in the market today. Reflectance and emittance properties are measured on a scale of 0 - 1.0 where 1.0 is the most reflective or emissive according to the Cool Roof Rating Council (CRRC). The ENERGY STAR program also uses these standards to evaluate the energy efficiency of elastomeric roof coatings. Roof coating formulations containing Kraton G1643 can reduce the total cost of installation and offer a fast cure coating that works better in cold, humid, or wet conditions. They can withstand ponding water, provide excellent adhesion to all types of roofing substrates, are ideal for low slope roofs (or high traffic areas), deliver excellent reflectance to reduce energy costs, and extend the life of a roof. It can be used to help lower volatile organic compounds (VOCs) in a solvented formulation, which have significant vapor pressures that can affect the environment and human health. In addition, our tested formulation can be used under the EPA’s regulation for thermoplastic rubber coatings and mastic.
In October 2010, we announced the development of a new SBC-based alternative for slush molded interior soft skins. Slush molding is a specialized processing operation traditionally designed for polyvinyl chloride (PVC) based compounds to produce the interior surface of automobiles such as instrument panel skins, door
45
Table of Contents
panels, airbags and consoles. Kraton Performance Polymers and SO.F.TER. SPA formed a strategic alliance to leverage the leading innovation and scientific capabilities of both companies. This resulted in the development of a superior and more environmentally-friendly alternative to PVC and thermoplastic polyurethanes (TPU) which provides a major technology and performance leap for the automotive industry. Manufacturers can achieve significant improvements in low-temperature performance, fogging, and recyclability while still using existing slush molding equipment and standard processing conditions. An additional benefit is lowered manufacturing costs due to reduced service temperatures and decreased processing time. Our new product provides a 30% to 40% reduction in material weight, better aging properties, and improved soft touch compared to existing materials. These benefits help automotive manufacturers reduce the weight of vehicle components, while enhancing aesthetics and performance.
Poly-Isoprene Rubber Manufacturing at Belpre, Ohio. We commenced plant modifications and upgrades at our Belpre facility. The investment of approximately $27.0 million, of which $16.0 million was spent as of December 31, 2010, will enable production of Poly-Isoprene Rubber, for use in production of Isoprene Latex by our Emerging Business end use. We expect to complete this project by mid-2011.
Isoprene Rubber Latex Capacity Expansion at Paulinia, Brazil. We commenced the IRL debottleneck and expansion project at our Paulinia facility in the third quarter of 2010. The investment of approximately $9.9 million, of which $7.1 million was spent as of December 31, 2010, when combined with capacity contractually available to us at a third party site in Japan, will expand IRL capacity by approximately 33.0%. We expect to complete this project by mid-2011.
European Office Consolidation. In the third quarter of 2010, we consolidated our transactional functions as well as much of our European management to a new European central office in Amsterdam, the Netherlands, which, we believe will result in greater operating efficiency and improved service to our global customers while ultimately lowering operating costs by an estimated $2.0 million per year. We expect the total cost related to the consolidation to be approximately $5.5 million.
Outlook
Based upon existing market trends, we currently expect that our first quarter 2011 sales volume will be up 5-7% compared to the first quarter 2010. In addition, we believe pricing for our three primary feedstocks, on average, will be higher in the first quarter of 2011 than in the fourth quarter of 2010, as monomer prices reflect factors such as higher crude oil prices and other supply/demand fundamentals such as the shortage of natural rubber, which has increased demand for butadiene and isoprene used in the production of natural rubber substitutes. As a result of the movement in raw material prices, we expect to recognize a LIFO to FIFO benefit in the first quarter of 2011. Finally, we expect capital expenditure to be $80 to $85 million in 2011, largely driven by completion of the CariflexTM isoprene rubber and latex projects in Belpre, Ohio and Paulinia, Brazil respectively, on-going expenditures in our four-year process control system upgrades also in Belpre, and initial expenditures associated with our anticipated Asian HSBC expansion project.
46
Table of Contents
The following table summarizes certain information relating to our operating results that has been derived from our consolidated financial statements.
| Years ended December 31, | ||||||||||||
| 2010 | 2009 | 2008 | ||||||||||
| (In thousands, except per share data) | ||||||||||||
| Consolidated Statements of Operations Data: |
||||||||||||
| Operating Revenues |
||||||||||||
| Sales |
$ | 1,228,425 | $ | 920,362 | $ | 1,171,253 | ||||||
| Other(1) |
— | 47,642 | 54,780 | |||||||||
| Total operating revenues |
1,228,425 | 968,004 | 1,226,033 | |||||||||
| Cost of Goods Sold |
927,932 | 792,472 | 971,283 | |||||||||
| Gross Profit |
300,493 | 175,532 | 254,750 | |||||||||
| Operating Expenses |
||||||||||||
| Research and development |
23,628 | 21,212 | 27,049 | |||||||||
| Selling, general and administrative |
92,305 | 79,504 | 101,431 | |||||||||
| Depreciation and amortization of identifiable intangibles |
49,220 | 66,751 | 53,162 | |||||||||
| Total operating expenses |
165,153 | 167,467 | 181,642 | |||||||||
| Gain on Extinguishment of Debt |
— | 23,831 | — | |||||||||
| Earnings of Unconsolidated Joint Venture(2) |
487 | 403 | 437 | |||||||||
| Interest Expense, Net |
23,969 | 33,956 | 36,695 | |||||||||
| Income (Loss) Before Income Taxes |
111,858 | (1,657 | ) | 36,850 | ||||||||
| Income Tax Expense (Benefit) |
15,133 | (1,367 | ) | 8,431 | ||||||||
| Net Income (Loss) |
$ | 96,725 | $ | (290 | ) | $ | 28,419 | |||||
| Earnings (Loss) per common share (note 12) |
||||||||||||
| Basic |
$ | 3.13 | $ | (0.01 | ) | $ | 1.46 | |||||
| Diluted |
$ | 3.07 | $ | (0.01 | ) | $ | 1.46 | |||||
| Weighted average common shares outstanding |
||||||||||||
| Basic |
30,825 | 19,808 | 19,387 | |||||||||
| Diluted |
31,379 | 19,808 | 19,464 | |||||||||
| (1) | Other revenues include the sale of by-products generated in the production of IR and SIS. |
| (2) | Represents our 50% joint venture interest in Kraton JSR Elastomers K.K., which is accounted for using the equity method of accounting. |
47
Table of Contents
The following table summarizes certain information relating to our operating results as a percentage of total operating revenues and has been derived from the financial information presented above. We believe this presentation is useful to investors in comparing historical results. Certain amounts in the table may not sum due to the rounding of individual components.
| Years ended December 31, | ||||||||||||
| 2010 | 2009 | 2008 | ||||||||||
| Consolidated Statements of Operations Data: |
||||||||||||
| Operating Revenues |
||||||||||||
| Sales |
100.0 | % | 95.1 | % | 95.5 | % | ||||||
| Other |
— | 4.9 | 4.5 | |||||||||
| Total operating revenues |
100.0 | 100.0 | 100.0 | |||||||||
| Cost of Goods Sold |
75.5 | 81.9 | 79.2 | |||||||||
| Gross Profit |
24.5 | 18.1 | 20.8 | |||||||||
| Operating Expenses |
||||||||||||
| Research and development |
1.9 | 2.2 | 2.2 | |||||||||
| Selling, general and administrative |
7.5 | 8.2 | 8.3 | |||||||||
| Depreciation and amortization of identifiable intangibles |
4.0 | 6.9 | 4.3 | |||||||||
| Total operating expenses |
13.4 | 17.3 | 14.8 | |||||||||
| Gain on Extinguishment of Debt |
— | 2.5 | — | |||||||||
| Earnings of Unconsolidated Joint Venture |
— | — | — | |||||||||
| Interest Expense, Net |
2.0 | 3.5 | 3.0 | |||||||||
| Income (Loss) Before Income Taxes |
9.1 | (0.2 | ) | 3.0 | ||||||||
| Income Tax Expense (Benefit) |
1.2 | (0.1 | ) | 0.7 | ||||||||
| Net Income (Loss) |
7.9 | % | — | % | 2.3 | % | ||||||
Year Ended December 31, 2010 Compared to Year Ended December 31, 2009
Operating Revenues
Operating revenues include revenue from the sale of our core products and, prior to the exit of our Pernis facility on December 31, 2009, the sale of small quantities of by-products resulting from the manufacturing process of IR. For the year ended December 31, 2010, total operating revenues increased $260.4 million or 26.9% compared to the same period in 2009.
Sales increased $308.1 million or 33.5% compared to 2009 sales largely due to increased sales volumes of approximately $167.0 million, primarily related to the positive worldwide economic climate, increases in global product sales prices primarily in response to higher raw material costs and increased demand for our products of approximately $159.8 million, partially offset by a decrease of approximately $18.7 million from changes in foreign currency exchange rates.
In addition to the aforementioned increase in global product sales prices, which was evidenced in each of the end-uses, the following factors also influenced our sales revenue in each of our end use markets:
| • | Advanced Materials. Sales amounted to $374.5 million in 2010, an increase of $92.7 million or 32.9% compared to 2009 sales of $281.8 million. Sales growth was primarily driven by higher demand in automotive, consumer electronics, personal care and medical device applications. In addition, growth was also realized in our innovation products, notably wire and cable, medical device, and personal care applications. |
| • | Adhesives, Sealants and Coatings. Sales amounted to $398.0 million in 2010, an increase of $100.5 million or 33.8% compared to 2009 sales of $297.5 million. The increase was primarily driven by strong core volume growth in North America and Europe, including the positive effect from the global |
48
Table of Contents
| economic recovery which spurred increased demand in personal care and specialty tape applications. Sales of innovation products progressed, as we gained momentum in removable protective films, health and beauty gels, and white elastomeric roof coatings. |
| • | Paving and Roofing. Sales amounted to $343.8 million in 2010, an increase of $100.9 million or 41.5% compared to 2009 sales of $242.9 million. We experienced improved European and emerging market growth for our roofing products and to a lesser extent, increased demand in North America roofing. Global paving demand was essentially flat compared to 2009. |
| • | Emerging Businesses. Sales amounted to $79.4 million in 2010, an increase of $18.6 million or 30.6% compared to 2009 sales of $60.8 million. The increase reflects the continued volume growth of our isoprene rubber products in applications such as surgical gloves and condoms. |
As a result of our exit from our Pernis facility, other revenue, which had been derived from the sale of by-products generated at the Pernis facility, decreased $47.6 million or 100.0% compared to 2009 other revenue.
Cost of Goods Sold
Cost of goods sold for the year ended December 31, 2010 increased $135.5 million or 17.1% compared to the same period in 2009. The increase was driven primarily by a $133.5 million increase in monomer and other production costs and a $92.6 million increase related to the increase in sales volume. These increases were partially offset by a $47.6 million decrease in by-product costs, a $11.8 million decrease in plant turnaround costs, and a $12.4 million decrease from changes in foreign currency exchange rates. Furthermore, we also realized an $18.8 million decrease in costs associated with the 2009 shutdown of our Pernis site, which includes ongoing operating cost reductions of $11.7 million, lower restructuring costs of $6.0 million and a $1.1 million non-cash charge to write-down our inventory of spare-parts recognized in the third quarter 2009.
Cost of goods sold was 75.5% of operating revenues for the year ended December 31, 2010 compared to 81.9% for the same period in 2009. The spread between first-in, first-out basis and estimated current replacement cost basis resulted in a decrease in cost of goods sold of approximately $12.1 million for the year ended December 31, 2010 compared to an increase in cost of goods sold of approximately $17.6 million for the same period in 2009.
Gross Profit
Gross profit for the year ended December 31, 2010 increased $125.0 million or 71.2% compared to the same period in 2009. Gross profit was 24.5% of operating revenues for the year ended December 31, 2010 compared to 18.1% for the same period in 2009.
Operating Expenses
| • | Research and Development. Research and development expense increased $2.4 million or 11.4% largely due to higher operating costs. Research and development expense was 1.9% of operating revenues for the year ended December 31, 2010 compared to 2.2% for the same period in 2009. |
| • | Selling, General and Administrative. Selling, general and administrative expenses increased $12.8 million or 16.1% primarily due to an increase in employment related costs of $16.5 million, which includes an increase in incentive compensation costs of $10.2 million, salaries of $5.0 million, and stock-based compensation costs of $1.3 million. Furthermore, restructuring and related costs increased by approximately $3.5 million. These increases were partially offset by $4.6 million of savings from the implementation of our global ERP system, and a $2.0 million decline in management fees. Selling, general and administrative expenses were 7.5% of operating revenues for the year ended December 31, 2010 compared to 8.2% for the same period in 2009. |
| • | Depreciation and Amortization. Depreciation and amortization expense decreased $17.5 million or 26.3% largely due to the exit from our Pernis facility in December 2009. |
49
Table of Contents
Interest Expense, Net
Interest expense, net for the year ended December 31, 2010 decreased $10.0 million or 29.4% to $24.0 million compared to $34.0 million during the same period in 2009 primarily due to the decline in outstanding indebtedness. The average debt balances outstanding were $388.3 million at an average effective interest rate of 6.2% and $531.0 million at an average effective interest rate of 6.4% for the years ended December 31, 2010 and 2009, respectively.
Income Tax Expense (Benefit)
Income tax expense for the year ended December 31, 2010 was $15.1 million compared to an income tax benefit of $1.4 million for the year ended December 31, 2009. The effective tax rate for the year ended December 31, 2010 was 13.5% compared to (82.5%) for the year ended December 31, 2009.
The provision for income taxes differs from the amount computed by applying the U.S. statutory income tax rate to income from continuing operations before income taxes for the reasons set forth below:
| Years ended December 31, | ||||||||||||
| 2010 | 2009 | 2008 | ||||||||||
| (in thousands) | ||||||||||||
| Income Taxes at the Statutory Rate |
$ | 39,153 | $ | (580 | ) | $ | 12,897 | |||||
| Foreign Tax Rate Differential |
(4,261 | ) | (97 | ) | (3,294 | ) | ||||||
| State Taxes |
52 | (225 | ) | (86 | ) | |||||||
| Permanent Differences |
648 | (832 | ) | (221 | ) | |||||||
| Differences in Foreign Earnings Remitted |
— | 4,165 | 6,354 | |||||||||
| Tax Credits |
(610 | ) | (122 | ) | — | |||||||
| Deferred Adjustment |
(29,806 | ) | (2,597 | ) | — | |||||||
| Change in Valuation Allowance and Uncertain Tax Positions |
9,055 | (890 | ) | (7,219 | ) | |||||||
| Other |
902 | (189 | ) | — | ||||||||
| Income Tax Expense (Benefit) |
$ | 15,133 | $ | (1,367 | ) | $ | 8,431 | |||||
| Years ended December 31, | ||||||||||||
| 2010 | 2009 | 2008 | ||||||||||
| Income Taxes at the Statutory Rate |
35.0 | % | 35.0 | % | 35.0 | % | ||||||
| Foreign Tax Rate Differential |
(3.8 | )% | 5.9 | % | (8.9 | )% | ||||||
| State Taxes |
0.0 | % | 13.6 | % | (0.2 | )% | ||||||
| Permanent Differences—Other |
0.6 | % | 50.2 | % | (0.6 | )% | ||||||
| Differences in Foreign Earnings Remitted |
0.0 | % | (251.4 | )% | 17.2 | % | ||||||
| Tax Credits |
(0.6 | )% | 7.4 | % | 0.0 | % | ||||||
| Deferred Adjustment |
(26.6 | )% | 156.7 | % | 0.0 | % | ||||||
| Change in Valuation Allowance and Uncertain Tax Positions |
8.1 | % | 53.7 | % | (19.6 | )% | ||||||
| Other |
0.8 | % | 11.4 | % | 0.0 | % | ||||||
| Effective Tax Rate |
13.5 | % | 82.5 | % | 22.9 | % | ||||||
Net Income (Loss)
Net income was $96.7 million or $3.07 per diluted share for the year ended December 31, 2010, an increase of $97.0 million compared to a net loss of $0.3 million or $(0.01) per diluted share in the same period in 2009. For the year ended December 31, 2009, we realized a gain on the extinguishment of debt that amounted to $1.20 per diluted share.
50
Table of Contents
Year Ended December 31, 2009 Compared to Year Ended December 31, 2008
Operating Revenues
Operating revenues includes revenue from the sale of our core products and the sale of small quantities of by-products resulting from the manufacturing process of IR. For the year ended December 31, 2009 total operating revenues decreased $258.0 million or 21.0% compared to the same period in 2008.
Sales decreased $250.9 million or 21.4%. The decline in sales was the result of:
| • | a $168.5 million decline in sales volume from 313.1 kilotons in 2008 to 260.3 kilotons in 2009. The 52.8 kilotons or 16.9% decline in sales volume was largely the result of weak first half demand where year-over-year volume was 52.5 kilotons below the first half of 2008. Demand was negatively impacted by the global economic slowdown; |
| • | a $59.1 million decline in global product sales prices, including the effect on sales prices from changes in the cost of monomers, and product mix; and |
| • | a $23.3 decline from changes in foreign currency exchange rates, principally from a weaker Euro versus U.S. dollar in 2009 compared to 2008. |
The following are the primary factors influencing our sales revenue in each of our in these end use markets:
| • | In our Advanced Materials end use market, sales amounted to $281.8 million in 2009, a decline of $73.1 million or 20.6% from 2008 sales of $354.9 million. Our sales volume into key markets such as automotive, consumer electronics/appliances and personal care applications declined commensurate with global economic conditions; however, as market conditions improved late in the third quarter and continued through the fourth quarter of 2009, volume began to recover. HSBC sales were up 20% in the fourth quarter of 2009 compared to the fourth quarter of 2008, as demand for consumer electronics and personal care items returned. There was also an improvement in innovation programs that were delayed in the first-half of 2009 which began to move forward by year end. |
| • | In our Adhesives, Sealants and Coatings end use market, sales amounted to $297.5 million in 2009, a decline of $75.7 million or 20.3% from 2008 sales of $373.2 million. Sales were down due to the general weak demand in the first half of 2009 due to the global economic crisis. We experienced a decline in overall demand that began in the fourth quarter of 2008 and continued into 2009. However, we did experience positive trends during the year, including increased demand for non-woven adhesives applications such as for diapers and hygiene products along with continued growth in commercial and specialty tapes and labels. |
| • | In our Paving and Roofing end use market, sales amounted to $242.9 million in 2009, a decline of $122.4 million or 33.5% from 2008 sales of $365.3 million. Roofing applications were lower due to the overall decline in construction activity, particularly in the commercial sector. We also experienced a decline in our paving business, largely due to delays associated with the uncertainty around the impact of the U.S. government economic stimulus spending and budgetary constraints on state and local government spending. |
| • | In our Emerging Businesses end use market, sales amounted to $60.8 million in 2009, an increase of $26.0 million or 74.7% from 2008 sales of $34.8 million. The increase reflects the continued penetration of our IR and IRL products in applications such as surgical gloves and condoms. |
Other revenue decreased $7.1 million or 13.0%. Other revenue primarily consists of the sales of small quantities of by-products resulting from the manufacturing process of IR, which is offset by a corresponding cost included in cost of goods sold.
51
Table of Contents
Cost of Goods Sold
Cost of goods sold for the year ended December 31, 2009 decreased $178.8 million or 18.4% compared to the same period in 2008. The decrease was driven primarily by:
| • | a $127.3 million decrease related to the decline in sales volume; |
| • | a $37.1 million decrease in monomer and other production costs; |
| • | a $18.8 million decrease from changes in foreign currency exchange rates; |
| • | a $7.1 million decrease due to lower by-product costs; offset by |
| • | a $11.5 million increase in plant turnaround costs. The increase in turnaround costs reflects major maintenance at our Wesseling, Germany and Berre, France facilities, which are required by regulatory authorities required every six years. |
The spread between first-in, first-out or FIFO basis and current replacement cost resulted in an increase in cost of goods sold in 2009 of approximately $17.6 million and a decrease in cost of goods sold of approximately $37.1 million in 2008.
As a percentage of operating revenues, cost of goods sold increased to 81.9% from 79.2%.
Gross Profit
Gross profit for the year ended December 31, 2009 decreased $79.2 million or 31.1% compared to the same period in 2008. The decrease was driven primarily by a decrease in sales volume. As a percentage of operating revenues, gross profit decreased to 18.1% from 20.8%. On an estimated replacement cost basis, gross profit margins would have been 19.9% and 17.7% in 2009 and 2008, respectively.
Operating Expenses
Operating expenses for the year ended December 31, 2009 decreased $14.2 million or 7.8% compared to the same period in 2008. The decrease was driven primarily by:
| • | a $5.8 million or 21.6% decrease in research and development expenses. The decrease was largely due to a $2.1 million one-time cost of severance incurred in 2008, and approximately $2.7 million in staffing related savings in 2009 associated with the realignment of our Research and Technology Service organization. As a percentage of operating revenues, research and development was unchanged at 2.2%. |
| • | a $21.9 million or 21.6% decrease in selling, general and administrative expenses. The decrease was primarily due to a reduction of our incentive compensation costs of $13.4 million and lower restructuring and related costs of $7.9 million. As a percentage of operating revenues, selling, general and administrative expenses decreased to 8.2% from 8.3%. |
| • | a $13.6 million or 25.6% increase in depreciation and amortization expenses. The increase was largely due to the one-time accelerated depreciation associated with the shutdown and exit of the Pernis facility as of December 31, 2009. As a percentage of operating revenues, depreciation and amortization expenses increased to 6.9% from 4.3%. |
Interest Expense, Net
Interest expense, net for the year ended December 31, 2009 decreased $2.7 million or 7.4% to $34.0 million compared to $36.7 million during the same period in 2008. The decrease was primarily due to lower interest rates, amortized gains from our interest rate swap that was settled in June 2008 and lower debt balances; partially offset by the write off of approximately $1.5 million of deferred financing costs and the ineffective portion of our
52
Table of Contents
2010 interest rate swap associated with the prepayment of $100 million on the term portion of our senior secured credit facility. The average debt balances outstanding were $531.0 million for the year ended December 31, 2009 and $562.4 million for the year ended December 31, 2008. The effective interest rates on our debt were 6.4% for the year ended December 31, 2009 and 6.5% for the year ended December 31, 2008.
Income Tax Expense
Income tax expense for the year ended December 31, 2009 was a tax benefit of $1.4 million compared to an income tax expense of $8.4 million for the year ended December 31, 2008. The effective tax rate for the year ended December 31, 2009 was (82.5)% compared to 22.9% for the year ended December 31, 2008.
The provision for income taxes differs from the amount computed by applying the U.S. statutory income tax rate to income from continuing operations before income taxes for the reasons set forth below:
| Years ended December 31, | ||||||||||||
| 2009 | 2008 | 2007 | ||||||||||
| (in thousands) | ||||||||||||
| Income Taxes at the Statutory Rate |
$ | (580 | ) | $ | 12,897 | $ | (13,171 | ) | ||||
| Foreign Tax Rate Differential |
(97 | ) | (3,294 | ) | 3,331 | |||||||
| State Taxes |
(225 | ) | (86 | ) | (3,012 | ) | ||||||
| Permanent Differences—Netherlands Participation Exemption |
(784 | ) | (903 | ) | — | |||||||
| Permanent Differences |
(48 | ) | 682 | (144 | ) | |||||||
| Differences in Foreign Earnings Remitted |
4,165 | 6,354 | 4,043 | |||||||||
| Tax Credits |
(122 | ) | — | — | ||||||||
| Tax Benefit Related to Foreign Losses |
(2,597 | ) | — | — | ||||||||
| Change in Valuation Allowance and Uncertain Tax Positions |
(890 | ) | (7,219 | ) | 15,073 | |||||||
| Other |
(189 | ) | — | — | ||||||||
| Income Tax Expense (Benefit) |
$ | (1,367 | ) | $ | 8,431 | $ | 6,120 | |||||
| Years ended December 31, | ||||||||||||
| 2009 | 2008 | 2007 | ||||||||||
| Income Taxes at the Statutory Rate |
35.0 | % | 35.0 | % | 35.0 | % | ||||||
| Foreign Tax Rate Differential |
5.9 | % | (8.9 | )% | (8.9 | )% | ||||||
| State Taxes |
13.6 | % | (0.2 | )% | 8.0 | % | ||||||
| Permanent Differences—Netherlands Participation Exemption |
47.3 | % | (2.5 | )% | 0.0 | % | ||||||
| Permanent Differences |
2.9 | % | 1.9 | % | 0.4 | % | ||||||
| Differences in Foreign Earnings Remitted |
(251.4 | )% | 17.2 | % | (10.7 | )% | ||||||
| Tax Credits |
7.4 | % | 0.0 | % | 0.0 | % | ||||||
| Tax Benefit Related to Foreign Losses |
156.7 | % | 0.0 | % | 0.0 | % | ||||||
| Change in Valuation Allowance and Uncertain Tax Positions |
53.7 | % | (19.6 | )% | (40.1 | )% | ||||||
| Other |
11.4 | % | 0.0 | % | 0.0 | % | ||||||
| Effective Tax Rate |
82.5 | % | 22.9 | % | (16.3 | )% | ||||||
Net Income (Loss)
Net loss was $0.3 million or $(0.01) per diluted share for the year ended December 31, 2009, a decrease of $28.7 million compared to a net income of $28.4 million or $1.46 per diluted share in the same period in 2008.
Critical Accounting Policies
The application of accounting policies and estimates is an important process that continues to evolve as our operations change and accounting guidance is issued. We have identified a number of critical accounting policies and estimates that require the use of significant estimates and judgments.
53
Table of Contents
Management bases its estimates and judgments on historical experience and on other various assumptions that it believes are reasonable at the time of application. The estimates and judgments may change as time passes and more information becomes available. If estimates and judgments are different from the actual amounts recorded, adjustments are made in subsequent periods to take into consideration the new information.
Inventories. Our inventory is principally comprised of finished goods inventory. Inventories are stated at the lower of cost or market as determined on a first-in, first-out basis. On a quarterly basis, we evaluate the carrying cost of our inventory to ensure that it is stated at the lower of cost or market. Our products are typically not subject to spoiling or obsolescence and consequently our reserves for slow moving and obsolete inventory have historically not been significant. Cash flows from the sale of inventory are reported in cash flows from operations in the consolidated statement of cash flows.
Property, Plant and Equipment. Property, plant and equipment are recorded at cost. Major renewals and improvements that extend the useful lives of equipment are capitalized. Repair and maintenance expenses are charged to operations as incurred. Disposals are removed at carrying cost less accumulated depreciation with any resulting gain or loss reflected in operations. When applicable, we capitalize interest costs which are incurred as part of the cost of constructing major facilities and equipment. We capitalized approximately $0.5 million of interest cost in 2010. No amounts of interest were capitalized in any other periods presented. Depreciation is recognized using the straight-line method over the following estimated useful lives:
| Machinery and equipment |
20 years | |||
| Building and land improvements |
20 years | |||
| Manufacturing Control Equipment |
10 years | |||
| Office equipment |
5 years | |||
| Research equipment and facilities |
5 years | |||
| Vehicles |
5 years | |||
| Computer hardware/information systems |
3 years |
Long-Lived Assets. In accordance with Impairment or Disposal of Long-Lived Assets Subsections of FASB ASC Subtopic 360-10, Property, Plant, and Equipment—Overall, (FASB Statement No. 144, Accounting for the Impairment or Disposal of Long-Lived Assets), long-lived assets, such as property, plant, and equipment, and purchased intangible assets subject to amortization are reviewed for impairment whenever events or changes in circumstances indicate that the carrying amount of an asset may not be recoverable. If circumstances require a long-lived asset or asset group be tested for possible impairment, we first compare undiscounted cash flows expected to be generated by that asset or asset group to its carrying value. If the carrying value of the long-lived asset or asset group is not recoverable on an undiscounted cash flow basis, an impairment is recognized to the extent that the carrying value exceeds its fair value. Fair value is determined through various valuation techniques including discounted cash flow models, quoted market values and third-party independent appraisals, as considered necessary.
Income Taxes. We conduct operations in separate legal entities in different jurisdictions. As a result, income tax amounts are reflected in these consolidated financial statements for each of those jurisdictions.
Net operating losses and credit carryforwards are recorded in the event such benefits are expected to be realized. Deferred taxes result from differences between the financial and tax bases of our assets and liabilities and are adjusted for changes in tax rates and tax laws when changes are enacted. Valuation allowances are recorded to reduce deferred tax assets when it is more likely than not that a tax benefit will not be realized. In determining whether a valuation allowance is required, the company evaluates primarily (a) the impact of cumulative losses in past years, and (b) current and/or recent losses. A recent trend in earnings despite cumulative losses is a prerequisite to considering not recording a valuation allowance.
In assessing the realizability of deferred tax assets, we consider whether it is more likely than not that some portion or all of the deferred tax assets will not be realized. The ultimate realization of deferred tax assets is dependent upon the generation of future taxable income during the periods in which those temporary differences
54
Table of Contents
become deductible. We consider the scheduled reversal of deferred tax liabilities, projected future taxable income and tax planning strategies in making this assessment. Based upon the level of historical taxable income and projections for future taxable income over the periods in which the deferred tax assets are deductible, we believe it is more likely than not that we will realize the benefits of these deductible differences, net of the existing valuation allowances.
Benefit Plans. We sponsor a noncontributory defined benefit pension plan, a non-qualified defined benefit pension plan, and other postretirement benefit plans. The actuarial determination of the projected benefit obligations and related benefit expense requires that certain assumptions be made regarding such variables as expected return on plan assets, discount rates, rates of future compensation increases, estimated future employee turnover rates and retirement dates, distribution election rates, mortality rates, retiree utilization rates for health care services and health care cost trend rates. The selection of assumptions requires considerable judgment concerning future events and has a significant impact on the amount of the obligations recorded in the consolidated balance sheets and on the amount of expense included in the consolidated statements of operations.
The movements of the capital markets impact the market value of the investment assets used to fund our defined benefit pension plans. Future changes in plan asset returns, assumed discount rates and various other factors related to our pension and post-retirement plans will impact future pension expense and liabilities.
Revenue Recognition. Sales are recognized in accordance with the provisions of ASC 605, Revenue Recognition—Overall, when the revenue is realized or realizable, and has been earned. Revenue for product sales is recognized when risk and title to the product transfer to the customer, which usually occurs at the time shipment is made. Our products are generally sold FOB (free on board) shipping point or, with respect to countries other than the United States, an equivalent basis. As such, title to the product passes when the product is delivered to the freight carrier. Our standard terms of delivery are included in our contracts of sale, order confirmation documents and invoices. Shipping and other transportation costs charged to customers are recorded in both sales and cost of sales.
We have entered into agreements with some of our customers whereby they earn rebates from us when the volume of their purchases of our product reach certain agreed upon levels. We recognize the rebate obligation ratably, as a reduction of revenue.
Liquidity and Capital Resources
Known Trends and Uncertainties
We are a holding company without any operations or assets other than the operations of our subsidiaries.
Based upon current and anticipated levels of operations, we believe that cash flow from operations of our subsidiaries and borrowings available to us will be adequate for the foreseeable future for us to fund our working capital and capital expenditure requirements and to make required payments of principal and interest on the notes and the new senior secured credit facility. However, these cash flows are subject to a number of factors, including, but not limited to, earnings, sensitivities to the cost of raw materials, seasonality, currency transactions and currency translation. Because feedstock costs generally represent approximately 50% of our cost of goods sold, in periods of rising feedstock costs, we consume cash in operating activities due to increases in accounts receivable and inventory costs, partially offset by increased value of accounts payable. Conversely, during periods in which feedstock costs are declining, we generate cash flow from decreases in working capital.
55
Table of Contents
On February 11, 2011, we refinanced our existing indebtedness by completing an offering of $250.0 million in aggregate principal amount of 6.75% Senior Notes due 2019 through an institutional private placement and entering into a new $350.0 million senior secured credit agreement. The new credit agreement provides for senior secured financing consisting of:
| • | a $200.0 million senior secured revolving credit facility. The new revolver, which was undrawn at close, replaces our previous $80.0 million facility; |
| • | a $150.0 million senior secured term loan facility; and |
| • | an option to raise up to $125.0 million of incremental term loans or incremental revolving credit commitments. |
See Note 16 Subsequent Events to the Consolidated Financial Statements accompanying this report for further discussion.
Going forward there can be no assurance that our business will generate sufficient cash flow from operations or that future borrowings will be available under the new senior secured credit facility to fund liquidity needs in an amount sufficient to enable us to service our indebtedness. At December 31, 2010, we had $92.8 million of cash and cash equivalents. Our available cash and cash equivalents are held in accounts managed by third-party financial institutions and consist of cash invested in interest bearing funds and cash in our operating accounts. To date, we have experienced no loss or lack of access to our invested cash or cash equivalents; however, we can provide no assurances that access to our invested cash and cash equivalents will not be impacted by adverse conditions in the financial markets.
Under the terms of our new senior secured credit facility, we are subject to certain financial covenants, including maintenance of a maximum consolidated net total leverage ratio, a minimum consolidated net interest coverage ratio and maximum capital expenditures. Our failure to comply with any of these financial covenants would give rise to a default under the new senior secured credit facility. The maintenance of these financial ratios is based on our level of profitability. If factors arise that negatively impact our profitability, we may not be able to satisfy our covenants. If we are unable to satisfy such covenants or other provisions at any future time we would need to seek an amendment or waiver of such financial covenants or other provisions. The respective lenders under the new senior secured credit facility may not consent to any amendment or waiver requests that we may make in the future, and, if they do consent, they may not do so on terms which are favorable to us. In the event that we were unable to obtain any such waiver or amendment and we were not able to refinance or repay our debt instruments, our inability to meet the financial covenants or other provisions of the new senior secured credit facility would constitute an event of default under our debt instruments, including the senior secured credit facility, which would permit the bank lenders to accelerate the senior secured credit facility.
As of the date hereof, we have available to us, upon compliance with customary conditions, $200.0 million under the revolving portion of the new senior secured credit facility and have no drawings under the revolving portion. While we expect to meet the conditions required to provide us full access to the revolving portion of the new senior secured credit facility, we cannot guarantee that all of the counterparties contractually committed to fund a revolving credit draw request will actually fund future requests, although, based upon our present analysis, we currently believe that each of the counterparties would meet their funding requirements.
We expect to make contributions of $7.4 million to our employee benefit plans in 2011 versus $3.3 million in 2010. If the market value of these assets does not improve during 2011, higher levels of contributions could be required in 2012 and beyond.
Turbulence in the U.S. and international markets and economies may adversely affect our liquidity and financial condition, and the liquidity and financial condition of our customers, and our ability to timely replace maturing liabilities and access the capital markets to meet liquidity needs, resulting in adverse effects on our financial condition and results of operations. However, to date we have been able to access borrowings available to us in amounts sufficient to fund liquidity needs.
56
Table of Contents
Our ability to pay principal and interest on our indebtedness, fund working capital and make anticipated capital expenditures depends on our future performance, which is subject to general economic conditions and other factors, some of which are beyond our control. See Part I, Item 1A. Risk Factors for further discussion.
Operating Cash Flows
Net cash provided by operating activities totaled $55.4 million for the year ended December 31, 2010 compared to $72.8 million for the year ended December 31, 2009. This represents a decline of $17.4 million or 24.0% largely due to higher levels of working capital, partially offset by higher net earnings. Net income for the year ended December 31, 2010 was $97.0 million higher than the year ended December 31, 2009. After adjusting net income for certain items, including depreciation and amortization, the gain on extinguishment of debt and deferred taxes that are necessary to reconcile net income to cash provided by operating activities, we generated $113.6 million more cash in 2010 than in 2009. However, this increase was more than offset by higher levels of working capital which consumed $101.8 million of cash in the year ended December 31, 2010 compared to providing $29.2 million of cash in 2009. This $131.0 million decrease in cash flows period over period was primarily driven by:
| • | a $90.8 million increase in inventories of products, materials and supplies, largely due to increases in the cost of raw materials and inventory quantity; |
| • | a $24.6 million increase in other assets; and |
| • | a $14.4 million decrease in other payables and accruals. |
Cash and cash equivalents increased from $69.3 million at December 31, 2009 to $92.8 million at December 31, 2010. Including amounts undrawn on our revolving loans, which amounted to $80.0 million at December 31, 2009 and 2010, liquidity, defined as cash and cash equivalents plus the undrawn amount of our revolving loans, amounted to $149.3 million and $172.8 million at December 31, 2009 and 2010, respectively.
Net cash provided by operating activities increased $32.6 million to $72.8 million in 2009 compared to $40.2 million provided by operating activities during the same period in 2008. This change was driven primarily by:
| • | a $130.8 million decrease in inventories of products, materials and supplies, largely due to decreases in the cost of raw material feedstocks and volume; |
| • | a $1.1 million decrease in other assets largely due to the timing of certain payments; |
| • | a $3.8 increase in accounts payable primarily due to the timing of payments; partially offset by |
| • | a $59.5 million increase in accounts receivable due to the increase in sales volume in the fourth quarter of 2009 versus the fourth quarter of 2008; |
| • | a $23.8 million gain on the extinguishment of debt; and |
| • | a $28.7 million in lower earnings. |
Cash and cash equivalents decreased from $101.4 million at December 31, 2008 to $69.3 million at December 31, 2009. Including amounts undrawn on our revolving loans, which amounted to $80.0 million at December 31, 2009 and $25.5 million at December 31, 2008, liquidity, defined as cash and cash equivalents (and the undrawn amount of our revolving loans), amounted to $149.3 million at December 31, 2009 and $126.9 million at December 31, 2008.
57
Table of Contents
Investing Cash Flows
Net cash used in investing activities totaled $55.7 million in 2010 compared to net cash used in investing activities of $49.6 million during the same period in 2009. Capital projects in 2010 included the following:
| • | $13.9 million associated with transferring IR production from Pernis to our Belpre facility; |
| • | $8.2 million for upgrades of certain systems and operating controls at our Belpre facility; |
| • | $6.7 million for the IRL debottleneck and expansion project at our Paulinia facility. |
Net cash used in investing activities totaled $49.6 million in 2009 compared to net cash used in investing activities of $24.1 million during the same period in 2008. This $25.5 million increase was primarily driven by timing of capital expenditures. We are upgrading certain systems and operating controls at our Belpre facility. This project is designed to significantly improve the effectiveness, competitiveness and operating efficiency of the Belpre facility. The project began in the second-half of 2008 and will be completed in distinct phases extending into 2012, with 2009 spending of $9.1 million. We also incurred approximately $15.3 million for an ERP software system upgrade, which we began implementing in January 2009. We upgraded our ERP software systems utilizing a single global system and implementing best practices for our industry. For Europe and the United States, we completed this upgrade in August 2009 and for Brazil and Asia, we completed this upgrade in October 2009.
Expected Capital Expenditures.
We expect 2011 capital expenditures will be approximately $80.0 to $85.0 million. Our minimum annual capital expenditure levels to maintain and achieve required improvements in our facilities in each of the next three to five years are expected to be approximately $16.0 million to $22.0 million. Included in our 2011 capital expenditure estimate is approximately $13.0 million for engineering related to our ongoing assessment of a possible HSBC manufacturing facility in Asia, approximately $5.6 million for the multi-year systems and control upgrades, approximately $11.4 million to replace IR production from the closure of our Pernis facility, approximately $2.8 million to upgrade or replace our coal-burning boilers at our Belpre facility, and approximately $2.8 million for IRL expansion at our Paulinia facility. For the year ended December 31, 2010, capital expenditures were $55.7 million.
Financing Cash Flows and Liquidity
Our consolidated capital structure as of December 31, 2010 was approximately 54% equity and 46% debt compared to approximately 47.5% equity and 52.5% debt as of December 31, 2009.
Net cash provided by financing activities totaled $16.5 million in 2010 compared to $40.6 million net cash used in financing activities during the same period in 2009. The $57.1 million increase was driven primarily by $10.7 million in net proceeds from the exercise, in January 2010, of the underwriters’ over-allotment option granted in connection with our initial public offering and $8.0 million of proceeds received from employees exercising of stock options. In 2009, $11.2 million of cash was used to purchase and extinguish $30.7 million face value of our senior subordinated notes; and cash repayments of $50.0 million and $100 million were made on the senior secured credit facility in June 2009 and December 2009, respectively. These uses of cash in financing activities were primarily offset by $126.7 million in proceeds from the issuance of common stock from our initial public offering in December 2009.
Net cash used in financing activities totaled $40.6 million in 2009 compared to $46.1 million net cash provided by financing activities in 2008. This change was driven primarily by:
| • | a pre-payment of $100 million on the term loan portion of the senior secured credit facility in December 2009; |
| • | a $50.0 million repayment on the revolving portion of the senior secured credit facility in 2009; |
58
Table of Contents
| • | $10.8 million to purchase and extinguish $30.7 million face value of our 8.125% Notes in 2009; |
| • | $3.2 million of fees in connection with the amendment to our Term Loan and Revolving loan in 2009; |
| • | a $50 million draw on the revolving portion of the senior secured credit facility in September 2008; partially offset by |
| • | $126.7 million in proceeds from the issuance of common stock in December 2009. |
Description of Certain Indebtedness
On February 11, 2011, we refinanced our existing indebtedness by completing an offering of $250.0 million in aggregate principal amount of 6.75% Senior Notes due 2019 through an institutional private placement and entering into a new $350.0 million senior secured credit agreement. The new credit agreement provides for senior secured financing consisting of:
| • | a $200.0 million senior secured revolving credit facility. The new revolver, which was undrawn at close, replaces our previous $80.0 million facility; |
| • | a $150.0 million senior secured term loan facility; and |
| • | an option to raise up to $125.0 million of incremental term loans or incremental revolving credit commitments. |
In connection with this refinancing we repaid in full all outstanding borrowings under the existing term and revolving loans. In addition, we purchased $151.0 million principal amount of our outstanding 8.125% Senior Notes and have called for the redemption of the remaining $12.0 million principal amount of these notes, with such redemption to be completed on March 14, 2011. We also redeemed the $0.3 million outstanding principal amount of the 12% Discount Notes and terminated Kraton Polymers LLC’s separate reporting obligations.
See Note 5 Long-Term Debt and Note 16 Subsequent Events to the Consolidated Financial Statements accompanying this report for further discussion.
Other Contingencies
As a chemicals manufacturer, our operations in the United States and abroad are subject to a wide range of environmental laws and regulations at both the national and local levels. These laws and regulations govern, among other things, air emissions, wastewater discharges, solid and hazardous waste management, site remediation programs and chemical use and management.
Pursuant to these laws and regulations, our facilities are required to obtain and comply with a wide variety of environmental permits for different aspects of their operations. Generally, many of these environmental laws and regulations are becoming increasingly stringent, and the cost of compliance with these various requirements can be expected to increase over time.
In the context of the separation in February 2001, Shell Chemicals agreed to indemnify us for specific categories of environmental claims brought with respect to matters occurring before the separation. However, the indemnity from Shell Chemicals is subject to dollar and time limitations. Coverage under the indemnity also varies depending upon the nature of the environmental claim, the location giving rise to the claim and the manner in which the claim is triggered. Therefore, if claims arise in the future related to past operations, we cannot give assurances that those claims will be covered by the Shell Chemicals’ indemnity and also cannot be certain that any amounts recoverable will be sufficient to satisfy claims against us.
In addition, we may in the future be subject to claims that arise solely from events or circumstances occurring after February 2001, which would not, in any event, be covered by the Shell Chemicals’ indemnity. While we recognize that we may in the future be held liable with respect for remediation activities beyond those
59
Table of Contents
identified to date, at present we are not aware of any circumstances that are reasonably expected to give rise to remediation claims that would have a material adverse effect on our results of operations or cause us to exceed our projected level of anticipated capital expenditures.
On February 21, 2011, U.S. Environmental Protection Agency Regulations were promulgated and are awaiting publication in the Federal Register. If ultimately implemented as promulgated, these new regulations would require us to incur capital investments and ARO related to upgrading or replacing our coal-burning boilers at our Belpre, Ohio, facility. Preliminary capital expenditure and ARO requirements are estimated to be $20.0 million to $25.0 million and $5.0 million to $7.0 million, respectively, of which approximately $2.8 million may be spent in 2011 and the balance to be incurred between 2012 and 2014.
Except for the foregoing, we currently estimate that any expenses incurred in maintaining compliance with environmental laws and regulations will not materially affect our results of operations or cause us to exceed our level of anticipated capital expenditures. However, we cannot give assurances that regulatory requirements or permit conditions will not change, and we cannot predict the aggregate costs of additional measures that may be required to maintain compliance as a result of such changes or expenses.
We had no material operating expenditures for environmental fines, penalties, government imposed remedial or corrective actions during the years ended December 31, 2010, 2009, or 2008. Management believes that we are in material compliance with all current environmental laws and regulations.
Off-Balance Sheet Transactions
We are not involved in any off-balance sheet transactions as of December 31, 2010.
Contractual Obligations
Our principal outstanding contractual obligations relate to the term loan under the senior secured credit facility and the senior notes, the operating leases of some of our facilities and the feedstock contracts with Shell Chemicals, or its affiliates, LyondellBasell and others to provide us with styrene, butadiene and isoprene. The following table summarizes our contractual cash obligations for the periods indicated. Contractual Obligations as of December 31, 2010:
| Payments Due by Period | ||||||||||||||||||||||||||||
| Dollars in Millions |
Total | 2011 | 2012 | 2013 | 2014 | 2015 | 2016 and after |
|||||||||||||||||||||
| Long-term debt obligations |
$ | 382.7 | $ | 2.3 | $ | 109.1 | $ | 108.0 | $ | 163.3 | — | — | ||||||||||||||||
| Estimated interest payments on debt |
68.3 | 23.2 | 22.3 | 16.2 | 6.6 | — | — | |||||||||||||||||||||
| Operating lease obligations |
30.6 | 5.4 | 4.3 | 2.9 | 2.5 | 2.5 | 13.0 | |||||||||||||||||||||
| Purchase obligations(1)(2) |
1,902.6 | 132.5 | 104.0 | 76.8 | 69.8 | 69.8 | 1,449.7 | |||||||||||||||||||||
| Total contractual cash obligations |
$ | 2,384.2 | $ | 163.4 | $ | 239.7 | $ | 203.9 | $ | 242.2 | $ | 72.3 | $ | 1,462.7 | ||||||||||||||
| (1) | Pursuant to two feedstock supply contracts with Shell Chemicals or its affiliates, we are obligated to purchase minimum quantities of isoprene each year. If we do not meet these minimums, we are obligated to pay a penalty of approximately $300 per ton up to a maximum aggregate penalty of approximately $2.2 million. Pursuant to the styrene and butadiene feedstock supply contracts with Shell Chemicals and its affiliates, we are obligated to purchase minimum quantities. The contracts do not contain a stated penalty for failure to purchase the minimum quantities. However, if we do not purchase the minimum requirements, it is required under the terms of the contracts to meet with Shell Chemicals in an effort to determine a resolution equitable to both parties. |
| (2) | Pursuant to production agreements with LyondellBasell, we are currently paying the costs incurred by them in connection with the operation and maintenance of, and other services related to, our European facilities. These obligations are not included in this table. The terms of these agreements range between 20 years and 40 years and each agreement includes bilateral renewal rights. |
60
Table of Contents
See Note 16 Subsequent Events to the Consolidated Financial Statements accompanying this report for further discussion.
Impact of Inflation
Our results of operations and financial condition are presented based on historical cost. While it is difficult to accurately measure the impact of inflation due to the imprecise nature of the estimates required, we believe the effects of inflation, if any, on our results of operations and financial condition have been immaterial.
Adoption of Accounting Standards. We have implemented all new accounting pronouncements that are in effect and that may impact our financial statements and do not believe that there are any other new accounting pronouncements that have been issued that might have a material impact on our financial position or results of operations.
Future Adoption of Accounting Standards. The following new accounting pronouncement has been issued, but has not yet been adopted as of December 31, 2010:
In October 2009, the Financial Accounting Standards Board (FASB), issued Accounting Standards Update (“ASU”), Number 2009-13 “Revenue Recognition (Topic 605): Multiple-Deliverable Revenue Arrangements—a consensus of the FASB Emerging Issues Task Force.” This update amends the revenue recognition guidance for arrangements with multiple deliverables. The amendments allow vendors to account for products and services separately rather than as a combined unit. A selling price hierarchy for determining the selling price of each deliverable is established in this ASU, along with eliminating the residual method. The amendments are effective for revenue arrangements that begin or are changed in fiscal years that start June 15, 2010 or later. We have assessed the provisions of this new guidance but we do not expect that the adoption will have a material impact on our consolidated financial statements.
61
Table of Contents
| Item 7A. | Quantitative and Qualitative Disclosures About Market Risk. |
We are exposed to market risk from changes in interest rates, foreign currency exchange rates, and commodity prices. We currently do not hedge our exposure to these risks, except for the interest rate swap agreements and foreign currency option contracts discussed below.
Interest Rate Risk. We have $219.4 million of variable rate debt outstanding under the term facility as of December 31, 2010. The loans made under the term facility bear interest at a rate equal to the adjusted Eurodollar rate plus 2.00% per annum or, at our option, the base rate plus 1.00% per annum. The loans made under the portion of the revolving commitments extended pursuant to the November 2009 Amendment bear interest at a rate equal to the adjusted Eurodollar rate plus a margin of between 3.00% and 3.50% per annum (depending on our consolidated leverage ratio) or at our option, the base rate plus a margin of between 2.00% and 2.50% per annum (also depending on Kraton’s consolidated leverage ratio). The terms of the $0.2 million portion of the revolving commitments that was not extended pursuant to the November 2009 Amendment were not changed. Loans made under this portion of the revolving commitments bear interest at a rate equal to the adjusted Eurodollar rate plus a margin of between 2.00% and 2.50% per annum (depending on our leverage ratio), or at our option, the base rate plus a margin of between 1.00% and 1.50% per annum (also depending on Kraton’s leverage ratio).
See Note 16 Subsequent Events to the Consolidated Financial Statements for further discussion of our debt refinancing.
Interest Rate Swap Agreements. Periodically, we enter into interest rate swap agreements to hedge or otherwise protect against Eurodollar interest rate fluctuations on a portion of our variable rate debt. These interest rate swap agreements are designated as cash flow hedges on the exposure of the variability of future cash flows.
In May 2009, we entered into a $310.0 million notional amount interest rate swap agreement to hedge or otherwise protect against Eurodollar interest rate fluctuations on a portion of our variable rate debt. This agreement was effective on January 4, 2010 and expired on January 3, 2011 and had a fixed rate of 1.53%, therefore, including the 2.00% margin on the term loan agreement, our hedged fixed rate is 3.53%. In December 2009, we made a $100.0 million payment of outstanding indebtedness under the Term Loans, reducing the principal amount outstanding from approximately $323.0 million to approximately $223.0 million. As a result, we were required to discontinue hedge accounting prospectively as the hedging relationship failed to meet all of the criteria set forth in ASC 815, “Derivatives and Hedging,” specifically the notional amount of the swap and the principal amount of the debt were no longer equal and the forecasted transaction was no longer probable of occurring based on the original hedge documentation. We have elected to re-designate the cash flow hedge relationship for approximately $218.0 million notional amount out of the total $310.0 million notional amount interest rate swap agreement. We recorded interest expense of $3.1 million and $0.8 million related to the ineffective portion and a gain of $2.1 million and a loss of $1.9 million in accumulated other comprehensive income related to the effective portion of the hedge for the years ended December 31, 2010 and 2009, respectively.
In June 2010, we entered into a $215.0 million notional amount interest rate swap agreement to hedge or otherwise protect against Eurodollar interest rate fluctuations on a portion of our variable rate debt. This agreement is effective as of January 3, 2011 and expires on January 3, 2012 and has a fixed rate of 0.87%, therefore, including the 2.00% margin on the term loan agreement, our hedged fixed rate will be 2.87%. We recorded an unrealized loss of $1.1 million in accumulated other comprehensive income related to the effective portion of this hedge for the year ended December 31, 2010. On February 10, 2011, in connection with the refinancing of our existing indebtedness, we terminated and settled the interest rate swap prior to its expiration date and as a result recognized interest expense of $1.0 million.
Foreign Currency Risk. We conduct operations in many countries around the world. Our results of operations are subject to both currency transaction risk and currency translation risk. We incur currency transaction risk when we enter into either a purchase or sale transaction using a currency other than the local
62
Table of Contents
currency of the transacting entity. We are subject to currency translation risk because our financial condition and results of operations are measured and recorded in the relevant domestic currency and then translated into U.S. dollars for inclusion in our historical consolidated financial statements. In recent years, exchange rates between these currencies and U.S. dollars have fluctuated significantly and may do so in the future. For the year ended December 31, 2010, approximately 42% of total operating revenues were generated from customers located in the Americas, 37% in Europe and 21% in the Asia Pacific region. Although we sell and manufacture our products in many countries, our sales and production costs are mainly denominated in U.S. dollars, Euros, Japanese Yen and Brazilian Real.
Foreign Currency Contracts. We take steps to minimize risks from foreign currency exchange rate fluctuations through normal operating and financing activities and, when deemed appropriate, through the use of derivative instruments. We do not enter into any speculative positions with regard to derivative instruments. From time to time, we use hedging strategies to reduce our exposure to currency fluctuations.
In May 2010, we entered into multiple non-deliverable forward contracts to reduce our exposure to fluctuations in the Brazilian Real against the U.S. dollar associated with the funding of the debottleneck and expansion of our IRL capacity at our Paulina, Brazil, plant, for the notional amounts of R$2.7 million, R$7.1 million, and R$7.8 million with expiration dates of June 30, September 30, and December 31, 2010, respectively. The non-deliverable forward contracts qualify for hedge accounting and were designated as net investment hedges in accordance with ASC 815-35, “Net Investment Hedges.” We recorded a $0.9 million gain in accumulated other comprehensive income related to the effective portion of the hedge for the year ended December 31, 2010.
The impacts from foreign currency exchange rate fluctuations historically have not had a material impact on our financial position or results of operations. For the year ended December 31, 2010 and 2009, the estimated pre-tax loss from currency fluctuations, including the cost of hedging strategies, amounted to $5.5 million and $3.3 million, respectively.
Commodity Price Risk. We are subject to commodity price risk under agreements for the supply of our raw materials and energy.
| Item 8. | Financial Statements and Supplementary Data. |
The financial statements are set forth herein commencing on page F-5 of this report.
| Item 9. | Changes in and Disagreements with Accountants on Accounting and Financial Disclosure. |
None.
| Item 9A. | Controls and Procedures. |
Evaluation of Disclosure Controls and Procedures
In accordance with the Securities Exchange Act of 1934 Rules 13a-15 and 15d-15, we carried out an evaluation, under the supervision and with the participation of management, including our Chief Executive Officer and Chief Financial Officer, of the effectiveness of our disclosure controls and procedures as of the end of the period covered by this report. Based on that evaluation, our Chief Executive Officer and Chief Financial Officer concluded that our disclosure controls and procedures were effective as of December 31, 2010 to provide reasonable assurance that information required to be disclosed in our reports filed or submitted under the Exchange Act is recorded, processed, summarized, and reported within the time periods specified in the Securities and Exchange Commission’s rules and forms. Our disclosure controls and procedures include controls and procedures designed to ensure that information required to be disclosed in reports filed or submitted under
63
Table of Contents
the Exchange Act is accumulated and communicated to our management, including our Chief Executive Officer and Chief Financial Officer, as appropriate, to allow timely decisions regarding required disclosure.
Management’s Report on Internal Control Over Financial Reporting
See Management’s Report on Internal Control Over Financial Reporting under Item 8 of this Form 10-K.
Attestation Report of the Registered Public Accounting Firm
See Report of Independent Registered Public Accounting Firm under Item 8 of this Form 10-K.
Changes in Internal Control Over Financial Reporting
Our management, together with our Chief Executive Officer and Chief Financial Officer, evaluated the changes in our internal control over financial reporting during the quarter ended December 31, 2010. We determined that there were no changes in our internal control over financial reporting during the quarter ended December 31, 2010 that have materially affected, or are reasonably likely to materially affect, our internal control over financial reporting.
| Item 9B. | Other Information. |
None.
64
Table of Contents
PART III
| Item 10. | Directors, Executive Officers and Corporate Governance. |
Information in response to this item is incorporated by reference from our Proxy Statement relating to our 2011 annual meeting of shareholders. The Proxy Statement will be filed with the SEC within 120 days after the end of the fiscal year covered by this Form 10-K pursuant to Regulation 14A under the Exchange Act.
| Item 11. | Executive Compensation. |
Information in response to this item is incorporated by reference from our Proxy Statement relating to our 2011 annual meeting of shareholders. The Proxy Statement will be filed with the SEC within 120 days after the end of the fiscal year covered by this Form 10-K pursuant to Regulation 14A under the Exchange Act.
| Item 12. | Security Ownership of Certain Beneficial Owners and Management and Related Stockholder Matters. |
Information in response to this item is incorporated by reference from our Proxy Statement relating to our 2011 annual meeting of shareholders.
| Item 13. | Certain Relationships and Related Transactions, and Director Independence. |
Information in response to this item is incorporated by reference from our Proxy Statement relating to our 2011 annual meeting of shareholders.
| Item 14. | Principal Accountant Fees and Services. |
Information in response to this item is incorporated by reference from our Proxy Statement relating to our 2011 annual meeting of shareholders.
65
Table of Contents
PART IV
| Item 15. | Exhibits and Financial Statement Schedules. |
(a) 1. Financial Statements
The following financial statements are included in Item 8:
Kraton Performance Polymers, Inc.
| (i) | The reports of KPMG LLP, Independent Registered Public Accounting Firm |
| (ii) | Consolidated Balance Sheets as of December 31, 2010 and 2009 |
| (iii) | Consolidated Statements of Operations—years ended December 31, 2010, 2009 and 2008 |
| (iv) | Consolidated Statements of Changes in Stockholders’ and Member’s Equity and Comprehensive Income (Loss)—years ended December 31, 2010, 2009 and 2008 |
| (v) | Consolidated Statements of Cash Flows—years ended December 31, 2010, 2009 and 2008 |
| (vi) | Notes to consolidated financial statements |
2. Exhibits
The exhibits listed on the accompanying Exhibit Index are filed as part of this report and are on file with us.
(b) Exhibits
See Item 15(a) 2 above.
(c) Financial Statement Schedule
See Schedule II.
66
Table of Contents
SIGNATURES
Pursuant to the requirements of Section 13 or 15(d) of the Securities Exchange Act of 1934, the registrant has duly caused this report to be signed on its behalf by the undersigned, thereunto duly authorized.
Date: March 7, 2011
| Kraton Performance Polymers, Inc. |
| /S/ KEVIN M. FOGARTY |
| Kevin M. Fogarty President and Chief Executive Officer |
This report has been signed below by the following persons on behalf of the registrant and in the capacities indicated on March 7, 2011.
| Signature |
Title | |
| /S/ KEVIN M. FOGARTY Kevin M. Fogarty |
President, Chief Executive Officer and a Director (Principal Executive Officer) | |
| /S/ STEPHEN E. TREMBLAY Stephen E. Tremblay |
Vice President and Chief Financial Officer | |
| /S/ LOUIS A. VITALE Louis A. Vitale |
Controller (Chief Accounting Officer) | |
| /S/ DAN F. SMITH* Dan F. Smith |
Director and Chairman of the Board of Directors | |
| /S/ BARRY J. GOLDSTEIN* Barry J. Goldstein |
Director and Chairman of the Audit Committee | |
| /S/ KELVIN L. DAVIS* Kelvin L. Davis |
Director | |
| /S/ MICHAEL G. MACDOUGALL* Michael G. MacDougall |
Director | |
| /S/ NATHAN H. WRIGHT* Nathan H. Wright |
Director | |
| /S/ TIMOTHY J. WALSH* Timothy J. Walsh |
Director | |
| /S/ KEVIN G. O’BRIEN* Kevin G. O’Brien |
Director | |
| /S/ STEVEN J. DEMETRIOU* Steven J. Demetriou |
Director | |
| /S/ RICHARD C. BROWN* Richard C. Brown |
Director | |
| /S/ KAREN A. TWITCHELL* Karen A. Twitchell |
Director | |
| *By: | /S/ STEPHEN E. TREMBLAY | |
| Stephen E. Tremblay As attorney-in-fact | ||
67
Table of Contents
KRATON PERFORMANCE POLYMERS, INC.
INDEX TO CONSOLIDATED FINANCIAL STATEMENTS
| Page | ||||
| Audited Consolidated Financial Statements |
||||
| Management’s Report on Internal Control Over Financial Reporting |
F-2 | |||
| The reports of KPMG LLP, Independent Registered Public Accounting Firm |
F-3 | |||
| Consolidated Balance Sheets as of December 31, 2010 and 2009 |
F-5 | |||
| Consolidated Statements of Operations for Years Ended December 31, 2010, 2009 and 2008 |
F-6 | |||
| F-7 | ||||
| Consolidated Statements of Cash Flows for Years Ended December 31, 2010, 2009 and 2008 |
F-8 | |||
| F-9 | ||||
F-1
Table of Contents
Management’s Report on Internal Control Over Financial Reporting
Our management is responsible for establishing and maintaining adequate internal control over financial reporting, as defined in Rules 13a-15(f) and 15d-15(f) of the Securities Exchange Act of 1934, as amended. Internal control over financial reporting, no matter how well designed, has inherent limitations. Therefore, even those systems determined to be effective can provide only reasonable assurance with respect to financial statement preparation and presentation. Further, because of changes in conditions, the effectiveness of internal control over financial reporting may vary over time.
Under the supervision and with the participation of our management, including our chief executive officer and chief financial officer, we conducted an evaluation to assess the effectiveness of our internal control over financial reporting as of December 31, 2010 based upon criteria set forth in the Internal Control - Integrated Framework issued by the Committee of Sponsoring Organizations of the Treadway Commission. Based on our assessment, we believe that, as of December 31, 2010, our internal control over financial reporting is effective.
The effectiveness of our internal control over financial reporting as of December 31, 2010 has been audited by KPMG LLP, an independent registered public accounting firm, as stated in their report that is included herein.
F-2
Table of Contents
Report of Independent Registered Public Accounting Firm
The Board of Directors and Stockholders
Kraton Performance Polymers, Inc.:
We have audited Kraton Performance Polymers, Inc.’s internal control over financial reporting as of December 31, 2010, based on criteria established in Internal Control—Integrated Framework issued by the Committee of Sponsoring Organizations of the Treadway Commission (COSO). Kraton Performance Polymers, Inc.’s management is responsible for maintaining effective internal control over financial reporting and for its assessment of the effectiveness of internal control over financial reporting, included in the accompanying Management’s Annual Report on Internal Control Over Financial Reporting. Our responsibility is to express an opinion on the Company’s internal control over financial reporting based on our audit.
We conducted our audit in accordance with the standards of the Public Company Accounting Oversight Board (United States). Those standards require that we plan and perform the audit to obtain reasonable assurance about whether effective internal control over financial reporting was maintained in all material respects. Our audit included obtaining an understanding of internal control over financial reporting, assessing the risk that a material weakness exists, and testing and evaluating the design and operating effectiveness of internal control based on the assessed risk. Our audit also included performing such other procedures as we considered necessary in the circumstances. We believe that our audit provides a reasonable basis for our opinion.
A company’s internal control over financial reporting is a process designed to provide reasonable assurance regarding the reliability of financial reporting and the preparation of financial statements for external purposes in accordance with generally accepted accounting principles. A company’s internal control over financial reporting includes those policies and procedures that (1) pertain to the maintenance of records that, in reasonable detail, accurately and fairly reflect the transactions and dispositions of the assets of the company; (2) provide reasonable assurance that transactions are recorded as necessary to permit preparation of financial statements in accordance with generally accepted accounting principles, and that receipts and expenditures of the company are being made only in accordance with authorizations of management and directors of the company; and (3) provide reasonable assurance regarding prevention or timely detection of unauthorized acquisition, use, or disposition of the company’s assets that could have a material effect on the financial statements.
Because of its inherent limitations, internal control over financial reporting may not prevent or detect misstatements. Also, projections of any evaluation of effectiveness to future periods are subject to the risk that controls may become inadequate because of changes in conditions, or that the degree of compliance with the policies or procedures may deteriorate.
In our opinion, Kraton Performance Polymers, Inc. maintained, in all material respects, effective internal control over financial reporting as of December 31, 2010, based on criteria established in Internal Control—Integrated Framework issued by the Committee of Sponsoring Organizations of the Treadway Commission.
We also have audited, in accordance with the standards of the Public Company Accounting Oversight Board (United States), the consolidated balance sheets of Kraton Performance Polymers, Inc. and subsidiaries as of December 31, 2010 and 2009, and the related consolidated statements of operations, changes in stockholders’ and member’s equity and other comprehensive income (loss), and cash flows for each of the years in the three-year period ended December 31, 2010, and our report dated March 7, 2011 expressed an unqualified opinion on those consolidated financial statements.
/s/ KPMG LLP
Houston, Texas
March 7, 2011
F-3
Table of Contents
Report of Independent Registered Public Accounting Firm
The Board of Directors and Stockholders
Kraton Performance Polymers, Inc.:
We have audited the accompanying consolidated balance sheets of Kraton Performance Polymers, Inc. and subsidiaries as of December 31, 2010 and 2009, and the related consolidated statements of operations, changes in stockholders’ and member’s equity and other comprehensive income (loss), and cash flows for each of the years in the three-year period ended December 31, 2010. These consolidated financial statements are the responsibility of Kraton Performance Polymers, Inc.’s management. Our responsibility is to express an opinion on these consolidated financial statements based on our audits.
We conducted our audits in accordance with the standards of the Public Company Accounting Oversight Board (United States). Those standards require that we plan and perform the audit to obtain reasonable assurance about whether the financial statements are free of material misstatement. An audit includes examining, on a test basis, evidence supporting the amounts and disclosures in the financial statements. An audit also includes assessing the accounting principles used and significant estimates made by management, as well as evaluating the overall financial statement presentation. We believe that our audits provide a reasonable basis for our opinion.
In our opinion, the consolidated financial statements referred to above present fairly, in all material respects, the financial position of Kraton Performance Polymers, Inc. and subsidiaries as of December 31, 2010 and 2009, and the results of their operations and their cash flows for each of the years in the three-year period ended December 31, 2010, in conformity with U.S. generally accepted accounting principles.
We also have audited, in accordance with the standards of the Public Company Accounting Oversight Board (United States), Kraton Performance Polymers, Inc.’s internal control over financial reporting as of December 31, 2010, based on criteria established in Internal Control—Integrated Framework issued by the Committee of Sponsoring Organizations of the Treadway Commission (COSO), and our report dated March 7, 2011 expressed an unqualified opinion on the effectiveness of Kraton Performance Polymers, Inc.’s internal control over financial reporting.
/s/ KPMG LLP
Houston, Texas
March 7, 2011
F-4
Table of Contents
KRATON PERFORMANCE POLYMERS, INC.
CONSOLIDATED BALANCE SHEETS
(In thousands, except par value)
| December 31, 2010 |
December 31, 2009 |
|||||||
| ASSETS |
||||||||
| Current Assets |
||||||||
| Cash and cash equivalents |
$ | 92,750 | $ | 69,291 | ||||
| Receivables, net of allowances of $947 and $1,335 |
136,132 | 115,329 | ||||||
| Inventories of products, net |
325,120 | 284,258 | ||||||
| Inventories of materials and supplies, net |
9,631 | 10,862 | ||||||
| Deferred income taxes |
— | 3,107 | ||||||
| Other current assets |
38,749 | 16,770 | ||||||
| Total current assets |
602,382 | 499,617 | ||||||
| Property, plant and equipment, less accumulated depreciation of $252,387 and $236,558 |
365,366 | 354,860 | ||||||
| Identifiable intangible assets, less accumulated amortization of $50,123 and $42,741 |
70,461 | 75,801 | ||||||
| Investment in unconsolidated joint venture |
13,589 | 12,078 | ||||||
| Deferred financing costs |
3,172 | 7,318 | ||||||
| Other long-term assets |
25,753 | 24,825 | ||||||
| Total Assets |
$ | 1,080,723 | $ | 974,499 | ||||
| LIABILITIES AND STOCKHOLDERS’ EQUITY |
||||||||
| Current Liabilities |
||||||||
| Current portion of long-term debt |
$ | 2,304 | $ | 2,304 | ||||
| Accounts payable-trade |
86,699 | 93,494 | ||||||
| Deferred income taxes |
595 | — | ||||||
| Other payables and accruals |
60,782 | 68,271 | ||||||
| Due to related party |
19,264 | 19,006 | ||||||
| Total current liabilities |
169,644 | 183,075 | ||||||
| Long-term debt, net of current portion |
380,371 | 382,675 | ||||||
| Deferred income taxes |
14,089 | 13,488 | ||||||
| Long-term liabilities |
64,242 | 46,477 | ||||||
| Total liabilities |
628,346 | 625,715 | ||||||
| Commitments and contingencies (note 9) |
||||||||
| Stockholders’ Equity |
||||||||
| Preferred stock, $0.01 par value; 100,000 shares authorized; none issued |
||||||||
| Common stock, $0.01 par value; 500,000 shares authorized; 31,390 shares issued and outstanding at December 31, 2010; 29,709 shares issued and outstanding at December 31, 2009 |
314 | 297 | ||||||
| Additional paid in capital |
334,457 | 311,665 | ||||||
| Retained earnings |
96,711 | (14 | ) | |||||
| Accumulated other comprehensive income |
20,895 | 36,836 | ||||||
| Total stockholders’ equity |
452,377 | 348,784 | ||||||
| Total Liabilities and Stockholders’ Equity |
$ | 1,080,723 | $ | 974,499 | ||||
See Notes to Consolidated Financial Statements
F-5
Table of Contents
KRATON PERFORMANCE POLYMERS, INC.
CONSOLIDATED STATEMENTS OF OPERATIONS
(In thousands, except per share data)
| Years ended December 31, | ||||||||||||
| 2010 | 2009 | 2008 | ||||||||||
| Operating Revenues |
||||||||||||
| Sales |
$ | 1,228,425 | $ | 920,362 | $ | 1,171,253 | ||||||
| Other |
— | 47,642 | 54,780 | |||||||||
| Total operating revenues |
1,228,425 | 968,004 | 1,226,033 | |||||||||
| Cost of Goods Sold |
927,932 | 792,472 | 971,283 | |||||||||
| Gross Profit |
300,493 | 175,532 | 254,750 | |||||||||
| Operating Expenses |
||||||||||||
| Research and development |
23,628 | 21,212 | 27,049 | |||||||||
| Selling, general and administrative |
92,305 | 79,504 | 101,431 | |||||||||
| Depreciation and amortization of identifiable intangibles |
49,220 | 66,751 | 53,162 | |||||||||
| Total operating expenses |
165,153 | 167,467 | 181,642 | |||||||||
| Gain on Extinguishment of Debt |
— | 23,831 | — | |||||||||
| Earnings of Unconsolidated Joint Venture |
487 | 403 | 437 | |||||||||
| Interest Expense, Net |
23,969 | 33,956 | 36,695 | |||||||||
| Income (Loss) Before Income Taxes |
111,858 | (1,657 | ) | 36,850 | ||||||||
| Income Tax Expense (Benefit) |
15,133 | (1,367 | ) | 8,431 | ||||||||
| Net Income (Loss) |
$ | 96,725 | $ | (290 | ) | $ | 28,419 | |||||
| Earnings (Loss) per common share (note 11) |
||||||||||||
| Basic |
$ | 3.13 | $ | (0.01 | ) | $ | 1.46 | |||||
| Diluted |
$ | 3.07 | $ | (0.01 | ) | $ | 1.46 | |||||
| Weighted average common shares outstanding |
||||||||||||
| Basic |
30,825 | 19,808 | 19,387 | |||||||||
| Diluted |
31,379 | 19,808 | 19,464 | |||||||||
See Notes to Consolidated Financial Statements
F-6
Table of Contents
KRATON PERFORMANCE POLYMERS, INC.
CONSOLIDATED STATEMENTS OF CHANGES IN STOCKHOLDERS’ AND MEMBER’S EQUITY AND OTHER COMPREHENSIVE INCOME (LOSS)
(In thousands)
| Common Stock |
Additional Paid in Capital |
Retained Earnings (post 12/17/2009) |
Common Equity (pre 12/17/2009) |
Accumulated Other Comprehensive Income |
Total | |||||||||||||||||||
| December 31, 2007 |
$ | — | $ | — | $ | — | $ | 142,950 | $ | 39,561 | $ | 182,511 | ||||||||||||
| Net income |
— | — | — | 28,419 | — | 28,419 | ||||||||||||||||||
| Other comprehensive loss |
||||||||||||||||||||||||
| Foreign currency translation adjustments, net of tax |
— | — | — | — | 5,396 | 5,396 | ||||||||||||||||||
| Change in fair value of interest rate swaps |
— | — | — | — | (858 | ) | (858 | ) | ||||||||||||||||
| Reclassification of gain on interest rate swap into earnings |
— | — | — | — | (1,326 | ) | (1,326 | ) | ||||||||||||||||
| Increase in pension liability, net of tax |
— | — | — | — | (36,950 | ) | (36,950 | ) | ||||||||||||||||
| Total comprehensive loss |
(5,319 | ) | ||||||||||||||||||||||
| Cash contribution from member |
— | — | — | 10,000 | — | 10,000 | ||||||||||||||||||
| Non-cash compensation related to equity awards |
— | — | — | 1,184 | — | 1,184 | ||||||||||||||||||
| December 31, 2008 |
$ | — | $ | — | $ | — | $ | 182,553 | $ | 5,823 | $ | 188,376 | ||||||||||||
| Net loss |
— | — | (14 | ) | (276 | ) | — | (290 | ) | |||||||||||||||
| Other comprehensive income |
||||||||||||||||||||||||
| Foreign currency translation adjustments, net of tax |
— | — | — | — | 14,023 | 14,023 | ||||||||||||||||||
| Change in fair value of interest rate swaps |
— | — | — | — | 3,158 | 3,158 | ||||||||||||||||||
| Reclassification of gain on interest rate swap into earnings |
— | — | — | — | (2,827 | ) | (2,827 | ) | ||||||||||||||||
| Decrease in pension liability, net of tax |
— | — | — | — | 16,659 | 16,659 | ||||||||||||||||||
| Total comprehensive income |
30,723 | |||||||||||||||||||||||
| Non-cash compensation related to equity awards |
— | — | — | 2,160 | — | 2,160 | ||||||||||||||||||
| Liquidation of Kraton Polymers Management LLC |
— | — | — | (1,760 | ) | — | (1,760 | ) | ||||||||||||||||
| Non-cash contribution from member |
— | — | — | 2,560 | — | 2,560 | ||||||||||||||||||
| Equity conversion—December 16, 2009 |
194 | 185,043 | — | (185,237 | ) | — | — | |||||||||||||||||
| Public stock offering, December 17, 2009 |
103 | 126,622 | — | — | — | 126,725 | ||||||||||||||||||
| December 31, 2009 |
$ | 297 | $ | 311,665 | $ | (14 | ) | $ | — | $ | 36,836 | $ | 348,784 | |||||||||||
| Net income |
— | — | 96,725 | — | — | 96,725 | ||||||||||||||||||
| Other comprehensive income |
||||||||||||||||||||||||
| Foreign currency translation adjustments, net of tax |
— | — | — | — | (5,364 | ) | (5,364 | ) | ||||||||||||||||
| Change in fair value of interest rate swaps |
— | — | — | — | 1,157 | 1,157 | ||||||||||||||||||
| Reclassification of gain on interest rate swap into earnings |
— | — | — | — | (450 | ) | (450 | ) | ||||||||||||||||
| Change in fair value of foreign currency net investment hedge |
— | — | — | — | 899 | 899 | ||||||||||||||||||
| Increase in pension liability, net of tax |
— | — | — | — | (12,183 | ) | (12,183 | ) | ||||||||||||||||
| Total comprehensive income |
80,784 | |||||||||||||||||||||||
| Proceeds from issuance of common stock |
9 | 11,188 | — | — | — | 11,197 | ||||||||||||||||||
| Costs associated with the issuance of common stock |
— | (534 | ) | — | — | — | (534 | ) | ||||||||||||||||
| Proceeds from the exercise of stock options |
8 | 8,666 | — | — | — | 8,674 | ||||||||||||||||||
| Non-cash compensation related to equity awards |
— | 3,472 | — | — | — | 3,472 | ||||||||||||||||||
| December 31, 2010 |
$ | 314 | $ | 334,457 | $ | 96,711 | $ | — | $ | 20,895 | $ | 452,377 | ||||||||||||
See Notes to Consolidated Financial Statements
F-7
Table of Contents
KRATON PERFORMANCE POLYMERS, INC.
CONSOLIDATED STATEMENTS OF CASH FLOWS
(In thousands)
| Years ended December 31, | ||||||||||||
| 2010 | 2009 | 2008 | ||||||||||
| CASH FLOWS FROM OPERATING ACTIVITIES |
||||||||||||
| Net income (loss) |
$ | 96,725 | $ | (290 | ) | $ | 28,419 | |||||
| Adjustments to reconcile net income (loss) to net cash provided by operating activities: |
||||||||||||
| Depreciation and amortization of identifiable intangibles |
49,220 | 66,751 | 53,162 | |||||||||
| Accretion of debt discount |
— | 5 | 24 | |||||||||
| Inventory impairment |
— | 1,769 | 8,100 | |||||||||
| Amortization of deferred financing costs |
2,071 | 4,090 | 2,139 | |||||||||
| (Gain) loss on disposal of fixed assets |
(54 | ) | 348 | 184 | ||||||||
| Gain on extinguishment of debt |
— | (23,831 | ) | — | ||||||||
| Gain on settlement of insurance note payable |
(131 | ) | — | — | ||||||||
| Change in fair value of interest rate swaps |
(450 | ) | (2,827 | ) | (1,378 | ) | ||||||
| Distributed (undistributed) earnings in unconsolidated joint venture |
(84 | ) | 30 | 604 | ||||||||
| Deferred income tax expense (benefit) |
6,389 | (4,623 | ) | (5,445 | ) | |||||||
| Non-cash compensation related to equity awards |
3,472 | 2,160 | 1,184 | |||||||||
| Decrease (increase) in |
||||||||||||
| Accounts receivable |
(22,315 | ) | (16,680 | ) | 42,815 | |||||||
| Inventories of products, materials and supplies |
(46,711 | ) | 44,060 | (86,738 | ) | |||||||
| Other assets |
(24,871 | ) | (305 | ) | (1,377 | ) | ||||||
| Increase (decrease) in |
||||||||||||
| Accounts payable-trade, other payables and accruals, and other long-term liabilities |
(6,055 | ) | 8,328 | 4,541 | ||||||||
| Due to related party |
(1,846 | ) | (6,180 | ) | (6,007 | ) | ||||||
| Net cash provided by operating activities |
55,360 | 72,805 | 40,227 | |||||||||
| CASH FLOWS FROM INVESTING ACTIVITIES |
||||||||||||
| Purchase of property, plant and equipment |
(53,435 | ) | (38,101 | ) | (24,093 | ) | ||||||
| Purchase of software |
(2,242 | ) | (15,322 | ) | — | |||||||
| Proceeds from sale of property, plant and equipment |
30 | 3,870 | 26 | |||||||||
| Net cash used in investing activities |
(55,647 | ) | (49,553 | ) | (24,067 | ) | ||||||
| CASH FLOWS FROM FINANCING ACTIVITIES |
||||||||||||
| Proceeds from debt |
69,000 | 144,000 | 316,250 | |||||||||
| Repayment of debt |
(71,304 | ) | (308,131 | ) | (279,644 | ) | ||||||
| Cash contribution from member |
— | — | 10,000 | |||||||||
| Proceeds from issuance of common stock |
11,197 | 126,725 | — | |||||||||
| Costs associated with the issuance of common stock |
(534 | ) | — | — | ||||||||
| Proceeds from the exercise of stock options |
7,974 | — | — | |||||||||
| Proceeds from insurance note payable |
3,518 | 3,706 | 4,731 | |||||||||
| Repayment of insurance note payable |
(3,387 | ) | (3,706 | ) | (5,225 | ) | ||||||
| Deferred financing costs |
— | (3,216 | ) | — | ||||||||
| Net cash provided by (used in) financing activities |
16,464 | (40,622 | ) | 46,112 | ||||||||
| Effect of exchange rate differences on cash |
7,282 | (14,735 | ) | (9,153 | ) | |||||||
| Net increase (decrease) in cash and cash equivalents |
23,459 | (32,105 | ) | 53,119 | ||||||||
| Cash and cash equivalents at beginning of period |
69,291 | 101,396 | 48,277 | |||||||||
| Cash and cash equivalents at end of period |
$ | 92,750 | $ | 69,291 | $ | 101,396 | ||||||
| Supplemental Disclosures |
||||||||||||
| Cash paid during the period for income taxes |
$ | 4,625 | $ | 9,164 | $ | 11,251 | ||||||
| Cash paid during the period for interest |
$ | 23,723 | $ | 34,707 | $ | 39,533 | ||||||
See Notes to Consolidated Financial Statements
F-8
Table of Contents
KRATON PERFORMANCE POLYMERS, INC.
Notes to Consolidated Financial Statements
INDEX
| PAGE | ||||
| 1. Description of Business, Basis of Presentation, and Significant Accounting Policies |
F-9 | |||
| F-14 | ||||
| F-17 | ||||
| F-18 | ||||
| F-19 | ||||
| F-23 | ||||
| F-23 | ||||
| F-26 | ||||
| F-35 | ||||
| F-37 | ||||
| F-37 | ||||
| F-38 | ||||
| F-40 | ||||
| F-49 | ||||
| F-52 | ||||
| F-53 | ||||
1. Description of Business, Basis of Presentation, and Significant Accounting Policies
Description of the Business. We believe we are the world’s leading producer of styrenic block copolymers (“SBCs”) as measured by 2010 sales revenue. We market our products under the widely recognized KRATON® brand. SBCs are highly-engineered synthetic elastomers that we invented and commercialized almost 50 years ago, which enhance the performance of numerous end use products, imparting greater flexibility, resilience, strength, durability and processability. Our SBC products are found in many everyday applications, including disposable baby diapers, the rubberized grips of toothbrushes, razor blades, power tools and in asphalt formulations used to pave roads. We also produce isoprene rubber latex (“IRL”), a highly-engineered, reliable synthetic substitute for natural rubber latex. Our IRL products, which are used in applications such as surgical gloves, have not been found to contain the proteins present in natural latex and are, therefore, not known to cause allergies. Our polymers are typically formulated or compounded with other products to achieve improved, customer specific performance characteristics in a variety of applications. We manufacture our polymers at five manufacturing facilities globally, including our flagship plant in Belpre, Ohio, the most diversified SBC plant in the world, as well as plants in Germany, France, Brazil, and Japan. The plant in Japan is operated by a unconsolidated manufacturing joint venture. The terms “Kraton,” “our company,” “we,” “our,” “ours” and “us” as used in this report refer collectively to Kraton Performance Polymers, Inc. and its consolidated subsidiaries.
Basis of Presentation. The accompanying Consolidated Financial Statements presented herein are for us and our consolidated subsidiaries, each of which is a wholly-owned subsidiary. Polymer Holdings LLC (“Polymer Holdings,”) and its consolidated subsidiaries are treated as our predecessor entity for financial statement reporting purposes. The Consolidated Financial Statements present our historical financial statements and the historical financial statements of our predecessor. Accordingly the information for periods prior to December 22, 2009, is that of Polymer Holdings. The historical Consolidated Financial Statements presented for the years ended December 31, 2010, 2009 and 2008 and as of December 31, 2010 and 2009 have been derived from our audited consolidated financial statements.
Significant Accounting Policies. These financial statements reflect all normal recurring adjustments that are, in the opinion of management, necessary to fairly present our results of operations and financial position.
F-9
Table of Contents
KRATON PERFORMANCE POLYMERS, INC.
Notes to Consolidated Financial Statements—(Continued)
Use of Estimates. The preparation of consolidated financial statements in conformity with accounting principles generally accepted in the United States of America requires management to make estimates and assumptions that affect the reported amounts of assets and liabilities and disclosure of contingent assets and liabilities at the date of the consolidated financial statements and the reported amounts of revenues and expenses during the reporting period. Actual results could differ from those estimates. Significant items subject to such estimates and assumptions include the useful lives of fixed assets; allowances for doubtful accounts and sales returns; the valuation of derivatives, deferred tax assets, property, plant and equipment, inventory, investments and share-based compensation; and liabilities for employee benefit obligations, asset retirement obligations, income tax uncertainties and other contingencies.
Reclassifications. Certain amounts reported in the Consolidated Financial Statements and Notes to Consolidated Financial Statements for the prior periods have been reclassified to conform to the current reporting presentation.
Cash and Cash Equivalents. It is our policy to invest our excess cash in investment instruments whose value is not subject to market fluctuations, such as bank deposits or certificates of deposit. Other permitted investments include commercial paper of major U.S. corporations with ratings of A1 by Standard & Poor’s Ratings Group or P1 by Moody’s Investor Services, Inc., loan participations of major U.S. corporations with a short term credit rating of A1/P1 and direct obligations of the U.S. government or its agencies. We consider all investments having a remaining maturity of 3 months or less to be cash equivalents.
Receivables. Receivables are recorded at the invoiced amount and do not bear interest. The allowance for doubtful accounts is our best estimate of the amount of probable credit losses in our existing receivables. We determine the allowance based on historical write-off experience and global economic data. We review the allowance for doubtful accounts quarterly. Past due balances over 90 days and above a specified amount are reviewed individually for collectability. Account balances are charged off against the allowance after all means of collection have been exhausted and the potential for recovery is considered remote. We do not have any off-balance sheet credit exposure related to our customers.
Inventories. Our inventory is principally comprised of finished goods inventory. Inventories are stated at the lower of cost or market as determined on a first-in, first-out basis. On a quarterly basis, we evaluate the carrying cost of our inventory to ensure that it is stated at the lower of cost or market. Our products are typically not subject to spoiling or obsolescence and consequently our reserves for slow moving and obsolete inventory have historically not been significant. Cash flows from the sale of inventory are reported in cash flows from operations in the consolidated statement of cash flows.
Derivative Instruments and Hedging Activities. We account for derivatives and hedging activities in accordance with ASC 815, Derivatives and Hedging, which requires entities to recognize all derivative instruments as either assets or liabilities in the balance sheet at their respective fair values. For derivatives designated in cash flow hedging relationships, changes in the fair value are either offset through earnings against the change in fair value of the hedged item attributable to the risk being hedged or recognized in accumulated other comprehensive income, to the extent the derivative is effective at offsetting the changes in cash flows being hedged until the hedged item affects earnings.
For all hedging relationships, we formally document the hedging relationship and our risk-management objective and strategy for undertaking the hedge, the hedging instrument, the hedged transaction, the nature of the risk being hedged, how the hedging instrument’s effectiveness in offsetting the hedged risk will be assessed prospectively and retrospectively, and a description of the method used to measure ineffectiveness. We also formally assesses, both at the inception of the hedging relationship and on an ongoing basis, whether the
F-10
Table of Contents
KRATON PERFORMANCE POLYMERS, INC.
Notes to Consolidated Financial Statements—(Continued)
derivatives that are used in hedging relationships are highly effective in offsetting changes in cash flows of hedged transactions. For derivative instruments that are designated and qualify as part of a cash flow hedging relationship, the effective portion of the gain or loss on the derivative is reported as a component of other comprehensive income and reclassified into earnings in the same period or periods during which the hedged transaction affects earnings. Gains and losses on the derivative representing either hedge ineffectiveness or hedge components excluded from the assessment of effectiveness are recognized in current earnings.
We discontinue hedge accounting prospectively when we determine that the derivative is no longer effective in offsetting cash flows attributable to the hedged risk, the derivative expires or is sold, terminated, or exercised, the cash flow hedge is dedesignated because a forecasted transaction is not probable of occurring, or management determines to remove the designation of the cash flow hedge.
In all situations in which hedge accounting is discontinued and the derivative remains outstanding, we continue to carry the derivative at its fair value on the balance sheet and recognize any subsequent changes in its fair value in earnings. When it is probable that a forecasted transaction will not occur, we discontinue hedge accounting and recognize immediately in earnings gains and losses that were accumulated in other comprehensive income related to the hedging relationship.
Property, Plant and Equipment. Property, plant and equipment are recorded at cost. Major renewals and improvements which extend the useful lives of equipment are capitalized. Repair and maintenance expenses are charged to operations as incurred. Disposals are removed at carrying cost less accumulated depreciation with any resulting gain or loss reflected in operations. We capitalize interest costs which are incurred as part of the cost of constructing major facilities and equipment. We capitalized approximately $0.5 million of interest cost in 2010. No amounts of interest were capitalized in any other periods presented. Depreciation is recognized using the straight-line method over the following estimated useful lives:
| Machinery and equipment |
20 years | |||
| Building and land improvements |
20 years | |||
| Manufacturing Control Equipment |
10 years | |||
| Office equipment |
5 years | |||
| Research equipment and facilities |
5 years | |||
| Vehicles |
5 years | |||
| Computer hardware/information systems |
3 years |
Major Maintenance Activities. Repair and maintenance costs, including major maintenance/turnaround costs are expensed as incurred.
Asset Retirement Obligations. We account for asset retirement obligations pursuant to the provisions of ASC 410-20, “Asset Retirement Obligations.” ASC 410-20 requires us to record the fair value of an asset retirement obligation as a liability in the period in which we incur a legal obligation associated with the retirement of tangible long-lived assets that result from the acquisition, construction, development, and/or normal use of the assets. ASC 410-20 also requires us to record a corresponding asset that is depreciated over the life of the asset. Subsequent to the initial measurement of the asset retirement obligation, the obligation is to be adjusted at the end of each period to reflect the passage of time and changes in the estimated future cash flows underlying the obligation.
We have no assets that are legally restricted for purposes of settling asset retirement obligations. We have determined that we have contractual or regulatory requirements to decommission and perform other remediation for many of our manufacturing facilities and other assets upon retirement. These manufacturing facilities have
F-11
Table of Contents
KRATON PERFORMANCE POLYMERS, INC.
Notes to Consolidated Financial Statements—(Continued)
historically been profitable, and we plan to continue to upgrade these assets and expand the manufacturing capacity in conjunction with the growing market for our products. We plan to operate our manufacturing facilities for the foreseeable future and there are no current plans to close or convert these assets for use in the manufacture of fundamentally different products. Unlike our manufacturing assets in the United States and Brazil, our manufacturing assets in Europe are all located on leased land. For these assets, we used the lease termination dates as the estimate for when our asset retirement obligations related to those assets will be settled.
Long-Lived Assets. In accordance with the Impairment or Disposal of Long-Lived Assets Subsections of ASC 360-10, Property, Plant, and Equipment—Overall, long-lived assets, such as property, plant, and equipment, and purchased intangible assets subject to amortization, are reviewed for impairment whenever events or changes in circumstances indicate that the carrying amount of an asset may not be recoverable. If circumstances require a long-lived asset or asset group be tested for possible impairment, we first compare undiscounted cash flows expected to be generated by that asset or asset group to its carrying value. If the carrying value of the long-lived asset or asset group is not recoverable on an undiscounted cash flow basis, an impairment is recognized to the extent that the carrying value exceeds its fair value. Fair value is determined through various valuation techniques including discounted cash flow models, quoted market values and third-party independent appraisals, as considered necessary.
Identifiable Intangible Assets. We have identifiable intangible assets related to technology, tradenames/trademarks, customer relationships and software as detailed in Note 4 below. Identifiable intangible assets are amortized on the straight-line method over the estimated useful lives of the assets. The estimated useful life of technology, tradenames/trademarks and customer relationships is 15 years, while the estimated useful life of software is 10 years.
Pension and Other Postretirement Plans. We have a noncontributory defined benefit pension plan covering substantially all of our employees upon their retirement. The benefits are based on age, years of service and the level of compensation during the five years before retirement. We also sponsor a defined benefit health care plan for substantially all retirees and full-time employees.
We record annual amounts relating to our pension and postretirement plans based on calculations that incorporate various actuarial and other assumptions, including discount rates, mortality, assumed rates of return, compensation increases, turnover rates and healthcare cost trend rates. We review our assumptions on an annual basis and make modifications to the assumptions based on current rates and trends when it is appropriate to do so. The effect of modifications to those assumptions is recorded in accumulated other comprehensive income and amortized to net periodic cost over future periods using the corridor method. We believe that the assumptions utilized in recording our obligations under our plans are reasonable based on our experience and market conditions.
The net periodic costs are recognized as employees render the services necessary to earn the postretirement benefits.
Investment in Unconsolidated Joint Venture. Our 50% equity investment in a manufacturing joint venture at our Kashima site is accounted for under the equity method with our share of the operating results of the joint venture classified within equity in earnings of unconsolidated joint venture in the Consolidated Statements of Operations.
We evaluate our equity method investment for impairment when events or changes in circumstances indicate, in management’s judgment, that the carrying value of such investment may have experienced an other-than-temporary decline in value. When evidence of loss in value has occurred, management compares the
F-12
Table of Contents
KRATON PERFORMANCE POLYMERS, INC.
Notes to Consolidated Financial Statements—(Continued)
estimated fair value of the investment to the carrying value of the investment to determine whether an impairment has occurred. Management assesses the fair value of its equity method investment using commonly accepted techniques, and may use more than one method, including, but not limited to, recent third party comparable sales, internally developed analysis and analysis from outside advisors. If the estimated fair value is less than the carrying value and management considers the decline in value to be other than temporary, the excess of the carrying value over the estimated fair value is recognized in the financial statements as an impairment.
Deferred Financing Costs. We capitalize financing fees and other costs related to issuing long-term debt. We amortize these costs using the effective interest method, except for costs related to revolving debt which are amortized using the straight-line method.
Environmental Costs. Environmental costs are expensed as incurred unless the expenditures extend the economic useful life of the relevant assets. Costs that extend the economic life of assets are capitalized and depreciated over the remaining life of those assets. Liabilities are recorded when environmental assessments, or remedial efforts are probable, and the cost can be reasonably estimated.
Disclosures about Fair Value of Financial Instruments. The carrying amount approximates fair value for cash and cash equivalents, receivables, accounts payable and certain accrued expenses due to the short maturities of these instruments. The fair values of long-term debt instruments and the interest rate swap agreements are estimated based upon market values (if applicable) or on the current interest rates available to us for debt with similar terms and remaining maturities. Considerable judgment is required in developing these estimates.
Revenue Recognition. Sales are recognized in accordance with the provisions of ASC 605, Revenue Recognition—Overall, when the revenue is realized or realizable, and has been earned. Revenue for product sales is recognized when risk and title to the product transfer to the customer, which usually occurs at the time shipment is made. Our products are generally sold FOB (free on board) shipping point or, with respect to countries other than the United States, an equivalent basis. As such, title to the product passes when the product is delivered to the freight carrier. Our standard terms of delivery are included in our contracts of sale, order confirmation documents and invoices. Shipping and other transportation costs charged to customers are recorded in both sales and cost of sales.
We have entered into agreements with some of our customers whereby they earn rebates from us when the volume of their purchases of our product reach certain agreed upon levels. We recognize the rebate obligation ratably, as a reduction of revenue.
Research and Development Expenses. Research and development expenses are expensed as incurred.
Leases. All leases entered into as of December 31, 2010 are classified as operating leases. For those leases which contain escalating rent payment clauses, we use the straight-line method to record lease expense.
Income Taxes. We conduct operations in separate legal entities; as a result, income tax amounts are reflected in these consolidated financial statements for each of those jurisdictions.
Net operating losses and credit carryforwards are recorded in the event such benefits are expected to be realized. Deferred taxes result from differences between the financial and tax bases of our assets and liabilities and are adjusted for changes in tax rates and tax laws when changes are enacted. Valuation allowances are recorded to reduce deferred tax assets when it is more likely than not that a tax benefit will not be realized.
F-13
Table of Contents
KRATON PERFORMANCE POLYMERS, INC.
Notes to Consolidated Financial Statements—(Continued)
In assessing the realizability of deferred tax assets, we consider whether it is more likely than not that some portion or all of the deferred tax assets will not be realized. The ultimate realization of deferred tax assets is dependent upon the generation of future taxable income during the periods in which those temporary differences become deductible. We consider the scheduled reversal of deferred tax liabilities, projected future taxable income and tax planning strategies in making this assessment. Based upon the level of historical taxable income and projections for future taxable income over the periods in which the deferred tax assets are deductible, we believe it is more likely than not that we will realize the benefits of these deductible differences, net of the existing valuation allowances.
Foreign Currency Translation and Foreign Currency Exchange Rates. Financial statements of our operations outside the United States where the local currency is considered to be the functional currency are translated into U.S. dollars using the exchange rate at each balance sheet date for assets and liabilities and the average exchange rate for each period for revenues, expenses, gains, and losses and cash flows. The effects of translating such operations into U.S. dollars are included as a component of other comprehensive income (loss) in stockholders’/ member’s equity.
New Accounting Pronouncements
Adoption of Accounting Standards. We have implemented all new accounting pronouncements that are in effect and that may impact our financial statements and do not believe that there are any other new accounting pronouncements that have been issued that might have a material impact on our financial position or results of operations.
Future Adoption of Accounting Standards. The following new accounting pronouncement has been issued, but has not yet been adopted as of December 31, 2010:
In October 2009, the Financial Accounting Standards Board (FASB), issued Accounting Standards Update (“ASU”), Number 2009-13 “Revenue Recognition (Topic 605): Multiple-Deliverable Revenue Arrangements—a consensus of the FASB Emerging Issues Task Force.” This update amends the revenue recognition guidance for arrangements with multiple deliverables. The amendments allow vendors to account for products and services separately rather than as a combined unit. A selling price hierarchy for determining the selling price of each deliverable is established in this ASU, along with eliminating the residual method. The amendments are effective for revenue arrangements that begin or are changed in fiscal years that start June 15, 2010 or later. We have assessed the provisions of this new guidance and do not expect that the adoption will have a material impact on our consolidated financial statements.
We account for share-based awards under the provisions of ASC 718, “Share-Based Payment,” which established the accounting for share-based awards exchanged for employee services. Accordingly, share-based compensation cost is measured at the grant date based on the fair value of the award and is recognized as expense over the requisite service period. We record non-cash compensation expense for the restricted stock awards, restricted stock units and option awards over the vesting period using the straight-line method. See Note 11 Earnings per Common Share for further discussion.
Polymer Holdings 2009 Equity Incentive Plan. On November 30, 2009, our board of directors and our stockholders approved the Polymer Holdings LLC Equity Incentive Plan (the “Equity Plan”). The Equity Plan allows for the grant to key employees, independent contractors, and eligible non-employee directors of incentive
F-14
Table of Contents
KRATON PERFORMANCE POLYMERS, INC.
Notes to Consolidated Financial Statements—(Continued)
stock options (“ISOs”, non-qualified stock options (“NSOs” and together with the ISOs, “Options”), stock appreciation rights (“SARs”), restricted stock awards and restricted stock unit awards, in addition to other equity or equity-based awards as the board determines is necessary from time to time.
Under this plan, there are a total 4,350,000 shares of common stock reserved for issuance. We awarded 74,008 shares of restricted stock on December 22, 2009 and 22,202 shares of restricted stock on January 27, 2010. These restricted shares are subject to a three-year cliff vesting. On January 28, 2010, 32,517 shares of common stock were awarded to the board of directors. During 2010, 641,789 options were granted to our employees. These options have a ten year term and vest in equal installments over five years. All unvested grants of restricted units and notional units made prior to the initial public offering were canceled and replaced with new grants of restricted stock and notional shares under this plan. These replacement grants have substantially similar terms as the original grants.
Stock Option Activity
Information pertaining to option activity for the year ended December 31, 2010 is as follows:
| Options | Weighted Average Exercise Price |
|||||||
| (in thousands) | ||||||||
| Outstanding at December 31, 2009 |
1,585 | $ | 13.51 | |||||
| Granted |
642 | 15.93 | ||||||
| Exercised |
644 | 13.51 | ||||||
| Forfeited |
21 | 28.55 | ||||||
| Expired |
3 | 13.51 | ||||||
| Outstanding at December 31, 2010. |
1,559 | 14.31 | ||||||
| Exercisable at December 31, 2010 |
647 | $ | 13.51 | |||||
There were 644,185 options exercised during the year ended December 31, 2010. The total intrinsic value of these options was $8.7 million. No options were exercised in the years ended December 31, 2009 and 2008.
The number, weighted average exercise price, aggregate intrinsic value, and weighted average remaining contractual term of options outstanding and exercisable as of December 31, 2010 is as follows:
| Options | Weighted Average Exercise Price |
Aggregate Intrinsic Value(1) |
Weighted Average Remaining Contractual Term |
|||||||||||||
| (in thousands) | (in thousands) | (in years) | ||||||||||||||
| Outstanding options |
1,559 | $ | 14.31 | $ | 25,796 | 7.57 | ||||||||||
| Exercisable options |
647 | 13.51 | 11,220 | 6.18 | ||||||||||||
| (1) | The intrinsic value of a stock option is the amount by which the market value of the underlying stock exceeds the exercise price of the option. |
F-15
Table of Contents
KRATON PERFORMANCE POLYMERS, INC.
Notes to Consolidated Financial Statements—(Continued)
Weighted-Average Assumptions for Option Pricing
| 2010 | 2009 | 2008 | ||||||||||
| Risk-free interest rate |
3.01 | % | n/a | 3.59 | % | |||||||
| Expected dividend yield |
0.00 | % | n/a | 0.00 | % | |||||||
| Expected volatility |
0.50 | n/a | 0.38 | |||||||||
| Expected term |
6.4 years | n/a | 5 years | |||||||||
The weighted-average grant-date fair value of options granted in 2008 was $0.31 as valued using the Black-Scholes Merton option-pricing model. No options were granted in 2009. Option grants subsequent to 2009 were valued at the fair market value of our common stock on the date of grant. The weighted-average grant-date fair value of options granted during 2010 was $7.98.
Since our membership units were privately held prior to the initial public offering (“IPO”), the estimated volatility is based on the historical volatility of similar companies’ stock that is publicly traded. Until such time we have enough publicly traded stock history, we will continue to estimate volatility of options granted (including options granted in 2010) based on the historical volatility of similar companies’ stock that is publicly traded. The expected term of options represents the period of time that options granted are expected to be outstanding. For all periods presented, we used the simplified method to calculate the expected term of options as we had no employee share option exercises prior to 2010. The risk free interest rate for the periods within the contractual life of the option is based on the U.S. Treasury yield curve in effect at the time of grant.
We may grant time-vested restricted stock awards and time-vested restricted stock units to certain employees. Holders of restricted stock units do not have any beneficial ownership in the underlying restricted stock units and the grant represents an unsecured promise to deliver restricted stock on a future date. Actual stock units underlying the restricted stock units will not be distributed until the earlier of a change in control or the termination of the grantee’s employment.
The following table represents the non-vested restricted stock awards and restricted stock units granted, vested and forfeited during 2010.
| Shares | Weighted- average Grant-date Fair Value |
|||||||
| (in thousands) | ||||||||
| Restricted Stock Awards and Units |
||||||||
| Non-vested shares at January 1, 2010 |
124 | $ | 13.51 | |||||
| Granted |
22 | 13.51 | ||||||
| Vested |
28 | 13.51 | ||||||
| Forfeited |
— | — | ||||||
| Non-vested shares at December 31, 2010 |
118 | $ | 13.51 | |||||
The total fair value of shares vested during 2010 is $0.4 million.
We record non-cash compensation expense for the restricted stock awards, restricted stock units and option awards over the vesting period using the straight-line method. We recorded share-based employee compensation expense of approximately $3.4 million, $1.4 million, and $0.8 million for the years ended December 31, 2010, 2009 and 2008, respectively, net of tax effects of $0.1 million, $0.8 million, and $0.4 million, respectively. At December 31, 2010, there was approximately $4.3 million of unrecognized compensation cost related to
F-16
Table of Contents
KRATON PERFORMANCE POLYMERS, INC.
Notes to Consolidated Financial Statements—(Continued)
non-vested option awards to be recognized over a weighted-average period of 3.87 years, and $1.0 million of unrecognized compensation expense related to restricted stock awards and restricted stock units expected to be recognized over a weighted-average period of 1.79 years.
3. Restructuring and Restructuring-related Costs
As part of our ongoing efforts to improve efficiencies and increase productivity, we have implemented a number of restructuring initiatives in recent years.
European Office Consolidation. In the third quarter of 2010, we consolidated our transactional functions as well as much of our European management to a new European central office in Amsterdam, the Netherlands, which, we believe will result in greater operating efficiency and improved service to our global customers while ultimately lowering operating costs. We expect the total cost related to the consolidation to be approximately $5.5 million.
For the year ended December 31, 2010, we have incurred $4.6 million of restructuring charges, primarily comprised of severance and consulting expenses, which are recorded in Selling, General and Administrative expenses in our consolidated statements of operations. The following is a summary of the 2010 activity associated with our European office consolidation:
| Europe Restructuring |
||||
| (in thousands) | ||||
| Accrued European office consolidation restructuring at December 31, 2009 |
$ | — | ||
| Restructuring costs |
4,588 | |||
| Payments |
(3,199 | ) | ||
| Accrued European office consolidation restructuring at December 31, 2010 |
$ | 1,389 | ||
Pernis Restructuring. We ceased production at our Pernis, the Netherlands, facility on December 31, 2009, where, prior to the exit, we manufactured isoprene rubber. In connection with the exit, in 2009 we incurred $3.9 million in asset retirement obligations (“ARO”), $6.0 million in restructuring costs and a $1.1 million non-cash charge to write-down our inventory of spare parts. We recorded the ARO in Depreciation and Amortization of Identifiable Intangibles and the restructuring costs and write-down of inventory in Cost of Goods Sold, respectively, in our consolidated statements of operations.
For the year ended December 31, 2010, the original estimated ARO of $3.9 million was reduced to $2.6 million as a result of our completing the exit of the facility two months earlier than originally anticipated. The $1.3 million reduction in the ARO is reflected as a reduction in depreciation and amortization of intangible assets in the year ended December 31, 2010. The following is a summary of the 2010 activity associated with the exit of the Pernis facility:
| Pernis Restructuring |
||||
| (in thousands) | ||||
| Accrued Pernis restructuring at December 31, 2008 |
$ | — | ||
| Restructuring costs |
11,039 | |||
| Less: non-cash charge |
(1,050 | ) | ||
| Accrued Pernis restructuring at December 31, 2009 |
$ | 9,989 | ||
| Payments |
(8,698 | ) | ||
| Change in estimate for ARO |
(1,291 | ) | ||
| Accrued Pernis restructuring at December 31, 2010 |
$ | — | ||
F-17
Table of Contents
KRATON PERFORMANCE POLYMERS, INC.
Notes to Consolidated Financial Statements—(Continued)
Research and Technical Service Reorganization. In 2008, we restructured our research and technical service organizations to better align our research and product development capabilities with our customers’ needs and market requirements and to focus on our core capabilities, and incurred $2.2 million of severance and other staffing-related costs which were recorded in research and development expenses in the consolidated statements of operations. Substantially all of the cash expenditures related to these restructurings were paid as of December 31, 2008.
4. Detail of Certain Balance Sheet Accounts
| December 31, | ||||||||
| 2010 | 2009 | |||||||
| (in thousands) | ||||||||
| Inventories of products, net: |
||||||||
| Finished products |
$ | 252,056 | $ | 223,500 | ||||
| Work in progress |
4,319 | 3,254 | ||||||
| Raw materials |
68,745 | 57,504 | ||||||
| $ | 325,120 | $ | 284,258 | |||||
| Property, plant, and equipment: |
||||||||
| Land |
$ | 11,176 | $ | 8,782 | ||||
| Buildings |
39,111 | 32,467 | ||||||
| Plant and equipment |
527,418 | 508,057 | ||||||
| Construction in progress |
40,048 | 42,112 | ||||||
| 617,753 | 591,418 | |||||||
| Less accumulated depreciation |
252,387 | 236,558 | ||||||
| $ | 365,366 | $ | 354,860 | |||||
| Identifiable intangible assets: |
||||||||
| Technology |
$ | 44,726 | $ | 44,813 | ||||
| Customer relations |
35,145 | 35,213 | ||||||
| Trademarks |
23,149 | 23,194 | ||||||
| Software |
17,564 | 15,322 | ||||||
| 120,584 | 118,542 | |||||||
| Less accumulated amortization |
50,123 | 42,741 | ||||||
| $ | 70,461 | $ | 75,801 | |||||
The identifiable intangible assets are amortized on the straight-line method over the estimated useful lives of the assets. The estimated useful life of technology, tradenames/trademarks and customer relationships is 15 years, while the estimated useful life of software is 10 years. Aggregate amortization expense for intangible assets was approximately $7.4 million, $6.6 million, and $7.0 million for the years ended December 31, 2010, 2009 and 2008, respectively. Estimated amortization expense for each of the next five years is approximately $6.9 million.
F-18
Table of Contents
KRATON PERFORMANCE POLYMERS, INC.
Notes to Consolidated Financial Statements—(Continued)
| December 31, | ||||||||
| 2010 | 2009 | |||||||
| (in thousands) | ||||||||
| Other payables and accruals: |
||||||||
| Employee related |
$ | 17,807 | $ | 5,783 | ||||
| Interest |
6,548 | 7,366 | ||||||
| Property and other taxes |
1,088 | 4,255 | ||||||
| Customer rebates |
4,660 | 2,960 | ||||||
| Income taxes payable |
7,258 | 4,000 | ||||||
| Derivative liabilities |
1,435 | 2,926 | ||||||
| Restructuring |
1,389 | 9,874 | ||||||
| Other |
20,597 | 31,107 | ||||||
| $ | 60,782 | $ | 68,271 | |||||
| Accumulated other comprehensive income consists of the following: |
||||||||
| Foreign currency adjustments |
$ | 50,401 | $ | 55,765 | ||||
| Net unrealized loss on interest rate swaps |
(1,073 | ) | (1,780 | ) | ||||
| Net unrealized gain on investment hedge |
899 | — | ||||||
| Pension adjustment, net of tax |
(29,332 | ) | (17,149 | ) | ||||
| $ | 20,895 | $ | 36,836 | |||||
On February 11, 2011, we refinanced our existing indebtedness by completing an offering of $250.0 million in aggregate principal amount of 6.75% Senior Notes due 2019 through an institutional private placement and entering into a new $350.0 million senior secured credit agreement. The new credit agreement provides for senior secured financing consisting of:
| • | a $200.0 million senior secured revolving credit facility. The new revolver, which was undrawn at close, replaces our previous $80.0 million facility; |
| • | a $150.0 million senior secured term loan facility; and |
| • | an option to raise up to $125.0 million of incremental term loans or incremental revolving credit commitments. |
In connection with this refinancing we repaid in full all outstanding borrowings under the existing term and revolving loans. In addition, we purchased $151.0 million principal amount of our outstanding 8.125% Senior Notes and have called for the redemption of the remaining $12.0 million principal amount of these notes, with such redemption to be completed on March 14, 2011. We also redeemed the $0.3 million outstanding principal amount of the 12% Discount Notes.
As of December 31, 2010, we were in compliance with the applicable financial ratios in the prior senior secured credit facility and the other covenants contained in the prior senior secured credit facility and the indentures governing the senior subordinated notes then outstanding and as of the date of this filing is in compliance with same, for the new senior secured credit facility and the indentures governing the new 6.75% senior subordinated notes.
F-19
Table of Contents
KRATON PERFORMANCE POLYMERS, INC.
Notes to Consolidated Financial Statements—(Continued)
The following discusses our indebtedness as of December 31, 2010, which was superseded on February 11, 2011, as a result of our refinancing our existing indebtedness. See Note 16 Subsequent Events for further discussion.
Long-term debt consists of the following:
| December 31, | ||||||||
| 2010 | 2009 | |||||||
| (in thousands) | ||||||||
| Term loans |
$ | 219,425 | $ | 221,729 | ||||
| 12% discount notes |
250 | 250 | ||||||
| 8.125% discount notes |
170,000 | 170,000 | ||||||
| 8.125% discount notes held in treasury |
(7,000 | ) | (7,000 | ) | ||||
| Total debt |
382,675 | 384,979 | ||||||
| Less current portion of long-term debt |
2,304 | 2,304 | ||||||
| Total long-term debt |
$ | 380,371 | $ | 382,675 | ||||
Term Loans and Revolving Loans. Kraton Polymers LLC is the borrower under our senior secured credit agreement dated as of December 23, 2003, as amended, (the “Credit Agreement”), and Kraton Polymers LLC’s wholly-owned domestic subsidiaries along with Kraton, as successor to Polymer Holdings, are guarantors under the Credit Agreement. We refer to these guarantors, together with Kraton Polymers LLC, as the Loan Parties. The Credit Agreement is secured by a perfected first priority security interest in substantially all of each Loan Party’s tangible and intangible assets, including intellectual property, real property, all of Kraton Polymers LLC’s capital stock, the capital stock of Kraton Polymers LLC’s domestic subsidiaries and 65% of the capital stock of the direct foreign subsidiaries of each Loan Party. There have been no material changes to our Credit Agreement since the disclosure made in our December 31, 2009 Annual Report on Form 10-K, as amended. In these notes to the Consolidated Financial Statements, the loans made under the revolving facility are referred to as the Revolving Loans, and the loans made under the term facility are referred to as the Term Loans.
Pursuant to Amendment No. 7 to the Credit Agreement, dated November 30, 2009 (the “November 2009 Amendment”), the maximum available borrowings under the revolving commitments increased from $75.5 million to $80.0 million and the maturity on $79.8 million of the Revolving Loans was extended from May 2011 to May 2013.
In December 2009, we used a portion of the proceeds from our initial public offering and prepaid $100 million on the term loan portion of our senior secured credit facility and recorded a charge of $1.5 million related to deferred financing cost.
As of December 31, 2010, we had no outstanding borrowings under the Revolving Loans.
The following is a summary of the material terms of the amended Credit Agreement.
Maturity. The Revolving Loans extended pursuant to the November 2009 Amendment are payable in a single maturity on May 12, 2013. The $0.2 million portion of the Revolving Loans that were not extended pursuant to November 2009 Amendment are payable on May 12, 2011. The Term Loans are payable in six remaining consecutive equal quarterly installments, in an aggregate annual amount equal to 1.0% of the original principal amount of such loans. The remaining balance is payable in four equal quarterly installments commencing on September 30, 2012 and ending on May 12, 2013.
F-20
Table of Contents
KRATON PERFORMANCE POLYMERS, INC.
Notes to Consolidated Financial Statements—(Continued)
Interest. The loans made under the existing term facility bear interest at a rate equal to the adjusted Eurodollar rate plus 2.00% per annum or, at our option, the base rate plus 1.00% per annum. The average effective interest rates on the loans made under the term facility for the years ended December 31, 2010 and 2009 were 3.6% and 4.5%, respectively. The Revolving Loans extended pursuant to the November 2009 Amendment bear interest at a rate equal to the adjusted Eurodollar rate plus a margin of between 3.00% and 3.50% per annum (depending on our consolidated leverage ratio) or at our option, the base rate plus a margin of between 2.00% and 2.50% per annum (also depending on our consolidated leverage ratio). In addition, with respect to the extended portion of the Revolving Loans, an annual commitment fee equal to 0.75% payable quarterly on the daily average undrawn portion of the Revolving Loans extended pursuant to the November 2009 Amendment accrues and is payable quarterly in arrears.
The $0.2 million of the Revolving Loans that were not extended pursuant to the November 2009 Amendment bear interest at a rate equal to the adjusted Eurodollar rate plus a margin of between 2.00% and 2.50% per annum (depending on our leverage ratio), or at our option, the base rate plus a margin of between 1.00% and 1.50% per annum (also depending on our leverage ratio). The unused commitment fee for the unextended Revolving Loan is 0.5%.
Mandatory Prepayments. The term facility is subject to mandatory prepayment with, in general: (1) 100% of the net cash proceeds of certain asset sales, subject to certain reinvestment rights; (2) 100% of the net cash proceeds of certain insurance and condemnation payments, subject to certain reinvestment rights; (3) 50% of the net cash proceeds of certain equity offerings (declining to 25%, if a leverage ratio is met); (4) 100% of the net cash proceeds of debt incurrences (other than debt incurrences permitted under the Credit Agreement); and (5) 50% of Kraton’s excess cash flow, as defined in the Credit Agreement (declining to 25%, if a leverage ratio is met and to 0% if a further leverage ratio is met). Any such prepayment is applied first to the term facility and thereafter to the revolving facility.
Covenants. The Credit Agreement contains certain affirmative covenants including, among others, covenants to furnish the Lenders with financial statements and other financial information and to provide the Lenders notice of material events and information regarding collateral.
The Credit Agreement contains certain negative covenants that, among other things, restrict our ability, subject to certain exceptions, to incur additional indebtedness, grant liens on its assets, undergo fundamental changes, make investments, sell assets, make acquisitions, engage in sale and leaseback transactions, make restricted payments, engage in transactions with its affiliates, amend or modify certain agreements and charter documents and change its fiscal year. The covenants also restrict our activities. We were required to maintain a fiscal quarter end interest coverage ratio of at least 2.75:1.00 through December 31, 2009; and of at least 3.00:1.00 beginning March 31, 2010 and continuing thereafter. In addition, we were required to maintain a fiscal quarter end leverage ratio not to exceed 4.00 beginning December 31, 2009 and continuing thereafter.
Senior Discount Notes Due July 15, 2014. As part of a refinancing of indebtedness on November 2, 2004, Polymer Holdings issued the 12% discount notes. On May 12, 2006, all but $0.25 million of the 12% discount notes were extinguished.
Senior Subordinated Notes Due January 15, 2014. On December 23, 2003, Kraton Polymers LLC and Kraton Polymers Capital Corporation issued the 8.125% Notes in an aggregate principal amount of $200.0 million. The 8.125% Notes are subject to the provisions for mandatory and optional prepayment and acceleration and are payable in full on January 15, 2014. Each of Kraton Polymers U.S. LLC and Elastomers Holdings LLC has guaranteed the 8.125% Notes.
Interest. The 8.125% Notes bear interest at a fixed rate of 8.125% per annum. Interest is payable semi-annually on January 15 and July 15.
F-21
Table of Contents
KRATON PERFORMANCE POLYMERS, INC.
Notes to Consolidated Financial Statements—(Continued)
Optional Redemption. We may redeem all or a part of the senior subordinated notes at the redemption prices (expressed as percentages of principal amount) set forth below plus accrued and unpaid interest, if any, on the Notes redeemed to the applicable redemption date.
| Year |
Percentage | |||
| 2011 |
101.354 | % | ||
| 2012 |
100.000 | % | ||
| 2013 |
100.000 | % | ||
| 2014 |
100.000 | % | ||
Purchase of a Portion of the Senior Subordinated Notes. In April 2009, TJ Chemical purchased approximately $6.3 million face value of the senior subordinated notes for cash consideration of $2.5 million, which included accrued interest of $0.1 million. Immediately upon purchasing the senior subordinated notes, TJ Chemical contributed the purchased notes to us, and we in turn contributed the notes to Kraton Polymers LLC. No equity interest or other consideration was issued in exchange for the contribution of the senior subordinated notes, although equity of each of Kraton and Kraton Polymers LLC was increased by an amount equal to the cash consideration paid by TJ Chemical. Kraton Polymers LLC holds the senior subordinated notes as treasury bonds. Also in April 2009, Kraton Polymers LLC purchased approximately $0.7 million face value of the senior subordinated notes for cash consideration of $0.3 million which Kraton Polymers LLC is holding as treasury bonds. We recorded a gain of approximately $4.3 million on the extinguishment of debt in the quarter ended June 30, 2009.
On March 16, 2009, Kraton Polymers LLC purchased and retired $30 million face value of the senior subordinated notes for cash consideration of $10.9 million, which included accrued interest of $0.4 million. We recorded a gain of approximately $19.5 million in the quarter ending March 31, 2009 related to the purchase and retirement of these senior subordinated notes.
Covenants. The 8.125% Notes contain certain affirmative covenants including, among others, covenants to furnish the holders of the 8.125% Notes with financial statements and other financial information and to provide the holders of the 8.125% Notes notice of material events.
The 8.125% Notes contain certain negative covenants including limitations on indebtedness, limitations on restricted payments, limitations on restrictions on distributions from certain subsidiaries, limitations on lines of businesses and mergers and consolidations. As of December 31, 2010, we were in compliance with all covenants under the 8.125% Notes.
Debt Maturities. The estimated remaining principal payments on our outstanding total debt as of December 31, 2010, are as follows:
| Principal Payments |
||||
| (in thousands) | ||||
| December 31: |
||||
| 2011 |
$ | 2,304 | ||
| 2012 |
$ | 109,137 | ||
| 2012 |
$ | 107,984 | ||
| 2014 |
$ | 163,250 | ||
| Total debt |
$ | 382,675 | ||
F-22
Table of Contents
KRATON PERFORMANCE POLYMERS, INC.
Notes to Consolidated Financial Statements—(Continued)
See Note 14 Financial Instruments and Credit Risk for fair value information related to our long-term debt.
We capitalize financing fees and other costs related to issuing long-term debt. We amortize these costs using the effective interest method, except for costs related to revolving debt which are amortized using the straight-line method. We had net deferred financing costs of $5.2 million and $7.3 million as of December 31, 2010 and 2009, respectively. We amortized $2.1 million, $4.1 million, and $2.1 million in deferred financing costs in the years ended 2010, 2009 and 2008, respectively.
Income taxes are recorded utilizing an asset and liability approach. This method gives consideration to the future tax consequences associated with the differences between the financial accounting basis and tax basis of the assets and liabilities, and the ultimate realization of any deferred tax asset resulting from such differences.
The expense (benefit) for income taxes on income from continuing operations is comprised of the following:
| Years ended December 31, | ||||||||||||
| 2010 | 2009 | 2008 | ||||||||||
| (in thousands) | ||||||||||||
| Current tax provision: |
||||||||||||
| U.S. |
$ | 690 | $ | 422 | $ | 262 | ||||||
| Foreign |
8,054 | 8,239 | 13,614 | |||||||||
| Total current tax provision |
8,744 | 8,661 | 13,876 | |||||||||
| Deferred tax provision: |
||||||||||||
| U.S. |
— | (285 | ) | (51 | ) | |||||||
| Foreign |
6,389 | (9,743 | ) | (5,394 | ) | |||||||
| Total deferred tax provision |
6,389 | (10,028 | ) | (5,445 | ) | |||||||
| Total income tax expense (benefit) |
15,133 | $ | (1,367 | ) | $ | 8,431 | ||||||
Income (Loss) before income taxes is comprised of the following:
| Years ended December 31, | ||||||||||||
| 2010 | 2009 | 2008 | ||||||||||
| (in thousands) | ||||||||||||
| Income (Loss) Before Income Taxes: |
||||||||||||
| U.S. |
$ | 55,350 | $ | 9,656 | $ | 7,098 | ||||||
| Foreign |
56,508 | (11,313 | ) | 29,752 | ||||||||
| Total income (loss) before income taxes |
$ | 111,858 | $ | (1,657 | ) | $ | 36,850 | |||||
F-23
Table of Contents
KRATON PERFORMANCE POLYMERS, INC.
Notes to Consolidated Financial Statements—(Continued)
The provision for income taxes differs from the amount computed by applying the U.S. statutory income tax rate to income from continuing operations before income taxes for the reasons set forth below:
| Years ended December 31, | ||||||||||||
| 2010 | 2009 | 2008 | ||||||||||
| (in thousands) | ||||||||||||
| Income Taxes at the Statutory Rate |
$ | 39,153 | $ | (580 | ) | $ | 12,897 | |||||
| Foreign Tax Rate Differential |
(4,261 | ) | (97 | ) | (3,294 | ) | ||||||
| State Taxes |
52 | (225 | ) | (86 | ) | |||||||
| Permanent Differences |
648 | (832 | ) | (221 | ) | |||||||
| Differences in Foreign Earnings Remitted |
— | 4,165 | 6,354 | |||||||||
| Tax Credits |
(610 | ) | (122 | ) | — | |||||||
| Tax Benefit Related to Foreign Losses |
— | (2,597 | ) | — | ||||||||
| Change in Valuation Allowance and Uncertain Tax Positions |
(20,421 | ) | (890 | ) | (7,219 | ) | ||||||
| Other |
572 | (189 | ) | — | ||||||||
| Income Tax Expense (Benefit) |
$ | 15,133 | $ | (1,367 | ) | $ | 8,431 | |||||
| Years ended December 31, | ||||||||||||
| 2010 | 2009 | 2008 | ||||||||||
| Income Taxes at the Statutory Rate |
35.0 | % | 35.0 | % | 35.0 | % | ||||||
| Foreign Tax Rate Differential |
(3.8 | )% |
|
5.9 |
% |
(8.9 | )% | |||||
| State Taxes |
0.0 | % | 13.6 | % | (0.2 | )% | ||||||
| Permanent Differences |
0.6 | % | 50.2 | % | (0.6 | )% | ||||||
| Differences in Foreign Earnings Remitted |
0.0 | % | (251.4 | )% | 17.2 | % | ||||||
| Tax Credits |
(0.6 | )% | 7.4 | % | 0.0 | % | ||||||
| Tax Benefit Related to Foreign Losses |
0.0 | % | 156.7 | % | 0.0 | % | ||||||
| Change in Valuation Allowance and Uncertain Tax Positions |
(18.2 | )% |
|
53.7 |
% |
(19.6 | )% | |||||
| Other |
0.5 | % | 11.4 | % | 0.0 | % | ||||||
| Effective Tax Rate |
13.5 | % | 82.5 | % | 22.9 | % | ||||||
F-24
Table of Contents
KRATON PERFORMANCE POLYMERS, INC.
Notes to Consolidated Financial Statements—(Continued)
Deferred income taxes reflect the net tax effects of temporary differences between the carrying amounts of assets and liabilities for financial reporting purposes and the amounts used for income tax purposes, as well as operating loss and tax credit carryforwards. The tax effects of temporary differences that gave rise to significant components of deferred tax liabilities and assets are as follows:
| December 31, | ||||||||
| 2010 | 2009 | |||||||
| (in thousands) | ||||||||
| Deferred tax liabilities: |
||||||||
| Property, plant and equipment |
$ | 81,756 | $ | 82,926 | ||||
| Identifiable intangibles |
3,502 | 2,128 | ||||||
| Exchange rate differences |
2,233 | (236 | ) | |||||
| Total deferred tax liabilities |
87,491 | 84,818 | ||||||
| Deferred tax assets: |
||||||||
| Net operating loss carryforward |
(104,254 | ) | (131,877 | ) | ||||
| Inventory |
(11,208 | ) | (8,057 | ) | ||||
| Interest rate swaps |
(395 | ) | (1,097 | ) | ||||
| Pension accrual |
(17,659 | ) | (14,812 | ) | ||||
| Other accruals and reserves |
(5,735 | ) | (5,028 | ) | ||||
| Total deferred tax assets |
(139,251 | ) | (160,871 | ) | ||||
| Valuation allowance for deferred tax assets |
66,444 | 86,431 | ||||||
| Net deferred tax liabilities |
$ | 14,684 | $ | 10,378 | ||||
| December 31 | ||||||||
| 2010 | 2009 | |||||||
| (in thousands) | ||||||||
| Net deferred tax liabilities consist of: |
||||||||
| Current deferred tax assets |
$ | (20,354 | ) | $ | (14,730 | ) | ||
| Non-current deferred tax assets |
(122,910 | ) | (168,979 | ) | ||||
| Current deferred tax liabilities |
20,949 | 11,624 | ||||||
| Non-current deferred tax liabilities |
136,999 | 182,463 | ||||||
| Net deferred tax liabilities |
$ | 14,684 | $ | 10,378 | ||||
As of December 31, 2010, we had $282.1 million of operating loss carryforwards for income tax purposes, of which $89.2 million relates to foreign jurisdictions and the remaining $192.9 million relates to the United States, which will expire in 2024, 2025, 2026 and 2027, if not utilized in prior years. The United States federal net operating loss amount excludes approximately $3.8 million in gross potential future tax benefits associated with excess tax deductions above previously recognized book expense for employee stock option exercises that occurred in 2010. We anticipate taxable income in future years that will allow us to utilize the carryforwards that have not had a valuation allowance placed against them.
As of December 31, 2010 and 2009, a valuation allowance of $66.4 million and $86.4 million, respectively, had been recorded related to certain deferred tax assets. We record a valuation allowance when it is more likely than not that some portion or all of the deferred tax assets will not be realized. The ultimate realization of the deferred tax assets depends on the ability to generate sufficient taxable income of the appropriate character in the future and in the appropriate taxing jurisdictions. We have provided a valuation allowance for operating loss carryforwards and deferred tax assets in certain jurisdictions.
F-25
Table of Contents
KRATON PERFORMANCE POLYMERS, INC.
Notes to Consolidated Financial Statements—(Continued)
In assessing realizability of deferred tax assets, management considers whether it is more likely than not that some portion or all of the deferred tax assets will not be realized. The ultimate realization of deferred tax assets is dependent upon the generation of future taxable income during the periods in which those temporary differences become deductible. Based upon management’s expectations at December 31, 2010, management believes it is more likely than not, that we will realize the benefit of the deferred tax assets, net of the existing valuation allowances.
We provide for taxes in certain situations where assessments have not been received. In those situations, we consider it probable that the taxes ultimately payable will exceed the amounts reflected in filed tax returns; accordingly, taxes are provided in those situations under the guidance in ASC 740-10, Accounting for Uncertainty in Income Taxes, and are included in both current and deferred income taxes.
We account for uncertainty in income taxes accordance with ASC 740-10, Accounting for Uncertainty in Income Taxes, which prescribes the minimum recognition threshold a tax position taken or expected to be taken in a tax return is required to meet before being recognized in the financial statements. It also provides guidance for derecognition, classification, interest and penalties, accounting in interim periods, disclosure, and transition. We file income tax returns in the U.S. federal jurisdiction, and various state and foreign jurisdictions. For our U.S. federal income tax returns, the statute of limitations has expired through the tax year December 31, 2003; as a result of operating loss carryforwards from 2004, the statute remains open for all years subsequent to 2003. In addition, open tax years for state and foreign jurisdictions remain subject to examination.
As of January 1, 2010, we had total unrecognized tax benefits of approximately $1.3 million. During the year ended December 31, 2010, we had a change in uncertain tax positions mainly related to the current tax period. The decrease of $1.3 million in these tax positions was primarily due to settling an ongoing tax audit in Asia and the increase of $3.7 million relates to uncertain tax positions in Europe. As of December 31, 2010, we estimated $3.7 million in unrecognized tax benefits, that if recognized, would impact the effective tax rate. We recognize interest and penalties related to unrecognized tax benefits within the provision for income taxes in our consolidated statement of operations. During the year ended December 31, 2010, no additional interest and penalties charges were recognized since the tax benefits relate to the current year. As of January 1, 2011, we believe that no current tax positions that have resulted in unrecognized tax benefits will significantly increase or decrease within one year.
The following presents a rollforward of our unrecognized tax benefits and associated interest and penalties.
| Unrecognized Tax Benefits |
Interest and Penalties |
Total | ||||||||||
| (in thousands) | ||||||||||||
| Balance at December 31, 2008 |
$ | 1,144 | $ | 83 | $ | 1,227 | ||||||
| Increase in prior year tax positions |
11 | 38 | 49 | |||||||||
| Balance at December 31, 2009 |
$ | 1,155 | $ | 121 | $ | 1,276 | ||||||
| Decrease in prior year tax positions |
(1,155 | ) | (121 | ) | (1,276 | ) | ||||||
| Increase in prior year tax positions |
3,689 | — | 3,689 | |||||||||
| Balance at December 31, 2010 |
$ | 3,689 | $ | — | $ | 3,689 | ||||||
(a) U.S. Retirement Benefit Plan. We have a U.S. noncontributory defined benefit pension plan (“Pension Plan”) which covers all salaried and hourly wage employees in the United States, who were employed by us on or before December 31, 2005. Employees who began their employment with us after December 31, 2005 are not
F-26
Table of Contents
KRATON PERFORMANCE POLYMERS, INC.
Notes to Consolidated Financial Statements—(Continued)
covered by our Pension Plan. The benefits under the Pension Plan are based primarily on years of service and employees’ pay near retirement. For our employees who were employed as of March 1, 2001 and who: (1) were previously employed by Shell Chemicals; and (2) elected to transfer their pension assets to us, we consider the total combined Shell Chemicals and Kraton service when calculating the employee’s pension benefit. For those employees who: (1) elected to retire from Shell Chemicals; or (2) elected not to transfer their pension benefit, only Kraton service (since March 1, 2001) is considered when calculating benefits.
The 2010 measurement date of the Pension Plan’s assets and obligations was December 31, 2010. Based on the funded status of our defined benefit pension plan as of December 31, 2010, we reported a decrease in our accumulated other comprehensive income of approximately $7.5 million and a related increase in accrued pension obligations. Accrued pension obligations are included in long-term liabilities on our consolidated balance sheet. Information concerning the pension obligation, plan assets, amounts recognized in our financial statements and underlying actuarial assumptions are as follows:
| December 31, | ||||||||
| 2010 | 2009 | |||||||
| (in thousands) | ||||||||
| Change in benefit obligation |
||||||||
| Benefit obligation at beginning of year |
$ | 76,889 | $ | 82,163 | ||||
| Service cost |
2,285 | 2,813 | ||||||
| Interest cost |
4,863 | 4,690 | ||||||
| Benefits paid |
(2,489 | ) | (2,086 | ) | ||||
| Actuarial (gain) loss |
9,774 | (10,691 | ) | |||||
| Plan amendments |
— | — | ||||||
| Benefit obligation at end of year |
$ | 91,322 | $ | 76,889 | ||||
| Change in plan assets |
||||||||
| Fair value at beginning of year |
$ | 50,321 | $ | 39, 111 | ||||
| Actual return on plan assets |
7,079 | 9,106 | ||||||
| Employer contributions |
3,312 | 4,190 | ||||||
| Benefits paid |
(2,489 | ) | (2,086 | ) | ||||
| Fair value at end of year |
$ | 58,223 | $ | 50,321 | ||||
| Funded status at end of year |
$ | (33,099 | ) | $ | (26,568 | ) | ||
| Amounts Recognized on Balance Sheet |
||||||||
| Noncurrent assets |
$ | — | $ | — | ||||
| Current liabilities |
— | — | ||||||
| Noncurrent liabilities |
(33,099 | ) | (26,568 | ) | ||||
| $ | (33,099 | ) | $ | (26,568 | ) | |||
| Amounts Recognized in Accumulated Other Comprehensive Income |
||||||||
| Prior service cost |
$ | — | $ | — | ||||
| Net actuarial loss |
20,515 | 12,974 | ||||||
| $ | 20,515 | $ | 12,974 | |||||
The accumulated benefit obligation for the Pension Plan was $83.0 million and $67.7 million at December 31, 2010, and 2009, respectively.
F-27
Table of Contents
KRATON PERFORMANCE POLYMERS, INC.
Notes to Consolidated Financial Statements—(Continued)
Net periodic pension costs consist of the following components:
| Years ended December 31, | ||||||||||||
| 2010 | 2009 | 2008 | ||||||||||
| (in thousands) | ||||||||||||
| Service cost benefits earned during the period |
$ | 2,285 | $ | 2,813 | $ | 2,281 | ||||||
| Interest on prior year’s projected benefit obligation |
4,863 | 4,690 | 4,275 | |||||||||
| Expected return on plan assets |
(4,845 | ) | (4,680 | ) | (4,084 | ) | ||||||
| Amortization of net actuarial (gain)/loss |
— | 514 | — | |||||||||
| Recognized curtailment loss |
— | — | — | |||||||||
| Recognized loss due to special term benefits |
— | — | 158 | |||||||||
| Net periodic pension costs |
$ | 2,303 | $ | 3,337 | $ | 2,630 | ||||||
Discount rates are determined annually and are based on rates of return of high-quality long-term fixed income securities currently available and expected to be available during the maturity of the pension benefits.
| December 31, | ||||||||
| 2010 | 2009 | |||||||
| Weighted average assumptions used to determine benefit obligations |
||||||||
| Measure date |
12/31/2010 | 12/31/2009 | ||||||
| Discount rate |
5.68 | % | 6.38 | % | ||||
| Rates of increase in salary compensation level |
3.00 | % | 3.00 | % | ||||
| Weighted average assumptions used to determine net periodic benefit cost |
||||||||
| Discount rate |
6.38 | % | 5.73 | % | ||||
| Rates of increase in salary compensation level |
3.00 | % | 3.70 | % | ||||
| Expected long-term rate of return on plan assets |
8.50 | % | 8.50 | % | ||||
The expected long-term rate of return on assets assumption is derived from a study conducted by our actuaries. The study includes a review of anticipated future long-term performance of individual asset classes and consideration of the appropriate asset allocation strategy given the anticipated requirements of the Pension Plan to determine the average rate of earnings expected on the funds invested to provide for the Pension Plan benefits. While the study gives appropriate consideration to recent fund performance and historical returns, the assumption is primarily a long-term, prospective rate. Based on our most recent study, the expected long-term return assumption for our Pension Plan effective for the current year will remain at 8.5%.
Pension Plan Assets. We maintain target allocation percentages among various asset classes based on an investment policy established for the pension plan. The target allocation is designed to achieve long term objectives of return, while mitigating against downside risk and considering expected cash flows. The current weighted-average target asset allocation is as follows: equity securities 38.0%, debt securities 45.0%, and other 17.0%. Our investment policy is reviewed from time to time to ensure consistency with our long term objective.
Our Pension Plan asset allocations at December 31, 2010, and 2009, by asset category are as follows:
| Percentage of
Plan Assets at December 31, |
||||||||
| Asset Category |
2010 | 2009 | ||||||
| Equity securities |
38.0 | % | 64.6 | % | ||||
| Debt securities |
52.8 | % | 34.9 | % | ||||
| Real estate |
3.0 | % | 0.0 | % | ||||
| Other |
6.2 | % | 0.5 | % | ||||
| Total |
100.0 | % | 100.0 | % | ||||
F-28
Table of Contents
KRATON PERFORMANCE POLYMERS, INC.
Notes to Consolidated Financial Statements—(Continued)
No pension assets were invested in debt or equity securities of Kraton at December 31, 2010, and 2009.
See Note 14 Financial Instruments and Credit Risk for discussion of disclosure requirements related to ASC 820, “Fair Value Measurements and Disclosures.” The fair value of our Pension Plan assets at December 31, 2010, by asset category are as follows:
| Pension Plan Assets Fair Value Measurements at December 31, 2010 |
||||||||||||||||
| Total | Quoted Prices In Active Markets Identical Assets (Level 1) |
Significant Observable Inputs (Level 2) |
Significant Unobservable Inputs (Level 3) |
|||||||||||||
| (In thousands) | ||||||||||||||||
| Equity Mutual Funds |
||||||||||||||||
| Dodge & Cox Stock Fund(a) |
2,327 | 2,327 | ||||||||||||||
| Harbor Cap Appreciation Fund(b) |
2,318 | 2,318 | ||||||||||||||
| Harding Loevner Emerging Markets Fund(c) |
1,753 | 1,753 | ||||||||||||||
| Matthews Asian Growth & Income Fund(d) |
584 | 584 | ||||||||||||||
| Total |
6,982 | 6,982 | — | — | ||||||||||||
| Debt Mutual Funds |
||||||||||||||||
| Eaton Vance Global Macro Fund—I(e) |
4,650 | 4,650 | ||||||||||||||
| PIMCO Emerging Local Bond Fund(f) |
1,750 | 1,750 | ||||||||||||||
| PIMCO Extended Duration Fund(g) |
4,748 | 4,748 | ||||||||||||||
| PIMCO Short Term Institutional Fund(h) |
2,906 | 2,906 | ||||||||||||||
| Vanguard Inflation Protected Bond Fund(i) |
2,629 | 2,629 | ||||||||||||||
| Total |
16,683 | 16,683 | — | — | ||||||||||||
| Equity Commingled Pools |
||||||||||||||||
| FMTC US Equity Index Pool(j) |
5,811 | 5,811 | ||||||||||||||
| Pyramis International Growth Commingled Pool(k) |
5,242 | 5,242 | ||||||||||||||
| Pyramis Large Cap Core Commingled Pool(l) |
1,744 | 1,744 | ||||||||||||||
| Pyramis Small Company Commingled Pool(m) |
2,316 | 2,316 | ||||||||||||||
| Total |
15,113 | — | 15,113 | — | ||||||||||||
| Debt Commingled Pools |
||||||||||||||||
| Pyramis Emerging Market Debt Commingled Pool(n) |
1,164 | 1,164 | ||||||||||||||
| Pyramis Long Corp. A or Better Commingled Pool(o) |
4,110 | 4,110 | ||||||||||||||
| Pyramis Long Duration(p) |
8,808 | 8,808 | ||||||||||||||
| Total |
14,082 | — | 14,082 | — | ||||||||||||
| Real Estate |
||||||||||||||||
| Virtus Real Estate SEC—I Fund(q) |
1,739 | 1,739 | ||||||||||||||
| Total |
1,739 | 1,739 | — | — | ||||||||||||
| Other |
||||||||||||||||
| Money Market Mutual Fund |
80 | 80 | — | — | ||||||||||||
| Credit Suisse Commodity Return Strategy Fund(r) |
3,544 | 3,544 | ||||||||||||||
| Total |
3,624 | 3,624 | — | — | ||||||||||||
| Total |
$ | 58,223 | $ | 29,028 | $ | 29,195 | $ | — | ||||||||
F-29
Table of Contents
KRATON PERFORMANCE POLYMERS, INC.
Notes to Consolidated Financial Statements—(Continued)
The fair value of our pension plan assets at December 31, 2009, by asset category are as follows:
| Pension Plan Assets Fair Value Measurements at December 31, 2009 |
||||||||||||||||
| Total | Quoted Prices In Active Markets Identical Assets (Level 1) |
Significant Observable Inputs (Level 2) |
Significant Unobservable Inputs (Level 3) |
|||||||||||||
| (In thousands) | ||||||||||||||||
| Money Market Mutual Fund |
$ | 244 | $ | 244 | $ | — | $ | — | ||||||||
| Commingled Pool Equity |
||||||||||||||||
| FMTC US Equity Index Pool(j) |
6,224 | 6,224 | ||||||||||||||
| Pyramis International Growth Commingled Pool(k) |
3,015 | 3,015 | ||||||||||||||
| Pyramis Quant LG Cap Cor Com Pool(s) |
2,547 | 2,547 | ||||||||||||||
| Pyramis Select Intl Equity(t) |
5,486 | 5,486 | ||||||||||||||
| Pyramis Small Company Commingled Pool(m) |
5,008 | 5,008 | ||||||||||||||
| Pyramis US Total Market Equity(u) |
10,230 | 10,230 | ||||||||||||||
| Total |
32,510 | 32,510 | ||||||||||||||
| Commingled Pool Debt |
||||||||||||||||
| Pyramis Emerging Market Debt Commingled Pool(n) |
1,022 | 1,022 | ||||||||||||||
| Pyramis High Yield Bond Com Pool(v) |
2,095 | 2,095 | ||||||||||||||
| Pyramis Long Duration(p) |
14,451 | 14,451 | ||||||||||||||
| Total |
17,568 | 17,568 | ||||||||||||||
| Total |
$ | 50,322 | $ | 244 | $ | 50,078 | $ | — | ||||||||
| (a) | Portfolio with the primary objective to invest in common stocks that appear to be temporarily undervalued by the stock market but have a favorable outlook for long-term growth. |
| (b) | Portfolio with the primary objective to seek long-term growth of capital by investing in mid to large cap growth stocks. |
| (c) | Portfolio with the primary objective to seek long-term capital appreciation through investment in equity securities of companies based in emerging markets. |
| (d) | Portfolio with the primary objective to seek long-term capital appreciation and some current income through investment in equity securities of companies located in Asia. |
| (e) | Portfolio with the primary objective to seek total return by investing in securities, derivatives, and other instruments to establish long and short investment exposure around the world. |
| (f) | Portfolio with the primary objective to seek maximum total return, consistent with preservation of capital and prudent investment management by investing in fixed income securities denominated in currencies of non-U.S. countries. |
| (g) | Portfolio with the primary objective to seek maximum total return, consistent with prudent investment management by investing in long-term maturity fixed income securities. |
| (h) | Portfolio with the primary objective to seek maximum current income, consistent with preservation of capital and daily liquidity by investing in short-term investment grade bonds (average duration less than or equal to one year). |
| (i) | Portfolio with the primary objective to protect investors from the eroding effect of inflation by investing in bonds that are backed by the federal government and whose principal is adjusted quarterly based on inflation. |
| (j) | Portfolio with the primary objective to provide investment results that correspond to the total return performance of common stocks publicly traded in the United States. |
F-30
Table of Contents
KRATON PERFORMANCE POLYMERS, INC.
Notes to Consolidated Financial Statements—(Continued)
| (k) | Portfolio with the primary objective to seek long-term growth of capital primarily through investments in foreign equity securities. |
| (l) | Portfolio with the primary objective to achieve excess return relative to the S&P 500 Index. |
| (m) | Portfolio with the primary objective to achieve long-term growth of capital, principally by investing in the equity securities of smaller, growing companies. |
| (n) | Portfolio with the primary objective to achieve superior total returns primarily through investments in debt securities of emerging countries. |
| (o) | Portfolio with the primary objective to provide investment returns in excess of the Barclays Capital® Long Corporate A or Better Index through investments in fixed income securities and commingled vehicles. |
| (p) | Portfolio with the primary objective to generate returns that exceed the Barclays Capital® US Long Government/Credit Bond Index through investments in investment-grade fixed-income securities and commingled vehicles. |
| (q) | Portfolio with the primary objective to provide exposure to the equity REITs market, which has historically had a lower correlation to traditional asset classes. |
| (r) | Portfolio with the primary objective to achieve positive total return relative to the performance of the Dow Jones—UBS Commodity Index total return. |
| (s) | Portfolio with the primary objective to consistently provide excess return over the S&P 500® Index through active stock selection while maintaining portfolio risk characteristics similar to the benchmark. |
| (t) | Portfolio with the primary objective to seek long-term growth of capital primarily through investments in foreign securities. |
| (u) | Portfolio with the primary objective to provide excess return over a market cycle relative to the Dow Jones U.S. Total Stock Market Index® (Index), an unmanaged index of all U.S. headquartered companies maintained by Whilshire Associates, while maintaining similar style characteristics and sector weights. |
| (v) | Portfolio with the primary objective to achieve superior total returns through investments in a universe of lower-rated and non-rated debt securities providing high current income. |
Contributions. We expect to contribute $7.4 million to our Pension Plan in 2011.
Estimated Future Benefit Payments.
The following benefit payments, which reflect expected future service, as appropriate, are expected to be paid:
| (in thousands) | ||||
| 2011 |
2,540 | |||
| 2012 |
2,723 | |||
| 2013 |
2,985 | |||
| 2014 |
3,348 | |||
| 2015 |
3,696 | |||
| Years 2016-2020 |
25,845 | |||
| $ | 41,137 | |||
(b) Other Retirement Benefit Plans. Certain employees are eligible to participate in a non-qualified defined benefit restoration plan and/or a non-qualified defined contribution restoration plan (“benefit restoration plans”) which are intended to restore certain benefits under the Pension Plan in the United States and the Kraton Savings Plan in the United States, respectively, which would otherwise be lost due to certain limitations imposed by law on tax-qualified plans. We made $0.0 million, $0.9 million and $0.0 million in contributions to the benefit
F-31
Table of Contents
KRATON PERFORMANCE POLYMERS, INC.
Notes to Consolidated Financial Statements—(Continued)
restoration plans for the years ended December 31, 2010, 2009 and 2008 respectively. As of December 31, 2010 and 2009, amounts recognized in the statement of financial position as a component of long-term liabilities for the benefit restoration plans were $1.1 million and $0.4 million, respectively.
We have established a defined benefit plan in Japan designed to be equivalent to the plan previously provided by Shell Chemicals which covers substantially all Japan employees. Our contributions to the plan for the years ended December 31, 2010, 2009 and 2008 were $0.1 million, $0.2 million, and $0.0 million, respectively. As of December 31, 2010, 2009 and 2008 amounts recognized in the statement of financial position as a component of long-term liabilities for the defined benefit plan were $1.5 million, $1.3 million, and $1.3 million, respectively.
(c) Postretirement Benefits Other Than Pensions. Health and welfare benefits are provided to benefit eligible employees in the United States who retire from Kraton and were employed by us prior to January 1, 2006. Retirees under the age of 65 are eligible for the same medical, dental, and vision plans as active employees, but with an annual cap on premiums that varies based on years of service and ranges from $7,000 to $10,000 per employee. Our subsidy schedule for medical plans is based on accredited service at retirement. Retirees are responsible for the full cost of premiums for postretirement dental and vision coverage. In general, the plans stipulate that health and welfare benefits are paid as covered expenses as incurred. We accrue the cost of these benefits during the period in which the employee renders the necessary service.
Employees who were retirement eligible as of February 28, 2001, have the option to participate in either Shell Chemicals or Kraton postretirement health and welfare plans.
ASC 715, “Compensation-Retirement Benefits,” requires that we measure the plans’ assets and obligations that determine our funded status as of the end of the fiscal year. The 2010 measurement date of the plans’ assets and obligations was December 31, 2010. We are also required to recognize as a component of accumulated other comprehensive income the changes in funded status that occurred during the year that are not recognized as part of new periodic benefit cost.
Based on the funded status of our postretirement benefit plan as of December 31, 2010, we reported a decrease in our accumulated other comprehensive income of approximately $3.5 million and a related increase in accrued pension obligations.
F-32
Table of Contents
KRATON PERFORMANCE POLYMERS, INC.
Notes to Consolidated Financial Statements—(Continued)
Information concerning the plan obligation, the funded status and amounts recognized in our financial statements and underlying actuarial assumptions are as follows:
| December 31, | ||||||||
| 2010 | 2009 | |||||||
| (in thousands) | ||||||||
| Change in benefit obligation: |
||||||||
| Benefit obligation at beginning of period |
$ | 18,474 | $ | 16,138 | ||||
| Service cost |
364 | 393 | ||||||
| Interest cost |
1,213 | 1,058 | ||||||
| Benefits and expenses paid (premiums) |
(801 | ) | (614 | ) | ||||
| Part D subsidy received |
7 | — | ||||||
| Actuarial loss |
3,735 | 1,499 | ||||||
| Plan amendments |
— | — | ||||||
| Benefit obligation at end of period |
$ | 22,992 | $ | 18,474 | ||||
| Reconciliation of plan assets(1): |
||||||||
| Employer contributions |
$ | 794 | $ | 614 | ||||
| Part D subsidy received |
7 | — | ||||||
| Benefits paid |
(801 | ) | (614 | ) | ||||
| $ | — | $ | — | |||||
| Funded status at end of year |
$ | (22,992 | ) | $ | (18,474 | ) | ||
| (1) | As part of the Ripplewood Transaction, Shell Chemicals has committed to a future cash payment related to retiree medical expenses based on a specified dollar amount per employee, if certain contractual commitments are met. We have recorded an asset of approximately $7.5 million and $6.6 million as our estimate of the present value of this commitment as of December 31, 2010 and 2009, respectively. |
| December 31, | ||||||||
| 2010 | 2009 | |||||||
| (in thousands) | ||||||||
| Amounts Recognized in the Balance Sheet: |
||||||||
| Noncurrent assets |
$ | — | $ | — | ||||
| Current liabilities |
(932 | ) | (687 | ) | ||||
| Noncurrent liabilities |
(22,060 | ) | (17,787 | ) | ||||
| $ | (22,992 | ) | $ | (18,474 | ) | |||
| Amounts Recognized in Accumulated Other Comprehensive Income: |
||||||||
| Prior service cost |
$ | — | $ | — | ||||
| Net actuarial loss |
7,423 | 3,942 | ||||||
| $ | 7,423 | $ | 3,942 | |||||
F-33
Table of Contents
KRATON PERFORMANCE POLYMERS, INC.
Notes to Consolidated Financial Statements—(Continued)
Net periodic benefit costs consist of the following components:
| Years ended December 31, | ||||||||||||
| 2010 | 2009 | 2008 | ||||||||||
| (in thousands) | ||||||||||||
| Service cost |
$ | 364 | $ | 392 | $ | 332 | ||||||
| Interest cost |
1,213 | 1,058 | 871 | |||||||||
| Amortization of net actuarial loss |
253 | 231 | — | |||||||||
| Plan amendments |
— | — | 264 | |||||||||
| Net periodic benefit costs |
$ | 1,830 | $ | 1,681 | $ | 1,467 | ||||||
| December 31, | ||||||||
| 2010 | 2009 | |||||||
| Weighted average assumptions used to determine benefit obligations |
||||||||
| Measurement date |
12/31/2010 | 12/31/2009 | ||||||
| Discount rate |
5.46 | % | 6.17 | % | ||||
| Rates of increase in salary compensation level |
N/A | N/A | ||||||
| Weighted average assumptions used to determine net periodic benefit cost |
||||||||
| Discount rate |
6.17 | % | 5.76 | % | ||||
| Rates of increase in salary compensation level |
N/A | N/A | ||||||
| Expected long-term rate of return on plan assets |
N/A | N/A | ||||||
| December 31, | ||||||||
| 2010 | 2009 | |||||||
| Assumed health care cost trend rates |
||||||||
| Health care cost trend rate assumed for next year |
8.00 | % | 8.00 | % | ||||
| Rate to which the cost trend rate is assumed to decline (the ultimate trend rate) |
5.00 | % | 4.00 | % | ||||
| Year that the rate reaches the ultimate trend rate |
2016 | 2014 | ||||||
The discount rate for 2010 was based in part on the average Moody’s Aa Corporate Bond Yield and the average Citigroup Pension Liability Index, which were 5.15% and 5.54%, respectively. The Fidelity Investments bond modeler was used to compare the expected future cash outflows to the bonds included in the indices noted above.
Assumed health care cost trend rates have a significant effect on the amounts reported for the health care plans. A 1% change in assumed health care cost trend rates would have the following effect (in thousands):
| 1% Increase | 1% Decrease | |||||||
| Effect on total of service and interest cost components |
$ | 55 | $ | (62 | ) | |||
| Effect on postretirement benefit obligation |
794 | (835 | ) | |||||
(d) Kraton Savings Plan. The Kraton Savings Plan, as adopted on March 1, 2001, covers substantially all U.S. employees, including executive officers. Through automatic payroll deduction, participants have the option to defer up to 60% of eligible earnings in any combination of pretax and/or post-tax contributions, subject to annual dollar limitations set forth in the Internal Revenue Code. Under this plan, we have two types of employer contributions:
(1) For our standard contributions, we make matching contributions of 50% of the first 6% contributed by the employee after completing one year of service, and we make matching contributions of 100% of the first 6% contributed by the employee after completing five years of service.
F-34
Table of Contents
KRATON PERFORMANCE POLYMERS, INC.
Notes to Consolidated Financial Statements—(Continued)
(2) For our enhanced contributions, we make employer contributions of 3% for employees who have less than five years of service and a 4% contribution for employees who have five or more years of service.
For our employees who were employed as of February 28, 2001, and who were previously employed by Shell Chemicals, we recognize their Shell Chemicals years of service for purposes of determining employer contributions under our Plan. Our contributions to the plan for the year ended December 31, 2010, 2009 and 2008, were $2.6 million, $2.7 million, and $2.2 million, respectively.
9. Commitments and Contingencies
(a) Lease Commitments
We have entered into various long-term non-cancelable operating leases. Future minimum lease commitments at December 31, 2010, are as follows: 2011—$5.4 million; 2012—$4.3 million; 2013—$2.9 million; 2014—$2.5 million, 2015—$2.5 million, and 2016 and thereafter—$13.0 million. We recorded $6.6 million, $4.1 million, and $8.4 million in rent expense for the years ended December 31, 2010, 2009 and 2008, respectively.
(b) Environmental and Safety Matters
Our finished products are not classified as hazardous. However, our operations involve the handling, transportation, treatment, and disposal of potentially hazardous materials that are extensively regulated by environmental, health and safety laws, regulations and permit requirements. Environmental permits required for our operations are subject to periodic renewal and can be revoked or modified for cause or when new or revised environmental requirements are implemented. Changing and increasingly strict environmental requirements can affect the manufacturing, handling, processing, distribution and use of our chemical products and the raw materials used to produce such products and, if so affected, our business and operations may be materially and adversely affected. In addition, changes in environmental requirements can cause us to incur substantial costs in upgrading or redesigning our facilities and processes, including waste treatment, disposal, and other waste handling practices and equipment.
We conduct environmental management programs designed to maintain compliance with applicable environmental requirements at all of our facilities. We routinely conduct inspection and surveillance programs designed to detect and respond to leaks or spills of regulated hazardous substances and to correct identified regulatory deficiencies. We believe that our procedures for waste handling are consistent with industry standards and applicable requirements. In addition, we believe that our operations are consistent with good industry practice. However, a business risk inherent with chemical operations is the potential for personal injury and property damage claims from employees, contractors and their employees, and nearby landowners and occupants. While we believe our business operations and facilities generally are operated in compliance, in all material respects, with all applicable environmental and health and safety requirements, we cannot be sure that past practices or future operations will not result in material claims or regulatory action, require material environmental expenditures, or result in exposure or injury claims by employees, contractors and their employees, and the public. Some risk of environmental costs and liabilities are inherent in our operations and products, as it is with other companies engaged in similar businesses.
The Paulinia, Brazil and Belpre, Ohio facilities are subject to a number of actual and/or potential environmental liabilities primarily relating to contamination caused by former operations at those facilities. Some environmental laws could impose on us the entire costs of cleanup regardless of fault, legality of the original disposal, or ownership of the disposal site. In some cases, the governmental entity with jurisdiction could seek an
F-35
Table of Contents
KRATON PERFORMANCE POLYMERS, INC.
Notes to Consolidated Financial Statements—(Continued)
assessment for damage to the natural resources caused by contamination from those sites. Shell Chemicals has agreed, subject to certain limitations, in time and amounts, to indemnify us against most environmental liabilities related to the acquired facilities that arise from conditions existing prior to the closing.
We had no material operating expenditures for environmental fines, penalties, government imposed remedial or corrective actions in each of the years ended December 31, 2010, 2009 and 2008.
(c) Asset Retirement Obligations.
We account for asset retirement obligations pursuant to the provisions of ASC 410-20, “Asset Retirement Obligations.” ASC 410-20 requires us to record the fair value of an asset retirement obligation as a liability in the period in which we incur a legal obligation associated with the retirement of tangible long-lived assets that result from the acquisition, construction, development, and/or normal use of the assets. ASC 410-20 also requires us to record a corresponding asset that is depreciated over the life of the asset. Subsequent to the initial measurement of the asset retirement obligation, the obligation is to be adjusted at the end of each period to reflect the passage of time and changes in the estimated future cash flows underlying the obligation. We have no assets that are legally restricted for purposes of settling asset retirement obligations. We have determined that we have contractual or regulatory requirements to decommission and perform other remediation for many of our manufacturing facilities and other assets upon retirement.
The following table shows changes in the aggregate carrying amount of our asset retirement obligations:
| December 31, | ||||||||
| 2010 | 2009 | |||||||
| (in thousands) | ||||||||
| Asset Retirement Obligations: |
||||||||
| Balance at January 1 |
$ | 4,171 | $ | 278 | ||||
| Additional accruals |
3,024 | 5,104 | ||||||
| Accretion expense |
57 | 172 | ||||||
| Liabilities settled |
(2,583 | ) | — | |||||
| Revisions in estimated cash flows |
(1,291 | ) | (1,383 | ) | ||||
| Balance at December 31 |
$ | 3,378 | $ | 4,171 | ||||
(d) Legal Proceedings
We and certain of our subsidiaries are parties to several legal proceedings that have arisen in the ordinary course of business. While the outcome of these proceedings cannot be predicted with certainty, management does not expect these matters, individually or in the aggregate, to have a material adverse effect upon our financial position, results of operations or cash flows. Furthermore, Shell Chemicals has agreed, subject to certain limitations, to indemnify us for certain claims brought with respect to matters occurring before February 28, 2001.
Kraton and LyondellBasell have negotiated and concluded the terms of an agreed arbitration proceeding (to take place in London, England) to determine the ongoing effect of a multi-year term sheet that had been reached between the parties and put into effect in January 2009, covering certain terms and conditions applicable to operations and butadiene sales by LyondellBasell (for and to Kraton) at Berre, France and Wesseling, Germany. The parties had been dealing with one another in accordance with the term sheet from January 2009 until
F-36
Table of Contents
KRATON PERFORMANCE POLYMERS, INC.
Notes to Consolidated Financial Statements—(Continued)
LyondellBasell notified Kraton on September 9, 2010 that LyondellBasell would no longer be governed by the term sheet. Since receiving the September 9 notice, Kraton has been paying an increased net amount to LyondellBasell on a monthly basis (under protest) to reflect the pre-term sheet arrangements between the parties.
The outcome of the arbitration cannot be predicted with accuracy at this time. However, we do not believe it is probable that LyondellBasell will prevail in the arbitration, and we do not expect the final resolution of this matter to have a material impact on our ongoing business or operations. Until resolution of this matter, we are recognizing a charge to current operations for the net excess payments to LyondellBasell over those we would have made pursuant to the term sheet. In 2010, we recognized a net pre-tax charge of $0.9 million associated with this matter.
10. Related Party Transactions
We own a 50% equity investment in a manufacturing joint venture with JSR Corporation (“JSR”) under the name of Kraton JSR Elastomers K.K. (“KJE”) located in Kashima, Japan. KJE manufactures thermoplastic rubber (“TR”), which is wholly or predominantly composed of a block co-polymer comprising styrene blocks with butadiene and/or isoprene polymer blocks. KJE produces TR for sale to third party customers only through Kraton and JSR. We and JSR separately, but with equal rights, participate as distributors in the sales of the TR produced by KJE.
The aggregate amounts of related-party transactions were as follows:
| December 31, | ||||||||||||
| 2010 | 2009 | 2008 | ||||||||||
| Sales to related party |
$ | — | $ | — | $ | 626 | ||||||
| Purchases from related party |
$ | 35,384 | $ | 27,763 | $ | 37,894 | ||||||
Basic Earnings per share (“EPS”) is computed by dividing net income by the weighted-average number of common shares outstanding during the period.
Diluted EPS is computed by dividing net income by the diluted weighted-average number of common shares outstanding during the period and, accordingly, reflects the potential dilution that could occur if securities or other agreements to issue common stock, such as stock options, stock-based performance awards and preferred stock, were exercised, settled or converted into common stock and were dilutive. The diluted weighted-average number of common shares used in the diluted EPS calculation is determined using the treasury stock method.
Unvested awards of share-based payments with rights to receive dividends or dividend equivalents, such as our restricted stock awards are considered to be participating securities and the two-class method is used for purposes of calculating EPS. Under the two-class method, a portion of net income is allocated to these participating securities and therefore is excluded from the calculation of EPS allocated to common stock.
F-37
Table of Contents
KRATON PERFORMANCE POLYMERS, INC.
Notes to Consolidated Financial Statements—(Continued)
The following table summarizes the effect of the share-based compensation awards on the weighted- average number of shares outstanding used in calculating diluted earnings per share:
| Years ended December 31, | ||||||||||||
| 2010 | 2009 | 2008 | ||||||||||
| (In thousands, except per share data) | ||||||||||||
| Net income (loss) as reported |
$ | 96,725 | $ | (290 | ) | $ | 28,419 | |||||
| Less (income) allocated to unvested restricted shares |
(396 | ) | 1 | (28 | ) | |||||||
| Income allocated to common share for basic and diluted EPS |
96,329 | (289 | ) | 28,391 | ||||||||
| Total weighted-average number of common shares for basic EPS |
30,825 | 19,808 | 19,387 | |||||||||
| Incremental effect of dilutive common stock equivalents: |
||||||||||||
| Restricted share units |
35 | — | 77 | |||||||||
| Stock options |
519 | — | — | |||||||||
| Total weighted-average number of shares for diluted EPS |
31,379 | 19,808 | 19,464 | |||||||||
| Total basic earnings per common share |
$ | 3.13 | $ | (0.01 | ) | $ | 1.46 | |||||
| Total dilutive earnings per common share |
$ | 3.07 | $ | (0.01 | ) | $ | 1.46 | |||||
Restricted common shares outstanding totaled 118,413 and 119,892 at December 31, 2010 and 2009, respectively, and are subject to time vesting and restrictions on transfer until vested and have identical voting, income and distribution rights to the unrestricted common shares outstanding. Restricted share units in the amount of 35,098, 78,197 and 76,924 and stock options in the amount of 1,559,354, 1,584,970 and 1,635,666, were outstanding at December 31, 2010, 2009 and 2008, respectively.
The computation of diluted earnings per share excludes the effect of the potential exercise of stock options that are anti-dilutive. Only the number of shares that would be issuable under the treasury stock method of accounting for share dilution are included, which is based upon the amount by which the average stock price exceeds the conversion price. The number of stock options excluded from the computation was 150,000, 1,584,970, and 1,635,660 for the years ended December 31, 2010, 2009, and 2008, respectively.
12. Industry Segment and Foreign Operations
We operate in one segment for the manufacture and marketing of styrenic block copolymers. In accordance with the provisions of ASC 280, “Segment Reporting,” our chief operating decision-maker has been identified as the President and Chief Executive Officer, who reviews operating results to make decisions about allocating resources and assessing performance for the entire company. Since we operate in one segment and in one group of similar products, all financial segment and product line information required by ASC 280 can be found in the consolidated financial statements.
F-38
Table of Contents
KRATON PERFORMANCE POLYMERS, INC.
Notes to Consolidated Financial Statements—(Continued)
For geographic reporting, revenues are attributed to the geographic location in which the customers’ facilities are located. Long-lived assets consist primarily of property, plant, and equipment, which are attributed to the geographic location in which they are located, and are presented at historical cost. Total operating revenues and long-lived assets by geographic region were as follows:
| Years ended December 31, | ||||||||||||
| 2010 | 2009 | 2008 | ||||||||||
| (in thousands) | ||||||||||||
| Total Operating Revenues: |
||||||||||||
| United States |
$ | 421,856 | $ | 304,265 | $ | 395,568 | ||||||
| Germany |
162,260 | 121,959 | 149,011 | |||||||||
| Japan |
89,987 | 73,055 | 70,169 | |||||||||
| China |
53,359 | 37,123 | 31,421 | |||||||||
| Brazil |
47,387 | 40,438 | 40,868 | |||||||||
| Italy |
46,386 | 35,934 | 48,328 | |||||||||
| France |
36,122 | 27,342 | 39,757 | |||||||||
| Thailand |
34,647 | 28,779 | 22,877 | |||||||||
| The Netherlands |
33,093 | 66,027 | 80,980 | |||||||||
| United Kingdom |
29,214 | 27,425 | 40,401 | |||||||||
| Belgium |
24,081 | 16,273 | 30,079 | |||||||||
| Turkey |
23,767 | 12,990 | 15,979 | |||||||||
| Canada |
20,855 | 16,168 | 25,361 | |||||||||
| Taiwan |
20,446 | 15,711 | 18,527 | |||||||||
| Sweden |
15,096 | 11,292 | 13,002 | |||||||||
| Austria |
14,583 | 8,170 | 13,062 | |||||||||
| Australia |
13,973 | 9,124 | 15,939 | |||||||||
| South Korea |
13,598 | 9,928 | 11,013 | |||||||||
| Mexico |
11,431 | 11,029 | 14,028 | |||||||||
| Argentina |
11,334 | 10,854 | 17,174 | |||||||||
| Poland |
10,836 | 15,537 | 26,934 | |||||||||
| All other countries |
94,114 | 68,581 | 105,555 | |||||||||
| $ | 1,228,425 | $ | 968,004 | $ | 1,226,033 | |||||||
During the years ended December 31, 2010, 2009 and 2008, no single customer accounted for 10% or more of our total operating revenues.
| December 31, | ||||||||||||
| 2010 | 2009 | 2008 | ||||||||||
| (in thousands) | ||||||||||||
| Long-lived Assets: |
||||||||||||
| United States |
$ | 334,081 | $ | 317,719 | $ | 303,278 | ||||||
| Germany |
47,059 | 42,724 | 39,361 | |||||||||
| Japan |
1,582 | 482 | 6,699 | |||||||||
| France |
136,449 | 125,839 | 108,665 | |||||||||
| The Netherlands |
12,539 | 36,971 | 34,018 | |||||||||
| Brazil |
78,260 | 64,385 | 48,237 | |||||||||
| China |
3,190 | 2,334 | 2,317 | |||||||||
| All other countries |
4,593 | 964 | 11,685 | |||||||||
| $ | 617,753 | $ | 591,418 | $ | 554,260 | |||||||
F-39
Table of Contents
KRATON PERFORMANCE POLYMERS, INC.
Notes to Consolidated Financial Statements—(Continued)
13. Supplemental Guarantor Information
Kraton Polymers LLC and Kraton Polymers Capital Corporation, a financing subsidiary, collectively, the Issuers, are co-issuers of the 8.125% Notes. The Guarantor Subsidiaries include Elastomers Holdings LLC, a U.S. holding company, and Kraton Polymers U.S. LLC, a U.S. operating subsidiary, collectively, the Guarantor Subsidiaries, fully and unconditionally guarantee on a joint and several basis, the Issuers’ obligations under the 8.125% Notes. Our remaining subsidiaries are not guarantors of the 8.125% Notes. We do not believe that separate financial statements and other disclosures concerning the Guarantor Subsidiaries would provide any additional information that would be material to investors in making an investment decision. See Note 16 Subsequent Event for further discussion.
F-40
Table of Contents
KRATON PERFORMANCE POLYMERS, INC.
CONSOLIDATING BALANCE SHEET
December 31, 2010
(In thousands, except par value)
| Kraton Performance Polymers(1) |
Kraton(2) | Guarantor Subsidiaries |
Non-Guarantor Subsidiaries |
Eliminations | Consolidated | |||||||||||||||||||
| ASSETS |
||||||||||||||||||||||||
| Current Assets |
||||||||||||||||||||||||
| Cash and cash equivalents |
$ | — | $ | — | $ | 31,421 | $ | 61,329 | $ | — | $ | 92,750 | ||||||||||||
| Receivables, net of allowance |
731 | 161 | 48,623 | 86,617 | — | 136,132 | ||||||||||||||||||
| Inventories of products, net |
— | — | 171,989 | 153,131 | — | 325,120 | ||||||||||||||||||
| Inventories of materials and supplies, net |
— | — | 6,988 | 2,643 | — | 9,631 | ||||||||||||||||||
| Other current assets |
— | 2,933 | 728 | 35,088 | — | 38,749 | ||||||||||||||||||
| Total current assets |
731 | 3,094 | 259,749 | 338,808 | — | 602,382 | ||||||||||||||||||
| Property, plant and equipment, less accumulated depreciation |
— | 75,632 | 186,611 | 103,123 | — | 365,366 | ||||||||||||||||||
| Identifiable intangible assets, less accumulated amortization |
— | 54,528 | 15,933 | — | — | 70,461 | ||||||||||||||||||
| Investment in consolidated subsidiaries |
431,001 | 1,064,238 | — | — | (1,495,239 | ) | — | |||||||||||||||||
| Investment in unconsolidated joint venture |
— | 813 | — | 12,776 | — | 13,589 | ||||||||||||||||||
| Deferred financing costs |
— | 3,172 | — | — | — | 3,172 | ||||||||||||||||||
| Deferred income taxes |
— | — | — | 2,376 | (2,376 | ) | — | |||||||||||||||||
| Other long-term assets |
— | 439 | 514,860 | 196,866 | (686,412 | ) | 25,753 | |||||||||||||||||
| Total Assets |
$ | 431,732 | $ | 1,201,916 | $ | 977,153 | $ | 653,949 | $ | (2,184,027 | ) | $ | 1,080,723 | |||||||||||
| LIABILITIES AND STOCKHOLDERS’ AND MEMBER’S EQUITY |
||||||||||||||||||||||||
| Current Liabilities |
||||||||||||||||||||||||
| Current portion of long-term debt |
— | 2,304 | — | — | — | 2,304 | ||||||||||||||||||
| Accounts payable-trade |
— | — | 51,653 | 35,046 | — | 86,699 | ||||||||||||||||||
| Deferred income taxes |
— | — | — | 595 | — | 595 | ||||||||||||||||||
| Other payables and accruals |
— | 7,967 | 27,864 | 24,951 | — | 60,782 | ||||||||||||||||||
| Due to related party |
— | — | — | 19,264 | — | 19,264 | ||||||||||||||||||
| Total current liabilities |
— | 10,271 | 79,517 | 79,856 | — | 169,644 | ||||||||||||||||||
| Long-term debt, net of current portion |
250 | 380,121 | — | — | — | 380,371 | ||||||||||||||||||
| Deferred income taxes |
— | 16,465 | — | — | (2,376 | ) | 14,089 | |||||||||||||||||
| Long-term liabilities |
— | 363,333 | 69,784 | 317,537 | (686,412 | ) | 64,242 | |||||||||||||||||
| Total liabilities |
250 | 770,190 | 149,301 | 397,393 | (688,788 | ) | 628,346 | |||||||||||||||||
| Commitments and contingencies (note 9) |
||||||||||||||||||||||||
| Stockholders’ and Member’s equity |
||||||||||||||||||||||||
| Preferred stock, $.01 par value; 100,000 shares authorized; none issued |
— | — | — | — | — | — | ||||||||||||||||||
| Common stock, $.01 par value; 500,000 shares authorized; 31,390 shares issued and outstanding |
314 | — | — | — | — | 314 | ||||||||||||||||||
| Additional paid in capital |
334,457 | — | — | — | — | 334,457 | ||||||||||||||||||
| Member’s equity |
— | 431,001 | 855,209 | 209,029 | (1,495,239 | ) | — | |||||||||||||||||
| Retained earnings |
96,711 | — | — | — | — | 96,711 | ||||||||||||||||||
| Accumulated other comprehensive income |
— | 725 | (27,357 | ) | 47,527 | — | 20,895 | |||||||||||||||||
| Total stockholders’ and member’s equity |
431,482 | 431,726 | 827,852 | 256,556 | (1,495,239 | ) | 452,377 | |||||||||||||||||
| Total Liabilities and Stockholders’ and Member’s Equity |
$ | 431,732 | $ | 1,201,916 | $ | 977,153 | $ | 653,949 | $ | (2,184,027 | ) | $ | 1,080,723 | |||||||||||
| (1) | Kraton Performance Polymers, Inc. and Polymer Holdings Capital Corporation are the issuers of the 12% Discount Notes. Polymer Holdings Capital Corporation has minimal assets and income. We do not believe that separate financial information concerning the issuers would provide information that would be useful. |
| (2) | Kraton Polymers LLC and Kraton Polymers Capital Corporation are the issuers of the 8.125% Notes. Kraton Polymers Capital Corporation has minimal assets and income. We do not believe that separate financial information concerning the Issuers would provide additional information that would be useful. |
F-41
Table of Contents
KRATON PERFORMANCE POLYMERS, INC.
CONSOLIDATING BALANCE SHEET
December 31, 2009
(In thousands, except par value)
| Kraton Performance Polymers(1) |
Kraton(2) | Guarantor Subsidiaries |
Non-Guarantor Subsidiaries |
Eliminations | Consolidated | |||||||||||||||||||
| ASSETS |
||||||||||||||||||||||||
| Current Assets |
||||||||||||||||||||||||
| Cash and cash equivalents |
$ | — | $ | — | $ | 36,567 | $ | 32,724 | $ | — | $ | 69,291 | ||||||||||||
| Receivables, net of allowance |
— | — | 41,194 | 74,135 | — | 115,329 | ||||||||||||||||||
| Inventories of products, net |
— | — | 124,003 | 160,255 | — | 284,258 | ||||||||||||||||||
| Inventories of materials and supplies, net |
— | — | 6,830 | 4,032 | — | 10,862 | ||||||||||||||||||
| Deferred income taxes |
— | — | — | 3,107 | — | 3,107 | ||||||||||||||||||
| Other current assets |
— | 1,086 | 1,421 | 14,263 | — | 16,770 | ||||||||||||||||||
| Total current assets |
— | 1,086 | 210,015 | 288,516 | — | 499,617 | ||||||||||||||||||
| Property, plant and equipment, less accumulated depreciation |
— | 85,284 | 171,024 | 98,552 | — | 354,860 | ||||||||||||||||||
| Identifiable intangible assets, less accumulated amortization |
— | 13,541 | 15,322 | 46,938 | — | 75,801 | ||||||||||||||||||
| Investment in consolidated subsidiaries |
312,164 | 971,995 | — | — | (1,284,159 | ) | — | |||||||||||||||||
| Investment in unconsolidated joint venture |
— | 813 | — | 11,265 | — | 12,078 | ||||||||||||||||||
| Deferred financing costs |
— | 7,309 | — | 9 | — | 7,318 | ||||||||||||||||||
| Deferred income taxes |
34 | — | — | — | (34 | ) | — | |||||||||||||||||
| Other long-term assets |
— | 1,142 | 468,794 | 95,054 | (540,165 | ) | 24,825 | |||||||||||||||||
| Total Assets |
$ | 312,198 | $ | 1,081,170 | $ | 865,155 | $ | 540,334 | $ | (1,824,358 | ) | $ | 974,499 | |||||||||||
| LIABILITIES AND STOCKHOLDERS’ AND MEMBER’S EQUITY |
||||||||||||||||||||||||
| Current Liabilities |
||||||||||||||||||||||||
| Current portion of long-term debt |
$ | — | $ | 2,304 | $ | — | $ | — | $ | — | $ | 2,304 | ||||||||||||
| Accounts payable-trade |
— | 2,699 | 37,732 | 53,063 | — | 93,494 | ||||||||||||||||||
| Other payables and accruals |
— | 18,251 | 15,010 | 35,118 | (108 | ) | 68,271 | |||||||||||||||||
| Due to related party |
— | — | — | 19,006 | — | 19,006 | ||||||||||||||||||
| Total current liabilities |
— | 23,254 | 52,742 | 107,187 | (108 | ) | 183,075 | |||||||||||||||||
| Long-term debt, net of current portion |
250 | 382,425 | — | — | — | 382,675 | ||||||||||||||||||
| Deferred income taxes |
— | 12,858 | — | 630 | — | 13,488 | ||||||||||||||||||
| Long-term liabilities |
— | 351,353 | 47,494 | 187,721 | (540,091 | ) | 46,477 | |||||||||||||||||
| Total liabilities |
250 | 769,890 | 100,236 | 295,538 | (540,199 | ) | 625,715 | |||||||||||||||||
| Commitments and contingencies (note 9) |
||||||||||||||||||||||||
| Stockholders’ and Member’s equity |
||||||||||||||||||||||||
| Preferred stock, $0.01 par value; 100,000 shares authorized; none issued |
||||||||||||||||||||||||
| Common stock, $0.01 par value; 500,000 shares authorized; 29,709 shares issued and outstanding |
297 | — | — | — | — | 297 | ||||||||||||||||||
| Additional paid in capital |
311,665 | — | — | — | — | 311,665 | ||||||||||||||||||
| Member’s equity |
— | 312,164 | 775,493 | 196,502 | (1,284,159 | ) | — | |||||||||||||||||
| Retained earnings |
(14 | ) | — | — | — | — | (14 | ) | ||||||||||||||||
| Accumulated other comprehensive income |
— | (884 | ) | (10,574 | ) | 48,294 | — | 36,836 | ||||||||||||||||
| Total stockholders’ and member’s equity |
311,948 | 311,280 | 764,919 | 244,796 | (1,284,159 | ) | 348,784 | |||||||||||||||||
| Total Liabilities and Stockholders’ and Member’s Equity |
$ | 312,198 | $ | 1,081,170 | $ | 865,155 | $ | 540,334 | $ | (1,824,358 | ) | $ | 974,499 | |||||||||||
| (1) | Kraton Performance Polymers, Inc. and Polymer Holdings Capital Corporation are the issuers of the 12% Discount Notes. Polymer Holdings Capital Corporation has minimal assets and income. We do not believe that separate financial information concerning the issuers would provide information that would be useful. |
| (2) | Kraton Polymers LLC and Kraton Polymers Capital Corporation are the issuers of the 8.125% Notes. Kraton Polymers Capital Corporation has minimal assets and income. We do not believe that separate financial information concerning the Issuers would provide additional information that would be useful. |
F-42
Table of Contents
KRATON PERFORMANCE POLYMERS, INC.
CONSOLIDATING STATEMENT OF OPERATIONS
Year Ended December 31, 2010
(In thousands)
| Kraton Performance Polymers(1) |
Kraton(2) | Guarantor Subsidiaries |
Non-Guarantor Subsidiaries |
Eliminations | Consolidated | |||||||||||||||||||
| Operating Revenues |
||||||||||||||||||||||||
| Sales |
$ | — | $ | — | $ | 632,234 | $ | 721,004 | $ | (124,813 | ) | $ | 1,228,425 | |||||||||||
| Total operating revenues |
— | — | 632,234 | 721,004 | (124,813 | ) | 1,228,425 | |||||||||||||||||
| Cost of Goods Sold |
— | 297 | 455,287 | 597,161 | (124,813 | ) | 927,932 | |||||||||||||||||
| Gross Profit |
— | (297 | ) | 176,947 | 123,843 | — | 300,493 | |||||||||||||||||
| Operating Expenses |
||||||||||||||||||||||||
| Research and development expenses |
— | — | 14,616 | 9,012 | — | 23,628 | ||||||||||||||||||
| Selling, general and administrative expenses |
— | (2,414 | ) | 66,134 | 28,585 | — | 92,305 | |||||||||||||||||
| Depreciation |
— | 14,901 | 24,983 | 9,336 | — | 49,220 | ||||||||||||||||||
| Total operating expenses |
— | 12,487 | 105,733 | 46,933 | — | 165,153 | ||||||||||||||||||
| Earnings in consolidated subsidiaries |
96,759 | 88,799 | — | — | (185,558 | ) | — | |||||||||||||||||
| Earnings of Unconsolidated Joint Venture |
— | — | — | 487 | — | 487 | ||||||||||||||||||
| Interest Expense (Income), net |
— | 32,948 | (12,169 | ) | 3,190 | — | 23,969 | |||||||||||||||||
| Income Before Income Taxes |
96,759 | 43,067 | 83,383 | 74,207 | (185,558 | ) | 111,858 | |||||||||||||||||
| Income Tax Expense (Benefit) |
34 | (53,692 | ) | 7,141 | 61,650 | — | 15,133 | |||||||||||||||||
| Net Income |
$ | 96,725 | $ | 96,759 | $ | 76,242 | $ | 12,557 | $ | (185,558 | ) | $ | 96,725 | |||||||||||
| (1) | Kraton Performance Polymers, Inc. and Polymer Holdings Capital Corporation are the issuers of the 12% Discount Notes. Polymer Holdings Capital Corporation has minimal assets and income. We do not believe that separate financial information concerning the issuers would provide information that would be useful. |
| (2) | Kraton Polymers LLC and Kraton Polymers Capital Corporation are the issuers of the 8.125% Notes. Kraton Polymers Capital Corporation has minimal assets and income. We do not believe that separate financial information concerning the Issuers would provide additional information that would be useful. |
F-43
Table of Contents
KRATON PERFORMANCE POLYMERS, INC.
CONSOLIDATING STATEMENT OF OPERATIONS
Year Ended December 31, 2009
(In thousands)
| Kraton Performance Polymers(1) |
Kraton(2) | Guarantor Subsidiaries |
Non-Guarantor Subsidiaries |
Eliminations | Consolidated | |||||||||||||||||||
| Operating Revenues |
||||||||||||||||||||||||
| Sales |
$ | — | $ | — | $ | 480,438 | $ | 591,309 | $ | (151,385 | ) | $ | 920,362 | |||||||||||
| Other |
— | — | 74 | 47,568 | — | 47,642 | ||||||||||||||||||
| Total operating revenues |
— | — | 480,512 | 638,877 | (151,385 | ) | 968,004 | |||||||||||||||||
| Cost of Goods Sold |
— | (15,654 | ) | 376,543 | 582,968 | (151,385 | ) | 792,472 | ||||||||||||||||
| Gross Profit |
— | 15,654 | 103,969 | 55,909 | — | 175,532 | ||||||||||||||||||
| Operating Expenses |
||||||||||||||||||||||||
| Research and development expenses |
— | — | 13,150 | 8,062 | — | 21,212 | ||||||||||||||||||
| Selling, general and administrative expenses |
— | (1,430 | ) | 45,497 | 35,437 | — | 79,504 | |||||||||||||||||
| Depreciation |
— | 22,039 | 21,598 | 23,114 | — | 66,751 | ||||||||||||||||||
| Total operating expenses |
— | 20,609 | 80,245 | 66,613 | — | 167,467 | ||||||||||||||||||
| Gain on Extinguishment of Debt |
— | 23,831 | — | — | — | 23,831 | ||||||||||||||||||
| Earnings in consolidated subsidiaries |
(288 | ) | 29,893 | — | — | (29,605 | ) | — | ||||||||||||||||
| Earnings of Unconsolidated Joint Venture |
— | — | — | 403 | — | 403 | ||||||||||||||||||
| Interest Expense (Income), net |
5 | 40,818 | (11,156 | ) | 4,289 | — | 33,956 | |||||||||||||||||
| Income (Loss) Before Income Taxes |
(293 | ) | 7,951 | 34,880 | (14,590 | ) | (29,605 | ) | (1,657 | ) | ||||||||||||||
| Income Tax Expense (Benefit) |
(3 | ) | 8,239 | (876 | ) | (8,727 | ) | — | (1,367 | ) | ||||||||||||||
| Net Income (Loss) |
$ | (290 | ) | $ | (288 | ) | $ | 35,756 | $ | (5,863 | ) | $ | (29,605 | ) | $ | (290 | ) | |||||||
| (1) | Kraton Performance Polymers, Inc. and Polymer Holdings Capital Corporation are the issuers of the 12% Discount Notes. Polymer Holdings Capital Corporation has minimal assets and income. We do not believe that separate financial information concerning the issuers would provide information that would be useful. |
| (2) | Kraton Polymers LLC and Kraton Polymers Capital Corporation are the issuers of the 8.125% Notes. Kraton Polymers Capital Corporation has minimal assets and income. We do not believe that separate financial information concerning the Issuers would provide additional information that would be useful. |
F-44
Table of Contents
KRATON PERFORMANCE POLYMERS, INC.
CONSOLIDATING STATEMENT OF OPERATIONS
Year Ended December 31, 2008
(In thousands)
| Kraton Performance Polymers(1) |
Kraton(2) | Guarantor Subsidiaries |
Non-Guarantor Subsidiaries |
Eliminations | Consolidated | |||||||||||||||||||
| Operating Revenues |
||||||||||||||||||||||||
| Sales |
$ | — | $ | — | $ | 607,428 | $ | 750,165 | $ | (186,340 | ) | $ | 1,171,253 | |||||||||||
| Other |
— | — | — | 54,780 | — | 54,780 | ||||||||||||||||||
| Total operating revenues |
— | — | 607,428 | 804,945 | (186,340 | ) | 1,226,033 | |||||||||||||||||
| Cost of Goods Sold |
— | 2,356 | 467,079 | 688,188 | (186,340 | ) | 971,283 | |||||||||||||||||
| Gross Profit |
— | (2,356 | ) | 140,349 | 116,757 | — | 254,750 | |||||||||||||||||
| Operating Expenses |
||||||||||||||||||||||||
| Research and development expenses |
— | — | 15,829 | 11,220 | — | 27,049 | ||||||||||||||||||
| Selling, general and administrative expenses |
— | 902 | 52,729 | 47,800 | — | 101,431 | ||||||||||||||||||
| Depreciation |
— | 18,127 | 21,676 | 13,359 | — | 53,162 | ||||||||||||||||||
| Total operating expenses |
— | 19,029 | 90,234 | 72,379 | — | 181,642 | ||||||||||||||||||
| Earnings in consolidated subsidiaries |
28,434 | 85,848 | — | — | (114,282 | ) | — | |||||||||||||||||
| Earnings of Unconsolidated Joint Venture |
— | — | — | 437 | — | 437 | ||||||||||||||||||
| Interest Expense (Income), net |
24 | 39,394 | (10,576 | ) | 7,853 | — | 36,695 | |||||||||||||||||
| Income Before Income Taxes |
28,410 | 25,069 | 60,691 | 36,962 | (114,282 | ) | 36,850 | |||||||||||||||||
| Income Tax Expense (Benefit) |
(9 | ) | (3,365 | ) | 220 | 11,585 | — | 8,431 | ||||||||||||||||
| Net Income |
$ | 28,419 | $ | 28,434 | $ | 60,471 | $ | 25,377 | $ | (114,282 | ) | $ | 28,419 | |||||||||||
| (1) | Kraton Performance Polymers, Inc. and Polymer Holdings Capital Corporation are the issuers of the 12% Discount Notes. Polymer Holdings Capital Corporation has minimal assets and income. We do not believe that separate financial information concerning the issuers would provide information that would be useful. |
| (2) | Kraton Polymers LLC and Kraton Polymers Capital Corporation are the issuers of the 8.125% Notes. Kraton Polymers Capital Corporation has minimal assets and income. We do not believe that separate financial information concerning the Issuers would provide additional information that would be useful. |
F-45
Table of Contents
KRATON PERFORMANCE POLYMERS, INC.
CONSOLIDATED STATEMENT OF CASH FLOWS
Year Ended December 31, 2010
(In thousands)
| Kraton Performance Polymers(1) |
Kraton(2) | Guarantor Subsidiaries |
Non-Guarantor Subsidiaries |
Eliminations | Consolidated | |||||||||||||||||||
| Cash flows provided by (used in) operating activities |
$ | — | $ | (20,392 | ) | $ | 57,625 | $ | 18,127 | $ | — | $ | 55,360 | |||||||||||
| Cash flows provided by (used in) investing activities |
||||||||||||||||||||||||
| Proceeds from (payments on) intercompany loans |
— | 3,928 | — | — | (3,928 | ) | — | |||||||||||||||||
| Purchase of plant and equipment, net of proceeds from sales of equipment |
— | — | (38,938 | ) | (14,467 | ) | — | (53,405 | ) | |||||||||||||||
| Purchase of software |
— | — | (2,242 | ) | — | — | (2,242 | ) | ||||||||||||||||
| Net cash provided by (used in) investing activities |
— | 3,928 | (41,180 | ) | (14,467 | ) | (3,928 | ) | (55,647 | ) | ||||||||||||||
| Cash flows provided by (used in) financing activities |
||||||||||||||||||||||||
| Proceeds from debt |
— | 69,000 | — | — | — | 69,000 | ||||||||||||||||||
| Repayment of debt |
— | (71,304 | ) | — | — | — | (71,304 | ) | ||||||||||||||||
| Cash contribution from member |
— | 18,637 | — | — | (18,637 | ) | — | |||||||||||||||||
| Cash distribution to member |
(18,637 | ) | — | — | — | 18,637 | — | |||||||||||||||||
| Proceeds from issuance of common stock |
11,197 | — | — | — | — | 11,197 | ||||||||||||||||||
| Costs associated with the issuance of common stock |
(534 | ) | — | — | — | — | (534 | ) | ||||||||||||||||
| Proceeds from the exercise of stock options |
7,974 | — | — | — | — | 7,974 | ||||||||||||||||||
| Proceeds from insurance note payable |
— | 3,518 | — | — | — | 3,518 | ||||||||||||||||||
| Repayment of insurance note payable |
— | (3,387 | ) | — | — | — | (3,387 | ) | ||||||||||||||||
| Proceeds from (payments on) intercompany loans |
— | — | (21,592 | ) | 17,664 | 3,928 | — | |||||||||||||||||
| Net cash provided by (used in) financing activities |
— | 16,464 | (21,592 | ) | 17,664 | 3,928 | 16,464 | |||||||||||||||||
| Effect of exchange rate difference on cash |
— | — | — | 7,282 | — | 7,282 | ||||||||||||||||||
| Net increase (decrease) in cash and cash equivalents |
— | — | (5,147 | ) | 28,606 | — | 23,459 | |||||||||||||||||
| Cash and cash equivalents at beginning of period |
— | — | 36,567 | 32,724 | — | 69,291 | ||||||||||||||||||
| Cash and cash equivalents at end of period |
$ | — | $ | — | $ | 31,420 | $ | 61,330 | $ | — | $ | 92,750 | ||||||||||||
| (1) | Kraton Performance Polymers, Inc. and Polymer Holdings Capital Corporation are the issuers of the 12% Discount Notes. Polymer Holdings Capital Corporation has minimal assets and income. We do not believe that separate financial information concerning the issuers would provide information that would be useful. |
| (2) | Kraton Polymers LLC and Kraton Polymers Capital Corporation are the issuers of the 8.125% Notes. Kraton Polymers Capital Corporation has minimal assets and income. We do not believe that separate financial information concerning the Issuers would provide additional information that would be useful. |
F-46
Table of Contents
KRATON PERFORMANCE POLYMERS, INC.
CONSOLIDATED STATEMENT OF CASH FLOWS
Year Ended December 31, 2009
(In thousands)
| Kraton Performance Polymers(1) |
Kraton(2) | Guarantor Subsidiaries |
Non-Guarantor Subsidiaries |
Eliminations | Consolidated | |||||||||||||||||||
| Cash flows provided by (used in) operating activities |
$ | — | $ | (39,221 | ) | $ | 53,247 | $ | 58,779 | $ | — | $ | 72,805 | |||||||||||
| Cash flows provided by (used in) investing activities |
||||||||||||||||||||||||
| Proceeds from (payments on) intercompany loans |
— | 79,843 | — | — | (79,843 | ) | — | |||||||||||||||||
| Purchase of plant and equipment, net of proceeds from sales of equipment |
— | — | (28,226 | ) | (6,005 | ) | — | (34,231 | ) | |||||||||||||||
| Purchase of software |
— | — | (15,322 | ) | — | — | (15,322 | ) | ||||||||||||||||
| Net cash provided by (used in) investing activities |
— | 79,843 | (43,548 | ) | (6,005 | ) | (79,843 | ) | (49,553 | ) | ||||||||||||||
| Cash flows used in financing activities |
||||||||||||||||||||||||
| Proceeds from debt |
— | 144,000 | — | — | — | 144,000 | ||||||||||||||||||
| Repayment of debt |
— | (308,131 | ) | — | — | — | (308,131 | ) | ||||||||||||||||
| Cash contribution from member |
— | 126,725 | — | — | (126,725 | ) | — | |||||||||||||||||
| Cash distribution to member |
(126,725 | ) | — | — | — | 126,725 | — | |||||||||||||||||
| Proceeds from issuance of common stock |
126,725 | — | — | — | — | 126,725 | ||||||||||||||||||
| Proceeds from insurance note payable |
— | 3,706 | — | — | — | 3,706 | ||||||||||||||||||
| Repayment of insurance note payable |
— | (3,706 | ) | — | — | — | (3,706 | ) | ||||||||||||||||
| Deferred financing costs |
— | (3,216 | ) | — | — | — | (3,216 | ) | ||||||||||||||||
| Proceeds from (payments on) intercompany loans |
— | — | (38,592 | ) | (41,251 | ) | 79,843 | — | ||||||||||||||||
| Net cash used in financing activities |
— | (40,622 | ) | (38,592 | ) | (41,251 | ) | 79,843 | (40,622 | ) | ||||||||||||||
| Effect of exchange rate difference on cash |
— | — | — | (14,735 | ) | — | (14,735 | ) | ||||||||||||||||
| Net decrease in cash and cash equivalents |
— | — | (28,893 | ) | (3,212 | ) | — | (32,105 | ) | |||||||||||||||
| Cash and cash equivalents at beginning of period |
— | — | 65,460 | 35,936 | — | 101,396 | ||||||||||||||||||
| Cash and cash equivalents at end of period |
$ | — | $ | — | $ | 36,567 | $ | 32,724 | $ | — | $ | 69,291 | ||||||||||||
| (1) | Kraton Performance Polymers, Inc. and Polymer Holdings Capital Corporation are the issuers of the 12% Discount Notes. Polymer Holdings Capital Corporation has minimal assets and income. We do not believe that separate financial information concerning the issuers would provide information that would be useful. |
| (2) | Kraton Polymers LLC and Kraton Polymers Capital Corporation are the issuers of the 8.125% Notes. Kraton Polymers Capital Corporation has minimal assets and income. We do not believe that separate financial information concerning the Issuers would provide additional information that would be useful. |
F-47
Table of Contents
KRATON PERFORMANCE POLYMERS, INC.
CONSOLIDATED STATEMENT OF CASH FLOWS
Year Ended December 31, 2008
(In thousands)
| Kraton Performance Polymers(1) |
Kraton(2) | Guarantor Subsidiaries |
Non-Guarantor Subsidiaries |
Eliminations | Consolidated | |||||||||||||||||||
| Cash flows provided by (used in) operating activities |
$ | — | $ | (7,968 | ) | $ | 83,530 | $ | (35,335 | ) | $ | — | $ | 40,227 | ||||||||||
| Cash flows provided by (used in) investing activities |
||||||||||||||||||||||||
| Purchase of plant and equipment, net of proceeds from sales of equipment |
— | — | (19,123 | ) | (4,944 | ) | — | (24,067 | ) | |||||||||||||||
| Proceeds from (payments on) intercompany loans |
— | (38,144 | ) | — | — | 38,144 | — | |||||||||||||||||
| Net cash provided by (used in) investing activities |
— | (38,144 | ) | (19,123 | ) | (4,944 | ) | 38,144 | (24,067 | ) | ||||||||||||||
| Cash flows provided by (used in) financing activities |
||||||||||||||||||||||||
| Proceeds from debt |
— | 316,250 | — | — | — | 316,250 | ||||||||||||||||||
| Repayment of debt |
— | (279,644 | ) | — | — | — | (279,644 | ) | ||||||||||||||||
| Cash contribution from member |
— | 10,000 | — | — | — | 10,000 | ||||||||||||||||||
| Proceeds from insurance note payable |
— | 4,731 | — | — | — | 4,731 | ||||||||||||||||||
| Repayment of insurance note payable |
— | (5,225 | ) | — | — | — | (5,225 | ) | ||||||||||||||||
| Proceeds from (payments on) intercompany loans |
— | — | (10,099 | ) | 48,243 | (38,144 | ) | — | ||||||||||||||||
| Net cash provided by (used in) financing activities |
— | 46,112 | (10,099 | ) | 48,243 | (38,144 | ) | 46,112 | ||||||||||||||||
| Effect of exchange rate difference on cash |
— | — | — | (9,153 | ) | — | (9,153 | ) | ||||||||||||||||
| Net increase (decrease) in cash and cash equivalents |
— | — | 54,308 | (1,189 | ) | — | 53,119 | |||||||||||||||||
| Cash and cash equivalents at beginning of period |
— | — | 11,152 | 37,125 | — | 48,277 | ||||||||||||||||||
| Cash and cash equivalents at end of period |
$ | — | $ | — | $ | 65,460 | $ | 35,936 | $ | — | $ | 101,396 | ||||||||||||
| (1) | Kraton Performance Polymers, Inc. and Polymer Holdings Capital Corporation are the issuers of the 12% Discount Notes. Polymer Holdings Capital Corporation has minimal assets and income. We do not believe that separate financial information concerning the issuers would provide information that would be useful. |
| (2) | Kraton Polymers LLC and Kraton Polymers Capital Corporation are the issuers of the 8.125% Notes. Kraton Polymers Capital Corporation has minimal assets and income. We do not believe that separate financial information concerning the Issuers would provide additional information that would be useful. |
F-48
Table of Contents
KRATON PERFORMANCE POLYMERS, INC.
Notes to Consolidated Financial Statements—(Continued)
14. Financial Instruments and Credit Risk
Financial Instruments
Interest Rate Swap Agreements. Periodically, we enter into interest rate swap agreements to hedge or otherwise protect against Eurodollar interest rate fluctuations on our variable rate debt. These interest rate swap agreements are designated as cash flow hedges on the exposure of the variability of future cash flows.
In February 2008, we entered into a $325 million notional amount interest rate swap agreement. The agreement had a fixed rate of 2.77%, therefore, including the 2.00% margin on the term loan agreement, our hedged fixed rate was 4.77% through April 1, 2010. We settled the swap early in June 2008 in advance of the scheduled maturity, resulting in a gain on sale of $4.6 million. The gain was deferred in accumulated other comprehensive income and was being reclassified as a reduction in interest expense through March 31, 2010 using the effective interest method. We reclassified $0.5 million for the twelve months ended December 31, 2010 and $2.9 million for the year ended December 31, 2009 into earnings, respectively.
In October 2008, we entered into a $320 million notional amount interest rate swap agreement. The agreement had a term through December 31, 2009, and had a fixed rate of 2.99%, therefore, including the margin of 2.00% on the term loan agreement, our hedged fixed rate was 4.99%. We settled the swap on December 31, 2009 and recorded a loss of $2.2 million.
In May 2009, we entered into a $310 million notional amount interest rate swap agreement. This agreement was effective on January 4, 2010 and expires on January 3, 2011 and has a fixed rate of 1.53%, therefore, including the margin of 2.00% on the term loan agreement, our hedged fixed rate is 3.53%. In December 2009, we made a $100.0 million payment of outstanding indebtedness under the Term Loans reducing the principal amount outstanding from approximately $323.0 million to $223.0 million. As a result, we were required to discontinue hedge accounting prospectively as the hedging relationship fails to meet all of the criteria set forth in ASC 815, “Derivatives and Hedging” specifically the notional amount of the swap and the principal amount of the debt are no longer equal and the forecasted transaction is no longer probable of occurring based on the original hedge documentation. We have elected to re-designate the cash flow hedge relationship for approximately $218.0 million notional amount out of the total $310.0 million notional amount interest rate swap agreement. We recorded interest expense of $3.1 million and $0.8 million related to the ineffective portion and a gain of $2.1 million and a loss of $1.9 million in accumulated other comprehensive income related to the effective portion of the hedge for the years ended December 31, 2010 and 2009, respectively.
In June 2010, we entered into a $215.0 million notional amount interest rate swap agreement to hedge or otherwise protect against Eurodollar interest rate fluctuations on a portion of our variable rate debt. This agreement will be effective on January 3, 2011 and expires on January 3, 2012 and has a fixed rate of 0.87%, therefore, including the 2.00% margin on the term loan agreement, our hedged fixed rate will be 2.87%. We recorded an unrealized loss of $1.1 million in accumulated other comprehensive income related to the effective portion of this hedge for the year ended December 31, 2010. On February 10, 2011, in connection with the refinancing of our existing indebtedness, we terminated and settled the interest rate swap prior to its expiration date and as a result recognized interest expense of $1.0 million.
Net Investment Hedges. In May 2010, we entered into multiple non-deliverable forward contracts to reduce our exposure to fluctuations in the Brazilian Real to the U.S. dollar associated with the funding of the debottleneck and expansion of our isoprene rubber latex capacity at our Paulina, Brazil, plant, for the notional amounts of R$2.7 million, R$7.1 million, and R$7.8 million with expiration dates of June 30, September 30, and December 31, 2010, respectively. The non-deliverable forward contracts qualify for hedge accounting and were
F-49
Table of Contents
KRATON PERFORMANCE POLYMERS, INC.
Notes to Consolidated Financial Statements—(Continued)
designated as net investment hedges in accordance with ASC 815-35 “Net Investment Hedges.” We have recorded a $0.9 million gain in accumulated other comprehensive income related to the effective portion of the hedge for the year ended December 31, 2010.
Foreign Currency Hedges. On April 3 and July 1, 2008 we entered into two foreign currency option contracts to reduce our exposure to fluctuations in the Euro to U.S. dollar exchange rate for notional amounts of €10 million and €20 million with expiration dates of June 26, and December 29, 2008, respectively. The option contracts do not qualify for hedge accounting. The April, 2008 option contract expired on June 26, 2008 and the July, 2008 option contract expired on December 29, 2008. The impact on our consolidated results of operations, financial position and cash flows was immaterial.
On February 18, 2009 we entered into a foreign currency option contract to reduce our exposure to fluctuations in the Euro to U.S. dollar exchange rate for a notional amount of €47.3 million which expired on December 29, 2009. The option contract did not qualify for hedge accounting. We settled the hedge on December 31, 2009, with a gain of $1.9 million which represented the mark-to-market impact of the purchased option contract. The gain was recorded in selling, general, and administrative expense on the Consolidated Statements of Operations.
Fair Value of Financial Instruments. ASC 820, “Fair Value Measurements and Disclosures” defines fair value, establishes a consistent framework for measuring fair value and expands disclosure requirements about fair value measurements. ASC 820 requires entities to, among other things, maximize the use of observable inputs and minimize the use of unobservable inputs when measuring fair value.
ASC 820 defines fair value as the exchange price that would be received for an asset or paid to transfer a liability (an exit price) in the principal or most advantageous market for the asset or liability in an orderly transaction between market participants on the measurement date.
ASC 820 specifies a hierarchy of valuation techniques based on whether the inputs to those valuation techniques are observable or unobservable. Observable inputs reflect market data obtained from independent sources, while unobservable inputs reflect our market assumptions. In accordance with ASC 820, these two types of inputs have created the following fair value hierarchy:
| • | Level 1—Quoted unadjusted prices for identical instruments in active markets. |
| • | Level 2—Quoted prices for similar instruments in active markets; quoted prices for identical or similar instruments in markets that are not active; and model-derived valuations in which all significant inputs and significant value drivers are observable in active markets. |
| • | Level 3—Model-derived valuations in which one or more significant inputs or significant value drivers are unobservable. |
The following table presents the carrying values and approximate fair values of our long-term debt at December 31, 2010 and December 31, 2009:
| December 31, 2010 | December 31, 2009 | |||||||||||||||
| Carrying Value |
Fair Value |
Carrying Value |
Fair Value |
|||||||||||||
| (in thousands) | ||||||||||||||||
| Revolving loans |
$ | — | $ | — | $ | — | $ | — | ||||||||
| Term loans |
219,425 | 219,425 | 221,729 | 221,729 | ||||||||||||
| 12.00% Discount notes |
250 | 324 | 250 | 250 | ||||||||||||
| 8.125% Notes |
163,000 | 164,630 | 163,000 | 146,089 | ||||||||||||
| 8.125% Notes Held as Treasury Bonds |
7,000 | 7,070 | 7,000 | 6,274 | ||||||||||||
F-50
Table of Contents
KRATON PERFORMANCE POLYMERS, INC.
Notes to Consolidated Financial Statements—(Continued)
The Term Loans and Revolving Loans are variable interest rate securities, and as such, the fair value approximates their carrying value.
The financial assets and liabilities measured at fair value on a recurring basis are included below:
| Fair Value Measurements at Reporting Date Using | ||||||||||||||||||
| Balance Sheet Location |
December 31, 2010 |
Quoted Prices in Active Markets for Identical Assets (Level 1) |
Significant Other Observable Inputs (Level 2) |
Significant Unobservable Inputs (Level 3) |
||||||||||||||
| (in thousands) | ||||||||||||||||||
| Derivative liabilities—2009 Interest rate swap |
Other payables and accruals | $ | 362 | $ | — | $ | 362 | $ | — | |||||||||
| Derivative liabilities—2010 Interest rate swap |
Other payables and accruals | $ | 1,073 | $ | — | $ | 1,073 | $ | — | |||||||||
| Fair Value Measurements at Reporting Date Using | ||||||||||||||||||
| Balance Sheet Location |
December 31, 2009 |
Quoted Prices in Active Markets for Identical Assets (Level 1) |
Significant Other Observable Inputs (Level 2) |
Significant Unobservable Inputs (Level 3) |
||||||||||||||
| (in thousands) | ||||||||||||||||||
| Derivative liabilities—2009 Interest rate swap |
Other payables and accruals | $ | 2,926 | $ | — | $ | 2,926 | $ | — | |||||||||
The use of derivatives creates exposure to credit risk relating to potential losses that could be recognized in the event that the counterparties to these instruments fail to perform their obligations under the contracts. We minimize this risk by limiting our counterparties to major financial institutions with acceptable credit ratings and monitoring positions with individual counterparties. In the event of a default by one of our counterparties, we may not receive payments provided for under the terms of our derivatives. We do not anticipate any defaults by our derivative instrument contract counterparties.
Credit Risk. Our customers are diversified by industry and geography with more than 700 customers in over 60 countries. We do not have concentrations of receivables from these industry sectors throughout these countries. The recent global economic downturn may affect our overall credit risk. Where exposed to credit risk, we analyze the counterparties’ financial condition prior to entering into an agreement, establishes credit limits and monitors the appropriateness of those limits on an ongoing basis. We also obtain cash, letters of credit or other acceptable forms of security from customers to provide credit support, where appropriate, based on our financial analysis of the customer and the contractual terms and conditions applicable to each transaction.
F-51
Table of Contents
KRATON PERFORMANCE POLYMERS, INC.
Notes to Consolidated Financial Statements—(Continued)
15. Selected Quarterly Financial Data (Unaudited)
The following table sets forth a summary of Kraton Performance Polymers, Inc.’s quarterly financial information for each of the four quarters ended December 31, 2010 and December 31, 2009:
| First Quarter(1) |
Second Quarter(2) |
Third Quarter(3) |
Fourth Quarter(4) |
Total | ||||||||||||||||
| (In thousands, except per share data) | ||||||||||||||||||||
| 2010 |
||||||||||||||||||||
| Operating revenues |
$ | 272,732 | $ | 332,086 | $ | 335,442 | $ | 288,165 | $ | 1,228,425 | ||||||||||
| Gross profit |
69,127 | 89,113 | 82,881 | 59,372 | 300,493 | |||||||||||||||
| Operating income |
30,035 | 49,800 | 38,910 | 16,595 | 135,340 | |||||||||||||||
| Net income |
19,795 | 38,595 | 28,036 | 10,299 | 96,725 | |||||||||||||||
| Earnings per common share |
||||||||||||||||||||
| Basic |
0.64 | 1.25 | 0.90 | 0.33 | 3.13 | |||||||||||||||
| Diluted |
0.64 | 1.24 | 0.88 | 0.32 | 3.07 | |||||||||||||||
| Weighted average common shares outstanding |
||||||||||||||||||||
| Basic |
30,539 | 30,668 | 30,916 | 31,147 | 30,825 | |||||||||||||||
| Diluted |
30,728 | 31,106 | 31,590 | 31,910 | 31,379 | |||||||||||||||
| 2009 |
||||||||||||||||||||
| Operating revenues |
$ | 184,957 | $ | 243,821 | $ | 288,518 | $ | 250,708 | $ | 968,004 | ||||||||||
| Gross profit |
8,934 | 35,761 | 69,969 | 60,868 | 175,532 | |||||||||||||||
| Operating income |
(26,849 | ) | 96 | 28,135 | 6,683 | 8,065 | ||||||||||||||
| Net income (loss) |
(16,461 | ) | (4,178 | ) | 21,865 | (1,516 | ) | (290 | ) | |||||||||||
| Earnings (loss) per common share |
||||||||||||||||||||
| Basic |
(0.85 | ) | (0.22 | ) | 1.13 | (0.07 | ) | (0.01 | ) | |||||||||||
| Diluted |
(0.85 | ) | (0.22 | ) | 1.12 | (0.07 | ) | (0.01 | ) | |||||||||||
| Weighted average common shares outstanding |
||||||||||||||||||||
| Basic |
19,385 | 19,383 | 19,386 | 21,064 | 19,808 | |||||||||||||||
| Diluted |
19,385 | 19,383 | 19,449 | 21,064 | 19,808 | |||||||||||||||
| (1) | During the first quarter of 2010, we recorded a $1.3 million reduction of depreciation associated with exiting the Pernis, the Netherlands facilities two months earlier than anticipated, which is included in Depreciation and Amortization of Identifiable Intangibles. In addition, we recognized costs of $0.2 million associated with our European Office Consolidation, which is included in Selling, General and Administrative expenses. During the first quarter of 2009, we recorded a gain of $19.5 million associated with the purchase and retirement of a portion of the 8.125% senior subordinated notes, which is included in Gain on Extinguishment of Debt. |
| (2) | During the second quarter of 2010, we recognized costs of $0.6 million associated with our European Office Consolidation, which is included in Selling, General and Administrative expenses. During the second quarter of 2009, we recorded a gain of $4.3 million associated with the purchase and retirement of a portion of the 8.125% senior subordinated notes, which is included in Gain on Extinguishment of Debt. |
| (3) | During the third quarter of 2010, we recognized costs of $1.1 million associated with our European Office Consolidation as well as $0.8 million in costs associated with our secondary public offering, which are included in Selling, General and Administrative expenses. During the third quarter of 2009, we recorded restructuring costs of $6.0 million and a $1.1 million non-cash charge to write-down our inventory of spare-parts associated with the shutdown and exit from the Pernis, the Netherlands facilities, which are included in Cost of Goods Sold. |
| (4) | During the fourth quarter of 2010, we recognized costs of $2.7 million associated with our European Office Consolidation and $1.0 million of costs associated with evaluating an acquisition, which are included in Selling, General and Administrative expenses. During the fourth quarter of 2009, we recorded one-time accelerated depreciation of $14.3 million associated with the shutdown and exit from the Pernis, the Netherlands facilities, which is included in Depreciation and Amortization of Identifiable Intangibles. |
F-52
Table of Contents
KRATON PERFORMANCE POLYMERS, INC.
Notes to Consolidated Financial Statements—(Continued)
Basic and diluted earnings per share are computed independently for each of the quarters presented. Therefore, the sum of quarterly basic and diluted per share information may not equal annual basic and diluted earnings per share.
Refinancing of Our Existing Indebtedness. On February 11, 2011, we refinanced our existing indebtedness by completing an offering of $250.0 million in aggregate principal amount of 6.75% Senior Notes due 2019 through an institutional private placement and entering into a new $350.0 million senior secured credit agreement. The new credit agreement provides for senior secured financing consisting of:
| • | a $200.0 million senior secured revolving credit facility. The new revolver, which was undrawn at close, replaces our previous $80.0 million facility; |
| • | a $150.0 million senior secured term loan facility; and |
| • | an option to raise up to $125.0 million of incremental term loans or incremental revolving credit commitments. |
In connection with this refinancing we repaid in full all outstanding borrowings under the existing term and revolving loans. In addition, we purchased $151.0 million principal amount of our outstanding 8.125% Senior Notes and have called for the redemption of the remaining $12.0 million principal amount of these notes, with such redemption to be completed on March 14, 2011. We also redeemed the $0.3 million outstanding principal amount of the 12% Discount Notes.
As of December 31, 2010, we were in compliance with the applicable financial ratios in the prior senior secured credit facility and the other covenants contained in the prior senior secured credit facility and the indentures governing the senior subordinated notes then outstanding, and as of the date of this filing is in compliance with same, for the new senior secured credit facility and the indentures governing the new 6.75% senior subordinated notes.
Senior Secured Credit Agreement. Borrowings under the new senior secured revolving credit facility (other than swingline loans) bear an interest rate equal to, at our option, either (a) a base rate determined by reference to the higher of (1) the federal funds rate plus 0.50% and, (2) the prime rate of Bank of America, N.A., in each case plus a margin of 2.00% through December 31, 2011 and thereafter 1.75% to 2.25% depending on a consolidated net leverage ratio, or (b) a LIBOR rate determined by reference to the costs of funds for U.S. dollar deposits for the interest period relevant to such borrowing adjusted for certain additional costs plus a margin of 3.00% through December 31, 2011 and thereafter 2.75% to 3.25% depending on a consolidated net leverage ratio. Swingline loans shall bear interest at a rate per annum equal to the base rate plus the applicable rate unless mutually agreed otherwise.
Borrowings under the new senior term loan bear interest at a rate per annum equal to, at our option, either (a) a base rate determined by reference to the higher of (1) the federal funds rate plus 0.50% and (2) the prime rate of Bank of America, N.A. in each case plus a margin of 2.00% per annum, or (b) a LIBOR rate determined by reference to the costs of funds for U.S. dollar deposits for the interest period relevant to such borrowing adjusted for certain additional costs plus a margin of 3.00% per annum.
In addition to paying interest on outstanding principal under the new revolving credit facility and new term loan, we will be required to pay a commitment fee in respect of the unutilized commitments under the new revolving credit facility, as well as pay customary letter of credit fees and agency fees.
F-53
Table of Contents
KRATON PERFORMANCE POLYMERS, INC.
Notes to Consolidated Financial Statements—(Continued)
Guarantees and Security. The new senior secured credit facility is unconditionally guaranteed by Kraton Performance Polymers, Inc. and the wholly-owned domestic subsidiaries of Kraton Polymers LLC, and is required to be guaranteed by all future direct and indirect material domestic subsidiaries. Pursuant to the pledge agreement and security agreement entered into in connection with the new senior secured credit facility all obligations are secured, subject to certain exceptions, by substantially all of Kraton Polymers LLC’s assets and the assets of other existing wholly-owned domestic subsidiaries, including (a) a pledge of 100% of the equity interests of Kraton Polymers LLC and other existing wholly-owned domestic subsidiaries, direct or indirect, (b) a pledge of 65% of the voting capital stock and the other equity interests of all material first-tier foreign subsidiaries, direct or indirect, subject to certain exceptions, (c) a grant of a security interest in substantially all of Kraton Polymers LLC’s assets and the assets of all other wholly-owned domestic subsidiaries, (d) a mortgage lien on all of Kraton Polymers LLC’s material real property and that of the other wholly-owned domestic subsidiaries, and (e) all proceeds of the foregoing.
Prepayments. The new senior secured credit facility will require us to prepay (a) 100% of the net cash proceeds of all asset dispositions in excess of $7.5 million in any fiscal year, to the extent that such proceeds are not reinvested within 12 months of such disposition or committed to be reinvested within 12 months and actually so reinvested within 18 months of such commitment, (b) 50% of excess cash flow, declining to 25% and 0% based on a consolidated net leverage ratio, and (c) a percentage of net cash proceeds of certain unsecured indebtedness issued pursuant to the credit agreement in excess of $200.0 million equal to (i) 100% if a consolidated net leverage ratio is greater than 2.75:1.00 on a pro forma basis and (ii) 0% if a consolidated net leverage ratio is less than or equal to 2.75:1.00 on a pro forma basis.
Kraton is permitted to voluntarily prepay outstanding obligations under the new senior secured credit facility at any time without penalty, other than customary breakage costs with respect to LIBOR loans.
Certain Covenants and Events of Default. The new senior secured credit facility requires Kraton to maintain a consolidated net leverage ratio not exceeding certain agreed levels, and restricts the operations and business of Kraton Performance Polymers, Inc., Kraton and its subsidiaries. Additionally, the new senior secured credit facility contains a number of affirmative covenants, including, among other things: (i) the delivery of financial statements and other reports; (ii) the delivery of compliance certificates and other information; (iii) the delivery of notices, including notices of default and other material matters; (iv) compliance with laws and material contractual obligations; (v) payment of obligations, including taxes and indebtedness; (vi) the maintenance of insurance; (vii) the preservation of existence; and (viii) the maintenance of properties.
The new senior secured credit facility also contains a number of negative covenants, including, among other things: (i) limitations on liens; (ii) limitations on mergers and consolidations; (iii) limitations on sales of assets outside of the ordinary course of business; (iv) limitations on the incurrence and existence of debt; (v) limitations on restricted payments; (vi) limitations on investments, loans, advances and acquisitions; and (vii) limitations on transactions with affiliates. The Senior Secured Credit Facility also contains certain customary events of default, including, without limitation, a failure to make payments under the facility, cross-default and cross-judgment default, certain bankruptcy events and certain change of control events.
6.75% Senior Notes due 2019. In connection with this refinancing, Kraton Polymers LLC issued $250.0 million aggregate principal amount of 6.75% Senior Notes, which mature on March 1, 2019, pursuant to an indenture, dated as of February 11, 2011. The indenture provides that the new notes are general unsecured, senior obligations and initially will be unconditionally guaranteed on a senior unsecured basis. We will pay interest on the new notes at 6.75% per annum, semi-annually in arrears on March 1 and September 1, commencing on September 1, 2011.
F-54
Table of Contents
KRATON PERFORMANCE POLYMERS, INC.
Notes to Consolidated Financial Statements—(Continued)
We may redeem some or all of the New Notes at any time on or after March 1, 2015, at the redemption prices set forth in the indenture plus accrued and unpaid interest to the redemption date. We may redeem the new notes prior to March 1, 2015 at a price equal to 100% of the principal amount of the new notes redeemed plus accrued and unpaid interest to the redemption date, plus a “make-whole” premium. In addition, we may redeem up to 35% of the aggregate principal amount of the new notes using net proceeds from certain equity offerings completed prior to March 1, 2014 at a redemption price of 106.75% of the principal amount, plus accrued and unpaid interest to the redemption date, subject to compliance with certain conditions.
The indenture contains covenants that limit our ability to, among other things: (i) incur or guarantee additional indebtedness or issue preferred stock; (ii) conduct certain asset sales; (iii) pay dividends or distributions on, or redeem or repurchase, its capital stock; (iv) make certain investments; (v) create liens on assets; (vi) merge or consolidate or sell all or substantially all of our assets; (vii) enter into transactions with affiliates; and (viii) create restrictions on the payment of dividends or other amounts to the Issuers. These covenants are subject to a number of important limitations and exceptions. The Indenture also provides for events of default, which, if any of them occurs, may permit or, in certain circumstances, require the principal, premium, if any, interest and any other monetary obligations on all the then outstanding notes to be due and payable immediately.
U.S. Environmental Protection Agency Regulations.
On February 21, 2011, U.S. Environmental Protection Agency Regulations were promulgated and are awaiting publication in the Federal Register. If ultimately implemented as promulgated, these new regulations would require us to incur capital investments and ARO related to upgrading or replacing our coal-burning boilers at our Belpre, Ohio, facility.
We have evaluated significant events and transactions that have occurred and have determined that there were no events or transactions other than those disclosed in this report that would require recognition or disclosure in our Consolidated Financial Statements for the period ended December 31, 2010.
F-55
Table of Contents
Report of Independent Registered Public Accounting Firm
The Board of Directors and Stockholders
Kraton Performance Polymers, Inc.:
Under date of March 7, 2011, we reported on the consolidated balance sheets of Kraton Performance Polymers, Inc. and subsidiaries as of December 31, 2010 and 2009, and the related consolidated statements of operations, changes in stockholders’ and member’s equity and other comprehensive income (loss), and cash flows for each of the years in the three-year period ended December 31, 2010, which are included in Kraton Performance Polymers, Inc.’s Annual Report on Form 10-K. In connection with our audits of the aforementioned consolidated financial statements, we also audited the related financial statement schedule in Kraton Performance Polymers, Inc.’s Annual Report on Form 10-K. This financial statement schedule is the responsibility of Kraton Performance Polymers, Inc.’s management. Our responsibility is to express an opinion on this financial statement schedule based on our audits.
In our opinion, the financial statement schedule, when considered in relation to the basic consolidated financial statements taken as a whole, presents fairly, in all material respects, the information set forth therein.
/s/ KPMG LLP
Houston, Texas
March 7, 2011
F-56
Table of Contents
KRATON PERFORMANCE POLYMERS, INC.
SCHEDULE II—VALUATION AND QUALIFYING ACCOUNTS AND RESERVES
For the Years Ended December 31, 2010, 2009 and 2008
(In thousands)
| Balance at Beginning of Period |
Charged to Costs and Expenses |
Deductions | Balance at End of Period |
|||||||||||||
| Allowance for Doubtful Accounts |
||||||||||||||||
| Year ended December 31, 2010 |
$ | 1,335 | $ | (336 | ) | $ | (52 | ) | $ | 947 | ||||||
| Year ended December 31, 2009 |
2,512 | (857 | ) | (320 | ) | 1,335 | ||||||||||
| Year ended December 31, 2008 |
1,542 | 2,075 | (1,105 | ) | 2,512 | |||||||||||
| Balance at Beginning of Period |
Charged to Costs and Expenses |
Deductions | Balance at End of Period |
|||||||||||||
| Inventory Reserves |
||||||||||||||||
| Year ended December 31, 2010 |
$ | 6,135 | $ | 2,292 | $ | (158 | ) | $ | 8,269 | |||||||
| Year ended December 31, 2009 |
5,063 | 1,526 | (454 | ) | 6,135 | |||||||||||
| Year ended December 31, 2008 |
4,755 | 768 | (460 | ) | 5,063 | |||||||||||
F-57
Table of Contents
EXHIBIT INDEX
| Item | 15. Exhibits |
The following is a list of all exhibits filed as a part of this annual report on Form 10-K, including those incorporated in this registration statement by reference.
| Exhibit No |
Description of Exhibits | |
| 3.1 | Certificate of Incorporation of Kraton Performance Polymers, Inc. (incorporated by reference to Exhibit 3.1 to the Kraton Performance Polymers’ Form S-1/A filed with the SEC on September 20, 2010) | |
| 3.2 | Bylaws of Kraton Performance Polymers, Inc. (Incorporated by reference to Exhibit 3.2 to the Kraton Performance Polymers’ Form S-1/A filed with the SEC on September 20, 2010) | |
| 4.1 | Specimen Stock Certificate of Kraton Performance Polymers, Inc.’s Common Stock, par value $0.01 per share (incorporated by reference to Exhibit 4.1 to the Kraton Performance Polymers’ Form S-1 filed with the SEC on December 12, 2009) | |
| 4.2 | Indenture dated as of November 2, 2004, among Polymer Holdings LLC, Polymer Holdings Capital Corporation, and Wells Fargo Bank, N.A., as trustee, relating to the 12.000% Senior Discount Notes due 2014 (incorporated by reference to Exhibit 4.1 to Polymer Holdings LLC’s Registration Statement on Form S-4 filed with the SEC on April 1, 2005) | |
| 4.3 | First Supplemental Indenture dated May 9, 2006, among Polymer Holdings LLC, Polymer Holdings Capital Corporation and Wells Fargo Bank, N.A., as trustee, relating to the 12.000% Senior Discount Notes due 2014 (incorporated by reference to Exhibit 4.1 to Polymer Holdings LLC’s Quarterly Report on Form 10-Q filed with the SEC on May 15, 2006) | |
| 4.4 | Indenture dated as of December 23, 2003, among Kraton Polymers LLC, Kraton Polymers Capital Corporation, the Guarantors named therein and Wells Fargo Bank Minnesota, N.A., as trustee, relating to the 8.125% Senior Subordinated Notes due 2014 (incorporated by reference to Exhibit 4.1 to Kraton Polymer LLC’s Registration Statement on Form S-4 filed with the SEC on April 1, 2005) | |
| 4.5 | Form of 8.125% Senior Subordinated Notes due 2014 of Kraton Polymers LLC and Kraton Polymers Capital Corporation (incorporated by reference to Exhibit A1 to the Indenture filed as Exhibit 4.1 to Kraton Polymers LLC’s Registration Statement on Form S-4 filed with the SEC on April 1, 2005) | |
| 4.6 | Pledge and Security Agreement dated December 23, 2003, among Kraton Polymers LLC, Polymer Holdings LLC, Kraton Polymers Capital Corporation, Elastomers Holdings LLC, and Kraton Polymers U.S. LLC, as Grantors and UBS AG, Stamford Branch, as Collateral Agent (incorporated by reference to Exhibit 4.4 to Kraton Polymers LLC’s Registration Statement on Form S-4 filed with the SEC on April 1, 2005) | |
| 4.7 | Credit and Guaranty Agreement dated December 23, 2003, among Kraton Polymers LLC, as Borrower, Polymer Holdings LLC, certain subsidiaries of Kraton Polymers LLC, as Guarantors, various lenders, Goldman Sachs Credit Partners L.P. and UBS Securities LLC, as Lead Arrangers, Goldman Sachs Credit Partners L.P., as Syndication Agent, UBS AG, Stamford Branch, as Administrative Agent and Collateral Agent and Morgan Stanley Senior Funding Inc., Credit Suisse First Boston, acting through its Cayman Islands Branch and General Electric Capital Corporation, as Documentation Agents (incorporated by reference to Exhibit 4.5(a) to Kraton Polymers LLC’s Registration Statement on Form S-4 filed with the SEC on April 1, 2005) | |
| 4.8 | Amendment No. 1 to the Credit and Guaranty Agreement dated as of March 4, 2004 (incorporated by reference to Exhibit 4.5(b) to Kraton Polymers LLC’s Registration Statement on Form S-4 filed with the SEC on April 1, 2005) | |
E-1
Table of Contents
| Exhibit No |
Description of Exhibits | |
| 4.9 | Amendment No. 2 to the Credit and Guaranty Agreement dated as of October 21, 2004 (incorporated by reference to Exhibit 4.5(c) to Kraton Polymers LLC’s Registration Statement on Form S-4 filed with the SEC on April 1, 2005) | |
| 4.10 | Amendment No. 3 to the Credit and Guaranty Agreement dated as of February 16, 2006 (incorporated by reference to Exhibit 10.1 to Kraton Polymers LLC’s Quarterly Report on Form 10-Q filed with the SEC on May 15, 2006) | |
| 4.11 | Amendment No. 4 to the Credit and Guaranty Agreement dated as of May 12, 2006 (incorporated by reference to Exhibit 10.3 to Kraton Polymers LLC’s Quarterly Report on Form 10-Q filed with the SEC on May 15, 2006) | |
| 4.12 | Amendment No. 5 to the Credit and Guaranty Agreement dated as of December 15, 2006 (incorporated by reference to Exhibit 10.1 to Kraton Polymers LLC’s Current Report on Form 8-K filed with the SEC on December 21, 2006) | |
| 4.13 | Amendment No. 6 to the Credit and Guaranty Agreement dated as of October 20, 2009 (incorporated by reference to Exhibit 99.1 to Kraton Polymers LLC’s Current Report on Form 8-K filed with the SEC on October 22, 2009) | |
| 4.14 | Amendment No. 7 to the Credit and Guaranty Agreement dated as of November 30, 2009 (incorporated by reference to Exhibit 99.1 to Kraton Polymers LLC’s Current Report on Form 8-K filed with the SEC on November 30, 2009) | |
| 4.15 | Joinder Agreement dated June 7, 2006, among Amegy Bank National Association as Lender, Kraton Polymers LLC as Borrower, the Guarantors and the UBS AG, Stamford Branch as Administrative Agent (incorporated by reference to Exhibit 10.1 to Kraton Polymers LLC’s Current Report on Form 8-K filed with the SEC on June 7, 2006) | |
| 4.16 | Form of Amended and Restated Registration Rights and Shareholders’ Agreement (incorporated by reference to Exhibit 4.17 to the Kraton Performance Polymers, Inc.’s Form S-1 filed with the SEC on December 12, 2009) | |
| 10.1+ | Restricted Unit Award Grant Agreement dated September 10, 2004, between David A. Bradley and Kraton Polymers LLC (incorporated by reference to Exhibit 10.29 to Kraton Polymers LLC’s Registration Statement on Form S-4 filed with the SEC on April 1, 2005) | |
| 10.2+ | Restricted Unit Award Grant Agreement dated as of March 17, 2005, between Kraton Polymers LLC and David A. Bradley (incorporated by reference to Exhibit 10.29(a) to Amendment No. 1 to Kraton Polymers LLC’s Registration Statement on Form S-4 filed with the SEC on June 9, 2005) | |
| 10.3+ | Restricted Unit Award Grant Agreement dated as of June 19, 2008, between Kraton Polymers LLC and David A. Bradley (incorporated by reference to Exhibit 10.18 to the Kraton Performance Polymers’ Form S-1 filed with the SEC on November 20, 2009) | |
| 10.4+ | Notional Unit Award Grant Agreement dated July 15, 2005, between Kevin M. Fogarty and Kraton Polymers LLC (incorporated by reference to Exhibit 10.56 to Amendment No. 3 to Kraton Polymers LLC’s Registration Statement on Form S-4 filed with the SEC on August 30, 2005) | |
| 10.5+ | Amendment No. 1 dated December 18, 2008 to the Notional Unit Award Grant Agreement, between Kevin M. Fogarty and Kraton Polymers LLC (incorporated by reference to Exhibit 10.23 to the Kraton Performance Polymers’ Form S-1 filed with the SEC on November 20, 2009) | |
| 10.6+ | Restricted Unit Award Grant Agreement dated as of June 19, 2008, between Kraton Polymers LLC and Kevin M. Fogarty (incorporated by reference to Exhibit 10.25 to the Kraton Performance Polymers’ Form S-1 filed with the SEC on November 20, 2009) | |
E-2
Table of Contents
| Exhibit No |
Description of Exhibits | |
| 10.7+ | Savings Deferred Compensation and Restoration Plan dated December 31, 2008, restated (incorporated by reference to Exhibit 10.28 to the Kraton Performance Polymers, Inc.’s Form S-1 filed with the SEC on November 20, 2009) | |
| 10.8+ | Pension Benefit Restoration Plan dated December 31, 2008, restated (incorporated by reference to Exhibit 10.29 to the Kraton Performance Polymers, Inc.’s Form S-1 filed with the SEC on December 2, 2009) | |
| 10.9+ | Kraton Polymers LLC Executive Deferred Compensation Plan dated December 31, 2008 (incorporated by reference to Exhibit 10.30 to the Kraton Performance Polymers, Inc.’s Form S-1 filed with the SEC on December 2, 2009) | |
| 10.10+ | TJ Chemical Holdings LLC 2004 Option Plan and Form of Option Grant Agreement (incorporated by reference to Exhibit 10.31 to Kraton Polymers LLC’s Registration Statement on Form S-4 filed with the SEC on April 1, 2005) | |
| 10.11+ | Amendment to TJ Chemical Holdings LLC 2004 Option Plan dated August 18, 2008 (incorporated by reference to Exhibit 10.1 to Kraton Polymers LLC’s Quarterly Report on Form 10-Q filed with the SEC on November 12, 2008) | |
| 10.12+ | Form of Amendment No. 3 to the Employment Agreement of Executive Officers effective December 31, 2008 (incorporated by reference to Exhibit 10.43 to the Kraton Performance Polymers, Inc.’s Form S-1 filed with the SEC on November 20, 2009) | |
| 10.13+ | Amendment No. 2 dated December 8, 2009 to the Notional Unit Award Grant Agreement, between Kevin M. Fogarty and Kraton Polymers LLC (incorporated by reference to Exhibit 10.47 to the Kraton Performance Polymers, Inc.’s Form S-1 filed with the SEC on December 12, 2009) | |
| 10.14+ | Polymer Holdings Equity Incentive Plan dated November 30, 2009 (incorporated by reference to Exhibit 10.48 to the Kraton Performance Polymers, Inc.’s Form S-1 filed with the SEC on December 2, 2009) | |
| 10.15+ | Polymer Holdings Cash Incentive Plan dated November 30, 2009 (incorporated by reference to Exhibit 10.49 to the Kraton Performance Polymers, Inc.’s Form S-1 filed with the SEC on November 20, 2009) | |
| 10.16+ | Form of Polymer Holdings Restricted Stock Grant Agreement (incorporated by reference to Exhibit 10.50 to the Kraton Performance Polymers, Inc.’s Form S-1 filed with the SEC on December 2, 2009) | |
| 10.17+ | Form of Polymer Holdings Option Grant Agreement (incorporated by reference to Exhibit 10.51 to the Kraton Performance Polymers, Inc.’s Form S-1 filed with the SEC on December 2, 2009) | |
| 10.18+ | Polymer Holdings Executive Deferred Compensation Plan dated November 30, 2009 (incorporated by reference to Exhibit 10.52 to the Kraton Performance Polymers, Inc.’s Form S-1 filed with the SEC on December 2, 2009) | |
| 10.19+ | Amendment to TJ Chemical Option Plan dated November 30, 2009 (incorporated by reference to Exhibit 10.53 to the Kraton Performance Polymers, Inc.’s Form S-1 filed with the SEC on December 2, 2009) | |
| 10.20+ | Amendment No.1 dated December 8, 2009 to the Restricted Unit Award Grant Agreement dated as of June 19, 2008, between Kraton Polymers LLC and Kevin M. Fogarty (incorporated by reference to Exhibit 10.54 to the Kraton Performance Polymers, Inc.’s Form S-1 filed with the SEC on December 12, 2009) | |
E-3
Table of Contents
| Exhibit No |
Description of Exhibits | |
| 10.21+ | Amendment No.1 dated December 8, 2009 to the Restricted Unit Award Grant Agreement dated as of March 17, 2005, between Kraton Polymers LLC and David A. Bradley (incorporated by reference to Exhibit 10.55 to the Kraton Performance Polymers, Inc.’s Form S-1 filed with the SEC on December 12, 2009) | |
| 10.22+ | Amendment dated December 8, 2009 to the Restricted Unit Award Grant Agreement dated as of June 19, 2008, between Kraton Polymers LLC and David A. Bradley (incorporated by reference to Exhibit 10.56 to the Kraton Performance Polymers, Inc.’s Form S-1 filed with the SEC on December 12, 2009) | |
| 10.23+ | Amended and Restated Employment Agreement dated December 8, 2009 between Kevin M. Fogarty and Kraton Polymers LLC (incorporated by reference to Exhibit 10.60 to the Kraton Performance Polymers, Inc.’s Form S-1 filed with the SEC on December 12, 2009) | |
| 10.24+ | Amended and Restated Employment Agreement dated December 8, 2009, between David A. Bradley and Kraton Polymers LLC (incorporated by reference to Exhibit 10.61 to the Kraton Performance Polymers, Inc.’s Form S-1 filed with the SEC on December 12, 2009) | |
| 10.25+ | Amended and Restated Employment Agreement dated December 8, 2009, between Richard Ott and Kraton Polymers LLC (incorporated by reference to Exhibit 10.62 to the Kraton Performance Polymers, Inc.’s Form S-1 filed with the SEC on December 12, 2009) | |
| 10.26+ | Amended and Restated Employment Agreement dated December 8, 2009, between Lothar Freund and Kraton Polymers LLC (incorporated by reference to Exhibit 10.63 to the Kraton Performance Polymers, Inc.’s Form S-1 filed with the SEC on December 12, 2009) | |
| 10.27+ | Amended and Restated Employment Agreement dated December 8, 2009, between Stephen E. Tremblay and Kraton Polymers LLC (incorporated by reference to Exhibit 10.64 to the Kraton Performance Polymers, Inc.’s Form S-1 filed with the SEC on December 12, 2009) | |
| 10.28+ | Amended and Restated Employment Agreement dated December 8, 2009, by and between Larry R. Frazier, Polymer Holdings, LLC and Kraton Polymers LLC (incorporated by reference to Exhibit 10.48 to Kraton Performance Polymers, Inc.’s Annual Report on Form 10-K filed with the SEC on March 15, 2010) | |
| 10.29+ | Amended and Restated Employment Agreement dated December 8, 2009, by and between Stephen W. Duffy, Polymer Holdings, LLC and Kraton Polymers LLC (incorporated by reference to Exhibit 10.49 to Kraton Performance Polymers, Inc.’s Annual Report on Form 10-K filed with the SEC on March 15, 2010) | |
| 10.30 | First Amended and Restated Site Services, Utilities, Materials and Facilities Agreement dated February 28, 2001, between Shell Chimie S.A. and Kraton Polymers France S.A.S. (Berre) (portions of this exhibit have been omitted pursuant to a request for confidential treatment) (incorporated by reference to Exhibit 10.34 to Amendment No. 2 to Kraton Polymers LLC’s Registration Statement on Form S-4 filed with the SEC on July 15, 2005) | |
| 10.31 | Amended and Restated Belpre Facility Sharing and Operating Agreement dated July 1, 1999, among Infineum USA LP, Shell Oil Kraton and Shell Elastomers LLC (portions of this exhibit have been omitted pursuant to a request for confidential treatment) (incorporated by reference to Exhibit 10.38 to Amendment No. 2 to Kraton Polymers LLC’s Registration Statement on Form S-4 filed with the SEC on July 15, 2005) | |
| 10.32 | Amendment No. 1 dated January 23, 2007 to Amended and Restated Belpre Facility Sharing and Operating Agreement (incorporated by reference to Exhibit 10.69 to the Kraton Performance Polymers, Inc.’s Form S-1 filed with the SEC on November 20, 2009) | |
E-4
Table of Contents
| Exhibit No |
Description of Exhibits | |
| 10.33 | Amendment No. 2 dated January 1, 2009 to Amended and Restated Belpre Facility Sharing and Operating Agreement (incorporated by reference to Exhibit 10.70 to the Kraton Performance Polymers, Inc.’s Form S-1 filed with the SEC on November 20, 2009) | |
| 10.34 | First Amended and Restated Operations and Maintenance Services Agreement dated February 28, 2001, between Kraton Polymers Nederland B.V. and Shell Nederland Chemie B.V. (Pernis) (portions of this exhibit have been omitted pursuant to a request for confidential treatment) (incorporated by reference to Exhibit 10.35 to Amendment No. 2 to Kraton Polymers LLC’s Registration Statement on Form S-4 filed with the SEC on July 15, 2005) | |
| 10.35 | First Amended and Restated Operations and Maintenance Services Agreement dated February 28, 2001, between Kraton Polymers France S.A.S. and Shell Chimie S.A. (Berre) (portions of this exhibit have been omitted pursuant to a request for confidential treatment) (incorporated by reference to Exhibit 10.36 to Amendment No. 2 to Kraton Polymers LLC’s Registration Statement on Form S-4 filed with the SEC on July 15, 2005) | |
| 10.36 | Production Agreement dated March 31, 2000, between Elenac GmbH and Kraton Polymers GmbH (Wesseling) (portions of this exhibit have been omitted pursuant to a request for confidential treatment) (incorporated by reference to Exhibit 10.37 to Amendment No. 2 to Kraton Polymers LLC’s Registration Statement on Form S-4 filed with the SEC on July 15, 2005) | |
| 10.37 | 1,3-Butadiene Agreement dated December 1, 1999, between Deutsche Shell Chemie GmbH and MWW Achtundzwanzigste Vermoegensverwaltungs GmbH (portions of this exhibit have been omitted pursuant to a request for confidential treatment) (incorporated by reference to Exhibit 10.44 to Amendment No. 2 to Kraton Polymers LLC’s Registration Statement on Form S-4 filed with the SEC on July 15, 2005) | |
| 10.38 | Agreement dated February 28, 2001, between Shell Nederland Chemie B.V. and Kraton Polymers Nederland B.V. for the supply of Isoprene Monomer (portions of this exhibit have been omitted pursuant to a request for confidential treatment) (incorporated by reference to Exhibit 10.46 to Amendment No. 2 to Kraton Polymers LLC’s Registration Statement on Form S-4 filed with the SEC on July 15, 2005) | |
| 10.39 | Letter Amendment No. 2 (and by reference Amendment No. 1) to the Agreement dated February 28, 2001, between Shell Nederland Chemie B.V. and Kraton Polymers Nederland B.V. for the supply of Isoprene Monomer, dated December 10, 2007, between Shell Chemicals Europe B.V. and Kraton Polymers Nederland P.V. (incorporated by reference to Exhibit 10.39(a) to Kraton Polymers LLC’s Annual Report on Form 10-K filed with the SEC on March 31, 2008) | |
| 10.40 | Manufacturing Facility Lease dated August 24, 2000, between Shell Chemie and Kravis (Berre-Kraton D) (incorporated by reference to Exhibit 10.47 to Kraton Polymers LLC’s Registration Statement on Form S-4 filed with the SEC on April 1, 2005) | |
| 10.41 | Manufacturing Facility Lease dated August 24, 2000, between Shell Chimie and Kraton Polymers France SAS (Berre-Kraton G) (incorporated by reference to Exhibit 10.48 to Kraton Polymers LLC’s Registration Statement on Form S-4 filed with the SEC on April 1, 2005) | |
| 10.42 | Business Lease dated March 31, 2000, between Elenac GmbH and Kraton Polymers GmbH (Wesseling) (portions of this exhibit have been omitted pursuant to a request for confidential treatment) (incorporated by reference to Exhibit 10.49 to Kraton Polymers LLC’s Registration Statement on Form S-4 filed with the SEC on April 1, 2005) | |
| 10.43 | Amendment to the Business Lease dated March 31, 2000, between Bassell Polyolefine GmbH (previously Elenac GmbH) and Kraton Polymers GmbH (incorporated by reference to Exhibit 10.49(a) to Kraton Polymers LLC’s Registration Statement on Form S-4 filed with the SEC on April 1, 2005) | |
E-5
Table of Contents
| Exhibit No |
Description of Exhibits | |
| 10.44 | Contribution Agreement dated February 28, 2001, between Shell Oil Kraton and Shell Elastomers (portions of this exhibit have been omitted pursuant to a request for confidential treatment) (incorporated by reference to Exhibit 10.50 to Amendment No. 2 to Kraton Polymers LLC’s Registration Statement on Form S-4 filed with the SEC on July 15, 2005) | |
| 10.45 | Contribution Agreement dated February 28, 2001, between Shell Internationale Research Maatschappij B.V. and Kraton Polymers Research B.V. (portions of this exhibit have been omitted pursuant to a request for confidential treatment) (incorporated by reference to Exhibit 10.51 to Amendment No. 2 to Kraton Polymers LLC’s Registration Statement on Form S-4 filed with the SEC on July 15, 2005) | |
| 10.46 | Agreement for Adjustment and Termination of Services under Kraton/SNC SUMFs and OMS Agreements at Pernis dated as of June 28, 2007 by and among Shell Nederland Chemie B.V. and Kraton Polymers Nederland B.V. (incorporated by reference to Exhibit 10.1 to Kraton Polymers LLC’s Quarterly Report on Form 10-Q filed with the SEC on November 14, 2007) | |
| 10.47+ | Amendment to Outstanding Option Grant Agreements (incorporated by reference to Exhibit 10.92 to the Kraton Performance Polymers, Inc.’s Form S-1 filed with the SEC on December 2, 2009) | |
| 10.48+ | Form of Indemnification Agreement (incorporated by reference to Exhibit 10.1 to Kraton Performance Polymers, Inc.’s Current Report on Form 8-K filed with the SEC on June 2, 2010) | |
| 10.49+ | First Amendment to Employment Agreement (Fogarty) dated effective as of January 1, 2011 (incorporated by reference to Exhibit 99.1 to Kraton Performance Polymers, Inc.’s Current Report on Form 8-K filed with the SEC on February 1, 2011) | |
| 10.50+ | First Amendment to Employment Agreement (Bradley) dated effective as of October 12, 2010 (incorporated by reference to Exhibit 99.1 to Kraton Performance Polymers, Inc.’s Current Report on Form 8-K filed with the SEC on November 12, 2010) | |
| 10.51+ | First Amendment to Employment Agreement (Freund) dated effective as of October 12, 2010 (incorporated by reference to Exhibit 99.2 to Kraton Performance Polymers, Inc.’s Current Report on Form 8-K filed with the SEC on November 12, 2010) | |
| 10.52+ | First Amendment to Employment Agreement (Ott) dated effective as of October 12, 2010 (incorporated by reference to Exhibit 99.3 to Kraton Performance Polymers, Inc.’s Current Report on Form 8-K filed with the SEC on November 12, 2010) | |
| 10.53+ | First Amendment to Employment Agreement (Tremblay) dated effective as of October 12, 2010 (incorporated by reference to Exhibit 99.4 to Kraton Performance Polymer, Inc.’s Current Report on Form 8-K filed with the SEC on November 12, 2010) | |
| 10.54+* | Employment Agreement (Lee) dated effective as of January 1, 2011 | |
| 10.55+ | Summary of Terms of 2010 Kraton Polymers LLC Cash Incentive Plan (incorporated by reference to Kraton Performance Polymers, Inc.’s Current Report on Form 8-K filed with the SEC on March 11, 2010 | |
| 12.1* | Statement of Computation of Ratio of Earnings to Fixed Charges | |
| 21.1* | List of Significant Subsidiaries | |
| 23.1* | Consent of Independent Registered Public Accounting Firm | |
| 24.1* | Powers of Attorney | |
| 31.1* | Certification by CEO pursuant to Rule 13a-14(a) or 15d-14(a) of the Securities Exchange Act of 1934, as adopted pursuant to Section 302 of the Sarbanes-Oxley Act of 2002 | |
E-6
Table of Contents
| Exhibit No |
Description of Exhibits | |
| 31.2* | Certification by CFO pursuant to Rule 13a-14(a) or 15d-14(a) of the Securities Exchange Act of 1934, as adopted pursuant to Section 302 of the Sarbanes-Oxley Act of 2002 | |
| 32.1* | Certification by CEO and CFO pursuant to 18 U.S.C. Section 1350, as adopted pursuant to Section 906 of the Sarbanes-Oxley Act of 2002 | |
| + | Denotes management contract or compensatory plan or arrangement. |
| * | Filed herewith. |
E-7