Attached files
| file | filename |
|---|---|
| 8-K - FORM 8-K - STERLING BANCORP | tm2113359d1_8k.htm |
| EX-99.2 - EXHIBIT 99.2 - STERLING BANCORP | tm2113359d1_ex99-2.htm |
Exhibit 99.1

April 19 , 2021 Webster + Sterling Creating Scale, Unlocking Growth and Value

CAUTION REGARDING FORWARD - LOOKING STATEMENTS This communication may contain certain forward - looking statements, including, but not limited to, certain plans, expectations, g oals, projections, and statements about the benefits of the proposed transaction, the plans, objectives, expectations and intentions of Webster and Sterling, the expected timing of completion of the transaction, and other statements that are n ot historical facts. Such statements are subject to numerous assumptions, risks, and uncertainties. Statements that do not describe historical or current facts, including statements about beliefs and expectations, are forward - looking statements. Forward - looking statements may be identified by words such as expect, anticipate, believe, intend, estimate, plan, target, goal, or similar expressions, or future or conditional verbs such as will, may, might, should, would, could, or simil ar variations. The forward - looking statements are intended to be subject to the safe harbor provided by Section 27A of the Securities Act of 1933, Section 21E of the Securities Exchange Act of 1934, and the Private Securities Litigation Reform Act of 1995. While there is no assurance that any list of risks and uncertainties or risk factors is complete, below are certain factors w hic h could cause actual results to differ materially from those contained or implied in the forward - looking statements: changes in general economic, political, or industry conditions; the magnitude and duration of the COVID - 19 pandemic and its impa ct on the global economy and financial market conditions and our business, results of operations, and financial condition; uncertainty in U.S. fiscal and monetary policy, including the interest rate policies of the Federal Reserve Board; vo latility and disruptions in global capital and credit markets; movements in interest rates; reform of LIBOR; competitive pressures on product pricing and services; success, impact, and timing of our business strategies, including market acceptanc e o f any new products or services; the nature, extent, timing, and results of governmental actions, examinations, reviews, reforms, regulations, and interpretations, including those related to the Dodd - Frank Wall Street Reform and Consumer Pr otection Act and the Basel III regulatory capital reforms, as well as those involving the OCC, Federal Reserve, FDIC, and CFPB; the occurrence of any event, change or other circumstances that could give rise to the right of one or both o f t he parties to terminate the merger agreement between Webster and Sterling; the outcome of any legal proceedings that may be instituted against Webster or Sterling; delays in completing the transaction; the failure to obtain necessary reg ula tory approvals (and the risk that such approvals may result in the imposition of conditions that could adversely affect the combined company or the expected benefits of the transaction); the failure to obtain stockholder approvals or to satisfy any of the other conditions to the transaction on a timely basis or at all; the possibility that the anticipated benefits of the transaction are not realized when expected or at all, including as a result of the impact of, or problems arising from, the i nte gration of the two companies or as a result of the strength of the economy and competitive factors in the areas where Webster and Sterling do business; the possibility that the transaction may be more expensive to complete than anticipated, in clu ding as a result of unexpected factors or events; diversion of management’s attention from ongoing business operations and opportunities; potential adverse reactions or changes to business or employee relationships, including those r esu lting from the announcement or completion of the transaction; the ability to complete the transaction and integration of Webster and Sterling successfully; the dilution caused by Webster’s issuance of additional shares of its capital stock in con nection with the transaction; and other factors that may affect the future results of Webster and Sterling. Additional factors that could cause results to differ materially from those described above can be found in Webster’s Annual Report on F orm 10 - K for the year ended December 31, 2020, which is on file with the Securities and Exchange Commission (the “SEC”) and available on Webster’s investor relations website, https://webster.gcs - web.com/, under the heading “Financials” and i n other documents Webster files with the SEC, and in Sterling’s Annual Report on Form 10 - K for the year ended December 31, 2020, which is on file with the SEC and available on Sterling’s investor relations website, https://sterlingbank.gc s - web.com/investor - relations, under the heading “Financials” and in other documents Sterling files with the SEC. All forward - looking statements speak only as of the date they are made and are based on information available at that time. Nei ther Webster nor Sterling assumes any obligation to update forward - looking statements to reflect circumstances or events that occur after the date the forward - looking statements were made or to reflect the occurrence of unanticipated events e xcept as required by federal securities laws. As forward - looking statements involve significant risks and uncertainties, caution should be exercised against placing undue reliance on such statements . IMPORTANT ADDITIONAL INFORMATION In connection with the proposed transaction, Webster will file with the SEC a Registration Statement on Form S - 4 that will inclu de a Joint Proxy Statement of Webster and Sterling and a Prospectus of Webster, as well as other relevant documents concerning the proposed transaction. The proposed transaction involving Webster and Sterling will be submitted to Sterling’s st ockholders and Webster’s stockholders for their consideration. This communication does not constitute an offer to sell or the solicitation of an offer to buy any securities or a solicitation of any vote or approval, nor shall there be any sal e of securities in any jurisdiction in which such offer, solicitation or sale would be unlawful prior to registration or qual ifi cation under the securities laws of any such jurisdiction. INVESTORS AND STOCKHOLDERS OF WEBSTER AND STOCKHOLDERS OF STERLING ARE U RGE D TO READ THE REGISTRATION STATEMENT AND THE JOINT PROXY STATEMENT/PROSPECTUS REGARDING THE TRANSACTION WHEN IT BECOMES AVAILABLE AND ANY OTHER RELEVANT DOCUMENTS FILED WITH THE SEC, AS WELL AS ANY AMENDMENTS OR SUPPLEMENTS TO THOSE DOCUMENTS, BECAUSE THEY WILL CONTAIN IMPORTANT INFORMATION. Stockholders will be able to obtain a free copy of the definitiv e j oint proxy statement/prospectus, as well as other filings containing information about Webster and Sterling, without charge, at the SEC’s website (http://www.sec.gov). Copies of the joint proxy statement/prospectus and the fil ings with the SEC that will be incorporated by reference in the joint proxy statement/prospectus can also be obtained, without charge, by directing a request to Kristen Manginelli, Director of Investor Relations, Webster Financial Corporation, 145 Bank Street, Waterbury, Connecticut 06702, (203) 578 - 2202 or to Emlen Harmon, Managing Director, Investor Relations, Sterling Bancorp, Two Blue Hill Plaza, Second Floor, Pearl River, New York 10965, (845) 369 - 8040. PARTICIPANTS IN THE SOLICITATION Webster, Sterling, and certain of their respective directors and executive officers may be deemed to be participants in the s oli citation of proxies from the stockholders of Webster and Sterling in connection with the proposed transaction under the rules of the SEC. Information regarding Webster’s directors and executive officers is available in its definitive proxy stat eme nt relating to its 2021 Annual Meeting of Stockholders, which was filed with the SEC on March 19, 2021, and other documents filed by Webster with the SEC. Information regarding Sterling’s directors and executive officers is available in i ts definitive proxy statement relating to its 2021 Annual Meeting of Stockholders, which was filed with the SEC on April 14, 2021, and other documents filed by Sterling with the SEC. Other information regarding the participants in the proxy solicita tio n and a description of their direct and indirect interests, by security holdings or otherwise, will be contained in the joint proxy statement/prospectus and other relevant materials filed with the SEC. Free copies of this document may be obtained as des cribed in the preceding paragraph. Disclaimer 2
Non - GAAP Financial Measures In addition to results presented in accordance with GAAP, this presentation contains certain non - GAAP financial measures . A reconciliation of tangible book value and other ratios, as adjusted, is included on page 27. We believe that providing certain non - GAAP financial measures provides investors with information useful in understanding our financial performance, our performance trends and financial position. We utilize these measures for internal planning and forecasting purposes. We, as well as securities analysts, investors, and other interested parties, also use these measures to compare peer company operating performance. We believe that our presentation and discussion , together with the accompanying reconciliations, provides a complete understanding of factors and trends affecting our business and allows investors to view performance in a manner similar to management. These non - GAAP measures should not be considered a substitute for GAAP basis measures and results, and we strongly encourage investors to review our consolidated financial statements in their entirety and not to rely on any single financial measure. Because non - GAAP financial measures are not standardized, it may not be possible to compare these financial measures with other companies’ non - GAAP financial measures having the same or similar names. 3
4 PRESENTERS John R. Ciulla Chairman, President & CEO Glenn I. MacInnes CFO Jack L. Kopnisky President & CEO Luis Massiani COO

5 Creating Scale, Unlocking Growth and Value Scale • Uniting strong banks with complementary strategies to create a powerhouse Northeast player with national reach Growth • Unlocking compelling revenue growth opportunities in commercial lending, health savings, fee - based businesses, and consumer and digital banking Performance • Delivering peer - leading 17% ROATCE 1 • >20% EPS accretion to WBS, >10% to STL 2 • $440M annual excess capital generation 3 Culture • Maintaining our shared values, strong risk management and responsible corporate citizenship 1 Pro forma metric based on 2022 median analyst consensus estimates as of April 16, 2021, assuming $120M of pre - tax cost savings are fully phased in and including other GAAP earnings adjustments 2 Run - rate GAAP EPS accretion, assuming $120M of pre - tax cost savings are fully phased in and including other GAAP earnings adjustments; See page 25 for detail regarding calculation of run - rate GAAP EPS accretion 3 Represents CET1 capital created after common dividends and capital required for expected risk - weighted asset growth; See page 17 for calculation of excess capital generation

6 Powerhouse Northeast Bank ROATCE 3 run - rate after realizing cost synergies 17 % LOANS $ 42B DEPOSITS $ 52B FLOATING RATE loans / total loans 2 63 % REGIONAL RANK by total assets COMMERCIAL loans / total loans 1 80 % ASSETS $ 63B Note: Financial data as of March 31, 2021; Pro forma balance sheet metrics exclude impact of purchase accounting 1 Excludes PPP loans 2 Includes floating rate and periodically resetting loans as a percentage of total loans, excluding PPP 3 Pro forma metric based on 2022 median analyst consensus estimates as of April 16, 2021, assuming $120M of pre - tax cost savings are fully phased in and including other GAAP earnings adjustments 4 Represents 2Q21 forecast after previously announced banking center closures are complete NY VT NH ME MA RI CT Webster (130 4 ) Sterling (76) Headquarters NJ PA Stamford, CT 95 95 95 I - 95 corridor 95 95 95

7 Combined Platform Growth and Value Unlocked Relationship - and Expertise - Based Commercial Banking • Preferred banking partner to sophisticated companies and sponsors in targeted segments • Bankers, organized as teams, have deep relationships and expertise • Grow relationships with existing clients • Retain relationships as companies grow • Cross - sell capital markets capabilities • Enhance talent and product set High - Growth HSA Bank • Top health savings account provider with 3 million customers nationally • Grew accounts at an 11% compound annual rate over the past five years 1 • Significantly increased capacity for growth and investment Local Presence with Digital Capabilities • Regional leader serving consumers and small businesses in CT, MA, NY and RI • Growing scalable direct and digital banking businesses • Invest in and deploy innovative digital banking capabilities to meet evolving customer expectations Highly Differentiated Businesses 1 HSA Bank annualized account growth between 2015 and 2020

17% 4% 10% 24% 8% 16% 8% 27% 17% 19% 52% 36% 33% 8% 20% Webster Sterling Together Consumer & Other Commercial real estate Diversified C&I Traditional C&I Sponsor & Specialty Significant Loan Growth Potential • Northeast corridor footprint is the largest in the nation by population • The combined company unlocks a diversified, multi - billion dollar opportunity to grow regional and national C&I, CRE and Sponsor & Specialty loans through expanding existing relationships and new clients • National reach further enhances growth, risk - adjusted returns and diversification 8 DIVERSIFICATION UNLOCKS GROWTH gross loans, % of total¹ Gross loans 1 $20B $21B $41B ACL / Gross loans 1 1.64% 1.54% 1.59% 67% Commercial 92% Commercial 80% Commercial Note : Financial data as of March 31, 2021; Sterling standalone gross loans include existing purchase accounting adjustments; Pro forma balance sheet metrics exclude impact of pro forma purchase accounting 1 Excludes PPP loans 2 Consumer & other includes residential mortgage, home equity, other consumer and other loans 3 Commercial real estate includes commercial real estate, multifamily and construction loans; Webster commercial real estate based on its Investor Commercial Real Estate business 4 Diversified C&I includes ABL, factored receivables, equipment finance, mortgage warehouse, payroll finance and public sector fin ance 5 Traditional C&I includes middle market lending, private banking, business banking and franchise lending 6 Sponsor & Specialty includes loans to sponsor - backed companies 2 3 4 5 6

9 Best - in - Class Deposit Franchises • Consumer – 200+ financial centers serving consumers and small businesses in the highly populated Northeast I - 95 corridor and Long Island • Commercial – Sophisticated treasury services offerings for commercial clients • HSA Bank – Longstanding top 3 player nationally, with strong growth characteristics • Direct bank – Growing source of deposits with low “all - in” cost 14% 41% 41% 4% HSA Bank Consumer Commercial Direct & other $52B HSA BANK top 3 health savings platform nationally 0.12% cost of deposits STRONG DEPOSIT BASE low cost, long duration LOCAL DENSITY from New York to Boston ACCOUNTS 3M FOOTINGS deposits and investments $ 10B MARKET SHARE nationally 12 % GROWTH accounts, 2015 – 20 2 11 % HSA BANK top 3 health savings platform nationally Note : Deposit data as of March 31, 2021; HSA Bank data as of December 31, 2020; Pro forma balance sheet metrics exclude impact of purchase accounting; HSA Bank market share per Devenir Research 1 Direct & other includes BrioDirect platform and brokered / wholesale deposits 2 HSA Bank annualized account growth between 2015 and 2020 1

10 Shared Values, Benefits for All Stakeholders COMPLEMENTARY VALUES BASED CULTURES and robust risk management EXPAND PRODUCTS AND SERVICES to better serve customers $ 6.5 M+ in a n n ua l corporate giving 100,000+ VOLUNTEER HOURS in communities where we live and work COMMITMENT to advancing our progress on DIVERSITY, EQUITY & INCLUSION Retain commitment to COMMUNITY DEVELOPMENT AND CORPORATE CITIZENSHIP INVEST IN TECHNOLOGY to enhance client and customer experience ENVIRONMENTAL, SOCIAL AND GOVERNANCE efforts remain a top priority

Transaction Structure and Financial Impact
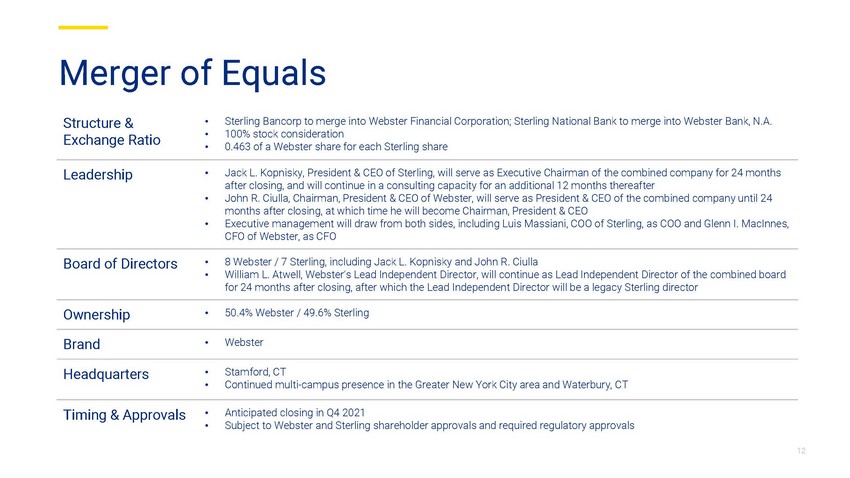
12 Merger of Equals Structure & Exchange Ratio • Sterling Bancorp to merge into Webster Financial Corporation; Sterling National Bank to merge into Webster Bank, N.A. • 100% stock consideration • 0.463 of a Webster share for each Sterling share Leadership • Jack L. Kopnisky , President & CEO of Sterling, will serve as Executive Chairman of the combined company for 24 months after closing, and will continue in a consulting capacity for an additional 12 months thereafter • John R. Ciulla, Chairman, President & CEO of Webster, will serve as President & CEO of the combined company until 24 months after closing, at which time he will become Chairman, President & CEO • Executive management will draw from both sides, including Luis Massiani, COO of Sterling, as COO and Glenn I. MacInnes, CFO of Webster, as CFO Board of Directors • 8 Webster / 7 Sterling, including Jack L. Kopnisky and John R. Ciulla • William L. Atwell, Webster’s Lead Independent Director, will continue as Lead Independent Director of the combined board for 24 months after closing, after which the Lead Independent Director will be a legacy Sterling director Ownership • 50.4% Webster / 49.6% Sterling Brand • Webster Headquarters • Stamford, CT • Continued multi - campus presence in the Greater New York City area and Waterbury, CT Timing & Approvals • Anticipated closing in Q4 2021 • Subject to Webster and Sterling shareholder approvals and required regulatory approvals

13 Key Financial Assumptions Standalone EPS • 2022 consensus EPS 1 : Webster $4.24, Sterling $2.20 Annual Cost Savings • $120M pre - tax, representing 11% of combined 2022 expenses 2 (o ver and above Webster's announced 2021 efficiency plan) • Net of planned investments in people, products and technology • Expected to be realized 75% in 2022, 100% thereafter Revenue Synergies • Identified but not included in announced financial returns One - Time Costs • $245M pre - tax / $211M after - tax; for illustrative purposes, fully reflected in pro forma capital at closing Pro Forma Payout • 75% target total payout ratio, comprised of 30% dividend payout ratio and 45% target share repurchase payout ratio • $400M of share repurchases in 2022 Credit Marks • $323M total lifetime loan loss estimate, equivalent to 1.5% of Sterling’s gross loans and 1.0x Sterling’s ACL • Non - Purchase Credit Deteriorated reserve of $194M, established day 2 through provision expense • Non - Purchase Credit Deteriorated credit mark is accreted into earnings over four years using sum - of - years digits Fair Value Marks • $58M write - down of gross loans • $102M write - up of securities • $21M write - up of time deposits, subordinated debt and preferred equity CDI • Core deposit intangible of 0.50% of Sterling’s $21B core deposits, amortized over 10 years using sum - of - years digits 1 Based on 2022 median analyst consensus estimates as of April 16, 2021 2 Based on 2022 median analyst consensus noninterest expense estimates as of April 16, 2021, excluding amortization of intangibles
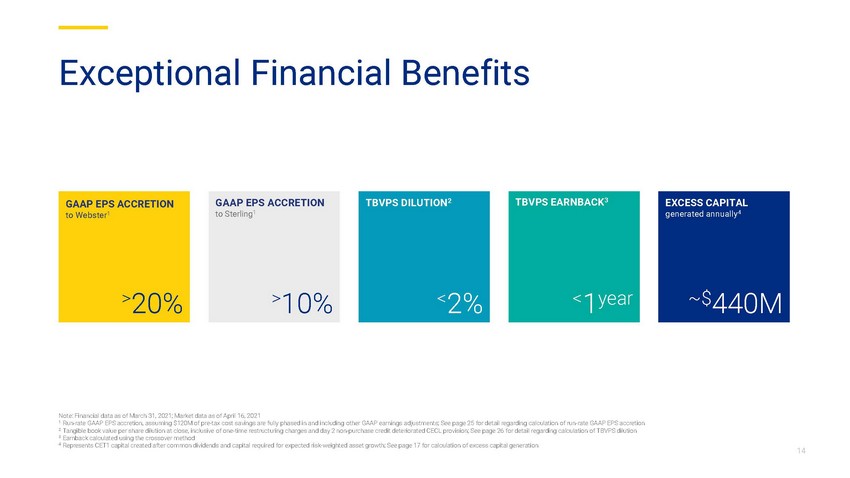
14 Exceptional Financial Benefits GAAP EPS ACCRETION to Sterling 1 > 10% GAAP EPS ACCRETION to Webster 1 > 20% TBVPS DILUTION 2 < 2% TBVPS EARNBACK 3 < 1 year EXCESS CAPITAL generated annually 4 ~$ 440M Note: Financial data as of March 31, 2021; Market data as of April 16, 2021 1 Run - rate GAAP EPS accretion, assuming $120M of pre - tax cost savings are fully phased in and including other GAAP earnings adjust ments; See page 25 for detail regarding calculation of run - rate GAAP EPS accretion 2 Tangible book value per share dilution at close, inclusive of one - time restructuring charges and day 2 non - purchase credit deteriorated C ECL provision; See page 26 for detail regarding calculation of TBVPS dilution 3 Earnback calculated using the crossover method 4 Represents CET1 capital created after common dividends and capital required for expected risk - weighted asset growth; See page 17 for calculation of excess capital generation

15 Enhanced Opportunity to Aggressively Grow HSA Bank Source: Company filings; SNL Financial 1 Includes all U.S. banks with total consolidated assets between $20 – 100B as of December 31, 2020, excluding banks involved in ma jor M&A transactions since 2015 2 Average of disclosed net interest margins of HealthEquity as of January 31, 2021 and Optum Bank as of December 31, 2020; HealthEquity net interest margin calculated as custodial revenue minus custodial costs divided by average cash balances HSA BANK IS A GROWTH ENGINE 2015 – 2020 account CAGR (%) WEBSTER MAXIMIZES HSA BANK’S PROFITABILITY net interest margin (%) 2% 11% 2.11% 3.15% HSA Bank Banks 1 Webster + Sterling HSA Bank’s standalone peers 2 MERGER ENHANCES STRONG GROWTH Combined company has ~2x balance sheet capacity to grow HSA Bank vs. Webster standalone HSA Bank will be a top priority for larger pro forma product and technology investments HSA Bank will continue to benefit from strong underlying market growth and opportunities to capture share
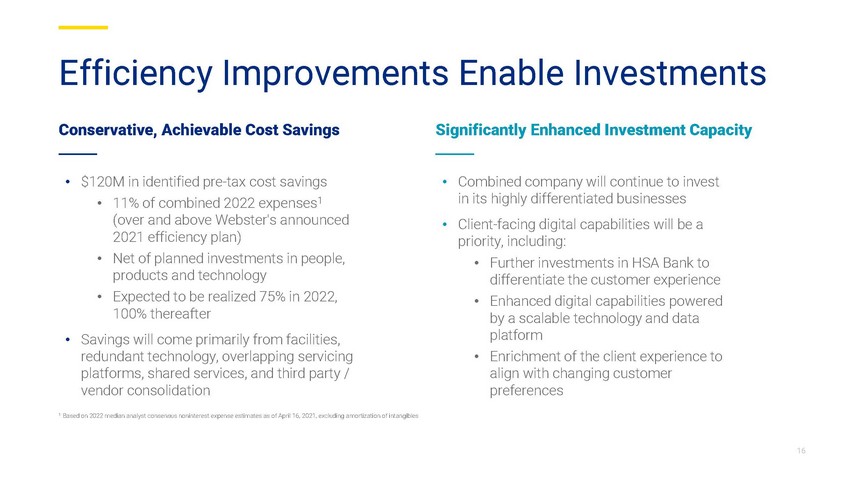
16 Efficiency Improvements Enable Investments Conservative, Achievable Cost Savings Significantly Enhanced Investment Capacity • $120M in identified pre - tax cost savings • 11% of combined 2022 expenses 1 ( over and above Webster's announced 2021 efficiency plan) • Net of planned investments in people, products and technology • Expected to be realized 75% in 2022, 100% thereafter • Savings will come primarily from facilities, redundant technology, overlapping servicing platforms, shared services, and third party / vendor consolidation • Combined company will continue to invest in its highly differentiated businesses • Client - facing digital capabilities will be a priority, including : • Further investments in HSA Bank to differentiate the customer experience • Enhanced digital capabilities powered by a scalable technology and data platform • Enrichment of the client experience to align with changing customer preferences 1 Based on 2022 median analyst consensus noninterest expense estimates as of April 16, 2021, excluding amortization of intangibles
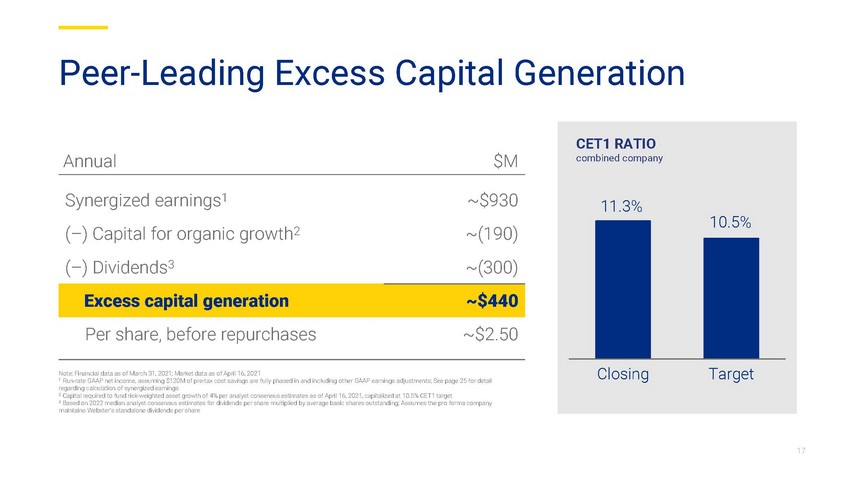
17 Peer - Leading Excess Capital Generation 10.5 % 11.3 % Closing Target Annual $M Synergized earnings 1 ~$930 ( – ) Capital for organic growth 2 ~(190) ( – ) Dividends 3 ~(300) Excess capital generation ~$440 Per share, before repurchases ~$2.50 Note: Financial data as of March 31, 2021; Market data as of April 16, 2021 1 Run - rate GAAP net income, assuming $120M of pre - tax cost savings are fully phased in and including other GAAP earnings adjustments; See page 25 for detail regarding calculation of synergized earnings 2 Capital required to fund risk - weighted asset growth of 4% per analyst consensus estimates as of April 16, 2021, capitalized at 10.5% CET 1 target 3 Based on 2022 median analyst consensus estimates for dividends per share multiplied by average basic shares outstanding; Assu me s the pro forma company maintains Webster’s standalone dividends per share CET1 RATIO combined company

18 Thorough, Reciprocal Due Diligence LOCAL DENSITY from New York to Boston BY THE NUMBERS EXTENSIVE SCOPE Consumer Banking Commercial Banking Digital Banking Credit CECL & Capital Stress Testing CRA Enterprise Risk Management BSA & Compliance Audit Finance, Tax & Accounting Legal Human Resources Loan & Deposit Operations Technology & Enterprise Data Facilities Marketing & Communications Significant sampling 200+ 20,000+ 2,000+ 50+ • Webster and Sterling employees participated • Outside professionals engaged • Documents and files exchanged • Loan files reviewed, split roughly evenly between both sides • Loan file review of COVID - impacted sectors (including restaurants, hospitality, office and investor real estate) and criticized/classified loans

19 Webster + Sterling $50 – 100B asset banks 1 Webster Sterling 2022 ROAA 1.08% 1.25% 1.40% 0.97 % 2022 ROATCE 13% 14% 17% 13 % CET1 11.9% 11.9% 11.3 % 9.9 % Price / run - rate 2022 EPS 13.5x 10.8x 10.9x 2 12.7 x Significant Upside Source: FactSet, SNL Financial Note : Financial data as of most recent quarter available; Market data as of April 16, 2021 1 Includes all U.S. banks with total consolidated assets between $50 – 100B as of December 31, 2020, excluding those party to a sizable trans action 2 Webster share price as of April 16, 2021 divided by pro forma run - rate fully - synergized GAAP EPS; See page 25 for detail regard ing calculation of run - rate GAAP EPS

20 Driving growth and value Creating scale Delivering exceptional performance Maintaining our values and culture Webster + Sterling

Appendix

22 Webster + Sterling Strong capital position and adequate loan loss reserves x Established ERM systems and platform x Positive regulatory relationships x Strong earnings performance, internal capital generation and capital management strategy x Diversified and low cost core funding and liquidity profile x Balanced business mix and balance sheet x Solid CRA program x Clear and consistent go - forward business strategy x M&A and integration history and experience x Management talent and bench strength x Delivers on All Key Elements Necessary for a Successful Merger

23 Shared Values We take personal responsibility for meeting our customers’ needs . We respect the dignity of every individual . We earn trust through ethical behavior . We give of ourselves in the communities we serve . We work together to achieve outstanding results . THE WEBSTER WAY Accountability Collaboration Integrity Initiative High Achievement STERLING — ABOVE AND BEYOND IS STANDARD PROCEDURE HERE

24 As of March 31, 2021 Illustrative at closing¹ ($B) Webster Sterling Webster + Sterling Assets Total cash and securities $10.3 $5.2 $13.9 Net loans 21.0 20.9 43.4 Total intangibles 0.6 1.8 2.7 Other assets 1.5 2.1 3.9 Total assets $33.3 $29.9 $63.9 Liabilities and Equity Deposits $28.5 $23.8 $51.9 Other liabilities 1.5 1.5 3.7 Total liabilities $30.0 $25.3 $55.6 Preferred equity $0.1 $0.1 $0.3 Common equity 3.1 4.5 8.0 Total equity $3.3 $4.6 $8.3 Total liabilities & equity $33.3 $29.9 $63.9 ACL / Gross loans² 1.54% 1.53% 1.48% NPLs / Loans³ 0.71% 0.80% 0.72% Common equity tier 1 risk-based capital 11.9% 11.9% 11.3% Bank level regulatory CRE / Total risk-based capital⁴ 164% 308% 253% Pro Forma B alance S heet Note: Financial data as of March 31, 2021; Market data as of April 16, 2021 1 Balance sheet metrics at closing assume growth rates for the standalone companies based on analyst consensus estimates as of April 16, 2021; Illustrative pro forma metrics include impacts of merger ad justments and purchase accounting 2 Includes PPP loans; Assumes each company maintains their current allowance for credit losses on loans and leases 3 Assumes pro forma NPLs at closing are equal to the sum of the standalone company NPLs as of March 31, 2021 and assumes the il lu strative loans at closing are based on median analyst consensus estimates, adjusted for purchase accounting adjustments 4 Concentration shown at the bank level ; Regulatory CRE includes loans on construction and land development, multifamily loans, non owner - occupied nonfarm nonresidenti al loans and commercial real estate purpose loans included in C&I; Illustrative CRE at closing assumes regulatory CRE as of March 31, 2021 grows at the median analyst consensus loan growth estimate; Total risk - based capital at closing assumes purchase accounting adjustments are also made at the bank level

Earnings Per Share Accretion 25 Note : Financial data as of March 31, 2021; Market data as of April 16, 2021 1 $ 120 million in pre - tax cost savings identified on a fully synergized basis, net of targeted investments 2 Core deposit intangible of 0.50% of Sterling’s $21 billion core deposits, amortized over 10 years using sum - of - years digits 3 Estimated fair value mark accreted back through earnings based on the estimated expected lives of individual assets and liabi li ties 4 Non - Purchase Credit Deteriorated credit mark is accreted into earnings over four years using sum - of - years digits 5 Reflects weighted - average fully diluted shares outstanding 6 Weighted average shares repurchased in 2022 assuming $400 million of share repurchases 7 IRR based on a 5 - year dividend discount model, assuming a 10.5% CET1 ratio target and a 13.0x terminal multiple, which represen ts the weighted average P/E multiple of the standalone companies 6 5 $M Webster 2022 EPS consensus median estimate $375 Sterling 2022 EPS consensus median estimate 400 After-tax transaction adjustments Fully phased-in cost savings¹ $95 Cost of financing (1) Add-back of Sterling standalone intangible amortization expense 11 Core deposit intangible amortization² (15) Fair market value adjustment amortization³ 4 Non-Purchase Credit Deteriorated loan credit mark accretion under CECL⁴ 61 Pro forma 2022 Webster net income $930 Webster weighted average diluted shares outstanding 91 Shares issued to Sterling 89 Weighted average shares repurchased (3) Pro forma weighted average shares outstanding 177 Webster 2022 standalone EPS $4.24 Sterling 2022 standalone EPS 2.20 Webster 2022 pro forma EPS $5.25 $ EPS accretion to Webster $1.01 % EPS accretion to Webster 23.9% Pro forma 2022 EPS $5.25 (x) Fixed exchange ratio 0.463x Pro forma 2022 EPS attributable to Sterling $2.43 $ EPS accretion to Sterling $0.23 % EPS accretion to Sterling 10.6% Internal rate of return >17% 7
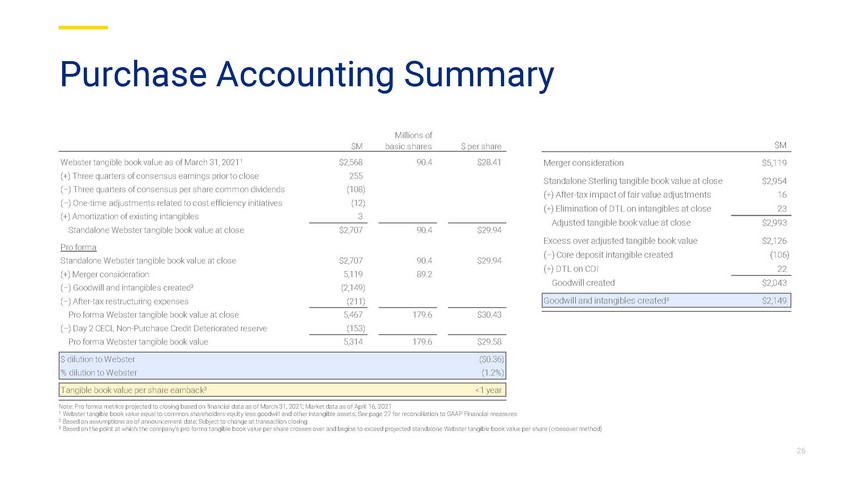
Purchase Accounting Summary 26 Millions of $M basic shares $ per share Webster tangible book value as of March 31, 2021¹ $2,568 90.4 $28.41 (+) Three quarters of consensus earnings prior to close 255 (–) Three quarters of consensus per share common dividends (108) (–) One-time adjustments related to cost efficiency initiatives (12) (+) Amortization of existing intangibles 3 Standalone Webster tangible book value at close $2,707 90.4 $29.94 Pro forma Standalone Webster tangible book value at close $2,707 90.4 $29.94 (+) Merger consideration 5,119 89.2 (–) Goodwill and intangibles created² (2,149) (–) After-tax restructuring expenses (211) Pro forma Webster tangible book value at close 5,467 179.6 $30.43 (–) Day 2 CECL Non-Purchase Credit Deteriorated reserve (153) Pro forma Webster tangible book value 5,314 179.6 $29.58 $ dilution to Webster ($0.36) % dilution to Webster (1.2%) Tangible book value per share earnback³ <1 year Note : Pro forma metrics projected to closing based on financial data as of March 31, 2021; Market data as of April 16, 2021 1 Webster tangible book value equal to common shareholders equity less goodwill and other intangible assets; See page 27 for re co nciliation to GAAP Financial measures 2 Based on assumptions as of announcement date; Subject to change at transaction closing 3 Based on the point at which the company’s pro forma tangible book value per share crosses over and begins to exceed projected s tandalone Webster tangible book value per share (crossover method)

27 Webster Financial Corporation (In thousands, except per share data) Tangible equity: Shareholders' equity (GAAP) $3,272,928 Less: Goodwill and other intangible assets (GAAP) 559,617 Tangible shareholders' equity (non-GAAP) $2,713,311 Tangible common equity: Tangible shareholders' equity (non-GAAP) $2,713,311 Less: Preferred stock (GAAP) 145,037 Tangible common shareholders' equity (non-GAAP) $2,568,274 Tangible book value per common share: Tangible common shareholders' equity (non-GAAP) $2,568,274 Common shares outstanding 90,410 Tangible book value per common share (non-GAAP) $28.41 Reconciliations to GAAP Financial Measures Note: Financial data as of March 31, 2021