Attached files
| file | filename |
|---|---|
| EX-99.1 - EX-99.1 - Williams Industrial Services Group Inc. | tmb-20210331xex99d1.htm |
| 8-K - 8-K - Williams Industrial Services Group Inc. | tmb-20210331x8k.htm |
Exhibit 99.2
| Q4 2020 Financial Results March 31, 2021 Tracy Pagliara President & CEO NYSE American: WLMS Randy Lay SVP & Chief Financial Officer |

| 2 2 Forward-looking Statement Disclaimer This presentation contains “forward-looking statements” within the meaning of the term set forth in the Private Securities Litigation Reform Act of 1995. The forward-looking statements include statements or expectations regarding the Company’s ability to perform in accordance with guidance, realize opportunities and successfully achieve its growth and strategic initiatives, including diversifying the Company, increasing its margins and managing costs, future demand for the Company’s services, expectations regarding future contract awards, revenues, Adjusted EBITDA and positive cash flow and other related matters. These statements reflect the Company’s current views of future events and financial performance and are subject to a number of risks and uncertainties, some of which have been, and may further be, exacerbated by the COVID-19 pandemic, including the Company’s level of indebtedness and ability to make payments on, and satisfy the financial and other covenants contained in, its debt facilities; its ability to engage in certain transactions and activities due to limitations and covenants contained in such facilities; its ability to generate sufficient cash resources to continue funding operations and the possibility that it may be unable to obtain any additional funding as needed or incur losses from operations in the future; exposure to market risks from changes in interest rates; failure to maintain effective internal control over financial reporting and disclosure controls and procedures; the Company’s ability to attract and retain qualified personnel, skilled workers, and key officers; failure to successfully implement or realize its business strategies, plans and objectives of management, and liquidity, operating and growth initiatives and opportunities, including its expansion into international markets; the loss of one or more of its significant customers; its competitive position; market outlook and trends in the Company’s industry, including the possibility of reduced investment in, or increased regulation of, nuclear power plants, declines in public infrastructure construction and reductions in government funding; costs exceeding estimates the Company uses to set fixed-price contracts; harm to the Company’s reputation or profitability due to, among other things, internal operational issues, poor subcontractor performances or subcontractor insolvency; potential insolvency or financial distress of third parties, including customers and suppliers; the Company’s contract backlog and related amounts to be recognized as revenue; its ability to maintain its safety record, the risks of potential liability and adequacy of insurance; adverse changes in the Company’s relationships with suppliers, vendors, and subcontractors; compliance with environmental, health, safety and other related laws and regulations; limitations or modifications to indemnification regulations of the U.S. or Canada; the Company’s expected financial condition, future cash flows, results of operations and future capital and other expenditures; the impact of general economic conditions including the current economic disruption and any recession resulting from the COVID-19 pandemic; the impact of the COVID-19 pandemic on the Company’s business, results of operations, financial condition, and cash flows; the potential for additional COVID-19 cases to occur at the Company’s active or future job sites, which potentially could impact cost and labor availability; information technology vulnerabilities and cyberattacks on the Company’s networks; the Company’s failure to comply with applicable laws and regulations, including, but not limited to, those relating to privacy and anti-bribery; the Company’s participation in multiemployer pension plans; the impact of any disruptions resulting from the expiration of collective bargaining agreements; the impact of natural disasters and other severe catastrophic events (such as the ongoing COVID-19 pandemic); the impact of changes in tax regulations and laws, including future income tax payments and utilization of net operating loss and foreign tax credit carryforwards; volatility of the market price for the Company’s common stock; the Company’s ability to maintain its stock exchange listing; the effects of anti-takeover provisions in the Company’s organizational documents and Delaware law; the impact of future offerings or sales of the Company’s common stock on the market price of such stock; expected outcomes of legal or regulatory proceedings and their anticipated effects on the Company’s results of operations; and any other statements regarding future growth, future cash needs, future operations, business plans and future financial results. Other important factors that may cause actual results to differ materially from those expressed in the forward-looking statements are discussed in the Company’s filings with the U.S. Securities and Exchange Commission, including the section of the Annual Report on Form 10-K for its 2020 fiscal year titled “Risk Factors.” Any forward-looking statement speaks only as of the date of this presentation. Except as may be required by applicable law, the Company undertakes no obligation to publicly update or revise any forward-looking statements, whether as a result of new information, future events or otherwise, and you are cautioned not to rely upon them unduly. Non-GAAP Financial Measures This presentation will discuss some non-GAAP financial measures, which the Company believes are useful in evaluating its performance. You should not consider the presentation of this additional information in isolation or as a substitute for results prepared in accordance with GAAP. The Company has provided reconciliations of comparable GAAP to non-GAAP measures in tables found on the slides following the “Supplemental Information” slide of this presentation. Cautionary Notes Note: Unless otherwise noted, all discussion is based upon continuing operations. |
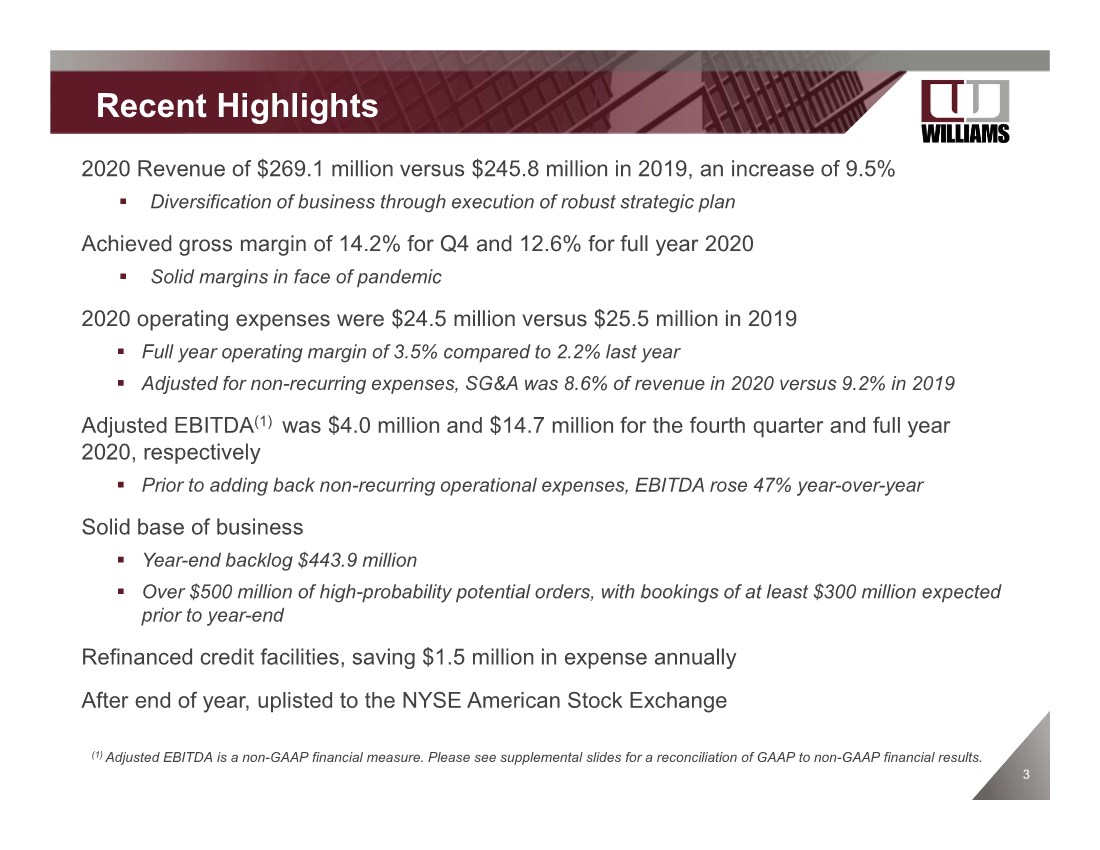
| 3 Recent Highlights 2020 Revenue of $269.1 million versus $245.8 million in 2019, an increase of 9.5% . Diversification of business through execution of robust strategic plan Achieved gross margin of 14.2% for Q4 and 12.6% for full year 2020 . Solid margins in face of pandemic 2020 operating expenses were $24.5 million versus $25.5 million in 2019 . Full year operating margin of 3.5% compared to 2.2% last year . Adjusted for non-recurring expenses, SG&A was 8.6% of revenue in 2020 versus 9.2% in 2019 Adjusted EBITDA(1) was $4.0 million and $14.7 million for the fourth quarter and full year 2020, respectively . Prior to adding back non-recurring operational expenses, EBITDA rose 47% year-over-year Solid base of business . Year-end backlog $443.9 million . Over $500 million of high-probability potential orders, with bookings of at least $300 million expected prior to year-end Refinanced credit facilities, saving $1.5 million in expense annually After end of year, uplisted to the NYSE American Stock Exchange (1) Adjusted EBITDA is a non-GAAP financial measure. Please see supplemental slides for a reconciliation of GAAP to non-GAAP financial results. |
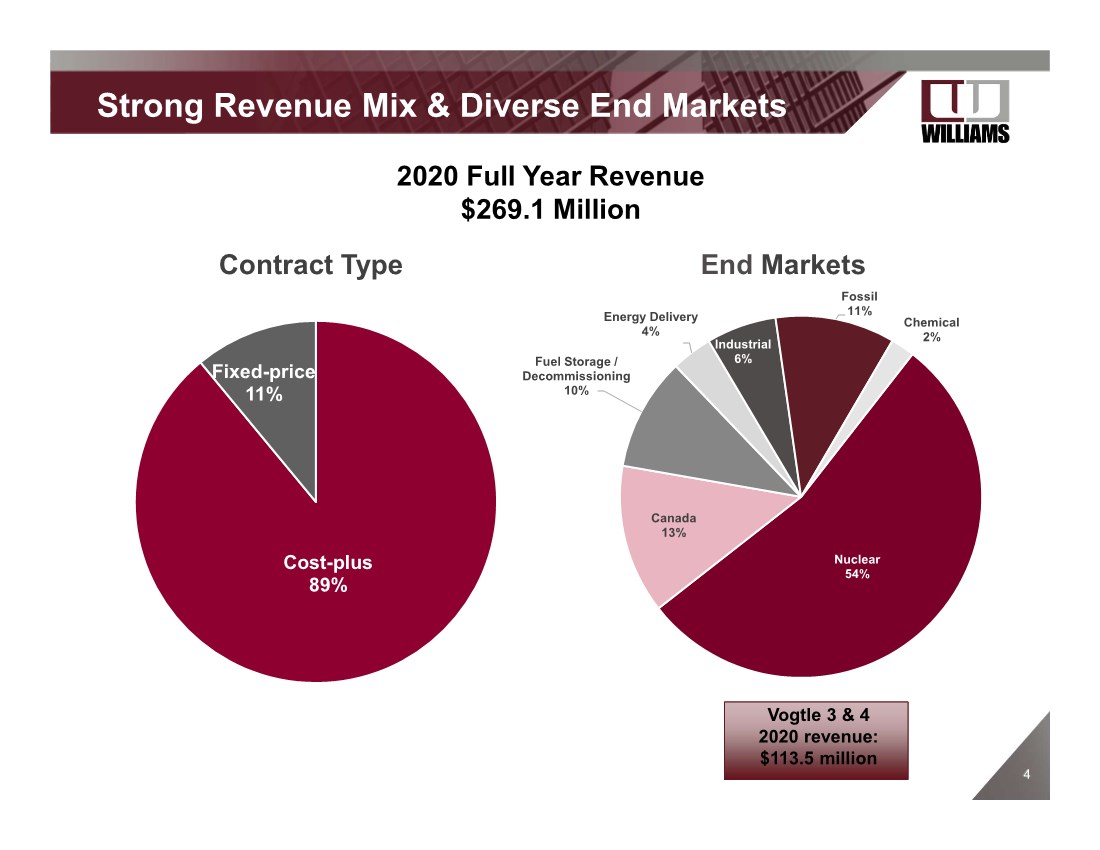
| 4 4 Cost-plus 89% Fixed-price 11% Strong Revenue Mix & Diverse End Markets 2020 Full Year Revenue $269.1 Million Contract Type End Markets (1) Vogtle 3 & 4 2020 revenue: $113.5 million Nuclear 54% Canada 13% Fuel Storage / Decommissioning 10% Energy Delivery 4% Industrial 6% Fossil 11% Chemical 2% |
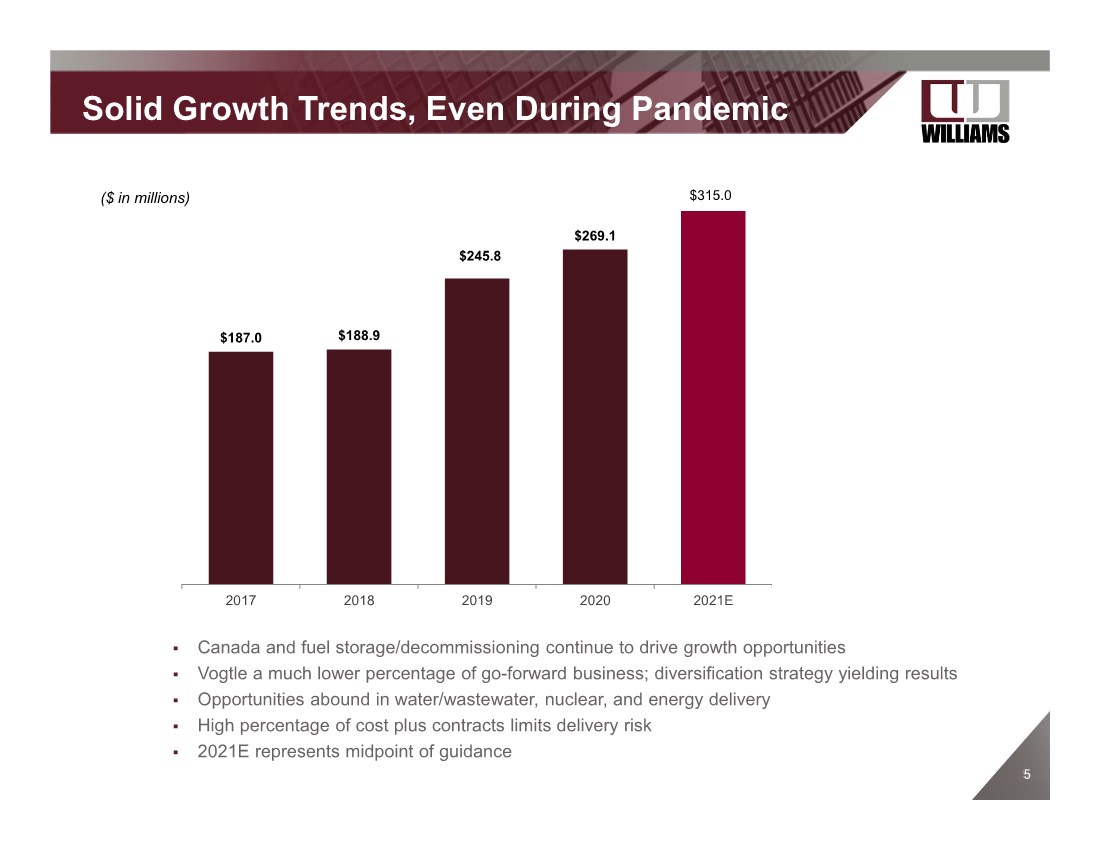
| 5 5 Solid Growth Trends, Even During Pandemic ($ in millions) $187.0 $188.9 $245.8 $269.1 2017 2018 2019 2020 2021E $315.0 . Canada and fuel storage/decommissioning continue to drive growth opportunities . Vogtle a much lower percentage of go-forward business; diversification strategy yielding results . Opportunities abound in water/wastewater, nuclear, and energy delivery . High percentage of cost plus contracts limits delivery risk . 2021E represents midpoint of guidance |
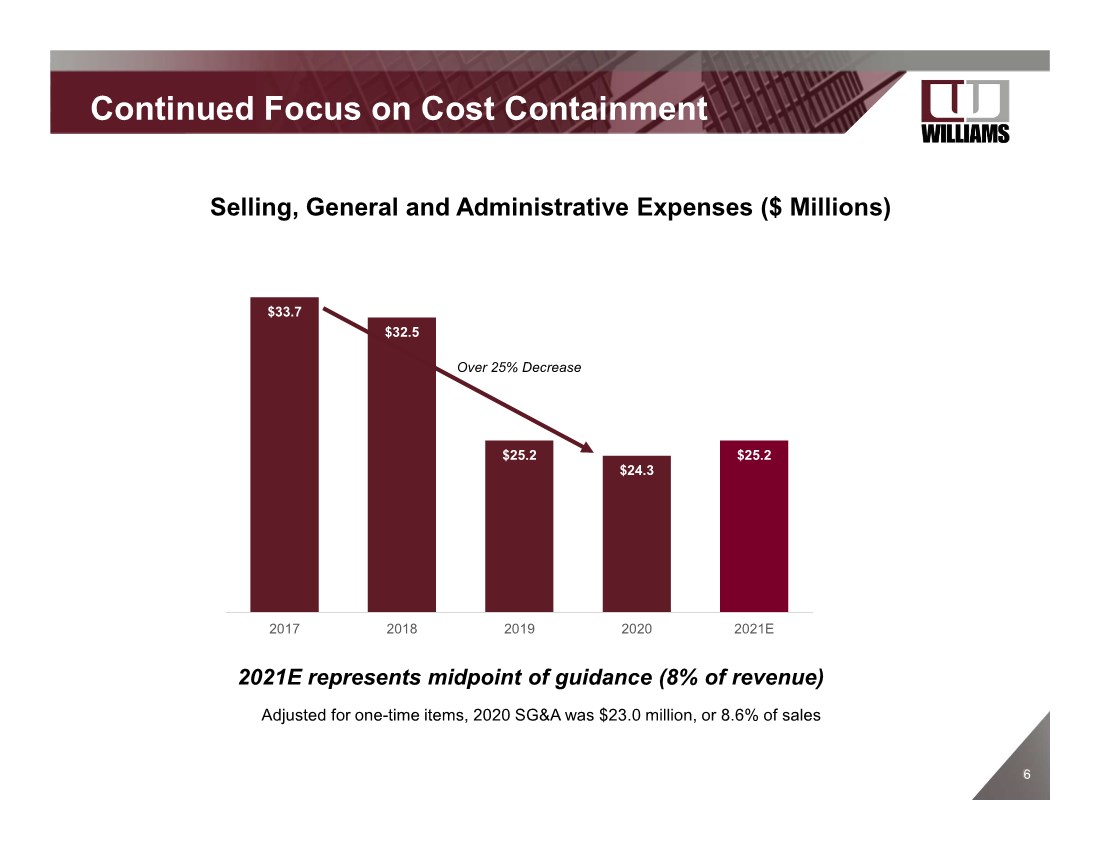
| 6 6 Continued Focus on Cost Containment $33.7 $32.5 $25.2 $24.3 $25.2 2017 2018 2019 2020 2021E Selling, General and Administrative Expenses ($ Millions) Over 25% Decrease 2021E represents midpoint of guidance (8% of revenue) Adjusted for one-time items, 2020 SG&A was $23.0 million, or 8.6% of sales |
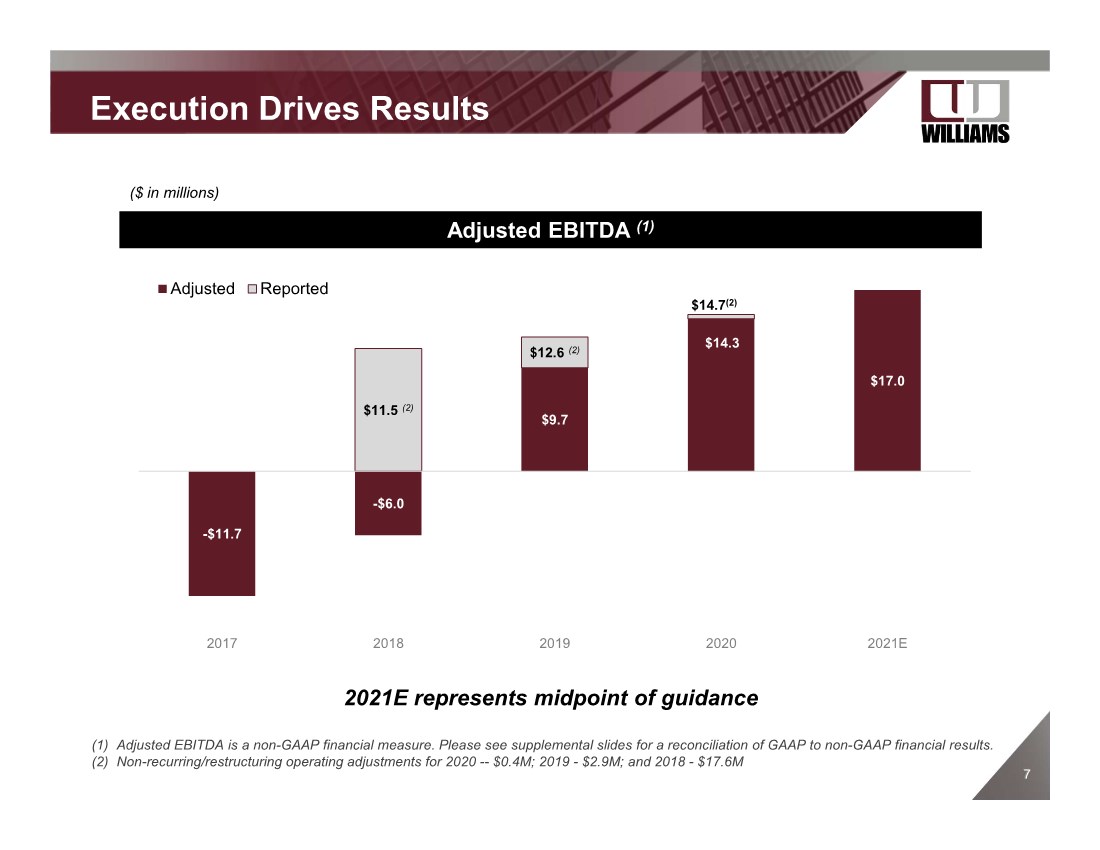
| 7 7 Execution Drives Results (1) Adjusted EBITDA is a non-GAAP financial measure. Please see supplemental slides for a reconciliation of GAAP to non-GAAP financial results. (2) Non-recurring/restructuring operating adjustments for 2020 -- $0.4M; 2019 - $2.9M; and 2018 - $17.6M -$11.7 -$6.0 $9.7 $17.0 $11.5 (2) $12.6 (2) $14.7(2) 2017 2018 2019 2020 2021E Adjusted Reported ($ in millions) Adjusted EBITDA (1) 2021E represents midpoint of guidance $14.3 |
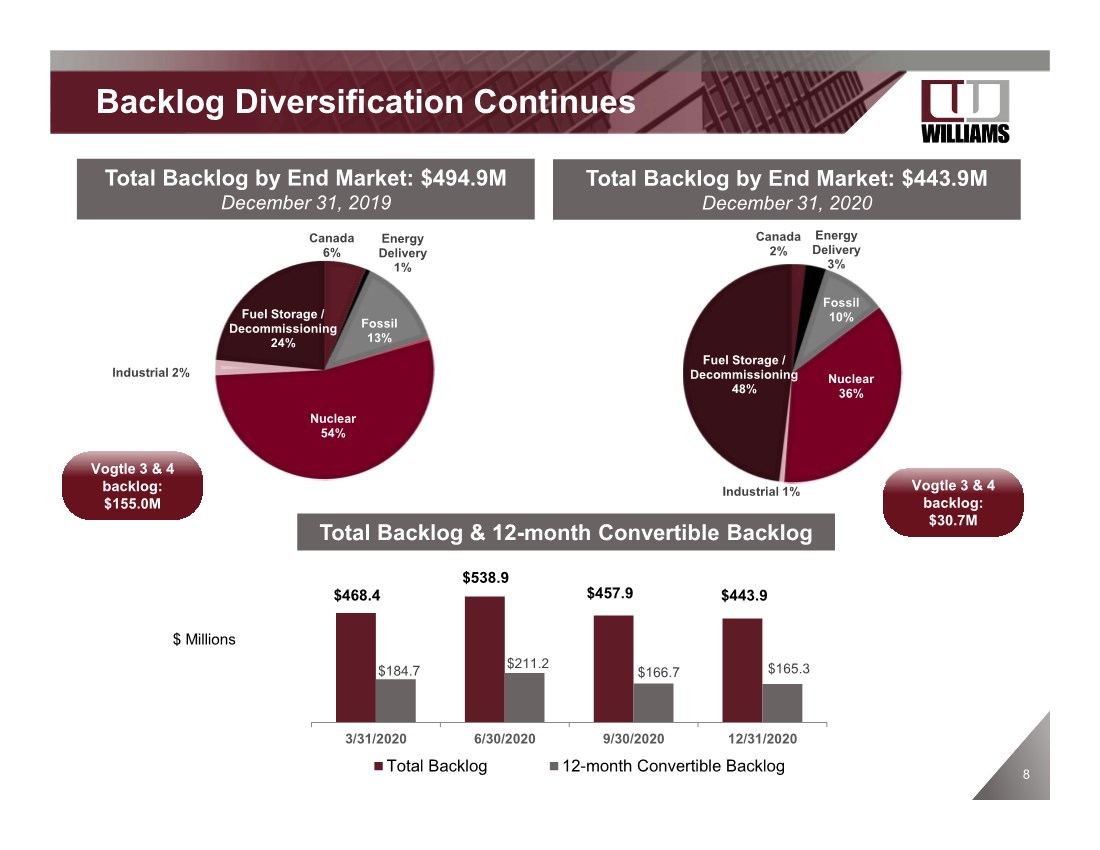
| 8 Backlog Diversification Continues Total Backlog by End Market: $494.9M December 31, 2019 Vogtle 3 & 4 backlog: $155.0M Canada 6% Energy Delivery 1% Fossil 13% Nuclear 54% Industrial 2% Fuel Storage / Decommissioning 24% Total Backlog by End Market: $443.9M December 31, 2020 $ Millions Vogtle 3 & 4 backlog: $30.7M $468.4 $538.9 $184.7 $211.2 $166.7 $165.3 3/31/2020 6/30/2020 9/30/2020 12/31/2020 Total Backlog 12-month Convertible Backlog Total Backlog & 12-month Convertible Backlog $457.9 $443.9 Canada 2% Energy Delivery 3% Fossil 10% Nuclear 36% Industrial 1% Fuel Storage / Decommissioning 48% |
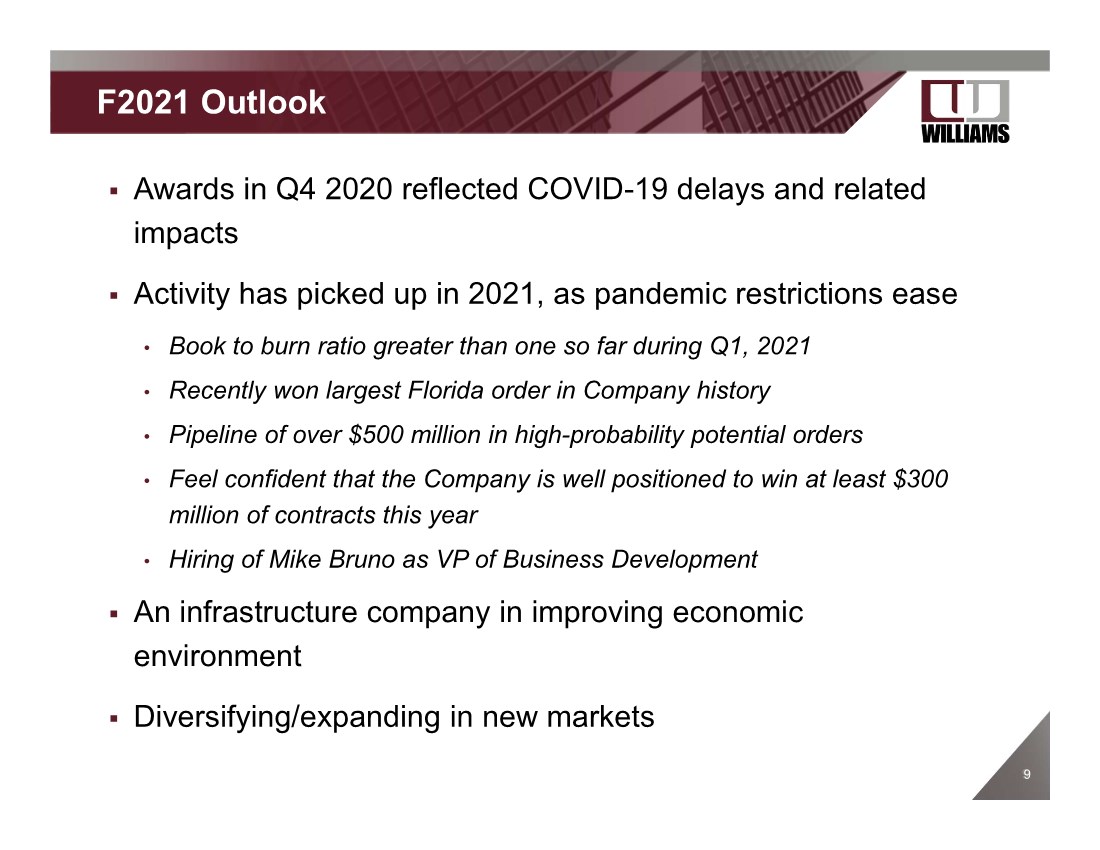
| 9 9 F2021 Outlook . Awards in Q4 2020 reflected COVID-19 delays and related impacts . Activity has picked up in 2021, as pandemic restrictions ease • Book to burn ratio greater than one so far during Q1, 2021 • Recently won largest Florida order in Company history • Pipeline of over $500 million in high-probability potential orders • Feel confident that the Company is well positioned to win at least $300 million of contracts this year • Hiring of Mike Bruno as VP of Business Development . An infrastructure company in improving economic environment . Diversifying/expanding in new markets |
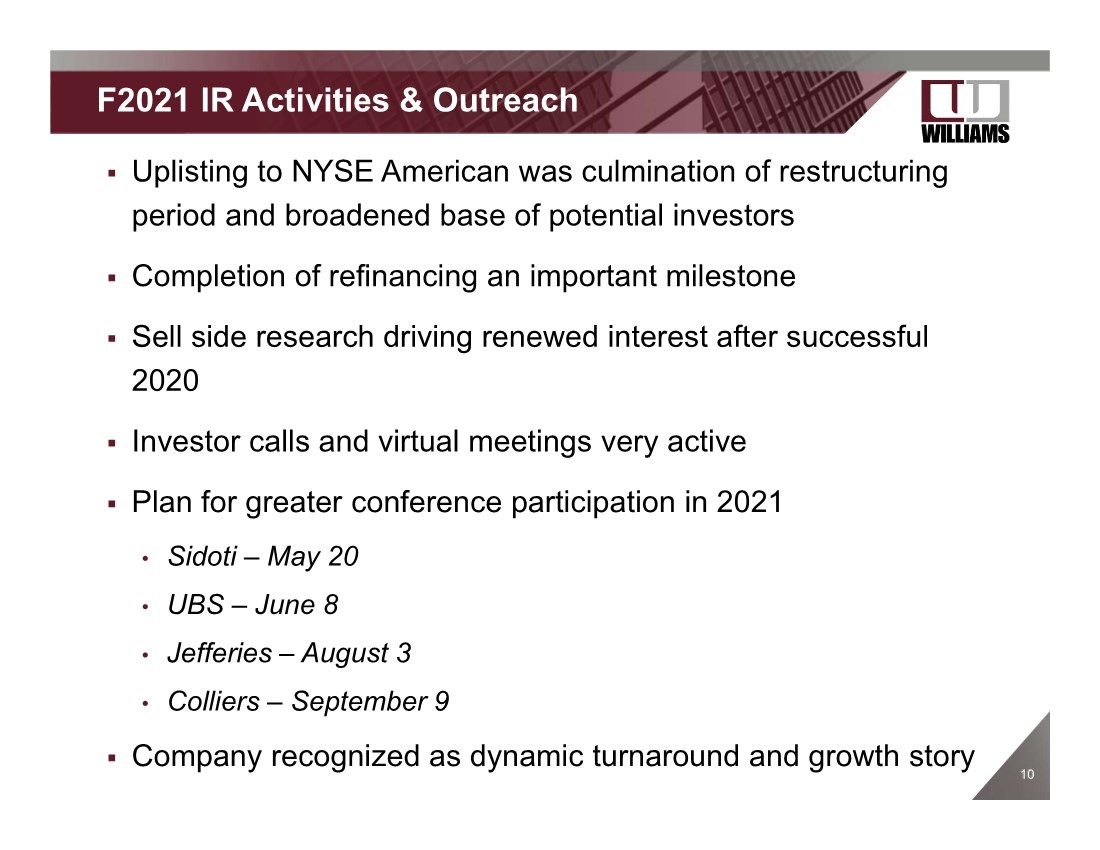
| 10 10 F2021 IR Activities & Outreach . Uplisting to NYSE American was culmination of restructuring period and broadened base of potential investors . Completion of refinancing an important milestone . Sell side research driving renewed interest after successful 2020 . Investor calls and virtual meetings very active . Plan for greater conference participation in 2021 • Sidoti – May 20 • UBS – June 8 • Jefferies – August 3 • Colliers – September 9 . Company recognized as dynamic turnaround and growth story |
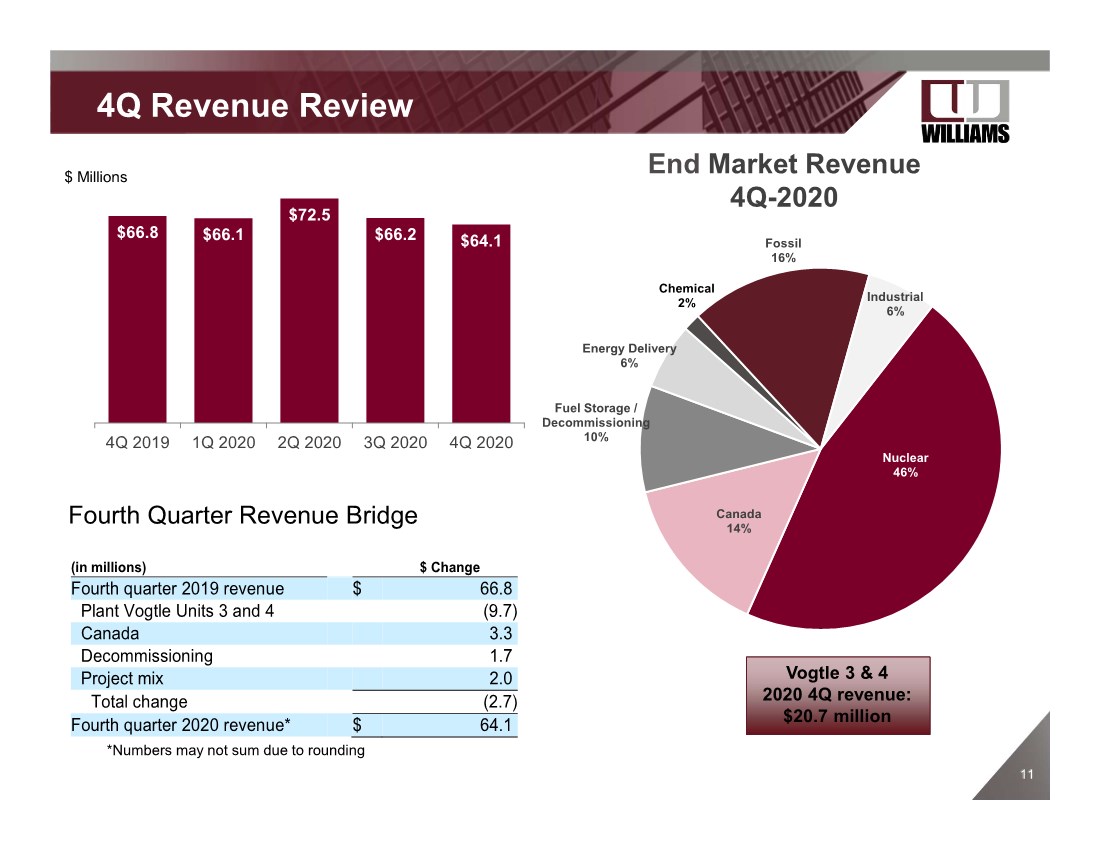
| 11 11 Nuclear 46% Canada 14% Fuel Storage / Decommissioning 10% Energy Delivery 6% Chemical 2% Fossil 16% Industrial 6% 4Q Revenue Review End Market Revenue 4Q-2020 Vogtle 3 & 4 2020 4Q revenue: $20.7 million $66.8 $66.1 $72.5 $66.2 $64.1 4Q 2019 1Q 2020 2Q 2020 3Q 2020 4Q 2020 Fourth Quarter Revenue Bridge $ Millions *Numbers may not sum due to rounding (in millions) $ Change Fourth quarter 2019 revenue $ 66.8 Plant Vogtle Units 3 and 4 (9.7) Canada 3.3 Decommissioning 1.7 Project mix 2.0 Total change (2.7) Fourth quarter 2020 revenue* $ 64.1 |
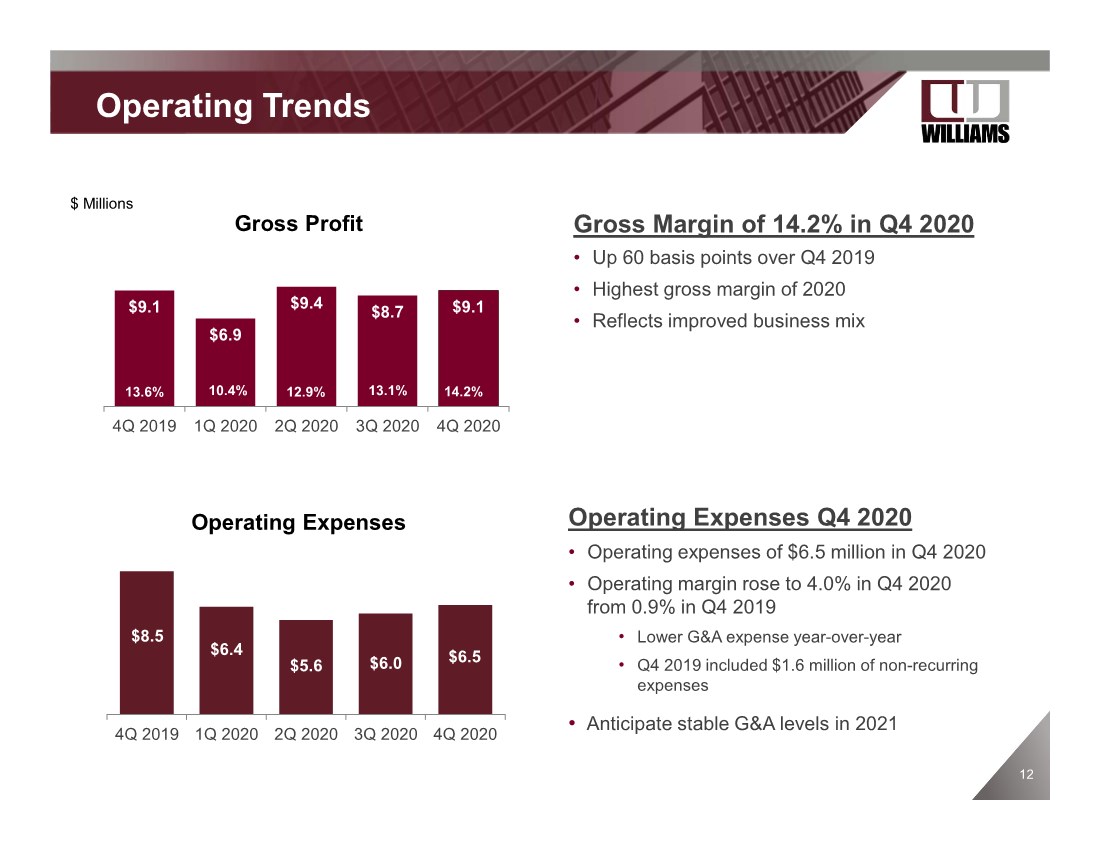
| 12 Operating Trends Gross Margin of 14.2% in Q4 2020 • Up 60 basis points over Q4 2019 • Highest gross margin of 2020 • Reflects improved business mix $9.1 $6.9 $9.4 $8.7 $9.1 4Q 2019 1Q 2020 2Q 2020 3Q 2020 4Q 2020 12.9% 13.6% $ Millions 14.2% $8.5 $6.4 $5.6 $6.0 $6.5 4Q 2019 1Q 2020 2Q 2020 3Q 2020 4Q 2020 Gross Profit Operating Expenses Q4 2020 • Operating expenses of $6.5 million in Q4 2020 • Operating margin rose to 4.0% in Q4 2020 from 0.9% in Q4 2019 • Lower G&A expense year-over-year • Q4 2019 included $1.6 million of non-recurring expenses • Anticipate stable G&A levels in 2021 10.4% Operating Expenses 13.1% |
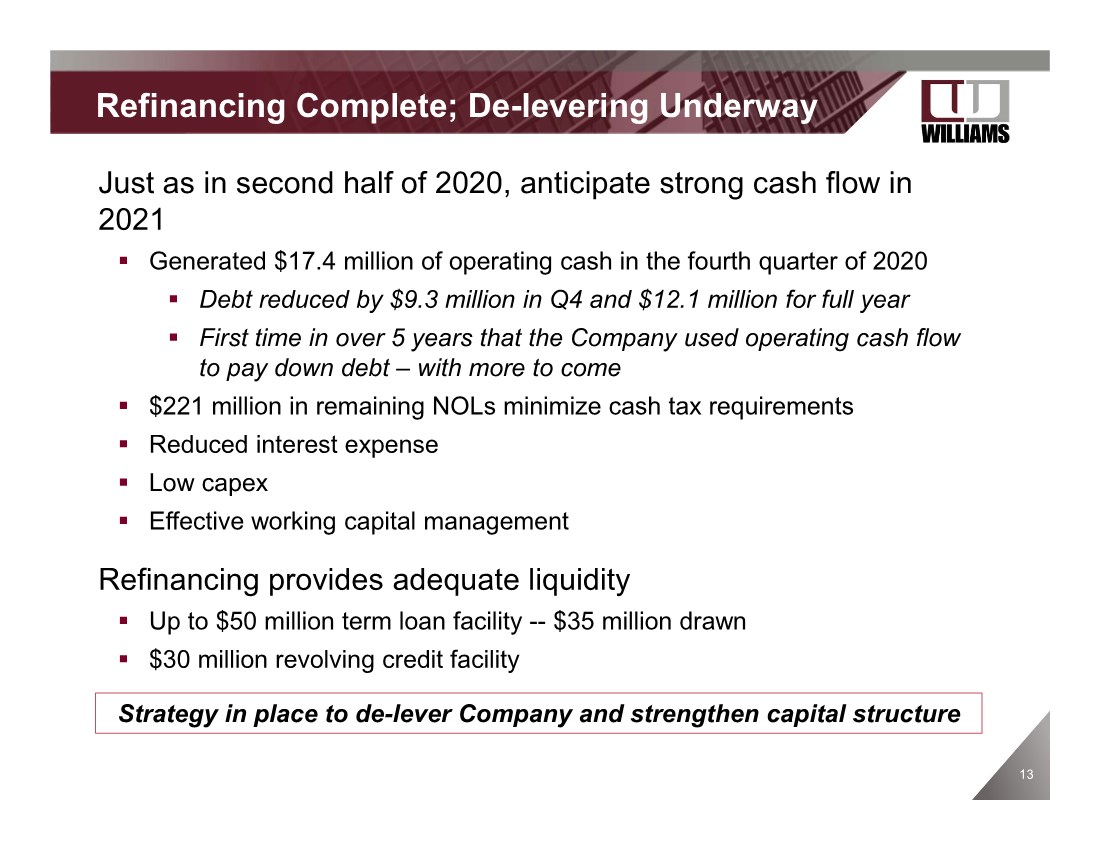
| 13 Refinancing Complete; De-levering Underway Just as in second half of 2020, anticipate strong cash flow in 2021 . Generated $17.4 million of operating cash in the fourth quarter of 2020 . Debt reduced by $9.3 million in Q4 and $12.1 million for full year . First time in over 5 years that the Company used operating cash flow to pay down debt – with more to come . $221 million in remaining NOLs minimize cash tax requirements . Reduced interest expense . Low capex . Effective working capital management Refinancing provides adequate liquidity . Up to $50 million term loan facility -- $35 million drawn . $30 million revolving credit facility Strategy in place to de-lever Company and strengthen capital structure |
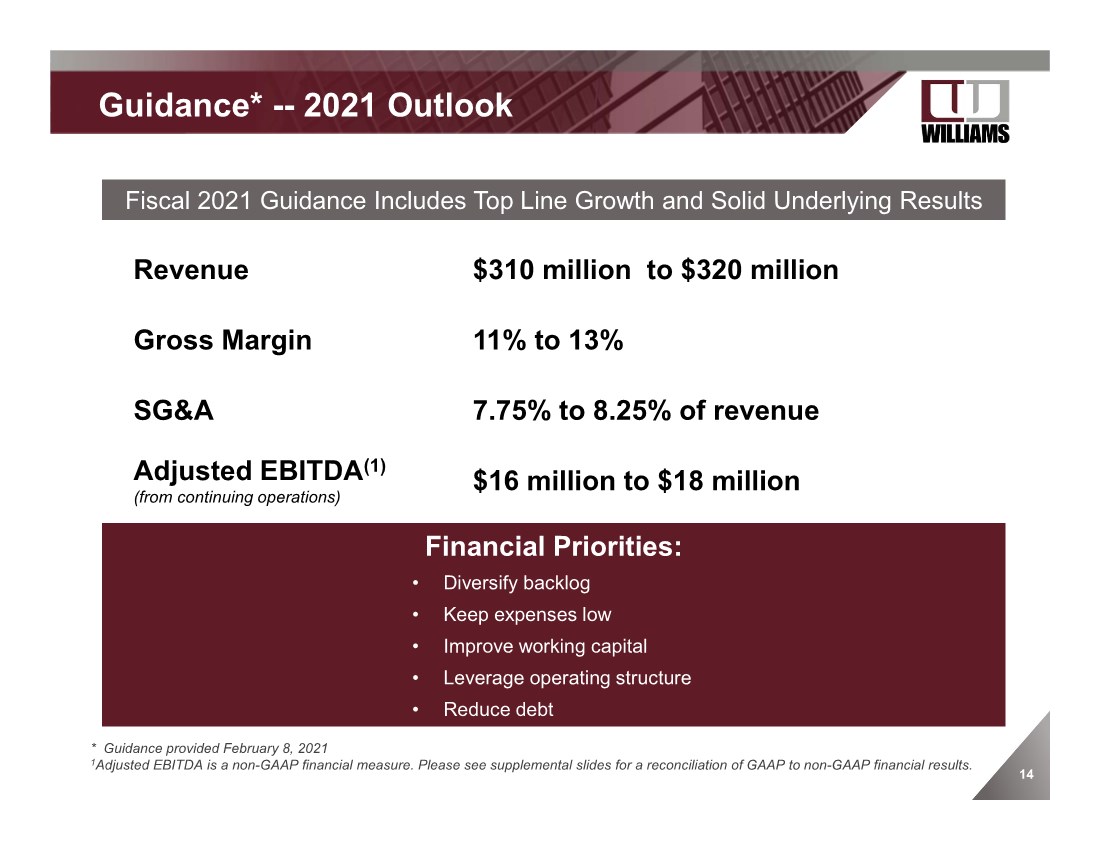
| 14 . Guidance* -- 2021 Outlook * Guidance provided February 8, 2021 1Adjusted EBITDA is a non-GAAP financial measure. Please see supplemental slides for a reconciliation of GAAP to non-GAAP financial results. Fiscal 2021 Guidance Includes Top Line Growth and Solid Underlying Results Revenue $310 million to $320 million Gross Margin 11% to 13% SG&A 7.75% to 8.25% of revenue Adjusted EBITDA(1) (from continuing operations) $16 million to $18 million Financial Priorities: • Diversify backlog • Keep expenses low • Improve working capital • Leverage operating structure • Reduce debt |
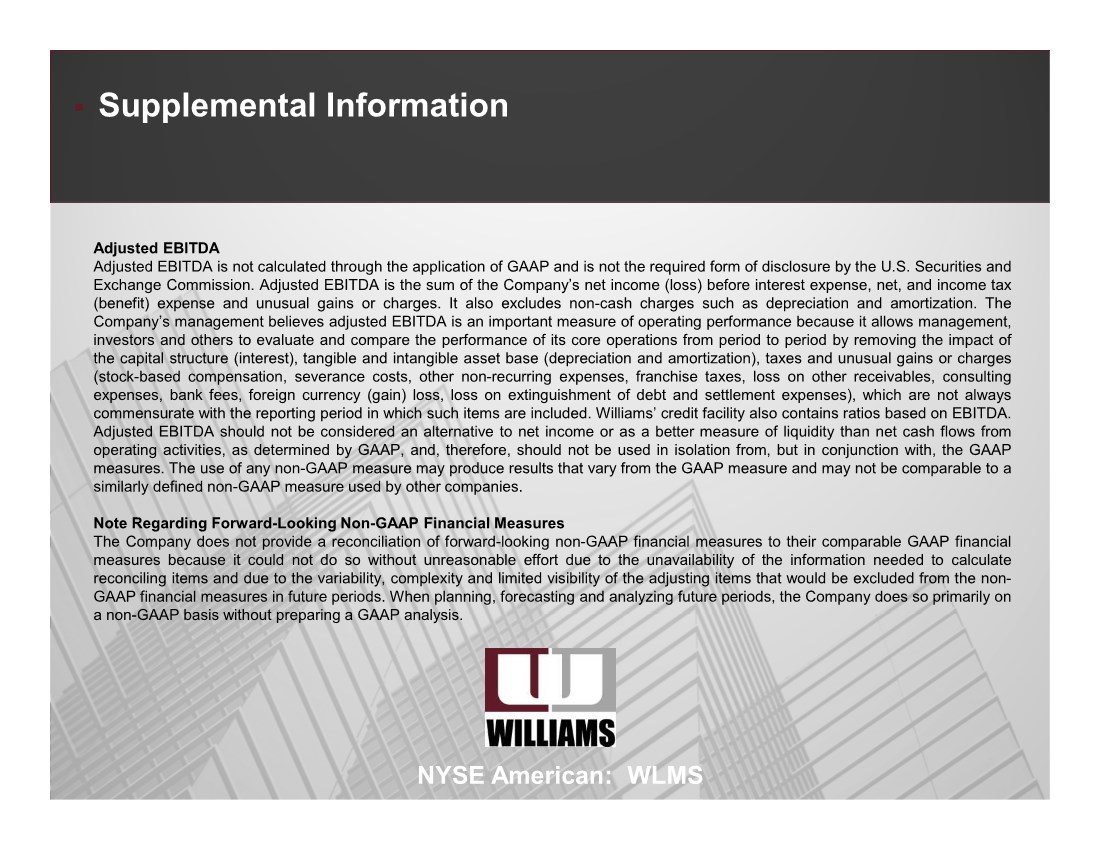
| NYSE American: WLMS Adjusted EBITDA Adjusted EBITDA is not calculated through the application of GAAP and is not the required form of disclosure by the U.S. Securities and Exchange Commission. Adjusted EBITDA is the sum of the Company’s net income (loss) before interest expense, net, and income tax (benefit) expense and unusual gains or charges. It also excludes non-cash charges such as depreciation and amortization. The Company’s management believes adjusted EBITDA is an important measure of operating performance because it allows management, investors and others to evaluate and compare the performance of its core operations from period to period by removing the impact of the capital structure (interest), tangible and intangible asset base (depreciation and amortization), taxes and unusual gains or charges (stock-based compensation, severance costs, other non-recurring expenses, franchise taxes, loss on other receivables, consulting expenses, bank fees, foreign currency (gain) loss, loss on extinguishment of debt and settlement expenses), which are not always commensurate with the reporting period in which such items are included. Williams’ credit facility also contains ratios based on EBITDA. Adjusted EBITDA should not be considered an alternative to net income or as a better measure of liquidity than net cash flows from operating activities, as determined by GAAP, and, therefore, should not be used in isolation from, but in conjunction with, the GAAP measures. The use of any non-GAAP measure may produce results that vary from the GAAP measure and may not be comparable to a similarly defined non-GAAP measure used by other companies. Note Regarding Forward-Looking Non-GAAP Financial Measures The Company does not provide a reconciliation of forward-looking non-GAAP financial measures to their comparable GAAP financial measures because it could not do so without unreasonable effort due to the unavailability of the information needed to calculate reconciling items and due to the variability, complexity and limited visibility of the adjusting items that would be excluded from the non- GAAP financial measures in future periods. When planning, forecasting and analyzing future periods, the Company does so primarily on a non-GAAP basis without preparing a GAAP analysis. . Supplemental Information |
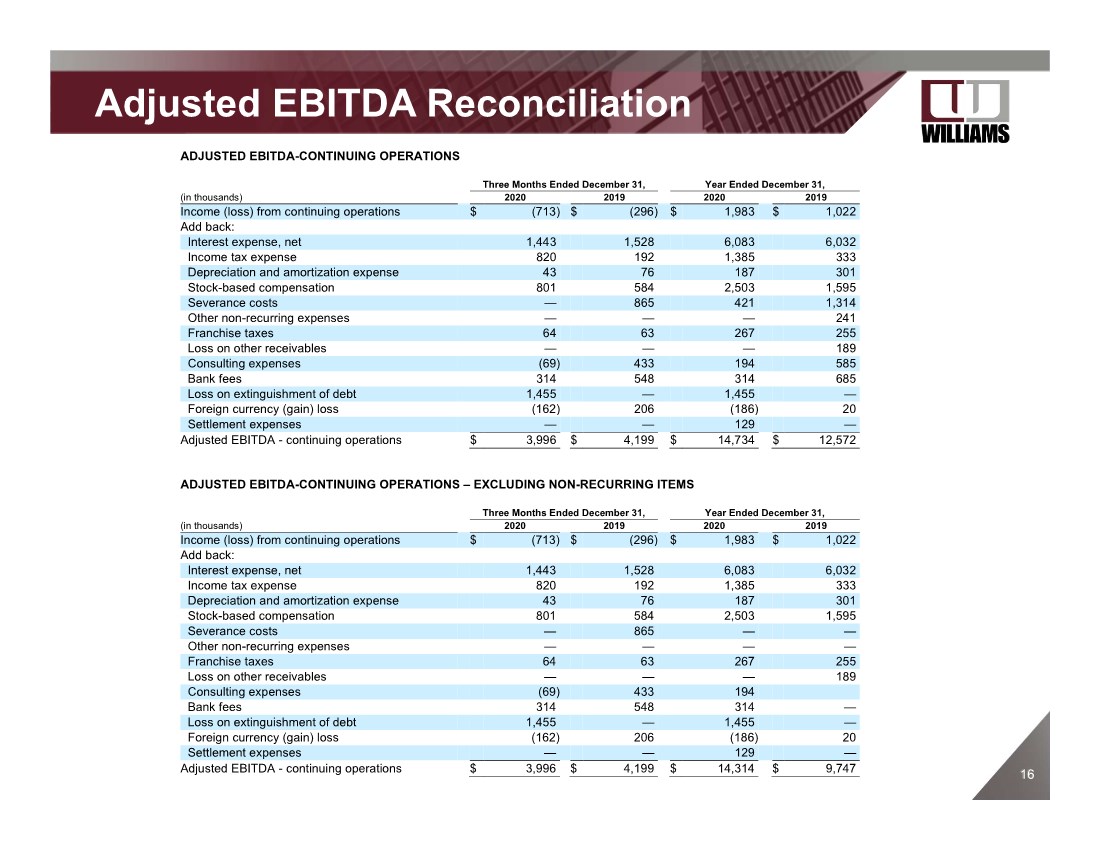
| 16 16 Adjusted EBITDA Reconciliation ADJUSTED EBITDA-CONTINUING OPERATIONS Three Months Ended December 31, Year Ended December 31, (in thousands) 2020 2019 2020 2019 Income (loss) from continuing operations $ (713) $ (296) $ 1,983 $ 1,022 Add back: Interest expense, net 1,443 1,528 6,083 6,032 Income tax expense 820 192 1,385 333 Depreciation and amortization expense 43 76 187 301 Stock-based compensation 801 584 2,503 1,595 Severance costs — 865 421 1,314 Other non-recurring expenses — — — 241 Franchise taxes 64 63 267 255 Loss on other receivables — — — 189 Consulting expenses (69) 433 194 585 Bank fees 314 548 314 685 Loss on extinguishment of debt 1,455 — 1,455 — Foreign currency (gain) loss (162) 206 (186) 20 Settlement expenses — — 129 — Adjusted EBITDA - continuing operations $ 3,996 $ 4,199 $ 14,734 $ 12,572 ADJUSTED EBITDA-CONTINUING OPERATIONS – EXCLUDING NON-RECURRING ITEMS Three Months Ended December 31, Year Ended December 31, (in thousands) 2020 2019 2020 2019 Income (loss) from continuing operations $ (713) $ (296) $ 1,983 $ 1,022 Add back: Interest expense, net 1,443 1,528 6,083 6,032 Income tax expense 820 192 1,385 333 Depreciation and amortization expense 43 76 187 301 Stock-based compensation 801 584 2,503 1,595 Severance costs — 865 — — Other non-recurring expenses — — — — Franchise taxes 64 63 267 255 Loss on other receivables — — — 189 Consulting expenses (69) 433 194 Bank fees 314 548 314 — Loss on extinguishment of debt 1,455 — 1,455 — Foreign currency (gain) loss (162) 206 (186) 20 Settlement expenses — — 129 — Adjusted EBITDA - continuing operations $ 3,996 $ 4,199 $ 14,314 $ 9,747 |
| 17 17 Fourth Quarter 2020 Revenue Bridge (in millions) $ Change Fourth quarter 2019 revenue $ 66.8 Plant Vogtle Units 3 and 4 (9.7) Canada 3.3 Decommissioning 1.7 Project mix 2.0 Total change (2.7) Fourth quarter 2020 revenue* $ 64.1 2020 Full Year Revenue Bridge (in millions) $ Change 2019 revenue $ 245.8 Plant Vogtle Units 3 and 4 14.6 Canada 18.8 Decommissioning 18.8 Nuclear Maintenance (19.1) Oil & Gas (8.1) Project mix (1.7) Total change 23.3 2020 revenue* $ 269.1 *Numbers may not sum due to rounding Revenue Bridge |