Attached files
| file | filename |
|---|---|
| EX-99.3 - EX-99.3 - NELNET INC | a117826_shareholderxlett.htm |
| EX-99.1 - EX-99.1 - NELNET INC | aex991_22521xearningsrelea.htm |
| 8-K - 8-K - NELNET INC | nni-20210225.htm |
For Release: February 25, 2021
Investor Contact: Phil Morgan, 402.458.3038
Nelnet, Inc. supplemental financial information for the fourth quarter 2020
(All dollars are in thousands, except per share amounts, unless otherwise noted)
The following information should be read in connection with Nelnet, Inc.'s (the “Company's”) press release for fourth quarter 2020 earnings, dated February 25, 2021, and the Company's Annual Report on Form 10-K for the year ended December 31, 2020.
Forward-looking and cautionary statements
This report contains forward-looking statements and information that are based on management's current expectations as of the date of this document. Statements that are not historical facts, including statements about the Company's plans and expectations for future financial condition, results of operations or economic performance, or that address management's plans and objectives for future operations, and statements that assume or are dependent upon future events, are forward-looking statements. The words “anticipate,” “assume,” “believe,” “continue,” “could,” “estimate,” “expect,” “forecast,” “future,” “intend,” “may,” “plan,” “potential,” “predict,” “scheduled,” “should,” “will,” “would,” and similar expressions, as well as statements in future tense, are intended to identify forward-looking statements.
The forward-looking statements are based on assumptions and analyses made by management in light of management's experience and its perception of historical trends, current conditions, expected future developments, and other factors that management believes are appropriate under the circumstances. These statements are subject to known and unknown risks, uncertainties, assumptions, and other factors that may cause the actual results and performance to be materially different from any future results or performance expressed or implied by such forward-looking statements. These factors include, among others, the risks and uncertainties set forth in the “Risk Factors” section of the Company's Annual Report on Form 10-K for the year ended December 31, 2020 (the "2020 Annual Report"), and include such risks and uncertainties as:
•risks and uncertainties related to the severity, magnitude, and duration of the Coronavirus Disease 2019 (“COVID-19”) pandemic, including changes in the macroeconomic environment and consumer behavior, restrictions on business, educational, individual, or travel activities intended to slow the spread of the pandemic, and volatility in market conditions resulting from the pandemic, including interest rates, the value of equities, and other financial assets;
•risks related to the ability to successfully maintain and increase allocated volumes of student loans serviced by the Company under existing and any future servicing contracts with the U.S. Department of Education (the "Department"), which current contracts accounted for 27 percent of the Company's revenue in 2020, risks to the Company related to the Department's initiatives to procure new contracts for federal student loan servicing, including the pending and uncertain nature of the Department's NextGen and ISS procurement processes (under which awards of new NextGen contracts have been made to other service providers), the possibility that awards or evaluations of proposals may be challenged by various interested parties and may not be finalized or implemented for an extended period of time or at all, risks that the Company may not be successful in obtaining any of such potential new contracts, and risks related to the Company's ability to comply with agreements with third-party customers for the servicing of Federal Direct Loan Program, Federal Family Education Loan Program (the "FFEL Program" or "FFELP"), and private education and consumer loans;
•loan portfolio risks such as interest rate basis and repricing risk resulting from the fact that the interest rate characteristics of the student loan assets do not match the interest rate characteristics of the funding for those assets, the risk of loss of floor income on certain student loans originated under the FFEL Program, risks related to the use of derivatives to manage exposure to interest rate fluctuations, uncertainties regarding the expected benefits from purchased securitized and unsecuritized FFELP, private education, and consumer loans and initiatives to purchase additional FFELP, private education, and consumer loans, and risks from changes in levels of loan prepayment or default rates;
•financing and liquidity risks, including risks of changes in the general interest rate environment, including the availability of any relevant money market index rate such as LIBOR or the relationship between the relevant money market index rate and the rate at which the Company's assets and liabilities are priced, and changes in the securitization and other financing markets for loans, including adverse changes resulting from unanticipated repayment trends on student loans in FFELP securitization trusts that could accelerate or delay repayment of the associated bonds, which may increase the costs or limit the availability of financings necessary to purchase, refinance, or continue to hold student loans;
•risks from changes in the terms of education loans and in the educational credit and services markets resulting from changes in applicable laws, regulations, and government programs and budgets, such as changes resulting from the Coronavirus Aid, Relief, and Economic Security Act (the "CARES Act") and the expected decline over time in FFELP loan interest income due to the discontinuation of new FFELP loan originations in 2010 and potential government initiatives or legislative proposals to consolidate existing FFELP loans to the Federal Direct Loan Program or otherwise allow FFELP loans to be refinanced with Federal Direct Loan Program loans;
•risks related to a breach of or failure in the Company's operational or information systems or infrastructure, or those of third-party vendors, including cybersecurity risks related to the potential disclosure of confidential loan borrower and other customer information, the potential disruption of the Company's systems or those of third-party vendors or customers, and/or the potential damage to the Company's reputation resulting from cyber-breaches;
•uncertainties inherent in forecasting future cash flows from student loan assets and related asset-backed securitizations;
•risks and uncertainties of the expected benefits from the November 2020 launch of Nelnet Bank operations, including the ability to successfully conduct banking operations and achieve expected market penetration;
•risks related to the expected benefits to the Company and to ALLO Communications LLC (“ALLO”) from the recapitalization and additional funding for ALLO and the Company’s continuing investment in ALLO, and risks related to investments in solar projects, including risks of not being able to realize tax credits which remain subject to recapture by taxing authorities;
•risks and uncertainties related to other initiatives to pursue additional strategic investments, acquisitions, and other activities, such as the planned transactions associated with the sale by Wells Fargo of its private education loan portfolio, including activities that are intended to diversify the Company both within and outside of its historical core education-related businesses; and
•risks and uncertainties associated with litigation matters and with maintaining compliance with the extensive regulatory requirements applicable to the Company's businesses, reputational and other risks, including the risk of increased regulatory costs resulting from the politicization of student loan servicing, and uncertainties inherent in the estimates and assumptions about future events that management is required to make in the preparation of the Company's consolidated financial statements.
All forward-looking statements contained in this report are qualified by these cautionary statements and are made only as of the date of this document. Although the Company may from time to time voluntarily update or revise its prior forward-looking statements to reflect actual results or changes in the Company's expectations, the Company disclaims any commitment to do so except as required by law.
1
Consolidated Statements of Income
(Dollars in thousands, except share data)
(unaudited)
| Three months ended | Year ended | ||||||||||||||||||||||||||||
| December 31, 2020 | September 30, 2020 | December 31, 2019 | December 31, 2020 | December 31, 2019 | |||||||||||||||||||||||||
| Interest income: | |||||||||||||||||||||||||||||
| Loan interest | $ | 132,673 | 134,507 | 204,638 | 595,113 | 914,256 | |||||||||||||||||||||||
| Investment interest | 6,165 | 5,238 | 7,720 | 24,543 | 34,421 | ||||||||||||||||||||||||
| Total interest income | 138,838 | 139,745 | 212,358 | 619,656 | 948,677 | ||||||||||||||||||||||||
| Interest expense: | |||||||||||||||||||||||||||||
| Interest on bonds and notes payable and bank deposits | 52,282 | 58,423 | 148,106 | 330,071 | 699,327 | ||||||||||||||||||||||||
| Net interest income | 86,556 | 81,322 | 64,252 | 289,585 | 249,350 | ||||||||||||||||||||||||
| Less (negative provision) provision for loan losses | (10,116) | (5,821) | 13,000 | 63,360 | 39,000 | ||||||||||||||||||||||||
| Net interest income after provision for loan losses | 96,672 | 87,143 | 51,252 | 226,225 | 210,350 | ||||||||||||||||||||||||
| Other income/expense: | |||||||||||||||||||||||||||||
| Loan servicing and systems revenue | 113,990 | 113,794 | 113,086 | 451,561 | 455,255 | ||||||||||||||||||||||||
| Education technology, services, and payment processing revenue | 65,097 | 74,121 | 63,578 | 282,196 | 277,331 | ||||||||||||||||||||||||
| Communications revenue | 19,253 | 20,211 | 17,499 | 76,643 | 64,269 | ||||||||||||||||||||||||
| Other | (12,350) | 1,502 | 10,973 | 57,561 | 47,918 | ||||||||||||||||||||||||
| Gain on sale of loans | — | 14,817 | 15,549 | 33,023 | 17,261 | ||||||||||||||||||||||||
| Gain from deconsolidation of ALLO | 258,588 | — | — | 258,588 | — | ||||||||||||||||||||||||
| Impairment expense and provision for beneficial interests | 9,696 | — | — | (24,723) | — | ||||||||||||||||||||||||
| Derivative settlements, net | (3,988) | (2,391) | 6,100 | 3,679 | 45,406 | ||||||||||||||||||||||||
| Derivative market value adjustments, net | (7,071) | 3,440 | (2,930) | (28,144) | (76,195) | ||||||||||||||||||||||||
| Total other income/expense | 443,215 | 225,494 | 223,855 | 1,110,384 | 831,245 | ||||||||||||||||||||||||
| Cost of services: | |||||||||||||||||||||||||||||
| Cost to provide education technology, services, and payment processing services | 18,782 | 25,243 | 19,002 | 82,206 | 81,603 | ||||||||||||||||||||||||
| Cost to provide communications services | 5,573 | 5,914 | 5,327 | 22,812 | 20,423 | ||||||||||||||||||||||||
| Total cost of services | 24,355 | 31,157 | 24,329 | 105,018 | 102,026 | ||||||||||||||||||||||||
| Operating expenses: | |||||||||||||||||||||||||||||
| Salaries and benefits | 136,612 | 126,096 | 124,561 | 501,832 | 463,503 | ||||||||||||||||||||||||
| Depreciation and amortization | 31,350 | 30,308 | 28,651 | 118,699 | 105,049 | ||||||||||||||||||||||||
| Other expenses | 45,391 | 34,744 | 46,710 | 160,574 | 194,272 | ||||||||||||||||||||||||
| Total operating expenses | 213,353 | 191,148 | 199,922 | 781,105 | 762,824 | ||||||||||||||||||||||||
| Income before income taxes | 302,179 | 90,332 | 50,856 | 450,486 | 176,745 | ||||||||||||||||||||||||
| Income tax expense | (70,573) | (19,156) | (9,022) | (100,860) | (35,451) | ||||||||||||||||||||||||
| Net income | 231,606 | 71,176 | 41,834 | 349,626 | 141,294 | ||||||||||||||||||||||||
| Net loss attributable to noncontrolling interests | 3,385 | 327 | 546 | 2,817 | 509 | ||||||||||||||||||||||||
| Net income attributable to Nelnet, Inc. | $ | 234,991 | 71,503 | 42,380 | 352,443 | 141,803 | |||||||||||||||||||||||
| Earnings per common share: | |||||||||||||||||||||||||||||
| Net income attributable to Nelnet, Inc. shareholders - basic and diluted | $ | 6.10 | 1.86 | 1.06 | 9.02 | 3.54 | |||||||||||||||||||||||
| Weighted average common shares outstanding - basic and diluted | 38,552,261 | 38,538,476 | 39,896,232 | 39,059,588 | 40,047,402 | ||||||||||||||||||||||||
2
Condensed Consolidated Balance Sheets
(Dollars in thousands)
(unaudited)
| As of | As of | As of | |||||||||||||||
| December 31, 2020 | September 30, 2020 | December 31, 2019 | |||||||||||||||
| Assets: | |||||||||||||||||
| Loans and accrued interest receivable, net | $ | 20,185,656 | 20,076,542 | 21,402,868 | |||||||||||||
| Cash, cash equivalents, and investments | 1,114,189 | 573,143 | 381,005 | ||||||||||||||
| Restricted cash | 837,146 | 805,225 | 1,088,695 | ||||||||||||||
| Goodwill and intangible assets, net | 217,162 | 215,613 | 238,444 | ||||||||||||||
| Other assets | 292,007 | 552,003 | 597,958 | ||||||||||||||
| Total assets | $ | 22,646,160 | 22,222,526 | 23,708,970 | |||||||||||||
| Liabilities: | |||||||||||||||||
| Bonds and notes payable | $ | 19,320,726 | 19,215,053 | 20,529,054 | |||||||||||||
| Bank deposits | 54,633 | — | — | ||||||||||||||
| Other liabilities | 642,452 | 604,642 | 788,822 | ||||||||||||||
| Total liabilities | 20,017,811 | 19,819,695 | 21,317,876 | ||||||||||||||
| Equity: | |||||||||||||||||
| Total Nelnet, Inc. shareholders' equity | 2,632,042 | 2,399,485 | 2,386,712 | ||||||||||||||
| Noncontrolling interests | (3,693) | 3,346 | 4,382 | ||||||||||||||
| Total equity | 2,628,349 | 2,402,831 | 2,391,094 | ||||||||||||||
| Total liabilities and equity | $ | 22,646,160 | 22,222,526 | 23,708,970 | |||||||||||||
3
Overview
The Company is a diverse company with a purpose to serve others and a vision to make customers' dreams possible by delivering customer focused products and services. The largest operating businesses engage in loan servicing and education technology, services, and payment processing, and the Company also has a significant investment in communications. A significant portion of the Company's revenue is net interest income earned on a portfolio of federally insured student loans. The Company also makes investments to further diversify both within and outside of its historical core education-related businesses, including, but not limited to, investments in real estate, early-stage and emerging growth companies, and renewable energy.
GAAP Net Income and Non-GAAP Net Income, Excluding Adjustments
The Company prepares its financial statements and presents its financial results in accordance with GAAP. However, it also provides additional non-GAAP financial information related to specific items management believes to be important in the evaluation of its operating results and performance. A reconciliation of the Company's GAAP net income to net income, excluding derivative market value adjustments, and a discussion of why the Company believes providing this additional information is useful to investors, is provided below.
| Three months ended | Year ended | ||||||||||||||||||||||||||||
| December 31, 2020 | September 30, 2020 | December 31, 2019 | December 31, 2020 | December 31, 2019 | |||||||||||||||||||||||||
| GAAP net income attributable to Nelnet, Inc. | $ | 234,991 | 71,503 | 42,380 | 352,443 | 141,803 | |||||||||||||||||||||||
| Realized and unrealized derivative market value adjustments | 7,071 | (3,440) | 2,930 | 28,144 | 76,195 | ||||||||||||||||||||||||
| Tax effect (a) | (1,697) | 826 | (703) | (6,755) | (18,287) | ||||||||||||||||||||||||
| Net income attributable to Nelnet, Inc., excluding derivative market value adjustments (b) | $ | 240,365 | 68,889 | 44,607 | 373,832 | 199,711 | |||||||||||||||||||||||
| Earnings per share: | |||||||||||||||||||||||||||||
| GAAP net income attributable to Nelnet, Inc. | $ | 6.10 | 1.86 | 1.06 | 9.02 | 3.54 | |||||||||||||||||||||||
| Realized and unrealized derivative market value adjustments | 0.18 | (0.09) | 0.07 | 0.72 | 1.90 | ||||||||||||||||||||||||
| Tax effect (a) | (0.05) | 0.02 | (0.01) | (0.17) | (0.45) | ||||||||||||||||||||||||
| Net income attributable to Nelnet, Inc., excluding derivative market value adjustments (b) | $ | 6.23 | 1.79 | 1.12 | 9.57 | 4.99 | |||||||||||||||||||||||
(a) The tax effects are calculated by multiplying the realized and unrealized derivative market value adjustments by the applicable statutory income tax rate.
(b) "Derivative market value adjustments" includes both the realized portion of gains and losses (corresponding to variation margin received or paid on derivative instruments that are settled daily at a central clearinghouse) and the unrealized portion of gains and losses that are caused by changes in fair values of derivatives which do not qualify for "hedge treatment" under GAAP. "Derivative market value adjustments" does not include "derivative settlements" that represent the cash paid or received during the current period to settle with derivative instrument counterparties the economic effect of the Company's derivative instruments based on their contractual terms.
The accounting for derivatives requires that changes in the fair value of derivative instruments be recognized currently in earnings, with no fair value adjustment of the hedged item, unless specific hedge accounting criteria is met. Management has structured all of the Company’s derivative transactions with the intent that each is economically effective; however, the Company’s derivative instruments do not qualify for hedge accounting. As a result, the change in fair value of derivative instruments is reported in current period earnings with no consideration for the corresponding change in fair value of the hedged item. Under GAAP, the cumulative net realized and unrealized gain or loss caused by changes in fair values of derivatives in which the Company plans to hold to maturity will equal zero over the life of the contract. However, the net realized and unrealized gain or loss during any given reporting period fluctuates significantly from period to period.
The Company believes these point-in-time estimates of asset and liability values related to its derivative instruments that are subject to interest rate fluctuations are subject to volatility mostly due to timing and market factors beyond the control of management, and affect the period-to-period comparability of the results of operations. Accordingly, the Company’s management utilizes operating results excluding these items for comparability purposes when making decisions regarding the Company’s performance and in presentations with credit rating agencies, lenders, and investors. Consequently, the Company reports this non-GAAP information because the Company believes that it provides additional information regarding operational and performance indicators that are closely assessed by management. There is no comprehensive, authoritative guidance for the presentation of such non-GAAP information, which is only meant to supplement GAAP results by providing additional information that management utilizes to assess performance.
4
Operating Results
The Company earns net interest income on its loan portfolio, consisting primarily of FFELP loans in its Asset Generation and Management ("AGM") operating segment. This segment is expected to generate a stable net interest margin and significant amounts of cash as the FFELP portfolio amortizes. As of December 31, 2020, AGM had a $19.6 billion loan portfolio that management anticipates will amortize over the next approximately 20 years and has a weighted average remaining life of 9.8 years. The Company actively works to maximize the amount and timing of cash flows generated by its FFELP portfolio and seeks to acquire additional loan assets to leverage its servicing scale and expertise to generate incremental earnings and cash flow. However, due to the continued amortization of the Company’s FFELP loan portfolio, over time, the Company's net income generated by the AGM segment will continue to decrease. The Company currently believes that in the short-term it will most likely not be able to invest the excess cash generated from the FFELP loan portfolio into assets that immediately generate the rates of return historically realized from that portfolio.
In addition, the Company earns fee-based revenue through the following reportable operating segments:
•Loan Servicing and Systems ("LSS") - referred to as Nelnet Diversified Services ("NDS")
•Education Technology, Services, and Payment Processing ("ETS&PP") - referred to as Nelnet Business Services ("NBS")
Further, the Company earned communications revenue through ALLO, formerly a majority owned subsidiary of the Company prior to a recapitalization of ALLO resulting in the deconsolidation of ALLO from the Company’s financial statements on December 21, 2020. The recapitalization of ALLO is not considered a strategic shift in the Company’s involvement with ALLO, and ALLO’s results of operations, prior to the deconsolidation, are presented by the Company as a reportable operating segment.
On November 2, 2020, the Company obtained final approval from the Federal Deposit Insurance Corporation ("FDIC") for federal deposit insurance and for a bank charter from the Utah Department of Financial Institutions ("UDFI") in connection with the establishment of Nelnet Bank, and Nelnet Bank launched operations. Nelnet Bank operates as an internet Utah-chartered industrial bank franchise focused on the private education loan marketplace, with a home office in Salt Lake City, Utah. Nelnet Bank’s operations are presented by the Company as a reportable operating segment.
Other business activities and operating segments that are not reportable are combined and included in Corporate and Other Activities ("Corporate"). Corporate and Other Activities also includes income earned on certain investments and interest expense incurred on unsecured and other corporate related debt transactions. In addition, the Corporate segment includes direct incremental costs associated with Nelnet Bank prior to the UDFI’s approval for its bank charter and certain shared service and support costs incurred by the Company that will not be reflected in Nelnet Bank’s operating results through 2023 (the bank’s de novo period). Such Nelnet Bank-related costs included in the Corporate segment totaled $5.9 million (pre-tax) and $1.7 million (pre-tax) in 2020 and 2019, respectively.
5
The information below provides the operating results for each reportable operating segment (excluding Nelnet Bank) for the years ended December 31, 2020 and 2019 (dollars in millions).
| LSS (a) | ETS&PP | ALLO (c) | AGM (b) | ||||||||||||||||||||
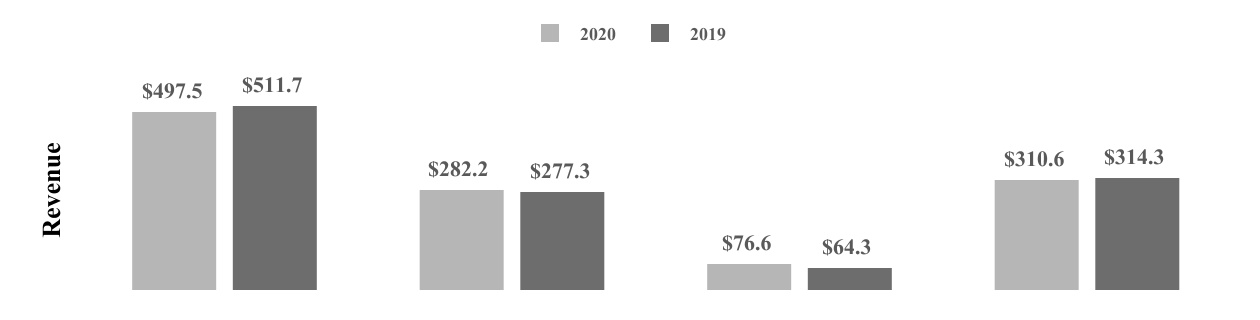
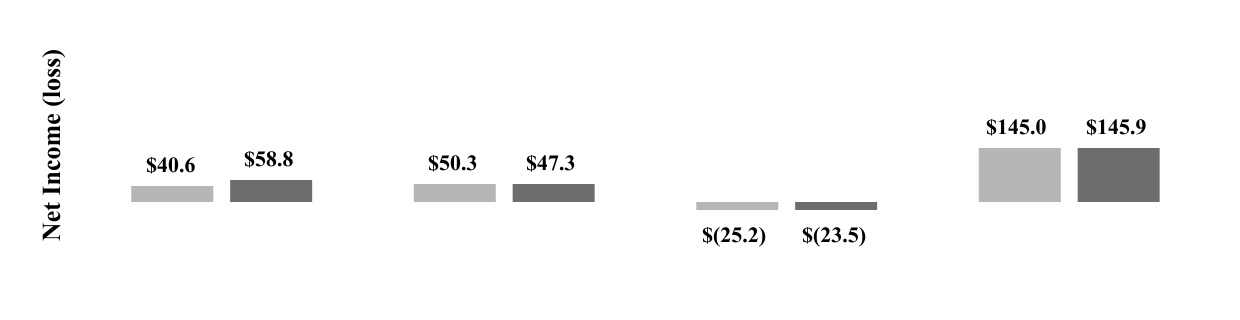
(a) Revenue includes intersegment revenue.
(b) Total revenue includes "net interest income" and "total other income/expense" from the Company's segment statements of income, excluding the impact from changes in fair values of derivatives. Net income excludes changes in fair values of derivatives, net of tax. For information regarding the exclusion of the impact from changes in fair values of derivatives, see "GAAP Net Income and Non-GAAP Net Income, Excluding Adjustments" above.
(c) On December 21, 2020, the Company deconsolidated ALLO from the Company's consolidated financial statements. Accordingly, the 2020 operating results for the Communications operating segment in the table above are for the period January 1, 2020 through December 21, 2020.
Certain events and transactions from 2020, which have impacted, will impact, or could impact the operating results of the Company, are discussed below.
Recapitalization and Additional Funding for ALLO
On October 1, 2020, the Company entered into various agreements with SDC Allo Holdings, LLC (“SDC”), a third party global digital infrastructure investor, and ALLO, then a majority owned communications subsidiary of the Company, to recapitalize and provide additional funding for ALLO. On October 15, 2020, ALLO received proceeds of $197.0 million from SDC for the issuance of membership units of ALLO, and redeemed $160.0 million of non-voting preferred membership units of ALLO held by the Company. As a result of the receipt of required regulatory approvals on December 21, 2020, SDC, the Company, and members of ALLO’s management own approximately 48 percent, 45 percent, and 7 percent, respectively, of the outstanding voting membership interests of ALLO, and the Company deconsolidated ALLO from the Company’s consolidated financial statements.
Upon the deconsolidation of ALLO, the Company recorded its 45 percent voting membership interests in ALLO at fair value, and accounts for such investment under the Hypothetical Liquidation at Book Value (“HLBV”) method of accounting. In addition, the Company recorded its remaining non-voting preferred membership units in ALLO at fair value, and accounts for such investment as a separate equity investment. As a result of the deconsolidation of ALLO, the Company recognized a gain of $258.6 million in the fourth quarter of 2020.
On January 19, 2021, ALLO closed on certain private debt financing facilities from unrelated third-party lenders providing for aggregate financing of up to $230.0 million. With proceeds from this transaction, ALLO redeemed a portion of its non-voting preferred membership units held by the Company in exchange for an aggregate redemption price payment to the Company of $100.0 million.
The agreements among the Company, SDC, and ALLO provide that they will use commercially reasonable efforts (which expressly excludes requiring ALLO to raise any additional equity financing or sell any assets) to cause ALLO to redeem, on or before April 2024, the remaining non-voting preferred membership units of ALLO held by the Company, plus the amount of accrued and unpaid
6
preferred return on such units. As of January 19, 2021, the outstanding preferred membership units of ALLO held by the Company was $129.7 million. The preferred membership units earn a preferred annual return of 6.25 percent.
As discussed above, subsequent to the recapitalization and deconsolidation of ALLO, the Company will account for its investment in ALLO under the HLBV method of accounting. The HLBV method of accounting is used by the Company for equity method investments when the liquidation rights and priorities as defined by an equity investment agreement differ from what is reflected by the underlying percentage ownership or voting interests. The Company applies the HLBV method using a balance sheet approach. A calculation is prepared at each balance sheet date to determine the amount that the Company would receive if an equity investment entity were to liquidate its net assets and distribute that cash to the investors based on the contractually defined liquidation priorities. The difference between the calculated liquidation distribution amounts at the beginning and the end of the reporting period, after adjusting for capital contributions and distributions, is the Company’s share of the earnings or losses from the equity investment for the period. Because the Company will be able to utilize certain tax losses related to ALLO’s operations, the equity investment agreements for the Company have liquidation rights and priorities that are sufficiently different from the voting membership interests percentages such that the HLBV method of accounting was deemed appropriate. Accordingly, the recognition of earnings or losses during any reporting period related to the Company’s equity investment in ALLO may or may not reflect its voting membership interests percentage and could vary substantially from those calculated based on the Company’s voting membership interests in ALLO.
Assuming ALLO continues its planned growth in existing and new communities, it will continue to invest substantial amounts in property and equipment to build the network and connect customers. The resulting recognition of depreciation and development costs could result in net operating losses by ALLO under generally accepted accounting principles. Applying the HLBV method of accounting, the Company will recognize a significant portion of ALLO’s anticipated losses over the next several years.
Impacts of COVID-19 Pandemic
Beginning in March 2020, the coronavirus 2019 or COVID-19 (“COVID-19”) pandemic resulted in many businesses and schools closing or reducing hours throughout the U.S. to combat the spread of COVID-19, and states and local jurisdictions implementing various containment efforts, including lockdowns on non-essential business and other business restrictions, stay-at-home orders, and shelter-in-place orders. The COVID-19 pandemic has caused significant disruption to the U.S. and world economies, including significantly higher unemployment and underemployment, significantly lower interest rates, and extreme volatility in the U.S. and world markets. As a result of the COVID-19 outbreak and federal, state, and local government responses to COVID-19, the Company has experienced and may in the future experience various disruptions and impacts to the Company's businesses and results of operations. The following provides a summary of how COVID-19 has impacted and may impact the Company's business and operating results.
Corporate
The Company has implemented adjustments to its operations designed to keep employees safe and comply with federal, state, and local guidelines, including those regarding social distancing. As of March 25, 2020, the majority of our associates were working and continue to work from home. Substantially all Company associates working from home are able to connect to their work environment virtually and continue to serve our customers.
The Company has investments in real estate, early-stage and emerging growth companies (venture capital investments), and renewable energy (solar). The Company identified several venture capital investments that were negatively impacted by the distressed economic conditions resulting from the COVID-19 pandemic and recognized impairment charges on such investments of $7.8 million (pre-tax) during the first quarter of 2020.
Loan Servicing and Systems
The CARES Act, which was signed into law on March 27, 2020, among other things, provides broad relief for federal student loan borrowers. Under the CARES Act, federal student loan payments and interest accruals were suspended for all borrowers that have loans owned by the Department. The benefits of the law were applied retroactively to March 13, 2020, when the President declared a state of emergency related to COVID-19, and these federal student loan borrower relief provisions have been extended through September 30, 2021. Beginning March 13, 2020, the Company received less servicing revenue per borrower from the Department based on the borrower forbearance status through September 30, 2020 than what was earned on such accounts prior to these provisions, and the Department further reduced the monthly rate paid to its servicers for those in a forbearance status for the period from October 1, 2020 through September 30, 2021 from $2.19 per borrower to $2.05 per borrower. As a result of the extension of these CARES Act provisions through September 30, 2021, the Company currently anticipates Department servicing revenue will be lower in 2021 from recent historical periods due to the lower rates. The Company currently anticipates revenue per borrower will return to pre-COVID levels when borrowers begin to re-enter repayment in the fourth quarter of 2021. While federal student loan
7
payments are suspended, the Company's operating expenses have been and will continue to be lower due to a significant reduction of borrower statement printing and postage costs. In addition, revenue from the Department for originating consolidation loans was adversely impacted as a result of borrowers receiving relief on their existing loans, thus not initiating a consolidation. The Company currently anticipates this revenue will continue to be negatively impacted while student loan payments and interest accruals are suspended.
During 2020, FFELP, private education, and consumer loan servicing revenue was adversely impacted by the COVID-19 pandemic due to reduced or eliminated delinquency outreach to borrowers, holds on claim filings, and reduced or eliminated late fees processing. In addition, origination fee revenue was negatively impacted as borrowers are less likely to refinance their loans when they are receiving certain relief measures from their current lender. The Company currently anticipates this trend will continue in future periods that are impacted by the COVID-19 pandemic, with the magnitude based on the extent to which existing or additional borrower relief policies and activities are implemented or extended by servicing customers.
If the student loan borrower relief provisions of the CARES Act were potentially extended past September 30, 2021 and/or new legislative or regulatory student loan borrower relief measures similar to such provisions of the CARES Act were to become effective, the levels and timing of future servicing revenues could continue to be impacted in a similar manner through the extended period of time that such provisions or measures are in effect.
Due to decreased servicing and transaction activity as a result of suspended payments under the CARES Act as discussed above, the Company has been able to transition associates to help state agencies process unemployment claims and conduct certain health contact tracing support activities. Revenue earned on these temporary contracts for the year ended December 31, 2020 was $21.9 million. These contracts were awarded to the Company as a result of the Company's technology, security, compliance, and other capabilities needed to conduct such activities.
Education Technology, Services, and Payment Processing
This segment has been and will continue to be impacted by COVID-19 through lower interest rate levels, which reduce earnings for this business compared to recent historical results as the tuition funds held in custody for schools produce less interest earnings. If interest rates remain at current levels, the Company anticipates this segment will earn minimal interest income in future periods. In addition, as a result of COVID-19, demand for certain of the Company's products and services has been negatively impacted. The Company currently anticipates this trend will continue through the 2020-2021 academic year and could extend longer as a result of trends and shifts in the industry that could be long term as a result of the COVID-19 pandemic.
Communications
As a result of COVID-19, ALLO experienced increased demand from new and existing residential customers to support connectivity needs primarily for work and learn from home applications. Along with offering 60 days free for eligible customers, ALLO partnered with school districts to provide more connectivity to students, often at discounted rates.
In view of the importance of ALLO's technicians being able to connect new customers while maintaining social distance and protecting community and associate health and safety, ALLO adjusted operational procedures by implementing associate health checks, following CDC and local health official safety protocols, facilitating customer screening, and adjusting the installation process to limit the time in the home or business as much as possible.
Asset Generation and Management
AGM's results were adversely impacted during the first quarter of 2020 as a result of COVID-19 due to:
•An incremental increase in the provision for loan losses of $63.0 million (pre-tax) resulting from an increase in expected life of loan defaults due to the COVID-19 pandemic.
•A $26.3 million (pre-tax) provision charge recognized on the Company's beneficial interest in consumer loan securitizations. The Company's estimate of future cash flows from the beneficial interest in consumer loan securitizations was lower than originally anticipated due to the expectation of increased consumer loan defaults within such securitizations due to the distressed economic conditions resulting from the COVID-19 pandemic.
As economic factors improved in the third and fourth quarters of 2020, a portion of the charges noted above were reversed.
The CARES Act, among other things, provides broad relief, effective March 13, 2020, for borrowers that have student loans owned by the Department. This relief package excluded FFELP, private education, and consumer loans. Although the Company’s loans are excluded from the provisions of the CARES Act, the Company is providing relief for its borrowers.
8
For the Company's federally insured and private education loans, effective March 13, 2020 through June 30, 2020, the Company proactively applied a 90 day natural disaster forbearance to any loan that was 31-269 days past due (for federally insured loans) and 80 days past due (for private education loans), and to any current loan upon request. Beginning July 1, 2020, the Company discontinued proactively applying 90 day natural disaster forbearances on past due loans. However, the Company will continue to apply a natural disaster forbearance in 90 day increments to any federally insured and private education loan upon request through September 30, 2021. As of December 31, 2020, federally insured and private education loans in forbearance were $2.0 billion (or 10.3% of the portfolio) and $2.4 million (or 0.7% of the portfolio), respectively. The amount of federally insured and private education loans in forbearance hit their peak in May 2020 at $6.0 billion and $38.6 million, respectively. The Company anticipates that loans in forbearance will continue to decline in 2021, absent any intervening policy change, when borrowers are currently scheduled to exit forbearance. Despite the COVID-19 pandemic, a large portion of borrowers continue to make payments according to their payment plans.
In addition, for both federally insured and private education loans, effective March 13, 2020, borrower late fees have been waived.
For the majority of the Company's consumer loans, borrowers are generally being offered, upon request and/or documented evidence of financial distress, up to a two-month deferral of payments, with an option of additional deferrals if the COVID-19 pandemic continues. In addition, effective March 13, 2020, the majority of fees (non-sufficient funds, late charges, check fees) and credit bureau reporting have been suspended. The specific relief terms on the Company's consumer loan portfolio vary depending on the loan program and servicer of such loans.
The Company will continue to review whether additional and/or extended borrower relief policies and activities are needed.
The Company is not contractually committed to acquire FFELP, private education, or consumer loans, so the Company has been and will continue to be selective as to which, if any, loans it purchases during the current period of economic uncertainty.
Other Risks and Uncertainties
The COVID-19 pandemic is unprecedented and continues to evolve. The extent to which COVID-19 may impact the Company's businesses depends on future developments, which are highly uncertain, subject to various risks, and cannot be predicted with confidence, such as the ultimate spread, severity, and duration of the pandemic, travel restrictions, stay-at-home or other similar orders and social distancing in the United States and other countries, business and/or school closures and disruptions, and the effectiveness of actions taken in the United States and other countries to contain and treat the virus.
Investment in Agile Sports Technologies, Inc. (doing business as "Hudl")
On May 20, 2020, the Company made an additional equity investment of approximately $26.0 million in Hudl, as one of the participants in an equity raise completed by Hudl. As a result of Hudl’s equity raise, the Company recognized a $51.0 million (pre-tax) gain during the second quarter of 2020 to adjust its carrying value to reflect the May 20, 2020 transaction value.
Department of Education Servicing Contracts and Procurements for New Contracts
Nelnet Servicing, a subsidiary of the Company, earns loan servicing revenue from a servicing contract with the Department. Revenue earned by Nelnet Servicing related to this contract was $146.8 million and $158.0 million for the years ended December 31, 2020 and 2019, respectively. In addition, Great Lakes, which was acquired by the Company on February 7, 2018, also earns loan servicing revenue from a similar servicing contract with the Department. Revenue earned by Great Lakes related to this contract was $179.9 million and $185.7 million for the years ended December 31, 2020 and 2019, respectively.
Nelnet Servicing and Great Lakes' servicing contracts with the Department are currently scheduled to expire on June 14, 2021, but provide the potential for an additional six-month extension at the Department’s discretion through December 14, 2021. The Consolidated Appropriations Act, 2021, signed into law on December 27, 2020, provides that the Department may extend the period of performance for the servicing contracts scheduled to expire on December 14, 2021 for up to two additional years to December 14, 2023.
The Department is conducting a contract procurement process entitled Next Generation Financial Services Environment (“NextGen”) for a new framework for the servicing of all student loans owned by the Department. On January 15, 2019, the Department issued solicitations for certain NextGen components, including the NextGen Enhanced Processing Solution (“EPS”), which is for a technology servicing system and certain processing functions the Department planned to use under NextGen to service the Department's student loan customers, and the NextGen Business Processing Operations (“BPO”), which is for the back office and call center operational functions for servicing the Department's student loan customers.
9
On June 24, 2020, the Department awarded and signed contracts with five other companies in connection with the BPO solicitation. On July 10, 2020, the Department cancelled the solicitation for the EPS component. In the Department's description of its cancellation of the EPS solicitation component, the Department indicated that it continues to be committed to the goals and vision of NextGen, and that it would be introducing a new solicitation to continue the NextGen strategy in the future. On October 28, 2020, the Department issued a new federal loan servicing solicitation for an Interim Servicing Solution ("ISS"). ISS was a follow-on to the existing contracts, which would award a full system and servicing solution to two providers. Under ISS, the selected providers would have provided the technology platform to host the Department's student loan portfolio; customer service (including contact centers) and back-office processing; digital engagement layer including borrower-facing website and mobile-applications; intake, imaging, and fulfillment; and portfolio-level operations. As the companies awarded BPO contracts are onboarded, contact center and back-office operations would have shifted from the ISS contract to the BPO providers. The Consolidated Appropriations Act, 2021 contains provisions directing certain aspects of the NextGen process, including that any new federal student loan servicing environment shall provide for the participation of multiple student loan servicers and the allocation of borrower accounts to eligible student loan servicers based on performance, and directed the suspension of awarding any ISS contract for at least 90 days. On January 9, 2021, the Department suspended the ISS solicitation. In the Department’s description of the suspension, it indicated that in consideration of the Consolidated Appropriations Act, 2021, the Government is reassessing its needs and will amend or cancel the subject solicitation in the future.
Adoption of New Accounting Standard for Credit Losses
On January 1, 2020, the Company adopted ASU No. 2016-13, Financial Instruments – Credit Losses (“ASC 326”), which replaces the incurred loss methodology with an expected loss methodology that is referred to as the current expected credit loss (“CECL”) methodology. The CECL methodology utilizes a lifetime “expected credit loss” measurement objective for the recognition of credit losses for financial assets measured at amortized cost at the time the financial asset is originated or acquired. The expected credit losses are adjusted each period for changes in expected lifetime credit losses.
The new guidance primarily impacted the allowance for loan losses related to the Company’s loan portfolio. Upon adoption, the Company recorded an increase to the allowance for loan losses of $91.0 million, which included a reclassification of the non-accretable discount balance and premiums related to loans purchased with evidence of credit deterioration, and decreased retained earnings, net of tax, by $18.9 million. Results for reporting periods beginning after January 1, 2020 are presented under ASC 326 (recognizing estimated credit losses expected to occur over the asset's remaining life) while prior period amounts continue to be reported in accordance with previously applicable GAAP (recognizing estimated credit losses using an incurred loss model); therefore, the comparative information for 2019 is not comparable to the information presented for 2020.
Solar Investments
During the last three years, the Company has invested $148.6 million in tax equity investments in renewable energy solar partnerships to support the development and operations of solar projects throughout the country. The projects are currently forecasted to generate more than 214 megawatts of power each year. These investments provide a federal income tax credit under the Internal Revenue Code, currently at 26 percent (for projects commencing construction in 2020-2022) and 30 percent (for projects commencing construction prior to 2020) of the eligible project cost, with the tax credit available when the project is placed-in-service. The Company is then allowed to reduce its tax estimates paid to the U.S. Treasury based on the credits earned. In addition to the credits, the Company structures the investments to receive quarterly distributions of cash from the operating earnings of the solar project for a period of at least five years (so the tax credits are not recaptured). After that period, the contractual agreements typically provide for the Company’s interest in the projects to be purchased in an exit at the fair market value of the discounted forecasted future cash flows allocable to the Company. Given the expected timing of cash flows, experience the Company has in underwriting these assets, and beneficial impact to the climate, the Company believes these investments are a great fit within its capital deployment initiatives.
These investments are structured such that a significant proportion of the cash distributions and tax items (including the income tax credit) are allocated back to the Company within the first eighteen months of the investment capital contribution, in order to achieve a target after tax return. The cash distributions to the Company are then structured to flatten until exit, typically between years five and six. Given the unique arrangement in which investors share in the profits and losses of the solar investment with cash and tax benefit allocations among the partners changing over the life of the project, the accounting guidance calls for the use of the Hypothetical Liquidation at Book Value (“HLBV”) method, which can result in non-linear GAAP income/loss allocation results. Under this method, a balance sheet approach is utilized to determine what each investor would hypothetically receive at each balance sheet date under the liquidation provisions of the contractual agreements, assuming the net assets of the funding structures were liquidated at their recorded amounts determined in accordance with GAAP. As the investor receives a majority of this return through the income tax credit and higher cash distributions at the beginning of the investment, as of the first period of the hypothetical liquidation, the investor’s remaining net claim on assets is relatively low compared to the initial cash contributed. This difference between the initial cash contributions and the first period’s ending net claim on assets through the hypothetical
10
liquidation causes significant GAAP losses on the investment to be recognized through the income statement within the initial periods of the investment. After the carrying value of the investment on the balance sheet is written down to the hypothetical liquidation amount, subsequent year’s earnings are expected to align with and reflect the operating profits or losses of the investment. The Company realizes that application of the HLBV method to its solar investments has a variable impact on its periodic earnings that in the early years is not reflective of the expected long-term economics of the investments. Given the significant amount of investments made in the last couple of years and the associated ramp-up period, the negative impact to earnings in 2020 was significant as the Company recognized a $37.4 million pre-tax loss from these investments under the HLBV method. However, as these investments mature and perform as forecasted, the Company expects to recoup that loss and realize additional income between now and the sale of each of its interests, likely 60 to 72 months from the date the project is placed in service. Thus, the Company expects the economic gain from these investments to be realized in its future earnings, but, due to the hypothetical liquidation valuations as of the balance sheet dates during the intended investment horizon, the HLBV method results in some volatility in the Company’s consolidated periodic earnings results.
Private Loan Servicing and Acquisition
In December of 2020, Wells Fargo announced the sale of its approximately $10 billion portfolio of private education student loans representing approximately 475,000 borrowers. In conjunction with the sale, the Company was selected as servicer of the portfolio and will begin servicing the portfolio following a series of loan transfers during the first half of 2021. In addition, the Company has entered into agreements to participate in a joint venture to acquire the portfolio. The Company expects to own approximately 8 percent of the interest in the loans and, dependent upon financing, currently expects to invest approximately $100 million as part of the acquisition. In addition, the Company will serve as the sponsor and administrator for loan securitizations on behalf of the purchaser group as the loans are securitized, and provide the required level of risk retention as the loans are permanently financed. This transaction is expected to close during the first half of 2021, with the securitizations occurring subsequent to closing.
Liquidity and Capital Resources
•As of December 31, 2020, the Company had cash and cash equivalents of $121.2 million. In addition, the Company had a portfolio of available-for-sale investments, consisting primarily of student loan asset-backed securities, with a fair value of $348.6 million as of December 31, 2020. As of December 31, 2020, the Company has participated $118.6 million of these securities, and such participation is reflected as debt on the Company's consolidated balance sheet.
•The Company has historically generated positive cash flow from operations. For the year ended December 31, 2020, the Company’s net cash provided by operating activities was $212.8 million.
•The Company has a $455.0 million unsecured line of credit with a maturity date of December 16, 2024. As of December 31, 2020, the unsecured line of credit had $120.0 million outstanding. Subsequent to December 31, 2020, the Company paid down the full balance outstanding on the line of credit, and as of February 25, 2021, $455.0 million was available for future use. The line of credit provides that the Company may increase the aggregate financing commitments, through the existing lenders and/or through new lenders, up to a total of $550.0 million, subject to certain conditions.
•On November 2, 2020, Nelnet Bank launched operations. Nelnet Bank was funded by the Company with an initial capital contribution of $100.0 million, consisting of $55.9 million of cash and $44.1 million of student loan asset-backed securities. In addition, the Company made a pledged deposit of $40.0 million with Nelnet Bank, as required under an agreement with the FDIC.
•The majority of the Company’s portfolio of student loans is funded in asset-backed securitizations that will generate significant earnings and cash flow over the life of these transactions. As of December 31, 2020, the Company currently expects future undiscounted cash flows from its securitization portfolio to be approximately $2.30 billion, of which approximately $1.51 billion will be generated over the next five years.
•The Company has a stock repurchase program to purchase up to a total of five million shares of the Company’s Class A common stock during the three-year period ending May 7, 2022. During 2020, the Company repurchased a total of 1,594,394 shares of stock for $73.4 million ($46.01 per share). As of December 31, 2020, 3,246,732 shares remained authorized for repurchase under the Company's stock repurchase program.
•During 2020, the Company paid cash dividends totaling $31.8 million ($0.82 per share).
The Company intends to use its strong liquidity position to capitalize on market opportunities, including FFELP, private education, and consumer loan acquisitions; strategic acquisitions and investments; and capital management initiatives, including stock repurchases, debt repurchases, and dividend distributions. The timing and size of these opportunities will vary and will have a direct impact on the Company’s cash and investment balances.
11
Segment Reporting
The following tables include the results of each of the Company's reportable operating segments reconciled to the consolidated financial statements.
| Three months ended December 31, 2020 | |||||||||||||||||||||||||||||||||||||||||||||||
| Loan Servicing and Systems | Education Technology, Services, and Payment Processing | Communications (a) | Asset Generation and Management | Nelnet Bank | Corporate and Other Activities | Eliminations | Total | ||||||||||||||||||||||||||||||||||||||||
| Total interest income | $ | 33 | 259 | 2 | 137,005 | 414 | 1,378 | (253) | 138,838 | ||||||||||||||||||||||||||||||||||||||
| Interest expense | 24 | — | — | 52,664 | 41 | (195) | (253) | 52,282 | |||||||||||||||||||||||||||||||||||||||
| Net interest income (expense) | 9 | 259 | 2 | 84,341 | 373 | 1,573 | — | 86,556 | |||||||||||||||||||||||||||||||||||||||
| Less provision for loan losses | — | — | — | (10,447) | 330 | — | — | (10,116) | |||||||||||||||||||||||||||||||||||||||
| Net interest income after provision for loan losses | 9 | 259 | 2 | 94,788 | 43 | 1,573 | — | 96,672 | |||||||||||||||||||||||||||||||||||||||
| Other income/expense: | |||||||||||||||||||||||||||||||||||||||||||||||
| Loan servicing and systems revenue | 113,990 | — | — | — | — | — | — | 113,990 | |||||||||||||||||||||||||||||||||||||||
| Intersegment revenue | 8,642 | 3 | — | — | — | — | (8,645) | — | |||||||||||||||||||||||||||||||||||||||
| Education technology, services, and payment processing revenue | — | 65,097 | — | — | — | — | — | 65,097 | |||||||||||||||||||||||||||||||||||||||
| Communications revenue | — | — | 19,253 | — | — | — | — | 19,253 | |||||||||||||||||||||||||||||||||||||||
| Other | 2,524 | — | 304 | 2,239 | 48 | (17,465) | — | (12,350) | |||||||||||||||||||||||||||||||||||||||
| Gain on sale of loans | — | — | — | — | — | — | — | — | |||||||||||||||||||||||||||||||||||||||
| Gain from deconsolidation of ALLO | — | — | — | — | — | 258,588 | — | 258,588 | |||||||||||||||||||||||||||||||||||||||
| Impairment expense and provision for beneficial interests | — | — | — | 9,696 | — | — | — | 9,696 | |||||||||||||||||||||||||||||||||||||||
| Derivative settlements, net | — | — | — | (3,988) | — | — | — | (3,988) | |||||||||||||||||||||||||||||||||||||||
| Derivative market value adjustments, net | — | — | — | (7,071) | — | — | — | (7,071) | |||||||||||||||||||||||||||||||||||||||
| Total other income/expense | 125,156 | 65,100 | 19,557 | 876 | 48 | 241,123 | (8,645) | 443,215 | |||||||||||||||||||||||||||||||||||||||
| Cost of services: | |||||||||||||||||||||||||||||||||||||||||||||||
| Cost to provide education technology, services, and payment processing services | — | 18,782 | — | — | — | — | — | 18,782 | |||||||||||||||||||||||||||||||||||||||
| Cost to provide communications services | — | — | 5,573 | — | — | — | — | 5,573 | |||||||||||||||||||||||||||||||||||||||
| Total cost of services | — | 18,782 | 5,573 | — | — | — | — | 24,355 | |||||||||||||||||||||||||||||||||||||||
| Operating expenses: | |||||||||||||||||||||||||||||||||||||||||||||||
| Salaries and benefits | 73,720 | 25,169 | 14,464 | 446 | 36 | 22,776 | — | 136,612 | |||||||||||||||||||||||||||||||||||||||
| Depreciation and amortization | 9,669 | 2,344 | 10,106 | — | — | 9,232 | — | 31,350 | |||||||||||||||||||||||||||||||||||||||
| Other expenses | 14,143 | 3,022 | 3,645 | 3,554 | 135 | 20,892 | — | 45,391 | |||||||||||||||||||||||||||||||||||||||
| Intersegment expenses, net | 15,817 | 3,927 | 82 | 9,332 | — | (20,513) | (8,645) | — | |||||||||||||||||||||||||||||||||||||||
| Total operating expenses | 113,349 | 34,462 | 28,297 | 13,332 | 171 | 32,387 | (8,645) | 213,353 | |||||||||||||||||||||||||||||||||||||||
| Income (loss) before income taxes | 11,816 | 12,115 | (14,311) | 82,332 | (80) | 210,309 | — | 302,179 | |||||||||||||||||||||||||||||||||||||||
| Income tax (expense) benefit | (2,836) | (2,908) | 3,434 | (19,760) | 20 | (48,524) | — | (70,573) | |||||||||||||||||||||||||||||||||||||||
| Net income (loss) | 8,980 | 9,207 | (10,877) | 62,572 | (60) | 161,785 | — | 231,606 | |||||||||||||||||||||||||||||||||||||||
| Net loss (income) attributable to noncontrolling interests | — | — | — | — | — | 3,385 | — | 3,385 | |||||||||||||||||||||||||||||||||||||||
| Net income (loss) attributable to Nelnet, Inc. | $ | 8,980 | 9,207 | (10,877) | 62,572 | (60) | 165,170 | — | 234,991 | ||||||||||||||||||||||||||||||||||||||
(a) On December 21, 2020, the Company deconsolidated ALLO from the Company’s consolidated financial statements. Accordingly, the operating results for the Communications operating segment in the table above are for the period from October 1 2020 through December 21, 2020.
12
| Three months ended September 30, 2020 | |||||||||||||||||||||||||||||||||||||||||||||||
| Loan Servicing and Systems | Education Technology, Services, and Payment Processing | Communications | Asset Generation and Management | Nelnet Bank | Corporate and Other Activities | Eliminations | Total | ||||||||||||||||||||||||||||||||||||||||
| Total interest income | $ | 34 | 367 | — | 137,959 | — | 1,646 | (261) | 139,745 | ||||||||||||||||||||||||||||||||||||||
| Interest expense | 24 | 16 | — | 57,755 | — | 888 | (261) | 58,423 | |||||||||||||||||||||||||||||||||||||||
| Net interest income (expense) | 10 | 351 | — | 80,204 | — | 758 | — | 81,322 | |||||||||||||||||||||||||||||||||||||||
| Less provision for loan losses | — | — | — | (5,821) | — | — | — | (5,821) | |||||||||||||||||||||||||||||||||||||||
| Net interest income after provision for loan losses | 10 | 351 | — | 86,025 | — | 758 | — | 87,143 | |||||||||||||||||||||||||||||||||||||||
| Other income/expense: | |||||||||||||||||||||||||||||||||||||||||||||||
| Loan servicing and systems revenue | 113,794 | — | — | — | — | — | — | 113,794 | |||||||||||||||||||||||||||||||||||||||
| Intersegment revenue | 8,287 | 3 | — | — | — | — | (8,290) | — | |||||||||||||||||||||||||||||||||||||||
| Education technology, services, and payment processing revenue | — | 74,121 | — | — | — | — | — | 74,121 | |||||||||||||||||||||||||||||||||||||||
| Communications revenue | — | — | 20,211 | — | — | — | — | 20,211 | |||||||||||||||||||||||||||||||||||||||
| Other | 2,353 | 373 | 511 | 1,004 | — | (2,737) | — | 1,502 | |||||||||||||||||||||||||||||||||||||||
| Gain on sale of loans | — | — | — | 14,817 | — | — | — | 14,817 | |||||||||||||||||||||||||||||||||||||||
| Gain from deconsolidation of ALLO | — | — | — | — | — | — | — | — | |||||||||||||||||||||||||||||||||||||||
| Impairment expense and provision for beneficial interests | — | — | — | — | — | — | — | — | |||||||||||||||||||||||||||||||||||||||
| Derivative settlements, net | — | — | — | (2,391) | — | — | — | (2,391) | |||||||||||||||||||||||||||||||||||||||
| Derivative market value adjustments, net | — | — | — | 3,440 | — | — | — | 3,440 | |||||||||||||||||||||||||||||||||||||||
| Total other income/expense | 124,434 | 74,497 | 20,722 | 16,870 | — | (2,737) | (8,290) | 225,494 | |||||||||||||||||||||||||||||||||||||||
| Cost of services: | |||||||||||||||||||||||||||||||||||||||||||||||
| Cost to provide education technology, services, and payment processing services | — | 25,243 | — | — | — | — | — | 25,243 | |||||||||||||||||||||||||||||||||||||||
| Cost to provide communications services | — | — | 5,914 | — | — | — | — | 5,914 | |||||||||||||||||||||||||||||||||||||||
| Total cost of services | — | 25,243 | 5,914 | — | — | — | — | 31,157 | |||||||||||||||||||||||||||||||||||||||
| Operating expenses: | |||||||||||||||||||||||||||||||||||||||||||||||
| Salaries and benefits | 72,912 | 25,460 | 5,485 | 438 | — | 21,801 | — | 126,096 | |||||||||||||||||||||||||||||||||||||||
| Depreciation and amortization | 9,951 | 2,366 | 11,152 | — | — | 6,839 | — | 30,308 | |||||||||||||||||||||||||||||||||||||||
| Other expenses | 12,407 | 3,126 | 2,219 | 3,672 | — | 13,320 | — | 34,744 | |||||||||||||||||||||||||||||||||||||||
| Intersegment expenses, net | 15,834 | 3,610 | 491 | 8,868 | — | (20,513) | (8,290) | — | |||||||||||||||||||||||||||||||||||||||
| Total operating expenses | 111,104 | 34,562 | 19,347 | 12,978 | — | 21,447 | (8,290) | 191,148 | |||||||||||||||||||||||||||||||||||||||
| Income (loss) before income taxes | 13,340 | 15,043 | (4,539) | 89,917 | — | (23,426) | — | 90,332 | |||||||||||||||||||||||||||||||||||||||
| Income tax (expense) benefit | (3,201) | (3,610) | 1,089 | (21,580) | — | 8,146 | — | (19,156) | |||||||||||||||||||||||||||||||||||||||
| Net income (loss) | 10,139 | 11,433 | (3,450) | 68,337 | — | (15,280) | — | 71,176 | |||||||||||||||||||||||||||||||||||||||
| Net loss (income) attributable to noncontrolling interests | — | — | — | — | — | 327 | — | 327 | |||||||||||||||||||||||||||||||||||||||
| Net income (loss) attributable to Nelnet, Inc. | $ | 10,139 | 11,433 | (3,450) | 68,337 | — | (14,953) | — | 71,503 | ||||||||||||||||||||||||||||||||||||||
13
| Three months ended December 31, 2019 | |||||||||||||||||||||||||||||||||||||||||||||||
| Loan Servicing and Systems | Education Technology, Services, and Payment Processing | Communications | Asset Generation and Management | Nelnet Bank | Corporate and Other Activities | Eliminations | Total | ||||||||||||||||||||||||||||||||||||||||
| Total interest income | $ | 452 | 2,069 | — | 208,576 | — | 2,062 | (801) | 212,358 | ||||||||||||||||||||||||||||||||||||||
| Interest expense | 46 | 14 | — | 149,056 | — | (208) | (801) | 148,106 | |||||||||||||||||||||||||||||||||||||||
| Net interest income (expense) | 406 | 2,055 | — | 59,520 | — | 2,270 | — | 64,252 | |||||||||||||||||||||||||||||||||||||||
| Less provision for loan losses | — | — | — | 13,000 | — | — | — | 13,000 | |||||||||||||||||||||||||||||||||||||||
| Net interest income after provision for loan losses | 406 | 2,055 | — | 46,520 | — | 2,270 | — | 51,252 | |||||||||||||||||||||||||||||||||||||||
| Other income/expense: | |||||||||||||||||||||||||||||||||||||||||||||||
| Loan servicing and systems revenue | 113,086 | — | — | — | — | — | — | 113,086 | |||||||||||||||||||||||||||||||||||||||
| Intersegment revenue | 11,325 | — | — | — | — | — | (11,325) | — | |||||||||||||||||||||||||||||||||||||||
| Education technology, services, and payment processing revenue | — | 63,578 | — | — | — | — | — | 63,578 | |||||||||||||||||||||||||||||||||||||||
| Communications revenue | — | — | 17,499 | — | — | — | — | 17,499 | |||||||||||||||||||||||||||||||||||||||
| Other | 3,094 | 259 | 490 | 3,004 | — | 4,127 | — | 10,973 | |||||||||||||||||||||||||||||||||||||||
| Gain on sale of loans | — | — | — | 15,549 | — | — | — | 15,549 | |||||||||||||||||||||||||||||||||||||||
| Gain from deconsolidation of ALLO | — | — | — | — | — | — | — | — | |||||||||||||||||||||||||||||||||||||||
| Impairment expense and provision for beneficial interests | — | — | — | — | — | — | — | — | |||||||||||||||||||||||||||||||||||||||
| Derivative settlements, net | — | — | — | 6,100 | — | — | — | 6,100 | |||||||||||||||||||||||||||||||||||||||
| Derivative market value adjustments, net | — | — | — | (2,930) | — | — | — | (2,930) | |||||||||||||||||||||||||||||||||||||||
| Total other income/expense | 127,505 | 63,837 | 17,989 | 21,723 | — | 4,127 | (11,325) | 223,855 | |||||||||||||||||||||||||||||||||||||||
| Cost of services: | |||||||||||||||||||||||||||||||||||||||||||||||
| Cost to provide education technology, services, and payment processing services | — | 19,002 | — | — | — | — | — | 19,002 | |||||||||||||||||||||||||||||||||||||||
| Cost to provide communications services | — | — | 5,327 | — | — | — | — | 5,327 | |||||||||||||||||||||||||||||||||||||||
| Total cost of services | — | 19,002 | 5,327 | — | — | — | — | 24,329 | |||||||||||||||||||||||||||||||||||||||
| Operating expenses: | |||||||||||||||||||||||||||||||||||||||||||||||
| Salaries and benefits | 74,212 | 25,010 | 5,312 | 392 | — | 19,635 | — | 124,561 | |||||||||||||||||||||||||||||||||||||||
| Depreciation and amortization | 8,519 | 2,988 | 11,148 | — | — | 5,995 | — | 28,651 | |||||||||||||||||||||||||||||||||||||||
| Other expenses | 18,332 | 5,587 | 3,981 | 5,346 | — | 13,464 | — | 46,710 | |||||||||||||||||||||||||||||||||||||||
| Intersegment expenses, net | 14,008 | 3,763 | 881 | 11,732 | — | (19,059) | (11,325) | — | |||||||||||||||||||||||||||||||||||||||
| Total operating expenses | 115,071 | 37,348 | 21,322 | 17,470 | — | 20,035 | (11,325) | 199,922 | |||||||||||||||||||||||||||||||||||||||
| Income (loss) before income taxes | 12,840 | 9,542 | (8,660) | 50,773 | — | (13,638) | — | 50,856 | |||||||||||||||||||||||||||||||||||||||
| Income tax (expense) benefit | (3,082) | (2,290) | 2,079 | (12,186) | — | 6,457 | — | (9,022) | |||||||||||||||||||||||||||||||||||||||
| Net income (loss) | 9,758 | 7,252 | (6,581) | 38,587 | — | (7,181) | — | 41,834 | |||||||||||||||||||||||||||||||||||||||
| Net loss (income) attributable to noncontrolling interests | — | — | — | — | — | 546 | — | 546 | |||||||||||||||||||||||||||||||||||||||
| Net income (loss) attributable to Nelnet, Inc. | $ | 9,758 | 7,252 | (6,581) | 38,587 | — | (6,635) | — | 42,380 | ||||||||||||||||||||||||||||||||||||||
14
| Year ended December 31, 2020 | |||||||||||||||||||||||||||||||||||||||||||||||
| Loan Servicing and Systems | Education Technology, Services, and Payment Processing | Communications (a) | Asset Generation and Management | Nelnet Bank | Corporate and Other Activities | Eliminations | Total | ||||||||||||||||||||||||||||||||||||||||
| Total interest income | $ | 436 | 3,036 | 2 | 611,474 | 414 | 5,775 | (1,480) | 619,656 | ||||||||||||||||||||||||||||||||||||||
| Interest expense | 121 | 54 | — | 328,157 | 41 | 3,178 | (1,480) | 330,071 | |||||||||||||||||||||||||||||||||||||||
| Net interest income (expense) | 315 | 2,982 | 2 | 283,317 | 373 | 2,597 | — | 289,585 | |||||||||||||||||||||||||||||||||||||||
| Less provision for loan losses | — | — | — | 63,029 | 330 | — | — | 63,360 | |||||||||||||||||||||||||||||||||||||||
| Net interest income after provision for loan losses | 315 | 2,982 | 2 | 220,288 | 43 | 2,597 | — | 226,225 | |||||||||||||||||||||||||||||||||||||||
| Other income/expense: | |||||||||||||||||||||||||||||||||||||||||||||||
| Loan servicing and systems revenue | 451,561 | — | — | — | — | — | — | 451,561 | |||||||||||||||||||||||||||||||||||||||
| Intersegment revenue | 36,520 | 20 | — | — | — | — | (36,540) | — | |||||||||||||||||||||||||||||||||||||||
| Education technology, services, and payment processing revenue | — | 282,196 | — | — | — | — | — | 282,196 | |||||||||||||||||||||||||||||||||||||||
| Communications revenue | — | — | 76,643 | — | — | — | — | 76,643 | |||||||||||||||||||||||||||||||||||||||
| Other | 9,421 | 373 | 1,561 | 7,189 | 48 | 38,969 | — | 57,561 | |||||||||||||||||||||||||||||||||||||||
| Gain on sale of loans | — | — | — | 33,023 | — | — | — | 33,023 | |||||||||||||||||||||||||||||||||||||||
| Gain from deconsolidation of ALLO | — | — | — | — | — | 258,588 | — | 258,588 | |||||||||||||||||||||||||||||||||||||||
| Impairment expense and provision for beneficial interests | — | — | — | (16,607) | — | (8,116) | — | (24,723) | |||||||||||||||||||||||||||||||||||||||
| Derivative settlements, net | — | — | — | 3,679 | — | — | — | 3,679 | |||||||||||||||||||||||||||||||||||||||
| Derivative market value adjustments, net | — | — | — | (28,144) | — | — | — | (28,144) | |||||||||||||||||||||||||||||||||||||||
| Total other income/expense | 497,502 | 282,589 | 78,204 | (860) | 48 | 289,441 | (36,540) | 1,110,384 | |||||||||||||||||||||||||||||||||||||||
| Cost of services: | |||||||||||||||||||||||||||||||||||||||||||||||
| Cost to provide education technology, services, and payment processing services | — | 82,206 | — | — | — | — | — | 82,206 | |||||||||||||||||||||||||||||||||||||||
| Cost to provide communications services | — | — | 22,812 | — | — | — | — | 22,812 | |||||||||||||||||||||||||||||||||||||||
| Total cost of services | — | 82,206 | 22,812 | — | — | — | — | 105,018 | |||||||||||||||||||||||||||||||||||||||
| Operating expenses: | |||||||||||||||||||||||||||||||||||||||||||||||
| Salaries and benefits | 285,526 | 98,847 | 30,935 | 1,747 | 36 | 84,741 | — | 501,832 | |||||||||||||||||||||||||||||||||||||||
| Depreciation and amortization | 37,610 | 9,459 | 42,588 | — | — | 29,043 | — | 118,699 | |||||||||||||||||||||||||||||||||||||||
| Other expenses | 57,420 | 14,566 | 13,327 | 15,806 | 135 | 59,320 | — | 160,574 | |||||||||||||||||||||||||||||||||||||||
| Intersegment expenses, net | 63,886 | 14,293 | 1,732 | 39,172 | — | (82,543) | (36,540) | — | |||||||||||||||||||||||||||||||||||||||
| Total operating expenses | 444,442 | 137,165 | 88,582 | 56,725 | 171 | 90,561 | (36,540) | 781,105 | |||||||||||||||||||||||||||||||||||||||
| Income (loss) before income taxes | 53,375 | 66,200 | (33,188) | 162,703 | (80) | 201,477 | — | 450,486 | |||||||||||||||||||||||||||||||||||||||
| Income tax (expense) benefit | (12,810) | (15,888) | 7,965 | (39,049) | 20 | (41,098) | — | (100,860) | |||||||||||||||||||||||||||||||||||||||
| Net income (loss) | 40,565 | 50,312 | (25,223) | 123,654 | (60) | 160,379 | — | 349,626 | |||||||||||||||||||||||||||||||||||||||
| Net loss (income) attributable to noncontrolling interests | — | — | — | — | — | 2,817 | — | 2,817 | |||||||||||||||||||||||||||||||||||||||
| Net income (loss) attributable to Nelnet, Inc. | $ | 40,565 | 50,312 | (25,223) | 123,654 | (60) | 163,196 | — | 352,443 | ||||||||||||||||||||||||||||||||||||||
(a) On December 21, 2020, the Company deconsolidated ALLO from the Company’s consolidated financial statements. Accordingly, the operating results for the Communications operating segment in the table above are for the period from January 1 2020 through December 21, 2020.
15
| Year ended December 31, 2019 | |||||||||||||||||||||||||||||||||||||||||||||||
| Loan Servicing and Systems | Education Technology, Services, and Payment Processing | Communications | Asset Generation and Management | Nelnet Bank | Corporate and Other Activities | Eliminations | Total | ||||||||||||||||||||||||||||||||||||||||
| Total interest income | $ | 2,031 | 9,244 | 3 | 931,963 | — | 9,232 | (3,796) | 948,677 | ||||||||||||||||||||||||||||||||||||||
| Interest expense | 115 | 46 | — | 693,375 | — | 9,587 | (3,796) | 699,327 | |||||||||||||||||||||||||||||||||||||||
| Net interest income (expense) | 1,916 | 9,198 | 3 | 238,588 | — | (355) | — | 249,350 | |||||||||||||||||||||||||||||||||||||||
| Less provision for loan losses | — | — | — | 39,000 | — | — | — | 39,000 | |||||||||||||||||||||||||||||||||||||||
| Net interest income after provision for loan losses | 1,916 | 9,198 | 3 | 199,588 | — | (355) | — | 210,350 | |||||||||||||||||||||||||||||||||||||||
| Other income/expense: | |||||||||||||||||||||||||||||||||||||||||||||||
| Loan servicing and systems revenue | 455,255 | — | — | — | — | — | — | 455,255 | |||||||||||||||||||||||||||||||||||||||
| Intersegment revenue | 46,751 | — | — | — | — | — | (46,751) | — | |||||||||||||||||||||||||||||||||||||||
| Education technology, services, and payment processing revenue | — | 277,331 | — | — | — | — | — | 277,331 | |||||||||||||||||||||||||||||||||||||||
| Communications revenue | — | — | 64,269 | — | — | — | — | 64,269 | |||||||||||||||||||||||||||||||||||||||
| Other | 9,736 | 259 | 1,509 | 13,088 | — | 23,327 | — | 47,918 | |||||||||||||||||||||||||||||||||||||||
| Gain on sale of loans | — | — | — | 17,261 | — | — | — | 17,261 | |||||||||||||||||||||||||||||||||||||||
| Gain from deconsolidation of ALLO | — | — | — | — | — | — | — | — | |||||||||||||||||||||||||||||||||||||||
| Impairment expense and provision for beneficial interests | — | — | — | — | — | — | — | — | |||||||||||||||||||||||||||||||||||||||
| Derivative settlements, net | — | — | — | 45,406 | — | — | — | 45,406 | |||||||||||||||||||||||||||||||||||||||
| Derivative market value adjustments, net | — | — | — | (76,195) | — | — | — | (76,195) | |||||||||||||||||||||||||||||||||||||||
| Total other income/expense | 511,742 | 277,590 | 65,778 | (440) | — | 23,327 | (46,751) | 831,245 | |||||||||||||||||||||||||||||||||||||||
| Cost of services: | |||||||||||||||||||||||||||||||||||||||||||||||
| Cost to provide education technology, services, and payment processing services | — | 81,603 | — | — | — | — | — | 81,603 | |||||||||||||||||||||||||||||||||||||||
| Cost to provide communications services | — | — | 20,423 | — | — | — | — | 20,423 | |||||||||||||||||||||||||||||||||||||||
| Total cost of services | — | 81,603 | 20,423 | — | — | — | — | 102,026 | |||||||||||||||||||||||||||||||||||||||
| Operating expenses: | |||||||||||||||||||||||||||||||||||||||||||||||
| Salaries and benefits | 276,136 | 94,666 | 21,004 | 1,545 | — | 70,152 | — | 463,503 | |||||||||||||||||||||||||||||||||||||||
| Depreciation and amortization | 34,755 | 12,820 | 37,173 | — | — | 20,300 | — | 105,049 | |||||||||||||||||||||||||||||||||||||||
| Other expenses | 71,064 | 22,027 | 15,165 | 34,445 | — | 51,571 | — | 194,272 | |||||||||||||||||||||||||||||||||||||||
| Intersegment expenses, net | 54,325 | 13,405 | 2,962 | 47,362 | — | (71,303) | (46,751) | — | |||||||||||||||||||||||||||||||||||||||
| Total operating expenses | 436,280 | 142,918 | 76,304 | 83,352 | — | 70,720 | (46,751) | 762,824 | |||||||||||||||||||||||||||||||||||||||
| Income (loss) before income taxes | 77,378 | 62,267 | (30,946) | 115,796 | — | (47,748) | — | 176,745 | |||||||||||||||||||||||||||||||||||||||
| Income tax (expense) benefit | (18,571) | (14,944) | 7,427 | (27,792) | — | 18,428 | — | (35,451) | |||||||||||||||||||||||||||||||||||||||
| Net income (loss) | 58,807 | 47,323 | (23,519) | 88,004 | — | (29,320) | — | 141,294 | |||||||||||||||||||||||||||||||||||||||
| Net loss (income) attributable to noncontrolling interests | — | — | — | — | — | 509 | — | 509 | |||||||||||||||||||||||||||||||||||||||
| Net income (loss) attributable to Nelnet, Inc. | $ | 58,807 | 47,323 | (23,519) | 88,004 | — | (28,811) | — | 141,803 | ||||||||||||||||||||||||||||||||||||||
16
Net Interest Income, Net of Settlements on Derivatives
The following table summarizes the components of "net interest income" and "derivative settlements, net."
Derivative settlements represent the cash paid or received during the current period to settle with derivative instrument counterparties the economic effect of the Company's derivative instruments based on their contractual terms. Derivative accounting requires that net settlements with respect to derivatives that do not qualify for "hedge treatment" under GAAP be recorded in a separate income statement line item below net interest income. The Company maintains an overall risk management strategy that incorporates the use of derivative instruments to reduce the economic effect of interest rate volatility. As such, management believes derivative settlements for each applicable period should be evaluated with the Company’s net interest income as presented in the table below. Net interest income (net of settlements on derivatives) is a non-GAAP financial measure, and the Company reports this non-GAAP information because the Company believes that it provides additional information regarding operational and performance indicators that are closely assessed by management. There is no comprehensive, authoritative guidance for the presentation of such non-GAAP information, which is only meant to supplement GAAP results by providing additional information that management utilizes to assess performance. See "Derivative Settlements" included in this supplement for the net settlement activity recognized by the Company for each type of derivative for the periods presented in the table below.
| Three months ended | Year ended | ||||||||||||||||||||||||||||
| December 31, 2020 | September 30, 2020 | December 31, 2019 | December 31, 2020 | December 31, 2019 | |||||||||||||||||||||||||
| Variable loan interest margin | $ | 44,008 | 40,364 | 40,643 | 144,871 | 174,954 | |||||||||||||||||||||||
| Settlements on associated derivatives (a) | (60) | 1,197 | 1,839 | 10,378 | 5,214 | ||||||||||||||||||||||||
| Variable loan interest margin, net of settlements on derivatives | 43,948 | 41,561 | 42,482 | 155,249 | 180,168 | ||||||||||||||||||||||||
| Fixed rate floor income | 36,202 | 36,633 | 15,727 | 123,460 | 49,677 | ||||||||||||||||||||||||
| Settlements on associated derivatives (b) | (3,927) | (3,588) | 4,261 | (6,699) | 40,192 | ||||||||||||||||||||||||
| Fixed rate floor income, net of settlements on derivatives | 32,275 | 33,045 | 19,988 | 116,761 | 89,869 | ||||||||||||||||||||||||
| Investment interest | 6,164 | 5,238 | 7,720 | 24,543 | 34,421 | ||||||||||||||||||||||||
| Corporate debt interest expense | 181 | (913) | 162 | (3,289) | (9,702) | ||||||||||||||||||||||||
| Net interest income (net of settlements on derivatives) | $ | 82,568 | 78,931 | 70,352 | 293,264 | 294,756 | |||||||||||||||||||||||
(a) Includes the net settlements (paid) received related to the Company’s 1:3 basis swaps.
(b) Includes the net settlements (paid) received related to the Company’s floor income interest rate swaps.
17
Loan Servicing and Systems Revenue
The following table provides disaggregated revenue by service offering for the Loan Servicing and Systems operating segment.
| Three months ended | Year ended | ||||||||||||||||||||||||||||
| December 31, 2020 | September 30, 2020 | December 31, 2019 | December 31, 2020 | December 31, 2019 | |||||||||||||||||||||||||
| Government servicing - Nelnet | $ | 34,493 | 36,295 | 39,247 | 146,798 | 157,991 | |||||||||||||||||||||||
| Government servicing - Great Lakes | 42,862 | 45,350 | 46,371 | 179,872 | 185,656 | ||||||||||||||||||||||||
| Private education and consumer loan servicing | 7,759 | 7,928 | 8,762 | 32,492 | 36,788 | ||||||||||||||||||||||||
| FFELP servicing | 4,740 | 4,912 | 5,835 | 20,183 | 25,043 | ||||||||||||||||||||||||
| Software services | 9,604 | 10,426 | 10,822 | 41,999 | 41,077 | ||||||||||||||||||||||||
| Outsourced services and other | 14,532 | 8,883 | 2,049 | 30,217 | 8,700 | ||||||||||||||||||||||||
| Loan servicing and systems revenue | $ | 113,990 | 113,794 | 113,086 | 451,561 | 455,255 | |||||||||||||||||||||||
Loan Servicing Volumes
| As of | |||||||||||||||||||||||||||||||||||||||||||||||||||||
| December 31, 2018 | March 31, 2019 | June 30, 2019 | September 30, 2019 | December 31, 2019 | March 31, 2020 | June 30, 2020 | September 30, 2020 | December 31, 2020 | |||||||||||||||||||||||||||||||||||||||||||||
| Servicing volume (dollars in millions): | |||||||||||||||||||||||||||||||||||||||||||||||||||||
| Nelnet: | |||||||||||||||||||||||||||||||||||||||||||||||||||||
| Government | $ | 179,507 | 183,093 | 181,682 | 184,399 | 183,790 | 185,477 | 185,315 | 189,932 | 191,678 | |||||||||||||||||||||||||||||||||||||||||||
| FFELP | 36,748 | 35,917 | 35,003 | 33,981 | 33,185 | 32,326 | 31,392 | 31,122 | 30,763 | ||||||||||||||||||||||||||||||||||||||||||||
| Private and consumer | 15,666 | 16,065 | 16,025 | 16,286 | 16,033 | 16,364 | 16,223 | 16,267 | 16,226 | ||||||||||||||||||||||||||||||||||||||||||||
| Great Lakes: | |||||||||||||||||||||||||||||||||||||||||||||||||||||
| Government | 232,694 | 237,050 | 236,500 | 240,268 | 239,980 | 243,205 | 243,609 | 249,723 | 251,570 | ||||||||||||||||||||||||||||||||||||||||||||
| Total | $ | 464,615 | 472,125 | 469,210 | 474,934 | 472,988 | 477,372 | 476,539 | 487,044 | 490,237 | |||||||||||||||||||||||||||||||||||||||||||
| Number of servicing borrowers: | |||||||||||||||||||||||||||||||||||||||||||||||||||||
| Nelnet: | |||||||||||||||||||||||||||||||||||||||||||||||||||||
| Government | 5,771,923 | 5,708,582 | 5,592,989 | 5,635,653 | 5,574,001 | 5,498,872 | 5,496,662 | 5,604,685 | 5,645,946 | ||||||||||||||||||||||||||||||||||||||||||||
| FFELP | 1,709,853 | 1,650,785 | 1,588,530 | 1,529,392 | 1,478,703 | 1,423,286 | 1,370,007 | 1,332,908 | 1,300,677 | ||||||||||||||||||||||||||||||||||||||||||||
| Private and consumer | 696,933 | 699,768 | 693,410 | 701,299 | 682,836 | 670,702 | 653,281 | 649,258 | 636,136 | ||||||||||||||||||||||||||||||||||||||||||||
| Great Lakes: | |||||||||||||||||||||||||||||||||||||||||||||||||||||
| Government | 7,458,684 | 7,385,284 | 7,300,691 | 7,430,165 | 7,396,657 | 7,344,509 | 7,346,691 | 7,542,679 | 7,605,984 | ||||||||||||||||||||||||||||||||||||||||||||
| Total | 15,637,393 | 15,444,419 | 15,175,620 | 15,296,509 | 15,132,197 | 14,937,369 | 14,866,641 | 15,129,530 | 15,188,743 | ||||||||||||||||||||||||||||||||||||||||||||
| Number of remote hosted borrowers: | 6,393,151 | 6,332,261 | 6,211,132 | 6,457,296 | 6,433,324 | 6,354,158 | 6,264,559 | 6,251,598 | 6,555,841 | ||||||||||||||||||||||||||||||||||||||||||||
Education Technology, Services, and Payment Processing
The following table provides disaggregated revenue by servicing offering for the Education Technology, Services, and Payment Processing operating segment.
| Three months ended | Year ended | ||||||||||||||||||||||||||||
| December 31, 2020 | September 30, 2020 | December 31, 2019 | December 31, 2020 | December 31, 2019 | |||||||||||||||||||||||||
| Tuition payment plan services | $ | 23,663 | 22,477 | 26,093 | 100,674 | 106,682 | |||||||||||||||||||||||
| Payment processing | 25,975 | 35,420 | 25,420 | 114,304 | 110,848 | ||||||||||||||||||||||||
| Education technology and services | 15,065 | 15,840 | 11,706 | 65,885 | 58,578 | ||||||||||||||||||||||||
| Other | 394 | 384 | 359 | 1,333 | 1,223 | ||||||||||||||||||||||||
| Education technology, services, and payment processing revenue | $ | 65,097 | 74,121 | 63,578 | 282,196 | 277,331 | |||||||||||||||||||||||
18
Communications Financial and Operating Data
Certain financial and operating data for ALLO is summarized in the tables below. On December 21, 2020, the Company deconsolidated ALLO from the Company's consolidated financial statements. See "Overview - Recapitalization and Additional Funding for ALLO" above in this supplement for additional information.
| Period from October 1 to December 21, 2020 | Three months ended September 30, 2020 | Three months ended December 31, 2019 | Period from January 1 to December 21, 2020 | Year ended December 31, 2019 | |||||||||||||||||||||||||||||||||||||||||||||||||||||||
| Residential revenue | $ | 15,083 | 78.3 | % | $ | 15,173 | 75.1 | % | $ | 12,993 | 74.3 | % | $ | 58,029 | 75.7 | % | $ | 48,344 | 75.2 | % | |||||||||||||||||||||||||||||||||||||||
| Business revenue | 4,036 | 21.0 | 4,918 | 24.3 | 4,433 | 25.3 | 18,038 | 23.5 | 15,689 | 24.4 | |||||||||||||||||||||||||||||||||||||||||||||||||
| Other revenue | 134 | 0.7 | 120 | 0.6 | 73 | 0.4 | 576 | 0.8 | 236 | 0.4 | |||||||||||||||||||||||||||||||||||||||||||||||||
| Communications revenue | $ | 19,253 | 100.0 | % | $ | 20,211 | 100.0 | % | $ | 17,499 | 100.0 | % | $ | 76,643 | 100.0 | % | $ | 64,269 | 100.0 | % | |||||||||||||||||||||||||||||||||||||||
| Revenue contribution: | |||||||||||||||||||||||||||||||||||||||||||||||||||||||||||
| Internet | $ | 12,436 | 64.6 | % | $ | 12,794 | 63.3 | % | $ | 10,598 | 60.5 | % | $ | 48,362 | 63.1 | % | $ | 38,239 | 59.5 | % | |||||||||||||||||||||||||||||||||||||||
| Television | 4,178 | 21.7 | 4,446 | 22.0 | 4,176 | 23.9 | 17,091 | 22.3 | 16,196 | 25.2 | |||||||||||||||||||||||||||||||||||||||||||||||||
| Telephone | 2,601 | 13.5 | 2,931 | 14.5 | 2,643 | 15.1 | 11,037 | 14.4 | 9,705 | 15.1 | |||||||||||||||||||||||||||||||||||||||||||||||||
| Other | 38 | 0.2 | 40 | 0.2 | 82 | 0.5 | 153 | 0.2 | 129 | 0.2 | |||||||||||||||||||||||||||||||||||||||||||||||||
| Communications revenue | $ | 19,253 | 100.0 | % | $ | 20,211 | 100.0 | % | $ | 17,499 | 100.0 | % | $ | 76,643 | 100.0 | % | $ | 64,269 | 100.0 | % | |||||||||||||||||||||||||||||||||||||||
| Net loss | $ | (10,877) | (3,450) | (6,581) | (25,223) | (23,519) | |||||||||||||||||||||||||||||||||||||||||||||||||||||
| EBITDA (a) | (4,207) | 6,613 | 2,488 | 9,398 | 6,224 | ||||||||||||||||||||||||||||||||||||||||||||||||||||||
| Capital expenditures | 16,467 | 14,250 | 7,803 | 47,957 | 44,988 | ||||||||||||||||||||||||||||||||||||||||||||||||||||||
| As of | |||||||||||||||||||||||||||||||||||||||||||||||||||||
| December 21, 2020 | September 30, 2020 | June 30, 2020 | March 31, 2020 | December 31, 2019 | September 30, 2019 | June 30, 2019 | March 31, 2019 | December 31, 2018 | |||||||||||||||||||||||||||||||||||||||||||||
| Residential customer information: | |||||||||||||||||||||||||||||||||||||||||||||||||||||
| Households served | 59,274 | 56,787 | 53,067 | 49,684 | 47,744 | 45,228 | 42,760 | 40,338 | 37,351 | ||||||||||||||||||||||||||||||||||||||||||||
| Households passed (b) | 149,622 | 147,087 | 144,869 | 143,505 | 140,986 | 137,269 | 132,984 | 127,253 | 122,396 | ||||||||||||||||||||||||||||||||||||||||||||
| Households served/passed | 39.6 | % | 38.6 | % | 36.6 | % | 34.6 | % | 33.9 | % | 32.9 | % | 32.2 | % | 31.7 | % | 30.5 | % | |||||||||||||||||||||||||||||||||||
| Total households in current markets | 171,121 | 171,121 | 171,121 | 171,121 | 160,884 | 159,974 | 159,974 | 152,840 | 152,840 | ||||||||||||||||||||||||||||||||||||||||||||
(a) Earnings (loss) before interest, income taxes, depreciation, and amortization ("EBITDA") is a supplemental non-GAAP performance measure that is frequently used in capital-intensive industries such as telecommunications. ALLO's management uses EBITDA to compare ALLO's performance to that of its competitors and to eliminate certain non-cash and non-operating items in order to consistently measure performance from period to period. EBITDA excludes interest and income taxes because these items are associated with a company's particular capitalization and tax structures. EBITDA also excludes depreciation and amortization expense because these non-cash expenses primarily reflect the impact of historical capital investments, as opposed to the cash impacts of capital expenditures made in recent periods, which may be evaluated through cash flow measures. The Company reports EBITDA for ALLO because the Company believes that it provides useful additional information for investors regarding a key metric used by management to assess ALLO's performance. There are limitations to using EBITDA as a performance measure, including the difficulty associated with comparing companies that use similar performance measures whose calculations may differ from ALLO's calculations. In addition, EBITDA should not be considered a substitute for other measures of financial performance, such as net income or any other performance measures derived in accordance with GAAP. A reconciliation of EBITDA from ALLO's net loss under GAAP is presented below.
| Period from October 1 to December 21, 2020 | Three months ended September 30, 2020 | Three months ended December 31, 2019 | Period from January 1 to December 21, 2020 | Year ended December 31, 2019 | |||||||||||||||||||||||||
| Net loss | $ | (10,877) | (3,450) | (6,581) | (25,223) | (23,519) | |||||||||||||||||||||||
| Net interest income | (2) | — | — | (2) | (3) | ||||||||||||||||||||||||
| Income tax benefit | (3,434) | (1,089) | (2,079) | (7,965) | (7,427) | ||||||||||||||||||||||||
| Depreciation and amortization | 10,106 | 11,152 | 11,148 | 42,588 | 37,173 | ||||||||||||||||||||||||
| Earnings (loss) before interest, income taxes, depreciation, and amortization (EBITDA) | $ | (4,207) | 6,613 | 2,488 | 9,398 | 6,224 | |||||||||||||||||||||||
(b) Represents the number of single residence homes, apartments, and condominiums that ALLO already serves and those in which ALLO has the capacity to connect to its network distribution system without further material extensions to the transmission lines, but have not been connected.
19
Other Income
The following table summarizes the components of "other income."
| Three months ended | Year ended | ||||||||||||||||||||||||||||
| December 31, 2020 | September 30, 2020 | December 31, 2019 | December 31, 2020 | December 31, 2019 | |||||||||||||||||||||||||
| Gain on remeasurement of HUDL investment | $ | — | — | — | 51,018 | — | |||||||||||||||||||||||
| Investment advisory services | 2,688 | 4,463 | 747 | 10,875 | 2,941 | ||||||||||||||||||||||||
| Management fee revenue | 2,524 | 2,353 | 3,094 | 9,421 | 9,736 | ||||||||||||||||||||||||
| Borrower late fee income | 816 | 871 | 3,014 | 5,194 | 12,884 | ||||||||||||||||||||||||
| Income/gains from investments, net | 1,451 | 1,687 | 2,577 | 2,205 | 8,356 | ||||||||||||||||||||||||
| Loss from solar investments | (24,785) | (11,839) | (2,220) | (37,423) | (2,220) | ||||||||||||||||||||||||
| Other | 4,956 | 3,967 | 3,761 | 16,271 | 16,221 | ||||||||||||||||||||||||
| Other income | $ | (12,350) | 1,502 | 10,973 | 57,561 | 47,918 | |||||||||||||||||||||||
Derivative Settlements
The following table summarizes the components of "derivative settlements, net" included in the attached consolidated statements of income.
| Three months ended | Year ended | ||||||||||||||||||||||||||||
| December 31, 2020 | September 30, 2020 | December 31, 2019 | December 31, 2020 | December 31, 2019 | |||||||||||||||||||||||||
| 1:3 basis swaps | $ | (60) | 1,197 | 1,839 | 10,378 | 5,214 | |||||||||||||||||||||||
| Interest rate swaps - floor income hedges | (3,928) | (3,588) | 4,261 | (6,699) | 40,192 | ||||||||||||||||||||||||
| Total derivative settlements - (expense) income | $ | (3,988) | (2,391) | 6,100 | 3,679 | 45,406 | |||||||||||||||||||||||
Loans and Accrued Interest Receivable and Allowance for Loan Losses
Loans and accrued interest receivable consisted of the following:
| As of | As of | As of | |||||||||||||||
| December 31, 2020 | September 30, 2020 | December 31, 2019 | |||||||||||||||
| Federally insured student loans: | |||||||||||||||||
| Stafford and other | $ | 4,383,000 | 4,372,469 | 4,684,314 | |||||||||||||
| Consolidation | 14,746,173 | 14,773,110 | 15,644,229 | ||||||||||||||
| Total | 19,129,173 | 19,145,579 | 20,328,543 | ||||||||||||||
| Private education loans | 338,132 | 273,807 | 244,258 | ||||||||||||||
| Consumer loans | 109,346 | 100,180 | 225,918 | ||||||||||||||
| 19,576,651 | 19,519,566 | 20,798,719 | |||||||||||||||
| Accrued interest receivable | 794,611 | 760,787 | 733,497 | ||||||||||||||
| Loan discount, net of unamortized loan premiums and deferred origination costs | (9,908) | (17,912) | (35,036) | ||||||||||||||
| Non-accretable discount | — | — | (32,398) | ||||||||||||||
| Allowance for loan losses: | |||||||||||||||||
| Federally insured loans | (128,590) | (139,943) | (36,763) | ||||||||||||||
| Private education loans | (19,852) | (20,013) | (9,597) | ||||||||||||||
| Consumer loans | (27,256) | (25,943) | (15,554) | ||||||||||||||
| $ | 20,185,656 | 20,076,542 | 21,402,868 | ||||||||||||||
The Company's total allowance for loan losses of $175.7 million at December 31, 2020 represents reserves equal to 0.7% of the Company's federally insured loans (or 26.3% of the risk sharing component of the loans that is not covered by the federal guaranty), 5.9% of the Company's private education loans, and 24.9% of the Company's consumer loans.
20
Loan Activity
The following table sets forth the activity of AGM's loan portfolio:
| Three months ended | Year ended | ||||||||||||||||||||||||||||
| December 31, 2020 | September 30, 2020 | December 31, 2019 | December 31, 2020 | December 31, 2019 | |||||||||||||||||||||||||
| Beginning balance | $ | 19,519,566 | 19,830,397 | 21,206,948 | 20,798,719 | 22,520,498 | |||||||||||||||||||||||
| Loan acquisitions: | |||||||||||||||||||||||||||||
| Federally insured student loans | 380,402 | 137,714 | 441,645 | 1,327,690 | 1,530,294 | ||||||||||||||||||||||||
| Private education loans | 71,140 | — | 67,739 | 152,048 | 71,543 | ||||||||||||||||||||||||
| Consumer loans | 24,728 | 26,446 | 107,634 | 136,985 | 405,726 | ||||||||||||||||||||||||
| Total loan acquisitions | 476,270 | 164,160 | 617,018 | 1,616,723 | 2,007,563 | ||||||||||||||||||||||||
| Repayments, claims, capitalized interest, and other | (283,881) | (277,949) | (635,693) | (1,999,095) | (2,511,641) | ||||||||||||||||||||||||
| Consolidation loans lost to external parties | (152,847) | (136,263) | (210,253) | (672,211) | (990,720) | ||||||||||||||||||||||||
| Consumer loans sold | — | (60,779) | (179,301) | (185,028) | (226,981) | ||||||||||||||||||||||||
| Ending balance | $ | 19,559,108 | 19,519,566 | 20,798,719 | 19,559,108 | 20,798,719 | |||||||||||||||||||||||
The Company has also purchased partial ownership in certain federally insured and consumer loan securitizations. As of the latest remittance reports filed by the various trusts prior to December 31, 2020, the Company’s ownership correlates to approximately $500 million and $280 million of federally insured and consumer loans, respectively, included in these securitizations.
21
Loan Spread Analysis
The following table analyzes the loan spread on AGM’s portfolio of loans, which represents the spread between the yield earned on loan assets and the costs of the liabilities and derivative instruments used to fund the assets.
| Three months ended | Year ended | ||||||||||||||||||||||||||||
| December 31, 2020 | September 30, 2020 | December 31, 2019 | December 31, 2020 | December 31, 2019 | |||||||||||||||||||||||||
| Variable loan yield, gross | 2.76 | % | 2.77 | % | 4.36 | % | 3.17 | % | 4.80 | % | |||||||||||||||||||
| Consolidation rebate fees | (0.84) | (0.84) | (0.83) | (0.84) | (0.83) | ||||||||||||||||||||||||
| Discount accretion, net of premium and deferred origination costs amortization | 0.01 | 0.01 | 0.02 | 0.01 | 0.02 | ||||||||||||||||||||||||
| Variable loan yield, net | 1.93 | 1.94 | 3.55 | 2.34 | 3.99 | ||||||||||||||||||||||||
| Loan cost of funds - interest expense | (1.08) | (1.16) | (2.83) | (1.64) | (3.25) | ||||||||||||||||||||||||
| Loan cost of funds - derivative settlements (a) (b) | (0.00 | ) | 0.02 | 0.04 | 0.05 | 0.03 | |||||||||||||||||||||||
| Variable loan spread | 0.85 | 0.80 | 0.76 | 0.75 | 0.77 | ||||||||||||||||||||||||
| Fixed rate floor income, gross | 0.73 | 0.73 | 0.30 | 0.61 | 0.22 | ||||||||||||||||||||||||
| Fixed rate floor income - derivative settlements (a) (c) | (0.08) | (0.07) | 0.08 | (0.03) | 0.19 | ||||||||||||||||||||||||
| Fixed rate floor income, net of settlements on derivatives | 0.65 | 0.66 | 0.38 | 0.58 | 0.41 | ||||||||||||||||||||||||
| Core loan spread | 1.50 | % | 1.46 | % | 1.14 | % | 1.33 | % | 1.18 | % | |||||||||||||||||||
| Average balance of AGM's loans | $ | 19,753,650 | 19,866,040 | 21,040,484 | 20,163,876 | 21,698,094 | |||||||||||||||||||||||
| Average balance of AGM's debt outstanding | 19,402,942 | 19,632,675 | 20,850,214 | 19,964,813 | 21,259,309 | ||||||||||||||||||||||||
(a) Derivative settlements represent the cash paid or received during the current period to settle with derivative instrument counterparties the economic effect of the Company's derivative instruments based on their contractual terms. Derivative accounting requires that net settlements with respect to derivatives that do not qualify for "hedge treatment" under GAAP be recorded in a separate income statement line item below net interest income. The Company maintains an overall risk management strategy that incorporates the use of derivative instruments to reduce the economic effect of interest rate volatility. As such, management believes derivative settlements for each applicable period should be evaluated with the Company’s net interest income (loan spread) as presented in this table. The Company reports this non-GAAP information because it believes that it provides additional information regarding operational and performance indicators that are closely assessed by management. There is no comprehensive, authoritative guidance for the presentation of such non-GAAP information, which is only meant to supplement GAAP results by providing additional information that management utilizes to assess performance. See "Derivative Settlements" included in this supplement for additional information on the Company's derivative instruments, including the net settlement activity recognized by the Company for each type of derivative for the periods presented in the table.
A reconciliation of core loan spread, which includes the impact of derivative settlements on loan spread, to loan spread without derivative settlements follows.
| Three months ended | Year ended | ||||||||||||||||||||||||||||
| December 31, 2020 | September 30, 2020 | December 31, 2019 | December 31, 2020 | December 31, 2019 | |||||||||||||||||||||||||
| Core loan spread | 1.50 | % | 1.46 | % | 1.14 | % | 1.33 | % | 1.18 | % | |||||||||||||||||||
| Derivative settlements (1:3 basis swaps) | 0.00 | (0.02) | (0.04) | (0.05) | (0.03) | ||||||||||||||||||||||||
| Derivative settlements (fixed rate floor income) | 0.08 | 0.07 | (0.08) | 0.03 | (0.19) | ||||||||||||||||||||||||
| Loan spread | 1.58 | % | 1.51 | % | 1.02 | % | 1.31 | % | 0.96 | % | |||||||||||||||||||
(b) Derivative settlements consist of net settlements (paid) received related to the Company’s 1:3 basis swaps.
(c) Derivative settlements consist of net settlements (paid) received related to the Company’s floor income interest rate swaps.
22
A trend analysis of AGM's core and variable loan spreads by calendar year quarter is summarized below.
(a) The interest earned on a large portion of AGM's FFELP student loan assets is indexed to the one-month LIBOR rate. AGM funds a portion of its assets with three-month LIBOR indexed floating rate securities. The relationship between the indices in which AGM earns interest on its loans and funds such loans has a significant impact on loan spread. This table (the right axis) shows the difference between AGM's liability base rate and the one-month LIBOR rate by quarter.
The difference between variable loan spread and core loan spread is fixed rate floor income earned on a portion of AGM's federally insured student loan portfolio. A summary of fixed rate floor income and its contribution to core loan spread follows:
| Three months ended | Year ended | ||||||||||||||||||||||||||||
| December 31, 2020 | September 30, 2020 | December 31, 2019 | December 31, 2020 | December 31, 2019 | |||||||||||||||||||||||||
| Fixed rate floor income, gross | $ | 36,202 | 36,633 | 15,727 | 123,460 | 49,677 | |||||||||||||||||||||||
| Derivative settlements (a) | (3,927) | (3,588) | 4,261 | (6,699) | 40,192 | ||||||||||||||||||||||||
| Fixed rate floor income, net | $ | 32,275 | 33,045 | 19,988 | 116,761 | 89,869 | |||||||||||||||||||||||
| Fixed rate floor income contribution to spread, net | 0.65 | % | 0.66 | % | 0.38 | % | 0.58 | % | 0.41 | % | |||||||||||||||||||
(a) Derivative settlements consist of net settlements (paid) received related to the Company's derivatives used to hedge student loans earning fixed rate floor income.
23
Fixed Rate Floor Income
The following table shows the Company’s federally insured student loan assets that were earning fixed rate floor income as of December 31, 2020.
| Fixed interest rate range | Borrower/lender weighted average yield | Estimated variable conversion rate (a) | Loan balance | |||||||||||||||||
| < 3.0% | 2.88% | 0.24% | $ | 1,186,168 | ||||||||||||||||
| 3.0 - 3.49% | 3.19% | 0.55% | 1,503,152 | |||||||||||||||||
| 3.5 - 3.99% | 3.65% | 1.01% | 1,444,215 | |||||||||||||||||
| 4.0 - 4.49% | 4.20% | 1.56% | 1,081,191 | |||||||||||||||||
| 4.5 - 4.99% | 4.71% | 2.07% | 674,391 | |||||||||||||||||
| 5.0 - 5.49% | 5.22% | 2.58% | 447,689 | |||||||||||||||||
| 5.5 - 5.99% | 5.67% | 3.03% | 300,574 | |||||||||||||||||
| 6.0 - 6.49% | 6.19% | 3.55% | 346,665 | |||||||||||||||||
| 6.5 - 6.99% | 6.70% | 4.06% | 339,577 | |||||||||||||||||
| 7.0 - 7.49% | 7.17% | 4.53% | 125,250 | |||||||||||||||||
| 7.5 - 7.99% | 7.71% | 5.07% | 227,133 | |||||||||||||||||
| 8.0 - 8.99% | 8.18% | 5.54% | 537,150 | |||||||||||||||||
| > 9.0% | 9.05% | 6.41% | 200,936 | |||||||||||||||||
| $ | 8,414,091 | |||||||||||||||||||
(a) The estimated variable conversion rate is the estimated short-term interest rate at which loans would convert to a variable rate. As of December 31, 2020, the weighted average estimated variable conversion rate was 1.94% and the short-term interest rate was 15 basis points.
The following table summarizes the outstanding derivative instruments as of December 31, 2020 used by the Company to economically hedge loans earning fixed rate floor income.
| Maturity | Notional amount | Weighted average fixed rate paid by the Company (a) | ||||||||||||
| 2021 | $ | 600,000 | 2.15 | % | ||||||||||
| 2022 (b) | 500,000 | 0.94 | ||||||||||||
| 2023 | 900,000 | 0.62 | ||||||||||||
| 2024 (c) | 2,000,000 | 0.32 | ||||||||||||
| 2025 | 500,000 | 0.35 | ||||||||||||
| $ | 4,500,000 | 0.70 | % | |||||||||||
(a) For all interest rate derivatives, the Company receives discrete three-month LIBOR.
(b) $250.0 million of these derivatives have forward effective start dates in June 2021.
(c) $750.0 million of these derivatives have forward effective start dates in June 2021.
24