Attached files
| file | filename |
|---|---|
| EX-32 - NELNET INC | ex32.htm |
| EX-10.3 - NELNET INC | ex10-3.htm |
| EX-31.1 - NELNET INC | ex31-1.htm |
| EX-10.1 - NELNET INC | ex10-1.htm |
| EX-31.2 - NELNET INC | ex31-2.htm |
| EX-10.4 - NELNET INC | ex10-4.htm |
| EX-10.2 - NELNET INC | ex10-2.htm |
UNITED STATES
SECURITIES AND EXCHANGE COMMISSION
WASHINGTON, D.C. 20549
FORM 10-Q
(Mark One)
|
x
|
QUARTERLY REPORT PURSUANT TO SECTION 13 OR 15(d)
OF THE SECURITIES EXCHANGE ACT OF 1934
|
For the quarterly period ended March 31, 2010
or
|
¨
|
TRANSITION REPORT PURSUANT TO SECTION 13 OR 15(d) OF THE
SECURITIES EXCHANGE ACT OF 1934
|
For the transition period from to .
COMMISSION FILE NUMBER 001-31924
NELNET, INC.
(Exact name of registrant as specified in its charter)
|
NEBRASKA
(State or other jurisdiction of incorporation or organization)
|
84-0748903
(I.R.S. Employer Identification No.)
|
|
121 SOUTH 13TH STREET, SUITE 201
LINCOLN, NEBRASKA
(Address of principal executive offices)
|
68508
(Zip Code)
|
(402) 458-2370
(Registrant’s telephone number, including area code)
Indicate by check mark whether the registrant (1) has filed all reports required to be filed by Section 13 or 15(d) of the Securities Exchange Act of 1934 during the preceding 12 months (or for such shorter period that the registrant was required to file such reports), and (2) has been subject to such filing requirements for the past 90 days. Yes [X] No [ ]
Indicate by check mark whether the registrant has submitted electronically and posted on its corporate Web site, if any, every Interactive Data File required to be submitted and posted pursuant to Rule 405 of Regulation S-T (§232.405 of this chapter) during the preceding 12 months (or for such shorter period that the registrant was required to submit and post such files). Yes [ ] No [ ]
Indicate by check mark whether the registrant is a large accelerated filer, an accelerated filer, a non-accelerated filer, or a smaller reporting company. See the definitions of “large accelerated filer,” “accelerated filer” and “smaller reporting company” in Rule 12b-2 of the Exchange Act.
Large accelerated filer [ ] Accelerated filer [X]
Non-accelerated filer [ ] Smaller reporting company [ ]
Indicate by check mark whether the registrant is a shell company (as defined in Rule 12b-2 of the Exchange Act).
Yes [ ] No [X]
As of April 30, 2010, there were 38,589,242 and 11,495,377 shares of Class A Common Stock and Class B Common Stock, par value $0.01 per share, outstanding, respectively (excluding 11,317,364 shares of Class A Common Stock held by wholly owned subsidiaries).
NELNET, INC.
FORM 10-Q
INDEX
March 31, 2010
|
PART I. FINANCIAL INFORMATION
|
||||||||||
|
Item 1.
|
Financial Statements
|
2
|
||||||||
|
Item 2.
|
Management’s Discussion and Analysis of Financial Condition and Results of Operations
|
25
|
||||||||
|
Item 3.
|
Quantitative and Qualitative Disclosures about Market Risk
|
62
|
||||||||
|
Item 4.
|
Controls and Procedures
|
67
|
||||||||
|
PART II. OTHER INFORMATION
|
||||||||||
|
Item 1.
|
Legal Proceedings
|
67
|
||||||||
|
Item 1A.
|
Risk Factors
|
69
|
||||||||
|
Item 2.
|
Unregistered Sales of Equity Securities and Use of Proceeds
|
69
|
||||||||
|
Item 6.
|
Exhibits
|
71
|
||||||||
|
Signatures
|
72
|
|||||||||
1
PART I. FINANCIAL INFORMATION
ITEM 1. FINANCIAL STATEMENTS
|
NELNET, INC. AND SUBSIDIARIES
|
||||||||
|
CONSOLIDATED BALANCE SHEETS
|
||||||||
|
(Dollars in thousands, except share data)
|
||||||||
|
As of
|
As of
|
|||||||
|
March 31,
2010
|
December 31,
2009
|
|||||||
|
(unaudited)
|
||||||||
|
Assets:
|
||||||||
|
Student loans receivable (net of allowance for loan losses of
|
||||||||
|
$49,400 and $50,887 respectively)
|
$ | 24,835,493 | 23,926,957 | |||||
|
Cash and cash equivalents:
|
||||||||
|
Cash and cash equivalents - not held at a related party
|
34,107 | 12,301 | ||||||
|
Cash and cash equivalents - held at a related party
|
295,972 | 325,880 | ||||||
|
Total cash and cash equivalents
|
330,079 | 338,181 | ||||||
|
Restricted cash and investments
|
727,858 | 625,492 | ||||||
|
Restricted cash - due to customers
|
39,199 | 91,741 | ||||||
|
Accrued interest receivable
|
336,242 | 329,313 | ||||||
|
Accounts receivable (net of allowance for doubtful accounts of
|
||||||||
|
$1,125 and $1,198, respectively)
|
60,704 | 42,043 | ||||||
|
Goodwill
|
143,717 | 143,717 | ||||||
|
Intangible assets, net
|
54,940 | 53,538 | ||||||
|
Property and equipment, net
|
27,649 | 26,606 | ||||||
|
Other assets
|
157,005 | 104,940 | ||||||
|
Fair value of derivative instruments
|
129,059 | 193,899 | ||||||
|
Total assets
|
$ | 26,841,945 | 25,876,427 | |||||
|
Liabilities:
|
||||||||
|
Bonds and notes payable
|
$ | 25,756,182 | 24,805,289 | |||||
|
Accrued interest payable
|
16,814 | 19,831 | ||||||
|
Other liabilities
|
184,463 | 172,514 | ||||||
|
Due to customers
|
39,199 | 91,741 | ||||||
|
Fair value of derivative instruments
|
6,074 | 2,489 | ||||||
|
Total liabilities
|
26,002,732 | 25,091,864 | ||||||
|
Shareholders' equity:
|
||||||||
|
Preferred stock, $0.01 par value. Authorized 50,000,000 shares;
|
||||||||
|
no shares issued or outstanding
|
— | — | ||||||
|
Common stock:
|
||||||||
|
Class A, $0.01 par value. Authorized 600,000,000 shares;
|
||||||||
|
issued and outstanding 38,587,293 shares as of March 31,
|
||||||||
|
2010 and 38,396,791 shares as of December 31, 2009
|
386 | 384 | ||||||
|
Class B, convertible, $0.01 par value. Authorized 60,000,000 shares;
|
||||||||
|
issued and outstanding 11,495,377 shares as of March 31,
|
||||||||
|
2010 and December 31, 2009
|
115 | 115 | ||||||
|
Additional paid-in capital
|
112,980 | 109,359 | ||||||
|
Retained earnings
|
726,982 | 676,154 | ||||||
|
Employee notes receivable
|
(1,250 | ) | (1,449 | ) | ||||
|
Total shareholders' equity
|
839,213 | 784,563 | ||||||
|
Commitments and contingencies
|
||||||||
|
Total liabilities and shareholders' equity
|
$ | 26,841,945 | 25,876,427 | |||||
See accompanying notes to consolidated financial statements.
2
|
NELNET, INC. AND SUBSIDIARIES
|
||||||||
|
CONSOLIDATED STATEMENTS OF INCOME
|
||||||||
|
(Dollars in thousands, except share data)
|
||||||||
|
(unaudited)
|
||||||||
|
Three months
|
||||||||
|
ended March 31,
|
||||||||
|
2010
|
2009
|
|||||||
|
Interest income:
|
||||||||
|
Loan interest
|
$ | 134,967 | 170,919 | |||||
|
Investment interest
|
1,001 | 4,091 | ||||||
|
Total interest income
|
135,968 | 175,010 | ||||||
|
Interest expense:
|
||||||||
|
Interest on bonds and notes payable
|
50,859 | 146,502 | ||||||
|
Net interest income
|
85,109 | 28,508 | ||||||
|
Less provision for loan losses
|
5,000 | 7,500 | ||||||
|
Net interest income after provision for loan losses
|
80,109 | 21,008 | ||||||
|
Other income (expense):
|
||||||||
|
Loan and guaranty servicing revenue
|
36,394 | 26,471 | ||||||
|
Tuition payment processing and campus commerce revenue
|
17,382 | 15,538 | ||||||
|
Enrollment services revenue
|
33,271 | 28,771 | ||||||
|
Software services revenue
|
4,344 | 5,705 | ||||||
|
Other income
|
7,260 | 8,787 | ||||||
|
Gain on sale of loans and debt repurchases, net
|
10,177 | 7,869 | ||||||
|
Derivative market value and foreign currency
|
||||||||
|
adjustments and derivative settlements, net
|
1,682 | 19,478 | ||||||
|
Total other income
|
110,510 | 112,619 | ||||||
|
Operating expenses:
|
||||||||
|
Salaries and benefits
|
41,641 | 38,226 | ||||||
|
Other operating expenses:
|
||||||||
|
Cost to provide enrollment services
|
22,025 | 17,793 | ||||||
|
Professional and other services
|
11,241 | 6,077 | ||||||
|
Depreciation and amortization
|
8,491 | 10,083 | ||||||
|
Occupancy and communications
|
3,588 | 5,354 | ||||||
|
Advertising and marketing
|
3,459 | 1,710 | ||||||
|
Postage and distribution
|
2,869 | 2,656 | ||||||
|
Trustee and other debt related fees
|
1,202 | 2,868 | ||||||
|
Other
|
9,188 | 7,804 | ||||||
|
Total other operating expenses
|
62,063 | 54,345 | ||||||
|
Total operating expenses
|
103,704 | 92,571 | ||||||
|
Income before income taxes
|
86,915 | 41,056 | ||||||
|
Income tax expense
|
(32,593 | ) | (15,601 | ) | ||||
|
Net income
|
$ | 54,322 | 25,455 | |||||
|
Earnings per common share:
|
||||||||
|
Net earnings - basic
|
$ | 1.09 | 0.51 | |||||
|
Net earnings - diluted
|
1.08 | 0.51 | ||||||
|
Dividends paid per common share
|
$ | 0.07 | — | |||||
|
Weighted average common shares outstanding:
|
||||||||
|
Basic
|
49,716,696 | 49,142,324 | ||||||
|
Diluted
|
49,912,589 | 49,334,981 | ||||||
See accompanying notes to consolidated financial statements.
3
|
NELNET, INC. AND SUBSIDIARIES
|
|||||||||||||||||||||||||||||||||||||||
|
CONSOLIDATED STATEMENTS OF SHAREHOLDERS' EQUITY AND COMPREHENSIVE INCOME
|
|||||||||||||||||||||||||||||||||||||||
|
(Dollars in thousands, except share data)
|
|||||||||||||||||||||||||||||||||||||||
|
(unaudited)
|
|||||||||||||||||||||||||||||||||||||||
|
Preferred
|
Class A
|
Class B
|
Additional
|
Employee
|
Total
|
||||||||||||||||||||||||||||||||||
|
stock
|
Common stock shares
|
Preferred
|
common
|
common
|
paid-in
|
Retained
|
notes
|
shareholders’
|
|||||||||||||||||||||||||||||||
|
shares
|
Class A
|
Class B
|
stock
|
stock
|
stock
|
capital
|
earnings
|
receivable
|
equity
|
||||||||||||||||||||||||||||||
|
Balance as of December 31, 2008
|
— | 37,794,067 | 11,495,377 | $ | — | 378 | 115 | 103,762 | 540,521 | (1,550 | ) | 643,226 | |||||||||||||||||||||||||||
|
Comprehensive income:
|
|||||||||||||||||||||||||||||||||||||||
|
Net income
|
— | — | — | — | — | — | — | 25,455 | — | 25,455 | |||||||||||||||||||||||||||||
|
Issuance of common stock, net of forfeitures
|
— | 486,583 | — | — | 5 | — | 2,345 | — | — | 2,350 | |||||||||||||||||||||||||||||
|
Compensation expense for stock based awards
|
— | — | — | — | — | — | 607 | — | — | 607 | |||||||||||||||||||||||||||||
|
Repurchase of common stock
|
— | (3,780 | ) | — | — | — | — | (36 | ) | — | — | (36 | ) | ||||||||||||||||||||||||||
|
Balance as of March 31, 2009
|
— | 38,276,870 | 11,495,377 | $ | — | 383 | 115 | 106,678 | 565,976 | (1,550 | ) | 671,602 | |||||||||||||||||||||||||||
|
Balance as of December 31, 2009
|
— | 38,396,791 | 11,495,377 | $ | — | 384 | 115 | 109,359 | 676,154 | (1,449 | ) | 784,563 | |||||||||||||||||||||||||||
|
Comprehensive income:
|
|||||||||||||||||||||||||||||||||||||||
|
Net income
|
— | — | — | — | — | — | — | 54,322 | — | 54,322 | |||||||||||||||||||||||||||||
|
Cash dividend on Class A and Class B
|
|||||||||||||||||||||||||||||||||||||||
|
common stock - $0.07 per share
|
— | — | — | — | — | — | — | (3,494 | ) | — | (3,494 | ) | |||||||||||||||||||||||||||
|
Issuance of common stock, net of forfeitures
|
— | 203,438 | — | — | 2 | — | 3,532 | — | — | 3,534 | |||||||||||||||||||||||||||||
|
Compensation expense for stock based awards
|
— | — | — | — | — | — | 325 | — | — | 325 | |||||||||||||||||||||||||||||
|
Repurchase of common stock
|
— | (12,936 | ) | — | — | — | — | (236 | ) | — | — | (236 | ) | ||||||||||||||||||||||||||
|
Reduction of employee notes receivable
|
— | — | — | — | — | — | — | — | 199 | 199 | |||||||||||||||||||||||||||||
|
Balance as of March 31, 2010
|
— | 38,587,293 | 11,495,377 | $ | — | 386 | 115 | 112,980 | 726,982 | (1,250 | ) | 839,213 | |||||||||||||||||||||||||||
See accompanying notes to consolidated financial statements.
4
|
NELNET, INC. AND SUBSIDIARIES
|
||||||||
|
CONSOLIDATED STATEMENTS OF CASH FLOWS
|
||||||||
|
(Dollars in thousands)
|
||||||||
|
(unaudited)
|
||||||||
|
Three months ended March 31,
|
||||||||
|
2010
|
2009
|
|||||||
|
Net income
|
$ | 54,322 | 25,455 | |||||
|
Adjustments to reconcile income to net cash provided by operating activities, net of business acquisition:
|
||||||||
|
Depreciation and amortization, including loan premiums and deferred origination costs
|
26,864 | 30,134 | ||||||
|
Provision for loan losses
|
5,000 | 7,500 | ||||||
|
Derivative market value adjustment
|
67,570 | 52,122 | ||||||
|
Foreign currency transaction adjustment
|
(71,675 | ) | (47,242 | ) | ||||
|
Proceeds to terminate and/or amend derivative instruments
|
855 | 50 | ||||||
|
Payments to terminate and/or amend derivative instruments
|
— | (11,760 | ) | |||||
|
Gain from repurchase of bonds and notes payable
|
(10,177 | ) | (8,075 | ) | ||||
|
Loss on sale of loans, net
|
— | 206 | ||||||
|
Deferred income tax expense
|
7,509 | 1,323 | ||||||
|
Non-cash compensation expense
|
523 | 723 | ||||||
|
Other non-cash items
|
254 | 301 | ||||||
|
(Increase) decrease in accrued interest receivable
|
(6,929 | ) | 83,563 | |||||
|
Increase in accounts receivable
|
(18,661 | ) | (487 | ) | ||||
|
(Increase) decrease in other assets
|
(51,071 | ) | 7,236 | |||||
|
Decrease in accrued interest payable
|
(3,017 | ) | (33,500 | ) | ||||
|
Increase in other liabilities
|
1,319 | 2,817 | ||||||
|
Net cash provided by operating activities
|
2,686 | 110,366 | ||||||
|
Cash flows from investing activities, net of business acquisition:
|
||||||||
|
Originations and purchases of student loans, including loan premiums and deferred origination costs
|
(1,027,883 | ) | (972,450 | ) | ||||
|
Purchases of student loans, including loan premiums, from a related party
|
(535,907 | ) | (13,803 | ) | ||||
|
Net proceeds from student loan repayments, claims, capitalized interest, participations, and other
|
615,431 | 734,445 | ||||||
|
Proceeds from sale of student loans
|
20,032 | 125 | ||||||
|
Proceeds from sale of student loans to a related party
|
— | 20,016 | ||||||
|
Purchases of property and equipment, net
|
(2,883 | ) | (62 | ) | ||||
|
Increase in restricted cash and investments, net
|
(102,366 | ) | (221,240 | ) | ||||
|
Business acquisition, net of cash acquired
|
(3,000 | ) | — | |||||
|
Net cash used in investing activities
|
(1,036,576 | ) | (452,969 | ) | ||||
|
Cash flows from financing activities:
|
||||||||
|
Payments on bonds and notes payable
|
(1,028,622 | ) | (642,115 | ) | ||||
|
Proceeds from issuance of bonds and notes payable
|
2,061,893 | 1,039,942 | ||||||
|
Payments of debt issuance costs
|
(4,069 | ) | (1,448 | ) | ||||
|
Dividends paid
|
(3,494 | ) | — | |||||
|
Proceeds from issuance of common stock
|
117 | 118 | ||||||
|
Repurchases of common stock
|
(236 | ) | (36 | ) | ||||
|
Payments received on employee stock notes receivable
|
199 | — | ||||||
|
Net cash provided by financing activities
|
1,025,788 | 396,461 | ||||||
|
Net (decrease) increase in cash and cash equivalents
|
(8,102 | ) | 53,858 | |||||
|
Cash and cash equivalents, beginning of period
|
338,181 | 189,847 | ||||||
|
Cash and cash equivalents, end of period
|
$ | 330,079 | 243,705 | |||||
|
Supplemental disclosures of cash flow information:
|
||||||||
|
Interest paid
|
$ | 49,777 | 177,210 | |||||
|
Income taxes paid, net of refunds
|
$ | 25,123 | 8,096 | |||||
See accompanying notes to consolidated financial statements.
5
NELNET, INC. AND SUBSIDIARIES
NOTES TO CONSOLIDATED FINANCIAL STATEMENTS
(Information as of March 31, 2010 and for the three months ended
March 31, 2010 and 2009 is unaudited)
(Dollars in thousands, except per share amounts, unless otherwise noted)
1. Basis of Financial Reporting
The accompanying unaudited consolidated financial statements of Nelnet, Inc. and subsidiaries (the “Company”) as of March 31, 2010 and for the three months ended March 31, 2010 and 2009 have been prepared on the same basis as the audited consolidated financial statements for the year ended December 31, 2009 and, in the opinion of the Company’s management, the unaudited consolidated financial statements reflect all adjustments, consisting of normal recurring adjustments, necessary for a fair presentation of results of operations for the interim periods presented. The preparation of financial statements in conformity with U.S. generally accepted accounting principles requires management to make estimates and assumptions that affect the amounts reported in the consolidated financial statements and accompanying notes. Actual results could differ from those estimates. Operating results for the three months ended March 31, 2010 are not necessarily indicative of the results for the year ending December 31, 2010. The unaudited consolidated financial statements should be read in conjunction with the Company’s Annual Report on Form 10-K for the year ended December 31, 2009. Management has evaluated subsequent events, and the impact on the reported results and disclosures through the date these financial statements were filed with the Securities and Exchange Commission (“SEC”).
Reclassifications
Certain amounts previously reported have been reclassified to conform to the current period presentation. The reclassifications were made to change the income statement presentation to provide the users of the financial statements additional information related to the operating results of the Company. These reclassifications include reclassifying the Company’s gains on debt repurchases to “gain on sale of loans and debt repurchases, net” which were previously included in “other income.” The reclassifications had no effect on consolidated net income or consolidated assets and liabilities.
2. Recent Developments
On March 30, 2010, President Obama signed into law the Health Care and Education Reconciliation Act of 2010 (the “Reconciliation Act of 2010”). Effective July 1, 2010, this law prohibits new loan originations under the Federal Family Education Loan Program (“FFELP”) and requires that all new federal loan originations be made through the Federal Direct Loan Program (the “Direct Loan Program”). If a first disbursement has been made on a FFELP loan prior to July 1, 2010, subsequent disbursements of that loan may still be made under the FFELP. The new law does not alter or affect the terms and conditions of existing FFELP loans.
As a result of the Reconciliation Act of 2010, the Company will no longer originate FFELP loans after 2010. During 2009, the Company recognized a gain of $36.6 million from selling $2.1 billion of 2008-2009 academic year loans to the Department of Education (the “Department”) under the Loan Purchase Commitment Program (the “Purchase Program”). The Company continues to use the Department’s Participation Program to fund loans originated for the 2009-2010 academic year. The Company has not yet determined if it will sell these loans to the Department under the Purchase Program. However, based on the number of 2009-2010 academic year loans held by the Company that are eligible for this program ($1.0 billion as of March 31, 2010), the Company estimates that it would recognize a gain of approximately $16 million to $18 million if it chose to sell these loans under this program. This amount does not include loans originated and/or acquired after March 31, 2010 which would increase the gain recognized by the Company. In addition, as a result of the Reconciliation Act of 2010, net interest income on the Company’s existing FFELP loan portfolio, as well as fee-based revenue from guarantee and third-party FFELP servicing and education loan software licensing and consulting fees will decline over time as the Company and its customers’ FFELP loan portfolios pay down.
In June 2009, the Company was one of four private sector companies awarded a student loan servicing contract by the Department. As of April 30, 2010, the Company was servicing $9.5 billion of FFELP loans now owned by the Department, and by August 2010 the Company expects to also begin servicing new loans originated under the Direct Loan Program. The Department has estimated $116 billion of new student loan originations will be funded through the Direct Loan Program for the 2010-2011 academic year. This volume will be allocated by the Department to the four servicers based on performance factors such as customer satisfaction levels and default rates. The Company believes revenue earned under the Department servicing contract and growth in non-FFELP fee-based operating segments in the future will partially offset the loss of future revenue due to the elimination of the FFELP.
Due to the legislative changes in the student loan industry, the Company also believes there will be opportunities to purchase FFELP loan portfolios and/or expand its current level of guarantee and third-party FFELP servicing volume on behalf of current FFELP participants looking to modify their involvement in FFELP and/or exit the market. For example, since April 1, 2010, the Company has purchased approximately $2 billion of FFELP student loans from various third-parties. These loans are not included in the March 31, 2010 balance sheet.
6
3. Student Loans Receivable and Allowance for Loan Losses
Student loans receivable consisted of the following:
|
As of
|
As of
|
|||||||
|
March 31,
2010
|
December 31,
2009
|
|||||||
|
Federally insured loans
|
$ | 24,412,262 | 23,472,553 | |||||
|
Non-federally insured loans
|
138,890 | 163,321 | ||||||
| 24,551,152 | 23,635,874 | |||||||
|
Unamortized loan premiums and deferred origination costs
|
333,741 | 341,970 | ||||||
|
Allowance for loan losses – federally insured loans
|
(30,744 | ) | (30,102 | ) | ||||
|
Allowance for loan losses – non-federally insured loans
|
(18,656 | ) | (20,785 | ) | ||||
| $ | 24,835,493 | 23,926,957 | ||||||
|
Allowance for federally insured loans as a percentage of such loans
|
0.13 | % | 0.13 | % | ||||
|
Allowance for non-federally insured allowance as a percentage of such loans
|
13.43 | % | 12.73 | % | ||||
The Company has provided for an allowance for loan losses related to its student loan portfolio. Activity in the allowance for loan losses for the three months ended March 31, 2010 and 2009 is shown below:
|
2010
|
2009
|
|||||||
|
Beginning balance
|
$ | 50,887 | 50,922 | |||||
|
Provision for loan losses
|
5,000 | 7,500 | ||||||
|
Loans charged off, net of recoveries
|
(5,197 | ) | (3,905 | ) | ||||
|
Purchase of loans
|
710 | — | ||||||
|
Sale of loans
|
(2,000 | ) | (6,020 | ) | ||||
|
Ending balance
|
$ | 49,400 | 48,497 | |||||
As of March 31, 2010, the Company has participated $115.5 million of non-federally insured loans to third parties, including $20.0 million during the first quarter of 2010. Loans participated under these agreements have been accounted for by the Company as loan sales. Accordingly, the participation interests sold are not included on the Company’s consolidated balance sheet. The loss on the sale of these loans was not material. Per the terms of the servicing agreements, the Company’s servicing operations are obligated to repurchase loans subject to the participation interests in the event such loans become 60 or 90 days delinquent. The activity in the accrual account during the three months ended March 31, 2010 and 2009 related to this repurchase obligation, which is included in “other liabilities” in the accompanying consolidated balance sheets, is detailed below.
|
2010
|
2009
|
|||||||
|
Beginning balance
|
$ | 10,600 | — | |||||
|
Transfer from allowance for loan losses
|
2,000 | 5,500 | ||||||
|
Ending balance
|
$ | 12,600 | 5,500 | |||||
Related Party Loan Activity
During 2008 and 2009, the Company sold $611.9 million of FFELP student loans (the “FFELP Loans”) to Union Bank & Trust Company (“Union Bank”), an entity under common control with the Company. These loans were sold pursuant to an affiliate transaction exemption granted by the Federal Reserve Board which allowed Union Bank to purchase FFELP loans from the Company. In connection with the exemption and the loan purchases by Union Bank, an Assurance Commitment Agreement (the “Commitment Agreement”) was also entered into, by and among, the Company, Union Bank, and Michael S. Dunlap, the Company’s Chairman, Chief Executive Officer, and a principal shareholder of the Company. Per the terms of the Commitment Agreement, the Company provided certain assurances to Union Bank designed to mitigate potential losses related to the FFELP Loans, including holding amounts in escrow equal to the unguaranteed portion and reimbursing Union Bank for losses, if any, related to the portfolio. As part of this agreement, the Company was also obligated to buy back loans once they were 30 days delinquent. During the first quarter 2010, the Company purchased $535.9 million (par value) of federally insured student loans from Union Bank, which represented all outstanding FFELP loans remaining under the provisions of the Commitment Agreement. As a result of this loan purchase, the Company no longer has a commitment to hold amounts in escrow, reimburse Union Bank for losses, and buy back delinquent loans related to this portfolio.
7
4. Bonds and Notes Payable
The Company has historically utilized operating cash flow, secured financing transactions (which include warehouse facilities, asset-backed securitizations, and the government’s Participation and Conduit Programs), operating lines of credit, and other borrowing arrangements to fund its Asset Generation and Management operations and student loan acquisitions. In addition, the Company has used operating cash flow, borrowings on its unsecured line of credit, and unsecured debt offerings to fund corporate activities, business acquisitions, and repurchases of common stock.
The following tables summarize the Company’s outstanding debt obligations by type of instrument:
|
As of March 31, 2010
|
|||||||||
|
Carrying
|
Interest rate
|
Final | |||||||
|
amount
|
range
|
maturity
|
|||||||
|
Variable-rate bonds and notes (a):
|
|||||||||
|
Bonds and notes based on indices
|
$ | 20,904,154 | 0.24% - 6.90 | % |
05/26/14 - 11/25/43
|
||||
|
Bonds and notes based on auction or remarketing
|
1,370,510 | 0.30% - 1.75 | % |
05/01/11 - 07/01/43
|
|||||
|
Total variable-rate bonds and notes
|
22,274,664 | ||||||||
|
Commercial paper - FFELP facility (b)
|
80,051 | 0.22% - 0.33 | % |
08/03/12
|
|||||
|
Unsecured debt - Senior Notes
|
66,716 | 5.125 | % |
06/01/10
|
|||||
|
Unsecured debt - Junior Subordinated Hybrid Securities
|
198,250 | 7.40 | % |
09/15/61
|
|||||
|
Unsecured line of credit
|
691,500 | 0.73 | % |
05/08/12
|
|||||
|
Department of Education Participation
|
1,028,402 | 0.71 | % |
09/30/10
|
|||||
|
Department of Education Conduit
|
1,384,819 | 0.23 | % |
05/08/14
|
|||||
|
Other borrowings
|
31,780 | 0.23% - 5.10 | % |
11/14/10 - 11/01/15
|
|||||
| $ | 25,756,182 | ||||||||
|
As of December 31, 2009
|
|||||||||
|
Carrying
|
Interest rate
|
Final | |||||||
|
amount
|
range
|
maturity
|
|||||||
|
Variable-rate bonds and notes (a):
|
|||||||||
|
Bonds and notes based on indices
|
$ | 20,187,356 | 0.26% - 6.90 | % |
05/26/14 - 04/25/42
|
||||
|
Bonds and notes based on auction or remarketing
|
1,726,960 | 0.21% - 3.73 | % |
05/01/11 - 07/01/43
|
|||||
|
Total variable-rate bonds and notes
|
21,914,316 | ||||||||
|
Commercial paper - FFELP facility (b)
|
305,710 | 0.21% - 0.32 | % |
08/03/12
|
|||||
|
Fixed-rate bonds and notes (a)
|
8,940 | 6.15% - 6.34 | % |
07/02/20 - 05/01/29
|
|||||
|
Unsecured debt - Senior Notes
|
66,716 | 5.125 | % |
06/01/10
|
|||||
|
Unsecured debt - Junior Subordinated Hybrid Securities
|
198,250 | 7.40 | % |
09/15/61
|
|||||
|
Unsecured line of credit
|
691,500 | 0.73 | % |
05/08/12
|
|||||
|
Department of Education Participation
|
463,912 | 0.79 | % |
09/30/10
|
|||||
|
Department of Education Conduit
|
1,125,929 | 0.27 | % |
05/08/14
|
|||||
|
Other borrowings
|
30,016 | 0.24% - 5.10 | % |
01/01/10 - 11/01/15
|
|||||
| $ | 24,805,289 | ||||||||
(a) Issued in asset-backed securitizations
(b) Loan warehouse facility
Secured Financing Transactions
The Company has historically relied upon secured financing vehicles as its most significant source of funding for student loans. The net cash flow the Company receives from the securitized student loans generally represents the excess amounts, if any, generated by the underlying student loans over the amounts required to be paid to the bondholders, after deducting servicing fees and any other expenses relating to the securitizations. The Company’s rights to cash flow from securitized student loans are subordinate to bondholder interests and may fail to generate any cash flow beyond what is due to bondholders.
8
The majority of the bonds and notes payable are primarily secured by the student loans receivable, related accrued interest, and by the amounts on deposit in the accounts established under the respective bond resolutions or financing agreements. Certain variable rate bonds and notes are secured by a letter of credit and reimbursement agreement issued by State Street.
Historically, the Company funded loan originations and acquisitions using loan warehouse facilities and asset-backed securitizations. Student loan warehousing allows the Company to buy and manage student loans prior to transferring them into more permanent financing arrangements. In August 2008, the Company began funding FFELP Stafford and PLUS student loan originations for the 2008-2009 and 2009-2010 academic years pursuant to the Department’s Participation Program and a participation agreement with Union Bank. In addition, in March 2009, the Company began funding loans under the Department’s Conduit Program.
Loan warehouse facility
On August 3, 2009, the Company entered into a FFELP warehouse facility (the “2009 FFELP Warehouse Facility”). The 2009 FFELP Warehouse Facility has a maximum financing amount of $500.0 million, with a revolving financing structure supported by 364-day liquidity provisions, which expire on August 2, 2010. The final maturity date of the facility is August 3, 2012. In the event the Company is unable to renew the liquidity provisions by August 2, 2010, the facility would become a term facility at a stepped-up cost, with no additional student loans being eligible for financing, and the Company would be required to refinance the existing loans in the facility by August 3, 2012.
The 2009 FFELP Warehouse Facility provides for formula based advance rates depending on FFELP loan type, up to a maximum of 92 percent to 98 percent of the principal and interest of loans financed. The advance rates for collateral may increase or decrease based on market conditions. The facility contains financial covenants relating to levels of the Company’s consolidated net worth, ratio of adjusted EBITDA to corporate debt interest, and unencumbered cash. Any violation of these covenants could result in a requirement for the immediate repayment of any outstanding borrowings under the facility. As of March 31, 2010, the Company was in compliance with all of these requirements. Unlike the Company’s prior FFELP warehouse facility, the 2009 FFELP Warehouse Facility does not require the Company to refinance or remove a percentage of the pledged student loan collateral on an annual basis. As of March 31, 2010, $80.1 million was outstanding under this facility and $419.9 million was available for future use.
On May 5, 2010, the Company amended the 2009 FFELP Warehouse Facility to increase the maximum financing amount by $500.0 million, to $1.0 billion in total. All loans funded with the additional $500.0 million of capacity must be eligible for the Department’s Straight-A Funding Conduit Program. The financing cost on the entire FFELP Warehouse Facility will increase by 300 basis points on any day after June 30, 2010 when the aggregate note balance is greater than $500.0 million. However, the Company intends to refinance loans in the warehouse facility that are eligible for the Department’s Conduit Program in advance of June 30, 2010 to avoid paying the increased cost.
Asset-backed securitizations
As part of the Company’s issuance of asset-backed securities in March 2008 and May 2008, due to credit market conditions when these notes were issued, the Company purchased the Class B subordinated notes of $36 million (par value) and $41 million (par value), respectively. These notes are not included on the Company’s consolidated balance sheet. If the credit market conditions continue to improve, the Company anticipates selling these notes to third parties. Upon a sale to third parties, the Company would obtain cash proceeds equal to the market value of the notes on the date of such sale. Upon sale, these notes would be shown as “bonds and notes payable” on the Company’s consolidated balance sheet. The Company believes the market value of such notes is currently less than par value. The difference between the par value and market value would be recognized by the Company as interest expense over the life of the bonds.
On February 17, 2010 and March 9, 2010, the Company completed asset-backed securities transactions of $523.3 million and $660.0 million, respectively. Notes issued in these transactions carry interest rates based on a spread to LIBOR. The Company used the proceeds from the sale of these notes to purchase principal and interest on student loans, which were previously financed in other asset-backed securitizations and the 2009 FFELP Warehouse Facility. In addition, the Company used the proceeds to purchase $535.9 million (par value) of federally insured student loans from Union Bank (see note 3).
Department of Education’s Loan Participation and Purchase Commitment Programs
In August 2008, the Department implemented the Purchase Program and the Participation Program pursuant to the Ensuring Continued Access to Student Loans Act of 2008 (“ECASLA”). Under the Department’s Purchase Program, the Department will purchase loans at a price equal to the sum of (i) par value, (ii) accrued interest, (iii) the one percent origination fee paid to the Department, and (iv) a fixed amount of $75 per loan. Under the Participation Program, the Department provides interim short term liquidity to FFELP lenders by purchasing participation interests in pools of FFELP loans. FFELP lenders are charged a rate of commercial paper plus 50 basis points on the principal amount of participation interests outstanding. Loans funded under the Participation Program for the 2009-2010 academic year must be either refinanced by the lender or sold to the Department pursuant to the Purchase Program on or prior to September 30, 2010. To be eligible for purchase or participation under the Department’s programs, loans are limited to FFELP Stafford or PLUS loans first disbursed on or after May 1, 2008 but no later than July 1, 2010, with eligible borrower benefits. As of March 31, 2010 and December 31, 2009, the Company had $1.0 billion and $0.5 billion, respectively, borrowed under the Participation Program. The Company plans to continue to use the Participation Program to fund 2009-2010 academic year loans.
9
Department of Education’s Conduit Program
In January 2009, the Department published summary terms for its program under which it will finance eligible FFELP Stafford and PLUS loans in a conduit vehicle established to provide funding for student lenders (the “Conduit Program”). Loans eligible for the Conduit Program had to be first disbursed on or after October 1, 2003, but not later than June 30, 2009, and fully disbursed before September 30, 2009, and meet certain other requirements. The Conduit Program was launched on May 11, 2009. Funding for the Conduit Program is provided by the capital markets at a cost based on market rates, with the Company being advanced 97 percent of the student loan face amount. Excess amounts needed to fund the remaining 3 percent of the student loan balances are contributed by the Company. The Conduit Program has a term of five years and expires on May 8, 2014. The Student Loan Short-Term Notes (“Student Loan Notes”) issued by the Conduit Program are supported by a combination of (i) notes backed by FFELP loans, (ii) a liquidity agreement with the Federal Financing Bank, and (iii) a put agreement provided by the Department. If the conduit does not have sufficient funds to pay all Student Loan Notes, then those Student Loan Notes will be repaid with funds from the Federal Financing Bank. The Federal Financing Bank will hold the notes for a short period of time and, if at the end of that time, the Student Loan Notes still cannot be paid off, the underlying FFELP loans that serve as collateral to the Conduit Program will be sold to the Department through a put agreement at a price of 97 percent of the face amount of the loans. As of March 31, 2010 and December 31, 2009, the Company had $1.4 billion and $1.1 billion, respectively, borrowed under the facility and $62.7 million and $66.8 million, respectively, advanced as equity support in the facility.
Union Bank Participation Agreement
The Company maintains an agreement with Union Bank, as trustee for various grantor trusts, under which Union Bank has agreed to purchase from the Company participation interests in student loans (the “FFELP Participation Agreement”). The Company has the option to purchase the participation interests from the grantor trusts at the end of a 364-day term upon termination of the participation certificate. As of March 31, 2010 and December 31, 2009, $725.9 million and $613.3 million, respectively, of loans were subject to outstanding participation interests held by Union Bank, as trustee, under this agreement. The agreement automatically renews annually and is terminable by either party upon five business days notice. This agreement provides beneficiaries of Union Bank’s grantor trusts with access to investments in interests in student loans, while providing liquidity to the Company on a short-term basis. The Company can participate loans to Union Bank to the extent of availability under the grantor trusts, up to $750 million or an amount in excess of $750 million if mutually agreed to by both parties. Loans participated under this agreement have been accounted for by the Company as loan sales. Accordingly, the participation interests sold are not included on the Company’s consolidated balance sheet.
Unsecured Line of Credit
The Company has a $750.0 million unsecured line of credit that terminates in May 2012. As of March 31, 2010 there was $691.5 million outstanding on this line. The weighted average interest rate on this line of credit was 0.725% as of March 31, 2010. Upon termination in 2012, there can be no assurance that the Company will be able to maintain this line of credit, find alternative funding, or increase the amount outstanding under the line, if necessary. The lending commitment under the Company’s unsecured line of credit is provided by a total of thirteen banks, with no individual bank representing more than 11% of the total lending commitment. The bank lending group includes Lehman Brothers Bank (“Lehman”), a subsidiary of Lehman Brothers Holdings Inc., which represents approximately 7% of the lending commitment under the line of credit. On September 15, 2008, Lehman Brothers Holdings Inc. filed a voluntary petition for relief under Chapter 11 of the United States Bankruptcy Code. The Company does not expect that Lehman will fund future borrowing requests. As of March 31, 2010, excluding Lehman’s lending commitment, the Company has $51.2 million available for future use under its unsecured line of credit.
The line of credit agreement contains certain financial covenants that, if not met, lead to an event of default under the agreement. The covenants include maintaining:
|
|
·
|
A minimum consolidated net worth
|
|
|
·
|
A minimum adjusted EBITDA to corporate debt interest (over the last four rolling quarters)
|
|
|
·
|
A limitation on subsidiary indebtedness
|
|
|
·
|
A limitation on the percentage of non-guaranteed loans in the Company’s portfolio
|
As of March 31, 2010, the Company was in compliance with all of these requirements. Many of these covenants are duplicated in the Company’s other lending facilities, including its FFELP warehouse facility.
The Company’s operating line of credit does not have any covenants related to unsecured debt ratings. However, changes in the Company’s ratings (as well as the amounts the Company borrows) have modest implications on the pricing level at which the Company obtains funding.
10
A default on the 2009 FFELP Warehouse Facility would result in an event of default on the Company’s unsecured line of credit that would result in the outstanding balance on the line of credit becoming immediately due and payable.
Debt Repurchases
The Company repurchased outstanding debt during the first quarter of 2010 and 2009 as summarized below. Gains recorded by the Company from the repurchase of debt are included in “gain on sale of loans and debt repurchases, net” on the Company’s consolidated statements of income.
|
Three months ended March 31, 2010
|
||||||||||||
|
Notional
amount
|
Purchase
price
|
Gain
|
||||||||||
|
Asset-backed securities
|
$ | 274,250 | 264,073 | 10,177 | ||||||||
|
Three months ended March 31, 2009
|
||||||||||||
|
Notional
amount
|
Purchase
price
|
Gain
|
||||||||||
|
5.125% Senior Notes due 2010
|
$ | 34,866 | 26,791 | 8,075 | ||||||||
As of March 31, 2010, the Company has repurchased $622.4 million of its own asset-backed securities (bonds and notes payable). For accounting purposes, these notes were effectively retired and are not included on the Company’s consolidated balance sheet. However, $155.7 million of these securities are legally outstanding at the trust level and the Company could sell these notes to third parties or redeem the notes at par as cash is generated by the trust estate. Upon a sale to third parties, the Company would obtain cash proceeds equal to the market value of the notes on the date of such sale. Upon sale, these notes would be shown as “bonds and notes payable” on the Company’s consolidated balance sheet.
5. Derivative Financial Instruments
The Company is exposed to certain risks relating to its ongoing business operations. The primary risks managed by using derivative instruments are interest rate risk and foreign currency exchange risk.
Interest Rate Risk
The Company’s primary market risk exposure arises from fluctuations in its borrowing and lending rates, the spread between which could impact the Company due to shifts in market interest rates. Because the Company generates a significant portion of its earnings from its student loan spread, the interest rate sensitivity of the balance sheet is a key profitability driver. The Company has adopted a policy of periodically reviewing the mismatch related to the interest rate characteristics of its assets and liabilities together with the Company's outlook as to current and future market conditions. Based on those factors, the Company uses derivative instruments as part of its overall risk management strategy.
Basis Swaps
The Company issues asset-backed securities, the vast majority being variable rate, to fund its student loan assets. The variable rate debt is generally indexed to three-month LIBOR, set by auction, or through a remarketing process. The income generated by the Company’s student loan assets is generally driven by short term indices (treasury bills, commercial paper, and certain fixed rates) that are different from those which affect the Company’s liabilities, which creates basis risk. Moreover, the Company also faces repricing risk due to the timing of the interest rate resets on its liabilities, which may occur as infrequently as every quarter, and the timing of the interest rate resets on its assets, which generally occurs daily. In a declining interest rate environment, this may cause the Company’s student loan spread to compress, while in a rising rate environment, it may cause the spread to increase. As of March 31, 2010, the Company had $23.4 billion and $1.0 billion of FFELP loans indexed to the three-month financial commercial paper rate and the three-month treasury bill rate, respectively, both of which reset daily, and $20.9 billion of debt indexed to three-month LIBOR, which resets quarterly.
Because of the different index types and different index reset frequencies, the Company is exposed to interest rate risk in the form of basis risk and repricing risk, which, as noted above, is the risk that the different indices may reset at different frequencies, or will not move in the same direction or with the same magnitude. While these indices are short term with rate movements that are highly correlated over a longer period of time, capital market dislocations or other factors not within the Company’s control can impact the level of correlation on these indices.
The Company has used derivative instruments to hedge both the basis and repricing risk on certain student loans in which the Company earns interest based on a treasury bill rate that resets daily and are funded with debt indexed to primarily three-month LIBOR. To hedge these loans, the Company has entered into basis swaps in which the Company receives three-month LIBOR set discretely in advance and pays a weekly treasury bill rate plus a spread as defined in the agreement (“T-Bill/LIBOR Basis Swaps”).
11
However, the Company does not generally hedge the basis risk on those assets indexed to the commercial paper rate that are funded with liabilities in which the Company pays primarily on the LIBOR index, since the derivatives needed to hedge this risk are generally illiquid or non-existent and the relationship between these indices has been highly correlated over a long period of time.
The Company has also used derivative instruments to hedge the repricing risk due to the timing of the interest rate resets on its assets and liabilities. The Company has entered into basis swaps in which the Company:
|
|
·
|
receives three-month LIBOR set discretely in advance and pays a daily weighted average three-month LIBOR less a spread as defined in the agreements (the “Average/Discrete Basis Swaps”)
|
|
|
·
|
receives three-month LIBOR and pays one-month LIBOR plus or minus a spread as defined in the agreements (the “1/3 Basis Swaps”)
|
The following table summarizes the Company’s basis swaps outstanding as of March 31, 2010 and December 31, 2009:
|
Notional amounts
|
||||||||
|
1/3 Basis
Swaps
|
T-Bill/LIBOR
Basis Swaps
|
|||||||
|
Maturity
|
||||||||
|
2010
|
$ | 1,000,000 | — | |||||
|
2011 (a)
|
— | 225,000 | ||||||
|
2013
|
500,000 | — | ||||||
|
2014
|
500,000 | — | ||||||
|
2018
|
1,300,000 | — | ||||||
|
2019
|
500,000 | — | ||||||
|
2021
|
250,000 | — | ||||||
|
2023
|
1,250,000 | — | ||||||
|
2024
|
250,000 | — | ||||||
|
2028
|
100,000 | — | ||||||
|
2039
|
150,000 | — | ||||||
| $ | 5,800,000 | 225,000 | ||||||
(a) These derivatives have forward effective start dates of October 2010 ($75 million), November 2010 ($75 million), and December 2010 ($75 million).
Interest rate swaps
FFELP loans originated prior to April 1, 2006 generally earn interest at the higher of a floating rate based on the Special Allowance Payment (or SAP) formula set by the Department and the borrower rate, which is fixed over a period of time. The SAP formula is based on an applicable index plus a fixed spread that is dependent upon when the loan was originated, the loan’s repayment status, and funding sources for the loan. The Company generally finances its student loan portfolio with variable rate debt. In low and/or declining interest rate environments, when the fixed borrower rate is higher than the rate produced by the SAP formula, the Company’s student loans earn at a fixed rate while the interest on the variable rate debt typically continues to decline. In these interest rate environments, the Company may earn additional spread income that it refers to as floor income.
Depending on the type of loan and when it was originated, the borrower rate is either fixed to term or is reset to an annual rate each July 1. As a result, for loans where the borrower rate is fixed to term, the Company may earn floor income for an extended period of time, which the Company refers to as fixed rate floor income, and for those loans where the borrower rate is reset annually on July 1, the Company may earn floor income to the next reset date, which the Company refers to as variable rate floor income. In accordance with legislation enacted in 2006, lenders are required to rebate fixed rate floor income and variable rate floor income to the Department for all FFELP loans first originated on or after April 1, 2006.
Absent the use of derivative instruments, a rise in interest rates may reduce the amount of floor income received and this may have an impact on earnings due to interest margin compression caused by increasing financing costs, until such time as the federally insured loans earn interest at a variable rate in accordance with their special allowance payment formulas. In higher interest rate environments, where the interest rate rises above the borrower rate and fixed rate loans effectively become variable rate loans, the impact of the rate fluctuations is reduced.
12
As of March 31, 2010 and December 31, 2009, the Company had $10.4 billion and $10.3 billion, respectively, of student loan assets that were earning fixed rate floor income. The following tables summarize the outstanding derivative investments used by the Company to hedge these loans.
| As of March 31, 2010 | ||||||||
|
Weighted
|
||||||||
|
average fixed
|
||||||||
|
Notional
|
rate paid by
|
|||||||
| Maturity | amount | the Company (a) | ||||||
|
2010
|
$ | 4,750,000 | 0.54 | % | ||||
|
2011
|
1,500,000 | 0.66 | ||||||
| $ | 6,250,000 | 0.57 | % | |||||
| As of December 31, 2009 | ||||||||
|
Weighted
|
||||||||
|
average fixed
|
||||||||
|
Notional
|
rate paid by
|
|||||||
| Maturity | amount | the Company (a) | ||||||
|
2010
|
$ | 4,750,000 | 0.54 | % | ||||
|
2011
|
150,000 | 1.03 | ||||||
| $ | 4,900,000 | 0.55 | % | |||||
(a) For all interest rate derivatives, the Company receives discrete three-month LIBOR.
Foreign Currency Exchange Risk
During 2006, the Company completed separate debt offerings of student loan asset-backed securities that included 420.5 million and 352.7 million Euro Notes with interest rates based on a spread to the EURIBOR index. As a result of this transaction, the Company is exposed to market risk related to fluctuations in foreign currency exchange rates between the U.S. dollar and Euro. The principal and accrued interest on these notes is re-measured at each reporting period and recorded on the Company’s balance sheet in U.S. dollars based on the foreign currency exchange rate on that date. Changes in the principal and accrued interest amounts as a result of foreign currency exchange rate fluctuations are included in the “derivative market value and foreign currency adjustments and derivative settlements, net” in the Company’s consolidated statements of income.
The Company entered into cross-currency interest rate swaps in connection with the issuance of the Euro Notes. Under the terms of these derivative instrument agreements, the Company receives from a counterparty a spread to the EURIBOR index based on notional amounts of €420.5 million and €352.7 million and pays a spread to the LIBOR index based on notional amounts of $500.0 million and $450.0 million, respectively. In addition, under the terms of these agreements, all principal payments on the Euro Notes will effectively be paid at the exchange rate in effect as of the issuance of the notes.
The following table shows the income statement impact as a result of the re-measurement of the Euro Notes and the change in the fair value of the related derivative instruments for the three months ended March 31, 2010 and 2009. These items are included in “Derivative market value and foreign currency adjustments and derivative settlements, net” on the accompanying consolidated statements of income.
|
2010
|
2009
|
|||||||
|
Re-measurement of Euro Notes
|
$ | 71,675 | 47,242 | |||||
|
Change in fair value of cross currency interest rate swaps
|
(59,075 | ) | (57,110 | ) | ||||
|
Total impact to statements of income - income (expense)
|
$ | 12,600 | (9,868 | ) | ||||
The re-measurement of the Euro-denominated bonds generally correlates with the change in fair value of the cross-currency interest rate swaps. However, the Company will experience unrealized gains or losses related to the cross-currency interest rate swaps if the two underlying indices (and related forward curve) do not move in parallel. Management intends to hold the cross-currency interest rate swaps through the maturity of the Euro-denominated bonds.
13
Accounting for Derivative Financial Instruments
The Company records derivative instruments on the consolidated balance sheet as either an asset or liability measured at its fair value. Management has structured the majority of the Company’s derivative transactions with the intent that each is economically effective; however, the Company’s derivative instruments do not qualify for hedge accounting. As a result, the change in fair value of the Company’s derivatives at each reporting date are included in “derivative market value and foreign currency adjustments and derivative settlements, net” in the Company’s consolidated statements of income. Changes or shifts in the forward yield curve and fluctuations in currency rates can significantly impact the valuation of the Company’s derivatives. Accordingly, changes or shifts to the forward yield curve and fluctuations in currency rates will impact the financial position and results of operations of the Company.
Any proceeds received or payments made by the Company to terminate a derivative in advance of its expiration date, or to amend the terms of an existing derivative, are included in “derivative market value and foreign currency adjustments and derivative settlements, net” on the consolidated statements of income and are accounted for as a change in fair value on such derivative.
The following table summarizes the fair value of the Company’s derivatives not designated as hedging:
|
Fair value of asset derivatives
|
Fair value of liability derivatives
|
|||||||||||||||
|
As of
March 31,
2010
|
As of
December 31, 2009
|
As of
March 31,
2010
|
As of
December 31, 2009
|
|||||||||||||
|
Interest rate swaps
|
$ | 66 | 4,497 | (5,337 | ) | (2,230 | ) | |||||||||
|
Average/discrete basis swaps
|
— | — | — | — | ||||||||||||
|
1/3 basis swaps
|
17,233 | 17,768 | (170 | ) | — | |||||||||||
|
T-Bill/LIBOR basis swaps
|
— | — | (55 | ) | (259 | ) | ||||||||||
|
Cross-currency interest rate swaps
|
110,742 | 169,817 | — | — | ||||||||||||
|
Other
|
1,018 | 1,817 | (512 | ) | — | |||||||||||
|
Total
|
$ | 129,059 | 193,899 | (6,074 | ) | (2,489 | ) | |||||||||
The following table summarizes the effect of derivative instruments in the consolidated statements of income for the three months ended March 31, 2010 and 2009. All gains and losses recognized in income related to the Company’s derivative activity are included in “Derivative market value and foreign currency adjustments and derivative settlements, net”, on the consolidated statements of income.
|
Amount of gain (or loss)
|
||||||||
|
Derivatives not designated as hedging
|
recognized in income on derivatives
|
|||||||
|
2010
|
2009
|
|||||||
|
Settlements:
|
||||||||
|
Interest rate swaps
|
$ | (3,856 | ) | — | ||||
|
Average/discrete basis swaps
|
— | 10,022 | ||||||
|
1/3 basis swaps
|
131 | 10,744 | ||||||
|
Cross-currency interest rate swaps
|
1,302 | 3,592 | ||||||
|
Total settlements - (expense) income
|
(2,423 | ) | 24,358 | |||||
|
Change in fair value:
|
||||||||
|
Interest rate swaps
|
(7,538 | ) | — | |||||
|
Average/discrete basis swaps
|
— | (286 | ) | |||||
|
1/3 basis swaps
|
(546 | ) | 5,274 | |||||
|
T-Bill/LIBOR basis swaps
|
45 | — | ||||||
|
Cross-currency interest rate swaps
|
(59,075 | ) | (57,110 | ) | ||||
|
Other
|
(456 | ) | — | |||||
|
Total change in fair value - (expense) income
|
(67,570 | ) | (52,122 | ) | ||||
|
Re-measurement of Euro Notes (foreign currency
|
||||||||
|
transaction adjustment) - income
|
71,675 | 47,242 | ||||||
|
Derivative market value and forgeign currency adjustments
|
||||||||
|
and derivative settlements - income
|
$ | 1,682 | 19,478 | |||||
Derivative Instruments - Credit and Market Risk
By using derivative instruments, the Company is exposed to credit and market risk.
When the fair value of a derivative instrument is negative, the Company would owe the counterparty if the derivative was settled and, therefore, has no immediate credit risk. Additionally, if the negative fair value of derivatives with a counterparty exceeds a specified threshold, the Company may have to make a collateral deposit with the counterparty. The threshold at which the Company posts collateral may depend on the Company’s unsecured credit rating. If interest and foreign currency exchange rates move materially, the Company could be required to deposit a significant amount of collateral with its derivative instrument counterparties. The collateral deposits, if significant, could negatively impact the Company’s liquidity and capital resources. As of March 31, 2010, the Company had $3.4 million posted as collateral to derivative counterparties.
14
When the fair value of a derivative contract is positive, this generally indicates that the counterparty would owe the Company if the derivative was settled. If the counterparty fails to perform, credit risk with such counterparty is equal to the extent of the fair value gain in the derivative less any collateral held by the Company. As of March 31, 2010, the Company held $199.1 million of collateral from the counterparty on the cross-currency interest rate swaps.
The Company attempts to manage market and credit risks associated with interest and foreign currency exchange rates by establishing and monitoring limits as to the types and degree of risk that may be undertaken, and by entering into transactions with high-quality counterparties that are reviewed periodically by the Company’s risk committee. The Company also has a policy of requiring that all derivative contracts be governed by an International Swaps and Derivatives Association, Inc. Master Agreement.
6. Segment Reporting
The Company has four operating segments as follows: Student Loan and Guaranty Servicing, Tuition Payment Processing and Campus Commerce, Enrollment Services, and Asset Generation and Management. The Company’s operating segments are defined by the products and services they offer or the types of customers they serve, and they reflect the manner in which financial information is currently evaluated by management. In the first quarter of 2010, internal reporting to executive management (the “chief operating decision maker”) changed to reflect operational changes made within the organization. The operations of various segments changed in 2010 in order for the Company to capitalize on external servicing opportunities while obtaining maximum operating leverage. The change in operating results reviewed by management changed the operating segments historically reported by the Company. The operational and internal reporting changes included moving the majority of software and information technology products and services and related expenses to the Student Loan and Guaranty Servicing operating segment. The internal and external revenue and expenses related to these products and services were historically included within Corporate Activities and the former Software and Technical Services operating segment. The Software and Technical Services operating segment no longer meets the definition of an operating segment as described in the Accounting Standards Codification (“ASC”) Topic 280, Segment Reporting. Prior period segment operating results were restated to conform to the current period presentation.
The accounting policies of the Company’s operating segments are the same as those described in the summary of significant accounting policies. Intersegment revenues are charged by a segment to another segment that provides the product or service. Intersegment revenues and expenses are included within each segment consistent with the income statement presentation provided to management. Changes in management structure or allocation methodologies and procedures may result in changes in reported segment financial information. In 2010, the Company began allocating certain corporate overhead expenses to the individual operating segments. These expenses include certain corporate activities related to executive management, human resources, accounting and finance, legal, and marketing. These costs are allocated to each operating segment based on estimated use of such activities and services. These allocations were not made in 2009, and thus are not reflected in the 2009 segment operating results.
The management reporting process measures the performance of the Company’s operating segments based on the management structure of the Company as well as the methodology used by management to evaluate performance and allocate resources. Management, including the Company’s chief operating decision maker, evaluates the performance of the Company’s operating segments based on their profitability. As discussed further below, management measures the profitability of the Company’s operating segments based on “base net income.” Accordingly, information regarding the Company’s operating segments is provided based on “base net income.” The Company’s “base net income” is not a defined term within generally accepted accounting principles (“GAAP”) and may not be comparable to similarly titled measures reported by other companies. Unlike financial accounting, there is no comprehensive, authoritative guidance for management reporting.
Historically, the Company generated the majority of its revenue from net interest income earned in its Asset Generation and Management operating segment. The Company made several acquisitions that have expanded the Company’s products and services and have diversified its revenue – primarily from fee-based businesses. The Company currently offers a broad range of pre-college, in-college, and post-college products and services to students, families, schools, and financial institutions. These products and services help students and families plan and pay for their education and students plan their careers. The Company’s products and services are designed to simplify the education planning and financing process and are focused on providing value to students, families, and schools throughout the education life cycle. The Company continues to diversify its sources of revenue, including those generated from businesses that are not dependent upon government programs, thereby reducing legislative and political risk.
15
Fee-Based Operating Segments
Student Loan and Guaranty Servicing
The following are the primary product and service offerings the Company offers as part of its Student Loan and Guaranty Servicing segment:
|
|
·
|
Origination and servicing of FFELP loans
|
|
|
·
|
Origination and servicing of non-federally insured student loans
|
|
|
·
|
Servicing federally-owned student loans for the Department of Education
|
|
|
·
|
Servicing and support outsourcing for guaranty agencies
|
|
|
·
|
Student loan servicing software and other information technology products and services
|
The Student Loan and Guaranty Servicing operating segment provides for the servicing of the Company’s student loan portfolios and the portfolios of third parties. The loan servicing activities include loan origination activities, application processing, borrower updates, payment processing, due diligence procedures, and claim processing. These activities are performed internally for the Company’s portfolio in addition to generating fee revenue when performed for third-party clients.
In June 2009, the Department of Education named the Company as one of four private sector companies awarded a servicing contract to service all federally-owned student loans, including FFELP loans purchased by the Department pursuant to ECASLA. No later than August 2010, the Company expects to also begin servicing new loans originated under the Direct Loan Program. The contract spans five years with one, five-year renewal option.
This operating segment also provides servicing activities for guarantee agencies. These activities include providing software and data center services, borrower and loan updates, default aversion tracking services, claim processing services, and post-default collection services.
This operating segment also develops student loan servicing software, which is used internally by the Company and also licensed to third-party student loan holders and servicers. In addition, this operating segment provides information technology products and services, with core areas of business in educational loan software solutions, business intelligence, technical consulting services, and Enterprise Content Management solutions.
Tuition Payment Processing and Campus Commerce
The Tuition Payment Processing and Campus Commerce operating segment provides products and services to help institutions and education-seeking families manage the payment of education costs during the pre-college and college stages of the education life cycle. The Company provides actively managed tuition payment solutions, online payment processing, detailed information reporting, financial needs analysis, and data integration services to K-12 and higher educational institutions, families, and students. In addition, the Company provides customer-focused electronic transactions, information sharing, and account and bill presentment to colleges and universities.
Enrollment Services
The Enrollment Services operating segment offers products and services that are focused on helping colleges recruit and retain students (interactive and list marketing products and services) and helping students plan and prepare for life after high school (publishing and editing services and resource centers). Interactive marketing products and services include vendor lead management services, admissions lead generation, pay per click marketing management, email marketing, and admissions consulting. Publishing and editing services include test preparation study guides and essay and resume editing services. Resource centers and list marketing products and services include online courses and related services and list marketing services.
Asset Generation and Management Operating Segment
The Asset Generation and Management operating segment includes the acquisition, management, and ownership of the Company’s student loan assets. Revenues are primarily generated from the Company’s earnings from the spread, referred to as the Company’s student loan spread, between the yield received on the student loan portfolio and the costs associated with originating, acquiring, and financing its student loan portfolio. The Company generates student loan assets through direct origination or through acquisitions. The student loan assets are held in a series of education lending subsidiaries designed specifically for this purpose. In addition to the student loan portfolio, all costs and activity associated with the generation of assets, funding of those assets, and maintenance of the debt transactions are included in this segment.
Segment Operating Results – “Base Net Income”
The tables below include the operating results of each of the Company’s operating segments. Management, including the chief operating decision maker, evaluates the Company on certain non-GAAP performance measures that the Company refers to as “base net income” for each operating segment. While “base net income” is not a substitute for reported results under GAAP, the Company relies on “base net income” to manage each operating segment because it believes this measure provides additional information regarding the operational and performance indicators that are most closely assessed by management.
16
“Base net income” is the primary financial performance measure used by management to develop the Company’s financial plans, track results, and establish corporate performance targets and incentive compensation. Management believes this information provides additional insight into the financial performance of the core business activities of the Company’s operating segments. Accordingly, the tables presented below reflect “base net income,” which is the operating measure reviewed and utilized by management to manage the business. Reconciliation of the segment totals to the Company’s operating results in accordance with GAAP are also included in the tables below.
Certain amounts previously reported have been reclassified to conform to the current period presentation. The reclassifications were made to change the income statement presentation to provide the users of the financial statements additional information related to the operating results of the Company. These reclassifications include reclassifying the Company’s gains on debt repurchases to “gain on sale of loans and debt repurchases, net” which were previously included in “other income.” In addition, as discussed previously, in the first quarter of 2010, a change in operating results reviewed by management changed the operating segments historically reported by the Company. Prior period segment operating results were restated to conform to the current period presentation.
Segment Results and Reconciliations to GAAP
|
Three months ended March 31, 2010
|
||||||||||||||||||||||||||||||||||||
|
Fee-Based
|
||||||||||||||||||||||||||||||||||||
|
Student
|
Tuition
|
Elimin- |
"Base net
|
|||||||||||||||||||||||||||||||||
|
Loan
|
Payment
|
Asset
|
Corporate
|
ations |
income"
|
|||||||||||||||||||||||||||||||
|
and
|
Processing
|
Total
|
Generation
|
Activity
|
and
|
Adjustments
|
GAAP
|
|||||||||||||||||||||||||||||
|
Guaranty
|
and Campus
|
Enrollment
|
Fee-
|
and
|
and
|
Reclass-
|
to GAAP
|
Results of
|
||||||||||||||||||||||||||||
|
Servicing
|
Commerce
|
Services
|
Based
|
Management
|
Overhead
|
ifications
|
Results
|
Operations
|
||||||||||||||||||||||||||||
|
Total interest income
|
$ | 13 | 8 | — | 21 | 135,262 | 1,598 | (913 | ) | — | 135,968 | |||||||||||||||||||||||||
|
Interest expense
|
— | — | — | — | 45,656 | 6,116 | (913 | ) | — | 50,859 | ||||||||||||||||||||||||||
|
Net interest income (loss)
|
13 | 8 | — | 21 | 89,606 | (4,518 | ) | — | — | 85,109 | ||||||||||||||||||||||||||
|
Less provision for loan losses
|
— | — | — | — | 5,000 | — | — | — | 5,000 | |||||||||||||||||||||||||||
|
Net interest income (loss) after provision for loan losses
|
13 | 8 | — | 21 | 84,606 | (4,518 | ) | — | — | 80,109 | ||||||||||||||||||||||||||
|
Other income (expense):
|
||||||||||||||||||||||||||||||||||||
|
Loan and guaranty servicing revenue
|
36,648 | — | — | 36,648 | — | (254 | ) | — | — | 36,394 | ||||||||||||||||||||||||||
|
Tuition payment processing and campus commerce revenue
|
— | 17,382 | — | 17,382 | — | — | — | — | 17,382 | |||||||||||||||||||||||||||
|
Enrollment services revenue
|
— | — | 33,271 | 33,271 | — | — | — | — | 33,271 | |||||||||||||||||||||||||||
|
Software services revenue
|
4,344 | — | — | 4,344 | — | — | — | — | 4,344 | |||||||||||||||||||||||||||
|
Other income
|
224 | — | — | 224 | 4,768 | 2,268 | — | — | 7,260 | |||||||||||||||||||||||||||
|
Gain on sale of loans and debt repurchases, net
|
— | — | — | — | 10,177 | — | — | — | 10,177 | |||||||||||||||||||||||||||
|
Intersegment revenue
|
22,719 | 65 | 17 | 22,801 | — | 4,081 | (26,882 | ) | — | — | ||||||||||||||||||||||||||
|
Derivative market value and foreign currency adjustments
|
— | — | — | — | — | — | — | 4,105 | 4,105 | |||||||||||||||||||||||||||
|
Derivative settlements, net
|
— | — | — | — | (2,423 | ) | — | — | — | (2,423 | ) | |||||||||||||||||||||||||
|
Total other income (expense)
|
63,935 | 17,447 | 33,288 | 114,670 | 12,522 | 6,095 | (26,882 | ) | 4,105 | 110,510 | ||||||||||||||||||||||||||
|
Operating expenses:
|
||||||||||||||||||||||||||||||||||||
|
Salaries and benefits
|
23,582 | 6,618 | 6,071 | 36,271 | 1,358 | 4,117 | (105 | ) | — | 41,641 | ||||||||||||||||||||||||||
|
Restructure expense- severance and contract terminination costs
|
1,205 | — | — | 1,205 | — | (8 | ) | (1,197 | ) | — | — | |||||||||||||||||||||||||
|
Cost to provide enrollment services
|
— | — | 22,025 | 22,025 | — | — | — | — | 22,025 | |||||||||||||||||||||||||||
|
Other expenses
|
15,519 | 2,441 | 5,062 | 23,022 | 4,221 | 6,079 | 200 | 6,516 | 40,038 | |||||||||||||||||||||||||||
|
Intersegment expenses
|
2,982 | 839 | 450 | 4,271 | 20,825 | 684 | (25,780 | ) | — | — | ||||||||||||||||||||||||||
|
Total operating expenses
|
43,288 | 9,898 | 33,608 | 86,794 | 26,404 | 10,872 | (26,882 | ) | 6,516 | 103,704 | ||||||||||||||||||||||||||
| Income (loss) before income taxes and corporate overhead | ||||||||||||||||||||||||||||||||||||
|
allocation
|
20,660 | 7,557 | (320 | ) | 27,897 | 70,724 | (9,295 | ) | — | (2,411 | ) | 86,915 | ||||||||||||||||||||||||
|
Corporate overhead allocation
|
(1,189 | ) | (396 | ) | (396 | ) | (1,981 | ) | (1,981 | ) | 3,962 | — | — | — | ||||||||||||||||||||||
|
Income (loss) before income taxes
|
19,471 | 7,161 | (716 | ) | 25,916 | 68,743 | (5,333 | ) | — | (2,411 | ) | 86,915 | ||||||||||||||||||||||||
|
Income tax (expense) benefit (a)
|
(7,400 | ) | (2,722 | ) | 273 | (9,849 | ) | (26,123 | ) | 2,463 | — | 916 | (32,593 | ) | ||||||||||||||||||||||
|
Net income (loss)
|
$ | 12,071 | 4,439 | (443 | ) | 16,067 | 42,620 | (2,870 | ) | — | (1,495 | ) | 54,322 | |||||||||||||||||||||||
(a) Income taxes are applied based on 38% of income (loss) before taxes for the individual operating segments.
17
|
Three months ended March 31, 2009
|
||||||||||||||||||||||||||||||||||||
|
Fee-Based
|
||||||||||||||||||||||||||||||||||||
|
Student
|
Tuition
|
Elimin- |
"Base net
|
|||||||||||||||||||||||||||||||||
|
Loan
|
Payment
|
Asset
|
Corporate
|
ations |
income"
|
|||||||||||||||||||||||||||||||
|
and
|
Processing
|
Total
|
Generation
|
Activity
|
and
|
Adjustments
|
GAAP
|
|||||||||||||||||||||||||||||
|
Guaranty
|
and Campus
|
Enrollment
|
Fee-
|
and
|
and
|
Reclass-
|
to GAAP
|
Results of
|
||||||||||||||||||||||||||||
|
Servicing
|
Commerce
|
Services
|
Based
|
Management
|
Overhead
|
ifications
|
Results
|
Operations
|
||||||||||||||||||||||||||||
|
Total interest income
|
$ | 66 | 30 | — | 96 | 172,587 | 1,427 | (560 | ) | 1,460 | 175,010 | |||||||||||||||||||||||||
|
Interest expense
|
— | — | — | — | 138,594 | 8,468 | (560 | ) | — | 146,502 | ||||||||||||||||||||||||||
|
Net interest income (loss)
|
66 | 30 | — | 96 | 33,993 | (7,041 | ) | — | 1,460 | 28,508 | ||||||||||||||||||||||||||
|
Less provision for loan losses
|
— | — | — | — | 7,500 | — | — | — | 7,500 | |||||||||||||||||||||||||||
|
Net interest income (loss) after provision for loan losses
|
66 | 30 | — | 96 | 26,493 | (7,041 | ) | — | 1,460 | 21,008 | ||||||||||||||||||||||||||
|
Other income (expense):
|
||||||||||||||||||||||||||||||||||||
|
Loan and guaranty servicing revenue
|
26,853 | — | — | 26,853 | — | (382 | ) | — | — | 26,471 | ||||||||||||||||||||||||||
|
Tuition payment processing and campus commerce revenue
|
— | 15,538 | — | 15,538 | — | — | — | — | 15,538 | |||||||||||||||||||||||||||
|
Enrollment services revenue
|
— | — | 28,771 | 28,771 | — | — | — | — | 28,771 | |||||||||||||||||||||||||||
|
Software services revenue
|
5,705 | — | — | 5,705 | — | — | — | — | 5,705 | |||||||||||||||||||||||||||
|
Other income
|
112 | — | — | 112 | 4,651 | 4,024 | — | — | 8,787 | |||||||||||||||||||||||||||
|
Gain (loss) on sale of loans and debt repurchases, net
|
— | — | — | — | (206 | ) | 8,075 | — | — | 7,869 | ||||||||||||||||||||||||||
|
Intersegment revenue
|
21,958 | 57 | — | 22,015 | — | 4,000 | (26,015 | ) | — | — | ||||||||||||||||||||||||||
|
Derivative market value and foreign currency adjustments
|
— | — | — | — | — | — | — | (4,880 | ) | (4,880 | ) | |||||||||||||||||||||||||
|
Derivative settlements, net
|
— | — | — | — | 24,358 | — | — | — | 24,358 | |||||||||||||||||||||||||||
|
Total other income (expense)
|
54,628 | 15,595 | 28,771 | 98,994 | 28,803 | 15,717 | (26,015 | ) | (4,880 | ) | 112,619 | |||||||||||||||||||||||||
|
Operating expenses:
|
||||||||||||||||||||||||||||||||||||
|
Salaries and benefits
|
22,354 | 6,545 | 6,095 | 34,994 | 1,775 | 3,802 | (2,504 | ) | 159 | 38,226 | ||||||||||||||||||||||||||
|
Restructure expense - severance and contract terminination costs
|
— | — | — | — | — | — | — | — | — | |||||||||||||||||||||||||||
|
Cost to provide enrollment services
|
— | — | 17,793 | 17,793 | — | — | — | — | 17,793 | |||||||||||||||||||||||||||
|
Other expenses
|
12,874 | 2,408 | 3,295 | 18,577 | 4,959 | 6,862 | — | 6,154 | 36,552 | |||||||||||||||||||||||||||
|
Intersegment expenses
|
3,007 | 623 | 546 | 4,176 | 17,876 | 1,459 | (23,511 | ) | — | — | ||||||||||||||||||||||||||
|
Total operating expenses
|
38,235 | 9,576 | 27,729 | 75,540 | 24,610 | 12,123 | (26,015 | ) | 6,313 | 92,571 | ||||||||||||||||||||||||||
|
Income (loss) before income taxes
|
16,459 | 6,049 | 1,042 | 23,550 | 30,686 | (3,447 | ) | — | (9,733 | ) | 41,056 | |||||||||||||||||||||||||
|
Income tax (expense) benefit (a)
|
(6,255 | ) | (2,298 | ) | (396 | ) | (8,949 | ) | (11,661 | ) | 1,310 | — | 3,699 | (15,601 | ) | |||||||||||||||||||||
|
Net income (loss)
|
$ | 10,204 | 3,751 | 646 | 14,601 | 19,025 | (2,137 | ) | — | (6,034 | ) | 25,455 | ||||||||||||||||||||||||
(a) Income taxes are applied based on 38% of income (loss) before income taxes for the individual operating segments.
Corporate Activity and Overhead in the previous tables primarily includes the following items:
|
|
·
|
Income earned on certain investment activities
|
|
|
·
|
Interest expense incurred on unsecured debt transactions
|
|
|
·
|
Other products and service offerings that are not considered operating segments
|
|
|
·
|
Corporate Activities also includes certain corporate activities and overhead functions related to executive management, human resources, accounting and finance, legal, and marketing. Beginning in 2010, these costs were allocated to each operating segment based on estimated use of such activities and services.
|
18
The adjustments required to reconcile from the Company’s “base net income” measure to its GAAP results of operations relate to differing treatments for derivatives, foreign currency transaction adjustments, and certain other items that management does not consider in evaluating the Company’s operating results. The following tables reflect adjustments associated with these areas by operating segment and Corporate Activity and Overhead:
|
Student
|
Tuition
|
|||||||||||||||||||||||
|
Loan
|
Payment
|
Asset
|
Corporate
|
|||||||||||||||||||||
|
and
|
Processing
|
Generation
|
Activity
|
|||||||||||||||||||||
|
Guaranty
|
and Campus
|
Enrollment
|
and
|
and
|
||||||||||||||||||||
|
Servicing
|
Commerce
|
Services
|
Management
|
Overhead
|
Total
|
|||||||||||||||||||
|
Three months ended March 31, 2010
|
||||||||||||||||||||||||
|
Derivative market value and foreign currency adjustments (a)
|
$ | — | — | — | (4,561 | ) | 456 | (4,105 | ) | |||||||||||||||
|
Amortization of intangible assets (b)
|
2,236 | 1,925 | 2,355 | — | — | 6,516 | ||||||||||||||||||
|
Compensation related to business combinations (c)
|
— | — | — | — | — | — | ||||||||||||||||||
|
Variable-rate floor income, net of settlements on derivatives (d)
|
— | — | — | — | — | — | ||||||||||||||||||
|
Net tax effect (e)
|
(850 | ) | (732 | ) | (895 | ) | 1,733 | (172 | ) | (916 | ) | |||||||||||||
|
Total adjustments to GAAP
|
$ | 1,386 | 1,193 | 1,460 | (2,828 | ) | 284 | 1,495 | ||||||||||||||||
|
Three months ended March 31, 2009
|
||||||||||||||||||||||||
|
Derivative market value and foreign currency adjustments (a)
|
$ | — | — | — | 4,880 | — | 4,880 | |||||||||||||||||
|
Amortization of intangible assets (b)
|
1,225 | 1,887 | 3,042 | — | — | 6,154 | ||||||||||||||||||
|
Compensation related to business combinations (c)
|
— | — | — | — | 159 | 159 | ||||||||||||||||||
|
Variable-rate floor income, net of settlements on derivatives (d)
|
— | — | — | (1,460 | ) | — | (1,460 | ) | ||||||||||||||||
|
Net tax effect (e)
|
(465 | ) | (717 | ) | (1,157 | ) | (1,300 | ) | (60 | ) | (3,699 | ) | ||||||||||||
|
Total adjustments to GAAP
|
$ | 760 | 1,170 | 1,885 | 2,120 | 99 | 6,034 | |||||||||||||||||
|
|
(a)
|
Derivative market value and foreign currency adjustments: “Base net income” excludes the periodic unrealized gains and losses that are caused by the change in fair value on derivatives used in the Company’s risk management strategy in which the Company does not qualify for “hedge treatment” under GAAP. Included in “base net income” are the economic effects of the Company’s derivative instruments, which includes any cash paid or received being recognized as an expense or revenue upon actual derivative settlements. “Base net income” also excludes the foreign currency transaction gains or losses caused by the re-measurement of the Company’s Euro-denominated bonds to U.S. dollars.
|
|
|
(b)
|
Amortization of intangible assets: “Base net income” excludes the amortization of acquired intangibles.
|
|
|
(c)
|
Compensation related to business combinations: The Company has structured certain business combinations in which the consideration paid has been dependent on the sellers’ continued employment with the Company. As such, the value of the consideration paid is recognized as compensation expense by the Company over the term of the applicable employment agreement. The compensation expense related to existing agreements was fully expensed in 2009. “Base net income” excludes this expense.
|
|
|
(d)
|
Variable-rate floor income: Loans that reset annually on July 1 can generate excess spread income compared with the rate based on the special allowance payment formula in declining interest rate environments. The Company refers to this additional income as variable-rate floor income. The Company excludes variable-rate floor income, net of settlements paid on derivatives used to hedge student loan assets earning variable-rate floor income, from its “base net income” since the timing and amount of variable-rate floor income (if any) is uncertain, it has been eliminated by legislation for all loans originated on and after April 1, 2006, and it is in excess of expected spreads. In addition, because variable-rate floor income is subject to the underlying rate for the subject loans being reset annually on July 1, it is a factor beyond the Company’s control which can affect the period-to-period comparability of results of operations.
|
|
|
(e)
|
Income taxes are applied based on 38% for the individual operating segments.
|
19
7. Intangible Assets and Goodwill
Intangible assets consist of the following:
|
Weighted
|
||||||||||||
|
average
|
||||||||||||
|
remaining
|
||||||||||||
|
useful life as of
|
As of
|
As of
|
||||||||||
|
March 31,
|
March 31,
|
December 31,
|
||||||||||
|
2010 (months)
|
2010
|
2009
|
||||||||||
|
Amortizable intangible assets:
|
||||||||||||
|
Customer relationships (net of accumulated amortization of $42,051
|
||||||||||||
|
and $38,875, respectively)
|
74 | $ | 37,725 | 40,991 | ||||||||
|
Computer software (net of accumulated amortization of $9,170
|
||||||||||||
|
and $8,915, respectively)
|
34 | 7,478 | 87 | |||||||||
|
Trade names (net of accumulated amortization of $9,858 and
|
||||||||||||
|
$9,101, respectively)
|
32 | 6,695 | 7,452 | |||||||||
|
Covenants not to compete (net of accumulated amortization of
|
||||||||||||
|
$21,707 and $20,372, respectively)
|
6 | 1,894 | 3,229 | |||||||||
|
Database and content (net of accumulated amortization of $8,332
|
||||||||||||
|
and $7,701, respectively)
|
6 | 1,148 | 1,779 | |||||||||
|
Total - amortizable intangible assets
|
60 | $ | 54,940 | 53,538 | ||||||||
The Company recorded amortization expense on its intangible assets of $6.5 million and $6.2 million for the three months ended March 31, 2010 and 2009, respectively. The Company will continue to amortize intangible assets over their remaining useful lives. As of March 31, 2010, the Company estimates it will record amortization expense as follows:
|
2010 (April 1 - December 31)
|
$ | 16,228 | ||
|
2011
|
15,784 | |||
|
2012
|
15,269 | |||
|
2013
|
2,024 | |||
|
2014
|
1,298 | |||
|
2015 and thereafter
|
4,337 | |||
| $ | 54,940 |
During the first quarter of 2010, the Company purchased certain assets of a software company that constituted a business combination. The initial consideration paid by the Company was $3.0 million in cash. In addition to the initial purchase price, additional payments are to be made by the Company based on certain operating results as defined in the purchase agreement. These contingent payments are payable in three annual installments beginning in March 2011 and in total are estimated by the Company to be $5.0 million. The contingent payments will be remeasured to fair value each reporting date until the contingency is resolved with all changes in fair value being recognized in earnings. Substantially all of the $8.0 million purchase price was allocated to a computer software intangible asset that will be amortized over three years.
The following table summarizes the Company’s allocation of goodwill by operating segment as of March 31, 2010 and December 31, 2009:
|
Student Loan and Guaranty Servicing
|
$ | 8,596 | ||
|
Tuition Payment Processing and Campus Commerce
|
58,086 | |||
|
Enrollment Services
|
35,152 | |||
|
Asset Generation and Management
|
41,883 | |||
| $ | 143,717 |
The Company performs goodwill impairment testing annually (as of November 30) or more frequently if an event occurs or circumstances change such that there is a potential that the fair value of a reporting unit or reporting units may be below their respective carrying values. When testing goodwill for impairment, the Company performs a two-step impairment test as prescribed in ASC Topic 350, Intangibles – Goodwill and Other. In the first step, the Company compares the fair value of each reporting unit to its carrying value. If the fair value of the reporting unit exceeds the carrying value of the net assets assigned to that unit, goodwill is considered not impaired and the Company is not required to perform further testing. If the carrying value of the net assets assigned to the reporting unit exceeds the fair value of the reporting unit, then the Company must perform the second step of the impairment test in order to determine the implied fair value of the reporting unit’s goodwill. If the carrying value of a reporting unit’s goodwill exceeds its implied fair value, the Company would record an impairment loss equal to the difference.
20
On March 30, 2010, President Obama signed into law the Reconciliation Act of 2010. Effective July 1, 2010, this law prohibits new loan originations under the FFELP and requires that all new federal loan originations be made through the Direct Loan Program. This new legislation does not alter or affect the terms and conditions of existing FFELP loans.
The provisions of the Reconciliation Act of 2010 were consistent with President Obama’s February 2009 budget request to Congress and the student loan legislation passed in September 2009 by the House of Representatives (the “SAFRA Legislation”), both of which called for the elimination of the FFEL Program and a requirement that all new federal loans be made through the Direct Loan Program.
During the Company’s goodwill impairment testing completed as of November 30, 2009, the Company performed the first step of the goodwill impairment test to determine whether the fair value of each of its reporting units exceeded the carrying value of net assets assigned to that unit. The fair value of each reporting unit was determined by weighing different valuation approaches, as applicable, with the primary approach being the income approach.
The income approach measures the value of each reporting unit based on the present value of the reporting unit’s future economic benefit determined based on discounted cash flows derived from the Company’s projections for each reporting unit. These projections reflect the estimated future strategic operating and financial performance of each respective reporting unit, including assumptions related to applicable cost savings and planned dispositions or wind down activities. In conjunction with the Company’s November 30, 2009 impairment assessment, cash flow projections were made for each reporting unit as if the Administration’s budget proposal and SAFRA Legislation were enacted. Accordingly, cash flow projections for each reporting unit assumed no new FFELP loan originations beyond June 30, 2010. As such, management has determined that passage of the Reconciliation Act of 2010 does not decrease the fair value of any reporting unit from the fair value assessment as of November 30, 2009 and management did not perform an impairment assessment during the first quarter of 2010 due to the passage of the Reconciliation Act of 2010.
However, as a result of the Reconciliation Act of 2010, the Company will no longer originate FFELP loans after 2010 and net interest income on the Company’s existing FFELP loan portfolio will decline over time as the Company’s portfolio pays down. As a result, as this revenue stream winds down, goodwill impairment will be triggered for the Asset Generation and Management reporting unit due to the passage of time and depletion of projected cash flows stemming from its FFELP student loan portfolio. Other than the Asset Generation and Management reporting unit, management believes the elimination of FFELP will not have an adverse impact on the fair value of the Company’s other reporting units.
8. Fair Value of Financial Instruments
The following tables present the Company’s financial assets and liabilities that are measured at fair value on a recurring basis. All financial assets and liabilities that are measured at fair value are categorized as Level 1 or Level 2 based on the hierarchy as discussed in note 3, summary of significant accounting policies and procedures, in the Company’s Annual Report on Form 10-K for the year ended December 31, 2009.
| As of March 31, 2010 | ||||||||||||
|
Level 1
|
Level 2
|
Total
|
||||||||||
|
Assets:
|
||||||||||||
|
Investment securities (a)
|
$ | 57,104 | — | 57,104 | ||||||||
|
Fair value of derivative instruments (b)
|
— | 129,059 | 129,059 | |||||||||
|
Total assets
|
$ | 57,104 | 129,509 | 186,163 | ||||||||
|
Liabilities:
|
||||||||||||
|
Fair value of derivative instruments (b)
|
$ | — | 6,074 | 6,074 | ||||||||
|
Total liabilities
|
$ | — | 6,074 | 6,074 | ||||||||
|
As of December 31, 2009
|
||||||||||||
|
Level 1
|
Level 2
|
Total
|
||||||||||
|
Assets:
|
||||||||||||
|
Investment securities (a)
|
$ | 4,278 | — | 4,278 | ||||||||
|
Fair value of derivative instruments (b)
|
— | 193,899 | 193,899 | |||||||||
|
Total assets
|
$ | 4,278 | 193,899 | 198,177 | ||||||||
|
Liabilities:
|
||||||||||||
|
Fair value of derivative instruments (b)
|
$ | — | 2,489 | 2,489 | ||||||||
|
Total liabilities
|
$ | — | 2,489 | 2,489 | ||||||||
|
|
(a)
|
Investment securities are included in “other assets” in the accompanying consolidated balance sheets and include investments recorded at fair value on a recurring basis. Level 1 investments are measured based upon quoted prices and include investments traded on an active exchange, such as the New York Stock Exchange, and U.S. Treasury Securities.
|
|
|
(b)
|
All derivatives are accounted for at fair value on a recurring basis. The fair values of derivative financial instruments are determined by derivative pricing models using the stated terms of the contracts and observable yield curves, forward foreign currency exchange rates, and volatilities from active markets. It is the Company’s policy to compare its derivative fair values to those received by its counterparties in order to validate the model’s outputs. Fair value of derivative instruments is comprised of market value less accrued interest and excludes collateral.
|
21
The following table summarizes the fair values of all of the Company’s financial instruments on the consolidated balance sheet:
|
As of March 31, 2010
|
As of December 31, 2009
|
|||||||||||||||
|
Fair value
|
Carrying value
|
Fair value
|
Carrying value
|
|||||||||||||
|
Financial assets:
|
||||||||||||||||
|
Student loans receivable
|
$ | 25,609,615 | 24,835,493 | 24,387,267 | 23,926,957 | |||||||||||
|
Cash and cash equivalents
|
330,079 | 330,079 | 338,181 | 338,181 | ||||||||||||
|
Restricted cash
|
357,587 | 357,587 | 318,530 | 318,530 | ||||||||||||
|
Restricted cash – due to customers
|
39,199 | 39,199 | 91,741 | 91,741 | ||||||||||||
|
Restricted investments
|
370,271 | 370,271 | 306,962 | 306,962 | ||||||||||||
|
Accrued interest receivable
|
336,242 | 336,242 | 329,313 | 329,313 | ||||||||||||
|
Investment securities
|
57,104 | 57,104 | 4,278 | 4,278 | ||||||||||||
|
Derivative instruments
|
129,059 | 129,059 | 193,899 | 193,899 | ||||||||||||
|
Financial liabilities:
|
||||||||||||||||
|
Bonds and notes payable
|
25,721,761 | 25,756,182 | 24,741,306 | 24,805,289 | ||||||||||||
|
Accrued interest payable
|
16,814 | 16,814 | 19,831 | 19,831 | ||||||||||||
|
Due to customers
|
39,199 | 39,199 | 91,741 | 91,741 | ||||||||||||
|
Derivative instruments
|
6,074 | 6,074 | 2,489 | 2,489 | ||||||||||||
The methodologies for estimating the fair value of financial assets and liabilities that are measured at fair value on a recurring basis are discussed above. The remaining financial assets and liabilities were estimated using the following methods and assumptions:
Student Loans Receivable
The fair value of student loans receivable is estimated at amounts recently paid and/or received or amounts anticipated to be received by the Company to acquire and/or sell similar loans in the market and/or the characteristics of the portfolio and are considered to be fair value exit prices.
Cash and Cash Equivalents, Restricted Cash, Restricted Cash – Due to Customers, Restricted Investments, Accrued Interest Receivable/Payable and Due to Customers
The carrying amount approximates fair value due to the variable rate of interest and/or the short maturities of these instruments.
Bonds and Notes Payable
The fair value of the bonds and notes payable is based on market prices for securities that possess similar credit risk and interest rate risk.
9. Shareholders’ Equity
Issuance of Class A Common Stock
In March 2010 and 2009, the Company’s 2009 and 2008 annual performance-based incentives awarded to management were paid in approximately 173,000 and 455,000 fully vested and unrestricted shares of Class A common stock, respectively, issued pursuant to the Company’s Restricted Stock Plan. It is the Company’s current intention to pay future annual performance-based incentives to management, if any, in common stock issued pursuant to the Restricted Stock Plan.
Dividends
In the first quarter of 2007, the Company began paying dividends of $0.07 per share on the Company's Class A and Class B Common Stock which were paid quarterly through the first quarter of 2008. On May 21, 2008, the Company announced that it was temporarily suspending its quarterly dividend program. On November 5, 2009, the Company's Board of Directors voted to reinstate the quarterly dividend program effective for the fourth quarter 2009. Accordingly, a dividend of $0.07 per share on the Company's Class A and Class B Common Stock was paid on March 15, 2010 to all holders of record as of March 1, 2010. In addition, a dividend of $0.07 per share on the Company’s Class A and Class B Common Stock will be paid on June 15, 2010 to all holders of record as of June 1, 2010.
22
10. Earnings per Common Share
Presented below is a summary of the components used to calculate basic and diluted earnings per share. The Company applies the two-class method of computing earnings per share which requires the calculation of separate earnings per share amounts for unvested share-based awards and for common stock. Unvested share-based awards that contain nonforfeitable rights to dividends are considered securities which participate in undistributed earnings with common stock. Earnings per share attributable to common stock is shown in the table below.
A reconciliation of weighted average shares outstanding for the three months ended March 31, 2010 and 2009 follows:
|
2010
|
2009
|
|||||||
|
Net income attributable to Nelnet, Inc.
|
$ | 54,322 | 25,455 | |||||
|
Less earnings allocated to unvested restricted stockholders
|
339 | 157 | ||||||
|
Net income available to common stockholders
|
$ | 53,983 | 25,298 | |||||
|
Weighted average common shares outstanding - basic
|
49,716,696 | 49,142,324 | ||||||
|
Dilutive effect of the assumed vesting of restricted stock awards
|
195,893 | 192,657 | ||||||
|
Weighted average common shares outstanding - diluted
|
49,912,589 | 49,334,981 | ||||||
|
Basic earnings per common share
|
$ | 1.09 | 0.51 | |||||
|
Diluted earnings per common share
|
$ | 1.08 | 0.51 | |||||
11. Restructuring Charge
On May 8, 2009, as a result of continued challenges in the economy and the student loan industry, the Company adopted a plan to further streamline its operations by continuing to reduce its geographic footprint and consolidate servicing operations and related support services.
Management has developed a restructuring plan that will result in lower costs and provide enhanced synergies through cross training, career development, and simplified communications. The Company will simplify its operating structure to leverage its larger facilities and technology by closing certain offices and downsizing its presence in certain geographic locations. Approximately 300 associates will be impacted by this restructuring plan. However, the majority of these functions will be relocated to the Company’s Lincoln headquarters and Denver offices. Implementation of the plan began immediately and is expected to be substantially complete during the second quarter of 2010.
The Company estimates that the charge to earnings associated with this restructuring plan will be fully recognized by June 30, 2010 and will total approximately $13.2 million, consisting of approximately $6.0 million in severance costs and approximately $7.2 million in contract terminations, of which $7.3 million and $1.2 million has been recognized in 2009 and the first quarter of 2010, respectively, and $4.7 million is expected to be recognized in the second quarter of 2010. The majority of the restructuring charge and related activity has and will impact the Company’s Student Loan and Guaranty Servicing operating segment. Selected information relating to the restructuring charge follows:
|
Employee
|
||||||||||||||
|
termination
|
Lease
|
|||||||||||||
|
benefits
|
terminations
|
Total
|
||||||||||||
|
Restructuring costs recognized in 2009
|
$ | 4,247 |
(a)
|
3,031 |
(b)
|
7,278 | ||||||||
|
Cash payments
|
(898 | ) | (605 | ) | (1,503 | ) | ||||||||
|
Restructuring accrual as of December 31, 2009
|
3,349 | 2,426 | 5,775 | |||||||||||
|
Restructuring costs recognized during the
|
||||||||||||||
|
three month period ended March 31, 2010
|
997 |
(a)
|
200 |
(b)
|
1,197 | |||||||||
|
Cash payments
|
(264 | ) | (406 | ) | (670 | ) | ||||||||
|
Restructuring accrual as of March 31, 2010
|
$ | 4,082 | 2,220 | 6,302 | ||||||||||
|
|
(a)
|
Employee termination benefits are included in "salaries and benefits" in the consolidated statements of income.
|
|
|
(b)
|
Lease termination costs are included in "occupancy and communications" in the consolidated statements of income.
|
23
12. Legal Proceedings and Regulatory Reviews
General
The Company is subject to various claims, lawsuits, and proceedings that arise in the normal course of business. These matters principally consist of claims by student loan borrowers disputing the manner in which their student loans have been processed and disputes with other business entities. In addition, from time to time the Company receives information and document requests from state or federal regulators concerning its business practices. The Company cooperates with these inquiries and responds to the requests. While the Company cannot predict the ultimate outcome of any inquiry or investigation, the Company believes its activities have materially complied with applicable law, including the Higher Education Act, the rules and regulations adopted by the Department of Education thereunder, and the Department’s guidance regarding those rules and regulations. Other than the items specifically discussed below, on the basis of present information, anticipated insurance coverage, and advice received from counsel, it is the opinion of the Company’s management that the disposition or ultimate determination of these claims, lawsuits, and proceedings will not have a material adverse effect on the Company’s business, financial position, or results of operations.
Regulatory Reviews
The Department of Education periodically reviews participants in the FFELP for compliance with program provisions. On June 28, 2007, the Department notified the Company that it would be conducting a review of the Company’s practices in connection with the prohibited inducement provisions of the Higher Education Act and the associated regulations that allow borrowers to have a choice of lenders. The Company understands that the Department selected several schools and lenders for review. The Company responded to the Department’s requests for information and documentation and cooperated with their review. On May 1, 2009, the Company received the Department’s preliminary program review report, which covered the Department’s review of the period from October 1, 2002 to September 30, 2007. The preliminary program review report contained certain initial findings of noncompliance with the Higher Education Act’s prohibited inducement provisions and required that the Company provide an explanation for the basis of the arrangements noted in the preliminary program review report. The Company has responded and provided an explanation of the arrangements noted in the Department of Education’s initial findings, and the Department of Education is expected to issue a final program review determination letter and advise the Company whether it intends to take any additional action. To the extent any findings are contained in a final letter, the additional action may include the assessment of fines or penalties, or the limitation, suspension, and termination of the Company’s participation in the FFELP.
While the Company is unable to predict the ultimate outcome of these reviews, the Company believes its practices complied with applicable law, including the provisions of the Higher Education Act, the rules and regulations adopted by the Department of Education thereunder, and the Department’s guidance regarding those rules and regulations.
United States ex rel Oberg v. Nelnet, Inc. et al
On September 28, 2009, the Company was served with a Summons and First Amended Complaint naming the Company as one of ten defendants in a “qui tam” action brought by Jon H. Oberg on behalf of the United States of America. Qui tam actions assert claims by an individual on behalf of the federal government, and are filed under seal until the government decides, if at all, to intervene in the case.
An original complaint in the action was filed under seal in the U.S. District Court for the Eastern District of Virginia on September 21, 2007, and was unsealed on August 26, 2009 upon the government’s filing of a Notice of Election to Decline Intervention in the matter. The First Amended Complaint (the “Oberg Complaint”) was filed on August 24, 2009 and alleges the defendant student loan lenders submitted false claims for payment to the Department of Education in order to obtain special allowance payments on certain student loans at a rate of 9.5%, which the Oberg Complaint alleges is in excess of amounts permitted by law. The Oberg Complaint seeks the imposition of civil penalties and treble the amount of damages sustained by the government in connection with the alleged overbilling by the defendants for special allowance payments. The Oberg Complaint alleges that approximately $407 million in unlawful 9.5% special allowance payment claims were submitted by the Company to the Department of Education.
The 9.5% special allowance payments received by the Company were disclosed by the Company on multiple occasions beginning in 2003. In January 2007 the Company entered into a settlement agreement with the Department of Education to resolve an audit report by the Office of Inspector General of the Department of Education with respect to the Company’s student loan portfolio receiving special allowance payments at a minimum 9.5% interest rate (the “Settlement Agreement”). Under the terms of the Settlement Agreement, the Company was permitted to retain the 9.5% special allowance payments that it received from the Department prior to July 1, 2006 and the Settlement Agreement included an acknowledgment by the Department of Education that the dispute with the Company in connection with billings for 9.5% interest was in good faith. In addition, the Settlement Agreement eliminated all 9.5% special allowance payments with respect to the Company’s portfolios of student loans for periods on and after July 1, 2006.
The Company filed a Motion to Dismiss the Oberg Complaint, and on December 1, 2009, the Court denied the Motion. The Company believes it has strong defenses to the Oberg Complaint and is vigorously contesting the matter. The case is currently in the discovery stage and the Company intends to move for summary judgment. Due to the uncertainty, costs, and risks inherent in the litigation process, the Company may explore various resolutions of the matter, but cannot predict the ultimate outcome or resolution, which could have a material adverse effect on the Company’s results of operations and financial condition.
24
United States ex rel Vigil v. Nelnet, Inc. et al
On November 4, 2009, the Company was served with a Summons and Third Amended Complaint naming the Company as one of three defendants in an unrelated qui tam action brought by Rudy Vigil (the “Vigil Complaint”). This matter was filed under seal in the U.S. District Court for the District of Nebraska on July 11, 2007 and was unsealed on October 15, 2009 following the government’s notice that it declined to intervene in the matter. The Vigil Complaint, filed by a former employee of the Company, appeared to allege that the Company engaged in false advertising and offered prohibited inducements to student loan borrowers in order to increase the Company’s loan holdings, and subsequently submitted false claims to the Department of Education in order to obtain special allowance payments and default claim payments on such loans.
The Company filed a Motion to Dismiss the Vigil Complaint, and on April 1, 2010 the Court granted the Motion, dismissing the Vigil Complaint with prejudice. On April 7, 2010, Mr. Vigil filed a Notice of Appeal of the Court’s Order of Dismissal.
ITEM 2. MANAGEMENT’S DISCUSSION AND ANALYSIS OF FINANCIAL CONDITION AND RESULTS OF OPERATIONS
(Management’s Discussion and Analysis of Financial Condition and Results of Operations is for the three months ended March 31, 2010 and 2009. All dollars are in thousands, except per share amounts, unless otherwise noted.)
The following discussion and analysis provides information that the Company’s management believes is relevant to an assessment and understanding of the consolidated results of operations and financial condition of the Company. The discussion should be read in conjunction with the Company’s consolidated financial statements included in the Company’s Annual Report on Form 10-K for the year ended December 31, 2009.
Reclassifications
Certain amounts previously reported have been reclassified to conform to the current period presentation. The reclassifications were made to change the income statement presentation to provide the users of the financial statements additional information related to the operating results of the Company. These reclassifications include reclassifying the Company’s gain on debt repurchases to “gain on sale of loans and debt repurchases, net,” which were previously recorded in “other income.” In addition, in the first quarter of 2010, a change in operating results reviewed by management changed the operating segments historically reported by the Company. Prior period segment operating results were restated to conform to the current period presentation. See Item 2 – “Operating Segments” for additional information on the change in operating segment reporting. The reclassifications had no effect on consolidated net income or consolidated assets and liabilities.
Forward-looking and cautionary statements
This report contains forward-looking statements and information that are based on management’s current expectations as of the date of this document. Statements that are not historical facts, including statements about the Company’s expectations and statements that assume or are dependent upon future events, are forward-looking statements. These forward-looking statements are subject to risks, uncertainties, assumptions, and other factors that may cause the actual results to be materially different from those reflected in such forward-looking statements. These factors include, among others, the risks and uncertainties set forth in “Risk Factors” and elsewhere in this Quarterly Report on Form 10-Q and the Company’s Annual Report on Form 10-K for the year ended December 31, 2009; increases in financing costs; limits on liquidity; any adverse outcomes in any significant litigation to which the Company is a party; and changes in the terms of student loans and the educational credit marketplace arising from the implementation of, or changes in, applicable laws and regulations, which may reduce the average term, special allowance payments, and yields on student loans under the FFEL Program of the Department. The Company could also be affected by changes in the demand for educational financing or in financing preferences of lenders, educational institutions, students, and their families; the Company’s ability to maintain credit facilities or obtain new facilities; the ability of lenders under the Company’s credit facilities to fulfill their lending commitments under these facilities; changes to the terms and conditions of the liquidity programs offered by the Department; changes in the general interest rate environment and in the securitization markets for education loans, which may increase the costs or limit the availability of financings necessary to initiate, purchase, or carry education loans; losses from loan defaults; changes in prepayment rates, guaranty rates, loan floor rates, and credit spreads; uncertainties inherent in forecasting future cash flows from student loan assets and related asset-backed securitizations; the uncertain nature of estimated expenses that may be incurred and cost savings that may result from restructuring plans; incorrect estimates or assumptions by management in connection with the preparation of the consolidated financial statements; and changes in general economic conditions. Additionally, financial projections may not prove to be accurate and may vary materially. The reader should not place undue reliance on forward-looking statements, which speak only as of the date of this Quarterly Report on Form 10-Q. The Company is not obligated to publicly release any revisions to forward-looking statements to reflect events after the date of this Quarterly Report on Form 10-Q or unforeseen events. Although the Company may from time to time voluntarily update its prior forward-looking statements, it disclaims any commitment to do so except as required by securities laws.
25
OVERVIEW
The Company is a transaction processing and finance company focused primarily on providing quality education related products and services to students, families, schools, and financial institutions nationwide. The Company earns its revenue from fee-based processing businesses, including its loan servicing, payment processing, and interactive marketing businesses, and the net interest income on its student loan portfolio.
The Company has certain business objectives in place that include:
|
·
|
Grow and diversify revenue from fee based businesses
|
|
·
|
Manage operating costs
|
|
·
|
Maximize the value of existing portfolio
|
|
·
|
Use liquidity to capitalize on market opportunities
|
Achieving these business objectives has impacted and will continue to impact the financial condition and operating results of the Company during 2010. Each of these items are discussed below.
Recent Developments
On March 30, 2010, President Obama signed into law the Reconciliation Act of 2010. Effective July 1, 2010, this law prohibits new loan originations under the FELP Program and requires that all new federal loan originations be made through the Direct Loan Program. If a first disbursement has been made on a FFELP loan prior to July 1, 2010, subsequent disbursements of that loan may still be made under the FFELP. The new law does not alter or affect the terms and conditions of existing FFELP loans.
As a result of the Reconciliation Act of 2010, the Company will no longer originate FFELP loans after 2010. During 2009, the Company recognized a gain of $36.6 million from selling $2.1 billion of 2008-2009 academic year loans to the Department under the Purchase Program. The Company continues to use the Department’s Participation Program to fund loans originated for the 2009-2010 academic year. The Company has not yet determined if it will sell these loans to the Department under the Purchase Program. However, based on the number of 2009-2010 academic year loans held by the Company that are eligible for this program ($1.0 billion as of March 31, 2010), the Company estimates that it would recognize a gain of approximately $16 million to $18 million if it chose to sell these loans under this program. This amount does not include loans originated and/or acquired after March 31, 2010 which would increase the gain recognized by the Company. In addition, as a result of the Reconciliation Act of 2010, net interest income on the Company’s existing FFELP loan portfolio, as well as fee-based revenue from guarantee and third-party FFELP servicing and education loan software licensing and consulting fees will decline over time as the Company and its customers’ FFELP loan portfolios pay down.
In June 2009, the Company was one of four private sector companies awarded a student loan servicing contract by the Department. As of April 30, 2010, the Company was servicing $9.5 billion of FFELP loans now owned by the Department, and by August 2010 the Company expects to also begin servicing new loans originated under the Direct Loan Program. The Department has estimated $116 billion of new student loan originations will be funded through the Direct Loan Program for the 2010-2011 academic year. This volume will be allocated by the Department to the four servicers based on performance factors such as customer satisfaction levels and default rates. The Company believes revenue earned under the Department servicing contract and growth in non-FFELP fee-based operating segments in the future will partially offset the loss of future revenue due to the elimination of the FFELP.
Due to the legislative changes in the student loan industry, the Company also believes there will be opportunities to purchase FFELP loan portfolios and/or expand its current level of guarantee and third-party FFELP servicing volume on behalf of current FFELP participants looking to modify their involvement in FFELP and/or exit the market. For example, since April 1, 2010, the Company has purchased approximately $2 billion of FFELP student loans from various third-parties. These loans are not included in the March 31, 2010 balance sheet.
26
Grow and Diversify Revenue from Fee-Based Businesses
In recent years, the Company has expanded products and services generated from businesses that are not dependent upon the FFEL Program, thereby reducing legislative and political risk related to the education lending industry. Revenues from these businesses are primarily generated from products and services offered in the Company’s Tuition Payment Processing and Campus Commerce and Enrollment Services operating segments. In addition, beginning in the third quarter of 2009, the Company began servicing federally-owned student loans for the Department of Education. As discussed previously, the amount of federally-owned student loans originated through the Direct Loan Program is expected to increase substantially, which will lead to an increase in servicing volume and related revenue for the Company. As shown below, revenue earned from the Company’s fee-based operating segments has grown $14.8 million (19.2%) for the three months ended March 31, 2010 compared to the same period in 2009.
|
Three months ended March 31,
|
||||||||||||||||
|
2010
|
2009
|
$ Change
|
% Change
|
|||||||||||||
|
Student Loan and Guaranty Servicing (a)
|
$ | 41,229 | 32,736 | 8,493 | 25.9 | % | ||||||||||
|
Tuition Payment Processing and Campus Commerce
|
17,390 | 15,568 | 1,822 | 11.7 | ||||||||||||
|
Enrollment Services
|
33,271 | 28,771 | 4,500 | 15.6 | ||||||||||||
| Total revenue from fee-based businesses | 91,890 | 77,075 | 14,815 | 19.2 | % | |||||||||||
|
|
(a)
|
The Student Loan and Guaranty Servicing operating segment included $10.0 million and $0.4 million of revenue earned from rehabilitation collections on defaulted loans in the first quarter of 2010 and 2009, respectively.
|
Manage Operating Costs
|
Three months ended March 31,
|
||||||||||||||||
|
2010
|
2009
|
$ Change
|
% Change
|
|||||||||||||
|
Salaries and benefits (a)
|
$ | 40,644 | 38,226 | 2,418 | 6.3 | % | ||||||||||
|
Other expenses (b)
|
34,615 | 36,128 | (1,513 | ) | (4.2 | ) | ||||||||||
|
Operating expenses, excluding the cost
|
||||||||||||||||
|
to provide enrollment services, restructure expenses,
|
||||||||||||||||
|
and collection costs related to loan rehabilitation revenue
|
75,259 | 74,354 | $ | 905 | 1.2 | % | ||||||||||
|
Cost to provide enrollment services
|
22,025 | 17,793 | ||||||||||||||
|
Restructure expense (c)
|
1,197 | — | ||||||||||||||
|
Collection costs related to loan rehabilitation revenue (d)
|
5,223 | 424 | ||||||||||||||
|
Total operating expenses
|
$ | 103,704 | 92,571 | |||||||||||||
|
(a)
|
Excludes restructure expenses related to employee termination costs.
|
|
(b)
|
Excludes restructure expenses related to lease terminations and collection costs related to loan rehabilitation revenue.
|
|
(c)
|
Restructure expense is included in “salaries and benefits” and “occupancy and communications” in the consolidated statements of income.
|
|
(d)
|
The Company incurred $5.2 million and $0.4 million in collection costs related to revenue earned from rehabilitation loans in the first quarter of 2010 and 2009, respectively. These costs are included in “professional and other services” in the consolidated statements of income and are shown separately in the above table for comparability purposes for the periods shown.
|
Excluding the cost to provide enrollment services, restructuring charges, and collection costs related to loan rehabilitation revenue, operating expenses increased $0.9 million (1.2%) for the three months ended March 31, 2010 compared to 2009. The Company continues to manage operating costs while growing its fee-based businesses.
27
Maximize the Value of Existing Portfolio
Fixed rate floor income
Loans originated prior to April 1, 2006 generally earn interest at the higher of a floating rate based on the Special Allowance Payment or the SAP formula set by the Department and the borrower rate, which is fixed over a period of time. The SAP formula is based on an applicable index plus a fixed spread that is dependent upon when the loan was originated, the loan’s repayment status, and funding sources for the loan. The Company generally finances its student loan portfolio with variable rate debt. In low and/or declining interest rate environments, when the fixed borrower rate is higher than the rate produced by the SAP formula, the Company’s student loans earn at a fixed rate while the interest on the variable rate debt typically continues to decline. In these interest rate environments, the Company earns additional spread income that it refers to as floor income. For loans where the borrower rate is fixed to term, the Company earns floor income for an extended period of time, which the Company refers to as fixed rate floor income.
The Company’s core student loan spread (variable student loan spread including fixed rate floor contribution) and variable student loan spread (net interest margin excluding fixed rate floor income) is summarized below.
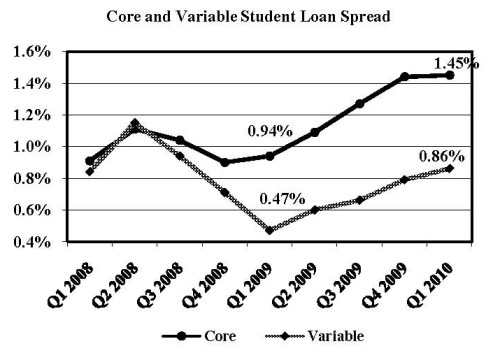
The Company’s core and variable student loan spread increased to 1.45% and 0.86%, respectively, for the three month period ended March 31, 2010, from 0.94% and 0.47% for the same period in 2009. During the three months ended March 31, 2010 and 2009, loan interest income includes $35.3 million (59 basis points of spread contribution) and $30.3 million (49 basis points of spread contribution), respectively, of fixed rate floor income. The increase in fixed rate floor income throughout 2009 and the first quarter of 2010 is due to historically low interest rates. The Company’s variable student loan spread increased throughout 2009 and the first quarter of 2010 as a result of the tightening of the commercial paper rate, which is the primary rate the Company earns on its student loan portfolio, and the LIBOR rate, which is the primary rate the Company pays to fund its student loan assets. The CP/LIBOR spread during the first quarter of 2009 was 52 basis points compared to 5 basis points during the first quarter of 2010.
If interest rates remain low, the Company anticipates continuing to earn significant fixed rate floor income in future periods.
Future Cash Flow from Portfolio
The majority of the Company’s portfolio of student loans is funded in asset backed securitizations that are structured to substantially match the maturity of the funded assets and there are minimal liquidity issues related to these facilities. In addition, due to the difference between the yield the Company receives on the loans and cost of financing within these transactions, the Company has created a portfolio that will generate earnings and significant cash flow over the life of these transactions.
As of March 31, 2010, based on cash flow models developed to reflect management’s current estimate of, among other factors, prepayments, defaults, deferment, forbearance, and interest rates, the Company currently expects future undiscounted cash flows from its portfolio to be approximately $1.56 billion as detailed below. This amount does not include cash flows that the Company expects to receive related to loans funded through the Department of Education’s Conduit and Loan Participation and Purchase Programs and other warehouse facilities or loans originated and/or acquired subsequent to March 31, 2010. The Company expects the future cash flows shown below would correspond to earnings when excluding the amortization of loan premiums and deferred origination costs, potential derivative activity used by the Company to hedge the portfolio, and other portfolio management and administrative costs. Because the Company does not use gain-on-sale accounting when issuing asset-backed securitizations, the future earnings of these transactions are not yet reflected in the Company’s consolidated financial statements.
28
The increase in the Company’s expected portfolio cash flows from December 31, 2009 (which was $1.43 billion) is due to changes in forward rates, offset by cash received during the first quarter of 2010.
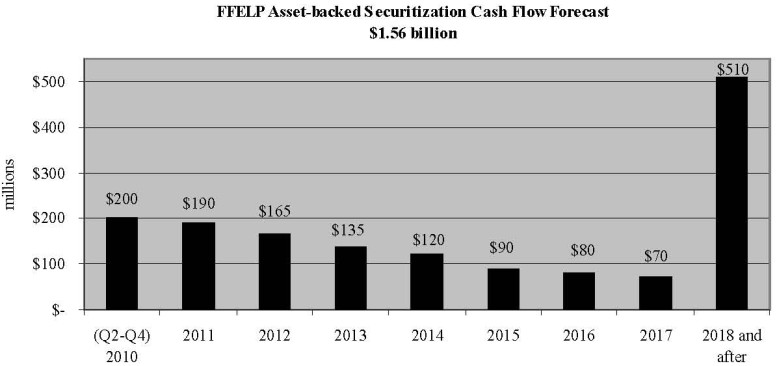
FFELP 2009-2010 Academic Year Originations
The Company continues to use the Department’s Participation Program to fund loans originated for the 2009-2010 academic year. The Company has not yet determined if it will sell these loans to the Department under the Purchase Program. However, based on the number of 2009-2010 academic year loans held by the Company that are eligible for this program ($1.0 billion as of March 31, 2010) the Company estimates that it would recognize a gain of approximately $16 million to $18 million if it chose to sell these loans under this program. This gain does not include loans originated and/or acquired after March 31, 2010 which would increase the gain recognized by the Company.
Use Liquidity to Capitalize on Market Opportunities
Debt Repurchases
The Company plans to use its improved liquidity position to capitalize on market opportunities. During the first quarter of 2010, the Company has used operating cash to repurchase additional asset-backed securities as summarized below. Due to improvements in the capital markets, the opportunities for the Company to repurchase debt at less than par are becoming more limited.
|
Three months ended March 31, 2010
|
||||||||||||
|
Notional
amount
|
Purchase
price
|
Gain
|
||||||||||
|
Asset-backed securities
|
$ | 274,250 | 264,073 | 10,177 | ||||||||
Loan Purchases
As disclosed previously, since April 1, 2010, the Company has purchased approximately $2 billion (par value) of student loans. The Company believes there will be opportunities to purchase FFELP loan portfolios and/or expand its current level of guarantee and third-party FFELP servicing volume from current FFELP participants looking to modify their involvement and/or exit the market.
29
RESULTS OF OPERATIONS
The Company’s operating results are primarily driven by the performance of its existing portfolio, the cost necessary to generate new assets, the revenues generated by its fee based businesses, and the cost to provide those services. The performance of the Company’s portfolio is driven by net interest income and losses related to credit quality of the assets along with the cost to administer and service the assets and related debt.
Net Interest Income
The Company generates a significant portion of its earnings from the spread, referred to as its student loan spread, between the yield the Company receives on its student loan portfolio and the cost of funding these loans. This spread income is reported on the Company’s consolidated statements of income as net interest income. The amortization of loan premiums and discounts, including capitalized costs of origination, the 1.05% per year consolidation loan rebate fee paid to the Department, and yield adjustments from borrower benefit programs, are netted against loan interest income on the Company’s consolidated statements of income. The amortization of debt issuance costs is included in interest expense on the Company’s consolidated statements of income.
The Company’s portfolio of FFELP loans originated prior to April 1, 2006 earns interest at the higher of a variable rate based on the special allowance payment or SAP formula set by the Department of Education and the borrower rate. The SAP formula is based on an applicable index plus a fixed spread that is dependent upon when the loan was originated, the loan’s repayment status, and funding sources for the loan. As a result of one of the provisions of the Higher Education Reconciliation Act of 2005 (“HERA”), the Company’s portfolio of FFELP loans originated on or after April 1, 2006 earns interest at a variable rate based on the SAP formula. For the portfolio of loans originated on or after April 1, 2006, when the borrower rate exceeds the variable rate based on the SAP formula, the Company must return the excess to the Department.
In September 2007, the College Cost Reduction Act was enacted into law. This legislation reduced the annual yield on FFELP loans originated after October 1, 2007 and should be considered when reviewing the Company’s results of operations. The Company has mitigated some of the reduction in annual yield by creating efficiencies and lowering costs, modifying borrower benefits, and reducing loan acquisition costs.
Because the Company generates a significant portion of its earnings from its student loan spread, the interest rate sensitivity of the Company’s balance sheet is very important to its operations. The current and future interest rate environment can and will affect the Company’s interest earnings, net interest income, and net income. The effects of changing interest rate environments are further outlined in Item 3, “Quantitative and Qualitative Disclosures about Market Risk — Interest Rate Risk.”
Investment interest income, which is a component of net interest income, includes income from unrestricted interest-earning deposits and investments and funds in the Company’s special purpose entities which are utilized for its asset-backed securitizations.
Net interest income also includes interest expense on unsecured debt offerings. The proceeds from these unsecured debt offerings were used by the Company to fund general business operations, certain asset and business acquisitions, and the repurchase of stock under the Company’s stock repurchase plan.
Provision for Loan Losses
Management estimates and establishes an allowance for loan losses through a provision charged to expense. Losses are charged against the allowance when management believes the collection of the loan principal is unlikely. Recovery of amounts previously charged off is credited to the allowance for loan losses. Management maintains the allowance for federally insured and non-federally insured loans at a level believed to be adequate to provide for estimated probable credit losses inherent in the loan portfolio. This evaluation is inherently subjective because it requires estimates that may be susceptible to significant changes. The Company analyzes the allowance separately for its federally insured loans and its non-federally insured loans.
The allowance for the federally insured loan portfolio is based on periodic evaluations of the Company’s loan portfolios considering past experience, trends in student loan claims rejected for payment by guarantors, changes to federal student loan programs, current economic conditions, and other relevant factors. The federal government currently guarantees 97% of the principal of and the interest on federally insured student loans disbursed on and after July 1, 2006 (and 98% for those loans disbursed prior to July 1, 2006), which limits the Company’s loss exposure on the outstanding balance of the Company’s federally insured portfolio. Student loans disbursed prior to October 1, 1993 are fully insured.
In determining the adequacy of the allowance for loan losses on the non-federally insured loans, the Company considers several factors including: loans in repayment versus those in a nonpaying status, delinquency status, type of program, and trends in defaults in the portfolio based on Company and industry data. The Company places a non-federally insured loan on nonaccrual status when the collection of principal and interest is 30 days past due and charges off the loan when the collection of principal and interest is 120 days past due.
30
Other Income
The Company also earns fees and generates revenue from other sources as summarized below.
Student Loan and Guaranty Servicing Revenue – Loan servicing fees are determined according to individual agreements with customers and are calculated based on the dollar value of loans, number of loans, or number of borrowers serviced for each customer. Guaranty servicing fees, generally, are calculated based on the number of loans serviced, volume of loans serviced, or amounts collected. Revenue is recognized when earned pursuant to applicable agreements, and when ultimate collection is assured.
Tuition Payment Processing and Campus Commerce Revenue – Tuition payment processing and campus commerce revenue includes actively managed tuition payment solutions, online payment processing, detailed information reporting, and data integration services. Fees for these payment management services are recognized over the period in which services are provided to customers.
Enrollment Services Revenue – Enrollment services revenue primarily consists of the following items:
|
·
|
Interactive Marketing – Interactive marketing revenue is derived primarily from fees which are earned through the delivery of qualified leads or clicks. The Company recognizes revenue when persuasive evidence of an arrangement exists, delivery has occurred, the fee is fixed or determinable, and collectability is reasonably assured. Delivery is deemed to have occurred at the time a qualified lead or click is delivered to the customer provided that no significant obligations remain. From time to time, the Company may agree to credit certain leads or clicks if they fail to meet the contractual or other guidelines of a particular client. The Company has established a sales reserve based on historical experience. To date, such credits have been immaterial and within management’s expectations.
For a portion of its interactive marketing revenue, the Company has agreements with providers of online media or traffic (“Publishers”) used in the generation of leads or clicks. The Company receives a fee from its customers and pays a fee to Publishers either on a cost per lead, cost per click, or cost per number of impressions basis. The Company is the primary obligor in the transaction. As a result, the fees paid by the Company’s customers are recognized as revenue and the fees paid to its Publishers are included in “cost to provide enrollment services” in the Company’s consolidated statements of income.
|
|
·
|
Publishing and editing services - Revenue from the sale of print products is generally earned and recognized, net of estimated returns, upon shipment or delivery. Revenue from the sale of editing services is generally recognized upon completion of providing the service.
|
|
·
|
Resource centers and list marketing – Resource centers and list marketing services includes the sale of subscription and performance based products and services, as well as list sales. Revenues from sales of subscription and performance based products and services are recognized ratably over the term of the contract. Subscription and performance based revenues received or receivable in advance of the delivery of services is included in deferred revenue. Revenue from the sale of lists is generally earned and recognized, net of estimated returns, upon delivery.
|
Software Services Revenue – Software services revenue is determined from individual agreements with customers and includes license and maintenance fees associated with student loan software products. Computer and software consulting services are recognized over the period in which services are provided to customers.
Operating Expenses
Operating expenses includes indirect costs incurred to generate and acquire student loans, costs incurred to manage and administer the Company’s student loan portfolio and its financing transactions, costs incurred to service the Company’s student loan portfolio and the portfolios of third parties, the cost to provide enrollment services, costs incurred to provide tuition payment processing, campus commerce, resource center and list marketing services, software and technical services to third parties, the depreciation and amortization of capital assets and intangible assets, investments in products, services, and technology to meet customer needs and support continued revenue growth, and other general and administrative expenses. The cost to provide enrollment services, as discussed previously, consists of costs incurred to provide interactive marketing and publishing and editing services in the Company’s Enrollment Services operating segment. Operating expenses also includes employee termination benefits and lease termination costs related to the Company’s restructuring initiatives.
31
Three months ended March 31, 2010 compared to the three months ended March 31, 2009
Net Interest Income (net of settlements on derivatives)
|
Three months ended March 31,
|
||||||||||||||||
|
Change
|
||||||||||||||||
|
2010
|
2009
|
$ | % | |||||||||||||
|
Interest income:
|
||||||||||||||||
|
Loan interest
|
$ | 134,967 | 170,919 | (35,952 | ) | (21.0 | ) % | |||||||||
|
Investment interest
|
1,001 | 4,091 | (3,090 | ) | (75.5 | ) | ||||||||||
|
Total interest income
|
135,968 | 175,010 | (39,042 | ) | (22.3 | ) | ||||||||||
|
Interest expense:
|
||||||||||||||||
|
Interest on bonds and notes payable
|
50,859 | 146,502 | (95,643 | ) | (65.3 | ) | ||||||||||
|
Net interest income
|
85,109 | 28,508 | 56,601 | 198.5 | ||||||||||||
|
Provision for loan losses
|
5,000 | 7,500 | (2,500 | ) | (33.3 | ) | ||||||||||
|
Net interest income after
|
||||||||||||||||
|
provision for loan losses
|
80,109 | 21,008 | 59,101 | 281.3 | ||||||||||||
|
Derivative settlements, net (a)
|
(2,423 | ) | 24,358 | (26,781 | ) | (109.9 | ) | |||||||||
|
Net interest income after
|
||||||||||||||||
|
provision for loan losses (net of
|
||||||||||||||||
|
settlements on derivatives)
|
$ | 77,686 | 45,366 | 32,320 | 71.2 | % | ||||||||||
|
|
(a)
|
The Company maintains an overall risk management strategy that incorporates the use of derivative instruments to reduce the economic effect of interest rate volatility. Management has structured the majority of the Company’s derivative transactions with the intent that each is economically effective; however, the Company’s derivative instruments do not qualify for hedge accounting. Derivative settlements for each applicable period should be evaluated with the Company’s net interest income.
|
Net interest income after provision for loan losses, net of settlements on derivatives, changed for the three months ended March 31, 2010 compared to same period in 2009 as follows:
|
Three months ended March 31,
|
||||||||||||||||
|
Change
|
||||||||||||||||
|
2010
|
2009
|
$ | % | |||||||||||||
|
Student loan interest margin, net of
|
||||||||||||||||
|
settlements on derivatives (a)
|
$ | 52,530 | 25,498 | 27,032 | 106.0 | % | ||||||||||
|
Fixed rate floor income, net of
|
||||||||||||||||
|
settlements on derivatives (b)
|
35,271 | 30,285 | 4,986 | 16.5 | ||||||||||||
|
Variable-rate floor income, net of
|
||||||||||||||||
|
settlements on derivatives (c)
|
— | 1,460 | (1,460 | ) | (100.0 | ) | ||||||||||
|
Investment interest (d)
|
1,001 | 4,091 | (3,090 | ) | (75.5 | ) | ||||||||||
|
Corporate debt interest expense (e)
|
(6,116 | ) | (8,468 | ) | 2,352 | (27.8 | ) | |||||||||
|
Provision for loan losses (f)
|
(5,000 | ) | (7,500 | ) | 2,500 | (33.3 | ) | |||||||||
|
Net interest income after
|
||||||||||||||||
|
provision for loan losses (net of
|
||||||||||||||||
|
settlements on derivatives)
|
$ | 77,686 | 45,366 | 32,320 | 71.2 | % | ||||||||||
|
(a)
|
Variable student loan spread increased to 0.86% for the three months ended March 31, 2010 compared to 0.47% in 2009 as further discussed in this Item 2 under “Asset Generation and Management Operating Segment – Results of Operations – Student Loan Spread Analysis.”
|
|
(b)
|
The Company has a portfolio of student loans that are earning interest at a fixed borrower rate which exceeds the statutorily defined variable lender rate creating fixed rate floor income. Due to lower interest rates in the three months ended March 31, 2010 compared to the same period in 2009, the Company received additional fixed rate floor income on a portion of its student loan portfolio. See Item 3, “Quantitative and Qualitative Disclosures about Market Risk – Interest Rate Risk” for additional information.
|
|
(c)
|
Loans that reset annually on July 1 can generate excess spread income compared with the rate based on the special allowance payment formula in declining interest rate environments. The Company refers to this additional income as variable-rate floor income. A portion of the Company’s portfolio was earning variable-rate floor income during the first quarter of 2009. No variable-rate floor income was earned during the first quarter of 2010.
|
32
|
(d)
|
Investment interest decreased for the three months ended March 31, 2010 compared to the same period in 2009 due to lower interest rates in 2010.
|
|
(e)
|
Corporate debt interest expense decreased for the three months ended March 31, 2010 compared to the same period in 2009 as a result of a decrease in interest rates, as well as a reduction in debt outstanding due to the purchase of unsecured fixed rate debt. The weighted average interest rate and notes outstanding on the Company’s unsecured line of credit was 0.725% and $691.5 million, respectively, as of March 31, 2010 compared to 1.042% and $691.5 million, respectively, as of March 31, 2009. During 2009, the Company purchased $208.3 million of its 5.125% Senior Notes due 2010.
|
|
(f)
|
The provision for loan losses decreased for the three months ended March 31, 2010 compared to 2009 due to the aging of the Company’s student loan portfolio and improved credit performance.
|
Other Income
|
Three months ended March 31,
|
||||||||||||||||
|
Change
|
||||||||||||||||
|
2010
|
2009
|
$ | % | |||||||||||||
|
Loan and guaranty servicing revenue (a)
|
$ | 36,394 | 26,471 | 9,923 | 37.5 | % | ||||||||||
|
Tuition payment processing and campus commerce revenue (b)
|
17,382 | 15,538 | 1,844 | 11.9 | ||||||||||||
|
Enrollment services revenue (c)
|
33,271 | 28,771 | 4,500 | 15.6 | ||||||||||||
|
Software services revenue (d)
|
4,344 | 5,705 | (1,361 | ) | (23.9 | ) | ||||||||||
|
Other income (e)
|
7,260 | 8,787 | (1,527 | ) | (17.4 | ) | ||||||||||
|
Gain on sale of loans and debt repurchases, net (f)
|
10,177 | 7,869 | 2,308 | 100.0 | ||||||||||||
|
Derivative market value and foreign currency adjustments (g)
|
4,105 | (4,880 | ) | 8,985 | (184.1 | ) | ||||||||||
|
Derivative settlements, net (h)
|
(2,423 | ) | 24,358 | (26,781 | ) | (109.9 | ) | |||||||||
|
Total other income
|
$ | 110,510 | 112,619 | (2,109 | ) | (1.9 | ) % | |||||||||
|
(a)
|
“Loan and guaranty servicing revenue” increased due to an increase in loan servicing revenue as a result of servicing loans for the Department, as well as an increase in guaranty servicing revenue as a result of recognizing $10.0 million in revenue related to rehabilitation collections on defaulted loans in the first quarter of 2010 compared to $0.4 million in 2009. See Item 2 under “Student Loan and Guaranty Servicing Operating Segment – Results of Operations” for additional information.
|
|
(b)
|
“Tuition payment processing and campus commerce revenue” increased due to an increase in the number of managed tuition payment plans and an increase in campus commerce transactions processed as discussed in this Item 2 under “Tuition Payment Processing and Campus Commerce Operating Segment – Results of Operations.”
|
|
(c)
|
“Enrollment services revenue” increased due to an increase in interactive marketing revenue as further discussed in this Item 2 under “Enrollment Services Operating Segment – Results of Operations.”
|
|
(d)
|
“Software and technical services revenue” decreased due to a reduction in the number of projects for existing customers and the loss of customers due to the legislative developments in the student loan industry throughout 2009 and 2010 as discussed in this Item 2 under “Loan and Guaranty Servicing Operating Segment – Results of Operations.”
|
|
(e)
|
The following table summarizes the components of “other income”.
|
|
Three months ended March 31,
|
||||||||
|
2010
|
2009
|
|||||||
|
Borrower late fee income
|
$ | 3,258 | 3,030 | |||||
|
Gain on sale of equity method investment
|
— | 3,500 | ||||||
|
Other
|
4,002 | 2,257 | ||||||
|
Other income
|
$ | 7,260 | 8,787 | |||||
|
(f)
|
“Gain on sale of loans and debt repurchases, net” includes gains of $10.2 million and $8.1 million for the three months ended March 31, 2010 and 2009, respectively, related to the purchase of $274.3 million of asset-backed securities and $34.9 million of 5.125% Senior Notes due in 2010, respectively.
|
|
(g)
|
The change in “derivative market value and foreign currency adjustments” was primarily the result of the change in the fair value of the Company’s derivative portfolio and transaction gains/losses resulting from the remeasurement of the Company’s Euro-denominated bonds to U.S. dollars. These changes are summarized below.
|
33
|
Three months ended March 31,
|
||||||||
|
2010
|
2009
|
|||||||
|
Change in fair value of derivatives
|
$ | (67,570 | ) | (52,122 | ) | |||
|
Foreign currency transaction adjustment
|
71,675 | 47,242 | ||||||
|
Derivative market value and foreign currency adjustments
|
$ | 4,105 | (4,880 | ) | ||||
|
(h)
|
Further detail of the components of derivative settlements is included in Item 3, “Quantitative and Qualitative Disclosures about Market Risk.” The Company maintains an overall risk management strategy that incorporates the use of derivative instruments to reduce the economic effect of interest rate volatility. Management has structured the majority of the Company’s derivative transactions with the intent that each is economically effective; however, the Company’s derivative instruments do not qualify for hedge accounting. Derivative settlements for each applicable period should be evaluated with the Company’s net interest income.
|
Operating Expenses
|
Three months ended March 31,
|
||||||||||||||||
|
2010
|
2009
|
$ Change
|
% Change
|
|||||||||||||
|
Salaries and benefits (a)
|
$ | 40,644 | 38,226 | 2,418 | 6.3 | % | ||||||||||
|
Other expenses (b)
|
34,615 | 36,128 | (1,513 | ) | (4.2 | ) | ||||||||||
|
Operating expenses, excluding the cost
|
||||||||||||||||
|
to provide enrollment services, restructure expenses,
|
||||||||||||||||
|
and collection costs related to loan rehabilitation revenue
|
75,259 | 74,354 | $ | 905 | 1.2 | % | ||||||||||
|
Cost to provide enrollment services
|
22,025 | 17,793 | ||||||||||||||
|
Restructure expense (c)
|
1,197 | — | ||||||||||||||
|
Collection costs related to loan rehabilitation revenue (d)
|
5,223 | 424 | ||||||||||||||
|
Total operating expenses
|
$ | 103,704 | 92,571 | |||||||||||||
|
(a)
|
Excludes restructure expenses related to employee termination costs.
|
|
(b)
|
Excludes restructure expenses related to lease terminations and collection costs related to loan rehabilitation revenue.
|
|
(c)
|
Restructure expense is included in “salaries and benefits” and “occupancy and communications” in the consolidated statements of income.
|
|
(d)
|
The Company incurred $5.2 million and $0.4 million in collection costs related to revenue earned from rehabilitation loans in the first quarter of 2010 and 2009, respectively. These costs are included in “professional and other services” in the consolidated statements of income and are shown separately in the above table for comparability purposes for the periods shown.
|
Excluding the cost to provide enrollment services, restructuring charges, and collection costs related to loan rehabilitation revenue, operating expenses increased $0.9 million (1.2%) for the three months ended March 31, 2010 compared to 2009. The Company continues to manage operating costs while growing its fee-based businesses.
Income Taxes
The Company’s effective tax rate was 37.5% and 38.0% for the three months ended March 31, 2010 and 2009, respectively. The effective tax rate for the first quarter of 2010 decreased as compared to the same period in 2009 due to various state tax law changes.
Additional information on the Company’s results of operations is included with the discussion of the Company’s operating segments in this Item 2 under “Operating Segments.”
34
Financial Condition as of March 31, 2010 compared to December 31, 2009
|
As of
|
As of
|
|||||||||||||||
|
March 31,
|
December 31,
|
Change
|
||||||||||||||
|
2010
|
2009
|
Dollars
|
Percent
|
|||||||||||||
|
Assets:
|
||||||||||||||||
|
Student loans receivable, net
|
$ | 24,835,493 | 23,926,957 | 908,536 | 3.8 | % | ||||||||||
|
Cash, cash equivalents, and investments
|
1,097,136 | 1,055,414 | 41,722 | 4.0 | ||||||||||||
|
Goodwill
|
143,717 | 143,717 | — | — | ||||||||||||
|
Intangible assets, net
|
54,940 | 53,538 | 1,402 | 2.6 | ||||||||||||
|
Fair value of derivative instruments
|
129,059 | 193,899 | (64,840 | ) | (33 | ) | ||||||||||
|
Other assets
|
581,600 | 502,902 | 78,698 | 15.6 | ||||||||||||
|
Total assets
|
$ | 26,841,945 | 25,876,427 | 965,518 | 3.7 | % | ||||||||||
|
Liabilities:
|
||||||||||||||||
|
Bonds and notes payable
|
$ | 25,756,182 | 24,805,289 | 950,893 | 3.8 | % | ||||||||||
|
Fair value of derivative instruments
|
6,074 | 2,489 | 3,585 | 144.0 | ||||||||||||
|
Other liabilities
|
240,476 | 284,086 | (43,610 | ) | (15.4 | ) | ||||||||||
|
Total liabilities
|
26,002,732 | 25,091,864 | 910,868 | 3.6 | ||||||||||||
|
Shareholders' equity
|
839,213 | 784,563 | 54,650 | 7.0 | ||||||||||||
|
Total liabilities and shareholders' equity
|
$ | 26,841,945 | 25,876,427 | 965,518 | 3.7 | % | ||||||||||
Total assets and total liabilities increased during 2010 primarily due to the Company originating and acquiring student loans in the first quarter of 2010 and funding the loans with bonds and notes payable.
OPERATING SEGMENTS
The Company has four operating segments as follows: Student Loan and Guaranty Servicing, Tuition Payment Processing and Campus Commerce, Enrollment Services, and Asset Generation and Management. The Company’s operating segments are defined by the products and services they offer or the types of customers they serve, and they reflect the manner in which financial information is currently evaluated by management. In the first quarter of 2010, internal reporting to executive management (the “chief operating decision maker”) changed to reflect operational changes made within the organization. The operations of various segments changed in 2010 in order for the Company to capitalize on external servicing opportunities while obtaining maximum operating leverage. The change in operating results reviewed by management changed the operating segments historically reported by the Company. The operational and internal reporting changes included moving the majority of software and information technology products and services and related expenses to the Student Loan and Guaranty Servicing operating segment. The internal and external revenue and expenses related to these products and services were historically included within Corporate Activities and the former Software and Technical Services operating segment. The Software and Technical Services operating segment no longer meets the definition of an operating segment as described in ASC Topic 280, Segment Reporting. Prior period segment operating results were restated to conform to the current period presentation.
The accounting policies of the Company’s operating segments are the same as those described in the summary of significant accounting policies. Intersegment revenues are charged by a segment to another segment that provides the product or service. Intersegment revenues and expenses are included within each segment consistent with the income statement presentation provided to management. Changes in management structure or allocation methodologies and procedures may result in changes in reported segment financial information. In 2010, the Company began allocating certain corporate overhead expenses to the individual operating segments. These expenses include certain corporate activities related to executive management, human resources, accounting and finance, legal, and marketing. These costs are allocated to each operating segment based on estimated use of such activities and services. These allocations were not made in 2009, and thus are not reflected in the 2009 segment operating results.
The management reporting process measures the performance of the Company’s operating segments based on the management structure of the Company as well as the methodology used by management to evaluate performance and allocate resources. Management, including the Company’s chief operating decision maker, evaluates the performance of the Company’s operating segments based on their profitability. As discussed further below, management measures the profitability of the Company’s operating segments based on “base net income.” Accordingly, information regarding the Company’s operating segments is provided based on “base net income.” The Company’s “base net income” is not a defined term within generally accepted accounting principles (“GAAP”) and may not be comparable to similarly titled measures reported by other companies. Unlike financial accounting, there is no comprehensive, authoritative guidance for management reporting.
35
Historically, the Company generated the majority of its revenue from net interest income earned in its Asset Generation and Management operating segment. The Company made several acquisitions that have expanded the Company’s products and services and have diversified its revenue – primarily from fee-based businesses. The Company currently offers a broad range of pre-college, in-college, and post-college products and services to students, families, schools, and financial institutions. These products and services help students and families plan and pay for their education and students plan their careers. The Company’s products and services are designed to simplify the education planning and financing process and are focused on providing value to students, families, and schools throughout the education life cycle. The Company continues to diversify its sources of revenue, including those generated from businesses that are not dependent upon government programs, thereby reducing legislative and political risk.
“Base net income” is the primary financial performance measure used by management to develop the Company’s financial plans, track results, and establish corporate performance targets and incentive compensation. While “base net income” is not a substitute for reported results under GAAP, the Company relies on “base net income” in operating its business because “base net income” permits management to make meaningful period-to-period comparisons of the operational and performance indicators that are most closely assessed by management. Management believes this information provides additional insight into the financial performance of the core business activities of the Company’s operating segments.
Accordingly, the tables presented below reflect “base net income” which is reviewed and utilized by management to manage the business for each of the Company’s operating segments. Reconciliation of the segment totals to the Company’s consolidated operating results in accordance with GAAP are also included in the tables below. Included below under “Non-GAAP Performance Measures” is further discussion regarding “base net income” and its limitations, including a table that details the differences between “base net income” and GAAP net income by operating segment.
Reclassifications
Certain amounts previously reported have been reclassified to conform to the current period presentation. The reclassifications were made to change the income statement presentation to provide the users of the financial statements additional information related to the operating results of the Company. These reclassifications include reclassifying the Company’s gains on debt repurchases to “gains on sale of loans and debt repurchases, net” which were previously included in “other income.” In addition, as discussed previously, in the first quarter of 2010, a change in operating results reviewed by management changed the operating segments historically reported by the Company. Prior period segment operating results were restated to conform to the current period presentation.
36
Segment Results and Reconciliations to GAAP
|
Three months ended March 31, 2010
|
||||||||||||||||||||||||||||||||||||
|
Fee-Based
|
||||||||||||||||||||||||||||||||||||
|
Student
|
Tuition
|
Elimin- |
"Base net
|
|||||||||||||||||||||||||||||||||
|
Loan
|
Payment
|
Asset
|
Corporate
|
ations |
income"
|
|||||||||||||||||||||||||||||||
|
and
|
Processing
|
Total
|
Generation
|
Activity
|
and
|
Adjustments
|
GAAP
|
|||||||||||||||||||||||||||||
|
Guaranty
|
and Campus
|
Enrollment
|
Fee-
|
and
|
and
|
Reclass-
|
to GAAP
|
Results of
|
||||||||||||||||||||||||||||
|
Servicing
|
Commerce
|
Services
|
Based
|
Management
|
Overhead
|
ifications
|
Results
|
Operations
|
||||||||||||||||||||||||||||
|
Total interest income
|
$ | 13 | 8 | — | 21 | 135,262 | 1,598 | (913 | ) | — | 135,968 | |||||||||||||||||||||||||
|
Interest expense
|
— | — | — | — | 45,656 | 6,116 | (913 | ) | — | 50,859 | ||||||||||||||||||||||||||
|
Net interest income (loss)
|
13 | 8 | — | 21 | 89,606 | (4,518 | ) | — | — | 85,109 | ||||||||||||||||||||||||||
|
Less provision for loan losses
|
— | — | — | — | 5,000 | — | — | — | 5,000 | |||||||||||||||||||||||||||
|
Net interest income (loss) after provision for loan losses
|
13 | 8 | — | 21 | 84,606 | (4,518 | ) | — | — | 80,109 | ||||||||||||||||||||||||||
|
Other income (expense):
|
||||||||||||||||||||||||||||||||||||
|
Loan and guaranty servicing revenue
|
36,648 | — | — | 36,648 | — | (254 | ) | — | — | 36,394 | ||||||||||||||||||||||||||
|
Tuition payment processing and campus commerce revenue
|
— | 17,382 | — | 17,382 | — | — | — | — | 17,382 | |||||||||||||||||||||||||||
|
Enrollment services revenue
|
— | — | 33,271 | 33,271 | — | — | — | — | 33,271 | |||||||||||||||||||||||||||
|
Software services revenue
|
4,344 | — | — | 4,344 | — | — | — | — | 4,344 | |||||||||||||||||||||||||||
|
Other income
|
224 | — | — | 224 | 4,768 | 2,268 | — | — | 7,260 | |||||||||||||||||||||||||||
|
Gain on sale of loans and debt repurchases, net
|
— | — | — | — | 10,177 | — | — | — | 10,177 | |||||||||||||||||||||||||||
|
Intersegment revenue
|
22,719 | 65 | 17 | 22,801 | — | 4,081 | (26,882 | ) | — | — | ||||||||||||||||||||||||||
|
Derivative market value and foreign currency adjustments
|
— | — | — | — | — | — | — | 4,105 | 4,105 | |||||||||||||||||||||||||||
|
Derivative settlements, net
|
— | — | — | — | (2,423 | ) | — | — | — | (2,423 | ) | |||||||||||||||||||||||||
|
Total other income (expense)
|
63,935 | 17,447 | 33,288 | 114,670 | 12,522 | 6,095 | (26,882 | ) | 4,105 | 110,510 | ||||||||||||||||||||||||||
|
Operating expenses:
|
||||||||||||||||||||||||||||||||||||
|
Salaries and benefits
|
23,582 | 6,618 | 6,071 | 36,271 | 1,358 | 4,117 | (105 | ) | — | 41,641 | ||||||||||||||||||||||||||
|
Restructure expense- severance and contract terminination costs
|
1,205 | — | — | 1,205 | — | (8 | ) | (1,197 | ) | — | — | |||||||||||||||||||||||||
|
Cost to provide enrollment services
|
— | — | 22,025 | 22,025 | — | — | — | — | 22,025 | |||||||||||||||||||||||||||
|
Other expenses
|
15,519 | 2,441 | 5,062 | 23,022 | 4,221 | 6,079 | 200 | 6,516 | 40,038 | |||||||||||||||||||||||||||
|
Intersegment expenses
|
2,982 | 839 | 450 | 4,271 | 20,825 | 684 | (25,780 | ) | — | — | ||||||||||||||||||||||||||
|
Total operating expenses
|
43,288 | 9,898 | 33,608 | 86,794 | 26,404 | 10,872 | (26,882 | ) | 6,516 | 103,704 | ||||||||||||||||||||||||||
|
Income (loss) before income taxes and corporate overhead allocation
|
20,660 | 7,557 | (320 | ) | 27,897 | 70,724 | (9,295 | ) | — | (2,411 | ) | 86,915 | ||||||||||||||||||||||||
|
Corporate overhead allocation
|
(1,189 | ) | (396 | ) | (396 | ) | (1,981 | ) | (1,981 | ) | 3,962 | — | — | — | ||||||||||||||||||||||
|
Income (loss) before income taxes
|
19,471 | 7,161 | (716 | ) | 25,916 | 68,743 | (5,333 | ) | — | (2,411 | ) | 86,915 | ||||||||||||||||||||||||
|
Income tax (expense) benefit (a)
|
(7,400 | ) | (2,722 | ) | 273 | (9,849 | ) | (26,123 | ) | 2,463 | — | 916 | (32,593 | ) | ||||||||||||||||||||||
|
Net income (loss)
|
$ | 12,071 | 4,439 | (443 | ) | 16,067 | 42,620 | (2,870 | ) | — | (1,495 | ) | 54,322 | |||||||||||||||||||||||
|
(a) Income taxes are applied based on 38% of income (loss) before taxes for the individual operating segments.
|
||||||||||||||||||||||||||||||||||||
|
Three months ended March 31, 2010:
|
||||||||||||||||||||||||||||||||||||
|
Before Tax Operating Margin (1)
|
32.3 | % | 43.3 | % | (1.0 | %) | 24.3 | % | ||||||||||||||||||||||||||||
|
Before Tax Operating Margin (2)
|
32.3 | % | 43.3 | % | 5.9 | % | 26.3 | % | ||||||||||||||||||||||||||||
|
Three months ended March 31, 2009:
|
||||||||||||||||||||||||||||||||||||
|
Before Tax Operating Margin (1)
|
30.1 | % | 38.7 | % | 3.6 | % | 23.8 | % | ||||||||||||||||||||||||||||
|
Before Tax Operating Margin (2)
|
30.1 | % | 38.7 | % | 5.7 | % | 24.4 | % | ||||||||||||||||||||||||||||
(1) Excludes corporate overhead allocation (2010)
(2) Excludes corporate overhead allocation (2010) and list cost amortization expense (2010 and 2009)
37
|
Three months ended March 31, 2009
|
||||||||||||||||||||||||||||||||||||
|
Fee-Based
|
||||||||||||||||||||||||||||||||||||
|
Student
|
Tuition
|
Elimin- |
"Base net
|
|||||||||||||||||||||||||||||||||
|
Loan
|
Payment
|
Asset
|
Corporate
|
ations |
income"
|
|||||||||||||||||||||||||||||||
|
and
|
Processing
|
Total
|
Generation
|
Activity
|
and
|
Adjustments
|
GAAP
|
|||||||||||||||||||||||||||||
|
Guaranty
|
and Campus
|
Enrollment
|
Fee-
|
and
|
and
|
Reclass-
|
to GAAP
|
Results of
|
||||||||||||||||||||||||||||
|
Servicing
|
Commerce
|
Services
|
Based
|
Management
|
Overhead
|
ifications
|
Results
|
Operations
|
||||||||||||||||||||||||||||
|
Total interest income
|
$ | 66 | 30 | — | 96 | 172,587 | 1,427 | (560 | ) | 1,460 | 175,010 | |||||||||||||||||||||||||
|
Interest expense
|
— | — | — | — | 138,594 | 8,468 | (560 | ) | — | 146,502 | ||||||||||||||||||||||||||
|
Net interest income (loss)
|
66 | 30 | — | 96 | 33,993 | (7,041 | ) | — | 1,460 | 28,508 | ||||||||||||||||||||||||||
|
Less provision for loan losses
|
— | — | — | — | 7,500 | — | — | — | 7,500 | |||||||||||||||||||||||||||
|
Net interest income (loss) after provision for loan losses
|
66 | 30 | — | 96 | 26,493 | (7,041 | ) | — | 1,460 | 21,008 | ||||||||||||||||||||||||||
|
Other income (expense):
|
||||||||||||||||||||||||||||||||||||
|
Loan and guaranty servicing revenue
|
26,853 | — | — | 26,853 | — | (382 | ) | — | — | 26,471 | ||||||||||||||||||||||||||
|
Tuition payment processing and campus commerce revenue
|
— | 15,538 | — | 15,538 | — | — | — | — | 15,538 | |||||||||||||||||||||||||||
|
Enrollment services revenue
|
— | — | 28,771 | 28,771 | — | — | — | — | 28,771 | |||||||||||||||||||||||||||
|
Software services revenue
|
5,705 | — | — | 5,705 | — | — | — | — | 5,705 | |||||||||||||||||||||||||||
|
Other income
|
112 | — | — | 112 | 4,651 | 4,024 | — | — | 8,787 | |||||||||||||||||||||||||||
|
Gain (loss) on sale of loans and debt repurchases, net
|
— | — | — | — | (206 | ) | 8,075 | — | — | 7,869 | ||||||||||||||||||||||||||
|
Intersegment revenue
|
21,958 | 57 | — | 22,015 | — | 4,000 | (26,015 | ) | — | — | ||||||||||||||||||||||||||
|
Derivative market value and foreign currency adjustments
|
— | — | — | — | — | — | — | (4,880 | ) | (4,880 | ) | |||||||||||||||||||||||||
|
Derivative settlements, net
|
— | — | — | — | 24,358 | — | — | — | 24,358 | |||||||||||||||||||||||||||
|
Total other income (expense)
|
54,628 | 15,595 | 28,771 | 98,994 | 28,803 | 15,717 | (26,015 | ) | (4,880 | ) | 112,619 | |||||||||||||||||||||||||
|
Operating expenses:
|
||||||||||||||||||||||||||||||||||||
|
Salaries and benefits
|
22,354 | 6,545 | 6,095 | 34,994 | 1,775 | 3,802 | (2,504 | ) | 159 | 38,226 | ||||||||||||||||||||||||||
|
Restructure expense- severance and contract terminination costs
|
— | — | — | — | — | — | — | — | — | |||||||||||||||||||||||||||
|
Cost to provide enrollment services
|
— | — | 17,793 | 17,793 | — | — | — | — | 17,793 | |||||||||||||||||||||||||||
|
Other expenses
|
12,874 | 2,408 | 3,295 | 18,577 | 4,959 | 6,862 | — | 6,154 | 36,552 | |||||||||||||||||||||||||||
|
Intersegment expenses
|
3,007 | 623 | 546 | 4,176 | 17,876 | 1,459 | (23,511 | ) | — | — | ||||||||||||||||||||||||||
|
Total operating expenses
|
38,235 | 9,576 | 27,729 | 75,540 | 24,610 | 12,123 | (26,015 | ) | 6,313 | 92,571 | ||||||||||||||||||||||||||
|
Income (loss) before income taxes
|
16,459 | 6,049 | 1,042 | 23,550 | 30,686 | (3,447 | ) | — | (9,733 | ) | 41,056 | |||||||||||||||||||||||||
|
Income tax (expense) benefit (a)
|
(6,255 | ) | (2,298 | ) | (396 | ) | (8,949 | ) | (11,661 | ) | 1,310 | — | 3,699 | (15,601 | ) | |||||||||||||||||||||
|
Net income (loss)
|
$ | 10,204 | 3,751 | 646 | 14,601 | 19,025 | (2,137 | ) | — | (6,034 | ) | 25,455 | ||||||||||||||||||||||||
(a) Income taxes are applied based on 38% of income (loss) before taxes for the individual operating segments.
Non-GAAP Performance Measures
In accordance with the rules and regulations of the Securities and Exchange Commission, the Company prepares financial statements in accordance with generally accepted accounting principles. In addition to evaluating the Company’s GAAP-based financial information, management also evaluates the Company’s operating segments on a non-GAAP performance measure referred to as “base net income” for each operating segment. While “base net income” is not a substitute for reported results under GAAP, the Company relies on “base net income” to manage each operating segment because management believes these measures provide additional information regarding the operational and performance indicators that are most closely assessed by management.
“Base net income” is the primary financial performance measure used by management to develop financial plans, establish corporate performance targets, allocate resources, track results, evaluate performance, and determine incentive compensation. Accordingly, financial information is reported to management on a “base net income” basis by operating segment, as these are the measures used regularly by the Company’s chief operating decision maker. The Company’s board of directors utilizes “base net income” to set performance targets and evaluate management’s performance. The Company also believes analysts, rating agencies, and creditors use “base net income” in their evaluation of the Company’s results of operations. While “base net income” is not a substitute for reported results under GAAP, the Company utilizes “base net income” in operating its business because “base net income” permits management to make meaningful period-to-period comparisons by eliminating the temporary volatility in the Company’s performance that arises from certain items that are primarily affected by factors beyond the control of management. Management believes “base net income” provides additional insight into the financial performance of the core business activities of the Company’s operations.
Limitations of “Base Net Income”
While GAAP provides a uniform, comprehensive basis of accounting, for the reasons discussed above, management believes that “base net income” is an important additional tool for providing a more complete understanding of the Company’s results of operations. Nevertheless, “base net income” is subject to certain general and specific limitations that investors should carefully consider. For example, as stated above, unlike financial accounting, there is no comprehensive, authoritative guidance for management reporting. The Company’s “base net income” is not a defined term within GAAP and may not be comparable to similarly titled measures reported by other companies. Investors, therefore, may not be able to compare the Company’s performance with that of other companies based upon “base net income”. “Base net income” results are only meant to supplement GAAP results by providing additional information regarding the operational and performance indicators that are most closely monitored and used by the Company’s management and board of directors to assess performance and information which the Company believes is important to analysts, rating agencies, and creditors.
38
Other limitations of “base net income” arise from the specific adjustments that management makes to GAAP results to derive “base net income” results. These differences are described below.
The adjustments required to reconcile from the Company’s “base net income” measure to its GAAP results of operations relate to differing treatments for derivatives, foreign currency transaction adjustments, and certain other items that management does not consider in evaluating the Company’s operating results. The following table reflects adjustments associated with these areas by operating segment and Corporate Activity and Overhead:
|
Student
|
Tuition
|
|||||||||||||||||||||||
|
Loan
|
Payment
|
Asset
|
Corporate
|
|||||||||||||||||||||
|
and
|
Processing
|
Generation
|
Activity
|
|||||||||||||||||||||
|
Guaranty
|
and Campus
|
Enrollment
|
and
|
and
|
||||||||||||||||||||
|
Servicing
|
Commerce
|
Services
|
Management
|
Overhead
|
Total
|
|||||||||||||||||||
|
Three months ended March 31, 2010
|
||||||||||||||||||||||||
|
Derivative market value and foreign currency adjustments
|
$ | — | — | — | (4,561 | ) | 456 | (4,105 | ) | |||||||||||||||
|
Amortization of intangible assets
|
2,236 | 1,925 | 2,355 | — | — | 6,516 | ||||||||||||||||||
|
Compensation related to business combinations
|
— | — | — | — | — | — | ||||||||||||||||||
|
Variable-rate floor income, net of settlements on derivatives
|
— | — | — | — | — | — | ||||||||||||||||||
|
Net tax effect (a)
|
(850 | ) | (732 | ) | (895 | ) | 1,733 | (172 | ) | (916 | ) | |||||||||||||
|
Total adjustments to GAAP
|
$ | 1,386 | 1,193 | 1,460 | (2,828 | ) | 284 | 1,495 | ||||||||||||||||
|
Three months ended March 31, 2009
|
||||||||||||||||||||||||
|
Derivative market value and foreign currency adjustments
|
$ | — | — | — | 4,880 | — | 4,880 | |||||||||||||||||
|
Amortization of intangible assets
|
1,225 | 1,887 | 3,042 | — | — | 6,154 | ||||||||||||||||||
|
Compensation related to business combinations
|
— | — | — | — | 159 | 159 | ||||||||||||||||||
|
Variable-rate floor income, net of settlements on derivatives
|
— | — | — | (1,460 | ) | — | (1,460 | ) | ||||||||||||||||
|
Net tax effect (a)
|
(465 | ) | (717 | ) | (1,157 | ) | (1,300 | ) | (60 | ) | (3,699 | ) | ||||||||||||
|
Total adjustments to GAAP
|
$ | 760 | 1,170 | 1,885 | 2,120 | 99 | 6,034 | |||||||||||||||||
|
(a)
|
Income taxes are applied based on 38% for the individual operating segments.
|
Differences between GAAP and “Base Net Income”
Management’s financial planning and evaluation of operating results does not take into account the following items because their volatility and/or inherent uncertainty affect the period-to-period comparability of the Company’s results of operations. A more detailed discussion of the differences between GAAP and “base net income” follows.
Derivative market value and foreign currency adjustments: “Base net income” excludes the periodic unrealized gains and losses that are caused by the change in fair value on derivatives used in the Company’s risk management strategy in which the Company does not qualify for “hedge treatment” under GAAP. As such, the Company recognizes changes in fair value of derivative instruments currently in earnings. The Company maintains an overall interest rate risk management strategy that incorporates the use of derivative instruments to reduce the economic effect of interest rate volatility. Derivative instruments primarily used by the Company to manage interest rate risk includes interest rate swaps and basis swaps. Management has structured the majority of the Company's derivative transactions with the intent that each is economically effective. However, the Company does not qualify its derivatives for “hedge treatment,” and the stand-alone derivative must be marked-to-market in the income statement with no consideration for the corresponding change in fair value of the hedged item. The Company believes these point-in-time estimates of asset and liability values that are subject to interest rate fluctuations make it difficult to evaluate the ongoing results of operations against its business plan and affect the period-to-period comparability of the results of operations. Included in “base net income” are the economic effects of the Company’s derivative instruments, which includes any cash paid or received being recognized as an expense or revenue upon actual derivative settlements. These settlements are included in “Derivative market value and foreign currency adjustments and derivative settlements, net” on the Company’s consolidated statements of income.
39
“Base net income” excludes the foreign currency transaction gains or losses caused by the re-measurement of the Company’s Euro-denominated bonds to U.S. dollars. In connection with the issuance of the Euro-denominated bonds, the Company has entered into cross-currency interest rate swaps. Under the terms of these agreements, the principal payments on the Euro-denominated notes will effectively be paid at the exchange rate in effect at the issuance date of the bonds. The cross-currency interest rate swaps also convert the floating rate paid on the Euro-denominated bonds (EURIBOR index) to an index based on LIBOR. Included in “base net income” are the economic effects of any cash paid or received being recognized as an expense or revenue upon actual settlements of the cross-currency interest rate swaps. These settlements are included in “Derivative market value and foreign currency adjustments and derivative settlements, net” on the Company’s consolidated statements of income. However, the gains or losses caused by the re-measurement of the Euro-denominated bonds to U.S. dollars and the change in market value of the cross-currency interest rate swaps are excluded from “base net income” as the Company believes the point-in-time estimates of value that are subject to currency rate fluctuations related to these financial instruments make it difficult to evaluate the ongoing results of operations against the Company’s business plan and affect the period-to-period comparability of the results of operations. The re-measurement of the Euro-denominated bonds generally correlates with the change in fair value of the cross-currency interest rate swaps. However, the Company will experience unrealized gains or losses related to the cross-currency interest rate swaps if the two underlying indices (and related forward curve) do not move in parallel.
The gains and/or losses included in “Derivative market value and foreign currency adjustments and derivative settlements, net” on the Company’s consolidated statements of income are primarily caused by interest rate and currency volatility, as well as the volume and terms of derivatives not receiving hedge treatment. “Base net income” excludes these unrealized gains and losses and isolates the effect of interest rate and currency volatility related to the fair value of such instruments during the period. Under GAAP, the effects of these factors on the fair value of the derivative instruments (but not the underlying hedged item) tend to show more volatility in the short term.
Amortization of intangible assets: “Base net income” excludes the amortization of acquired intangibles, which arises primarily from the acquisition of definite life intangible assets in connection with the Company’s acquisitions, since the Company feels that such charges do not drive the Company’s operating performance on a long-term basis and can affect the period-to-period comparability of the results of operations.
Compensation related to business combinations: The Company has structured certain business combinations in which the consideration paid has been dependent on the sellers’ continued employment with the Company. As such, the value of the consideration paid is recognized as compensation expense by the Company over the term of the applicable employment agreement. “Base net income” excludes this expense because the Company believes such charges do not drive its operating performance on a long-term basis and can affect the period-to-period comparability of the results of operations. If the Company did not enter into the employment agreements in connection with the acquisition, the amount paid to these former shareholders of the acquired entity would have been recorded by the Company as additional consideration of the acquired entity, thus, not having an effect on the Company’s results of operations.
Variable-rate floor income, net of settlements on derivatives: Loans that reset annually on July 1 can generate excess spread income compared with the rate based on the special allowance payment formula in declining interest rate environments. The Company refers to this additional income as variable-rate floor income. The Company excludes variable-rate floor income, net of settlements paid on derivatives used to hedge student loan assets earning variable-rate floor income, from its “base net income” since the timing and amount of variable-rate floor income (if any) is uncertain, it has been eliminated by legislation for all loans originated on and after April 1, 2006, and it is in excess of expected spreads. In addition, because variable-rate floor income is subject to the underlying rate for the subject loans being reset annually on July 1, it is a factor beyond the Company’s control which can affect the period-to-period comparability of results of operations.
STUDENT LOAN AND GUARANTY SERVICING OPERATING SEGMENT – RESULTS OF OPERATIONS
The Student Loan and Guaranty Servicing operating segment provides for the servicing of the Company’s student loan portfolio and the portfolios of third parties and servicing provided to guaranty agencies. The loan servicing activities include loan origination activities, loan conversion activities, application processing, borrower updates, payment processing, due diligence procedures, and claim processing. These activities are performed internally for the Company’s portfolio in addition to generating fee revenue when performed for third-party clients. The guaranty servicing activities include providing software and data center services, borrower and loan updates, default aversion tracking services, claim processing services, and post-default collection services to guaranty agencies. The Company’s student loan servicing division uses proprietary systems to manage the servicing process. These systems provide for automated compliance with most of the federal student loan regulations adopted under the Higher Education Act.
This operating segment also develops student loan servicing software, which is used internally by the Company and also licensed to third-party student loan holders and servicers. In addition, this operating segment provides information technology products and services, with core areas of business in educational loan software solutions, business intelligence, technical consulting services, and Enterprise Content Management solutions.
Loan servicing fees are determined according to individual agreements with customers and are calculated based on the dollar value of loans, number of loans, or number of borrowers serviced for each customer. In addition, the Company earns servicing revenue for the origination of loans and conversion of loan portfolios. Guaranty servicing fees, generally, are calculated based on the number of loans serviced, volume of loans serviced, or amounts collected.
In June 2009, the Department of Education named the Company as one of four private sector companies awarded a servicing contract to service all federally-owned student loans, including FFELP loans purchased by the Department pursuant to ECASLA. By August 2010, the Company expects to also begin servicing new loans originated under the Direct Loan Program. Servicing volume has initially been allocated by the Department to the four servicers, and performance factors such as customer satisfaction levels and default rates will determine volume allocations over time. The contract spans five years, with one five-year renewal option. Servicing loans under this contract will increase revenue earned by this segment. However, operating margins under this contract are expected to be lower than historical levels achieved.
40
Segment Summary of Results
Significant items for the three months ended March 31, 2010 compared to the same period in 2009 include:
|
·
|
A $4.8 billion increase in Department of Education loan servicing volume from December 31, 2009
|
|
·
|
An increase in guaranty servicing revenue due to $10.0 million in revenue earned in the first quarter of 2010 from rehabilitation collections on defaulted loan assets
|
Student Loan Servicing Volumes (dollars in millions)
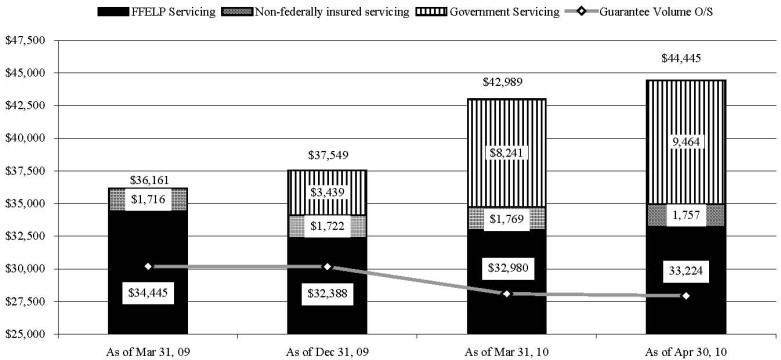
The table below includes a summary of key data related to the Company’s servicing portfolio.
|
As of
December 31, 2009
|
As of
March 31, 2010
|
As of
April 30, 2010
|
||||||||||
|
Number of Borrowers:
|
||||||||||||
|
Government Servicing
|
441,913 | 1,055,896 | 1,209,186 | |||||||||
| FFELP Servicing | 2,311,558 | 2,327,016 | 2,320,994 | |||||||||
| Servicing volume (in millions): | ||||||||||||
| Government Servicing | $ | 3,439 | $ | 8,241 | $ | 9,464 | ||||||
|
FFELP Servicing
|
$ | 32,388 | $ | 32,980 | $ | 33,224 | ||||||
41
Three months ended March 31, 2010 compared to the three months ended March 31, 2009
|
Three months ended March 31,
|
||||||||||||||||
|
Change
|
||||||||||||||||
|
2010
|
2009
|
$ | % | |||||||||||||
|
Net interest income
|
$ | 13 | 66 | (53 | ) | (80.3 | ) % | |||||||||
|
Loan and guaranty servicing revenue
|
36,648 | 26,853 | 9,795 | 36.5 | ||||||||||||
|
Software services revenue
|
4,344 | 5,705 | (1,361 | ) | (23.9 | ) | ||||||||||
|
Other income
|
224 | 112 | 112 | 100.0 | ||||||||||||
|
Intersegment revenue
|
22,719 | 21,958 | 761 | 3.5 | ||||||||||||
|
Total other income
|
63,935 | 54,628 | 9,307 | 17.0 | ||||||||||||
|
Salaries and benefits
|
23,582 | 22,354 | 1,228 | 5.5 | ||||||||||||
|
Restructure expense
|
1,205 | — | 1,205 | 100.0 | ||||||||||||
|
Other expenses
|
15,519 | 12,874 | 2,645 | 20.5 | ||||||||||||
|
Intersegment expenses
|
2,982 | 3,007 | (25 | ) | (0.8 | ) | ||||||||||
|
Total operating expenses
|
43,288 | 38,235 | 5,053 | 13.2 | ||||||||||||
|
"Base net income" before income taxes and corporate overhead allocation
|
20,660 | 16,459 | 4,201 | 25.5 | ||||||||||||
|
Corporate overhead allocation
|
(1,189 | ) | — | (1,189 | ) | (100.0 | ) | |||||||||
|
"Base net income" before income taxes
|
19,471 | 16,459 | 3,012 | 18.3 | % | |||||||||||
|
Income tax expense
|
(7,400 | ) | (6,255 | ) | (1,145 | ) | 18.3 | |||||||||
|
"Base net income"
|
$ | 12,071 | 10,204 | 1,867 | 18.3 | % | ||||||||||
|
Before Tax Operating Margin (a)
|
32.3 | % | 30.1 | % | ||||||||||||
(a) Excludes corporate overhead allocation.
Total other income.
|
Three months ended March 31,
|
||||||||||||||||||||||||||||||||
|
2010
|
2009
|
|||||||||||||||||||||||||||||||
|
Origination
revenue
|
Servicing
revenue
|
Software
services
revenue and information
technology
|
Total
revenue
|
Origination
revenue
|
Servicing
revenue
|
Software
services
revenue and information
technology
|
Total
revenue
|
|||||||||||||||||||||||||
|
FFELP servicing (a)
|
$ | 168 | 12,456 | — | 12,624 | 317 | 15,469 | — | 15,786 | |||||||||||||||||||||||
|
Private servicing
|
196 | 1,923 | — | 2,119 | 60 | 1,812 | — | 1,872 | ||||||||||||||||||||||||
|
Government servicing (b)
|
— | 3,540 | — | 3,540 | — | — | — | — | ||||||||||||||||||||||||
|
Guaranty servicing (c)
|
82 | 18,283 | 909 | 19,274 | 178 | 9,017 | 875 | 10,070 | ||||||||||||||||||||||||
|
Other (d)
|
— | 224 | 3,435 | 3,659 | — | 112 | 4,830 | 4,942 | ||||||||||||||||||||||||
|
Total third-party revenue
|
446 | 36,426 | 4,344 | 41,216 | 555 | 26,410 | 5,705 | 32,670 | ||||||||||||||||||||||||
|
Intersegment revenue (e)
|
3,097 | 18,494 | 1,128 | 22,719 | 2,701 | 17,135 | 2,122 | 21,958 | ||||||||||||||||||||||||
|
Total other income
|
$ | 3,543 | 54,920 | 5,472 | 63,935 | 3,256 | 43,545 | 7,827 | 54,628 | |||||||||||||||||||||||
|
(a)
|
FFELP origination revenue decreased in 2010 compared to 2009 due to lenders exiting the FFELP marketplace as a result of legislative changes and disruptions in the capital markets. FFELP servicing revenue decreased in 2010 due to the loss of life of loan servicing and transfer related activities for third party clients that sold loans to the Department of Education under the Purchase Program.
|
|
(b)
|
The Company began servicing loans for the Department of Education in September 2009.
|
|
(c)
|
Guaranty servicing revenue increased in 2010 due to $10.0 million in revenue earned from rehabilitation collections on defaulted loan assets in the first quarter of 2010. In the first quarter of 2009, revenue from rehabilitation collections on defaulted loans was $0.4 million.
|
|
(d)
|
The decrease in software services revenue in 2010 compared to the same period in 2009 is the result of a reduction in the number of projects for existing external customers and the loss of external customers due to legislative developments in the student loan industry throughout 2009 and 2010.
|
|
(e)
|
Intersegment origination and servicing revenue increased in 2010 compared to the same period in 2009 due to an increase in the Company’s disbursement volume and composition of the Company’s loan portfolio, respectively.
|
42
Operating expenses. Excluding restructure charges and collection fees paid related to rehabilitation revenue, operating expenses decreased $1.0 million (2.5%) for the three months ended March 31, 2010 compared to the same periods in 2009. These decreases were a result of cost savings from the Company’s restructuring plans.
TUITION PAYMENT PROCESSING AND CAMPUS COMMERCE OPERATING SEGMENT – RESULTS OF OPERATIONS
The Tuition Payment Processing and Campus Commerce operating segment provides products and services to help institutions and education seeking families manage the payment of education costs during the pre-college and college stages of the education life cycle. The Company provides actively managed tuition payment solutions, online payment processing, detailed information reporting, financial needs analysis, and data integration services to K-12 and higher educational institutions, families, and students. In addition, the Company provides customer-focused electronic transactions, information sharing, and account and bill presentment to colleges and universities.
This segment of the Company’s business is subject to seasonal fluctuations which correspond, or are related to, the traditional school year. Tuition management revenue is recognized over the course of the academic term, but the peak operational activities take place in summer and early fall. Revenue associated with providing electronic commerce subscription services is recognized over the service period with the highest revenue months being July through September and December and January. The Company’s operating expenses do not follow the seasonality of the revenues. This is primarily due to fixed year-round personnel costs and seasonal marketing costs.
Segment Summary of Results
Significant items for the three months ended March 31, 2010 compared to the same period in 2009 include:
|
·
|
A $1.8 million (12%) increase in revenue as a result of an increase in the number of managed tuition payment plans and campus commerce transactions processed
|
|
·
|
An insignificant change in operating expenses, despite the growth in revenue, due to the Company’s continued focus on managing costs and gaining efficiencies
|
Three months ended March 31, 2010 compared to the three months ended March 31, 2009
|
Three months ended March 31,
|
|||||||||||||||
|
Change
|
|||||||||||||||
|
2010
|
2009
|
$ | % | ||||||||||||
|
Net interest income
|
$ | 8 | 30 | (22 | ) | (73.3 | ) % | ||||||||
|
Tuition payment processing and campus commerce revenue
|
17,382 | 15,538 | 1,844 | 11.9 | |||||||||||
|
Intersegment revenue
|
65 | 57 | 8 | 14.0 | |||||||||||
|
Total other income
|
17,447 | 15,595 | 1,852 | 11.9 | |||||||||||
|
Salaries and benefits
|
6,618 | 6,545 | 73 | 1.1 | |||||||||||
|
Other expenses
|
2,441 | 2,408 | 33 | 1.4 | |||||||||||
|
Intersegment expenses
|
839 | 623 | 216 | 34.7 | |||||||||||
|
Total operating expenses
|
9,898 | 9,576 | 322 | 3.4 | |||||||||||
|
"Base net income" before income taxes and corporate overhead allocation
|
7,557 | 6,049 | 1,508 | 24.9 | |||||||||||
|
Corporate overhead allocation
|
(396 | ) | — | (396 | ) | (100.0 | ) | ||||||||
|
"Base net income" before income taxes
|
7,161 | 6,049 | 1,112 | 18.4 | |||||||||||
|
Income tax expense
|
(2,722 | ) | (2,298 | ) | (424 | ) | 18.5 | ||||||||
|
"Base net income"
|
$ | 4,439 | 3,751 | 688 | 18.3 | % | |||||||||
|
Before Tax Operating Margin (a)
|
43.3 | % | 38.7 | % | |||||||||||
(a) Excludes corporate overhead allocation.
Tuition payment processing and campus commerce revenue. Tuition payment processing and campus commerce revenue increased in 2010 compared to the same period in 2009 as a result of an increase in the number of managed tuition payment plans as well as an increase in campus commerce transactions processed.
Operating expenses. Operating expenses remained relatively flat for the three months ended March 31, 2010 compared to 2009 as a result of a continued focus on managing costs and gaining efficiencies.
43
ENROLLMENT SERVICES OPERATING SEGMENT – RESULTS OF OPERATIONS
The Enrollment Services segment offers products and services that are focused on helping colleges recruit and retain students (interactive and list marketing services) and helping students plan and prepare for life after high school (publishing and editing services and resource centers). Interactive marketing products and services include vendor lead management services, admissions lead generation, pay per click marketing management, email marketing, and admissions consulting. Publishing and editing services include test preparation study guides and essay and resume editing services. Resource centers and list marketing products and services include online courses and related services and list marketing services.
Segment Summary of Results
Significant items for the three months ended March 31, 2010 compared to the same period in 2009 include:
|
·
|
A $4.5 million (16%) increase in revenue as a result of an increase in interactive marketing services volume
|
|
·
|
A decrease in gross profit margin for interactive marketing services due to more competitive pricing
|
|
·
|
A $1.7 million increase in operating expenses due to accelerating the amortization of student list costs in the first quarter of 2010
|
Three months ended March 31, 2010 compared to the three months ended March 31, 2009
|
Three months ended March 31,
|
||||||||||||||||
|
Change
|
||||||||||||||||
|
2010
|
2009
|
$ | % | |||||||||||||
|
Enrollment services revenue
|
$ | 33,271 | 28,771 | 4,500 | 15.6 | |||||||||||
|
Intersegment revenue
|
17 | — | 17 | 100.0 | ||||||||||||
|
Total other income
|
33,288 | 28,771 | 4,517 | 15.7 | ||||||||||||
|
Salaries and benefits
|
6,071 | 6,095 | (24 | ) | (0.4 | ) | ||||||||||
|
Cost to provide enrollment services
|
22,025 | 17,793 | 4,232 | 23.8 | ||||||||||||
|
Other expenses
|
5,062 | 3,295 | 1,767 | 53.6 | ||||||||||||
|
Intersegment expenses
|
450 | 546 | (96 | ) | (17.6 | ) | ||||||||||
|
Total operating expenses
|
33,608 | 27,729 | 5,879 | 21.2 | ||||||||||||
|
"Base net (loss) income" before income taxes and corporate overhead allocation
|
(320 | ) | 1,042 | (1,362 | ) | (130.7 | ) | |||||||||
|
Corporate overhead allocation
|
(396 | ) | — | (396 | ) | (100.0 | ) | |||||||||
|
"Base net (loss) income" before income taxes
|
(716 | ) | 1,042 | (1,758 | ) | (168.7 | ) | |||||||||
|
Income tax benefit (expense)
|
273 | (396 | ) | 669 | (168.9 | ) | ||||||||||
|
"Base net (loss) income"
|
$ | (443 | ) | 646 | (1,089 | ) | (168.6 | ) % | ||||||||
|
Before Tax Operating Margin (a)
|
(1.0 | %) | 3.6 | % | ||||||||||||
|
Before Tax Operating Margin (b)
|
5.9 | % | 5.7 | % | ||||||||||||
(a) Excludes corporate overhead allocation.
(b) Excludes corporate overhead allocation and list cost amortization expense.
44
Enrollment services revenue, cost to provide enrollment services, and gross profit.
|
Three months ended March 31, 2010
|
||||||||||||||||||||
|
Publishing
|
Resource
|
|||||||||||||||||||
|
and
|
centers
|
|||||||||||||||||||
|
Interactive
|
editing
|
and list
|
||||||||||||||||||
|
marketing (a)
|
services (b)
|
Subtotal
|
marketing (c)
|
Total
|
||||||||||||||||
|
Enrollment services revenue
|
$ | 27,767 | 2,394 | 30,161 | 3,110 | 33,271 | ||||||||||||||
|
Cost to provide enrollment services
|
21,198 | 827 | 22,025 | |||||||||||||||||
|
Gross profit
|
$ | 6,569 | 1,567 | 8,136 | ||||||||||||||||
|
Gross profit %
|
23.7 | % | 65.5 | % | 27.0 | % | ||||||||||||||
|
Three months ended March 31, 2009
|
||||||||||||||||||||
|
Publishing
|
Resource
|
|||||||||||||||||||
|
and
|
centers
|
|||||||||||||||||||
|
Interactive
|
editing
|
and list
|
||||||||||||||||||
|
marketing (a)
|
services (b)
|
Subtotal
|
marketing (c)
|
Total
|
||||||||||||||||
|
Enrollment services revenue
|
$ | 22,913 | 2,880 | 25,793 | 2,978 | 28,771 | ||||||||||||||
|
Cost to provide enrollment services
|
16,614 | 1,179 | 17,793 | |||||||||||||||||
|
Gross profit
|
$ | 6,299 | 1,701 | 8,000 | ||||||||||||||||
|
Gross profit %
|
27.5 | % | 59.1 | % | 31.0 | % | ||||||||||||||
|
(a)
|
Interactive marketing revenue increased $4.9 million (21.2%) for the three months ended March 31, 2010 compared to the same period in 2009 as a result of an increase in interactive marketing services volume. The gross profit margin for interactive marketing services decreased due to more competitive pricing.
|
|
(b)
|
Publishing and editing services revenue decreased $0.5 million (16.9%) for the three months ended March 31, 2010 compared to 2009 due to competition related to online delivery of similar products. The gross profit margin for publishing and editing services increased as a result of a shift in the mix of products sold.
|
|
(c)
|
Resource center and list marketing revenue increased $0.1 million (4.4%) for the three months ended March 31, 2010 compared to 2009. Resource center and list marketing revenue grew modestly due to slowly improving general economic conditions.
|
Other expenses. Other expenses for the three months ended March 31, 2010 and 2009 includes $2.3 million and $0.6 million, respectively, of amortization expense related to student list costs. During the first quarter of 2010, the Company began accelerating the amortization of student list costs over a shorter period of time to better reflect the pattern in which the economic benefit of this asset is used to generate revenue.
Operating expenses. Excluding the cost to provide enrollment services and list amortization expenses, operating expenses decreased $0.7 million (6.6%) for the three months ended March 31, 2010 compared to the same period in 2009 as a result of continued focus on cost efficiencies.
45
ASSET GENERATION AND MANAGEMENT OPERATING SEGMENT – RESULTS OF OPERATIONS
The Asset Generation and Management Operating Segment includes the origination, acquisition, management, and ownership of the Company’s student loan assets, which has historically been the Company’s largest product and service offering. The Company generates a substantial portion of its earnings from the spread, referred to as the Company’s student loan spread, between the yield it receives on its student loan portfolio and the costs associated with originating, acquiring, and financing its portfolio. The Company generates student loan assets through direct origination or through acquisitions. The student loan assets are held in a series of education lending subsidiaries designed specifically for this purpose. In addition to the student loan portfolio, all costs and activity associated with the generation of assets, funding of those assets, and maintenance of the debt transactions are included in this segment.
Segment Summary of Results
Significant items for the three months ended March 31, 2010 compared to the same period in 2009 include:
|
·
|
An increase in student loan spread due to the tightening of the CP/LIBOR spread and an increase in fixed rate floor income
|
|
·
|
A gain of $10.2 million from the purchase of $274.3 million of the Company’s asset-backed securities
|
Student Loan Portfolio
The tables below outline the components of the Company’s student loan portfolio:
|
As of March 31, 2010
|
||||||||||||||||||||
|
Originated
|
Originated
|
2009-2010 | ||||||||||||||||||
|
prior to
|
on or after
|
Academic Year
|
||||||||||||||||||
|
Total
|
10/1/07
|
10/1/07 (a)
|
Loans (b)
|
|||||||||||||||||
|
Federally insured:
|
||||||||||||||||||||
|
Stafford
|
$ | 7,568,223 | 30.5 | % | $ | 6,105,355 | 532,957 | 929,911 | ||||||||||||
|
PLUS/SLS
|
514,293 | 2.1 | % | 361,402 | 53,895 | 98,996 | ||||||||||||||
|
Consolidation
|
16,329,746 | 65.7 | % | 16,027,438 | 302,308 | — | ||||||||||||||
|
Total federally insured
|
24,412,262 | 98.3 | % | $ | 22,494,195 | 889,160 | 1,028,907 | |||||||||||||
| 100.0 | % | 92.2 | % | 3.6 | % | 4.2 | % | |||||||||||||
|
Non-federally insured
|
138,890 | 0.6 | % | |||||||||||||||||
|
Total student loans receivable (gross)
|
24,551,152 | 98.9 | % | |||||||||||||||||
|
Unamortized premiums and deferred
|
||||||||||||||||||||
|
origination costs
|
333,741 | 1.3 | % | |||||||||||||||||
|
Allowance for loan losses:
|
||||||||||||||||||||
|
Federally insured
|
(30,744 | ) | (0.1 | %) | ||||||||||||||||
|
Non-federally insured
|
(18,656 | ) | (0.1 | %) | ||||||||||||||||
|
Total student loans receivable (net)
|
$ | 24,835,493 | 100.0 | % | ||||||||||||||||
46
|
As of December 31, 2009
|
||||||||||||||||||||
|
Originated
|
Originated
|
2009-2010 | ||||||||||||||||||
|
prior to
|
on or after
|
Academic Year
|
||||||||||||||||||
|
Total
|
10/1/07
|
10/1/07 (a)
|
Loans (b)
|
|||||||||||||||||
|
Federally insured:
|
||||||||||||||||||||
|
Stafford
|
$ | 7,145,966 | 29.9 | % | $ | 6,237,445 | 494,611 | 413,910 | ||||||||||||
|
PLUS/SLS
|
474,826 | 2.0 | % | 372,434 | 52,122 | 50,270 | ||||||||||||||
|
Consolidation
|
15,851,761 | 66.3 | % | 15,665,937 | 185,824 | — | ||||||||||||||
|
Total federally insured
|
23,472,553 | 98.2 | % | $ | 22,275,816 | 732,557 | 464,180 | |||||||||||||
| 100.0 | % | 94.9 | % | 3.1 | % | 2.0 | % | |||||||||||||
|
Non-federally insured
|
163,321 | 0.6 | % | |||||||||||||||||
|
Total student loans receivable (gross)
|
23,635,874 | 98.8 | % | |||||||||||||||||
|
Unamortized premiums and deferred
|
||||||||||||||||||||
|
origination costs
|
341,970 | 1.4 | % | |||||||||||||||||
|
Allowance for loan losses:
|
||||||||||||||||||||
|
Federally insured
|
(30,102 | ) | (0.1 | %) | ||||||||||||||||
|
Non-federally insured
|
(20,785 | ) | (0.1 | %) | ||||||||||||||||
|
Total student loans receivable (net)
|
$ | 23,926,957 | 100.0 | % | ||||||||||||||||
|
(a)
|
Federally insured student loans originated on or after October 1, 2007 earn a reduced annual yield as a result of the enactment of the College Cost Reduction Act in September 2007.
|
|
(b)
|
2009-2010 Academic Year loans are eligible to be participated and sold to the Department under the Department’s Participation and Purchase Programs.
|
Origination and Acquisition
The Company has historically originated and acquired loans through various methods and channels including: (i) direct-to-consumer channel (in which the Company originates student loans directly with student and parent borrowers), (ii) campus based origination channels, and (iii) spot purchases.
The Company will originate or acquire loans through its campus based channel either directly under one of its brand names or through other originating lenders. In addition to its brands, the Company acquires student loans from lenders to whom the Company provides marketing and/or origination services established through various contracts. Branding partners are lenders for which the Company acts as a marketing agent in specified geographic areas. A forward flow lender is one for whom the Company provides origination services but provides no marketing services or whom simply agrees to sell loans to the Company under forward sale commitments.
The following table sets forth the activity of loans originated or acquired through each of the Company’s channels:
|
Beginning balance
|
$ | 23,635,874 | 25,061,049 | |||||
|
Direct channel - Stafford/PLUS loan originations
|
587,483 | 541,592 | ||||||
|
Branding partner channel
|
285,119 | 412,313 | ||||||
|
Forward flow channel
|
92,218 | — | ||||||
|
Other channels (a)
|
585,921 | 13,805 | ||||||
|
Total channel acquisitions
|
1,550,741 | 967,710 | ||||||
|
Repayments, claims, capitalized interest, participations, and other
|
(491,553 | ) | (628,927 | ) | ||||
|
Consolidation loans lost to external parties
|
(123,878 | ) | (105,518 | ) | ||||
|
Loans sold
|
(20,032 | ) | (20,141 | ) | ||||
|
Ending balance
|
$ | 24,551,152 | 25,274,173 |
(a) Includes the purchase of $535.9 million in loans from Union Bank in 2010.
As discussed previously, as a result of the Reconciliation Act of 2010, the Company will no longer originate first disbursements on any FFELP loans after June 30, 2010. If a first disbursement has been made prior to July 1, 2010, subsequent disbursements of that loan may still be made under the FFELP.
47
Due to the legislative changes in the student loan industry, the Company believes there will be opportunities to purchase FFELP loan portfolios on behalf of current FFELP participants looking to modify their involvement in FFELP and/or exit the market. For example, since April 1, 2010 the Company has purchased approximately $2 billion of FFELP student loans from various third-parties.
Activity in the Allowance for Loan Losses
The provision for loan losses represents the periodic expense of maintaining an allowance sufficient to absorb losses, net of recoveries, inherent in the portfolio of student loans. An analysis of the Company’s allowance for loan losses is presented in the following table:
|
Three months ended March 31,
|
||||||||
|
2010
|
2009
|
|||||||
|
Balance at beginning of period
|
$ | 50,887 | 50,922 | |||||
|
Provision for loan losses:
|
||||||||
|
Federally insured loans
|
4,000 | 5,500 | ||||||
|
Non-federally insured loans
|
1,000 | 2,000 | ||||||
|
Total provision for loan losses
|
5,000 | 7,500 | ||||||
|
Charge-offs, net of recoveries:
|
||||||||
|
Federally insured loans
|
(4,068 | ) | (3,247 | ) | ||||
|
Non-federally insured loans
|
(1,129 | ) | (658 | ) | ||||
|
Net charge-offs
|
(5,197 | ) | (3,905 | ) | ||||
|
Purchase (sale) of federally insured loans
|
710 | (520 | ) | |||||
|
Sale of non-federally insured loans
|
(2,000 | ) | (5,500 | ) | ||||
|
Balance at end of period
|
$ | 49,400 | 48,497 | |||||
|
Allocation of the allowance for loan losses:
|
||||||||
|
Federally insured loans
|
$ | 30,744 | 27,310 | |||||
|
Non-federally insured loans
|
18,656 | 21,187 | ||||||
|
Total allowance for loan losses
|
$ | 49,400 | 48,497 | |||||
|
Allowance for federally insured loans as a percentage such loans
|
0.13 | % | 0.11 | % | ||||
|
Allowance for non-federally insured loans as a percentage such loans
|
13.43 | % | 9.70 | % | ||||
As of March 31, 2010, the Company has participated $115.5 million of non-federally insured loans to third parties, including $20.0 million that were participated during the three months ended March 31, 2010. Loans participated under these agreements have been accounted for by the Company as loan sales. Accordingly, the participation interests sold are not included on the Company’s consolidated balance sheet.
Per the terms of the servicing agreements, the Company’s servicing operations are obligated to repurchase loans subject to the participation interests in the event such loans become 60 or 90 days delinquent. The activity in the accrual account related to this repurchase obligation, which is included in “other liabilities” in the Company’s consolidated balance sheet, is detailed below.
|
Three months ended March 31,
|
||||||||
|
2010
|
2009
|
|||||||
|
Beginning balance
|
$ | 10,600 | — | |||||
|
Transfer from allowance for loan losses
|
2,000 | 5,500 | ||||||
|
Ending balance
|
$ | 12,600 | 5,500 | |||||
48
Delinquencies have the potential to adversely impact the Company’s earnings through increased servicing and collection costs and account charge-offs. The table below shows the Company’s student loan delinquency amounts:
|
As of March 31, 2010
|
As of December 31, 2009
|
|||||||||||||||
|
Dollars
|
Percent
|
Dollars
|
Percent
|
|||||||||||||
|
Federally Insured Loans:
|
||||||||||||||||
|
Loans in-school/grace/deferment (a)
|
$ | 6,159,440 | $ | 5,783,648 | ||||||||||||
|
Loans in forebearance (b)
|
2,646,435 | 2,495,672 | ||||||||||||||
|
Loans in repayment status:
|
||||||||||||||||
|
Loans current
|
13,592,902 | 87.2 | % | 13,038,428 | 85.8 | % | ||||||||||
|
Loans delinquent 31-60 days (c)
|
569,612 | 3.6 | 691,232 | 4.5 | ||||||||||||
|
Loans delinquent 61-90 days (c)
|
348,448 | 2.2 | 314,265 | 2.1 | ||||||||||||
|
Loans delinquent 91 days or greater (d)
|
1,095,425 | 7.0 | 1,149,308 | 7.6 | ||||||||||||
|
Total loans in repayment
|
15,606,387 | 100.0 | % | 15,193,233 | 100.0 | % | ||||||||||
|
Total federally insured loans
|
$ | 24,412,262 | $ | 23,472,553 | ||||||||||||
|
Non-Federally Insured Loans:
|
||||||||||||||||
|
Loans in-school/grace/deferment (a)
|
$ | 27,890 | $ | 34,815 | ||||||||||||
|
Loans in forebearance (b)
|
1,280 | 1,919 | ||||||||||||||
|
Loans in repayment status:
|
||||||||||||||||
|
Loans current
|
102,381 | 93.3 | % | 118,761 | 93.8 | % | ||||||||||
|
Loans delinquent 31-60 days (c)
|
2,138 | 1.9 | 3,023 | 2.4 | ||||||||||||
|
Loans delinquent 61-90 days (c)
|
1,931 | 1.8 | 1,559 | 1.2 | ||||||||||||
|
Loans delinquent 91 days or greater (d)
|
3,270 | 3.0 | 3,244 | 2.6 | ||||||||||||
|
Total loans in repayment
|
109,720 | 100.0 | % | 126,587 | 100.0 | % | ||||||||||
|
Total non-federally insured loans
|
$ | 138,890 | $ | 163,321 | ||||||||||||
|
(a)
|
Loans for borrowers who still may be attending school or engaging in other permitted educational activities and are not yet required to make payments on the loans, e.g., residency periods for medical students or a grace period for bar exam preparation for law students.
|
|
(b)
|
Loans for borrowers who have temporarily ceased making full payments due to hardship or other factors, according to a schedule approved by the servicer consistent with the established loan program servicing procedures and policies.
|
|
(c)
|
The period of delinquency is based on the number of days scheduled payments are contractually past due and relate to repayment loans, that is, receivables not charged off, and not in school, grace, deferment, or forbearance.
|
|
(d)
|
Loans delinquent 91 days or greater include loans in claim status, which are loans that have gone into default and have been submitted to the guaranty agency for FFELP loans, or, if applicable, the insurer for non-federally insured loans, to process the claim for payment.
|
49
Student Loan Spread Analysis
The following table analyzes the student loan spread on the Company’s portfolio of student loans and represents the spread on assets earned in conjunction with the liabilities and derivative instruments used to fund the assets:
|
Three months ended March 31,
|
||||||||
|
2010
|
2009
|
|||||||
|
Variable student loan yield
|
2.56 | % | 3.26 | % | ||||
|
Consolidation rebate fees
|
(0.71 | ) | (0.71 | ) | ||||
|
Premium and deferred origination costs amortization
|
(0.27 | ) | (0.30 | ) | ||||
|
Variable student loan net yield
|
1.58 | 2.25 | ||||||
|
Student loan cost of funds - interest expense
|
(0.75 | ) | (2.16 | ) | ||||
|
Student loan cost of funds - derivative settlements
|
0.03 | 0.38 | ||||||
|
Variable student loan spread
|
0.86 | 0.47 | ||||||
|
Variable rate floor income,
|
||||||||
|
net of settlements on derivatives
|
— | (0.02 | ) | |||||
|
Fixed rate floor income,
|
||||||||
|
net of settlements on derivatives
|
0.59 | 0.49 | ||||||
|
Core student loan spread
|
1.45 | % | 0.94 | % | ||||
|
Average balance of student loans
|
$ | 24,080,805 | 25,265,903 | |||||
|
Average balance of debt outstanding
|
24,197,221 | 25,764,285 | ||||||
The Company’s variable student loan spread has increased primarily due to the tightening of the CP/LIBOR spread. Historically, the movement of the various interest rate indices received on the Company’s student loan assets, primarily three-month commercial paper, and paid on the debt to fund such loans, primarily LIBOR, was highly correlated. The short term movement of these indices was dislocated beginning in August 2007 which negatively impacted the Company’s net interest income during the first quarter of 2009. Beginning in the fourth quarter of 2009, the CP/LIBOR spread began to tighten to more historical levels, which has had a positive impact on spread. The CP/LIBOR spread during the first quarter of 2009 was 52 basis points compared to 5 basis points for the same period in 2010.
Core student loan spread has also increased due to an increase in fixed rate floor income. The Company has a portfolio of student loans that are earning interest at a fixed borrower rate which exceeds the statutorily defined variable lender rate creating fixed rate floor income. Due to the decrease in the short-term interest rates, the Company earned fixed rate floor income of $35.3 million during the first quarter of 2010 compared to $30.3 million in 2009.
Three months ended March 31, 2010 compared to the three months ended March 31, 2009
|
Three months ended March 31,
|
||||||||||||||||
|
Change
|
||||||||||||||||
|
2010
|
2009
|
$ | % | |||||||||||||
|
Net interest income after provision
|
||||||||||||||||
|
for loan losses
|
$ | 84,606 | 26,493 | 58,113 | 219.4 | % | ||||||||||
|
Other income
|
4,768 | 4,651 | 117 | 2.5 | ||||||||||||
|
Gain (loss) on sale of loans and debt repurchases, net
|
10,177 | (206 | ) | 10,383 | (5,040.3 | ) | ||||||||||
|
Derivative settlements, net
|
(2,423 | ) | 24,358 | (26,781 | ) | (109.9 | ) | |||||||||
|
Total other income
|
12,522 | 28,803 | (16,281 | ) | (56.5 | ) | ||||||||||
|
Salaries and benefits
|
1,358 | 1,775 | (417 | ) | (23.5 | ) | ||||||||||
|
Other expenses
|
4,221 | 4,959 | (738 | ) | (14.9 | ) | ||||||||||
|
Intersegment expenses
|
20,825 | 17,876 | 2,949 | 16.5 | ||||||||||||
|
Total operating expenses
|
26,404 | 24,610 | 1,794 | 7.3 | ||||||||||||
|
"Base net income" before income taxes and corporate overhead allocation
|
70,724 | 30,686 | 40,038 | 130.5 | ||||||||||||
|
Corporate overhead allocation
|
(1,981 | ) | — | (1,981 | ) | (100.0 | ) | |||||||||
|
"Base net income" before income taxes
|
68,743 | 30,686 | 38,057 | 124.0 | ||||||||||||
|
Income tax expense
|
(26,123 | ) | (11,661 | ) | (14,462 | ) | 124.0 | |||||||||
|
"Base net income"
|
$ | 42,620 | 19,025 | 23,595 | 124.0 | % | ||||||||||
50
Net interest income after provision for loan losses (net of settlements on derivatives).
|
Three months ended March 31,
|
Change
|
|||||||||||||||
|
2010
|
2009
|
Dollars
|
Percent
|
|||||||||||||
|
Student loan interest, net of settlements
|
||||||||||||||||
|
on derivatives
|
$ | 155,801 | 226,661 | (70,860 | ) | (31.3 | ) % | |||||||||
|
Consolidation rebate fees
|
(42,449 | ) | (44,478 | ) | 2,029 | 4.6 | ||||||||||
|
Amortization of loan premiums and
|
||||||||||||||||
|
deferred origination costs
|
(16,080 | ) | (18,651 | ) | 2,571 | 13.8 | ||||||||||
|
Interest on bonds and notes payable
|
(44,742 | ) | (138,034 | ) | 93,292 | (67.6 | ) | |||||||||
|
Student loan interest margin, net of
|
||||||||||||||||
|
settlements on derivatives
|
52,530 | 25,498 | 27,032 | (106.0 | ) | |||||||||||
|
Fixed rate floor income, net of settlements
|
||||||||||||||||
|
on derivatives
|
35,271 | 30,285 | 4,986 | 16.5 | ||||||||||||
|
Investment interest
|
295 | 3,128 | (2,833 | ) | (90.6 | ) | ||||||||||
|
Intercompany interest
|
(913 | ) | (560 | ) | (353 | ) | 63.0 | |||||||||
|
Provision for loan losses
|
(5,000 | ) | (7,500 | ) | 2,500 | (33.3 | ) | |||||||||
|
Net interest income after provision for loan
|
||||||||||||||||
|
losses (net of settlements on derivatives)
|
$ | 82,183 | 50,851 | 31,332 | 61.6 | % | ||||||||||
`
|
·
|
Student loan interest, net of settlements on derivatives, decreased $70.9 million as a result of a decrease in the average student loan portfolio of $1.2 billion (4.7%) and a decrease in the yield earned on student loans due to a decrease in interest rates for the three months ended March 31, 2010 compared to 2009.
|
|
·
|
Consolidation rebate fees decreased due to the $0.4 billion (2.6%) decrease in the average consolidation portfolio.
|
|
·
|
The amortization of loan premiums and deferred origination costs decreased as a result of reduced costs to acquire or originate loans.
|
|
·
|
Interest expense decreased as a result of a decrease in interest rates on the Company’s variable rate debt which lowered the Company’s cost of funds (excluding net derivative settlements) to 0.75% for the three months ended March 31, 2010 compared to 2.16% for the same period a year ago. In addition, average debt decreased by $1.6 billion (6.1%) for the three months ended March 31, 2010 compared to 2009.
|
|
·
|
The Company has a portfolio of student loans that are earning interest at a fixed borrower rate which exceeds the statutorily defined variable lender rate creating fixed rate floor income. Due to lower interest rates in the three months ended March 31, 2010 compared to the same period in 2009, the Company received additional fixed rate floor income on a portion of its student loan portfolio.
|
|
·
|
Investment income decreased as a result of lower interest rates and a decrease in average cash held for the three months ended March 31, 2010 compared to 2009.
|
|
·
|
The provision for loan losses decreased for the three months ended March 31, 2010 compared to 2009 due to the aging of the Company’s student loan portfolio and improved credit performance.
|
|
·
|
The Company maintains an overall risk management strategy that incorporates the use of derivative instruments to reduce the economic effect of interest rate volatility. Management has structured the majority of the Company’s derivative transactions with the intent that each is economically effective; however, the Company’s derivative instruments do not qualify for hedge accounting. Derivative settlements for each applicable period should be evaluated with the Company’s net interest income.
|
Gain (loss) on sale of loans and debt repurchases, net. During the three months ended March 31, 2010, the Company purchased $274.3 million of its asset-backed securities resulting in gains of $10.2 million. During the three months ended March 31, 2009, the Company sold $20.0 million (par value) of federally insured student loans to Union Bank, an entity under common control, resulting in the recognition of a loss of $0.2 million.
Salaries and benefits and other expenses. “Salaries and benefits” and “other expenses” decreased for the three months ended March 31, 2010 compared to the same period in 2009 as a result of continued focus by the Company on managing costs and gaining efficiencies and continued benefits from restructuring activities.
51
Intersegment expenses. Intersegment expenses increased for the three months ended March 31, 2010 compared to the same period in 2009 due to additional fees paid to the Student Loan and Guaranty Servicing operating segment. These additional fees relate to an increase in origination fees due to an increase in disbursement volume and an increase in servicing fees.
LIQUIDITY AND CAPITAL RESOURCES
The Company’s fee generating businesses are non-capital intensive and all produce positive operating cash flows. As such, a minimal amount of debt and equity capital is allocated to the fee-based segments and any liquidity or capital needs are satisfied using cash flow from operations. Therefore, the Liquidity and Capital Resources discussion is concentrated on the Company’s liquidity and capital needs to meet existing debt obligations, primarily unsecured corporate debt and debt facilities in the Asset Generation and Management operating segment, and fund new FFELP student loan originations and acquisitions from third parties.
The Company may issue equity and debt securities in the future in order to improve capital, increase liquidity, refinance upcoming maturities, or provide for general corporate purposes. Moreover, the Company may from time-to-time repurchase certain amounts of its outstanding secured and unsecured debt securities, including debt securities which the Company may issue in the future, for cash and/or through exchanges for other securities. Such repurchases or exchanges may be made in open market transactions, privately negotiated transactions, or otherwise. Any such repurchases or exchanges will depend on prevailing market conditions, the Company’s liquidity requirements, contractual restrictions, compliance with securities laws, and other factors. The amounts involved in any such transactions may be material.
The Company has historically utilized operating cash flow, secured financing transactions (which include warehouse facilities and asset-backed securitizations), operating lines of credit, and other borrowing arrangements to fund its Asset Generation and Management operations and student loan acquisitions. In addition, the Company has used operating cash flow, borrowings on its unsecured line of credit, and unsecured debt offerings to fund corporate activities, business acquisitions, and repurchases of common stock. The Company has also used its common stock to partially fund certain business acquisitions. The Company has a universal shelf registration statement with the SEC which allows the Company to sell up to $825.0 million of securities that may consist of common stock, preferred stock, unsecured debt securities, warrants, stock purchase contracts, and stock purchase units. The terms of any securities are established at the time of the offering.
The following table summarizes the Company’s debt obligations as of March 31, 2010.
|
Carrying
|
Interest rate
|
Final | |||||||
|
amount
|
range
|
maturity
|
|||||||
|
Asset Generation and Management:
|
|||||||||
|
Bonds and notes issued in asset-backed securitizations
|
$ | 22,274,664 | 0.24% - 6.90 | % |
05/01/11 - 11/25/43
|
||||
|
Department of Education Participation
|
1,028,402 | 0.71 | % |
09/30/10
|
|||||
|
FFELP warehouse facility
|
80,051 | 0.22% - 0.33 | % |
08/03/12
|
|||||
|
Department of Education Conduit
|
1,384,819 | 0.23 | % |
05/08/14
|
|||||
|
Other borrowings
|
31,780 | 0.23% - 5.10 | % |
11/14/10 - 11/01/15
|
|||||
| 24,799,716 | |||||||||
|
Unsecured Corporate Debt:
|
|||||||||
|
Senior notes
|
66,716 | 5.125 | % |
06/01/10
|
|||||
|
Unsecured line of credit
|
691,500 | 0.73 | % |
05/08/12
|
|||||
|
Junior Subordinated Hybrid securities
|
198,250 | 7.40 | % |
09/15/61
|
|||||
| 956,466 | |||||||||
| $ | 25,756,182 | ||||||||
Liquidity Needs
The Company has three primary liquidity needs:
· Satisfy unsecured debt obligations, specifically its unsecured senior notes and unsecured line of credit
· Satisfy debt obligations secured by student loan assets and related collateral
· Fund 2009-2010 academic year FFELP Stafford and PLUS loan originations and FFELP student loan acquisitions from third parties
52
Liquidity Needs and Sources of Liquidity Available to Satisfy Unsecured Debt Obligations
Excluding the Junior Subordinated Hybrid securities (which have a maturity in 2061), the Company has the following unsecured debt obligations outstanding:
|
As of
May 7, 2010
|
||||
|
Unsecured Corporate Debt:
|
||||
|
Senior Notes - due June 2010
|
$ | 66,716 | ||
|
Unsecured line of credit - due May 2012
|
691,500 | |||
| $ | 758,216 | |||
Sources of liquidity currently available
The following table details the Company’s sources of liquidity currently available:
|
As of
May 7, 2010
|
||||
|
Sources of primary liquidity:
|
||||
|
Cash and cash equivalents
|
$ | 440,000 | ||
|
Unencumbered FFELP student loan assets
|
4,000 | |||
|
Unencumbered private student loan assets
|
108,000 | |||
|
Asset-backed security investments - Class B subordinated notes (a)
|
77,000 | |||
|
Asset-backed security investments (b)
|
107,000 | |||
|
Total sources of primary liquidity
|
$ | 736,000 | ||
|
(a)
|
As part of the Company’s issuance of asset-backed securitizations in March 2008 and May 2008, due to credit market conditions when these notes were issued, the Company purchased the Class B subordinated notes of $36 million (par value) and $41 million (par value), respectively. These notes are not included on the Company’s consolidated balance sheet. If the credit market conditions continue to improve, the Company anticipates selling these notes to third parties. Upon a sale to third parties, the Company would obtain cash proceeds equal to the market value of the notes on the date of such sale. The amount included in the table above is the par value of these subordinated notes and may not represent market value upon sale of the notes.
|
|
(b)
|
During 2009 and 2010, the Company purchased $622.4 million of its own asset-backed securities (bonds and notes payable). For accounting purposes, these notes were effectively retired and are not included on the Company’s consolidated balance sheet. However, $107 million of these securities are legally outstanding at the trust level and the Company could sell these notes to third parties or redeem the notes at par as cash is generated by the trust estate. Upon a sale to third parties, the Company would obtain cash proceeds equal to the market value of the notes on the date of such sale. The amount included in the table above is the par value of these notes and may not represent market value upon sale of the notes.
|
Cash generated from operations
In addition to current sources of liquidity, the Company plans to use cash generated from operations to satisfy its unsecured debt obligations. The Company has historically generated positive cash flow from operations. For the three months ended March 31, 2010 and year ended December 31, 2009, the Company had net cash flow from operating activities of $55.7 million (excluding $52.9 million in cash used to purchase U.S. Treasury securities classified as a trading investment) and $324.7 million, respectively.
Liquidity Needs and Sources of Liquidity Available to Satisfy Debt Obligations Secured by Student Loan Assets and Related Collateral
The Company had the following debt obligations outstanding that are secured by student loan assets and related collateral.
|
As of March 31, 2010
|
|||||
|
Carrying
|
Final | ||||
|
amount
|
maturity
|
||||
|
Asset Generation and Management:
|
|||||
|
Bonds and notes issued in asset-backed securitizations
|
$ | 22,274,664 |
05/01/11 - 11/25/42
|
||
|
Department of Education Participation
|
1,028,402 |
09/30/10
|
|||
|
FFELP warehouse facility
|
80,051 |
08/03/12
|
|||
|
Department of Education Conduit
|
1,384,819 |
05/08/14
|
|||
|
Other borrowings
|
31,780 |
11/14/10 and 11/01/15
|
|||
| $ | 24,799,716 | ||||
53
Bonds and notes issued in asset-backed securitizations
The majority of the Company’s portfolio of student loans is funded in asset backed securitizations that are structured to substantially match the maturity of the funded assets and there are minimal liquidity issues related to these facilities. In addition, due to the difference between the yield the Company receives on the loans and cost of financing within these transactions, the Company has created a portfolio that will generate earnings and significant cash flow over the life of these transactions.
As of March 31, 2010, based on cash flow models developed to reflect management’s current estimate of, among other factors, prepayments, defaults, deferment, forbearance, and interest rates, the Company currently expects future undiscounted cash flows from its portfolio to be approximately $1.56 billion as detailed below. This amount does not include cash flows that the Company expects to receive related to loans funded through the Department of Education’s Conduit and Loan Participation and Purchase Programs and other warehouse facilities or loans originated and/or acquired subsequent to March 31, 2010. The Company expects the future cash flows shown below would correspond to earnings when excluding the amortization of loan premiums and deferred origination costs, potential derivative activity used by the Company to hedge the portfolio, and other portfolio management and administrative costs. Because the Company does not use gain-on-sale accounting when issuing asset-backed securitizations, the future earnings of these transactions are not yet reflected in the Company’s consolidated financial statements.
The increase in the Company’s expected portfolio cash flows from December 31, 2009 (which was $1.43 billion) is due to changes in forward rates, offset by cash received during the first quarter of 2010.
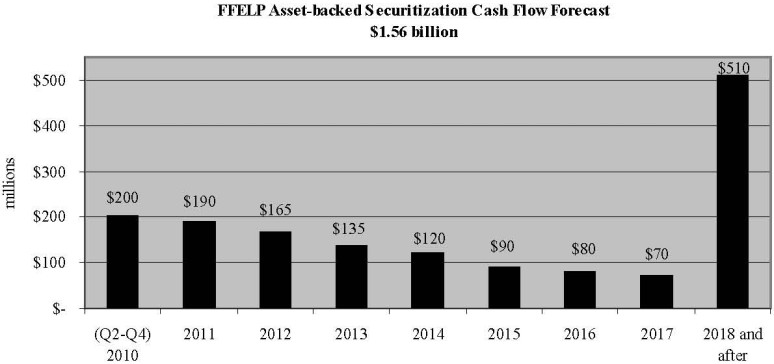
Department of Education Participation / FFELP Warehouse Facility
The Department of Education Participation and FFELP warehouse facility are further discussed below under “Sources of Liquidity Available to Fund 2009-2010 Academic Year FFELP Stafford and PLUS Loan Originations and FFELP Student Loan Acquisitions from Third Parties.”
Department of Education Conduit
In January 2009, the Department published summary terms for its program under which it will finance eligible FFELP Stafford and PLUS loans in a conduit vehicle established to provide funding for student lenders (the “Conduit Program”). Loans eligible for the Conduit Program had to be first disbursed on or after October 1, 2003, but not later than June 30, 2009, and fully disbursed before September 30, 2009, and meet certain other requirements. The Conduit Program was launched on May 11, 2009. Funding for the Conduit Program is provided by the capital markets at a cost based on market rates, with the Company being advanced 97 percent of the student loan face amount. Excess amounts needed to fund the remaining 3 percent of the student loan balances are contributed by the Company. The Conduit Program has a term of five years and expires on May 8, 2014. The Student Loan Short-Term Notes (“Student Loan Notes”) issued by the Conduit Program are supported by a combination of (i) notes backed by FFELP loans, (ii) a liquidity agreement with the Federal Financing Bank, and (iii) a put agreement provided by the Department. If the conduit does not have sufficient funds to pay all Student Loan Notes, then those Student Loan Notes will be repaid with funds from the Federal Financing Bank. The Federal Financing Bank will hold the notes for a short period of time and, if at the end of that time, the Student Loan Notes still cannot be paid off, the underlying FFELP loans that serve as collateral to the Conduit Program will be sold to the Department through a put agreement at a price of 97 percent of the face amount of the loans.
54
Sources of Liquidity Available to Fund 2009-2010 Academic Year FFELP Stafford and PLUS Loan Originations and FFELP Student Loan Acquisitions from Third Parties
The Company has reliable sources of liquidity available for new FFELP Stafford and PLUS loan originations for the 2009-2010 academic year under the Department’s Participation and Purchase Programs. In addition, the Company maintains an agreement with Union Bank, as trustee for various grantor trusts, under which Union Bank has agreed to purchase from the Company participation interests in student loans, and in August 2009, the Company entered into a FFELP warehouse facility with a revolving financing structure.
The Company plans to fund all 2009-2010 academic year loans using the Participation Program, the agreement with Union Bank, and the FFELP warehouse facility. These facilities are described in further detail below.
The Company plans to fund FFELP student loan acquisitions from third parties using the agreement with Union Bank, the FFELP warehouse facility, and, if loans are eligible, the Department’s Conduit Program.
Department of Education’s Loan Participation and Purchase Commitment Programs
In August 2008, the Department implemented the Purchase and Participation Programs pursuant to ECASLA. Under the Department’s Purchase Program, the Department will purchase loans at a price equal to the sum of (i) par value, (ii) accrued interest, (iii) the one percent origination fee paid to the Department, and (iv) a fixed amount of $75 per loan. Under the Participation Program, the Department provides interim short term liquidity to FFELP lenders by purchasing participation interests in pools of FFELP loans. FFELP lenders are charged a rate of commercial paper plus 50 basis points on the principal amount of participation interests outstanding. Loans funded under the Participation Program for the 2009-2010 academic year must be either refinanced by the lender or sold to the Department pursuant to the Purchase Program on or prior to September 30, 2010. To be eligible for purchase or participation under the Department’s programs, loans are limited to FFELP Stafford or PLUS loans first disbursed on or before May 1, 2008 but not later than July 1, 2010, with eligible borrower benefits.
As of March 31, 2010, the Company had $1.0 billion of 2009-2010 academic year FFELP loans funded using the Participation Program. The Company has not yet determined if it will sell its 2009-2010 academic year loans to the Department under the Purchase Program. However, based on the number of 2009-2010 academic year loans held by the Company that are eligible for this program ($1.0 billion as of March 31, 2010), the Company would recognize a gain of approximately $16 million to $18 million if it chose to sell these loans under this program. This gain does not include loans originated and/or acquired after March 31, 2010 which would increase the gain recognized by the Company.
Union Bank Participation Agreement
The Company maintains an agreement with Union Bank, as trustee for various grantor trusts, under which Union Bank has agreed to purchase from the Company participation interests in student loans (the “FFELP Participation Agreement”). The Company has the option to purchase the participation interests from the grantor trusts at the end of a 364-day period upon termination of the participation certificate. As of March 31, 2010, $725.9 million of loans were subject to outstanding participation interests held by Union Bank, as trustee, under this agreement. The agreement automatically renews annually and is terminable by either party upon five business days notice. This agreement provides beneficiaries of Union Bank’s grantor trusts with access to investments in interests in student loans, while providing liquidity to the Company on a short term basis. The Company can participate loans to Union Bank to the extent of availability under the grantor trusts, up to $750 million or an amount in excess of $750 million if mutually agreed to by both parties. Loans participated under this agreement have been accounted for by the Company as loan sales. Accordingly, the participation interests sold are not included on the Company’s consolidated balance sheet.
FFELP Warehouse Facility
On August 3, 2009, the Company entered into the 2009 FFELP Warehouse Facility. The 2009 FFELP Warehouse Facility has a maximum financing amount of $500.0 million, with a revolving financing structure supported by 364-day liquidity provisions, which expire on August 2, 2010. The final maturity date of the facility is August 3, 2012. In the event the Company is unable to renew the liquidity provisions by August 2, 2010, the facility would become a term facility at a stepped-up cost, with no additional student loans being eligible for financing, and the Company would be required to refinance the existing loans in the facility by August 3, 2012.
On May 5, 2010, the Company amended the 2009 FFELP Warehouse Facility to increase the maximum financing amount by $500.0 million, to $1.0 billion in total. All loans funded with the additional $500.0 million of capacity must be eligible for the Department’s Straight-A Funding Conduit Program. The financing cost on the entire FFELP Warehouse Facility will increase by 300 basis points on any day after June 30, 2010 when the aggregate note balance is greater than $500.0 million. However, the Company intends to refinance loans in the warehouse facility that are eligible for the Department’s Conduit Program in advance of June 30, 2010 to avoid paying the increased cost.
The 2009 FFELP Warehouse Facility provides for formula based advance rates depending on FFELP loan type up to a maximum of 92 percent to 98 percent of the principal and interest financed. The advance rates for collateral may increase or decrease based on market conditions. The facility contains financial covenants relating to levels of the Company’s consolidated net worth, ratio of adjusted EBITDA to corporate debt interest, and unencumbered cash. Any violation of these covenants could result in a requirement for the immediate repayment of any outstanding borrowings under the facility. Unlike the Company’s prior FFELP warehouse facility, the new facility does not require the Company to refinance or remove a percentage of the pledged student loan collateral on an annual basis. As of March 31, 2010 and May 7, 2010, $80.1 million and $962.5 million, respectively, was outstanding under this facility and $419.9 million and $37.5 million, respectively, was available for future use. Upon termination or expiration of the facility, the Company would expect to access the securitization market, use operating cash, rely on sale of assets, or transfer collateral to satisfy any remaining obligations.
55
Asset-backed securities transactions
Depending on market conditions, the Company anticipates continuing to access the asset-backed securities market. Asset-backed securities transactions would be used to refinance student loans included in the FFELP warehouse facility, the Department of Education Conduit facility, and/or existing asset-backed security transactions. The FFELP warehouse facility and DOE Conduit facility have advance rates that are less than par. As of March 31, 2010 and May 7, 2010, the Company had approximately $8.9 million and $13.9 million, respectively, advanced in operating cash for the FFELP warehouse facility and $62.7 million and $76.2 million, respectively, advanced in operating cash for the DOE Conduit facility. Depending on the terms of asset-backed security transactions, refinancing loans included in these facilities could produce positive cash flow to the Company and are contemplated by management when making student loan financing decisions.
During the three months ended March 31, 2010, the Company completed asset-backed securities transactions totaling $1.2 billion. The Company used the proceeds from the sale of these notes to purchase student loans previously financed in other asset-backed securitizations and the FFELP warehouse facility. In addition, the Company used the proceeds to purchase $535.9 million (par value) of federally insured student loans from Union Bank.
Description of Other Debt Facilities
Unsecured Line of Credit
The Company has a $750.0 million unsecured line of credit that terminates in May 2012. As of March 31, 2010 and May 7, 2010, there was $691.5 million outstanding on this line. The weighted average interest rate on this line of credit was 0.725% as of March 31, 2010. Upon termination in 2012, there can be no assurance that the Company will be able to maintain this line of credit, find alternative funding, or increase the amount outstanding under the line, if necessary. The lending commitment under the Company’s unsecured line of credit is provided by a total of thirteen banks, with no individual bank representing more than 11% of the total lending commitment. The bank lending group includes Lehman Brothers Bank, a subsidiary of Lehman Brothers Holdings Inc., which represents approximately 7% of the lending commitment under the line of credit. On September 15, 2008, Lehman Brothers Holdings Inc. filed a voluntary petition for relief under Chapter 11 of the United States Bankruptcy Code. The Company does not expect Lehman to fund future borrowing requests. As of March 31, 2010 and May 7, 2010, excluding Lehman’s lending commitment, the Company had $51.2 million available for future use under its unsecured line of credit.
The line of credit agreement contains certain financial covenants that, if not met, lead to an event of default under the agreement. The covenants include maintaining:
· A minimum consolidated net worth
· A minimum adjusted EBITDA to corporate debt interest (over the last four rolling quarters)
· A limitation on subsidiary indebtedness
· A limitation on the percentage of non-guaranteed loans in the Company’s portfolio
As of March 31, 2010, the Company was in compliance with all of these requirements. Many of these covenants are duplicated in the Company’s other lending facilities, including its FFELP warehouse facilities.
A default on the 2009 FFELP Warehouse Facility would result in an event of default on the Company’s unsecured line of credit that would result in the outstanding balance on the line of credit becoming immediately due and payable.
The Company’s operating line of credit does not have any covenants related to unsecured debt ratings. However, changes in the Company’s ratings (as well as the amounts the Company borrows) have modest implications on the pricing level at which the Company obtains funding.
56
Junior Subordinated Hybrid Securities
In September 2006, the Company issued $200.0 million aggregate principal amount of Junior Subordinated Hybrid Securities (“Hybrid Securities”). The Hybrid Securities are unsecured obligations of the Company. The interest rate on the Hybrid Securities from the date they were issued through the optional redemption date, September 28, 2011, is 7.40%, payable semi-annually. Beginning September 29, 2011 through September 29, 2036, the “scheduled maturity date”, the interest rate on the Hybrid Securities will be equal to three-month LIBOR plus 3.375%, payable quarterly. The principal amount of the Hybrid Securities will become due on the scheduled maturity date only to the extent that the Company has received proceeds from the sale of certain qualifying capital securities prior to such date (as defined in the Hybrid Securities’ prospectus). If any amount is not paid on the scheduled maturity date, it will remain outstanding and bear interest at a floating rate as defined in the prospectus, payable monthly. On September 15, 2061, the Company must pay any remaining principal and interest on the Hybrid Securities in full whether or not the Company has sold qualifying capital securities. At the Company’s option, the Hybrid Securities are redeemable in whole at any time or in part from time to time at the redemption price described in the prospectus supplement.
Debt Repurchases
Due to the Company’s improved cash position, the Company repurchased debt during 2010. During the three months ended March 31, 2010, the Company purchased $274.3 million of its asset-backed securities, resulting in a gain of $10.2 million. Gains recorded by the Company from the purchase of debt are included in “gain (loss) on the sale of loans and debt repurchases, net” on the Company’s consolidated statements of income.
The Company's Senior Notes due 2010 (“Senior Notes”) were previously covered debt under a Replacement Capital Covenant dated September 27, 2006 (the "RCC"). Under the RCC, if $100 million or more of the Senior Notes remained outstanding, the Company was restricted in its ability to repurchase or redeem its Junior Subordinated Hybrid Securities. On September 17, 2009, the Company announced that less than $100 million of the Senior Notes remained outstanding, and therefore the RCC no longer provided any benefit to the holders of the Senior Notes. The Company has no other eligible senior debt or eligible subordinated debt under the terms of the RCC, therefore the RCC and the restrictions on repurchase or redemption of the Junior Subordinated Hybrid Securities are of no further force and effect.
Contractual Obligations
The Company is committed under noncancelable operating leases for certain office and warehouse space and equipment. The Company’s contractual obligations were as follows:
|
As of March 31, 2010
|
||||||||||||||||||||
|
Total
|
Less than
1 year
|
1 to 3 years
|
3 to 5 years
|
More than
5 years
|
||||||||||||||||
|
Bonds and notes payable
|
$ | 25,756,182 | 1,202,088 | 738,200 | 1,667,267 | 22,148,627 | ||||||||||||||
|
Operating lease obligations (a)
|
24,500 | 7,585 | 11,318 | 5,597 | — | |||||||||||||||
|
Other
|
21,309 | 21,309 | — | — | — | |||||||||||||||
|
Total
|
$ | 25,801,991 | 1,230,982 | 749,518 | 1,672,864 | 22,148,627 | ||||||||||||||
|
(a)
|
Operating lease obligations are presented net of approximately $2.1 million in sublease arrangements.
|
As of March 31, 2010, the Company had a reserve of $6.5 million for uncertain income tax positions (including the federal benefit received from state positions and accrued interest). This obligation is not included in the above table as the timing and resolution of the income tax positions cannot be reasonably estimated at this time.
The Company has an obligation to purchase $21.3 million of private loans from an unrelated financial institution in quarterly installments of approximately $5.0 million through the third quarter of 2010 with any remaining amount to be purchased at that time. This obligation is included in “other” in the above table.
As of March 31, 2010, the Company has participated $115.5 million of non-federally insured loans to third parties, including $20.0 million that was participated in the three months ended March 31, 2010. The Company has accounted for these participations as loan sales. Accordingly, the participation interests sold are not included on the Company’s consolidated balance sheet. Per the terms of the servicing agreements, the Company’s servicing operations are obligated to repurchase loans subject to the participation interests when such loans become 60 or 90 days delinquent. As of March 31, 2010, the Company has $12.6 million accrued related to this obligation which is included in “other liabilities” in the Company’s consolidated balance sheet. This obligation is not included in the above table.
The Company has commitments with its branding partners and forward flow lenders which obligate the Company to purchase loans originated under specific criteria, although the branding partners and forward flow lenders are typically not obligated to provide the Company with a minimum amount of loans. These commitments generally run for periods ranging from one to five years and are generally renewable. Commitments to purchase loans under these arrangements are not included in the table above.
In 2004, the Company purchased 50% of the stock of infiNET Integrated Solutions, Inc. (“infiNET”) and, in 2006, purchased the remaining 50% of infiNET’s stock. Consideration for the purchase of the remaining 50% of the stock of infiNET included 95,380 restricted shares of the Company’s Class A common stock. Under the terms of the purchase agreement, the 95,380 shares of Class A common stock issued in the acquisition are subject to stock price guaranty provisions whereby if on or about February 28, 2011 the average market trading price of the Class A common stock is less than $104.8375 per share and has not exceeded that price for any 25 consecutive trading days during the 5-year period from the closing of the acquisition to February 28, 2011, then the Company must pay additional cash to the sellers of infiNET for each share of Class A common stock issued in an amount representing the difference between $104.8375 less the greater of $41.9335 or the gross sales price such seller obtained from a sale of the shares occurring subsequent to February 28, 2011 as defined in the agreement. Based on the closing price of the Company’s Class A common stock as of March 31, 2010 of $18.56 per share, the Company’s obligation under this stock price guarantee would have been approximately $6.0 million (($104.8375-$41.9335) x 95,380 shares). Any payment on the guaranty is reduced by the aggregate of any dividends or other distributions made by the Company to the sellers. Any cash paid by the Company in consideration of satisfying the guaranteed value of stock issued for this acquisition would be recorded by the Company as a reduction to additional paid-in capital. The obligation to pay this guaranteed stock price is due February 28, 2011 and is not included in the table above.
During the first quarter of 2010, the Company purchased certain assets of a software company. The initial consideration paid by the Company was $3.0 million in cash. In addition to the initial purchase price, additional payments are to be made by the Company based on certain operating results as defined in the purchase agreement. These contingent payments are payable in three annual installments beginning in March 2011 and in total are estimated by the Company to be $5.0 million. The contingent payments will be remeasured to fair value each reporting date until the contingency is resolved with all changes in fair value being recognized in earnings. These contingent payments are not included in the table above.
57
Dividends
In the first quarter of 2007, the Company began paying dividends of $0.07 per share on the Company's Class A and Class B Common Stock which were paid quarterly through the first quarter of 2008. On May 21, 2008, the Company announced that it was temporarily suspending its quarterly dividend program. On November 5, 2009, the Company's Board of Directors voted to reinstate the quarterly dividend program effective for the fourth quarter 2009. Accordingly, a dividend of $0.07 per share on the Company's Class A and Class B Common Stock was paid on March 15, 2010 to all holders of record as of March 1, 2010. In addition, a dividend of $0.07 per share on the Company’s Class A and Class B Common Stock will be paid on June 15, 2010 to shareholders of record as of June 1, 2010. The Company currently plans to continue making quarterly dividend payments, subject to future earnings, capital requirements, financial condition, and other factors. In addition, the payment of dividends is subject to the terms of the Company’s outstanding junior subordinated hybrid securities, which generally provide that if the Company defers interest payments on those securities it cannot pay dividends on its capital stock.
CRITICAL ACCOUNTING POLICIES
This Management’s Discussion and Analysis of Financial Condition and Results of Operations discusses the Company’s consolidated financial statements, which have been prepared in accordance with accounting principles generally accepted in the United States. The preparation of these financial statements requires management to make estimates and assumptions that affect the reported amounts of assets and liabilities and the reported amounts of income and expenses during the reporting periods. The Company bases its estimates and judgments on historical experience and on various other factors that the Company believes are reasonable under the circumstances. Actual results may differ from these estimates under varying assumptions or conditions. Note 3 of the consolidated financial statements, which are included in the Company’s Annual Report on Form 10-K for the year ended December 31, 2009, includes a summary of the significant accounting policies and methods used in the preparation of the consolidated financial statements.
On an on-going basis, management evaluates its estimates and judgments, particularly as they relate to accounting policies that management believes are most “critical” — that is, they are most important to the portrayal of the Company’s financial condition and results of operations and they require management’s most difficult, subjective, or complex judgments, often as a result of the need to make estimates about the effect of matters that are inherently uncertain. Management has identified the following critical accounting policies that are discussed in more detail below: allowance for loan losses, revenue recognition, impairment assessments related to goodwill and intangible assets, income taxes, and accounting for derivatives.
Allowance for Loan Losses
The allowance for loan losses represents management’s estimate of probable losses on student loans. This evaluation process is subject to numerous estimates and judgments. The Company evaluates the adequacy of the allowance for loan losses on its federally insured loan portfolio separately from its non-federally insured loan portfolio.
The allowance for the federally insured loan portfolio is based on periodic evaluations of the Company’s loan portfolios considering past experience, trends in student loan claims rejected for payment by guarantors, changes to federal student loan programs, current economic conditions, and other relevant factors. Should any of these factors change, the estimates made by management would also change, which in turn would impact the level of the Company’s future provision for loan losses.
In determining the adequacy of the allowance for loan losses on the non-federally insured loans, the Company considers several factors including: loans in repayment versus those in a nonpaying status, delinquency status, type of program, and trends in defaults in the portfolio based on Company and industry data. Should any of these factors change, the estimates made by management would also change, which in turn would impact the level of the Company’s future provision for loan losses. The Company places a non-federally insured loan on nonaccrual status when the collection of principal and interest is 30 days past due and charges off the loan when the collection of principal and interest is 120 days past due.
The allowance for federally insured and non-federally insured loans is maintained at a level management believes is adequate to provide for estimated probable credit losses inherent in the loan portfolio. This evaluation is inherently subjective because it requires estimates that may be susceptible to significant changes.
Revenue Recognition
Student Loan Income – The Company recognizes student loan income as earned, net of amortization of loan premiums and discounts and deferred origination costs. Loan income is recognized based upon the expected yield of the loan after giving effect to borrower utilization of incentives such as principal reductions for timely payments (“borrower benefits”) and other yield adjustments. The estimate of the borrower benefits discount is dependent on the estimate of the number of borrowers who will eventually qualify for these benefits. For competitive and liquidity purposes, the Company frequently changes the borrower benefit programs in both amount and qualification factors. These programmatic changes must be reflected in the estimate of the borrower benefit discount. Loan premiums, deferred origination costs, and borrower benefits are included in the carrying value of the student loan on the consolidated balance sheet and are amortized over the estimated life of the loan. The most sensitive estimate for loan premiums, deferred origination costs, and borrower benefits is the estimate of the constant prepayment rate (“CPR”). CPR is a variable in the life of loan estimate that measures the rate at which loans in a portfolio pay before their stated maturity. The CPR is directly correlated to the average life of the portfolio. CPR equals the percentage of loans that prepay annually as a percentage of the beginning of period balance. A number of factors can affect the CPR estimate such as the rate of consolidation activity and default rates. Should any of these factors change, the estimates made by management would also change, which in turn would impact the amount of loan premium and deferred origination cost amortization recognized by the Company in a particular period.
58
Loan and guaranty servicing revenue – Loan servicing fees are determined according to individual agreements with customers and are calculated based on the dollar value of loans, number of loans, or number of borrowers serviced for each customer. Guaranty servicing fees, generally, are calculated based on the number of loans serviced, volume of loans serviced, or amounts collected.
Tuition payment processing and campus commerce revenue - Fees for payment management services are recognized over the period in which services are provided to customers.
Enrollment services revenue – Enrollment services revenue primarily consists of the following items:
|
·
|
Interactive marketing – Interactive marketing services revenue is derived primarily from fees which are earned through the delivery of qualified leads or clicks. The Company recognizes revenue when persuasive evidence of an arrangement exists, delivery has occurred, the fee is fixed or determinable, and collectability is reasonably assured. Delivery is deemed to have occurred at the time a qualified lead or click is delivered to the customer provided that no significant obligations remain. From time to time, the Company may agree to credit certain leads or clicks if they fail to meet the contractual or other guidelines of a particular client. The Company has established a sales reserve based on historical experience. To date, such credits have been immaterial and within management’s expectations.
For a portion of its interactive marketing revenue, the Company has agreements with providers of online media or traffic (“Publishers”) used in the generation of leads or clicks. The Company receives a fee from its customers and pays a fee to Publishers either on a cost per lead, cost per click, or cost per number of impressions basis. The Company is the primary obligor in the transaction. As a result, the fees paid by the Company’s customers are recognized as revenue and the fees paid to its Publishers are included in “cost to provide enrollment services” in the Company’s consolidated statements of income.
|
|
·
|
Publishing and editing services - Revenue from the sale of print products is generally earned and recognized, net of estimated returns, upon shipment or delivery. Revenue from the sale of editing services is generally recognized upon completion of providing the service.
|
|
·
|
Resource centers and list marketing – Resource centers and list marketing services includes the sale of subscription and performance based products and services, as well as list sales. Revenues from sales of subscription and performance based products and services are recognized ratably over the term of the contract. Subscription and performance based revenues received or receivable in advance of the delivery of services is included in deferred revenue. Revenue from the sale of lists is generally earned and recognized, net of estimated returns, upon delivery.
|
Fees associated with the majority of the services described above are recognized in the period services are rendered and earned under service arrangements with clients where service fees are fixed or determinable and collectability is reasonably assured. The Company’s service fees are determined based on written price quotations or service agreements having stipulated terms and conditions that do not require management to make any significant judgments or assumptions regarding any potential uncertainties.
The Company assesses collectability of revenues and its allowance for doubtful accounts based on a number of factors, including past transaction history with the customer and the credit-worthiness of the customer. An allowance for doubtful accounts is established to record accounts receivable at estimated net realizable value. If the Company determines that collection of revenues is not reasonably assured at or prior to delivery of the Company’s services, revenue is recognized upon the receipt of cash.
Goodwill and Intangible Assets – Impairment Assessments
The Company reviews goodwill for impairment annually (as of November 30) and whenever triggering events or changes in circumstances indicate its carrying value may not be recoverable. The Company performs a two-step impairment test on goodwill. In the first step, the Company compares the fair value of each reporting unit to its carrying value. If the fair value of the reporting unit exceeds the carrying value of the net assets assigned to that unit, goodwill is considered not impaired and the Company is not required to perform further testing. If the carrying value of the net assets assigned to the reporting unit exceeds the fair value of the reporting unit, then the Company must perform the second step of the impairment test in order to determine the implied fair value of the reporting unit’s goodwill. If the carrying value of a reporting unit’s goodwill exceeds its implied fair value, then the Company would record an impairment loss equal to the difference.
59
Determining the fair value of a reporting unit involves the use of significant estimates and assumptions. These estimates and assumptions include revenue growth rates and operating margins used to calculate projected future cash flows, risk-adjusted discount rates, future economic and market conditions, and determination of appropriate market comparables. Actual future results may differ from those estimates.
The Company makes judgments about the recoverability of purchased intangible assets annually and whenever triggering events or changes in circumstances indicate that an other than temporary impairment may exist. Each quarter the Company evaluates the estimated remaining useful lives of purchased intangible assets and whether events or changes in circumstances warrant a revision to the remaining periods of amortization. Recoverability of these assets is measured by comparison of the carrying amount of the asset to the future undiscounted cash flows the asset is expected to generate. If the asset is considered to be impaired, the amount of any impairment is measured as the difference between the carrying value and the fair value of the impaired asset.
Assumptions and estimates about future values and remaining useful lives of the Company’s intangible and other long-lived assets are complex and subjective. They can be affected by a variety of factors, including external factors such as industry and economic trends, and internal factors such as changes in the Company’s business strategy and internal forecasts. Although the Company believes the historical assumptions and estimates used are reasonable and appropriate, different assumptions and estimates could materially impact the reported financial results.
Income Taxes
The Company is subject to the income tax laws of the U.S and its states and municipalities in which the Company operates. These tax laws are complex and subject to different interpretations by the taxpayer and the relevant government taxing authorities. In establishing a provision for income tax expense, the Company must make judgments and interpretations about the application of these inherently complex tax laws. The Company must also make estimates about when in the future certain items will affect taxable income in the various tax jurisdictions. Disputes over interpretations of the tax laws may be subject to review/adjudication by the court systems of the various tax jurisdictions or may be settled with the taxing authority upon examination or audit. The Company reviews these balances quarterly and as new information becomes available, the balances are adjusted, as appropriate.
Derivative Accounting
The Company records derivative instruments at fair value on the balance sheet as either an asset or liability. The Company determines the fair value for its derivative contracts using either (i) pricing models that consider current market conditions and the contractual terms of the derivative contract or (ii) counterparty valuations. These factors include interest rates, time value, forward interest rate curve, and volatility factors, as well as foreign exchange rates. Pricing models and their underlying assumptions impact the amount and timing of unrealized gains and losses recognized, and the use of different pricing models or assumptions could produce different financial results. Management has structured the majority of the Company’s derivative transactions with the intent that each is economically effective. However, the Company’s derivative instruments do not qualify for hedge accounting. Accordingly, changes in the fair value of derivative instruments are reported in current period earnings. Net settlements on derivatives are included in “derivative market value and foreign currency adjustments and derivative settlements, net” on the consolidated statements of operations.
RECENT ACCOUNTING PRONOUNCEMENTS
Fair Value Measurements
The Financial Accounting Standards Board (“FASB”) issued Accounting Standards Update (“ASU”) 2010-06, Improving Disclosures about Fair Value Measurements, an update to ASC Topic 820, Fair Value Measurements and Disclosures. The update provides additional disclosures for transfers in and out of Levels I and II and for activity in Level III. This update also clarifies certain other existing disclosure requirements including level of desegregation and disclosures around inputs and valuation techniques. The update was effective for annual or interim periods beginning after December 15, 2009 (January 1, 2010 for the Company), except for purchases, sales, issuances, and settlements on a gross basis, which will be effective for fiscal and interim periods beginning after December 15, 2010 (January 1, 2011 for the Company). The update did not have a material impact on the preparation of and disclosures in the Company’s consolidated financial statements.
Transfers of Financial Assets and the Variable Interest Entity Consolidation Model
The FASB issued ASU 2009-16, Accounting for Transfers of Financial Assets, an update to ASC 860, Transfers and Servicing, which provides guidance on improving the relevance, representational faithfulness, and comparability of the information that a reporting entity provides in its financial statements about a transfer of financial assets; the effects of a transfer on its financial position, financial performance, and cash flows; and a transferor’s continuing involvement, if any, in transferred financial assets. The update removes the concept of a qualifying special-purpose entity. Additionally, the update defines the term participating interest to establish specific conditions for reporting a transfer of a portion of a financial asset as a sale, and also requires that a transferor recognize and initially measure at fair value all assets obtained (including a transferor’s beneficial interest) and liabilities incurred as a result of a transfer of financial assets accounted for as a sale. The update was effective for fiscal and interim periods beginning after November 15, 2009 (January 1, 2010 for the Company). The Company adopted the update for the fiscal and interim period beginning January 1, 2010. The Company completed two asset-backed securitizations during the first quarter of 2010. Consistent with all historical asset-backed securitizations completed by the Company, these transactions are accounted for as a secured borrowing and the student loan assets and notes payable remain on the consolidated balance sheet per the provisions of ASC Topic 860. The Company’s participation agreements continue to qualify as a transfer of financial assets (accounted for as a sale) under the provisions of ASC Topic 860.
60
The FASB issued ASU 2009-17, Improvements to Financial Reporting by Enterprises Involved with Variable Interest Entities, an update to ASC Topic 810, Consolidations, which provides guidance for determining whether an entity is a variable interest entity in addition to subjecting enterprises to a number of other requirements including, among other things: (i) requiring an enterprise to perform an analysis to determine whether the enterprise’s variable interest or interests give it a controlling financial interest in a variable interest entity and specifies the characteristics the primary beneficiary of a variable interest entity must have to be designated as such; (ii) requiring an enterprise to assess whether it has an implicit financial responsibility to ensure that a variable interest entity operates as designed when determining whether it has the power to direct the activities of the variable interest entity that most significantly impact the entity’s economic performance; (iii) requiring the ongoing reassessments of whether an enterprise is the primary beneficiary of a variable interest entity; (iv) the elimination of the quantitative approach previously required for determining the primary beneficiary of a variable interest entity, and (v) adding an additional reconsideration event for determining whether an entity is a variable interest entity when any changes in facts and circumstances occur such that investors of the equity investment at risk, as a group, lose the power from voting or similar rights of the investment to direct the activities of the entity that have the most significant impact on the entity’s economic performance. The update was effective for fiscal and interim periods beginning after November 15, 2009 (January 1, 2010 for the Company). For the Company, the update was effective for fiscal and interim periods beginning January 1, 2010 and did not have an impact on the preparation of the Company’s consolidated financial statements.
Revenue Recognition
In October 2009, the FASB issued ASU 2009-13, Multiple Deliverable Revenue Arrangements, an update to ASC 605, Revenue Recognition. Under the new update, tangible products that have software components that are essential to the functionality of the tangible product will no longer be within the scope of the software revenue recognition guidance, and software-enabled products will now be subject to other relevant revenue recognition guidance. The update will be effective prospectively for revenue arrangements entered into or materially modified in fiscal years beginning on or after June 15, 2010 (January 1, 2011 for the Company), with early adoption permitted. The Company is currently evaluating the impacts and disclosures related to this update.
In October 2009, the FASB issued ASU 2009-14, Certain Revenue Arrangements that Include Software Elements, an update to ASC 985, Software, which provides guidance on revenue arrangements with multiple deliverables that are outside the scope of the software revenue recognition guidance. Under the update, when vendor specific objective evidence or third party evidence for deliverables in an arrangement cannot be determined, a best estimate of the selling price is required to separate deliverables and allocate arrangement consideration using the relative selling price method. The update includes new disclosure requirements on how the application of the relative selling price method affects the timing and amount of revenue recognition. The update is effective prospectively for revenue arrangements entered into or materially modified in fiscal years beginning on or after June 15, 2010 (January 1, 2011 for the Company), with early adoption permitted. The Company is currently evaluating the impacts and disclosures related to this update.
61
ITEM 3. QUANTITATIVE AND QUALITATIVE DISCLOSURES ABOUT MARKET RISK
(All dollars are in thousands, except share amounts, unless otherwise noted)
Interest Rate Risk
The Company’s primary market risk exposure arises from fluctuations in its borrowing and lending rates, the spread between which could impact the Company due to shifts in market interest rates. Because the Company generates a significant portion of its earnings from its student loan spread, the interest sensitivity of the balance sheet is a key profitability driver.
The following table sets forth the Company’s loan assets and debt instruments by rate characteristics:
|
As of March 31, 2010
|
As of December 31, 2009
|
|||||||||||||||
|
Dollars
|
Percent
|
Dollars
|
Percent
|
|||||||||||||
|
Fixed-rate loan assets
|
$ | 10,434,740 | 42.5 | % | $ | 10,305,622 | 43.6 | % | ||||||||
|
Variable-rate loan assets
|
14,116,412 | 57.5 | 13,330,252 | 56.4 | ||||||||||||
|
Total
|
$ | 24,551,152 | 100.0 | % | $ | 23,635,874 | 100.0 | % | ||||||||
|
Fixed-rate debt instruments
|
$ | 264,966 | 1.0 | % | $ | 273,906 | 1.1 | % | ||||||||
|
Variable-rate debt instruments
|
25,491,216 | 99.0 | 24,531,383 | 98.9 | ||||||||||||
|
Total
|
$ | 25,756,182 | 100.0 | % | $ | 24,805,289 | 100.0 | % | ||||||||
Loans originated prior to April 1, 2006 generally earn interest at the higher of a floating rate based on the Special Allowance Payment or SAP formula set by the Department and the borrower rate, which is fixed over a period of time. The SAP formula is based on an applicable index plus a fixed spread that is dependent upon when the loan was originated, the loan’s repayment status, and funding sources for the loan. The Company generally finances its student loan portfolio with variable rate debt. In low and/or declining interest rate environments, when the fixed borrower rate is higher than the rate produced by the SAP formula, the Company’s student loans earn at a fixed rate while the interest on the variable rate debt typically continues to decline. In these interest rate environments, the Company may earn additional spread income that it refers to as floor income.
Depending on the type of loan and when it was originated, the borrower rate is either fixed to term or is reset to an annual rate each July 1. As a result, for loans where the borrower rate is fixed to term, the Company may earn floor income for an extended period of time, which the Company refers to as fixed rate floor income, and for those loans where the borrower rate is reset annually on July 1, the Company may earn floor income to the next reset date, which the Company refers to as variable rate floor income. In accordance with legislation enacted in 2006, lenders are required to rebate fixed rate floor income and variable rate floor income to the Department for all new FFELP loans first originated on or after April 1, 2006.
For the three months ended March 31, 2010 and 2009, loan interest income includes $35.3 million and $30.3 million, respectively, of fixed rate floor income. The amount of fixed rate floor income has increased due to a decrease in interest rates. If interest rates remain low, the Company anticipates continuing to earn significant fixed rate floor income in future periods.
Absent the use of derivative instruments, a rise in interest rates may reduce the amount of floor income received and this may have an impact on earnings due to interest margin compression caused by increasing financing costs, until such time as the federally insured loans earn interest at a variable rate in accordance with their special allowance payment formulas. In higher interest rate environments, where the interest rate rises above the borrower rate and fixed rate loans effectively become variable rate loans, the impact of the rate fluctuations is reduced.
62
The following graph depicts fixed rate floor income for a borrower with a fixed rate of 6.75% and a SAP rate of 2.64%:
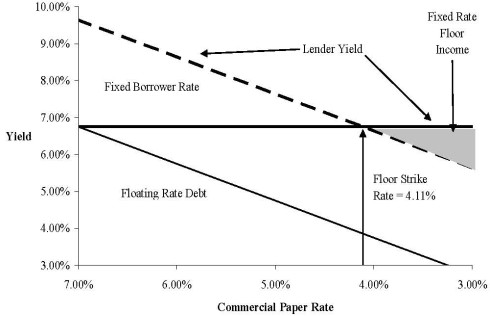
The following table shows the Company’s student loan assets that are earning fixed rate floor income as of March 31, 2010:
|
Borrower/
|
Estimated
|
Balance of
|
||||||||
|
Fixed
|
lender
|
variable
|
assets earning fixed-rate
|
|||||||
|
interest
|
weighted
|
conversion
|
floor income as of
|
|||||||
|
rate range
|
average yield
|
rate (a)
|
March 31, 2010
|
|||||||
|
<3.0
|
% | 2.88 | % | 0.24 | % | $ | 1,651,592 | |||
| 3.0 - 3.49 | % | 3.21 | % | 0.57 | % | 1,864,868 | ||||
| 3.5 - 3.99 | % | 3.65 | % | 1.01 | % | 1,916,914 | ||||
| 4.0 - 4.49 | % | 4.20 | % | 1.56 | % | 1,519,603 | ||||
| 4.5 - 4.99 | % | 4.72 | % | 2.08 | % | 842,585 | ||||
| 5.0 - 5.49 | % | 5.24 | % | 2.60 | % | 548,884 | ||||
| 5.5 - 5.99 | % | 5.67 | % | 3.03 | % | 326,840 | ||||
| 6.0 - 6.49 | % | 6.19 | % | 3.55 | % | 384,529 | ||||
| 6.5 - 6.99 | % | 6.70 | % | 4.06 | % | 342,566 | ||||
| 7.0 - 7.49 | % | 7.17 | % | 4.53 | % | 118,318 | ||||
| 7.5 - 7.99 | % | 7.71 | % | 5.07 | % | 200,691 | ||||
| 8.0 - 8.99 | % | 8.16 | % | 5.52 | % | 454,028 | ||||
|
> 9.0
|
% | 9.04 | % | 6.40 | % | 263,322 | ||||
| $ | 10,434,740 | |||||||||
|
|
(a)
|
The estimated variable conversion rate is the estimated short-term interest rate at which loans would convert to variable rate. As of March 31, 2010, the short-term interest rate was 21 basis points. As of May 7, 2010, the short-term interest rate was 31 basis points.
|
The following table summarizes the outstanding derivatives instruments as of March 31, 2010 used by the Company to hedge fixed-rate student loan assets.
|
Weighted
|
||||||||
|
average fixed
|
||||||||
|
Notional
|
rate paid by
|
|||||||
|
Maturity
|
Amount
|
the Company (a)
|
||||||
|
2010
|
$ | 4,750,000 | 0.54 | % | ||||
|
2011
|
1,500,000 | 0.66 | ||||||
| $ | 6,250,000 | 0.57 | % | |||||
(a) For all interest rate derivatives, the Company receives discrete three-month LIBOR.
63
As of March 31, 2010, the Company had $3.2 billion of student loan assets that were eligible to earn variable-rate floor income.
The Company is exposed to interest rate risk in the form of basis risk and repricing risk because the interest rate characteristics of the Company’s assets do not match the interest rate characteristics of the funding. The Company attempts to match the interest rate characteristics of certain pools of loan assets with debt instruments of substantially similar characteristics. Due to the variability in duration of the Company’s assets and varying market conditions, the Company does not attempt to perfectly match the interest rate characteristics of the entire loan portfolio with the underlying debt instruments. The Company has adopted a policy of periodically reviewing the mismatch related to the interest rate characteristics of its assets and liabilities together with the Company's outlook as to current and future market conditions. Based on those factors, the Company uses derivative instruments as part of its overall risk management strategy. Derivative instruments used as part of the Company's interest rate risk management strategy currently include interest rate swaps, basis swaps, and cross-currency swaps.
The following table presents the Company’s FFELP student loan assets and related funding arranged by underlying indices as of March 31, 2010:
|
Index
|
Frequency of
Variable Resets
|
Assets
|
Debt
outstanding
that funded
student loan
assets (a)
|
|||||||
|
3 month H15 financial commercial paper (b)
|
Daily
|
$ | 23,383,350 | 1,028,402 | ||||||
|
3 month Treasury bill (c)
|
Varies
|
1,028,912 | — | |||||||
|
3 month LIBOR (d)
|
Quarterly
|
— | 20,904,154 | |||||||
|
Auction-rate or remarketing
|
Varies
|
— | 1,370,510 | |||||||
|
Asset-backed commercial paper (e)
|
Varies
|
— | 1,464,870 | |||||||
|
Other (f)
|
387,454 | 31,780 | ||||||||
| $ | 24,799,716 | 24,799,716 | ||||||||
|
|
(a)
|
The Company has certain basis swaps outstanding in which the Company receives three-month LIBOR and pays one-month LIBOR plus or minus a spread as defined in the agreements (the “1/3 Basis Swaps”). The Company entered into these derivative instruments to better match the interest rate characteristics on its student loan assets and the debt funding such assets. The following table summarizes these derivatives:
|
|
Maturity
|
Notional amount:
1/3 Basis Swaps
|
|||
|
2010
|
$ | 1,000,000 | ||
|
2013
|
500,000 | |||
|
2014
|
500,000 | |||
|
2018
|
1,300,000 | |||
|
2019
|
500,000 | |||
|
2021
|
250,000 | |||
|
2023
|
1,250,000 | |||
|
2024
|
250,000 | |||
|
2028
|
100,000 | |||
|
2039
|
150,000 | |||
| $ | 5,800,000 | |||
|
(b)
|
The Company’s FFELP student loans earn interest based on the daily average H15 financial commercial paper index calculated on a fiscal quarter. The Company’s funding includes FFELP student loans under the Department’s Participation Program. The interest rate on the principal amount of participation interests outstanding under the Department’s Participation Program is based on a rate of commercial paper plus 50 basis points, which is set a quarter in arrears, while the earnings on the student loans is based primarily on the daily average H15 financial commercial paper index calculated on the current fiscal quarter.
|
|
(c)
|
The Company has used derivative instruments to hedge both the basis and repricing risk on certain student loans in which the Company earns interest based on a treasury bill rate that resets daily and are funded with debt indexed to primarily three-month LIBOR. To hedge these loans, the Company has entered into basis swaps in which the Company receives three-month LIBOR set discretely in advance and pays a weekly treasury bill rate plus a spread as defined in the agreement (“T-BILL/LIBOR Basis Swaps”). The following table summarizes these derivatives:
|
64
|
As of March 31, 2010
|
||||
| Notional | ||||
|
Maturity
|
Amount
|
|||
|
2011 (a)
|
$ | 225,000 | ||
(a) These derivatives have forward effective start dates of October 2010 ($75 million), November 2010 ($75 million), and December 2010 ($75 million).
|
(d)
|
The Company has Euro-denominated notes that reprice on the EURIBOR index. The Company has entered into derivative instruments (cross-currency interest rate swaps) that convert the EURIBOR index to three-month LIBOR. As a result, these notes are reflected in the three-month LIBOR category in the above table. See “Foreign Currency Exchange Risk.”
|
|
(e)
|
Asset-backed commercial paper consists of $80.1 million funded in the Company’s FFELP warehouse facility and $1.4 billion funded through the Department’s Conduit Program. Funding for the Conduit Program is provided by the capital markets at a cost based on market rates.
|
|
(f)
|
Assets include restricted cash and investments and other assets. Debt outstanding includes other debt obligations secured by student loan assets and related collateral.
|
Financial Statement Impact of Derivative Instruments
The Company recognizes changes in the fair value of derivative instruments currently in earnings unless specific hedge accounting criteria are met. Management has structured the majority of the Company’s derivative transactions with the intent that each is economically effective. However, the Company’s derivative instruments do not qualify for hedge accounting; consequently, the change in fair value of these derivative instruments is included in the Company’s operating results. Changes or shifts in the forward yield curve and fluctuations in currency rates can significantly impact the valuation of the Company’s derivatives. Accordingly, changes or shifts to the forward yield curve and fluctuations in currency rates will impact the financial position and results of operations of the Company. The change in fair value of the Company’s derivatives are included in “derivative market value and foreign currency adjustments and derivative settlements, net” in the Company’s consolidated statements of operations and resulted in expenses of $67.6 million and $52.1 million for the three months ended March 31, 2010 and 2009, respectively.
The following summarizes the derivative settlements included in “derivative market value and foreign currency adjustments and derivative settlements, net” on the consolidated statements of income:
|
Three months ended March 31
|
||||||||
|
2010
|
2009
|
|||||||
|
Settlements:
|
||||||||
|
Interest rate swaps
|
$ | (3,856 | ) | — | ||||
|
Average/discrete basis swaps
|
— | 10,022 | ||||||
|
1/3 basis swaps
|
131 | 10,744 | ||||||
|
Cross-currency interest rate swaps
|
1,302 | 3,592 | ||||||
|
Total settlements - (expense) income
|
$ | (2,423 | ) | 24,358 | ||||
65
Sensitivity Analysis
The following tables summarize the effect on the Company’s earnings, based upon a sensitivity analysis performed by the Company assuming hypothetical increases in interest rates of 100 basis points and 300 basis points while funding spreads remain constant. In addition, as it relates to the effect on earnings, a sensitivity analysis was performed assuming the funding index increases 10 basis points and 30 basis points while holding the asset index constant, if the funding index is different than the asset index. The effect on earnings was performed on the Company’s variable rate assets and liabilities. The analysis includes the effects of the Company’s interest rate and basis swaps in existence during these periods.
|
Three months ended March 31, 2010
|
||||||||||||||||||||||||||||||||
|
Interest Rates
|
Asset and funding index mismatches
|
|||||||||||||||||||||||||||||||
|
Change from increase
of 100 basis points
|
Change from increase
of 300 basis points
|
Increase of
10 basis points
|
Increase of
30 basis points
|
|||||||||||||||||||||||||||||
|
Dollar
|
Percent
|
Dollar
|
Percent
|
Dollar
|
Percent
|
Dollar
|
Percent
|
|||||||||||||||||||||||||
|
Effect on earnings:
|
||||||||||||||||||||||||||||||||
|
Increase (decrease) in pre-tax net income before
|
||||||||||||||||||||||||||||||||
|
impact of derivative settlements
|
$ | (15,641 | ) | (18.0 | ) % | (26,354 | ) | (30.3 | ) % | (5,966 | ) | (6.9 | ) % | (17,899 | ) | (20.6 | ) % | |||||||||||||||
|
Impact of derivative settlements
|
12,368 | 14.2 | 37,105 | 42.7 | — | — | — | — | ||||||||||||||||||||||||
|
Increase (decrease) in net income before taxes
|
$ | (3,273 | ) | (3.8 | ) % | 10,751 | 12.4 | % | (5,966 | ) | (6.9 | ) % | (17,899 | ) | (20.6 | ) % | ||||||||||||||||
|
Increase (decrease) in basic and diluted
|
||||||||||||||||||||||||||||||||
|
earnings per share
|
$ | (0.04 | ) | 0.14 | (0.08 | ) | (0.23 | ) | ||||||||||||||||||||||||
|
Three months ended March 31, 2009
|
||||||||||||||||||||||||||||||||
|
Interest Rates
|
Asset and funding index mismatches
|
|||||||||||||||||||||||||||||||
|
Change from increase
of 100 basis points
|
Change from increase
of 300 basis points
|
Increase of
10 basis points
|
Increase of
30 basis points
|
|||||||||||||||||||||||||||||
|
Dollar
|
Percent
|
Dollar
|
Percent
|
Dollar
|
Percent
|
Dollar
|
Percent
|
|||||||||||||||||||||||||
|
Effect on earnings:
|
||||||||||||||||||||||||||||||||
|
Increase (decrease) in pre-tax net income before
|
||||||||||||||||||||||||||||||||
|
impact of derivative settlements
|
$ | (29,030 | ) | (70.7 | ) % | (30,715 | ) | (74.8 | ) % | (6,354 | ) | (15.5 | ) % | (19,059 | ) | (46.4 | ) % | |||||||||||||||
|
Impact of derivative settlements
|
— | — | — | — | — | — | — | — | ||||||||||||||||||||||||
|
Increase (decrease) in net income before taxes
|
$ | (29,030 | ) | (70.7 | ) % | (30,715 | ) | (74.8 | ) % | (6,354 | ) | (15.5 | ) % | (19,059 | ) | (46.4 | ) % | |||||||||||||||
|
Increase (decrease) in basic and diluted
|
||||||||||||||||||||||||||||||||
|
earnings per share
|
$ | (0.37 | ) | (0.39 | ) | (0.08 | ) | (0.24 | ) | |||||||||||||||||||||||
Foreign Currency Exchange Risk
During 2006, the Company completed separate debt offerings of student loan asset-backed securities that included 420.5 million and 352.7 million Euro-denominated notes with interest rates based on a spread to the EURIBOR index. As a result of this transaction, the Company is exposed to market risk related to fluctuations in foreign currency exchange rates between the U.S. dollar and Euro. The principal and accrued interest on these notes is re-measured at each reporting period and recorded on the Company’s balance sheet in U.S. dollars based on the foreign currency exchange rate on that date. Changes in the principal and accrued interest amounts as a result of foreign currency exchange rate fluctuations are included in the “derivative market value and foreign currency adjustments and derivative settlements, net” in the Company’s consolidated statements of income.
The Company entered into cross-currency interest rate swaps in connection with the issuance of the Euro Notes. Under the terms of these derivative instrument agreements, the Company receives from a counterparty a spread to the EURIBOR index based on notional amounts of €420.5 million and €352.7 million and pays a spread to the LIBOR index based on notional amounts of $500.0 million and $450.0 million, respectively. In addition, under the terms of these agreements, all principal payments on the Euro Notes will effectively be paid at the exchange rate in effect as of the issuance of the notes. The Company did not qualify these derivative instruments as hedges under accounting authoritative guidance; consequently, the change in fair value is included in the Company’s operating results.
66
The following table summarizes the financial statement impact as a result of the remeasurement of the Euro Notes and change in the fair value of the related derivative instruments. These amounts are included in “derivative market value and foreign currency adjustments and derivative settlements, net” on the Company’s consolidated statements of operations.
|
Three Months Ended March 31,
|
||||||||
|
2010
|
2009
|
|||||||
|
Re-measurement of Euro Notes
|
$ | 71,675 | 47,242 | |||||
|
Change in fair value of
|
||||||||
|
cross-currency derivatives
|
(59,075 | ) | (57,110 | ) | ||||
|
Total impact to statements of
|
||||||||
|
income - income (expense)
|
$ | 12,600 | (9,868 | ) | ||||
The re-measurement of the Euro-denominated bonds generally correlates with the change in fair value of the cross-currency interest rate swaps. However, the Company will experience unrealized gains or losses related to the cross-currency interest rate swaps if the two underlying indices (and related forward curve) do not move in parallel. Management intends to hold the cross-currency interest rate swaps through the maturity of the Euro-denominated bonds.
The following table summarizes all of the components of “Derivative market value and foreign currency adjustments and derivative settlements, net” included in the consolidated statements of operations.
|
Three Months Ended March 31,
|
||||||||
|
2010
|
2009
|
|||||||
|
Change in fair value of derivatives
|
$ | (67,570 | ) | (52,122 | ) | |||
|
Foreign currency transaction adjustment
|
71,675 | 47,242 | ||||||
|
Derivative settlements, net
|
(2,423 | ) | 24,358 | |||||
|
Derivative market value and foreign currency
|
||||||||
|
adjustments and derivative settlements, net
|
$ | 1,682 | 19,478 | |||||
ITEM 4. CONTROLS AND PROCEDURES
Disclosure Controls and Procedures
Under supervision and with the participation of certain members of the Company’s management, including the chief executive and the chief financial officers, the Company completed an evaluation of the effectiveness of the design and operation of its disclosure controls and procedures (as defined in SEC Rules 13a-15(e) and 15d-15(e) under the Securities Exchange Act of 1934). Based on this evaluation, the Company’s chief executive and chief financial officers believe that the disclosure controls and procedures were effective as of the end of the period covered by this Report with respect to timely communication to them and other members of management responsible for preparing periodic reports and material information required to be disclosed in this Report as it relates to the Company and its consolidated subsidiaries.
Changes in Internal Control over Financial Reporting
There was no change in the Company’s internal control over financial reporting during the Company’s last fiscal quarter that has materially affected, or is reasonably likely to materially affect, the Company’s internal control over financial reporting.
PART II. OTHER INFORMATION
ITEM 1. LEGAL PROCEEDINGS
General
The Company is subject to various claims, lawsuits, and proceedings that arise in the normal course of business. These matters principally consist of claims by student loan borrowers disputing the manner in which their student loans have been processed and disputes with other business entities. In addition, from time to time the Company receives information and document requests from state or federal regulators concerning its business practices. The Company cooperates with these inquiries and responds to the requests. While the Company cannot predict the ultimate outcome of any inquiry or investigation, the Company believes its activities have materially complied with applicable law, including the Higher Education Act, the rules and regulations adopted by the Department of Education thereunder, and the Department’s guidance regarding those rules and regulations. Other than the items specifically discussed below, on the basis of present information, anticipated insurance coverage, and advice received from counsel, it is the opinion of the Company’s management that the disposition or ultimate determination of these claims, lawsuits, and proceedings will not have a material adverse effect on the Company’s business, financial position, or results of operations.
67
Regulatory Reviews
The Department of Education periodically reviews participants in the FFELP for compliance with program provisions. On June 28, 2007, the Department notified the Company that it would be conducting a review of the Company’s practices in connection with the prohibited inducement provisions of the Higher Education Act and the associated regulations that allow borrowers to have a choice of lenders. The Company understands that the Department selected several schools and lenders for review. The Company responded to the Department’s requests for information and documentation and cooperated with their review. On May 1, 2009, the Company received the Department’s preliminary program review report, which covered the Department’s review of the period from October 1, 2002 to September 30, 2007. The preliminary program review report contained certain initial findings of noncompliance with the Higher Education Act’s prohibited inducement provisions and required that the Company provide an explanation for the basis of the arrangements noted in the preliminary program review report. The Company has responded and provided an explanation of the arrangements noted in the Department of Education’s initial findings, and the Department of Education is expected to issue a final program review determination letter and advise the Company whether it intends to take any additional action. To the extent any findings are contained in a final letter, the additional action may include the assessment of fines or penalties, or the limitation, suspension, and termination of the Company’s participation in the FFELP.
While the Company is unable to predict the ultimate outcome of these reviews, the Company believes its practices complied with applicable law, including the provisions of the Higher Education Act, the rules and regulations adopted by the Department of Education thereunder, and the Department’s guidance regarding those rules and regulations.
United States ex rel Oberg v. Nelnet, Inc. et al
On September 28, 2009, the Company was served with a Summons and First Amended Complaint naming the Company as one of ten defendants in a “qui tam” action brought by Jon H. Oberg on behalf of the United States of America. Qui tam actions assert claims by an individual on behalf of the federal government, and are filed under seal until the government decides, if at all, to intervene in the case.
An original complaint in the action was filed under seal in the U.S. District Court for the Eastern District of Virginia on September 21, 2007, and was unsealed on August 26, 2009 upon the government’s filing of a Notice of Election to Decline Intervention in the matter. The First Amended Complaint (the “Oberg Complaint”) was filed on August 24, 2009 and alleges the defendant student loan lenders submitted false claims for payment to the Department of Education in order to obtain special allowance payments on certain student loans at a rate of 9.5%, which the Oberg Complaint alleges is in excess of amounts permitted by law. The Oberg Complaint seeks the imposition of civil penalties and treble the amount of damages sustained by the government in connection with the alleged overbilling by the defendants for special allowance payments. The Oberg Complaint alleges that approximately $407 million in unlawful 9.5% special allowance payment claims were submitted by the Company to the Department of Education.
The 9.5% special allowance payments received by the Company were disclosed by the Company on multiple occasions beginning in 2003. In January 2007, the Company entered into a settlement agreement with the Department of Education to resolve an audit report by the Office of Inspector General of the Department of Education with respect to the Company’s student loan portfolio receiving special allowance payments at a minimum 9.5% interest rate (the “Settlement Agreement”). Under the terms of the Settlement Agreement, the Company was permitted to retain the special allowance payments that it received from the Department prior to July 1, 2006 and the Settlement Agreement included an acknowledgment by the Department of Education that the dispute with the Company in connection with billings for 9.5% interest was in good faith. In addition, the Settlement Agreement eliminated all 9.5% special allowance payments with respect to the Company’s portfolios of student loans for periods on and after July 1, 2006.
The Company filed a Motion to Dismiss the Oberg Complaint, and on December 1, 2009, the Court denied the Motion. The Company believes it has strong defenses to the Oberg Complaint and is vigorously contesting the matter. The case is currently in the discovery stage and the Company intends to move for summary judgment. Due to the uncertainty, costs, and risks inherent in the litigation process, the Company may explore various resolutions of the matter, but cannot predict the ultimate outcome or resolution, which could have a material adverse effect on the Company’s results of operations and financial condition.
United States ex rel Vigil v. Nelnet, Inc. et al
On November 4, 2009, the Company was served with a Summons and Third Amended Complaint naming the Company as one of three defendants in an unrelated qui tam action brought by Rudy Vigil (the “Vigil Complaint”). This matter was filed under seal in the U.S. District Court for the District of Nebraska on July 11, 2007 and was unsealed on October 15, 2009 following the government’s notice that it declined to intervene in the matter. The Vigil Complaint, filed by a former employee of the Company, appeared to allege that the Company engaged in false advertising and offered prohibited inducements to student loan borrowers in order to increase the Company’s loan holdings, and subsequently submitted false claims to the Department of Education in order to obtain special allowance payments and default claim payments on such loans.
68
The Company filed a Motion to Dismiss the Vigil Complaint, and on April 1, 2010 the Court granted the Motion, dismissing the Vigil Complaint with prejudice. On April 7, 2010, Mr. Vigil filed a Notice of Appeal of the Court’s Order of Dismissal.
There have been no material changes from the risk factors described in the Company’s Annual Report on Form 10-K for the year ended December 31, 2009 in response to Item 1A of Part I of such Form 10-K.
ITEM 2. UNREGISTERED SALES OF EQUITY SECURITIES AND USE OF PROCEEDS
Stock Repurchases
The following table summarizes the repurchases of Class A common stock during the first quarter of 2010 by the Company or any “affiliated purchaser” of the Company, as defined in Rule 10b-18(a)(3) under the Securities Exchange Act of 1934.
|
Total number of
|
Maximum number
|
|||||||||||||||
|
shares purchased
|
of shares that may
|
|||||||||||||||
|
Total number
|
Average
|
as part of publicly
|
yet be purchased
|
|||||||||||||
|
of shares
|
price paid
|
announced plans
|
under the plans
|
|||||||||||||
|
Period
|
purchased (1)
|
per share
|
or programs (2) (3)
|
or programs (4)
|
||||||||||||
|
January 1 - January 31, 2010
|
2,594 | $ | 16.96 | 1,282 | 7,016,567 | |||||||||||
|
February 1 - February 28, 2010
|
102 | 16.17 | 102 | 7,151,225 | ||||||||||||
|
March 1 - March 31, 2010
|
10,240 | 18.63 | 1,033 | 6,795,391 | ||||||||||||
|
Total
|
12,936 | $ | 18.28 | 2,417 | ||||||||||||
|
|
(1)
|
The total number of shares includes: (i) shares purchased pursuant to the 2006 Plan discussed in footnote (2) below; (ii) shares owned and tendered by employees to satisfy tax withholding obligations on the vesting of restricted shares; and (iii) shares purchased pursuant to the 2006 ESLP discussed in footnote (3) below, of which there were none for the months of January, February, or March 2010. Shares of Class A common stock purchased pursuant to the 2006 Plan included 1,282 shares, 102 shares, and 1,033 shares in January, February, and March, respectively, that had been issued to the Company’s 401(k) plan and allocated to employee participant accounts pursuant to the plan’s provisions for Company matching contributions in shares of Company stock, and were purchased by the Company from the plan pursuant to employee participant instructions to dispose of such shares. Shares of Class A common stock tendered by employees to satisfy tax withholding obligations included 1,312 shares and 9,207 shares in January and March, respectively. Unless otherwise indicated, shares owned and tendered by employees to satisfy tax withholding obligations were purchased at the closing price of the Company’s shares on the date of vesting.
|
|
|
(2)
|
The Company’s Board of Directors has authorized a stock repurchase program to repurchase up to a total of ten million shares of the Company’s Class A common stock (the “2006 Plan”). The 2006 Plan has an expiration date of May 24, 2012.
|
|
|
(3)
|
On May 25, 2006, the Company publicly announced that the shareholders of the Company approved an Employee Stock Purchase Loan Plan (the “2006 ESLP”) to allow the Company to make loans to employees for the purchase of shares of the Company's Class A common stock either in the open market or directly from the Company. A total of $40 million in loans may be made under the 2006 ESLP, and a total of one million shares of Class A common stock are reserved for issuance under the 2006 ESLP. Shares may be purchased directly from the Company or in the open market through a broker at prevailing market prices at the time of purchase, subject to any conditions or restrictions on the timing, volume, or prices of purchases as determined by the Compensation Committee of the Board of Directors and set forth in the Stock Purchase Loan Agreement with the participant. The 2006 ESLP shall terminate May 25, 2016.
|
|
|
(4)
|
The maximum number of shares that may yet be purchased under the plans is calculated below. There are no assurances that any additional shares will be repurchased under either the 2006 Plan or the 2006 ESLP. Shares under the 2006 ESLP may be issued by the Company rather than purchased in open market transactions.
|
69
|
As of
|
Maximum
number of
shares that
may yet be
purchased
under the
2006 Plan
(A)
|
Approximate
dollar value
of shares
that may
yet be
purchased
under the
2006 ESLP
(B)
|
Closing price
on the last
trading day
of the
Company's
Class A
Common Stock
(C)
|
(B / C)
Approximate
number of
shares that
may yet be
purchased
under the
2006 ESLP
(D)
|
(A + D)
Approximate
number of
shares that
may yet be
purchased
under the
2006 Plan
and 2006
ESLP
|
|||||||||||||||
|
January 31, 2010
|
4,832,625 | 36,450,000 | 16.69 | 2,183,942 | 7,016,567 | |||||||||||||||
|
February 28, 2010
|
4,832,523 | 36,450,000 | 15.72 | 2,318,702 | 7,151,225 | |||||||||||||||
|
March 31, 2010
|
4,831,490 | 36,450,000 | 18.56 | 1,963,901 | 6,795,391 | |||||||||||||||
Working capital and dividend restrictions/limitations
The Company’s credit facilities, including its revolving line of credit which is available through May of 2012, impose restrictions on the Company’s minimum consolidated net worth, the ratio of the Company’s Adjusted EBITDA to corporate debt interest, the indebtedness of the Company's subsidiaries, and the ratio of Non-FFELP loans to all loans in the Company's portfolio. In addition, trust indentures and other financing agreements governing debt issued by the Company's education lending subsidiaries may have general limitations on the amounts of funds that can be transferred to the Company by its subsidiaries through cash dividends.
On September 27, 2006 the Company consummated a debt offering of $200.0 million aggregate principal amount of Hybrid Securities. So long as any Hybrid Securities remain outstanding, if the Company gives notice of its election to defer interest payments but the related deferral period has not yet commenced or a deferral period is continuing, then the Company will not, and will not permit any of its subsidiaries to:
|
·
|
declare or pay any dividends or distributions on, or redeem, purchase, acquire or make a liquidation payment regarding, any of the Company’s capital stock
|
|
·
|
except as required in connection with the repayment of principal, and except for any partial payments of deferred interest that may be made through the alternative payment mechanism described in the Hybrid Securities indenture, make any payment of principal of, or interest or premium, if any, on, or repay, repurchase, or redeem any of the Company’s debt securities that rank pari passu with or junior to the Hybrid Securities
|
|
·
|
make any guarantee payments regarding any guarantee by the Company of the subordinated debt securities of any of the Company’s subsidiaries if the guarantee ranks pari passu with or junior in interest to the Hybrid Securities
|
In addition, if any deferral period lasts longer than one year, the limitation on the Company’s ability to redeem or repurchase any of its securities that rank pari passu with or junior in interest to the Hybrid Securities will continue until the first anniversary of the date on which all deferred interest has been paid or cancelled.
If the Company is involved in a business combination where immediately after its consummation more than 50% of the surviving entity’s voting stock is owned by the shareholders of the other party to the business combination, then the immediately preceding sentence will not apply to any deferral period that is terminated on the next interest payment date following the date of consummation of the business combination.
However, at any time, including during a deferral period, the Company will be permitted to:
|
·
|
pay dividends or distributions in additional shares of the Company’s capital stock
|
|
·
|
declare or pay a dividend in connection with the implementation of a shareholders’ rights plan, or issue stock under such a plan, or redeem or repurchase any rights distributed pursuant to such a plan
|
|
·
|
purchase common stock for issuance pursuant to any employee benefit plans
|
70
ITEM 6. EXHIBITS
|
|
10.1*
|
Ninth Amendment of Amended and Restated Participation Agreement, dated as of January 23, 2009, by and between Union Bank and Trust Company and National Education Loan Network, Inc.
|
|
|
10.2*
|
Tenth Amendment of Amended and Restated Participation Agreement, dated as of October 19, 2009, by and between Union Bank and Trust Company and National Education Loan Network, Inc.
|
|
|
10.3*
|
Eleventh Amendment of Amended and Restated Participation Agreement, dated as of December 14, 2009, by and between Union Bank and Trust Company and National Education Loan Network, Inc.
|
|
|
10.4**
|
Twelfth Amendment of Amended and Restated Participation Agreement, dated as of January 1, 2010, by and between Union Bank and Trust Company and National Education Loan Network, Inc.
|
|
|
31.1**
|
Certification Pursuant to Section 302 of the Sarbanes-Oxley Act of 2002 of Chief Executive Officer Michael S. Dunlap.
|
|
|
31.2**
|
Certification Pursuant to Section 302 of the Sarbanes-Oxley Act of 2002 of Chief Financial Officer Terry J. Heimes.
|
|
|
32***
|
Certification Pursuant to 18 U.S.C. Section 1350, as Adopted Pursuant to Section 906 of the Sarbanes-Oxley Act of 2002.
|
|
*
|
Filed herewith for purposes of providing a complete set of all intervening amendment documents to the Amended and Restated Participation Agreement by and between Union Bank and Trust Company and Nelnet, Inc. (f/k/a NELnet, Inc.)(subsequently renamed National Education Loan Network, Inc.)
|
|
**
|
Filed herewith
|
|
***
|
Furnished herewith
|
71
SIGNATURES
Pursuant to the requirements of the Securities Exchange Act of 1934, the registrant has duly caused this report to be signed on its behalf by the undersigned thereunto duly authorized.
| NELNET, INC. | |||
|
Date: May 10, 2010
|
By:
|
/s/ MICHAEL S. DUNLAP | |
|
Name: Michael S. Dunlap
Title: Chairman and Chief Executive Officer
|
|||
|
|
By:
|
/s/ TERRY J. HEIMES | |
|
Name: Terry J. Heimes
Title: Chief Financial Officer
|
72