Attached files
| file | filename |
|---|---|
| EX-99.4 - EX-99.4 - SLR Investment Corp. | d118840dex994.htm |
| EX-99.3 - EX-99.3 - SLR Investment Corp. | d118840dex993.htm |
| EX-99.2 - EX-99.2 - SLR Investment Corp. | d118840dex992.htm |
| EX-99.1 - EX-99.1 - SLR Investment Corp. | d118840dex991.htm |
| EX-32.3 - EX-32.3 - SLR Investment Corp. | d118840dex323.htm |
| EX-32.2 - EX-32.2 - SLR Investment Corp. | d118840dex322.htm |
| EX-32.1 - EX-32.1 - SLR Investment Corp. | d118840dex321.htm |
| EX-31.3 - EX-31.3 - SLR Investment Corp. | d118840dex313.htm |
| EX-31.2 - EX-31.2 - SLR Investment Corp. | d118840dex312.htm |
| EX-31.1 - EX-31.1 - SLR Investment Corp. | d118840dex311.htm |
| EX-23.1 - EX-23.1 - SLR Investment Corp. | d118840dex231.htm |
| EX-21.1 - EX-21.1 - SLR Investment Corp. | d118840dex211.htm |
| EX-14.1 - EX-14.1 - SLR Investment Corp. | d118840dex141.htm |
| EX-4.4 - EX-4.4 - SLR Investment Corp. | d118840dex44.htm |
Table of Contents
UNITED STATES
SECURITIES AND EXCHANGE COMMISSION
WASHINGTON, D.C. 20549
FORM 10-K
| ☒ | ANNUAL REPORT PURSUANT TO SECTION 13 OR 15(d) OF THE SECURITIES EXCHANGE ACT OF 1934 |
FOR THE FISCAL YEAR ENDED DECEMBER 31, 2020
OR
| ☐ | TRANSITION REPORT PURSUANT TO SECTION 13 OR 15(d) OF THE SECURITIES EXCHANGE ACT OF 1934 |
FOR THE TRANSITION PERIOD FROM TO
COMMISSION FILE NUMBER: 814-00754
SOLAR CAPITAL LTD.
(Exact name of registrant as specified in its charter)
| Maryland | 26-1381340 | |
| (State of Incorporation) | (I.R.S. Employer Identification Number) | |
| 500 Park Avenue New York, N.Y. |
10022 | |
| (Address of principal executive offices) | (Zip Code) | |
Registrant’s telephone number, including area code: (212) 993-1670
Securities registered pursuant to Section 12(b) of the Act:
| Title of Each Class |
Trading Symbol |
Name of Each Exchange on Which Registered | ||
| Common Stock, par value $0.01 per share | SLRC | The NASDAQ Global Select Market |
Securities registered pursuant to Section 12(g) of the Act: None
Indicate by check mark if the registrant is a well-known seasoned issuer, as defined in Rule 405 of the Securities Act. Yes ☒ No ☐
Indicate by check mark if the registrant is not required to file reports pursuant to Section 13 or Section 15(d) of the Act. Yes ☐ No ☒
Indicate by check mark whether the Registrant (1) has filed all reports required to be filed by Section 13 or 15(d) of the Securities Exchange Act of 1934 during the preceding 12 months (or for such shorter period that the Registrant was required to file such reports), and (2) has been subject to such filing requirements for the past 90 days. Yes ☒ No ☐
Indicate by check mark whether the registrant has submitted electronically every Interactive Data File required to be submitted pursuant to Rule 405 of Regulation S-T during the preceding 12 months (or for such shorter period that the registrant was required to submit such files). Yes ☐ No ☐
Indicate by check mark whether the registrant is a large accelerated filer, an accelerated filer, a non-accelerated filer, a smaller reporting company or an emerging growth company. See the definitions of “large accelerated filer,” “accelerated filer”, “smaller reporting company” and “emerging growth company” in Rule 12b-2 of the Exchange Act.
| Large accelerated filer | ☒ | Accelerated filer | ☐ | |||
| Non-accelerated filer | ☐ | Smaller Reporting Company | ☐ | |||
| Emerging growth company | ☐ | |||||
If an emerging growth company, indicate by check mark if the registrant has elected not to use the extended transition period for complying with any new or revised financial accounting standards provided pursuant to Section 13(a) of the Exchange Act. ☐
Indicate by check mark whether the registrant has filed a report on and attestation to its management’s assessment of the effectiveness of its internal control over financial reporting under Section 404(b) of the Sarbanes-Oxley Act (15 U.S.C. 7262(b)) by the registered public accounting firm that prepared or issued its audit report. Yes ☒ No ☐
Indicate by check mark whether the registrant is a shell company (as defined in Rule 12b-2 of the Act) Yes ☐ No ☒
The aggregate market value of common stock held by non-affiliates of the Registrant on June 30, 2020 based on the closing price on that date of $16.01 on the NASDAQ Global Select Market was approximately $631.3 million. For the purposes of calculating this amount only, all directors and executive officers of the Registrant have been treated as affiliates. There were 42,260,826 shares of the Registrant’s common stock outstanding as of February 23, 2021.
Table of Contents
SOLAR CAPITAL LTD.
FORM 10-K
FOR THE FISCAL YEAR ENDED DECEMBER 31, 2020
| Page | ||||||
| PART I | ||||||
| Item 1. |
1 | |||||
| Item 1A. |
28 | |||||
| Item 1B. |
69 | |||||
| Item 2. |
69 | |||||
| Item 3. |
69 | |||||
| Item 4. |
69 | |||||
| PART II | ||||||
| Item 5. |
70 | |||||
| Item 6. |
75 | |||||
| Item 7. |
Management’s Discussion and Analysis of Financial Condition
and Results of |
76 | ||||
| Item 7A. |
96 | |||||
| Item 8. |
97 | |||||
| Item 9. |
Changes in and Disagreements With Accountants on Accounting and Financial Disclosure |
138 | ||||
| Item 9A. |
138 | |||||
| Item 9B. |
138 | |||||
| PART III | ||||||
| Item 10. |
139 | |||||
| Item 11. |
144 | |||||
| Item 12. |
Security Ownership of Certain Beneficial Owners and Management and Related Stockholder Matters |
146 | ||||
| Item 13. |
Certain Relationships and Related Transactions, and Director Independence |
147 | ||||
| Item 14. |
150 | |||||
| PART IV | ||||||
| Item 15. |
152 | |||||
| Item 16. |
154 | |||||
| 155 | ||||||
Table of Contents
PART I
| Item 1. | Business |
Solar Capital Ltd. (“Solar”, “Solar Capital”, the “Company”, “we” or “our”), a Maryland corporation formed in November 2007, is a closed-end, externally managed, non-diversified management investment company that has elected to be regulated as a business development company (“BDC”) under the Investment Company Act of 1940, as amended (the “1940 Act”). Furthermore, as the Company is an investment company, it continues to apply the guidance in FASB Accounting Standards Codification (“ASC”) Topic 946. In addition, for U.S. federal income tax purposes, the Company has elected to be treated, and intends to qualify annually, as a regulated investment company (“RIC”) under Subchapter M of the Internal Revenue Code of 1986, as amended (the “Code”).
In February 2010, we completed our initial public offering and a concurrent private offering of shares to our senior management team.
We invest primarily in privately held U.S. middle-market companies, where we believe the supply of primary capital is limited and the investment opportunities are most attractive. Our investment objective is to generate both current income and capital appreciation through debt and equity investments. We invest primarily in leveraged middle-market companies in the form of senior secured loans, stretch-senior loans, financing leases and to a lesser extent, unsecured loans and equity securities. We define “middle market” to refer to companies with annual revenues typically between $50 million and $1 billion. Our investments in stretch-senior loans represent loans where the amount of senior debt of the portfolio company is larger than a traditional senior secured loan but is less than a unitranche loan. From time to time, we may also invest directly in the debt and equity of public companies that are thinly traded and such investments will not be limited to any minimum or maximum market capitalization. In addition, we may invest in foreign markets, including emerging markets. Our business is focused primarily on the direct origination of investments through portfolio companies or their financial sponsors. Our investments generally range between $5 million and $100 million each, although we expect that this investment size will vary proportionately with the size of our capital base and/or with strategic initiatives.
In addition, we may invest a portion of our portfolio in other types of investments, which we refer to as opportunistic investments, which are not our primary focus but are intended to enhance our overall returns. These investments may include, but are not limited to, direct investments in public companies that are not thinly traded and securities of leveraged companies located in select countries outside of the United States. The securities that we invest in are typically rated below investment grade. Securities rated below investment grade are often referred to as “leveraged loans,” “high yield” or “junk” securities, and may be considered “high risk” compared to debt instruments that are rated investment grade. In addition, some of our debt investments will not fully amortize during their lifetime, which means that a borrower may be unable to payoff its debt due to bankruptcy or other reasons and therefore we may write-off such debt investment prior to its scheduled maturity. Upon such an occurrence, we may realize a loss or a substantial amount of unpaid principal and interest due upon maturity.
Our investment activities are managed by Solar Capital Partners, LLC (“Solar Capital Partners” or the “Investment Adviser”) and supervised by our board of directors, a majority of whom are non-interested, as such term is defined in the 1940 Act. Solar Capital Management, LLC (“Solar Capital Management”) provides the administrative services necessary for us to operate.
As of December 31, 2020, our investment portfolio totaled $1.5 billion and our net asset value was $852.0 million. Our portfolio was comprised of debt and equity investments in 105 portfolio companies.
During the fiscal year ended December 31, 2020, we invested approximately $427 million in 40 portfolio companies. Investments sold or prepaid during the fiscal year ended December 31, 2020 totaled approximately $363 million.
1
Table of Contents
Solar Capital Partners
Solar Capital Partners, our investment adviser, is controlled and led by Michael S. Gross, our Chairman and Co-Chief Executive Officer, and Bruce Spohler, our Co-Chief Operating Officer and Chief Operating Officer. They are supported by a team of investment professionals. Solar Capital Partners’ investment team has extensive experience in leveraged lending and private equity, as well as significant contacts with financial sponsors.
In addition, at December 31, 2020, Solar Capital Partners serves as investment adviser to private funds and managed accounts as well as to Solar Senior Capital Ltd. (or “Solar Senior”), another publicly traded BDC that primarily invests directly and indirectly in leveraged, private middle market companies in the form of senior secured loans, including first lien and stretch-senior debt instruments, and SCP Private Credit Income BDC LLC, an unlisted BDC that primarily invests in first lien and stretch first lien loans to upper middle market private leveraged companies. Through December 31, 2020, the investment team led by Messrs. Gross and Spohler has invested approximately $10.0 billion in more than 400 different portfolio companies involving over 200 different financial sponsors. As of February 22, 2021, Mr. Gross and Mr. Spohler beneficially owned, either directly or indirectly, approximately 6.3% of our outstanding common stock.
Mr. Gross has over 25 years of experience in the private equity, distressed debt and mezzanine i.e., actually or structurally subordinated lending businesses and has been involved in originating, structuring, negotiating, consummating and managing private equity, distressed debt and mezzanine lending transactions. Prior to his current role as our Chairman, Co-Chief Executive Officer and President, Mr. Gross founded Apollo Investment Corporation, a publicly traded BDC. He served as its chairman from February 2004 to July 2006 and its chief executive officer from February 2004 to February 2006. Under his management, Apollo Investment Corporation raised approximately $930 million in gross proceeds in an initial public offering in April 2004, built a dedicated investment team and infrastructure and invested approximately $2.3 billion in over 65 companies in conjunction with 50 different private equity sponsors. Mr. Gross is also a founder and a former senior partner of Apollo Management, L.P., a leading private equity firm. During his tenure at Apollo Management, L.P., Mr. Gross was a member of the investment committee that was responsible for overseeing more than $13 billion of investments in over 150 companies.
Mr. Gross also currently serves on the boards of directors of three public companies, and in the past has served on the boards of directors of more than 20 public and private companies. As a result, Mr. Gross has developed an extensive network of private equity sponsor relationships as well as relationships with management teams of public and private companies, investment bankers, attorneys and accountants that we believe should provide us with significant business opportunities.
We also rely on the over 25 years of experience of Mr. Spohler, who has served as our Chief Operating Officer and a partner of Solar Capital Partners since its inception and as Co-Chief Executive Officer since June 2019. Previously, Mr. Spohler was a managing director and a former co-head of U.S. Leveraged Finance for CIBC World Markets. He held numerous senior roles at CIBC World Markets, including serving on the U.S. Management Committee, Global Executive Committee and the Deals Committee, which approves all of CIBC World Markets’ U.S. corporate finance debt capital decisions. During Mr. Spohler’s tenure, he was responsible for senior loan, high yield and mezzanine origination and execution, as well as CIBC World Markets’ below investment grade loan portfolio in the United States. As a co-head of U.S. Leveraged Finance, Mr. Spohler oversaw over 300 capital raising and merger and acquisition transactions, comprising over $40 billion in market capitalization.
Solar Capital Partners’ senior investment professionals have been active participants in the primary and secondary leveraged credit markets throughout their careers. They have effectively managed portfolios of senior secured, distressed and mezzanine debt as well as other investment types. The depth of their prior experience and credit market expertise has led them through various stages of the economic cycle as well as several market disruptions.
2
Table of Contents
Solar Capital Management
Pursuant to an administration agreement (the “Administration Agreement”), Solar Capital Management furnishes us with office facilities, equipment and clerical, bookkeeping and record keeping services at such facilities. Under the Administration Agreement, Solar Capital Management also performs, or oversees the performance of, our required administrative services, which include, among other things, being responsible for the financial records which we are required to maintain and preparing reports to our stockholders. In addition, Solar Capital Management assists us in determining and publishing our net asset value, oversees the preparation and filing of our tax returns and the printing and dissemination of reports to our stockholders, and generally oversees the payment of our expenses and the performance of administrative and professional services rendered to us by others. Solar Capital Management also provides managerial assistance, if any, on our behalf to those portfolio companies that request such assistance.
License Agreement
We have entered into a license agreement with Solar Capital Partners pursuant to which Solar Capital Partners has agreed to grant us a non-exclusive, royalty-free license to use the name “Solar Capital.” Under this agreement, we have a right to use the Solar Capital name for so long as the Investment Advisory and Management Agreement with our investment adviser is in effect. Other than with respect to this limited license, we will have no legal right to the “Solar Capital” name.
Market Opportunity
Solar Capital invests directly and indirectly in leveraged middle-market companies, including in senior secured loans, stretch-senior loans and to a lesser extent, unsecured loans and equity securities. We believe that the size of this market, coupled with leveraged companies’ need for flexible sources of capital at attractive terms and rates, creates an attractive investment environment for us.
| • | Middle-market companies continue to face increasing difficulty in accessing the capital markets. While many middle-market companies were formerly able to raise funds by issuing high-yield bonds, we believe this approach to financing has become more difficult in recent years as institutional investors have sought to invest in larger, more liquid offerings. In addition, many private finance companies that historically financed their lending and investing activities through securitization transactions have lost that source of funding and reduced lending significantly. Moreover, consolidation of lenders and market participants and the illiquid nature of investments have resulted in fewer middle-market lenders and market participants. |
| • | There is a large pool of uninvested private equity capital likely to seek additional capital to support their investments. We believe there is more than $600 billion of uninvested private equity capital seeking debt financing to support acquisitions. |
| • | The significant amount of debt maturing through 2024 should provide additional demand for capital. A high volume of financings are expected to mature over the next few years. We believe that this supply of prospective lending opportunities coupled with a lack of available credit in the middle-market lending space may offer attractive risk-adjusted returns to investors. Risk-adjusted return compares returns against the amount of risk incurred. The term “risk-adjusted return” does not imply that an investment is no risk or low risk. |
| • | Investing in private middle-market debt provides an attractive risk reward profile. In general, terms for illiquid, middle-market subordinated debt have been more attractive than those for larger corporations which are typically more liquid. We believe this is because fewer institutions are able to invest in illiquid asset classes. |
3
Table of Contents
Therefore, we believe that there is an attractive opportunity to invest in leveraged middle-market companies, including in senior secured loans, stretch-senior loans, unitranche loans and to a lesser extent, unsecured loans and equity securities, and that we are well positioned to serve this market.
Competitive Advantages and Strategy
We believe that we have the following competitive advantages over other providers of financing to leveraged companies.
Management Expertise
As managing partner, Mr. Gross has principal management responsibility for Solar Capital Partners, to which he currently dedicates substantially all of his time. Mr. Gross has over 25 years of experience in leveraged finance, private equity and distressed debt investing. Mr. Spohler, our Co-Chief Executive Officer, Chief Operating Officer and a partner of Solar Capital Partners, has over 25 years of experience in evaluating and executing leverage finance transactions.
Investment Capacity
The proceeds from our public offerings and the Concurrent Private Placement, the borrowing capacity under the senior secured credit facility led by Citibank, N.A. (the “Credit Facility”), our $50 million NEFPASS SPV credit facility (the “NEFPASS Facility”), our $75 million of unsecured senior notes due 2023 (the “2023 Unsecured Notes”), our $150 million of unsecured senior notes due 2022 (the “2022 Unsecured Notes”), our $21 million of unsecured senior notes due 2022 (the “2022 Tranche C Notes”), our $125 million of unsecured notes due 2024 (the “2024 Unsecured Notes”), our $75 million of unsecured notes due 2026 (the “2026 Unsecured Notes”), the available capital at our significant subsidiaries and the expected repayments of existing portfolio company investments provide us with a substantial amount of capital available for deployment into new investment opportunities. We believe we are well positioned for the current marketplace.
Solar Capital’s Limited Leverage
As of December 31, 2020, we had total outstanding borrowings of approximately $677.0 million. Under the provisions of the 1940 Act, we are permitted to issue senior securities in amounts such that our asset coverage ratio, as defined in the 1940 Act, equals at least 150% of gross assets less all liabilities and indebtedness not represented by senior securities, after each issuance of senior securities. As of December 31, 2020, our asset coverage ratio was 225.9%. We believe our relatively low level of leverage provides us with a competitive advantage as proceeds from our investments are available for reinvestment as opposed to being consumed by debt repayment. We may increase our relative level of debt in the future. However, we do not currently anticipate operating with a substantial amount of debt relative to our total assets.
Proprietary Sourcing and Origination
We believe that Solar Capital Partners’ senior investment professionals’ longstanding relationships with financial sponsors, commercial and investment banks, management teams and other financial intermediaries provide us with a strong pipeline of proprietary origination opportunities. We expect to continue leveraging the relationships Mr. Gross established while sourcing and originating investments at Apollo Investment Corporation (“Apollo”) as well as the financial sponsor relationships Mr. Spohler developed while he was a co-head of CIBC World Markets’ U.S. Leveraged Finance Group.
Versatile Transaction Structuring and Flexibility of Capital
We believe Solar Capital Partners’ senior investment team’s broad expertise and ability to draw upon its extensive experience enable us to identify, assess and structure investments successfully across all levels of a
4
Table of Contents
company’s capital structure and to manage potential risk and return at all stages of the economic cycle. The attempt to manage risk does not imply low risk or no risk. While we are subject to significant regulation as a BDC, we are not subject to many of the regulatory limitations that govern traditional lending institutions such as banks. As a result, we believe that we can be more flexible than such lending institutions in selecting and structuring investments, adjusting investment criteria, transaction structures and, in some cases, the types of securities in which we invest.
Emphasis on Achieving Strong Risk-Adjusted Returns
Solar Capital Partners uses a structured investment and risk management process that emphasizes research and analysis. Solar Capital Partners seeks to build our portfolio on a “bottom-up” basis, choosing and sizing individual positions based on their relative risk/reward profiles as a function of the associated downside risk, volatility, correlation with the existing portfolio and liquidity. At the same time, Solar Capital Partners takes into consideration a variety of factors in managing our portfolio and imposes portfolio-based risk constraints promoting a more diverse portfolio of investments and limiting issuer and industry concentration. We do not pursue short-term origination targets. We believe this approach enables us to build an attractive investment portfolio that meets our return and value criteria over the long term. We believe it is critical to conduct extensive due diligence on investment targets. In evaluating new investments we, through Solar Capital Partners, conduct a rigorous due diligence process.
Dedication of Resources to Industries with Substantial Information Flow
We dedicate our investing resources to industries characterized by strong cash flow and in which Solar Capital Partners’ investment professionals have deep investment experience. As a result of their investment experience, Messrs. Gross and Spohler, together with Solar Capital Partners’ other senior investment professionals, have long-term relationships with management consultants and management teams in the industries we target, as well as substantial information concerning those industries.
Longer Investment Horizon
Unlike private equity and venture capital funds, we will not be subject to standard periodic capital return requirements. Such requirements typically stipulate that the capital of these funds, together with any capital gains on such invested funds, can only be invested once and must be returned to investors after a pre-agreed time period. We believe that our flexibility to make investments with a long-term view and without the capital return requirements of traditional private investment vehicles provides us with the opportunity to generate favorable returns relative to the risks of our invested capital and enables us to be a better long-term partner for our portfolio companies.
Investments
Solar Capital seeks to create a diverse portfolio that includes senior secured loans, stretch-senior loans and to a lesser extent unsecured loans and equity securities by investing approximately $5 million to $100 million of capital, on average, in the securities of leveraged companies, including middle-market companies. We expect that this investment size will vary with the size of our capital base and/or for strategic initiatives. Structurally, unsecured loans usually rank subordinate in priority of payment to senior debt, such as senior bank debt. As such, other creditors may rank senior to us in the event of insolvency. However, unsecured loans rank senior to common and preferred equity in a borrowers’ capital structure. Due to its higher risk profile and often less restrictive covenants as compared to senior loans, unsecured loans generally earn a higher return than senior secured loans.
In addition to senior secured loans, stretch-senior loans and unsecured loans, we may invest a portion of our portfolio in opportunistic investments, which are not our primary focus, but are intended to enhance our returns
5
Table of Contents
to our investors. These investments may include direct investments in public companies that are not thinly traded and securities of leveraged companies located in select countries outside of the United States. The securities that we invest in are typically rated below investment grade. Securities rated below investment grade are speculative and are often referred to as “leveraged loans,” “high yield” or “junk” securities, and may be considered “high risk” compared to debt instruments that are rated investment grade. In addition, some of our debt investments will not fully amortize during their lifetime, which means that a borrower may be unable to payoff its debt due to bankruptcy or other reasons and therefore we may write-off such debt investment prior to its scheduled maturity. Upon such an occurrence, we may realize a loss or a substantial amount of unpaid principal and interest due upon maturity. We may invest up to 30% of our total assets in such opportunistic investments, including loans issued by non-U.S. issuers, subject to compliance with our regulatory obligations as a BDC under the 1940 Act.
We have and will continue to borrow funds to make investments. As a result, we will be exposed to the risks of leverage, which may be considered a speculative investment technique. The use of leverage magnifies the potential for loss on amounts invested and therefore increases the risks associated with investing in our securities. In addition, the costs associated with our borrowings, including any increase in management fees payable to our investment adviser, Solar Capital Partners, will be borne by our common stockholders.
Additionally, we may in the future seek to securitize our loans to generate cash for funding new investments. To securitize loans, we may create a wholly-owned subsidiary and contribute a pool of loans to the subsidiary. This could include the sale of interests in the subsidiary on a non-recourse basis to purchasers who we would expect to be willing to accept a lower interest rate to invest in investment grade loan pools, and we would retain a portion of the equity in the securitized pool of loans.
Moreover, we may acquire investments in the secondary market and, in analyzing such investments, we will employ a substantially similar analytical process as we use for our primary investments.
We may utilize instruments such as forward contracts, currency options and interest rate swaps, caps, collars and floors to seek to hedge against fluctuations in the relative values of our portfolio positions from changes in currency exchange rates and market interest rates. Hedging against a decline in the values of our portfolio positions does not eliminate the possibility of fluctuations in the values of such positions or prevent losses if the values of such positions decline. However, such hedging can establish other positions designed to gain from those same developments, thereby offsetting the decline in the value of such portfolio positions. Such hedging transactions may also limit the opportunity for gain if the values of the underlying portfolio positions should increase. It may not be possible to hedge against an exchange rate or interest rate fluctuation that is so generally anticipated that we are not able to enter into a hedging transaction at an acceptable price. Moreover, for a variety of reasons, we may not seek to establish a perfect correlation between such hedging instruments and the portfolio holdings being hedged. Any such imperfect correlation may prevent us from achieving the intended hedge and expose us to risk of loss. In addition, it may not be possible to hedge fully or perfectly against currency fluctuations affecting the value of securities denominated in non-U.S. currencies because the value of those securities is likely to fluctuate as a result of factors not related to currency fluctuations.
Our principal focus is to provide senior secured loans and stretch-senior loans to leveraged companies in a variety of industries. We generally seek to target companies that generate positive cash flows and/or have substantial assets that secure our loans. We generally seek to invest in companies from the broad variety of industries in which our investment adviser has direct expertise.
6
Table of Contents
The following is a representative list of the industries in which we may invest:
| • Aerospace & Defense
• Air Freight & Logistics
• Airlines
• Asset Management
• Automobiles
• Building Products
• Capital Markets
• Chemicals
• Commercial Services & Supplies
• Communications Equipment
• Construction & Engineering
• Consumer Finance
• Containers & Packaging
• Distributors
• Diversified Consumer Services
• Diversified Financial Services
• Diversified Real Estate Activities
• Diversified Telecommunications Services
• Education Services
• Energy Equipment & Services
• Food Products
• Footwear
• Health Care Equipment & Supplies
• Health Care Facilities
• Health Care Providers & Services
• Health Care Technology
• Hotels, Restaurants & Leisure |
• Household & Personal Products
• Industrial Conglomerates
• Insurance
• Internet Services & Infrastructure
• IT Services
• Leisure Equipment & Products
• Life SciencesTools & Services
• Machinery
• Media
• Metals & Mining
• Multiline Retail
• Multi-Sector Holdings
• Oil, Gas & Consumable Fuels
• Paper & Forest Products
• Personal Products
• Pharmaceuticals
• Professional Services
• Research & Consulting Services
• Road & Rail
• Software
• Specialty Retail
• Textiles, Apparel & Luxury Goods
• Thrifts & Mortgage Finance
• Trading Companies & Distributors
• Utilities
• Wireless Telecommunications Services |
We may also invest in other industries if we are presented with attractive opportunities.
We may invest, to the extent permitted by law, in the securities and instruments of other investment companies, including private funds. We may also participate in negotiated co-investment transactions with certain affiliates, each of whose investment adviser is Solar Capital Partners, or an investment adviser controlling, controlled by or under common control with Solar Capital Partners and is registered as an investment adviser under the Investment Advisers Act of 1940, as amended (the “Advisers Act”), in a manner consistent with our investment objective, positions, policies, strategies and restrictions as well as regulatory requirements and other pertinent factors, and pursuant to the conditions of the most recent exemptive order obtained from the SEC on June 13, 2017 (the “Exemptive Order”). Pursuant to the Exemptive Order, we are permitted to co-invest with our affiliates if a “required majority” (as defined in Section 57(o) of the 1940 Act) of our independent directors make certain conclusions in connection with a co-investment transaction, including, but not limited to,
7
Table of Contents
that (1) the terms of the potential co-investment transaction, including the consideration to be paid, are reasonable and fair to us and our stockholders and do not involve overreaching in respect of us or our stockholders on the part of any person concerned, and (2) the potential co-investment transaction is consistent with the interests of our stockholders and is consistent with our then-current investment objective and strategies.
At December 31, 2020, our portfolio consisted of 105 portfolio companies and was invested 18.8% in cash flow senior secured loans, 27.0% in asset-based senior secured loans / Crystal Financial LLC (“Crystal”), 14.2% in Kingsbridge Holdings LLC (“KBH”), 18.6% in equipment senior secured financings / NEF Holdings, LLC (“NEF”), and 21.4% in life science senior secured loans, in each case, measured at fair value. We expect that our portfolio will continue to include primarily senior secured, stretch-senior, financing leases and to a lesser extent, unsecured loans and equity securities. In addition, we also expect to invest a portion of our portfolio in opportunistic investments, which are not our primary focus, but are intended to enhance our risk-adjusted returns to stockholders. These investments may include, but are not limited to, securities of public companies and debt and equity securities of companies located outside of the United States.
While our primary investment objective is to maximize current income and capital appreciation through investments in U.S. senior and subordinated loans, other debt securities and equity, we may also invest a portion of the portfolio in opportunistic investments, including foreign securities.
Listed below are our top ten portfolio companies and industries based on their fair value and represented as a percentage of total assets as of December 31, 2020 and December 31, 2019:
TOP TEN PORTFOLIO COMPANIES AND INDUSTRIES AS OF DECEMBER 31, 2020
| Portfolio Company |
% of Total Assets |
|||
| Crystal Financial LLC* |
15.3 | % | ||
| Kingsbridge Holdings, LLC* |
11.2 | % | ||
| NEF Holdings, LLC* |
6.7 | % | ||
| GenMark Diagnostics, Inc. |
2.6 | % | ||
| Rubius Therapeutics, Inc. |
2.1 | % | ||
| KORE Wireless Group, Inc. |
1.9 | % | ||
| Varilease Finance, Inc. |
1.9 | % | ||
| PhyMed Management LLC |
1.6 | % | ||
| Cardiva Medical, Inc. |
1.5 | % | ||
| Pet Holdings ULC & Pet Supermarket Inc. |
1.5 | % | ||
| * | Denotes investments in which we are deemed to exercise a controlling influence over the management or policies of a company, as defined in the 1940 Act, due to beneficially owning, either directly or through one or more controlled companies, more than 25% of the outstanding voting securities of the investment. |
| Industry |
% of Total Assets |
|||
| Multi-Sector Holdings |
21.8 | % | ||
| Diversified Financial Services |
15.6 | % | ||
| Health Care Providers & Services |
8.7 | % | ||
| Pharmaceuticals |
7.4 | % | ||
| Health Care Equipment & Supplies |
6.9 | % | ||
| Commercial Services & Supplies |
3.2 | % | ||
| Specialty Retail |
2.7 | % | ||
| Wireless Telecommunication Services |
1.9 | % | ||
| Road & Rail |
1.8 | % | ||
| Communications Equipment |
1.8 | % | ||
8
Table of Contents
TOP TEN PORTFOLIO COMPANIES AND INDUSTRIES AS OF DECEMBER 31, 2019
| Portfolio Company |
% of Total Assets |
|||
| Crystal Financial LLC* |
15.2 | % | ||
| NEF Holdings, LLC* |
7.4 | % | ||
| Genmark Diagnostics, Inc. |
2.6 | % | ||
| Falmouth Group Holdings Corp. (AMPAC) |
1.9 | % | ||
| KORE Wireless Group, Inc. |
1.9 | % | ||
| Varilease Finance, Inc. |
1.9 | % | ||
| Kingsbridge Holdings, LLC |
1.7 | % | ||
| PhyMed Management LLC |
1.7 | % | ||
| MRI Software, Inc. |
1.6 | % | ||
| Equipment Operating Leases LLC* |
1.5 | % | ||
| * | Denotes investments in which we are deemed to exercise a controlling influence over the management or policies of a company, as defined in the 1940 Act, due to beneficially owning, either directly or through one or more controlled companies, more than 25% of the outstanding voting securities of the investment. |
| Industry |
% of Total Assets |
|||
| Diversified Financial Services |
15.4 | % | ||
| Multi-Sector Holdings |
13.3 | % | ||
| Health Care Providers & Services |
10.0 | % | ||
| Pharmaceuticals |
6.6 | % | ||
| Health Care Equipment & Supplies |
5.6 | % | ||
| Software |
3.2 | % | ||
| Commercial Services & Supplies |
2.2 | % | ||
| Media |
2.0 | % | ||
| Wireless Telecommunication Services |
1.9 | % | ||
| Chemicals |
1.9 | % | ||
Set forth below is a brief description of each portfolio company in which we have made an investment that represents greater than 5% of our total assets as of December 31, 2020.
Crystal Financial LLC
We currently hold Crystal Financial LLC is an independent commercial finance company that provides primarily senior secured loans for both asset-based and cash flow financings to middle-market companies. Its team of experienced, responsive professionals has underwritten, closed and managed more than $20 billion in secured debt commitments across a wide range of industries. As of December 31, 2020, Crystal Financial LLC had 30 funded commitments to 24 different issuers with total funded loans of approximately $404.1 million on total assets of $433.9 million. Crystal’s competitors include other specialty finance companies and small banks. As with any lender, Crystal is exposed to interest rate risk, which it mostly mitigates by issuing loans with floating rates.
NEF Holdings, LLC
On July 31, 2017, the Company completed the acquisition of NEF Holdings, which conducts its business through its wholly-owned subsidiary Nations Equipment Finance, LLC. NEF Holdings is an independent equipment finance company that provides senior secured loans and leases primarily to U.S. based companies. The Company invested $209.9 million in cash to effect the transaction, of which $145.0 million was invested in
9
Table of Contents
the equity of NEF Holdings through our wholly-owned consolidated taxable subsidiary NEFCORP LLC and our wholly-owned consolidated subsidiary NEFPASS LLC and $64.9 million was used to purchase certain leases and loans held by NEF Holdings through NEFPASS LLC. At July 31, 2017, NEF Holdings also had two securitizations outstanding, with an issued note balance of $94.6 million, which were later redeemed in 2018. As of December 31, 2020, NEF had 138 funded equipment-backed leases and loans to 61 different customers with a total net investment in leases and loans of approximately $188.5 million on total assets of $263.4 million.
Kingsbridge Holdings, LLC
On November 3, 2020, the Company acquired 87.5% of Kingsbridge Holdings, LLC (“KBH”) through KBH Topco LLC (“KBHT”), a newly formed Delaware corporation. KBH is a residual focused independent mid-ticket lessor of equipment primarily to U.S. investment grade companies. The Company invested $216.6 million to effect the transaction, of which $136.6 million was invested to acquire 87.5% of KBHT’s equity and $80.0 million in KBH’s debt. The existing management team of KBH committed to continue to lead KBH after the transaction. Post the transaction, the Company owns 87.5% of KBHT equity and the KBH management team owns the remaining 12.5% of KBHT’s equity. As of December 31, 2020, KBHT had total assets of $744.7 million.
Investment Selection Process
Solar Capital Partners is committed to and utilizes a value-oriented investment philosophy with a focus on the preservation of capital and a commitment to managing downside exposure.
Portfolio Company Characteristics
We have identified several criteria that we believe are important in identifying and investing in prospective portfolio companies. These criteria provide general guidelines for our investment decisions; however, not all of these criteria will be met by each prospective portfolio company in which we choose to invest.
Stable Earnings and Strong Free Cash Flow. We seek to invest in companies who have demonstrated stable earnings through economic cycles. We target companies that can de-lever through consistent generation of cash flows rather than relying solely on growth to service and repay our loans.
Value Orientation. Our investment philosophy places a premium on fundamental analysis from an investor’s perspective and has a distinct value orientation. We focus on companies in which we can invest at relatively low multiples of operating cash flow and that are profitable at the time of investment on an operating cash flow basis.
Value of Assets. The prospective value of the assets, if any, that collateralizes the loans in which we invest, is an important factor in our credit analysis. Our analysis emphasizes both tangible assets, such as accounts receivable, inventory, equipment and real estate, and intangible assets, such as intellectual property, customer lists, networks and databases. In some of our transactions the company’s fundings may be derived from a borrowing base determined by the value of the company’s assets.
Strong Competitive Position in Industry. We seek to invest in target companies that have developed leading market positions within their respective markets and are well positioned to capitalize on growth opportunities. We seek companies that demonstrate significant competitive advantages versus their competitors, which we believe should help to protect their market position and profitability.
Diversified Customer and Supplier Base. We seek to invest in businesses that have a diversified customer and supplier base. We believe that companies with a diversified customer and supplier base are generally better able to endure economic downturns, industry consolidation, changing business preferences and other factors that may negatively impact their customers, suppliers and competitors.
10
Table of Contents
Exit Strategy. We predominantly invest in companies which provide multiple alternatives for an eventual exit. We look for opportunities that provide an exit typically within three years of the initial capital commitment.
We generally seek companies that we believe will have or provide a steady stream of cash flow to repay our loans and reinvest in their respective businesses. We believe that such internally generated cash flow, leading to the payment of our interest, and the repayment of our principal, represent a key means by which we will be able to exit from our investments over time.
In addition, we also seek to invest in companies whose business models and expected future cash flows or cash positions offer attractive exit possibilities. These companies include candidates for strategic acquisition by other industry participants and companies that may repay our investments through an initial public offering of common stock or another capital market transaction. We underwrite our investments on a held-to-maturity basis, but expensive capital is often repaid prior to stated maturity.
Experienced and Committed Management. We generally require that portfolio companies have an experienced management team. We also require portfolio companies have in place proper incentives to induce management to succeed and to act in concert with our interests as investors, including having significant equity interests.
Strong Sponsorship. We generally aim to invest alongside other sophisticated investors. We typically seek to partner with successful financial sponsors who have historically generated high returns. We believe that investing in these sponsors’ portfolio companies enables us to benefit from their direct involvement and due diligence.
Solar Capital’s investment team works in concert with sponsors to proactively manage investment opportunities by acting as a partner throughout the investment process. We actively focus on the middle-market financial sponsor community, with a particular focus on the upper-end of the middle-market (sponsors with equity funds of $500 million to $5 billion). We favor such sponsors because they typically:
| • | buy larger companies with strong business franchises; |
| • | invest significant amounts of equity in their portfolio companies; |
| • | value flexibility and creativity in structuring their transactions; |
| • | possess longer track records over multiple investment funds; |
| • | have a deeper management bench; |
| • | have better ability to withstand downturns; and |
| • | possess the ability to support portfolio companies with additional capital. |
We divide our coverage of these sponsors among our more senior investment professionals, who are responsible for day-to-day interaction with financial sponsors. Our coverage approach aims to act proactively, consider all investments in the capital structure, provide quick feedback, deliver on commitments, and are constructive throughout the life cycle of an investment.
Due Diligence
Our “private equity” approach to credit investing typically incorporates extensive in-depth due diligence often alongside the private equity sponsor. In conducting due diligence, we will use publicly available information as well as information from relationships with former and current management teams, consultants, competitors and investment bankers. We believe that our due diligence methodology allows us to screen a high volume of potential investment opportunities on a consistent and thorough basis.
11
Table of Contents
Our due diligence typically includes:
| • | review of historical and prospective financial information; |
| • | review and valuation of assets; |
| • | research relating to the company’s management, industry, markets, products and services and competitors; |
| • | on-site visits; |
| • | discussions with management, employees, customers or vendors of the potential portfolio company; |
| • | review of senior loan documents; and |
| • | background investigations. |
We also expect to evaluate the private equity sponsor making the investment. Further, due to Solar Capital Partners’ considerable repeat business with sponsors, we have direct experience with the management teams of many sponsors. A private equity sponsor is typically the controlling stockholder upon completion of an investment and as such is considered critical to the success of the investment. The equity sponsor is evaluated along several key criteria, including:
| • | investment track record; |
| • | industry experience; |
| • | capacity and willingness to provide additional financial support to the company through additional capital contributions, if necessary; and |
| • | reference checks. |
Throughout the due diligence process, a deal team is in constant dialogue with the management team of the company in which we are considering to invest to ensure that any concerns are addressed as early as possible through the process and that unsuitable investments are filtered out before considerable time has been invested.
Upon the completion of due diligence and a decision to proceed with an investment in a company, the investment professionals leading the investment present the investment opportunity to Solar Capital Partners’ investment committee, which then determines whether to pursue the potential investment. Additional due diligence with respect to any investment may be conducted on our behalf by attorneys and independent accountants prior to the closing of the investment, as well as other outside advisers, as appropriate.
The Investment Committee
All new investments are required to be approved by a consensus of the investment committee of Solar Capital Partners, which is led by Messrs. Gross and Spohler. The members of Solar Capital Partners’ investment committee receive no compensation from us. Such members may be employees or partners of Solar Capital Partners and may receive compensation or profit distributions from Solar Capital Partners.
Investment Structure
Once we determine that a prospective portfolio company is suitable for investment, we work with the management of that company and its other capital providers, including senior, junior and equity capital providers, to structure an investment. We negotiate among these parties to agree on how our investment is expected to perform relative to the other capital in the portfolio company’s capital structure.
12
Table of Contents
Solar Capital seeks to create a diverse portfolio that includes senior secured loans, stretch-senior loans and to a lesser extent, unsecured loans and equity securities by investing approximately $5 million to $100 million of capital. With respect to our senior secured loans, we seek to obtain security interests in the assets of our portfolio companies that serve as collateral in support of the repayment of these loans. This collateral may take the form of first or second priority liens on the assets of a portfolio company.
We structure our unsecured loans primarily subordinated loans that provide for relatively high, fixed or floating interest rates that provide us with significant current interest income. These loans typically have interest-only payments in the early years, with amortization of principal, if any, deferred to the later years of the unsecured loans. In some cases, we may enter into loans that, by their terms, convert into equity or additional debt securities or defer payments of interest for the first few years after our investment. Also, in some cases our unsecured loans may be collateralized by a subordinated lien on some or all of the assets of the borrower.
Typically, our senior secured and unsecured loans have final maturities of five to ten years. However, we expect that our portfolio companies often may repay these loans early, generally within three to four years from the date of initial investment. In some cases and when available, we seek to structure these loans with prepayment premiums to capture foregone interest.
In the case of our senior secured and unsecured loan investments, we tailor the terms of the investment to the facts and circumstances of the transaction and the prospective portfolio company, negotiating a structure that protects our rights and manages our risk while creating incentives for the portfolio company to achieve its business plan and improve its profitability. For example, in addition to seeking a senior or fulcrum position in the capital structure of our portfolio companies, we will seek to limit the downside potential of our investments by:
| • | requiring a total return on our investments (including both interest and potential capital appreciation) that compensates us for credit risk; |
| • | incorporating “put” rights and call protection into the investment structure; and |
| • | negotiating covenants in connection with our investments that afford our portfolio companies as much flexibility in managing their businesses as possible, consistent with preservation of our capital. Such restrictions may include affirmative and negative covenants, default penalties, lien protection, change of control provisions and board rights, including either observation or participation rights. |
Our investments may include equity features, such as warrants or options to buy a minority interest in the portfolio company. Any warrants we receive with our debt securities generally require only a nominal cost to exercise, and thus, as a portfolio company appreciates in value, we may achieve additional investment return from this equity interest. We may structure the warrants to provide provisions protecting our rights as a minority interest holder, as well as puts, or rights to sell such securities back to the company, upon the occurrence of specified events. In many cases, we also obtain registration rights in connection with these equity securities, which may include demand and “piggyback” registration rights. In addition, we may from time to time make direct equity investments in portfolio companies.
We generally seek to hold most of our investments to maturity or repayment, but will sell our investments earlier, including if a liquidity event takes place such as the sale or recapitalization of a portfolio company.
Ongoing Relationships with Portfolio Companies
Solar Capital Partners monitors our portfolio companies on an ongoing basis. Solar Capital Partners monitors the financial trends of each portfolio company to determine if it is meeting its business plan and to assess the appropriate course of action for each company.
13
Table of Contents
Solar Capital Partners has several methods of evaluating and monitoring the performance and fair value of our investments, which include the following:
| • | Assessment of success in adhering to each portfolio company’s business plan and compliance with covenants; |
| • | Periodic and regular contact with portfolio company management and, if appropriate, the financial or strategic sponsor, to discuss financial position, requirements and accomplishments; |
| • | Comparisons to other Solar Capital invested portfolio companies in the industry, if any; |
| • | Attendance at and participation in board meetings; and |
| • | Review of monthly and quarterly financial statements and financial projections for portfolio companies. |
In addition to various risk management and monitoring tools, Solar Capital Partners also uses an investment rating system to characterize and monitor our expected level of returns on each investment in our portfolio.
We use an investment rating scale of 1 to 4. The following is a description of the conditions associated with each investment rating:
| Investment Rating |
Summary Description | |
| 1 | Involves the least amount of risk in our portfolio, the portfolio company is performing above expectations, and the trends and risk factors are generally favorable (including a potential exit) | |
| 2 | Risk that is similar to the risk at the time of origination, the portfolio company is performing as expected, and the risk factors are neutral to favorable; all new investments are initially assessed a grade of 2 | |
| 3 | The portfolio company is performing below expectations, may be out of compliance with debt covenants, and requires procedures for closer monitoring | |
| 4 | The investment is performing well below expectations and is not anticipated to be repaid in full | |
Solar Capital Partners monitors and, when appropriate, changes the investment ratings assigned to each investment in our portfolio. As of December 31, 2020 and December 31, 2019 the weighted average investment rating on the fair market value of our portfolio was a 2. In connection with our valuation process, Solar Capital Partners reviews these investment ratings on a quarterly basis.
Valuation Procedures
We conduct the valuation of our assets, pursuant to which our net asset value is determined, at all times consistent with GAAP, and the 1940 Act. Our valuation procedures are set forth in more detail below:
Under procedures established by our board of directors (the “Board”), we value investments, including certain senior secured debt, subordinated debt and other debt securities with maturities greater than 60 days, for which market quotations are readily available, at such market quotations (unless they are deemed not to represent fair value). We attempt to obtain market quotations from at least two brokers or dealers (if available, otherwise from a principal market maker or a primary market dealer or other independent pricing service). We utilize mid-market pricing as a practical expedient for fair value unless a different point within the range is more representative. If and when market quotations are deemed not to represent fair value, we may utilize independent third-party valuation firms to assist us in determining the fair value of material assets. Accordingly, such investments go through our multi-step valuation process as described below. In each case, independent valuation firms consider observable market inputs together with significant unobservable inputs in arriving at their
14
Table of Contents
valuation recommendations. Debt investments with maturities of 60 days or less shall each be valued at cost plus accreted discount, or minus amortized premium, which is expected to approximate fair value, unless such valuation, in the judgment of the Investment Adviser, does not represent fair value, in which case such investments shall be valued at fair value as determined in good faith by or under the direction of our Board. Investments that are not publicly traded or whose market quotations are not readily available are valued at fair value as determined in good faith by or under the direction of our Board. Such determination of fair values involves subjective judgments and estimates.
With respect to investments for which market quotations are not readily available or when such market quotations are deemed not to represent fair value, our Board has approved a multi-step valuation process each quarter, as described below:
| (1) | our quarterly valuation process begins with each portfolio company or investment being initially valued by the investment professionals of the Investment Adviser responsible for the portfolio investment; |
| (2) | preliminary valuation conclusions are then documented and discussed with senior management of the Investment Adviser; |
| (3) | independent valuation firms engaged by our Board conduct independent appraisals and review the Investment Adviser’s preliminary valuations and make their own independent assessment for all material assets; |
| (4) | the audit committee of the Board reviews the preliminary valuation of the Investment Adviser and that of the independent valuation firm, if any, and responds to the valuation recommendation of the independent valuation firm to reflect any comments; and |
| (5) | the Board discusses valuations and determines the fair value of each investment in our portfolio in good faith based on the input of the Investment Adviser, the respective independent valuation firm, if any, and the audit committee. |
Investments in all asset classes are valued utilizing a market approach, an income approach, or both approaches, as appropriate. However, in accordance with ASC 820-10, certain investments that qualify as investment companies in accordance with ASC 946, may be valued using net asset value as a practical expedient for fair value. The market approach uses prices and other relevant information generated by market transactions involving identical or comparable assets or liabilities (including a business). The income approach uses valuation approaches to convert future amounts (for example, cash flows or earnings) to a single present amount (discounted). The measurement is based on the value indicated by current market expectations about those future amounts. In following these approaches, the types of factors that we may take into account in fair value pricing our investments include, as relevant: available current market data, including relevant and applicable market trading and transaction comparables, applicable market yields and multiples, security covenants, call protection provisions, the nature and realizable value of any collateral, the portfolio company’s ability to make payments, its earnings and discounted cash flows, the markets in which the portfolio company does business, comparisons of financial ratios of peer companies that are public, M&A comparables, our principal market (as the reporting entity) and enterprise values, among other factors. When available, broker quotations and/or quotations provided by pricing services are considered as an input in the valuation process. For the fiscal year ended December 31, 2020, there has been no change to the Company’s valuation approaches or techniques and the nature of the related inputs considered in the valuation process.
Accounting Standards Codification (“ASC”) Topic 820 classifies the inputs used to measure these fair values into the following hierarchy:
Level 1: Quoted prices in active markets for identical assets or liabilities, accessible by the Company at the measurement date.
15
Table of Contents
Level 2: Quoted prices for similar assets or liabilities in active markets, or quoted prices for identical or similar assets or liabilities in markets that are not active, or other observable inputs other than quoted prices.
Level 3: Unobservable inputs for the asset or liability.
In all cases, the level in the fair value hierarchy within which the fair value measurement in its entirety falls is determined based on the lowest level of input that is significant to the fair value measurement. Our assessment of the significance of a particular input to the fair value measurement in its entirety requires judgment and considers factors specific to each investment. The exercise of judgment is based in part on our knowledge of the asset class and our prior experience.
Determination of fair value involves subjective judgments and estimates. Accordingly, the notes to our consolidated financial statements express the uncertainty with respect to the possible effect of such valuations, and any change in such valuations, on our consolidated financial statements.
Competition
Our primary competitors provide financing to middle-market companies and include other business development companies, commercial and investment banks, commercial financing companies and, to the extent they provide an alternative form of financing, private equity funds. Additionally, alternative investment vehicles, such as hedge funds, frequently invest in middle-market companies. As a result, competition for investment opportunities at middle-market companies can be intense. While many middle-market companies were previously able to raise senior debt financing through traditional large financial institutions, we believe this approach to financing will become more difficult as implementation of U.S. and international financial reforms limits the capacity of large financial institutions to hold non-investment grade leveraged loans on their balance sheets. We believe that many of these financial institutions have de-emphasized their service and product offerings to middle-market companies in particular.
Many of our competitors are substantially larger and have considerably greater financial, technical and marketing resources than we do. For example, some competitors may have a lower cost of funds and access to funding sources that are not available to us. In addition, some of our competitors may have higher risk tolerances or different risk assessments, which could allow them to consider a wider variety of investments and establish more relationships than us. Furthermore, many of our competitors are not subject to the regulatory restrictions that the 1940 Act imposes on us as a BDC. We use the industry information available to Messrs. Gross and Spohler and the other investment professionals of Solar Capital Partners to assess investment risks and determine appropriate pricing for our investments in portfolio companies. In addition, we believe that the relationships of Messrs. Gross and Spohler and the other investment professionals of our investment adviser enable us to learn about, and compete effectively for, financing opportunities with attractive leveraged companies in the industries in which we seek to invest.
Staffing
We do not currently have any employees. Mr. Gross, our Chairman and Co-Chief Executive Officer and President, and Mr. Spohler, our Co-Chief Executive Officer and Chief Operating Officer and board member, are managing members and senior investment professionals of, and have financial and controlling interests in, Solar Capital Partners. In addition, Mr. Peteka, our Chief Financial Officer, Treasurer and Secretary serves as the Chief Financial Officer for Solar Capital Partners. Guy Talarico, our Chief Compliance Officer, is the Chief Executive Officer of Alaric Compliance Services, LLC, and performs his functions as our Chief Compliance Officer under the terms of an agreement between Solar Capital Management and Alaric Compliance Services, LLC. Solar Capital Management has retained Mr. Talarico and Alaric Compliance Services, LLC pursuant to its obligations under our Administration Agreement.
16
Table of Contents
Our day-to-day investment operations are managed by Solar Capital Partners. Based upon its needs, Solar Capital Partners may hire additional investment professionals. In addition, we will reimburse Solar Capital Management for the allocable portion of overhead and other expenses incurred by it in performing its obligations under the Administration Agreement, including rent, and the allocable portion of the cost of the company’s chief compliance officer and chief financial officer and their respective staffs.
Sarbanes-Oxley Act of 2002
The Sarbanes-Oxley Act of 2002 imposes a wide variety of new regulatory requirements on publicly-held companies and their insiders. Many of these requirements affect us. For example:
| • | pursuant to Rule 13a-14 of the Securites Exchange Act of 1934 (the “1934 Act”), our co-chief executive officers and chief financial officer must certify the accuracy of the financial statements contained in our periodic reports; |
| • | pursuant to Item 307 of Regulation S-K, our periodic reports must disclose our conclusions about the effectiveness of our disclosure controls and procedures; |
| • | pursuant to Rule 13a-15 of the 1934 Act, our management is required to prepare an annual report regarding its assessment of our internal control over financial reporting and to obtain an audit of the effectiveness of internal control over financial reporting performed by our independent registered public accounting firm; and |
| • | pursuant to Item 308 of Regulation S-K and Rule 13a-15 of the 1934 Act, our periodic reports must disclose whether there were significant changes in our internal controls over financial reporting or in other factors that could significantly affect these controls subsequent to the date of their evaluation, including any corrective actions with regard to significant deficiencies and material weaknesses. |
The Sarbanes-Oxley Act of 2002 requires us to review our current policies and procedures to determine whether we comply with the Sarbanes-Oxley Act of 2002 and the regulations promulgated thereunder. We will continue to monitor our compliance with all regulations that are adopted under the Sarbanes-Oxley Act of 2002 and will take actions necessary to ensure that we are in compliance therewith.
Business Development Company Regulations
A BDC is regulated by the 1940 Act. A BDC must be organized in the United States for the purpose of investing in or lending to primarily private companies and making significant managerial assistance available to them. A BDC may use capital provided by public stockholders and from other sources to make long-term, private investments in businesses. A BDC provides stockholders the ability to retain the liquidity of a publicly-traded stock while sharing in the possible benefits, if any, of investing in primarily privately owned companies.
We may not change the nature of our business so as to cease to be, or withdraw our election as, a BDC unless authorized by vote of a majority of our outstanding voting securities, as required by the 1940 Act. A majority of the outstanding voting securities of a company is defined under the 1940 Act as the lesser of: (a) 67% or more of such company’s voting securities present at a meeting if more than 50% of the outstanding voting securities of such company are present or represented by proxy, or (b) more than 50% of the outstanding voting securities of such company. We do not anticipate any substantial change in the nature of our business.
As with other companies regulated by the 1940 Act, a BDC must adhere to certain substantive regulatory requirements. A majority of our directors must be persons who are not interested persons, as that term is defined in the 1940 Act. Additionally, we are required to provide and maintain a bond issued by a reputable fidelity insurance company to protect the BDC. Furthermore, as a BDC, we are prohibited from protecting any director or officer against any liability to us or our stockholders arising from willful misfeasance, bad faith, gross negligence or reckless disregard of the duties involved in the conduct of such person’s office.
17
Table of Contents
As a BDC, we are required to meet an asset coverage ratio, reflecting the value of our total assets to our total senior securities, which include all of our borrowings and any preferred stock we may issue in the future, of at least 150%. We may also be prohibited under the 1940 Act from knowingly participating in certain transactions with our affiliates without the prior approval of our directors who are not interested persons and, in some cases, prior approval by the SEC.
We are generally not able to issue and sell our common stock at a price below net asset value per share without annual stockholder approval. We may, however, sell our common stock, or warrants, options or rights to acquire our common stock, at a price below the then-current net asset value of our common stock if our board of directors determines that such sale is in our best interests and the best interests of our stockholders, and our stockholders approve such sale. At our Annual Meeting of Stockholders on October 6, 2020, our stockholders approved a proposal authorizing us to sell up to 25% of our common stock at a price below our then-current asset value per share, subject to the approval by our board of directors for the offering. This authorization expires on the earlier of October 6, 2021 and the date of our 2021 Annual Meeting of Stockholders. In addition, we may generally issue new shares of our common stock at a price below net asset value in rights offerings to existing stockholders, in payment of dividends and in certain other limited circumstances.
As a BDC, we were substantially limited in our ability to co-invest in privately negotiated transactions with affiliated funds until we obtained an exemptive order from the SEC. The most recent exemptive order, received on June 13, 2017 (the “Exemptive Order”), permits us to participate in negotiated co-investment transactions with certain affiliates, each of whose investment adviser is an investment adviser that controls, is controlled by or is under common control with Solar Capital Partners and is registered as an investment adviser under the Advisers Act, in a manner consistent with our investment objective, positions, policies, strategies and restrictions as well as regulatory requirements and other pertinent factors, and pursuant to the conditions to the Exemptive Order. If we are unable to rely on the Exemptive Order for a particular opportunity, such opportunity will be allocated first to the entity whose investment strategy is the most consistent with the opportunity being allocated, and second, if the terms of the opportunity are consistent with more than one entity’s investment strategy, on an alternating basis. Although our investment professionals will endeavor to allocate investment opportunities in a fair and equitable manner, we and our common stockholders could be adversely affected to the extent investment opportunities are allocated among us and other investment vehicles managed or sponsored by, or affiliated with, our executive officers, directors and members of our investment adviser.
We will be periodically examined by the SEC for compliance with the federal securities laws, including the 1940 Act.
Qualifying Assets
Under the 1940 Act, a BDC may not acquire any asset other than assets of the type listed in Section 55(a) of the 1940 Act, which are referred to as qualifying assets, unless, at the time the acquisition is made, qualifying assets represent at least 70% of the BDC’s total assets. The principal categories of qualifying assets relevant to our business are the following:
(1) Securities purchased in transactions not involving any public offering from the issuer of such securities, which issuer (subject to certain limited exceptions) is an eligible portfolio company, or from any person who is, or has been during the preceding 13 months, an affiliated person of an eligible portfolio company, or from any other person, subject to such rules as may be prescribed by the SEC. An eligible portfolio company is defined in the 1940 Act as any issuer which:
(a) is organized under the laws of, and has its principal place of business in, the United States;
(b) is not an investment company (other than a small business investment company wholly owned by the BDC); and
18
Table of Contents
(c) satisfies any of the following:
i. does not have any class of securities that is traded on a national securities exchange;
ii. has a class of securities listed on a national securities exchange, but has an aggregate market value of outstanding voting and non-voting common equity of less than $250 million;
iii. is controlled by a BDC or a group of companies including a BDC and the BDC has an affiliated person who is a director of the eligible portfolio company; or
iv. is a small and solvent company having total assets of not more than $4.0 million and capital and surplus of not less than $2.0 million.
(2) Securities of any eligible portfolio company which we control, which, as defined by the 1940 Act, is presumed to exist where a BDC beneficially owns more than 25% of the outstanding voting securities of the portfolio company.
(3) Securities purchased in a private transaction from a U.S. issuer that is not an investment company or from an affiliated person of the issuer, or in transactions incident thereto, if the issuer is in bankruptcy and subject to reorganization or if the issuer, immediately prior to the purchase of its securities, was unable to meet its obligations as they came due without material assistance other than conventional lending or financing arrangements.
(4) Securities of an eligible portfolio company purchased from any person in a private transaction if there is no ready market for such securities and we already own 60% of the outstanding equity of the eligible portfolio company.
(5) Securities received in exchange for or distributed on or with respect to securities described in (1) through (4) above, or pursuant to the exercise of warrants or rights relating to such securities.
(6) Cash, cash equivalents, U.S. government securities or high-quality debt securities maturing in one year or less from the time of investment.
(7) Office furniture and equipment, interests in real estate and leasehold improvements and facilities maintained to conduct the business operations of the BDC, deferred organization and operating expenses, and other noninvestment assets necessary and appropriate to its operations as a BDC, including notes of indebtedness of directors, officers, employees, and general partners held by a BDC as payment for securities of such company issued in connection with an executive compensation plan described in Section 57(j) of the 1940 Act.
Under Section 55(b) of the 1940 Act, the value of a BDC’s assets shall be determined as of the date of the most recent financial statements filed by such company with the SEC pursuant to Section 13 of the 1934 Act, and shall be determined no less frequently than annually.
Significant Managerial Assistance to Portfolio Companies
As a BDC, we offer, and must provide upon request, significant managerial assistance to our portfolio companies. This assistance could involve, among other things, monitoring the operations of our portfolio companies, participating in board and management meetings, consulting with and advising officers of portfolio companies and providing other organizational and financial guidance. We may also receive fees for these services. Solar Capital Management provides such managerial assistance, if any, on our behalf to portfolio companies that request this assistance.
19
Table of Contents
Temporary Investments
Pending investment in other types of “qualifying assets,” as described above, our investments may consist of cash, cash equivalents, U.S. government securities or high-quality investment grade debt securities maturing in one year or less from the time of investment, which we refer to, collectively, as temporary investments, so that 70% of our assets are qualifying assets. Typically, we will invest in U.S. Treasury bills or in repurchase agreements, provided that such repurchase agreements are fully collateralized by cash or securities issued by the U.S. government or its agencies. A repurchase agreement involves the purchase by an investor, such as us, of a specified security and the simultaneous agreement by the seller to repurchase it at an agreed-upon future date and at a price which is greater than the purchase price by an amount that reflects an agreed-upon interest rate. There is no percentage restriction on the proportion of our assets that may be invested in such repurchase agreements. However, if more than 25% of our total assets constitute repurchase agreements from a single counterparty, we would not meet the diversification tests in order to qualify as a RIC for U.S. federal income tax purposes. Thus, we do not intend to enter into repurchase agreements with a single counterparty in excess of this limit. Our investment adviser will monitor the creditworthiness of the counterparties with which we enter into repurchase agreement transactions.
Senior Securities
We are permitted, under specified conditions, to issue multiple classes of indebtedness and one class of stock senior to our common stock if our asset coverage, as defined in the 1940 Act, is at least equal to 150% immediately after each such issuance. In addition, while certain senior securities remain outstanding, we may be required to make provisions to prohibit any distribution to our stockholders or the repurchase of such securities or shares unless we meet the applicable asset coverage ratios at the time of the distribution or repurchase. We may also borrow amounts up to 5% of the value of our total assets for temporary purposes without regard to asset coverage. We may borrow money, which would magnify the potential for gain or loss on amounts invested and may increase the risk of investing in us.
Code of Ethics
We and Solar Capital Partners have each adopted a code of ethics pursuant to Rule 17j-1 under the 1940 Act and Rule 204A-1 under the Advisers Act, respectively, that establishes procedures for personal investments and restricts certain transactions by our personnel. Our codes of ethics generally do not permit investments by our employees in securities that may be purchased or held by us. Each code of ethics is available on the EDGAR Database on the SEC’s Internet site at http://www.sec.gov. You may also obtain copies of the codes of ethics, after paying a duplicating fee, by electronic request at the following Email address: publicinfo@sec.gov.
Compliance Policies and Procedures
We and our investment adviser have adopted and implemented written policies and procedures reasonably designed to detect and prevent violation of the federal securities laws. We are required to review these compliance policies and procedures annually for their adequacy and the effectiveness of their implementation and to designate a chief compliance officer to be responsible for their administration. Guy Talarico currently serves as our Chief Compliance Officer.
Proxy Voting Policies and Procedures
We have delegated our proxy voting responsibility to our investment adviser. A summary of the Proxy Voting Policies and Procedures of our adviser are set forth below. The guidelines are reviewed periodically by the adviser and our non-interested directors, and, accordingly, are subject to change.
20
Table of Contents
As an investment adviser registered under the Advisers Act, Solar Capital Partners has a fiduciary duty to act solely in the best interests of its clients. As part of this duty, it recognizes that it must vote securities held by its clients in a timely manner free of conflicts of interest. These policies and procedures for voting proxies for investment advisory clients are intended to comply with Section 206 of, and Rule 206(4)-6 under, the Advisers Act.
Our investment adviser votes proxies relating to our portfolio securities in the best interest of our stockholders. Solar Capital Partners reviews on a case-by-case basis each proposal submitted for a proxy vote to determine its impact on our investments. Although it generally votes against proposals that may have a negative impact on our investments, it may vote for such a proposal if there exists compelling long-term reasons to do so. The proxy voting decisions of our investment adviser are made by the senior investment professionals who are responsible for monitoring each of our investments. To ensure that our vote is not the product of a conflict of interest, it requires that: (i) anyone involved in the decision making process disclose to a managing member of Solar Capital Partners any potential conflict that he or she is aware of and any contact that he or she has had with any interested party regarding a proxy vote; and (ii) employees involved in the decision making process or vote administration are prohibited from revealing how we intend to vote on a proposal in order to reduce any attempted influence from interested parties.
You may obtain information about how we voted proxies by making a written request for proxy voting information to: Solar Capital Partners, LLC, 500 Park Avenue, New York, NY 10022.
Privacy Principles
We are committed to maintaining the privacy of our stockholders and to safeguarding their non-public personal information. The following information is provided to help you understand what personal information we may have access to, how we protect that information and why, in certain cases, we may share such information with select other parties.
Generally, we do not receive any non-public personal information relating to our stockholders, although certain non-public personal information of our stockholders may become available to us. We do not disclose any non-public personal information about our stockholders or former stockholders to anyone, except as permitted by law or as is necessary in order to service stockholder accounts (for example, through a transfer agent or proxy solicitor).
We restrict access to non-public personal information about our stockholders to employees of our investment adviser and its affiliates with a legitimate business need for the information. We maintain physical, electronic and procedural safeguards designed to protect the non-public personal information of our stockholders.
Taxation as a Regulated Investment Company
As a BDC, we elected to be treated, and intend to qualify annually, as a RIC under Subchapter M of the Code. As a RIC, we generally will not have to pay corporate-level U.S. federal income taxes on any ordinary income or capital gains that we timely distribute to our stockholders as dividends. To continue to qualify as a RIC, we must, among other things, meet certain source-of-income and asset diversification requirements (as described below). In addition, to qualify for RIC tax treatment we must distribute to our stockholders, for each taxable year, at least 90% of our “investment company taxable income,” which generally is our ordinary income plus the excess of our realized net short-term capital gains over our realized net long-term capital losses (the “Annual Distribution Requirement”). If we qualify as a RIC and satisfy the Annual Distribution Requirement, then we will not be subject to U.S. federal income tax on the portion of our investment company taxable income and net capital gain (i.e., realized net long-term capital gains in excess of realized net short-term capital losses) we distribute (or are deemed to distribute) to stockholders. We will be subject to U.S. federal income tax at the regular corporate rates on any ordinary income or capital gain not distributed (or deemed not distributed) to our stockholders.
21
Table of Contents
We will be subject to a 4% nondeductible U.S. federal excise tax on certain undistributed income unless we distribute in a timely manner an amount at least equal to the sum of (1) 98% of our ordinary income for each calendar year, (2) 98.2% of our capital gain net income for the one-year period ending October 31 in that calendar year and (3) any ordinary income and net capital gains that we recognized in preceding years, but were not distributed during such years, and on which we paid no U.S. federal income tax (the “Excise Tax Avoidance Requirement”).
In order to qualify as a RIC for U.S. federal income tax purposes, we must, among other things:
| • | at all times during each taxable year, have in effect an election to be treated as a BDC under the 1940 Act; |
| • | derive in each taxable year at least 90% of our gross income from (a) dividends, interest, payments with respect to certain securities loans, gains from the sale of stock or other securities or currencies, or other income derived with respect to our business of investing in such stock, securities or currencies and (b) net income derived from an interest in a “qualified publicly traded partnership;” and |
| • | diversify our holdings so that at the end of each quarter of the taxable year: |
| • | at least 50% of the value of our assets consists of cash, cash equivalents, U.S. government securities, securities of other RICs, and other securities if such other securities of any one issuer do not represent more than 5% of the value of our assets or more than 10% of the outstanding voting securities of the issuer; and |
| • | no more than 25% of the value of our assets is invested in (i) the securities, other than U.S. government securities or securities of other RICs, of one issuer, (ii) the securities of two or more issuers that are controlled, as determined under applicable tax rules, by us and that are engaged in the same or similar or related trades or businesses or (iii) the securities of one or more “qualified publicly traded partnerships.” |
We may be required to recognize taxable income in circumstances in which we do not receive cash. For example, if we hold debt obligations that are treated under applicable tax rules as having original issue discount (such as debt instruments with payment-in-kind (“PIK”) interest or, in certain cases, increasing interest rates or debt instruments issued with warrants), we must include in income each year a portion of the original issue discount that accrues over the life of the obligation, regardless of whether cash representing such income is received by us in the same taxable year. Because any original issue discount accrued will be included in our investment company taxable income for the year of accrual, we may be required to make a distribution to our stockholders in order to satisfy the Annual Distribution Requirement, even though we will not have received any corresponding cash amount.
Because we may use debt financing, we will be subject to certain asset coverage ratio requirements under the 1940 Act and financial covenants under loan and credit agreements that could, under certain circumstances, restrict us from making distributions necessary to satisfy the Annual Distribution Requirement. If we are unable to obtain cash from other sources or are otherwise limited in our ability to make distributions, we could fail to qualify for RIC tax treatment and thus become subject to corporate-level U.S. federal income tax.
Certain of our investment practices may be subject to special and complex U.S. federal income tax provisions that may, among other things: (i) disallow, suspend or otherwise limit the allowance of certain losses or deductions; (ii) convert lower taxed long-term capital gain into higher taxed short-term capital gain or ordinary income; (iii) convert an ordinary loss or a deduction into a capital loss (the deductibility of which is more limited); (iv) cause us to recognize income or gain without a corresponding receipt of cash; (v) adversely affect the time as to when a purchase or sale of securities is deemed to occur; (vi) adversely alter the characterization of certain complex financial transactions; and (vii) produce income that will not be qualifying income for purposes of the 90% gross income test described above. We will monitor our transactions and may make certain tax elections in order to mitigate the potential adverse effect of these provisions.
22
Table of Contents
Gain or loss realized by us from the sale or exchange of warrants acquired by us as well as any loss attributable to the lapse of such warrants generally will be treated as capital gain or loss. The treatment of such gain or loss as long-term or short-term will depend on how long we held a particular warrant. Upon the exercise of a warrant acquired by us, our tax basis in the stock purchased under the warrant will equal the sum of the amount paid for the warrant plus the strike price paid on the exercise of the warrant.
Failure to Qualify as a Regulated Investment Company
If we were unable to qualify for treatment as a RIC, we would be subject to U.S. federal income tax on all of our taxable income at regular corporate rates. We would not be able to deduct distributions to stockholders, nor would they be required to be made. Such distributions would be taxable to our stockholders as dividends and, provided certain holding period and other requirements were met, could qualify for treatment as “qualified dividend income” in the hands of non-corporate stockholders (and thus eligible for the current 20% maximum rate) to the extent of our current and accumulated earnings and profits. Subject to certain limitations under the Code, corporate distributees would be eligible for the dividends received deduction. Distributions in excess of our current and accumulated earnings and profits would be treated first as a return of capital to the extent of the stockholder’s tax basis, and any remaining distributions would be treated as a capital gain. To requalify as a RIC in a subsequent taxable year, we would be required to satisfy the RIC qualification requirements for that year and dispose of any earnings and profits from any year in which we failed to qualify as a RIC. Subject to a limited exception applicable to RICs that qualified as such under Subchapter M of the Code for at least one year prior to disqualification and that requalify as a RIC no later than the second year following the non-qualifying year, we could be subject to tax on any unrealized net built-in gains in the assets held by us during the period in which we failed to qualify as a RIC that are recognized within the subsequent 5 years, unless we made a special election to pay corporate-level U.S. federal income tax on such built-in gain at the time of our requalification as a RIC.
Investment Advisory Fees
Pursuant to an investment advisory and management agreement (the “Advisory Agreement”), we have agreed to pay Solar Capital Partners a fee for investment advisory and management services consisting of two components — a base management fee and a performance-based incentive fee.
The base management fee is determined by taking the average value of Solar Capital’s gross assets at the end of the two most recently completed calendar quarters calculated at an annual rate of 1.75% on gross assets up to 200% of the Company’s total net assets as of the immediately preceding quarter end and 1.00% on gross assets that exceed 200% of the Company’s total net assets as of the immediately preceding quarter end. For purposes of computing the base management fee, gross assets exclude temporary assets acquired at the end of each fiscal quarter for purposes of preserving investment flexibility in the next fiscal quarter. Temporary assets include, but are not limited to, U.S. treasury bills, other short-term U.S. government or government agency securities, repurchase agreements or cash borrowings.
The performance-based incentive fee has two parts, as follows: one is calculated and payable quarterly in arrears based on our pre-incentive fee net investment income for the immediately preceding calendar quarter. For this purpose, pre-incentive fee net investment income means interest income, dividend income and any other income (including any other fees (other than fees for providing managerial assistance), such as commitment, origination, structuring, diligence and consulting fees or other fees that we receive from portfolio companies) accrued during the calendar quarter, minus our operating expenses for the quarter (including the base management fee, expenses payable under the Administration Agreement to Solar Capital Management, and any interest expense and dividend paid on any issued and outstanding preferred stock, but excluding the performance-based incentive fee). Pre-incentive fee net investment income includes, in the case of investments with a deferred interest feature (such as original issue discount, debt instruments with pay in kind interest and zero coupon securities), accrued income that we have not yet received in cash. Pre-incentive fee net investment income does not include any realized capital gains, computed net of all realized capital losses or unrealized capital
23
Table of Contents
appreciation or depreciation. Pre-incentive fee net investment income, expressed as a rate of return on the value of our net assets at the end of the immediately preceding calendar quarter, is compared to a hurdle of 1.75% per quarter (7.00% annualized). Our net investment income used to calculate this part of the incentive fee is also included in the amount of our gross assets used to calculate the 1.75% base management fee. We pay Solar Capital Partners an incentive fee with respect to our pre-incentive fee net investment income in each calendar quarter as follows:
| • | no performance-based incentive fee in any calendar quarter in which our pre-incentive fee net investment income does not exceed the hurdle of 1.75%; |
| • | 100% of our pre-incentive fee net investment income with respect to that portion of such pre-incentive fee net investment income, if any, that exceeds the hurdle but is less than 2.1875% in any calendar quarter (8.75% annualized). We refer to this portion of our pre-incentive fee net investment income (which exceeds the hurdle but is less than 2.1875%) as the “catch-up.” The “catch-up” is meant to provide our investment adviser with 20% of our pre-incentive fee net investment income as if a hurdle did not apply if this net investment income exceeds 2.1875% in any calendar quarter; and |
| • | 20% of the amount of our pre-incentive fee net investment income, if any, that exceeds 2.1875% in any calendar quarter (8.75% annualized) is payable to Solar Capital Partners (once the hurdle is reached and the catch-up is achieved, 20% of all pre-incentive fee investment income thereafter is allocated to Solar Capital Partners). |
The following is a graphical representation of the calculation of the income-related portion of the performance-based incentive fee:
Quarterly Incentive Fee Based on Net Investment Income
Pre-incentive fee net investment income
(expressed as a percentage of the value of net assets)
Percentage of pre-incentive fee net investment income
allocated to Solar Capital Partners
These calculations are appropriately pro-rated for any period of less than three months. You should be aware that a rise in the general level of interest rates can be expected to lead to higher interest rates applicable to our debt investments. Accordingly, an increase in interest rates would make it easier for us to meet or exceed the incentive fee hurdle rate and may result in a substantial increase of the amount of incentive fees payable to our investment adviser with respect to pre-incentive fee net investment income.
The second part of the incentive fee is determined and payable in arrears as of the end of each calendar year (or upon termination of the Investment Advisory and Management Agreement, as of the termination date), and equals 20% of our realized capital gains, if any, on a cumulative basis from inception through the end of each calendar year, computed net of all realized capital losses and unrealized capital depreciation on a cumulative basis, less the aggregate amount of any previously paid capital gain incentive fees with respect to each of the investments in our portfolio.
24
Table of Contents
Examples of Quarterly Incentive Fee Calculation
Example 1: Income Related Portion of Incentive Fee (*):
Alternative 1:
Assumptions
Investment income (including interest, dividends, fees, etc.) = 1.25%
Hurdle rate(1) = 1.75%
Management fee(2) = 0.4375%
Other expenses (legal, accounting, custodian, transfer agent, etc.)(3) = 0.20%
Pre-incentive fee net investment income
(investment income – (management fee + other expenses)) = 0.6125%
Pre-incentive net investment income does not exceed hurdle rate, therefore there is no incentive fee.
Alternative 2:
Assumptions
Investment income (including interest, dividends, fees, etc.) = 2.70%
Hurdle rate(1) = 1.75%
Management fee(2) = 0.4375%
Other expenses (legal, accounting, custodian, transfer agent, etc.)(3) = 0.20%
Pre-incentive fee net investment income
(investment income – (management fee + other expenses)) = 2.0625%
Incentive fee = 100% × pre-incentive fee net investment income, subject to the “catch-up”(4)
= 100% × (2.0625% – 1.75%)
= 0.3125%
Alternative 3:
Assumptions
Investment income (including interest, dividends, fees, etc.) = 3.00%
Hurdle rate(1) = 1.75%
Management fee(2) = 0.4375%
Other expenses (legal, accounting, custodian, transfer agent, etc.)(3) = 0.20%
Pre-incentive fee net investment income
(investment income – (management fee + other expenses)) = 2.3625%
Incentive fee = 20% × pre-incentive fee net investment income, subject to “catch-up”(4)
Incentive fee = 100% × “catch-up” + (20% × (pre-incentive fee net investment income – 2.1875%))
Catch-up = 2.1875% – 1.75%
= 0.4375%
Incentive fee = (100% × 0.4375%) + (20% × (2.3625% – 2.1875%))
= 0.4375% + (20% × 0.175%)
= 0.4375% + 0.035%
= 0.4725%
| (*) | The hypothetical amount of pre-incentive fee net investment income shown is based on a percentage of total net assets. |
| (1) | Represents 7% annualized hurdle rate. |
| (2) | Represents 1.75% annualized management fee. |
| (3) | Excludes organizational and offering expenses. |
| (4) | The “catch-up” provision is intended to provide our investment adviser with an incentive fee of 20% on all of our pre-incentive fee net investment income as if a hurdle rate did not apply when our net investment income exceeds 2.1875% in any calendar quarter. |
25
Table of Contents
Example 2: Capital Gains Portion of Incentive Fee:
Alternative 1:
Assumptions
| • | Year 1: $20 million investment made in Company A (“Investment A”), and $30 million investment made in Company B (“Investment B”) |
| • | Year 2: Investment A sold for $50 million and fair market value (“FMV”) of Investment B determined to be $32 million |
| • | Year 3: FMV of Investment B determined to be $25 million |
| • | Year 4: Investment B sold for $31 million |
The capital gains portion of the incentive fee would be:
| • | Year 1: None |
| • | Year 2: Capital gains incentive fee of $6 million ($30 million realized capital gains on sale of Investment A multiplied by 20%) |
| • | Year 3: None |
$5 million (20% multiplied by ($30 million cumulative capital gains less $5 million cumulative capital depreciation)) less $6 million (previous capital gains fee paid in Year 2)
| • | Year 4: Capital gains incentive fee of $200,000 |
$6.2 million ($31 million cumulative realized capital gains multiplied by 20%) less $6 million (capital gains fee taken in Year 2)
Alternative 2:
Assumptions
| • | Year 1: $20 million investment made in Company A (“Investment A”), $30 million investment made in Company B (“Investment B”) and $25 million investment made in Company C (“Investment C”) |
| • | Year 2: Investment A sold for $50 million, FMV of Investment B determined to be $25 million and FMV of Investment C determined to be $25 million |
| • | Year 3: FMV of Investment B determined to be $27 million and Investment C sold for $30 million |
| • | Year 4: FMV of Investment B determined to be $24 million |
| • | Year 5: Investment B sold for $20 million |
The capital gains incentive fee, if any, would be:
| • | Year 1: None |
| • | Year 2: $5 million capital gains incentive fee |
20% multiplied by $25 million ($30 million realized capital gains on Investment A less unrealized capital depreciation on Investment B)
| • | Year 3: $1.4 million capital gains incentive fee(1) |
26
Table of Contents
$6.4 million (20% multiplied by $32 million ($35 million cumulative realized capital gains less $3 million unrealized capital depreciation)) less $5 million capital gains fee received in Year 2
| • | Year 4: None |
| • | Year 5: None |
$5 million (20% multiplied by $25 million (cumulative realized capital gains of $35 million less realized capital losses of $10 million)) less $6.4 million cumulative capital gains fee paid in Year 2 and Year 3
| (1) | As illustrated in Year 3 of Alternative 2 above, if Solar Capital were to be wound up on a date other than December 31 of any year, Solar Capital may have paid aggregate capital gain incentive fees that are more than the amount of such fees that would be payable if Solar Capital had been wound up on December 31 of such year. |
Payment of Our Expenses
All investment professionals of the investment adviser and their respective staffs, when and to the extent engaged in providing investment advisory and management services, and the compensation and routine overhead expenses of such personnel allocable to such services, are provided and paid for by Solar Capital Partners. We bear all other costs and expenses of our operations and transactions, including (without limitation):
| • | the cost of our organization and public offerings; |
| • | the cost of calculating our net asset value, including the cost of any third-party valuation services; |
| • | the cost of effecting sales and repurchases of our shares and other securities; |
| • | interest payable on debt, if any, to finance our investments; |
| • | fees payable to third parties relating to, or associated with, making investments, including fees and expenses associated with performing due diligence reviews of prospective investments and advisory fees; |
| • | transfer agent and custodial fees; |
| • | fees and expenses associated with marketing efforts; |
| • | federal and state registration fees, any stock exchange listing fees; |
| • | federal, state and local taxes; |
| • | independent directors’ fees and expenses; |
| • | brokerage commissions; |
| • | fidelity bond, directors and officers errors and omissions liability insurance and other insurance premiums; |
| • | direct costs and expenses of administration, including printing, mailing, long distance telephone and staff; |
| • | fees and expenses associated with independent audits and outside legal costs; |
| • | costs associated with our reporting and compliance obligations under the 1940 Act and applicable federal and state securities laws; and |
| • | all other expenses incurred by either Solar Capital Management or us in connection with administering our business, including payments under the Administration Agreement that will be based upon our allocable portion of overhead and other expenses incurred by Solar Capital Management in performing its obligations under the Administration Agreement, including rent, the fees and expenses associated with performing compliance functions, and our allocable portion of the costs of compensation and related expenses of our chief compliance officer and our chief financial officer and their respective staffs. |
27
Table of Contents
Available Information
The SEC maintains an Internet site that contains reports, proxy and information statements, and other information regarding issuers that file electronically with the SEC. The address of that site is (http://www.sec.gov).
Our internet address is www.solarcapltd.com. We make available free of charge on our website our annual report on Form 10-K, quarterly reports on Form 10-Q, current reports on Form 8-K and amendments to those reports as soon as reasonably practicable after we electronically file such material with, or furnish it to, the SEC. Information contained on our website is not incorporated by reference into this annual report on Form 10-K, and you should not consider information contained on our website to be part of this annual report on Form 10-K.
| Item 1A. | Risk Factors |
Before you invest in our securities, you should be aware of various risks, including those described below. You should carefully consider these risk factors, together with all of the other information included in this annual report on Form 10-K before you decide whether to make an investment in our securities. The risks described in this document and set out below are not the only risks we face. If any of the following events occur, our business, financial condition and results of operations could be materially adversely affected. In such case, our net asset value and the trading price of our common stock could decline or the value of our preferred stock, debt securities, subscription rights or warrants may decline, and you may lose all or part of your investment.
SUMMARY RISK FACTORS
Risks Relating to Our Investments
| • | We operate in a highly competitive market for investment opportunities. |
| • | Our investments are very risky and highly speculative. |
| • | The lack of liquidity in our investments may make it difficult for us to dispose of our investments at a favorable price, which may adversely affect our ability to meet our investment objectives. |
| • | Our portfolio may be concentrated in a limited number of portfolio companies and industries, which will subject us to a risk of significant loss if any of these companies performs poorly or defaults on its obligations under any of its debt instruments or if there is a downturn in a particular industry. |
| • | Volatility or a prolonged disruption in the credit markets could materially damage our business. |
| • | Adverse developments in the credit markets may impair our ability to secure debt financing. |
| • | Economic sanction laws in the United States and other jurisdictions may prohibit us and our affiliates from transacting with certain countries, individuals and companies. |
| • | If we cannot obtain additional capital because of either regulatory or market price constraints, we could be forced to curtail or cease our new lending and investment activities, our net asset value could decrease and our level of distributions and liquidity could be affected adversely. |
| • | Changes relating to the LIBOR calculation process may adversely affect the value of our portfolio of LIBOR-indexed, floating-rate debt securities. |
| • | Events outside of our control, including public health crises, could negatively affect our portfolio companies and our results of our operations. |
| • | We are currently operating in a period of capital markets disruption and economic uncertainty. |
| • | The continued uncertainty related to the sustainability and pace of economic recovery in the U.S. and globally could have a negative impact on our business. |
28
Table of Contents
| • | We may suffer a loss if a portfolio company defaults on a loan and the underlying collateral is not sufficient. |
| • | Prepayments of our debt investments by our portfolio companies could adversely impact our results of operations and reduce our return on equity. |
Risks Relating to an Investment in Our Securities
| • | Our shares may trade at a substantial discount from net asset value and may continue to do so over the long term. |
| • | Our common stock price may be volatile and may decrease substantially. |
| • | Our business and operation could be negatively affected if we become subject to any securities litigation or shareholder activism, which could cause us to incur significant expense, hinder execution of investment strategy and impact our stock price. |
| • | If the current period of capital market disruption and instability continues for an extended period of time, there is a risk that investors in our equity securities may not receive distributions consistent with historical levels or at all or that our distributions may not grow over time and a portion of our distributions may be a return of capital. |
| • | Due to the COVID-19 pandemic or other disruptions in the economy, we may not be able to increase our dividends and may reduce or defer our dividends and choose to incur U.S. federal excise tax in order preserve cash and maintain flexibility. |
| • | We may choose to pay distributions in our own common stock, in which case our stockholders may be required to pay U.S. federal income taxes in excess of the cash distributions they receive. |
| • | Sales of substantial amounts of our common stock in the public market may have an adverse effect on the market price of our common stock. |
| • | The net asset value per share of our common stock may be diluted if we issue or sell shares of our common stock at prices below the then current net asset value per share of our common stock or securities to subscribe for or convertible into shares of our common stock. |
| • | To the extent we use debt or preferred stock to finance our investments, changes in interest rates will affect our cost of capital and net investment income. |
Risks Relating to Our Business and Structure
| • | We are dependent upon Solar Capital Partners’ key personnel for our future success. |
| • | Our business model depends to a significant extent upon strong referral relationships with financial sponsors, and the inability of the senior investment professionals of our investment adviser to maintain or develop these relationships, or the failure of these relationships to generate investment opportunities, could adversely affect our business. |
| • | Our financial condition and results of operations will depend on Solar Capital Partners’ ability to manage our future growth effectively by identifying, investing in and monitoring companies that meet our investment criteria. |
| • | We may need to raise additional capital to grow because we must distribute most of our income. |
| • | Any failure on our part to maintain our status as a BDC would reduce our operating flexibility and we may be limited in our investment choices as a BDC. |
| • | Regulations governing our operation as a BDC affect our ability to, and the way in which we will, raise additional capital. As a BDC, the necessity of raising additional capital may expose us to risks, including the typical risks associated with leverage. |
29
Table of Contents
| • | We have and will continue to borrow money, which would magnify the potential for loss on amounts invested and may increase the risk of investing in us. |
| • | It is likely that the terms of any current or future long-term or revolving credit or warehouse facility we may enter into in the future could constrain our ability to grow our business. |
| • | There will be uncertainty as to the value of our portfolio investments, which may impact our net asset value. |
| • | There are significant potential conflicts of interest, including Solar Capital Partners’ management of other investment funds such as Solar Senior Capital Ltd., SCP Private Credit Income BDC LLC, and SLR HC BDC LLC, which could impact our investment returns, and an investment in Solar Capital Ltd. is not an investment in Solar Senior Capital Ltd., SCP Private Credit Income BDC LLC, or SLR HC BDC LLC. |
| • | We may be obligated to pay our investment adviser incentive compensation even if we incur a loss. |
| • | Our incentive fee may induce Solar Capital Partners to pursue speculative investments. |
| • | We may become subject to corporate-level U.S. federal income tax if we are unable to qualify and maintain our qualification for tax treatment as a regulated investment company under Subchapter M of the Code. |
| • | The failure in cyber security systems, as well as the occurrence of events unanticipated in our disaster recovery systems and management continuity planning could impair our ability to conduct business effectively. |
| • | Our business is subject to increasingly complex corporate governance, public disclosure and accounting requirements that could adversely affect our business and financial results. |
RISK FACTORS (CONTINUED)
Risks Relating to Our Investments
We operate in a highly competitive market for investment opportunities.
A number of entities compete with us to make the types of investments that we target in leveraged companies. We compete with other BDCs, public and private funds, commercial and investment banks, commercial financing companies and, to the extent they provide an alternative form of financing, private equity funds. Many of our competitors are substantially larger and have considerably greater financial, technical and marketing resources than we do. For example, some competitors may have a lower cost of funds and access to funding sources that are not available to us. In addition, some of our competitors may have higher risk tolerances or different risk assessments than we have, which could allow them to consider a wider variety of investments and establish more relationships and offer better pricing and a more flexible structure than we are able to do. Furthermore, many of our potential competitors are not subject to the regulatory restrictions that the 1940 Act imposes on us as a BDC. If we are unable to source attractive investments, we may hold a greater percentage of our assets in cash and cash equivalents than anticipated, which could impact potential returns on our portfolio. We cannot assure you that the competitive pressures we face will not have a material adverse effect on our business, financial condition and results of operations. Also, as a result of this competition, we may not be able to take advantage of attractive investment opportunities from time to time, and we can offer no assurance that we will be able to identify and make investments that are consistent with our investment objective.
Participants in our industry compete on several factors, including price, flexibility in transaction structure, customer service, reputation, market knowledge and speed in decision-making. We do not seek to compete primarily based on the interest rates we will offer, and we believe that some of our competitors may make loans with interest rates that will be comparable to or lower than the rates we offer. We may lose investment opportunities if we do not match our competitors’ pricing, terms and structure. However, if we match our competitors’ pricing, terms and structure, we may experience decreased net interest income and increased risk of credit loss.
30
Table of Contents
Our investments are very risky and highly speculative.
We invest primarily in leveraged middle-market companies in the form of senior secured loans, stretch-senior loans, financing leases and to a lesser extent, unsecured loans and equity securities.
Senior Secured Loans. When we make a senior secured term loan investment, including stretch-senior loan investments, in a portfolio company, we generally take a security interest in the available assets of the portfolio company, including the equity interests of its subsidiaries, which we expect to help mitigate the risk that we will not be repaid. However, there is a risk that the collateral securing our loans may decrease in value over time, may be difficult to sell in a timely manner, may be difficult to appraise and may fluctuate in value based upon the success of the business and market conditions, including as a result of the inability of the portfolio company to raise additional capital, and, in some circumstances, our lien could be subordinated to claims of other creditors. In addition, deterioration in a portfolio company’s financial condition and prospects, including its inability to raise additional capital, may be accompanied by deterioration in the value of the collateral for the loan. Consequently, the fact that a loan is secured does not guarantee that we will receive principal and interest payments according to the loan’s terms, or at all, or that we will be able to collect on the loan should we be forced to enforce our remedies.
Unsecured Loans and Preferred Securities. Our unsecured and preferred investments are generally subordinated to senior loans and are generally unsecured. As such, other creditors may rank senior to us in the event of an insolvency. This may result in an above average amount of risk and loss of principal.
Equity Investments. When we invest in senior secured loans, stretch-senior loans, unitranche loans, unsecured loans or preferred securities, we may acquire common equity securities as well. In certain other unique circumstances we may also make equity investments in businesses that make senior loans and/or leases, such as our investments in Crystal, KBH and NEF. In addition, we may invest directly in the equity securities of portfolio companies without limitation as to market capitalization. For instance, we may invest in thinly traded companies, the prices of which may be subject to erratic market movement. Our goal is ultimately to exit such equity interests and realize gains upon our disposition of such interests. However, the equity interests we receive may not appreciate in value and, in fact, may decline in value. Accordingly, we may not be able to realize gains from our equity interests, and any gains that we do realize on the disposition of any equity interests may not be sufficient to offset any other losses we experience.
In addition, investing in middle-market companies involves a number of significant risks, including:
| • | these companies may have limited financial resources and may be unable to meet their obligations under their debt securities that we hold, which may be accompanied by a deterioration in the value of any collateral and a reduction in the likelihood of us realizing any guarantees we may have obtained in connection with our investment; |
| • | they typically have shorter operating histories, narrower product lines and smaller market shares than larger businesses, which tend to render them more vulnerable to competitors’ actions and market conditions, as well as general economic downturns; |
| • | they are more likely to depend on the management talents and efforts of a small group of persons; therefore, the death, disability, resignation or termination of one or more of these persons could have a material adverse impact on our portfolio company and, in turn, on us; |
| • | they generally have less predictable operating results, may from time to time be parties to litigation, may be engaged in rapidly changing businesses with products subject to a substantial risk of obsolescence, and may require substantial additional capital to support their operations, finance |
31
Table of Contents
| expansion or maintain their competitive position. In addition, our executive officers, directors and our investment adviser may, in the ordinary course of business, be named as defendants in litigation arising from our investments in the portfolio companies; and |
| • | they may have difficulty accessing the capital markets to meet future capital needs, which may limit their ability to grow or to repay their outstanding indebtedness upon maturity. |
The lack of liquidity in our investments may make it difficult for us to dispose of our investments at a favorable price, which may adversely affect our ability to meet our investment objectives.
We generally make investments in private companies. We invest and expect to continue investing in companies whose securities have no established trading market and whose securities are and will be subject to legal and other restrictions on resale or whose securities are and will be less liquid than are publicly-traded securities. Investments purchased by us that are liquid at the time of purchase may subsequently become illiquid due to events relating to the issuer of the investments, market events, economic conditions or investor perceptions. The illiquidity of our investments may make it difficult for us to sell such investments if the need arises. In addition, if we are required to liquidate all or a portion of our portfolio quickly, we may realize significantly less than the value at which we have previously recorded our investments. As a result, we do not expect to achieve liquidity in our investments in the near-term. However, to maintain our qualification as a BDC and as a RIC, we may have to dispose of investments if we do not satisfy one or more of the applicable criteria under the respective regulatory frameworks. Domestic and foreign markets are complex and interrelated, so that events in one sector of the world markets or economy, or in one geographical region, can reverberate and have materially negative consequences for other markets, economic or regional sectors in a manner that may not be foreseen and which may negatively impact the liquidity of our investments and materially harm our business. In addition, we may face other restrictions on our ability to liquidate an investment in a portfolio company to the extent that we have material non-public information regarding such portfolio company.
Our portfolio may be concentrated in a limited number of portfolio companies and industries, which will subject us to a risk of significant loss if any of these companies performs poorly or defaults on its obligations under any of its debt instruments or if there is a downturn in a particular industry.
Our portfolio may be concentrated in a limited number of portfolio companies and industries. For example, as of December 31, 2020, our investments in Crystal Financial LLC, Kingsbridge Holdings, LLC and NEF Holdings comprised 15.3%, 11.2% and 6.7%, respectively, of our total assets and our investments in multi-sector holdingsd and diversified financial services industries comprised 21.8% and 15.6%, respectively, of our total assets. Beyond the asset diversification requirements associated with our qualification as a RIC under Subchapter M of the Code, we do not have fixed guidelines for diversification, and while we are not targeting any specific industries, our investments may be concentrated in relatively few industries or portfolio companies. As a result, the aggregate returns we realize may be significantly adversely affected if a small number of investments perform poorly or if we need to write down the value of any one investment. Additionally, a downturn in any particular industry in which we are invested could also significantly impact the aggregate returns we realize.
Our investments in securities rated below investment grade are speculative in nature and are subject to additional risk factors such as increased possibility of default, illiquidity of the security, and changes in value based on changes in interest rates.
The securities that we invest in are typically rated below investment grade. Securities rated below investment grade are speculative and are often referred to as “leveraged loans,” “high yield” or “junk” securities, and may be considered “high risk” compared to debt instruments that are rated investment grade. High yield securities are regarded as having predominantly speculative characteristics with respect to the issuer’s capacity to pay interest and repay principal in accordance with the terms of the obligations and involve major risk exposure to adverse conditions. In addition, high yield securities generally offer a higher current yield than that available from higher
32
Table of Contents
grade issues, but typically involve greater risk. These securities are especially sensitive to adverse changes in general economic conditions, to changes in the financial condition of their issuers and to price fluctuation in response to changes in interest rates. During periods of economic downturn or rising interest rates, issuers of below investment grade instruments may experience financial stress that could adversely affect their ability to make payments of principal and interest and increase the possibility of default. The secondary market for high yield securities may not be as liquid as the secondary market for more highly rated securities. In addition, many of our debt investments will not fully amortize during their lifetime, which means that a borrower may be unable to payoff its debt due to bankruptcy or other reasons and therefore we may write-off such debt investment prior to its scheduled maturity. Upon such an occurrence, we may realize a loss or a substantial amount of unpaid principal and interest due upon maturity.
Price declines and illiquidity in the corporate debt markets have adversely affected, and may continue to adversely affect, the fair value of our portfolio investments, reducing our net asset value through increased net unrealized depreciation. Any unrealized depreciation that we experience on our loan portfolio may be an indication of future realized losses, which could reduce our income available for distribution and could adversely affect our ability to service our outstanding borrowings.
As a BDC, we are required to carry our investments at market value or, if no market value is ascertainable, at fair value as determined in good faith by or under the direction of our board of directors. Decreases in the market values or fair values of our investments are recorded as unrealized depreciation. Any unrealized depreciation in our loan portfolio could be an indication of a portfolio company’s inability to meet its repayment obligations to us with respect to the affected loans. This could result in realized losses in the future and ultimately in reductions of our income available for distribution in future periods and could materially adversely affect our ability to service our outstanding borrowings. Depending on market conditions, we could incur substantial losses in future periods, which could further reduce our net asset value and have a material adverse impact on our business, financial condition and results of operations.
Global economic, regulatory and market conditions may adversely affect our business, results of operations and financial condition, including our revenue growth and profitability.
We and our portfolio companies are subject to regulation by laws at the U.S. federal, state and local levels. These laws and regulations, as well as their interpretation, could change from time to time, including as the result of interpretive guidance or other directives from the U.S. President and others in the executive branch, and new laws, regulations and interpretations could also come into effect. Any such new or changed laws or regulations could have a material adverse effect on our business, and political uncertainty could increase regulatory uncertainty in the near term.
The effects of legislative and regulatory proposals directed at the financial services industry or affecting taxation, could negatively impact the operations, cash flows or financial condition of us and our portfolio companies, impose additional costs on us or our portfolio companies, intensify the regulatory supervision of us or our portfolio companies or otherwise adversely affect our business or the business of our portfolio companies. In addition, if we do not comply with applicable laws and regulations, we could lose any licenses that we then hold for the conduct of business and could be subject to civil fines and criminal penalties.
Over the last several years, there also has been an increase in regulatory attention to the extension of credit outside of the traditional banking sector, raising the possibility that some portion of the non-bank financial sector will be subject to new regulation. While it cannot be known at this time whether any regulation will be implemented or what form it will take, increased regulation of non-bank credit extension could negatively impact our operations, cash flows or financial condition, impose additional costs on us, intensify the regulatory supervision of us or otherwise adversely affect our business, financial condition and results of operations.
On May 24, 2018, the President of the United States signed into law the Economic Growth, Regulatory Relief, and Consumer Protection Act, which increased from $50 billion to $250 billion the asset threshold for
33
Table of Contents
designation of “systemically important financial institutions” or “SIFIs” subject to enhanced prudential standards set by the Federal Reserve Board, staggering application of this change based on the size and risk of the covered bank holding company. On May 30, 2018, the Federal Reserve Board voted to consider changes to the Volcker Rule that would loosen compliance requirements for all banks. The effect of this change and any further rules or regulations are and could be complex and far-reaching, and the change and any future laws or regulations or changes thereto could negatively impact our operations, cash flows or financial condition, impose additional costs on us, intensify the regulatory supervision of us or otherwise adversely affect our business, financial condition and results of operations.
Although we cannot predict the impact, if any, of these changes to our business, they could adversely affect our business, financial condition, operating results and cash flows. Until we know what policy changes are made and how those changes impact business and the business of our competitors over the long term, we will not know if, overall, it will benefit from them or be negatively affected by them.
In 2010, a financial crisis emerged in Europe, triggered by high budget deficits and rising direct and contingent sovereign debt, which created concerns about the ability of certain nations to continue to service their sovereign debt obligations. Risks resulting from such debt crisis, including any austerity measures taken in exchange for bailout of certain nations, and any future debt crisis in Europe or any similar crisis elsewhere could have a detrimental impact on the global economic recovery, sovereign and non-sovereign debt in certain countries and the financial condition of financial institutions generally. On January 31, 2020, the United Kingdom (the “UK”) ended its membership in the European Union (“Brexit”). Under the terms of the withdrawal agreement negotiated and agreed between the UK and the European Union, the UK’s departure from the European Union was followed by a transition period (the “Transition Period”), which ran until December 31, 2020 and during which the UK continued to apply European Union law and was treated for all material purposes as if it were still a member of the European Union. On December 24, 2020, the European Union and UK governments signed a trade deal that became provisionally effective on January 1, 2021 and that now governs the relationship between the UK and European Union (the “Trade Agreement”). The Trade Agreement implements significant regulation around trade, transport of goods and travel restrictions between the UK and the European Union. Notwithstanding the foregoing, the longer term economic, legal, political and social implications of Brexit are unclear at this stage and are likely to continue to lead to ongoing political and economic uncertainty and periods of increased volatility in both the UK and in wider European markets for some time. In particular, Brexit could lead to calls for similar referendums in other European jurisdictions, which could cause increased economic volatility in the European and global markets. This mid- to long-term uncertainty could have adverse effects on the economy generally and on our ability to earn attractive returns. In particular, currency volatility could mean that our returns are adversely affected by market movements and could make it more difficult, or more expensive, for us to execute prudent currency hedging policies. Potential decline in the value of the British Pound and/or the Euro against other currencies, along with the potential further downgrading of the UK’s sovereign credit rating, could also have an impact on the performance of certain investments made in the UK or Europe.
There is uncertainty surrounding potential legal, regulatory and policy changes by new presidential administrations in the United States that may directly affect financial institutions and the global economy.
As a result of the November 2020 elections in the United States, the Democratic Party gained control of both the Presidency and the Senate from the Republican Party. Therefore, changes in federal policy, including tax policies, and at regulatory agencies are expected to occur over time through policy and personnel changes, which may lead to changes involving the level of oversight and focus on the financial services industry or the tax rates paid by corporate entities. The nature, timing and economic and political effects of potential changes to the current legal and regulatory framework affecting financial institutions remain highly uncertain. Uncertainty surrounding future changes may adversely affect our operating environment and therefore our business, financial condition, results of operations and growth prospects.
34
Table of Contents
Volatility or a prolonged disruption in the credit markets could materially damage our business.
We are required to record our assets at fair value, as determined in good faith by our board of directors, in accordance with our valuation policy. As a result, volatility in the capital markets may have a material adverse effect on our valuations and our net asset value, even if we hold investments to maturity. Volatility or dislocation in the capital markets may depress our stock price below our net asset value per share and create a challenging environment in which to raise equity and debt capital. These conditions could continue for a prolonged period of time or worsen in the future. While these conditions persist, we and other companies in the financial services sector may have to access, if available, alternative markets for debt and equity capital. Equity capital may be difficult to raise because, subject to some limited exceptions which apply to us, as a BDC we are generally not able to issue additional shares of our common stock at a price less than net asset value without first obtaining approval for such issuance from our stockholders and our independent directors. At our 2020 Annual Stockholders Meeting, our stockholders approved our ability to sell or otherwise issue shares of our common stock, not exceeding 25% of our then outstanding common stock immediately prior to each such offering, at a price or prices below the then current net asset value per share, in each case subject to the approval of our board of directors and compliance with the conditions set forth in the proxy statement pertaining thereto, during a period beginning on October 6, 2020 and expiring on the earlier of the one-year anniversary of the date of the 2020 Annual Stockholders Meeting and the date of our 2021 Annual Stockholders Meeting. However, notwithstanding such stockholder approval, since our initial public offering on February 9, 2010, we have not sold any shares of our common stock in an offering that resulted in proceeds to us of less than our then current net asset value per share. Any offering of our common stock that requires stockholder approval must occur, if at all, within one year after receiving such stockholder approval. In addition, our ability to incur indebtedness (including by issuing preferred stock) is limited by applicable regulations such that our asset coverage, as defined in the 1940 Act, must equal at least 150% immediately after each time we incur indebtedness. The debt capital that will be available, if at all, may be at a higher cost and on less favorable terms and conditions in the future. Any inability to raise capital could have a negative effect on our business, financial condition and results of operations.
Additionally, our ability to incur indebtedness is limited by the asset coverage ratio for a BDC, as defined under the 1940 Act. Declining portfolio values negatively impact our ability to borrow additional funds because our net asset value is reduced for purposes of the asset coverage ratio. If the fair value of our assets declines substantially, we may fail to maintain the asset coverage ratio stipulated by the 1940 Act, which could, in turn, cause us to lose our status as a BDC and materially impair our business operations. A lengthy disruption in the credit markets could also materially decrease demand for our investments.
The significant disruption in the capital markets experienced in the past, including the disruption caused by the COVID-19 pandemic, has had, and may in the future have, a negative effect on the valuations of our investments and on the potential for liquidity events involving our investments. The debt capital that may be available to us in the future may be at a higher cost and have less favorable terms and conditions than those currently in effect. If our financing costs increase and we have no increase in interest income, then our net investment income will decrease. A prolonged inability to raise capital may require us to reduce the volume of investments we originate and could have a material adverse impact on our business, financial condition and results of operations. This may also increase the probability that other structural risks negatively impact us. These situations may arise due to circumstances that we may be unable to control, such as a lengthy disruption in the credit markets, a severe decline in the value of the U.S. dollar, a sharp economic downturn or recession or an operational problem that affects third parties or us, and could materially damage our business, financial condition and results of operations.
Adverse developments in the credit markets may impair our ability to secure debt financing.
In past economic downturns, such as the financial crisis in the United States that began in mid-2007 and during other times of extreme market volatility, many commercial banks and other financial institutions stopped lending
35
Table of Contents
or significantly curtailed their lending activity. In addition, in an effort to stem losses and reduce their exposure to segments of the economy deemed to be high risk, some financial institutions limited routine refinancing and loan modification transactions and even reviewed the terms of existing facilities to identify bases for accelerating the maturity of existing lending facilities. If these conditions recur, for example as a result of the COVID-19 pandemic, it may be difficult for us to obtain desired financing to finance the growth of our investments on acceptable economic terms, or at all.
So far, the COVID-19 pandemic has resulted in, and until fully resolved is likely to continue to result in, among other things, increased draws by borrowers on revolving lines of credit and increased requests by borrowers for amendments, modifications and waivers of their credit agreements to avoid default or change payment terms, increased defaults by such borrowers and/or increased difficulty in obtaining refinancing at the maturity dates of their loans. In addition, the duration and effectiveness of responsive measures implemented by governments and central banks cannot be predicted. The commencement, continuation, or cessation of government and central bank policies and economic stimulus programs, including changes in monetary policy involving interest rate adjustments or governmental policies, may contribute to the development of or result in an increase in market volatility, illiquidity and other adverse effects that could negatively impact the credit markets and the Company.
If we are unable to consummate credit facilities on commercially reasonable terms, our liquidity may be reduced significantly. If we are unable to repay amounts outstanding under any facility we may enter into and are declared in default or are unable to renew or refinance any such facility, it would limit our ability to initiate significant originations or to operate our business in the normal course. These situations may arise due to circumstances that we may be unable to control, such as inaccessibility of the credit markets, a severe decline in the value of the U.S. dollar, a further economic downturn or an operational problem that affects third parties or us, and could materially damage our business. Moreover, we are unable to predict when economic and market conditions may become more favorable. Even if such conditions improve broadly and significantly over the long term, adverse conditions in particular sectors of the financial markets could adversely impact our business.
Economic sanction laws in the United States and other jurisdictions may prohibit us and our affiliates from transacting with certain countries, individuals and companies.
Economic sanction laws in the United States and other jurisdictions may prohibit us or our affiliates from transacting with certain countries, individuals and companies. In the United States, the U.S. Department of the Treasury’s Office of Foreign Assets Control administers and enforces laws, executive orders and regulations establishing U.S. economic and trade sanctions, which prohibit, among other things, transactions with, and the provision of services to, certain non-U.S. countries, territories, entities and individuals. These types of sanctions may significantly restrict or completely prohibit investment activities in certain jurisdictions, and if we, our portfolio companies or other issuers in which we invest were to violate any such laws or regulations, we may face significant legal and monetary penalties.
The Foreign Corrupt Practices Act, or FCPA, and other anti-corruption laws and regulations, as well as anti-boycott regulations, may also apply to and restrict our activities, our portfolio companies and other issuers of our investments. If an issuer or we were to violate any such laws or regulations, such issuer or we may face significant legal and monetary penalties. The U.S. government has indicated that it is particularly focused on FCPA enforcement, which may increase the risk that an issuer or us becomes the subject of such actual or threatened enforcement. In addition, certain commentators have suggested that private investment firms and the funds that they manage may face increased scrutiny and/or liability with respect to the activities of their underlying portfolio companies. As such, a violation of the FCPA or other applicable regulations by us or an issuer of our portfolio investments could have a material adverse effect on us. We are committed to complying with the FCPA and other anti-corruption laws and regulations, as well as anti-boycott regulations, to which it is subject. As a result, we may be adversely affected because of our unwillingness to enter into transactions that violate any such laws or regulations.
36
Table of Contents
If we cannot obtain additional capital because of either regulatory or market price constraints, we could be forced to curtail or cease our new lending and investment activities, our net asset value could decrease and our level of distributions and liquidity could be affected adversely.
Our ability to secure additional financing and satisfy our financial obligations under indebtedness outstanding from time to time will depend upon our future operating performance, which is subject to the prevailing general economic and credit market conditions, including interest rate levels and the availability of credit generally, and financial, business and other factors, many of which are beyond our control. The worsening of current economic and capital market conditions could have a material adverse effect on our ability to secure financing on favorable terms, if at all.
If we are unable to obtain debt capital, then our equity investors will not benefit from the potential for increased returns on equity resulting from leverage to the extent that our investment strategy is successful and we may be limited in our ability to make new commitments or fundings to our portfolio companies.
Changes relating to the LIBOR calculation process may adversely affect the value of our portfolio of LIBOR-indexed, floating-rate debt securities.
LIBOR, the London Interbank Offered Rate, is the basic rate of interest used in lending transactions between banks on the London interbank market and is widely used as a reference for setting the interest rate on loans globally. We typically use LIBOR as a reference rate in floating-rate loans we extend to portfolio companies such that the interest due to us pursuant to a term loan extended to a portfolio company is calculated using LIBOR. The terms of our debt investments generally include minimum interest rate floors which are calculated based on LIBOR. In the recent past, concerns have been publicized that some of the member banks surveyed by the British Bankers’ Association (“BBA”) in connection with the calculation of LIBOR across a range of maturities and currencies may have been under-reporting or otherwise manipulating the inter-bank lending rate applicable to them in order to profit on their derivative positions or to avoid an appearance of capital insufficiency or adverse reputational or other consequences that may have resulted from reporting inter-bank lending rates higher than those they actually submitted. A number of BBA member banks entered into settlements with their regulators and law enforcement agencies with respect to alleged manipulation of LIBOR, and investigations by regulators and governmental authorities in various jurisdictions are ongoing.
Actions by the ICE Benchmark Administration, regulators or law enforcement agencies as a result of these or future events, may result in changes to the manner in which LIBOR is determined. Potential changes, or uncertainty related to such potential changes may adversely affect the market for LIBOR-based securities, including our portfolio of LIBOR-indexed, floating-rate debt securities. In addition, any further changes or reforms to the determination or supervision of LIBOR may result in a sudden or prolonged increase or decrease in reported LIBOR, which could have an adverse impact on the market for LIBOR-based securities or the value of our portfolio of LIBOR-indexed, floating-rate debt securities, loans, and other financial obligations or extensions of credit held by or due to us.
On July 27, 2017, the U.K. Financial Conduct Authority (the “FCA”), which regulates LIBOR, announced that it intends to stop persuading or compelling banks to submit LIBOR rates after 2021. In addition, on March 25, 2020, the FCA stated that although the central assumption that firms cannot rely on LIBOR being published after the end of 2021 has not changed, the outbreak of COVID-19 has impacted the timing of many firms’ transition planning, and the FCA will continue to assess the impact of the COVID-19 pandemic on transition timelines and update the marketplace as soon as possible. Furthermore, on November 30, 2020, the Intercontinental Exchange, Inc. (“ICE”) announced that the ICE Benchmark Administration Limited, a wholly owned subsidiary of ICE and the administrator of LIBOR, announced its plan to extend the date that most U.S. LIBOR values would cease being computed and announced from December 31, 2021 to June 30, 2023. Despite this extension of the U.S. LIBOR transition deadline for certain LIBOR values, U.S. regulators continue to urge financial institutions to stop entering into new LIBOR transactions by the end of 2021. It is unclear if after 2021 LIBOR will cease to
37
Table of Contents
exist or if new methods of calculating LIBOR will be established such that it continues to exist after 2021. It is also unclear whether the COVID-19 pandemic will have further effect on LIBOR transition plans. We have exposure to LIBOR, including in financial instruments that mature after 2021. Our exposure arises from the value of our portfolio of LIBOR-indexed, floating-rate debt securities.
In the United States, the Federal Reserve Board and the Federal Reserve Bank of New York, in conjunction with the Alternative Reference Rates Committee, a steering committee comprised of large U.S. financial institutions, is considering replacing U.S. dollar LIBOR with a new index calculated by short-term repurchase agreements, backed by Treasury securities called the Secured Overnight Financing Rate (“SOFR”). The Federal Reserve Bank of New York began publishing SOFR in April 2018. Whether or not SOFR attains market traction as a LIBOR replacement remains a question and the future of LIBOR at this time is uncertain, including whether the COVID-19 pandemic will have further effect on LIBOR transition plans.
The elimination of LIBOR or any other changes or reforms to the determination or supervision of LIBOR could have an adverse impact on the market for or value of any LIBOR-indexed, floating-rate debt securities, loans, and other financial obligations or extensions of credit held by or due to us or on our overall financial condition or results of operations. If LIBOR ceases to exist, we may need to renegotiate the credit agreements extending beyond 2021 with our portfolio companies that utilize LIBOR as a factor in determining the interest rate to replace LIBOR with the new standard that is established. In the event that the LIBOR rate is no longer available or published on a current basis or no longer made available or used for determining the interest rate of loans, our administrative agent that manages our loans will generally select a comparable successor rate; provided that (i) to the extent a comparable or successor rate is approved by the administrative agent, the approved rate shall be applied in a manner consistent with market practice; and (ii) to the extent such market practice is not administratively feasible for the administrative agent, such approved rate shall be applied as otherwise reasonably determined by the administrative agent.
Events outside of our control, including public health crises, could negatively affect our portfolio companies and our results of our operations.
Periods of market volatility have occurred and could continue to occur in response to pandemics or other events outside of our control. These types of events have adversely affected and could continue to adversely affect operating results for us and for our portfolio companies. For example, the COVID-19 pandemic has delivered a shock to the global economy. This outbreak has led and for an unknown period of time will continue to lead to disruptions in local, regional, national and global markets and economies affected thereby, including a recession and a steep increase in unemployment in the United States.
With respect to the U.S. credit markets (in particular for middle market loans), this outbreak has resulted in, and until fully resolved is likely to continue to result in, the following among other things: (i) government imposition of various forms of shelter-in-place orders and the closing of “non-essential” businesses, resulting in significant disruption to the businesses of many middle-market loan borrowers including supply chains, demand and practical aspects of their operations, as well as in lay-offs of employees, and, while these effects are hoped to be temporary, some effects could be persistent or even permanent; (ii) increased draws by borrowers on revolving lines of credit; (iii) increased requests by borrowers for amendments and waivers of their credit agreements to avoid default, increased defaults by such borrowers and/or increased difficulty in obtaining refinancing at the maturity dates of their loans; (iv) volatility and disruption of these markets including greater volatility in pricing and spreads and difficulty in valuing loans during periods of increased volatility, and liquidity issues; and (v) rapidly evolving proposals and/or actions by state and federal governments to address problems being experienced by the markets and by businesses and the economy in general which will not necessarily adequately address the problems facing the loan market and middle market businesses.
While several countries, as well as certain states, counties and cities in the United States, have relaxed initial public health restrictions with the view to partially or fully reopening their economies, many cities have since
38
Table of Contents
experienced a surge in the reported number of cases, hospitalizations and deaths related to the COVID-19 pandemic. These surges have led to the re-introduction of such restrictions and business shutdowns in certain states in the United States and globally and could continue to lead to the re-introduction of such restrictions elsewhere. Health advisors warn that recurring COVID-19 outbreaks will continue if reopening is pursued too soon or in the wrong manner, which may lead to the re-introduction or continuation of certain public health restrictions (such as instituting quarantines, prohibitions on travel and the closure of offices, businesses, schools, retail stores and other public venues). Additionally, as of late December 2020, travelers from the United States are not allowed to visit Canada, Australia or the majority of countries in Europe, Asia, Africa and South America. These continued travel restrictions may prolong the global economic downturn. In addition, although the Federal Food and Drug Administration authorized vaccines produced by Pfizer-BioNTech and Moderna for emergency use starting in December 2020, it remains unclear how quickly the vaccines will be distributed nationwide and globally or when “herd immunity” will be achieved and the restrictions that were imposed to slow the spread of the virus will be lifted entirely. The delay in distributing the vaccines could lead people to continue to self-isolate and not participate in the economy at pre-pandemic levels for a prolonged period of time. Even after the COVID-19 pandemic subsides, the U.S. economy and most other major global economies may continue to experience a recession, and we anticipate our business and operations could be materially adversely affected by a prolonged recession in the United States and other major markets.
This outbreak is having, and any future outbreaks could have, an adverse impact on the markets and the economy in general, which could have a material adverse impact on, among other things, the ability of lenders to originate loans, the volume and type of loans originated, and the volume and type of amendments and waivers granted to borrowers and remedial actions taken in the event of a borrower default, each of which could negatively impact the amount and quality of loans available for investment by us and returns to us, among other things. As of the date of this annual report on Form 10-K, it is impossible to determine the scope of this outbreak, or any future outbreaks, how long any such outbreak, market disruption or uncertainties may last, the effect any governmental actions will have or the full potential impact on us and our portfolio companies. Any potential impact to our results of operations will depend to a large extent on future developments and new information that could emerge regarding the duration and severity of COVID-19 and the actions taken by authorities and other entities to contain COVID-19 or treat its impact, all of which are beyond our control. These potential impacts, while uncertain, could adversely affect our and our portfolio companies’ operating results.
If the economy is unable to substantially reopen, and high levels of unemployment continue for an extended period of time, loan delinquencies, loan non-accruals, problem assets, and bankruptcies may increase. In addition, collateral for our loans may decline in value, which could cause loan losses to increase and the net worth and liquidity of loan guarantors could decline, impairing their ability to honor commitments to us. An increase in loan delinquencies and non-accruals or a decrease in loan collateral and guarantor net worth could result in increased costs and reduced income which would have a material adverse effect on our business, financial condition or results of operations. Additionally, oil prices collapsed to an 18-year low on supply glut concerns, as shutdowns across the global economy sharply reduced oil demand while Saudi Arabia and Russia engaged in a price war. Central banks and governments have responded with liquidity injections to ease the strain on financial systems and stimulus measures to buffer the shock to businesses and consumers. These measures have helped stabilize certain portions of the financial markets over the short term, but volatility will likely remain elevated until the health crisis itself is under control (via fewer new cases, lower infection rates and/or verified treatments). There are still many unknowns and new information is incoming daily, compounding the difficulty of modeling outcomes for epidemiologists and economists alike.
We cannot be certain as to the duration or magnitude of the economic impact of the COVID-19 pandemic in the markets in which we and our portfolio companies operate, including with respect to travel restrictions, business closures, mitigation efforts (whether voluntary, suggested, or mandated by law) and corresponding declines in economic activity that may negatively impact the U.S. economy and the markets for the various types of goods and services provided by U.S. middle market companies. Depending on the duration, magnitude and severity of these conditions and their related economic and market impacts, certain portfolio companies may suffer declines
39
Table of Contents
in earnings and could experience financial distress, which could cause them to default on their financial obligations to us and their other lenders.
We will also be negatively affected if our operations and effectiveness or the operations and effectiveness of a portfolio company (or any of the key personnel or service providers of the foregoing) is compromised or if necessary or beneficial systems and processes are disrupted.
Any public health emergency, including the COVID-19 pandemic or any outbreak of other existing or new epidemic diseases, or the threat thereof, and the resulting financial and economic market uncertainty could have a significant adverse impact on us and the fair value of our investments. Our valuations, and particularly valuations of private investments and private companies, are inherently uncertain, may fluctuate over short periods of time and are often based on estimates, comparisons and qualitative evaluations of private information that may not show the complete impact of the COVID-19 pandemic and the resulting measures taken in response thereto. These potential impacts, while uncertain, could adversely affect our and our portfolio companies’ operating results.
We are currently operating in a period of capital markets disruption and economic uncertainty.
The U.S. capital markets have experienced extreme volatility and disruption following the global outbreak of COVID-19 that began in December 2019. The global impact of the outbreak is rapidly evolving, and many countries have reacted by instituting quarantines, prohibitions on travel and the closure of offices, businesses, schools, retail stores and other public venues. Businesses are also implementing similar precautionary measures. Such measures, as well as the general uncertainty surrounding the dangers and impact of COVID-19, have created significant disruption in supply chains and economic activity. The impact of COVID-19 has led to significant volatility and declines in the global public equity markets and it is uncertain how long this volatility will continue. As COVID-19 continues to spread, the potential impacts, including a global, regional or other economic recession, are increasingly uncertain and difficult to assess. Some economists and major investment banks have expressed concern that the continued spread of the virus globally could lead to a world-wide economic downturn.
General uncertainty surrounding the dangers and impact of COVID-19 (including the preventative measures taken in response thereto and additional uncertainty regarding new variants of COVID-19 that have emerged in the U.K, South Africa and Brazil) has to date created significant disruption in supply chains and economic activity. Disruptions in the capital markets caused by the COVID-19 pandemic have increased the spread between the yields realized on risk-free and higher risk securities, resulting in illiquidity in parts of the capital markets. These and future market disruptions and/or illiquidity would be expected to have an adverse effect on our business, financial condition, results of operations and cash flows. Unfavorable economic conditions also would be expected to increase our funding costs, limit our access to the capital markets or result in a decision by lenders not to extend credit to us. These events have limited and could continue to limit our investment originations, limit our ability to grow and have a material negative impact on our operating results and the fair values of our debt and equity investments.
In addition, due to the outbreak in the United States, certain personnel of our investment adviser are currently working remotely, which may introduce additional operational risk to us. Staff members of certain of our other service providers may also work remotely during the COVID-19 outbreak. An extended period of remote working could lead to service limitations or failures that could impact us or our performance.
Further, current market conditions resulting from the COVID-19 pandemic may make it difficult for us to obtain debt capital on favorable terms and any failure to do so could have a material adverse effect on our business. The debt capital that will be available to us in the future, if at all, may be at a higher cost and on less favorable terms and conditions than what we would otherwise expect, including being at a higher cost in rising rate environments. If we are unable to raise debt, then our equity investors may not benefit from the potential for increased returns
40
Table of Contents
on equity resulting from leverage and we may be limited in our ability to make or fund commitments to portfolio companies. An inability to obtain indebtedness could have a material adverse effect on our business, financial condition or results of operations.
The continued uncertainty related to the sustainability and pace of economic recovery in the U.S. and globally could have a negative impact on our business.
Our business is directly influenced by the economic cycle, and could be negatively impacted by a downturn in economic activity in the U.S. as well as globally. Fiscal and monetary actions taken by U.S. and non-U.S. government and regulatory authorities could have a material adverse impact on our business. To the extent uncertainty regarding the U.S. or global economy, including as a result of the global COVID-19 pandemic, negatively impacts consumer confidence and consumer credit factors, our business, financial condition and results of operations could be adversely affected. Moreover, Federal Reserve policy, including with respect to certain interest rates and the decision to end its quantitative easing policy, along with the general policies of the current Presidential administration, may also adversely affect the value, volatility and liquidity of dividend- and interest-paying securities. Market volatility, rising interest rates and/or a return to unfavorable economic conditions could adversely affect our business.
We may suffer a loss if a portfolio company defaults on a loan and the underlying collateral is not sufficient.
In the event of a default by a portfolio company on a secured loan, we will only have recourse to the assets collateralizing the loan. If the underlying collateral value is less than the loan amount, we will suffer a loss. In addition, we sometimes make loans that are unsecured, which are subject to the risk that other lenders may be directly secured by the assets of the portfolio company. In the event of a default, those collateralized lenders would have priority over us with respect to the proceeds of a sale of the underlying assets. In cases described above, we may lack control over the underlying asset collateralizing our loan or the underlying assets of the portfolio company prior to a default, and as a result the value of the collateral may be reduced by acts or omissions by owners or managers of the assets.
In the event of bankruptcy of a portfolio company, we may not have full recourse to its assets in order to satisfy our loan, or our loan may be subject to equitable subordination. In addition, certain of our loans are subordinate to other debt of the portfolio company. If a portfolio company defaults on our loan or on debt senior to our loan, or in the event of a portfolio company bankruptcy, our loan will be satisfied only after the senior debt receives payment. Where debt senior to our loan exists, the presence of inter-creditor arrangements may limit our ability to amend our loan documents, assign our loans, accept prepayments, exercise our remedies (through “standstill” periods) and control decisions made in bankruptcy proceedings relating to the portfolio company. Bankruptcy and portfolio company litigation can significantly increase collection losses and the time needed for us to acquire the underlying collateral in the event of a default, during which time the collateral may decline in value, causing us to suffer further losses.
If the value of collateral underlying our loan declines or interest rates increase during the term of our loan, a portfolio company may not be able to obtain the necessary funds to repay our loan at maturity through refinancing. Decreasing collateral value and/or increasing interest rates may hinder a portfolio company’s ability to refinance our loan because the underlying collateral cannot satisfy the debt service coverage requirements necessary to obtain new financing. If a borrower is unable to repay our loan at maturity, we could suffer a loss which may adversely impact our financial performance.
The business, financial condition and results of operations of our portfolio companies could be adversely affected by worldwide economic conditions, as well as political and economic conditions in the countries in which they conduct business.
The business and operating results of our portfolio companies may be impacted by worldwide economic conditions. Although the U.S. economy has in recent years shown signs of recovery from the 2008–2009 global recession, the
41
Table of Contents
strength and duration of any economic recovery will be impacted by worldwide economic growth. For instance, the global outbreak of COVID-19 has disrupted economic markets, and the prolonged economic impact is uncertain. Many manufacturers of goods have seen a downturn in production due to the suspension of business and temporary closure of factories globally in an attempt to curb the spread of the virus. As a result of these disruptions, our non-performing assets may increase and the value of its portfolio may decrease during these periods as we are required to record the values of our investments. Furthermore, concerns of economic slowdown in China and other emerging markets and signs of deteriorating sovereign debt conditions in Europe could lead to disruption and instability in the global financial markets. The significant debt in the United States and European countries is expected to hinder growth in those countries for the foreseeable future. In the future, the U.S. government may not be able to meet its debt payments unless the federal debt ceiling is raised. If legislation increasing the debt ceiling is not enacted, as needed, and the debt ceiling is reached, the U.S. federal government may stop or delay making payments on its obligations. Any default by the U.S. government on its obligations or any prolonged U.S. government shutdown could negatively impact the U.S. economy and our portfolio companies. Multiple factors relating to the international operations of some of our portfolio companies and to particular countries in which they operate could negatively impact their business, financial condition and results of operations.
Some of the products of our portfolio companies are developed, manufactured, assembled, tested or marketed outside the United States. Any conflict or uncertainty in these countries, including due to natural disasters, public health concerns (including the global COVID-19 pandemic), political unrest or safety concerns, could harm their business, financial condition and results of operations. In addition, if the government of any country in which their products are developed, manufactured or sold sets technical or regulatory standards for products developed or manufactured in or imported into their country that are not widely shared, it may lead some of their customers to suspend imports of their products into that country, require manufacturers or developers in that country to manufacture or develop products with different technical or regulatory standards and disrupt cross-border manufacturing, marketing or business relationships which, in each case, could harm their businesses.
Our failure to make follow-on investments in our portfolio companies could impair the value of our portfolio.
Following an initial investment in a portfolio company, we may make additional investments in that portfolio company as “follow-on” investments, in order to: (i) increase or maintain in whole or in part our ownership percentage; (ii) exercise warrants, options or convertible securities that were acquired in the original or subsequent financing; or (iii) attempt to preserve or enhance the value of our investment. We may elect not to make follow-on investments or otherwise lack sufficient funds to make those investments. We will have the discretion to make any follow-on investments, subject to the availability of capital resources. The failure to make follow-on investments may, in some circumstances, jeopardize the continued viability of a portfolio company and our initial investment, or may result in a missed opportunity for us to increase our participation in a successful operation. Even if we have sufficient capital to make a desired follow-on investment, we may elect not to make a follow-on investment because we may not want to increase our concentration of risk, either because we prefer other opportunities or because we are subject to BDC requirements that would prevent such follow-on investments or the desire to maintain our RIC tax treatment.
Where we do not hold controlling equity interests in our portfolio companies, we may not be in a position to exercise control over our portfolio companies or to prevent decisions by management of our portfolio companies that could decrease the value of our investments.
Although we hold controlling equity positions in some of our portfolio companies, we do not currently hold controlling equity positions in the majority of our portfolio companies. As a result, we are subject to the risk that a portfolio company in which we do not have a controlling interest may make business decisions with which we disagree, and that the management and/or stockholders of such portfolio company may take risks or otherwise act in ways that are adverse to our interests. Due to the lack of liquidity of the debt and equity investments that we typically hold in our portfolio companies, we may not be able to dispose of our investments in the event we disagree with the actions of a portfolio company and may therefore suffer a decrease in the value of our investments.
42
Table of Contents
Prepayments of our debt investments by our portfolio companies could adversely impact our results of operations and reduce our return on equity.
We are subject to the risk that the investments we make in our portfolio companies may be prepaid prior to maturity. When this occurs, we may reduce our borrowings outstanding or reinvest these proceeds in temporary investments, pending their future investment in new portfolio companies. These temporary investments, if any, will typically have substantially lower yields than the debt investment being prepaid and we could experience significant delays in reinvesting these amounts. Any future investment in a new portfolio company may also be at lower yields than the debt investment that was prepaid. As a result, our results of operations could be materially adversely affected if one or more of our portfolio companies elect to prepay amounts owed to us. Additionally, prepayments could negatively impact our return on equity, which could result in a decline in the market price of our common stock.
We may choose to waive or defer enforcement of covenants in the debt securities held in our portfolio, which may cause us to lose all or part of our investment in these companies.
We structure the debt investments in our portfolio companies to include business and financial covenants placing affirmative and negative obligations on the operation of the company’s business and its financial condition. However, from time to time we may elect to waive breaches of these covenants, including our right to payment, or waive or defer enforcement of remedies, such as acceleration of obligations or foreclosure on collateral, depending upon the financial condition and prospects of the particular portfolio company. These actions may reduce the likelihood of our receiving the full amount of future payments of interest or principal and be accompanied by a deterioration in the value of the underlying collateral as many of these companies may have limited financial resources, may be unable to meet future obligations and may go bankrupt. This could negatively impact our ability to pay distributions, could adversely affect our results of operation and financial condition and cause the loss of all or part of your investment.
In addition, some of the loans in which we may invest may be “covenant-lite” loans. We use the term “covenant-lite” loans to refer generally to loans that do not have a complete set of financial maintenance covenants. Generally, “covenant-lite” loans provide borrower companies more freedom to negatively impact lenders because their covenants are incurrence-based, which means they are only tested and can only be breached following an affirmative action of the borrower, rather than by a deterioration in the borrower’s financial condition. Accordingly, to the extent we invest in “covenant-lite” loans, we may have fewer rights against a borrower and may have a greater risk of loss on such investments as compared to investments in or exposure to loans with financial maintenance covenants.
Our loans could be subject to equitable subordination by a court which would increase our risk of loss with respect to such loans.
Courts may apply the doctrine of equitable subordination to subordinate the claim or lien of a lender against a borrower to claims or liens of other creditors of the borrower, when the lender or its affiliates is found to have engaged in unfair, inequitable or fraudulent conduct. The courts have also applied the doctrine of equitable subordination when a lender or its affiliates is found to have exerted inappropriate control over a client, including control resulting from the ownership of equity interests in a client. We have made direct equity investments or received warrants in connection with loans. Payments on one or more of our loans, particularly a loan to a client in which we may also hold an equity interest, may be subject to claims of equitable subordination. If we were deemed to have the ability to control or otherwise exercise influence over the business and affairs of one or more of our portfolio companies resulting in economic hardship to other creditors of that company, this control or influence may constitute grounds for equitable subordination and a court may treat one or more of our loans as if it were unsecured or common equity in the portfolio company. In that case, if the portfolio company were to liquidate, we would be entitled to repayment of our loan on a pro-rata basis with other unsecured debt or, if the effect of subordination was to place us at the level of common equity, then on an equal basis with other holders of the portfolio company’s common equity only after all of its obligations relating to its debt and preferred securities had been satisfied.
43
Table of Contents
An investment strategy focused primarily on privately held companies presents certain challenges, including the lack of available information about these companies, a dependence on the talents and efforts of only a few key portfolio company personnel and a greater vulnerability to economic downturns.
We invest primarily in privately held companies. Generally, little public information exists about these companies, and we are required to rely on the ability of Solar Capital Partners’ investment professionals to obtain adequate information to evaluate the potential returns from investing in these companies. If we are unable to uncover all material information about these companies, we may not make a fully informed investment decision, and we may lose money on our investments. Also, smaller privately held companies frequently have less diverse product lines and smaller market presence than larger competitors. These factors could adversely affect our investment returns as compared to companies investing primarily in the securities of public companies.
Our portfolio companies may incur debt that ranks equally with, or senior to, our investments in such companies.
We invest primarily in leveraged middle-market companies in the form of senior secured loans, stretch-senior loans, financing leases and to a lesser extent, unsecured loans and equity securities. Our portfolio companies typically have, or may be permitted to incur, other debt that ranks equally with, or senior to, the debt securities in which we invest. By their terms, such debt instruments may provide that the holders are entitled to receive payment of interest or principal on or before the dates on which we are entitled to receive payments in respect of the debt securities in which we invest. Also, in the event of insolvency, liquidation, dissolution, reorganization or bankruptcy of a portfolio company, holders of debt instruments ranking senior to our investment in that portfolio company would typically be entitled to receive payment in full before we receive any distribution in respect of our investment. After repaying such senior creditors, such portfolio company may not have any remaining assets to use for repaying its obligation to us. In the case of debt ranking equally with debt securities in which we invest, we would have to share on an equal basis any distributions with other creditors holding such debt in the event of an insolvency, liquidation, dissolution, reorganization or bankruptcy of the relevant portfolio company. Any such limitations on the ability of our portfolio companies to make principal or interest payments to us, if at all, may reduce our net asset value and have a negative material adverse impact to our business, financial condition and results of operation.
Our investments in foreign securities may involve significant risks in addition to the risks inherent in U.S. investments.
Our investment strategy contemplates potential investments in debt securities of foreign companies, including emerging market companies. Investing in foreign companies may expose us to additional risks not typically associated with investing in U.S. companies. These risks include changes in exchange control regulations, political and social instability, expropriation, imposition of foreign taxes, less liquid markets and less available information than is generally the case in the United States, higher transaction costs, less government supervision of exchanges, brokers and issuers, less developed bankruptcy laws, difficulty in enforcing contractual obligations, lack of uniform accounting and auditing standards and greater price volatility. These risks may be more pronounced for portfolio companies located or operating primarily in emerging markets, whose economies, markets and legal systems may be less developed.
Although most of our investments will be U.S. dollar-denominated, any investments denominated in a foreign currency will be subject to the risk that the value of a particular currency will change in relation to one or more other currencies. Among the factors that may affect currency values are trade balances, the level of short-term interest rates, differences in relative values of similar assets in different currencies, long-term opportunities for investment and capital appreciation, and political developments. We may employ hedging techniques to minimize these risks, but we can offer no assurance that we will, in fact, hedge currency risk, or that if we do, such strategies will be effective.
44
Table of Contents
We may expose ourselves to risks if we engage in hedging transactions.
If we engage in hedging transactions, we may expose ourselves to risks associated with such transactions. We may utilize instruments such as forward contracts, currency options and interest rate swaps, caps, collars and floors to seek to hedge against fluctuations in the relative values of our portfolio positions from changes in currency exchange rates and market interest rates. Hedging against a decline in the values of our portfolio positions does not eliminate the possibility of fluctuations in the values of such positions or prevent losses if the values of such positions decline. However, such hedging can establish other positions designed to gain from those same developments, thereby offsetting the decline in the value of such portfolio positions. Such hedging transactions may also limit the opportunity for gain if the values of the underlying portfolio positions should increase. It may not be possible to hedge against an exchange rate or interest rate fluctuation that is so generally anticipated that we are not able to enter into a hedging transaction at an acceptable price.
The success of our hedging transactions will depend on our ability to correctly predict movements in currencies and interest rates. Therefore, while we may enter into such transactions to seek to reduce currency exchange rate and interest rate risks, unanticipated changes in currency exchange rates or interest rates may result in poorer overall investment performance than if we had not engaged in any such hedging transactions. In addition, the degree of correlation between price movements of the instruments used in a hedging strategy and price movements in the portfolio positions being hedged may vary. Moreover, for a variety of reasons, we may not seek to establish a perfect correlation between such hedging instruments and the portfolio holdings being hedged. Any such imperfect correlation may prevent us from achieving the intended hedge and expose us to risk of loss. In addition, it may not be possible to hedge fully or perfectly against currency fluctuations affecting the value of securities denominated in non-U.S. currencies because the value of those securities is likely to fluctuate as a result of factors not related to currency fluctuations. To the extent we engage in hedging transactions, we also face the risk that counterparties to the derivative instruments we hold may default, which may expose us to unexpected losses from positions where we believed that our risk had been appropriately hedged.
Our investment adviser may not be able to achieve the same or similar returns as those achieved for other funds it currently manages or by our senior investment professionals while they were employed at prior positions.
Our investment adviser manages other funds, including other BDCs, and may manage other entities in the future. The track record and achievements of these other entities are not necessarily indicative of future results that will be achieved by our investment adviser because these other entities may have investment objectives and strategies that differ from ours. Additionally, although in the past our senior investment professionals held senior positions at a number of investment firms, their track record and achievements are not necessarily indicative of future results that will be achieved by our investment adviser. In their roles at such other firms, our senior investment professionals were part of investment teams, and they were not solely responsible for generating investment ideas. In addition, such investment teams arrived at investment decisions by consensus.
Risks Relating to an Investment in Our Securities
Our shares may trade at a substantial discount from net asset value and may continue to do so over the long term.
Shares of BDCs may trade at a market price that is less than the net asset value that is attributable to those shares. For example, as a result of the COVID-19 pandemic, the stocks of BDCs as an industry, including shares of our common stock, have traded below NAV, at or near historic lows as a result of concerns over liquidity, leverage restrictions and distribution requirements. The possibility that our shares of common stock will trade at a substantial discount from net asset value over the long term is separate and distinct from the risk that our net asset value will decrease. We cannot predict whether shares of our common stock will trade above, at or below our net asset value in the future. If our common stock trades below its net asset value, we will generally not be
45
Table of Contents
able to issue additional shares or sell our common stock at its market price without first obtaining the approval for such issuance from our stockholders and our independent directors. At our 2020 Annual Stockholders Meeting, our stockholders approved our ability to sell or otherwise issue shares of our common stock, not exceeding 25% of our then outstanding common stock immediately prior to each such offering, at a price or prices below the then current net asset value per share, in each case subject to the approval of our board of directors and compliance with the conditions set forth in the proxy statement pertaining thereto, during a period beginning on October 6, 2020 and expiring on the earlier of the one-year anniversary of the date of the 2020 Annual Stockholders Meeting and the date of our 2021 Annual Stockholders Meeting. However, notwithstanding such stockholder approval, since our initial public offering on February 9, 2010, we have not sold any shares of our common stock in an offering that resulted in proceeds to us of less than our then current net asset value per share. Any offering of our common stock that requires stockholder approval must occur, if at all, within one year after receiving such stockholder approval. If additional funds are not available to us, we could be forced to curtail or cease our new lending and investment activities, and our net asset value could decrease and our level of distributions could be impacted.
Our common stock price may be volatile and may decrease substantially.
The trading price of our common stock may fluctuate substantially. The price of our common stock that will prevail in the market may be higher or lower than the price you pay, depending on many factors, some of which are beyond our control and may not be directly related to our operating performance. These factors include, but are not limited to, the following:
| • | price and volume fluctuations in the overall stock market from time to time; |
| • | investor demand for our shares; |
| • | significant volatility in the market price and trading volume of securities of BDCs or other companies in our sector, which are not necessarily related to the operating performance of these companies; |
| • | exclusion of our common stock from certain market indices, such as the Russell 2000 Financial Services Index, which could reduce the ability of certain investment funds to own our common stock and put short-term selling pressure on our common stock; |
| • | changes in regulatory policies or tax guidelines with respect to RICs or BDCs; |
| • | failure to qualify as a RIC, or the loss of RIC tax treatment; |
| • | any shortfall in revenue or net income or any increase in losses from levels expected by investors or securities analysts; |
| • | changes, or perceived changes, in the value of our portfolio investments; |
| • | departures of Solar Capital Partners’ key personnel; |
| • | operating performance of companies comparable to us; |
| • | changes in the prevailing interest rates; |
| • | loss of a major funding source; or |
| • | general economic conditions and trends and other external factors. |
Our business and operation could be negatively affected if we become subject to any securities litigation or shareholder activism, which could cause us to incur significant expense, hinder execution of investment strategy and impact our stock price.
In the past, following periods of volatility in the market price of a company’s securities, securities class action litigation has often been brought against that company. Shareholder activism, which could take many forms or
46
Table of Contents
arise in a variety of situations, has been increasing in the BDC space recently. While we are currently not subject to any securities litigation or shareholder activism, due to the potential volatility of our stock price and for a variety of other reasons, we may in the future become the target of securities litigation or shareholder activism. Securities litigation and shareholder activism, including potential proxy contests, could result in substantial costs and divert management’s and our board of directors’ attention and resources from our business. Additionally, such securities litigation and shareholder activism could give rise to perceived uncertainties as to our future, adversely affect our relationships with service providers and make it more difficult to attract and retain qualified personnel. Also, we may be required to incur significant legal fees and other expenses related to any securities litigation and activist shareholder matters. Further, our stock price could be subject to significant fluctuation or otherwise be adversely affected by the events, risks and uncertainties of any securities litigation and shareholder activism.
If the current period of capital market disruption and instability continues for an extended period of time, there is a risk that investors in our equity securities may not receive distributions consistent with historical levels or at all or that our distributions may not grow over time and a portion of our distributions may be a return of capital.
We intend to make distributions on a quarterly basis to our stockholders out of assets legally available for distribution. We cannot assure you that we will achieve investment results that will allow us to make a specified level of cash distributions. Our ability to pay distributions might be adversely affected by the impact of one or more of the risk factors described in this annual report or incorporated herein by reference, including the COVID-19 pandemic described above. For example, if the temporary closure of many corporate offices, retail stores, and manufacturing facilities and factories in the jurisdictions, including the United States, affected by the COVID-19 pandemic were to continue for an extended period of time, it could result in reduced cash flows to us from our existing portfolio companies, which could reduce cash available for distribution to our stockholders. If we violate certain covenants under our existing or future credit facilities or other leverage, we may be limited in our ability to make distributions. If we declare a distribution and if more stockholders opt to receive cash distributions rather than participate in our dividend reinvestment plan, we may be forced to sell some of our investments in order to make cash distribution payments. To the extent we make distributions to stockholders that include a return of capital, such portion of the distribution essentially constitutes a return of the stockholder’s investment. Although such return of capital may not be taxable, such distributions would generally decrease a stockholder’s basis in our common stock and may therefore increase such stockholder’s tax liability for capital gains upon the future sale of such stock. A return of capital distribution may cause a stockholder to recognize a capital gain from the sale of our common stock even if the stockholder sells its shares for less than the original purchase price.
As a RIC, if we do not distribute a certain percentage of our income annually, we may suffer adverse tax consequences, including possibly losing the U.S. federal income tax benefits allowable to RICs. We cannot assure you that you will receive distributions at a particular level or at all.
In certain cases, we may recognize income before or without receiving the accompanying cash. Depending on the amount of noncash income, this could result in difficulty satisfying the annual distribution requirement applicable to RICs. Accordingly, we may have to sell some portfolio investments at times it would not consider advantageous, raise additional debt or equity capital or reduce new investments to meet these distribution requirements.
Due to the COVID-19 pandemic or other disruptions in the economy, we may not be able to increase our dividends and may reduce or defer our dividends and choose to incur U.S. federal excise tax in order preserve cash and maintain flexibility.
As a BDC, we are not required to make any distributions to shareholders other than in connection with our election to be taxed as a RIC under subchapter M of the Code. In order to maintain our tax treatment as a RIC, we must distribute to shareholders for each taxable year at least 90% of our investment company taxable income (i.e., net ordinary income
47
Table of Contents
plus realized net short-term capital gains in excess of realized net long-term capital losses). If we qualify for taxation as a RIC, we generally will not be subject to corporate-level US federal income tax on our investment company taxable income and net capital gains (i.e., realized net long-term capital gains in excess of realized net short-term capital losses) that we timely distribute to shareholders. We will be subject to a 4% U.S. federal excise tax on undistributed earnings of a RIC unless we distribute each calendar year at least the sum of (i) 98.0% of our ordinary income for the calendar year, (ii) 98.2% of our capital gains in excess of capital losses for the one-year period ending on October 31 of the calendar year, and (iii) any ordinary income and net capital gains that we recognized for preceding years, but were not distributed during such years and on which we paid no U.S. federal income tax.
Under the Code, we may satisfy certain of our RIC distributions with dividends paid after the end of the current year. In particular, if we pay a distribution in January of the following year that was declared in October, November, or December of the current year and is payable to shareholders of record in the current year, the dividend will be treated for all US federal income tax purposes as if it were paid on December 31 of the current year. In addition, under the Code, we may pay dividends, referred to as “spillover dividends,” that are paid during the following taxable year that will allow us to maintain our qualification for taxation as a RIC and eliminate our liability for corporate-level U.S. federal income tax. Under these spillover dividend procedures, we may defer distribution of income earned during the current year until December of the following year. For example, we may defer distributions of income earned during 2020 until as late as December 31, 2021. If we choose to pay a spillover dividend, we will incur the 4% U.S. federal excise tax on some or all of the distribution.
Due to the COVID-19 pandemic or other disruptions in the economy, we may take certain actions with respect to the timing and amounts of our distributions in order to preserve cash and maintain flexibility. For example, we may not be able to increase our dividends. In addition, we may reduce our dividends and/or defer our dividends to the following taxable year. If we defer our dividends, we may choose to utilize the spillover dividend rules discussed above and incur the 4% U.S. federal excise tax on such amounts. To further preserve cash, we may combine these reductions or deferrals of dividends with one or more distributions that are payable partially in our stock as discussed below under “We may choose to pay distributions in our own stock, in which case our stockholders may be required to pay U.S. federal income taxes in excess of the cash distributions they receive.”
We may choose to pay distributions in our own common stock, in which case our stockholders may be required to pay U.S. federal income taxes in excess of the cash distributions they receive.
We may distribute taxable distributions that are payable in cash or shares of our common stock at the election of each stockholder. Under certain applicable provisions of the Code and the published guidance, distributions payable of a publicly offered RIC that are in cash or in shares of stock at the election of stockholders may be treated as taxable distributions. The Internal Revenue Service has issued a revenue procedure indicating that this rule will apply if the total amount of cash to be distributed is not less than 20% of the total distribution. Under this revenue procedure, if too many stockholders elect to receive their distributions in cash, the cash available for distribution must be allocated among the stockholders electing to receive cash (with the balance of distributions paid in stock). In no event will any stockholder, electing to receive cash, receive less than the lesser of (a) the portion of the distribution such stockholder has elected to receive in cash or (b) an amount equal to his or her entire distribution times the percentage limitation on cash available for distribution. If we decide to make any distributions consistent with this revenue procedure that are payable in part in our stock, taxable stockholders receiving such distributions will be required to include the full amount of the distribution (whether received in cash, our stock, or a combination thereof) as ordinary income (or as long-term capital gain to the extent such distribution is properly reported as a capital gain distribution) to the extent of our current and accumulated earnings and profits for U.S. federal income tax purposes. As a result, a U.S. stockholder may be required to pay tax with respect to such distributions in excess of any cash received. If a U.S. stockholder sells the stock it receives as a distribution in order to pay this tax, the sales proceeds may be less than the amount included in income with respect to the distribution, depending on the market price of our stock at the time of the sale. Furthermore, with respect to non-U.S. stockholders, we may be required to withhold U.S. tax with respect to such distributions, including in respect of all or a portion of such distribution that is payable in stock. If a significant number of our stockholders determine to sell shares of our stock
48
Table of Contents
in order to pay taxes owed on distributions, it may put downward pressure on the trading price of our stock. Furthermore, with respect to non-U.S. stockholders, we may be required to withhold U.S. tax with respect to such distributions, including in respect of all or a portion of such distribution that is payable in stock. If a significant number of our stockholders determine to sell shares of our stock in order to pay taxes owed on distributions, it may put downward pressure on the trading price of our stock.
Sales of substantial amounts of our common stock in the public market may have an adverse effect on the market price of our common stock.
The shares of our common stock beneficially owned by each of Messrs. Gross and Spohler immediately prior to completion of our initial public offering, including any shares that are attributable to such shares issued pursuant to our dividend reinvestment plan, are no longer subject to lock-up restrictions that each of Messrs. Gross and Spohler agreed to in connection with our initial public offering, and are generally available for resale without restriction, subject to the provisions of Rule 144 promulgated under the Securities Act. In addition, on November 30, 2010, Messrs. Gross and Spohler jointly acquired 115,000 shares of our common stock in a private placement transaction conducted in accordance with Regulation D under the Securities Act. Such shares are generally available for resale without restriction, subject to the provisions of Rule 144 promulgated under the Securities Act. Sales of substantial amounts of our common stock, or the availability of such common stock for sale, could adversely affect the prevailing market prices for our common stock. If this occurs and continues, it could impair our ability to raise additional capital through the sale of securities should we desire to do so.
We may be unable to invest the net proceeds raised from any offerings on acceptable terms or allocate net proceeds from any offering of our securities in ways with which you may not agree.
We cannot assure you that we will be able to find enough appropriate investments that meet our investment criteria or that any investment we complete using the proceeds from any securities offering will produce a sufficient return. Until we identify new investment opportunities, we intend to either invest the net proceeds of future offerings in cash equivalents, U.S. government securities and other high-quality debt investments that mature in one year or less or use the net proceeds from such offerings to reduce then-outstanding obligations.
We have significant flexibility in investing the net proceeds of any offering of our securities and may use the net proceeds from an offering in ways with which you may not agree or for purposes other than those contemplated at the time of the offering.
The net asset value per share of our common stock may be diluted if we issue or sell shares of our common stock at prices below the then current net asset value per share of our common stock or securities to subscribe for or convertible into shares of our common stock.
At our 2020 Annual Stockholders Meeting, our stockholders approved our ability to sell or otherwise issue shares of our common stock, not exceeding 25% of our then outstanding common stock immediately prior to each such offering, at a price or prices below the then current net asset value per share, in each case subject to the approval of our board of directors and compliance with the conditions set forth in the proxy statement pertaining thereto, during a period beginning on October 6, 2020 and expiring on the earlier of the one-year anniversary of the date of the 2020 Annual Stockholders Meeting and the date of our 2021 Annual Stockholders Meeting. However, notwithstanding such stockholder approval, since our initial public offering on February 9, 2010, we have not sold any shares of our common stock in an offering that resulted in proceeds to us of less than our then current net asset value per share. Any offering of our common stock that requires stockholder approval must occur, if at all, within one year after receiving such stockholder approval.
In addition, at our 2011 Annual Stockholders Meeting, our stockholders authorized us to sell or otherwise issue warrants or securities to subscribe for or convertible into shares of our common stock subject to certain limitations (including, without limitation, that the number of shares issuable does not exceed 25% of our then
49
Table of Contents
outstanding common stock and that the exercise or conversion price thereof is not, at the date of issuance, less than the market value per share of our common stock). Such authorization has no expiration.
We may also use newly issued shares to implement our dividend reinvestment plan, whether our shares are trading at a premium or at a discount to our then current net asset value per share. Any decision to issue or sell shares of our common stock below our then current net asset value per share or securities to subscribe for or convertible into shares of our common stock would be subject to the determination by our board of directors that such issuance or sale is in our and our stockholders’ best interests.
If we were to issue or sell shares of our common stock below our then current net asset value per share, such issuances or sales would result in an immediate dilution to the net asset value per share of our common stock.
This dilution would occur as a result of the issuance or sale of shares at a price below the then current net asset value per share of our common stock and a proportionately greater decrease in the stockholders’ interest in our earnings and assets and their voting interest in us than the increase in our assets resulting from such issuance or sale. Because the number of shares of common stock that could be so issued and the timing of any issuance is not currently known, the actual dilutive effect cannot be predicted.
In addition, if we issue warrants or securities to subscribe for or convertible into shares of our common stock, subject to certain limitations, the exercise or conversion price per share could be less than net asset value per share at the time of exercise or conversion (including through the operation of anti-dilution protections).
Because we would incur expenses in connection with any issuance of such securities, such issuance could result in a dilution of the net asset value per share at the time of exercise or conversion. This dilution would include reduction in net asset value per share as a result of the proportionately greater decrease in the stockholders’ interest in our earnings and assets and their voting interest than the increase in our assets resulting from such issuance.
Further, if our current stockholders do not purchase any shares to maintain their percentage interest, regardless of whether such offering is above or below the then current net asset value per share, their voting power will be diluted. For example, if we sell an additional 10% of our common stock at a 5% discount from net asset value, a stockholder who does not participate in that offering for its proportionate interest will suffer net asset value dilution of up to 0.5% or $5 per $1,000 of net asset value.
Similarly, all distributions declared in cash payable to stockholders that are participants in our dividend reinvestment plan are generally automatically reinvested in shares of our common stock. As a result, stockholders that do not participate in the dividend reinvestment plan may experience dilution over time. Stockholders who do not elect to receive distributions in shares of common stock may experience accretion to the net asset value of their shares if our shares are trading at a premium and dilution if our shares are trading at a discount. The level of accretion or discount would depend on various factors, including the proportion of our stockholders who participate in the plan, the level of premium or discount at which our shares are trading and the amount of the distribution payable to a stockholder.
If we issue preferred stock, the net asset value and market value of our common stock may become more volatile.
We cannot assure you that the issuance of preferred stock would result in a higher yield or return to the holders of the common stock. The issuance of preferred stock would likely cause the net asset value and market value of the common stock to become more volatile. If the distribution rate on the preferred stock were to approach the net rate of return on our investment portfolio, the benefit of leverage to the holders of the common stock would be reduced. If the distribution rate on the preferred stock were to exceed the net rate of return on our portfolio, the leverage would result in a lower rate of return to the holders of common stock than if we had not issued
50
Table of Contents
preferred stock. Any decline in the net asset value of our investments would be borne entirely by the holders of common stock. Therefore, if the market value of our portfolio were to decline, the leverage would result in a greater decrease in net asset value to the holders of common stock than if we were not leveraged through the issuance of preferred stock. This greater net asset value decrease would also tend to cause a greater decline in the market price for the common stock. We might be in danger of failing to maintain the required asset coverage of the preferred stock or of losing our ratings on the preferred stock or, in an extreme case, our current investment income might not be sufficient to meet the distribution requirements on the preferred stock. In order to counteract such an event, we might need to liquidate investments in order to fund a redemption of some or all of the preferred stock. In addition, we would pay (and the holders of common stock would bear) all costs and expenses relating to the issuance and ongoing maintenance of the preferred stock, including higher advisory fees if our total return exceeds the distribution rate on the preferred stock. Holders of preferred stock may have different interests than holders of common stock and may at times have disproportionate influence over our affairs.
Our board of directors is authorized to reclassify any unissued shares of common stock into one or more classes of preferred stock, which could convey special rights and privileges to its owners.
Under Maryland General Corporation Law and our charter, our board of directors is authorized to classify and reclassify any authorized but unissued shares of stock into one or more classes of stock, including preferred stock. Prior to issuance of shares of each class or series, the board of directors is required by Maryland law and our charter to set the preferences, conversion or other rights, voting powers, restrictions, limitations as to other distributions, qualifications and terms or conditions of redemption for each class or series. Thus, the board of directors could authorize the issuance of shares of preferred stock with terms and conditions which could have the effect of delaying, deferring or preventing a transaction or a change in control that might involve a premium price for holders of our common stock or otherwise be in their best interest. The cost of any such reclassification would be borne by our existing common stockholders. The issuance of shares of preferred stock convertible into shares of common stock might also reduce the net income and net asset value per share of our common stock upon conversion, provided, that we will only be permitted to issue such convertible preferred stock to the extent we comply with the requirements of Section 61 of the 1940 Act, including obtaining common stockholder approval. These effects, among others, could have an adverse effect on your investment in our common stock.
Certain matters under the 1940 Act require the separate vote of the holders of any issued and outstanding preferred stock. For example, holders of preferred stock would vote separately from the holders of common stock on a proposal to cease operations as a BDC. In addition, the 1940 Act provides that holders of preferred stock are entitled to vote separately from holders of common stock to elect two preferred stock directors. In the event distributions become two full years in arrears, holders of any preferred stock would have the right to elect a majority of the directors until such arrearage is completely eliminated. Preferred stockholders also have class voting rights on certain matters, including changes in fundamental investment restrictions and conversion to open-end status, and accordingly can veto any such changes. Restrictions imposed on the declarations and payment of distributions to the holders of our common stock and preferred stock, both by the 1940 Act and by requirements imposed by rating agencies or the terms of our credit facilities, might impair our ability to maintain our qualification for tax treatment as a RIC for U.S. federal income tax purposes. While we would intend to redeem our preferred stock to the extent necessary to enable us to distribute our income as required to maintain our qualification as a RIC, there can be no assurance that such actions could be effected in time to meet the tax requirements.
To the extent we use debt or preferred stock to finance our investments, changes in interest rates will affect our cost of capital and net investment income.
To the extent we borrow money, or issue preferred stock, to make investments, our net investment income will depend, in part, upon the difference between the rate at which we borrow funds or pay distributions on preferred stock and the rate at which we invest those funds. As a result, we can offer no assurance that a significant change in market interest rates will not have a material adverse effect on our net investment income in the event we use
51
Table of Contents
debt to finance our investments. In periods of rising interest rates, our cost of funds would increase, except to the extent we issue fixed rate debt or preferred stock, which could reduce our net investment income. We expect that our long-term fixed-rate investments will generally be financed with equity and long-term debt. We may use interest rate risk management techniques in an effort to limit our exposure to interest rate fluctuations. Such techniques may include various interest rate hedging activities to the extent permitted by the 1940 Act.
You should also be aware that a rise in the general level of interest rates can be expected to lead to higher interest rates applicable to our debt investments. Accordingly, an increase in interest rates would make it easier for us to meet or exceed the incentive fee hurdle rate and may result in a substantial increase of the amount of incentive fees payable to our investment adviser with respect to our pre-incentive fee net investment income.
Further, rising interest rates could also adversely affect our performance if we hold investments with floating interest rates, subject to specified minimum interest rates (such as a LIBOR floor), while at the same time engaging in borrowings subject to floating interest rates not subject to such minimums. In such a scenario, rising interest rates may increase our interest expense, even though our interest income from Investments is not increasing in a corresponding manner as a result of such minimum interest rates.
We may in the future determine to fund a portion of our investments with preferred stock, which would magnify the potential for loss and the risks of investing in us in a similar way as our borrowings.
Preferred stock, which is another form of leverage, has the same risks to our common stockholders as borrowings because the distributions on any preferred stock we issue must be cumulative. Payment of such distributions and repayment of the liquidation preference of such preferred stock must take preference over any distributions or other payments to our common stockholders, and preferred stockholders are not subject to any of our expenses or losses and are not entitled to participate in any income or appreciation in excess of their stated preference.
Risks Relating to Our Business and Structure
We are dependent upon Solar Capital Partners’ key personnel for our future success.
We depend on the diligence, skill and network of business contacts of Messrs. Gross and Spohler, who serve as the managing partners of Solar Capital Partners and who lead Solar Capital Partners’ investment team. Messrs. Gross and Spohler, together with the other dedicated investment professionals available to Solar Capital Partners, evaluate, negotiate, structure, close and monitor our investments. Our future success will depend on the diligence, skill, network of business contacts and continued service of Messrs. Gross and Spohler and the other investment professionals available to Solar Capital Partners. We cannot assure you that unforeseen business, medical, personal or other circumstances would not lead any such individual to terminate his relationship with us. The loss of Mr. Gross or Mr. Spohler, or any of the other senior investment professionals who serve on Solar Capital Partners’ investment team, could have a material adverse effect on our ability to achieve our investment objective as well as on our financial condition and results of operations. In addition, we can offer no assurance that Solar Capital Partners will remain our investment adviser.
The senior investment professionals of Solar Capital Partners are and may in the future become affiliated with entities engaged in business activities similar to those intended to be conducted by us, and may have conflicts of interest in allocating their time. We expect that Messrs. Gross and Spohler will dedicate a significant portion of their time to the activities of Solar Capital Partners; however, they may be engaged in other business activities which could divert their time and attention in the future. Specifically, Mr. Gross serves as Co-Chief Executive Officer and President of Solar Senior Capital Ltd., SCP Private Credit Income BDC LLC, and SLR HC BDC LLC. In addition, Mr. Spohler serves as Co-Chief Executive Officer and Chief Operating Officer of Solar Senior Capital Ltd., SCP Private Credit Income BDC LLC, and SLR HC BDC LLC.
52
Table of Contents
Our business model depends to a significant extent upon strong referral relationships with financial sponsors, and the inability of the senior investment professionals of our investment adviser to maintain or develop these relationships, or the failure of these relationships to generate investment opportunities, could adversely affect our business.
We expect that the principals of our investment adviser will maintain and develop their relationships with financial sponsors, and we will rely to a significant extent upon these relationships to provide us with potential investment opportunities. If the senior investment professionals of our investment adviser fail to maintain their existing relationships or develop new relationships with other sponsors or sources of investment opportunities, we will not be able to grow our investment portfolio. In addition, individuals with whom the senior investment professionals of our investment adviser have relationships are not obligated to provide us with investment opportunities, and, therefore, there is no assurance that such relationships will generate investment opportunities for us. If our investment adviser is unable to source investment opportunities, we may hold a greater percentage of our assets in cash and cash equivalents than anticipated, which could impact potential returns on our portfolio.
A disruption in the capital markets and the credit markets could negatively affect our business.
As a BDC, we must maintain our ability to raise additional capital for investment purposes. Without sufficient access to the capital markets or credit markets, we may be forced to curtail our business operations or we may not be able to pursue new business opportunities. Disruptive conditions in the financial industry and the impact of new legislation in response to those conditions could restrict our business operations and could adversely impact our results of operations and financial condition.
If the fair value of our assets declines substantially, we may fail to maintain the asset coverage ratios imposed upon us by the 1940 Act and our existing credit facilities. Any such failure could result in an event of default and all of our debt being declared immediately due and payable and would affect our ability to issue senior securities, including borrowings, and pay distributions, which could materially impair our business operations. Our liquidity could be impaired further by an inability to access the capital markets or to draw on our credit facilities. For example, we cannot be certain that we will be able to renew our existing credit facilities as they mature or to consummate new borrowing facilities to provide capital for normal operations, including new originations. Reflecting concern about the stability of the financial markets, many lenders and institutional investors have reduced or ceased providing funding to borrowers. This market turmoil and tightening of credit have led to increased market volatility and widespread reduction of business activity generally.
If we are unable to renew or replace our existing credit facilities and consummate new facilities on commercially reasonable terms, our liquidity will be reduced significantly. If we consummate new facilities but are then unable to repay amounts outstanding under such facilities and are declared in default or are unable to renew or refinance these facilities, we would not be able to initiate significant originations or to operate our business in the normal course. These situations may arise due to circumstances that we may be unable to control, such as inaccessibility to the credit markets, a severe decline in the value of the U.S. dollar, a further economic downturn or an operational problem that affects third parties or us, and could materially damage our business. Moreover, we are unable to predict when economic and market conditions may become more favorable. Even if such conditions improve broadly and significantly over the long term, adverse conditions in particular sectors of the financial markets could adversely impact our business.
Our financial condition and results of operations will depend on Solar Capital Partners’ ability to manage our future growth effectively by identifying, investing in and monitoring companies that meet our investment criteria.
Our ability to achieve our investment objective and to grow depends on Solar Capital Partners’ ability to identify, invest in and monitor companies that meet our investment criteria. Accomplishing this result on a cost-effective basis is largely a function of Solar Capital Partners’ structuring of the investment process, its ability to provide
53
Table of Contents
competent, attentive and efficient services to us and its ability to access financing for us on acceptable terms. The investment team of Solar Capital Partners has substantial responsibilities under the Investment Advisory and Management Agreement, and they may also be called upon to provide managerial assistance to our portfolio companies as the principals of our administrator. In addition, the members of Solar Capital Partners’ investment team have similar responsibilities with respect to the management of other investment portfolios, including the investment portfolios of Solar Senior Capital Ltd., SCP Private Credit Income BDC LLC, and SLR HC BDC LLC. Such demands on their time may distract them or slow our rate of investment. In order to grow, we and Solar Capital Partners will need to retain, train, supervise and manage new investment professionals. However, we can offer no assurance that any such investment professionals will contribute effectively to the work of the investment adviser. Any failure to manage our future growth effectively could have a material adverse effect on our business, financial condition and results of operations.
We may need to raise additional capital to grow because we must distribute most of our income.
We may need additional capital to fund growth in our investments. We expect to issue equity securities and expect to borrow from financial institutions in the future. A reduction in the availability of new capital could limit our ability to grow. We must distribute at least 90% of our investment company taxable income to our stockholders to maintain our tax treatment as a RIC. As a result, any such cash earnings may not be available to fund investment originations. We expect to borrow from financial institutions and issue additional debt and equity securities. If we fail to obtain funds from such sources or from other sources to fund our investments, it could limit our ability to grow, which may have an adverse effect on the value of our securities. In addition, as a BDC, our ability to borrow or issue additional preferred stock may be restricted if our total assets are less than 150% of our total borrowings and preferred stock.
Any failure on our part to maintain our status as a BDC would reduce our operating flexibility and we may be limited in our investment choices as a BDC.
The 1940 Act imposes numerous constraints on the operations of BDCs. For example, BDCs are required to invest at least 70% of their total assets in specified types of securities, primarily in private companies or thinly-traded U.S. public companies, cash, cash equivalents, U.S. government securities and other high quality debt investments that mature in one year or less. Furthermore, any failure to comply with the requirements imposed on BDCs by the 1940 Act could cause the SEC to bring an enforcement action against us and/or expose us to claims of private litigants. In addition, upon approval of a majority of our stockholders, we may elect to withdraw our status as a BDC. If we decide to withdraw our election, or if we otherwise fail to qualify, or maintain our qualification, as a BDC, we may be subject to the substantially greater regulation under the 1940 Act as a closed-end investment company. Compliance with such regulations would significantly decrease our operating flexibility, and could have a material adverse effect on our business, financial condition and results of operations.
Regulations governing our operation as a BDC affect our ability to, and the way in which we will, raise additional capital. As a BDC, the necessity of raising additional capital may expose us to risks, including the typical risks associated with leverage.
In order to satisfy the tax requirements applicable to a RIC, to avoid payment of excise taxes and to minimize or avoid payment of income taxes, we intend to distribute to our stockholders substantially all of our ordinary income and realized net capital gains except for certain realized net long-term capital gains, which we may retain, pay applicable income taxes with respect thereto and elect to treat as deemed distributions to our stockholders. We may issue debt securities or preferred stock and/or borrow money from banks or other financial institutions, which we refer to collectively as “senior securities,” up to the maximum amount permitted by the 1940 Act. Under the provisions of the 1940 Act, we had been permitted, as a BDC, to issue senior securities in amounts such that our asset coverage ratio, as defined in the 1940 Act, equals at least 200% of gross assets less all liabilities and indebtedness not represented by senior securities, after each issuance of senior securities.
54
Table of Contents
However, our stockholders have approved a resolution permitting us to be subject to a 150% asset coverage ratio effective as of October 12, 2018. If the value of our assets declines, we may be unable to satisfy the asset coverage test. If that happens, we may be required to sell a portion of our investments and, depending on the nature of our leverage, repay a portion of our indebtedness at a time when such sales may be disadvantageous. Also, any amounts that we use to service our indebtedness would not be available for distributions to our common stockholders. Furthermore, as a result of issuing senior securities, we would also be exposed to typical risks associated with leverage, including an increased risk of loss. In addition, because our management fee is calculated as a percentage of our gross assets, which includes any borrowings for investment purposes, the management fee expenses will increase if we incur additional indebtedness.
As of December 31, 2020, we had $201 million outstanding under our senior secured revolving credit facility (the “Credit Facility”), composed of $126 million of revolving credit and $75 million outstanding of term loans, and $30 million outstanding under our NEFPASS Facility. We also had $75 million outstanding of the 2026 Unsecured Notes, $125 million outstanding of the 2024 Unsecured Notes, $75 million outstanding of the 2023 Unsecured Notes, $150 million outstanding of the 2022 Unsecured Notes, and $21 million outstanding of the 2022 Tranche C Notes. If we issue preferred stock, the preferred stock would rank “senior” to common stock in our capital structure, preferred stockholders would generally vote together with common stockholders but would have separate voting rights on certain matters and might have other rights, preferences, or privileges more favorable than those of our common stockholders, and the issuance of preferred stock could have the effect of delaying, deferring or preventing a transaction or a change of control that might involve a premium price for holders of our common stock or otherwise be in your best interest.
We are not generally able to issue and sell our common stock at a price below net asset value per share. We may, however, sell our common stock, or warrants, options or rights to acquire our common stock, at a price below the then-current net asset value per share of our common stock if our board of directors determines that such sale is in the best interests of Solar Capital and its stockholders, and our stockholders approve such sale. In any such case, the price at which our securities are to be issued and sold may not be less than a price that, in the determination of our board of directors, closely approximates the market value of such securities (less any distributing commission or discount). If we raise additional funds by issuing more common stock or senior securities convertible into, or exchangeable for, our common stock, then the percentage ownership of our stockholders at that time will decrease, and you might experience dilution. This dilution would occur as a result of a proportionately greater decrease in a stockholder’s interest in our earnings and assets and voting interest in us than the increase in our assets resulting from such issuance. Because the number of future shares of common stock that may be issued below our net asset value per share and the price and timing of such issuances are not currently known, we cannot predict the actual dilutive effect of any such issuance. We cannot determine the resulting reduction in our net asset value per share of any such issuance. We also cannot predict whether shares of our common stock will trade above, at or below our net asset value.
At our 2020 Annual Stockholders Meeting, our stockholders approved our ability to sell or otherwise issue shares of our common stock, not exceeding 25% of our then outstanding common stock immediately prior to each such offering, at a price or prices below the then current net asset value per share, in each case subject to the approval of our board of directors and compliance with the conditions set forth in the proxy statement pertaining thereto, during a period beginning on October 6, 2020 and expiring on the earlier of the one-year anniversary of the date of the 2020 Annual Stockholders Meeting and the date of our 2021 Annual Stockholders Meeting. However, notwithstanding such stockholder approval, since our initial public offering on February 9, 2010, we have not sold any shares of our common stock in an offering that resulted in proceeds to us of less than our then current net asset value per share. Any offering of our common stock that requires stockholder approval must occur, if at all, within one year after receiving such stockholder approval.
Our credit ratings may not reflect all risks of an investment in our debt securities.
Our credit ratings are an assessment by third parties of our ability to pay our obligations. Consequently, real or anticipated changes in our credit ratings will generally affect the market value of our publicly issued debt
55
Table of Contents
securities. Our credit ratings, however, may not reflect the potential impact of risks related to market conditions generally or other factors discussed above on the market value of, or trading market for, any publicly issued debt securities.
Our stockholders may experience dilution in their ownership percentage if they opt out of our dividend reinvestment plan.
All distributions declared in cash payable to stockholders that are participants in our dividend reinvestment plan are automatically reinvested in shares of our common stock. In the event we issue new shares in connection with our dividend reinvestment plan, our stockholders that do not elect to receive distributions in shares of common stock may experience dilution in their ownership percentage over time as a result of such issuance.
We have and will continue to borrow money, which would magnify the potential for loss on amounts invested and may increase the risk of investing in us.
We borrow money as part of our business plan. Borrowings, also known as leverage magnify the potential for loss on amounts invested and, therefore, increase the risks associated with investing in our securities. As of December 31, 2020, we had $201 million outstanding under our Credit Facility, composed of $126 million of revolving credit and $75 million outstanding of term loans, and $30 million outstanding under our NEFPASS Facility. We also had $75 million outstanding of the 2026 Unsecured Notes, $125 million outstanding of the 2024 Unsecured Notes, $75 million outstanding of the 2023 Unsecured Notes, $150 million outstanding of the 2022 Unsecured Notes, and $21 million outstanding of the 2022 Tranche C Notes. We may borrow from and issue senior debt securities to banks, insurance companies and other lenders in the future. Lenders of these senior securities, including the Credit Facility, the 2026 Unsecured Notes, the 2024 Unsecured Notes, the 2022 Unsecured Notes, the 2023 Unsecured Notes, and the 2022 Tranche C Notes, will have fixed dollar claims on our assets that are superior to the claims of our common stockholders, and we would expect such lenders to seek recovery against our assets in the event of a default. If the value of our assets increases, then leveraging would cause the net asset value attributable to our common stock to increase more sharply than it would have had we not leveraged. Conversely, if the value of our assets decreases, leveraging would cause net asset value to decline more sharply than it otherwise would have had we not leveraged. Similarly, any decrease in our income would cause net income to decline more sharply than it would have had we not borrowed. Also, any increase in our income in excess of interest payable on the borrowed funds would cause our net investment income to increase more than it would without the leverage, while any decrease in our income would cause net investment income to decline more sharply than it would have had we not borrowed. Such a decline could also negatively affect our ability to make distribution payments on our common stock, scheduled debt payments or other payments related to our securities. Leverage is generally considered a speculative investment technique. Our ability to service any debt that we incur will depend largely on our financial performance and will be subject to prevailing economic conditions and competitive pressures. Moreover, as the management fee payable to our investment adviser, Solar Capital Partners, will be payable based on our gross assets, including those assets acquired through the use of leverage, Solar Capital Partners will have a financial incentive to incur leverage which may not be consistent with our stockholders’ interests. In addition, our common stockholders will bear the burden of any increase in our expenses as a result of leverage, including any increase in the management fee payable to Solar Capital Partners.
As a BDC, we had generally been required to meet a coverage ratio of total assets to total borrowings and other senior securities, which include all of our borrowings and any preferred stock that we may issue in the future, of at least 200%. However, our stockholders have approved a resolution permitting us to be subject to a 150% asset coverage ratio effective as of October 12, 2018. Even though we are subject to a 150% asset coverage ratio effective as of October 12, 2018, contractual leverage limitations under our existing credit facilities or future borrowings may limit our ability to incur additional indebtedness. On August 28, 2019, we entered into a new Senior Secured Credit Agreement to replace and refinance the Credit Facility, which permits 150% asset coverage. Some of our wholly and/or substantially owned portfolio companies, including Crystal Financial LLC,
56
Table of Contents
NEF Holdings and Kingsbridge Holdings, LLC, may incur significantly more leverage than we can but we do not consolidate Crystal Financial LLC, NEF Holdings and Kingsbridge Holdings LLC and their leverage is non-recourse to us. Additionally, the Credit Facility requires us to comply with certain financial and other restrictive covenants including maintaining an asset coverage ratio of not less than 150% at any time. Failure to maintain compliance with these covenants could result in an event of default and all of our debt being declared immediately due and payable. If this ratio declines below 150%, we may not be able to incur additional debt and could be required by law to sell a portion of our investments to repay some debt when it is disadvantageous to do so, which could have a material adverse effect on our operations, and we may not be able to make distributions. The amount of leverage that we employ will depend on our investment adviser’s and our board of directors’ assessment of market and other factors at the time of any proposed borrowing. We cannot assure you that we will be able to obtain credit at all or on terms acceptable to us.
In addition, our credit facilities impose, and any other debt facility into which we may enter would likely impose, financial and operating covenants that restrict our business activities, including limitations that could hinder our ability to finance additional loans and investments or to make the distributions required to maintain RIC tax treatment under Subchapter M of the Code.
Illustration. The following table illustrates the effect of leverage on returns from an investment in our common stock assuming various annual returns on our portfolio, net of interest expense. The calculations in the table below are hypothetical and actual returns may be higher or lower than those appearing in the table below.
| Assumed total return (net of interest expense) |
||||||||||||||||||||
| (10)% | (5)% | 0% | 5% | 10% | ||||||||||||||||
| Corresponding return to stockholder(1) |
(26.0 | )% | (14.6 | )% | (3.3 | )% | 8.1 | % | 19.5 | % | ||||||||||
| (1) | Assumes $1.94 billion in total assets and $677.0 million in total debt outstanding, which reflects our total assets and total debt outstanding as of December 31, 2020, and a cost of funds of 4.11%. Excludes non-leverage related expenses. |
In order for us to cover our annual interest payments on our outstanding indebtedness at December 31, 2020, we must achieve annual returns on our December 31, 2020 total assets of at least 1.4%.
It is likely that the terms of any current or future long-term or revolving credit or warehouse facility we may enter into in the future could constrain our ability to grow our business.
Our current lenders have, and any future lender or lenders may have, fixed dollar claims on our assets that are senior to the claims of our stockholders and, thus, will have a preference over our stockholders with respect to our assets in the collateral pool. Our current credit facilities and borrowings also subject us to various financial and operating covenants, including, but not limited to, maintaining certain financial ratios and minimum tangible net worth amounts. Future credit facilities and borrowings will likely subject us to similar or additional covenants. In addition, we may grant a security interest in our assets in connection with any such credit facilities and borrowings.
Our credit facilities generally contain customary default provisions such as a minimum net worth amount, a profitability test, and a restriction on changing our business and loan quality standards. In addition, our credit facilities require or are expected to require the repayment of all outstanding debt on the maturity which may disrupt our business and potentially the business of our portfolio companies that are financed through our credit facilities. An event of default under our credit facilities would likely result, among other things, in termination of the availability of further funds under our credit facilities and accelerated maturity dates for all amounts outstanding under our credit facilities, which would likely disrupt our business and, potentially, the business of the portfolio companies whose loans we finance through our credit facilities. This could reduce our revenues and, by delaying any cash payment allowed to us under our credit facilities until the lender has been paid in full, reduce our liquidity and cash flow and impair our ability to grow our business and maintain RIC tax treatment.
57
Table of Contents
The terms of future available financing may place limits on our financial and operation flexibility. If we are unable to obtain sufficient capital in the future, we may be forced to reduce or discontinue our operations, not be able to make new investments, or otherwise respond to changing business conditions or competitive pressures.
Our quarterly and annual operating results are subject to fluctuation as a result of the nature of our business, and if we fail to achieve our investment objective, the net asset value of our common stock may decline.
We could experience fluctuations in our quarterly and annual operating results due to a number of factors, some of which are beyond our control, including, but not limited to, the interest rate payable on the debt securities that we acquire, the default rate on such securities, the level of our expenses, variations in and the timing of the recognition of realized and unrealized gains or losses, changes in our portfolio composition, the degree to which we encounter competition in our markets, market volatility in our publicly traded securities and the securities of our portfolio companies, and general economic conditions. As a result of these factors, results for any period should not be relied upon as being indicative of performance in future periods. In addition, any of these factors could negatively impact our ability to achieve our investment objectives, which may cause our net asset value of our common stock to decline.
58
Table of Contents
Our investments may be in portfolio companies that may have limited operating histories and financial resources.
We expect that our portfolio will continue to consist of investments that may have relatively limited operating histories. These companies may be particularly vulnerable to U.S. and foreign economic downturns such as the U.S. recession that began in mid-2007, the European financial crisis, and the COVID-19 related economic downturn, may have more limited access to capital and higher funding costs, may have a weaker financial position and may need more capital to expand or compete. These businesses also may experience substantial variations in operating results. They may face intense competition, including from companies with greater financial, technical and marketing resources. Furthermore, some of these companies do business in regulated industries and could be affected by changes in government regulation. Accordingly, these factors could impair their cash flow or result in other events, such as bankruptcy, which could limit their ability to repay their obligations to us, and may adversely affect the return on, or the recovery of, our investment in these companies. We cannot assure you that any of our investments in our portfolio companies will be successful. Our portfolio companies compete with larger, more established companies with greater access to, and resources for, further development in these new technologies. Therefore, we may lose our entire investment in any or all of our portfolio companies.
There will be uncertainty as to the value of our portfolio investments, which may impact our net asset value.
A large percentage of our portfolio investments are in the form of securities that are not publicly traded. The fair value of securities and other investments that are not publicly traded may not be readily determinable. We value these securities and the 2022 Unsecured Notes on a quarterly basis in accordance with our valuation policy, which is at all times consistent with U.S. generally accepted accounting principles (“GAAP”). Our board of directors utilizes the services of third-party valuation firms to aid it in determining the fair value of material assets. The board of directors discusses valuations and determines the fair value in good faith based on the input of our investment adviser and, when utilized, the respective third-party valuation firms. The factors that may be considered in fair value pricing our investments include the nature and realizable value of any collateral, the portfolio company’s ability to make payments and its earnings, the markets in which the portfolio company does business, comparisons to publicly traded companies, discounted cash flow and other relevant factors. Because such valuations, and particularly valuations of private securities and private companies, are inherently uncertain, may fluctuate over short periods of time and may be based on estimates, our determinations of fair value may differ materially from the values that would have been used if a ready market for these securities existed. Our net asset value could be adversely affected if our determinations regarding the fair value of our investments were materially higher than the values that we ultimately realize upon the disposal of such securities.
Our equity ownership in a portfolio company may represent a control investment. Our ability to exit an investment in a timely manner because we are in a control position or have access to inside information in the portfolio company could result in a realized loss on the investment.
If we obtain a control investment in a portfolio company our ability to divest ourselves from a debt or equity investment could be restricted due to illiquidity in a private stock, limited trading volume on a public company’s stock, inside information on a company’s performance, insider blackout periods, or other factors that could prohibit us from disposing of the investment as we would if it were not a control investment. Additionally, we may choose not to take certain actions to protect a debt investment in a control investment portfolio company. As a result, we could experience a decrease in the value of our portfolio company holdings and potentially incur a realized loss on the investment.
59
Table of Contents
There are significant potential conflicts of interest, including Solar Capital Partners’ management of other investment funds such as Solar Senior Capital Ltd., SCP Private Credit Income BDC LLC, and SLR HC BDC LLC, which could impact our investment returns, and an investment in Solar Capital Ltd. is not an investment in Solar Senior Capital Ltd., SCP Private Credit Income BDC LLC, or SLR HC BDC LLC.
Our executive officers and directors, as well as the current and future partners of our investment adviser, Solar Capital Partners, may serve as officers, directors or principals of entities that operate in the same or a related line of business as we do. For example, Solar Capital Partners presently serves as the investment adviser to (i) Solar Senior Capital Ltd., a publicly-traded BDC that focuses on investing primarily in senior secured loans, including first lien and stretch-senior debt instruments, (ii) SCP Private Credit Income BDC LLC, an unlisted BDC that focuses on investing primarily in senior secured loans, including non-traditional asset-based loans and first lien loans, and (iii) SLR HC BDC LLC, an unlisted BDC whose principal focus is to invest directly and indirectly in senior secured loans and other debt instruments typically to middle market companies within the healthcare industry. In addition, Michael S. Gross, our Chairman, Co-Chief Executive Officer and President, Bruce Spohler, our Co-Chief Executive Officer and Chief Operating Officer and board member, and Richard L. Peteka, our Chief Financial Officer, serve in similar capacities for Solar Senior Capital Ltd., SCP Private Credit Income BDC LLC, and SLR HC BDC LLC. Accordingly, they may have obligations to investors in those entities, the fulfillment of which obligations might not be in the best interests of us or our stockholders. In addition, we note that any affiliated investment vehicle formed in the future and managed by our investment adviser or its affiliates may, notwithstanding different stated investment objectives, have overlapping investment objectives with our own and, accordingly, may invest in asset classes similar to those targeted by us. As a result, Solar Capital Partners may face conflicts in allocating investment opportunities between us and such other entities. Although Solar Capital Partners will endeavor to allocate investment opportunities in a fair and equitable manner, it is possible that, in the future, we may not be given the opportunity to participate in investments made by investment funds managed by our investment adviser or an investment manager affiliated with our investment adviser. In any such case, when Solar Capital Partners identifies an investment, it will be forced to choose which investment fund should make the investment.
As a BDC, we were substantially limited in our ability to co-invest in privately negotiated transactions with affiliated funds until we obtained an exemptive order from the SEC. The most recent exemptive order, received on June 13, 2017 (the “Exemptive Order”), permits us to participate in negotiated co-investment transactions with certain affiliates, each of whose investment adviser is an investment adviser that controls, is controlled by or is under common control with Solar Capital Partners and is registered as an investment adviser under the Advisers Act, in a manner consistent with our investment objective, positions, policies, strategies and restrictions as well as regulatory requirements and other pertinent factors, and pursuant to the conditions to the Exemptive Order. If we are unable to rely on the Exemptive Order for a particular opportunity, such opportunity will be allocated first to the entity whose investment strategy is the most consistent with the opportunity being allocated, and second, if the terms of the opportunity are consistent with more than one entity’s investment strategy, on an alternating basis. Although our investment professionals will endeavor to allocate investment opportunities in a fair and equitable manner, we and our common stockholders could be adversely affected to the extent investment opportunities are allocated among us and other investment vehicles managed or sponsored by, or affiliated with, our executive officers, directors and members of our investment adviser.
Solar Capital Partners and certain investment advisory affiliates may determine that an investment is appropriate for us and for one or more of those other funds. In such event, depending on the availability of such investment and other appropriate factors, Solar Capital Partners or its affiliates may determine that we should invest side-by-side with one or more other funds. Any such investments will be made only to the extent permitted by applicable law and interpretive positions of the SEC and its staff, and consistent with Solar Capital Partners’ allocation procedures. Related party transactions may occur among Solar Capital Ltd., Crystal Financial LLC, Equipment Operating Leases LLC, NEF Holdings, North Mill Holdco LLC, Gemino Healthcare Finance, LLC and Kingsbridge Holdings LLC. These transactions may occur in the normal course of business. No administrative or other fees are paid to Solar Capital Partners by Crystal Financial LLC, Equipment Operating Leases LLC, NEF Holdings, North Mill Holdco LLC, Gemino Healthcare Finance, LLC or Kingsbridge Holdings, LLC.
60
Table of Contents
In the ordinary course of our investing activities, we pay management and incentive fees to Solar Capital Partners and reimburse Solar Capital Partners for certain expenses it incurs. As a result, investors in our common stock will invest on a “gross” basis and receive distributions on a “net” basis after expenses, resulting in a lower rate of return than an investor might achieve through direct investments. Accordingly, there may be times when the management team of Solar Capital Partners has interests that differ from those of our stockholders, giving rise to a conflict.
We have entered into a royalty-free license agreement with our investment adviser, pursuant to which our investment adviser has granted us a non-exclusive license to use the name “Solar Capital.” Under the license agreement, we have the right to use the “Solar Capital” name for so long as Solar Capital Partners or one of its affiliates remains our investment adviser. In addition, we pay Solar Capital Management, an affiliate of Solar Capital Partners, our allocable portion of overhead and other expenses incurred by Solar Capital Management in performing its obligations under the Administration Agreement, including rent, the fees and expenses associated with performing compliance functions, and our allocable portion of the compensation of our chief compliance officer and our chief financial officer and their respective staffs. These arrangements create conflicts of interest that our board of directors must monitor.
Our ability to enter into transactions involving derivatives and financial commitment transactions may be limited.
Through comprehensive new global regulatory regimes impacting derivatives (e.g., the Dodd-Frank Act, European Market Infrastructure Regulation (“EMIR”), Markets in Financial Investments Regulation (“MIFIR”)/Markets in Financial Instruments Directive (“MIFID II”)), certain over-the-counter derivatives transactions in which we may engage are either now or will soon be subject to various requirements, such as mandatory central clearing of transactions which include additional margin requirements and in certain cases trading on electronic platforms, pre-and post-trade transparency reporting requirements and mandatory bi-lateral exchange of initial margin for non-cleared swaps. The Dodd-Frank Act also created new categories of regulated market participants, such as “swap dealers,” “security-based swap dealers,” “major swap participants,” and “major security-based swap participants” who are subject to significant new capital, registration, recordkeeping, reporting, disclosure, business conduct and other regulatory requirements. The EU and some other jurisdictions are implementing similar requirements. Because these requirements are new and evolving (and some of the rules are not yet final), their ultimate impact remains unclear. However, even if the Company itself is not located in a particular jurisdiction or directly subject to the jurisdiction’s derivatives regulations, we may still be impacted to the extent we enter into a derivatives transaction with a regulated market participant or counterparty that is organized in that jurisdiction or otherwise subject to that jurisdiction’s derivatives regulations.
Based on information available as of the date of this annual report on Form 10-K, the effect of such requirements will be likely to (directly or indirectly) increase our overall costs of entering into derivatives transactions. In particular, new margin requirements, position limits and significantly higher capital charges resulting from new global capital regulations, even if not directly applicable to us, may cause an increase in the pricing of derivatives transactions entered into by market participants to whom such requirements apply or affect our overall ability to enter into derivatives transactions with certain counterparties. Such new global capital regulations and the need to satisfy the various requirements by counterparties are resulting in increased funding costs, increased overall transaction costs, and significantly affecting balance sheets, thereby resulting in changes to financing terms and potentially impacting our ability to obtain financing. Administrative costs, due to new requirements such as registration, recordkeeping, reporting, and compliance, even if not directly applicable to us, may also be reflected in our derivatives transactions. New requirements to trade certain derivatives transactions on electronic trading platforms and trade reporting requirements may lead to (among other things) fragmentation of the markets, higher transaction costs or reduced availability of derivatives, and/or a reduced ability to hedge, all of which could adversely affect the performance of certain of our trading strategies. In addition, changes to derivatives regulations may impact the tax and/or accounting treatment of certain derivatives, which could adversely impact us.
61
Table of Contents
In November 2020, the SEC adopted new rules regarding the ability of a BDC (or a registered investment company) to use derivatives and other transactions that create future payment or delivery obligations. BDCs that use derivatives would be subject to a value-at-risk leverage limit, certain other derivatives risk management program and testing requirements and requirements related to board reporting. These new requirements would apply unless the BDC qualified as a “limited derivatives user,” as defined in the SEC’s adopted rules. A BDC that enters into reverse repurchase agreements or similar financing transactions would need to aggregate the amount of indebtedness associated with the reverse repurchase agreements or similar financing transactions could either (i) comply with the asset coverage requirements of the Section 18 of the 1940 Act when engaging in reverse repurchase agreements or (ii) choose to treat such agreements as derivative transactions under the adopted rule. Under the adopted rule, a BDC may enter into an unfunded commitment agreement that is not a derivatives transaction, such as an agreement to provide financing to a portfolio company, if the BDC has a reasonable belief, at the time it enters into such an agreement, that it will have sufficient cash and cash equivalents to meet its obligations with respect to all of its unfunded commitment agreements, in each case as it becomes due. If the BDC cannot meet this test, it is required to treat unfunded commitments as a derivatives transaction subject to the requirements of the rule. Collectively, these requirements may limit our ability to use derivatives and/or enter into certain other financial contracts.
We may be obligated to pay our investment adviser incentive compensation even if we incur a loss.
Our investment adviser will be entitled to incentive compensation for each fiscal quarter in an amount equal to a percentage of the excess of our pre-incentive fee net investment income for that quarter (before deducting incentive compensation) above a performance threshold for that quarter. Accordingly, since the performance threshold is based on a percentage of our net asset value, decreases in our net asset value make it easier to achieve the performance threshold. Our pre-incentive fee net investment income for incentive compensation purposes excludes realized and unrealized capital losses or depreciation that we may incur in the fiscal quarter, even if such capital losses or depreciation result in a net loss on our statement of operations for that quarter. Thus, we may be required to pay Solar Capital Partners incentive compensation for a fiscal quarter even if there is a decline in the value of our portfolio or we incur a net loss for that quarter.
Our incentive fee may induce Solar Capital Partners to pursue speculative investments.
The incentive fee payable by us to Solar Capital Partners may create an incentive for Solar Capital Partners to pursue investments on our behalf that are riskier or more speculative than would be the case in the absence of such compensation arrangement. The incentive fee payable to our investment adviser is calculated based on a percentage of our return on invested capital. This may encourage our investment adviser to use leverage to increase the return on our investments. Under certain circumstances, the use of leverage may increase the likelihood of default, which would impair the value of our common stock. In addition, our investment adviser receives the incentive fee based, in part, upon net capital gains realized on our investments. Unlike that portion of the incentive fee based on income, there is no hurdle rate applicable to the portion of the incentive fee based on net capital gains. As a result, our investment adviser may have a tendency to invest more capital in investments that are likely to result in capital gains as compared to income producing securities. Such a practice could result in our investing in more speculative securities than would otherwise be the case, which could result in higher investment losses, particularly during economic downturns.
The incentive fee payable by us to our investment adviser also may induce Solar Capital Partners to invest on our behalf in instruments that have a deferred interest feature, even if such deferred payments would not provide cash necessary to enable us to pay current distributions to our stockholders. Under these investments, we would accrue interest over the life of the investment but would not receive the cash income from the investment until the end of the term. Our net investment income used to calculate the income portion of our investment fee, however, includes accrued interest. Thus, a portion of this incentive fee would be based on income that we have not received in cash. In addition, the “catch-up” portion of the incentive fee may encourage Solar Capital Partners to accelerate or defer interest payable by portfolio companies from one calendar quarter to another, potentially resulting in fluctuations in timing and distribution amounts.
62
Table of Contents
We may invest, to the extent permitted by law, in the securities and instruments of other investment companies, including private funds, and, to the extent we so invest, will bear our ratable share of any such investment company’s expenses, including management and performance fees. We will also remain obligated to pay management and incentive fees to Solar Capital Partners with respect to the assets invested in the securities and instruments of other investment companies. With respect to each of these investments, each of our stockholders will bear his or her share of the management and incentive fee of Solar Capital Partners as well as indirectly bearing the management and performance fees and other expenses of any investment companies in which we invest.
We may become subject to corporate-level U.S. federal income tax if we are unable to qualify and maintain our qualification for tax treatment as a regulated investment company under Subchapter M of the Code.
Although we have elected to be treated as a RIC under Subchapter M of the Code, no assurance can be given that we will continue to be able to qualify for and maintain RIC tax treatment. To maintain RIC tax treatment under the Code, we must meet the following annual distribution, income source and asset diversification requirements.
| • | The Annual Distribution Requirement for a RIC will be satisfied if we distribute to our stockholders on an annual basis at least 90% of our net ordinary income and realized net short-term capital gains in excess of realized net long-term capital losses, if any. Because we may use debt financing, we are subject to certain asset coverage ratio requirements under the 1940 Act and financial covenants under loan and credit agreements that could, under certain circumstances, restrict us from making distributions necessary to satisfy the Annual Distribution Requirement. If we are unable to obtain cash from other sources, we could fail to qualify for RIC tax treatment and thus become subject to corporate-level U.S federal income tax. |
| • | The income source requirement will be satisfied if we obtain at least 90% of our income for each year from certain passive investments, including interest, dividends, gains from the sale of stock or securities or similar sources. |
| • | The asset diversification requirement will be satisfied if we meet certain asset diversification requirements at the end of each quarter of our taxable year. Failure to meet those requirements may result in our having to dispose of certain investments quickly in order to prevent the loss of RIC tax treatment. Because most of our investments will be in private companies, and therefore will be relatively illiquid, any such dispositions could be made at disadvantageous prices and could result in substantial losses. |
If we fail to qualify for RIC tax treatment for any reason and become subject to corporate income tax, the resulting corporate taxes could substantially reduce our net assets, the amount of income available for distribution and the amount of our distributions. Such a failure could have a material adverse effect on us, the net asset value of our common stock and the total return, if any, obtainable from your investment in our common stock. Any net operating losses that we incur in periods during which we qualify as a RIC will not offset net capital gains (i.e., net realized long-term capital gains in excess of net realized short-term capital losses) that we are otherwise required to distribute, and we cannot pass such net operating losses through to our stockholders. In addition, net operating losses that we carry over to a taxable year in which we qualify as a RIC normally cannot offset ordinary income or capital gains.
We may have difficulty satisfying the Annual Distribution Requirement in order to qualify and maintain RIC tax treatment if we recognize income before or without receiving cash representing such income.
In accordance with GAAP and tax requirements, we include in income certain amounts that we have not yet received in cash, such as contractual PIK interest, which represents contractual interest added to a loan balance and due at the end of such loan’s term. In addition to the cash yields received on our loans, in some instances, certain loans may also include any of the following: end-of-term payments, exit fees, balloon payment fees or prepayment fees. The increases in loan balances as a result of contractual PIK arrangements are included in income for the period in which such PIK interest was accrued, which is often in advance of receiving cash payment, and are separately identified on our statements of cash flows. We also may be required to include in income certain other amounts prior to receiving the related cash.
63
Table of Contents
Any warrants that we receive in connection with our debt investments will generally be valued as part of the negotiation process with the particular portfolio company. As a result, a portion of the aggregate purchase price for the debt investments and warrants will be allocated to the warrants that we receive. This will generally result in “original issue discount” for U.S. federal income tax purposes, which we must recognize as ordinary income, increasing the amount that we are required to distribute to qualify for the U.S. federal income tax benefits applicable to RICs. Because these warrants generally will not produce distributable cash for us at the same time as we are required to make distributions in respect of the related original issue discount, we would need to obtain cash from other sources or to pay a portion of our distributions using shares of newly issued common stock, consistent with Internal Revenue Service requirements, to satisfy the Annual Distribution and Excise Tax Avoidance requirements.
Other features of the debt instruments that we hold may also cause such instruments to generate an original issue discount, resulting in a distribution requirement in excess of current cash interest received. Since in certain cases we may recognize income before or without receiving cash representing such income, we may have difficulty meeting the RIC tax requirement to distribute at least 90% of our net ordinary income and realized net short-term capital gains in excess of realized net long-term capital losses, if any. Under such circumstances, we may have to sell some of our investments at times we would not consider advantageous, raise additional debt or equity capital or reduce new investment originations to meet these distribution requirements. If we are unable to obtain cash from other sources and are otherwise unable to satisfy such distribution requirements, we may fail to qualify for the U.S. federal income tax benefits allowable to RICs and, thus, become subject to a corporate-level U.S. federal income tax on all our income.
The higher yields and interest rates on PIK securities reflects the payment deferral and increased credit risk associated with such instruments and that such investments may represent a significantly higher credit risk than coupon loans. PIK securities may have unreliable valuations because their continuing accruals require continuing judgments about the collectability of the deferred payments and the value of any associated collateral. PIK interest has the effect of generating investment income and increasing the incentive fees payable at a compounding rate. In addition, the deferral of PIK interest also increases the loan-to-value ratio at a compounding rate. PIK securities create the risk that incentive fees will be paid to our investment adviser based on non-cash accruals that ultimately may not be realized, but our investment adviser will be under no obligation to reimburse the Company for these fees.
Provisions of the Maryland General Corporation Law and of our charter and bylaws could deter takeover attempts and have an adverse impact on the price of our common stock.
The Maryland General Corporation Law and our charter and bylaws contain provisions that may discourage, delay or make more difficult a change in control of Solar Capital or the removal of our directors. We are subject to the Maryland Business Combination Act, subject to any applicable requirements of the 1940 Act. Our board of directors has adopted a resolution exempting from the Maryland Business Combination Act any business combination between us and any other person, subject to prior approval of such business combination by our board of directors, including approval by a majority of our disinterested directors. If the resolution exempting business combinations is repealed or our board of directors does not approve a business combination, the Maryland Business Combination Act may discourage third parties from trying to acquire control of us and increase the difficulty of consummating such an offer. Our bylaws exempt from the Maryland Control Share Acquisition Act (the “Control Share Act”) acquisitions of our stock by any person. If we amend our bylaws to repeal the exemption from the Control Share Act, the Control Share Act also may make it more difficult for a third party to obtain control of us and increase the difficulty of consummating such a transaction. The SEC staff has rescinded its position that, under the 1940 Act, an investment company may not avail itself of the Control Share Act. As a result, we will amend our bylaws to be subject to the Control Share Act only if our board of directors determines that it would be in our best interests.
64
Table of Contents
We have also adopted measures that may make it difficult for a third party to obtain control of us, including provisions of our charter classifying our board of directors in three classes serving staggered three-year terms, and authorizing our board of directors to classify or reclassify shares of our stock in one or more classes or series, to cause the issuance of additional shares of our stock and to amend our charter without stockholder approval to increase or decrease the number of shares of stock that we have authority to issue. These provisions, as well as other provisions of our charter and bylaws, may delay, defer or prevent a transaction or a change in control that might otherwise be in the best interests of our stockholders.
The foregoing provisions are expected to discourage certain coercive takeover practices and inadequate takeover bids and to encourage persons seeking to acquire control of us to negotiate first with our board of directors. However, these provisions may deprive a stockholder of the opportunity to sell such stockholder’s shares at a premium to a potential acquirer. We believe that the benefits of these provisions outweigh the potential disadvantages of discouraging any such acquisition proposals because, among other things, the negotiation of such proposals may improve their terms. Our board of directors has considered both the positive and negative effects of the foregoing provisions and determined that they are in the best interest of our stockholders.
The failure in cyber security systems, as well as the occurrence of events unanticipated in our disaster recovery systems and management continuity planning could impair our ability to conduct business effectively.
The occurrence of a disaster, such as a cyber-attack against us or against a third-party that has access to our data or networks, a natural catastrophe, an industrial accident, failure of our disaster recovery systems, or consequential employee error, could have an adverse effect on our ability to communicate or conduct business, negatively impacting our operations and financial condition. This adverse effect can become particularly acute if those events affect our electronic data processing, transmission, storage, and retrieval systems, or impact the availability, integrity, or confidentiality of our data.
We depend heavily upon computer systems to perform necessary business functions. Despite our implementation of a variety of security measures, our computer systems, networks, and data, like those of other companies, could be subject to cyber-attacks and unauthorized access, use, alteration, or destruction, such as from physical and electronic break-ins or unauthorized tampering. If one or more of these events occurs, it could potentially jeopardize the confidential, proprietary, and other information processed, stored in, and transmitted through our computer systems and networks. Such an attack could cause interruptions or malfunctions in our operations, which could result in financial losses, litigation, regulatory penalties, client dissatisfaction or loss, reputational damage, and increased costs associated with mitigation of damages and remediation. If unauthorized parties gain access to such information and technology systems, they may be able to steal, publish, delete or modify private and sensitive information, including nonpublic personal information related to stockholders (and their beneficial owners) and material nonpublic information. The systems we have implemented to manage risks relating to these types of events could prove to be inadequate and, if compromised, could become inoperable for extended periods of time, cease to function properly or fail to adequately secure private information. Breaches such as those involving covertly introduced malware, impersonation of authorized users and industrial or other espionage may not be identified even with sophisticated prevention and detection systems, potentially resulting in further harm and preventing them from being addressed appropriately. The failure of these systems or of disaster recovery plans for any reason could cause significant interruptions in our and our Adviser’s operations and result in a failure to maintain the security, confidentiality or privacy of sensitive data, including personal information relating to stockholders, material nonpublic information and other sensitive information in our possession.
A disaster or a disruption in the infrastructure that supports our business, including a disruption involving electronic communications or other services used by us or third parties with whom we conduct business, or directly affecting our headquarters, could have a material adverse impact on our ability to continue to operate our business without interruption. Our disaster recovery programs may not be sufficient to mitigate the harm that may result from such a disaster or disruption. In addition, insurance and other safeguards might only partially reimburse us for our losses, if at all.
65
Table of Contents
Third parties with which we do business may also be sources of cybersecurity or other technological risk. We outsource certain functions and these relationships allow for the storage and processing of our information, as well as client, counterparty, employee, and borrower information. While we engage in actions to reduce our exposure resulting from outsourcing, ongoing threats may result in unauthorized access, loss, exposure, destruction, or other cybersecurity incident that affects our data, resulting in increased costs and other consequences as described above.
In addition, cybersecurity has become a top priority for regulators around the world, and some jurisdictions have enacted laws requiring companies to notify individuals of data security breaches involving certain types of personal data. If we fail to comply with the relevant laws and regulations, we could suffer financial losses, a disruption of our businesses, liability to investors, regulatory intervention or reputational damage.
We and our service providers are currently impacted by quarantines and similar measures being enacted by governments in response to the global COVID-19 pandemic, which are obstructing the regular functioning of business workforces (including requiring employees to work from external locations and their homes). Policies of extended periods of remote working, whether by us or by our Service Providers, could strain technology resources, introduce operational risks and otherwise heighten the risks described above. Remote working environments may be less secure and more susceptible to hacking attacks, including phishing and social engineering attempts that seek to exploit the COVID-19 pandemic. Accordingly, the risks described above are heightened under current conditions.
We, our Investment Adviser and our portfolio companies are subject to risks associated with “phishing” and other cyber-attacks.
Our business and the business of our portfolio companies relies upon secure information technology systems for data processing, storage and reporting. Despite careful security and controls design, implementation and updating, ours and our portfolio companies’ information technology systems could become subject to cyber-attacks. Cyber-attacks include, but are not limited to, gaining unauthorized access to digital systems (e.g., through “hacking”, malicious software coding, social engineering or “phishing” attempts) for purposes of misappropriating assets or sensitive information, corrupting data, or causing operational disruption. Cyber-attacks may also be carried out in a manner that does not require gaining unauthorized access, such as causing denial-of service attacks on websites (i.e., efforts to make network services unavailable to intended users). Our Investment Adviser’s employees have been and expect to continue to be the target of fraudulent calls, emails and other forms of activities. The result of these incidents may include disrupted operations, misstated or unreliable financial data, liability for stolen information, misappropriation of assets, increased cybersecurity protection and insurance costs, litigation and damage to our business relationships, regulatory fines or penalties, or other adverse effects on our business, financial condition or results of operations. In addition, we may be required to expend significant additional resources to modify our protective measures and to investigate and remediate vulnerabilities or other exposures arising from operational and security risks related to cyber-attacks.
Our Investment Adviser’s and other service providers’ increased use of mobile and cloud technologies could heighten the risk of a cyber-attack as well as other operational risks, as certain aspects of the security of such technologies may be complex, unpredictable or beyond their control. Our Investment Adviser’s and other service providers’ reliance on mobile or cloud technology or any failure by mobile technology and cloud service providers to adequately safeguard their systems and prevent cyber-attacks could disrupt their operations and result in misappropriation, corruption or loss of personal, confidential or proprietary information. In addition, there is a risk that encryption and other protective measures against cyber-attacks may be circumvented, particularly to the extent that new computing technologies increase the speed and computing power available.
Additionally, remote working environments may be less secure and more susceptible to cyber-attacks, including phishing and social engineering attempts that seek to exploit the COVID-19 pandemic. Accordingly, the risks associated with cyber-attacks are heightened under current conditions.
66
Table of Contents
We can be highly dependent on information systems and systems failures could significantly disrupt our business, which may, in turn, negatively affect the market price of our common stock and our ability to pay distributions.
Our business is highly dependent on our and third parties’ communications and information systems. Any failure or interruption of those systems, including as a result of the termination of an agreement with any third-party service providers, could cause delays or other problems in our activities. Our financial, accounting, data processing, backup or other operating systems and facilities may fail to operate properly or become disabled or damaged as a result of a number of factors including events that are wholly or partially beyond our control and adversely affect our business. There could be:
| • | sudden electrical or telecommunications outages; |
| • | natural disasters such as earthquakes, tornadoes and hurricanes; |
| • | events arising from local or larger scale political or social matters, including terrorist acts; and |
| • | cyber-attacks. |
These events, in turn, could have a material adverse effect on our operating results and negatively affect the market price of our common stock and our ability to pay distributions to our stockholders.
Our board of directors may change our investment objective, operating policies and strategies without prior notice or stockholder approval.
Our board of directors has the authority to modify or waive certain of our operating policies and strategies without prior notice (except as required by the 1940 Act) and without stockholder approval. However, absent stockholder approval, we may not change the nature of our business so as to cease to be, or withdraw our election as a BDC. We cannot predict the effect any changes to our current operating policies and strategies would have on our business, operating results and value of our stock. Nevertheless, the effects may adversely affect our business and impact our ability to make distributions.
Our business is subject to increasingly complex corporate governance, public disclosure and accounting requirements that could adversely affect our business and financial results.
We are subject to changing rules and regulations of federal and state government as well as the stock exchange on which our common stock is listed. These entities, including the Public Company Accounting Oversight Board, the SEC and the NASDAQ Stock Market, have issued a significant number of new and increasingly complex requirements and regulations over the course of the last several years and continue to develop additional regulations and requirements in response to laws enacted by Congress. Our efforts to comply with these existing requirements, or any revised or amended requirements, have resulted in, and are likely to continue to result in, an increase in expenses and a diversion of management’s time from other business activities.
Changes in laws or regulations governing our operations may adversely affect our business.
Changes in the laws or regulations, or the interpretations of the laws and regulations, which govern BDCs, RICs or non-depository commercial lenders could significantly affect our operations and our cost of doing business. We are subject to federal, state and local laws and regulations and are subject to judicial and administrative decisions that affect our operations, including our loan originations, maximum interest rates, fees and other charges, disclosures to portfolio companies, the terms of secured transactions, collection and foreclosure procedures, and other trade practices. If these laws, regulations or decisions change, or if we expand our business into jurisdictions that have adopted more stringent requirements than those in which we currently conduct business, then we may have to incur significant expenses in order to comply or we may have to restrict our operations. In addition, if we do not comply with applicable laws, regulations and decisions, then we may lose licenses needed for the conduct of our business and be subject to civil fines and criminal penalties, any of which could have a material adverse effect upon our business results of operations or financial condition.
67
Table of Contents
Uncertainty about U.S. government initiatives could negatively impact our business, financial condition and results of operations.
The U.S. government has recently called for significant changes to U.S. trade, healthcare, immigration, foreign and government regulatory policy. In this regard, there is significant uncertainty with respect to legislation, regulation and government policy at the federal level, as well as the state and local levels. Recent events have created a climate of heightened uncertainty and introduced new and difficult-to-quantify macroeconomic and political risks with potentially far-reaching implications. There has been a corresponding meaningful increase in the uncertainty surrounding interest rates, inflation, foreign exchange rates, trade volumes and fiscal and monetary policy. To the extent the U.S. Congress or the current administration implements changes to U.S. policy, those changes may impact, among other things, the U.S. and global economy, international trade and relations, unemployment, immigration, corporate taxes, healthcare, the U.S. regulatory environment, inflation and other areas.
A particular area identified as subject to potential change, amendment or repeal includes the Dodd-Frank Wall Street Reform and Consumer Protection Act, or the “Dodd-Frank Act,” including the Volcker Rule and various swaps and derivatives regulations, credit risk retention requirements and the authorities of the Federal Reserve, the Financial Stability Oversight Council and the SEC. Given the uncertainty associated with the manner in which and whether the provisions of the Dodd-Frank Act will be implemented, repealed, amended, or replaced, the full impact such requirements will have on our business, results of operations or financial condition is unclear. The changes resulting from the Dodd-Frank Act or any changes to the regulations already implemented thereunder may require us to invest significant management attention and resources to evaluate and make necessary changes in order to comply with new statutory and regulatory requirements. Failure to comply with any such laws, regulations or principles, or changes thereto, may negatively impact our business, results of operations or financial condition. While we cannot predict what effect any changes in the laws or regulations or their interpretations would have on us as a result of recent financial reform legislation, these changes could be materially adverse to us and our stockholders.
Changes to United States tariff and import/export regulations may have a negative effect on our portfolio companies and, in turn, harm us.
There has been ongoing discussion and commentary regarding potential significant changes to United States trade policies, treaties and tariffs. The current administration, along with Congress, has created significant uncertainty about the future relationship between the United States and other countries with respect to the trade policies, treaties and tariffs. These developments, or the perception that any of them could occur, may have a material adverse effect on global economic conditions and the stability of global financial markets, and may significantly reduce global trade and, in particular, trade between the impacted nations and the United States. Any of these factors could depress economic activity and restrict our portfolio companies’ access to suppliers or customers and have a material adverse effect on their business, financial condition and results of operations, which in turn would negatively impact us.
Our investment adviser can resign on 60 days’ notice, and we may not be able to find a suitable replacement within that time, resulting in a disruption in our operations that could adversely affect our financial condition, business and results of operations.
Our investment adviser has the right, under the Investment Advisory and Management Agreement, to resign at any time upon 60 days’ written notice, whether we have found a replacement or not. If our investment adviser resigns, we may not be able to find a new investment adviser or hire internal management with similar expertise and ability to provide the same or equivalent services on acceptable terms within 60 days, or at all. If we are unable to do so quickly, our operations are likely to experience a disruption, our financial condition, business and results of operations as well as our ability to pay distributions are likely to be adversely affected and the market price of our shares may decline. In addition, the coordination of our internal management and investment
68
Table of Contents
activities is likely to suffer if we are unable to identify and reach an agreement with a single institution or group of executives having the expertise possessed by our investment adviser and its affiliates. Even if we are able to retain comparable management, whether internal or external, the integration of such management and their lack of familiarity with our investment objective may result in additional costs and time delays that may adversely affect our financial condition, business and results of operations.
| Item 1B. | Unresolved Staff Comments |
None
| Item 2. | Properties |
Our executive offices are located at 500 Park Avenue, New York, New York 10022, and are provided by Solar Capital Management in accordance with the terms of the Administration Agreement. We believe that our office facilities are suitable and adequate for our business as it is presently conducted.
| Item 3. | Legal Proceedings |
We and our consolidated subsidiaries are not currently subject to any material legal proceedings, nor, to our knowledge, is any material legal proceeding threatened against us or our consolidated subsidiaries. From time to time, we and our consolidated subsidiaries may be a party to certain legal proceedings in the ordinary course of business, including proceedings relating to the enforcement of our rights under contracts with our portfolio companies. While the outcome of these legal proceedings cannot be predicted with certainty, we do not expect that these proceedings will have a material effect upon our financial condition or results of operations.
| Item 4. | Mine Safety Disclosures |
Not applicable.
69
Table of Contents
PART II
| Item 5. | Market for Registrant’s Common Equity, Related Stockholder Matters and Issuer Purchases of Equity Securities |
Common Stock
Our common stock is traded on the NASDAQ Global Select Market under the symbol “SLRC”. The following table sets forth, for each fiscal quarter during the last two fiscal years, the net asset value (“NAV”) per share of our common stock, the high and low closing sales prices for our common stock, such sales prices as a percentage of NAV per share and quarterly distributions per share.
| NAV(1) | Price Range | Premium or (Discount) of High Closing Price to NAV(2) |
Premium or (Discount) of Low Closing Price to NAV (2) |
Declared Distributions (3) |
||||||||||||||||||||
| High | Low | |||||||||||||||||||||||
| Fiscal 2020 |
||||||||||||||||||||||||
| Fourth Quarter |
$ | 20.16 | $ | 18.14 | $ | 15.43 | (10.0 | )% | (23.5 | )% | $ | 0.41 | ||||||||||||
| Third Quarter |
20.14 | 17.38 | 15.36 | (13.7 | ) | (23.7 | ) | 0.41 | ||||||||||||||||
| Second Quarter |
20.11 | 17.73 | 11.03 | (11.8 | ) | (45.2 | ) | 0.41 | ||||||||||||||||
| First Quarter |
19.24 | 21.15 | 7.55 | 9.9 | (60.8 | ) | 0.41 | |||||||||||||||||
| Fiscal 2019 |
||||||||||||||||||||||||
| Fourth Quarter |
$ | 21.44 | $ | 21.18 | $ | 19.98 | (1.2 | )% | (6.8 | )% | $ | 0.41 | ||||||||||||
| Third Quarter |
21.90 | 21.07 | 20.15 | (3.8 | ) | (8.0 | ) | 0.41 | ||||||||||||||||
| Second Quarter |
21.98 | 21.54 | 20.18 | (2.0 | ) | (8.2 | ) | 0.41 | ||||||||||||||||
| First Quarter |
21.93 | 21.75 | 19.41 | (0.8 | ) | (11.5 | ) | 0.41 | ||||||||||||||||
| (1) | NAV per share is determined as of the last day in the relevant quarter and therefore may not reflect the NAV per share on the date of the high and low sales prices. The net asset values shown are based on outstanding shares at the end of each period. |
| (2) | Calculated as of the respective high or low closing price divided by NAV and subtracting 1. |
| (3) | Represents the cash distribution for the specified quarter. |
On February 19, 2021 the last reported sales price of our common stock was $19.01 per share. As of February 19, 2021, we had 18 shareholders of record.
Shares of BDCs may trade at a market price that is less than the value of the net assets attributable to those shares. The possibility that our shares of common stock will trade at a discount from net asset value or at premiums that are unsustainable over the long term are separate and distinct from the risk that our net asset value will decrease. Since our IPO on February 9, 2010, our shares of common stock have traded at both a discount and a premium to the net assets attributable to those shares. As of February 19, 2021, our shares of common stock traded at a discount equal to approximately 5.7% of the net assets attributable to those shares based upon our net asset value as of December 31, 2020. It is not possible to predict whether the shares offered hereby will trade at, above, or below net asset value.
70
Table of Contents
DISTRIBUTIONS
Tax characteristics of all distributions will be reported to stockholders on Form 1099 after the end of the calendar year. Future quarterly distributions, if any, will be determined by our Board. We expect that our distributions to stockholders will generally be from accumulated net investment income, from net realized capital gains or non-taxable return of capital, if any, as applicable.
We have elected to be taxed as a RIC under Subchapter M of the Code. To maintain our RIC tax treatment, we must distribute at least 90% of our ordinary income and realized net short-term capital gains in excess of realized net long-term capital losses, if any, out of the assets legally available for distribution. In addition, although we currently intend to distribute realized net capital gains (i.e., net long-term capital gains in excess of short-term capital losses), if any, at least annually, out of the assets legally available for such distributions, we may in the future decide to retain such capital gains for investment.
We maintain an “opt out” dividend reinvestment plan for our common stockholders. As a result, if we declare a distribution, then stockholders’ cash distributions will be automatically reinvested in additional shares of our common stock, unless they specifically “opt out” of the dividend reinvestment plan so as to receive cash distributions.
We may not be able to achieve operating results that will allow us to make distributions at a specific level or to increase the amount of these distributions from time to time. In addition, due to the asset coverage test applicable to us as a business development company, we may in the future be limited in our ability to make distributions. Also, our revolving credit facility may limit our ability to declare distributions if we default under certain provisions. If we do not distribute a certain percentage of our income annually, we will suffer adverse tax consequences, including possible loss of the tax benefits available to us as a regulated investment company. In addition, in accordance with GAAP and tax regulations, we include in income certain amounts that we have not yet received in cash, such as contractual payment-in-kind interest, which represents contractual interest added to the loan balance that becomes due at the end of the loan term, or the accrual of original issue or market discount. Since we may recognize income before or without receiving cash representing such income, we may have difficulty meeting the requirement to distribute at least 90% of our investment company taxable income to obtain tax benefits as a regulated investment company.
With respect to the distributions to stockholders, income from origination, structuring, closing and certain other upfront fees associated with investments in portfolio companies are treated as taxable income and accordingly, distributed to stockholders.
We cannot assure stockholders that they will receive any distributions at a particular level.
All distributions declared in cash payable to stockholders that are participants in our dividend reinvestment plan are generally automatically reinvested in shares of our common stock. As a result, stockholders that do not participate in the dividend reinvestment plan may experience dilution over time. Stockholders who do not elect to receive distributions in shares of common stock may experience accretion to the net asset value of their shares if our shares are trading at a premium and dilution if our shares are trading at a discount. The level of accretion or discount would depend on various factors, including the proportion of our stockholders who participate in the plan, the level of premium or discount at which our shares are trading and the amount of the distribution payable to a stockholder.
Recent Sales of Unregistered Securities
None.
Issuer Purchases of Equity Securities
None.
71
Table of Contents
STOCK PERFORMANCE GRAPH
This graph compares the cumulative total return on our common stock with that of the Standard & Poor’s BDC Index, Standard & Poor’s 500 Stock Index and the Russell 2000 Financial Services Index, for the period from December 31, 2015 through December 31, 2020. The graph assumes that a person invested $10,000 in each of the following: our common stock (SLRC), the S&P BDC Index, the S&P 500 Index, and the Russell 2000 Financial Services Index. The graph measures total stockholder return, which takes into account both changes in stock price and dividends. It assumes that dividends paid are invested in additional shares of the same class of equity securities at the frequency with which dividends are paid of such securities during the applicable fiscal year.
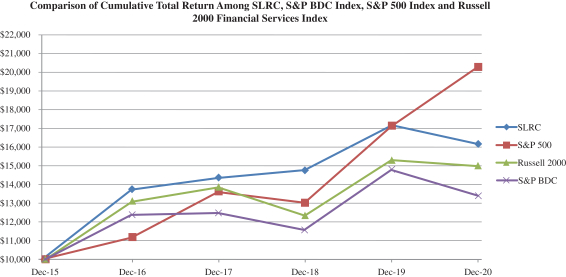
The graph and other information furnished under this Part II Item 5 of this Form 10-K shall not be deemed to be “soliciting material” or to be “filed” with the SEC or subject to Regulation 14A or 14C, or to the liabilities of Section 18 of the 1934 Act. The stock price performance included in the above graph is not necessarily indicative of future stock price performance.
72
Table of Contents
FEES AND EXPENSES
The following table is intended to assist an investor in understanding the costs and expenses that you will bear directly or indirectly. We caution you that some of the percentages indicated in the table below are estimates and may vary. Except where the context suggests otherwise, whenever this report contains a reference to fees or expenses paid by “us” or “Solar Capital,” or that “we” will pay fees or expenses, you will indirectly bear such fees or expenses as an investor in Solar Capital Ltd.
| Stockholder transaction expenses: |
||||
| Sales load (as a percentage of offering price) |
— | %(1) | ||
| Offering expenses (as a percentage of offering price) |
— | %(2) | ||
| Dividend reinvestment plan expenses |
— | %(3) | ||
| Total stockholder transaction expenses (as a percentage of offering price) |
— | %(2) | ||
| Annual expenses (as a percentage of net assets attributable to common stock)(4): |
||||
| Base management fee |
2.93 | %(5) | ||
| Incentive fees payable under our Investment Advisory and Management Agreement (up to 20%) |
0.27 | %(6) | ||
| Interest payments on borrowed funds |
3.19 | %(7) | ||
| Acquired fund fees and expenses |
— | % | ||
| Other expenses (estimated) |
0.95 | %(8) | ||
| Total annual expenses |
7.34 | % | ||
| (1) | In the event that the shares of common stock are sold to or through underwriters, a corresponding prospectus supplement will disclose the applicable sales load and the “Example” will be updated accordingly. |
| (2) | The prospectus supplement corresponding to each offering will disclose the applicable offering expenses and total stockholder transaction expenses. |
| (3) | The expenses of the dividend reinvestment plan are included in “other expenses.” |
| (4) | Annual Expenses are presented in this manner because common shareholders will bear all costs of running the Company. |
| (5) | Our 1.75% base management fee under the Investment Advisory and Management Agreement is based on our gross assets, which is defined as all the assets of Solar Capital, excluding temporary assets, including those acquired using borrowings for investment purposes, and assumes our gross assets remain consistent with gross assets for the fiscal year ended December 31, 2020. The base management fee is reduced to 1.00% on gross assets that execeed 200% of total net assets as of the immediately preceding quarter. |
| (6) | Assumes that annual incentive fees earned by our investment adviser, Solar Capital Partners, remain consistent with the incentive fees earned by Solar Capital Partners for the fiscal year ended December 31, 2020. The incentive fee consists of two parts: |
The first part, which is payable quarterly in arrears, equals 20% of the excess, if any, of our “Pre-Incentive Fee Net Investment Income” that exceeds a 1.75% quarterly (7.00% annualized) hurdle rate, which we refer to as the Hurdle, subject to a “catch-up” provision measured at the end of each calendar quarter. The first part of the incentive fee is computed and paid on income that may include interest that is accrued but not yet received in cash. The operation of the first part of the incentive fee for each quarter is as follows:
| • | no incentive fee is payable to our investment adviser in any calendar quarter in which our Pre-Incentive Fee Net Investment Income does not exceed the Hurdle of 1.75%; |
| • | 100% of our Pre-Incentive Fee Net Investment Income with respect to that portion of such Pre-Incentive Fee Net Investment Income, if any, that exceeds the Hurdle but is less than 2.1875% in any calendar quarter (8.75% annualized) is payable to our investment adviser. We refer to this portion of our Pre-Incentive Fee Net Investment Income (which exceeds the Hurdle but is less than 2.1875%) as the “catch-up.” The “catch-up” is meant to provide our investment adviser with 20% of our Pre-Incentive Fee Net Investment Income, as if a Hurdle did not apply when our Pre-Incentive Fee Net Investment Income exceeds 2.1875% in any calendar quarter; and |
73
Table of Contents
| • | 20% of the amount of our Pre-Incentive Fee Net Investment Income, if any, that exceeds 2.1875% in any calendar quarter (8.75% annualized) is payable to our investment adviser (once the Hurdle is reached and the catch-up is achieved, 20% of all Pre-Incentive Fee Investment Income thereafter is allocated to our investment adviser). |
The second part of the incentive fee equals 20% of our “Incentive Fee Capital Gains,” if any, which equals our realized capital gains on a cumulative basis from inception through the end of each calendar year, computed net of all realized capital losses and unrealized capital depreciation on a cumulative basis, less the aggregate amount of any previously paid capital gain incentive fees. The second part of the incentive fee is payable, in arrears, at the end of each calendar year (or upon termination of the Investment Advisory and Management Agreement, as of the termination date).
| (7) | We have historically and will in the future borrow funds from time to time to make investments to the extent we determine that the economic situation is conducive to doing so. The costs associated with our outstanding borrowings are indirectly born by our investors. For purposes of this section, we have computed interest expense using the average consolidated balance outstanding for borrowings during the fiscal year ended December 31, 2020. We used the London Interbank Offered Rate (“LIBOR”) rate or similar base rate on December 31, 2020 and the interest rate on the Credit Facility, the NEFPASS Facility, the 2026 Unsecured Notes, the 2024 Unsecured Notes, the 2023 Unsecured Notes, the 2022 Unsecured Notes and the 2022 Tranche C Notes on December 31, 2020. We have also included, as applicable, the estimated amortization of fees incurred in establishing the Credit Facility, the NEFPASS Facility, the 2026 Unsecured Notes, the 2024 Unsecured Notes, the 2023 Unsecured Notes, the 2022 Unsecured Notes and the 2022 Tranche C Notes as of December 31, 2020. Additionally, we included the estimated cost of commitment fees for unused balances on the Credit Facility and the NEFPASS Facility. As of December 31, 2020, we had $201.0 million outstanding under the Credit Facility, $30 million outstanding under our NEFPASS Facility, and $75 million, $125 million, $75 million, $150 million and $21 million outstanding under the 2026 Unsecured Notes, the 2024 Unsecured Notes, the 2023 Unsecured Notes, the 2022 Unsecured Notes and the 2022 Tranche C Notes, respectively. We may also issue preferred stock, subject to our compliance with applicable requirements under the 1940 Act, although we have no immediate intention to do so. |
| (8) | “Other expenses” are based on estimated amounts for the current fiscal year, which considers the amounts incurred for the fiscal year ended December 31, 2020 and include our overhead expenses, including payments under our Administration Agreement based on our allocable portion of overhead and other expenses incurred by Solar Capital Management in performing its obligations under the Administration Agreement. |
Example
The following example demonstrates the projected dollar amount of total cumulative expenses that would be incurred over various periods with respect to a hypothetical investment in our common stock. In calculating the following expense amounts, we have assumed that our annual operating expenses would remain at the levels set forth in the table above and have excluded performance-based incentive fees. As such, the below example is based on an annual expense ratio of 7.07%. See Note 7 above for
additional information regarding certain assumptions regarding our level of leverage. In the event that shares are sold to or through underwriters, a corresponding prospectus supplement will restate this example to reflect the applicable sales load.
| 1 Year | 3 Years | 5 Years | 10 Years | |||||||||||||
| You would pay the following expenses on a $1,000 investment, assuming a 5% annual return |
$ | 71 | $ | 208 | $ | 339 | $ | 645 | ||||||||
The example and the expenses in the tables above should not be considered a representation of our future expenses, and actual expenses may be greater or less than those shown. While the example assumes,
74
Table of Contents
as required by the SEC, a 5% annual return, our performance will vary and may result in a return greater or less than 5%. The incentive fee under the Investment Advisory and Management Agreement, which, assuming a 5% annual return, would either not be payable or would have an insignificant impact on the expense amounts shown above, is not included in the example. This illustration assumes that we will not realize any capital gains (computed net of all realized capital losses and unrealized capital depreciation) in any of the indicated time periods. If we achieve sufficient returns on our investments, including through the realization of capital gains, to trigger an incentive fee of a material amount, our expenses and returns to our investors would be higher. For example, if we assumed that we received our 5% annual return completely in the form of net realized capital gains on our investments, computed net of all cumulative unrealized depreciation on our investments, the projected dollar amount of total cumulative expenses set forth in the above illustration would be as follows:
| 1 Year | 3 Years | 5 Years | 10 Years | |||||||||||||
| You would pay the following expenses on a $1,000 investment, assuming a 5% annual return |
$ | 81 | $ | 235 | $ | 380 | $ | 704 | ||||||||
In addition, the example assumes no sales load. Also, while the example assumes reinvestment of all distributions at net asset value, participants in our dividend reinvestment plan will receive a number of shares of our common stock, determined by dividing the total dollar amount of the distribution payable to a participant by the market price per share of our common stock at the close of trading on the distribution payment date, which may be at, above or below net asset value unless the company makes open market purchases and the shares received will be determined based on the average price paid by our agent, plus commissions.
| Item 6. | Selected Financial Data |
The selected financial and other data below should be read in conjunction with our “Management’s Discussion and Analysis of Financial Condition and Results of Operations” and the consolidated financial statements and notes thereto. Financial information is presented for the fiscal years ended December 31, 2020, 2019, 2018, 2017 and 2016. Financial information for the periods ending December 31, 2020, 2019, 2018, 2017 and 2016 has been derived from our consolidated financial statements that were audited by KPMG LLP (“KPMG”), an independent registered public accounting firm.
| ($ in thousands, except per share data) |
Year ended December 31, 2020 |
Year ended December 31, 2019 |
Year ended December 31, 2018 |
Year ended December 31, 2017 |
Year ended December 31, 2016 |
|||||||||||||||
| Income statement data: |
||||||||||||||||||||
| Total investment income |
$ | 121,745 | $ | 154,711 | $ | 153,526 | $ | 143,338 | $ | 151,839 | ||||||||||
| Total expenses |
$ | 62,530 | $ | 82,266 | $ | 78,637 | $ | 74,975 | $ | 80,738 | ||||||||||
| Net investment income |
$ | 59,215 | $ | 72,445 | $ | 74,889 | $ | 68,363 | $ | 71,101 | ||||||||||
| Net realized gain (loss) |
$ | (26,638 | ) | $ | (1,760 | ) | $ | 2,078 | $ | (12,015 | ) | $ | 776 | |||||||
| Net change in unrealized gain (loss). |
$ | (17,126 | ) | $ | (14,669 | ) | $ | (10,093 | ) | $ | 14,082 | $ | 34,938 | |||||||
| Net increase in net assets resulting from operations |
$ | 15,451 | $ | 56,016 | $ | 66,874 | $ | 70,430 | $ | 106,815 | ||||||||||
| Per share data: |
||||||||||||||||||||
| Net investment income (1) |
$ | 1.40 | $ | 1.71 | $ | 1.77 | $ | 1.62 | $ | 1.68 | ||||||||||
| Net realized and unrealized gain (loss)(1) |
$ | (1.04 | ) | $ | (0.38 | ) | $ | (0.19 | ) | $ | 0.05 | $ | 0.84 | |||||||
| Dividends and distributions declared |
$ | 1.64 | $ | 1.64 | $ | 1.64 | $ | 1.60 | $ | 1.60 | ||||||||||
75
Table of Contents
| As of December 31, 2020 |
As of December 31, 2019 |
As of December 31, 2018 |
As of December 31, 2017 |
As of December 31, 2016 |
||||||||||||||||
| Balance sheet data: |
||||||||||||||||||||
| Total investment portfolio |
$ | 1,531,951 | $ | 1,494,824 | $ | 1,456,080 | $ | 1,461,170 | $ | 1,304,778 | ||||||||||
| Cash and cash equivalents |
$ | 388,776 | $ | 436,354 | $ | 207,216 | $ | 150,789 | $ | 312,046 | ||||||||||
| Total assets |
$ | 1,935,958 | $ | 1,949,889 | $ | 1,683,429 | $ | 1,641,565 | $ | 1,650,547 | ||||||||||
| Debt |
$ | 677,000 | $ | 593,900 | $ | 476,185 | $ | 541,600 | $ | 390,200 | ||||||||||
| Net assets |
$ | 852,023 | $ | 905,880 | $ | 919,171 | $ | 921,605 | $ | 918,507 | ||||||||||
| Per share data: |
||||||||||||||||||||
| Net asset value per share |
$ | 20.16 | $ | 21.44 | $ | 21.75 | $ | 21.81 | $ | 21.74 | ||||||||||
| Other data (unaudited): |
||||||||||||||||||||
| Total return(2) |
(5.7 | %) | 16.2 | % | 2.8 | % | 4.5 | % | 37.5 | % | ||||||||||
| Number of portfolio companies at period end |
105 | 108 | 117 | 93 | 63 | |||||||||||||||
| (1) | The per-share calculations are based on weighted average shares of 42,260,826, 42,260,826, 42,260,826, 42,257,692 and 42,258,143 for the years ended December 31, 2020, 2019, 2018, 2017 and 2016, respectively. |
| (2) | Total return is based on the change in market price per share during the year and takes into account dividends, if any, reinvested in accordance with the dividend reinvestment plan. Total return does not include a sales load. |
| Item 7. | Management’s Discussion and Analysis of Financial Condition and Results of Operations |
The information contained in this section should be read in conjunction with the Selected Financial and Other Data and our Consolidated Financial Statements and notes thereto appearing elsewhere in this report.
Some of the statements in this report constitute forward-looking statements, which relate to future events or our future performance or financial condition. The forward-looking statements contained herein involve risks and uncertainties, including statements as to:
| • | our future operating results, including our ability to achieve objectives as a result of the current COVID-19 pandemic; |
| • | our business prospects and the prospects of our portfolio companies; |
| • | the impact of investments that we expect to make; |
| • | our contractual arrangements and relationships with third parties; |
| • | the dependence of our future success on the general economy and its impact on the industries in which we invest and the impact of the COVID-19 pandemic thereon; |
| • | the impact of any protracted decline in the liquidity of credit markets on our business and the impact of the COVID-19 pandemic thereon; |
| • | the ability of our portfolio companies to achieve their objectives, including as a result of the current COVID-19 pandemic; |
| • | the valuation of our investments in portfolio companies, particularly those having no liquid trading market, and the impact of the COVID-19 pandemic thereon; |
| • | market conditions and our ability to access alternative debt markets and additional debt and equity capital, and the impact of the COVID-19 pandemic thereon; |
| • | our expected financings and investments; |
76
Table of Contents
| • | the adequacy of our cash resources and working capital; |
| • | the timing of cash flows, if any, from the operations of our portfolio companies and the impact of the COVID-19 pandemic thereon; and |
| • | the ability of our investment adviser to locate suitable investments for us and to monitor and administer our investments and the impacts of the COVID-19 pandemic thereon. |
These statements are not guarantees of future performance and are subject to risks, uncertainties, and other factors, some of which are beyond our control and difficult to predict and could cause actual results to differ materially from those expressed or forecasted in the forward-looking statements, including without limitation:
| • | an economic downturn, including as a result of the current COVID-19 pandemic, could impair our portfolio companies’ ability to continue to operate, which could lead to the loss of some or all of our investments in such portfolio companies; |
| • | a contraction of available credit and/or an inability to access the equity markets, including as a result of the current COVID-19 pandemic, could impair our lending and investment activities; |
| • | interest rate volatility could adversely affect our results, particularly because we use leverage as part of our investment strategy; |
| • | currency fluctuations could adversely affect the results of our investments in foreign companies, particularly to the extent that we receive payments denominated in foreign currency rather than U.S. dollars; and |
| • | the risks, uncertainties and other factors we identify in Item 1A. — Risk Factors contained in this Annual Report on Form 10-K for the year ended December 31, 2020 and in our other filings with the SEC. |
We generally use words such as “anticipates,” “believes,” “expects,” “intends” and similar expressions to identify forward-looking statements. Our actual results could differ materially from those projected in the forward-looking statements for any reason, including any factors set forth in “Risk Factors” and elsewhere in this report.
We have based the forward-looking statements included in this report on information available to us on the date of this report, and we assume no obligation to update any such forward-looking statements. Although we undertake no obligation to revise or update any forward-looking statements, whether as a result of new information, future events or otherwise, you are advised to consult any additional disclosures that we may make directly to you or through reports that we in the future may file with the SEC, including any annual reports on Form 10-K, quarterly reports on Form 10-Q and current reports on Form 8-K.
Overview
Solar Capital LLC, a Maryland limited liability company, was formed in February 2007 and commenced operations on March 13, 2007 with initial capital of $1.2 billion of which 47.04% was funded by affiliated parties.
Solar Capital Ltd. (“Solar Capital”, the “Company”, “we” or “our”), a Maryland corporation formed in November 2007, is a closed-end, externally managed, non-diversified management investment company that has elected to be regulated as a business development company (“BDC”) under the Investment Company Act of 1940, as amended (the “1940 Act”). Furthermore, as the Company is an investment company, it continues to apply the guidance in the Financial Accounting Standards Board (“FASB”) Accounting Standards Codification (“ASC”) Topic 946. In addition, for U.S federal income tax purposes, the Company has elected to be treated as a regulated investment company (“RIC”) under Subchapter M of the Internal Revenue Code of 1986, as amended (the “Code”).
77
Table of Contents
On February 9, 2010, we priced our initial public offering, selling 5.68 million shares of our common stock. Concurrent with our initial public offering, Michael S. Gross, our Chairman, Co-Chief Executive Officer and President, and Bruce Spohler, our Co-Chief Executive Officer and Chief Operating Officer, collectively purchased an additional 0.6 million shares of our common stock through a private placement transaction exempt from registration under the Securities Act.
We invest primarily in privately held U.S. middle-market companies, where we believe the supply of primary capital is limited and the investment opportunities are most attractive. Our investment objective is to generate both current income and capital appreciation through debt and equity investments. We invest primarily in leveraged middle-market companies in the form of senior secured loans, stretch-senior loans, financing leases and to a lesser extent, unsecured loans and equity securities. From time to time, we may also invest in public companies that are thinly traded. Our business is focused primarily on the direct origination of investments through portfolio companies or their financial sponsors. Our investments generally range between $5 million and $100 million each, although we expect that this investment size will vary proportionately with the size of our capital base and/or with strategic initiatives. Our investment activities are managed by Solar Capital Partners, LLC (the “Investment Adviser”) and supervised by our board of directors, a majority of whom are non-interested, as such term is defined in the 1940 Act. Solar Capital Management, LLC (the “Administrator”) provides the administrative services necessary for us to operate.
In addition, we may invest a portion of our portfolio in other types of investments, which we refer to as opportunistic investments, which are not our primary focus but are intended to enhance our overall returns. These investments may include, but are not limited to, direct investments in public companies that are not thinly traded and securities of leveraged companies located in select countries outside of the United States.
As of December 31, 2020, the Investment Adviser has directly invested approximately $10.0 billion in more than 400 different portfolio companies since 2006. Over the same period, the Investment Adviser completed transactions with over 200 different financial sponsors.
Recent Developments
On February 24, 2021, our Board declared a quarterly distribution of $0.41 per share payable on April 2, 2021 to holders of record as of March 18, 2021.
The global outbreak of the COVID-19 pandemic, and the related effect on the U.S. and global economies, has continued to have adverse consequences for the business operations of some of the Company’s portfolio companies and, as a result, has had adverse effects on the Company’s operations. The ultimate economic fallout from the pandemic, and the long-term impact on economies, markets, industries and individual issuers, including the Company, remain uncertain. The operational and financial performance of the issuers of securities in which the Company invests depends on future developments, including the duration and spread of the outbreak, and such uncertainty may in turn adversely affect the value and liquidity of the Company’s investments and negatively impact the Company’s performance.
Investments
Our level of investment activity can and does vary substantially from period to period depending on many factors, including the amount of debt and equity capital available to middle market companies, the level of merger and acquisition activity for such companies, the general economic environment and the competitive environment for the types of investments we make. As a BDC, we must not acquire any assets other than “qualifying assets” specified in the 1940 Act unless, at the time the acquisition is made, at least 70% of our total assets are qualifying assets (with certain limited exceptions). Qualifying assets include investments in “eligible portfolio companies.” The definition of “eligible portfolio company” includes certain public companies that do not have any securities listed on a national securities exchange and companies whose securities are listed on a national securities exchange but whose market capitalization is less than $250 million.
78
Table of Contents
Revenue
We generate revenue primarily in the form of interest and dividend income from the securities we hold and capital gains, if any, on investment securities that we may sell. Our debt investments generally have a stated term of three to seven years and typically bear interest at a floating rate usually determined on the basis of a benchmark London interbank offered rate (“LIBOR”), commercial paper rate, or the prime rate. Interest on our debt investments is generally payable monthly or quarterly but may be bi-monthly or semi-annually. In addition, our investments may provide payment-in-kind (“PIK”) interest. Such amounts of accrued PIK interest are added to the cost of the investment on the respective capitalization dates and generally become due at maturity of the investment or upon the investment being called by the issuer. We may also generate revenue in the form of commitment, origination, structuring fees, fees for providing managerial assistance and, if applicable, consulting fees, etc.
Expenses
All investment professionals of the investment adviser and their respective staffs, when and to the extent engaged in providing investment advisory and management services, and the compensation and routine overhead expenses of such personnel allocable to such services, are provided and paid for by Solar Capital Partners. We bear all other costs and expenses of our operations and transactions, including (without limitation):
| • | the cost of our organization and public offerings; |
| • | the cost of calculating our net asset value, including the cost of any third-party valuation services; |
| • | the cost of effecting sales and repurchases of our shares and other securities; |
| • | interest payable on debt, if any, to finance our investments; |
| • | fees payable to third parties relating to, or associated with, making investments, including fees and expenses associated with performing due diligence reviews of prospective investments and advisory fees; |
| • | transfer agent and custodial fees; |
| • | fees and expenses associated with marketing efforts; |
| • | federal and state registration fees, any stock exchange listing fees; |
| • | federal, state and local taxes; |
| • | independent directors’ fees and expenses; |
| • | brokerage commissions; |
| • | fidelity bond, directors and officers errors and omissions liability insurance and other insurance premiums; |
| • | direct costs and expenses of administration, including printing, mailing, long distance telephone and staff; |
| • | fees and expenses associated with independent audits and outside legal costs; |
| • | costs associated with our reporting and compliance obligations under the 1940 Act and applicable federal and state securities laws; and |
| • | all other expenses incurred by either Solar Capital Management or us in connection with administering our business, including payments under the Administration Agreement that will be based upon our allocable portion of overhead and other expenses incurred by Solar Capital Management in performing its obligations under the Administration Agreement, including rent, the fees and expenses associated with performing compliance functions, and our allocable portion of the costs of compensation and related expenses of our chief compliance officer and our chief financial officer and their respective staffs. |
79
Table of Contents
We expect our general and administrative operating expenses related to our ongoing operations to increase moderately in dollar terms. During periods of asset growth, we generally expect our general and administrative operating expenses to decline as a percentage of our total assets and increase during periods of asset declines. Incentive fees, interest expense and costs relating to future offerings of securities, among others, may also increase or reduce overall operating expenses based on portfolio performance, interest rate benchmarks, and offerings of our securities relative to comparative periods, among other factors.
Portfolio and Investment Activity
During the year ended December 31, 2020, we invested approximately $427 million across 40 portfolio companies. This compares to investing approximately $404 million in over 50 portfolio companies for the year ended December 31, 2019. Investments sold, prepaid or repaid during the year ended December 31, 2020 totaled approximately $363 million versus approximately $362 million for the year ended December 31, 2019.
At December 31, 2020, our portfolio consisted of 105 portfolio companies and was invested 18.8% in cash flow senior secured loans, 27.0% in asset-based senior secured loans / Crystal Financial LLC (“Crystal”), 14.2% in Kingsbridge Holdings LLC (“KBH”), 18.6% in equipment senior secured financings / NEF Holdings, LLC (“NEF”), and 21.4% in life science senior secured loans, in each case, measured at fair value, versus 108 portfolio companies invested 31.0% in cash flow senior secured loans, 28.2% in asset-based senior secured loans / Crystal, 21.5% in equipment senior secured financings / NEF, and 19.3% in life science senior secured loans, in each case, measured at fair value, at December 31, 2019.
At December 31, 2020, 72.1% or $1.10 billion of our income producing investment portfolio* is floating rate and 27.9% or $425.4 million is fixed rate, measured at fair value. At December 31, 2019, 77.5% or $1.14 billion of our income producing investment portfolio* is floating rate and 22.5% or $331.9 million is fixed rate, measured at fair value. As of December 31, 2020 and 2019, we had zero issuers and one issuer on non-accrual status, respectively.
Since inception through December 31, 2020, Solar Capital and its predecessor companies have invested approximately $6.7 billion in more than 295 portfolio companies. Over the same period, Solar Capital has completed transactions with more than 150 different financial sponsors.
* We have included Crystal Financial LLC and NEF Holdings LLC within our income producing investment portfolio.
Crystal Financial LLC
On December 28, 2012, we completed the acquisition of Crystal Capital Financial Holdings LLC (“Crystal Financial”), a commercial finance company focused on providing asset-based and other secured financing solutions (the “Crystal Acquisition”). We invested $275 million in cash to effect the Crystal Acquisition. Crystal Financial owned approximately 98% of the outstanding ownership interest in Crystal Financial LLC. The remaining financial interest was held by various employees of Crystal Financial LLC, through their investment in Crystal Management LP. Crystal Financial LLC had a diversified portfolio of 23 loans having a total par value of approximately $400 million at November 30, 2012 and a $275 million committed revolving credit facility. On July 28, 2016, the Company purchased Crystal Management LP’s approximately 2% equity interest in Crystal Financial LLC for approximately $5.7 million. Upon the closing of this transaction, the Company holds 100% of the equity interest in Crystal Financial LLC. On September 30, 2016, Crystal Capital Financial Holdings LLC was dissolved. On December 20, 2018, the revolving credit facility was expanded to $330 million.
As of December 31, 2020, Crystal Financial LLC had 30 funded commitments to 24 different issuers with total funded loans of approximately $404.1 million on total assets of $433.9 million. As of December 31, 2019, Crystal Financial LLC had 35 funded commitments to 28 different issuers with total funded loans of
80
Table of Contents
approximately $496.8 million on total assets of $518.0 million. As of December 31, 2020 and December 31, 2019, the largest loan outstanding totaled $45.0 million and $45.0 million, respectively. For the same periods, the average exposure per issuer was $16.8 million and $17.7 million, respectively. Crystal Financial LLC’s credit facility, which is non-recourse to Solar Capital, had approximately $183.9 million and $276.0 million of borrowings outstanding at December 31, 2020 and December 31, 2019, respectively. For the years ended December 31, 2020 and 2019, Crystal Financial LLC had net income of $23.3 million and $8.0 million, respectively, on gross income of $45.3 million and $61.2 million, respectively. Due to timing and non-cash items, there may be material differences between GAAP net income and cash available for distributions. As such, and subject to fluctuations in Crystal Financial LLC’s funded commitments, the timing of originations, and the repayments of financings, the Company cannot guarantee that Crystal Financial LLC will be able to maintain consistent dividend payments to us. Crystal Financial LLC’s consolidated financial statements for the fiscal years ended December 31, 2020 and December 31, 2019 are attached as an exhibit to this annual report on Form 10-K.
NEF Holdings, LLC
On July 31, 2017, we completed the acquisition of NEF Holdings, LLC (“NEF”), which conducts its business through its wholly-owned subsidiary Nations Equipment Finance, LLC. NEF is an independent equipment finance company that provides senior secured loans and leases primarily to U.S. based companies. We invested $209.9 million in cash to effect the transaction, of which $145.0 million was invested in the equity of NEF through our wholly-owned consolidated taxable subsidiary NEFCORP LLC and our wholly-owned consolidated subsidiary NEFPASS LLC and $64.9 million was used to purchase certain leases and loans held by NEF through NEFPASS LLC. Concurrent with the transaction, NEF refinanced its existing senior secured credit facility into a $150.0 million non-recourse facility with an accordion feature to expand up to $250.0 million. In September 2019, NEF amended the facility, increasing commitments to $214.0 million with an accordion feature to expand up to $314.0 million and extended the maturity date of the facility to July 31, 2023. At July 31, 2017, NEF also had two securitizations outstanding, with an issued note balance of $94.6 million, which were later redeemed in 2018.
As of December 31, 2020, NEF had 138 funded equipment-backed leases and loans to 61 different customers with a total net investment in leases and loans of approximately $188.4 million on total assets of $263.4 million. As of December 31, 2019, NEF had 168 funded equipment-backed leases and loans to 78 different customers with a total net investment in leases and loans of approximately $245.0 million on total assets of $304.2 million. As of December 31, 2020 and December 31, 2019, the largest position outstanding totaled $25.1 million and $26.9 million, respectively. For the same periods, the average exposure per customer was $3.1 million and $3.1 million, respectively. NEF’s credit facility, which is non-recourse to Solar Capital, had approximately $100.6 million and $128.2 million of borrowings outstanding at December 31, 2020 and December 31, 2019, respectively. For the years ended December 31, 2020 and 2019, NEF had net income (loss) of ($8.9) million and ($6.0) million, respectively, on gross income of $24.5 million and $31.9 million, respectively. Due to timing and non-cash items, there may be material differences between GAAP net income and cash available for distributions. As such, and subject to fluctuations in NEF’s funded commitments, the timing of originations, and the repayments of financings, the Company cannot guarantee that NEF will be able to maintain consistent dividend payments to us. NEF’s consolidated financial statements for the fiscal years ended December 31, 2020 and December 31, 2019 are attached as an exhibit to this annual report on Form 10-K.
Kingsbridge Holdings, LLC
On November 3, 2020, the Company acquired 87.5% of Kingsbridge Holdings, LLC (“KBH”) through KBH Topco LLC (“KBHT”), a newly formed Delaware corporation. KBH is a residual focused independent mid-ticket lessor of equipment primarily to U.S. investment grade companies. The Company invested $216.6 million to effect the transaction, of which $136.6 million was invested to acquire 87.5% of KBHT’s equity and $80.0 million in KBH’s debt. The existing management team of KBH committed to continue to lead KBH after the transaction. Post the transaction, the Company owns 87.5% of KBHT equity and the KBH management team owns the remaining 12.5% of KBHT’s equity.
81
Table of Contents
As of December 31, 2020, KBHT had total assets of $744.7 million. KBHT also had recourse debt outstanding of $219.0 million as well as non-recourse debt outstanding of $335.9 million. For the period November 3, 2020 through December 31, 2020, KBHT had net income of $2.2 million, on gross income of $43.6 million. Due to timing and non-cash items, there may be material differences between GAAP net income and cash available for distributions. As such, and subject to fluctuations in KBHT’s funded commitments, the timing of originations, and the repayments of financings, the Company cannot guarantee that KBHT will be able to maintain consistent dividend payments to us. KBHT’s consolidated financial statements for the period November 3, 2020 through December 31, 2020 are attached as an exhibit to this annual report on Form 10-K.
Critical Accounting Policies
The preparation of consolidated financial statements and related disclosures in conformity with GAAP requires management to make estimates and assumptions that affect the reported amounts of assets and liabilities, disclosure of contingent assets and liabilities at the date of the consolidated financial statements, and revenues and expenses during the periods reported. Actual results could materially differ from those estimates. We have identified the following items as critical accounting policies. Within the context of these critical accounting policies and disclosed subsequent events herein, we are not currently aware of any other reasonably likely events or circumstances that would result in materially different amounts being reported.
Valuation of Portfolio Investments
We conduct the valuation of our assets, pursuant to which our net asset value is determined, at all times consistent with GAAP, and the 1940 Act. Our valuation procedures are set forth in more detail below:
Under procedures established by our board of directors (the “Board”), we value investments, including certain senior secured debt, subordinated debt and other debt securities with maturities greater than 60 days, for which market quotations are readily available, at such market quotations (unless they are deemed not to represent fair value). We attempt to obtain market quotations from at least two brokers or dealers (if available, otherwise from a principal market maker or a primary market dealer or other independent pricing service). We utilize mid-market pricing as a practical expedient for fair value unless a different point within the range is more representative. If and when market quotations are deemed not to represent fair value, we may utilize independent third-party valuation firms to assist us in determining the fair value of material assets. Accordingly, such investments go through our multi-step valuation process as described below. In each case, independent valuation firms consider observable market inputs together with significant unobservable inputs in arriving at their valuation recommendations. Debt investments with maturities of 60 days or less shall each be valued at cost plus accreted discount, or minus amortized premium, which is expected to approximate fair value, unless such valuation, in the judgment of the Investment Adviser, does not represent fair value, in which case such investments shall be valued at fair value as determined in good faith by or under the direction of our Board. Investments that are not publicly traded or whose market quotations are not readily available are valued at fair value as determined in good faith by or under the direction of our Board. Such determination of fair values involves subjective judgments and estimates.
With respect to investments for which market quotations are not readily available or when such market quotations are deemed not to represent fair value, our Board has approved a multi-step valuation process each quarter, as described below:
| (1) | our quarterly valuation process begins with each portfolio company or investment being initially valued by the investment professionals of the Investment Adviser responsible for the portfolio investment; |
| (2) | preliminary valuation conclusions are then documented and discussed with senior management of the Investment Adviser; |
82
Table of Contents
| (3) | independent valuation firms engaged by our Board conduct independent appraisals and review the Investment Adviser’s preliminary valuations and make their own independent assessment for all material assets; |
| (4) | the audit committee of the Board reviews the preliminary valuation of the Investment Adviser and that of the independent valuation firm, if any, and responds to the valuation recommendation of the independent valuation firm to reflect any comments; and |
| (5) | the Board discusses valuations and determines the fair value of each investment in our portfolio in good faith based on the input of the Investment Adviser, the respective independent valuation firm, if any, and the audit committee. |
Investments in all asset classes are valued utilizing a market approach, an income approach, or both approaches, as appropriate. However, in accordance with ASC 820-10, certain investments that qualify as investment companies in accordance with ASC 946, may be valued using net asset value as a practical expedient for fair value. The market approach uses prices and other relevant information generated by market transactions involving identical or comparable assets or liabilities (including a business). The income approach uses valuation approaches to convert future amounts (for example, cash flows or earnings) to a single present amount (discounted). The measurement is based on the value indicated by current market expectations about those future amounts. In following these approaches, the types of factors that we may take into account in fair value pricing our investments include, as relevant: available current market data, including relevant and applicable market trading and transaction comparables, applicable market yields and multiples, security covenants, call protection provisions, the nature and realizable value of any collateral, the portfolio company’s ability to make payments, its earnings and discounted cash flows, the markets in which the portfolio company does business, comparisons of financial ratios of peer companies that are public, M&A comparables, our principal market (as the reporting entity) and enterprise values, among other factors. When available, broker quotations and/or quotations provided by pricing services are considered as an input in the valuation process. For the fiscal year ended December 31, 2020, there has been no change to the Company’s valuation approaches or techniques and the nature of the related inputs considered in the valuation process.
Accounting Standards Codification (“ASC”) Topic 820 classifies the inputs used to measure these fair values into the following hierarchy:
Level 1: Quoted prices in active markets for identical assets or liabilities, accessible by the Company at the measurement date.
Level 2: Quoted prices for similar assets or liabilities in active markets, or quoted prices for identical or similar assets or liabilities in markets that are not active, or other observable inputs other than quoted prices.
Level 3: Unobservable inputs for the asset or liability.
In all cases, the level in the fair value hierarchy within which the fair value measurement in its entirety falls is determined based on the lowest level of input that is significant to the fair value measurement. Our assessment of the significance of a particular input to the fair value measurement in its entirety requires judgment and considers factors specific to each investment. The exercise of judgment is based in part on our knowledge of the asset class and our prior experience.
Determination of fair value involves subjective judgments and estimates. Accordingly, the notes to our consolidated financial statements express the uncertainty with respect to the possible effect of such valuations, and any change in such valuations, on our consolidated financial statements.
83
Table of Contents
Valuation of 2022 Unsecured Notes
The Company has made an election to apply the fair value option of accounting to the 2022 Unsecured Notes, in accordance with ASC 825-10. We believe accounting for the 2022 Unsecured Notes at fair value better aligns the measurement methodologies of assets and liabilities, which may mitigate certain earnings volatility.
Revenue Recognition
The Company records dividend income and interest, adjusted for amortization of premium and accretion of discount, on an accrual basis. Investments that are expected to pay regularly scheduled interest and/or dividends in cash are generally placed on non- accrual status when principal or interest/dividend cash payments are past due 30 days or more (90 days or more for equipment financing) and/or when it is no longer probable that principal or interest/dividend cash payments will be collected. Such non-accrual investments are restored to accrual status if past due principal and interest or dividends are paid in cash, and in management’s judgment, are likely to continue timely payment of their remaining interest or dividend obligations. Interest or dividend cash payments received on investments may be recognized as income or applied to principal depending upon management’s judgment. Some of our investments may have contractual PIK interest or dividends. PIK interest and dividends computed at the contractual rate are accrued into income and reflected as receivable up to the capitalization date. PIK investments offer issuers the option at each payment date of making payments in cash or in additional securities. When additional securities are received, they typically have the same terms, including maturity dates and interest rates as the original securities issued. On these payment dates, the Company capitalizes the accrued interest or dividends receivable (reflecting such amounts as the basis in the additional securities received). PIK generally becomes due at the maturity of the investment or upon the investment being called by the issuer. At the point the Company believes PIK is not expected to be realized, the PIK investment will be placed on non-accrual status. When a PIK investment is placed on non-accrual status, the accrued, uncapitalized interest or dividends is reversed from the related receivable through interest or dividend income, respectively. The Company does not reverse previously capitalized PIK interest or dividends. Upon capitalization, PIK is subject to the fair value estimates associated with their related investments. PIK investments on non-accrual status are restored to accrual status if the Company again believes that PIK is expected to be realized. Loan origination fees, original issue discount, and market discounts are capitalized and amortized into income using the effective interest method. Upon the prepayment of a loan, any unamortized loan origination fees are recorded as interest income. We record prepayment premiums on loans and other investments as interest income when we receive such amounts. Capital structuring fees are recorded as other income when earned.
The typically higher yields and interest rates on PIK securities, to the extent we invested, reflects the payment deferral and increased credit risk associated with such instruments and that such investments may represent a significantly higher credit risk than coupon loans. PIK securities may have unreliable valuations because their continuing accruals require continuing judgments about the collectability of the deferred payments and the value of any associated collateral. PIK interest has the effect of generating investment income and increasing the incentive fees payable at a compounding rate. In addition, the deferral of PIK interest also increases the loan-to-value ratio at a compounding rate. PIK securities create the risk that incentive fees will be paid to the Investment Adviser based on non-cash accruals that ultimately may not be realized, but the Investment Adviser will be under no obligation to reimburse the Company for these fees. For the fiscal years ended December 31, 2020 and 2019, capitalized PIK income totaled $5.4 million and $1.1 million, respectively.
Net Realized Gain or Loss and Net Change in Unrealized Gain or Loss
We generally measure realized gain or loss by the difference between the net proceeds from the repayment or sale and the amortized cost basis of the investment, without regard to unrealized appreciation or depreciation previously recognized, but considering unamortized origination or commitment fees and prepayment penalties. The net change in unrealized gain or loss reflects the change in portfolio investment values during the reporting
84
Table of Contents
period, including the reversal of previously recorded unrealized gain or loss, when gains or losses are realized. Gains or losses on investments are calculated by using the specific identification method.
Income Taxes
Solar Capital, a U.S. corporation, has elected to be treated, and intends to qualify annually, as a RIC under Subchapter M of the Code. In order to qualify for U.S. federal income taxation as a RIC, the Company is required, among other things, to timely distribute to its stockholders at least 90% of investment company taxable income, as defined by the Code, for each year. Depending on the level of taxable income earned in a given tax year, we may choose to carry forward taxable income in excess of current year distributions into the next tax year and pay a nondeductible 4% U.S. federal excise tax on such income, as required. To the extent that the Company determines that its estimated current year annual taxable income will be in excess of estimated current year distributions, the Company accrues an estimated excise tax, if any, on estimated excess taxable income.
Recent Accounting Pronouncements
In March 2020, the FASB issued Accounting Standards Update No. 2020-04, “Reference Rate Reform (Topic 848): Facilitation of the Effects of Reference Rate Reform on Financial Reporting.” The guidance provides optional expedients and exceptions for applying GAAP to contract modifications, hedging relationships and other transactions, subject to meeting certain criteria, that reference LIBOR or another reference rate expected to be discontinued because of the reference rate reform. ASU 2020-04 is effective for all entities as of March 12, 2020 through December 31, 2022. The Company is evaluating the potential impact that the adoption of this guidance will have on the Company’s financial statements.
RESULTS OF OPERATIONS
Results comparisons are for the fiscal years ended December 31, 2020 and December 31, 2019. Results for the fiscal year ended December 31, 2018 can be found in Item 7 of the Company’s report on Form 10-K filed on February 20, 2020, which is incorporated by reference herein.
Investment Income
For the fiscal years ended December 31, 2020 and 2019, gross investment income totaled $121.7 million and $154.7 million, respectively. The decrease in gross investment income for the year over year periods was primarily due to a reduction in portfolio yield, mainly as a result of the approximately 160 basis point decrease in average LIBOR year over year, on a smaller income producing investment portfolio on average. Additionally, the volatility and disruption to the global economy and capital markets from the COVID-19 pandemic reduced the volume of our investment activity during much of the year, particularly in the second and third quarters, thus negatively impacting investment income for the period.
Expenses
Expenses totaled $62.5 million and $82.3 million, respectively, for the fiscal years ended December 31, 2020 and 2019, of which $27.2 million and $44.9 million, respectively, were base management fees and performance-based incentive fees and $27.2 million and $28.9 million, respectively, were interest and other credit facility expenses. Administrative services and other general and administrative expenses totaled $8.2 million and $8.5 million, respectively, for the fiscal years ended December 31, 2020 and 2019. Expenses generally consist of management and performance-based incentive fees, interest and other credit facility expenses, administrative services fees, insurance expenses, legal fees, directors’ fees, transfer agency fees, printing and proxy expenses, audit and tax services expenses, and other general and administrative expenses. Interest and other credit facility expenses generally consist of interest, unused fees, agency fees and loan origination fees, if any, among others. The decrease in expenses from 2019 to 2020 was primarily due to lower
85
Table of Contents
management and incentive fees resulting from a reduction in portfolio yield on a smaller income producing investment portfolio on average as well as lower interest expense due to reductions in LIBOR.
Net Investment Income
The Company’s net investment income totaled $59.2 million and $72.4 million, or $1.40 and $1.71, per average share, respectively, for the fiscal years ended December 31, 2020 and 2019.
Net Realized Loss
The Company had investment sales and prepayments totaling approximately $363 million and $362 million, respectively, for the fiscal years ended December 31, 2020 and 2019. Net realized losses over the same periods were $26.6 million and $1.8 million, respectively. Net realized loss for fiscal year 2020 was primarily related to the exit of our investment IHS Intermediate, Inc. Net realized loss for fiscal year 2019 was primarily related to the extinguishment of debt.
Net Change in Unrealized Loss
For the fiscal years ended December 31, 2020 and 2019, net change in unrealized loss on the Company’s assets and liabilities totaled $17.1 million and $14.7 million, respectively. Net unrealized loss for the fiscal year ended December 31, 2020 is primarily due to depreciation in the value of our investments in NEF Holdings LLC, Rug Doctor, PhyMed Management LLC, SOINT, LLC and SOAGG LLC, among others, partially offset by the reversal of previously recognized unrealized depreciation in the value of our investment in IHS Intermediate, Inc. and unrealized appreciation in the value of our investments in Crystal Financial LLC and B. Riley Financial Inc., among others. The year over year net change in unrealized loss for the fiscal year ended December 31, 2020 was impacted by uncertainty due to the COVID-19 pandemic and its effect on market yields and fundamental portfolio company performance. Net unrealized loss for the fiscal year ended December 31, 2019 is primarily due to unrealized depreciation in the value of our investments in IHS Intermediate, Inc., SOAGG LLC and American Teleconferencing Services, Ltd., among others, partially offset by unrealized appreciation in the value of our investments in Crystal Financial LLC, PPT Management Holdings, LLC and Alteon Health, LLC, among others.
Net Increase in Net Assets From Operations
For the fiscal years ended December 31, 2020 and 2019, the Company had a net increase in net assets resulting from operations of $15.5 million and $56.0 million, respectively. For the fiscal years ended December 31, 2020 and 2019, earnings per average share were $0.37 and $1.33, respectively.
LIQUIDITY AND CAPITAL RESOURCES
The Company’s liquidity and capital resources are generated and generally available through its Credit Facility, the 2022 Unsecured Notes, the 2022 Tranche C Notes, the NEFPASS Facility, the 2023 Unsecured Notes, the 2024 Unsecured Notes and the 2026 Unsecured Notes (collectively the “Credit Facilities”), through cash flows from operations, investment sales, prepayments of senior and subordinated loans, income earned on investments and cash equivalents, and periodic follow-on equity and/or debt offerings. As of December 31, 2020, we had a total of $439.0 million of unused borrowing capacity under the Credit Facilities, subject to borrowing base limits.
We may from time to time issue equity and/or debt securities in either public or private offerings. The issuance of such securities will depend on future market conditions, funding needs and other factors and there can be no assurance that any such issuance will occur or be successful. The primary uses of existing funds and any funds raised in the future is expected to be for investments in portfolio companies, repayment of indebtedness, cash distributions to our stockholders, or for other general corporate purposes.
86
Table of Contents
On February 12, 2020, a new lender to the Company executed a commitment increase to our Credit Facility providing for an additional $75.0 million of revolving credit, bringing our Credit Facility’s total revolving credit capacity to $545.0 million.
On December 18, 2019, the Company closed a private offering of $125 million of the 2024 Unsecured Notes with a fixed interest rate of 4.20% and a maturity date of December 15, 2024. Interest on the 2024 Unsecured Notes is due semi-annually on June 15 and December 15. The 2024 Unsecured Notes were issued in a private placement only to qualified institutional buyers.
On December 18, 2019, the Company closed a private offering of $75 million of the 2026 Unsecured Notes with a fixed interest rate of 4.375% and a maturity date of December 15, 2026. Interest on the 2026 Unsecured Notes is due semi-annually on June 15 and December 15. The 2026 Unsecured Notes were issued in a private placement only to qualified institutional buyers.
On August 28, 2019, the Company repaid its existing senior secured credit agreement due September 2021 and entered into the new senior secured credit agreement (the “Credit Facility”). The Credit Facility was originally composed of $470 million of revolving credit and $75 million of term loans, but was expanded to $545 million of revolving credit and $75 million of term loans in February 2020. Borrowings generally bear interest at a rate per annum equal to the base rate plus a range of 2.00-2.25% or the alternate base rate plus 1.00%-1.25%. The Credit Facility has no LIBOR floor requirement. The Credit Facility matures in August 2024 and includes ratable amortization in the final year.
On December 28, 2017, the Company closed a private offering of $21 million of the 2022 Tranche C Notes with a fixed interest rate of 4.50% and a maturity date of December 28, 2022. Interest on the 2022 Tranche C Notes is due semi-annually on June 28 and December 28. The 2022 Tranche C Notes were issued in a private placement only to qualified institutional buyers.
On November 22, 2017, we issued $75 million in aggregate principal amount of publicly registered 2023 Unsecured Notes for net proceeds of $73.8 million. Interest on the 2023 Unsecured Notes is paid semi-annually on January 20 and July 20, at a fixed rate of 4.50% per year, commencing on January 20, 2018. The 2023 Unsecured Notes mature on January 20, 2023.
On February 15, 2017, the Company closed a private offering of $100 million of the 2022 Unsecured Notes with a fixed interest rate of 4.60% and a maturity date of May 8, 2022. Interest on the 2022 Unsecured Notes is due semi-annually on May 8 and November 8. The 2022 Unsecured Notes were issued in a private placement only to qualified institutional buyers.
On November 8, 2016, the Company closed a private offering of $50 million of the 2022 Unsecured Notes with a fixed interest rate of 4.40% and a maturity date of May 8, 2022. Interest on the 2022 Unsecured Notes is due semi-annually on May 8 and November 8. The 2022 Unsecured Notes were issued in a private placement only to qualified institutional buyers.
On January 11, 2013, the Company closed its most recent follow-on public equity offering of 6.3 million shares of common stock raising approximately $146.9 million in net proceeds. The primary uses of the funds raised were for investments in portfolio companies, reductions in revolving debt outstanding and for other general corporate purposes.
Cash Equivalents
We deem certain U.S. Treasury bills, repurchase agreements and other high-quality, short-term debt securities as cash equivalents. The Company makes purchases that are consistent with its purpose of making investments in securities described in paragraphs 1 through 3 of Section 55(a) of the 1940 Act. From time to
87
Table of Contents
time, including at or near the end of each fiscal quarter, we consider using various temporary investment strategies for our business. One strategy includes taking proactive steps by utilizing cash equivalents as temporary assets with the objective of enhancing our investment flexibility pursuant to Section 55 of the 1940 Act. More specifically, from time-to-time we may purchase U.S. Treasury bills or other high-quality, short-term debt securities at or near the end of the quarter and typically close out the position on a net cash basis subsequent to quarter end. We may also utilize repurchase agreements or other balance sheet transactions, including drawing down on our credit facilities, as deemed appropriate. The amount of these transactions or such drawn cash for this purpose is excluded from total assets for purposes of computing the asset base upon which the management fee is determined. We held approximately $380 million in cash equivalents as of December 31, 2020.
Debt
Unsecured Notes
On December 18, 2019, the Company closed a private offering of $125 million of the 2024 Unsecured Notes with a fixed interest rate of 4.20% and a maturity date of December 15, 2024. Interest on the 2024 Unsecured Notes is due semi-annually on June 15 and December 15. The 2024 Unsecured Notes were issued in a private placement only to qualified institutional buyers.
On December 18, 2019, the Company closed a private offering of $75 million of the 2026 Unsecured Notes with a fixed interest rate of 4.375% and a maturity date of December 15, 2026. Interest on the 2026 Unsecured Notes is due semi-annually on June 15 and December 15. The 2026 Unsecured Notes were issued in a private placement only to qualified institutional buyers.
On December 28, 2017, the Company closed a private offering of $21 million of the 2022 Tranche C Notes with a fixed interest rate of 4.50% and a maturity date of December 28, 2022. Interest on the 2022 Tranche C Notes is due semi-annually on June 28 and December 28. The 2022 Tranche C Notes were issued in a private placement only to qualified institutional buyers.
On November 22, 2017, we issued $75 million in aggregate principal amount of publicly registered 2023 Unsecured Notes for net proceeds of $73.8 million. Interest on the 2023 Unsecured Notes is paid semi-annually on January 20 and July 20, at a fixed rate of 4.50% per year, commencing on January 20, 2018. The 2023 Unsecured Notes mature on January 20, 2023.
On February 15, 2017, the Company closed a private offering of $100 million of the 2022 Unsecured Notes with a fixed interest rate of 4.60% and a maturity date of May 8, 2022. Interest on the 2022 Unsecured Notes is due semi-annually on May 8 and November 8. The 2022 Unsecured Notes were issued in a private placement only to qualified institutional buyers.
On November 8, 2016, the Company closed a private offering of $50 million of the 2022 Unsecured Notes with a fixed interest rate of 4.40% and a maturity date of May 8, 2022. Interest on the 2022 Unsecured Notes is due semi-annually on May 8 and November 8. The 2022 Unsecured Notes were issued in a private placement only to qualified institutional buyers.
Revolving & Term Loan Facilities
On August 28, 2019, the Company repaid its existing senior secured credit agreement due September 2021 and entered into the new Credit Facility. The Credit Facility was originally composed of $470 million of revolving credit and $75 million of term loans. On February 12, 2020, a new lender to the Company executed a commitment increase to our Credit Facility providing for an additional $75.0 million of revolving credit, bringing our Credit Facility’s total revolving credit capacity to $545.0 million. Borrowings generally bear interest at a rate per annum equal to the base rate plus a range of 2.00-2.25% or the alternate base rate plus 1.00%-1.25%. The
88
Table of Contents
Credit Facility has no LIBOR floor requirement. The Credit Facility matures in August 2024 and includes ratable amortization in the final year. The Credit Facility may be increased up to $800 million with additional new lenders or an increase in commitments from current lenders. The Credit Facility contains certain customary affirmative and negative covenants and events of default. In addition, the Credit Facility contains certain financial covenants that among other things, requires the Company to maintain a minimum shareholder’s equity and a minimum asset coverage ratio.At December 31, 2020, outstanding USD equivalent borrowings under the Credit Facility totaled $201.0 million, composed of $126.0 million of revolving credit and $75.0 million of term loans.
On September 26, 2018, NEFPASS SPV LLC, a newly formed wholly-owned subsidiary of NEFPASS LLC, as borrower entered into the NEFPASS Facility with Keybank acting as administrative agent. The Company acts as servicer under the NEFPASS Facility. The NEFPASS Facility is scheduled to mature on September 26, 2023. The NEFPASS Facility generally bears interest at a rate of LIBOR plus 2.15%. NEFPASS and NEFPASS SPV LLC, as applicable, have made certain customary representations and warranties, and are required to comply with various covenants, including leverage restrictions, reporting requirements and other customary requirements for similar credit facilities. The NEFPASS Facility also includes usual and customary events of default for credit facilities of this nature.There were $30.0 million of borrowings outstanding as of December 31, 2020.
Certain covenants on our issued debt may restrict our business activities, including limitations that could hinder our ability to finance additional loans and investments or to make the distributions required to maintain our status as a RIC under Subchapter M of the Code. At December 31, 2020, the Company was in compliance with all financial and operational covenants required by our Credit Facilities.
Contractual Obligations
A summary of our significant contractual payment obligations is as follows as of December 31, 2020:
Payments Due by Period (in millions)
| Total | Less than 1 Year |
1-3 Years | 3-5 Years | More Than 5 Years |
||||||||||||||||
| Revolving credit facilities(1) |
$ | 156.0 | $ | — | $ | 30.0 | $ | 126.0 | $ | — | ||||||||||
| Unsecured senior notes |
446.0 | — | 246.0 | 125.0 | 75.0 | |||||||||||||||
| Term Loans |
75.0 | — | — | 75.0 | — | |||||||||||||||
| (1) | As of December 31, 2020, we had a total of $439.0 million of unused borrowing capacity under our revolving credit facilities, subject to borrowing base limits. |
Under the provisions of the 1940 Act, we are permitted, as a BDC, to issue senior securities in amounts such that our asset coverage ratio, as defined in the 1940 Act, equals at least 150% of gross assets less all liabilities and indebtedness not represented by senior securities, after each issuance of senior securities. If the value of our assets declines, we may be unable to satisfy the asset coverage test. If that happens, we may be required to sell a portion of our investments and, depending on the nature of our leverage, repay a portion of our indebtedness at a time when such sales may be disadvantageous. Also, any amounts that we use to service our indebtedness would not be available for distributions to our common stockholders. Furthermore, as a result of issuing senior securities, we would also be exposed to typical risks associated with leverage, including an increased risk of loss.
89
Table of Contents
Senior Securities
Information about our senior securities is shown in the following table (in thousands) as of each year ended December 31 for the past ten years, unless otherwise noted. The “—” indicates information which the SEC expressly does not require to be disclosed for certain types of senior securities.
| Class and Year |
Total Amount Outstanding(1) |
Asset Coverage Per Unit(2) |
Involuntary Liquidating Preference Per Unit(3) |
Average Market Value Per Unit(4) |
||||||||||||
| Revolving Credit Facility |
||||||||||||||||
| Fiscal 2020 |
$ | 126,000 | $ | 421 | — | N/A | ||||||||||
| Fiscal 2019 |
42,900 | 182 | — | N/A | ||||||||||||
| Fiscal 2018 |
96,400 | 593 | — | N/A | ||||||||||||
| Fiscal 2017 |
245,600 | 1,225 | — | N/A | ||||||||||||
| Fiscal 2016 |
115,200 | 990 | — | N/A | ||||||||||||
| Fiscal 2015 |
207,900 | 1,459 | — | N/A | ||||||||||||
| Fiscal 2014 |
— | — | — | N/A | ||||||||||||
| Fiscal 2013 |
— | — | — | N/A | ||||||||||||
| Fiscal 2012 |
264,452 | 1,510 | — | N/A | ||||||||||||
| Fiscal 2011 |
201,355 | 3,757 | — | N/A | ||||||||||||
| 2022 Unsecured Notes |
||||||||||||||||
| Fiscal 2020 |
150,000 | 501 | — | N/A | ||||||||||||
| Fiscal 2019 |
150,000 | 638 | — | N/A | ||||||||||||
| Fiscal 2018 |
150,000 | 923 | — | N/A | ||||||||||||
| Fiscal 2017 |
150,000 | 748 | — | N/A | ||||||||||||
| Fiscal 2016 |
50,000 | 430 | — | N/A | ||||||||||||
| 2022 Tranche C Notes |
||||||||||||||||
| Fiscal 2020 |
21,000 | 70 | — | N/A | ||||||||||||
| Fiscal 2019 |
21,000 | 89 | — | N/A | ||||||||||||
| Fiscal 2018 |
21,000 | 129 | — | N/A | ||||||||||||
| Fiscal 2017 |
21,000 | 105 | — | N/A | ||||||||||||
| 2023 Unsecured Notes |
||||||||||||||||
| Fiscal 2020 |
75,000 | 250 | — | N/A | ||||||||||||
| Fiscal 2019 |
75,000 | 319 | — | N/A | ||||||||||||
| Fiscal 2018 |
75,000 | 461 | — | N/A | ||||||||||||
| Fiscal 2017 |
75,000 | 374 | — | N/A | ||||||||||||
| 2024 Unsecured Notes |
||||||||||||||||
| Fiscal 2020 |
125,000 | 417 | — | N/A | ||||||||||||
| Fiscal 2019 |
125,000 | 531 | — | N/A | ||||||||||||
| 2026 Unsecured Notes |
||||||||||||||||
| Fiscal 2020 |
75,000 | 250 | — | N/A | ||||||||||||
| Fiscal 2019 |
75,000 | 319 | — | N/A | ||||||||||||
| 2042 Unsecured Notes |
||||||||||||||||
| Fiscal 2017 |
— | — | — | N/A | ||||||||||||
| Fiscal 2016 |
100,000 | 859 | — | $ | 1,002 | |||||||||||
| Fiscal 2015 |
100,000 | 702 | — | 982 | ||||||||||||
| Fiscal 2014 |
100,000 | 2,294 | — | 943 | ||||||||||||
| Fiscal 2013 |
100,000 | 2,411 | — | 934 | ||||||||||||
| Fiscal 2012 |
100,000 | 571 | — | 923 | ||||||||||||
| Senior Secured Notes |
||||||||||||||||
| Fiscal 2017 |
— | — | — | N/A | ||||||||||||
| Fiscal 2016 |
75,000 | 645 | — | N/A | ||||||||||||
90
Table of Contents
| Class and Year |
Total Amount Outstanding(1) |
Asset Coverage Per Unit(2) |
Involuntary Liquidating Preference Per Unit(3) |
Average Market Value Per Unit(4) |
||||||||||||
| Fiscal 2015 |
75,000 | 527 | — | N/A | ||||||||||||
| Fiscal 2014 |
75,000 | 1,721 | — | N/A | ||||||||||||
| Fiscal 2013 |
75,000 | 1,808 | — | N/A | ||||||||||||
| Fiscal 2012 |
75,000 | 428 | — | N/A | ||||||||||||
| Term Loans |
||||||||||||||||
| Fiscal 2020 |
75,000 | 250 | — | N/A | ||||||||||||
| Fiscal 2019 |
75,000 | 319 | — | N/A | ||||||||||||
| Fiscal 2018 |
50,000 | 308 | — | N/A | ||||||||||||
| Fiscal 2017 |
50,000 | 250 | — | N/A | ||||||||||||
| Fiscal 2016 |
50,000 | 430 | — | N/A | ||||||||||||
| Fiscal 2015 |
50,000 | 351 | — | N/A | ||||||||||||
| Fiscal 2014 |
50,000 | 1,147 | — | N/A | ||||||||||||
| Fiscal 2013 |
50,000 | 1,206 | — | N/A | ||||||||||||
| Fiscal 2012 |
50,000 | 285 | — | N/A | ||||||||||||
| Fiscal 2011 |
35,000 | 653 | — | N/A | ||||||||||||
| NEFPASS Facility |
||||||||||||||||
| Fiscal 2020 |
30,000 | 100 | — | N/A | ||||||||||||
| Fiscal 2019 |
30,000 | 128 | — | N/A | ||||||||||||
| Fiscal 2018 |
30,000 | 185 | — | N/A | ||||||||||||
| SSLP Facility |
||||||||||||||||
| Fiscal 2019 |
— | — | — | N/A | ||||||||||||
| Fiscal 2018 |
53,785 | 331 | — | N/A | ||||||||||||
| Total Senior Securities |
||||||||||||||||
| Fiscal 2020 |
$ | 677,000 | $ | 2,259 | — | N/A | ||||||||||
| Fiscal 2019 |
593,900 | 2,525 | — | N/A | ||||||||||||
| Fiscal 2018 |
476,185 | 2,930 | — | N/A | ||||||||||||
| Fiscal 2017 |
541,600 | 2,702 | — | N/A | ||||||||||||
| Fiscal 2016 |
390,200 | 3,354 | — | N/A | ||||||||||||
| Fiscal 2015 |
432,900 | 3,039 | — | N/A | ||||||||||||
| Fiscal 2014 |
225,000 | 5,162 | — | N/A | ||||||||||||
| Fiscal 2013 |
225,000 | 5,425 | — | N/A | ||||||||||||
| Fiscal 2012 |
489,452 | 2,794 | — | N/A | ||||||||||||
| Fiscal 2011 |
236,355 | 4,410 | — | N/A | ||||||||||||
| (1) | Total amount of each class of senior securities outstanding (in thousands) at the end of the period presented. |
| (2) | The asset coverage ratio for a class of senior securities representing indebtedness is calculated as our consolidated total assets, less all liabilities and indebtedness not represented by senior securities, divided by all senior securities representing indebtedness. This asset coverage ratio is multiplied by one thousand to determine the Asset Coverage Per Unit. In order to determine the specific Asset Coverage Per Unit for each class of debt, the total Asset Coverage Per Unit is allocated based on the amount outstanding in each class of debt at the end of the period. As of December 31, 2020, asset coverage was 225.9%. |
| (3) | The amount to which such class of senior security would be entitled upon the involuntary liquidation of the issuer in preference to any security junior to it. |
| (4) | Not applicable except for the 2042 Unsecured Notes which were publicly traded. The Average Market Value Per Unit is calculated by taking the daily average closing price during the period and dividing it by twenty-five dollars per share and multiplying the result by one thousand to determine a unit price per thousand consistent with Asset Coverage Per Unit. The average market value for the fiscal 2016, 2015, 2014, 2013 and 2012 periods was $100,175, $98,196, $94,301, $93,392, and $92,302, respectively. |
91
Table of Contents
We have also entered into two contracts under which we have future commitments: the Advisory Agreement, pursuant to which Solar Capital Partners, LLC has agreed to serve as our investment adviser, and the Administration Agreement, pursuant to which the Administrator has agreed to furnish us with the facilities and administrative services necessary to conduct our day-to-day operations and provide on our behalf managerial assistance to those portfolio companies to which we are required to provide such assistance. Payments under the Advisory Agreement are equal to (1) a percentage of the value of our average gross assets and (2) a two-part incentive fee. Payments under the Administration Agreement are equal to an amount based upon our allocable portion of the Administrator’s overhead in performing its obligations under the Administration Agreement, including rent, technology systems, insurance and our allocable portion of the costs of our chief financial officer and chief compliance officer and their respective staffs. Either party may terminate each of the Advisory Agreement and administration agreement without penalty upon 60 days’ written notice to the other. See note 3 to our Consolidated Financial Statements.
On July 31, 2017, the Company, NEFPASS LLC and NEFCORP LLC entered into a servicing agreement. NEFCORP LLC was engaged to provide NEFPASS LLC with administrative services related to the loans and capital leases held by NEFPASS LLC. NEFPASS LLC may terminate this agreement upon 30 days’ written notice to NEFCORP LLC.
92
Table of Contents
Off-Balance Sheet Arrangements
From time-to-time and in the normal course of business, the Company may make unfunded capital commitments to current or prospective portfolio companies. Typically, the Company may agree to provide delayed-draw term loans or, to a lesser extent, revolving loan or equity commitments. These unfunded capital commitments always take into account the Company’s liquidity and cash available for investment, portfolio and issuer diversification, and other considerations. Accordingly, the Company had the following unfunded capital commitments at December 31, 2020 and December 31, 2019, respectively:
| December 31, 2020 |
December 31, 2019 |
|||||||
| (in millions) | ||||||||
| Crystal Financial LLC* |
$ | 44.3 | $ | 44.3 | ||||
| Smile Doctors LLC |
26.7 | — | ||||||
| Soleo Health Holdings, Inc. |
7.4 | — | ||||||
| Cardiva Medical, Inc. |
7.3 | 11.0 | ||||||
| Kindred Biosciences, Inc. |
6.9 | 13.8 | ||||||
| Neuronetics, Inc. |
6.7 | — | ||||||
| One Touch Direct, LLC |
5.0 | — | ||||||
| PQ Bypass, Inc. |
5.0 | 5.0 | ||||||
| NEF Holdings, Inc. |
4.2 | — | ||||||
| Centrexion Therapeutics, Inc. |
3.8 | 7.6 | ||||||
| Atria Wealth Solutions, Inc. |
3.5 | 0.4 | ||||||
| Sentry Data Systems, Inc. |
1.6 | — | ||||||
| Pinnacle Treatment Centers, Inc. |
1.4 | — | ||||||
| Delphinus Medical Technologies, Inc. |
1.3 | — | ||||||
| Basic Fun, Inc. |
1.1 | — | ||||||
| Rubius Therapeutics, Inc. |
— | 13.4 | ||||||
| Cerapedics, Inc. |
— | 5.4 | ||||||
| Phynet Dermatology LLC |
— | 4.7 | ||||||
| Altern Marketing, LLC |
— | 4.2 | ||||||
| Varilease Finance, Inc. |
— | 3.4 | ||||||
| MRI Software LLC |
— | 3.3 | ||||||
| Enhanced Capital Group, LLC |
— | 2.5 | ||||||
| Solara Medical Supplies, Inc. |
— | 1.9 | ||||||
| RS Energy Group U.S., Inc. |
— | 1.7 | ||||||
| Alimera Sciences, Inc. |
— | 1.1 | ||||||
| iCIMS, Inc. |
— | 0.8 | ||||||
|
|
|
|
|
|||||
| Total Commitments |
$ | 126.2 | $ | 124.5 | ||||
|
|
|
|
|
|||||
| * | The Company controls the funding of the Crystal Financial LLC commitment and may cancel it at its discretion. |
The credit agreements of the above loan commitments contain customary lending provisions and/or are subject to the portfolio company’s achievement of certain milestones that allow relief to the Company from funding obligations for previously made commitments in instances where the underlying company experiences materially adverse events that affect the financial condition or business outlook for the company. Since these commitments may expire without being drawn upon, unfunded commitments do not necessarily represent future cash requirements or future earning assets for the Company. As of December 31, 2020 and December 31, 2019, the Company had sufficient cash available and/or liquid securities available to fund its commitments.
In the normal course of its business, we invest or trade in various financial instruments and may enter into various investment activities with off-balance sheet risk, which may include forward foreign currency contracts.
93
Table of Contents
Generally, these financial instruments represent future commitments to purchase or sell other financial instruments at specific terms at future dates. These financial instruments contain varying degrees of off-balance sheet risk whereby changes in the market value or our satisfaction of the obligations may exceed the amount recognized in our Consolidated Statements of Assets and Liabilities.
Distributions
The following table reflects the cash distributions per share on our common stock for the two most recent fiscal years and the current fiscal year to date:
| Date Declared |
Record Date | Payment Date | Amount | |||||||||
| Fiscal 2021 |
||||||||||||
| February 24, 2021 |
March 18, 2021 | April 2, 2021 | $ | 0.41 | ||||||||
|
|
|
|||||||||||
| Fiscal 2020 |
||||||||||||
| November 5, 2020 |
December 17, 2020 | January 5, 2021 | $ | 0.41 | ||||||||
| August 4, 2020 |
September 17, 2020 | October 2, 2020 | 0.41 | |||||||||
| May 7, 2020 |
June 18, 2020 | July 2, 2020 | 0.41 | |||||||||
| February 20, 2020 |
March 19, 2020 | April 3, 2020 | 0.41 | |||||||||
|
|
|
|||||||||||
| Total 2020 |
$ | 1.64 | ||||||||||
|
|
|
|||||||||||
| Fiscal 2019 |
||||||||||||
| November 4, 2019 |
December 19, 2019 | January 3, 2020 | $ | 0.41 | ||||||||
| August 5, 2019 |
September 19, 2019 | October 2, 2019 | 0.41 | |||||||||
| May 6, 2019 |
June 20, 2019 | July 2, 2019 | 0.41 | |||||||||
| February 21, 2019 |
March 21, 2019 | April 3, 2019 | 0.41 | |||||||||
|
|
|
|||||||||||
| Total 2019 |
$ | 1.64 | ||||||||||
|
|
|
|||||||||||
Tax characteristics of all distributions will be reported to stockholders on Form 1099 after the end of the calendar year. Future quarterly distributions, if any, will be determined by our Board. We expect that our distributions to stockholders will generally be from accumulated net investment income, from net realized capital gains or non-taxable return of capital, if any, as applicable.
We have elected to be taxed as a RIC under Subchapter M of the Code. To maintain our RIC tax treatment, we must distribute at least 90% of our ordinary income and realized net short-term capital gains in excess of realized net long-term capital losses, if any, out of the assets legally available for distribution. In addition, although we currently intend to distribute realized net capital gains (i.e., net long-term capital gains in excess of short-term capital losses), if any, at least annually, out of the assets legally available for such distributions, we may in the future decide to retain such capital gains for investment.
We maintain an “opt out” dividend reinvestment plan for our common stockholders. As a result, if we declare a distribution, then stockholders’ cash distributions will be automatically reinvested in additional shares of our common stock, unless they specifically “opt out” of the dividend reinvestment plan so as to receive cash distributions.
We may not be able to achieve operating results that will allow us to make distributions at a specific level or to increase the amount of these distributions from time to time. In addition, due to the asset coverage test applicable to us as a business development company, we may in the future be limited in our ability to make distributions. Also, our revolving credit facility may limit our ability to declare distributions if we default under certain provisions. If we do not distribute a certain percentage of our income annually, we will suffer adverse tax consequences, including possible loss of the tax benefits available to us as a regulated investment company. In addition, in accordance with GAAP and tax regulations, we include in income certain amounts that we have not
94
Table of Contents
yet received in cash, such as contractual payment-in-kind interest, which represents contractual interest added to the loan balance that becomes due at the end of the loan term, or the accrual of original issue or market discount. Since we may recognize income before or without receiving cash representing such income, we may have difficulty meeting the requirement to distribute at least 90% of our investment company taxable income to obtain tax benefits as a regulated investment company.
With respect to the distributions to stockholders, income from origination, structuring, closing and certain other upfront fees associated with investments in portfolio companies are treated as taxable income and accordingly, distributed to stockholders.
Related Parties
We have entered into a number of business relationships with affiliated or related parties, including the following:
| • | We have entered into the Advisory Agreement with Solar Capital Partners. Mr. Gross, our Chairman, Co-Chief Executive Officer and President and Mr. Spohler, our Co-Chief Executive Officer, Chief Operating Officer and board member, are managing members and senior investment professionals of, and have financial and controlling interests in, the Investment Adviser. In addition, Mr. Peteka, our Chief Financial Officer, Treasurer and Secretary serves as the Chief Financial Officer for Solar Capital Partners. |
| • | The Administrator provides us with the office facilities and administrative services necessary to conduct day-to-day operations pursuant to our Administration Agreement. We reimburse the Administrator for the allocable portion of overhead and other expenses incurred by it in performing its obligations under the Administration Agreement, including rent, the fees and expenses associated with performing compliance functions, and the compensation of our chief compliance officer, our chief financial officer and their respective staffs. |
| • | We have entered into a license agreement with the Investment Adviser, pursuant to which the Investment Adviser has granted us a non-exclusive, royalty-free license to use the name “Solar Capital.” |
The Investment Adviser may also manage other funds in the future that may have investment mandates that are similar, in whole and in part, with ours. For example, the Investment Adviser presently serves as investment adviser to Solar Senior Capital Ltd., a publicly traded BDC, which focuses on investing in senior secured loans, including first lien and second lien debt instruments, as well as SCP Private Credit Income BDC LLC, an unlisted BDC that focuses on investing primarily in senior secured loans, including non-traditional asset-based loans and first lien loans and SLR HC BDC LLC, an unlisted BDC whose principal focus is to invest directly and indirectly in senior secured loans and other debt instruments typically to middle market companies within the healthcare industry. In addition, Michael S. Gross, our Chairman, Co-Chief Executive Officer and President, Bruce Spohler, our Co-Chief Executive Officer and Chief Operating Officer, and Richard L. Peteka, our Chief Financial Officer, serve in similar capacities for Solar Senior Capital Ltd., SCP Private Credit Income BDC LLC and SLR HC BDC LLC. The Investment Adviser and certain investment advisory affiliates may determine that an investment is appropriate for us and for one or more of those other funds. In such event, depending on the availability of such investment and other appropriate factors, the Investment Adviser or its affiliates may determine that we should invest side-by-side with one or more other funds. Any such investments will be made only to the extent permitted by applicable law and interpretive positions of the SEC and its staff, and consistent with the Investment Adviser’s allocation procedures. On June 13, 2017, the Adviser received an exemptive order that permits the Company to participate in negotiated co-investment transactions with certain affiliates, in a manner consistent with the Company’s investment objective, positions, policies, strategies and restrictions as well as regulatory requirements and other pertinent factors, and pursuant to various conditions (the “Order”). If the Company is unable to rely on the Order for a particular opportunity, such opportunity will be allocated first to the entity whose investment strategy is the most consistent with the opportunity being allocated, and second, if the terms of the opportunity are consistent with more than one entity’s investment strategy, on an alternating
95
Table of Contents
basis. Although the Adviser’s investment professionals will endeavor to allocate investment opportunities in a fair and equitable manner, the Company and its stockholders could be adversely affected to the extent investment opportunities are allocated among us and other investment vehicles managed or sponsored by, or affiliated with, our executive officers, directors and members of the Adviser.
Related party transactions may occur among Solar Capital Ltd., Crystal Financial LLC, Equipment Operating Leases LLC, Kingsbridge Holdings, LLC, Loyer Capital LLC, North Mill Holdco LLC, Gemino Healthcare Finance, LLC and NEF Holdings LLC. These transactions may occur in the normal course of business. No administrative or other fees are paid to Solar Capital Partners by Crystal Financial LLC, Equipment Operating Leases LLC, Kingsbridge Holdings, LLC, Loyer Capital LLC, North Mill Holdco LLC, Gemino Healthcare Finance, LLC or NEF Holdings LLC.
In addition, we have adopted a formal code of ethics that governs the conduct of our officers and directors. Our officers and directors also remain subject to the duties imposed by both the 1940 Act and the Maryland General Corporation Law.
| Item 7A. | Quantitative and Qualitative Disclosure About Market Risk |
We are subject to financial market risks, including changes in interest rates. In addition, U.S. and global capital markets and credit markets have experienced a higher level of stress due to the global COVID-19 pandemic, which has resulted in an increase in the level of volatility across such markets and a general decline in value of the securities that we hold. Because we fund a portion of our investments with borrowings, our net investment income is affected by the difference between the rate at which we invest and the rate at which we borrow. As a result, there can be no assurance that a significant change in market interest rates will not have a material adverse effect on our net investment income. In connection with the COVID-19 pandemic, the U.S. Federal Reserve and other central banks have reduced certain interest rates and LIBOR has decreased. In a prolonged low interest rate environment, including a reduction of LIBOR to zero, the difference between the total interest income earned on interest earning assets and the total interest expense incurred on interest bearing liabilities may be compressed, reducing our net interest income and potentially adversely affecting our operating results. During the fiscal year ended December 31, 2020, certain of the investments in our comprehensive investment portfolio had floating interest rates. These floating rate investments were primarily based on floating LIBOR and typically have durations of one to three months after which they reset to current market interest rates. Additionally, some of these investments have LIBOR floors. The Company also has revolving credit facilities that are generally based on floating LIBOR. Assuming no changes to our balance sheet as of December 31, 2020 and no new defaults by portfolio companies, a hypothetical one percent decrease in LIBOR on our comprehensive floating rate assets and liabilities would increase our net investment income by two cents per average share over the next twelve months. Assuming no changes to our balance sheet as of December 31, 2020 and no new defaults by portfolio companies, a hypothetical one percent increase in LIBOR on our comprehensive floating rate assets and liabilities would decrease our net investment income by approximately five cents per average share over the next twelve months. However, we may hedge against interest rate fluctuations from time-to-time by using standard hedging instruments such as futures, options, swaps and forward contracts subject to the requirements of the 1940 Act. While hedging activities may insulate us against adverse changes in interest rates, they may also limit our ability to participate in any benefits of certain changes in interest rates with respect to our portfolio of investments. At December 31, 2020, we have no interest rate hedging instruments outstanding on our balance sheet.
| Increase (Decrease) in LIBOR |
(1.00 | %) | 1.00 | % | ||||
| Increase in Net Investment Income Per Share Per Year |
0.02 | $ | (0.05 | ) |
We may also have exposure to foreign currencies through various investments. These investments are converted into U.S. dollars at the balance sheet date, exposing us to movements in foreign exchange rates. In order to reduce our exposure to fluctuations in foreign exchange rates, we may borrow from time-to-time in such currencies under our multi-currency revolving credit facility or enter into forward currency or similar contracts.
96
Table of Contents
| Item 8. | Financial Statements and Supplementary Data |
INDEX TO CONSOLIDATED FINANCIAL STATEMENTS
97
Table of Contents
MANAGEMENT’S REPORT ON INTERNAL CONTROL OVER FINANCIAL REPORTING
Management is responsible for establishing and maintaining adequate internal control over financial reporting, and for performing an assessment of the effectiveness of internal control over financial reporting as of December 31, 2020. Internal control over financial reporting is a process designed to provide reasonable assurance regarding the reliability of financial reporting and the preparation of financial statements for external purposes in accordance with generally accepted accounting principles. The Company’s internal control over financial reporting includes those policies and procedures that (i) pertain to assets of the Company; (ii) provide reasonable assurance that transactions are recorded as necessary to permit preparation of consolidated financial statements in accordance with generally accepted accounting principles, and that receipts and expenditures of the Company are being made only in accordance with authorizations of management and directors of the Company; and (iii) provide reasonable assurance regarding prevention or timely detection of unauthorized acquisition, use, or disposition of the Company’s assets that could have a material effect on the consolidated financial statements.
Management performed an assessment of the effectiveness of the Company’s internal control over financial reporting as of December 31, 2020 based upon criteria in Internal Control – Integrated Framework (2013) issued by the Committee of Sponsoring Organizations of the Treadway Commission (“COSO”). Based on our assessment, management determined that the Company’s internal control over financial reporting was effective as of December 31, 2020 based on the criteria on Internal Control – Integrated Framework (2013) issued by COSO.
The effectiveness of the Company’s internal control over financial reporting as of December 31, 2020 has been audited by KPMG LLP, an independent registered public accounting firm, as stated in their report which appears herein.
98
Table of Contents
Report of Independent Registered Public Accounting Firm
To the Stockholders and Board of Directors
Solar Capital Ltd.:
Opinions on the Consolidated Financial Statements and Internal Control Over Financial Reporting
We have audited the accompanying consolidated statements of assets and liabilities, including the consolidated schedules of investments, of Solar Capital Ltd. (and subsidiaries) (the Company) as of December 31, 2020 and 2019, the related consolidated statements of operations, changes in net assets, and cash flows for each of the years in the three-year period ended December 31, 2020, and the related notes (collectively, the consolidated financial statements). We also have audited the Company’s internal control over financial reporting as of December 31, 2020, based on criteria established in Internal Control – Integrated Framework (2013) issued by the Committee of Sponsoring Organizations of the Treadway Commission.
In our opinion, the consolidated financial statements referred to above present fairly, in all material respects, the financial position of the Company as of December 31, 2020 and 2019, and the results of its operations and its cash flows for each of the years in the three-year period ended December 31, 2020, in conformity with U.S. generally accepted accounting principles. Also in our opinion, the Company maintained, in all material respects, effective internal control over financial reporting as of December 31, 2020, based on criteria established in Internal Control – Integrated Framework (2013) issued by the Committee of Sponsoring Organizations of the Treadway Commission.
Basis for Opinions
The Company’s management is responsible for these consolidated financial statements, for maintaining effective internal control over financial reporting, and for its assessment of the effectiveness of internal control over financial reporting, included in the accompanying management’s report on internal control over financial reporting. Our responsibility is to express an opinion on the Company’s consolidated financial statements and an opinion on the Company’s internal control over financial reporting based on our audits. We are a public accounting firm registered with the Public Company Accounting Oversight Board (United States) (PCAOB) and are required to be independent with respect to the Company in accordance with the U.S. federal securities laws and the applicable rules and regulations of the Securities and Exchange Commission and the PCAOB.
We conducted our audits in accordance with the standards of the PCAOB. Those standards require that we plan and perform the audits to obtain reasonable assurance about whether the consolidated financial statements are free of material misstatement, whether due to error or fraud, and whether effective internal control over financial reporting was maintained in all material respects.
Our audits of the consolidated financial statements included performing procedures to assess the risks of material misstatement of the consolidated financial statements, whether due to error or fraud, and performing procedures that respond to those risks. Such procedures included examining, on a test basis, evidence regarding the amounts and disclosures in the consolidated financial statements. Our procedures included confirmation of securities owned as of December 31, 2020 and 2019, by correspondence with the custodian, portfolio companies or agents. Our audits also included evaluating the accounting principles used and significant estimates made by management, as well as evaluating the overall presentation of the consolidated financial statements. Our audit of internal control over financial reporting included obtaining an understanding of internal control over financial reporting, assessing the risk that a material weakness exists, and testing and evaluating the design and operating effectiveness of internal control based on the assessed risk. Our audits also included performing such other procedures as we considered necessary in the circumstances. We believe that our audits provide a reasonable basis for our opinions.
99
Table of Contents
Definition and Limitations of Internal Control Over Financial Reporting
A company’s internal control over financial reporting is a process designed to provide reasonable assurance regarding the reliability of financial reporting and the preparation of financial statements for external purposes in accordance with generally accepted accounting principles. A company’s internal control over financial reporting includes those policies and procedures that (1) pertain to the maintenance of records that, in reasonable detail, accurately and fairly reflect the transactions and dispositions of the assets of the company; (2) provide reasonable assurance that transactions are recorded as necessary to permit preparation of financial statements in accordance with generally accepted accounting principles, and that receipts and expenditures of the company are being made only in accordance with authorizations of management and directors of the company; and (3) provide reasonable assurance regarding prevention or timely detection of unauthorized acquisition, use, or disposition of the company’s assets that could have a material effect on the financial statements.
Because of its inherent limitations, internal control over financial reporting may not prevent or detect misstatements. Also, projections of any evaluation of effectiveness to future periods are subject to the risk that controls may become inadequate because of changes in conditions, or that the degree of compliance with the policies or procedures may deteriorate.
Critical Audit Matter
The critical audit matter communicated below is a matter arising from the current period audit of the consolidated financial statements that was communicated or required to be communicated to the audit committee and that: (1) relates to accounts or disclosures that are material to the consolidated financial statements and (2) involved our especially challenging, subjective, or complex judgments. The communication of a critical audit matter does not alter in any way our opinion on the consolidated financial statements, taken as a whole, and we are not, by communicating the critical audit matter below, providing a separate opinion on the critical audit matter or on the accounts or disclosures to which it relates.
Fair value of investments and certain financial liabilities
As described in Notes 2 and 6 to the consolidated financial statements, the Company measures its investments at fair value and has made an irrevocable election to apply the fair value option of accounting to certain financial liabilities. Investments and certain financial liabilities in all asset classes are valued utilizing a market approach, an income approach, or both approaches, as appropriate. In determining the fair value of investments and financial liabilities that are not publicly traded and whose market quotations are not readily available, the Company makes subjective judgments and estimates using unobservable inputs. As of December 31, 2020, the fair value of such investments and financial liabilities was $1.5 billion and $150 million, respectively.
We identified the assessment of fair value of investments and financial liabilities with no readily determinable market value and whose market quotations are not readily available as a critical audit matter. A high degree of auditor judgment was required to assess the Company’s fair value methods and assumptions. Specifically, assessing the market yields used in the income approach analyses and the selection of comparable companies and the financial performance multiples of such comparable companies used in the market approach analyses required subjective auditor judgment. Additionally, the involvement of valuation professionals with specialized skills and knowledge was required to assist in evaluating the Company’s fair value estimates.
The following are the primary procedures we performed to address this critical audit matter. We evaluated the design and tested the operating effectiveness of certain internal controls over the Company’s process to measure fair value of investments and financial liabilities. These included controls related to the development of market yields, credit risk, and financial performance multiples assumptions. For a selection of investments and certain financial liabilities, we compared the inputs and assumptions used by the Company to underlying documentation. We evaluated the Company’s ability to estimate fair value by
100
Table of Contents
comparing market transaction prices to the Company’s most recent fair value estimate prior to the market transaction. We involved valuation professionals with specialized skills and knowledge, who assisted in evaluating the Company’s fair value estimate for a selection of investments and financial liabilities by:
| • | developing an independent market yield for investments and financial liabilities fair valued using an income approach, by assessing available market information, such as market yields of comparable companies of similar credit risk |
| • | developing an independent liquidation timeline for an investment fair valued using a recovery analysis, by assessing available market information, such as asset type or comparable companies of similar credit risk |
| • | developing an independent market multiple for investments fair valued using a market approach, by assessing market information from third-party sources, including financial performance multiples of independently selected comparable companies |
| • | developing independent estimates of fair value, for the selected investments and financial liabilities, based upon the independently developed market yields and financial performance multiples and compared the results of our estimates to the Company’s fair value estimates. |
/s/ KPMG LLP
We have served as the Company’s auditor since 2007.
New York, New York
February 24, 2021
101
Table of Contents
SOLAR CAPITAL LTD.
CONSOLIDATED STATEMENTS OF ASSETS AND LIABILITIES
(in thousands, except share amounts)
| December 31, 2020 |
December 31, 2019 |
|||||||
| Assets |
||||||||
| Investments at fair value: |
||||||||
| Companies less than 5% owned (cost: $832,507 and $989,564, respectively) |
$ | 822,298 | $ | 970,821 | ||||
| Companies more than 25% owned (cost: $724,428 and $513,119, respectively) |
709,653 | 524,003 | ||||||
| Cash |
8,779 | 16,783 | ||||||
| Cash equivalents (cost: $379,997 and $419,571, respectively) |
379,997 | 419,571 | ||||||
| Dividends receivable |
7,927 | 10,488 | ||||||
| Interest receivable |
6,478 | 5,401 | ||||||
| Receivable for investments sold |
255 | 2,207 | ||||||
| Prepaid expenses and other assets |
571 | 615 | ||||||
|
|
|
|
|
|||||
| Total assets |
$ | 1,935,958 | $ | 1,949,889 | ||||
|
|
|
|
|
|||||
| Liabilities |
||||||||
| Debt ($677,000 and $593,900 face amounts, respectively, reported net of unamortized debt issuance costs of $5,549 and $6,783, respectively. See notes 6 and 7) |
$ | 671,451 | $ | 587,117 | ||||
| Payable for investments and cash equivalents purchased |
380,038 | 419,662 | ||||||
| Distributions payable |
17,327 | 17,327 | ||||||
| Management fee payable (see note 3) |
6,535 | 6,747 | ||||||
| Performance-based incentive fee payable (see note 3) |
792 | 4,281 | ||||||
| Interest payable (see note 7) |
3,416 | 3,678 | ||||||
| Administrative services payable (see note 3) |
1,946 | 2,757 | ||||||
| Other liabilities and accrued expenses |
2,430 | 2,440 | ||||||
|
|
|
|
|
|||||
| Total liabilities |
$ | 1,083,935 | $ | 1,044,009 | ||||
|
|
|
|
|
|||||
| Commitments and contingencies (see note 12) |
||||||||
| Net Assets |
||||||||
| Common stock, par value $0.01 per share, 200,000,000 and 200,000,000 common shares authorized, respectively, and 42,260,826 and 42,260,826 shares issued and outstanding, respectively |
$ | 423 | $ | 423 | ||||
| Paid-in capital in excess of par (see note 2f) |
962,481 | 988,792 | ||||||
| Accumulated distributable net loss (see note 2f) |
(110,881 | ) | (83,335 | ) | ||||
|
|
|
|
|
|||||
| Total net assets |
$ | 852,023 | $ | 905,880 | ||||
|
|
|
|
|
|||||
| Net Asset Value Per Share |
$ | 20.16 | $ | 21.44 | ||||
|
|
|
|
|
|||||
See notes to consolidated financial statements.
102
Table of Contents
SOLAR CAPITAL LTD.
CONSOLIDATED STATEMENTS OF OPERATIONS
(in thousands, except share amounts)
| Year ended December 31, | ||||||||||||
| 2020 | 2019 | 2018 | ||||||||||
| INVESTMENT INCOME: |
||||||||||||
| Interest: |
||||||||||||
| Companies less than 5% owned |
$ | 84,143 | $ | 106,099 | $ | 98,172 | ||||||
| Companies more than 25% owned |
8,861 | 5,429 | 2,827 | |||||||||
| Dividends: |
||||||||||||
| Companies less than 5% owned |
50 | 56 | 28 | |||||||||
| Companies more than 25% owned |
26,794 | 39,382 | 50,953 | |||||||||
| Other income: |
||||||||||||
| Companies less than 5% owned |
1,885 | 3,727 | 1,367 | |||||||||
| Companies more than 25% owned |
12 | 18 | 179 | |||||||||
|
|
|
|
|
|
|
|||||||
| Total investment income |
121,745 | 154,711 | 153,526 | |||||||||
|
|
|
|
|
|
|
|||||||
| EXPENSES: |
||||||||||||
| Management fees (see note 3) |
24,951 | 26,774 | 25,789 | |||||||||
| Performance-based incentive fees (see note 3) |
2,272 | 18,111 | 18,722 | |||||||||
| Interest and other credit facility expenses (see note 7) |
27,156 | 28,901 | 24,728 | |||||||||
| Administrative services expense (see note 3) |
5,215 | 5,265 | 5,247 | |||||||||
| Other general and administrative expenses |
2,936 | 3,215 | 4,151 | |||||||||
|
|
|
|
|
|
|
|||||||
| Total expenses |
62,530 | 82,266 | 78,637 | |||||||||
|
|
|
|
|
|
|
|||||||
| Net investment income |
$ | 59,215 | $ | 72,445 | $ | 74,889 | ||||||
|
|
|
|
|
|
|
|||||||
| REALIZED AND UNREALIZED GAIN (LOSS) ON INVESTMENTS AND CASH EQUIVALENTS: |
||||||||||||
| Net realized gain (loss) on investments and cash equivalents: |
||||||||||||
| Companies less than 5% owned |
$ | (26,638 | ) | $ | 754 | $ | 1,857 | |||||
| Companies 5% to 25% owned |
— | — | 246 | |||||||||
| Companies more than 25% owned |
— | (661 | ) | (25 | ) | |||||||
|
|
|
|
|
|
|
|||||||
| Net realized gain (loss) on investments and cash equivalents |
(26,638 | ) | 93 | 2,078 | ||||||||
| Net realized loss on extinguishment of debt: |
— | (1,853 | ) | — | ||||||||
|
|
|
|
|
|
|
|||||||
| Net realized gain (loss) |
(26,638 | ) | (1,760 | ) | 2,078 | |||||||
|
|
|
|
|
|
|
|||||||
| Net change in unrealized gain (loss) on investments and cash equivalents: |
||||||||||||
| Companies less than 5% owned |
8,970 | (14,861 | ) | (2,805 | ) | |||||||
| Companies more than 25% owned |
(26,096 | ) | 192 | (7,288 | ) | |||||||
|
|
|
|
|
|
|
|||||||
| Net change in unrealized loss |
(17,126 | ) | (14,669 | ) | (10,093 | ) | ||||||
|
|
|
|
|
|
|
|||||||
| Net realized and unrealized loss on investments and cash equivalents |
(43,764 | ) | (16,429 | ) | (8,015 | ) | ||||||
|
|
|
|
|
|
|
|||||||
| NET INCREASE IN NET ASSETS RESULTING FROM OPERATIONS |
$ | 15,451 | $ | 56,016 | $ | 66,874 | ||||||
|
|
|
|
|
|
|
|||||||
| EARNINGS PER SHARE (see note 5) |
$ | 0.37 | $ | 1.33 | $ | 1.58 | ||||||
|
|
|
|
|
|
|
|||||||
See notes to consolidated financial statements.
103
Table of Contents
SOLAR CAPITAL LTD.
CONSOLIDATED STATEMENTS OF CHANGES IN NET ASSETS
(in thousands, except share amounts)
| Year ended December 31, | ||||||||||||
| 2020 | 2019 | 2018 | ||||||||||
| Increase in net assets resulting from operations: |
||||||||||||
| Net investment income |
$ | 59,215 | $ | 72,445 | $ | 74,889 | ||||||
| Net realized gain (loss) |
(26,638 | ) | (1,760 | ) | 2,078 | |||||||
| Net change in unrealized loss |
(17,126 | ) | (14,669 | ) | (10,093 | ) | ||||||
|
|
|
|
|
|
|
|||||||
| Net increase in net assets resulting from operations |
15,451 | 56,016 | 66,874 | |||||||||
|
|
|
|
|
|
|
|||||||
| Distributions to stockholders (see note 8a): |
||||||||||||
| From net investment income |
(48,795 | ) | (65,715 | ) | (69,308 | ) | ||||||
| From return of capital |
(20,513 | ) | (3,592 | ) | — | |||||||
|
|
|
|
|
|
|
|||||||
| Net distributions to stockholders |
(69,308 | ) | (69,307 | ) | (69,308 | ) | ||||||
|
|
|
|
|
|
|
|||||||
| Capital transactions (see note 14): |
||||||||||||
| Net increase in net assets resulting from capital transactions |
— | — | — | |||||||||
|
|
|
|
|
|
|
|||||||
| Total decrease in net assets |
(53,857 | ) | (13,291 | ) | (2,434 | ) | ||||||
| Net assets at beginning of year |
905,880 | 919,171 | 921,605 | |||||||||
|
|
|
|
|
|
|
|||||||
| Net assets at end of year |
$ | 852,023 | $ | 905,880 | $ | 919,171 | ||||||
|
|
|
|
|
|
|
|||||||
| Capital share activity (see note 14): |
||||||||||||
| Net increase from capital share activity |
— | — | — | |||||||||
|
|
|
|
|
|
|
|||||||
See notes to consolidated financial statements.
104
Table of Contents
SOLAR CAPITAL LTD.
CONSOLIDATED STATEMENTS OF CASH FLOWS
(in thousands)
| Year ended December 31, | ||||||||||||
| 2020 | 2019 | 2018 | ||||||||||
| Cash Flows from Operating Activities: |
||||||||||||
| Net increase in net assets resulting from operations |
$ | 15,451 | $ | 56,016 | $ | 66,874 | ||||||
| Adjustments to reconcile net increase in net assets resulting from operations to net cash provided by (used in) operating activities: |
||||||||||||
| Net realized (gain) loss on investments and cash equivalents |
26,638 | (93 | ) | (2,078 | ) | |||||||
| Net realized loss on extinguishment of debt |
— | 1,853 | — | |||||||||
| Net change in unrealized loss on investments and cash equivalents |
17,126 | 14,669 | 10,093 | |||||||||
| (Increase) decrease in operating assets: |
||||||||||||
| Purchase of investments |
(426,897 | ) | (403,693 | ) | (768,999 | ) | ||||||
| Proceeds from disposition of investments |
357,632 | 360,014 | 774,045 | |||||||||
| Net accretion of discount on investments |
(7,581 | ) | (9,242 | ) | (7,810 | ) | ||||||
| Capitalization of payment-in-kind interest |
(5,384 | ) | (1,071 | ) | (946 | ) | ||||||
| Collections of payment-in-kind interest |
1,339 | 672 | 785 | |||||||||
| Receivable for investments sold |
1,952 | (134 | ) | 4,087 | ||||||||
| Interest receivable |
(1,077 | ) | 2,218 | (283 | ) | |||||||
| Dividends receivable |
2,561 | (1,423 | ) | 5,948 | ||||||||
| Other receivables |
— | 593 | (535 | ) | ||||||||
| Prepaid expenses and other assets |
44 | 168 | 256 | |||||||||
| Increase (decrease) in operating liabilities: |
||||||||||||
| Payable for investments and cash equivalents purchased |
(39,624 | ) | 168,271 | 106,273 | ||||||||
| Management fee payable |
(212 | ) | 243 | (869 | ) | |||||||
| Performance-based incentive fee payable |
(3,489 | ) | (332 | ) | (47 | ) | ||||||
| Administrative services expense payable |
(811 | ) | 41 | (40 | ) | |||||||
| Interest payable |
(262 | ) | (1,036 | ) | 2,229 | |||||||
| Other liabilities and accrued expenses |
(10 | ) | (1,015 | ) | 2,047 | |||||||
|
|
|
|
|
|
|
|||||||
| Net Cash Provided by (Used in) Operating Activities |
(62,604 | ) | 186,719 | 191,030 | ||||||||
|
|
|
|
|
|
|
|||||||
| Cash Flows from Financing Activities: |
||||||||||||
| Cash distributions paid |
(69,308 | ) | (69,307 | ) | (68,670 | ) | ||||||
| Proceeds from issuance of unsecured debt |
— | 197,957 | — | |||||||||
| Deferred financing costs |
1,234 | 969 | 607 | |||||||||
| Consolidation of SSLP Facility and SSLP II Facility |
— | — | 61,066 | |||||||||
| Proceeds from secured borrowings |
337,000 | 967,385 | 558,374 | |||||||||
| Repayments of secured borrowings |
(253,900 | ) | (1,054,585 | ) | (685,980 | ) | ||||||
|
|
|
|
|
|
|
|||||||
| Net Cash Provided by (Used in) Financing Activities |
15,026 | 42,419 | (134,603 | ) | ||||||||
|
|
|
|
|
|
|
|||||||
| NET INCREASE (DECREASE) IN CASH AND CASH EQUIVALENTS |
(47,578 | ) | 229,138 | 56,427 | ||||||||
| CASH AND CASH EQUIVALENTS AT BEGINNING OF YEAR |
436,354 | 207,216 | 150,789 | |||||||||
|
|
|
|
|
|
|
|||||||
| CASH AND CASH EQUIVALENTS AT END OF YEAR |
$ | 388,776 | $ | 436,354 | $ | 207,216 | ||||||
|
|
|
|
|
|
|
|||||||
| Supplemental disclosure of cash flow information: |
||||||||||||
| Cash paid for interest |
$ | 27,418 | $ | 29,937 | $ | 22,499 | ||||||
|
|
|
|
|
|
|
|||||||
See notes to consolidated financial statements.
105
Table of Contents
SOLAR CAPITAL LTD.
CONSOLIDATED SCHEDULE OF INVESTMENTS
December 31, 2020
(in thousands, except share/unit amounts)
| Description |
Industry |
Spread Above Index(7) |
LIBOR Floor |
Interest Rate(1) |
Acquisition Date |
Maturity Date |
Par Amount | Cost | Fair Value |
|||||||||||||||||||||||||
| Senior Secured Loans —93.7% |
||||||||||||||||||||||||||||||||||
| First Lien Bank Debt/Senior Secured Loans |
||||||||||||||||||||||||||||||||||
| Aegis Toxicology Sciences Corporation |
Health Care Providers & Services | L+550 | 1.00 | % | 6.50 | % | 5/7/2018 | 5/9/2025 | $ | 16,869 | $ | 16,666 | $ | 16,531 | ||||||||||||||||||||
| Alteon Health, LLC |
Health Care Providers & Services | L+650 | 1.00 | % | 7.50 | % | 9/14/2018 | 9/1/2023 | 14,293 | 14,233 | 14,007 | |||||||||||||||||||||||
| American Teleconferencing Services, Ltd. (PGI) |
Communications Equipment | L+650 | 1.00 | % | 7.50 | % | 5/5/2016 | 6/8/2023 | 29,984 | 29,520 | 27,735 | |||||||||||||||||||||||
| Atria Wealth Solutions, Inc. |
Diversified Financial Services | L+600 | 1.00 | % | 7.00 | % | 9/14/2018 | 11/30/2022 | 5,841 | 5,808 | 5,841 | |||||||||||||||||||||||
| AviatorCap SII, LLC (2) |
Aerospace & Defense | L+700 | — | 7.23 | % | 3/19/2019 | 1/29/2021 | 2,941 | 2,941 | 2,941 | ||||||||||||||||||||||||
| Basic Fun, Inc. |
Specialty Retail | L+675 | 1.00 | % | 7.75 | % | 10/30/2020 | 10/30/2023 | 3,183 | 3,138 | 3,135 | |||||||||||||||||||||||
| Enhanced Permanent Capital, LLC(3) |
Capital Markets | L+700 | 1.00 | % | 8.00 | % | 12/29/2020 | 12/29/2025 | 18,288 | 17,763 | 17,763 | |||||||||||||||||||||||
| iCIMS, Inc. |
Software | L+650 | 1.00 | % | 7.50 | % | 9/7/2018 | 9/12/2024 | 19,341 | 19,050 | 18,955 | |||||||||||||||||||||||
| Kingsbridge Holdings, LLC(2) . |
Multi-Sector Holdings | L+700 | 1.00 | % | 8.00 | % | 12/21/2018 | 12/21/2024 | 80,000 | 79,634 | 80,000 | |||||||||||||||||||||||
| KORE Wireless Group, Inc. |
Wireless Telecommunication Services | L+550 | — | 5.75 | % | 12/21/2018 | 12/21/2024 | 36,477 | 35,949 | 36,477 | ||||||||||||||||||||||||
| Legility, LLC |
Commercial Services & Supplies | L+600 | 1.00 | % | 7.00 | % | 2/27/2020 | 12/17/2025 | 19,625 | 19,282 | 18,644 | |||||||||||||||||||||||
| Logix Holding Company, LLC |
Communications Equipment | L+575 | 1.00 | % | 6.75 | % | 9/14/2018 | 12/22/2024 | 7,027 | 6,983 | 6,887 | |||||||||||||||||||||||
| One Touch Direct, LLC |
Commercial Services & Supplies | P+100 | — | 6.50 | % | 4/3/2020 | 3/29/2021 | 2,458 | 2,458 | 2,458 | ||||||||||||||||||||||||
| Pet Holdings ULC & Pet Supermarket, Inc. (3) |
Specialty Retail | L+550 | 1.00 | % | 6.50 | % | 9/14/2018 | 7/5/2022 | 28,745 | 28,614 | 28,457 | |||||||||||||||||||||||
| PhyNet Dermatology LLC |
Health Care Providers & Services | L+550 | 1.00 | % | 6.50 | % | 9/5/2018 | 8/16/2024 | 17,065 | 16,973 | 16,468 | |||||||||||||||||||||||
| Pinnacle Treatment Centers, Inc. |
Health Care Providers & Services | L+625 | 1.00 | % | 7.25 | % | 1/22/2020 | 12/31/2022 | 11,773 | 11,688 | 11,773 | |||||||||||||||||||||||
| PPT Management Holdings, LLC |
Health Care Providers & Services | L+850 | (15) | 1.00 | % | 9.50 | % | 9/14/2018 | 12/16/2022 | 20,816 | 20,749 | 18,943 | ||||||||||||||||||||||
| Sentry Data Systems, Inc. |
Software | L+675 | 1.00 | % | 7.75 | % | 9/27/2020 | 10/6/2025 | 15,765 | 15,462 | 15,450 | |||||||||||||||||||||||
| Smile Doctors LLC |
Personal Products | L+600 | 1.00 | % | 7.00 | % | 12/17/2020 | 10/6/2022 | 3,302 | 3,237 | 3,236 | |||||||||||||||||||||||
| Soleo Health Holdings, Inc. |
Health Care Providers & Services | L+575 | 1.00 | % | 6.75 | % | 3/31/2020 | 12/29/2021 | 7,579 | 7,579 | 7,579 | |||||||||||||||||||||||
| The Children’s Place, Inc.(3) |
Specialty Retail | L+800 | 1.00 | % | 9.00 | % | 10/5/2020 | 5/9/2024 | 15,765 | 15,542 | 15,528 | |||||||||||||||||||||||
| USR Parent, Inc. (Staples) |
Specialty Retail | L+884 | 1.00 | % | 9.84 | % | 6/3/2020 | 9/12/2022 | 4,418 | 4,418 | 4,440 | |||||||||||||||||||||||
|
|
|
|
|
|||||||||||||||||||||||||||||||
| Total First Lien Bank Debt/Senior Secured Loans |
|
$ | 377,687 | $ | 373,248 | |||||||||||||||||||||||||||||
|
|
|
|
|
|||||||||||||||||||||||||||||||
| Second Lien Asset-Based Senior Secured Loans |
||||||||||||||||||||||||||||||||||
| Greystone Select Holdings LLC & Greystone & Co., Inc. |
Thrifts & Mortgage Finance | L+800 | 1.00 | % | 9.00 | % | 3/29/2017 | 4/17/2024 | 19,506 | $ | 19,398 | $ | 19,506 | |||||||||||||||||||||
| Varilease Finance, Inc. |
Multi-Sector Holdings | L+750 | 1.00 | % | 8.50 | % | 8/22/2014 | 11/15/2025 | 36,438 | 36,307 | 36,438 | |||||||||||||||||||||||
|
|
|
|
|
|||||||||||||||||||||||||||||||
| Total Second Lien Asset-Based Senior Secured Loans |
|
$ | 55,705 | $ | 55,944 | |||||||||||||||||||||||||||||
| Second Lien Bank Debt/Senior Secured Loans |
||||||||||||||||||||||||||||||||||
| PhyMed Management LLC |
Health Care Providers & Services | L+1100 | (17) | 1.00 | % | 12.00 | % | 12/18/2015 | 9/30/2022 | 33,881 | $ | 33,736 | $ | 31,340 | ||||||||||||||||||||
| Rug Doctor LLC (2) |
Diversified Consumer Services | L+975 | (11) | 1.50 | % | 11.25 | % | 12/23/2013 | 5/16/2023 | 10,559 | 10,543 | 10,559 | ||||||||||||||||||||||
|
|
|
|
|
|||||||||||||||||||||||||||||||
| Total Second Lien Bank Debt/Senior Secured Loans |
|
$ | 44,279 | $ | 41,899 | |||||||||||||||||||||||||||||
| First Lien Life Science Senior Secured Loans |
||||||||||||||||||||||||||||||||||
| Alimera Sciences, Inc. |
Pharmaceuticals | L+765 | 1.78 | % | 9.43 | % | 12/31/2019 | 7/1/2024 | $ | 20,074 | $ | 20,287 | $ | 20,275 | ||||||||||||||||||||
| Apollo Endosurgery, Inc. |
Health Care Equipment & Supplies | L+750 | 1.36 | % | 8.86 | % | 3/15/2019 | 9/1/2024 | 20,492 | 20,860 | 20,799 | |||||||||||||||||||||||
| Ardelyx, Inc. (3) |
Pharmaceuticals | L+745 | 0.25 | % | 7.70 | % | 5/10/2018 | 11/1/2022 | 24,500 | 25,275 | 25,235 | |||||||||||||||||||||||
| Axcella Health Inc. |
Pharmaceuticals | L+850 | 0.20 | % | 8.70 | % | 1/9/2018 | 1/1/2023 | 26,000 | 27,070 | 26,910 | |||||||||||||||||||||||
| Cardiva Medical, Inc. |
Health Care Equipment & Supplies | L+795 | 1.76 | % | 9.71 | % | 9/24/2018 | 12/1/2023 | 27,667 | 28,596 | 29,327 | |||||||||||||||||||||||
| Centrexion Therapeutics, Inc. |
Pharmaceuticals | L+725 | 2.45 | % | 9.70 | % | 6/28/2019 | 1/1/2024 | 16,400 | 16,472 | 16,564 | |||||||||||||||||||||||
| Cerapedics, Inc. |
Health Care Equipment & Supplies | L+695 | 2.50 | % | 9.45 | % | 3/22/2019 | 3/1/2024 | 24,175 | 24,501 | 24,537 | |||||||||||||||||||||||
| Delphinus Medical Technologies, Inc. |
Health Care Equipment & Supplies | L+850 | 1.00 | % | 9.50 | % | 8/18/2017 | 6/1/2022 | 2,177 | 2,410 | 2,395 | |||||||||||||||||||||||
| GenMark Diagnostics, Inc. (3) |
Health Care Providers & Services | L+590 | 2.51 | % | 8.41 | % | 2/1/2019 | 2/1/2023 | 49,522 | 50,892 | 50,884 | |||||||||||||||||||||||
| Kindred Biosciences, Inc. (16) |
Pharmaceuticals | L+675 | 2.17 | % | 8.92 | % | 9/30/2019 | 9/30/2024 | 9,197 | 9,243 | 9,242 | |||||||||||||||||||||||
| Neuronetics, Inc. |
Health Care Equipment & Supplies | L+765 | 1.66 | % | 9.31 | % | 3/2/2020 | 2/28/2025 | 15,613 | 15,689 | 15,691 | |||||||||||||||||||||||
| OmniGuide Holdings, Inc. (13). |
Health Care Equipment & Supplies | L+805 | 1.00 | % | 9.05 | % | 7/30/2018 | 2/1/2021 | 10,500 | 11,532 | 11,287 | |||||||||||||||||||||||
| PQ Bypass, Inc. |
Health Care Equipment & Supplies | L+795 | 1.00 | % | 8.95 | % | 12/20/2018 | 12/19/2022 | 10,000 | 10,190 | 10,500 | |||||||||||||||||||||||
| Rubius Therapeutics, Inc. (3) |
Pharmaceuticals | L+550 | — | 5.65 | % | 12/21/2018 | 12/21/2023 | 40,291 | 40,692 | 40,747 | ||||||||||||||||||||||||
| scPharmaceuticals, Inc. |
Pharmaceuticals | L+795 | 2.23 | % | 10.18 | % | 9/17/2019 | 9/17/2023 | 4,684 | 4,721 | 4,725 | |||||||||||||||||||||||
| SI-BONE, Inc. (3) |
Health Care Equipment & Supplies | L+940 | 0.33 | % | 9.73 | % | 5/29/2020 | 6/1/2025 | 17,843 | 17,856 | 17,843 | |||||||||||||||||||||||
|
|
|
|
|
|||||||||||||||||||||||||||||||
| Total First Lien Life Science Senior Secured Loans |
|
$ | 326,286 | $ | 326,961 | |||||||||||||||||||||||||||||
|
|
|
|
|
|||||||||||||||||||||||||||||||
| Total Senior Secured Loans |
|
$ | 803,957 | $ | 798,052 | |||||||||||||||||||||||||||||
|
|
|
|
|
|||||||||||||||||||||||||||||||
See notes to consolidated financial statements.
106
Table of Contents
SOLAR CAPITAL LTD.
CONSOLIDATED SCHEDULE OF INVESTMENTS (continued)
December 31, 2020
(in thousands, except share/unit amounts)
| Description |
Industry |
Interest Rate |
Acquisition Date |
Maturity Date |
Par Amount | Cost | Fair Value |
|||||||||||||||
| Equipment Financing — 33.4% |
| |||||||||||||||||||||
| AmeraMex International, Inc. (10) |
Commercial Services & Supplies | 10.00% | 3/29/2019 | 3/28/2022 | $ | 5,435 | $ | 5,397 | $ | 5,489 | ||||||||||||
| Blackhawk Mining, LLC (14) |
Oil, Gas & Consumable Fuels | 10.97-11.16% | 2/16/2018 | 3/1/2022-11/1/2022 | 3,531 | 3,415 | 3,443 | |||||||||||||||
| Boart Longyear Company (14) |
Metals & Mining | 10.44% | 5/28/2020 | 7/1/2024 | 3,455 | 3,455 | 3,455 | |||||||||||||||
| C&H Paving, Inc. (14) |
Construction & Engineering | 9.94-11.66% | 12/26/2018 | 1/1/2024-11/1/2024 | 3,416 | 3,455 | 3,410 | |||||||||||||||
| Capital City Jet Center, Inc. (10) |
Airlines | 10.00% | 4/4/2018 | 10/4/2023-6/22/26 | 3,882 | 3,882 | 3,812 | |||||||||||||||
| Central Freight Lines, Inc. (10) |
Road & Rail | 7.16% | 7/31/2017 | 1/14/2024 | 1,212 | 1,212 | 1,212 | |||||||||||||||
| Champion Air, LLC (10) |
Airlines | 10.00% | 3/19/2018 | 1/1/2023 | 2,255 | 2,255 | 2,255 | |||||||||||||||
| Easton Sales and Rentals, LLC (10) |
Commercial Services & Supplies | 10.00% | 9/18/2018 | 10/1/2021 | 1,235 | 1,233 | 1,188 | |||||||||||||||
| Environmental Protection & Improvement Company, LLC (10) |
Road & Rail | 8.25% | 9/30/2020 | 10/1/2027 | 6,520 | 6,567 | 6,520 | |||||||||||||||
| Equipment Operating Leases, LLC (2)(12) |
Multi-Sector Holdings | 7.53-8.37% | 4/27/2018 | 8/1/2022-4/27/2025 | 26,338 | 26,338 | 25,540 | |||||||||||||||
| EquipmentShare.com, Inc. (14) |
Commercial Services & Supplies | 6.60% | 1/8/2020 | 1/8/2025 | 8,097 | 7,658 | 8,097 | |||||||||||||||
| Family First Freight, LLC (10) |
Road & Rail | 8.00-10.33% | 7/31/2017 | 2/1/2022-5/1/2023 | 1,022 | 1,021 | 1,014 | |||||||||||||||
| Freightsol LLC (14) |
Road & Rail | 12.51-12.89% | 4/9/2019 | 11/1/2023 | 1,880 | 1,910 | 1,880 | |||||||||||||||
| Garda CL Technical Services, Inc. (14) |
Commercial Services & Supplies | 8.30-8.77% | 3/22/2018 | 6/5/2023-10/5/2023 | 1,956 | 1,957 | 1,953 | |||||||||||||||
| Georgia Jet, Inc. (10) |
Airlines | 8.00% | 12/4/2017 | 12/4/2021 | 973 | 973 | 954 | |||||||||||||||
| Globecomm Systems Inc. (14) |
Wireless Telecommunication Services | 13.18% | 5/10/2018 | 7/1/2021 | 413 | 413 | 413 | |||||||||||||||
| GMT Corporation (14) |
Machinery | 12.55% | 10/23/2018 | 10/23/2023 | 5,446 | 5,409 | 5,446 | |||||||||||||||
| Haljoe Coaches USA, LLC (14) |
Road & Rail | 8.03-9.69% | 7/31/2017 | 7/1/2022-7/1/2024 | 4,883 | 4,883 | 4,132 | |||||||||||||||
| HTI Logistics Corporation (10) |
Commercial Services & Supplies | 9.69-9.94% | 11/15/2018 | 5/1/2024-9/1/2025 | 527 | 527 | 514 | |||||||||||||||
| Hypro, Inc. (10) |
Machinery | 11.53% | 9/30/2019 | 10/1/2023 | 1,925 | 1,940 | 1,875 | |||||||||||||||
| Interstate NDT, Inc. (14) |
Road & Rail | 10.91-14.11% | 6/11/2018 | 7/1/2023-10/25/2023 | 1,795 | 1,795 | 1,704 | |||||||||||||||
| ISR Holdings, LLC (10) |
Commercial Services & Supplies | 9.25% | 8/27/2019 | 8/27/2022 | 3,124 | 3,124 | 3,124 | |||||||||||||||
| JP Motorsports, Inc. (14) |
Road & Rail | 16.06% | 8/17/2018 | 1/25/2022 | 118 | 118 | 117 | |||||||||||||||
| Kool Pak, LLC (14) |
Road & Rail | 8.58% | 2/5/2018 | 3/1/2024 | 484 | 484 | 484 | |||||||||||||||
| Lineal Industries, Inc. (10) |
Construction & Engineering | 8.00% | 12/21/2018 | 12/21/2021 | 45 | 45 | 45 | |||||||||||||||
| Loyer Capital LLC (2)(12) |
Multi-Sector Holdings | 8.73-11.52% | 5/16/2019 | 5/16/24-9/25/24 | 14,731 | 14,731 | 14,456 | |||||||||||||||
| Mountain Air Helicopters, Inc. (10) |
Commercial Services & Supplies | 10.00% | 7/31/2017 | 4/30/2022-2/28/2025 | 1,870 | 1,865 | 1,902 | |||||||||||||||
| NEF Holdings, LLC (2) |
Multi-Sector Holdings | 8.50% | 8/14/2020 | 8/14/2021 | 850 | 850 | 850 | |||||||||||||||
| Rane Light Metal Castings Inc. (14) |
Machinery | 10.00% | 6/1/2020 | 7/1/2024 | 338 | 338 | 338 | |||||||||||||||
| Rango, Inc. (10)(14) |
Commercial Services & Supplies | 9.33%-9.79% | 9/24/2019 | 4/1/2023-11/1/2024 | 5,137 | 5,207 | 5,041 | |||||||||||||||
| Rossco Crane & Rigging, Inc. (14) |
Commercial Services & Supplies | 11.13-11.53% | 8/25/2017 | 4/1/2021-9/1/2022 | 332 | 332 | 330 | |||||||||||||||
| Royal Coach Lines, Inc.(14) |
Road & Rail | 9.56% | 11/21/2019 | 8/1/2025 | 1,215 | 1,215 | 1,085 | |||||||||||||||
| Royal Express Inc. (14) |
Road & Rail | 9.53% | 1/17/2019 | 2/1/2024 | 914 | 927 | 914 | |||||||||||||||
| Sidelines Tree Service LLC (14) |
Diversified Consumer Services | 10.25% | 7/31/2017 | 10/1/2022 | 79 | 79 | 76 | |||||||||||||||
| South Texas Oilfield Solutions, LLC (14) |
Energy Equipment & Services | 12.52-13.76% | 3/29/2018 | 9/1/2022-7/1/2023 | 2,194 | 2,194 | 2,110 | |||||||||||||||
| ST Coaches, LLC (14) |
Road & Rail | 8.21-8.58% | 7/31/2017 | 10/1/2022-1/25/2025 | 4,755 | 4,755 | 4,318 | |||||||||||||||
| Stafford Logistics, Inc. (10) |
Commercial Services & Supplies | 12.63-13.12% | 9/11/2019 | 10/1/2024-10/1/2025 | 6,870 | 6,870 | 6,604 | |||||||||||||||
| Star Coaches Inc. (14) |
Road & Rail | 8.42% | 3/9/2018 | 4/1/2025 | 3,385 | 3,385 | 2,902 | |||||||||||||||
| Sturgeon Services International Inc. (10) |
Energy Equipment & Services | 18.42% | 7/31/2017 | 2/28/2022 | 816 | 816 | 770 | |||||||||||||||
| Sun-Tech Leasing of Texas, L.P. (14) |
Road & Rail |
8.68% | 7/31/2017 | 7/25/2021 | 36 | 36 | 36 | |||||||||||||||
| Superior Transportation, Inc. (14) |
Road & Rail |
9.40-12.26% | 7/31/2017 | 4/1/2022-8/1/2024 | 5,524 | 5,511 | 5,142 | |||||||||||||||
| Tailwinds, LLC (10) |
Air Freight & Logistics |
8.50%-9.00% | 7/26/2019 | 8/1/2024-10/16/2025 | 2,633 | 2,633 | 2,633 | |||||||||||||||
| The Smedley Company & Smedley Services, Inc. (10) |
Commercial Services & Supplies | 10.03-14.97% | 7/31/2017 | 10/29/2023-2/10/2024 | 3,902 | 3,905 | 3,634 | |||||||||||||||
| Thora Capital, LLC (10) |
Airlines | 9.00% | 7/3/2019 | 7/1/2025 | 5,602 | 5,602 | 5,596 | |||||||||||||||
| Trinity Equipment Rentals, Inc. (14) |
Commercial Services & Supplies | 11.23% | 9/13/2018 | 10/1/2022 | 538 | 538 | 538 | |||||||||||||||
| Trolleys, Inc. (14) |
Road & Rail | 9.98% | 7/18/2018 | 8/1/2022 | 1,999 | 1,999 | 1,919 | |||||||||||||||
| Up Trucking Services, LLC (14) |
Road & Rail | 11.21-12.53% | 3/23/2018 | 4/1/2022-8/1/2024 | 1,638 | 1,657 | 1,651 | |||||||||||||||
| Warrior Crane Services, LLC (10) |
Commercial Services & Supplies | 8.95% | 7/11/2019 | 8/1/2024-8/1/2026 | 3,087 | 3,087 | 3,030 | |||||||||||||||
| Wind River Environmental, LLC (10) |
Diversified Consumer Services | 8.43%-10.00% | 7/31/2019 | 8/1/2024-10/5/25 | 1,112 | 1,118 | 1,112 | |||||||||||||||
| Womble Company, Inc. (14) |
Energy Equipment & Services | 9.11% | 12/27/2019 | 1/1/2025 | 694 | 694 | 681 | |||||||||||||||
| Shares/Units | ||||||||||||||||||||||
| NEF Holdings, LLC Equity Interests (2)(9) |
Multi-Sector Holdings | 7/31/2017 | 200 | 145,000 | 129,102 | |||||||||||||||||
|
|
|
|
|
|||||||||||||||||||
| Total Equipment Financing |
|
$ | 304,810 | $ | 284,846 | |||||||||||||||||
|
|
|
|
|
|||||||||||||||||||
| Preferred Equity – 0.8% |
| |||||||||||||||||||||
| SOAGG LLC (2)(3)(4) |
Aerospace & Defense |
8.00% | 12/14/2010 | 6/30/2023 | 446 | $ | 446 | $ | 2,300 | |||||||||||||
| SOINT, LLC (2)(3)(4) |
Aerospace & Defense |
5.00%(11) | 6/8/2012 | 6/30/2023 | 53,321 | 5,332 | 4,101 | |||||||||||||||
|
|
|
|
|
|||||||||||||||||||
| Total Preferred Equity |
|
$ | 5,778 | $ | 6,401 | |||||||||||||||||
|
|
|
|
|
|||||||||||||||||||
See notes to consolidated financial statements.
107
Table of Contents
SOLAR CAPITAL LTD.
CONSOLIDATED SCHEDULE OF INVESTMENTS (continued)
December 31, 2020
(in thousands, except share/unit amounts)
| Description |
Industry |
Acquisition |
Shares/ Units |
Cost | Fair Value |
|||||||||||
| Common Equity/Equity Interests/Warrants—51.9% |
||||||||||||||||
| aTyr Pharma, Inc. Warrants * |
Pharmaceuticals | 11/18/2016 | 6,347 | $ | 106 | $ | — | |||||||||
| B Riley Financial Inc. (3)(8) |
Research & Consulting Services | 3/16/2007 | 38,015 | 2,684 | 1,681 | |||||||||||
| CardioFocus, Inc. Warrants * |
Health Care Equipment & Supplies | 3/31/2017 | 90 | 51 | — | |||||||||||
| Centrexion Therapeutics, Inc. Warrants * |
Pharmaceuticals | 6/28/2019 | 289,102 | 136 | 71 | |||||||||||
| Conventus Orthopaedics, Inc. Warrants * |
Health Care Equipment & Supplies | 6/15/2016 | 157,500 | 65 | — | |||||||||||
| Crystal Financial LLC (2)(3) |
Diversified Financial Services | 12/28/2012 | 280,303 | 280,737 | 296,766 | |||||||||||
| Delphinus Medical Technologies, Inc. Warrants * |
Health Care Equipment & Supplies | 8/18/2017 | 444,388 | 74 | 82 | |||||||||||
| Essence Group Holdings Corporation (Lumeris) Warrants * |
Health Care Technology | 3/22/2017 | 208,000 | 63 | 258 | |||||||||||
| KBH Topco LLC (Kingsbridge) (2)(5) |
Multi-Sector Holdings | 11/3/2020 | 73,500,000 | 136,596 | 136,596 | |||||||||||
| PQ Bypass, Inc. Warrants * |
Health Care Equipment & Supplies | 12/20/2018 | 300,000 | 106 | 675 | |||||||||||
| RD Holdco Inc. (Rug Doctor) (2)* |
Diversified Consumer Services | 12/23/2013 | 231,177 | 15,683 | 1,226 | |||||||||||
| RD Holdco Inc. (Rug Doctor) Class B (2)* |
Diversified Consumer Services | 12/23/2013 | 522 | 5,216 | 5,216 | |||||||||||
| RD Holdco Inc. (Rug Doctor) Warrants (2)* |
Diversified Consumer Services | 12/23/2013 | 30,370 | 381 | — | |||||||||||
| Scynexis, Inc. Warrants * |
Pharmaceuticals | 9/30/2016 | 12,243 | 105 | — | |||||||||||
| Senseonics Holdings, Inc. Warrants * |
Health Care Equipment & Supplies | 7/25/2019 | 526,901 | 117 | 81 | |||||||||||
| Sunesis Pharmaceuticals, Inc. Warrants * |
Pharmaceuticals | 3/31/2016 | 10,400 | 118 | — | |||||||||||
| Venus Concept Ltd. Warrants* (fka Restoration Robotics) |
Health Care Equipment & Supplies | 5/10/2018 | 27,352 | 152 | — | |||||||||||
|
|
|
|
|
|||||||||||||
| Total Common Equity/Equity Interests/Warrants |
|
$ | 442,390 | $ | 442,652 | |||||||||||
|
|
|
|
|
|||||||||||||
| Total Investments (6) — 179.8% |
|
$ | 1,556,935 | $ | 1,531,951 | |||||||||||
|
|
|
|
|
|||||||||||||
| Description |
Industry |
Acquisition Date |
Maturity Date |
Par Amount | ||||||||||||||||||
| Cash Equivalents — 44.6% |
||||||||||||||||||||||
| U.S. Treasury Bill |
Government | 12/31/2020 | 2/23/2021 | $ | 380,000 | $ | 379,997 | $ | 379,997 | |||||||||||||
|
|
|
|
|
|||||||||||||||||||
| Total Investments & Cash Equivalents —224.4% |
$ | 1,936,932 | $ | 1,911,948 | ||||||||||||||||||
| Liabilities in Excess of Other Assets — (124.4%). |
(1,059,925 | ) | ||||||||||||||||||||
|
|
|
|||||||||||||||||||||
| Net Assets — 100.0% |
$ | 852,023 | ||||||||||||||||||||
|
|
|
|||||||||||||||||||||
| (1) | Floating rate debt investments typically bear interest at a rate determined by reference to the London Interbank Offered Rate (“LIBOR”), and which typically reset monthly, quarterly or semi-annually. For each debt investment we have provided the current rate of interest, or in the case of leases the current implied yield, in effect as of December 31, 2020. |
108
Table of Contents
SOLAR CAPITAL LTD.
CONSOLIDATED SCHEDULE OF INVESTMENTS (continued)
December 31, 2020
(in thousands)
| (2) | Denotes investments in which we are deemed to exercise a controlling influence over the management or policies of a company, as defined in the Investment Company Act of 1940 (“1940 Act”), due to beneficially owning, either directly or through one or more controlled companies, more than 25% of the outstanding voting securities of the investment. Transactions during the year ended December 31, 2020 in these controlled investments are as follows: |
| Name of Issuer |
Fair Value at December 31, 2019 |
Gross Additions |
Gross Reductions |
Realized Gain (Loss) |
Change in Unrealized Gain (Loss) |
Interest/ Dividend /Other Income |
Fair Value at December 31, 2020 |
|||||||||||||||||||||
| AviatorCap SII, LLC |
$ | 2,896 | $ | — | $ | 2,896 | $ | — | $ | — | $ | 198 | $ | — | ||||||||||||||
| AviatorCap SII, LLC |
2,713 | 1,105 | 877 | — | — | 260 | 2,941 | |||||||||||||||||||||
| Crystal Financial LLC |
296,000 | — | — | — | 766 | 24,000 | 296,766 | |||||||||||||||||||||
| Equipment Operating Leases, LLC |
29,739 | — | 3,401 | — | (798 | ) | 2,290 | 25,540 | ||||||||||||||||||||
| Kingsbridge Holdings, LLC (debt) |
33,112 | 46,888 | — | — | (71 | ) | 3,481 | 80,000 | ||||||||||||||||||||
| Kingsbridge Holdings, LLC (equity) |
— | 136,596 | — | — | — | 1,925 | 136,596 | |||||||||||||||||||||
| Loyer Capital LLC |
14,731 | — | — | — | (275 | ) | 1,488 | 14,456 | ||||||||||||||||||||
| NEF Holdings, LLC (equity) |
145,000 | — | — | — | (15,898 | ) | 250 | 129,102 | ||||||||||||||||||||
| NEF Holdings, LLC (debt) |
— | 850 | — | — | — | 28 | 850 | |||||||||||||||||||||
| RD Holdco Inc. (Rug Doctor, common equity) |
7,706 | — | — | — | (6,480 | ) | — | 1,226 | ||||||||||||||||||||
| RD Holdco Inc. (Rug Doctor, class B).. |
5,216 | — | — | — | — | — | 5,216 | |||||||||||||||||||||
| RD Holdco Inc. (Rug Doctor, warrants).. |
— | — | — | — | — | — | — | |||||||||||||||||||||
| Rug Doctor LLC |
9,111 | 1,448 | — | — | (6 | ) | 1,128 | 10,559 | ||||||||||||||||||||
| SOAGG LLC |
4,952 | — | 1,095 | — | (1,557 | ) | 111 | 2,300 | ||||||||||||||||||||
| SOINT, LLC |
5,939 | 319 | 380 | — | (1,777 | ) | 508 | 4,101 | ||||||||||||||||||||
|
|
|
|
|
|
|
|
|
|
|
|
|
|
|
|||||||||||||||
| $ | 557,115 | $ | 187,206 | $ | 8,649 | $ | — | $ | (26,096 | ) | $ | 35,667 | $ | 709,653 | ||||||||||||||
|
|
|
|
|
|
|
|
|
|
|
|
|
|
|
|||||||||||||||
See notes to consolidated financial statements.
109
Table of Contents
SOLAR CAPITAL LTD.
CONSOLIDATED SCHEDULE OF INVESTMENTS (continued)
December 31, 2020
(in thousands)
| (3) | Indicates assets that the Company believes may not represent “qualifying assets” under Section 55(a) of the Investment Company Act of 1940 (“1940 Act”), as amended. If we fail to invest a sufficient portion of our assets in qualifying assets, we could be prevented from making follow-on investments in existing portfolio companies or could be required to dispose of investments at inappropriate times in order to comply with the 1940 Act. As of December 31, 2020, on a fair value basis, non-qualifying assets in the portfolio represented 25.9% of the total assets of the Company. |
| (4) | Solar Capital Ltd.’s investments in SOAGG, LLC and SOINT, LLC include a two and one dollar investment in common shares, respectively. |
| (5) | Kingsbridge Holdings, LLC is held through KBH Topco LLC, a Delaware corporation. |
| (6) | Aggregate net unrealized appreciation for U.S. federal income tax purposes is $4,446; aggregate gross unrealized appreciation and depreciation for U.S. federal tax purposes is $52,349 and $47,903, respectively, based on a tax cost of $1,527,505. Unless otherwise noted, all of the Company’s investments are pledged as collateral against the borrowings outstanding on the senior secured credit facility. The Company generally acquires its investments in private transactions exempt from registration under the Securities Act of 1933, as amended (the “Securities Act”). These investments are generally subject to certain limitations on resale, and may be deemed to be “restricted securities” under the Securities Act. All investments are Level 3 unless otherwise indicated. |
| (7) | Floating rate instruments accrue interest at a predetermined spread relative to an index, typically the LIBOR or PRIME rate. These instruments are often subject to a LIBOR or PRIME rate floor. |
| (8) | Denotes a Level 1 investment. |
| (9) | NEF Holdings, LLC is held through NEFCORP LLC, a wholly-owned consolidated taxable subsidiary and NEFPASS LLC, a wholly-owned consolidated subsidiary. |
| (10) | Indicates an investment that is wholly held by Solar Capital Ltd. through NEFPASS LLC. |
| (11) | Interest is paid in kind (“PIK”). |
| (12) | Denotes a subsidiary of NEF Holdings, LLC. |
| (13) | OmniGuide Holdings, Inc., Domain Surgical, Inc. and OmniGuide, Inc. are co-borrowers. |
| (14) | Indicates an investment that is held by the Company through its wholly-owned consolidated financing subsidiary NEFPASS SPV, LLC (the “NEFPASS SPV”). Such investments are pledged as collateral under the NEFPASS SPV, LLC Revolving Credit Facility (see Note 7 to the consolidated financial statements) and are not generally available to creditors, if any, of the Company. |
| (15) | Spread is 6.00% Cash / 2.50% PIK. |
| (16) | Kindred Biosciences, Inc., KindredBio Equine, Inc. and Centaur Biopharmaceutical Services, Inc. are co-borrowers. |
| (17) | Spread is 2.50% Cash / 8.50% PIK. |
| * | Non-income producing security. |
See notes to consolidated financial statements.
110
Table of Contents
SOLAR CAPITAL LTD.
CONSOLIDATED SCHEDULE OF INVESTMENTS (continued)
December 31, 2020
(in thousands)
| Industry Classification |
Percentage of Total Investments (at fair value) as of December 31, 2020 |
|||
| Multi-Sector Holdings (includes Kingsbridge Holdings, LLC, NEF Holdings, LLC, Equipment Operating Leases, LLC and Loyer Capital LLC) |
27.6 | % | ||
| Diversified Financial Services (includes Crystal Financial LLC) |
19.8 | % | ||
| Health Care Providers & Services |
10.9 | % | ||
| Pharmaceuticals |
9.4 | % | ||
| Health Care Equipment & Supplies |
8.7 | % | ||
| Commercial Services & Supplies |
4.1 | % | ||
| Specialty Retail |
3.4 | % | ||
| Wireless Telecommunication Services |
2.4 | % | ||
| Road & Rail |
2.3 | % | ||
| Communications Equipment |
2.3 | % | ||
| Software |
2.2 | % | ||
| Thrifts & Mortgage Finance |
1.3 | % | ||
| Diversified Consumer Services |
1.2 | % | ||
| Capital Markets |
1.2 | % | ||
| Airlines |
0.8 | % | ||
| Aerospace & Defense |
0.6 | % | ||
| Machinery |
0.5 | % | ||
| Energy Equipment & Services. |
0.2 | % | ||
| Metals & Mining |
0.2 | % | ||
| Construction & Engineering |
0.2 | % | ||
| Oil, Gas & Consumable Fuels |
0.2 | % | ||
| Personal Products |
0.2 | % | ||
| Air Freight & Logistics |
0.2 | % | ||
| Research & Consulting Services |
0.1 | % | ||
| Health Care Technology. |
0.0 | % | ||
|
|
|
|||
| Total Investments |
100.0 | % | ||
|
|
|
|||
See notes to consolidated financial statements.
111
Table of Contents
SOLAR CAPITAL LTD.
CONSOLIDATED SCHEDULE OF INVESTMENTS
December 31, 2019
(in thousands, except share/unit amounts)
| Description |
Industry |
Spread Above Index(7) |
LIBOR Floor |
Interest Rate(1) |
Acquisition Date |
Maturity Date |
Par Amount | Cost | Fair Value |
|||||||||||||||||||||||||
| Senior Secured Loans — 94.1% |
| |||||||||||||||||||||||||||||||||
| Bank Debt/Senior Secured Loans |
| |||||||||||||||||||||||||||||||||
| Aegis Toxicology Sciences Corporation |
Health Care Providers & Services | L+550 | 1.00 | % | 7.40 | % | 5/7/2018 | 5/9/2025 | $ | 17,043 | $ | 16,800 | $ | 16,191 | ||||||||||||||||||||
| Alteon Health, LLC |
Health Care Providers & Services | L+650 | 1.00 | % | 8.30 | % | 9/14/2018 | 9/1/2022 | 15,094 | 15,011 | 15,094 | |||||||||||||||||||||||
| Altern Marketing, LLC |
Household & Personal Products | L+600 | 2.00 | % | 8.00 | % | 10/25/2019 | 10/7/2024 | 27,899 | 27,626 | 27,620 | |||||||||||||||||||||||
| American Teleconferencing Services, Ltd. (PGI) |
Communications Equipment | L+650 | 1.00 | % | 8.32 | % | 5/5/2016 | 6/8/2023 | 30,038 | 29,386 | 28,236 | |||||||||||||||||||||||
| Atria Wealth Solutions, Inc |
Diversified Financial Services | L+600 | 1.00 | % | 7.80 | % | 9/14/2018 | 11/30/2022 | 4,404 | 4,371 | 4,360 | |||||||||||||||||||||||
| AviatorCap SII, LLC (2) |
Aerospace & Defense | L+700 | — | 8.90 | % | 12/27/2018 | 10/30/2020 | 2,896 | 2,896 | 2,896 | ||||||||||||||||||||||||
| AviatorCap SII, LLC (2) |
Aerospace & Defense | L+700 | — | 8.90 | % | 3/19/2019 | 1/29/2021 | 2,713 | 2,713 | 2,713 | ||||||||||||||||||||||||
| Bishop Lifting Products, Inc. (5) |
Trading Companies & Distributors | L+800 | 1.00 | % | 9.80 | % | 3/24/2014 | 3/27/2022 | 24,985 | 24,906 | 24,985 | |||||||||||||||||||||||
| Enhanced Capital Group, LLC |
Capital Markets | L+550 | 1.00 | % | 7.20 | % | 6/28/2019 | 6/28/2024 | 20,311 | 20,032 | 20,311 | |||||||||||||||||||||||
| Falmouth Group Holdings Corp. (AMPAC) |
Chemicals | L+675 | 1.00 | % | 8.55 | % | 12/7/2015 | 12/14/2021 | 37,195 | 37,058 | 37,195 | |||||||||||||||||||||||
| Greystone Select Holdings LLC & Greystone & Co., Inc. |
Thrifts & Mortgage Finance | L+800 | 1.00 | % | 9.93 | % | 3/29/2017 | 4/17/2024 | 19,702 | 19,567 | 19,702 | |||||||||||||||||||||||
| iCIMS, Inc. |
Software | L+650 | 1.00 | % | 8.29 | % | 9/7/2018 | 9/12/2024 | 15,003 | 14,751 | 15,003 | |||||||||||||||||||||||
| IHS Intermediate, Inc.** |
Health Care Providers & Services | L+825 | 1.00 | % | — | 6/19/2015 | 7/20/2022 | 25,000 | 24,728 | 7,500 | ||||||||||||||||||||||||
| Kingsbridge Holdings, LLC |
Multi-Sector Holdings | L+700 | 1.00 | % | 9.09 | % | 12/21/2018 | 12/21/2024 | 33,112 | 32,675 | 33,112 | |||||||||||||||||||||||
| KORE Wireless Group, Inc. |
Wireless Telecommunication Services | L+550 | — | 7.44 | % | 12/21/2018 | 12/21/2024 | 36,850 | 36,208 | 36,573 | ||||||||||||||||||||||||
| Logix Holding Company, LLC |
Communications Equipment | L+575 | 1.00 | % | 7.55 | % | 9/14/2018 | 12/22/2024 | 7,103 | 7,048 | 7,103 | |||||||||||||||||||||||
| MRI Software LLC |
Software | L+575 | 1.00 | % | 7.55 | % | 7/23/2019 | 6/30/2023 | 31,610 | 31,316 | 31,610 | |||||||||||||||||||||||
| On Location Events, LLC & PrimeSport Holdings Inc. |
Media | L+500 | 1.00 | % | 6.94 | % | 12/7/2017 | 9/29/2021 | 27,547 | 27,409 | 27,547 | |||||||||||||||||||||||
| Pet Holdings ULC & Pet Supermarket, Inc. (3) |
Specialty Retail | L+550 | 1.00 | % | 7.60 | % | 9/14/2018 | 7/5/2022 | 29,045 | 28,833 | 28,972 | |||||||||||||||||||||||
| PhyMed Management LLC |
Health Care Providers & Services | L+875 | 1.00 | % | 10.55 | % | 12/18/2015 | 5/18/2021 | 32,321 | 31,919 | 32,321 | |||||||||||||||||||||||
| PhyNet Dermatology LLC |
Health Care Providers & Services | L+550 | 1.00 | % | 7.29 | % | 9/5/2018 | 8/16/2024 | 17,239 | 17,125 | 17,239 | |||||||||||||||||||||||
| PPT Management Holdings, LLC |
Health Care Providers & Services | L+675 | (15) | 1.00 | % | 8.44 | % | 9/14/2018 | 12/16/2022 | 20,656 | 20,557 | 19,003 | ||||||||||||||||||||||
| PSKW, LLC & PDR, LLC |
Health Care Providers & Services | L+425 | 1.00 | % | 6.19 | % | 9/14/2018 | 11/25/2021 | 1,771 | 1,765 | 1,771 | |||||||||||||||||||||||
| PSKW, LLC & PDR, LLC |
Health Care Providers & Services | L+768 | 1.00 | % | 9.63 | % | 10/24/2017 | 11/25/2021 | 27,929 | 27,690 | 27,929 | |||||||||||||||||||||||
| RS Energy Group U.S., Inc. |
Software | L+475 | — | 6.69 | % | 10/26/2018 | 10/6/2023 | 15,096 | 14,855 | 15,096 | ||||||||||||||||||||||||
| Rug Doctor LLC (2) |
Diversified Consumer Services | L+975 | 1.50 | % | 11.54 | % | 12/23/2013 | 5/16/2023 | 9,111 | 9,089 | 9,111 | |||||||||||||||||||||||
| Solara Medical Supplies, Inc. |
Health Care Providers & Services | L+600 | 1.00 | % | 7.94 | % | 5/31/2018 | 2/27/2024 | 7,507 | 7,385 | 7,507 | |||||||||||||||||||||||
| The Octave Music Group, Inc. (fka TouchTunes) |
Media | L+825 | 1.00 | % | 9.95 | % | 5/28/2015 | 5/27/2022 | 12,194 | 12,116 | 12,194 | |||||||||||||||||||||||
| Varilease Finance, Inc. |
Multi-Sector Holdings | L+750 | 1.00 | % | 9.59 | % | 8/22/2014 | 11/15/2025 | 36,438 | 36,286 | 36,438 | |||||||||||||||||||||||
|
|
|
|
|
|||||||||||||||||||||||||||||||
| Total Bank Debt/Senior Secured Loans |
|
$ | 582,121 | $ | 565,332 | |||||||||||||||||||||||||||||
|
|
|
|
|
|||||||||||||||||||||||||||||||
| Life Science Senior Secured Loans |
| |||||||||||||||||||||||||||||||||
| Alimera Sciences, Inc. |
Pharmaceuticals | L+765 | 1.78 | % | 9.43 | % | 12/31/2019 | 7/1/2024 | $ | 18,959 | $ | 18,959 | $ | 18,959 | ||||||||||||||||||||
| Apollo Endosurgery, Inc. |
Health Care Equipment & Supplies | L+750 | — | 9.19 | % | 3/15/2019 | 9/1/2023 | 20,492 | 20,539 | 20,492 | ||||||||||||||||||||||||
| Ardelyx, Inc. (3) |
Pharmaceuticals | L+745 | — | 9.14 | % | 5/10/2018 | 11/1/2022 | 24,500 | 24,741 | 24,745 | ||||||||||||||||||||||||
| aTyr Pharma, Inc. |
Pharmaceuticals | P+410 | — | 8.85 | % | 11/18/2016 | 11/18/2020 | 3,667 | 4,302 | 4,327 | ||||||||||||||||||||||||
| Axcella Health Inc. |
Pharmaceuticals | L+850 | — | 10.20 | % | 1/9/2018 | 1/1/2023 | 26,000 | 26,514 | 26,546 | ||||||||||||||||||||||||
| Cardiva Medical, Inc. |
Health Care Equipment & Supplies | L+795 | 1.76 | % | 9.71 | % | 9/24/2018 | 12/1/2023 | 24,000 | 24,383 | 24,480 | |||||||||||||||||||||||
| Centrexion Therapeutics, Inc. |
Pharmaceuticals | L+725 | 2.45 | % | 9.70 | % | 6/28/2019 | 1/1/2024 | 12,615 | 12,533 | 12,504 | |||||||||||||||||||||||
| Cerapedics, Inc. |
Health Care Equipment & Supplies | L+695 | 2.50 | % | 9.45 | % | 3/22/2019 | 3/1/2024 | 18,803 | 18,893 | 18,897 | |||||||||||||||||||||||
| Delphinus Medical Technologies, Inc. |
Health Care Equipment & Supplies | L+850 | — | 10.19 | % | 8/18/2017 | 9/1/2021 | 3,810 | 3,919 | 3,906 | ||||||||||||||||||||||||
| GenMark Diagnostics, Inc. (3) |
Health Care Providers & Services | L+590 | 2.51 | % | 8.41 | % | 2/1/2019 | 2/1/2023 | 49,522 | 49,823 | 50,017 | |||||||||||||||||||||||
| Kindred Biosciences, Inc. (3)(16) |
Pharmaceuticals | L+675 | 2.17 | % | 8.92 | % | 9/30/2019 | 9/30/2024 | 9,197 | 9,169 | 9,173 | |||||||||||||||||||||||
| OmniGuide Holdings, Inc. (13). |
Health Care Equipment & Supplies | L+805 | — | 9.74 | % | 7/30/2018 | 7/29/2023 | 10,500 | 10,639 | 10,552 | ||||||||||||||||||||||||
| PQ Bypass, Inc. |
Health Care Equipment & Supplies | L+795 | 1.00 | % | 9.65 | % | 12/20/2018 | 12/19/2022 | 10,000 | 9,974 | 10,140 | |||||||||||||||||||||||
| Rubius Therapeutics, Inc. (3) |
Pharmaceuticals | L+550 | — | 7.19 | % | 12/21/2018 | 12/21/2023 | 26,861 | 26,974 | 26,995 | ||||||||||||||||||||||||
| scPharmaceuticals, Inc. |
Pharmaceuticals | L+795 | 2.23 | % | 10.18 | % | 9/17/2019 | 9/17/2023 | 4,684 | 4,692 | 4,693 | |||||||||||||||||||||||
| Senseonics Holdings, Inc |
Health Care Equipment & Supplies | L+650 | 2.48 | % | 8.98 | % | 7/25/2019 | 7/1/2024 | 21,076 | 20,989 | 21,076 | |||||||||||||||||||||||
|
|
|
|
|
|||||||||||||||||||||||||||||||
| Total Life Science Senior Secured Loans |
|
$ | 287,043 | $ | 287,502 | |||||||||||||||||||||||||||||
|
|
|
|
|
|||||||||||||||||||||||||||||||
| Total Senior Secured Loans |
|
$ | 869,164 | $ | 852,834 | |||||||||||||||||||||||||||||
|
|
|
|
|
|||||||||||||||||||||||||||||||
See notes to consolidated financial statements.
112
Table of Contents
SOLAR CAPITAL LTD.
CONSOLIDATED SCHEDULE OF INVESTMENTS (continued)
December 31, 2019
(in thousands, except share/unit amounts)
| Description |
Industry |
Interest |
Acquisition Date |
Maturity Date |
Par Amount | Cost | Fair Value |
|||||||||||||||
| Equipment Financing — 35.4% |
| |||||||||||||||||||||
| Althoff Crane Service, Inc. (14) |
Commercial Services & Supplies | 10.55% | 7/31/2017 | 6/8/2022 | $ | 1,180 | $ | 1,180 | $ | 1,200 | ||||||||||||
| AmeraMex International, Inc. (10) |
Commercial Services & Supplies | 10.00% | 3/29/2019 | 3/28/2022 | 6,314 | 6,206 | 6,400 | |||||||||||||||
| Blackhawk Mining, LLC (14) |
Oil, Gas & Consumable Fuels | 10.99-11.17% | 2/16/2018 | 3/1/2022-11/1/2022 | 4,701 | 4,474 | 4,764 | |||||||||||||||
| C&H Paving, Inc. (14) |
Construction & Engineering | 9.94-11.66% | 12/26/2018 | 1/1/2024-11/1/2024 | 4,136 | 4,187 | 4,158 | |||||||||||||||
| Capital City Jet Center, Inc. (10) |
Airlines | 10.00% | 4/4/2018 | 10/4/2023 | 1,806 | 1,806 | 1,808 | |||||||||||||||
| Central Freight Lines, Inc. (10) |
Road & Rail | 7.16% | 7/31/2017 | 1/14/2024 | 1,421 | 1,421 | 1,421 | |||||||||||||||
| Champion Air, LLC (10) |
Airlines | 10.00% | 3/19/2018 | 1/1/2023 | 2,770 | 2,770 | 2,748 | |||||||||||||||
| Easton Sales and Rentals, LLC (10) |
Commercial Services & Supplies | 10.00% | 9/18/2018 | 10/1/2021 | 1,882 | 1,866 | 1,845 | |||||||||||||||
| Equipment Operating Leases, LLC (2)(12) |
Multi-Sector Holdings | 7.53-8.37% | 4/27/2018 | 8/1/2022-4/27/2025 | 29,739 | 29,739 | 29,739 | |||||||||||||||
| Family First Freight, LLC (10) |
Road & Rail | 9.43-10.10% | 7/31/2017 | 7/1/2020-1/22/2022 | 557 | 556 | 554 | |||||||||||||||
| Freightsol LLC (14) |
Road & Rail | 12.62-12.99% | 4/9/2019 | 11/1/2023 | 2,225 | 2,266 | 2,225 | |||||||||||||||
| Garda CL Technical Services, Inc. (14) |
Commercial Services & Supplies | 8.31-8.77% | 3/22/2018 | 7/13/2023-10/5/2023 | 2,317 | 2,317 | 2,280 | |||||||||||||||
| Georgia Jet, Inc. (10) |
Airlines | 8.00% | 12/4/2017 | 12/4/2021 | 1,833 | 1,833 | 1,805 | |||||||||||||||
| Globecomm Systems Inc. (14) |
Wireless Telecommunication Services | 13.18% | 5/10/2018 | 7/1/2021 | 1,051 | 1,051 | 1,072 | |||||||||||||||
| GMT Corporation (14) |
Machinery | 12.46% | 10/23/2018 | 10/23/2023 | 6,363 | 6,309 | 6,363 | |||||||||||||||
| Haljoe Coaches USA, LLC (14) |
Road & Rail | 8.15-9.90% | 7/31/2017 | 7/1/2022-7/1/2024 | 5,626 | 5,626 | 5,527 | |||||||||||||||
| Hawkeye Contracting Company, LLC (10)(11) |
Oil, Gas & Consumable Fuels | 10.00% | 11/15/2017 | 11/15/2020 | 1,823 | 1,823 | 1,827 | |||||||||||||||
| HTI Logistics Corporation (10) |
Commercial Services & Supplies | 9.69-9.80% | 11/15/2018 | 12/1/2023-4/1/2024 | 289 | 289 | 286 | |||||||||||||||
| Hypro, Inc. (10) |
Machinery | 11.53% | 9/30/2019 | 10/1/2023 | 3,460 | 3,493 | 3,460 | |||||||||||||||
| Interstate NDT, Inc. (14) |
Road & Rail | 11.32-13.94% | 6/11/2018 | 7/1/2023-10/25/2023 | 2,019 | 2,019 | 2,055 | |||||||||||||||
| ISR Holdings, LLC (10) |
Commercial Services & Supplies | 9.25% | 8/27/2019 | 8/27/2022 | 4,781 | 4,781 | 4,781 | |||||||||||||||
| JP Motorsports, Inc. (14) |
Road & Rail | 16.35% | 8/17/2018 | 1/25/2022 | 192 | 191 | 194 | |||||||||||||||
| Kool Pak, LLC (14) |
Road & Rail | 8.58% | 2/5/2018 | 3/1/2024 | 612 | 612 | 612 | |||||||||||||||
| Lineal Industries, Inc. (10) |
Construction & Engineering | 8.00% | 12/21/2018 | 12/21/2021 | 76 | 76 | 76 | |||||||||||||||
| Loyer Capital LLC (2)(12) |
Multi-Sector Holdings | 8.73-11.52% | 5/16/2019 | 5/16/24-9/25/24 | 14,731 | 14,731 | 14,731 | |||||||||||||||
| Meridian Consulting I Corp, Inc. (10) |
Hotels, Restaurants & Leisure | 10.72% | 7/31/2017 | 12/4/2021 | 1,926 | 1,926 | 1,972 | |||||||||||||||
| Mountain Air Helicopters, Inc. (10) |
Commercial Services & Supplies | 10.00% | 7/31/2017 | 4/30/2022 | 1,509 | 1,509 | 1,528 | |||||||||||||||
| Rango, Inc. (10)(14) |
Commercial Services & Supplies | 9.42%-9.92% | 9/24/2019 | 4/1/2023-11/1/2024 | 6,055 | 6,150 | 6,055 | |||||||||||||||
| Rossco Crane & Rigging, Inc. (14) |
Commercial Services & Supplies | 11.13-11.53% | 8/25/2017 | 4/1/2021-9/1/2022 | 577 | 577 | 584 | |||||||||||||||
| Royal Coach Lines, Inc. |
Road & Rail | 9.56% | 11/21/2019 | 8/1/2025 | 1,240 | 1,240 | 1,240 | |||||||||||||||
| Royal Express Inc. (14) |
Road & Rail | 9.64% | 1/17/2019 | 2/1/2024 | 1,056 | 1,075 | 1,042 | |||||||||||||||
| Sidelines Tree Service LLC (14) |
Diversified Consumer Services | 10.31-10.52% | 7/31/2017 | 8/1/2022-10/1/2022 | 329 | 329 | 331 | |||||||||||||||
| South Texas Oilfield Solutions, LLC (14) |
Energy Equipment & Services | 12.52-13.76% | 3/29/2018 | 9/1/2022-7/1/2023 | 2,753 | 2,753 | 2,754 | |||||||||||||||
| Southern Nevada Oral & Maxillofacial Surgery, LLC (10) |
Health Care Providers & Services | 12.00% | 7/31/2017 | 3/1/2024 | 1,273 | 1,273 | 1,286 | |||||||||||||||
| Southwest Traders, Inc. (14) |
Road & Rail | 9.13% | 11/21/2017 | 11/1/2020 | 70 | 70 | 69 | |||||||||||||||
| Spartan Education, LLC (10) |
Diversified Consumer Services | 10.26-12.00% | 3/28/2019 | 7/31/2020-12/27/2023 | 6,758 | 6,867 | 6,766 | |||||||||||||||
| ST Coaches, LLC (14) |
Road & Rail | 8.21-8.59% | 7/31/2017 | 10/1/2022-1/25/2025 | 4,585 | 4,585 | 4,501 | |||||||||||||||
| Stafford Logistics, Inc. (10) |
Commercial Services & Supplies | 12.63-13.12% | 9/11/2019 | 10/1/2024-10/1/2025 | 7,930 | 7,930 | 7,930 | |||||||||||||||
| Star Coaches Inc. (14) |
Road & Rail | 8.42% | 3/9/2018 | 4/1/2025 | 3,305 | 3,305 | 3,288 | |||||||||||||||
| Sturgeon Services International Inc. (10) |
Energy Equipment & Services | 19.10% | 7/31/2017 | 2/28/2022 | 1,271 | 1,271 | 1,249 | |||||||||||||||
| Sun-Tech Leasing of Texas, L.P. (14) |
Road & Rail | 8.68-16.95% | 7/31/2017 | 6/25/2020-7/25/2021 | 238 | 238 | 236 | |||||||||||||||
| Superior Transportation, Inc. (14) |
Road & Rail | 9.38-12.26% | 7/31/2017 | 4/1/2022-8/1/2024 | 6,492 | 6,471 | 6,471 | |||||||||||||||
| Tailwinds, LLC (10) |
Air Freight & Logistics | 9.00% | 7/26/2019 | 8/1/2024 | 1,153 | 1,153 | 1,153 | |||||||||||||||
| The Smedley Company & Smedley Services, Inc. (10) |
Commercial Services & Supplies | 9.92-14.75% | 7/31/2017 | 10/29/2023-2/10/2024 | 5,011 | 5,030 | 5,070 | |||||||||||||||
| Thora Capital, LLC (10) |
Airlines | 9.00% | 7/3/2019 | 7/1/2025 | 6,209 | 6,209 | 6,209 | |||||||||||||||
| Tornado Bus Company (14) |
Road & Rail | 10.78% | 7/31/2017 | 9/1/2021 | 1,509 | 1,509 | 1,518 | |||||||||||||||
| Trinity Equipment Rentals, Inc. (14) |
Commercial Services & Supplies | 11.24% | 9/13/2018 | 10/1/2022 | 719 | 719 | 726 | |||||||||||||||
| Trolleys, Inc. (14) |
Road & Rail | 9.81% | 7/18/2018 | 8/1/2022 | 2,295 | 2,295 | 2,292 | |||||||||||||||
| Up Trucking Services, LLC (14) |
Road & Rail | 11.21-12.10% | 3/23/2018 | 4/1/2022-8/1/2024 | 2,512 | 2,549 | 2,540 | |||||||||||||||
| Warrior Crane Services, LLC (10) |
Commercial Services & Supplies | 8.95% | 7/11/2019 | 7/11/2024-8/1/2026 | 3,316 | 3,316 | 3,316 | |||||||||||||||
| Wind River Environmental, LLC (10) |
Diversified Consumer Services | 10.00% | 7/31/2019 | 8/1/2024 | 918 | 926 | 918 | |||||||||||||||
| Womble Company, Inc. (10) |
Energy Equipment & Services | 9.11% | 12/27/2019 | 1/1/2025 | 814 | 814 | 814 | |||||||||||||||
| W.P.M., Inc., WPM-Southern, LLC, WPM Construction Services, Inc.(10) |
Construction & Engineering | 7.50% | 7/31/2017 | 10/1/2022 | 1,841 | 1,841 | 1,841 | |||||||||||||||
| Shares/ Units |
||||||||||||||||||||||
| NEF Holdings, LLC Equity Interests (2)(9) |
Multi-Sector Holdings | 7/31/2017 | 200 | 145,000 | 145,000 | |||||||||||||||||
|
|
|
|
|
|||||||||||||||||||
| Total Equipment Financing |
$ | 320,552 | $ | 320,630 | ||||||||||||||||||
|
|
|
|
|
|||||||||||||||||||
| Preferred Equity – 1.2% |
| |||||||||||||||||||||
| SOAGG LLC (2)(3)(4) |
Aerospace & Defense | 8.00% | 12/14/2010 | 6/30/2023 | 1,541 | $ | 1,541 | $ | 4,952 | |||||||||||||
| SOINT, LLC (2)(3)(4) |
Aerospace & Defense | 15.00% | 6/8/2012 | 6/30/2023 | 53,932 | 5,393 | 5,939 | |||||||||||||||
|
|
|
|
|
|||||||||||||||||||
| Total Preferred Equity |
$ | 6,934 | $ | 10,891 | ||||||||||||||||||
|
|
|
|
|
|||||||||||||||||||
See notes to consolidated financial statements.
113
Table of Contents
SOLAR CAPITAL LTD.
CONSOLIDATED SCHEDULE OF INVESTMENTS (continued)
December 31, 2019
(in thousands, except share/unit amounts)
| Description |
Industry |
Acquisition Date |
Shares/ Units |
Cost | Fair Value |
|||||||||||||
| Common Equity/Equity Interests/Warrants—34.3% |
||||||||||||||||||
| aTyr Pharma, Inc. Warrants * |
Pharmaceuticals | 11/18/2016 | 6,347 | $ | 106 | $ | — | |||||||||||
| B Riley Financial Inc. (3)(8) |
Research & Consulting Services | 3/16/2007 | 38,015 | 2,684 | 957 | |||||||||||||
| CardioFocus, Inc. Warrants * |
Health Care Equipment & Supplies | 3/31/2017 | 440,816 | 51 | 34 | |||||||||||||
| Centrexion Therapeutics, Inc. Warrants * |
Pharmaceuticals | 6/28/2019 | 210,256 | 106 | 77 | |||||||||||||
| Conventus Orthopaedics, Inc. Warrants * |
Health Care Equipment & Supplies | 6/15/2016 | 157,500 | 65 | 10 | |||||||||||||
| Crystal Financial LLC (2)(3) |
Diversified Financial Services | 12/28/2012 | 280,303 | 280,737 | 296,000 | |||||||||||||
| Delphinus Medical Technologies, Inc. Warrants * |
Health Care Equipment & Supplies | 8/18/2017 | 380,904 | 74 | 50 | |||||||||||||
| Essence Group Holdings Corporation (Lumeris) Warrants * |
Health Care Technology | 3/22/2017 | 208,000 | 63 | 267 | |||||||||||||
| PQ Bypass, Inc. Warrants * |
Health Care Equipment & Supplies | 12/20/2018 | 300,000 | 106 | 75 | |||||||||||||
| RD Holdco Inc. (Rug Doctor) (2)* |
Diversified Consumer Services | 12/23/2013 | 231,177 | 15,683 | 7,706 | |||||||||||||
| RD Holdco Inc. (Rug Doctor) Class B (2)* |
Diversified Consumer Services | 12/23/2013 | 522 | 5,216 | 5,216 | |||||||||||||
| RD Holdco Inc. (Rug Doctor) Warrants (2)* |
Diversified Consumer Services | 12/23/2013 | 30,370 | 381 | — | |||||||||||||
| Scynexis, Inc. Warrants * |
Pharmaceuticals | 9/30/2016 | 122,435 | 105 | — | |||||||||||||
| Senseonics Holdings, Inc. Warrants * |
Health Care Equipment & Supplies | 7/25/2019 | 526,901 | 117 | 70 | |||||||||||||
| Sunesis Pharmaceuticals, Inc. Warrants * |
Pharmaceuticals | 3/31/2016 | 104,001 | 118 | — | |||||||||||||
| Tetraphase Pharmaceuticals, Inc. Warrants (3)* |
Pharmaceuticals | 10/30/2018 | 14,227 | 269 | — | |||||||||||||
| Venus Concept Ltd. Warrants* (fka Restoration Robotics) |
Health Care Equipment & Supplies | 5/10/2018 | 27,352 | 152 | 7 | |||||||||||||
|
|
|
|
|
|||||||||||||||
| Total Common Equity/Equity Interests/Warrants |
|
$ | 306,033 | $ | 310,469 | |||||||||||||
|
|
|
|
|
|||||||||||||||
| Total Investments (6) — 165.0% |
$ | 1,502,683 | $ | 1,494,824 | ||||||||||||||
|
|
|
|
|
|||||||||||||||
| Description |
Industry |
Acquisition Date |
Maturity Date |
Par Amount | ||||||||||||||||||
| Cash Equivalents — 46.3% |
| |||||||||||||||||||||
| U.S. Treasury Bill |
Government | 12/31/2019 | 1/28/2020 | $ | 420,000 | $ | 419,571 | $ | 419,571 | |||||||||||||
|
|
|
|
|
|||||||||||||||||||
| Total Investments & Cash Equivalents —211.3% |
$ | 1,922,254 | $ | 1,914,395 | ||||||||||||||||||
| Liabilities in Excess of Other Assets — (111.3%) |
(1,008,515 | ) | ||||||||||||||||||||
|
|
|
|||||||||||||||||||||
| Net Assets — 100.0% |
$ | 905,880 | ||||||||||||||||||||
|
|
|
|||||||||||||||||||||
| (1) | Floating rate debt investments typically bear interest at a rate determined by reference to the London Interbank Offered Rate (“LIBOR”), and which typically reset monthly, quarterly or semi-annually. For each debt investment we have provided the current rate of interest, or in the case of leases the current implied yield, in effect as of December 31, 2019. |
114
Table of Contents
SOLAR CAPITAL LTD.
CONSOLIDATED SCHEDULE OF INVESTMENTS (continued)
December 31, 2019
(in thousands)
| (2) | Denotes investments in which we are deemed to exercise a controlling influence over the management or policies of a company, as defined in the Investment Company Act of 1940 (“1940 Act”), due to beneficially owning, either directly or through one or more controlled companies, more than 25% of the outstanding voting securities of the investment. Transactions during the year ended December 31, 2019 in these controlled investments are as follows: |
| Name of Issuer |
Fair Value at December 31, 2018 |
Gross Additions |
Gross Reductions |
Realized Gain (Loss) |
Change in Unrealized Gain (Loss) |
Interest/ Dividend /Other Income |
Fair Value at December 31, 2019 |
|||||||||||||||||||||
| Ark Real Estate Partners LP |
$ | 39 | $ | — | $ | — | $ | (526 | ) | $ | 487 | $ | — | $ | — | |||||||||||||
| Ark Real Estate Partners II LP |
1 | — | — | (135 | ) | 11 | — | — | ||||||||||||||||||||
| AviatorCap SII, LLC |
2,975 | — | 79 | — | — | 274 | 2,896 | |||||||||||||||||||||
| AviatorCap SII, LLC |
— | 2,975 | 262 | — | — | 208 | 2,713 | |||||||||||||||||||||
| Crystal Financial LLC |
293,000 | — | — | — | 3,000 | 30,000 | 296,000 | |||||||||||||||||||||
| Equipment Operating Leases, LLC |
32,882 | — | 3,143 | — | — | 2,550 | 29,739 | |||||||||||||||||||||
| Loyer Capital LLC |
— | 21,634 | 6,903 | — | — | 1,085 | 14,731 | |||||||||||||||||||||
| NEF Holdings, LLC |
145,000 | — | — | — | — | 3,300 | 145,000 | |||||||||||||||||||||
| RD Holdco Inc. (Rug Doctor, common equity) |
7,732 | — | — | — | (26 | ) | — | 7,706 | ||||||||||||||||||||
| RD Holdco Inc. (Rug Doctor, class B) |
5,216 | — | — | — | — | — | 5,216 | |||||||||||||||||||||
| RD Holdco Inc. (Rug Doctor, warrants) |
— | — | — | — | — | — | — | |||||||||||||||||||||
| Rug Doctor LLC |
9,111 | — | — | — | (39 | ) | 1,182 | 9,111 | ||||||||||||||||||||
| SOAGG LLC |
9,113 | — | 951 | — | (3,210 | ) | 5,256 | 4,952 | ||||||||||||||||||||
| SOINT, LLC |
— | 2,144 | 2,188 | — | — | 148 | — | |||||||||||||||||||||
| SOINT, LLC (preferred equity) |
6,414 | — | 444 | — | (31 | ) | 826 | 5,939 | ||||||||||||||||||||
|
|
|
|
|
|
|
|
|
|
|
|
|
|
|
|||||||||||||||
| $ | 511,483 | $ | 26,753 | $ | 13,970 | $ | (661 | ) | $ | 192 | $ | 44,829 | $ | 524,003 | ||||||||||||||
|
|
|
|
|
|
|
|
|
|
|
|
|
|
|
|||||||||||||||
See notes to consolidated financial statements.
115
Table of Contents
SOLAR CAPITAL LTD.
CONSOLIDATED SCHEDULE OF INVESTMENTS (continued)
December 31, 2019
(in thousands)
| (3) | Indicates assets that the Company believes may not represent “qualifying assets” under Section 55(a) of the Investment Company Act of 1940 (“1940 Act”), as amended. If we fail to invest a sufficient portion of our assets in qualifying assets, we could be prevented from making follow-on investments in existing portfolio companies or could be required to dispose of investments at inappropriate times in order to comply with the 1940 Act. As of December 31, 2019, on a fair value basis, non-qualifying assets in the portfolio represented 22.9% of the total assets of the Company. |
| (4) | Solar Capital Ltd.’s investments in SOAGG, LLC and SOINT, LLC include a two and one dollar investment in common shares, respectively. |
| (5) | Bishop Lifting Products, Inc., SEI Holding I Corporation, Singer Equities, Inc. & Hampton Rubber Company are co-borrowers. |
| (6) | Aggregate net unrealized appreciation for U.S. federal income tax purposes is $8,172; aggregate gross unrealized appreciation and depreciation for U.S. federal tax purposes is $45,038 and $36,866, respectively, based on a tax cost of $1,486,652. Unless otherwise noted, all of the Company’s investments are pledged as collateral against the borrowings outstanding on the senior secured credit facility. The Company generally acquires its investments in private transactions exempt from registration under the Securities Act of 1933, as amended (the “Securities Act”). These investments are generally subject to certain limitations on resale, and may be deemed to be “restricted securities” under the Securities Act. All investments are Level 3 unless otherwise indicated. |
| (7) | Floating rate instruments accrue interest at a predetermined spread relative to an index, typically the LIBOR or PRIME rate. These instruments are often subject to a LIBOR or PRIME rate floor. |
| (8) | Denotes a Level 1 investment. |
| (9) | NEF Holdings, LLC is held through NEFCORP LLC, a wholly-owned consolidated taxable subsidiary and NEFPASS LLC, a wholly-owned consolidated subsidiary. |
| (10) | Indicates an investment that is wholly held by Solar Capital Ltd. through NEFPASS LLC. |
| (11) | Hawkeye Contracting Company, LLC, Eagle Creek Mining, LLC & Falcon Ridge Leasing, LLC are co-borrowers. |
| (12) | Denotes a subsidiary of NEF Holdings, LLC. |
| (13) | OmniGuide Holdings, Inc., Domain Surgical, Inc. and OmniGuide, Inc. are co-borrowers. |
| (14) | Indicates an investment that is held by the Company through its wholly-owned consolidated financing subsidiary NEFPASS SPV, LLC (the “NEFPASS SPV”). Such investments are pledged as collateral under the NEFPASS SPV, LLC Revolving Credit Facility (see Note 7 to the consolidated financial statements) and are not generally available to creditors, if any, of the Company. |
| (15) | Spread is 6.00% Cash / 0.75% PIK. |
| (16) | Kindred Biosciences, Inc., KindredBio Equine, Inc. and Centaur Biopharmaceutical Services, Inc. are co-borrowers. |
| * | Non-income producing security. |
| ** | Investment is on non-accrual status. |
See notes to consolidated financial statements.
116
Table of Contents
SOLAR CAPITAL LTD.
CONSOLIDATED SCHEDULE OF INVESTMENTS (continued)
December 31, 2019
(in thousands)
| Industry Classification |
Percentage of Total Investments (at fair value) as of December 31, 2019 |
|||
| Diversified Financial Services (includes Crystal Financial LLC) |
20.1 | % | ||
| Multi-Sector Holdings (includes NEF Holdings, LLC, Equipment Operating Leases, LLC and Loyer Capital LLC) |
17.3 | % | ||
| Health Care Providers & Services |
13.1 | % | ||
| Pharmaceuticals |
8.6 | % | ||
| Health Care Equipment & Supplies |
7.3 | % | ||
| Software |
4.1 | % | ||
| Commercial Services & Supplies |
2.8 | % | ||
| Media |
2.7 | % | ||
| Wireless Telecommunication Services |
2.5 | % | ||
| Chemicals |
2.5 | % | ||
| Road & Rail |
2.4 | % | ||
| Communications Equipment |
2.4 | % | ||
| Diversified Consumer Services |
2.0 | % | ||
| Specialty Retail |
1.9 | % | ||
| Household & Personal Products |
1.9 | % | ||
| Trading Companies & Distributors |
1.7 | % | ||
| Capital Markets |
1.4 | % | ||
| Thrifts & Mortgage Finance |
1.3 | % | ||
| Aerospace & Defense |
1.1 | % | ||
| Airlines |
0.8 | % | ||
| Machinery |
0.7 | % | ||
| Oil, Gas & Consumable Fuels |
0.4 | % | ||
| Construction & Engineering |
0.4 | % | ||
| Energy Equipment & Services. |
0.3 | % | ||
| Hotels, Restaurants & Leisure. |
0.1 | % | ||
| Air Freight & Logistics |
0.1 | % | ||
| Research & Consulting Services |
0.1 | % | ||
| Health Care Technology |
0.0 | % | ||
|
|
|
|||
| Total Investments |
100.0 | % | ||
|
|
|
|||
See notes to consolidated financial statements.
117
Table of Contents
SOLAR CAPITAL LTD.
NOTES TO CONSOLIDATED FINANCIAL STATEMENTS
December 31, 2020
(in thousands, except share amounts)
Note 1. Organization
Solar Capital LLC, a Maryland limited liability company, was formed in February 2007 and commenced operations on March 13, 2007 with initial capital of $1,200,000 of which 47.04% was funded by affiliated parties.
Immediately prior to our initial public offering, through a series of transactions, Solar Capital Ltd. merged with Solar Capital LLC, leaving Solar Capital Ltd. as the surviving entity (the “Merger”). Solar Capital Ltd. issued an aggregate of approximately 26.65 million shares of common stock and $125,000 in senior unsecured notes to the existing Solar Capital LLC unit holders in connection with the Merger. Solar Capital Ltd. had no assets or operations prior to completion of the Merger and as a result, the historical books and records of Solar Capital LLC have become the books and records of the surviving entity. The number of shares used to calculate weighted average shares for use in computations on a per share basis have been decreased retroactively by a factor of approximately 0.4022 for all periods prior to February 9, 2010. This factor represents the effective impact of the reduction in shares resulting from the Merger.
Solar Capital Ltd. (“Solar Capital”, the “Company”, “we”, “us” or “our”), a Maryland corporation formed in November 2007, is a closed-end, externally managed, non-diversified management investment company that has elected to be regulated as a business development company (“BDC”) under the Investment Company Act of 1940, as amended (the “1940 Act”). Furthermore, as the Company is an investment company, it continues to apply the guidance in FASB Accounting Standards Codification (“ASC”) Topic 946. In addition, for U.S. federal income tax purposes, the Company has elected to be treated, and intends to qualify annually, as a regulated investment company (“RIC”) under Subchapter M of the Internal Revenue Code of 1986, as amended (the “Code”).
On February 9, 2010, Solar Capital priced its initial public offering, selling 5.68 million shares of common stock, including the underwriters’ over-allotment, at a price of $18.50 per share. Concurrent with this offering, the Company’s senior management purchased an additional 600,000 shares through a private placement, also at $18.50 per share.
The Company’s investment objective is to maximize both current income and capital appreciation through debt and equity investments. The Company directly and indirectly invests primarily in leveraged middle market companies in the form of senior secured loans, stretch-senior loans, financing leases and to a lesser extent, unsecured loans and equity securities. From time to time, we may also invest in public companies that are thinly traded.
Note 2. Significant Accounting Policies
The accompanying consolidated financial statements have been prepared on the accrual basis of accounting in conformity with U.S. generally accepted accounting principles (“GAAP”), and include the accounts of the Company and certain wholly-owned subsidiaries. The consolidated financial statements reflect all adjustments and reclassifications which, in the opinion of management, are necessary for the fair presentation of the results of the operations and financial condition for the periods presented. All significant intercompany balances and transactions have been eliminated. Certain prior period amounts may have been reclassified to conform to the current period presentation.
The preparation of consolidated financial statements in conformity with GAAP and pursuant to the requirements for reporting on Form 10-K and Regulation S-X, as appropriate, also requires management to make estimates and assumptions that affect the reported amount of assets and liabilities at the date of the financial
118
Table of Contents
SOLAR CAPITAL LTD.
NOTES TO CONSOLIDATED FINANCIAL STATEMENTS (continued)
December 31, 2020
(in thousands, except share amounts)
statements and the reported amounts of income and expenses during the reported periods. Changes in the economic environment, financial markets and any other parameters used in determining these estimates could cause actual results to differ materially.
In the opinion of management, all adjustments, which are of a normal recurring nature, considered necessary for the fair presentation of financial statements have been included.
The significant accounting policies consistently followed by the Company are:
| (a) | Investment transactions are accounted for on the trade date; |
| (b) | Under procedures established by our board of directors (the “Board”), we value investments, including certain senior secured debt, subordinated debt and other debt securities with maturities greater than 60 days, for which market quotations are readily available, at such market quotations (unless they are deemed not to represent fair value). We attempt to obtain market quotations from at least two brokers or dealers (if available, otherwise from a principal market maker or a primary market dealer or other independent pricing service). We utilize mid-market pricing as a practical expedient for fair value unless a different point within the range is more representative. If and when market quotations are deemed not to represent fair value, we may utilize independent third-party valuation firms to assist us in determining the fair value of material assets. Accordingly, such investments go through our multi-step valuation process as described below. In each such case, independent valuation firms consider observable market inputs together with significant unobservable inputs in arriving at their valuation recommendations. Debt investments with maturities of 60 days or less shall each be valued at cost plus accreted discount, or minus amortized premium, which is expected to approximate fair value, unless such valuation, in the judgment of Solar Capital Partners, LLC (the “Investment Adviser”), does not represent fair value, in which case such investments shall be valued at fair value as determined in good faith by or under the direction of our Board. Investments that are not publicly traded or whose market quotations are not readily available are valued at fair value as determined in good faith by or under the direction of our Board. Such determination of fair values involves subjective judgments and estimates. |
With respect to investments for which market quotations are not readily available or when such market quotations are deemed not to represent fair value, our Board has approved a multi-step valuation process each quarter, as described below:
| (1) | our quarterly valuation process begins with each portfolio company or investment being initially valued by the investment professionals of the Investment Adviser responsible for the portfolio investment; |
| (2) | preliminary valuation conclusions are then documented and discussed with senior management of the Investment Adviser; |
| (3) | independent valuation firms engaged by our Board conduct independent appraisals and review the Investment Adviser’s preliminary valuations and make their own independent assessment for all material assets; |
| (4) | the audit committee of the Board reviews the preliminary valuation of the Investment Adviser and that of the independent valuation firm and responds to the valuation recommendation of the independent valuation firm, if any, to reflect any comments; and |
| (5) | the Board discusses valuations and determines the fair value of each investment in our portfolio in good faith based on the input of the Investment Adviser, the respective independent valuation firm, if any, and the audit committee. |
119
Table of Contents
SOLAR CAPITAL LTD.
NOTES TO CONSOLIDATED FINANCIAL STATEMENTS (continued)
December 31, 2020
(in thousands, except share amounts)
Investments in all asset classes are valued utilizing a market approach, an income approach, or both approaches, as appropriate. However, in accordance with ASC 820-10, certain investments that qualify as investment companies in accordance with ASC 946, may be valued using net asset value as a practical expedient for fair value. The market approach uses prices and other relevant information generated by market transactions involving identical or comparable assets or liabilities (including a business). The income approach uses valuation approaches to convert future amounts (for example, cash flows or earnings) to a single present amount (discounted). The measurement is based on the value indicated by current market expectations about those future amounts. In following these approaches, the types of factors that we may take into account in fair value pricing our investments include, as relevant: available current market data, including relevant and applicable market trading and transaction comparables, applicable market yields and multiples, security covenants, call protection provisions, the nature and realizable value of any collateral, the portfolio company’s ability to make payments, its earnings and discounted cash flows, the markets in which the portfolio company does business, comparisons of financial ratios of peer companies that are public, M&A comparables, our principal market (as the reporting entity) and enterprise values, among other factors. When available, broker quotations and/or quotations provided by pricing services are considered as an input in the valuation process. For the fiscal year ended December 31, 2020, there has been no change to the Company’s valuation approaches or techniques and the nature of the related inputs considered in the valuation process.
ASC Topic 820 classifies the inputs used to measure these fair values into the following hierarchy:
Level 1: Quoted prices in active markets for identical assets or liabilities, accessible by the Company at the measurement date.
Level 2: Quoted prices for similar assets or liabilities in active markets, or quoted prices for identical or similar assets or liabilities in markets that are not active, or other observable inputs other than quoted prices.
Level 3: Unobservable inputs for the asset or liability.
In all cases, the level in the fair value hierarchy within which the fair value measurement in its entirety falls is determined based on the lowest level of input that is significant to the fair value measurement. Our assessment of the significance of a particular input to the fair value measurement in its entirety requires judgment and considers factors specific to each investment. The exercise of judgment is based in part on our knowledge of the asset class and our prior experience.
| (c) | Gains or losses on investments are calculated by using the specific identification method. |
| (d) | The Company records dividend income and interest, adjusted for amortization of premium and accretion of discount, on an accrual basis. Loan origination fees, original issue discount, and market discounts are capitalized and we amortize such amounts into income using the effective interest method. Upon the prepayment of a loan, any unamortized loan origination fees are recorded as interest income. We record call premiums received on loans repaid as interest income when we receive such amounts. Capital structuring fees, amendment fees, consent fees, and any other non-recurring fee income as well as management fee and other fee income for services rendered, if any, are recorded as other income when earned. |
| (e) | The Company intends to comply with the applicable provisions of the Code pertaining to regulated investment companies to make distributions of taxable income sufficient to relieve it of substantially all |
120
Table of Contents
SOLAR CAPITAL LTD.
NOTES TO CONSOLIDATED FINANCIAL STATEMENTS (continued)
December 31, 2020
(in thousands, except share amounts)
| U.S. federal income taxes. The Company, at its discretion, may carry forward taxable income in excess of calendar year distributions and pay a 4% excise tax on this income. The Company will accrue excise tax on such estimated excess taxable income as appropriate. |
| (f) | Book and tax basis differences relating to stockholder distributions and other permanent book and tax differences are typically reclassified among the Company’s capital accounts. In addition, the character of income and gains to be distributed is determined in accordance with income tax regulations that may differ from GAAP; accordingly at December 31, 2020, $5,798 was reclassified on our balance sheet between accumulated distributable net loss and paid-in capital in excess of par. Total earnings and net asset value are not affected. |
| (g) | Distributions to common stockholders are recorded as of the record date. The amount to be paid out as a distribution is determined by the Board. Net realized capital gains, if any, are generally distributed or deemed distributed at least annually. |
| (h) | In accordance with Regulation S-X and ASC Topic 810—Consolidation, the Company consolidates its interest in controlled investment company subsidiaries, financing subsidiaries and certain wholly-owned holding companies that serve to facilitate investment in portfolio companies. In addition, the Company may also consolidate any controlled operating companies substantially all of whose business consists of providing services to the Company. |
| (i) | The accounting records of the Company are maintained in U.S. dollars. Any assets and liabilities denominated in foreign currencies are translated into U.S. dollars based on the rate of exchange of such currencies against U.S. dollars on the date of valuation. The Company will not isolate that portion of the results of operations resulting from changes in foreign exchange rates on investments from the fluctuations arising from changes in market prices of securities held. Such fluctuations would be included with the net unrealized gain or loss from investments. The Company’s investments in foreign securities, if any, may involve certain risks, including without limitation: foreign exchange restrictions, expropriation, taxation or other political, social or economic risks, all of which could affect the market and/or credit risk of the investment. In addition, changes in the relationship of foreign currencies to the U.S. dollar can significantly affect the value of these investments in terms of U.S. dollars and therefore the earnings of the Company. |
| (j) | The Company has made elections to apply the fair value option of accounting to the unsecured senior notes due 2022 (the “2022 Unsecured Notes”) (see notes 6 and 7), in accordance with ASC 825-10. |
| (k) | In accordance with ASC 835-30, the Company reports origination and other expenses related to certain debt issuances as a direct deduction from the carrying amount of the debt liability. Applicable expenses are deferred and amortized using either the effective interest method or the straight-line method over the stated life. The straight-line method may be used on revolving facilities and/or when it approximates the effective yield method. |
| (l) | The Company may enter into forward exchange contracts in order to hedge against foreign currency risk. These contracts are marked-to-market by recognizing the difference between the contract exchange rate and the current market rate as unrealized appreciation or depreciation. Realized gains or losses are recognized when contracts are settled. |
| (m) | The Company records expenses related to shelf registration statements and applicable equity offering costs as prepaid assets. These expenses are typically charged as a reduction of capital upon utilization or expensed, in accordance with ASC 946-20-25. |
121
Table of Contents
SOLAR CAPITAL LTD.
NOTES TO CONSOLIDATED FINANCIAL STATEMENTS (continued)
December 31, 2020
(in thousands, except share amounts)
| (n) | Investments that are expected to pay regularly scheduled interest in cash are generally placed on non-accrual status when principal or interest cash payments are past due 30 days or more (90 days or more for equipment financing) and/or when it is no longer probable that principal or interest cash payments will be collected. Such non-accrual investments are restored to accrual status if past due principal and interest are paid in cash, and in management’s judgment, are likely to continue timely payment of their remaining principal and interest obligations. Cash interest payments received on such investments may be recognized as income or applied to principal depending on management’s judgment. |
| (o) | The Company defines cash equivalents as securities that are readily convertible into known amounts of cash and so near their maturity that they present insignificant risk of changes in value because of changes in interest rates. Generally, only securities with a maturity of three months or less would qualify, with limited exceptions. The Company believes that certain U.S. Treasury bills, repurchase agreements and other high-quality, short-term debt securities would qualify as cash equivalents. |
Recent Accounting Pronouncements
In March 2020, the FASB issued Accounting Standards Update No. 2020-04, “Reference Rate Reform (Topic 848): Facilitation of the Effects of Reference Rate Reform on Financial Reporting.” The guidance provides optional expedients and exceptions for applying GAAP to contract modifications, hedging relationships and other transactions, subject to meeting certain criteria, that reference LIBOR or another reference rate expected to be discontinued because of the reference rate reform. ASU 2020-04 is effective for all entities as of March 12, 2020 through December 31, 2022. The Company is evaluating the potential impact that the adoption of this guidance will have on the Company’s financial statements.
Note 3. Agreements
Solar Capital has an investment advisory and management agreement (the “Advisory Agreement”) with the Investment Adviser, under which the Investment Adviser will manage the day-to-day operations of, and provide investment advisory services to, Solar Capital. For providing these services, the Investment Adviser receives a fee from Solar Capital, consisting of two components—a base management fee and a performance-based incentive fee. The base management fee is determined by taking the average value of Solar Capital’s gross assets at the end of the two most recently completed calendar quarters calculated at an annual rate of 1.75% on gross assets up to 200% of the Company’s total net assets as of the immediately preceding quarter end and 1.00% on gross assets that exceed 200% of the Company’s total net assets as of the immediately preceding quarter end. For purposes of computing the base management fee, gross assets exclude temporary assets acquired at the end of each fiscal quarter for purposes of preserving investment flexibility in the next fiscal quarter. Temporary assets include, but are not limited to, U.S. treasury bills, other short-term U.S. government or government agency securities, repurchase agreements or cash borrowings.
The performance-based incentive fee has two parts, as follows: one part is calculated and payable quarterly in arrears based on Solar Capital’s pre-incentive fee net investment income for the immediately preceding calendar quarter. For this purpose, pre-incentive fee net investment income means interest income, dividend income and any other income (including any other fees (other than fees for providing managerial assistance), such as commitment, origination, structuring, diligence and consulting fees or other fees that we receive from portfolio companies) accrued during the calendar quarter, minus Solar Capital’s operating expenses for the quarter (including the base management fee, any expenses payable under the Administration Agreement, and any interest expense and distributions paid on any issued and outstanding preferred stock, but excluding the
122
Table of Contents
SOLAR CAPITAL LTD.
NOTES TO CONSOLIDATED FINANCIAL STATEMENTS (continued)
December 31, 2020
(in thousands, except share amounts)
performance-based incentive fee). Pre-incentive fee net investment income does not include any realized capital gains or losses, or unrealized capital appreciation or depreciation. Pre-incentive fee net investment income, expressed as a rate of return on the value of Solar Capital’s net assets at the end of the immediately preceding calendar quarter, is compared to the hurdle rate of 1.75% per quarter (7% annualized). Solar Capital pays the Investment Adviser a performance-based incentive fee with respect to Solar Capital’s pre-incentive fee net investment income in each calendar quarter as follows: (1) no performance-based incentive fee in any calendar quarter in which Solar Capital’s pre-incentive fee net investment income does not exceed the hurdle rate; (2) 100% of Solar Capital’s pre-incentive fee net investment income with respect to that portion of such pre-incentive fee net investment income, if any, that exceeds the hurdle rate but is less than 2.1875% in any calendar quarter; and (3) 20% of the amount of Solar Capital’s pre-incentive fee net investment income, if any, that exceeds 2.1875% in any calendar quarter. These calculations are appropriately pro-rated for any period of less than three months.
The second part of the performance-based incentive fee is determined and payable in arrears as of the end of each calendar year (or upon termination of the Advisory Agreement, as of the termination date), and will equal 20% of Solar Capital’s cumulative realized capital gains less cumulative realized capital losses, unrealized capital depreciation (unrealized depreciation on a gross investment-by-investment basis at the end of each calendar year) and all net capital gains upon which prior performance-based capital gains incentive fee payments were previously made to the Investment Adviser. For financial statement purposes, the second part of the performance-based incentive fee is accrued based upon 20% of cumulative net realized gains and net unrealized capital appreciation. No accrual was required for the fiscal years ended December 31, 2020, 2019 and 2018.
For the fiscal years ended December 31, 2020, 2019 and 2018, the Company recognized $24,951, $26,774 and $25,789, respectively, in base management fees and $2,272, $18,111 and $18,722, respectively, in performance-based incentive fees.
Solar Capital has also entered into an Administration Agreement with Solar Capital Management, LLC (the “Administrator”) under which the Administrator provides administrative services to Solar Capital. For providing these services, facilities and personnel, Solar Capital reimburses the Administrator for Solar Capital’s allocable portion of overhead and other expenses incurred by the Administrator in performing its obligations under the Administration Agreement, including rent. The Administrator will also provide, on Solar Capital’s behalf, managerial assistance to those portfolio companies to which Solar Capital is required to provide such assistance. The Company typically reimburses the Administrator on a quarterly basis.
For the fiscal years ended December 31, 2020, 2019 and 2018, the Company recognized expenses under the Administration Agreement of $5,215, $5,265 and $5,247, respectively. No managerial assistance fees were accrued or collected for the fiscal years ended December 31, 2020, 2019 and 2018.
Note 4. Net Asset Value Per Share
At December 31, 2020, the Company’s total net assets and net asset value per share were $852,023 and $20.16, respectively. This compares to total net assets and net asset value per share at December 31, 2019 of $905,880 and $21.44, respectively.
123
Table of Contents
SOLAR CAPITAL LTD.
NOTES TO CONSOLIDATED FINANCIAL STATEMENTS (continued)
December 31, 2020
(in thousands, except share amounts)
Note 5. Earnings Per Share
The following table sets forth the computation of basic and diluted net increase in net assets per share resulting from operations, pursuant to ASC 260-10, for the years ended December 31, 2020, 2019 and 2018:
| Year ended December 31, 2020 |
Year ended December 31, 2019 |
Year ended December 31, 2018 |
||||||||||
| Earnings per share (basic & diluted) Numerator - net increase in net assets resulting from operations: |
$ | 15,451 | $ | 56,016 | $ | 66,874 | ||||||
| Denominator - weighted average shares: |
42,260,826 | 42,260,826 | 42,260,826 | |||||||||
| Earnings per share: |
$ | 0.37 | $ | 1.33 | $ | 1.58 | ||||||
Note 6. Fair Value
Fair value is defined as the price that would be received to sell an asset or paid to transfer a liability in an orderly transaction between market participants at the measurement date. GAAP establishes a framework for measuring fair value that includes a hierarchy used to classify the inputs used in measuring fair value. The hierarchy prioritizes the inputs to valuations used to measure fair value into three levels. The level in the fair value hierarchy within which the fair value measurement falls is determined based on the lowest level input that is significant to the fair value measurement. The levels of the fair value hierarchy are as follows:
Level 1. Financial assets and liabilities whose values are based on unadjusted quoted prices for identical assets or liabilities in an active market that the Company has the ability to access.
Level 2. Financial assets and liabilities whose values are based on quoted prices in markets that are not active or model inputs that are observable either directly or indirectly for substantially the full term of the asset or liability. Level 2 inputs include the following:
| a) | Quoted prices for similar assets or liabilities in active markets; |
| b) | Quoted prices for identical or similar assets or liabilities in non-active markets; |
| c) | Pricing models whose inputs are observable for substantially the full term of the asset or liability; and |
| d) | Pricing models whose inputs are derived principally from or corroborated by observable market data through correlation or other means for substantially the full term of the asset or liability. |
Level 3. Financial assets and liabilities whose values are based on prices or valuation techniques that require inputs that are both unobservable and significant to the overall fair value measurement. These inputs reflect management’s and, if applicable, an independent third-party valuation firm’s own assumptions about the assumptions a market participant would use in pricing the asset or liability.
When the inputs used to measure fair value fall within different levels of the hierarchy, the level within which the fair value measurement is categorized is based on the lowest level input that is significant to the fair value measurement in its entirety. For example, a Level 3 fair value measurement may include inputs that are observable (Levels 1 and 2) and unobservable (Level 3).
124
Table of Contents
SOLAR CAPITAL LTD.
NOTES TO CONSOLIDATED FINANCIAL STATEMENTS (continued)
December 31, 2020
(in thousands, except share amounts)
Gains and losses for assets and liabilities categorized within the Level 3 table below may include changes in fair value that are attributable to both observable inputs (Levels 1 and 2) and unobservable inputs (Level 3).
A review of fair value hierarchy classifications is conducted on a quarterly basis. Changes in the observability of valuation inputs may result in a reclassification for certain financial assets or liabilities. Such reclassifications involving Level 3 assets and liabilities are reported as transfers in/out of Level 3 as of the end of the quarter in which the reclassifications occur. Within the fair value hierarchy tables below, cash and cash equivalents are excluded but could be classified as Level 1.
The following tables present the balances of assets and liabilities measured at fair value on a recurring basis, as of December 31, 2019 and 2018:
Fair Value Measurements
As of December 31, 2020
| Level 1 | Level 2 | Level 3 | Total | |||||||||||||
| Assets: |
||||||||||||||||
| Senior Secured Loans |
$ | — | $ | — | $ | 798,052 | $ | 798,052 | ||||||||
| Equipment Financing |
— | — | 284,846 | 284,846 | ||||||||||||
| Preferred Equity |
— | — | 6,401 | 6,401 | ||||||||||||
| Common Equity/Equity Interests/Warrants |
1,681 | — | 440,971 | 442,652 | ||||||||||||
|
|
|
|
|
|
|
|
|
|||||||||
| Total Investments |
$ | 1,681 | $ | — | $ | 1,530,270 | $ | 1,531,951 | ||||||||
|
|
|
|
|
|
|
|
|
|||||||||
| Liabilities: |
||||||||||||||||
| 2022 Unsecured Notes |
$ | — | $ | — | $ | 150,000 | $ | 150,000 | ||||||||
|
|
|
|
|
|
|
|
|
|||||||||
Fair Value Measurements
As of December 31, 2019
| Level 1 | Level 2 | Level 3 | Total | |||||||||||||
| Assets: |
||||||||||||||||
| Senior Secured Loans |
$ | — | $ | — | $ | 852,834 | $ | 852,834 | ||||||||
| Equipment Financing |
— | — | 320,630 | 320,630 | ||||||||||||
| Preferred Equity |
— | — | 10,891 | 10,891 | ||||||||||||
| Common Equity/Equity Interests/Warrants |
957 | — | 309,512 | 310,469 | ||||||||||||
|
|
|
|
|
|
|
|
|
|||||||||
| Total Investments |
$ | 957 | $ | — | $ | 1,493,867 | $ | 1,494,824 | ||||||||
|
|
|
|
|
|
|
|
|
|||||||||
| Liabilities: |
||||||||||||||||
| 2022 Unsecured Notes |
$ | — | $ | — | $ | 150,000 | $ | 150,000 | ||||||||
|
|
|
|
|
|
|
|
|
|||||||||
125
Table of Contents
SOLAR CAPITAL LTD.
NOTES TO CONSOLIDATED FINANCIAL STATEMENTS (continued)
December 31, 2020
(in thousands, except share amounts)
The following table provides a summary of the changes in fair value of Level 3 assets for the year ended December 31, 2020, as well as the portion of gains or losses included in income attributable to unrealized gains or losses related to those assets still held at December 31, 2020:
Fair Value Measurements Using Level 3 Inputs
| Senior Secured Loans |
Equipment Financing |
Preferred Equity | Common Equity/ Equity Interests/ Warrants |
Total | ||||||||||||||||
| Fair value, December 31, 2019 |
$ | 852,834 | $ | 320,630 | $ | 10,891 | $ | 309,512 | $ | 1,493,867 | ||||||||||
| Total gains or losses included in earnings: |
||||||||||||||||||||
| Net realized loss |
(24,570 | ) | (123 | ) | — | (269 | ) | (24,962 | ) | |||||||||||
| Net change in unrealized gain (loss) |
10,426 | (20,043 | ) | (3,334 | ) | (4,898 | ) | (17,849 | ) | |||||||||||
| Purchase of investment securities |
264,939 | 37,977 | 320 | 136,626 | 439,862 | |||||||||||||||
| Proceeds from dispositions of investment securities. |
(305,577 | ) | (53,595 | ) | (1,476 | ) | — | (360,648 | ) | |||||||||||
| Transfers in/out of Level 3 |
— | — | — | — | — | |||||||||||||||
|
|
|
|
|
|
|
|
|
|
|
|||||||||||
| Fair value, December 31, 2020 |
$ | 798,052 | $ | 284,846 | $ | 6,401 | $ | 440,971 | $ | 1,530,270 | ||||||||||
|
|
|
|
|
|
|
|
|
|
|
|||||||||||
| Unrealized gains (losses) for the period relating to those Level 3 assets that were still held by the Company at the end of the period: |
||||||||||||||||||||
| Net change in unrealized loss |
$ | (5,084 | ) | $ | (20,043 | ) | $ | (3,334 | ) | $ | (4,898 | ) | $ | (33,359 | ) | |||||
|
|
|
|
|
|
|
|
|
|
|
|||||||||||
The following table shows a reconciliation of the beginning and ending balances for fair valued liabilities measured using significant unobservable inputs (Level 3) for the year ended December 31, 2020:
| 2022 Unsecured Notes |
For the year ended December 31, 2020 |
|||
| Beginning fair value |
$ | 150,000 | ||
| Net realized (gain) loss |
— | |||
| Net change in unrealized (gain) loss |
— | |||
| Borrowings |
— | |||
| Repayments |
— | |||
| Transfers in/out of Level 3 |
— | |||
|
|
|
|||
| Ending fair value |
$ | 150,000 | ||
|
|
|
|||
The Company made elections to apply the fair value option of accounting to the 2022 Unsecured Notes, in accordance with ASC 825-10. On December 31, 2020, there were borrowings of $150,000 on the 2022 Unsecured Notes.
126
Table of Contents
SOLAR CAPITAL LTD.
NOTES TO CONSOLIDATED FINANCIAL STATEMENTS (continued)
December 31, 2020
(in thousands, except share amounts)
The following table provides a summary of the changes in fair value of Level 3 assets and liabilities for the year ended December 31, 2019, as well as the portion of gains or losses included in income attributable to unrealized gains or losses related to those assets and liabilities still held at December 31, 2019:
Fair Value Measurements Using Level 3 Inputs
| Senior Secured Loans |
Equipment Financing |
Preferred Equity | Common Equity/ Equity Interests/ Warrants |
Total | ||||||||||||||||
| Fair value, December 31, 2018 |
$ | 818,861 | $ | 314,226 | $ | 15,527 | $ | 306,926 | $ | 1,455,540 | ||||||||||
| Total gains or losses included in earnings: |
||||||||||||||||||||
| Net realized gain (loss) |
391 | 162 | — | (108 | ) | 445 | ||||||||||||||
| Net change in unrealized gain (loss) |
(14,296 | ) | (576 | ) | (3,242 | ) | 3,028 | (15,086 | ) | |||||||||||
| Purchase of investment securities |
322,882 | 90,330 | — | 426 | 413,638 | |||||||||||||||
| Proceeds from dispositions of investment securities. |
(275,004 | ) | (83,512 | ) | (1,394 | ) | (760 | ) | (360,670 | ) | ||||||||||
| Transfers in/out of Level 3 |
— | — | — | — | — | |||||||||||||||
|
|
|
|
|
|
|
|
|
|
|
|||||||||||
| Fair value, December 31, 2019 |
$ | 852,834 | $ | 320,630 | $ | 10,891 | $ | 309,512 | $ | 1,493,867 | ||||||||||
|
|
|
|
|
|
|
|
|
|
|
|||||||||||
| Unrealized gains (losses) for the period relating to those Level 3 assets that were still held by the Company at the end of the period: |
||||||||||||||||||||
| Net change in unrealized gain (loss) |
$ | (14,064 | ) | $ | (576 | ) | $ | (3,242 | ) | $ | 2,519 | $ | (15,363 | ) | ||||||
|
|
|
|
|
|
|
|
|
|
|
|||||||||||
The following table shows a reconciliation of the beginning and ending balances for fair valued liabilities measured using significant unobservable inputs (Level 3) for the year ended December 31, 2019:
| Credit Facility, 2022 Unsecured Notes and SSLP Facility |
For the year ended December 31, 2019 |
|||
| Beginning fair value |
$ | 350,185 | ||
| Net realized (gain) loss |
— | |||
| Net change in unrealized (gain) loss |
— | |||
| Borrowings |
529,600 | |||
| Repayments |
(626,600 | ) | ||
| Transfers into Level 3 |
— | |||
| Transfers out of Level 3 |
(103,185 | ) | ||
|
|
|
|||
| Ending fair value |
$ | 150,000 | ||
|
|
|
|||
The Company made elections to apply the fair value option of accounting to the 2022 Unsecured Notes, in accordance with ASC 825-10. On December 31, 2019, there were borrowings of $150,000 on the 2022 Unsecured Notes.
127
Table of Contents
SOLAR CAPITAL LTD.
NOTES TO CONSOLIDATED FINANCIAL STATEMENTS (continued)
December 31, 2020
(in thousands, except share amounts)
The Company did not elect to apply the fair value option of accounting to the SSLP Facility, which was refinanced by way of amendment on May 31, 2019. As this refinancing was deemed to be a significant modification of debt, per ASC 825-10-25, a new election was triggered. As such the SSLP Facility is shown as a transfer out of Level 3.
Quantitative Information about Level 3 Fair Value Measurements
The Company typically determines the fair value of its performing debt investments utilizing a yield analysis. In a yield analysis, a price is ascribed for each investment based upon an assessment of current and expected market yields for similar investments and risk profiles. Additional consideration is given to current contractual interest rates, relative maturities and other key terms and risks associated with an investment. Among other factors, a significant determinant of risk is the amount of leverage used by the portfolio company relative to the total enterprise value of the company, and the rights and remedies of our investment within each portfolio company.
Significant unobservable quantitative inputs typically used in the fair value measurement of the Company’s Level 3 assets and liabilities primarily reflect current market yields, including indices, and readily available quotes from brokers, dealers, and pricing services as indicated by comparable assets and liabilities, as well as enterprise values, returns on equity and earnings before income taxes, depreciation and amortization (“EBITDA”) multiples of similar companies, and comparable market transactions for equity securities.
Quantitative information about the Company’s Level 3 asset and liability fair value measurements as of December 31, 2020 is summarized in the table below:
| Asset or Liability |
Fair Value at December 31, 2020 |
Principal Valuation Technique/ Methodology |
Unobservable Input |
Range (Weighted Average) | ||||||||
| Senior Secured Loans |
Asset | $ | 798,052 | Income Approach | Market Yield | 5.8% – 16.4% (8.9%) | ||||||
| Equipment Financing |
Asset | $ | 155,744 | Income Approach | Market Yield | 6.6% – 20.3% (10.3%) | ||||||
| $ | 129,102 | Market Approach | Return on Equity |
10.9% – 10.9% (10.9%) | ||||||||
| Preferred Equity |
Asset | $ | 6,401 | Income Approach | Market Yield | 3.3% – 8.0% (5.0%) | ||||||
| Common Equity/Equity Interests/Warrants |
Asset | $ | 144,205 | Market Multiple(1) | Comparable Multiple |
5.8x – 6.3x (6.3x) | ||||||
| $ | 296,766 | Market Approach | Return on Equity |
(10.3%) – 13.7% (0.5%) | ||||||||
| 2022 Unsecured Notes |
Liability | $ | 150,000 | Income Approach | Market Yield | 1.5% – 4.6% (4.5%) | ||||||
| (1) | Includes $675 of investments valued using a weighted valuation approach, $492 of investments valued using a Black-Scholes model, $6,442 of investments valued using an EBITDA multiple and $136,596 of investments which, due to the proximity of the transaction relative to the measurement date, were valued using the cost of the investments. |
128
Table of Contents
SOLAR CAPITAL LTD.
NOTES TO CONSOLIDATED FINANCIAL STATEMENTS (continued)
December 31, 2020
(in thousands, except share amounts)
Quantitative information about the Company’s Level 3 asset and liability fair value measurements as of December 31, 2019 is summarized in the table below:
| Asset or Liability |
Fair Value at December 31, 2019 |
Principal Valuation Technique/ Methodology |
Unobservable Input | Range (Weighted Average) | ||||||||
| Senior Secured Loans |
Asset | $ | 845,334 | Income Approach | Market Yield | 6.2% – 11.9% (9.3%) | ||||||
| $ | 7,500 | Market Approach | EBITDA Multiple | 7.8x - 8.0x (7.9x) | ||||||||
| Equipment Financing |
Asset | $ | 175,630 | Income Approach | Market Yield | 7.2% – 19.7% (10.0%) | ||||||
| $ | 145,000 | Market Approach | Return on Equity | 7.8% – 7.8% (7.8%) | ||||||||
| Preferred Equity |
Asset | $ | 10,891 | Income Approach | Market Yield | 8.0% – 12.9% (10.7%) | ||||||
| Common Equity/Equity Interests/Warrants |
Asset | $ | 296,000 | Market Approach | EBITDA Multiple | 5.8x – 6.3x (6.0x) | ||||||
| $ | 13,512 | Market Approach | Return on Equity | 3.9% – 17.0% (17.0%) | ||||||||
| 2022 Unsecured Notes |
Liability | $ | 150,000 | Income Approach | Market Yield | 3.8% – 6.0% (4.5%) | ||||||
Significant increases or decreases in any of the above unobservable inputs in isolation, including unobservable inputs used in deriving bid-ask spreads, if applicable, could result in significantly lower or higher fair value measurements for such assets and liabilities. Generally, an increase in market yields or decrease in EBITDA multiples may result in a decrease in the fair value of certain of the Company’s investments.
Note 7. Debt
Our debt obligations consisted of the following as of December 31, 2020 and December 31, 2019:
| December 31, 2020 | December 31, 2019 | |||||||||||||||
| Facility |
Face Amount | Carrying Value | Face Amount | Carrying Value | ||||||||||||
| Credit Facility |
$ | 201,000 | $ | 198,766 | (1) | $ | 117,900 | $ | 115,217 | (1) | ||||||
| NEFPASS Facility |
30,000 | 29,377 | (2) | 30,000 | 29,149 | (2) | ||||||||||
| 2022 Unsecured Notes |
150,000 | 150,000 | 150,000 | 150,000 | ||||||||||||
| 2022 Tranche C Notes |
21,000 | 20,930 | (3) | 21,000 | 20,905 | (3) | ||||||||||
| 2023 Unsecured Notes |
75,000 | 74,225 | (4) | 75,000 | 73,876 | (4) | ||||||||||
| 2024 Unsecured Notes |
125,000 | 123,877 | (5) | 125,000 | 123,732 | (5) | ||||||||||
| 2026 Unsecured Notes |
75,000 | 74,276 | (6) | 75,000 | 74,238 | (6) | ||||||||||
|
|
|
|
|
|
|
|
|
|||||||||
| $ | 677,000 | $ | 671,451 | $ | 593,900 | $ | 587,117 | |||||||||
|
|
|
|
|
|
|
|
|
|||||||||
| (1) | Carrying Value equals the Face Amount net of unamortized debt issuance costs of $2,234 and $2,683 as of December 31, 2020 and December 31, 2019, respectively. |
| (2) | Carrying Value equals the Face Amount net of unamortized debt issuance costs of $623 and $851 as of December 31, 2020 and December 31, 2019, respectively. |
| (3) | Carrying Value equals the Face Amount net of unamortized debt issuance costs of $70 and $95 as of December 31, 2020 and December 31, 2019, respectively. |
| (4) | Carrying Value equals the Face Amount net of unamortized debt issuance costs of $775 and $1,124 as of December 31, 2020 and December 31, 2019, respectively. |
| (5) | Carrying Value equals the Face Amount net of unamortized debt issuance costs of $1,123 and $1,268 as of December 31, 2020 and December 31, 2019, respectively. |
| (6) | Carrying Value equals the Face Amount net of unamortized debt issuance costs of $724 and $762 as of December 31, 2020 and December 31, 2019, respectively. |
129
Table of Contents
SOLAR CAPITAL LTD.
NOTES TO CONSOLIDATED FINANCIAL STATEMENTS (continued)
December 31, 2020
(in thousands, except share amounts)
Unsecured Notes
On December 18, 2019, the Company closed a private offering of $125,000 of the 2024 Unsecured Notes with a fixed interest rate of 4.20% and a maturity date of December 15, 2024. Interest on the 2024 Unsecured Notes is due semi-annually on June 15 and December 15. The 2024 Unsecured Notes were issued in a private placement only to qualified institutional buyers.
On December 18, 2019, the Company closed a private offering of $75,000 of the 2026 Unsecured Notes with a fixed interest rate of 4.375% and a maturity date of December 15, 2026. Interest on the 2026 Unsecured Notes is due semi-annually on June 15 and December 15. The 2026 Unsecured Notes were issued in a private placement only to qualified institutional buyers.
On December 28, 2017, the Company closed a private offering of $21,000 of the 2022 Tranche C Notes with a fixed interest rate of 4.50% and a maturity date of December 28, 2022. Interest on the 2022 Tranche C Notes is due semi-annually on June 28 and December 28. The 2022 Tranche C Notes were issued in a private placement only to qualified institutional buyers.
On November 22, 2017, we issued $75,000 in aggregate principal amount of publicly registered 2023 Unsecured Notes for net proceeds of $73,846. Interest on the 2023 Unsecured Notes is paid semi-annually on January 20 and July 20, at a fixed rate of 4.50% per year, commencing on January 20, 2018. The 2023 Unsecured Notes mature on January 20, 2023.
On February 15, 2017, the Company closed a private offering of $100,000 of the 2022 Unsecured Notes with a fixed interest rate of 4.60% and a maturity date of May 8, 2022. Interest on the 2022 Unsecured Notes is due semi-annually on May 8 and November 8. The 2022 Unsecured Notes were issued in a private placement only to qualified institutional buyers.
On November 8, 2016, the Company closed a private offering of $50,000 of the 2022 Unsecured Notes with a fixed interest rate of 4.40% and a maturity date of May 8, 2022. Interest on the 2022 Unsecured Notes is due semi-annually on May 8 and November 8. The 2022 Unsecured Notes were issued in a private placement only to qualified institutional buyers.
Revolving and Term Loan Facilities
On August 28, 2019, the Company repaid its existing senior secured credit agreement due September 2021 and entered into the new senior secured credit agreement (the “Credit Facility”). The Credit Facility was originally composed of $470,000 of revolving credit and $75,000 of term loans. On February 12, 2020, a new lender to the Company executed a commitment increase to our Credit Facility providing for an additional $75,000 of revolving credit, bringing our Credit Facility’s total revolving credit capacity to $545,000. Borrowings generally bear interest at a rate per annum equal to the base rate plus a range of 2.00-2.25% or the alternate base rate plus 1.00%-1.25%. The Credit Facility has no LIBOR floor requirement. The Credit Facility matures in August 2024 and includes ratable amortization in the final year. The Credit Facility may be increased up to $800,000 with additional new lenders or an increase in commitments from current lenders. The Credit Facility contains certain customary affirmative and negative covenants and events of default. In addition, the Credit Facility contains certain financial covenants that among other things, requires the Company to maintain a minimum shareholder’s equity and a minimum asset coverage ratio. At December 31, 2020, outstanding USD equivalent borrowings under the Credit Facility totaled $201,000, composed of $126,000 of revolving credit and $75,000 of term loans.
130
Table of Contents
SOLAR CAPITAL LTD.
NOTES TO CONSOLIDATED FINANCIAL STATEMENTS (continued)
December 31, 2020
(in thousands, except share amounts)
On September 26, 2018, NEFPASS SPV LLC, a newly formed wholly-owned subsidiary of NEFPASS LLC, as borrower entered into a $50,000 senior secured revolving credit facility (the “NEFPASS Facility”) with Keybank acting as administrative agent. The Company acts as servicer under the NEFPASS Facility. The NEFPASS Facility is scheduled to mature on September 26, 2023. The NEFPASS Facility generally bears interest at a rate of LIBOR plus 2.15%. NEFPASS and NEFPASS SPV LLC, as applicable, have made certain customary representations and warranties, and are required to comply with various covenants, including leverage restrictions, reporting requirements and other customary requirements for similar credit facilities. The NEFPASS Facility also includes usual and customary events of default for credit facilities of this nature. There were $30,000 of borrowings outstanding as of December 31, 2020.
Certain covenants on our issued debt may restrict our business activities, including limitations that could hinder our ability to finance additional loans and investments or to make the distributions required to maintain our status as a RIC under Subchapter M of the Code.
The Company has made an election to apply the fair value option of accounting to the 2022 Unsecured Notes, in accordance with ASC 825-10. We believe accounting for this facility at fair value better aligns the measurement methodologies of assets and liabilities, which may mitigate certain earnings volatility. ASC 825-10 requires entities to display the fair value of the selected assets and liabilities on the face of the Consolidated Statement of Assets and Liabilities and changes in fair value of the above facility are reported in the Consolidated Statement of Operations.
The average annualized interest cost for all borrowings for the year ended December 31, 2020 and the year ended December 31, 2019 was 4.11% and 4.52%, respectively. These costs are exclusive of other credit facility expenses such as unused fees, agency fees and other prepaid expenses related to establishing and/or amending the Credit Facility, the 2022 Unsecured Notes, the 2022 Tranche C Notes, the NEFPASS Facility, the 2023 Unsecured Notes, the 2024 Unsecured Notes, and the 2026 Unsecured Notes (collectively the “Credit Facilities”), if any. The maximum amounts borrowed on the Credit Facilities during the year ended December 31, 2020 and the year ended December 31, 2019 were $677,000 and $616,186, respectively.
Note 8(a). Income Tax Information and Distributions to Stockholders
The tax character of distributions for the fiscal years ended December 31, 2020, 2019 and 2018 were as follows (1):
| 2020 | 2019 | 2018 | ||||||||||||||||||||||
| Ordinary income |
$ | 48,795 | 70.4 | % | $ | 65,715 | 94.8 | % | $ | 69,308 | 100.0 | % | ||||||||||||
| Capital gains |
— | 0.0 | % | — | 0.0 | % | — | 0.0 | % | |||||||||||||||
| Return of capital |
20,513 | 29.6 | % | 3,592 | 5.2 | % | — | 0.0 | % | |||||||||||||||
|
|
|
|
|
|
|
|
|
|
|
|
|
|||||||||||||
| Total distributions |
$ | 69,308 | 100.0 | % | $ | 69,307 | 100.0 | % | $ | 69,308 | 100.0 | % | ||||||||||||
|
|
|
|
|
|
|
|
|
|
|
|
|
|||||||||||||
131
Table of Contents
SOLAR CAPITAL LTD.
NOTES TO CONSOLIDATED FINANCIAL STATEMENTS (continued)
December 31, 2020
(in thousands, except share amounts)
As of December 31, 2020, 2019 and 2018 the total accumulated earnings (loss) on a tax basis were as follows (1):
| 2020 | 2019 | 2018 | ||||||||||
| Undistributed ordinary income |
$ | — | $ | — | $ | 13,259 | ||||||
| Undistributed long-term net capital gains |
— | — | — | |||||||||
|
|
|
|
|
|
|
|||||||
| Total undistributed net earnings |
— | — | 13,259 | |||||||||
| Post-October capital losses |
— | — | — | |||||||||
| Capital loss carryforward |
(69,384 | ) | (45,400 | ) | (37,319 | ) | ||||||
| Other book/tax temporary differences |
2,168 | 2,004 | (1,098 | ) | ||||||||
| Net unrealized appreciation |
4,446 | 8,172 | 853 | |||||||||
|
|
|
|
|
|
|
|||||||
| Total tax accumulated loss |
$ | (62,770 | ) | $ | (35,224 | ) | $ | (24,305 | ) | |||
|
|
|
|
|
|
|
|||||||
| (1) | Tax information for the fiscal years ended December 31, 2020, 2019 and 2018 are/were estimates and are not final until the Company files its tax returns, typically in September or October each year. |
The Company recognizes in its consolidated financial statements the tax effect of a tax position when it is more likely than not, based on the technical merits, that the position will be sustained upon examination. To the best of our knowledge, we did not have any uncertain tax positions that met the recognition or measurement criteria of ASC 740-10-25 nor did we have any unrecognized tax benefits as of the periods presented herein. Although we file federal and state tax returns, our major tax jurisdiction is federal. Our tax returns for each of our federal tax years since 2017 remain subject to examination by the Internal Revenue Service and the state department of revenue. The capital loss carryforwards shown above do not expire.
Note 8(b). Other Tax Information (unaudited)
For the fiscal years ended December 31, 2020, 2019 and 2018, 0.1%, 0.0% and 0.0%, respectively, of the dividends paid during the year were eligible for qualified dividend income treatment and the dividends received deduction for corporate stockholders. For the fiscal years ended December 31, 2020, 2019, and 2018, 92.05%, 83.81% and 89.69%, respectively, of each of the distributions paid during the year represent interest-related dividends. For the fiscal years ended December 31, 2020, 2019 and 2018, none of the distributions represent short-term capital gains dividends.
132
Table of Contents
SOLAR CAPITAL LTD.
NOTES TO CONSOLIDATED FINANCIAL STATEMENTS (continued)
December 31, 2020
(in thousands, except share amounts)
Note 9. Financial Highlights
The following is a schedule of financial highlights for the respective years:
| Year ended December 31, 2020 |
Year ended December 31, 2019 |
Year ended December 31, 2018 |
Year ended December 31, 2017 |
Year ended December 31, 2016 |
||||||||||||||||
| Per Share Data: (a) |
||||||||||||||||||||
| Net asset value, beginning of year |
$ | 21.44 | $ | 21.75 | $ | 21.81 | $ | 21.74 | $ | 20.79 | ||||||||||
|
|
|
|
|
|
|
|
|
|
|
|||||||||||
| Net investment income |
1.40 | 1.71 | 1.77 | 1.62 | 1.68 | |||||||||||||||
| Net realized and unrealized gain (loss) |
(1.04 | ) | (0.38 | ) | (0.19 | ) | 0.05 | 0.84 | ||||||||||||
|
|
|
|
|
|
|
|
|
|
|
|||||||||||
| Net increase in net assets resulting from operations |
0.36 | 1.33 | 1.58 | 1.67 | 2.52 | |||||||||||||||
| Distributions to stockholders (see note 8a): |
||||||||||||||||||||
| From net investment income |
(1.15 | ) | (1.55 | ) | (1.64 | ) | (1.60 | ) | (1.60 | ) | ||||||||||
| From return of capital |
(0.49 | ) | (0.09 | ) | — | — | — | |||||||||||||
| Anti-dilution |
— | — | — | — | 0.03 | |||||||||||||||
|
|
|
|
|
|
|
|
|
|
|
|||||||||||
| Net asset value, end of year |
$ | 20.16 | $ | 21.44 | $ | 21.75 | $ | 21.81 | $ | 21.74 | ||||||||||
|
|
|
|
|
|
|
|
|
|
|
|||||||||||
| Per share market value, end of year |
$ | 17.51 | $ | 20.62 | $ | 19.19 | $ | 20.21 | $ | 20.82 | ||||||||||
| Total Return(b) |
(5.72 | %) | 16.22 | % | 2.77 | % | 4.47 | % | 37.49 | % | ||||||||||
| Net assets, end of year |
$ | 852,023 | $ | 905,880 | $ | 919,171 | $ | 921,605 | $ | 918,507 | ||||||||||
| Shares outstanding, end of year |
42,260,826 | 42,260,826 | 42,260,826 | 42,260,826 | 42,248,525 | |||||||||||||||
| Ratios to average net assets: |
||||||||||||||||||||
| Net investment income |
6.93 | % | 7.83 | % | 8.10 | % | 7.43 | % | 7.91 | % | ||||||||||
|
|
|
|
|
|
|
|
|
|
|
|||||||||||
| Operating expenses |
4.14 | % | 5.76 | % | 5.83 | % | 5.80 | % | 6.25 | % | ||||||||||
| Interest and other credit facility expenses |
3.18 | % | 3.13 | % | 2.67 | % | 2.35 | %* | 2.73 | %* | ||||||||||
|
|
|
|
|
|
|
|
|
|
|
|||||||||||
| Total expenses |
7.32 | % | 8.89 | % | 8.50 | % | 8.15 | % | 8.98 | % | ||||||||||
|
|
|
|
|
|
|
|
|
|
|
|||||||||||
| Average debt outstanding |
$ | 556,104 | $ | 561,249 | $ | 508,445 | $ | 414,264 | $ | 495,795 | ||||||||||
| Portfolio turnover ratio |
26.0 | % | 24.1 | % | 39.3 | % | 24.9 | % | 31.0 | % | ||||||||||
| (a) | Calculated using the average shares outstanding method. |
| (b) | Total return is based on the change in market price per share during the year and takes into account distributions, if any, reinvested in accordance with the dividend reinvestment plan. Total return does not include a sales load. |
| * | Ratios are shown without the non-recurring upfront costs that were expensed in the period associated with the amendment and establishment of the Credit Facility and 2022 Unsecured Notes. Ratios excluding those non-recurring upfront costs would be 2.29% and 2.39% for the fiscal year ended December 31, 2017 and December 31, 2016, respectively. |
133
Table of Contents
SOLAR CAPITAL LTD.
NOTES TO CONSOLIDATED FINANCIAL STATEMENTS (continued)
December 31, 2020
(in thousands, except share amounts)
Note 10. Crystal Financial LLC
On December 28, 2012, we completed the acquisition of Crystal Capital Financial Holdings LLC (“Crystal Financial”), a commercial finance company focused on providing asset-based and other secured financing solutions (the “Crystal Acquisition”). We invested $275,000 in cash to effect the Crystal Acquisition. Crystal Financial owned approximately 98% of the outstanding ownership interest in Crystal Financial LLC. The remaining financial interest was held by various employees of Crystal Financial LLC, through their investment in Crystal Management LP. Crystal Financial LLC had a diversified portfolio of 23 loans having a total par value of approximately $400,000 at November 30, 2012 and a $275,000 committed revolving credit facility. On July 28, 2016, the Company purchased Crystal Management LP’s approximately 2% equity interest in Crystal Financial LLC for approximately $5,737. Upon the closing of this transaction, the Company holds 100% of the equity interest in Crystal Financial LLC. On September 30, 2016, Crystal Capital Financial Holdings LLC was dissolved. On December 20, 2018, the revolving credit facility was expanded to $330,000.
As of December 31, 2020 Crystal Financial LLC had 30 funded commitments to 24 different issuers with a total par value of approximately $404,115 on total assets of $433,914. As of December 31, 2019 Crystal Financial LLC had 35 funded commitments to 28 different issuers with total funded loans of approximately $496,833 on total assets of $518,024. As of December 31, 2020 and December 31, 2019, the largest loan outstanding totaled $45,000 and $45,000, respectively. For the same periods, the average exposure per issuer was $16,838 and $17,744, respectively. Crystal Financial LLC’s credit facility, which is non-recourse to Solar Capital, had approximately $183,896 and $275,954 of borrowings outstanding at December 31, 2020 and December 31, 2019, respectively. For the years ended December 31, 2020, 2019 and 2018 Crystal Financial LLC had net income of $23,293, $8,021 and $33,026, respectively, on gross income of $45,315, $61,177 and $58,758, respectively. Due to timing and non-cash items, there may be material differences between GAAP net income and cash available for distributions. Crystal Financial LLC’s consolidated financial statements for the fiscal years ended December 31, 2020 and December 31, 2019 are attached as an exhibit to this annual report on Form 10-K.
Note 11. Selected Quarterly Financial Data (unaudited)
| Quarter Ended |
Investment Income |
Net Investment Income |
Net Realized And Unrealized Gain (Loss) on Assets |
Net Increase (Decrease) In Net Assets From Operations |
||||||||||||||||||||||||||||
| Total | Per Share |
Total | Per Share |
Total | Per Share |
Total | Per Share |
|||||||||||||||||||||||||
| December 31, 2020 |
$ | 31,366 | 0.74 | $ | 14,894 | 0.35 | $ | 3,363 | 0.08 | $ | 18,257 | 0.43 | ||||||||||||||||||||
| September 30, 2020 |
28,851 | 0.68 | 14,267 | 0.34 | 4,350 | 0.10 | 18,617 | 0.44 | ||||||||||||||||||||||||
| June 30, 2020 |
28,625 | 0.68 | 14,201 | 0.34 | 39,845 | 0.94 | 54,046 | 1.28 | ||||||||||||||||||||||||
| March 31, 2020 |
32,904 | 0.78 | 15,853 | 0.38 | (91,322 | ) | (2.16 | ) | (75,469 | ) | (1.79 | ) | ||||||||||||||||||||
| December 31, 2019 |
$ | 37,059 | 0.88 | $ | 17,123 | 0.41 | $ | (19,287 | ) | (0.46 | ) | $ | (2,164 | ) | (0.05 | ) | ||||||||||||||||
| September 30, 2019 |
39,711 | 0.94 | 18,426 | 0.44 | (4,709 | ) | (0.11 | ) | 13,717 | 0.32 | ||||||||||||||||||||||
| June 30, 2019 |
38,682 | 0.92 | 18,432 | 0.44 | 1,199 | 0.03 | 19,631 | 0.46 | ||||||||||||||||||||||||
| March 31, 2019 |
39,259 | 0.93 | 18,464 | 0.44 | 6,368 | 0.15 | 24,832 | 0.59 | ||||||||||||||||||||||||
134
Table of Contents
SOLAR CAPITAL LTD.
NOTES TO CONSOLIDATED FINANCIAL STATEMENTS (continued)
December 31, 2020
(in thousands, except share amounts)
Note 12. Commitments and Contingencies
The Company had unfunded debt and equity commitments to various revolving and delayed draw loans as well as to Crystal Financial LLC. The total amount of these unfunded commitments as of December 31, 2020 and December 31, 2019 is $126,180 and $124,529, respectively, comprised of the following:
| December 31, 2020 |
December 31, 2019 |
|||||||
| Crystal Financial LLC* |
$ | 44,263 | $ | 44,263 | ||||
| Smile Doctors LLC |
26,740 | — | ||||||
| Soleo Health Holdings, Inc. |
7,421 | — | ||||||
| Cardiva Medical, Inc. |
7,333 | 11,000 | ||||||
| Kindred Biosciences, Inc. |
6,897 | 13,795 | ||||||
| Neuronetics, Inc. |
6,691 | — | ||||||
| One Touch Direct, LLC |
5,042 | — | ||||||
| PQ Bypass, Inc. |
5,000 | 5,000 | ||||||
| NEF Holdings, Inc. |
4,150 | — | ||||||
| Centrexion Therapeutics, Inc. |
3,785 | 7,569 | ||||||
| Atria Wealth Solutions, Inc. |
3,529 | 387 | ||||||
| Sentry Data Systems, Inc. |
1,577 | — | ||||||
| Pinnacle Treatment Centers, Inc. |
1,386 | — | ||||||
| Delphinus Medical Technologies, Inc. |
1,250 | — | ||||||
| Basic Fun, Inc. |
1,116 | — | ||||||
| Rubius Therapeutics, Inc. |
— | 13,430 | ||||||
| Cerapedics, Inc. |
— | 5,372 | ||||||
| Phynet Dermatology LLC |
— | 4,668 | ||||||
| Altern Marketing, LLC |
— | 4,227 | ||||||
| Varilease Finance, Inc. |
— | 3,438 | ||||||
| MRI Software LLC |
— | 3,331 | ||||||
| Enhanced Capital Group, LLC |
— | 2,523 | ||||||
| Solara Medical Supplies, Inc. |
— | 1,934 | ||||||
| RS Energy Group U.S., Inc. |
— | 1,685 | ||||||
| Alimera Sciences, Inc. |
— | 1,115 | ||||||
| iCIMS, Inc. |
— | 792 | ||||||
|
|
|
|
|
|||||
| Total Commitments |
$ | 126,180 | $ | 124,529 | ||||
|
|
|
|
|
|||||
| * | The Company controls the funding of the Crystal Financial LLC commitment and may cancel it at its discretion. |
The credit agreements of the above loan commitments contain customary lending provisions and/or are subject to the portfolio company’s achievement of certain milestones that allow relief to the Company from funding obligations for previously made commitments in instances where the underlying company experiences materially adverse events that affect the financial condition or business outlook for the company. Since these commitments may expire without being drawn upon, unfunded commitments do not necessarily represent future cash requirements or future earning assets for the Company. As of December 31, 2020 and December 31, 2019, the Company had sufficient cash available and/or liquid securities available to fund its commitments.
135
Table of Contents
SOLAR CAPITAL LTD.
NOTES TO CONSOLIDATED FINANCIAL STATEMENTS (continued)
December 31, 2020
(in thousands, except share amounts)
Note 13. NEF Holdings, LLC
On July 31, 2017, we completed the acquisition of NEF Holdings, LLC (“NEF”), which conducts its business through its wholly-owned subsidiary Nations Equipment Finance, LLC. NEF is an independent equipment finance company that provides senior secured loans and leases primarily to U.S. based companies. We invested $209,866 in cash to effect the transaction, of which $145,000 was invested in the equity of NEF through our wholly-owned consolidated taxable subsidiary NEFCORP LLC and our wholly-owned consolidated subsidiary NEFPASS LLC and $64,866 was used to purchase certain leases and loans held by NEF through NEFPASS LLC. Concurrent with the transaction, NEF refinanced its existing senior secured credit facility into a $150,000 non-recourse facility with an accordion feature to expand up to $250,000. In September 2019, NEF amended the facility, increasing commitments to $213,957 with an accordion feature to expand up to $313,957 and extended the maturity date of the facility to July 31, 2023. At July 31, 2017, NEF also had two securitizations outstanding, with an issued note balance of $94,587, which were later redeemed in 2018.
As of December 31, 2020, NEF had 138 funded equipment-backed leases and loans to 61 different customers with a total net investment in leases and loans of approximately $188,448 on total assets of $263,443. As of December 31, 2019, NEF had 168 funded equipment-backed leases and loans to 78 different customers with a total net investment in leases and loans of approximately $244,996 on total assets of $304,203. As of December 31, 2020 and December 31, 2019, the largest position outstanding totaled $25,103 and $26,948, respectively. For the same periods, the average exposure per customer was $3,089 and $3,141, respectively. NEF’s credit facility, which is non-recourse to Solar Capital, had approximately $100,569 and $128,150 of borrowings outstanding at December 31, 2020 and December 31, 2019, respectively. For the years ended December 31, 2020, 2019 and 2018, NEF had net income (loss) of ($8,883), ($6,023) and $3,426, respectively on gross income of $24,512, $31,928 and $30,044, respectively. Due to timing and non-cash items, there may be material differences between GAAP net income and cash available for distributions. NEF’s consolidated financial statements for the fiscal years ended December 31, 2020 and December 31, 2019 are attached as an exhibit to this annual report on Form 10-K.
Note 14. Capital Share Transactions
As of December 31, 2020 and December 31, 2019, 200,000,000 shares of $0.01 par value capital stock were authorized.
Transactions in capital stock were as follows:
| Shares | Amount | |||||||||||||||
| Year ended December 31, 2020 |
Year ended December 31, 2019 |
Year ended December 31, 2020 |
Year ended December 31, 2019 |
|||||||||||||
| Shares issued in reinvestment of distributions |
— | — | $ | — | $ | — | ||||||||||
|
|
|
|
|
|
|
|
|
|||||||||
| Net increase (decrease) |
— | — | $ | — | $ | — | ||||||||||
|
|
|
|
|
|
|
|
|
|||||||||
136
Table of Contents
SOLAR CAPITAL LTD.
NOTES TO CONSOLIDATED FINANCIAL STATEMENTS (continued)
December 31, 2020
(in thousands, except share amounts)
Note 15. Kingsbridge Holdings, LLC
On November 3, 2020, the Company acquired 87.5% of Kingsbridge Holdings, LLC (“KBH”) through KBH Topco LLC (“KBHT”), a newly formed Delaware corporation. KBH is a residual focused independent mid-ticket lessor of equipment primarily to U.S. investment grade companies. The Company invested $216,596 to effect the transaction, of which $136,596 was invested to acquire 87.5% of KBHT’s equity and $80,000 in KBH’s debt. The existing management team of KBH committed to continue to lead KBH after the transaction. Post the transaction, the Company owns 87.5% of KBHT equity and the KBH management team owns the remaining 12.5% of KBHT’s equity.
As of December 31, 2020, KBHT had total assets of $744,684. KBHT also had recourse debt outstanding of $219,044 as well as non-recourse debt outstanding of $335,899. For the period November 3, 2020 through December 31, 2020, KBHT had net income of $2,170, on gross income of $43,618. Due to timing and non-cash items, there may be material differences between GAAP net income and cash available for distributions. As such, and subject to fluctuations in KBHT’s funded commitments, the timing of originations, and the repayments of financings, the Company cannot guarantee that KBHT will be able to maintain consistent dividend payments to us. KBHT’s consolidated financial statements for the period November 3, 2020 through December 31, 2020 are attached as an exhibit to this annual report on Form 10-K.
Note 16. Subsequent Events
The Company has evaluated the need for disclosures and/or adjustments resulting from subsequent events through the date the consolidated financial statements were issued.
On February 24, 2021, our Board declared a quarterly distribution of $0.41 per share payable on April 2, 2021 to holders of record as of March 18, 2021.
137
Table of Contents
| Item 9. | Changes in and Disagreements With Accountants on Accounting and Financial Disclosure |
None.
| Item 9A. | Controls and Procedures |
(a) Evaluation of Disclosure Controls and Procedures
As of December 31, 2020 (the end of the period covered by this report), we, including our Co-Chief Executive Officers and Chief Financial Officer, evaluated the effectiveness of the design and operation of our disclosure controls and procedures (as defined in Rule 13a-15(e) of the 1934 Act). Based on that evaluation, our management, including the Co-Chief Executive Officers and Chief Financial Officer, concluded that our disclosure controls and procedures were effective and provided reasonable assurance that information required to be disclosed in our periodic SEC filings is recorded, processed, summarized and reported within the time periods specified in the SEC’s rules and forms, and that such information is accumulated and communicated to our management, including our Co-Chief Executive Officers and Chief Financial Officer, as appropriate, to allow timely decisions regarding required disclosure. However, in evaluating the disclosure controls and procedures, management recognized that any controls and procedures, no matter how well designed and operated can provide only reasonable assurance of achieving the desired control objectives, and management necessarily was required to apply its judgment in evaluating the cost-benefit relationship of such possible controls and procedures.
(b) Management’s Report on Internal Control Over Financial Reporting
Management’s Report on Internal Control Over Financial Reporting, which appears in Item 8 of this Form 10-K, is incorporated by reference herein.
(c) Attestation Report of the Independent Registered Public Accounting Firm
Our independent registered public accounting firm, KPMG LLP, has issued an attestation report on the Company’s internal control over financial reporting, which is set forth above under the heading “Report of Independent Registered Public Accounting Firm” in Item 8.
(d) Changes in Internal Controls Over Financial Reporting
Management has not identified any change in the Company’s internal control over financial reporting that occurred during the fourth fiscal quarter of 2020 that has materially affected, or is reasonably likely to materially affect, the Company’s internal control over financial reporting.
| Item 9B. | Other Information |
None.
138
Table of Contents
PART III
| Item 10. | Directors, Executive Officers and Corporate Governance |
Information about Directors
Certain information with respect to each of the current directors is set forth below, including their names, ages, a brief description of their recent business experience, including present occupations and employment, certain directorships that each person holds, the year in which each person became a director of the Company, and a discussion of their particular experience, qualifications, attributes or skills that lead us to conclude that such individual should serve as a director of the Company, in light of the Company’s business and structure. There were no legal proceedings of the type described in Item 401(f) of Regulation S-K in the past 10 years against any of the directors or officers of the Company and none are currently pending. There is no arrangement or understanding between any of the Company’s directors or officers pursuant to which they were selected as directors or officers and the Company or any other person or entity.
Mr. Gross is an “interested person” of Solar Capital as defined in the Investment Company Act of 1940 (the “1940 Act”) due to his position as Co-Chief Executive Officer and President of the Company and a managing member of Solar Capital Partners, LLC (“Solar Capital Partners”), the Company’s investment adviser. Mr. Spohler is an “interested person” of the Company as defined in the 1940 Act due to his position as Co-Chief Executive Officer and Chief Operating Officer of the Company and a managing member of Solar Capital Partners, the Company’s investment adviser. Each of Mr. Wachter, Mr. Hochberg and Mr. Potter is not an “interested person” of the Company as defined in the 1940 Act.
| Name, Address and Age(1) |
Position(s) Held with Company |
Terms of Office and Length of Time Served |
Principal Occupation(s) During Past 5 Years |
Other Directorships Held by Director or Nominee for Director During Past 5 Years(2) | ||||
| Interested Director | ||||||||
| Michael S. Gross, 59 | Chairman of the Board of Directors, Co-Chief Executive Officer and President. | Class III Director since 2007; Term expires 2021. | Co-Chief Executive Officer of Solar Capital Ltd., Solar Senior Capital Ltd. and SCP Private Credit Income BDC LLC since June 2019 and President of Solar Capital Ltd. since 2007, Solar Senior Capital Ltd. since 2010, SCP Private Credit Income BDC LLC since 2018 and SLR HC BDC LLC since 2020; Sole Chief Executive Officer of Solar Capital Ltd. (February 2007-June 2019), of Solar Senior Capital Ltd. (December 2010-June 2019) and of SCP Private Credit Income BDC LLC (June 2018-June 2019). | Chairman of the Board of Directors of Solar Senior Capital Ltd. since 2010, of SCP Private Credit Income BDC LLC since 2018 and of SLR HC BDC LLC since 2020; Chairman of the Board of Directors of Global Ship Lease Inc.; Director of Jarden Corporation (2007-2016); Chairman of the Board of Mt. Sinai Children’s Center Foundation; Director of New York Road Runners; Member of the Kellogg Global Advisory Board; and Member of the Ross School Advisory Board at the University of Michigan. |
139
Table of Contents
Mr. Gross’ intimate knowledge of the business and operations of Solar Capital Partners, extensive familiarity with the financial industry and the investment management process in particular, and experience as a director of other public and private companies not only gives the board of directors valuable insight but also positions him well to continue to serve as the Chairman of our board of directors.
| Name, Address |
Position(s) Held with Company |
Terms of Office and Length of Time Served |
Principal Occupation(s) During Past 5 Years |
Other Directorships Held by Director or Nominee for Director During Past 5 Years (2) | ||||
| Interested Director | ||||||||
| Bruce Spohler, 60 | Co-Chief Executive Officer, Chief Operating Officer and Director | Class II Director since 2009; Term expires 2023. |
Co-Chief Executive Officer of Solar Capital Ltd., Solar Senior Capital Ltd. and SCP Private Credit Income BDC LLC since June 2019 and SLR HC BDC LLC since September 2020; Chief Operating Officer of Solar Capital Ltd. since February 2007, of Solar Senior Capital Ltd. since December 2010 and of SCP Private Credit Income BDC LLC since June 2018; previously, Managing Director and a former Co-Head of U.S. Leveraged Finance for CIBC World Markets. | Director of Solar Senior Capital Ltd. since 2010, of SCP Private Credit Income BDC LLC since 2018 and of SLR HC BDC LLC since 2020. |
Mr. Spohler’s depth of experience in managerial positions in investment management, leveraged finance and financial services, as well as his intimate knowledge of Solar Capital’s business and operations, gives the board of directors valuable industry-specific knowledge and expertise on these and other matters.
140
Table of Contents
| Name, Address and Age(1) |
Position(s) Held with Company |
Terms of Office and Length of Time Served |
Principal Occupation(s) During Past 5 Years |
Other Directorships Held by Director or Nominee for Director During Past 5 Years(2) | ||||
| Independent Director | ||||||||
| Steven Hochberg, 59 | Director | Class II Director since 2007; Term expires 2023. | Partner at Deerfield Management, a healthcare investment firm, since 2013. Co-founder and manager of Ascent Biomedical Ventures, a venture capital firm focused on early stage investment and development of biomedical companies, since 2004. | Director of Solar Senior Capital Ltd. since 2011, of SCP Private Credit Income BDC LLC since 2018, of SLR HC BDC LLC since 2020 and several private companies. Partner at Deerfield Management, a healthcare investment firm, since 2013. Co-founder and manager of Ascent Biomedical Ventures, a venture capital firm focused on early stage investment and development of biomedical companies, since 2004. Since 2011, Mr. Hochberg had been the Chairman of the Board of Continuum Health Partners until its merger with Mount Sinai in 2013, where he is the Senior Vice Chairman of the Mount Sinai Health System, a non-profit healthcare integrated delivery system in New York City. Director of a number of private healthcare companes, two special purposes acquisition companies, in cluding Deerfield Healthcare Technology Acquisitions Corp. and DFP Healthcare Acquisitions Corp., and the Cardiovascular Research Foundation, an organization focused on advancing new technologies and education in the field of cardiovascular medicine. |
Mr. Hochberg’s varied experience in investing in medical technology companies provides the board of directors with particular knowledge of this field, and his role as chairman of other companies’ board of directors brings the perspective of a knowledgeable corporate leader.
141
Table of Contents
| Name, Address and Age(1) |
Position(s) Held with Company |
Terms of Office and Length of Time Served |
Principal Occupation(s) During Past 5 Years |
Other Directorships Held by Director or Nominee for Director During Past 5 Years(2) | ||||
| Independent Director | ||||||||
| Leonard A. Potter, 59 | Director | Class III Director since 2009; Term expires 2021. | President and Chief Investment Officer of Wildcat Capital Management, LLC since 2011; Co-founder and Senior Managing Director at Vida Ventures since 2017; Chief Executive Officer of Infinity Q Capital Management, LLC from 2014 to 2020; Managing Director of Soros Private Equity at Soros Fund Management LLC from 2002 to 2009. | Director of Solar Senior Capital Ltd. since 2011, SCP Private Credit Income BDC LLC since 2018, SLR HC BDC LLC since 2020, Hilton Grand Vacations Inc. since 2017, SuRo Capital Corp. (formerly known as Sutter Rock Capital Corp.) since 2011, and several private companies. Non-Executive Chairman of Infinity Q Management since 2020. |
Mr. Potter’s experience practicing as a corporate lawyer provides valuable insight to the board of directors on regulatory and risk management issues. In addition, his tenure in private equity and other investments and service as a director of both public and private companies provide industry-specific knowledge and expertise to the board of directors.
| Name, Address and Age(1) |
Position(s) Held with Company |
Terms of Office and Length of Time Served |
Principal Occupation(s) During Past 5 Years |
Other Directorships Held by Director or Nominee for Director During Past 5 Years(2) | ||||
| Independent Director | ||||||||
| David S. Wachter, 57 | Director | Class I Director since 2007; Term expires 2022. | Founding Partner and Managing Partner of W Capital Partners, a private equity fund manager, since 2001. | Director of Solar Senior Capital Ltd. since 2011, SCP Private Credit Income BDC LLC since 2018, SLR HC BDC LLC since 2020 and of several private companies. |
Mr. Wachter’s extensive knowledge of private equity and investment banking provides the board of directors with the valuable insight of an experienced financial manager.
| (1) | The business address of the director nominees and other directors is c/o Solar Capital Ltd., 500 Park Avenue, New York, New York 10022. |
142
Table of Contents
| (2) | All of the Company’s directors also serve as directors of Solar Senior Capital Ltd., SCP Private Credit Income BDC LLC and SLR HC BDC LLC, which are investment companies that have each elected to be regulated as a business development company (“BDC”) and for which Solar Capital Partners serves as investment adviser. Mr. Potter also serves as a director of SuRo Capital Corp. (formerly known as Sutter Rock Capital Corp.), which is a closed-end management investment company that has elected to be regulated as a BDC. |
Information about Executive Officers Who Are Not Directors
The following information, as of December 31, 2020, pertains to our executive officers who are not directors of the Company.
| Name, Address, and Age(1) |
Position(s) Held with Company |
Principal Occupation(s) During Past 5 Years | ||
| Richard L. Peteka, 59 | Chief Financial Officer, Treasurer and Secretary | Chief Financial Officer, Treasurer and Secretary of the Company and of Solar Senior Capital Ltd. since May 2012, of SCP Private Credit Income BDC LLC since June 2018 and SLR HC BDC LLC since September 2020. Mr. Peteka joined the Company from Apollo Investment Corporation, a publicly-traded business development company, where he served from 2004 to 2012 as the Chief Financial Officer and Treasurer. | ||
| Guy Talarico, 65 | Chief Compliance Officer | Chief Compliance Officer of Solar Capital Ltd. since 2008, Solar Senior Capital Ltd. since 2010, SCP Private Credit Income BDC LLC since 2018, SLR HC BDC LLC since 2020 and Solar Capital Partners, LLC since February 2016—all affiliated entities; and Chief Executive Officer of Alaric Compliance Services, LLC (successor to EOS Compliance Services LLC) since December 2005. In conjunction with this primary occupation, Mr. Talarico has served and continues to serve as Chief Compliance Officer for other business development companies, funds, and/or investment advisers who are not affiliated with the Solar Capital entities. |
| (1) | The business address of the executive officers is c/o Solar Capital Ltd., 500 Park Avenue, New York, New York 10022. |
Our common stock is listed on the NASDAQ Global Select Market under the symbol “SLRC.”
Audit Committee
The Audit Committee operates pursuant to a charter approved by our board of directors, a copy of which is available on our website at http://www.solarcapltd.com. The charter sets forth the responsibilities of the Audit Committee. The Audit Committee’s responsibilities include selecting the independent registered public accounting firm for the Company, reviewing with such independent registered public accounting firm the planning, scope and results of their audit of the Company’s financial statements, pre-approving the fees for services performed, reviewing with the independent registered public accounting firm the adequacy of internal control systems, reviewing the Company’s annual financial statements and periodic filings and receiving the Company’s audit reports and financial statements. The Audit Committee also establishes guidelines and makes recommendations to our board of directors regarding the valuation of our investments. The Audit Committee is
143
Table of Contents
responsible for aiding our board of directors in determining the fair value of debt and equity securities that are not publicly traded or for which current market values are not readily available. The board of directors and Audit Committee utilize the services of nationally recognized third-party valuation firms to help determine the fair value of these securities. The Audit Committee is currently composed of Messrs. Hochberg, Wachter and Potter, all of whom are considered independent under the rules of the NASDAQ Stock Market and are not “interested persons” of the Company as that term is defined in Section 2(a)(19) of the 1940 Act. Mr. Hochberg serves as Chairman of the Audit Committee. Our board of directors has determined that Mr. Hochberg is an “audit committee financial expert” as that term is defined under Item 407 of Regulation S-K, as promulgated under the Securities Exchange Act of 1934, as amended (the “Exchange Act”). Mr. Hochberg meets the current independence and experience requirements of Rule 10A-3 of the Exchange Act.
Communication with the Board of Directors
Stockholders with questions about the Company are encouraged to contact the Company’s investor relations department. However, if stockholders believe that their questions have not been addressed, they may communicate with the Company’s board of directors by sending their communications to Solar Capital Ltd., c/o Richard L. Peteka, Secretary, 500 Park Avenue, New York, New York 10022. All stockholder communications received in this manner will be delivered to one or more members of the board of directors.
Code of Ethics
The Company has adopted a code of ethics that applies to, among others, its senior officers, including its Co-Chief Executive Officers and its Chief Financial Officer, as well as every officer, director and employee of the Company. The Company’s code of ethics can be accessed via its website at http://www.solarcapltd.com. The Company intends to disclose amendments to or waivers from a required provision of the code of ethics on Form 8-K.
Nomination of Directors
There have been no material changes to the procedures by which stockholders may recommend nominees to our Board of Directors implemented since the filing of our Proxy Statement for our 2020 Annual Meeting of Stockholders.
| Item 11. | Executive Compensation |
Compensation of Executive Officers
None of our officers receives direct compensation from the Company. As a result, we do not engage any compensation consultants. Mr. Gross, our Co-Chief Executive Officer and President, and Mr. Spohler, our Co-Chief Executive Officer and Chief Operating Officer, through their ownership interest in Solar Capital Partners, our investment adviser, are entitled to a portion of any profits earned by Solar Capital Partners, which includes any fees payable by us to Solar Capital Partners under the terms of the Advisory Agreement, less expenses incurred by Solar Capital Partners in performing its services under the Advisory Agreement. Messrs. Gross and Spohler do not receive any additional compensation from Solar Capital Partners in connection with the management of our portfolio.
Mr. Peteka, our Chief Financial Officer, Treasurer and Secretary and, through Alaric Compliance Services, LLC, Guy Talarico, our Chief Compliance Officer, are paid by Solar Capital Management, our administrator, subject to reimbursement by us of an allocable portion of such compensation for services rendered by such persons to the Company. To the extent that Solar Capital Management outsources any of its functions, we will pay the fees associated with such functions on a direct basis without profit to Solar Capital Management.
144
Table of Contents
Compensation of Directors
The following table sets forth compensation of the Company’s directors, for the year ended December 31, 2020.
| Name |
Fees Earned or Paid in Cash (1) |
Stock Awards (2) |
All Other Compensation |
Total | ||||||||||||
| Interested Directors |
||||||||||||||||
| Michael S. Gross |
— | — | — | — | ||||||||||||
| Bruce Spohler |
— | — | — | — | ||||||||||||
| Independent Directors |
||||||||||||||||
| Steven Hochberg |
$ | 127,000 | — | — | $ | 127,000 | ||||||||||
| David S. Wachter |
$ | 122,000 | — | — | $ | 122,000 | ||||||||||
| Leonard A. Potter |
$ | 122,000 | — | — | $ | 122,000 | ||||||||||
| (1) | For a discussion of the independent directors’ compensation, see below. |
| (2) | We do not maintain a stock or option plan, non-equity incentive plan or pension plan for our directors. However, our independent directors have the option to receive all or a portion of the directors’ fees to which they would otherwise be entitled in the form of shares of our common stock issued at a price per share equal to the greater of our then current net asset value per share or the market price at the time of payment. No shares were issued to any of our independent directors in lieu of cash during 2020. |
Our independent directors’ annual fee is $100,000. The independent directors also receive $2,500 ($1,500 if participating telephonically) plus reimbursement of reasonable out-of-pocket expenses incurred in connection with attending each board meeting and $1,000 plus reimbursement of reasonable out-of-pocket expenses incurred in connection with each committee meeting attended. In addition, the Chairman of the Audit Committee receives an annual fee of $7,500, the Chairman of the Nominating and Corporate Governance Committee receives an annual fee of $2,500 and the Chairman of the Compensation Committee receives an annual fee of $2,500. Further, we purchase directors’ and officers’ liability insurance on behalf of our directors and officers. In addition, no compensation was paid to directors who are interested persons of the Company as defined in the 1940 Act.
Compensation Committee
The Compensation Committee operates pursuant to a charter approved by our board of directors, a copy of which is available on our website at http://www.solarcapltd.com. The charter sets forth the responsibilities of the Compensation Committee. The Compensation Committee is responsible for reviewing and recommending for approval to our board of directors the Advisory Agreement and the Administration Agreement. In addition, although we do not directly compensate our executive officers currently, to the extent that we do so in the future, the Compensation Committee would also be responsible for reviewing and evaluating their compensation and making recommendations to the board of directors regarding their compensation. Lastly, the Compensation Committee would produce a report on our executive compensation practices and policies for inclusion in our proxy statement if required by applicable proxy rules and regulations and, if applicable, make recommendations to the board of directors with matters related to compensation generally. The Compensation Committee has the authority to engage compensation consultants and to delegate their duties and responsibilities to a member or to a subcommittee of the Compensation Committee. The members of the Compensation Committee are Messrs. Hochberg, Wachter and Potter, all of whom are considered independent under the rules of the NASDAQ Stock Market and are not “interested persons” of the Company as that term is defined in Section 2(a)(19) of the 1940 Act. Mr. Potter serves as Chairman of the Compensation Committee.
Compensation Committee Interlocks and Insider Participation
During fiscal year 2020 none of the Company’s executive officers served on the board of directors (or a compensation committee thereof or other board committee performing equivalent functions) of any entities that
145
Table of Contents
had one or more executive officers serve on the Compensation Committee of the Company or on the Board of Directors of the Company. No member of the Compensation Committee had any relationship requiring disclosure under any paragraph of Item 404 of Regulation S-K.
Compensation Committee Report
Currently, none of our executive officers are compensated by the Company, and as such the Company is not required to produce a report on executive officer compensation for inclusion in our annual report on Form 10-K.
| Item 12. | Security Ownership of Certain Beneficial Owners and Management and Related Stockholder Matters |
The following table sets forth, as of February 19, 2021, the beneficial ownership of each current director, the nominees for directors, the Company’s executive officers, each person known to us to beneficially own 5% or more of the outstanding shares of our common stock, and the executive officers and directors as a group.
Beneficial ownership is determined in accordance with the rules of the Securities and Exchange Commission (“SEC”) and includes voting or investment power with respect to the securities. Ownership information for those persons who beneficially own 5% or more of our shares of common stock is based upon reports filed by such persons with the SEC and other information obtained from such persons, if available.
Unless otherwise indicated, the Company believes that each beneficial owner set forth in the table has voting and investment power and has the same address as the Company. Our address is 500 Park Avenue, New York, New York 10022.
| Name and Address of Beneficial Owner |
Number of Shares Owned Beneficially(1) |
Percentage of Class(2) |
||||||
| Interested Directors |
||||||||
| Michael S. Gross(3)(4) |
2,663,881 | 6.3 | % | |||||
| Bruce Spohler(3) |
2,275,787 | 5.4 | % | |||||
| Independent Directors |
||||||||
| Steven Hochberg |
10,000 | * | ||||||
| Leonard A. Potter |
10,000 | * | ||||||
| David S. Wachter |
46,392 | * | ||||||
| Executive Officers |
||||||||
| Richard L. Peteka |
24,000 | 0.1 | % | |||||
| Guy Talarico |
10,350 | * | ||||||
| All executive officers and directors as a group (7 persons) |
2,832,149 | 6.7 | % | |||||
| Wellington Management Group LLP(5) |
2,714,236 | 6.4 | % | |||||
| Thornburg Investment Management Inc.(6) |
4,654,145 | 11.0 | % | |||||
| * | Represents less than one percent. |
| (1) | Beneficial ownership has been determined in accordance with Rule 13d-3 under the Securities Exchange Act of 1934, as amended (the “Exchange Act”). Assumes no other purchases or sales of our common stock since the most recently available SEC filings. This assumption has been made under the rules and regulations of the SEC and does not reflect any knowledge that we have with respect to the present intent of the beneficial owners of our common stock listed in this table. |
| (2) | Based on a total of 42,260,826 shares of the Company’s common stock issued and outstanding as of February 19, 2021. |
| (3) | Includes 1,285,013 shares held by Solar Capital Investors, LLC and 715,000 shares held by Solar Capital Investors II, LLC, a portion of both of which may be deemed to be indirectly beneficially owned by Michael S. Gross, by Bruce Spohler and a grantor retained annuity trust (“GRAT”) setup by and for |
146
Table of Contents
| Mr. Gross by virtue of their collective ownership interest therein. Also includes 208,248 shares held by Solar Capital Partners Employee Stock Plan LLC, which is controlled by Solar Capital Partners, LLC. Mr. Gross and Mr. Spohler may be deemed to beneficially own a portion of the shares held by Solar Capital Partners Employee Stock Plan LLC by virtue of their collective ownership interest in Solar Capital Partners, LLC. Each of Mr. Gross and Mr. Spohler disclaim beneficial ownership of any shares of our common stock directly held by Solar Capital Partners Employee Stock Plan LLC, Solar Capital Investors, LLC or Solar Capital Investors II, LLC, except to the extent of their respective pecuniary interest therein. |
| (4) | Includes 97,250 shares directly held by Michael S. Gross’ profit sharing plan (the “Profit Sharing Plan”). Mr. Gross may be deemed to directly beneficially own these shares as the sole participant in the Profit Sharing Plan. Also includes 20,000 shares directly held by the GRAT setup by and for Michael S. Gross, which Mr. Gross may be deemed to directly beneficially own as the sole trustee of the GRAT. Also includes 88,775 shares held by certain trusts for the benefit of family members for which Mr. Gross serves as trustee (the “Family Trusts”). Mr. Gross may be deemed to directly beneficially own these shares by virtue of his control with respect to the Family Trusts, and disclaims beneficial ownership of the securities held by the Family Trusts except to the extent of his pecuniary interest therein. |
| (5) | Based upon information contained in the Schedule 13G/A filed February 4, 2021 by Wellington Management Group LLP. Such securities are held by certain investment vehicles controlled and/or managed by Wellington Management Company, LLP or its affiliates. The address for Wellington Management Company, LLP is 280 Congress Street, Boston, MA 02210. |
| (6) | Based upon information contained in the Schedule 13G filed February 9, 2021 by Thornburg Investment Management Inc. Such securities are held by certain investment vehicles controlled and/or managed by Thornburg Investment Management Inc. or its affiliates. The address for Thornburg Investment Management Inc. is 2300 North Ridgetop Road, Santa Fe, New Mexico 87506. |
Set forth below is the dollar range of equity securities beneficially owned by each of our directors as of February 19, 2021. We are not part of a “family of investment companies,” as that term is defined in the 1940 Act.
| Name of Director |
Dollar Range of Equity Securities Beneficially Owned(1)(2) |
|||
| Interested Directors |
||||
| Michael S. Gross |
Over $ | 100,000 | ||
| Bruce Spohler |
Over $ | 100,000 | ||
| Independent Directors |
||||
| Steven Hochberg |
Over $ | 100,000 | ||
| Leonard A. Potter |
Over $ | 100,000 | ||
| David S. Wachter |
Over $ | 100,000 | ||
| (1) | The dollar ranges are: None, $1-$10,000, $10,001-$50,000, $50,001-$100,000, or Over $100,000. |
| (2) | The dollar range of equity securities beneficially owned in us is based on the closing price for our common stock of $19.01 on February 19, 2021 on the NASDAQ Global Select Market. Beneficial ownership has been determined in accordance with Rule 16a-1(a)(2) of the Exchange Act. |
| Item 13. | Certain Relationships and Related Transactions, and Director Independence |
We have entered into the Advisory Agreement with Solar Capital Partners. Mr. Gross, our Chairman, Co-Chief Executive Officer and President, and Mr. Spohler, our Co-Chief Executive Officer, Chief Operating Officer and board member, are managing members and senior investment professionals of, and have financial and controlling interests in, Solar Capital Partners. In addition, Mr. Peteka, our Chief Financial Officer, Treasurer and Secretary, serves as the Chief Financial Officer for Solar Capital Partners.
147
Table of Contents
Solar Capital Partners and its affiliates may also manage other funds in the future that may have investment mandates that are similar, in whole and in part, with ours. For example, Solar Capital Partners presently serves as investment adviser to private funds and managed accounts as well as to Solar Senior Capital Ltd., a publicly-traded BDC, which focuses on investing primarily in senior secured loans, including first lien and second lien debt instruments, SCP Private Credit Income BDC LLC, an unlisted BDC, which focuses on investing primarily in senior secured loans, including non-traditional asset-based loans and first lien loans and SLR HC BDC LLC, an unlisted BDC whose principal focus is to invest directly and indirectly in senior secured loans and other debt instruments typically to middle market companies within the healthcare industry. In addition, Michael S. Gross, our Chairman and Co-Chief Executive Officer, Bruce Spohler, our Co-Chief Executive Officer and Chief Operating Officer, and Richard L. Peteka, our Chief Financial Officer, serve in similar capacities for Solar Senior Capital Ltd., SCP Private Credit Income BDC LLC and SLR HC BDC LLC.
Solar Capital Partners and certain investment advisory affiliates may determine that an investment is appropriate for us and for one or more of those other funds. In such event, depending on the availability of such investment and other appropriate factors, Solar Capital Partners or its affiliates may determine that we should invest side-by-side with one or more other funds. Any such investments will be made only to the extent permitted by applicable law and interpretive positions of the SEC and its staff, and consistent with Solar Capital Partners’ allocation procedures.
Related party transactions may occur among Solar Capital Ltd., Crystal Financial LLC, Equipment Operating Leases LLC, Loyer Capital LLC, North Mill Holdco LLC, Gemino Healthcare Finance, LLC and NEF Holdings LLC. These transactions may occur in the normal course of business. No administrative or other fees are paid to Solar Capital Partners by Crystal Financial LLC, Equipment Operating Leases LLC, Loyer Capital LLC, North Mill Holdco LLC, Gemino Healthcare Finance, LLC or NEF Holdings LLC.
In addition, we have adopted a formal code of ethics that governs the conduct of our officers and directors. Our officers and directors also remain subject to the duties imposed by both the 1940 Act and the Maryland General Corporation Law.
Regulatory restrictions limit our ability to invest in any portfolio company in which any affiliate currently has an investment. The Company obtained its most recent exemptive order from the SEC on June 13, 2017 (the “Exemptive Order”). The Exemptive Order permits us to participate in negotiated co-investment transactions with certain affiliates, each of whose investment adviser is an investment adviser that controls, is controlled by or is under common control with Solar Capital Partners and is registered as an investment adviser under the Advisers Act, in a manner consistent with our investment objective, positions, policies, strategies and restrictions as well as regulatory requirements and other pertinent factors, and pursuant to the conditions to the Exemptive Order. We believe that it will be advantageous for us to co-invest with funds managed by Solar Capital Partners where such investment is consistent with the investment objectives, investment positions, investment policies, investment strategy, investment restrictions, regulatory requirements and other pertinent factors applicable to us.
We have entered into a license agreement with Solar Capital Partners, pursuant to which Solar Capital Partners has agreed to grant us a non-exclusive, royalty-free license to use the name “Solar Capital.” In addition, pursuant to the terms of the Administration Agreement, Solar Capital Management provides us with the office facilities and administrative services necessary to conduct our day-to-day operations.
148
Table of Contents
Board Consideration of the Investment Advisory and Management Agreement
Our board of directors determined at a virtual meeting held on November 2, 2020, to approve the Advisory Agreement between the Company and Solar Capital Partners. In reliance on certain exemptive relief provided by the SEC in connection with the global COVID-19 pandemic, our board undertook to ratify the Advisory Agreement at its next in-person meeting. In its consideration of the approval of the Advisory Agreement, the board of directors focused on information it had received relating to, among other things:
| • | the nature, extent and quality of advisory and other services provided by Solar Capital Partners, including information about the investment performance of the Company relative to its stated objectives and in comparison to the performance of the Company’s peer group and relevant market indices, and concluded that such advisory and other services are satisfactory and the Company’s investment performance is reasonable; |
| • | the experience and qualifications of the personnel providing such advisory and other services, including information about the backgrounds of the investment personnel, the allocation of responsibilities among such personnel and the process by which investment decisions are made, and concluded that the investment personnel of Solar Capital Partners have extensive experience and are well qualified to provide advisory and other services to the Company; |
| • | the current fee structure, the existence of any fee waivers, and the Company’s anticipated expense ratios in relation to those of other investment companies having comparable investment policies and limitations, and concluded that the current fee structure is reasonable; |
| • | the advisory fees charged by Solar Capital Partners to the Company, to Solar Senior Capital Ltd. and to SCP Private Credit Income BDC LLC, the advisory fees that will be charged by Solar Capital Partners to SLR HC BDC LLC, and comparative data regarding the advisory fees charged by other investment advisers to business development companies with similar investment objectives, and concluded that the advisory fees charged by Solar Capital Partners to the Company are reasonable; |
| • | the direct and indirect costs, including for personnel and office facilities, that are incurred by Solar Capital Partners and its affiliates in performing services for the Company and the basis of determining and allocating these costs, and concluded that the direct and indirect costs, including the allocation of such costs, are reasonable; |
| • | possible economies of scale arising from the Company’s size and/or anticipated growth, and the extent to which such economies of scale are reflected in the advisory fees charged by Solar Capital Partners to the Company, and concluded that some economies of scale may be possible in the future; |
| • | other possible benefits to Solar Capital Partners and its affiliates arising from their relationships with the Company, and concluded that all such other benefits were not material to Solar Capital Partners and its affiliates; and |
| • | possible alternative fee structures or bases for determining fees, and concluded that the Company’s current fee structure and bases for determining fees are satisfactory. |
Based on the information reviewed and the discussions detailed above, the board of directors, including a majority of the directors who are not “interested persons” as defined in the 1940 Act, concluded that the fees payable to Solar Capital Partners pursuant to the Advisory Agreement were reasonable, and comparable to the fees paid by other management investment companies with similar investment objectives, in relation to the services to be provided. The board of directors did not assign relative weights to the above factors or the other factors considered by it. Individual members of the board of directors may have given different weights to different factors.
149
Table of Contents
Director Independence
In accordance with rules of the NASDAQ Stock Market, our board of directors annually determines each director’s independence. We do not consider a director independent unless the board of directors has determined that he has no material relationship with us. We monitor the relationships of our directors and officers through a questionnaire each director completes no less frequently than annually and updates periodically as information provided in the most recent questionnaire changes.
Our governance guidelines require any director who has previously been determined to be independent to inform the Chairman of the board of directors, the Chairman of the Nominating and Corporate Governance Committee and our Secretary of any change in circumstance that may cause his status as an independent director to change. The board of directors limits membership on the Audit Committee, the Nominating and Corporate Governance Committee and the Compensation Committee to independent directors.
In order to evaluate the materiality of any such relationship, the board of directors uses the definition of director independence set forth in the rules promulgated by the NASDAQ Stock Market. Rule 5605(a)(2) provides that a director of a BDC, shall be considered to be independent if he or she is not an “interested person” of such BDC, as defined in Section 2(a)(19) of the 1940 Act.
The board of directors has determined that each of the directors is independent and has no relationship with us, except as a director and stockholder, with the exception of Michael S. Gross, as a result of his positions as the Co-Chief Executive Officer and President of the Company and a Managing Member of Solar Capital Partners, and Bruce Spohler, as a result of his positions as the Co-Chief Executive Officer and Chief Operating Officer of the Company and a Managing Member of Solar Capital Partners.
Indemnification Agreements
We have entered into indemnification agreements with our directors. The indemnification agreements are intended to provide our directors the maximum indemnification permitted under Maryland law and the 1940 Act. Each indemnification agreement provides that Solar Capital shall indemnify the director who is a party to the agreement (an “Indemnitee”), including the advancement of legal expenses, if, by reason of his or her corporate status, the Indemnitee is, or is threatened to be, made a party to or a witness in any threatened, pending, or completed proceeding, to the maximum extent permitted by Maryland law and the 1940 Act.
| Item 14. | Principal Accountant Fees and Services |
KPMG LLP has advised us that neither the firm nor any present member or associate of it has any material financial interest, direct or indirect, in the Company or its affiliates.
Table below in thousands
| Fiscal Year Ended December 31, 2020 |
Fiscal Year Ended December 31, 2019 |
|||||||
| Audit Fees |
$ | 655.3 | $ | 615.0 | ||||
| Audit-Related Fees |
— | 64.5 | ||||||
| Tax Fees |
165.8 | 204.7 | ||||||
| All Other Fees |
— | — | ||||||
| Total Fees: |
$ | 821.1 | $ | 884.2 | ||||
Audit Fees: Audit fees consist of fees billed for professional services rendered for the audit of our year-end financial statements and quarterly reviews and services that are normally provided by KPMG LLP in connection with statutory and regulatory filings.
150
Table of Contents
Audit-Related Fees: Audit-related services consist of fees billed for assurance and related services that are reasonably related to the performance of the audit or review of our financial statements and are not reported under “Audit Fees.” These services include attest services that are not required by statute or regulation and consultations concerning financial accounting and reporting standards.
Tax Services Fees: Tax services fees consist of fees billed for professional tax services. These services also include assistance regarding federal, state, and local tax compliance.
All Other Fees: Other fees would include fees for products and services other than the services reported above.
Pre-Approval Policy
The Audit Committee has established a pre-approval policy that describes the permitted audit, audit-related, tax and other services to be provided by KPMG LLP, the Company’s independent registered public accounting firm (“KPMG”). The policy requires that the Audit Committee pre-approve the audit and non-audit services performed by the independent auditor in order to assure that the provision of such service does not impair the auditor’s independence.
Any requests for audit, audit-related, tax and other services that have not received general pre-approval must be submitted to the Audit Committee for specific pre-approval, irrespective of the amount, and cannot commence until such approval has been granted. Normally, pre-approval is provided at regularly scheduled meetings of the Audit Committee. However, the Audit Committee may delegate pre-approval authority to one or more of its members. The member or members to whom such authority is delegated shall report any pre-approval decisions to the Audit Committee at its next scheduled meeting. The Audit Committee does not delegate its responsibilities to pre-approve services performed by the independent registered public accounting firm to management. During the fiscal year ended December 31, 2020, the Audit Committee pre-approved 100% of services described in this policy.
151
Table of Contents
PART IV
| Item 15. | Exhibit and Financial Statement Schedules |
a. Documents Filed as Part of this Report
The following reports and consolidated financial statements are set forth in Item 8:
152
Table of Contents
b. Exhibits
The following exhibits are filed as part of this report or hereby incorporated by reference to exhibits previously filed with the SEC:
153
Table of Contents
| (1) | Previously filed in connection with Solar Capital Ltd.’s registration statement on Form N-2 Pre-Effective Amendment No. 7 (File No. 333-148734) filed on January 7, 2010. |
| (2) | Previously filed in connection with Solar Capital Ltd.’s registration statement on Form N-2 (File No 333-148734) filed on February 9, 2010. |
| (3) | Previously filed in connection with Solar Capital Ltd.’s registration statement on Form N-2 Post-Effective Amendment No. 6 (File No. 333-172968) filed on November 16, 2012. |
| (4) | Previously filed in connection with Solar Capital Ltd.’s report on Form 8-K filed on November 29, 2010. |
| (5) | Previously filed in connection with Solar Capital Ltd.’s registration statement on Form N-2 Post-Effective Amendment No. 10 (File No. 333-172968) filed on November 12, 2013. |
| (6) | Previously filed in connection with Solar Capital Ltd.’s report on Form 10-K filed on February 25, 2014. |
| (7) | Previously filed in connection with Solar Capital Ltd.’s report on Form 10-Q filed on August 6, 2018. |
| (8) | Previously filed in connection with Solar Capital Ltd.’s registration statement on Form N-2 Post-Effective Amendment No. 5 (File No. 333-194870) filed on November 22, 2017. |
| (9) | Previously filed in connection with Solar Capital Ltd.’s report on Form 10-Q filed on November 4, 2019. |
| (10) | Previously filed in connection with Solar Capital Ltd.’s report on Form 10-K filed on February 20, 2020. |
| * | Filed herewith. |
c. Consolidated Financial Statement Schedules
Separate Financial Statements of Subsidiaries Not Consolidated:
Consolidated Financial Statements for Crystal Financial LLC’s (A Delaware Limited Liability Company) years ended December 31, 2020 and December 31, 2019 are attached as Exhibit 99.1 hereto.
Consolidated Financial Statements for NEF Holdings, LLC’s (A Delaware Limited Liability Company) years ended December 31, 2020 and December 31, 2019 are attached as Exhibit 99.2 hereto.
Consolidated Financial Statements for KBH Topco LLC’s (A Delaware Limited Liability Company) period November 3, 2020 to December 31, 2020 are attached as Exhibit 99.3 hereto.
| Item 16. | Form 10-K Summary |
None.
154
Table of Contents
Pursuant to the requirements of Section 13 or 15(d) of the Securities Act of 1934, the Registrant has duly caused this report to be signed on its behalf by the undersigned, thereunto duly authorized.
| SOLAR CAPITAL LTD. | ||||||
| By: |
/s/ MICHAEL S. GROSS |
/s/ BRUCE J. SPOHLER | ||||
| Michael S. Gross Co-Chief Executive Officer, President, Chairman of the Board and Director Date: February 24, 2021 |
Bruce J. Spohler Co-Chief Executive Officer, Chief Operating Officer and Director Date: February 24, 2021 | |||||
Pursuant to the requirements of the Securities Exchange Act of 1934, this report has been signed below by the following persons on behalf of the registrant and in the capacity and on the dates indicated.
| Date |
Signature |
Title | ||
| February 24, 2021 | /s/ MICHAEL S. GROSS Michael S. Gross |
Co-Chief Executive Officer, President, Chairman of the Board and Director (Principal Executive Officer) | ||
| February 24, 2021 | /s/ BRUCE J. SPOHLER Bruce J. Spohler |
Co-Chief Executive Officer, Chief Operating Officer and Director (Principal Executive Officer) | ||
| February 24, 2021 | /s/ STEVEN HOCHBERG Steven Hochberg |
Director | ||
| February 24, 2021 | /s/ DAVID S. WACHTER David S. Wachter |
Director | ||
| February 24, 2021 | /s/ LEONARD A. POTTER Leonard A. Potter |
Director | ||
| February 24, 2021 | /s/ RICHARD L. PETEKA Richard L. Peteka |
Chief Financial Officer (Principal Financial Officer) and Secretary | ||
155