Attached files
Table of Contents
UNITED STATES
SECURITIES AND EXCHANGE COMMISSION
WASHINGTON, D.C. 20549
FORM 10-K
| x | ANNUAL REPORT PURSUANT TO SECTION 13 OR 15(d) OF THE SECURITIES EXCHANGE ACT OF 1934 |
FOR THE FISCAL YEAR ENDED DECEMBER 31, 2011
OR
| ¨ | TRANSITION REPORT PURSUANT TO SECTION 13 OR 15(d) OF THE SECURITIES EXCHANGE ACT OF 1934 |
FOR THE TRANSITION PERIOD FROM TO
COMMISSION FILE NUMBER: 814-00754
SOLAR CAPITAL LTD.
(Exact name of registrant as specified in its charter)
| Maryland | 26-1381340 | |
| (State of Incorporation) | (I.R.S. Employer Identification Number) | |
| 500 Park Avenue New York, N.Y. |
10022 | |
| (Address of principal executive offices) | (Zip Code) | |
Registrant’s telephone number, including area code: (212) 993-1670
Securities registered pursuant to Section 12(b) of the Act:
| Title of Each Class | Name of Each Exchange on Which Registered | |
| Common Stock, par value $0.01 per share |
The NASDAQ Global Select Market |
Securities registered pursuant to Section 12(g) of the Act: None
Indicate by check mark if the registrant is a well-known seasoned issuer, as defined in Rule 405 of the Securities Act. Yes ¨ No x
Indicate by check mark if the registrant is not required to file reports pursuant to Section 13 or Section 15(d) of the Act. Yes ¨ No x
Indicate by check mark whether the Registrant (1) has filed all reports required to be filed by Section 13 or 15(d) of the Securities Exchange Act of 1934 during the preceding 12 months (or for such shorter period that the Registrant was required to file such reports), and (2) has been subject to such filing requirements for the past 90 days. Yes x No ¨
Indicate by check mark whether the registrant has submitted electronically and posted on its corporate Web site, if any, every Interactive Data File required to be submitted and posted pursuant to Rule 405 of Regulation S-T during the preceding 12 months (or for such shorter period that the registrant was required to submit and post such files). Yes ¨ No ¨
Indicate by check mark if disclosure of delinquent filers pursuant to Item 405 of Regulation S-K is not contained herein, and will not be contained, to the best of Registrant’s knowledge, in definitive proxy or information statements incorporated by reference in Part III of this Form 10-K or any amendment to this Form 10-K. x
Indicate by check mark whether the registrant is a large accelerated filer, an accelerated filer, a non-accelerated filer, or a smaller reporting company. See the definitions of “large accelerated filer,” “accelerated filer” and “smaller reporting company” in Rule 12b-2 of the Exchange Act.
| Large accelerated filer | x | Accelerated filer | ¨ | |||
| Non-accelerated filer | ¨ | Smaller Reporting Company | ¨ | |||
Indicate by check mark whether the registrant is a shell company (as defined in Rule 12b-2 of the Act) Yes ¨ No x
The aggregate market value of common stock held by non-affiliates of the Registrant on June 30, 2011 based on the closing price on that date of $24.69 on the NASDAQ Global Select Market was approximately $847.5 million. For the purposes of calculating this amount only, all directors and executive officers of the Registrant have been treated as affiliates. There were 36,608,038 shares of the Registrant’s common stock outstanding as of February 21, 2012.
Portions of the registrant’s Proxy Statement for its 2012 Annual Meeting of Stockholders to be filed not later than 120 days after the end of the fiscal year covered by this Annual Report on Form 10-K are incorporated by reference into Part III of this Form 10-K.
Table of Contents
FORM 10-K
FOR THE FISCAL YEAR ENDED DECEMBER 31, 2011
TABLE OF CONTENTS
| Page | ||||||
| PART I | ||||||
| Item 1. | 1 | |||||
| Item 1A. | 21 | |||||
| Item 1B. | 38 | |||||
| Item 2. | 38 | |||||
| Item 3. | 38 | |||||
| Item 4. | 38 | |||||
| PART II | ||||||
| Item 5. | 39 | |||||
| Item 6. | 42 | |||||
| Item 7. | Management’s Discussion and Analysis of Financial Condition and Results of Operations |
43 | ||||
| Item 7A. | 54 | |||||
| Item 8. | 56 | |||||
| Item 9. | Changes in and Disagreements with Accountants on Accounting and Financial Disclosure |
92 | ||||
| Item 9A. | 92 | |||||
| Item 9B. | 93 | |||||
| PART III | ||||||
| Item 10. | 94 | |||||
| Item 11. | 94 | |||||
| Item 12. | Security Ownership of Certain Beneficial Owners and Management and Related Stockholder Matters |
94 | ||||
| Item 13. | Certain Relationships and Related Transactions, and Director Independence |
94 | ||||
| Item 14. | 94 | |||||
| PART IV | ||||||
| Item 15. | 95 | |||||
| Signatures | 97 | |||||
Table of Contents
PART I
| Item 1. | Business |
Solar Capital Ltd. (“Solar”, the “Company” or “we”), a Maryland corporation formed in November 2007, is a closed-end, externally managed, non-diversified management investment company that has elected to be treated as a business development company (“BDC”) under the Investment Company Act of 1940, as amended (the “1940 Act”). In addition, for tax purposes we have elected to be treated as a regulated investment company (“RIC”) under Subchapter M of the Internal Revenue Code of 1986, as amended (the “Code”).
In February 2010, we completed our initial public offering and a concurrent private offering of shares to management. Prior to our initial public offering, Solar Capital LLC merged with and into Solar Capital Ltd. (the “Merger”), leaving Solar Capital Ltd. as the surviving entity. Solar Capital Ltd. issued shares of common stock and $125 million in senior unsecured notes (the “Senior Unsecured Notes”) to the existing Solar Capital LLC unit holders in connection with the Merger. The Senior Unsecured Notes that were issued in connection with the Merger were fully repaid in December 2010. Prior to the Merger, Solar Capital Ltd. had no assets or operations and as a result, the books and records of Solar Capital LLC have become the historical books and records of the Company.
We invest primarily in U.S. middle market companies, where we believe the supply of primary capital is limited and the investment opportunities are most attractive. Our investment objective is to generate both current income and capital appreciation through debt and equity investments. We invest primarily in leveraged middle market companies in the form of senior secured loans, mezzanine loans and equity securities. From time to time, we may also invest in public companies that are thinly traded. Our business model is focused primarily on the direct origination of investments through portfolio companies or their financial sponsors. Our investments generally range between $20 million and $100 million each, although we expect that this investment size will vary proportionately with the size of our capital base. In addition, we may invest a portion of our portfolio in other types of investments, which we refer to as opportunistic investments, which are not our primary focus but are intended to enhance our overall returns. These investments may include, but are not limited to, direct investments in public companies that are not thinly traded and securities of leveraged companies located in select countries outside of the United States. We are managed by Solar Capital Partners, LLC (“Solar Capital Partners”). Solar Capital Management, LLC (“Solar Capital Management”) provides the administrative services necessary for us to operate.
As of December 31, 2011, our long term investments totaled $1.05 billion and our net asset value was $805.9 million. Our portfolio was comprised of debt and equity investments in 40 portfolio companies and our income producing assets, which represented 91.2% of our total portfolio, had a weighted average annualized yield on a fair value basis of approximately 14.2%.
During the year ended December 31, 2011, we originated approximately $318.8 million of new investments in 13 portfolio companies and approximately $76.8 million was invested in six existing portfolio companies. We also had approximately $308.7 million in debt repayments of existing portfolio companies and sales of securities of 4 portfolio companies for approximately $29.4 million, during 2011.
Solar Capital Partners
Solar Capital Partners, our investment adviser, is controlled and led by Michael S. Gross, our chairman and chief executive officer, and Bruce Spohler, our chief operating officer. They are supported by a team of dedicated investment professionals, including senior team members Brian Gerson, Cedric Henley, David Mait and Suhail Shaikh. We refer to Messrs. Gross, Spohler, Gerson, Henley, Mait and Shaikh as Solar Capital Partners’ senior investment professionals. Solar Capital Partners’ investment team has extensive experience in the private equity and leveraged lending industries, as well as significant contacts with financial sponsors operating in those industries.
1
Table of Contents
In addition, Solar Capital Partners presently serves as the investment adviser for Solar Senior Capital Ltd, or “Solar Senior,” a publicly traded business development company with more than $300 million of investable capital that invests in the senior debt securities of leveraged middle market companies similar to those we intend to target for investment. The investment team led by Messrs. Gross and Spohler has invested in approximately 90 different portfolio companies for Solar Capital and Solar Senior, which investments involved an aggregate of approximately 80 different financial sponsors, through December 31, 2011. Since Solar Capital’s inception, these investment professionals have used their relationships in the middle-market financial sponsor and financial intermediary community to generate deal flow. As of February 21, 2012, Mr. Gross and Mr. Spohler beneficially owned, either directly or indirectly, approximately 5.76% and 5.62%, respectively, of our outstanding common stock.
Solar Capital Management
Pursuant to an administration agreement (the “Administration Agreement”), Solar Capital Management furnishes us with office facilities, equipment and clerical, bookkeeping and record keeping services at such facilities. Under the Administration Agreement, Solar Capital Management also performs, or oversees the performance of, our required administrative services, which include, among other things, being responsible for the financial records which we are required to maintain and preparing reports to our stockholders. In addition, Solar Capital Management assists us in determining and publishing our net asset value, oversees the preparation and filing of our tax returns and the printing and dissemination of reports to our stockholders, and generally oversees the payment of our expenses and the performance of administrative and professional services rendered to us by others. Solar Capital Management also provides managerial assistance on our behalf to those portfolio companies that request such assistance.
Operating and Regulatory Structure
A BDC is regulated by the 1940 Act. A BDC must be organized in the United States for the purpose of investing in or lending to primarily private companies and making significant managerial assistance available to them. A BDC may use capital provided by public stockholders and from other sources to make long-term, private investments in businesses. A BDC provides stockholders the ability to retain the liquidity of a publicly traded stock while sharing in the possible benefits, if any, of investing in primarily privately owned companies.
We may not change the nature of our business so as to cease to be, or withdraw our election as, a BDC unless authorized by vote of a majority of the outstanding voting securities, as required by the 1940 Act. A majority of the outstanding voting securities of a company is defined under the 1940 Act as the lesser of: (a) 67% or more of such company’s voting securities present at a meeting if more than 50% of the outstanding voting securities of such company are present or represented by proxy, or (b) more than 50% of the outstanding voting securities of such company. We do not anticipate any substantial change in the nature of our business.
As with other companies regulated by the 1940 Act, a BDC must adhere to certain substantive regulatory requirements. A majority of our directors must be persons who are not interested persons, as that term is defined in the 1940 Act. Additionally, we are required to provide and maintain a bond issued by a reputable fidelity insurance company to protect the BDC. Furthermore, as a BDC, we are prohibited from protecting any director or officer against any liability to us or our stockholders arising from willful misfeasance, bad faith, gross negligence or reckless disregard of the duties involved in the conduct of such person’s office.
As a BDC, we are required to meet a coverage ratio of the value of total assets to total senior securities, which include all of our borrowings and any preferred stock we may issue in the future, of at least 200%. We may also be prohibited under the 1940 Act from knowingly participating in certain transactions with our affiliates without the prior approval of our directors who are not interested persons and, in some cases, prior approval by the Securities and Exchange Commission (“SEC”).
2
Table of Contents
We are generally not able to issue and sell our common stock at a price below net asset value per share. We may, however, sell our common stock, or warrants, options or rights to acquire our common stock, at a price below the then-current net asset value of our common stock if our board of directors determines that such sale is in our best interests and the best interests of our stockholders, and our stockholders approve such sale. In addition, we may generally issue new shares of our common stock at a price below net asset value in rights offerings to existing stockholders, in payment of dividends and in certain other limited circumstances.
As a BDC, we are generally limited in our ability to invest in any portfolio company in which our investment adviser or any of its affiliates currently have an investment or to make any co-investments with our investment adviser or its affiliates without an exemptive order from the SEC, subject to certain exceptions.
We will be periodically examined by the SEC for compliance with the 1940 Act.
Qualifying Assets
Under the 1940 Act, a BDC may not acquire any asset other than assets of the type listed in Section 55(a) of the 1940 Act, which are referred to as qualifying assets, unless, at the time the acquisition is made, qualifying assets represent at least 70% of the BDC’s total assets. The principal categories of qualifying assets relevant to our business are the following:
| (1) | Securities purchased in transactions not involving any public offering from the issuer of such securities, which issuer (subject to certain limited exceptions) is an eligible portfolio company, or from any person who is, or has been during the preceding 13 months, an affiliated person of an eligible portfolio company, or from any other person, subject to such rules as may be prescribed by the SEC. An eligible portfolio company is defined in the 1940 Act as any issuer which: |
(a) is organized under the laws of, and has its principal place of business in, the United States;
(b) is not an investment company (other than a small business investment company wholly owned by the BDC) or a company that would be an investment company but for certain exclusions under the 1940 Act; and
(c) satisfies any of the following:
i. does not have any class of securities that is traded on a national securities exchange;
ii. has a class of securities listed on a national securities exchange, but has an aggregate market value of outstanding voting and non-voting common equity of less than $250 million;
iii. is controlled by a BDC or a group of companies including a BDC and the BDC has an affiliated person who is a director of the eligible portfolio company; or
iv. is a small and solvent company having total assets of not more than $4.0 million and capital and surplus of not less than $2.0 million.
| (2) | Securities of any eligible portfolio company which we control. |
| (3) | Securities purchased in a private transaction from a U.S. issuer that is not an investment company or from an affiliated person of the issuer, or in transactions incident thereto, if the issuer is in bankruptcy and subject to reorganization or if the issuer, immediately prior to the purchase of its securities, was unable to meet its obligations as they came due without material assistance other than conventional lending or financing arrangements. |
| (4) | Securities of an eligible portfolio company purchased from any person in a private transaction if there is no ready market for such securities and we already own 60% of the outstanding equity of the eligible portfolio company. |
3
Table of Contents
| (5) | Securities received in exchange for or distributed on or with respect to securities described in (1) through (4) above, or pursuant to the exercise of warrants or rights relating to such securities. |
| (6) | Cash, cash equivalents, U.S. government securities or high-quality debt securities maturing in one year or less from the time of investment. |
Managerial Assistance to Portfolio Companies
As a BDC, we offer, and must provide upon request, managerial assistance to our portfolio companies. This assistance could involve, among other things, monitoring the operations of our portfolio companies, participating in board and management meetings, consulting with and advising officers of portfolio companies and providing other organizational and financial guidance. We may also receive fees for these services. Solar Capital Management provides such managerial assistance on our behalf to portfolio companies that request this assistance.
Temporary Investments
Pending investment in other types of “qualifying assets,” as described above, our investments may consist of cash, cash equivalents, U.S. government securities or high-quality investment grade debt securities maturing in one year or less from the time of investment, which we refer to, collectively, as temporary investments, so that 70% of our assets are qualifying assets. Typically, we will invest in U.S. Treasury bills or in repurchase agreements, provided that such agreements are fully collateralized by cash or securities issued by the U.S. government or its agencies. A repurchase agreement involves the purchase by an investor, such as us, of a specified security and the simultaneous agreement by the seller to repurchase it at an agreed-upon future date and at a price which is greater than the purchase price by an amount that reflects an agreed-upon interest rate. There is no percentage restriction on the proportion of our assets that may be invested in such repurchase agreements. However, if more than 25% of our total assets constitute repurchase agreements from a single counterparty, we would not meet the diversification tests in order to qualify as a RIC for federal income tax purposes. Thus, we do not intend to enter into repurchase agreements with a single counterparty in excess of this limit. Our investment adviser will monitor the creditworthiness of the counterparties with which we enter into repurchase agreement transactions.
Senior Securities
We are permitted, under specified conditions, to issue multiple classes of indebtedness and one class of stock senior to our common stock if our asset coverage, as defined in the 1940 Act, is at least equal to 200% immediately after each such issuance. In addition, while any senior securities remain outstanding, we must make provisions to prohibit any distribution to our stockholders or the repurchase of such securities or shares unless we meet the applicable asset coverage ratios at the time of the distribution or repurchase. We may also borrow amounts up to 5% of the value of our total assets for temporary or emergency purposes without regard to asset coverage. We may borrow money, which would magnify the potential for gain or loss on amounts invested and may increase the risk of investing in us.
Code of Ethics
We and Solar Capital Partners have each adopted a code of ethics pursuant to Rule 17j-1 under the 1940 Act and Rule 204A-1 under the Investment Advisers Act of 1940 (the “Advisers Act”), respectively, that establishes procedures for personal investments and restricts certain transactions by our personnel. Our codes of ethics generally do not permit investments by our employees in securities that may be purchased or held by us. You may read and copy these codes of ethics at the SEC’s Public Reference Room in Washington, D.C. You may obtain information on the operation of the Public Reference Room by calling the SEC at 1 (800) SEC-0330. In addition, each code of ethics is available on the EDGAR Database on the SEC’s Internet site at http://www.sec.gov. You may also obtain copies of the codes of ethics, after paying a duplicating fee, by electronic request at the following Email address: publicinfo@sec.gov, or by writing the SEC’s Public Reference Section, 100 F Street, N.E., Washington, D.C. 20549.
4
Table of Contents
Compliance Policies and Procedures
We and our investment adviser have adopted and implemented written policies and procedures reasonably designed to detect and prevent violation of the federal securities laws. We are required to review these compliance policies and procedures annually for their adequacy and the effectiveness of their implementation and to designate a chief compliance officer to be responsible for their administration. Guy Talarico currently serves as our chief compliance officer.
Proxy Voting Policies and Procedures
We have delegated our proxy voting responsibility to our investment adviser. A summary of the Proxy Voting Policies and Procedures of our adviser are set forth below. The guidelines are reviewed periodically by the adviser and our non-interested directors, and, accordingly, are subject to change.
As an investment adviser registered under the Investment Advisers Act of 1940, Solar Capital Partners has a fiduciary duty to act solely in the best interests of its clients. As part of this duty, it recognizes that it must vote securities held by its clients in a timely manner free of conflicts of interest. These policies and procedures for voting proxies for investment advisory clients are intended to comply with Section 206 of, and Rule 206(4)-6 under, the Advisers Act.
Our investment adviser votes proxies relating to our portfolio securities in the best interest of our stockholders. Solar Capital Partners reviews on a case-by-case basis each proposal submitted for a proxy vote to determine its impact on our investments. Although it generally votes against proposals that may have a negative impact on our investments, it may vote for such a proposal if there exists compelling long-term reasons to do so.
The proxy voting decisions of our investment adviser are made by the senior officers who are responsible for monitoring each of our investments. To ensure that our vote is not the product of a conflict of interest, it requires that: (i) anyone involved in the decision making process disclose to the managing member any potential conflict that he or she is aware of and any contact that he or she has had with any interested party regarding a proxy vote; and (ii) employees involved in the decision making process or vote administration are prohibited from revealing how we intend to vote on a proposal in order to reduce any attempted influence from interested parties.
You may obtain information about how we voted proxies by making a written request for proxy voting information to: Solar Capital Partners, LLC, 500 Park Avenue, New York, NY 10022.
Privacy Principles
We are committed to maintaining the privacy of our stockholders and to safeguarding their non-public personal information. The following information is provided to help you understand what personal information we collect, how we protect that information and why, in certain cases, we may share information with select other parties.
Generally, we do not receive any non-public personal information relating to our stockholders, although certain non-public personal information of our stockholders may become available to us. We do not disclose any non-public personal information about our stockholders or former stockholders to anyone, except as permitted by law or as is necessary in order to service stockholder accounts (for example, to a transfer agent or third-party administrator).
We restrict access to non-public personal information about our stockholders to employees of our investment adviser and its affiliates with a legitimate business need for the information. We maintain physical, electronic and procedural safeguards designed to protect the non-public personal information of our stockholders.
5
Table of Contents
Taxation as a Regulated Investment Company
As a BDC, we have elected to be treated, and intend to continue to qualify annually, as a RIC under Subchapter M of the Code. As a RIC, we generally will not have to pay corporate-level federal income taxes on any ordinary income or capital gains that we distribute to our stockholders as dividends. To continue to qualify as a RIC, we must, among other things, meet certain source-of-income and asset diversification requirements (as described below). In addition, to qualify for RIC tax treatment we must distribute to our stockholders, for each taxable year, at least 90% of our “investment company taxable income,” which is generally our ordinary income plus the excess of our realized net short-term capital gains over our realized net long-term capital losses (the “Annual Distribution Requirement”).
If we:
| • | qualify as a RIC; and |
| • | satisfy the Annual Distribution Requirement; |
then we will not be subject to federal income tax on the portion of our investment company taxable income and net capital gain (i.e., realized net long-term capital gains in excess of realized net short-term capital losses) we distribute to stockholders. We will be subject to U.S. federal income tax at the regular corporate rates on any income or capital gain not distributed (or deemed distributed) to our stockholders.
We will be subject to a 4% nondeductible federal excise tax on certain undistributed income unless we distribute in a timely manner an amount at least equal to the sum of (1) 98% of our ordinary income for each calendar year, (2) 98.2% of our capital gain net income for the one-year period ending October 31 in that calendar year and (3) any income realized, but not distributed, and on which we paid no federal income tax, in preceding years (the “Excise Tax Avoidance Requirement”).
In order to qualify as a RIC for federal income tax purposes, we must, among other things:
| • | at all times during each taxable year, have in effect an election to be treated as a BDC under the 1940 Act; |
| • | derive in each taxable year at least 90% of our gross income from (a) dividends, interest, payments with respect to certain securities loans, gains from the sale of stock or other securities or currencies, or other income derived with respect to our business of investing in such stock, securities or currencies and (b) net income derived from an interest in a “qualified publicly traded partnership;” and |
| • | diversify our holdings so that at the end of each quarter of the taxable year: |
| • | at least 50% of the value of our assets consists of cash, cash equivalents, U.S. government securities, securities of other RICs, and other securities if such other securities of any one issuer do not represent more than 5% of the value of our assets or more than 10% of the outstanding voting securities of the issuer; and |
| • | no more than 25% of the value of our assets is invested in (i) the securities, other than U.S. government securities or securities of other RICs, of one issuer, (ii) the securities of two or more issuers that are controlled, as determined under applicable tax rules, by us and that are engaged in the same or similar or related trades or businesses or (iii) the securities of one or more “qualified publicly traded partnerships.” |
We may be required to recognize taxable income in circumstances in which we do not receive cash. For example, if we hold debt obligations that are treated under applicable tax rules as having original issue discount (such as debt instruments with payment-in-kind (“PIK”) interest or, in certain cases, increasing interest rates or debt instruments issued with warrants), we must include in income each year a portion of the original issue discount that accrues over the life of the obligation, regardless of whether cash representing such income is
6
Table of Contents
received by us in the same taxable year. Because any original issue discount accrued will be included in our investment company taxable income for the year of accrual, we may be required to make a distribution to our stockholders in order to satisfy the Annual Distribution Requirement, even though we will not have received any corresponding cash amount.
Because we may use debt financing, we will be subject to certain asset coverage ratio requirements under the 1940 Act and financial covenants under loan and credit agreements that could, under certain circumstances, restrict us from making distributions necessary to satisfy the Annual Distribution Requirement. If we are unable to obtain cash from other sources or are otherwise limited in our ability to make distributions, we could fail to qualify for RIC tax treatment and thus become subject to corporate-level income tax.
Certain of our investment practices may be subject to special and complex U.S. federal income tax provisions that may, among other things: (i) disallow, suspend or otherwise limit the allowance of certain losses or deductions; (ii) convert lower taxed long-term capital gain into higher taxed short-term capital gain or ordinary income; (iii) convert an ordinary loss or a deduction into a capital loss (the deductibility of which is more limited); (iv) cause us to recognize income or gain without a corresponding receipt of cash; (v) adversely affect the time as to when a purchase or sale of securities is deemed to occur; (vi) adversely alter the characterization of certain complex financial transactions; and (vii) produce income that will not be qualifying income for purposes of the 90% gross income test described above. We will monitor our transactions and may make certain tax elections in order to mitigate the potential adverse effect of these provisions.
Gain or loss realized by us from the sale or exchange of warrants acquired by us as well as any loss attributable to the lapse of such warrants generally will be treated as capital gain or loss. The treatment of such gain or loss as long-term or short-term will depend on how long we held a particular warrant. Upon the exercise of a warrant acquired by us, our tax basis in the stock purchased under the warrant will equal the sum of the amount paid for the warrant plus the strike price paid on the exercise of the warrant. Except as set forth in “Failure to Qualify as a Regulated Investment Company,” the remainder of this discussion assumes we will qualify as a RIC for each taxable year.
Failure to Qualify as a Regulated Investment Company
If we were unable to continue to qualify for treatment as a RIC, we would be subject to tax on all of our taxable income at regular corporate rates. We would not be able to deduct distributions to stockholders, nor would they be required to be made. Such distributions would be taxable to our stockholders as dividends and, if made in a taxable year beginning on or before December 31, 2012 and provided certain holding period and other requirements were met, could qualify for treatment as “qualified dividend income” in the hands of non-corporate stockholders (and thus eligible for the 15% maximum rate) to the extent of our current and accumulated earnings and profits. Subject to certain limitations under the Code, corporate distributees would be eligible for the dividends received deduction. Distributions in excess of our current and accumulated earnings and profits would be treated first as a return of capital to the extent of the stockholder’s tax basis, and any remaining distributions would be treated as a capital gain. To requalify as a RIC in a subsequent taxable year, we would be required to satisfy the RIC qualification requirements for that year and dispose of any earnings and profits from any year in which we failed to qualify as a RIC. Subject to a limited exception applicable to RICs that qualified as such under Subchapter M of the Code for at least one year prior to disqualification and that requalify as a RIC no later than the second year following the non-qualifying year, we could be subject to tax on any unrealized net built-in gains in the assets held by us during the period in which we failed to qualify as a RIC that are recognized within the subsequent 10 years, unless we made a special election to pay corporate-level tax on such built-in gain at the time of our requalification as a RIC.
Investment Advisory Fees
Pursuant to an investment advisory and management agreement (the “Investment Advisory and Management Agreement”), we have agreed to pay Solar Capital Partners a fee for investment advisory and
7
Table of Contents
management services consisting of two components—a base management fee and an incentive fee. The base management fee is calculated at an annual rate of 2.00% of our gross assets. For services rendered under the Investment Advisory and Management Agreement, the base management fee is payable quarterly in arrears. The base management fee is calculated based on the average value of our gross assets at the end of the two most recently completed calendar quarters, and appropriately adjusted for any share issuances or repurchases during the current calendar quarter.
The incentive fee has two parts, as follows: one is calculated and payable quarterly in arrears based on our pre-incentive fee net investment income for the immediately preceding calendar quarter. For this purpose, pre-incentive fee net investment income means interest income, dividend income and any other income (including any other fees (other than fees for providing managerial assistance), such as commitment, origination, structuring, diligence and consulting fees or other fees that we receive from portfolio companies) accrued during the calendar quarter, minus our operating expenses for the quarter (including the base management fee, expenses payable under the Administration Agreement to Solar Capital Management, and any interest expense and dividends paid on any issued and outstanding preferred stock, but excluding the incentive fee). Pre-incentive fee net investment income includes, in the case of investments with a deferred interest feature (such as original issue discount, debt instruments with PIK interest and zero coupon securities), accrued income that we have not yet received in cash. Pre-incentive fee net investment income does not include any realized capital gains, computed net of all realized capital losses or unrealized capital appreciation or depreciation. Pre-incentive fee net investment income, expressed as a rate of return on the value of our net assets at the end of the immediately preceding calendar quarter, is compared to a hurdle of 1.75% per quarter (7.00% annualized). Our net investment income used to calculate this part of the incentive fee is also included in the amount of our gross assets used to calculate the 2.00% base management fee. We pay Solar Capital Partners an incentive fee with respect to our pre-incentive fee net investment income in each calendar quarter as follows:
| • | no incentive fee in any calendar quarter in which our pre-incentive fee net investment income does not exceed the hurdle of 1.75%; |
| • | 100% of our pre-incentive fee net investment income with respect to that portion of such pre-incentive fee net investment income, if any, that exceeds the hurdle but is less than 2.1875% in any calendar quarter (8.75% annualized). We refer to this portion of our pre-incentive fee net investment income (which exceeds the hurdle but is less than 2.1875%) as the “catch-up.” The “catch-up” is meant to provide our investment adviser with 20% of our pre-incentive fee net investment income as if a hurdle did not apply if this net investment income exceeds 2.1875% in any calendar quarter; and |
| • | 20% of the amount of our pre-incentive fee net investment income, if any, that exceeds 2.1875% in any calendar quarter (8.75% annualized) is payable to Solar Capital Partners (once the hurdle is reached and the catch-up is achieved, 20% of all pre-incentive fee investment income thereafter is allocated to Solar Capital Partners). |
8
Table of Contents
The following is a graphical representation of the calculation of the income-related portion of the incentive fee:
Quarterly Incentive Fee Based on Net Investment Income
Pre-Incentive Fee Net Investment Income
(Expressed as a Percentage of the Value of Net Assets)
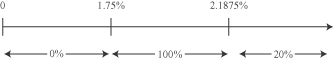
Percentage of Pre-Incentive Fee Net Investment Income
Allocated to Solar Capital Partners
These calculations are appropriately pro-rated for any period of less than three months and adjusted for any share issuances or repurchases during the relevant quarter. You should be aware that a rise in the general level of interest rates can be expected to lead to higher interest rates applicable to our debt investments. Accordingly, an increase in interest rates would make it easier for us to meet or exceed the incentive fee hurdle rate and may result in a substantial increase of the amount of incentive fees payable to our investment adviser with respect to pre-incentive fee net investment income.
The second part of the incentive fee is determined and payable in arrears as of the end of each calendar year (or upon termination of the Investment Advisory and Management Agreement, as of the termination date), and will equal 20% of our realized capital gains, if any, on a cumulative basis from inception through the end of each calendar year, computed net of all realized capital losses and unrealized capital depreciation on a cumulative basis, less the aggregate amount of any previously paid capital gain incentive fees with respect to each of the investments in our portfolio.
Examples of Quarterly Incentive Fee Calculation
Example 1: Income Related Portion of Incentive Fee (*):
Alternative 1:
Assumptions
Investment income (including interest, dividends, fees, etc.) = 1.25%
Hurdle rate (1) = 1.75%
Management fee (2) = 0.50%
Other expenses (legal, accounting, custodian, transfer agent, etc.) (3) = 0.20%
Pre-incentive fee net investment income
(investment income – (management fee + other expenses)) = 0.55%
Pre-incentive net investment income does not exceed hurdle rate, therefore there is no incentive fee.
9
Table of Contents
Alternative 2:
Assumptions
Investment income (including interest, dividends, fees, etc.) = 2.70%
= 100% × (2.00% – 1.75%)
= 0.25%
Alternative 3:
Assumptions
Investment income (including interest, dividends, fees, etc.) = 3.00%
Hurdle rate (1) = 1.75%
Management fee (2) = 0.50%
Other expenses (legal, accounting, custodian, transfer agent, etc.) (3) = 0.20%
Pre-incentive fee net investment income
(investment income – (management fee + other expenses)) = 2.30%
Incentive fee = 20% × pre-incentive fee net investment income, subject to “catch-up” (4)
Incentive fee = 100% × “catch-up” + (20% × (pre-incentive fee net investment income – 2.1875%))
Catch-up = 2.1875% – 1.75%
= 0.4375%
Incentive fee = (100% × 0.4375%) + (20% × (2.3% – 2.1875%))
= 0.4375% + (20% × 0.1125%)
= 0.4375% + 0.0225%
= 0.46%
| (*) | The hypothetical amount of pre-incentive fee net investment income shown is based on a percentage of total net assets. |
| (1) | Represents 7% annualized hurdle rate. |
| (2) | Represents 2% annualized management fee. |
| (3) | Excludes organizational and offering expenses. |
| (4) | The “catch-up” provision is intended to provide our investment adviser with an incentive fee of 20% on all of our pre-incentive fee net investment income as if a hurdle rate did not apply when our net investment income exceeds 2.1875% in any calendar quarter. |
10
Table of Contents
Example 2: Capital Gains Portion of Incentive Fee:
Alternative 1:
Assumptions
| • | Year 1: $20 million investment made in Company A (“Investment A”), and $30 million investment made in Company B (“Investment B”) |
| • | Year 2: Investment A sold for $50 million and fair market value (“FMV”) of Investment B determined to be $32 million |
| • | Year 3: FMV of Investment B determined to be $25 million |
| • | Year 4: Investment B sold for $31 million |
The capital gains portion of the incentive fee would be:
| • | Year 1: None |
| • | Year 2: Capital gains incentive fee of $6 million ($30 million realized capital gains on sale of Investment A multiplied by 20%) |
| • | Year 3: None |
$5 million (20% multiplied by ($30 million cumulative capital gains less $5 million cumulative capital depreciation)) less $6 million (previous capital gains fee paid in Year 2)
| • | Year 4: Capital gains incentive fee of $200,000 |
$6.2 million ($31 million cumulative realized capital gains multiplied by 20%) less $6 million (capital gains fee taken in Year 2)
Alternative 2:
Assumptions
| • | Year 1: $20 million investment made in Company A (“Investment A”), $30 million investment made in Company B (“Investment B”) and $25 million investment made in Company C (“Investment C”) |
| • | Year 2: Investment A sold for $50 million, FMV of Investment B determined to be $25 million and FMV of Investment C determined to be $25 million |
| • | Year 3: FMV of Investment B determined to be $27 million and Investment C sold for $30 million |
| • | Year 4: FMV of Investment B determined to be $24 million |
| • | Year 5: Investment B sold for $20 million |
The capital gains incentive fee, if any, would be:
| • | Year 1: None |
| • | Year 2: $5 million capital gains incentive fee |
20% multiplied by $25 million ($30 million realized capital gains on Investment A less unrealized capital depreciation on Investment B)
| • | Year 3: $1.4 million capital gains incentive fee (1) |
$6.4 million (20% multiplied by $32 million ($35 million cumulative realized capital gains less $3 million unrealized capital depreciation)) less $5 million capital gains fee received in Year 2
11
Table of Contents
| (1) | As illustrated in Year 3 of Alternative 2 above, if Solar Capital were to be wound up on a date other than December 31 of any year, Solar Capital may have paid aggregate capital gain incentive fees that are more than the amount of such fees that would be payable if Solar Capital had been wound up on December 31 of such year. |
| • | Year 4: None |
| • | Year 5: None |
$5 million (20% multiplied by $25 million (cumulative realized capital gains of $35 million less realized capital losses of $10 million)) less $6.4 million cumulative capital gains fee paid in Year 2 and Year 3
Payment of Our Expenses
All investment professionals of the investment adviser and their respective staffs, when and to the extent engaged in providing investment advisory and management services, and the compensation and routine overhead expenses of such personnel allocable to such services, are provided and paid for by Solar Capital Partners. We bear all other costs and expenses of our operations and transactions, including (without limitation):
| • | the cost of our organization and public offerings; |
| • | the cost of calculating our net asset value, including the cost of any third-party valuation services; |
| • | the cost of effecting sales and repurchases of our shares and other securities; |
| • | interest payable on debt, if any, to finance our investments; |
| • | fees payable to third parties relating to, or associated with, making investments, including fees and expenses associated with performing due diligence reviews of prospective investments and advisory fees; |
| • | transfer agent and custodial fees; |
| • | fees and expenses associated with marketing efforts; |
| • | federal and state registration fees, any stock exchange listing fees; |
| • | federal, state and local taxes; |
| • | independent directors’ fees and expenses; |
| • | brokerage commissions; |
| • | fidelity bond, directors and officers errors and omissions liability insurance and other insurance premiums; |
| • | direct costs and expenses of administration, including printing, mailing, long distance telephone and staff; |
| • | fees and expenses associated with independent audits and outside legal costs; |
| • | costs associated with our reporting and compliance obligations under the 1940 Act and applicable federal and state securities laws; and |
| • | all other expenses incurred by either Solar Capital Management or us in connection with administering our business, including payments under the Administration Agreement that will be based upon our allocable portion of overhead and other expenses incurred by Solar Capital Management in performing its obligations under the Administration Agreement, including rent, the fees and expenses associated with performing compliance functions, and our allocable portion of the costs of compensation and related expenses of our chief compliance officer and our chief financial officer and any administrative support staff. |
12
Table of Contents
Investments
Solar Capital seeks to create a diverse portfolio that includes senior secured loans, mezzanine loans and equity securities by investing approximately $20 to $100 million of capital, on average, in the securities of leveraged companies, including middle-market companies. Our portfolio includes both senior secured loans and mezzanine loans. Structurally, mezzanine loans usually rank subordinate in priority of payment to senior debt, such as senior bank debt, and are often unsecured. As such, other creditors may rank senior to us in the event of insolvency. However, mezzanine loans rank senior to common and preferred equity in a borrowers’ capital structure. Typically, mezzanine loans have elements of both debt and equity instruments, offering fixed returns in the form of interest payments associated with senior debt, while providing lenders an opportunity to participate in the capital appreciation of a borrower, if any, through an equity interest. This equity interest may take the form of warrants. Due to its higher risk profile and often less restrictive covenants as compared to senior loans, mezzanine loans generally earn a higher return than senior secured loans. The warrants associated with mezzanine loans are typically detachable, which allows lenders to receive repayment of their principal on an agreed amortization schedule while retaining their equity interest in the borrower. Mezzanine loans also may include a “put” feature, which permits the holder to sell its equity interest back to the borrower at a price determined through an agreed formula. We believe that mezzanine loans offer an attractive investment opportunity based upon their historic returns and resilience during economic downturns.
In addition to senior secured loans and mezzanine loans, we may invest a portion of our portfolio in opportunistic investments, which are not our primary focus, but are intended to enhance our returns to our investors. These investments may include direct investments in public companies that are not thinly traded and securities of leveraged companies located in select countries outside of the United States.
Additionally, we may in the future seek to securitize our loans to generate cash for funding new investments. To securitize loans, we may create a wholly owned subsidiary and contribute a pool of loans to the subsidiary. This could include the sale of interests in the subsidiary on a non-recourse basis to purchasers who we would expect to be willing to accept a lower interest rate to invest in investment grade loan pools, and we would retain a portion of the equity in the securitized pool of loans.
Moreover, we may acquire investments in the secondary market and, in analyzing such investments, we will employ the same analytical process as we use for our primary investments.
Our principal focus is to provide senior secured loans and mezzanine loans to leveraged companies in a variety of industries. We generally seek to target companies that generate positive cash flows. We generally seek to invest in companies from the broad variety of industries in which our investment adviser has direct expertise. The following is a representative list of the industries in which we may invest.
| • Aerospace & Defense • Automobile • Banking • Beverage, Food & Tobacco • Buildings & Real Estate • Broadcasting & Entertainment • Cargo Transport • Chemicals, Plastics & Rubber • Containers, Packaging & Glass • Diversified/Conglomerate Manufacturing • Diversified/Conglomerate Services • Electronics • Farming & Agriculture • Finance • Grocery |
• Healthcare, Education & Childcare • Home, Office Furnishings & Durable Consumer Prds • Hotels, Motels, Inns and Gaming • Insurance • Leisure, Amusement, Entertainment • Machinery • Mining, Steel, Iron & Nonprecious Metals • Oil & Gas • Personal, Food and Misc. Services • Personal Transportation • Printing & Publishing • Retail Stores • Telecommunications • Textiles & Leather • Utilities |
13
Table of Contents
We may invest in other industries if we are presented with attractive opportunities.
Set forth below is a list of our ten largest portfolio company investments as of December 31, 2011, as well as the top ten industries in which we were invested as of December 31, 2011, in each case calculated as a percentage of our total assets as of such date.
| Portfolio Company |
% of Total Assets |
|||
| DSW Group, Inc. |
9.9 | % | ||
| Midcap Financial Intermediate Holdings, LLC |
7.0 | % | ||
| Earthbound Farm |
5.2 | % | ||
| Rug Doctor L.P |
4.4 | % | ||
| Adams Outdoor Advertising |
3.9 | % | ||
| Asurion Corporation |
3.7 | % | ||
| Weetabix Group |
3.5 | % | ||
| Isotoner Corporation |
3.5 | % | ||
| Vision Holdings Corp. |
3.4 | % | ||
| Ark Real Estate Partners LP |
3.3 | % | ||
| Industry |
% of Total Assets |
|||
| Beverage, Food & Tobacco |
15.3 | % | ||
| Insurance |
9.9 | % | ||
| Banking |
9.2 | % | ||
| Personal, Food & Misc. Services |
7.4 | % | ||
| Leisure, Amusement, Entertainment |
7.1 | % | ||
| Healthcare, Education & Childcare |
5.3 | % | ||
| Farming & Agriculture |
5.2 | % | ||
| Grocery |
5.1 | % | ||
| Retail Stores |
4.2 | % | ||
| Diversified/Conglomerate Service |
3.9 | % | ||
Investment Selection Process
Solar Capital Partners utilizes a value-oriented investment philosophy with a focus on the preservation of capital and a commitment to managing downside exposure.
Portfolio Company Characteristics
We have identified several criteria that we believe are important in identifying and investing in prospective portfolio companies. These criteria provide general guidelines for our investment decisions; however, not all of these criteria will be met by each prospective portfolio company in which we choose to invest.
Stable Earnings and Strong Free Cash Flow. We seek to invest in companies who have demonstrated stable earnings through economic cycles. We target companies that can de-lever through consistent generation of cash flows rather than relying solely on growth to service and repay our loans.
Value Orientation. Our investment philosophy places a premium on fundamental analysis from an investor’s perspective and has a distinct value orientation. We focus on companies in which we can invest at relatively low multiples of operating cash flow and that are profitable at the time of investment on an operating cash flow basis.
Value of Assets. The prospective value of the assets, if any, that collateralizes the loans in which we invest, is an important factor in our credit analysis. Our analysis emphasizes both tangible assets, such as accounts receivable, inventory, equipment and real estate, and intangible assets, such as intellectual property, customer lists, networks and databases. In some of our transactions the company’s fundings may be derived from a borrowing base determined by the value of the company’s assets.
14
Table of Contents
Strong Competitive Position in Industry. We seek to invest in target companies that have developed leading market positions within their respective markets and are well positioned to capitalize on growth opportunities. We seek companies that demonstrate significant competitive advantages versus their competitors, which we believe should help to protect their market position and profitability. Typically, we would not invest in start-up companies or companies having speculative business plans.
Diversified Customer and Supplier Base. We seek to acquire businesses that have a diversified customer and supplier base. We believe that companies with a diversified customer and supplier base are generally better able to endure economic downturns, industry consolidation, changing business preferences and other factors that may negatively impact their customers, suppliers and competitors.
Exit Strategy. We predominantly invest in companies which provide multiple alternatives for an eventual exit. We look for opportunities that provide an exit typically within three years of the initial capital commitment.
We seek companies that we believe will provide a steady stream of cash flow to repay our loans and reinvest in their respective businesses. We believe that such internally generated cash flow, leading to the payment of interest on, and the repayment of the principal of, our investments in portfolio companies represents a key means by which we will be able to exit from our investments over time.
In addition, we also seek to invest in companies whose business models and expected future cash flows offer attractive exit possibilities. These companies include candidates for strategic acquisition by other industry participants and companies that may repay our investments through an initial public offering of common stock or another capital market transaction. We underwrite our investments on a held-to-maturity basis, but expensive capital is often repaid prior to stated maturity.
Experienced and Committed Management. We generally require that portfolio companies have an experienced management team. We also require portfolio companies have in place proper incentives to induce management to succeed and to act in concert with our interests as investors, including having significant equity interests.
Strong Sponsorship. We aim to invest alongside other sophisticated investors. We seek to partner with successful financial sponsors who have historically generated high returns. We believe that investing in these sponsors’ portfolio companies enables us to benefit from their direct involvement and due diligence.
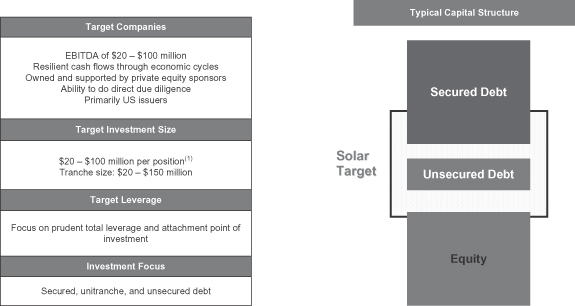
The illustration below provides Solar Capital’s target portfolio companies and the targeted position of its investment in a company’s capital structure.
15
Table of Contents
| (1) | Investment size may vary proportionally as the size of the capital base changes. |
Solar Capital’s investment team works in concert with sponsors to proactively manage investment opportunities by acting as a partner throughout the investment process. We actively focus on the middle-market financial sponsor community, with a particular focus on the upper-end of the middle-market (sponsors with equity funds of $800 million to $3 billion). We favor such sponsors because they typically:
| • | buy larger companies with strong business franchises; |
| • | invest significant amounts of equity in their portfolio companies; |
| • | value flexibility and creativity in structuring their transactions; |
| • | possess longer track records over multiple investment funds; |
| • | have a deeper management bench; |
| • | have better ability to withstand downturns; and |
| • | possess the ability to support portfolio companies with additional capital. |
We divide our coverage of these sponsors among our more senior investment professionals, who are responsible for day-to-day interaction with financial sponsors. Our coverage approach aims to act proactively, consider all investments in the capital structure, provide quick feedback, deliver on commitments, and are constructive throughout the life cycle of an investment.
Due Diligence
Our “private equity” approach to credit investing incorporates extensive in-depth due diligence often alongside the private equity sponsor. In conducting due diligence, we use publicly available information as well as information from relationships with former and current management teams, consultants, competitors and investment bankers. Our due diligence methodology allows us to screen a high volume of potential investment opportunities on a consistent and thorough basis and typically can last two to three months.
Our due diligence typically includes:
| • | review of historical and prospective financial information; |
| • | research relating to the company’s management, industry, markets, products and services and competitors; |
| • | on-site visits; |
| • | discussions with management, employees, customers or vendors of the potential portfolio company; |
| • | review of senior loan documents; and |
| • | background investigations. |
We also evaluate the private equity sponsor making the investment. Further, due to Solar Capital Partners’ considerable repeat business with sponsors, we have direct experience with the management teams of many sponsors. A private equity sponsor is typically the controlling shareholder upon completion of an investment and as such is considered critical to the success of the investment. The equity sponsor is evaluated along several key criteria, including:
| • | Investment track record; |
| • | Industry experience; |
| • | Capacity and willingness to provide additional financial support to the company through additional capital contributions, if necessary; and |
| • | Reference checks. |
16
Table of Contents
Throughout the diligence process, a deal team is in constant dialogue with the investment team to ensure that any concerns are addressed as early as possible through the process and that unsuitable investments are filtered out before considerable time has been invested. In total, due to our thorough diligence process, we only complete 1.5% to 2.0% of all opportunities that we review annually.
Upon the completion of due diligence and a decision to proceed with an investment in a company, the investment professionals leading the investment present the investment opportunity to Solar Capital Partners’ investment committee, which then determines whether to pursue the potential investment. Additional due diligence with respect to any investment may be conducted on our behalf by attorneys and independent accountants prior to the closing of the investment, as well as other outside advisers, as appropriate.
The Investment Committee
All new investments are required to be approved by a consensus of the investment committee of Solar Capital Partners, which is led by Messrs. Gross and Spohler. The members of Solar Capital Partners’ investment committee receive no compensation from us. Such members may be employees or partners of Solar Capital Partners and may receive compensation or profit distributions from Solar Capital Partners.
Investment Structure
Once we determine that a prospective portfolio company is suitable for investment, we work with the management of that company and its other capital providers, including senior, junior and equity capital providers, to structure an investment. We negotiate among these parties to agree on how our investment is expected to perform relative to the other capital in the portfolio company’s capital structure.
We structure our mezzanine investments primarily as unsecured, subordinated loans that provide for relatively high, fixed interest rates that provide us with significant current interest income. These loans typically have interest-only payments in the early years, with amortization of principal deferred to the later years of the mezzanine loans. In some cases, we may enter into loans that, by their terms, convert into equity or additional debt securities or defer payments of interest for the first few years after our investment. Also, in some cases our mezzanine loans may be collateralized by a subordinated lien on some or all of the assets of the borrower. Typically, our mezzanine loans have maturities of five to ten years.
We also invest in portfolio companies in the form of senior secured loans. These senior secured loans typically provide for deferred interest payments in the first few years of the term of the loan. We generally obtain security interests in the assets of our portfolio companies that serve as collateral in support of the repayment of these loans. This collateral may take the form of first or second priority liens on the assets of a portfolio company.
Typically, our mezzanine and senior secured loans have final maturities of five to ten years. However, we expect that our portfolio companies often may repay these loans early, generally within three years from the date of initial investment. To preserve an acceptable return on investment, we seek to structure these loans with prepayment premiums.
In the case of our mezzanine loan and senior secured loan investments, we tailor the terms of the investment to the facts and circumstances of the transaction and the prospective portfolio company, negotiating a structure that protects our rights and manages our risk while creating incentives for the portfolio company to achieve its business plan and improve its profitability. For example, in addition to seeking a senior position in the capital structure of our portfolio companies, we will seek to limit the downside potential of our investments by:
| • | requiring a total return on our investments (including both interest and potential capital appreciation) that compensates us for credit risk; |
17
Table of Contents
| • | incorporating “put” rights and call protection into the investment structure; and |
| • | negotiating covenants in connection with our investments that afford our portfolio companies as much flexibility in managing their businesses as possible, consistent with preservation of our capital. Such restrictions may include affirmative and negative covenants, default penalties, lien protection, change of control provisions and board rights, including either observation or participation rights. |
Our investments may include equity features, such as warrants or options to buy a minority interest in the portfolio company. Any warrants we receive with our debt securities generally require only a nominal cost to exercise, and thus, as a portfolio company appreciates in value, we may achieve additional investment return from this equity interest. We may structure the warrants to provide provisions protecting our rights as a minority interest holder, as well as puts, or rights to sell such securities back to the company, upon the occurrence of specified events. In many cases, we also obtain registration rights in connection with these equity securities, which may include demand and “piggyback” registration rights. In addition, we may from time to time make direct equity investments in portfolio companies.
We seek to hold most of our investments to maturity or repayment, but will sell our investments earlier if a liquidity event takes place, such as the sale or recapitalization of a portfolio company.
Ongoing Relationships with Portfolio Companies
Monitoring. Solar Capital Partners monitors our portfolio companies on an ongoing basis. Solar Capital Partners monitors the financial trends of each portfolio company to determine if it is meeting its business plan and to assess the appropriate course of action for each company.
Solar Capital Partners has several methods of evaluating and monitoring the performance and fair value of our investments, which include the following:
| • | Assessment of success in adhering to each portfolio company’s business plan and compliance with covenants; |
| • | Periodic and regular contact with portfolio company management and, if appropriate, the financial or strategic sponsor, to discuss financial position, requirements and accomplishments; |
| • | Comparisons to other Solar Capital portfolio companies in the industry, if any; |
| • | Attendance at and participation in board meetings; and |
| • | Review of monthly and quarterly financial statements and financial projections for portfolio companies. |
In addition to various risk management and monitoring tools, Solar Capital Partners also uses an investment rating system to characterize and monitor our expected level of returns on each investment in our portfolio.
We use an investment rating scale of 1 to 4. The following is a description of the conditions associated with each investment rating:
| Investment Rating |
Summary Description | |
| 1 | Involves the least amount of risk in our portfolio, the portfolio company is performing above expectations, and the trends and risk factors are generally favorable (including a potential exit) | |
| 2 | Risk that is similar to the risk at the time of origination, the portfolio company is performing as expected, and the risk factors are neutral to favorable; all new investments are initially assessed a grade of 2 | |
| 3 | The portfolio company is performing below expectations, may be out of compliance with debt covenants, and requires procedures for closer monitoring | |
| 4 | The investment is performing well below expectations and is not anticipated to be repaid in full | |
18
Table of Contents
Solar Capital Partners monitors and, when appropriate, changes the investment ratings assigned to each investment in our portfolio. As of December 31, 2011, the weighted average investment rating on the fair market value of our portfolio was 2.1. In connection with our valuation process, Solar Capital Partners reviews these investment ratings on a quarterly basis.
Valuation Procedures
We will conduct the valuation of our assets, pursuant to which our net asset value shall be determined, at all times consistent with U.S. generally accepted accounting principles (“GAAP”) and the 1940 Act. Our valuation procedures are set forth in more detail below:
Securities for which market quotations are readily available on an exchange shall be valued at the closing price on the day of valuation. We may also obtain quotes with respect to certain of our investments from pricing services or brokers or dealers in order to value assets. When doing so, we determine whether the quote obtained is sufficient according to GAAP to determine the fair value of the security. If determined adequate, we use the quote obtained.
Securities for which reliable market quotations are not readily available or for which the pricing source does not provide a valuation or methodology or provides a valuation or methodology that, in the judgment of our investment adviser or board of directors, does not represent fair value, shall each be valued as follows: (i) each portfolio company or investment is initially valued by the investment professionals responsible for the portfolio investment; (ii) preliminary valuation conclusions are documented and discussed with our senior management; (iii) independent third-party valuation firms engaged by, or on behalf of, the board of directors will conduct independent appraisals and review management’s preliminary valuations and make their own assessment for all material assets; (iv) the board of directors will discuss valuations and determine the fair value of each investment in our portfolio in good faith based on the input of the investment adviser and, where appropriate, the respective third-party valuation firms.
The recommendation of fair value will generally be based on the following factors, as relevant:
| • | the nature and realizable value of any collateral; |
| • | the portfolio company’s ability to make payments; |
| • | the portfolio company’s earnings and discounted cash flow; |
| • | the markets in which the issuer does business; and |
| • | comparisons to publicly traded securities. |
Securities for which market quotations are not readily available or for which a pricing source is not sufficient may include, but are not limited to, the following:
| • | private placements and restricted securities that do not have an active trading market; |
| • | securities whose trading has been suspended or for which market quotes are no longer available; |
| • | debt securities that have recently gone into default and for which there is no current market; |
| • | securities whose prices are stale; |
| • | securities affected by significant events; and |
| • | securities that the investment adviser believes were priced incorrectly. |
Determination of fair value involves subjective judgments and estimates. Accordingly, the notes to our financial statements express the uncertainty with respect to the possible effect of such valuations, and any change in such valuations, on our financial statements.
19
Table of Contents
Competition
Our primary competitors provide financing to middle-market companies and include other BDCs, commercial and investment banks, commercial financing companies and, to the extent they provide an alternative form of financing, private equity funds. Additionally, alternative investment vehicles, such as hedge funds, frequently invest in middle-market companies. As a result, competition for investment opportunities at middle-market companies can be intense. However, we believe that there has been a reduction in the amount of debt capital available since the downturn in the credit markets, which began in mid-2007, and that this has resulted in a less competitive environment for making new investments. Many of our competitors are substantially larger and have considerably greater financial, technical and marketing resources than we do. For example, some competitors may have a lower cost of funds and access to funding sources that are not available to us. In addition, some of our competitors may have higher risk tolerances or different risk assessments, which could allow them to consider a wider variety of investments and establish more relationships than us. Furthermore, many of our competitors are not subject to the regulatory restrictions that the 1940 Act imposes on us as a BDC. We use the industry information available to Mr. Gross and the other investment professionals of Solar Capital Partners to assess investment risks and determine appropriate pricing for our investments in portfolio companies. In addition, we believe that the relationships of Mr. Gross and the other investment professionals of our investment adviser enable us to learn about, and compete effectively for, financing opportunities with attractive leveraged companies in the industries in which we seek to invest.
Staffing
We do not currently have any employees. Mr. Gross, our chief executive officer, and Mr. Spohler, our chief operating officer, currently serve as partners of our investment adviser, Solar Capital Partners. Nicholas Radesca, our chief financial officer and corporate secretary, is employed by Solar Capital Management, and performs his functions as chief financial officer under the terms of our Administration Agreement. Guy Talarico, our chief compliance officer, is the chief executive officer of Alaric Compliance Services, LLC, and performs his functions as our chief compliance officer under the terms of an agreement between Solar Capital Management and Alaric Compliance Services, LLC. Solar Capital Management has retained Mr. Talarico and Alaric Compliance Services, LLC pursuant to its obligations under our Administration Agreement.
Our day-to-day investment operations are managed by Solar Capital Partners. Solar Capital Partners’ investment personnel currently consists of its senior investment professionals, Messrs. Gross, Spohler, Gerson, Henley, Mait and Shaikh, and a team of additional experienced investment professionals. Based upon its needs, Solar Capital Partners may hire additional investment professionals. In addition, we will reimburse Solar Capital Management for the allocable portion of overhead and other expenses incurred by it in performing its obligations under the Administration Agreement, including rent, the fees and expenses associated with performing compliance functions, and the compensation of our chief financial officer and any administrative support staff.
Sarbanes-Oxley Act of 2002
The Sarbanes-Oxley Act of 2002 imposes a wide variety of regulatory requirements on publicly-held companies and their insiders. Many of these requirements affect us. For example:
| • | Pursuant to Rule 13a-14 of the 1934 Act, our Chief Executive Officer and Chief Financial Officer must certify the accuracy of the financial statements contained in our periodic reports; |
| • | Pursuant to Item 307 of Regulation S-K, our periodic reports must disclose our conclusions about the effectiveness of our disclosure controls and procedures; |
| • | Pursuant to Rule 13a-15 of the 1934 Act, our management must prepare a report regarding its assessment of our internal control over financial reporting; and |
| • | Pursuant to Item 308 of Regulation S-K and Rule 13a-15 of the 1934 Act, our periodic reports must disclose whether there were significant changes in our internal controls or in other factors that could significantly affect these controls subsequent to the date of their evaluation, including any corrective actions with regard to significant deficiencies and material weaknesses. |
20
Table of Contents
The Sarbanes-Oxley Act requires us to review our current policies and procedures to determine whether we comply with the Sarbanes-Oxley Act and the regulations promulgated thereunder. We will continue to monitor our compliance with all regulations that are adopted under the Sarbanes-Oxley Act and will take actions necessary to ensure that we are in compliance therewith.
Available Information
You may read and copy any materials we file with the SEC at the SEC’s Public Reference Room at 100 F Street, NE, Washington, DC 20549, on official business days during the hours of 10:00 am to 3:00 pm. You may obtain information on the operation of the Public Reference Room by calling the SEC at 1-800-SEC-0330. The SEC maintains an Internet site that contains reports, proxy and information statements, and other information regarding issuers that file electronically with the SEC. The address of that site is (http://www.sec.gov).
Our internet address is www.solarcapltd.com. We make available free of charge on our website our annual report on Form 10-K, quarterly reports on Form 10-Q, current reports on Form 8-K and amendments to those reports as soon as reasonably practicable after we electronically file such material with, or furnish it to, the SEC. Information contained on our website is not incorporated by reference into this annual report on Form 10-K, and you should not consider information contained on our website to be part of this annual report on Form 10-K.
| Item 1A. | Risk Factors |
An investment in our securities involves certain risks relating to our structure and investment objectives. The risks set forth below are not the only risks we face, and we face other risks which we have not yet identified, which we do not currently deem material or which are not yet predictable. If any of the following risks occur, our business, financial condition and results of operations could be materially adversely affected. In such case, our net asset value and the trading price of our common stock could decline, and you may lose all or part of your investment.
Risks Related to Our Investments
We operate in a highly competitive market for investment opportunities.
A number of entities compete with us to make the types of investments that we target in leveraged companies. We compete with other BDCs, public and private funds, commercial and investment banks, commercial financing companies and, to the extent they provide an alternative form of financing, private equity funds. Many of our competitors are substantially larger and have considerably greater financial, technical and marketing resources than we do. For example, some competitors may have a lower cost of funds and access to funding sources that are not available to us. In addition, some of our competitors may have higher risk tolerances or different risk assessments than we do, which could allow them to consider a wider variety of investments and establish more relationships than us. Furthermore, many of our competitors are not subject to the regulatory restrictions that the 1940 Act imposes on us. We cannot assure you that the competitive pressures we face will not have a material adverse effect on our business, financial condition and results of operations. Also, as a result of this competition, we may not be able to take advantage of attractive investment opportunities from time to time, and we can offer no assurance that we will be able to identify and make investments that are consistent with our investment objective.
We do not seek to compete primarily based on the interest rates we will offer, and we believe that some of our competitors may make loans with interest rates that will be comparable to or lower than the rates we offer. We may lose investment opportunities if we do not match our competitors’ pricing, terms and structure. However, if we match our competitors’ pricing, terms and structure, we may experience decreased net interest income and increased risk of credit loss.
21
Table of Contents
Our investments are very risky and highly speculative.
We invest primarily in senior secured term loans, mezzanine debt and select equity investments issued by leveraged companies.
Senior Secured Loans. When we make a senior secured term loan investment in a portfolio company, we generally take a security interest in the available assets of the portfolio company, including the equity interests of its subsidiaries, which we expect to help mitigate the risk that we will not be repaid. However, there is a risk that the collateral securing our loans may decrease in value over time, may be difficult to sell in a timely manner, may be difficult to appraise and may fluctuate in value based upon the success of the business and market conditions, including as a result of the inability of the portfolio company to raise additional capital, and, in some circumstances, our lien could be subordinated to claims of other creditors. In addition, deterioration in a portfolio company’s financial condition and prospects, including its inability to raise additional capital, may be accompanied by deterioration in the value of the collateral for the loan. Consequently, the fact that a loan is secured does not guarantee that we will receive principal and interest payments according to the loan’s terms, or at all, or that we will be able to collect on the loan should we be forced to enforce our remedies.
Mezzanine Loans. Our mezzanine debt investments are generally subordinated to senior loans and are generally unsecured. As such, other creditors may rank senior to us in the event of insolvency. This may result in an above average amount of risk and loss of principal.
Equity Investments. When we invest in senior secured loans or mezzanine loans, we may acquire equity securities as well. In addition, we may invest directly in the equity securities of portfolio companies. Our goal is ultimately to dispose of such equity interests and realize gains upon our disposition of such interests. However, the equity interests we receive may not appreciate in value and, in fact, may decline in value. Accordingly, we may not be able to realize gains from our equity interests, and any gains that we do realize on the disposition of any equity interests may not be sufficient to offset any other losses we experience.
In addition, investing in middle-market companies involves a number of significant risks, including:
| • | these companies may have limited financial resources and may be unable to meet their obligations under their debt securities that we hold, which may be accompanied by a deterioration in the value of any collateral and a reduction in the likelihood of us realizing any guarantees we may have obtained in connection with our investment; |
| • | they typically have shorter operating histories, narrower product lines and smaller market shares than larger businesses, which tend to render them more vulnerable to competitors’ actions and market conditions, as well as general economic downturns; |
| • | they are more likely to depend on the management talents and efforts of a small group of persons; therefore, the death, disability, resignation or termination of one or more of these persons could have a material adverse impact on our portfolio company and, in turn, on us; |
| • | they generally have less predictable operating results, may from time to time be parties to litigation, may be engaged in rapidly changing businesses with products subject to a substantial risk of obsolescence, and may require substantial additional capital to support their operations, finance expansion or maintain their competitive position. In addition, our executive officers, directors and our investment adviser may, in the ordinary course of business, be named as defendants in litigation arising from our investments in the portfolio companies; and |
| • | they may have difficulty accessing the capital markets to meet future capital needs, which may limit their ability to grow or to repay their outstanding indebtedness upon maturity. |
22
Table of Contents
The lack of liquidity in our investments may adversely affect our business.
We generally make investments in private companies. Substantially all of these securities are subject to legal and other restrictions on resale or will otherwise be less liquid than publicly traded securities. The illiquidity of our investments may make it difficult for us to sell such investments if the need arises. In addition, if we are required to liquidate all or a portion of our portfolio quickly, we may realize significantly less than the value at which we have previously recorded our investments. In addition, we may face other restrictions on our ability to liquidate an investment in a portfolio company to the extent that we have material non-public information regarding such portfolio company.
Our portfolio may be concentrated in a limited number of portfolio companies and industries, which will subject us to a risk of significant loss if any of these companies defaults on its obligations under any of its debt instruments or if there is a downturn in a particular industry.
Our portfolio may be concentrated in a limited number of portfolio companies and industries. Beyond the asset diversification requirements associated with our qualification as a RIC under Subchapter M of the Code, we do not have fixed guidelines for diversification, and while we are not targeting any specific industries, our investments may be concentrated in relatively few industries. As a result, the aggregate returns we realize may be significantly adversely affected if a small number of investments perform poorly or if we need to write down the value of any one investment. Additionally, a downturn in any particular industry in which we are invested could also significantly impact the aggregate returns we realize.
Capital markets have recently been in a period of disruption and instability. These market conditions have materially and adversely affected debt and equity capital markets in the United States and abroad, which had, and may in the future have, a negative impact on our business and operations.
The global capital markets have recently been in a period of disruption as evidenced by a lack of liquidity in the debt capital markets, significant write-offs in the financial services sector, the re-pricing of credit risk in the broadly syndicated credit market and the failure of certain major financial institutions. Despite actions of the United States federal government and foreign governments, these events contributed to worsening general economic conditions that materially and adversely impacted the broader financial and credit markets and reduced the availability of debt and equity capital for the market as a whole and financial services firms in particular. These conditions could continue for a prolonged period of time or worsen in the future. While these conditions persist, we and other companies in the financial services sector may have to access, if available, alternative markets for debt and equity capital. Equity capital may be difficult to raise because as a BDC we are generally not able to issue additional shares of our common stock at a price less than net asset value. In addition, our ability to incur indebtedness (including by issued preferred stock) is limited by applicable regulations such that our asset coverage, as defined in the 1940 Act, must equal at least 200% immediately after each time we incur indebtedness. The debt capital that will be available, if at all, may be at a higher cost and on less favorable terms and conditions in the future. Any inability to raise capital could have a negative effect on our business, financial condition and results of operations.
The illiquidity of our investments may make it difficult for us to sell such investments if required. As a result, we may realize significantly less than the value at which we have recorded our investments. In addition, significant changes in the capital markets, including the recent extreme volatility and disruption, have had, and may in the future have, a negative effect on the valuations of our investments and on the potential for liquidity events involving our investments. An inability to raise capital, and any required sale of our investments for liquidity purposes, could have a material adverse impact on our business, financial condition or results of operations.
23
Table of Contents
The recent downgrade of the U.S. credit rating and the economic crisis in Europe could negatively impact our business, financial condition and results of operations.
Recent U.S. debt ceiling and budget deficit concerns, together with signs of deteriorating sovereign debt conditions in Europe, have increased the possibility of additional credit-rating downgrades and economic slowdowns. Although U.S. lawmakers passed legislation to raise the federal debt ceiling, Standard & Poor’s Ratings Services lowered its long-term sovereign credit rating on the United States from “AAA” to “AA+” in August 2011. The impact of this or any further downgrades to the U.S. government’s sovereign credit rating, or its perceived creditworthiness, and the impact of the current crisis in Europe with respect to the ability of certain European Union countries to continue to service their sovereign debt obligations is inherently unpredictable and could adversely effect the U.S. and global financial markets and economic conditions. There can be no assurance that governmental or other measures to aid economic recovery will be effective. These developments, and the government’s credit concerns in general, could cause interest rates and borrowing costs to rise, which may negatively impact our ability to access the capital markets on favorable terms. In addition, the decreased credit rating could create broader financial turmoil and uncertainty, which may weigh heavily on our stock price. Continued adverse economic conditions could have a material adverse effect on our business, financial condition and results of operations.
Economic recessions or downturns could impair our portfolio companies and harm our operating results.
Many of our portfolio companies may be susceptible to economic slowdowns or recessions and may be unable to repay our loans during these periods. Therefore, our non-performing assets may increase and the value of our portfolio may decrease during these periods as we are required to record the values of our investments. Adverse economic conditions also may decrease the value of collateral securing some of our loans and the value of our equity investments at fair value. Economic slowdowns or recessions could lead to financial losses in our portfolio and a decrease in revenues, net income and assets. Unfavorable economic conditions also could increase our funding costs, limit our access to the capital markets or result in a decision by lenders not to extend credit to us. These events could prevent us from increasing investments and harm our operating results.
A portfolio company’s failure to satisfy financial or operating covenants imposed by us or other lenders could lead to defaults and, potentially, acceleration of the time when the loans are due and foreclosure on its secured assets, which could trigger cross-defaults under other agreements and jeopardize the portfolio company’s ability to meet its obligations under the debt that we hold. We may incur additional expenses to the extent necessary to seek recovery upon default or to negotiate new terms with a defaulting portfolio company. In addition, if one of our portfolio companies were to go bankrupt, depending on the facts and circumstances, including the extent to which we actually provided significant managerial assistance to that portfolio company, a bankruptcy court might recharacterize our debt holding and subordinate all or a portion of our claim to that of other creditors.
The affect of global climate change may impact the operations of our portfolio companies.
There may be evidence of global climate change. Climate change creates physical and financial risk and some of our portfolio companies may be adversely affected by climate change. For example, the needs of customers of energy companies vary with weather conditions, primarily temperature and humidity. To the extent weather conditions are affected by climate change, energy use could increase or decrease depending on the duration and magnitude of any changes. Increases in the cost of energy could adversely affect the cost of operations of our portfolio companies if the use of energy products or services is material to their business. A decrease in energy use due to weather changes may affect some of our portfolio companies’ financial condition, through decreased revenues. Extreme weather conditions in general require more system backup, adding to costs, and can contribute to increased system stresses, including service interruptions.
24
Table of Contents
Price declines and illiquidity in the corporate debt markets may adversely affect, and may continue to adversely affect, the fair value of our portfolio investments, reducing our net asset value through increased net unrealized depreciation.
As a BDC, we are required to carry our investments at market value or, if no market value is ascertainable, at fair value as determined in good faith by or under the direction of our board of directors. Decreases in the market values or fair values of our investments are recorded as unrealized depreciation. The unprecedented declines in prices and liquidity in the corporate debt markets from 2008 through mid-2010 have resulted in significant net unrealized depreciation in our portfolio, reducing our net asset value. Depending on market conditions, we could continue to incur substantial losses in future periods, which could further reduce our net asset value and have a material adverse impact on our business, financial condition and results of operations.
Our failure to make follow-on investments in our portfolio companies could impair the value of our portfolio.
Following an initial investment in a portfolio company, we may make additional investments in that portfolio company as “follow-on” investments, in order to: (i) increase or maintain in whole or in part our equity ownership percentage; (ii) exercise warrants, options or convertible securities that were acquired in the original or subsequent financing; or (iii) attempt to preserve or enhance the value of our investment. We may elect not to make follow-on investments or otherwise lack sufficient funds to make those investments. We will have the discretion to make any follow-on investments, subject to the availability of capital resources. The failure to make follow-on investments may, in some circumstances, jeopardize the continued viability of a portfolio company and our initial investment, or may result in a missed opportunity for us to increase our participation in a successful operation. Even if we have sufficient capital to make a desired follow-on investment, we may elect not to make a follow-on investment because we may not want to increase our concentration of risk, either because we prefer other opportunities or because we are subject to BDC requirements that would prevent such follow-on investments or the desire to maintain our RIC tax status.
Because we generally do not hold controlling equity interests in our portfolio companies, we may not be in a position to exercise control over our portfolio companies or to prevent decisions by management of our portfolio companies that could decrease the value of our investments.
Although we may do so in the future, we do not currently hold controlling equity positions in our portfolio companies. As a result, we are subject to the risk that a portfolio company may make business decisions with which we disagree, and that the management and/or stockholders of a portfolio company may take risks or otherwise act in ways that are adverse to our interests. Due to the lack of liquidity of the debt and equity investments that we typically hold in our portfolio companies, we may not be able to dispose of our investments in the event we disagree with the actions of a portfolio company and may therefore suffer a decrease in the value of our investments.
An investment strategy focused primarily on privately held companies presents certain challenges, including the lack of available information about these companies, a dependence on the talents and efforts of only a few key portfolio company personnel and a greater vulnerability to economic downturns.
We invest primarily in privately held companies. Generally, little public information exists about these companies, and we are required to rely on the ability of Solar Capital Partners’ investment professionals to obtain adequate information to evaluate the potential returns from investing in these companies. If we are unable to uncover all material information about these companies, we may not make a fully informed investment decision, and we may lose money on our investments. Also, privately held companies frequently have less diverse product lines and smaller market presence than larger competitors. These factors could adversely affect our investment returns as compared to companies investing primarily in the securities of public companies.
25
Table of Contents
Our portfolio companies may incur debt that ranks equally with, or senior to, our investments in such companies.
We invest primarily in senior secured loans, mezzanine loans and equity securities issued by our portfolio companies. Our portfolio companies typically have, or may be permitted to incur, other debt that ranks equally with, or senior to, the debt securities in which we invest. By their terms, such debt instruments may provide that the holders are entitled to receive payment of interest or principal on or before the dates on which we are entitled to receive payments in respect of the debt securities in which we invest. Also, in the event of insolvency, liquidation, dissolution, reorganization or bankruptcy of a portfolio company, holders of debt instruments ranking senior to our investment in that portfolio company would typically be entitled to receive payment in full before we receive any distribution in respect of our investment. After repaying such senior creditors, such portfolio company may not have any remaining assets to use for repaying its obligation to us. In the case of debt ranking equally with debt securities in which we invest, we would have to share on an equal basis any distributions with other creditors holding such debt in the event of an insolvency, liquidation, dissolution, reorganization or bankruptcy of the relevant portfolio company.
Our investments in foreign securities may involve significant risks in addition to the risks inherent in U.S. investments.
Our investment strategy contemplates potential investments in debt securities of foreign companies. Investing in foreign companies may expose us to additional risks not typically associated with investing in U.S. companies. These risks include changes in exchange control regulations, political and social instability, expropriation, imposition of foreign taxes, less liquid markets and less available information than is generally the case in the United States, higher transaction costs, less government supervision of exchanges, brokers and issuers, less developed bankruptcy laws, difficulty in enforcing contractual obligations, lack of uniform accounting and auditing standards and greater price volatility.
Although most of our investments will be U.S. dollar-denominated, any investments denominated in a foreign currency will be subject to the risk that the value of a particular currency will change in relation to one or more other currencies. Among the factors that may affect currency values are trade balances, the level of short-term interest rates, differences in relative values of similar assets in different currencies, long-term opportunities for investment and capital appreciation, and political developments. We may employ hedging techniques to minimize these risks, but we can offer no assurance that we will, in fact, hedge currency risk, or that if we do, such strategies will be effective.
We may expose ourselves to risks if we engage in hedging transactions.
If we engage in hedging transactions, we may expose ourselves to risks associated with such transactions. We may utilize instruments such as forward contracts, currency options and interest rate swaps, caps, collars and floors to seek to hedge against fluctuations in the relative values of our portfolio positions from changes in currency exchange rates and market interest rates. Hedging against a decline in the values of our portfolio positions does not eliminate the possibility of fluctuations in the values of such positions or prevent losses if the values of such positions decline. However, such hedging can establish other positions designed to gain from those same developments, thereby offsetting the decline in the value of such portfolio positions. Such hedging transactions may also limit the opportunity for gain if the values of the underlying portfolio positions should increase. It may not be possible to hedge against an exchange rate or interest rate fluctuation that is so generally anticipated that we are not able to enter into a hedging transaction at an acceptable price. Moreover, for a variety of reasons, we may not seek to establish a perfect correlation between such hedging instruments and the portfolio holdings being hedged. Any such imperfect correlation may prevent us from achieving the intended hedge and expose us to risk of loss. In addition, it may not be possible to hedge fully or perfectly against currency fluctuations affecting the value of securities denominated in non-U.S. currencies because the value of those securities is likely to fluctuate as a result of factors not related to currency fluctuations.
26
Table of Contents
Our investment adviser may not be able to achieve the same or similar returns as those achieved by our senior investment professionals while they were employed at prior positions.
Although in the past Mr. Gross held senior positions at a number of investment firms, including Apollo Investment Corporation and Apollo Management, L.P., Mr. Gross’ track record and achievements are not necessarily indicative of future results that will be achieved by our investment adviser. In his role at such other firms, Mr. Gross was part of an investment team, and he was not solely responsible for generating investment ideas. In addition, such investment teams arrived at investment decisions by consensus.
Risks Relating to an Investment in Our Securities
Our shares may trade at a substantial discount from net asset value and may continue to do so over the long term.
Shares of closed-end investment companies have frequently traded at a market price that is less than the net asset value that is attributable to those shares. The possibility that our shares of common stock will trade at a substantial discount from net asset value over the long term is separate and distinct from the risk that our net asset value will decrease. We cannot predict whether shares of our common stock will trade above, at or below our net asset value. If our common stock trades below its net asset value, we will generally not be able to issue additional shares or sell our common stock at its market price without first obtaining the approval for such issuance from our stockholders and our independent directors. At our 2011 Annual Stockholders Meeting, subject to certain determinations required to be made by our board of directors, our stockholders approved our ability to sell or otherwise issue shares of our common stock at a price below the then current net asset value per share during a period beginning on June 9, 2011 and expiring on the earlier of the one-year anniversary of the date of the 2011 Annual Stockholders Meeting and the date of our 2012 Annual Stockholders Meeting, which is expected to be held in May 2012. If additional funds are not available to us, we could be forced to curtail or cease our new lending and investment activities, and our net asset value could decrease and our level of distributions could be impacted.
Our common stock price may be volatile and may decrease substantially.
The trading price of our common stock may fluctuate substantially. The price of our common stock that will prevail in the market may be higher or lower than the price you pay, depending on many factors, some of which are beyond our control and may not be directly related to our operating performance. These factors include, but are not limited to, the following:
| • | price and volume fluctuations in the overall stock market from time to time; |
| • | investor demand for our shares; |
| • | significant volatility in the market price and trading volume of securities of BDCs or other companies in our sector, which are not necessarily related to the operating performance of these companies; |
| • | changes in regulatory policies or tax guidelines with respect to RICs or BDCs; |
| • | failure to qualify as a RIC, or the loss of RIC status; |
| • | any shortfall in revenue or net income or any increase in losses from levels expected by investors or securities analysts; |
| • | changes, or perceived changes, in the value of our portfolio investments; |
| • | departures of Solar Capital Partners’ key personnel; |
| • | operating performance of companies comparable to us; or |
| • | general economic conditions and trends and other external factors. |
27
Table of Contents
In the past, following periods of volatility in the market price of a company’s securities, securities class action litigation has often been brought against that company. Due to the potential volatility of our stock price, we may become the target of securities litigation in the future. Securities litigation could result in substantial costs and divert management’s attention and resources from our business.
There is a risk that our stockholders may not receive distributions or that our distributions may not grow over time.
We intend to make distributions on a quarterly basis to our stockholders out of assets legally available for distribution. We cannot assure you that we will achieve investment results that will allow us to make a specified level of cash distributions or year-to-year increases in cash distributions. In addition, due to the asset coverage test applicable to us as a BDC, we may be limited in our ability to make distributions.
We may choose to pay dividends in our own common stock, in which case our stockholders may be required to pay federal income taxes in excess of the cash dividends they receive.
We may distribute taxable dividends that are payable in cash or shares of our common stock at the election of each stockholder. IRS Revenue Procedure 2010-12 temporarily allows a RIC whose stock is publicly traded on an established securities market in the United States to distribute its own stock as a dividend for the purpose of fulfilling its distribution requirements. Pursuant to this revenue procedure, a RIC may treat a distribution of its own stock as fulfilling its distribution requirements if (i) the distribution is declared on or before December 31, 2012, with respect to a taxable period ending on or before December 31, 2011, and (ii) each shareholder may elect to receive his or her entire distribution in either cash or stock of the RIC subject to a limitation on the aggregate amount of cash to be distributed to all shareholders, which limitation must be at least 10% of the aggregate declared distribution. Under Revenue Procedure 2010-12, if too many shareholders elect to receive cash, each shareholder electing to receive cash will receive a pro rata amount of cash (with the balance of the distribution paid in stock). In no event will any shareholder, electing to receive cash, receive less than 10% of his or her entire distribution in cash. If the requirements of Revenue Procedure 2010-12 are met, for U.S federal income tax purposes, the amount of the dividend paid in stock will be equal to the amount of cash that could have been received instead of stock.
Where Revenue Procedure 2010-12 is not currently applicable, the Internal Revenue Service has also issued private letter rulings on cash/stock dividends paid by RICs and real estate investment trusts using a 20% cash standard (and, more recently, the 10% cash standard of Revenue Procedure 2010-12) if certain requirements are satisfied. Stockholders receiving such dividends will be required to include the full amount of the dividend (including the portion payable in stock) as ordinary income (or, in certain circumstances, long-term capital gain) to the extent of our current and accumulated earnings and profits for federal income tax purposes. As a result, stockholders may be required to pay income taxes with respect to such dividends in excess of the cash dividends received. If a U.S. stockholder sells the common stock that it receives as a dividend in order to pay this tax, the sales proceeds may be less than the amount included in income with respect to the dividend, depending on the market price of our common stock at the time of the sale. Furthermore, with respect to non-U.S. stockholders, we may be required to withhold U.S. tax with respect to such dividends, including in respect of all or a portion of such dividend that is payable in common stock. In addition, if a significant number of our stockholders determine to sell shares of our common stock in order to pay taxes owed on dividends, it may put downward pressure on the trading price of our common stock. It is unclear whether and to what extent we will be able to pay taxable dividends of the type described in this paragraph (whether pursuant to Revenue Procedure 2010-12, a private letter ruling or otherwise).
28
Table of Contents
Sales of substantial amounts of our common stock in the public market may have an adverse effect on the market price of our common stock.
The shares of our common stock beneficially owned by each of Messrs. Gross and Spohler immediately prior to completion of our initial public offering, including any shares that are attributable to such shares issued pursuant to our dividend reinvestment plan, are no longer subject to lock-up restrictions that each of Messrs. Gross and Spohler agreed to in connection with our initial public offering, and are generally available for resale without restriction, subject to the provisions of Rule 144 promulgated under the Securities Act. In addition, on November 30, 2010, Messrs. Gross and Spohler jointly acquired 115,000 shares of our common stock in a private placement transaction conducted in accordance with Regulation D under the Securities Act. Such shares have been registered with the SEC and are generally available for resale. Sales of substantial amounts of our common stock, or the availability of such common stock for sale, could adversely affect the prevailing market prices for our common stock. If this occurs and continues, it could impair our ability to raise additional capital through the sale of securities should we desire to do so.
Risks Relating to Our Business and Structure
We are dependent upon Solar Capital Partners’ key personnel for our future success.
We depend on the diligence, skill and network of business contacts of Messrs. Gross and Spohler, who serve as the managing member and a partner of Solar Capital Partners, respectively, and who lead Solar Capital Partners’ investment team. Messrs. Gross and Spohler, together with the other dedicated investment professionals available to Solar Capital Partners, evaluate, negotiate, structure, close and monitor our investments. Our future success will depend on the continued service of Messrs. Gross and Spohler and the other investment professionals available to Solar Capital Partners. We cannot assure you that unforeseen business, medical, personal or other circumstances would not lead any such individual to terminate his relationship with us. The loss of Mr. Gross or Mr. Spohler, or any of the other senior investment professionals who serve on Solar Capital Partners’ investment team, could have a material adverse effect on our ability to achieve our investment objective as well as on our financial condition and results of operations. In addition, we can offer no assurance that Solar Capital Partners will remain our investment adviser.
The senior investment professionals of Solar Capital Partners are and may in the future become affiliated with entities engaged in business activities similar to those intended to be conducted by us, and may have conflicts of interest in allocating their time. We expect that Messrs. Gross and Spohler will dedicate a significant portion of their time to the activities of Solar Capital; however, they may be engaged in other business activities which could divert their time and attention in the future.
Our business model depends to a significant extent upon strong referral relationships with financial sponsors, and the inability of the senior investment professionals of our investment adviser to maintain or develop these relationships, or the failure of these relationships to generate investment opportunities, could adversely affect our business.
We expect that the principals of our investment adviser will maintain and develop their relationships with financial sponsors, and we will rely to a significant extent upon these relationships to provide us with potential investment opportunities. If the senior investment professionals of our investment adviser fail to maintain their existing relationships or develop new relationships with other sponsors or sources of investment opportunities, we will not be able to grow our investment portfolio. In addition, individuals with whom the senior investment professionals of our investment adviser have relationships are not obligated to provide us with investment opportunities, and, therefore, there is no assurance that such relationships will generate investment opportunities for us.
29
Table of Contents
A disruption in the capital markets and the credit markets could negatively affect our business.
As a BDC, we must maintain our ability to raise additional capital for investment purposes. Without sufficient access to the capital markets or credit markets, we may be forced to curtail our business operations or we may not be able to pursue new business opportunities. Disruptive conditions in the financial industry and the impact of new legislation in response to those conditions could restrict our business operations and could adversely impact our results of operations and financial condition.
If the fair value of our assets declines substantially, we may fail to maintain the asset coverage ratios imposed upon us by the 1940 Act. Any such failure would affect our ability to issue senior securities, including borrowings, and pay dividends, which could materially impair our business operations. Our liquidity could be impaired further by an inability to access the capital markets or to draw on our credit facilities. For example, we cannot be certain that we will be able to renew our credit facilities as they mature or to consummate new borrowing facilities to provide capital for normal operations, including new originations. Reflecting concern about the stability of the financial markets, many lenders and institutional investors have reduced or ceased providing funding to borrowers. This market turmoil and tightening of credit have led to increased market volatility and widespread reduction of business activity generally.
If we are unable to renew or replace such facilities and consummate new facilities on commercially reasonable terms, our liquidity will be reduced significantly. If we are unable to repay amounts outstanding under such facilities and are declared in default or are unable to renew or refinance these facilities, we would not be able to initiate significant originations or to operate our business in the normal course. These situations may arise due to circumstances that we may be unable to control, such as inaccessibility to the credit markets, a severe decline in the value of the U.S. dollar, a further economic downturn or an operational problem that affects third parties or us, and could materially damage our business. Moreover, we are unable to predict when economic and market conditions may become more favorable. Even if such conditions improve broadly and significantly over the long term, adverse conditions in particular sectors of the financial markets could adversely impact our business.
Our financial condition and results of operations will depend on our ability to manage future growth effectively.
Our ability to achieve our investment objective and to grow depends on Solar Capital Partners’ ability to identify, invest in and monitor companies that meet our investment criteria.
Accomplishing this result on a cost-effective basis is largely a function of Solar Capital Partners’ structuring of the investment process, its ability to provide competent, attentive and efficient services to us and its ability to access financing for us on acceptable terms. The investment team of Solar Capital Partners has substantial responsibilities under the Investment Advisory and Management Agreement, and they may also be called upon to provide managerial assistance to our portfolio companies as the principals of our administrator. Such demands on their time may distract them or slow our rate of investment. In order to grow, we and Solar Capital Partners will need to retain, train, supervise and manage new investment professionals. However, we can offer no assurance that any such investment professionals will contribute effectively to the work of the investment adviser. Any failure to manage our future growth effectively could have a material adverse effect on our business, financial condition and results of operations.
Any failure on our part to maintain our status as a BDC would reduce our operating flexibility.
The 1940 Act imposes numerous constraints on the operations of BDCs. For example, BDCs are required to invest at least 70% of their total assets in specified types of securities, primarily in private companies or thinly-traded U.S. public companies, cash, cash equivalents, U.S. government securities and other high quality debt investments that mature in one year or less. Furthermore, any failure to comply with the requirements imposed
30
Table of Contents
on BDCs by the 1940 Act could cause the SEC to bring an enforcement action against us and/or expose us to claims of private litigants. In addition, upon approval of a majority of our stockholders, we may elect to withdraw our status as a BDC. If we decide to withdraw our election, or if we otherwise fail to qualify, or maintain our qualification, as a BDC, we may be subject to the substantially greater regulation under the 1940 Act as a closed-end investment company. Compliance with such regulations would significantly decrease our operating flexibility, and could significantly increase our costs of doing business.
Regulations governing our operation as a BDC affect our ability to, and the way in which we, raise additional capital. As a BDC, the necessity of raising additional capital may expose us to risks, including the typical risks associated with leverage.
We may issue debt securities or preferred stock and/or borrow money from banks or other financial institutions, which we refer to collectively as “senior securities,” up to the maximum amount permitted by the 1940 Act. Under the provisions of the 1940 Act, we will be permitted, as a BDC, to issue senior securities in amounts such that our asset coverage ratio, as defined in the 1940 Act, equals at least 200% of gross assets less all liabilities and indebtedness not represented by senior securities, after each issuance of senior securities. If the value of our assets declines, we may be unable to satisfy this test. If that happens, we may be required to sell a portion of our investments and, depending on the nature of our leverage, repay a portion of our indebtedness at a time when such sales may be disadvantageous. Also, any amounts that we use to service our indebtedness would not be available for distributions to our common stockholders. Furthermore, as a result of issuing senior securities, we would also be exposed to typical risks associated with leverage, including an increased risk of loss.
As of December 31, 2011, we had $201.4 million outstanding under our credit facilities and $35 million outstanding under our term loan (the “Term Loan”). If we issue preferred stock, the preferred stock would rank “senior” to common stock in our capital structure, preferred stockholders would have separate voting rights on certain matters and might have other rights, preferences, or privileges more favorable than those of our common stockholders, and the issuance of preferred stock could have the effect of delaying, deferring or preventing a transaction or a change of control that might involve a premium price for holders of our common stock or otherwise be in your best interest.
We are not generally able to issue and sell our common stock at a price below net asset value per share. We may, however, sell our common stock, or warrants, options or rights to acquire our common stock, at a price below the then-current net asset value per share of our common stock if our board of directors determines that such sale is in the best interests of Solar Capital and its stockholders, and our stockholders approve such sale. In any such case, the price at which our securities are to be issued and sold may not be less than a price that, in the determination of our board of directors, closely approximates the market value of such securities (less any distributing commission or discount). If we raise additional funds by issuing more common stock or senior securities convertible into, or exchangeable for, our common stock, then the percentage ownership of our stockholders at that time will decrease, and you might experience dilution. At our 2011 Annual Stockholders Meeting, subject to certain determinations required to be made by our board of directors, our stockholders approved our ability to sell or otherwise issue shares of our common stock at a price below the then current net asset value per share during a period beginning on June 9, 2011 and expiring on the earlier of the one-year anniversary of the date of the 2011 Annual Stockholders Meeting and the date of our 2012 Annual Stockholders Meeting, which is expected to be held in May 2012.
We may borrow money, which would magnify the potential for gain or loss on amounts invested and may increase the risk of investing in us.
The use of leverage magnifies the potential for gain or loss on amounts invested and, therefore, increases the risks associated with investing in our securities. As of December 31, 2011, we had $201.4 million outstanding under our credit facilities and $35 million outstanding under our Term Loan. We may borrow from and issue
31
Table of Contents
senior debt securities to banks, insurance companies and other lenders in the future. Lenders of these senior securities, including our credit facilities and our Term Loan, will have fixed dollar claims on our assets that are superior to the claims of our common stockholders, and we would expect such lenders to seek recovery against our assets in the event of a default. If the value of our assets decreases, leveraging would cause net asset value to decline more sharply than it otherwise would have had we not leveraged. Similarly, any decrease in our income would cause net income to decline more sharply than it would have had we not borrowed. Such a decline could also negatively affect our ability to make dividend payments on our common stock. Leverage is generally considered a speculative investment technique. Our ability to service any debt that we incur will depend largely on our financial performance and will be subject to prevailing economic conditions and competitive pressures. Moreover, as the management fee payable to our investment adviser, Solar Capital Partners, will be payable based on our gross assets, including those assets acquired through the use of leverage, Solar Capital Partners will have a financial incentive to incur leverage which may not be consistent with our stockholders’ interests. In addition, our common stockholders will bear the burden of any increase in our expenses as a result of leverage, including any increase in the management fee payable to Solar Capital Partners.
As a BDC, we generally are required to meet a coverage ratio of total assets to total borrowings and other senior securities, which include all of our borrowings and any preferred stock that we may issue in the future, of at least 200%. If this ratio declines below 200%, we may not be able to incur additional debt and could be required by law to sell a portion of our investments to repay some debt when it is disadvantageous to do so, which could have a material adverse effect on our operations, and we may not be able to make distributions. The amount of leverage that we employ will depend on our investment adviser’s and our board of directors’ assessment of market and other factors at the time of any proposed borrowing. We cannot assure you that we will be able to obtain credit at all or on terms acceptable to us.
In addition, our credit facilities and Term Loan impose, and any other debt facility into which we may enter would likely impose financial and operating covenants that restrict our business activities, including limitations that could hinder our ability to finance additional loans and investments or to make the distributions required to maintain our status as a RIC under Subchapter M of the Code.
As of December 31, 2011, we had $201.4 million outstanding under our credit facilities and $35 million outstanding under our Term Loan.
Illustration. The following table illustrates the effect of leverage on returns from an investment in our common stock assuming various annual returns on the portfolio, net of expenses. The calculations in the table below are hypothetical and actual returns may be higher or lower than those appearing in the table below.
| Assumed total return on our portfolio (net of expenses) |
||||||||||||||||||||
| (10 )% | (5 )% | 0% | 5 % | 10 % | ||||||||||||||||
| Corresponding return to stockholder(1) |
(14.5 | )% | (7.8 | )% | (1.1 | )% | 5.6 | % | 12.3 | % | ||||||||||
| (1) | Assumes $1.08 billion in total assets and $236.4 million in total debt outstanding, which reflects our total assets and total debt outstanding as of December 31, 2011, and a cost of funds of 3.7%. Excludes non-leverage related liabilities. |
To the extent we use debt or preferred stock to finance our investments, changes in interest rates will affect our cost of capital and net investment income.
To the extent we borrow money, or issue preferred stock, to make investments, our net investment income will depend, in part, upon the difference between the rate at which we borrow funds or pay dividends on preferred stock and the rate at which we invest those funds. As a result, we can offer no assurance that a significant change in market interest rates will not have a material adverse effect on our net investment income in the event we use debt to finance our investments. In periods of rising interest rates, our cost of funds would
32
Table of Contents
increase, except to the extent we issue fixed rate debt or preferred stock, which could reduce our net investment income. We expect that our long-term fixed-rate investments will be financed primarily with equity and long-term debt. We may use interest rate risk management techniques in an effort to limit our exposure to interest rate fluctuations. Such techniques may include various interest rate hedging activities to the extent permitted by the 1940 Act.
You should also be aware that a rise in the general level of interest rates can be expected to lead to higher interest rates applicable to our debt investments. Accordingly, an increase in interest rates would make it easier for us to meet or exceed the incentive fee hurdle rate and may result in a substantial increase of the amount of incentive fees payable to our investment adviser with respect to our pre-incentive fee net investment income.
As of December 31, 2011, we had $201.4 million outstanding under our credit facilities and $35 million outstanding under our Term Loan.
We may in the future determine to fund a portion of our investments with preferred stock, which would magnify the potential for gain or loss and the risks of investing in us in the same way as our borrowings.
Preferred stock, which is another form of leverage, has the same risks to our common stockholders as borrowings because the dividends on any preferred stock we issue must be cumulative. Payment of such dividends and repayment of the liquidation preference of such preferred stock must take preference over any dividends or other payments to our common stockholders and preferred stockholders are not subject to any of our expenses or losses and are not entitled to participate in any income or appreciation in excess of their stated preference.
There will be uncertainty as to the value of our portfolio investments.
A large percentage of our portfolio investments are in the form of securities that are not publicly traded. The fair value of securities and other investments that are not publicly traded may not be readily determinable. We value these securities on a quarterly basis in accordance with our valuation policy, which is at all times consistent with GAAP. Our board of directors utilizes the services of third-party valuation firms to aid it in determining the fair value of these securities. The board of directors discusses valuations and determines the fair value in good faith based on the input of our investment adviser and the respective third-party valuation firms. The factors that may be considered in fair value pricing our investments include the nature and realizable value of any collateral, the portfolio company’s ability to make payments and its earnings, the markets in which the portfolio company does business, comparisons to publicly traded companies, discounted cash flow and other relevant factors. Because such valuations, and particularly valuations of private securities and private companies, are inherently uncertain, may fluctuate over short periods of time and may be based on estimates, our determinations of fair value may differ materially from the values that would have been used if a ready market for these securities existed. Our net asset value could be adversely affected if our determinations regarding the fair value of our investments were materially higher than the values that we ultimately realize upon the disposal of such securities.
We may experience fluctuations in our quarterly results.
We could experience fluctuations in our quarterly operating results due to a number of factors, including the interest rate payable on the debt securities we acquire, the default rate on such securities, the level of our expenses, variations in and the timing of the recognition of realized and unrealized gains or losses, the degree to which we encounter competition in our markets and general economic conditions. As a result of these factors, results for any period should not be relied upon as being indicative of performance in future periods.
There are significant potential conflicts of interest which could impact our investment returns.
Our executive officers and directors, as well as the current and future partners of our investment adviser, Solar Capital Partners, may serve as officers, directors or principals of entities that operate in the same or a
33
Table of Contents
related line of business as we do. For example, Solar Capital Partners presently serves as investment adviser to Solar Senior Capital Ltd., a publicly-traded BDC which focuses on investing primarily in senior secured loans, including first lien, unitranche and second lien debt instruments. In addition, Michael S. Gross, our chairman and chief executive officer, Bruce Spohler, our chief operating officer, and Nicholas Radesca, our chief financial officer, serve in similar capacities for Solar Senior Capital Ltd. Accordingly, they may have obligations to investors in those entities, the fulfillment of which obligations might not be in the best interests of us or our stockholders. In addition, we note that any affiliated investment vehicle formed in the future and managed by our investment adviser or its affiliates may, notwithstanding different stated investment objectives, have overlapping investment objectives with our own and, accordingly, may invest in asset classes similar to those targeted by us. As a result, Solar Capital Partners may face conflicts in allocating investment opportunities between us and such other entities. Although Solar Capital Partners will endeavor to allocate investment opportunities in a fair and equitable manner, it is possible that, in the future, we may not be given the opportunity to participate in investments made by investment funds managed by our investment adviser or an investment manager affiliated with our investment adviser. In any such case, when Solar Capital Partners identifies an investment, it will be forced to choose which investment fund should make the investment.
If our investment adviser forms other affiliates in the future, we may co-invest on a concurrent basis with such other affiliates, subject to compliance with applicable regulations and regulatory guidance and our allocation procedures.
In the course of our investing activities, we pay management and incentive fees to Solar Capital Partners and reimburse Solar Capital Partners for certain expenses it incurs. As a result, investors in our common stock will invest on a “gross” basis and receive distributions on a “net” basis after expenses, resulting in a lower rate of return than an investor might achieve through direct investments. Accordingly, there may be times when the management team of Solar Capital Partners has interests that differ from those of our stockholders, giving rise to a conflict.
We have entered into a royalty-free license agreement with our investment adviser, pursuant to which our investment adviser has granted us a non-exclusive license to use the name “Solar Capital.” Under the license agreement, we have the right to use the “Solar Capital” name for so long as Solar Capital Partners or one of its affiliates remains our investment adviser. In addition, we pay Solar Capital Management, an affiliate of Solar Capital Partners, our allocable portion of overhead and other expenses incurred by Solar Capital Management in performing its obligations under the Administration Agreement, including rent, the fees and expenses associated with performing compliance functions, and our allocable portion of the compensation of our chief financial officer and any administrative support staff. These arrangements create conflicts of interest that our board of directors must monitor.
We may be obligated to pay our investment adviser incentive compensation even if we incur a loss.
Our investment adviser will be entitled to incentive compensation for each fiscal quarter in an amount equal to a percentage of the excess of our pre-incentive fee net investment income for that quarter (before deducting incentive compensation) above a performance threshold for that quarter. Accordingly, since the performance threshold is based on a percentage of our net asset value, decreases in our net asset value make it easier to achieve the performance threshold. Our pre-incentive fee net investment income for incentive compensation purposes excludes realized and unrealized capital losses or depreciation that we may incur in the fiscal quarter, even if such capital losses or depreciation result in a net loss on our statement of operations for that quarter. Thus, we may be required to pay Solar Capital Partners incentive compensation for a fiscal quarter even if there is a decline in the value of our portfolio or we incur a net loss for that quarter.
Our incentive fee may induce Solar Capital Partners to pursue speculative investments.
The incentive fee payable by us to Solar Capital Partners may create an incentive for Solar Capital Partners to pursue investments on our behalf that are riskier or more speculative than would be the case in the absence of
34
Table of Contents
such compensation arrangement. The incentive fee payable to our investment adviser is calculated based on a percentage of our return on invested capital. This may encourage our investment adviser to use leverage to increase the return on our investments. Under certain circumstances, the use of leverage may increase the likelihood of default, which would impair the value of our common stock. In addition, the investment adviser receives the incentive fee based, in part, upon net capital gains realized on our investments. Unlike that portion of the incentive fee based on income, there is no hurdle rate applicable to the portion of the incentive fee based on net capital gains. As a result, the investment adviser may have a tendency to invest more capital in investments that are likely to result in capital gains as compared to income producing securities. Such a practice could result in our investing in more speculative securities than would otherwise be the case, which could result in higher investment losses, particularly during economic downturns.
The incentive fee payable by us to our investment adviser also may induce Solar Capital Partners to invest on our behalf in instruments that have a deferred interest feature, even if such deferred payments would not provide cash necessary to enable us to pay current distributions to our shareholders. Under these investments, we would accrue interest over the life of the investment but would not receive the cash income from the investment until the end of the term. Our net investment income used to calculate the income portion of our investment fee, however, includes accrued interest. Thus, a portion of this incentive fee would be based on income that we have not yet received in cash. In addition, the “catch-up” portion of the incentive fee may encourage Solar Capital Partners to accelerate or defer interest payable by portfolio companies from one calendar quarter to another, potentially resulting in fluctuations in timing and dividend amounts.
We may invest, to the extent permitted by law, in the securities and instruments of other investment companies, including private funds, and, to the extent we so invest, will bear our ratable share of any such investment company’s expenses, including management and performance fees. We will also remain obligated to pay management and incentive fees to Solar Capital Partners with respect to the assets invested in the securities and instruments of other investment companies. With respect to each of these investments, each of our stockholders will bear his or her share of the management and incentive fee of Solar Capital Partners as well as indirectly bearing the management and performance fees and other expenses of any investment companies in which we invest.
We will become subject to corporate-level income tax if we are unable to qualify and maintain our qualification as a regulated investment company under Subchapter M of the Code.
Although we have elected to be treated as a RIC under Subchapter M of the Code, no assurance can be given that we will be able to qualify for and maintain RIC status. To maintain RIC tax treatment under the Code, we must meet the following annual distribution, income source and asset diversification requirements.
| • | The annual distribution requirement for a RIC will be satisfied if we distribute to our stockholders on an annual basis at least 90% of our net ordinary income and realized net short-term capital gains in excess of realized net long-term capital losses, if any. Because we may use debt financing, we are subject to certain asset coverage ratio requirements under the 1940 Act and financial covenants under loan and credit agreements that could, under certain circumstances, restrict us from making distributions necessary to satisfy the distribution requirement. If we are unable to obtain cash from other sources, we could fail to qualify for RIC tax treatment and thus become subject to corporate-level income tax. |
| • | The income source requirement will be satisfied if we obtain at least 90% of our income for each year from dividends, interest, gains from the sale of stock or securities or similar sources. |
| • | The asset diversification requirement will be satisfied if we meet certain asset diversification requirements at the end of each quarter of our taxable year. Failure to meet those requirements may result in our having to dispose of certain investments quickly in order to prevent the loss of RIC status. Because most of our investments will be in private companies, and therefore will be relatively illiquid, any such dispositions could be made at disadvantageous prices and could result in substantial losses. |
35
Table of Contents
If we fail to qualify for RIC tax treatment for any reason and become subject to corporate income tax, the resulting corporate taxes could substantially reduce our net assets, the amount of income available for distribution and the amount of our distributions.
We may have difficulty satisfying the annual distribution requirement in order to qualify and maintain RIC status if we recognize income before or without receiving cash representing such income.
For federal income tax purposes, we will include in income certain amounts that we have not yet received in cash, such as original issue discount, which may arise if we receive warrants in connection with the making of a loan or possibly in other circumstances, or contracted “payment in kind,” or PIK, interest, which represents contractual interest added to the loan balance and due at the end of the loan term. We also may be required to include in income certain other amounts that we will not receive in cash.
Because in certain cases we may recognize income before or without receiving cash representing such income, we may have difficulty satisfying the annual distribution requirement applicable to RICs. Accordingly, we may have to sell some of our investments at times we would not consider advantageous, raise additional debt or equity capital or reduce new investments to meet these distribution requirements. If we are not able to obtain cash from other sources, we may fail to qualify for RIC tax treatment and thus be subject to corporate-level income tax.
Our board of directors is authorized to reclassify any unissued shares of common stock into one or more classes of preferred stock, which could convey special rights and privileges to its owners.
Under Maryland General Corporation Law and our charter, our board of directors is authorized to classify and reclassify any authorized but unissued shares of stock into one or more classes of stock, including preferred stock. Prior to issuance of shares of each class or series, the board of directors is required by Maryland law and our charter to set the terms, preferences, conversion or other rights, voting powers, restrictions, limitations as to dividends or other distributions, qualifications and terms or conditions of redemption for each class or series. Thus, the board of directors could authorize the issuance of shares of preferred stock with terms and conditions which could have the effect of delaying, deferring or preventing a transaction or a change in control that might involve a premium price for holders of our common stock or otherwise be in their best interest. The cost of any such reclassification would be borne by our existing common stockholders. Certain matters under the 1940 Act require the separate vote of the holders of any issued and outstanding preferred stock. For example, holders of preferred stock would vote separately from the holders of common stock on a proposal to cease operations as a BDC. In addition, the 1940 Act provides that holders of preferred stock are entitled to vote separately from holders of common stock to elect two preferred stock directors. We currently have no plans to issue preferred stock. The issuance of preferred shares convertible into shares of common stock might also reduce the net income and net asset value per share of our common stock upon conversion, provided, that we will only be permitted to issue such convertible preferred stock to the extent we comply with the requirements of Section 61 of the 1940 Act, including obtaining common stockholder approval. These effects, among others, could have an adverse effect on your investment in our common stock.
Provisions of the Maryland General Corporation Law and of our charter and bylaws could deter takeover attempts and have an adverse impact on the price of our common stock.
The Maryland General Corporation Law and our charter and bylaws contain provisions that may discourage, delay or make more difficult a change in control of Solar Capital or the removal of our directors. We are subject to the Maryland Business Combination Act, subject to any applicable requirements of the 1940 Act. Our board of directors has adopted a resolution exempting from the Business Combination Act any business combination between us and any other person, subject to prior approval of such business combination by our board, including approval by a majority of our disinterested directors. If the resolution exempting business combinations is repealed or our board does not approve a business combination, the Business Combination Act may discourage
36
Table of Contents
third parties from trying to acquire control of us and increase the difficulty of consummating such an offer. Our bylaws exempt from the Maryland Control Share Acquisition Act acquisitions of our stock by any person. If we amend our bylaws to repeal the exemption from the Control Share Acquisition Act, the Control Share Acquisition Act also may make it more difficult for a third party to obtain control of us and increase the difficulty of consummating such a transaction.
We have also adopted measures that may make it difficult for a third party to obtain control of us, including provisions of our charter classifying our board of directors in three classes serving staggered three-year terms, and authorizing our board of directors to classify or reclassify shares of our stock in one or more classes or series, to cause the issuance of additional shares of our stock, to amend our charter without stockholder approval and to increase or decrease the number of shares of stock that we have authority to issue. These provisions, as well as other provisions of our charter and bylaws, may delay, defer or prevent a transaction or a change in control that might otherwise be in the best interests of our stockholders.
Our board of directors may change our investment objective, operating policies and strategies without prior notice or stockholder approval.
Our board of directors has the authority to modify or waive certain of our operating policies and strategies without prior notice (except as required by the 1940 Act) and without stockholder approval. However, absent stockholder approval, we may not change the nature of our business so as to cease to be, or withdraw our election as, a BDC. We cannot predict the effect any changes to our current operating policies and strategies would have on our business, operating results and value of our stock. Nevertheless, the effects may adversely affect our business and impact our ability to make distributions.
The impact of recent financial reform legislation on us is uncertain.
In light of recent conditions in the U.S. and global financial markets, legislators, the presidential administration and regulators have increased their focus on the regulation of the financial services industry. The Dodd-Frank Wall Street Reform and Consumer Protection Act (the “Dodd-Frank Reform Act”) became effective on July 21, 2010; although many provisions of the Dodd-Frank Reform Act have delayed effectiveness or will not become effective until the relevant federal agencies issue new rules to implement the Dodd-Frank Reform Act. Nevertheless, the Dodd-Frank Reform Act may have a material adverse impact on the financial services industry as a whole and on our business, results of operations and financial condition. Accordingly, we cannot predict the effect the Dodd-Frank Act or its implementing regulations will have on our business, results of operations or financial condition.
Changes in laws or regulations governing our operations may adversely affect our business.
We and our portfolio companies are subject to regulation by laws at the local, state and federal levels. These laws and regulations, as well as their interpretation, may be changed from time to time. Accordingly, any change in these laws or regulations could have a material adverse affect on our business.
Our investment adviser can resign on 60 days’ notice, and we may not be able to find a suitable replacement within that time, resulting in a disruption in our operations that could adversely affect our financial condition, business and results of operations.
Our investment adviser has the right, under the Investment Advisory and Management Agreement, to resign at any time upon 60 days’ written notice, whether we have found a replacement or not. If our investment adviser resigns, we may not be able to find a new investment adviser or hire internal management with similar expertise and ability to provide the same or equivalent services on acceptable terms within 60 days, or at all. If we are unable to do so quickly, our operations are likely to experience a disruption, our financial condition, business and results of operations as well as our ability to pay distributions are likely to be adversely affected and the market
37
Table of Contents
price of our shares may decline. In addition, the coordination of our internal management and investment activities is likely to suffer if we are unable to identify and reach an agreement with a single institution or group of executives having the expertise possessed by our investment adviser and its affiliates. Even if we are able to retain comparable management, whether internal or external, the integration of such management and their lack of familiarity with our investment objective may result in additional costs and time delays that may adversely affect our financial condition, business and results of operations.
| Item 1B. | Unresolved Staff Comments |
None
| Item 2. | Properties |
Our executive offices are located at 500 Park Avenue, New York, New York 10022, and are provided by Solar Capital Management in accordance with the terms of the Administration Agreement. We believe that our office facilities are suitable and adequate for our business as it is contemplated to be conducted.
| Item 3. | Legal Proceedings |
We, Solar Capital Management, LLC and Solar Capital Partners, LLC are not currently subject to any material pending legal proceedings threatened against us. From time to time, we may be a party to certain legal proceedings incidental to the normal course of our business including the enforcement of our rights under contracts with our portfolio companies. While the outcome of these legal proceedings cannot be predicted with certainty, we do not expect that these proceedings will have a material effect upon our business, financial condition or results of operations.
| Item 4. | Mine Safety Disclosures |
Not applicable.
38
Table of Contents
PART II
| Item 5. | Market for Registrant’s Common Equity, Related Stockholder Matters and Issuer Purchases of Equity Securities |
Price Range of Common Stock
Our common stock is traded on the NASDAQ Global Select Market under the symbol “SLRC”. The following table sets forth, for each fiscal quarter since our initial public offering on February 9, 2010, the net asset value (“NAV”) per share of our common stock, the high and low sales prices for our common stock, such sales prices as a percentage of NAV per share and quarterly distributions per share.
| NAV(1) | Sales Price | Premium or Discount of High Sales Price to NAV(2) |
Premium or Discount of Low Sales Price to NAV(2) |
Declared Dividends(3) |
||||||||||||||||||||
| High | Low | |||||||||||||||||||||||
| Fiscal 2011 |
||||||||||||||||||||||||
| Fourth Quarter |
$ | 22.02 | $ | 23.66 | $ | 18.90 | 107.4 | % | 85.8 | % | $ | 0.60 | ||||||||||||
| Third Quarter |
21.20 | 25.16 | 19.17 | 118.7 | % | 90.4 | % | 0.60 | ||||||||||||||||
| Second Quarter |
23.22 | 25.93 | 23.92 | 111.7 | % | 103.0 | % | 0.60 | ||||||||||||||||
| First Quarter |
23.48 | 25.45 | 21.87 | 108.4 | % | 93.1 | % | 0.60 | ||||||||||||||||
| Fiscal 2010 |
||||||||||||||||||||||||
| Fourth Quarter |
$ | 22.73 | $ | 25.39 | $ | 21.32 | 111.7 | % | 93.8 | % | $ | 0.60 | ||||||||||||
| Third Quarter |
22.09 | 21.80 | 18.75 | 98.7 | % | 84.9 | % | 0.60 | ||||||||||||||||
| Second Quarter |
22.07 | 24.20 | 18.77 | 109.7 | % | 85.0 | % | 0.60 | ||||||||||||||||
| First Quarter(4) |
22.18 | 22.22 | 17.29 | 100.2 | % | 78.0 | % | 0.34 | ||||||||||||||||
| (1) | NAV per share is determined as of the last day in the relevant quarter and therefore may not reflect the NAV per share on the date of the high and low sales prices. The NAVs shown are based on outstanding shares at the end of each period. |
| (2) | Calculated as of the respective high or low sales price divided by the quarter end NAV. |
| (3) | Represents the cash dividend declared in the specified quarter. |
| (4) | The period from February 9, 2010 through March 31, 2010. |
Shares of BDCs may trade at a market price that is less than the value of the net assets attributable to those shares. The possibility that our shares of common stock will trade at a discount from net asset value or at premiums that are unsustainable over the long term are separate and distinct from the risk that our net asset value will decrease. Since our initial public offering on February 9, 2010, our shares of common stock have traded at both a discount and a premium to the net assets attributable to those shares.
The last reported closing market price of our common stock on February 21, 2012 was $23.42 per share. As of February 21, 2012, we had 16 stockholders of record.
DIVIDENDS
We intend to continue to distribute quarterly dividends to our stockholders. Our quarterly dividends, if any, will be determined by our board of directors.
We have elected to be taxed as a RIC under Subchapter M of the Code. To maintain our RIC status, we must distribute at least 90% of our ordinary income and realized net short-term capital gains in excess of realized net long-term capital losses, if any, out of the assets legally available for distribution. In addition, although we currently intend to distribute realized net capital gains (i.e., net long-term capital gains in excess of short-term capital losses), if any, at least annually, out of the assets legally available for such distributions, we may in the future decide to retain such capital gains for investment.
39
Table of Contents
We maintain an “opt out” dividend reinvestment plan for our common stockholders. As a result, if we declare a dividend, then stockholders’ cash dividends will be automatically reinvested in additional shares of our common stock, unless they specifically “opt out” of the dividend reinvestment plan so as to receive cash dividends.
We may not be able to achieve operating results that will allow us to make dividends and distributions at a specific level or to increase the amount of these dividends and distributions from time to time. In addition, we may be limited in our ability to make dividends and distributions due to the asset coverage test for borrowings when applicable to us as a business development company under the 1940 Act and due to provisions in current and future credit facilities. If we do not distribute a certain percentage of our income annually, we will suffer adverse tax consequences, including possible loss of our RIC status. We cannot assure stockholders that they will receive any dividends and distributions or dividends and distributions at a particular level.
All dividends declared in cash payable to stockholders that are participants in our dividend reinvestment plan are generally automatically reinvested in shares of our common stock. As a result, stockholders that do not participate in the dividend reinvestment plan may experience dilution over time. Stockholders who do not elect to receive dividends in shares of common stock may experience accretion to the net asset value of their shares if our shares are trading at a premium and dilution if our shares are trading at a discount. The level of accretion or discount would depend on various factors, including the proportion of our stockholders who participate in the plan, the level of premium or discount at which our shares are trading and the amount of the dividend payable to a stockholder.
The following table lists the quarterly dividends per share of our common stock since our initial public offering on February 9, 2010.
| Date Declared |
Record Date | Payment Date | Amount | |||||
| Fiscal 2011 |
||||||||
| November 1, 2011 |
December 15, 2011 | December 29, 2011 | $ | 0.60 | ||||
| August 2, 2011 |
September 20,2011 | October 4, 2011 | 0.60 | |||||
| May 2, 2011 |
June 17, 2011 | July 5, 2011 | 0.60 | |||||
| March 1, 2011 |
March 17, 2011 | April 4, 2011 | 0.60 | |||||
|
|
|
|||||||
| Total 2011 |
$ | 2.40 | ||||||
|
|
|
|||||||
| Fiscal 2010 |
||||||||
| November 2, 2010 |
December 17, 2010 | December 30, 2010 | $ | 0.60 | ||||
| August 3, 2010 |
September 17, 2010 | October 4, 2010 | 0.60 | |||||
| May 4, 2010 |
June 17, 2010 | July 2, 2010 | 0.60 | |||||
| January 26, 2010 |
March 18, 2010 | April 1, 2010 | 0.34 | |||||
|
|
|
|||||||
| Total 2010 |
$ | 2.14 | ||||||
|
|
|
|||||||
Sale of Unregistered Securities
During the year ended December 31, 2011, we issued 224,880 shares of common stock under our dividend reinvestment plan. This issuance was not subject to the registration requirements under the Securities Act. The aggregate value of the shares of common stock issued under our dividend reinvestment plan during 2011 was approximately $5.2 million.
Other than shares issued under our dividend reinvestment plan, during the year ended December 31, 2011, we did not sell any unregistered equity securities and we did not repurchase any of our equity securities.
40
Table of Contents
STOCK PERFORMANCE GRAPH
This graph compares the return on our common stock with that of the S&P 500 Index and the Russell 2000 Index, for the period from February 9, 2010 (the date that shares of our common stock began trading on NASDAQ Global Select Market) through December 31, 2011. The graph assumes that, on February 9, 2010, a person invested $100 in each of the following: our common stock (SLRC), the S&P 500 Index, and the Russell 2000 Index. The graph measures total stockholder return, which takes into account both changes in stock price and dividends. It assumes that dividends paid are invested in like securities.
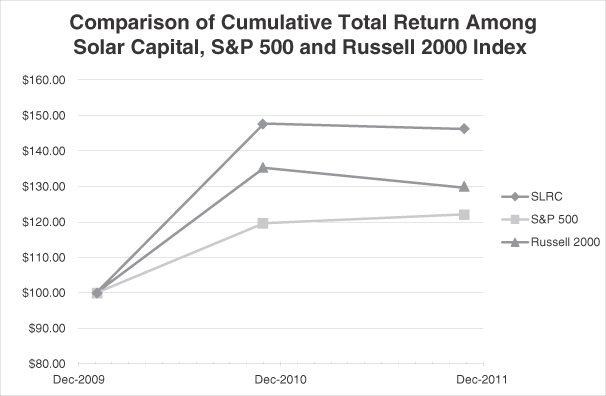
The graph and other information furnished under this Part II Item 5 of this Form 10-K shall not be deemed to be “soliciting material” or to be “filed” with the SEC or subject to Regulation 14A or 14C, or to the liabilities of Section 18 of the 1934 Act. The stock price performance included in the above graph is not necessarily indicative of future stock price performance.
41
Table of Contents
| Item 6. | Selected Financial Data |
The selected financial and other data below should be read in conjunction with our “Management’s Discussion and Analysis of Financial Condition and Results of Operations” and the financial statements and notes thereto. Financial information is presented for the fiscal years ended December 31, 2011, 2010, 2009 and 2008 and for the period from March 13, 2007 (Solar Capital LLC inception) through December 31, 2007. Financial information for the periods ending December 31, 2011, 2010, 2009, 2008 and 2007 has been derived from our financial statements that were audited by KPMG LLP (“KPMG”), an independent registered public accounting firm.
| ($ in thousands, except per |
Year ended December 31, 2011 |
Year ended December 31, 2010 |
Year ended December 31, 2009 |
Year ended December 31, 2008 |
Period from March 13, 2007 (inception) through December 31, 2007 |
|||||||||||||||
| Income statement data: |
||||||||||||||||||||
| Total investment income |
$ | 138,900 | $ | 124,641 | $ | 109,670 | $ | 133,959 | $ | 78,455 | ||||||||||
| Total expenses |
$ | 56,996 | $ | 55,429 | $ | 42,408 | $ | 46,560 | $ | 25,461 | ||||||||||
| Net investment income |
$ | 81,904 | $ | 69,212 | $ | 67,262 | $ | 87,399 | $ | 52,994 | ||||||||||
| Net realized loss |
$ | (2,393 | ) | $ | (38,968 | ) | $ | (264,898 | ) | $ | (937 | ) | $ | (10,489 | ) | |||||
| Net change in unrealized gain (loss) |
$ | (18,196 | ) | $ | 111,641 | $ | 284,572 | $ | (492,290 | ) | $ | 6,595 | ||||||||
| Net increase (decrease) in net assets resulting from operations |
$ | 61,315 | $ | 141,885 | $ | 86,936 | $ | (405,828 | ) | $ | 49,100 | |||||||||
| Other data (unaudited): |
||||||||||||||||||||
| Weighted average annualized yield on income producing investments: |
||||||||||||||||||||
| On fair value(1)(4) |
14.2 | % | 14.3 | % | 14.8 | % | 17.1 | % | 12.9 | % | ||||||||||
| On cost(2)(4) |
13.2 | % | 13.8 | % | 13.7 | % | 11.9 | % | 12.7 | % | ||||||||||
| Number of portfolio companies at period end(4) |
40 | 36 | 36 | 44 | 38 | |||||||||||||||
| As of December 31, 2011 |
As of December 31, 2010 |
As of December 31, 2009 |
As of December 31, 2008 |
As of December 31, 2007 |
||||||||||||||||
| Balance sheet data: |
||||||||||||||||||||
| Total investment portfolio |
$ | 1,045,043 | $ | 976,221 | $ | 863,140 | $ | 768,215 | $ | 1,178,736 | ||||||||||
| Total cash and cash equivalents |
$ | 11,787 | $ | 288,732 | $ | 5,675 | $ | 65,841 | $ | 169,692 | ||||||||||
| Total assets |
$ | 1,079,431 | $ | 1,291,791 | $ | 885,421 | $ | 873,026 | $ | 1,396,545 | ||||||||||
| Credit facilities payable |
$ | 201,355 | $ | 400,000 | $ | 88,114 | $ | — | $ | — | ||||||||||
| Senior secured term loan |
$ | 35,000 | $ | 35,000 | $ | — | $ | — | $ | — | ||||||||||
| Net assets |
$ | 805,941 | $ | 826,994 | $ | 697,903 | $ | 852,673 | $ | 1,258,501 | ||||||||||
| Per share data:(3) |
||||||||||||||||||||
| Net asset value per share |
$ | 22.02 | $ | 22.73 | $ | 21.24 | $ | 25.95 | $ | 38.30 | ||||||||||
| Net investment income |
$ | 2.25 | $ | 2.08 | $ | 2.05 | $ | 2.66 | $ | 1.62 | ||||||||||
| Net realized and unrealized gain (loss) |
$ | (0.57 | ) | $ | 2.19 | $ | 0.60 | $ | (15.01 | ) | $ | (0.12 | ) | |||||||
| Dividends and distributions declared |
$ | 2.40 | $ | 2.14 | $ | 7.36 | $ | — | $ | — | ||||||||||
| (1) | Throughout this document, the weighted average yield on income producing investments is computed as the (a) annual stated interest on accruing loans and debt securities plus the annual amortization of loan origination fees, original issue discount, and market discount on accruing loans and debt securities, plus the effective interest yield on preferred shares divided by (b) total income producing investments at fair value. The weighted average yield is computed as of the balance sheet date and excludes assets on non-accrual status or on a cost recovery basis as of such date. |
42
Table of Contents
| (2) | For this calculation, the weighted average yield on income producing investments is computed as the (a) annual stated interest on accruing loans and debt securities plus the annual amortization of loan origination fees, original issue discount, and market discount on accruing loans and debt securities, plus the effective interest yield on preferred shares divided by (b) total income producing investments at cost. The weighted average yield is computed as of the balance sheet date and excludes assets on non-accrual status or on a cost recovery basis as of such date. |
| (3) | The number of shares used to calculate weighted average shares for use in computations on a per share basis have been decreased retroactively by a factor of approximately 0.4022 for all periods prior to February 9, 2010. This factor represents the effective impact of the reduction in shares resulting from the Solar Capital Merger. The per-share calculations are based on 32,860,454 weighted average shares outstanding as of and for the years and period ended December 31, 2009, 2008, and 2007, 36,383,158 shares outstanding and 33,258,402 weighted average shares outstanding for the year ended December 31, 2010, and 36,608,038 shares outstanding and 36,470,384 weighted average shares outstanding for the year ended December 31, 2011. |
| (4) | Unaudited. |
| Item 7. | Management’s Discussion and Analysis of Financial Condition and Results of Operations |
The information contained in this section should be read in conjunction with the Selected Financial and Other Data and our Financial Statements and notes thereto appearing elsewhere in this report.
Overview
Solar Capital Ltd., a Maryland corporation formed in November 2007, is a closed-end, externally managed, non-diversified management investment company that has elected to be treated as a BDC under the 1940 Act. In addition, for tax purposes the Company has elected to be treated as a RIC under Subchapter M of the Code.
On February 9, 2010, we priced our initial public offering, selling 5.68 million shares. Concurrent with our initial public offering, Michael S. Gross, our chairman and chief executive officer, and Bruce Spohler, our chief operating officer, collectively purchased an additional 0.6 million shares through a private placement transaction exempt from registration under the Securities Act. Solar Capital Ltd. issued an aggregate of approximately 26.65 million shares of common stock and $125 million in Senior Unsecured Notes to the existing Solar Capital LLC unit holders in connection with the Solar Capital Merger. Solar Capital Ltd. had no assets or operations prior to completion of the Solar Capital Merger and as a result, the books and records of Solar Capital LLC have become the books and records of the surviving entity.
We invest primarily in U.S. middle market companies, where we believe the supply of primary capital is limited and the investment opportunities are most attractive. Our investment objective is to generate both current income and capital appreciation through debt and equity investments. We invest primarily in leveraged middle market companies in the form of senior secured loans, mezzanine loans and equity securities. From time to time, we may also invest in public companies that are thinly traded. Our business model is focused primarily on the direct origination of investments through portfolio companies or their financial sponsors. Our investments generally range between $20 million and $100 million each, although we expect that this investment size will vary proportionately with the size of our capital base. We are managed by Solar Capital Partners LLC. Solar Capital Management LLC provides the administrative services necessary for us to operate.
In addition, we may invest a portion of our portfolio in other types of investments, which we refer to as opportunistic investments, which are not our primary focus but are intended to enhance our overall returns. These investments may include, but are not limited to, direct investments in public companies that are not thinly traded and securities of leveraged companies located in select countries outside of the United States.
As of December 31, 2011, our long term investments totaled $1.05 billion and our net asset value was $805.9 million. Our portfolio was comprised of debt and equity investments in 40 portfolio companies and our
43
Table of Contents
income producing assets, which represented 91.2% of our total portfolio, had a weighted average annualized yield on a fair value basis of approximately 14.2%.
Critical Accounting Policies
The preparation of financial statements and related disclosures in conformity with GAAP requires management to make estimates and assumptions that affect the reported amounts of assets and liabilities, disclosure of contingent assets and liabilities at the date of the financial statements, and revenues and expenses during the periods reported. Actual results could materially differ from those estimates. We have identified the following items as critical accounting policies.
Valuation of Portfolio Investments
We conduct the valuation of our assets, pursuant to which our net asset value is determined, at all times consistent with GAAP, and the 1940 Act. Our valuation procedures are set forth in more detail below:
Securities for which market quotations are readily available on an exchange are valued at the closing price on the day of valuation. We may also obtain quotes with respect to certain of our investments from pricing services or brokers or dealers in order to value assets. When doing so, we determine whether the quote obtained is sufficient according to GAAP to determine the fair value of the security. If determined adequate, we use the quote obtained.
Securities for which reliable market quotations are not readily available or for which the pricing source does not provide a valuation or methodology or provides a valuation or methodology that, in the judgment of our investment adviser or board of directors, does not represent fair value, shall be valued as follows: (i) each portfolio company or investment is initially valued by the investment professionals responsible for the portfolio investment; (ii) preliminary valuation conclusions are documented and discussed with our senior management; (iii) independent third-party valuation firms engaged by, or on behalf of, the board of directors will conduct independent appraisals and review management’s preliminary valuations and make their own assessment for all material assets; (iv) the board of directors will discuss valuations and determine the fair value of each investment in our portfolio in good faith based on the input of the investment adviser and, where appropriate, the respective third-party valuation firms.
The recommendation of fair value will generally be based on the following factors, as relevant:
| • | the nature and realizable value of any collateral including credit risk; |
| • | the portfolio company’s ability to make payments; |
| • | the portfolio company’s earnings and discounted cash flow; |
| • | the markets in which the issuer does business and; and |
| • | comparisons to publicly traded securities. |
Securities for which market quotations are not readily available or for which a pricing source is not sufficient may include, but are not limited to, the following:
| • | private placements and restricted securities that do not have an active trading market; |
| • | securities whose trading has been suspended or for which market quotes are no longer available; |
| • | debt securities that have recently gone into default and for which there is no current market; |
| • | securities whose prices are stale; |
| • | securities affected by significant events; and |
| • | securities that the investment adviser believes were priced incorrectly. |
44
Table of Contents
Determination of fair value involves subjective judgments and estimates. Accordingly, the notes to our financial statements express the uncertainty with respect to the possible effect of such valuations, and any change in such valuations, on our financial statements.
GAAP fair value measurement guidance classifies the inputs used to measure these fair values into the following hierarchy:
Level 1. Financial assets and liabilities whose values are based on unadjusted quoted prices for identical assets or liabilities in an active market that the Company has the ability to access (examples include active exchange-traded equity securities, exchange-traded derivatives, and most U.S. Government and agency securities).
Level 2. Financial assets and liabilities whose values are based on quoted prices in markets that are not active or model inputs that are observable either directly or indirectly for substantially the full term of the asset or liability. Level 2 inputs include the following:
| a) | Quoted prices for similar assets or liabilities in active markets; |
| b) | Quoted prices for identical or similar assets or liabilities in non-active markets (examples include corporate and municipal bonds, which trade infrequently); |
| c) | Pricing models whose inputs are observable for substantially the full term of the asset or liability (examples include most over-the-counter derivatives, including foreign exchange forward contracts); and |
| d) | Pricing models whose inputs are derived principally from or corroborated by observable market data through correlation or other means for substantially the full term of the asset or liability. |
Level 3. Financial assets and liabilities whose values are based on prices or valuation techniques that require inputs that are both unobservable and significant to the overall fair value measurement. These inputs reflect management’s own assumptions about the assumptions a market participant would use in pricing the asset or liability (examples include certain of our private debt and equity investments) and long-dated or complex derivatives (including certain equity and currency derivatives).
Fair Value Measurements
As of December 31, 2011
| Level 1 | Level 2 | Level 3 | Total | |||||||||||||
| Assets: |
||||||||||||||||
| Bank Debt/Senior Secured Loans |
— | 46,377 | 366,019 | 412,396 | ||||||||||||
| Subordinated Debt / Corporate Notes |
— | 10,508 | 536,351 | 546,859 | ||||||||||||
| Preferred Equity |
— | — | 14,664 | 14,664 | ||||||||||||
| Common Equity / Partnership Interests / Warrants |
11,460 | — | 59,664 | 71,124 | ||||||||||||
| Derivative assets - interest rate cap |
— | 469 | — | 469 | ||||||||||||
| Derivative assets - forward contracts |
— | 180 | — | 180 | ||||||||||||
At December 31, 2011 the fair value of investments classified as Level 3 was $976.7 million or 93.5% of total investments. One asset with a fair value of $41.1 million was transferred out of Level 3 to Level 2 during 2011 because of the increase in availability and reliability of third party market quotes for this investments. Subsequently, prior to end of 2011, this asset was repaid at par.
Additionally, during 2011, one asset with a December 31, 2011 fair value of $9.9 million was transferred from Level 2 to Level 1 as trading restrictions expired on this publicly traded equity investment.
45
Table of Contents
At December 31, 2010 the fair value of investments classified as Level 3 was $823.9 million or 84% of total investments. Two assets with a combined fair value of $94.7 million were transferred out of Level 3 to Level 2 during 2010 because of the increase in availability and reliability of third party market quotes for these investments.
Additionally, during 2010, one asset with a fair value of $0.4 million was transferred from Level 2 to Level 1 when trading restrictions expired on a publicly traded equity investment.
Revenue Recognition
Our revenue recognition policies are as follows:
Sales: Gains or losses on the sale of investments are calculated by using the specific identification method.
Interest Income: Interest income, adjusted for amortization of premium and accretion of discount, is recorded on an accrual basis. Origination, closing and/or commitment fees associated with investments in portfolio companies are accreted into interest income over the respective terms of the applicable loans. Upon the prepayment of a loan or debt security, any prepayment penalties and unamortized loan origination, closing and commitment fees are recorded as part of interest income. We have loans in our portfolio that contain a PIK provision. PIK interest is accrued at the contractual rates and added to the loan principal on the reset dates.
Non-accrual: Loans are placed on non-accrual status when principal or interest payments are past due 30 days or more or when there is reasonable doubt that principal or interest will be collected. Accrued interest is generally reversed when a loan is placed on non-accrual status. Interest payments received on non-accrual loans may be recognized as income or applied to principal depending upon management’s judgment about ultimate collectability of principal. Non-accrual loans are restored to accrual status when past due principal and interest is paid and, in management’s judgment, are likely to remain current.
Payment-in-Kind Interest
We have investments in our portfolio which contain a PIK interest provision. PIK interest is added to the principal balance of the investment and is recorded as income. For us to maintain our status as a RIC, substantially all of this income must be paid out to stockholders in the form of dividends, even though we have not collected any cash with respect to PIK securities.
New Accounting Pronouncements and Accounting Standards Updates
In May 2011, the Financial Accounting Standards Board issued Accounting Standards Update (“ASU”) 2011-04, Fair Value Measurement (Topic 820): Amendments to Achieve Common Fair Value Measurement and Disclosure Requirements in U.S. GAAP and IFRSs (“ASU 2011-04”). ASU 2011-04 was issued concurrently with International Financial Reporting Standards No. 13 (“IFRS 13”), Fair Value Measurements, to provide largely identical guidance about fair value measurement and disclosure requirements as is currently required under ASU 2010-06, Fair Value Measurements and Disclosures (Topic 820). The new standards do not extend the use of fair value but, rather, provide guidance about how fair value should be applied where it already is required or permitted under IFRS or GAAP. For GAAP, most of the changes are clarifications of existing guidance or wording changes to align with IFRS 13. ASU 2011-04 eliminates the concepts of in-use and in-exchange when measuring fair value of all financial instruments. For Level 3 fair value measurements, the ASU requires that our disclosure include quantitative information about significant unobservable inputs, a qualitative discussion about the sensitivity of the fair value measurement to changes in the unobservable inputs and the interrelationship between inputs, and a description of our valuation process. Public companies are required to apply ASU 2011-04 prospectively for interim and annual periods beginning after December 15, 2011. Upon adoption of ASU 2011-04, it is not expected that it will have a significant impact on the Company’s financial statements and the Company is currently evaluating the impact on its disclosures.
46
Table of Contents
Portfolio Investments
The total value of our investments was approximately $1.05 billion and $976.2 million at December 31, 2011 and 2010, respectively. During the year ended December 31, 2011, we originated approximately $318.8 million of new investments in 13 portfolio companies and approximately $76.8 million was invested in six existing portfolio companies. During the year ended December 31, 2010, we originated approximately $272.3 million of new investments in 9 portfolio companies and approximately $68.2 million was invested in 3 existing portfolio companies.
In certain instances, we receive payments on our debt investments based on scheduled amortization of the outstanding balances. In addition, we may receive repayments of certain debt investments prior to their scheduled maturity date. The frequency or volume of these repayments may fluctuate significantly from period to period. Our portfolio activity also reflects sales of securities. For the year ended December 31, 2011, we had approximately $308.7 million in debt repayments of existing portfolio companies and sales of securities of 4 portfolio companies for approximately $29.4 million. For the year ended December 31, 2010, we had approximately $298.5 million in debt repayments and approximately $33.1 million in sales of securities in 7 portfolio companies.
At December 31, 2011, we had investments in debt and preferred securities of 34 portfolio companies, totaling approximately $973.9 million, and equity investments in 7 portfolio companies, totaling approximately $71.1 million. At December 31, 2010, we had investments in debt and preferred securities of 30 portfolio companies, totaling approximately $900.9 million, and equity investments in 9 portfolio companies, totaling approximately $75.4 million.
The following table shows the fair value of our portfolio of investments by asset class as of December 31, 2011 and 2010:
| December 31, 2011 | December 31, 2010 | |||||||||||||||
| Cost | Fair Value | Cost | Fair Value | |||||||||||||
| Bank Debt/Senior Secured Loans |
$ | 426,201 | $ | 412,396 | $ | 250,253 | $ | 247,141 | ||||||||
| Subordinated Debt/Corporate Notes |
604,157 | 546,859 | 690,817 | 649,784 | ||||||||||||
| Preferred Equity |
15,107 | 14,664 | 3,929 | 3,934 | ||||||||||||
| Common Equity/Partnership Interests/Warrants |
107,108 | 71,124 | 118,562 | 75,362 | ||||||||||||
|
|
|
|
|
|
|
|
|
|||||||||
| Total |
$ | 1,152,573 | $ | 1,045,043 | $ | 1,063,561 | $ | 976,221 | ||||||||
|
|
|
|
|
|
|
|
|
|||||||||
As of December 31, 2011 and 2010, the weighted average yield on income producing investments in our portfolio was approximately 14.2%.
As of December 31, 2011, we had one investment on non-accrual status with a fair value of $5.9 million. As of December 31, 2010 we had one investment on non-accrual status with a fair value of $6.6 million.
Recent Portfolio Developments
Subsequent to December 31, 2011, DSW Group, Inc., our largest investment, announced it is seeking to refinance its capital structure. Until the terms of the recapitalization have been finalized, we cannot fully assess the impact on our portfolio; however, at this time, we do not believe the impact will be material.
Results of Operations for the Year Ended December 31, 2011 compared to the Year Ended December 31, 2010
Revenue
| For the Year Ended December 31, |
||||||||||||
| 2011 | 2010 | % Change | ||||||||||
| (in thousands) | ||||||||||||
| Investment income |
$ | 138,900 | $ | 124,641 | 11 | % | ||||||
47
Table of Contents
The increase in investment income for the year ended December 31, 2011 compared to the year ended December 31, 2010 was primarily due to an increase of approximately $18.3 million in interest and dividend income on a higher average invested balance during 2011. Increases were partially offset by decreases of approximately $4.6 million in repayment related income (call premiums, accelerated fee amortization on prepaid loans, and other fees).
Expenses
| For the Year Ended December 31, |
||||||||||||
| 2011 | 2010 | % Change | ||||||||||
| (in thousands) | ||||||||||||
| Investment advisory and management fees |
$ | 20,596 | $ | 18,296 | 13 | % | ||||||
| Performance-based incentive fee |
20,476 | 17,305 | 18 | % | ||||||||
| Interest and other credit facility expenses |
9,212 | 14,276 | (35 | %) | ||||||||
| Administrative service fee |
1,638 | 1,294 | 27 | % | ||||||||
| Other general and administrative expenses |
4,326 | 3,930 | 10 | % | ||||||||
|
|
|
|
|
|||||||||
| Total operating expenses |
$ | 56,248 | $ | 55,101 | 2 | % | ||||||
|
|
|
|
|
|||||||||
Total operating expenses were relatively flat from 2010 to 2011. Both the performance-based incentive fee, which is calculated as a percentage of net investment income above certain hurdle rates, and investment advisory and management fees, which are calculated based on average gross assets, were higher during 2011 due to higher investment income earned on larger average gross assets. Interest and other credit facility expenses for 2011 were lower than 2010 primarily due to lower borrowing rates in 2011 subsequent to the repayment of higher priced fixed rate notes in late 2010. Administrative service fees and other general and administrative expenses were higher for 2011 than for 2010 primarily due to increases in overhead expenses.
Net Realized and Unrealized Gains and Losses
| For the Year Ended December 31, |
||||||||
| 2011 | 2010 | |||||||
| (in thousands) | ||||||||
| Net realized gain (loss) on investments (net of taxes) |
$ | 3,645 | $ | (39,365 | ) | |||
| Net realized loss on derivatives |
(5,620 | ) | (3,124 | ) | ||||
| Net realized gain (loss) on foreign currency exchange |
(418 | ) | 3,521 | |||||
| Net unrealized gain (loss) on investments |
(20,190 | ) | 113,508 | |||||
| Net unrealized loss on derivatives |
(1,354 | ) | (1,204 | ) | ||||
| Net unrealized gain (loss) on foreign currency exchange |
3,348 | (663 | ) | |||||
|
|
|
|
|
|||||
| Total realized and unrealized gain (loss) |
$ | (20,589 | ) | $ | 72,673 | |||
|
|
|
|
|
|||||
The combination of the net realized and unrealized gains or losses resulted in a net loss of $20.6 million for 2011 compared to a net gain of $72.7 million for 2010. Unrealized losses on investments were primarily due to technical valuation reductions due to overall market weakness during the second half of the year. Whereas, the net gain for 2010 was primarily due to increases in the fair value of our portfolio assets during the year as well as realizations in excess of prior valuations, following recession valuation lows. We analyze this section on a combined basis because offsets may exist in the individual line items due to foreign exchange fluctuations and movements from unrealized to realized.
Our investments denominated in Euro, British Pounds and Australian dollars are converted into U.S. dollars at the balance sheet date, and as such, we are exposed to movements in exchange rates. To limit our exposure to
48
Table of Contents
movements in foreign currency exchange rates we enter into foreign exchange forward contracts or borrow in foreign currencies under our multi-currency revolving credit facility. For the year ended December 31, 2011, the total net realized and unrealized gain on forward contracts was a loss of $4.5 million compared to a loss of $4.3 million for the same line items for the year ended December 31, 2010.
To partially mitigate this risk of rising interest rates on our floating rate debt exposure, we purchased two interest rate derivative contracts during 2011, which effectively cap the London Interbank Borrowing Rate (LIBOR) at 1.00% on $100 million of notional amount through January 2014 and $50 million of notional amount through May 2014. The interest rate caps were purchased for $2.94 million and were valued at $0.47 million on December 31, 2011.
Results of Operations for the Year Ended December 31, 2010 compared to the Year Ended December 31, 2009
Revenue
| For the Year Ended December 31, |
||||||||||||
| 2010 | 2009 | % Change | ||||||||||
| (in thousands) | ||||||||||||
| Investment income |
$ | 124,641 | $ | 109,670 | 14 | % | ||||||
The increase in investment income for the year ended December 31, 2010 compared to the year ended December 31, 2009 was primarily due to increased fee income resulting from the early repayment of assets and higher amortization income during 2010. Call premiums, accelerated fee amortization on prepaid loans, and other fee income was $12.4 million in 2010 compared to $1.6 million in 2009. Additionally, amortization of upfront fees was $2.6 million higher during 2010.
Expenses
| For the Year Ended December 31, |
||||||||||||
| 2010 | 2009 | % Change | ||||||||||
| (in thousands) | ||||||||||||
| Investment advisory and management fees |
$ | 18,296 | $ | 16,738 | 9 | % | ||||||
| Performance-based incentive fee |
17,305 | 16,815 | 3 | % | ||||||||
| Interest and other credit facility expenses |
14,276 | 2,636 | 442 | % | ||||||||
| Administrative service fee |
1,294 | 2,020 | (36 | %) | ||||||||
| Other general and administrative expenses |
3,930 | 3,971 | (1 | %) | ||||||||
|
|
|
|
|
|||||||||
| Total operating expenses |
$ | 55,101 | $ | 42,180 | 31 | % | ||||||
|
|
|
|
|
|||||||||
Investment advisory and management fees, which are calculated based on average gross assets, were higher in 2010 compared to 2009 primarily due to the increased average fair value of our investment portfolio. Total expenses increased by approximately $13.0 million for the year ended December 31, 2010 compared to the same period in 2009.
Interest and other credit facility expenses were higher in 2010 compared to 2009 primarily due to higher average debt balances outstanding during 2010, including the Senior Unsecured Notes (outstanding from February 2010 through December 2010), Term Loan, and our credit facilities, higher loan fee amortization expense and higher unused credit facility fees.
Administrative service fees and other general and administrative expenses were lower during the 2010 because 2009 included costs related to pre-IPO private fund administration and reporting.
49
Table of Contents
Net Realized and Unrealized Gains and Losses
| For the Year Ended December 31, |
||||||||
| 2010 | 2009 | |||||||
| (in thousands) | ||||||||
| Net realized loss on investments |
$ | (39,365 | ) | $ | (253,394 | ) | ||
| Net realized loss on derivatives |
(3,124 | ) | (12,608 | ) | ||||
| Net realized gain on foreign currency exchange |
3,521 | 1,104 | ||||||
| Net unrealized gain on investments |
113,508 | 287,671 | ||||||
| Net unrealized loss on derivatives |
(1,204 | ) | (2,583 | ) | ||||
| Net unrealized loss on foreign currency exchange |
(663 | ) | (516 | ) | ||||
|
|
|
|
|
|||||
| Total realized and unrealized gain |
$ | 72,673 | $ | 19,674 | ||||
|
|
|
|
|
|||||
The combination of the net realized and unrealized gains or losses resulted in a net gain of $72.7 million for 2010 compared to $19.7 million for 2009. The net gain for 2010 was primarily due to increases in the fair value of our portfolio assets during the year as well as realizations in excess of prior valuations. The net increase in the fair value of our portfolio assets was primarily due to continued credit improvement in the portfolio, the tightening of credit spreads in the high yield market and portfolio realizations. We analyze this section on a combined basis because offsets may exist in the individual line items due to foreign exchange fluctuations and movements from unrealized to realized.
Our investments denominated in Euro, British Pounds and Australian dollars are converted into U.S. dollars at the balance sheet date, and as such, we are exposed to movements in exchange rates. To limit our exposure to movements in foreign currency exchange rates we enter into foreign exchange forward contracts or borrow in foreign currencies under our multi-currency revolving credit facility. For the year ended December 31, 2010, the total net realized and unrealized gain on forward contracts was a loss of $4.3 million compared to a loss of $15.2 million for the same line items for the year ended December 31, 2009. This is due to a higher relative weakening of the U.S. dollar during 2009 compared to the same period in 2010.
Income Taxes
Solar Capital Ltd., a U.S. corporation, has elected to be treated as a RIC under Subchapter M of the Code, as amended (See “Taxation as a Regulated Investment Company” in Item 1. Business). In order to qualify as a RIC, among other things, the Company is required to timely distribute to its stockholders at least 90% of investment company taxable income, as defined by the Code, for each year. Depending on the level of taxable income earned in a given tax year, we may choose to carry forward taxable income in excess of current year dividend distributions into the next tax year and pay a 4% excise tax on such income, as required. To the extent that the Company determines that its estimated current year annual taxable income will be in excess of estimated current year dividend distributions, the Company accrues excise tax, if any, on estimated excess taxable income as taxable income is earned. For the years ended December 31, 2011 and 2010, U.S. Federal excise tax of $0.7 million and $0.1 million was accrued, respectively.
We are also subject to taxes in Luxembourg, through Solar Capital Luxembourg I S.a.r.l., a wholly-owned subsidiary. Under the laws of Luxembourg, we pay a corporate income tax and a municipal business tax on our subsidiary’s taxable income.
Prior to our initial public offering in February 2010, Solar Capital LLC was subject to New York City unincorporated business tax (UBT), which is imposed on the business income of every unincorporated business that is carried on in New York City. The UBT is imposed for each taxable year at a rate of 4 percent of taxable income that is allocable to New York City. There was no UBT for 2009 or 2010.
50
Table of Contents
Liquidity and Capital Resources
The Company’s liquidity and capital resources are generated and generally available through its $405 million multi-currency credit facility maturing in February 2013 (the “$405 Million Facility”), $100 million credit facility maturing in December 2015 (the “$100 Million Facility” and together with the $405 Million Facility, “Credit Facilities”), $35 million Term Loan maturing in September 2013, from cash flows from operations, investment sales, repayments of senior and subordinated loans, income earned on investments and cash equivalents, and we expect through periodic follow-on equity and/or debt offerings. We may from time to time issue such securities in either public or private offerings. The issuance of debt or equity securities will depend on future market conditions, funding needs and other factors and there can be no assurance that any such issuance will occur or be successful.
On February 9, 2010, we priced our initial public offering, selling 5.68 million shares at $18.50 per share. Immediately thereafter, our shares began to trade on the NASDAQ Global Select Market under the ticker “SLRC”. In addition, we sold 600,000 shares at $18.50 in a concurrent private placement to Messrs. Gross and Spohler. A total of approximately $106.7 million was raised through the IPO (net of underwriting fees), and the private placement.
On November 30, 2010, we completed a private placement transaction conducted in accordance with Regulation D under the Securities Act in which we sold an aggregate of 2,850,000 shares of our common stock to certain institutional accredited investors and 115,000 shares of our common stock jointly to Michael S. Gross, our chairman and chief executive officer, and Bruce Spohler, our chief operating officer at a purchase price per share of $22.94, resulting in approximately $68 million in gross proceeds. We used the net proceeds resulting from this private placement transaction to repay $67 million of the Company’s then outstanding $125 million of the Senior Unsecured Notes.
On December 17, 2010, the Company repaid the outstanding $58 million of Senior Unsecured Notes with borrowings under the $100 Million Facility.
The primary use of existing funds and any funds raised in the future is expected to be for repayment of indebtedness, investments in portfolio companies, cash distributions to our shareholders or for other general corporate purposes.
At December 31, 2011, 2010 and 2009, we had cash and cash equivalents of approximately $11.8 million, $288.7 million and $5.7 million, respectively. Cash provided by and (used in) operating activities for the years ended December 31, 2011, 2010 and 2009 was approximately $4.1 million, $20.6 million and $17.2 million, respectively. We expect that all current liquidity needs will be met with cash flows from operations and other activities.
Credit Facilities. On February 12, 2010, Solar Capital Ltd. amended and restated Solar Capital LLC’s $250 million credit facility, extending the maturity to February 2013 and increasing the total commitments under the facility to $270 million. Total commitments under the $405 Million Facility have since been increased to $405 million as a result of the addition of three new lenders on May 12, 2010, June 23, 2010 and December 19, 2011. The $405 Million Facility generally bears interest at LIBOR plus 3.25%. The $405 Million Facility size may be increased up to $600 million with additional new lenders or increases in the commitments of current lenders. The $405 Million Facility contains certain customary affirmative and negative covenants and events of default, including the occurrence of a change of control. In addition, the $405 Million Facility contains certain financial covenants that among other things, require the Company to maintain a minimum shareholder’s equity and a minimum asset coverage ratio.
On December 17, 2010, we established the $100 Million Facility with Wells Fargo Securities, LLC acting as administrative agent. In connection with the $100 Million Facility, our wholly owned financing subsidiary, Solar Capital Funding II, LLC (“SC Funding”), as borrower, entered into a Loan and Servicing Agreement whereby we
51
Table of Contents
transferred certain loans we have originated or acquired or will originate or acquire from time to time to SC Funding via a Purchase and Sale Agreement. The $100 Million Facility, as amended, among other things, matures on December 17, 2015 and generally bears interest based on LIBOR plus 2.75%. The $100 Million Facility is secured by all of the assets held by SC Funding. Under the $100 Million Facility, Solar and SC Funding, as applicable, have made certain customary representations and warranties, and are required to comply with various covenants, reporting requirements and other customary requirements for similar credit facilities. The $100 Million Facility includes usual and customary events of default for credit facilities of this nature.
Term Loan. On September 2, 2010, Solar Capital Ltd. entered into the fully funded $35 million Term Loan, which matures in September 2013, bears interest at a rate per annum equal to the base rate plus 3.25%, and has terms substantially similar to our revolving credit facilities.
Certain covenants may restrict our business activities, including limitations that could hinder our ability to finance additional loans and investments or to make the distributions required to maintain our status as a RIC under Subchapter M of the Code.
Contractual Obligations.
A summary of our significant contractual payment obligations is as follows:
Payments Due by Period
| (in millions) | Total | Less than 1 Year |
1-3 Years | 3-5 Years | More Than 5 Years |
|||||||||||||||
| Senior secured revolving credit facilities(1) |
$ | 201.4 | $ | — | $ | 103.4 | $ | 98.0 | $ | — | ||||||||||
| Term Loan |
$ | 35.0 | $ | — | $ | 35.0 | $ | — | $ | — | ||||||||||
| (1) | As of December 31, 2011, we had $303.6 million of unused borrowing capacity under the Credit Facilities. |
We have certain commitments pursuant to our Investment Advisory and Management Agreement entered into with Solar Capital Partners. We have agreed to pay a fee for investment advisory and management services consisting of two components—a base management fee and an incentive fee. Payments under the Investment Advisory and Management Agreement are equal to (1) a percentage of the value of our average gross assets and (2) a two-part incentive fee. See Item 1. Business—Investment Advisory and Management Agreement. We have also entered into a contract with Solar Capital Management to serve as our administrator. Payments under the Administration Agreement are equal to an amount based upon our allocable portion of Solar Capital Management’s overhead in performing its obligation under the agreement, including rent, fees, and other expenses inclusive of our allocable portion of the compensation of our chief financial officer and any administrative staff. See Item 1. Business—Solar Capital Management.
Off-Balance Sheet Arrangements
In the normal course of its business, we trade various financial instruments and may enter into various investment activities with off-balance sheet risk, which include forward foreign currency contracts. Generally, these financial instruments represent future commitments to purchase or sell other financial instruments at specific terms at future dates. These financial instruments contain varying degrees of off-balance sheet risk whereby changes in the market value or our satisfaction of the obligations may exceed the amount recognized in our Statement of Assets and Liabilities.
Borrowings
We had borrowings of $201.4 million and $400.0 million outstanding as of December 31, 2011 and 2010, respectively, under the Credit Facilities. See “Credit Facilities” for a description of the $405 Million Facility and the $100 Million Facility. We also had $35 million outstanding on the Term Loan as of December 31, 2011 and 2010.
52
Table of Contents
Distributions and Dividends
The following table reflects the cash distributions, including dividends and returns of capital, if any, per share that we have declared on our common stock since our initial public offering:
| Date Declared |
Record Date | Payment Date | Amount | |||||
| Fiscal 2011 |
||||||||
| November 1, 2011 |
December 15, 2011 | December 29, 2011 | $ | 0.60 | ||||
| August 2, 2011 |
September 20,2011 | October 4, 2011 | 0.60 | |||||
| May 2, 2011 |
June 17, 2011 | July 5, 2011 | 0.60 | |||||
| March 1, 2011 |
March 17, 2011 | April 4, 2011 | 0.60 | |||||
|
|
|
|||||||
| Total 2011 |
$ | 2.40 | ||||||
|
|
|
|||||||
| Fiscal 2010 |
||||||||
| November 2, 2010 |
December 17, 2010 | December 30, 2010 | $ | 0.60 | ||||
| August 3, 2010 |
September 17, 2010 | October 4, 2010 | 0.60 | |||||
| May 4, 2010 |
June 17, 2010 | July 2, 2010 | 0.60 | |||||
| January 26, 2010 |
March 18, 2010 | April 1, 2010 | 0.34 | |||||
|
|
|
|||||||
| Total 2010 |
$ | 2.14 | ||||||
|
|
|
|||||||
Tax characteristics of all dividends will be reported to shareholders on Form 1099 after the end of the calendar year. Future quarterly dividends, if any, will be determined by our board of directors.
We have elected to be taxed as a RIC under Subchapter M of the Code. To maintain our RIC status, we must distribute at least 90% of our ordinary income and realized net short-term capital gains in excess of realized net long-term capital losses, if any, out of the assets legally available for distribution. In addition, although we currently intend to distribute net realized capital gains (net long-term capital gains in excess of short-term capital losses), if any, at least annually, out of the assets legally available for such distributions, we may in the future decide to retain such capital gains for investment.
We maintain an “opt out” dividend reinvestment plan for our common stockholders. As a result, if we declare a dividend, then stockholders’ cash dividends will be automatically reinvested in additional shares of our common stock, unless they specifically “opt out” of the dividend reinvestment plan so as to receive cash dividends.
Related Parties
We have entered into a number of business relationships with affiliated or related parties, including the following:
| • | We have entered into an Investment Advisory and Management Agreement with Solar Capital Partners. Mr. Gross, our chairman and chief executive officer, is the managing member and a senior investment professional of, and has financial and controlling interests in, Solar Capital Partners. In addition, Mr. Spohler, our chief operating officer is a partner and a senior investment professional of, and has financial interests in, Solar Capital Partners. |
| • | Solar Capital Management provides us with the office facilities and administrative services necessary to conduct day-to-day operations pursuant to our Administration Agreement. We reimburse Solar Capital Management for the allocable portion of overhead and other expenses incurred by it in performing its obligations under the Administration Agreement, including rent, the fees and expenses associated with performing compliance functions, and the compensation of our chief compliance officer, our chief financial officer and any administrative support staff. Solar Capital Partners, our investment adviser, is the sole member of and controls Solar Capital Management. |
53
Table of Contents
| • | We have entered into a license agreement with Solar Capital Partners, pursuant to which Solar Capital Partners has granted us a non-exclusive, royalty-free license to use the name “Solar Capital.” |
Solar Capital Partners and its affiliates may also manage other funds in the future that may have investment mandates that are similar, in whole and in part, with ours. For example, Solar Capital Partners presently serves as investment adviser to Solar Senior Capital Ltd., a publicly traded BDC, which to focuses on investing primarily in senior secured loans, including first lien, unitranche and second lien debt instruments. In addition, Michael S. Gross, our chairman and chief executive officer, Bruce Spohler, our chief operating officer, and Nicholas Radesca, our chief financial officer, serve in similar capacities for Solar Senior Capital Ltd. Solar Capital Partners and its affiliates may determine that an investment is appropriate for us and for one or more of those other funds. In such event, depending on the availability of such investment and other appropriate factors, Solar Capital Partners or its affiliates may determine that we should invest side-by-side with one or more other funds. Any such investments will be made only to the extent permitted by applicable law and interpretive positions of the SEC and its staff, and consistent with Solar Capital Partners’ allocation procedures.
In addition, we have adopted a formal code of ethics that governs the conduct of our officers and directors. Our officers and directors also remain subject to the duties imposed by both the 1940 Act and the Maryland General Corporation Law.
| Item 7A. | Quantitative and Qualitative Disclosure about Market Risk |
We are subject to financial market risks, including changes in interest rates. During the year ended December 31, 2011, certain of the loans in our portfolio had floating interest rates and our senior secured revolving credit facilities and Term Loan also bear floating rate interest. Interest rates on these loans are typically based on floating LIBOR and reset to current market rates every one to six months. A moderate change in interest rates would not have a material effect on our net investment income. However, we may hedge against interest rate fluctuations from time-to-time by using standard hedging instruments such as futures, options, swaps, caps and forward contracts subject to the requirements of the 1940 Act. While hedging activities may insulate us against adverse changes in interest rates, they may also limit our ability to participate in the benefits of higher interest rates with respect to our portfolio of investments. During the year ended December 31, 2011, we purchased two 1.00% LIBOR caps on a total of $150 million of notional for 3 years. If during the three year contract period LIBOR exceeds 1.00%, we will receive payments from the counterparty equal to the difference between LIBOR and 1.00% on $150 million. The cost of the caps was $2.9 million.
The following table quantifies the potential changes in interest income net of interest expense should interest rates increase by 100 or 200 basis points or decrease by 25 basis points. Investment income is calculated as revenue from loans and other lending investments held at December 31, 2011. Interest expense is calculated separately for each of our borrowings. For our floating rate $35 million Term Loan we use the balance and interest rate as of December 31, 2011 and adjust the interest rate based on the hypothetical changes below. For our floating rate credit facility we use the average balance for the year ended December 31, 2011 as it fluctuates with our periodic cash requirements and we calculate interest expense using the interest rate as of December 31, 2011 adjusted for the hypothetical changes in rates below. The base interest rate case assumes the rates on our portfolio investments remain as they were on December 31, 2011. All of the hypothetical calculations are based on a model of our portfolio for the twelve months subsequent to December 31, 2011 and assume no change to any input other than the underlying base interest rates. Actual results could differ significantly from those estimated in the table.
| Change in Interest Rates |
Estimated Percentage Change in Interest Income Net of Interest Expense (Unaudited) |
|||
| -25 Basis Points |
0.16 | % | ||
| Base Interest Rate |
0.00 | % | ||
| +100 Basis Points |
0.05 | % | ||
| +200 Basis Points |
0.59 | % | ||
54
Table of Contents
We have exposure to foreign currencies (Euro, British Pound, Australian Dollar and Canadian Dollar) through various investments. These investments are converted into U.S. dollars at the balance sheet date, exposing us to movements in exchange rates. To limit our exposure to fluctuations in exchange rates, we enter into foreign exchange forward contracts or borrow in those currencies under our multi-currency revolving credit facility. Our foreign currency exchange contracts are short term contracts that are continuously rolled forward to hedge the longer term portfolio investments. The table below presents our exchange rate sensitive assets and liabilities as of December 31, 2011:
| Euro | British Pound | Australian Dollar | Canadian Dollar | |||||||||||||
| Portfolio Investments (Long) |
||||||||||||||||
| Par Amount, Fair Value for Equity (in Currency) |
€ | 16.3 | £ | 32.4 | $ | 1.4 | $ | 30.5 | ||||||||
| Par Amount, Fair Value for Equity ($ in millions) |
$ | 21.1 | $ | 50.3 | $ | 1.5 | $ | 30.0 | ||||||||
| Fair Value ($ in millions) |
$ | 10.5 | $ | 38.2 | $ | 1.5 | $ | 29.1 | ||||||||
| Forward Contracts (Short) |
||||||||||||||||
| Notional Amount (in Currency) |
€ | 1.0 | £ | 13.0 | $ | — | $ | — | ||||||||
| Weighted Average Exchange Rate |
1.340 | 1.563 | — | — | ||||||||||||
| Contract Amount ($ in millions) |
$ | 1.3 | $ | 20.3 | $ | — | $ | — | ||||||||
| Fair Value ($ in millions) |
$ | 0.0 | $ | 0.1 | $ | — | $ | — | ||||||||
| Credit Facilities (Short) |
||||||||||||||||
| Par Amount (in Currency) |
€ | 16.0 | £ | 20.0 | $ | — | $ | 13.8 | ||||||||
| Par Amount ($ in millions) |
$ | 20.7 | $ | 31.1 | $ | — | $ | 13.6 | ||||||||
55
Table of Contents
| Item 8. | Financial Statements and Supplementary Data |
INDEX TO CONSOLIDATED FINANCIAL STATEMENTS
56
Table of Contents
Report of Independent Registered Public Accounting Firm
The Board of Directors and Shareholders
Solar Capital Ltd.:
We have audited the accompanying consolidated statements of assets and liabilities, including the consolidated schedules of investments, of Solar Capital Ltd. (the Company) as of December 31, 2011 and 2010, and the related consolidated statements of operations, changes in net assets and cash flows for each of the years in the three-year period ended December 31, 2011. These consolidated financial statements are the responsibility of the Company’s management. Our responsibility is to express an opinion on these consolidated financial statements based on our audits.
We conducted our audits in accordance with the standards of the Public Company Accounting Oversight Board (United States). Those standards require that we plan and perform the audit to obtain reasonable assurance about whether the financial statements are free of material misstatement. An audit includes examining, on a test basis, evidence supporting the amounts and disclosure in the financial statements. Our procedures included confirmation of securities owned as of December 31, 2011, by correspondence with the custodian or by other appropriate auditing procedures. An audit also includes assessing the accounting principles used and significant estimates made by management, as well as evaluating the overall financial statement presentation. We believe that our audits provide a reasonable basis for our opinion.
In our opinion, the consolidated financial statements referred to above present fairly, in all material respects, the financial position of Solar Capital Ltd. as of December 31, 2011 and 2010, and the results of its operations, the changes in its net assets and cash flows for each of the years in the three-year period ended December 31, 2011, in conformity with U.S. generally accepted accounting principles.
We also have audited, in accordance with the standards of the Public Company Accounting Oversight Board (United States), Solar Capital Ltd.’s internal control over financial reporting as of December 31, 2011, based on criteria established in Internal Control – Integrated Framework, issued by the Committee of Sponsoring Organizations of the Treadway Commission (COSO), and our report dated February 22, 2012 expressed an unqualified opinion on the effectiveness of the Company’s internal control over financial reporting.
/s/ KPMG LLP
New York, New York
February 22, 2012
57
Table of Contents
Report of Independent Registered Public Accounting Firm
On Internal Control Over Financial Reporting
The Board of Directors and Shareholders
Solar Capital Ltd.:
We have audited Solar Capital Ltd.’s (the Company) internal control over financial reporting as of December 31, 2011, based on criteria established in Internal Control – Integrated Framework issued by the Committee of Sponsoring Organizations of the Treadway Commission (COSO). Management of the Company is responsible for maintaining effective internal control over financial reporting and for its assessment of the effectiveness of internal control over financial reporting, included in the Annual Report on Form 10-K, and Item 9A, Controls and Procedures–Management’s Report on Internal Control Over Financial Reporting. Our responsibility is to express an opinion on the Company’s internal control over financial reporting based on our audit.
We conducted our audit in accordance with the standards of the Public Company Accounting Oversight Board (United States). Those standards require that we plan and perform the audit to obtain reasonable assurance about whether effective internal control over financial reporting was maintained in all material respects. Our audit included obtaining an understanding of internal control over financial reporting, assessing the risk that a material weakness exists, and testing and evaluating the design and operating effectiveness of internal control based on the assessed risk. Our audit also included performing such other procedures as we considered necessary in the circumstances. We believe that our audit provides a reasonable basis for our opinion.
A company’s internal control over financial reporting is a process designed to provide reasonable assurance regarding the reliability of financial reporting and the preparation of financial statements for external purposes in accordance with U.S. generally accepted accounting principles. A company’s internal control over financial reporting includes those policies and procedures that (1) pertain to the maintenance of records that, in reasonable detail, accurately and fairly reflect the transactions and dispositions of the assets of the company; (2) provide reasonable assurance that transactions are recorded as necessary to permit preparation of financial statements in accordance with generally accepted accounting principles, and that receipts and expenditures of the company are being made only in accordance with authorizations of management and directors of the company; and (3) provide reasonable assurance regarding prevention or timely detection of unauthorized acquisition, use, or disposition of the company’s assets that could have a material effect on the financial statements.
Because of its inherent limitations, internal control over financial reporting may not prevent or detect misstatements. Also, projections of any evaluation of effectiveness to future periods are subject to the risk that controls may become inadequate because of changes in conditions, or that the degree of compliance with the policies or procedures may deteriorate.
In our opinion, Solar Capital Ltd. maintained, in all material respects, effective internal control over financial reporting as of December 31, 2011, based on criteria established in Internal Control – Integrated Framework issued by COSO.
We also have audited, in accordance with the standards of the Public Company Accounting Oversight Board (United States), the consolidated statements of assets and liabilities of Solar Capital Ltd. as of December 31, 2011 and 2010, and the related consolidated statements of operations, changes in net assets and cash flows for each of the years in the three-year period ended December 31, 2011, and our report dated February 22, 2012 expressed an unqualified opinion on those consolidated financial statements.
/s/ KPMG LLP
New York, New York
February 22, 2012
58
Table of Contents
CONSOLIDATED STATEMENTS OF ASSETS AND LIABILITIES
(in thousands, except per share amounts)
| December 31, 2011 |
December 31, 2010 |
|||||||
| Assets |
||||||||
| Investments at fair value: |
||||||||
| Companies more than 25% owned (cost: $47,910 and $20,511, respectively) |
$ | 53,454 | $ | 20,508 | ||||
| Companies 5% to 25% owned (cost: $41,819 and $34,806, respectively) |
35,820 | 29,235 | ||||||
| Companies less than 5% owned (cost: $1,062,844 and $1,008,244, respectively) |
955,769 | 926,478 | ||||||
|
|
|
|
|
|||||
| Total investments (cost: $1,152,573 and $1,063,561, respectively) |
1,045,043 | 976,221 | ||||||
| Cash and cash equivalents |
11,787 | 288,732 | ||||||
| Interest and dividends receivable |
9,763 | 5,592 | ||||||
| Deferred credit facility costs |
3,635 | 5,904 | ||||||
| Fee revenue receivable |
4,379 | 3,935 | ||||||
| Derivative assets (cost $2,938 and $0, repectively) |
649 | 604 | ||||||
| Receivable for investments sold |
3,225 | 10,560 | ||||||
| Deferred offering costs |
469 | — | ||||||
| Prepaid expenses and other receivables |
481 | 243 | ||||||
|
|
|
|
|
|||||
| Total Assets |
1,079,431 | 1,291,791 | ||||||
|
|
|
|
|
|||||
| Liabilities |
||||||||
| Credit facilities payable |
201,355 | 400,000 | ||||||
| Term loan |
35,000 | 35,000 | ||||||
| Payable for investments purchased |
22,443 | 14,625 | ||||||
| Due to Solar Capital Partners LLC: |
||||||||
| Investment advisory and management fee payable |
5,277 | 4,892 | ||||||
| Performance-based incentive fee payable |
5,203 | 4,347 | ||||||
| Interest payable |
1,063 | 597 | ||||||
| Deferred fee revenue |
318 | 1,242 | ||||||
| Due to Solar Capital Management LLC |
1,069 | 773 | ||||||
| Derivative liabilities |
— | 1,539 | ||||||
| Income taxes payable |
720 | 329 | ||||||
| Other accrued expenses and payables |
1,042 | 1,453 | ||||||
|
|
|
|
|
|||||
| Total Liabilities |
273,490 | 464,797 | ||||||
|
|
|
|
|
|||||
| Net Assets |
||||||||
| Common stock, par value $0.01 per share 36,608,038 and 36,383,158 shares issued and outstanding, respectively, 200,000,000 shares authorized |
366 | 364 | ||||||
| Paid-in capital in excess of par |
928,180 | 926,991 | ||||||
| Under (over) distributed net investment income |
2,245 | (1,545 | ) | |||||
| Accumulated net realized losses |
(18,379 | ) | (10,541 | ) | ||||
| Net unrealized depreciation |
(106,471 | ) | (88,275 | ) | ||||
|
|
|
|
|
|||||
| Total Net Assets |
$ | 805,941 | $ | 826,994 | ||||
|
|
|
|
|
|||||
| Number of shares outstanding |
36,608,038 | 36,383,158 | ||||||
| Net Asset Value Per Share |
$ | 22.02 | $ | 22.73 | ||||
See notes to consolidated financial statements.
59
Table of Contents
CONSOLIDATED STATEMENTS OF OPERATIONS
(in thousands, except shares)
| Year ended December 31, 2011 |
Year ended December 31, 2010 |
Year ended December 31, 2009 |
||||||||||
| INVESTMENT INCOME: |
||||||||||||
| Interest and dividends: |
||||||||||||
| Companies more than 25% owned |
$ | 6,963 | $ | 670 | $ | — | ||||||
| Companies 5% to 25% owned |
— | 7,673 | 9,190 | |||||||||
| Other interest and dividend income |
131,937 | 116,298 | 100,480 | |||||||||
|
|
|
|
|
|
|
|||||||
| Total investment income |
138,900 | 124,641 | 109,670 | |||||||||
|
|
|
|
|
|
|
|||||||
| EXPENSES: |
||||||||||||
| Investment advisory and management fees |
20,596 | 18,296 | 16,738 | |||||||||
| Performance-based incentive fee |
20,476 | 17,305 | 16,815 | |||||||||
| Interest and other credit facility expenses |
9,212 | 14,276 | 2,636 | |||||||||
| Administrative service fee |
1,638 | 1,294 | 2,020 | |||||||||
| Other general and administrative expenses |
4,326 | 3,930 | 3,971 | |||||||||
|
|
|
|
|
|
|
|||||||
| Total operating expenses |
56,248 | 55,101 | 42,180 | |||||||||
|
|
|
|
|
|
|
|||||||
| Net investment income before income tax expense |
82,652 | 69,540 | 67,490 | |||||||||
|
|
|
|
|
|
|
|||||||
| Income tax expense |
748 | 328 | 228 | |||||||||
|
|
|
|
|
|
|
|||||||
| Net investment income |
81,904 | 69,212 | 67,262 | |||||||||
|
|
|
|
|
|
|
|||||||
| REALIZED AND UNREALIZED GAIN (LOSS) ON INVESTMENTS, |
||||||||||||
| DERIVATIVES AND FOREIGN CURRENCIES: |
||||||||||||
| Net realized gain (loss): |
||||||||||||
| Investments: |
||||||||||||
| Companies more than 25% owned |
— | — | (30 | ) | ||||||||
| Companies 5% to 25% owned |
784 | 16,397 | — | |||||||||
| Companies less than 5% owned |
3,092 | (55,762 | ) | (253,364 | ) | |||||||
|
|
|
|
|
|
|
|||||||
| Net realized gain (loss) on investments |
3,876 | (39,365 | ) | (253,394 | ) | |||||||
| Derivatives |
(5,620 | ) | (3,124 | ) | (12,608 | ) | ||||||
| Foreign currency exchange |
(418 | ) | 3,521 | 1,104 | ||||||||
|
|
|
|
|
|
|
|||||||
| Net realized loss before income taxes |
(2,162 | ) | (38,968 | ) | (264,898 | ) | ||||||
|
|
|
|
|
|
|
|||||||
| Income tax expense |
231 | — | — | |||||||||
|
|
|
|
|
|
|
|||||||
| Net realized loss |
(2,393 | ) | (38,968 | ) | (264,898 | ) | ||||||
|
|
|
|
|
|
|
|||||||
| Net change in unrealized gain (loss): |
||||||||||||
| Investments: |
||||||||||||
| Companies more than 25% owned |
5,547 | 997 | (3,900 | ) | ||||||||
| Companies 5% to 25% owned |
(428 | ) | (13,892 | ) | 3,823 | |||||||
| Companies less than 5% owned |
(25,309 | ) | 126,403 | 287,748 | ||||||||
|
|
|
|
|
|
|
|||||||
| Net unrealized gain (loss) on investments |
(20,190 | ) | 113,508 | 287,671 | ||||||||
| Derivatives |
(1,354 | ) | (1,204 | ) | (2,583 | ) | ||||||
| Foreign currency exchange |
3,348 | (663 | ) | (516 | ) | |||||||
|
|
|
|
|
|
|
|||||||
| Net change in unrealized gain (loss) |
(18,196 | ) | 111,641 | 284,572 | ||||||||
|
|
|
|
|
|
|
|||||||
| Net realized and unrealized gain (loss) on investments, derivatives and foreign currencies |
(20,589 | ) | 72,673 | 19,674 | ||||||||
|
|
|
|
|
|
|
|||||||
| Net increase in net assets resulting from operations |
$ | 61,315 | $ | 141,885 | $ | 86,936 | ||||||
|
|
|
|
|
|
|
|||||||
| Earnings per share |
$ | 1.68 | $ | 4.27 | $ | 2.65 | ||||||
See notes to consolidated financial statements.
60
Table of Contents
CONSOLIDATED STATEMENTS OF CHANGES IN NET ASSETS
(in thousands except shares)
| Year ended December 31, 2011 |
Year ended December 31, 2010 |
Year ended December 31, 2009 |
||||||||||
| Increase (decrease) in net assets resulting from operations: |
||||||||||||
| Net investment income |
$ | 81,904 | $ | 69,212 | $ | 67,262 | ||||||
| Net realized loss |
(2,393 | ) | (38,968 | ) | (264,898 | ) | ||||||
| Net change in unrealized gain (loss) |
(18,196 | ) | 111,641 | 284,572 | ||||||||
|
|
|
|
|
|
|
|||||||
| Net increase in net assets resulting from operations |
61,315 | 141,885 | 86,936 | |||||||||
|
|
|
|
|
|
|
|||||||
| Dividends to shareholders declared(1) |
(87,532 | ) | (72,657 | ) | (241,706 | ) | ||||||
|
|
|
|
|
|
|
|||||||
| Capital transactions: |
||||||||||||
| Proceeds from shares sold |
— | 184,215 | — | |||||||||
| Common stock offering costs |
— | (10,198 | ) | — | ||||||||
| Senior notes issued in Solar Capital Merger |
— | (125,000 | ) | — | ||||||||
| Reinvestment of dividends |
5,164 | 10,846 | — | |||||||||
|
|
|
|
|
|
|
|||||||
| Net increase in net assets resulting from capital transactions |
5,164 | 59,863 | — | |||||||||
|
|
|
|
|
|
|
|||||||
| Net increase (decrease) in net assets |
(21,053 | ) | 129,091 | (154,770 | ) | |||||||
| Net assets at beginning of year |
826,994 | 697,903 | 852,673 | |||||||||
|
|
|
|
|
|
|
|||||||
| Net assets at end of year |
$ | 805,941 | $ | 826,994 | $ | 697,903 | ||||||
|
|
|
|
|
|
|
|||||||
| (1) | For the year ended December 31, 2009, represents distributions to Solar Capital LLC unit holders declared. |
See notes to consolidated financial statements
61
Table of Contents
CONSOLIDATED STATEMENTS OF CASH FLOWS
(in thousands except shares)
| Year ended December 31, 2011 |
Year ended December 31, 2010 |
Year ended December 31, 2009 |
||||||||||
| Cash Flows from Operating Activities: |
||||||||||||
| Net increase in net assets from operations |
$ | 61,315 | $ | 141,885 | $ | 86,936 | ||||||
| Adjustments to reconcile net increase in net assets from operations to net cash provided by operating activities: |
||||||||||||
| Net realized (gain) loss from investments |
(3,876 | ) | 39,365 | 253,394 | ||||||||
| Net realized (gain) loss from foreign currency exchange |
418 | (3,521 | ) | (1,104 | ) | |||||||
| Net change in unrealized (gain) loss on investments |
20,190 | (113,508 | ) | (287,671 | ) | |||||||
| Net change in unrealized loss on derivatives |
1,354 | 1,204 | 2,583 | |||||||||
| (Increase) decrease in operating assets: |
||||||||||||
| Purchase of investment securities |
(433,637 | ) | (381,521 | ) | (214,109 | ) | ||||||
| Proceeds from disposition of investment securities |
348,083 | 342,582 | 153,461 | |||||||||
| Receivable for investments sold |
7,335 | (10,560 | ) | — | ||||||||
| Interest and dividends receivable |
(4,171 | ) | 1,955 | 3,194 | ||||||||
| Purchase of interest rate caps |
(2,938 | ) | — | — | ||||||||
| Fee revenue receivable |
(444 | ) | 1,889 | (829 | ) | |||||||
| Deferred offering costs |
(469 | ) | 1,478 | (772 | ) | |||||||
| Deferred credit facility costs |
2,269 | (4,990 | ) | 549 | ||||||||
| Foreign tax receivable |
— | — | 101 | |||||||||
| Withholding tax receivable |
— | — | 16,505 | |||||||||
| Prepaid expenses and other receivables |
(238 | ) | 306 | (308 | ) | |||||||
| Increase (decrease) in operating liabilities: |
||||||||||||
| Payable for investments purchased |
7,818 | 14,625 | — | |||||||||
| Investment advisory and management fee payable |
385 | (3,771 | ) | 3,369 | ||||||||
| Performance-based incentive fee payable |
856 | (4,170 | ) | 3,012 | ||||||||
| Deferred fee revenue |
(924 | ) | (2,290 | ) | (460 | ) | ||||||
| Due to Solar Capital Management LLC |
296 | (139 | ) | (173 | ) | |||||||
| Income taxes payable |
391 | (206 | ) | (1,200 | ) | |||||||
| Interest payable |
466 | 444 | 153 | |||||||||
| Other accrued expenses and payables |
(411 | ) | (478 | ) | 555 | |||||||
|
|
|
|
|
|
|
|||||||
| Net Cash Provided by Operating Activities |
4,068 | 20,579 | 17,186 | |||||||||
|
|
|
|
|
|
|
|||||||
| Cash Flows from Financing Activities: |
||||||||||||
| Proceeds from shares sold |
— | 184,215 | — | |||||||||
| Common stock offering costs |
— | (10,198 | ) | — | ||||||||
| Cash dividends paid |
(82,368 | ) | (61,811 | ) | — | |||||||
| Distributions to Solar Capital LLC unit holders paid in cash |
— | (75,136 | ) | (166,570 | ) | |||||||
| Proceeds from borrowings on term loan |
— | 35,000 | — | |||||||||
| Repayments of borrowings on senior notes |
— | (125,000 | ) | — | ||||||||
| Proceeds from borrowings on credit facilities |
1,316,760 | 845,000 | 383,034 | |||||||||
| Repayments of borrowings on credit facilities |
(1,515,405 | ) | (529,592 | ) | (293,816 | ) | ||||||
|
|
|
|
|
|
|
|||||||
| Net Cash Provided by (Used in) Financing Activities |
(281,013 | ) | 262,478 | (77,352 | ) | |||||||
|
|
|
|
|
|
|
|||||||
| NET INCREASE (DECREASE) IN CASH AND CASH EQUIVALENTS |
(276,945 | ) | 283,057 | (60,166 | ) | |||||||
| CASH AND CASH EQUIVALENTS AT BEGINNING OF YEAR |
288,732 | 5,675 | 65,841 | |||||||||
|
|
|
|
|
|
|
|||||||
| CASH AND CASH EQUIVALENTS AT END OF YEAR |
$ | 11,787 | $ | 288,732 | $ | 5,675 | ||||||
|
|
|
|
|
|
|
|||||||
| Supplemental disclosure of cash flow information: |
||||||||||||
| Cash paid for interest |
$ | 6,038 | $ | 11,454 | $ | 1,410 | ||||||
| Cash paid for income taxes |
$ | 588 | $ | 534 | $ | 1,428 | ||||||
| Non-cash financing activity: |
||||||||||||
| Reinvestment of dividends |
$ | 5,164 | $ | 10,846 | $ | — | ||||||
| Issuance of Senior Notes |
$ | — | $ | 125,000 | $ | — | ||||||
| Distributions payable |
$ | — | $ | — | $ | 75,136 | ||||||
See notes to consolidated financial statements.
62
Table of Contents
CONSOLIDATED SCHEDULE OF INVESTMENTS
December 31, 2011
(in thousands, except shares)
| Description(1) |
Industry |
Interest(2) | Maturity | Par Amount/ Shares |
Cost | Fair Value |
||||||||||||||||
| Bank Debt/Senior Secured Loans- 39.46% |
||||||||||||||||||||||
| Asurion Corporation (18) |
Insurance | 9.00 | % | 5/24/2019 | $ | 40,000 | $ | 39,811 | $ | 39,517 | ||||||||||||
| Airvana Network Solutions Inc. |
Telecommunications | 10.00 | % | 3/25/2015 | 8,324 | 8,186 | 8,324 | |||||||||||||||
| AviatorCap SII, LLC I (10) |
Aerospace & Defense | 12.00 | % | 12/31/2014 | 3,728 | 3,678 | 3,671 | |||||||||||||||
| AviatorCap SII, LLC II (10) |
Aerospace & Defense | 11.00 | % | 12/31/2014 | 5,697 | 5,618 | 5,611 | |||||||||||||||
| AviatorCap SII, LLC III(10) |
Aerospace & Defense | 13.00 | % | 12/31/2014 | 8,856 | 8,696 | 8,724 | |||||||||||||||
| Direct Buy Inc. (20) |
Home, Office Furnishing & Durable Consumer Prds | 12.00 | % | 2/1/2017 | 25,000 | 24,332 | 5,875 | |||||||||||||||
| Fulton Holding Corp (18) |
Retail Stores | 13.74 | % | 5/28/2016 | 35,000 | 34,155 | 35,000 | |||||||||||||||
| Grakon, LLC |
Machinery | 12.00 | % | 12/31/2015 | 9,524 | 7,610 | 9,286 | |||||||||||||||
| Good Sam Enterprise, LLC |
Insurance | 11.50 | % | 12/1/2016 | 7,000 | 6,523 | 6,860 | |||||||||||||||
| Grocery Outlet Inc. |
Grocery | 10.50 | % | 12/15/2017 | 33,600 | 32,599 | 32,592 | |||||||||||||||
| Isotoner Corporation |
Personal & Nondurable Consumer Products | 10.75 | % | 1/8/2018 | 39,000 | 37,895 | 37,830 | |||||||||||||||
| Interactive Health Solutions, Inc. (18)(19) |
Healthcare, Education & Childcare | 11.50 | % | 10/4/2016 | 20,131 | 19,691 | 19,930 | |||||||||||||||
| MYI Acquiror Corporation (3)(4)(8) |
Insurance | 13.00 | % (7) | 3/13/2017 | 31,500 | 30,899 | 31,500 | |||||||||||||||
| Roundy’s Supermarkets, Inc.—2nd Lien (18) |
Grocery | 10.00 | % | 4/16/2016 | 22,000 | 21,685 | 22,069 | |||||||||||||||
| Southern Auto Finance Company |
Banking | 13.50 | % | 10/19/2017 | 25,000 | 24,453 | 24,437 | |||||||||||||||
| Spencer Spirit Holdings, Inc. |
Retail Stores | 11.00 | % | 5/1/2017 | 10,000 | 10,000 | 10,000 | |||||||||||||||
| Transplace Texas, LP (18) |
Cargo Transport | 11.00 | % | 4/12/2017 | 20,000 | 19,533 | 19,500 | |||||||||||||||
| USAW 767 (10) |
Aerospace & Defense | 14.50 | % | 12/31/2012 | 4,904 | 4,850 | 4,831 | |||||||||||||||
| ViaWest Inc (18) |
Personal, Food & Misc. Services | 13.50 | %(7) | 5/20/2016 | 33,255 | 32,520 | 32,756 | |||||||||||||||
| Vision Holding Corp. (18) |
Healthcare, Education & Childcare | 12.00 | % | 11/23/2016 | 37,500 | 36,869 | 37,125 | |||||||||||||||
| VPSI, Inc. (17) |
Personal Transportation | 12.00 | % | 12/23/2015 | 16,958 | 16,598 | 16,958 | |||||||||||||||
|
|
|
|
|
|
|
|||||||||||||||||
| Total Bank Debt/Senior Secured Loans |
$ | 436,977 | $ | 426,201 | $ | 412,396 | ||||||||||||||||
|
|
|
|
|
|
|
|||||||||||||||||
| Subordinated Debt/Corporate Notes—52.33% |
||||||||||||||||||||||
| Adams Outdoor Advertising |
Diversified/Conglomerate Service | 18.00 | % | 12/8/2015 | $ | 42,500 | $ | 41,878 | $ | 42,075 | ||||||||||||
| AMC Entertainment Holdings, Inc. |
Leisure, Amusement, Entertainment | 5.55 | % (7) | 6/13/2012 | 27,141 | 27,086 | 26,462 | |||||||||||||||
| CIBT Solutions |
Leisure, Amusement, Entertainment |
13.50 | % | 6/15/2018 | 36,200 | 35,389 | 35,386 | |||||||||||||||
| Crosman Corporation |
Leisure, Amusement, Entertainment | 13.00 | %(7) | 10/15/2016 | 15,219 | 14,808 | 14,762 | |||||||||||||||
| DSW Group, Inc. |
Beverage, Food & Tobacco | 15.00 | %(7) | 4/24/2012 | 125,106 | 124,972 | 106,340 | |||||||||||||||
| Earthbound Farm (18) |
Farming & Agriculture | 14.25 | % | 6/21/2017 | 58,947 | 57,739 | 56,590 | |||||||||||||||
| Grakon Holdings LLC Sr |
Machinery | 14.00 | %(7) | 12/31/2015 | 1,588 | 1,588 | 1,469 | |||||||||||||||
| Grakon Holdings LLC Jr |
Machinery | 12.00 | %(7) | 12/31/2015 | 15,118 | 12,344 | 7,710 | |||||||||||||||
| Granite Global Solutions Corp. (3)(16) |
Insurance | 13.50 | % | 5/31/2016 | 29,983 | 30,234 | 29,121 | |||||||||||||||
| Magnolia River, LLC |
Hotels, Motels, Inns and Gaming | 14.00 | % | 4/28/2014 | 19,064 | 18,664 | 19,064 | |||||||||||||||
| Midcap Financial Intermediate Holdings, LLC (18) |
Banking | 14.25 | % | 7/9/2015 | 75,000 | 73,542 | 75,000 | |||||||||||||||
| ProSieben Sat.1 Media AG (3)(6) |
Broadcasting & Entertainment | 8.83 | %(7) | 3/6/2017 | 21,125 | 20,261 | 10,508 | |||||||||||||||
| Richelieu Foods, Inc. (17) |
Beverage, Food & Tobacco | 13.75 | % | 5/18/2016 | 22,500 | 21,972 | 21,150 | |||||||||||||||
| Rug Doctor L.P. (18) |
Personal, Food & Misc. Services |
|
15.50% to 20.00 (wtd. avg. 17.54 |
%(7) %) |
10/31/2014 | 51,225 | 48,034 | 47,383 | ||||||||||||||
| Shoes For Crews, LLC (17) |
Textiles & Leather | 13.75 | %(7) | 7/23/2016 | 15,650 | 15,318 | 15,650 | |||||||||||||||
| Weetabix Group (3)(5) |
Beverage, Food & Tobacco | 9.22 | %(7) | 9/14/2016 | 15,986 | 18,589 | 12,469 | |||||||||||||||
| Weetabix Group (3)(5) |
Beverage, Food & Tobacco | 10.03 | %(7) | 5/3/2017 | 34,294 | 41,739 | 25,720 | |||||||||||||||
|
|
|
|
|
|
|
|||||||||||||||||
| Total Subordinated Debt/Corporate Notes |
$ | 606,646 | $ | 604,157 | $ | 546,859 | ||||||||||||||||
|
|
|
|
|
|
|
|||||||||||||||||
63
Table of Contents
SOLAR CAPITAL LTD.
CONSOLIDATED SCHEDULE OF INVESTMENTS (continued)
December 31, 2011
(in thousands, except shares)
| Description(1) |
Industry |
Interest(2) | Maturity | Par Amount/ Shares |
Cost | Fair Value |
||||||||||||||||
| Preferred Equity- 1.40% |
||||||||||||||||||||||
| SODO Corp. (10)(13) |
Aerospace & Defense | 8.43 | %(7) | — | 1,912 | $ | 2,009 | $ | 1,949 | |||||||||||||
| SOCAY Corp. (10)(13) |
Aerospace & Defense | 8.59 | %(7) | — | 12,357 | 13,059 | 12,668 | |||||||||||||||
| Wyle Laboratories |
Aerospace & Defense | 8.00 | % | 7/17/2015 | 387 | 39 | 47 | |||||||||||||||
|
|
|
|
|
|||||||||||||||||||
| Total Preferred Equity |
$ | 15,107 | $ | 14,664 | ||||||||||||||||||
|
|
|
|
|
|||||||||||||||||||
| Common Equity / Partnership Interests / Warrants - 6.81% |
||||||||||||||||||||||
| Ark Real Estate Partners LP (9)(11)(12) |
Buildings & Real Estate | 41,818,834 | $ | 41,819 | $ | 35,820 | ||||||||||||||||
| Grakon, LLC |
Machinery | 1,714,286 | 1,714 | — | ||||||||||||||||||
| Grakon, LLC Warrants |
Machinery | 3,518,001 | — | — | ||||||||||||||||||
| Great American Group Inc. (14) |
Personal, Food & Misc. Services | 572,800 | 2,681 | 69 | ||||||||||||||||||
| Great American Group Inc. (15) |
Personal, Food & Misc. Services | 187,500 | 3 | 23 | ||||||||||||||||||
| National Specialty Alloys, LLC(10) |
Mining, Steel, Iron & Nonprecious Metals | 1,000,000 | 10,000 | 16,000 | ||||||||||||||||||
| Nuveen Investments, Inc. |
Finance | 3,486,444 | 30,875 | 7,844 | ||||||||||||||||||
| NXP Semiconductors Netherlands B.V.(3) |
Electronics | 645,292 | 17,592 | 9,918 | ||||||||||||||||||
| Seven West Media Limited |
Broadcasting & Entertainment | 437,687 | 2,424 | 1,450 | ||||||||||||||||||
|
|
|
|
|
|||||||||||||||||||
| Total Common Equity/Partnerships Interests / Warrants |
||||||||||||||||||||||
| $ | 107,108 | $ | 71,124 | |||||||||||||||||||
|
|
|
|
|
|||||||||||||||||||
| Total Investments |
$ | 1,152,573 | $ | 1,045,043 | ||||||||||||||||||
|
|
|
|
|
|||||||||||||||||||
| (1) | We generally acquire our investments in private transactions exempt from registration under the Securities Act of 1933, as amended (the “Securities Act”). Our investments are therefore generally subject to certain limitations on resale, and may be deemed to be “restricted securities” under the Securities Act. |
| (2) | For each debt investment we have provided the current interest rate in effect as of December 31, 2011. Variable rate debt investments generally bear interest at a rate that may be determined by reference to LIBOR or EURIBOR, and which may reset daily, quarterly or semi-annually. |
| (3) | The following entities are domiciled outside the United States and the investments are denominated in British Pounds, Euro, Canadian Dollars or Australian Dollars: Weetabix Group in the United Kingdom; ProSieben Sat.1 Media AG in Germany; Granite Global Solutions Corp. in Canada; and Seven West Media Group Pty Limited in Australia. NXP Semiconductors Netherlands B.V. is domiciled in the Netherlands and $14,750 of MYI Aquiror Corporation is domiciled in the United Kingdom, but these assets are denominated in US Dollars. All other investments are domiciled in the United States. |
| (4) | Solar Capital Ltd.’s foreign domiciled portion of MYI Aquiror Corporation is held through its wholly-owned subsidiary Solar Capital Luxembourg I S.a.r.l. |
| (5) | Solar Capital Ltd.’s investments in Weetabix Group are held through its wholly-owned subsidiary Solar Capital Luxembourg I S.a.r.l. |
64
Table of Contents
| (6) | Solar Capital Ltd.’s investments in ProSieben Sat. 1 Media AG are held through its wholly-owned subsidiary Solar Capital Luxembourg I S.a.r.l. |
| (7) | Coupon is payable in cash and/or in kind (PIK). |
| (8) | Includes an unfunded commitment of $6,000. |
| (9) | Solar Capital Ltd. has an unfunded commitment of $2,879. |
| (10) | Denotes a Control Investment. “Control Investments” are defined in the 1940 Act as investments in those companies that the Company is deemed to “Control.” Generally, under the Investment Company Act of 1940, as amended (the “1940 Act”), the Company is deemed to “Control” a company in which it has invested if it owns 25% or more of the voting securities of such company or has greater than 50% representation on its board. |
| (11) | Denotes an Affiliate Investment. “Affiliate Investments” are investments in those companies that are “Affiliated Companies” of the Company, as defined in the 1940 Act, which are not “Control Investments.” The Company is deemed to be an “Affiliate” of a company in which it has invested if it owns 5% or more but less than 25% of the voting securities of such company. |
| (12) | Solar Capital Ltd.’s investment in Ark Real Estate Partners LP is held through its taxable subsidiary SLRC ADI Corp. |
| (13) | SODO Corp. and SOCAY Corp. own equity interests that represent a majority of the equity ownership in Aviator Cap SII, LLC and USAW 767. Solar Capital Ltd.’s investments in SODO Corp. and SOCAY Corp. each include a one dollar investment in common shares. |
| (14) | Founders Shares. |
| (15) | Contingent Founders Shares. |
| (16) | Includes an unfunded commitment of $15,600 Canadian Dollars or $15,313 U.S Dollars as of December 31, 2011. |
| (17) | Indicates an investment held by Solar Capital Ltd. through its wholly-owned subsidiary Solar Capital Funding II LLC. Such investments are pledged as collateral under the Senior Secured Loan Facility (see Note 6 to the consolidated financial statements) and are not generally available to the creditors of Solar Capital Ltd. Unless otherwise noted, as of December 31, 2011, all other investments were pledged as collateral for the Senior Secured Revolving Credit Facility and the Term Loan (see Note 6 to the consolidated financial statements). |
| (18) | Indicates an investment partially held by Solar Capital Ltd. through its wholly-owned subsidiary Solar Capital Funding II LLC. (See note 17 above for further explanation.) Par amounts held through Solar Capital Funding II LLC include: Asurion $14,224; Fulton Holding Corp. $18,000; Interactive Health Solutions, Inc. $10,236; Roundy’s Supermarkets Inc. $10,000; Transplace Texas, LP $18,800; ViaWest Inc. $15,239; Vision Holding Corp $13,883; Earthbound $23,500; Midcap Financial Intermediate Holdings, LLC $23,500; and Rug Doctor L.P. $9,515. Remaining par balances are held directly by Solar Capital Ltd. |
| (19) | Includes an unfunded commitment of $1,250. |
| (20) | Investment is on non-accrual status. |
See notes to consolidated financial statements.
65
Table of Contents
SOLAR CAPITAL LTD.
CONSOLIDATED SCHEDULE OF INVESTMENTS (continued)
December 31, 2011
| Industry Classification |
Pecentage of
Total Investments (at fair value) as of December 31, 2011 |
|||
| Beverage, Food & Tobacco |
16 | % | ||
| Insurance |
10 | % | ||
| Banking |
10 | % | ||
| Personal, Food & Misc. Services |
8 | % | ||
| Leisure, Amusement, Entertainment |
7 | % | ||
| Healthcare, Education & Childcare |
5 | % | ||
| Farming & Agriculture |
5 | % | ||
| Grocery |
5 | % | ||
| Retail Stores |
4 | % | ||
| Diversified/Conglomerate Service |
4 | % | ||
| Personal & Nondurable Consumer Products |
4 | % | ||
| Aerospace & Defense |
4 | % | ||
| Buildings & Real Estate |
3 | % | ||
| Cargo Transport |
2 | % | ||
| Hotels, Motels, Inns and Gaming |
2 | % | ||
| Machinery |
2 | % | ||
| Personal Transportation |
2 | % | ||
| Mining, Steel, Iron & Nonprecious Metals |
1 | % | ||
| Textiles & Leather |
1 | % | ||
| Broadcasting & Entertainment |
1 | % | ||
| Electronics |
1 | % | ||
| Telecommunications |
1 | % | ||
| Finance |
1 | % | ||
| Home, Office Furnishing & Durable Consumer Prds |
1 | % | ||
|
|
|
|||
| 100.00 | % | |||
|
|
|
|||
See notes to consolidated financial statements.
66
Table of Contents
SOLAR CAPITAL LTD.
CONSOLIDATED SCHEDULE OF INVESTMENTS
December 31, 2010
(in thousands, except shares)
| Description(1) |
Industry |
Interest(2) | Maturity | Par Amount/ Shares |
Cost | Fair Value |
||||||||||||||||
| Bank Debt/Senior Secured Loans—25.3% |
||||||||||||||||||||||
| Asurion Corporation (18) |
Insurance | 6.76 | % | 7/3/2015 | $ | 49,310 | $ | 49,266 | $ | 46,609 | ||||||||||||
| Classic Cruises Holdings (5) |
Leisure, Amusement, Entertainment | 10.11 | % | 1/31/2015 | 26,000 | 25,478 | 23,920 | |||||||||||||||
| Emdeon Business Services LLC |
Healthcare, Education & Childcare | 5.26 | % | 5/16/2014 | 15,000 | 15,087 | 14,850 | |||||||||||||||
| Fulton Holding Corp (18) |
Retail Stores | 13.82 | % | 5/28/2016 | 35,000 | 33,964 | 35,000 | |||||||||||||||
| Ram Energy Resources, Inc. |
Oil & Gas | 12.75 | % | 11/29/2012 | 9,270 | 9,247 | 8,899 | |||||||||||||||
| Roundy’s Supermarkets, Inc. (18) |
Grocery | 10.00 | % | 4/16/2016 | 22,000 | 21,612 | 22,371 | |||||||||||||||
| USAW 767 (10) |
Aerospace & Defense | 14.50 | % | 12/31/2012 | 6,753 | 6,621 | 6,618 | |||||||||||||||
| ViaWest Inc (18) |
Personal, Food & Misc. Services | 13.50 | %(21) | 5/20/2016 | 32,757 | 31,863 | 31,774 | |||||||||||||||
| Vision Holding Corp. |
Healthcare, Education & Childcare | 12.00 | % | 11/23/2016 | 40,000 | 39,238 | 39,225 | |||||||||||||||
| VPSI, Inc. |
Personal Transportation | 12.00 | % | 12/23/2015 | 18,333 | 17,877 | 17,875 | |||||||||||||||
|
|
|
|
|
|
|
|||||||||||||||||
| Total Bank Debt/Senior Secured Loans |
$ | 254,423 | $ | 250,253 | $ | 247,141 | ||||||||||||||||
|
|
|
|
|
|
|
|||||||||||||||||
| Subordinated Debt/Corporate Notes—66.6% |
||||||||||||||||||||||
| Ares Capital Corporation (17) |
Finance | 6.00 | % | 4/1/2012 | $ | 15,393 | $ | 12,046 | $ | 15,947 | ||||||||||||
| Ares Capital Corporation (18) |
Finance | 6.63 | % | 7/15/2011 | 14,500 | 12,552 | 14,784 | |||||||||||||||
| Adams Outdoor Advertising |
Diversified/Conglomerate Service | 18.00 | % | 12/8/2015 | 42,500 | 41,784 | 41,775 | |||||||||||||||
| AMC Entertainment Holdings, Inc. |
Leisure, Amusement, Entertainment | 5.30 | %(21) | 6/13/2012 | 25,729 | 25,564 | 23,414 | |||||||||||||||
| Booz Allen |
Aerospace & Defense | 13.00 | % | 7/31/2016 | 17,362 | 17,103 | 17,927 | |||||||||||||||
| Direct Buy Inc. (18) |
Home, Office Furnishing & Durable Consumer Prds | 16.00 | % | 5/30/2013 | 38,100 | 37,724 | 34,614 | |||||||||||||||
| DS Waters |
Beverage, Food & Tobacco | 15.00 | %(21) | 4/24/2012 | 107,759 | 107,158 | 100,216 | |||||||||||||||
| Earthbound (18) |
Farming & Agriculture | 14.25 | % | 6/21/2017 | 58,947 | 57,475 | 58,358 | |||||||||||||||
| Fleetpride Corporation (18) |
Cargo Transport | 11.50 | % | 10/1/2014 | 43,000 | 43,119 | 41,065 | |||||||||||||||
| Grakon, LLC (12) |
Machinery | 14.00 | %(21) | 6/19/2013 | 22,084 | 18,620 | 6,625 | |||||||||||||||
| Iglo Birds Eye Group Limited (3)(4) |
Beverage, Food & Tobacco | 11.79 | %(21) | 11/3/2016 | 5,100 | 5,131 | 5,144 | |||||||||||||||
| Iglo Birds Eye Group Limited (3)(4) |
Beverage, Food & Tobacco | 11.33 | %(21) | 11/3/2016 | 12,378 | 15,257 | 12,427 | |||||||||||||||
| Magnolia River, LLC |
Hotels, Motels, Inns and Gaming | 14.00 | % | 4/28/2014 | 19,064 | 18,492 | 18,111 | |||||||||||||||
| Midcap Financial Intermediate Holdings, LLC (16) (18) |
Banking | 14.25 | % | 7/9/2015 | 75,000 | 73,205 | 73,125 | |||||||||||||||
| ProSieben Sat.1 Media AG (3)(8) |
Broadcasting & Entertainment | 8.14 | %(21) | 3/6/2017 | 21,059 | 19,813 | 17,247 | |||||||||||||||
| Richelieu Foods, Inc. (17) |
Beverage, Food & Tobacco | 13.75 | % | 5/18/2016 | 22,500 | 21,901 | 21,881 | |||||||||||||||
| Rug Doctor L.P. (18) |
Personal, Food & Misc. Services | 13.50% to 16.00 | %(21) | 10/31/2014 | 49,715 | 47,828 | 47,229 | |||||||||||||||
| (avg. 14.95 | %) | |||||||||||||||||||||
| Seven Media Group Pty Limited (3) |
Broadcasting & Entertainment | 11.18 | % | 12/29/2013 | 20,712 | 16,328 | 20,297 | |||||||||||||||
| Seven Media Group Pty Limited (3) |
Broadcasting & Entertainment | 12.00 | %(21) | 12/29/2013 | 8,794 | 6,212 | 8,003 | |||||||||||||||
| Shoes For Crews, LLC (17) |
Textiles & Leather | 13.75 | % | 7/23/2016 | 15,650 | 15,249 | 15,650 | |||||||||||||||
| Tri-Star Electronics International, Inc. |
Aerospace & Defense | 15.25 | % | 8/2/2013 | 22,834 | 22,743 | 21,236 | |||||||||||||||
| Weetabix Group (3)(7) |
Beverage, Food & Tobacco | 10.53 | %(21) | 9/14/2016 | 14,586 | 17,092 | 11,304 | |||||||||||||||
| Weetabix Group (3)(7) |
Beverage, Food & Tobacco | 10.03 | %(21) | 5/7/2017 | 31,206 | 38,421 | 23,405 | |||||||||||||||
|
|
|
|
|
|
|
|||||||||||||||||
| Total Subordinated Debt/Corporate Notes |
$ | 703,972 | $ | 690,817 | $ | 649,784 | ||||||||||||||||
|
|
|
|
|
|
|
|||||||||||||||||
67
Table of Contents
SOLAR CAPITAL LTD.
CONSOLIDATED SCHEDULE OF INVESTMENTS (continued)
December 31, 2010
(in thousands, except shares)
| Description(1) |
Industry |
Interest(2) | Maturity | Par Amount/ Shares |
Cost | Fair Value |
||||||||||||||||
| Preferred Equity—0.4% |
||||||||||||||||||||||
| SODO Corp. (10)(20) |
Aerospace & Defense | 10.00 | % (21) | — | 388 | $ | 390 | $ | 390 | |||||||||||||
| SOCAY Corp. (10)(20) |
Aerospace & Defense | 10.00 | % (21) | — | 3,484 | 3,500 | 3,500 | |||||||||||||||
| Wyle Laboratories |
Aerospace & Defense | 8.00 | % | 7/17/2015 | 387 | 39 | 44 | |||||||||||||||
|
|
|
|
|
|||||||||||||||||||
| Total Preferred Equity |
$ | 3,929 | $ | 3,934 | ||||||||||||||||||
|
|
|
|
|
|||||||||||||||||||
| Common Equity / Partnership Interests / Warrants—7.7% |
||||||||||||||||||||||
| Ark Real Estate Partners LP (9)(11)(19) |
Buildings & Real Estate | 34,806,121 | $ | 34,806 | $ | 29,235 | ||||||||||||||||
| Direct Buy Inc. |
Home, Office Furnishing & Durable Consumer | |||||||||||||||||||||
| Prds | 5,000,000 | 5,000 | 2,500 | |||||||||||||||||||
| Global Garden Products (3)(6) |
Farming & Agriculture | 88,483 | — | — | ||||||||||||||||||
| Grakon, LLC |
Machinery | 1,714,286 | 1,714 | — | ||||||||||||||||||
| Great American Group Inc. (13) |
Personal, Food & Misc. Services | 572,800 | 2,681 | 281 | ||||||||||||||||||
| Great American Group Inc. (14) |
Personal, Food & Misc. Services | 187,500 | 3 | 92 | ||||||||||||||||||
| National Specialty Alloys, LLC(10) |
Mining, Steel, Iron & Nonprecious Metals | 1,000,000 | 10,000 | 10,000 | ||||||||||||||||||
| Nuveen Investments, Inc. |
Finance | 3,000,000 | 30,000 | 7,500 | ||||||||||||||||||
| NXP Semiconductors Netherlands B.V.(3)(15) |
Electronics | 1,139,081 | 31,057 | 21,897 | ||||||||||||||||||
| Seven Media Group Pty Limited (3) |
Broadcasting & Entertainment | 4,285,714 | 3,301 | 3,857 | ||||||||||||||||||
|
|
|
|
|
|||||||||||||||||||
| Total Common Equity/Partnerships Interests / |
||||||||||||||||||||||
| Warrants |
$ | 118,562 | $ | 75,362 | ||||||||||||||||||
|
|
|
|
|
|||||||||||||||||||
| Total Investments |
$ | 1,063,561 | $ | 976,221 | ||||||||||||||||||
|
|
|
|
|
|||||||||||||||||||
| (1) | We generally acquire our investments in private transactions exempt from registration under the Securities Act. Our investments are therefore generally subject to certain limitations on resale, and may be deemed to be “restricted securities” under the Securities Act. |
| (2) | A majority of the variable rate debt investments bear interest at a rate that may be determined by reference to LIBOR or EURIBOR, and which reset daily, quarterly or semi-annually. For each debt investment we have provided the current interest rate in effect as of December 31, 2010. |
| (3) | The following entities are domiciled outside the United States and the investments are denominated in either Euro, British Pounds or Australian Dollars: Iglo Birds Eye Group Limited, Global Garden Products and Weetabix Group in the United Kingdom; ProSieben Sat.1 Media AG in Germany; and Seven Media Group Pty Limited in Australia. NXP Semiconductors Netherlands B.V. is domiciled in the Netherlands and is denominated in U.S. dollars. All other investments are domiciled in the United States. |
| (4) | Solar Capital Ltd.’s investments in Iglo Birds Eye Group Limited are held through its wholly-owned subsidiary Solar Capital Luxembourg I S.a.r.l. |
| (5) | Solar Capital Ltd.’s investments in Classic Cruises Holdings are held through its wholly-owned subsidiary Solar Capital Luxembourg I S.a.r.l. |
| (6) | Solar Capital Ltd.’s investments in Global Garden Products are held through its wholly-owned subsidiary Solar Capital Luxembourg I S.a.r.l. |
| (7) | Solar Capital Ltd.’s investments in Weetabix Group are held through its wholly-owned subsidiary Solar Capital Luxembourg I S.a.r.l. |
| (8) | Solar Capital Ltd.’s investments in ProSieben Sat. 1 Media AG are held through its wholly-owned subsidiary Solar Capital Luxembourg I S.a.r.l. |
| (9) | Solar Capital Ltd. has an unfunded commitment of $9,946. |
68
Table of Contents
| (10) | Denotes a Control Investment. “Control Investments” are defined in the 1940 Act as investments in those companies that the Company is deemed to “Control.” Generally, under the 1940 Act, the Company is deemed to “Control” a company in which it has invested if it owns 25% or more of the voting securities of such company or has greater than 50% representation on its board. |
| (11) | Denotes an Affiliate Investment. “Affiliate Investments” are investments in those companies that are “Affiliated Companies” of the Company, as defined in the 1940 Act, which are not “Control Investments.” The Company is deemed to be an “Affiliate” of a company in which it has invested if it owns 5% or more but less than 25% of the voting securities of such company. |
| (12) | Investment is on non-accrual status |
| (13) | Founders Shares |
| (14) | Contingent Founders Shares |
| (15) | Administrative agent to NXP management equity plan |
| (16) | Includes an unfunded par commitment of $15,000 |
| (17) | Indicates an investment held by Solar Capital Ltd. through its wholly-owned subsidiary Solar Capital Funding II LLC. Such investments are pledged as collateral under the Senior Secured Loan Facility (see Note 6 to the consolidated financial statements) and are not generally available to the creditors of Solar Capital Ltd. Unless otherwise noted, as of December 31, 2010, all other investments were pledged as collateral for the Senior Secured Revolving Credit Facility and the Term Loan (see Note 6 to the consolidated financial statements). |
| (18) | Indicates an investment partially held by Solar Capital Ltd. through its wholly-owned subsidiary Solar Capital Funding II LLC. (See note 17 above for further explanation.) Par amounts held through Solar Capital Funding II LLC include: Asurion $14,224; Fulton Holding Corp. $18,000; Roundy’s Supermarkets Inc. $10,000; ViaWest Inc. $15,054; Ares Capital Corporation $12,000; Direct Buy Inc. $15,000; Earthbound $23,500; Fleetpride Corporation $23,500; Midcap Financial Intermediate Holdings, LLC $23,500; and Rug Doctor L.P. $9,371. Remaining par balances are held directly by Solar Capital Ltd. |
| (19) | Solar Capital Ltd.’s investments in Ark Real Estate Partners LP are held though it wholly-owned subsidiary SLRC ADI Corp. |
| (20) | Solar Capital Ltd.’s investments in SODO Corp. and SOCAY Corp. each include a one dollar investment in common shares |
| (21) | Coupon is payable in cash and/or in kind (PIK). |
See notes to consolidated financial statements.
69
Table of Contents
SOLAR CAPITAL LTD.
CONSOLIDATED SCHEDULE OF INVESTMENTS (continued)
December 31, 2010
| Industry Classification |
Pecentage of Total Investments (at fair value) as of December 31, 2010 |
|||
| Beverage, Food & Tobacco |
18 | % | ||
| Personal, Food & Misc. Services |
8 | % | ||
| Banking |
7 | % | ||
| Farming & Agriculture |
6 | % | ||
| Healthcare, Education & Childcare |
5 | % | ||
| Aerospace & Defense |
5 | % | ||
| Broadcasting & Entertainment |
5 | % | ||
| Leisure, Amusement, Entertainment |
5 | % | ||
| Insurance |
5 | % | ||
| Diversified/Conglomerate Service |
4 | % | ||
| Cargo Transport |
4 | % | ||
| Finance |
4 | % | ||
| Home, Office Furnishing & Durable Consumer Prds |
4 | % | ||
| Retail Stores |
4 | % | ||
| Buildings & Real Estate |
3 | % | ||
| Grocery |
2 | % | ||
| Electronics |
2 | % | ||
| Hotels, Motels, Inns and Gaming |
2 | % | ||
| Personal Transportation |
2 | % | ||
| Textiles & Leather |
2 | % | ||
| Mining, Steel, Iron & Nonprecious Metals |
1 | % | ||
| Oil & Gas |
1 | % | ||
| Machinery |
1 | % | ||
|
|
|
|||
| 100 | % | |||
|
|
|
|||
See notes to consolidated financial statements.
70
Table of Contents
NOTES TO CONSOLIDATED FINANCIAL STATEMENTS
December 31, 2011
(in thousands, except shares)
Note 1. Organization
Solar Capital Ltd. (“Solar Capital”, the “Company” or “we”), a Maryland corporation formed in November 2007, is a closed-end, externally managed, non-diversified management investment company that has elected to be treated as a business development company (“BDC”) under the Investment Company Act of 1940, as amended (the “1940 Act”). In addition, for tax purposes the Company has elected to be treated as a regulated investment company (“RIC”) under Subchapter M of the Internal Revenue Code of 1986, as amended (the “Code”).
On February 9, 2010, Solar Capital Ltd. priced its initial public offering, selling 5.68 million shares, including the underwriters’ over-allotment, at a price of $18.50 per share. Concurrent with this offering, management purchased an additional 600,000 shares through a private placement, also at $18.50 per share.
Immediately prior to the initial public offering, through a series of transactions Solar Capital Ltd. merged with Solar Capital LLC, leaving Solar Capital Ltd. as the surviving entity (the “Merger”). Solar Capital Ltd. issued an aggregate of approximately 26.65 million shares of common stock and $125 million in Senior Unsecured Notes to the existing Solar Capital LLC unit holders in connection with the Merger. Solar Capital Ltd. had no assets or operations prior to completion of the Merger and as a result, the historical books and records of Solar Capital LLC have become the books and records of the surviving entity.
Solar Capital LLC, a Maryland limited liability company, was formed in February 2007 and commenced operations on March 13, 2007 with initial capital of $1.2 billion of which 47.04% was funded by affiliated parties.
The Company’s investment objective is to generate both current income and capital appreciation through debt and equity investments. The Company invests primarily in middle-market companies in the form of mezzanine and senior secured loans, each of which may include an equity component, and, to a lesser extent, by making direct equity investments in such companies.
Note 2. Significant Accounting Policies
Basis of Presentation—The accompanying consolidated financial statements have been prepared on the accrual basis of accounting in conformity with accounting principles generally accepted in the United States of America (“GAAP”), and include the accounts of the Company and its wholly-owned subsidiaries, Solar Capital Luxembourg I S.a.r.l., which was incorporated under the laws of the Grand Duchy of Luxembourg on April 26, 2007, and Solar Capital Funding II LLC (“SC Funding”), a Delaware limited liability company formed on December 8, 2010. The consolidated financial statements reflect all adjustments and reclassifications which, in the opinion of management, are necessary for the fair presentation of the results of the operations and financial condition for the years presented. All significant intercompany balances and transactions have been eliminated.
As required by ASC 260-10, Earnings Per Share, the number of shares used to calculate weighted average shares for use in computations on a per share basis have been decreased retroactively by a factor of approximately 0.4022 for all periods prior to February 9, 2010. This factor represents the effective impact of the reduction in shares resulting from the Merger.
Investments—The Company applies fair value accounting in accordance with GAAP. Securities transactions are accounted for on trade date. Securities for which market quotations are readily available on an
71
Table of Contents
SOLAR CAPITAL LTD.
NOTES TO CONSOLIDATED FINANCIAL STATEMENTS
December 31, 2011
(in thousands, except shares)
exchange are valued at such price as of the closing price on the valuation date. The Company may also obtain quotes with respect to certain of its investments from pricing services or brokers or dealers in order to value assets. When doing so, the Company determines whether the quote obtained is sufficient according to GAAP to determine the fair value of the security. If determined adequate, the Company uses the quote obtained.
Securities for which reliable market quotations are not readily available or for which the pricing source does not provide a valuation or methodology or provides a valuation or methodology that, in the judgment of the Company’s investment adviser or Board of Directors (the “Board”), does not represent fair value, shall each be valued as follows:
| 1) | The quarterly valuation process begins with each portfolio company or investment being initially valued by the investment professionals responsible for the portfolio investment; |
| 2) | Preliminary valuation conclusions are then documented and discussed with senior management; |
| 3) | Third-party valuation firms are engaged by, or on behalf of, the Board to conduct independent appraisals and review management’s preliminary valuations and make their own independent assessment, for all material assets; and |
| 4) | The Board discusses valuations and determines the fair value of each investment in the portfolio in good faith based on the input of our investment adviser (note 4) and, where appropriate, the respective independent valuation firms. |
Valuation methods, among other measures and as applicable, may include comparisons of financial ratios of the portfolio companies that issued such private equity securities to peer companies that are public, the nature and realizable value of any collateral, the portfolio company’s ability to make payments and its earnings and discounted cash flows, the markets in which the portfolio company does business, and other relevant factors.
When an external event such as a purchase transaction, public offering or subsequent equity sale occurs, the Company will consider the pricing indicated by the external event to corroborate the private equity valuation. Due to the inherent uncertainty of determining the fair value of investments that do not have a readily available market value, the fair value of the investments may differ significantly from the values that would have been used had a readily available market value existed for such investments, and the differences could be material.
Investments of sufficient credit quality purchased within 60 days of maturity are valued at cost plus accreted discount, or minus amortized premium, which approximates fair value.
Cash and Cash Equivalents—Cash and cash equivalents include investments in money market accounts or investments with original maturities of three months or less.
Revenue Recognition—The Company’s revenue recognition policies are as follows:
Sales: Gains or losses on the sale of investments are calculated by using the specific identification method.
Interest Income: Interest income, adjusted for amortization of premium and accretion of discount, is recorded on an accrual basis. Origination, closing and/or commitment fees associated with investments in portfolio companies are accreted into interest income over the respective terms of the applicable loans. Upon the prepayment of a loan or debt security, any prepayment penalties and unamortized loan origination, closing and commitment fees are recorded as part of interest income. The Company has loans in its portfolio that contain a payment-in-kind (“PIK”) provision. PIK interest is accrued at the contractual rates and added to the loan principal on the reset dates.
Dividend Income: Dividend income on preferred equity securities is recorded as dividend income on an accrual basis to the extent that such amounts are payable by the portfolio company and are expected to be collected. Dividend income on common equity securities is recorded on the record date for private portfolio companies or on the ex-dividend date for publicly traded portfolio companies.
72
Table of Contents
SOLAR CAPITAL LTD.
NOTES TO CONSOLIDATED FINANCIAL STATEMENTS
December 31, 2011
(in thousands, except shares)
Non-accrual: Loans are placed on non-accrual status when principal or interest payments are past due 30 days or more or when there is reasonable doubt that principal or interest will be collected. Accrued interest is generally reversed when a loan is placed on non-accrual status. Interest payments received on non-accrual loans may be recognized as income or applied to principal depending upon management’s judgment. Non-accrual loans are restored to accrual status when past due principal and interest is paid and, in management’s judgment, are likely to remain current.
Fee Revenue Receivable—Fee revenue receivable consists of premium payments owed to the Company at the maturity of certain loans. The premium payments are recorded as a receivable at the inception of the loan and are accreted into interest income over the respective terms of the applicable loans.
Deferred Fee Revenue—Deferred fee revenue represents the unearned portion of premium payments owed to the Company at the maturity of certain loans.
U.S. Federal Income Taxes—The Company has elected to be treated as a RIC under subchapter M of the Code and operates in a manner so as to qualify for the tax treatment applicable to RICs. In order to qualify as a RIC, among other things, the Company is required to timely distribute to its stockholders at least 90% of investment company taxable income, as defined by the Code, for each year. Depending on the level of taxable income earned in a given tax year, we may choose to carry forward taxable income in excess of current year dividend distributions into the next tax year and pay a 4% excise tax on such income, as required. To the extent that the Company determines that its estimated current year annual taxable income will be in excess of estimated current year dividend distributions, the Company accrues excise tax, if any, on estimated excess taxable income as taxable income is earned. For the years ended December 31, 2011 and 2010, $697 and $120 was recorded for U.S. Federal excise tax, respectively.
Although we file federal and state tax returns, our major tax jurisdiction is federal. Our inception-to-date federal tax years remain subject to examination by the Internal Revenue Service. The Company is also subject to taxes in Luxembourg, through Solar Capital Luxembourg I S.a.r.l., a wholly-owned subsidiary. Under the laws of Luxembourg, the Company pays a corporate income tax and a municipal business tax on its subsidiary’s taxable income.
We have formed and used certain taxable subsidiaries to be taxed as a corporation for federal income tax purposes. These taxable subsidiaries allow us to hold portfolio companies organized as pass-through entities and still satisfy certain RIC income requirements. We do not consolidate the taxable subsidiaries for income tax purposes but we do recognize the results of these subsidiaries for financial reporting purposes.
The Company evaluates tax positions taken or expected to be taken in the course of preparing its financial statements to determine whether the tax positions are “more-likely-than-not” of being sustained by the applicable tax authority. Tax positions not deemed to meet the “more-likely-than-not” threshold are reversed and recorded as a tax benefit or expense in the current year. All penalties and interest associated with income taxes are included in income tax expense. Conclusions regarding tax positions are subject to review and may be adjusted at a later date based on factors including, but not limited to, on-going analyses of tax laws, regulations and interpretations thereof. We did not have any uncertain tax positions that met the recognition or measurement criteria of ASC 740-10-25 nor did we have any unrecognized tax benefits as of the periods presented herein.
Capital Accounts—Certain capital accounts including under (over) distributed net investment income, accumulated net realized gain or loss, net unrealized depreciation, and paid-in capital in excess of par, are
73
Table of Contents
SOLAR CAPITAL LTD.
NOTES TO CONSOLIDATED FINANCIAL STATEMENTS
December 31, 2011
(in thousands, except shares)
adjusted, at least annually, for permanent differences between book and tax. In addition, the character of income and gains to be distributed is determined in accordance with income tax regulations that may differ from GAAP.
Dividends—Dividends and distributions to common stockholders are recorded on the ex-dividend date. Quarterly dividend payments are determined by the Board and are generally based upon taxable earnings estimated by management. Net realized capital gains, if any, are distributed at least annually, although we may decide to retain such capital gains for investment. We have adopted a dividend reinvestment plan that provides for reinvestment of any distributions we declare in cash on behalf of our stockholders, unless a stockholder elects to receive cash. As a result, if our Board authorizes, and we declare, a cash dividend, then our stockholders who have not “opted out” of our dividend reinvestment plan will have their cash dividends automatically reinvested in additional shares of our common stock, rather than receiving the cash dividend. While we generally use newly issued shares to implement the plan (especially if our shares are trading at a premium to net asset value), we may purchase shares in the open market in connection with our obligations under the plan. In particular, if our shares are trading at a significant enough discount to net asset value and we are otherwise permitted under applicable law to purchase such shares, we intend to purchase shares in the open market in connection with our obligations under our dividend reinvestment plan.
Foreign Currency Translation—The accounting records of the Company are maintained in U.S. dollars. Foreign currency amounts are translated into U.S. dollars on the following basis:
(i) Market value of investment securities, other assets and liabilities – at the current rates of exchange.
(ii) Purchase and sales of investment securities, income and expenses – at the rates of exchange prevailing on the respective date of such transactions.
The Company does not isolate that portion of realized and unrealized gains or losses on investments that result from changes in market prices of investments from those that result from fluctuations in foreign exchange rates. Net realized foreign currency gains or losses arise from sales or repayments of foreign denominated investments (recorded in realized gain/loss on investments), maturities or terminations of foreign currency derivatives (recorded in realized gain/loss on derivatives), repayments of foreign denominated liabilities and other transactional gain or loss resulting from fluctuations in foreign exchange rates on amounts received or paid (recorded in realized gain/loss on foreign exchange). Net unrealized foreign exchange gains and losses arise from valuation changes in foreign denominated assets and liabilities, resulting from changes in exchange rates, including unrealized foreign exchange gains and losses on investments (recorded in unrealized gain/loss on investments), foreign currency derivatives (recorded in unrealized gain/loss on derivatives), and all other assets and liabilities (recorded in unrealized gain/loss on foreign exchange).
The Company’s investments in foreign securities may involve certain risks such as foreign exchange restrictions, expropriation, taxation or other political, social or economic risks, all of which could affect the market and/or credit risk of the investment. In addition, changes in the relationship of foreign currencies to the U.S. dollar can significantly affect the value of these investments and therefore the earnings of the Company.
Derivative Instruments and Hedging Activity—The Company recognizes derivatives as either assets or liabilities at fair value on its Consolidated Statements of Assets and Liabilities with valuation changes recorded as realized or unrealized gains and losses. The Company currently does not have any formally documented hedges that qualify for hedge accounting treatment.
74
Table of Contents
SOLAR CAPITAL LTD.
NOTES TO CONSOLIDATED FINANCIAL STATEMENTS
December 31, 2011
(in thousands, except shares)
The Company uses foreign exchange forward contracts and/or borrowings on its multicurrency revolving credit facility to economically hedge its foreign currency risks. Changes in the values of the Company’s foreign denominated assets are recorded in current earnings as realized and unrealized gains and losses (see above); likewise, realized and unrealized gains and losses from derivatives and foreign denominated debt are also recorded in current earnings. The fair value of foreign exchange forward contracts is determined by recognizing the difference between the contract exchange rate and the current market exchange rate. Fluctuations in market values of assets and liabilities denominated in the same foreign currency offset in earnings providing a “natural” foreign currency hedge.
The Company uses interest rate caps to create a synthetic “ceiling” on its borrowing rates. An interest rate cap is a derivative in which the buyer receives payments at the end of each period in which the interest rate exceeds an agreed strike price. Interest payments on the Company’s credit facilities are primarily LIBOR based. By purchasing caps on LIBOR, if LIBOR exceeds the strike price, the Company will pay a higher interest rate on its credit facilities but receive an offsetting payment from the cap counterparty on the notional amount above the strike price. Caps have an initial cost. The fair value of interest rate caps is determined using option pricing models that use readily available market inputs.
Deferred Offering Costs—Offering costs consist of fees paid in relation to legal, accounting, regulatory and printing work completed in connection with offerings of our common stock or debt.
Receivable for Investments Sold—Receivable for investments sold represents a receivable for investments that have sold but the proceeds have not been received.
Payable for Investments Purchased—Payable for investments purchased represents a liability for investments that have been purchased but the proceeds have not been paid and any unfunded loan commitments.
Deferred Credit Facility Costs—Deferred credit facility costs are being amortized over the life of the related credit facility.
Use of Estimates in the Preparation of Financial Statements—The preparation of consolidated financial statements in conformity with GAAP requires management to make estimates and assumptions that affect the reported amount of assets and liabilities at the date of the financial statements and the reported amounts of income and expenses during the reported period. Changes in the economic environment, financial markets and any other parameters used in determining these estimates could cause actual results to differ materially.
Subsequent Events Evaluation—The Company has evaluated the need for disclosures and/or adjustments resulting from subsequent events through the date the financial statements were issued and determined that none are required, except for the following.
Subsequent to December 31, 2011, DSW Group, Inc., the Company’s largest investment, announced it is seeking to refinance its capital structure. Until the terms of the recapitalization have been finalized, the Company cannot fully assess the impact on its portfolio; however, at this time the Company does not believe the impact will be material.
Note 3. Investments
Investments consisted of the following as of December 31, 2011 and 2010:
| December 31, 2011 | December 31, 2010 | |||||||||||||||
| Cost | Fair Value | Cost | Fair Value | |||||||||||||
| Bank Debt/Senior Secured Loans |
$ | 426,201 | $ | 412,396 | $ | 250,253 | $ | 247,141 | ||||||||
| Subordinated Debt/Corporate Notes |
604,157 | 546,859 | 690,817 | 649,784 | ||||||||||||
| Preferred Equity |
15,107 | 14,664 | 3,929 | 3,934 | ||||||||||||
| Common Equity/Partnership Interests/Warrants |
107,108 | 71,124 | 118,562 | 75,362 | ||||||||||||
|
|
|
|
|
|
|
|
|
|||||||||
| Total |
$ | 1,152,573 | $ | 1,045,043 | $ | 1,063,561 | $ | 976,221 | ||||||||
|
|
|
|
|
|
|
|
|
|||||||||
75
Table of Contents
SOLAR CAPITAL LTD.
NOTES TO CONSOLIDATED FINANCIAL STATEMENTS
December 31, 2011
(in thousands, except shares)
There was one asset on non-accrual status as of December 31, 2011 with a total fair value of $5,875. As of December 31, 2010, the Company had one investment on non-accrual status with a total fair value of $6,625.
Note 4. Agreements
Solar Capital has an Investment Advisory and Management Agreement with Solar Capital Partners LLC (the “Investment Adviser”), under which the Investment Adviser will manage the day-to-day operations of, and provide investment advisory services to, Solar Capital. For providing these services, the Investment Adviser receives a fee from Solar Capital, consisting of two components—a base management fee and an incentive fee. The base management fee is determined by taking the average value of Solar Capital’s gross assets at the end of the two most recently completed calendar quarters calculated at an annual rate of 2.00%. The incentive fee has two parts, as follows: one part is calculated and payable quarterly in arrears based on Solar Capital’s pre-incentive fee net investment income for the immediately preceding calendar quarter. For this purpose, pre-incentive fee net investment income means interest income, dividend income and any other income (including any other fees (other than fees for providing managerial assistance), such as commitment, origination, structuring, diligence and consulting fees or other fees that we receive from portfolio companies) accrued during the calendar quarter, minus Solar Capital’s operating expenses for the quarter (including the base management fee, any expenses payable under the Administration Agreement, and any interest expense and dividends paid on any issued and outstanding preferred stock, but excluding the incentive fee). Pre-incentive fee net investment income does not include any realized capital gains computed net of all realized capital losses and unrealized capital depreciation. Pre-incentive fee net investment income, expressed as a rate of return on the value of Solar Capital’s net assets at the end of the immediately preceding calendar quarter, is compared to the hurdle rate of 1.75% per quarter (7% annualized). Our net investment income used to calculate this part of the incentive fee is also included in the amount of our gross assets used to calculate the 2% base management fee. Solar Capital pays the Investment Adviser an incentive fee with respect to Solar Capital’s pre-incentive fee net investment income in each calendar quarter as follows: (1) no incentive fee in any calendar quarter in which Solar Capital’s pre-incentive fee net investment income does not exceed the hurdle rate; (2) 100% of Solar Capital’s pre-incentive fee net investment income with respect to that portion of such pre-incentive fee net investment income, if any, that exceeds the hurdle rate but is less than 2.1875% in any calendar quarter; and (3) 20% of the amount of Solar Capital’s pre-incentive fee net investment income, if any, that exceeds 2.1875% in any calendar quarter. These calculations are appropriately pro-rated for any period of less than three months and adjusted for any share issuances or repurchases during the relevant quarter. The second part of the incentive fee is determined and payable in arrears as of the end of each calendar year (or upon termination of the Investment Advisory and Management Agreement, as of the termination date), commencing on February 12, 2007, and will equal 20% of Solar Capital’s cumulative realized capital gains less cumulative realized capital losses, unrealized capital depreciation (unrealized depreciation on a gross investment-by-investment basis at the end of each calendar year) and all capital gains upon which prior performance-based capital gains incentive fee payments were previously made to the adviser. For financial statement purposes, the second part of the incentive fee is accrued based upon 20% of cumulative net realized and unrealized capital appreciation. No accrual was required for the years ended December 31, 2011, 2010 or 2009.
Solar Capital has also entered into an Administration Agreement with Solar Capital Management, LLC (the “Administrator”) under which the Administrator provides administrative services for Solar Capital. For providing these services, facilities and personnel, Solar Capital reimburses the Administrator for Solar Capital’s allocable portion of overhead and other expenses incurred by the Administrator in performing its obligations under the Administration Agreement, including rent. The Administrator will also provide, on Solar Capital’s behalf, managerial assistance to those portfolio companies to which Solar Capital is required to provide such assistance.
76
Table of Contents
SOLAR CAPITAL LTD.
NOTES TO CONSOLIDATED FINANCIAL STATEMENTS
December 31, 2011
(in thousands, except shares)
Note 5. Derivatives
The Company is exposed to interest rate risk both as a lender and a borrower. The Company’s borrowing facilities and term loan bear interest at a floating rate, which means that rising interest rates would increase our cost of borrowing. To partially mitigate this risk, in 2011, the Company purchased two interest rate cap contracts, which effectively limit the interest rate payable on $150 million of LIBOR based borrowings. The Company had no interest rate derivatives prior to 2011.
The following table highlights the outstanding interest rate caps:
| December 31, 2011 | ||||||||||||||||||||||||||||
| Index Rate |
Cap Rate | Notional Amount |
Expiration | Cost | Fair Value | Unrealized Depreciation |
Counterparty | |||||||||||||||||||||
| 3 Month Libor |
1.0 | % | $ | 100,000 | 1/13/2014 | $ | 1,950 | $ | 279 | $ | (1,671 | ) | Wells Fargo | |||||||||||||||
| 3 Month Libor |
1.0 | % | 50,000 | 5/4/2014 | 988 | 190 | (798 | ) | Wells Fargo | |||||||||||||||||||
|
|
|
|
|
|
|
|
|
|||||||||||||||||||||
| $ | 150,000 | $ | 2,938 | $ | 469 | $ | (2,469 | ) | ||||||||||||||||||||
|
|
|
|
|
|
|
|
|
|||||||||||||||||||||
The Company is also exposed to foreign exchange risk through its investments denominated in foreign currencies. The Company mitigates this risk through the use of foreign currency forward contracts. As an investment company, all changes in the fair value of assets, including changes caused by foreign currency fluctuation, flow through current earnings. The forward contracts serve as an economic hedge with their realized and unrealized gains and losses also recorded in current earnings. The Company has no derivatives designated as hedging instruments. During the year ended December 31, 2011, we entered into 80 foreign currency forward contracts with durations of 1 month with average U.S. dollar notional amounts of $30,697. During the year ended December 31, 2010, we entered into 77 foreign currency forward contracts with durations of 1 month with average U.S. dollar notional amounts of $28,181.
As of December 31, 2011, there were two open forward foreign currency contracts denominated in Euro and British Pounds, both of which terminate on January 10, 2012. As of December 31, 2010, there were three open forward foreign currency contracts denominated in Euro, Australian Dollar and British Pounds, all of which terminated on January 7, 2011. At December 31, 2011 and 2010, there was no fixed collateral held by counterparties for the open contracts and no credit-related contingent features associated with any of the open forward contracts. The contract details are as follows:
| December 31, 2011 | December 31, 2010 | |||||||||||||||||||||||||||||
| SOLD |
Foreign Currency |
USD Value | Unrealized appreciation (depreciation) |
Counterparty | Foreign Currency |
USD Value | Unrealized appreciation (depreciation) |
Counterparty | ||||||||||||||||||||||
| EUR |
966 | $ | 1,295 | $ | 44 | SunTrust Bank | 18,307 | $ | 24,464 | $ | (191 | ) | SunTrust Bank | |||||||||||||||||
| GBP |
12,989 | 20,308 | 136 | SunTrust Bank | 37,942 | 59,155 | 604 | SunTrust Bank | ||||||||||||||||||||||
| AUD |
— | — | — | — | 30,639 | 31,337 | (1,348 | ) | SunTrust Bank | |||||||||||||||||||||
|
|
|
|
|
|
|
|
|
|||||||||||||||||||||||
| Total Sold |
$ | 21,602 | $ | 180 | $ | 114,956 | $ | (935 | ) | |||||||||||||||||||||
|
|
|
|
|
|
|
|
|
|||||||||||||||||||||||
77
Table of Contents
SOLAR CAPITAL LTD.
NOTES TO CONSOLIDATED FINANCIAL STATEMENTS
December 31, 2011
(in thousands, except shares)
The following tables show the fair value and effect of the derivative instruments on the Consolidated Statements of Assets and Liabilities and the Consolidated Statements of Operations:
Fair Value of Derivative Instruments
| Derivative Assets | ||||||||||||
| December 31, 2011 | December 31, 2010 | |||||||||||
| Balance Sheet Location | Fair Value | Balance Sheet Location | Fair Value | |||||||||
| Derivatives not designated as hedging instruments(a) |
||||||||||||
| Foreign exchange contracts |
Derivative assets | $ | 180 | Derivative assets | $ | 604 | ||||||
| Interest rate caps |
Derivative assets | 469 | Derivative assets | — | ||||||||
|
|
|
|
|
|||||||||
| Total derivatives not designated as hedging instruments(a) |
$ | 649 | $ | 604 | ||||||||
|
|
|
|
|
|||||||||
| Total derivative assets |
$ | 649 | $ | 604 | ||||||||
|
|
|
|
|
|||||||||
| Derivative Liabilities | ||||||||||||
| December 31, 2011 | December 31, 2010 | |||||||||||
| Balance Sheet Location | Fair Value | Balance Sheet Location | Fair Value | |||||||||
| Derivatives not designated as hedging instruments(a) |
||||||||||||
| Foreign exchange contracts |
Derivative liabilities | $ | — | Derivative liabilities | $ | 1,539 | ||||||
|
|
|
|
|
|||||||||
| Total derivatives not designated as hedging instruments(a) |
$ | — | $ | 1,539 | ||||||||
|
|
|
|
|
|||||||||
| Total derivative liabilities |
$ | — | $ | 1,539 | ||||||||
|
|
|
|
|
|||||||||
| (a) | See Note 2 for additional information on the Company’s purpose for entering into derivatives not designated as hedging instruments and its overall risk management strategy. |
Effect of Derivative Instruments on the Consolidated Statements of Operations
| Derivatives not designated as hedging instruments(a) |
Location of Gain or (Loss) Recognized in Income on |
Amount of Gain or (Loss) Recognized in Income on Derivatives | ||||||||||||
| Year ended December 31, 2011 |
Year
ended December 31, 2010 |
Year
ended December 31, 2009 |
||||||||||||
| Foreign exchange contracts |
Realized gain (loss): | |||||||||||||
| Derivatives | $ | (5,620 | ) | $ | (3,124 | ) | $ | (12,608 | ) | |||||
| Foreign exchange contracts |
Unrealized gain (loss): | |||||||||||||
| Derivatives | 1,115 | (1,204 | ) | (2,583 | ) | |||||||||
| Interest rate caps |
Unrealized gain (loss): | |||||||||||||
| Derivatives | (2,469 | ) | — | — | ||||||||||
|
|
|
|
|
|
|
|||||||||
| Total |
$ | (6,974 | ) | $ | (4,328 | ) | $ | (15,191 | ) | |||||
|
|
|
|
|
|
|
|||||||||
78
Table of Contents
SOLAR CAPITAL LTD.
NOTES TO CONSOLIDATED FINANCIAL STATEMENTS
December 31, 2011
(in thousands, except shares)
Note 6. Borrowing Facilities, Senior Unsecured Notes, and Term Loan
Senior Secured Revolving Credit Facility—On January 11, 2008, Solar Capital LLC entered into a $200 million Senior Secured Revolving Credit Facility (the “$405 Million Facility”) with Citigroup Global Markets, Inc. (“CGMI”), various lenders, and Citibank, N.A., as administrative agent for the lenders. CGMI acted as the sole lead bookrunner and the sole lead arranger for the $405 Million Facility.
On February 12, 2010, Solar Capital Ltd. amended and restated the $405 Million Facility, extending the maturity to February 2013 and increasing the total commitments under the facility to $270 million. Per the amended agreement, borrowings bear interest at a rate per annum equal to the base rate plus 3.25% or the alternate base rate plus 2.25%. The commitment fee on unused balances is 0.375%. Total commitments under the $405 Million Facility have been increased to $405 million as a result of the addition of three new lenders on May 12, 2010, June 23, 2010 and December 19, 2011. The facility size may be increased up to $600 million with additional new lenders or the increase in commitments of current lenders. The Credit Facility contains certain customary affirmative and negative covenants and events of default, including the occurrence of a change of control. In addition, the Credit Facility contains certain financial covenants that among other things, requires the Company to maintain a minimum shareholder’s equity and a minimum asset coverage ratio.
Term Loan—On September 2, 2010, Solar Capital Ltd. entered into a fully funded $35 million senior secured term loan (the “Term Loan”), which matures in September 2013, bears interest at a rate per annum equal to the base rate plus 3.25%, and has terms substantially similar to our existing revolving credit facility. The Term Loan contains certain customary affirmative and negative covenants and events of default, including the occurrence of a change of control. In addition, the Term Loan contains certain financial covenants that among other things, requires the Company to maintain a minimum shareholders’ equity and a minimum asset coverage ratio.
Senior Secured Loan Facility—On December 17, 2010, Solar Capital Ltd. entered into a $100 million senior secured credit facility (the “$100 Million Facility”) with Wells Fargo Securities LLC, as administrative agent. Solar Capital entered into (i) a Purchase and Sale Agreement (the “Purchase and Sale Agreement”) with SC Funding, pursuant to which Solar Capital will sell to SC Funding certain loans that it has originated or acquired, or will originate or acquire (the “Loans”) from time to time; (ii) a Loan and Servicing Agreement (the “Loan and Servicing Agreement” and, together with the Purchase and Sale Agreement, the “Agreements”) with SC Funding as borrower; and (iii) various supporting documentation. The $100 Million Facility is secured by all of the assets held by SC Funding. The $100 Million Facility, among other things, matures on December 17, 2015 and bears interest based on LIBOR plus 3.00%. Under the Agreements, Solar Capital and SC Funding, as applicable, are required to comply with various covenants, reporting requirements and other customary requirements for similar credit facilities. The Purchase and Sale Agreement includes usual and customary events of default for credit facilities of this nature.
Senior Unsecured Notes—On February 9, 2010, in connection with the Merger, senior unsecured notes (the “Senior Unsecured Notes”) of Solar Capital Ltd. were issued to certain equity holders. The Senior Unsecured Notes were scheduled to mature in February 2014 and had a coupon of 8.75%, payable quarterly in cash beginning May 1, 2010. The Senior Unsecured Notes were redeemable at any time, in whole or in part, at a price of 100% of their principal amount, plus accrued and unpaid interest to the date of redemption. Further, net cash proceeds from the issuance of any other senior notes had to be used either to redeem or make an offer to purchase the outstanding Senior Unsecured Notes at a price of 100% of their principal amount, plus accrued and unpaid interest to the date of redemption. The Senior Unsecured Notes subjected Solar Capital Ltd. to customary covenants, including, among other things, (i) a requirement to maintain an “asset coverage ratio” of at least 2.00
79
Table of Contents
SOLAR CAPITAL LTD.
NOTES TO CONSOLIDATED FINANCIAL STATEMENTS
December 31, 2011
(in thousands, except shares)
to 1.00; (ii) a requirement that in the event of a “change of control” (as defined in the agreement governing the Senior Unsecured Notes) Solar Capital Ltd. will be required to offer to repurchase the Senior Unsecured Notes at a price of 101% of their principal amount, plus accrued and unpaid interest to the date of repurchase; and (iii) a restriction on incurring any debt on a junior lien basis, or any debt that is contractually subordinated in right of payment to any other debt unless it is also subordinated to the Senior Unsecured Notes on substantially identical terms. The agreement under which the Senior Unsecured Notes have been issued contained customary events of default. The Senior Unsecured Notes were repaid in full in December 2010 at par plus accrued interest.
The weighted average annualized interest cost for all borrowings for the year ended December 31, 2011 and 2010 was 3.66% and 7.71%, respectively. These costs are exclusive of commitment fees and for other prepaid expenses related to establishing the $405 Million Facility, the $100 Million Facility, the Senior Unsecured Notes, and the Term Loan (collectively the “Credit Facilities”). This weighted average annualized interest cost reflects the average interest cost for all outstanding borrowings. The average debt outstanding for the year ended December 31, 2011 and 2010 was $152,047 and $140,301, respectively. The maximum amounts borrowed on the Credit Facilities during the year ended December 31, 2011 and 2010 were $435,356 and $460,000, respectively. There was $236,355 drawn on the Credit Facilities as of December 31, 2011 and $435,000 as of December 31, 2010. At December 31, 2011 and 2010, the Company was in compliance with all financial and operational covenants required by the Credit Facilities.
Note 7. Fair Value
Fair value is defined as the price that would be received to sell an asset or paid to transfer a liability in an orderly transaction between market participants at the measurement date. GAAP establishes a framework for measuring fair value that includes a hierarchy used to classify the inputs used in measuring fair value. The hierarchy prioritizes the inputs to valuation techniques used to measure fair value into three levels. The level in the fair value hierarchy within which the fair value measurement falls is determined based on the lowest level input that is significant to the fair value measurement.
GAAP fair value measurement guidance classifies the inputs used to measure these fair values into the following hierarchy:
Level 1. Financial assets and liabilities whose values are based on unadjusted quoted prices for identical assets or liabilities in an active market that the Company has the ability to access (examples include active exchange-traded equity securities, exchange-traded derivatives, and most U.S. Government and agency securities).
Level 2. Financial assets and liabilities whose values are based on quoted prices in markets that are not active or model inputs that are observable either directly or indirectly for substantially the full term of the asset or liability. Level 2 inputs include the following:
| a) | Quoted prices for similar assets or liabilities in active markets; |
| b) | Quoted prices for identical or similar assets or liabilities in non-active markets (examples include corporate and municipal bonds, which trade infrequently); |
| c) | Pricing models whose inputs are observable for substantially the full term of the asset or liability (examples include most over-the-counter derivatives, including foreign exchange forward contracts); and |
| d) | Pricing models whose inputs are derived principally from or corroborated by observable market data through correlation or other means for substantially the full term of the asset or liability. |
80
Table of Contents
SOLAR CAPITAL LTD.
NOTES TO CONSOLIDATED FINANCIAL STATEMENTS
December 31, 2011
(in thousands, except shares)
Level 3. Financial assets and liabilities whose values are based on prices or valuation techniques that require inputs that are both unobservable and significant to the overall fair value measurement. These inputs reflect management’s own assumptions about the assumptions a market participant would use in pricing the asset or liability (examples include certain of our private debt and equity investments) and long-dated or complex derivatives (including certain equity and currency derivatives).
When the inputs used to measure fair value fall within different levels of the hierarchy, the level within which the fair value measurement is categorized is based on the lowest level input that is significant to the fair value measurement in its entirety. For example, a Level 3 fair value measurement may include inputs that are observable (Levels 1 and 2) and unobservable (Level 3). Therefore gains and losses for such assets and liabilities categorized within the Level 3 table below may include changes in fair value that are attributable to both observable inputs (Levels 1 and 2) and unobservable inputs (Level 3). Further, it should be noted that the following tables do not take into consideration the effect of offsetting Levels 1 and 2 financial instruments entered into by the Company that economically hedge certain exposures to the Level 3 positions.
A review of fair value hierarchy classifications is conducted on a quarterly basis. Changes in the observability of valuation inputs may result in a reclassification for certain financial assets or liabilities. Reclassifications impacting Level 3 of the fair value hierarchy are reported as transfers in/out of the Level 3 category as of the beginning of the quarter in which the reclassifications occur.
The following table presents the balances of assets and liabilities measured at fair value on a recurring basis, as of December 31, 2011 and 2010:
Fair Value Measurements
As of December 31, 2011
| Level 1 | Level 2 | Level 3 | Total | |||||||||||||
| Assets: |
||||||||||||||||
| Bank Debt/Senior Secured Loans |
$ | — | $ | 46,377 | $ | 366,019 | $ | 412,396 | ||||||||
| Subordinated Debt / Corporate Notes |
— | 10,508 | 536,351 | 546,859 | ||||||||||||
| Preferred Equity |
— | — | 14,664 | 14,664 | ||||||||||||
| Common Equity / Partnership Interests / Warrants |
11,460 | — | 59,664 | 71,124 | ||||||||||||
| Derivative assets - interest rate cap |
— | 469 | — | 469 | ||||||||||||
| Derivative assets - forward contracts |
— | 180 | — | 180 | ||||||||||||
Fair Value Measurements
As of December 31, 2010
| Level 1 | Level 2 | Level 3 | Total | |||||||||||||
| Assets: |
||||||||||||||||
| Bank Debt/Senior Secured Loans |
$ | — | $ | 46,609 | $ | 200,532 | $ | 247,141 | ||||||||
| Subordinated Debt / Corporate Notes |
— | 83,476 | 566,308 | 649,784 | ||||||||||||
| Preferred Equity |
— | — | 3,934 | 3,934 | ||||||||||||
| Common Equity / Partnership Interests |
373 | 21,897 | 53,092 | 75,362 | ||||||||||||
| Derivative assets—forward contracts |
— | 604 | — | 604 | ||||||||||||
| Liabilities: |
||||||||||||||||
| Derivative liabilities—forward contracts |
— | 1,539 | — | 1,539 | ||||||||||||
81
Table of Contents
SOLAR CAPITAL LTD.
NOTES TO CONSOLIDATED FINANCIAL STATEMENTS
December 31, 2011
(in thousands, except shares)
The following table provides a summary of the changes in fair value of Level 3 assets and liabilities for the years ended December 31, 2011 and 2010, as well as the portion of gains or losses included in income attributable to unrealized gains or losses related to those assets and liabilities still held at December 31, 2011 and 2010:
The Company had no assets or liabilities measured at fair value on a nonrecurring basis during the year.
Fair Value Measurements Using Level 3 Inputs
As of December 31, 2011
| Bank Debt/ Senior Secured Loans |
Subordinated Debt/ Corporate Notes |
Preferred Equity | Common Equity/ Partnership Interests/ Warrants |
|||||||||||||
| Fair value, January 1, 2011 |
$ | 200,532 | $ | 566,308 | $ | 3,934 | $ | 53,092 | ||||||||
| Total gains or losses included in earnings: |
||||||||||||||||
| Net realized gain (loss) |
(87 | ) | 6,218 | — | (4,500 | ) | ||||||||||
| Net change in unrealized gain (loss) |
(13,392 | ) | (6,991 | ) | (448 | ) | 6,931 | |||||||||
| Purchase of investment securities |
247,421 | 115,852 | 11,178 | 7,942 | ||||||||||||
| Proceeds from dispositions of investment securities |
(68,455 | ) | (103,971 | ) | — | (3,801 | ) | |||||||||
| Transfers in/out of Level 3 |
— | (41,065 | ) | — | — | |||||||||||
|
|
|
|
|
|
|
|
|
|||||||||
| Fair value, December 31, 2011 |
$ | 366,019 | $ | 536,351 | $ | 14,664 | $ | 59,664 | ||||||||
|
|
|
|
|
|
|
|
|
|||||||||
| Unrealized gains (losses) for the period relating to those Level 3 assets that were still held by the Company at the end of the period: |
||||||||||||||||
| Net change in unrealized gain (loss): |
$ | (15,535 | ) | $ | (17,844 | ) | $ | (448 | ) | $ | 4,988 | |||||
During 2011, one investment with a fair value of $41,065 was transferred from Level 3 to Level 2 as a result of an increase in the availability and reliability of third party market quotes for this investment. During 2011, one asset with a fair value of $9,900 was transferred from Level 2 to Level 1 when trading restrictions expired on a publicly traded equity investment.
Fair Value Measurements Using Level 3 Inputs
As of December 31, 2010
| Bank Debt/Senior Secured Loans |
Subordinated Debt/ Corporate Notes |
Preferred Equity | Common Equity/ Partnership Interests/Warrants |
|||||||||||||
| Fair value, January 1, 2010 |
$ | 163,499 | $ | 576,031 | $ | 40 | $ | 55,121 | ||||||||
| Total gains or losses included in earnings: |
||||||||||||||||
| Net realized gain (loss) |
463 | (54,012 | ) | — | 15,316 | |||||||||||
| Net change in unrealized gain (loss) |
3,704 | 86,974 | 4 | (4,006 | ) | |||||||||||
| Purchases, sales, issuances, and settlements (net) |
84,566 | 315 | 3,890 | (11,642 | ) | |||||||||||
| Transfers out of Level 3 |
(51,700 | ) | (43,000 | ) | — | (1,697 | ) | |||||||||
|
|
|
|
|
|
|
|
|
|||||||||
| Fair value, December 31, 2010 |
$ | 200,532 | $ | 566,308 | $ | 3,934 | $ | 53,092 | ||||||||
|
|
|
|
|
|
|
|
|
|||||||||
| Unrealized gains (losses) for the period relating to those Level 3 assets that were still held by the Company at the end of the period: |
||||||||||||||||
| Net change in unrealized gain: |
$ | 5,522 | $ | 18,999 | $ | 4 | $ | 9,161 | ||||||||
82
Table of Contents
SOLAR CAPITAL LTD.
NOTES TO CONSOLIDATED FINANCIAL STATEMENTS
December 31, 2011
(in thousands, except shares)
During 2010, two debt investments with fair values of $51,700 and $43,000 were transferred from Level 3 to Level 2 as a result of increases in the availability and reliability of third party market quotes for these investments. In addition, one equity investment with a fair value of $1,697 was transferred from Level 3 to Level 2 as a result of the company’s initial public offering. During 2010, one asset with a fair value of $400 was transferred from Level 2 to Level 1 when trading restrictions expired on a publicly traded equity investment.
Note 9. Stockholders’ Equity
The table below illustrates the effect of certain transactions on our capital accounts for the years ended December 31, 2011 and 2010:
| Common Stock | Partners’ Capital |
Paid in Capital in Excess of Par |
Under
(Over) Distributed Net Investment Income |
Accumulated Net Realized Gain/(Loss) |
Net Unrealized Depreciation |
Total Stockholders Equity |
||||||||||||||||||||||||||
| Shares | Par Amount | |||||||||||||||||||||||||||||||
| Balance at December 31, 2009 |
— | $ | — | $ | 697,903 | $ | — | $ | — | $ | — | $ | — | $ | 697,903 | |||||||||||||||||
| Solar Capital Merger (1) |
26,647,312 | 266 | (697,903 | ) | 772,553 | — | — | (199,916 | ) | (125,000 | ) | |||||||||||||||||||||
| Issuances of common stock in IPO(2) |
6,280,945 | 63 | — | 106,088 | — | — | — | 106,151 | ||||||||||||||||||||||||
| Issuances of common stock in private placement(3) |
2,965,000 | 30 | 67,836 | 67,866 | ||||||||||||||||||||||||||||
| Reinvestment of dividends |
489,901 | 5 | — | 10,841 | — | — | — | 10,846 | ||||||||||||||||||||||||
| Net increase in stockholders’ equity resulting from operations |
— | — | — | — | 69,212 | (38,968 | ) | 111,641 | 141,885 | |||||||||||||||||||||||
| Dividends declared ($2.14 per share) |
— | — | — | — | (65,457 | ) | (7,200 | ) | — | (72,657 | ) | |||||||||||||||||||||
| Permanent tax differences |
— | — | — | (30,327 | ) | (5,300 | ) | 35,627 | — | — | ||||||||||||||||||||||
|
|
|
|
|
|
|
|
|
|
|
|
|
|
|
|
|
|||||||||||||||||
| Balance at December 31, 2010 |
36,383,158 | $ | 364 | $ | — | $ | 926,991 | $ | (1,545 | ) | $ | (10,541 | ) | $ | (88,275 | ) | $ | 826,994 | ||||||||||||||
| Reinvestment of dividends |
224,880 | 2 | — | 5,162 | — | — | — | 5,164 | ||||||||||||||||||||||||
| Net increase in stockholders’ equity resulting from operations |
— | — | — | — | 81,904 | (2,393 | ) | (18,196 | ) | 61,315 | ||||||||||||||||||||||
| Dividends declared ($2.40 per share) |
— | — | — | — | (73,532 | ) | (14,000 | ) | — | (87,532 | ) | |||||||||||||||||||||
| Permanent tax differences |
— | — | — | (3,973 | ) | (4,582 | ) | 8,555 | — | — | ||||||||||||||||||||||
|
|
|
|
|
|
|
|
|
|
|
|
|
|
|
|
|
|||||||||||||||||
| Balance at December 31, 2011 |
36,608,038 | $ | 366 | $ | — | $ | 928,180 | $ | 2,245 | $ | (18,379 | ) | $ | (106,471 | ) | $ | 805,941 | |||||||||||||||
|
|
|
|
|
|
|
|
|
|
|
|
|
|
|
|
|
|||||||||||||||||
| (1) | Immediately prior to the initial public offering, through a series of transactions Solar Capital Ltd. merged with Solar Capital LLC, leaving Solar Capital Ltd. as the surviving entity. Solar Capital Ltd. issued an aggregate of approximately 26.65 million shares of common stock and $125 million in Senior Unsecured Notes to the existing Solar Capital LLC unit holders in connection with the Merger. |
| (2) | On February 9, 2010 Solar Capital Ltd. priced its initial public offering, selling 5.68 million shares, including the underwriters’ over-allotment, at a price of $18.50 per share. Concurrent with this offering, management purchased an additional 600,000 shares through a private placement, also at $18.50 per share. |
| (3) | On November 30, 2010 Solar Capital Ltd. priced a private offering, selling 2.85 million shares, at a price of $22.94 per share. Concurrent with this offering, management purchased an additional 115,000 shares, also at $22.94 per share. |
83
Table of Contents
SOLAR CAPITAL LTD.
NOTES TO CONSOLIDATED FINANCIAL STATEMENTS
December 31, 2011
(in thousands, except shares)
Note 10. Earnings Per Share
The following information sets forth the computation of basic and diluted net increase (decrease) in shareholders’ equity per share resulting from operations for the years ended December 31, 2011, 2010 and 2009:
| Year ended December 31, 2011 |
Year ended December 31, 2010 |
Year ended December 31, 2009 |
||||||||||
| Numerator for basic and diluted earnings per share: |
$ | 61,315 | $ | 141,885 | $ | 86,936 | ||||||
| Denominator for basic and diluted weighted average share: |
36,470,384 | 33,258,402 | 32,860,454 | |||||||||
| Basic and diluted net increase in share holders’ equity resulting from operations per share: |
$ | 1.68 | $ | 4.27 | $ | 2.65 | ||||||
As required by ASC 260-10, Earnings Per Share, the number of shares used to calculate weighted average shares for use in computations on a per share basis have been decreased retroactively by a factor of approximately 0.4022 for all periods prior to February 9, 2010. This factor represents the effective impact of the reduction in shares resulting from the Merger.
Note 11. Income Tax Information and Distributions to Stockholders
The tax character of dividends for the fiscal years ended December 31, 2011 and 2010 were as follows:
| 2011 | 2010 | |||||||||||||||
| Ordinary income |
$ | 73,532 | 84.0 | % | $ | 65,457 | 90.1 | % | ||||||||
| Capital gains |
14,000 | 16.0 | % | 7,200 | 9.9 | % | ||||||||||
|
|
|
|
|
|
|
|
|
|||||||||
| Total dividends |
$ | 87,532 | 100.0 | % | $ | 72,657 | 100.0 | % | ||||||||
For the years ended December 31, 2011 and 2010, the reconciliation of net increase in net assets resulting from operations to taxable income is as follows:
| 2011 | 2010 | |||||||
| Net increase in net assets resulting from operations |
$ | 61,315 | $ | 141,885 | ||||
| Net unrealized (gain)/loss on investments |
17,654 | (113,508 | ) | |||||
| Pre IPO earnings adjustment |
— | 15,164 | ||||||
| Consolidated subsidiaries adjustment |
(2,021 | ) | 9,994 | |||||
| Post-October capital (gains)/losses |
(3,232 | ) | 3,006 | |||||
| Market discount and OID adjustments |
23,844 | — | ||||||
| Other book-to-tax differences |
7,840 | 20,821 | ||||||
|
|
|
|
|
|||||
| Taxable income before deductions for dividends |
$ | 105,400 | $ | 77,362 | ||||
|
|
|
|
|
|||||
During 2011, as a result of permanent book-to-tax differences, the Company decreased under (over) distributed net investment income by $4,582, decreased accumulated net realized loss by $8,555, and decreased paid-in capital in excess of par value by $3,973. Aggregate stockholders’ equity was not affected by this reclassification.
84
Table of Contents
SOLAR CAPITAL LTD.
NOTES TO CONSOLIDATED FINANCIAL STATEMENTS
December 31, 2011
(in thousands, except shares)
As of December 31, 2011 and 2010, the components of accumulated gain and losses on a tax basis were as follows:
| 2011 | 2010 | |||||||
| Undistributed ordinary income |
$ | 21,586 | $ | 1,917 | ||||
| Undistributed long-term net capital gains |
— | 2,788 | ||||||
|
|
|
|
|
|||||
| Total undistributed net earnings |
21,586 | 4,705 | ||||||
| Post-October capital gains/(losses) |
— | (3,006 | ) | |||||
| Net unrealized appreciation on investments |
(133,468 | ) | 32,795 | |||||
|
|
|
|
|
|||||
| Total undistributed (undistributable) taxable income |
$ | (111,882 | ) | $ | 34,494 | |||
|
|
|
|
|
|||||
Tax information for the fiscal year ended December 31, 2011 is an estimate and will not be finally determined until the Company files its 2011 tax return in September 2012.
We did not have any uncertain tax positions that met the recognition or measurement criteria of ASC 740-10-25, Income Taxes, nor did we have any unrecognized tax benefits as of the periods presented herein. Although we file federal and state tax returns, our major tax jurisdiction is federal. Our inception-to-date federal tax years remain subject to examination by the Internal Revenue Service.
There were no deferred tax assets or liabilities as of December 31, 2011 or 2010.
Pre-Merger Taxation
Prior to the February 9, 2010, the Company was classified as a partnership for U.S. tax purposes, and therefore was generally not subject to federal and state income taxes. Each partner took into account separately on their tax return their share of the taxable income, gains, losses, deductions or credits for the partnership’s taxable year. Accordingly, no provisions were made in the accompanying financial statements for federal and state income tax. The Company was also subject to New York City unincorporated business tax (UBT), which is imposed on the business income of every unincorporated business that is carried on in New York City. The UBT is imposed for each taxable year at a rate of approximately 4 percent of taxable income that is allocable to New York City.
85
Table of Contents
SOLAR CAPITAL LTD.
NOTES TO CONSOLIDATED FINANCIAL STATEMENTS
December 31, 2011
(in thousands, except shares)
Note 12. Financial Highlights
The following is a schedule of financial highlights for the respective periods:
| Year ended December 31, 2011 |
Year ended December 31, 2010 |
Year ended December 31, 2009 |
Year ended December 31, 2008 |
March 13, 2007 (inception) through December 31, 2007 |
||||||||||||||||
| Per Share Data: (a) |
||||||||||||||||||||
| Net asset value, beginning of year |
$ | 22.73 | $ | 21.24 | $ | 25.95 | $ | 38.30 | $ | 37.30 | ||||||||||
| Net investment income |
2.25 | 2.08 | 2.05 | 2.66 | 1.62 | |||||||||||||||
| Net realized and unrealized gain (loss) |
(0.57 | ) | 2.19 | 0.60 | (15.01 | ) | (0.12 | ) | ||||||||||||
|
|
|
|
|
|
|
|
|
|
|
|||||||||||
| Net increase in net assets resulting from operations |
1.68 | 4.27 | 2.65 | (12.35 | ) | 1.50 | ||||||||||||||
| Dividends to shareholders declared |
(2.40 | ) | (2.14 | ) | — | — | — | |||||||||||||
| Distributions to unit holders declared |
— | — | (7.36 | ) | — | — | ||||||||||||||
| Effect of dilution |
0.01 | (0.33 | ) | — | — | — | ||||||||||||||
| Offering costs |
— | (0.31 | ) | — | — | (0.50 | ) | |||||||||||||
|
|
|
|
|
|
|
|
|
|
|
|||||||||||
| Net asset value, end of period |
$ | 22.02 | $ | 22.73 | $ | 21.24 | $ | 25.95 | $ | 38.30 | ||||||||||
|
|
|
|
|
|
|
|
|
|
|
|||||||||||
| Total return(b) |
(1.07 | )% | 45.51 | % | 10.16 | % | (32.25 | )% | 4.00 | % | ||||||||||
| Net assets, end of period |
$ | 805,941 | $ | 826,994 | $ | 697,903 | $ | 852,673 | $ | 1,258,501 | ||||||||||
| Per share market value at end of period |
$ | 22.09 | $ | 24.78 | N/A | N/A | N/A | |||||||||||||
| Shares outstanding end of period |
36,608,038 | 36,383,158 | 32,860,454 | 32,860,454 | 32,860,454 | |||||||||||||||
| Ratio to average net assets: |
||||||||||||||||||||
| Expenses without incentive fees |
4.45 | % | 5.13 | % | 3.35 | % | 3.27 | % | 2.55 | % | ||||||||||
| Incentive fees |
2.49 | % | 2.33 | % | 2.20 | % | 0.78 | % | — | % | ||||||||||
|
|
|
|
|
|
|
|
|
|
|
|||||||||||
| Total expenses |
6.94 | % | 7.46 | % | 5.55 | % | 4.05 | % | 2.55 | % | ||||||||||
|
|
|
|
|
|
|
|
|
|
|
|||||||||||
| Net investment income |
9.97 | % | 9.31 | % | 8.85 | % | 7.59 | % | 5.36 | % | ||||||||||
| Portfolio turnover ratio |
34.54 | % | 38.90 | % | 19.36 | % | 11.55 | % | 20.67 | % | ||||||||||
| (a) | Calculated using the average shares outstanding method. The number of shares used to calculate weighted average shares have been decreased retroactively by a factor of approximately 0.4022 for all periods prior to February 9, 2010. This factor represents the effective impact of the reduction in shares resulting from the Merger. |
| (b) | Total return for 2011 is based on the change in market price per share during the period and takes into account dividends reinvested with the dividend reinvestment plan. For 2010, the public offering price is used as the beginning market price and does not assume dividend reinvestment. Total return for 2009, 2008 and 2007 is equal to the net increase in net assets resulting from operations divided by the net asset value at beginning of year. |
86
Table of Contents
SOLAR CAPITAL LTD.
NOTES TO CONSOLIDATED FINANCIAL STATEMENTS
December 31, 2011
(in thousands, except shares)
Note 13. New Accounting Pronouncements and Accounting Standards Updates
In May 2011, the Financial Accounting Standards Board issued Accounting Standards Update (“ASU”) 2011-04, Fair Value Measurement (Topic 820): Amendments to Achieve Common Fair Value Measurement and Disclosure Requirements in U.S. GAAP and IFRSs (“ASU 2011-04”). ASU 2011-04 was issued concurrently with International Financial Reporting Standards No. 13 (“IFRS 13”), Fair Value Measurements, to provide largely identical guidance about fair value measurement and disclosure requirements as is currently required under ASU 2010-06, Fair Value Measurements and Disclosures (Topic 820). The new standards do not extend the use of fair value but, rather, provide guidance about how fair value should be applied where it already is required or permitted under IFRS or GAAP. For GAAP, most of the changes are clarifications of existing guidance or wording changes to align with IFRS 13. ASU 2011-04 eliminates the concepts of in-use and in-exchange when measuring fair value of all financial instruments. For Level 3 fair value measurements, the ASU requires that our disclosure include quantitative information about significant unobservable inputs, a qualitative discussion about the sensitivity of the fair value measurement to changes in the unobservable inputs and the interrelationship between inputs, and a description of our valuation process. Public companies are required to apply ASU 2011-04 prospectively for interim and annual periods beginning after December 15, 2011. Upon adoption of ASU 2011-04, it is not expected that it will have a significant impact on the Company’s financial statements and the Company is currently evaluating the impact on its disclosures.
Note 14. Selected Quarterly Financial Data (unaudited)
| For the Quarter Ended |
Investment Income |
Net Investment Income |
Net Realized And Unrealized Gain (Loss) on Assets |
Increase (Decrease) In Net Assets From Operations |
||||||||||||||||||||||||||||
| Total | Per Share |
Total | Per Share |
Total | Per Share |
Total | Per Share |
|||||||||||||||||||||||||
| December 31, 2011 |
$ | 35,994 | 0.98 | $ | 20,675 | 0.57 | $ | 31,182 | 0.85 | $ | 51,857 | 1.42 | ||||||||||||||||||||
| September 30, 2011 |
35,329 | 0.97 | 20,711 | 0.57 | (72,655 | ) | (1.99 | ) | (51,944 | ) | (1.42 | ) | ||||||||||||||||||||
| June 30, 2011 |
35,283 | 0.97 | 21,368 | 0.59 | (8,984 | ) | (0.25 | ) | 12,384 | 0.34 | ||||||||||||||||||||||
| March 31, 2011 |
32,294 | 0.89 | 19,150 | 0.53 | 29,868 | 0.82 | 49,018 | 1.35 | ||||||||||||||||||||||||
| December 31, 2010 |
31,644 | 0.92 | 17,384 | 0.51 | 24,974 | 0.73 | 42,358 | 1.24 | ||||||||||||||||||||||||
| September 30, 2010 |
29,403 | 0.89 | 15,551 | 0.47 | 5,458 | 0.16 | 21,009 | 0.63 | ||||||||||||||||||||||||
| June 30, 2010 |
28,284 | 0.86 | 15,166 | 0.46 | 1,348 | 0.04 | 16,514 | 0.50 | ||||||||||||||||||||||||
| March 31, 2010 |
35,310 | 1.08 | 21,111 | 0.65 | 40,893 | 1.26 | 62,004 | 1.90 | ||||||||||||||||||||||||
| December 31, 2009 |
28,456 | 0.87 | 17,685 | 0.54 | 22,271 | 0.68 | 39,956 | 1.23 | ||||||||||||||||||||||||
| September 30, 2009 |
27,785 | 0.85 | 16,383 | 0.50 | 22,181 | 0.68 | 38,564 | 1.17 | ||||||||||||||||||||||||
| June 30, 2009 |
25,252 | 0.77 | 16,099 | 0.49 | 17,899 | 0.54 | 33,998 | 1.03 | ||||||||||||||||||||||||
| March 31, 2009 |
28,177 | 0.86 | 17,095 | 0.52 | (42,677 | ) | (1.30 | ) | (25,582 | ) | (0.78 | ) | ||||||||||||||||||||
See notes to consolidated financial statements.
87
Table of Contents
SCHEDULE OF INVESTMENTS IN AND ADVANCES TO AFFILIATES
(unaudited)
(in thousands, except shares)
Schedule 12-14
| Portfolio Company |
Investment |
As of December 31, 2011 Number of Shares/Principal Amount |
Year ended December 31, 2011 |
As
of December 31, 2011 Fair Value |
||||||||||||||
| Amount of dividends and interest included in income |
Amount of equity in net profit and loss |
|||||||||||||||||
| Investments Owned Greater than 25% |
||||||||||||||||||
| AviatorCap SII, LLC I |
Senior Debt | 3,728 | $ | 288 | $ | — | $ | 3,671 | ||||||||||
| AviatorCap SII, LLC II |
Senior Debt | 5,697 | 243 | — | 5,611 | |||||||||||||
| AviatorCap SII, LLC III |
Senior Debt | 8,856 | 628 | — | 8,724 | |||||||||||||
| USAW 767 |
Senior Debt | 4,904 | 920 | — | 4,831 | |||||||||||||
| SODO Corp. |
Preferred Equity/Common | 1,912 | 96 | — | 1,949 | |||||||||||||
| SOCAY Corp. |
Preferred Equity/Common | 12,357 | 686 | — | 12,668 | |||||||||||||
| National Specialty Alloys, LLC |
Equity | 1,000,000 | 4,102 | — | 16,000 | |||||||||||||
|
|
|
|
|
|
|
|||||||||||||
| Total Investments Owned Greater than 25% |
$ | 6,963 | $ | — | $ | 53,454 | ||||||||||||
|
|
|
|
|
|
|
|||||||||||||
| Investments Owned Greater than 5% and Less than 25% |
||||||||||||||||||
| Ark Real Estate Partners LP |
Equity | 41,818,834 | — | — | 35,820 | |||||||||||||
|
|
|
|
|
|
|
|||||||||||||
| Total Investments Owned Greater than 5% and Less than 25% |
$ | — | $ | — | $ | 35,820 | ||||||||||||
|
|
|
|
|
|
|
|||||||||||||
88
Table of Contents
The table below represents the balance at the beginning of the year, December 31, 2010 and any gross additions and reductions and net unrealized gain (loss) made to such investments as well as the ending fair value as of December 31, 2011.
Gross additions represent increases in the investment from additional investments, amortization and payments in kind of interest or dividends.
Gross reductions represent decreases in the investment from sales of investments or repayments.
| Beginning Fair Value December 31, 2010 |
Gross additions |
Gross reductions |
Change in Unrealized Gain (Loss) |
Fair Value as of December 31, 2011 |
||||||||||||||||
| AviatorCap SII, LLC I |
$ | — | $ | 4,047 | $ | 369 | (7 | ) | $ | 3,671 | ||||||||||
| AviatorCap SII, LLC II |
— | 6,094 | 476 | (7 | ) | 5,611 | ||||||||||||||
| AviatorCap SII, LLC III |
— | 10,062 | 1,366 | 28 | 8,724 | |||||||||||||||
| USAW 767 |
6,618 | 76 | 1,848 | (15 | ) | 4,831 | ||||||||||||||
| SODO Corp. |
390 | 1,619 | — | (60 | ) | 1,949 | ||||||||||||||
| SOCAY Corp. |
3,500 | 9,559 | — | (391 | ) | 12,668 | ||||||||||||||
| National Specialty Alloys, LLC |
10,000 | — | — | 6,000 | 16,000 | |||||||||||||||
| Ark Real Estate Partners LP |
29,235 | 7,066 | 53 | (428 | ) | 35,820 | ||||||||||||||
89
Table of Contents
SOLAR CAPITAL LTD.
SCHEDULE OF INVESTMENTS IN AND ADVANCES TO AFFILIATES
(unaudited)
(in thousands, except units)
Schedule 12-14
| Year ended December 31, 2010 | ||||||||||||||||||
| Portfolio Company |
Investment |
As of December 31, 2010 Number of Shares/Principal Amount |
Amount of dividends and interest included in income |
Amount of equity in net profit and loss |
As
of December 31, 2010 Fair Value |
|||||||||||||
| Investments Owned Greater than 25% |
||||||||||||||||||
| USAW 767 |
Senior Debt | 6,753 | $ | 52 | $ | $ | 6,618 | |||||||||||
| SODO Corp. |
Preferred Equity/Common | 388 | 2 | 390 | ||||||||||||||
| SOCAY Corp. |
Preferred Equity/Common | 3,484 | 16 | 3,500 | ||||||||||||||
| National Specialty Alloys, LLC |
Equity | 1,000,000 | 600 | — | 10,000 | |||||||||||||
|
|
|
|
|
|
|
|||||||||||||
| Total Investments Owned Greater than 25% |
$ | 670 | $ | — | $ | 20,508 | ||||||||||||
|
|
|
|
|
|
|
|||||||||||||
| Investments Owned Greater than 5% and Less than 25% |
||||||||||||||||||
| National Interest Security Corp. |
Senior Debt | — | $ | 3,544 | $ | — | $ | — | ||||||||||
| National Interest Security Corp. |
Subordinated | — | 4,075 | — | — | |||||||||||||
| Ark Real Estate Partners LP |
Equity | 34,806,121 | — | — | 29,235 | |||||||||||||
|
|
|
|
|
|
|
|||||||||||||
| Total Investments Owned Greater than 5% and Less than 25% |
$ | 7,619 | $ | — | $ | 29,235 | ||||||||||||
|
|
|
|
|
|
|
|||||||||||||
90
Table of Contents
The table below represents the balance at the beginning of the year, December 31, 2009 and any gross additions and reductions and net unrealized gain (loss) made to such investments as well as the ending fair value as of December 31, 2010.
Gross additions represent increases in the investment from additional investments, payments in kind of interest or dividends.
Gross reductions represent decreases in the investment from sales of investments or repayments.
| Beginning Fair Value December 31, 2009 |
Gross additions |
Gross reductions |
Change in Unrealized Gain (Loss) |
Fair Value as of December 31, 2010 |
||||||||||||||||
| USAW 767 |
$ | — | $ | 7,297 | $ | 676 | $ | (3 | ) | $ | 6,618 | |||||||||
| SODO Corp. |
— | 390 | — | — | 390 | |||||||||||||||
| SOCAY Corp. |
— | 3,500 | — | — | 3,500 | |||||||||||||||
| National Specialty Alloys, LLC |
9,000 | — | — | 1,000 | 10,000 | |||||||||||||||
| National Interest Security Corp. |
26,152 | — | 24,740 | (1,412 | ) | — | ||||||||||||||
| National Interest Security Corp. |
31,303 | — | 30,230 | (1,073 | ) | — | ||||||||||||||
| National Interest Security Corp. |
16,293 | — | 2,126 | (14,167 | ) | — | ||||||||||||||
| Ark Real Estate Partners LP |
19,675 | 6,800 | — | 2,760 | 29,235 | |||||||||||||||
Federal Income Tax Information (unaudited)
The Company designates the maximum amount available but not less than $600 of the Company’s ordinary income dividends paid from 2011 earnings as qualified dividend income in accordance with section 854 of the Internal Revenue Code. The Company designates the maximum amount available but not less than $7,200 of the Company’s dividends paid from 2011 net realized securities gains as capital gain dividends in accordance with section 852(b)(3)(C) of the Internal Revenue Code.
91
Table of Contents
| Item 9. | Changes in and Disagreements with Accountants on Accounting and Financial Disclosure |
None
| Item 9A. | Controls and Procedures |
(a) Evaluation of Disclosure Controls and Procedures
As of December 31, 2011 (the end of the period covered by this report), we, including our Chief Executive Officer and Chief Financial Officer, evaluated the effectiveness of the design and operation of our disclosure controls and procedures (as defined in Rule 13a-15(e) of the 1934 Act). Based on that evaluation, our management, including the Chief Executive Officer and Chief Financial Officer, concluded that our disclosure controls and procedures were effective and provided reasonable assurance that information required to be disclosed in our periodic SEC filings is recorded, processed, summarized and reported within the time periods specified in the SEC ‘s rules and forms, and that such information is accumulated and communicated to our management, including our Chief Executive Officer and Chief Financial Officer, as appropriate, to allow timely decisions regarding required disclosure. However, in evaluating the disclosure controls and procedures, management recognized that any controls and procedures, no matter how well designed and operated can provide only reasonable assurance of achieving the desired control objectives, and management necessarily was required to apply its judgment in evaluating the cost-benefit relationship of such possible controls and procedures.
(b) Management’s Report on Internal Control Over Financial Reporting
Management is responsible for establishing and maintaining adequate internal control over financial reporting, and for performing an assessment of the effectiveness of internal control over financial reporting as of December 31, 2011. Internal control over financial reporting is a process designed by, or under the supervision of, our principal executive and principal financial officers, or persons performing similar functions, and effected by our Board of Directors, management and other personnel, to provide reasonable assurance regarding the reliability of financial reporting and the preparation of financial statements for external purposes in accordance with generally accepted accounting principles. Our internal control over financial reporting includes those policies and procedures that (i) pertain to the maintenance of records that in reasonable detail accurately and fairly reflect the transactions and dispositions of assets of the company; (ii) provide reasonable assurance that transactions are recorded as necessary to permit preparation of financial statements in accordance with generally accepted accounting principles, and that receipts and expenditures are being made only in accordance with authorizations; and (iii) provide reasonable assurance regarding prevention or timely detection of unauthorized acquisition, use, or disposition of our assets that could have a material effect on the financial statements.
Because of its inherent limitations, internal control over financial reporting may not prevent or detect misstatements. Therefore, even those systems determined to be effective can provide only reasonable assurance with respect to financial statement preparation and presentation.
Management performed an assessment of the effectiveness of our internal control over financial reporting as of December 31, 2011 based upon the criteria set forth in Internal Control—Integrated Framework issued by the Committee of Sponsoring Organizations of the Treadway Commission (“COSO”). Based on our assessment, management determined that our internal control over financial reporting was effective as of December 31, 2011.
(c) Attestation Report of the Registered Public Accounting Firm
KPMG LLP, the Company’s independent registered public accounting firm, has issued an attestation report on the effectiveness of the Company’s internal control over financial reporting, which appears on p.58 of this Form 10-K.
92
Table of Contents
(d) Changes in Internal Control Over Financial Reporting
Management has not identified any change in the Company’s internal control over financial reporting that occurred during the fourth quarter of 2011 that has materially affected, or is reasonably likely to materially affect, the Company’s internal control over financial reporting.
| Item 9B. | Other Information |
None
93
Table of Contents
PART III
We will file a definitive Proxy Statement for our 2012 Annual Meeting of Stockholders with the SEC, pursuant to Regulation 14A, not later than 120 days after the end of our fiscal year. Accordingly, certain information required by Part III has been omitted under General Instruction G (3) to Form 10-K. Only those sections of our definitive Proxy Statement that specifically address the items set forth herein are incorporated by reference.
| Item 10. | Directors, Executive Officers and Corporate Governance |
The information required by Item 10 is hereby incorporated by reference from our definitive Proxy Statement relating to our 2012 Annual Meeting of Stockholders, to be filed with the Securities and Exchange Commission within 120 days following the end of our fiscal year.
| Item 11. | Executive Compensation |
The information required by Item 11 is hereby incorporated by reference from our definitive Proxy Statement relating to our 2012 Annual Meeting of Stockholders, to be filed with the Securities and Exchange Commission within 120 days following the end of our fiscal year.
| Item 12. | Security Ownership of Certain Beneficial Owners and Management and Related Stockholder Matters |
The information required by Item 12 is hereby incorporated by reference from our definitive Proxy Statement relating to our 2012 Annual Meeting of Stockholders, to be filed with the Securities and Exchange Commission within 120 days following the end of our fiscal year.
| Item 13. | Certain Relationships and Related Transactions, and Director Independence |
The information required by Item 13 is hereby incorporated by reference from our definitive Proxy Statement relating to our 2012 Annual Meeting of Stockholders, to be filed with the Securities and Exchange Commission within 120 days following the end of our fiscal year.
| Item 14. | Principal Accountant Fees and Services |
The information required by Item 14 is hereby incorporated by reference from our definitive Proxy Statement relating to our 2012 Annual Meeting of Stockholders, to be filed with the Securities and Exchange Commission within 120 days following the end of our fiscal year.
94
Table of Contents
PART IV
| Item 15. | Exhibits and Financial Statement Schedules |
a. Documents Filed as Part of this Report
The following financial statements are set forth in Item 8:
| Page | ||||
| Report of Independent Registered Public Accounting Firm |
57 | |||
| Report of Independent Registered Public Accounting Firm on Internal Control Over Financial |
58 | |||
| Consolidated Statements of Assets and Liabilities as of December 31, 2011 and 2010 |
59 | |||
| Consolidated Statements of Operations for the years ended December 31, 2011, 2010 and 2009 |
60 | |||
| Consolidated Statements of Changes in Net Assets for the years ended December 31, 2011, 2010 and 2009 |
61 | |||
| Consolidated Statements of Cash Flows for the years ended December 31, 2011, 2010 and 2009 |
62 | |||
| Consolidated Schedules of Investments as of December 31, 2011 and 2010 |
63 | |||
| Notes to Consolidated Financial Statements |
71 | |||
| Schedules of Investments in and Advances to Affiliates (unaudited) |
88 | |||
b. Exhibits
The following exhibits are filed as part of this report or hereby incorporated by reference to exhibits previously filed with the SEC:
| Exhibit Number |
Description | |
| 3.1 | Articles of Amendment and Restatement** | |
| 3.2 | Amended and Restated Bylaws** | |
| 4.1 | Form of Common Stock Certificate**** | |
| 10.1 | Dividend Reinvestment Plan** | |
| 10.2 | Form of Amended and Restated Senior Secured Revolving Credit Agreement by and between the Registrant, the Lenders and Citibank, N.A., as administrative agent**** | |
| 10.3 | Form of Senior Secured Term Loan Agreement by and between the Registrant and ING Capital LLC, as lender and administrative agent, dated as of September 2, 2010***** | |
| 10.4 | Form of Loan and Servicing Agreement by and among the Registrant, Solar Capital Funding II LLC, Wells Fargo Securities, LLC, as administrative agent, Wells Fargo Delaware Trust Company, as collateral agent and Wells Fargo Bank, N.A., as account bank and collateral custodian******* | |
| 10.5 | Investment Advisory and Management Agreement by and between Registrant and Solar Capital Partners, LLC* | |
| 10.6 | Form of Custodian Agreement**** | |
| 10.7 | Administration Agreement by and between Registrant and Solar Capital Management, LLC* | |
| 10.8 | Form of Indemnification Agreement by and between Registrant and each of its directors** | |
| 10.9 | Registration Rights Agreement by and between Registrant, Solar Cayman Limited, Solar Offshore Limited, Citigroup Global Markets Inc., J.P. Morgan Securities Inc. and purchasers in the initial private placement* | |
| 10.10 | First Amendment to the Registration Rights Agreement by and between Registrant, Solar Cayman Limited, Solar Offshore Limited, Citigroup Global Markets Inc., J.P. Morgan Securities Inc. and purchasers in the initial private placement** | |
95
Table of Contents
| Exhibit Number |
Description | |
| 10.11 | Registration Rights Agreement by and between Registrant, Magnetar Capital Fund, LP and Solar Offshore Limited* | |
| 10.12 | Trademark License Agreement by and between Registrant and Solar Capital Partners, LLC** | |
| 10.13 | Form of Share Purchase Agreement by and between Registrant and Solar Capital Investors II, LLC**** | |
| 10.14 | Form of Agreement and Plan of Merger by and between Registrant and Solar Capital LLC**** | |
| 10.15 | Form of Registration Rights Agreement****** | |
| 10.16 | Form of Subscription Agreement****** | |
| 10.17 | Form of Purchase and Sale Agreement by and between the Registrant and Solar Capital Funding II LLC******* | |
| 10.18 | Amendment No. 2 to the Loan and Servicing Agreement by and among Registrant, Solar Capital Funding II LLC, Wells Fargo Securities, LLC, as administrative agent, Wells Fargo Delaware Trust Company, as collateral agent, and Wells Fargo Bank, N.A., as account bank and collateral custodian******** | |
| 11 | Computation of Per Share Earnings (included in the notes to the audited financial statements contained in this report). | |
| 14.1 | Code of Ethics** | |
| 14.2 | Code of Business Conduct** | |
| 31.1 | Certification of Chief Executive Officer pursuant to Rule 13a-14 of the Securities Exchange Act of 1934, as amended. | |
| 31.2 | Certification of Chief Financial Officer pursuant to Rule 13a-14 of the Securities Exchange Act of 1934, as amended. | |
| 32.1 | Certification of Chief Executive Officer pursuant to Section 906 of The Sarbanes-Oxley Act of 2002. | |
| 32.2 | Certification of Chief Financial Officer pursuant to Section 906 of The Sarbanes-Oxley Act of 2002. | |
| * | Previously filed in connection with Solar Capital Ltd.’s registration statement on Form N-2 (File No. 333-148734) filed on January 18, 2008. | |
| ** | Previously filed in connection with Solar Capital Ltd.’s registration statement on Form N-2 Pre-Effective Amendment No. 7 (File No. 333-148734) filed on January 7, 2010. | |
| *** | Previously filed in connection with Solar Capital Ltd.’s registration statement on Form N-2 Pre-Effective Amendment No. 8 (File No. 333-148734) filed on January 27, 2010. | |
| **** | Previously filed in connection with Solar Capital Ltd.’s registration statement on Form N-2 (File No. 333-148734) filed on February 9, 2010. | |
| ***** | Previously filed in connection with Solar Capital Ltd.’s report on Form 8-K filed on September 7, 2010. | |
| ****** | Previously filed in connection with Solar Capital Ltd.’s report on Form 8-K filed on November 29, 2010. | |
| ******* | Previously filed in connection with Solar Capital Ltd.’s report on Form 8-K filed on December 22, 2010. | |
| ******** | Previously filed in connection with Solar Capital Ltd.’s report on Form 8-K filed on February 8, 2012. | |
c. Financial statement schedules
No financial statement schedules are filed herewith because (1) such schedules are not required or (2) the information has been presented in the aforementioned financial statements.
96
Table of Contents
Pursuant to the requirements of Section 13 or 15(d) of the Securities Act of 1934, the Registrant has duly caused this report to be signed on its behalf by the undersigned, thereunto duly authorized.
| SOLAR CAPITAL LTD. | ||
| By: | /S/ MICHAEL S. GROSS | |
| Michael S. Gross Chief Executive Officer, President, Chairman of the Board and Director | ||
Pursuant to the requirements of the Securities Exchange Act of 1934, this report has been signed below by the following persons on behalf of the registrant and in the capacity and on the dates indicated.
| Date |
Signature |
Title | ||
| February 22, 2012 |
/s/ MICHAEL S. GROSS Michael S. Gross |
Chief Executive Officer, President, Chairman of the Board and Director (Principal Executive Officer) | ||
| February 22, 2012 |
/S/ STEVEN HOCHBERG Steven Hochberg |
Director | ||
| February 22, 2012 |
/S/ DAVID S. WACHTER David S. Wachter |
Director | ||
| February 22, 2012 |
/S/ LEONARD A. POTTER Leonard A. Potter |
Director | ||
| February 22, 2012 |
/S/ BRUCE SPOHLER Bruce Spohler |
Chief Operating Officer and Director | ||
| February 22, 2012 |
/S/ NICHOLAS RADESCA Nicholas Radesca |
Chief Financial Officer (Principal Financial Officer) and Secretary | ||
97