Attached files
| file | filename |
|---|---|
| EX-99.1 - EX-99.1 - Johnson Controls International plc | d66495dex991.htm |
| 8-K - 8-K - Johnson Controls International plc | d66495d8k.htm |

Investor Update February 17, 2021 Exhibit 99.2
Forward Looking & Cautionary Statements / Non-GAAP Financial Information Johnson Controls International plc Cautionary Statement Regarding Forward-Looking Statements Johnson Controls International plc has made statements in this communication that are forward-looking and therefore are subject to risks and uncertainties. All statements in this document other than statements of historical fact are, or could be, “forward-looking statements” within the meaning of the Private Securities Litigation Reform Act of 1995. In this communication, statements regarding Johnson Controls’ future financial position, sales, costs, earnings, cash flows, other measures of results of operations, synergies and integration opportunities, capital expenditures and debt levels are forward-looking statements. Words such as “may,” “will,” “expect,” “intend,” “estimate,” “anticipate,” “believe,” “should,” “forecast,” “project” or “plan” and terms of similar meaning are also generally intended to identify forward-looking statements. However, the absence of these words does not mean that a statement is not forward-looking. Johnson Controls cautions that these statements are subject to numerous important risks, uncertainties, assumptions and other factors, some of which are beyond Johnson Controls’ control, that could cause Johnson Controls’ actual results to differ materially from those expressed or implied by such forward-looking statements, including, among others, risks related to: Johnson Controls’ ability to manage general economic, business, capital market and geopolitical conditions, including the impacts of natural disasters, pandemics and outbreaks of contagious diseases and other adverse public health developments, such as the COVID-19 pandemic; the strength of the U.S. or other economies; changes or uncertainty in laws, regulations, rates, policies or interpretations that impact Johnson Controls’ business operations or tax status; the ability to develop or acquire new products and technologies that achieve market acceptance; changes to laws or policies governing foreign trade, including increased tariffs or trade restrictions; maintaining the capacity, reliability and security of Johnson Controls’ enterprise and product information technology infrastructure; the risk of infringement or expiration of intellectual property rights; any delay or inability of Johnson Controls to realize the expected benefits and synergies of recent portfolio transactions such as its merger with Tyco and the disposition of the Power Solutions business; the outcome of litigation and governmental proceedings; the ability to hire and retain key senior management; the tax treatment of recent portfolio transactions; significant transaction costs and/or unknown liabilities associated with such transactions; the availability of raw materials and component products; fluctuations in currency exchange rates; work stoppages, union negotiations, labor disputes and other matters associated with the labor force; the cancellation of or changes to commercial arrangements. A detailed discussion of risks related to Johnson Controls' business is included in the section entitled "Risk Factors" in Johnson Controls' Annual Report on Form 10-K for the year ended September 30, 2020 filed with the United States Securities and Exchange Commission ("SEC") on November 16, 2020, which is available at www.sec.gov and www.johnsoncontrols.com under the "Investors" tab. Shareholders, potential investors and others should consider these factors in evaluating the forward-looking statements and should not place undue reliance on such statements. The forward-looking statements included in this communication are made only as of the date of this document, unless otherwise specified, and, except as required by law, Johnson Controls assumes no obligation, and disclaims any obligation, to update such statements to reflect events or circumstances occurring after the date of this communication. Non-GAAP Financial Information This presentation contains financial information regarding adjusted earnings per share, which is a non-GAAP performance measure. The adjusting items include restructuring and impairment costs, transaction costs, integration costs, net mark-to-market adjustments, Power Solutions divestiture reserve adjustment and discrete tax items. Financial information regarding organic sales, adjusted segment EBITA margin and free cash flow are also presented, which are non-GAAP performance measures. Adjusted segment EBITA excludes special items such as integration costs because these costs are not considered to be directly related to the underlying operating performance of its business units. Management believes that, when considered together with unadjusted amounts, these non-GAAP measures are useful to investors in understanding period-over-period operating results and business trends of the Company. Management may also use these metrics as guides in forecasting, budgeting and long-term planning processes and for compensation purposes. These metrics should be considered in addition to, and not as replacements for, the most comparable GAAP measure. Johnson Controls has presented forward-looking statements regarding adjusted EPS, organic revenue growth, adjusted EBITA margin and free cash flow conversion, which are non-GAAP financial measures. These non-GAAP financial measures are derived by excluding certain amounts, expenses, or income from the corresponding financial measures determined in accordance with GAAP. The determination of the amounts that are excluded from these non-GAAP financial measures are a matter of management judgment and depends upon, among other factors, the nature of the underlying expense or income amounts recognized in a given period, including but not limited to the high variability of the net mark-to-market adjustments and the effect of foreign currency exchange fluctuations. Our fiscal 2021 full year and second quarter guidance for organic revenue also excludes the effect of acquisitions, divestitures and foreign currency. We are unable to present a quantitative reconciliation of the aforementioned forward-looking non-GAAP financial measures to their most directly comparable forward-looking GAAP financial measures because such information is not available and management cannot reliably predict all of the necessary components of such GAAP measures without unreasonable effort or expense. The unavailable information could have a significant impact on the Company’s second quarter and full year 2021 GAAP financial results.
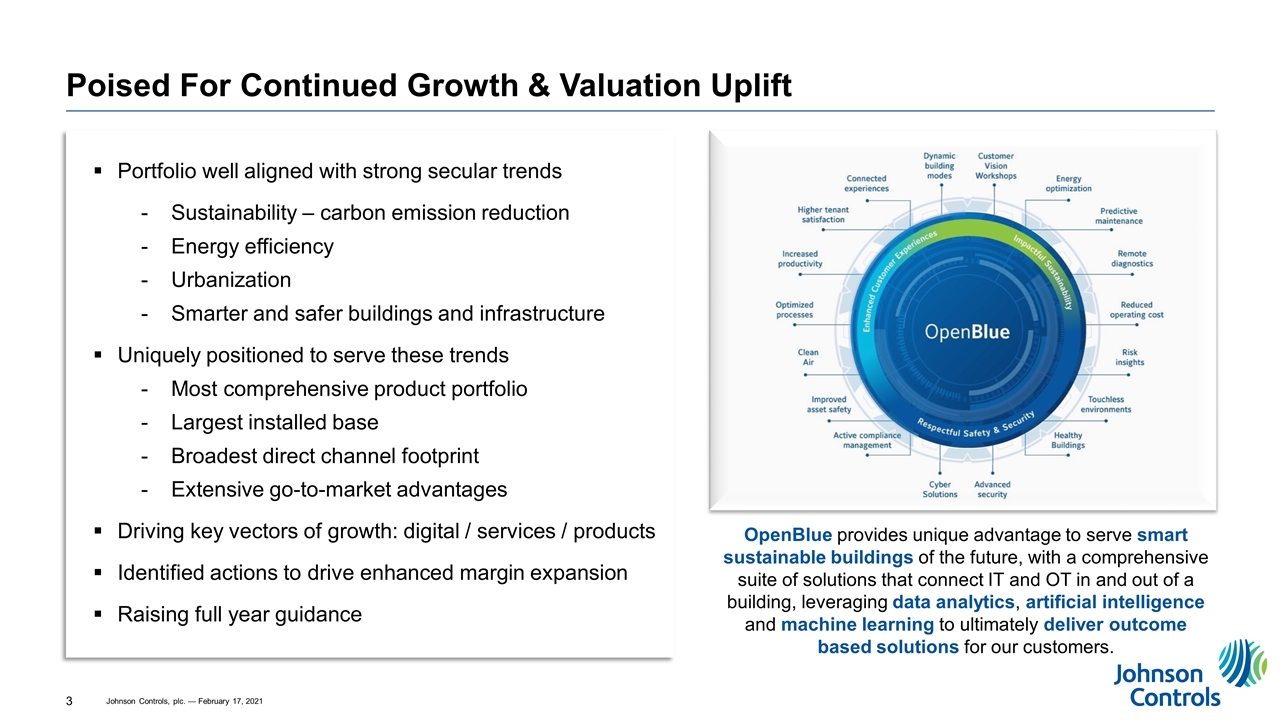
Poised For Continued Growth & Valuation Uplift Portfolio well aligned with strong secular trends Sustainability – carbon emission reduction Energy efficiency Urbanization Smarter and safer buildings and infrastructure Uniquely positioned to serve these trends Most comprehensive product portfolio Largest installed base Broadest direct channel footprint Extensive go-to-market advantages Driving key vectors of growth: digital / services / products Identified actions to drive enhanced margin expansion Raising full year guidance OpenBlue provides unique advantage to serve smart sustainable buildings of the future, with a comprehensive suite of solutions that connect IT and OT in and out of a building, leveraging data analytics, artificial intelligence and machine learning to ultimately deliver outcome based solutions for our customers.
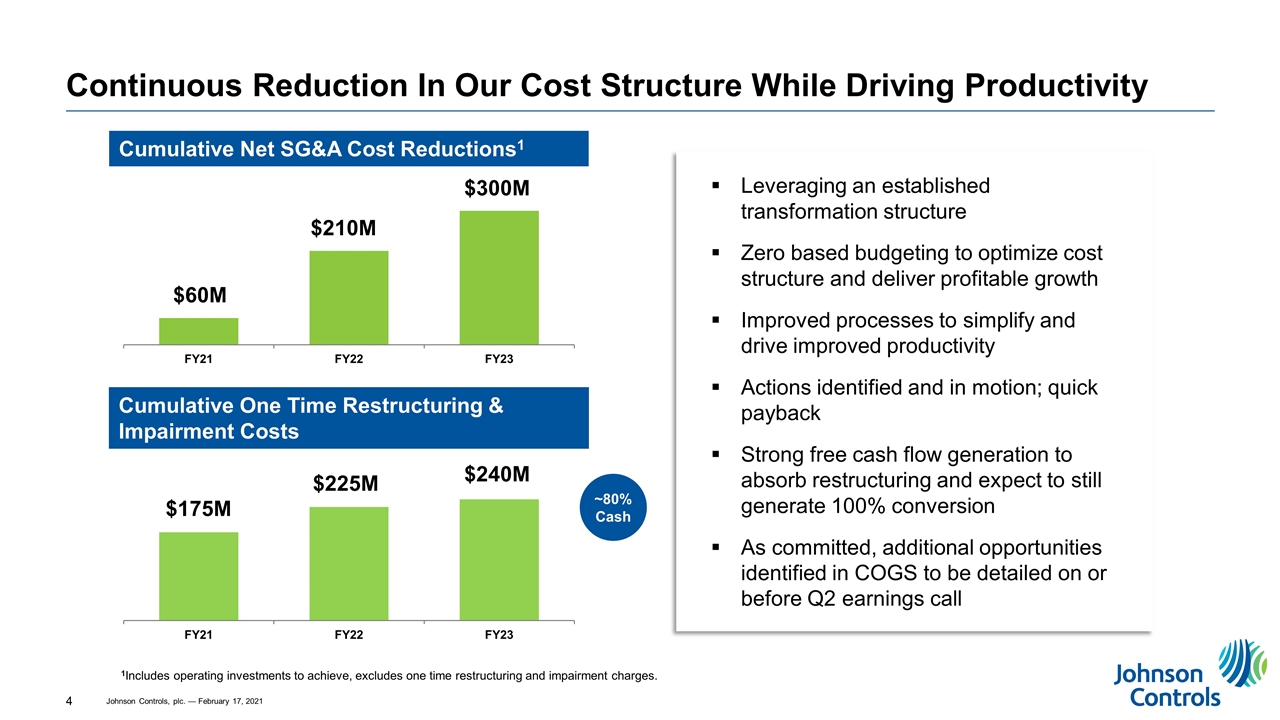
Continuous Reduction In Our Cost Structure While Driving Productivity Cumulative One Time Restructuring & Impairment Costs ($0.2B) Leveraging an established transformation structure Zero based budgeting to optimize cost structure and deliver profitable growth Improved processes to simplify and drive improved productivity Actions identified and in motion; quick payback Strong free cash flow generation to absorb restructuring and expect to still generate 100% conversion As committed, additional opportunities identified in COGS to be detailed on or before Q2 earnings call Cumulative Net SG&A Cost Reductions1 1Includes operating investments to achieve, excludes one time restructuring and impairment charges. $60M $210M $300M $175M $225M $240M ~80% Cash
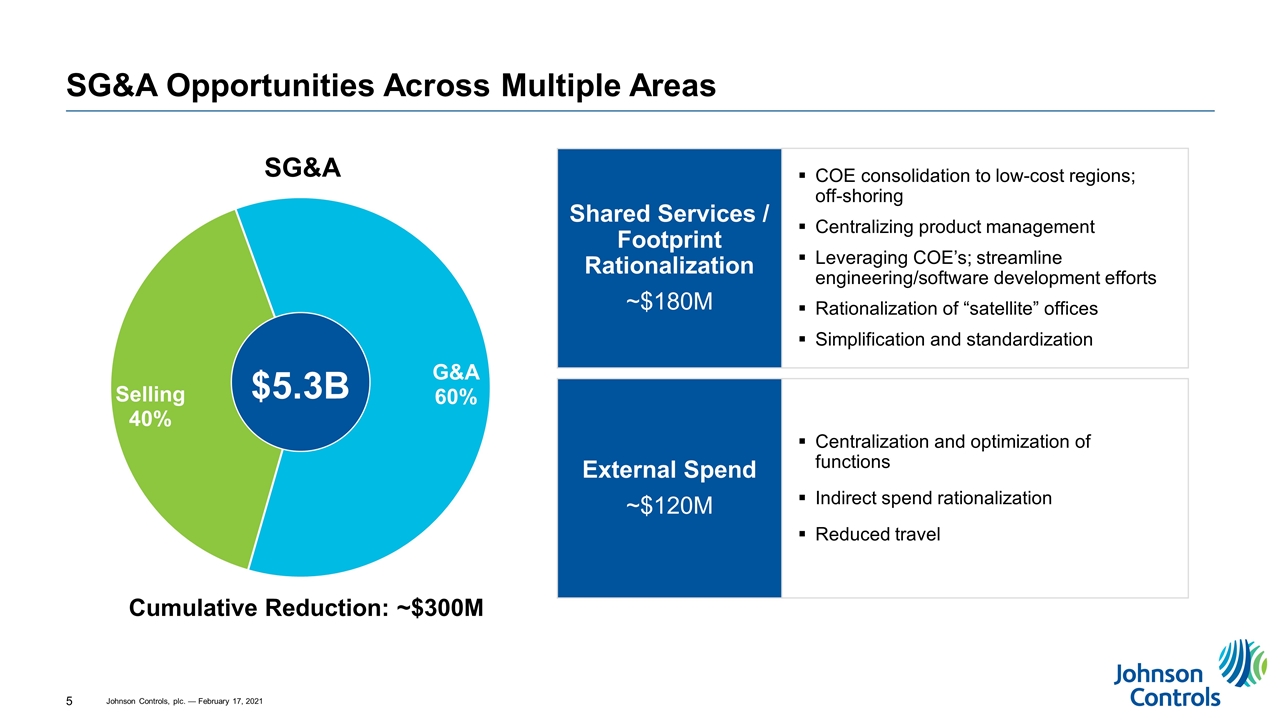
SG&A Opportunities Across Multiple Areas Cumulative Reduction: ~$300M COE consolidation to low-cost regions; off-shoring Centralizing product management Leveraging COE’s; streamline engineering/software development efforts Rationalization of “satellite” offices Simplification and standardization Shared Services / Footprint Rationalization ~$180M External Spend ~$120M Centralization and optimization of functions Indirect spend rationalization Reduced travel $5.3B
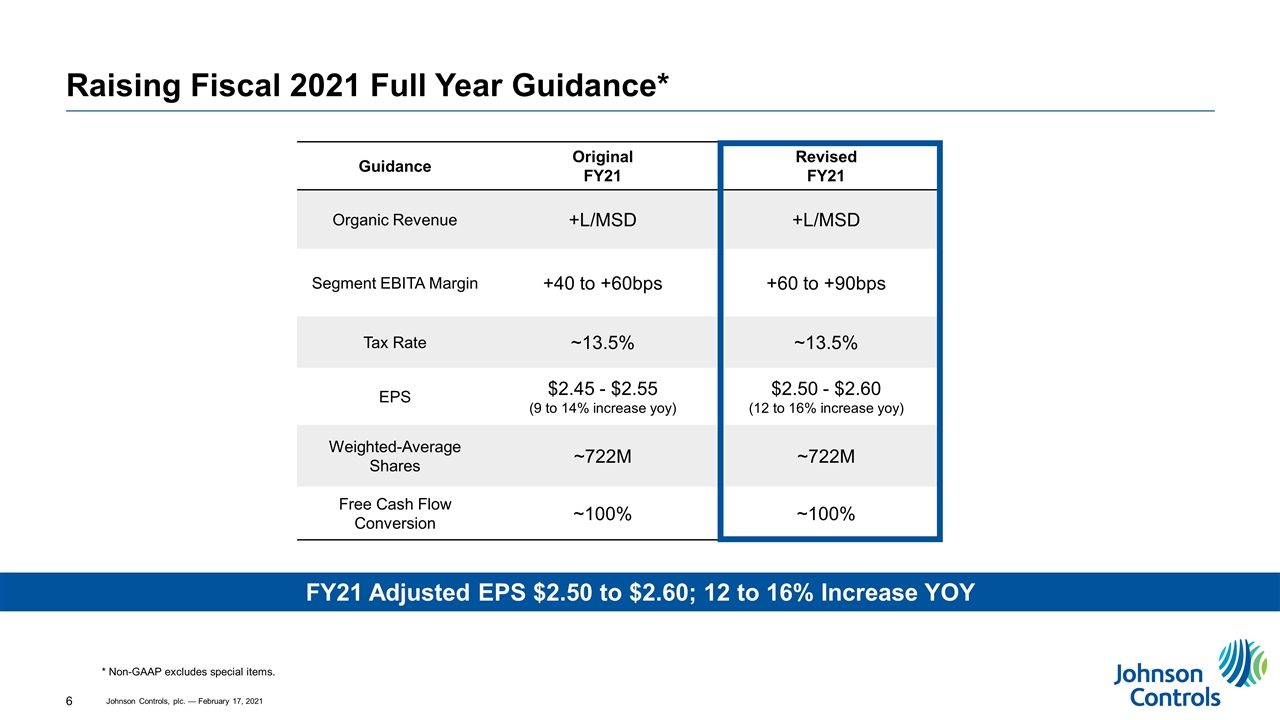
Raising Fiscal 2021 Full Year Guidance* Guidance Original FY21 Revised FY21 Organic Revenue +L/MSD +L/MSD Segment EBITA Margin +40 to +60bps +60 to +90bps Tax Rate ~13.5% ~13.5% EPS $2.45 - $2.55 (9 to 14% increase yoy) $2.50 - $2.60 (12 to 16% increase yoy) Weighted-Average Shares ~722M ~722M Free Cash Flow Conversion ~100% ~100% * Non-GAAP excludes special items. FY21 Adjusted EPS $2.50 to $2.60; 12 to 16% Increase YOY
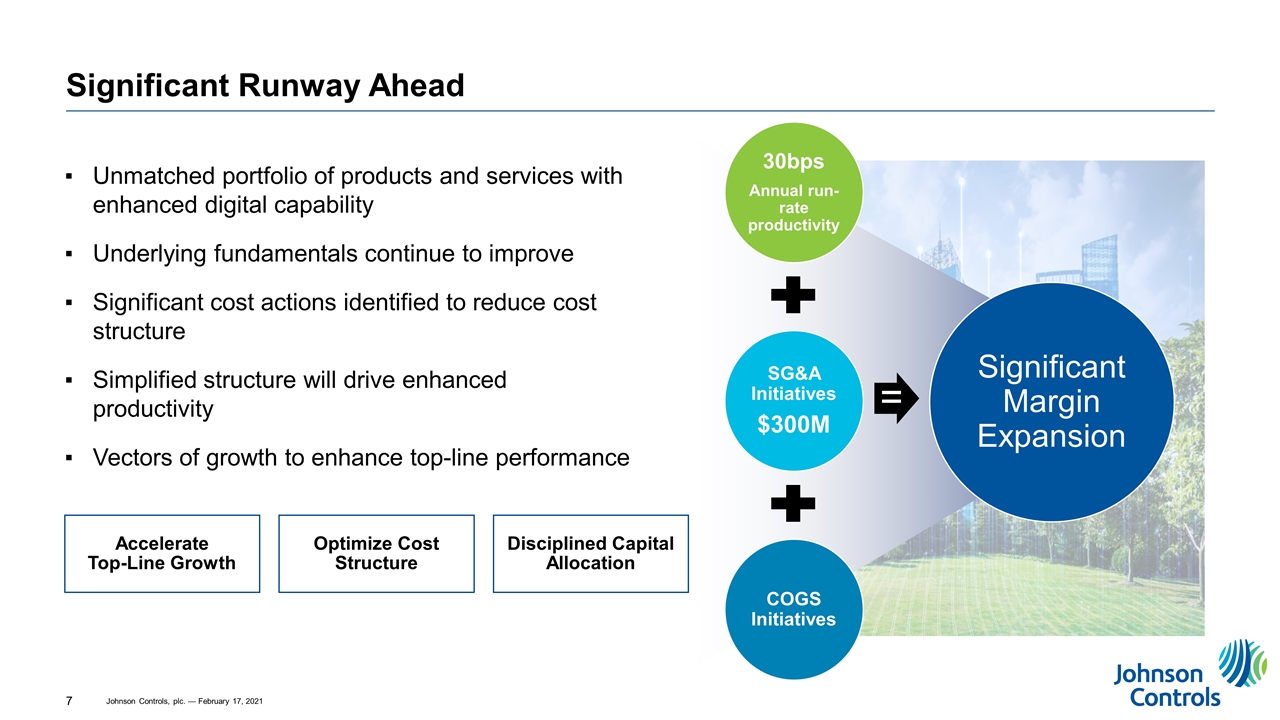
Significant Runway Ahead Unmatched portfolio of products and services with enhanced digital capability Underlying fundamentals continue to improve Significant cost actions identified to reduce cost structure Simplified structure will drive enhanced productivity Vectors of growth to enhance top-line performance 30bps Annual run-rate productivity SG&A Initiatives $300M COGS Initiatives = Significant Margin Expansion Accelerate Top-Line Growth Optimize Cost Structure Disciplined Capital Allocation

Appendix IR CONTACTS Antonella Franzen Chief Investor Relations & Communications Officer antonella.franzen@jci.com Ryan Edelman Executive Director, Investor Relations ryan.edelman@jci.com
