Attached files
| file | filename |
|---|---|
| EX-31.2 - EXHIBIT 31.2 - Johnson Controls International plc | tyc-20151225xex312.htm |
| EX-32.1 - EXHIBIT 32.1 - Johnson Controls International plc | tyc-20151225xex321.htm |
| EX-31.1 - EXHIBIT 31.1 - Johnson Controls International plc | tyc-20151225xex311.htm |
UNITED STATES
SECURITIES AND EXCHANGE COMMISSION
Washington, D.C. 20549
___________________________________________
FORM 10-Q
ý | QUARTERLY REPORT PURSUANT TO SECTION 13 OR 15(d) OF THE SECURITIES EXCHANGE ACT OF 1934 |
For the Quarterly Period Ended December 25, 2015 | |
or | |
o | TRANSITION REPORT PURSUANT TO SECTION 13 OR 15(d) OF THE SECURITIES EXCHANGE ACT OF 1934 |
333-196049
(Commission File Number)
___________________________________________________________
TYCO INTERNATIONAL PLC
(Exact name of Registrant as specified in its charter)
Ireland (Jurisdiction of Incorporation) | 98-0390500 (I.R.S. Employer Identification Number) | |
Unit 1202 Building 1000 City Gate Mahon, Cork, Ireland (Address of registrant's principal executive office) | ||
353-21-423-5000 (Registrant's telephone number) | ||
Indicate by check mark whether the registrant (1) has filed all reports required to be filed by Section 13 or 15(d) of the Securities Exchange Act of 1934 during the preceding 12 months (or for such shorter period that the registrant was required to file such reports), and (2) has been subject to such filing requirements for the past 90 days. Yes ý No o
Indicate by check mark whether the registrant has submitted electronically and posted on its corporate Web site, if any, every Interactive Data File required to be submitted and posted pursuant to Rule 405 of Regulation S-T during the preceding 12 months (or for such shorter period that the registrant was required to submit and post such files). Yes ý No o
Indicate by check mark whether the registrant is a large accelerated filer, an accelerated filer, a non-accelerated filer, or a smaller reporting company. See definitions of "large accelerated filer," "accelerated filer," and "smaller reporting company" in Rule 12b-2 of the Exchange Act. (Check one):
Large accelerated filer ý | Accelerated filer o | Non-accelerated filer o (Do not check if a smaller reporting company) | Smaller reporting company o | |||
Indicate by check mark whether the registrant is a shell company (as defined in Rule 12b-2 of the Exchange Act). Yes o No ý
The number of ordinary shares outstanding as of January 21, 2016 was 424,618,498.
TYCO INTERNATIONAL PLC
INDEX TO FORM 10-Q
Page | |||
2
PART I. FINANCIAL INFORMATION
Item 1. Financial Statements
TYCO INTERNATIONAL PLC
CONSOLIDATED STATEMENTS OF OPERATIONS (UNAUDITED)
(in millions, except per share data)
For the Quarters Ended | |||||||
December 25, 2015 | December 26, 2014 | ||||||
Revenue from product sales | $ | 1,408 | $ | 1,488 | |||
Service revenue | 968 | 990 | |||||
Net revenue | 2,376 | 2,478 | |||||
Cost of product sales | 962 | 1,022 | |||||
Cost of services | 536 | 547 | |||||
Selling, general and administrative expenses | 573 | 652 | |||||
Restructuring and asset impairment charges, net (see Note 3) | 12 | 58 | |||||
Operating income | 293 | 199 | |||||
Interest income | 4 | 3 | |||||
Interest expense | (24 | ) | (24 | ) | |||
Other (expense) income, net | (165 | ) | 4 | ||||
Income from continuing operations before income taxes | 108 | 182 | |||||
Income tax expense | (36 | ) | (19 | ) | |||
Income from continuing operations | 72 | 163 | |||||
Income (loss) from discontinued operations, net of income taxes | 4 | (2 | ) | ||||
Net income | 76 | 161 | |||||
Less: noncontrolling interest in subsidiaries net loss | — | (1 | ) | ||||
Net income attributable to Tyco ordinary shareholders | $ | 76 | $ | 162 | |||
Amounts attributable to Tyco ordinary shareholders: | |||||||
Income from continuing operations | $ | 72 | $ | 164 | |||
Income (loss) from discontinued operations | 4 | (2 | ) | ||||
Net income attributable to Tyco ordinary shareholders | $ | 76 | $ | 162 | |||
Basic earnings per share attributable to Tyco ordinary shareholders: | |||||||
Income from continuing operations | $ | 0.17 | $ | 0.39 | |||
Income from discontinued operations | 0.01 | — | |||||
Net income attributable to Tyco ordinary shareholders | $ | 0.18 | $ | 0.39 | |||
Diluted earnings per share attributable to Tyco ordinary shareholders: | |||||||
Income from continuing operations | $ | 0.17 | $ | 0.38 | |||
Income from discontinued operations | 0.01 | — | |||||
Net income attributable to Tyco ordinary shareholders | $ | 0.18 | $ | 0.38 | |||
Weighted average number of shares outstanding: | |||||||
Basic | 424 | 420 | |||||
Diluted | 428 | 427 | |||||
See Notes to Unaudited Consolidated Financial Statements.
3
TYCO INTERNATIONAL PLC
CONSOLIDATED STATEMENTS OF COMPREHENSIVE INCOME (LOSS) (UNAUDITED)
(in millions)
For the Quarters Ended | |||||||
December 25, 2015 | December 26, 2014 | ||||||
Net income | $ | 76 | $ | 161 | |||
Other comprehensive (loss) income, net of tax | |||||||
Foreign currency translation | (43 | ) | (198 | ) | |||
Defined benefit and post retirement plans | 5 | 5 | |||||
Unrealized gain on marketable securities and derivative instruments, net of tax | 1 | — | |||||
Total other comprehensive loss, net of tax | (37 | ) | (193 | ) | |||
Comprehensive income (loss) | 39 | (32 | ) | ||||
Less: comprehensive loss attributable to noncontrolling interests | — | (1 | ) | ||||
Comprehensive income (loss) attributable to Tyco ordinary shareholders | $ | 39 | $ | (31 | ) | ||
See Notes to Unaudited Consolidated Financial Statements.
4
TYCO INTERNATIONAL PLC
CONSOLIDATED BALANCE SHEETS (UNAUDITED)
(in millions, except per share data)
See Notes to Unaudited Consolidated Financial Statements.
December 25, 2015 | September 25, 2015 | ||||||
Assets | |||||||
Current Assets: | |||||||
Cash and cash equivalents | $ | 301 | $ | 1,401 | |||
Accounts receivable, less allowance for doubtful accounts of $74 and $70, respectively | 1,719 | 1,732 | |||||
Inventories | 647 | 624 | |||||
Prepaid expenses and other current assets | 853 | 754 | |||||
Deferred income taxes | 62 | 62 | |||||
Assets held for sale | 83 | 102 | |||||
Total Current Assets | 3,665 | 4,675 | |||||
Property, plant and equipment, net | 1,167 | 1,177 | |||||
Goodwill | 4,365 | 4,234 | |||||
Intangible assets, net | 927 | 863 | |||||
Other assets | 1,307 | 1,372 | |||||
Total Assets | $ | 11,431 | $ | 12,321 | |||
Liabilities and Equity | |||||||
Current Liabilities: | |||||||
Loans payable and current maturities of long-term debt | $ | 152 | $ | 987 | |||
Accounts payable | 789 | 774 | |||||
Accrued and other current liabilities | 1,837 | 1,661 | |||||
Deferred revenue | 349 | 380 | |||||
Liabilities held for sale | 84 | 50 | |||||
Total Current Liabilities | 3,211 | 3,852 | |||||
Long-term debt | 2,146 | 2,159 | |||||
Deferred revenue | 292 | 303 | |||||
Other liabilities | 1,736 | 1,931 | |||||
Total Liabilities | 7,385 | 8,245 | |||||
Commitments and Contingencies (see Note 10) | |||||||
Tyco Shareholders' Equity: | |||||||
Ordinary shares, $0.01 par value, 1,000,000,000 shares authorized, and 424,544,077 and 422,400,870 shares issued as of December 25, 2015 and September 25, 2015, respectively | 4 | 4 | |||||
Ordinary A shares, €1.00 par value, 40,000 shares authorized, none outstanding as of December 25, 2015 and September 25, 2015 | — | — | |||||
Preference shares, $0.01 par value, 100,000,000 shares authorized, none outstanding as of December 25, 2015 and September 25, 2015 | — | — | |||||
Ordinary shares held in treasury, 385,745 and 79,770 shares as of December 25, 2015 and September 25, 2015, respectively | (14 | ) | (3 | ) | |||
Additional paid in capital | 743 | 716 | |||||
Accumulated earnings | 5,154 | 5,165 | |||||
Accumulated other comprehensive loss | (1,878 | ) | (1,841 | ) | |||
Total Tyco Shareholders' Equity | 4,009 | 4,041 | |||||
Nonredeemable noncontrolling interest | 37 | 35 | |||||
Total Equity | 4,046 | 4,076 | |||||
Total Liabilities and Equity | $ | 11,431 | $ | 12,321 | |||
5
TYCO INTERNATIONAL PLC
CONSOLIDATED STATEMENTS OF CASH FLOWS (UNAUDITED)
(in millions)
For the Three Months Ended | |||||||
December 25, 2015 | December 26, 2014 | ||||||
Cash Flows From Operating Activities: | |||||||
Net income attributable to Tyco ordinary shareholders | $ | 76 | $ | 162 | |||
Noncontrolling interest in subsidiaries net income | — | (1 | ) | ||||
(Income) loss from discontinued operations, net of income taxes | (4 | ) | 2 | ||||
Income from continuing operations | 72 | 163 | |||||
Adjustments to reconcile net cash provided by operating activities: | |||||||
Depreciation and amortization | 83 | 90 | |||||
Non-cash compensation expense | 15 | 15 | |||||
Deferred income taxes | 17 | (6 | ) | ||||
Provision for losses on accounts receivable and inventory | 12 | 16 | |||||
Loss on extinguishment of debt | 168 | — | |||||
Loss on divestitures, net | 52 | 1 | |||||
Gain on investments, net | (115 | ) | (4 | ) | |||
Other non-cash items | 5 | 1 | |||||
Changes in assets and liabilities, net of the effects of acquisitions and divestitures: | |||||||
Accounts receivable, net | 29 | (7 | ) | ||||
Contracts in progress | (9 | ) | 8 | ||||
Inventories | (34 | ) | (43 | ) | |||
Prepaid expenses and other assets | (48 | ) | (25 | ) | |||
Asbestos insurance assets | 5 | 22 | |||||
Accounts payable | 1 | (41 | ) | ||||
Accrued and other liabilities | (41 | ) | (29 | ) | |||
Deferred revenue | (37 | ) | (38 | ) | |||
Income taxes, net | 11 | (2 | ) | ||||
Gross asbestos liabilities | (7 | ) | (4 | ) | |||
Other | 10 | (22 | ) | ||||
Net cash provided by operating activities | 189 | 95 | |||||
Net cash provided by discontinued operating activities | 2 | 1 | |||||
Cash Flows From Investing Activities: | |||||||
Capital expenditures | (68 | ) | (66 | ) | |||
Proceeds from disposal of assets | — | 1 | |||||
Acquisition of businesses, net of cash acquired | (138 | ) | (152 | ) | |||
Acquisition of dealer generated customer accounts and bulk account purchases | (4 | ) | (4 | ) | |||
Sales and maturities of investments | 1 | 275 | |||||
Purchases of investments | (7 | ) | (1 | ) | |||
Decrease (increase) in restricted cash | 5 | (45 | ) | ||||
Other | — | (1 | ) | ||||
Net cash (used in) provided by investing activities | (211 | ) | 7 | ||||
Net cash used in discontinued investing activities | — | (15 | ) | ||||
Cash Flows From Financing Activities: | |||||||
Proceeds from issuance of short-term debt | 817 | — | |||||
Repayment of short-term debt | (666 | ) | — | ||||
Repayment of current portion of long-term debt | (1,134 | ) | — | ||||
Proceeds from exercise of share options | 11 | 33 | |||||
Dividends paid | (87 | ) | (75 | ) | |||
Repurchase of ordinary shares | — | (417 | ) | ||||
Transfer from (to) discontinued operations | 2 | (14 | ) | ||||
Payment of contingent consideration | — | (23 | ) | ||||
Other | (12 | ) | (15 | ) | |||
Net cash used in financing activities | (1,069 | ) | (511 | ) | |||
Net cash (used in) provided by discontinued financing activities | (2 | ) | 14 | ||||
Effect of currency translation on cash | (9 | ) | (10 | ) | |||
Net decrease in cash and cash equivalents | (1,100 | ) | (419 | ) | |||
Cash and cash equivalents at beginning of period | 1,401 | 892 | |||||
Cash and cash equivalents at end of period | $ | 301 | $ | 473 | |||
See Notes to Unaudited Consolidated Financial Statements.
6
TYCO INTERNATIONAL PLC
CONSOLIDATED STATEMENTS OF SHAREHOLDERS' EQUITY (UNAUDITED)
For the Three Months Ended December 25, 2015 and December 26, 2014
(in millions)
Number of Ordinary Shares | Ordinary Shares at Par Value | Treasury Shares | Additional Paid in Capital | Accumulated Earnings | Accumulated Other Comprehensive Loss | Total Tyco Shareholders' Equity | Nonredeemable Noncontrolling Interest | Total Equity | ||||||||||||||||||||||||||
Balance as of September 26, 2014 | 427 | $ | 208 | $ | (2,515 | ) | $ | 3,306 | $ | 4,873 | $ | (1,225 | ) | $ | 4,647 | $ | 23 | $ | 4,670 | |||||||||||||||
Comprehensive income: | ||||||||||||||||||||||||||||||||||
Net income attributable to Tyco ordinary shareholders | 162 | 162 | (1 | ) | 161 | |||||||||||||||||||||||||||||
Other comprehensive loss, net of tax | (193 | ) | (193 | ) | (193 | ) | ||||||||||||||||||||||||||||
Cancellation of treasury shares | (34 | ) | 2,878 | (2,844 | ) | — | — | |||||||||||||||||||||||||||
Dividends declared | 2 | 2 | 2 | |||||||||||||||||||||||||||||||
Conversion of Tyco International Ltd. common shares to Tyco International plc ordinary shares | (170 | ) | 170 | — | — | |||||||||||||||||||||||||||||
Shares issued for vesting of share based equity awards | 3 | 67 | (34 | ) | 33 | 33 | ||||||||||||||||||||||||||||
Repurchase of ordinary shares | (10 | ) | (417 | ) | (417 | ) | (417 | ) | ||||||||||||||||||||||||||
Compensation expense | 15 | 15 | 15 | |||||||||||||||||||||||||||||||
Noncontrolling interest related to acquisitions | — | 29 | 29 | |||||||||||||||||||||||||||||||
Other | (13 | ) | (2 | ) | (15 | ) | (1 | ) | (16 | ) | ||||||||||||||||||||||||
Balance as of December 26, 2014 | 420 | $ | 4 | $ | — | $ | 613 | $ | 5,035 | $ | (1,418 | ) | $ | 4,234 | $ | 50 | $ | 4,284 | ||||||||||||||||
Number of Ordinary Shares | Ordinary Shares at Par Value | Treasury Shares | Additional Paid in Capital | Accumulated Earnings | Accumulated Other Comprehensive Loss | Total Tyco Shareholders' Equity | Nonredeemable Noncontrolling Interest | Total Equity | ||||||||||||||||||||||||||
Balance as of September 25, 2015 | 422 | $ | 4 | $ | (3 | ) | $ | 716 | $ | 5,165 | $ | (1,841 | ) | $ | 4,041 | $ | 35 | $ | 4,076 | |||||||||||||||
Comprehensive income: | ||||||||||||||||||||||||||||||||||
Net income attributable to Tyco ordinary shareholders | 76 | 76 | 76 | |||||||||||||||||||||||||||||||
Other comprehensive loss, net of tax | (37 | ) | (37 | ) | (37 | ) | ||||||||||||||||||||||||||||
Dividends declared | (87 | ) | (87 | ) | (87 | ) | ||||||||||||||||||||||||||||
Shares issued for vesting of share based equity awards | 2 | 11 | 11 | 11 | ||||||||||||||||||||||||||||||
Compensation expense | 15 | 15 | 15 | |||||||||||||||||||||||||||||||
Other | (11 | ) | 1 | (10 | ) | 2 | (8 | ) | ||||||||||||||||||||||||||
Balance as of December 25, 2015 | 424 | $ | 4 | $ | (14 | ) | $ | 743 | $ | 5,154 | $ | (1,878 | ) | $ | 4,009 | $ | 37 | $ | 4,046 | |||||||||||||||
See Notes to Unaudited Consolidated Financial Statements.
7
1. Basis of Presentation and Summary of Significant Accounting Policies
Basis of Presentation—The Consolidated Financial Statements included herein are unaudited, but in the opinion of management, such financial statements include all adjustments, consisting of normal recurring adjustments, necessary to summarize fairly the Company's financial position, results of operations and cash flows for the interim period. The unaudited Consolidated Financial Statements include the consolidated results of Tyco International plc, a corporation organized under the laws of Ireland, and its subsidiaries (Tyco and all its subsidiaries, hereinafter collectively referred to as the "Company" or "Tyco"). The unaudited Consolidated Financial Statements have been prepared in United States dollars ("USD") and in accordance with the instructions to Form 10-Q under the Securities and Exchange Act of 1934, as amended. The results reported in these unaudited Consolidated Financial Statements should not be taken as indicative of results that may be expected for the entire year. These financial statements should be read in conjunction with the Consolidated Financial Statements and accompanying notes contained in the Company's Annual Report on Form 10-K for the fiscal year ended September 25, 2015 (the "2015 Form 10-K").
References to 2016 and 2015 are to Tyco's fiscal quarters ending December 25, 2015 and December 26, 2014, respectively, unless otherwise indicated. The Company has a 52- or 53-week fiscal year that ends on the last Friday in September. Fiscal 2016 is a 53-week year as compared with fiscal 2015, which was 52 weeks, with the additional week occurring in the fourth quarter of fiscal 2016. The Company's results for the three months ended December 25, 2015 and December 26, 2014 both consisted of 13 weeks.
The Company operates and reports financial and operating information in the following three segments: North America Integrated Solutions & Services ("NA Integrated Solutions & Services"), Rest of World Integrated Solutions & Services ("ROW Integrated Solutions & Services") and Global Products. The Company also provides general corporate services to its segments which is reported as a fourth, non-operating segment, Corporate and Other.
Change of Jurisdiction— On May 30, 2014, Tyco entered into a Merger Agreement ("Merger Agreement") with Tyco International plc, a newly-formed Irish public limited company and a wholly-owned subsidiary of Tyco ("Tyco Ireland"). Under the Merger Agreement, Tyco merged with and into Tyco Ireland, with Tyco Ireland being the surviving company. This resulted in Tyco Ireland becoming Tyco's publicly-traded parent company and changed the jurisdiction of organization of Tyco from Switzerland to Ireland. Tyco's shareholders received one ordinary share of Tyco Ireland for each ordinary share of Tyco held immediately prior to the re-domicile to Ireland. The re-domicile to Ireland became effective on November 17, 2014.
Reclassifications— Certain prior period amounts have been reclassified to conform with the current period presentation.
Effective for the first quarter of fiscal 2016, the Company has elected to present operating income by segment, as well as Corporate and Other, excluding restructuring and repositioning charges, net. Restructuring and repositioning charges, net, are shown in aggregate. This measure of segment operating income (loss) is consistent with how management reviews the businesses, makes investing and resource decisions and assesses operating performance. See Note 14.
During the first quarter of fiscal 2016, the Company approved a plan to divest its Australian fire protection business, included in the ROW Integrated Solutions & Services segment. The assets and liabilities related to this business were classified as held for sale for all periods presented. Its results of operations are included in continuing operations, as the criteria to be presented as a discontinued operation were not satisfied. The sale of the business was completed in the second quarter of fiscal 2016.
During the second quarter of fiscal 2015, the Company approved a plan to sell a business in its ROW Integrated Solutions & Services segment which the Company expects to complete during the second quarter of fiscal 2016. The assets and liabilities of this business are classified as held for sale, and its results of operations are presented as discontinued operations for all periods presented. See Note 2.
Recently Adopted Accounting Pronouncements - In April 2014, the Financial Accounting Standards Board ("FASB") issued authoritative guidance to change the criteria for reporting discontinued operations. Under the new guidance, only disposals representing a strategic shift that has or will have a major effect on the Company's operations and financial results should be reported as discontinued operations, with expanded disclosures. The guidance became effective for Tyco in the first quarter of fiscal 2016. The Company considers both qualitative and quantitative factors when assessing whether a disposed business represents a strategic shift that will have a major effect on the Company's operations and financial results. The Company considers the level (e.g. individual business or product line, reporting unit or reportable segment) and geographic
8
TYCO INTERNATIONAL PLC
NOTES TO UNAUDITED CONSOLIDATED FINANCIAL STATEMENTS (Continued)
impact (e.g. country, region, worldwide) of the disposal group. In addition, the Company considers the significance of the disposed business on certain financial measures when assessing whether or not such disposal has a major effect on the Company's operations and financial results. The adoption of this guidance did not have a material impact on the Company's financial position, results of operations or cash flows. During the first quarter of fiscal 2016, the planned divestiture of the Company's Australian fire protection business did not meet the criteria set forth in the new guidance and therefore was not classified as a discontinued operation. See Note 2.
Recently Issued Accounting Pronouncements - In May 2014, the FASB issued authoritative guidance for revenue from contracts with customers, which provides a single comprehensive revenue recognition model to apply in determining how and when to recognize revenue. The core principle of the guidance is that an entity should recognize revenue to depict the transfer of promised goods or services to customers in an amount that reflects the consideration to which the entity expects to be entitled in exchange for those goods or services. When applying the new revenue model to contracts with customers the guidance requires five steps to be applied, which include: 1) identify the contract(s) with a customer, 2) identify the performance obligations in the contract, 3) determine the transaction price, 4) allocate the transaction price to the performance obligations in the contract and 5) recognize revenue when (or as) the entity satisfies a performance obligation. The guidance also requires quantitative and qualitative disclosures that are more comprehensive than existing standards. The disclosures are intended to enable financial statement users to understand the nature, timing and uncertainty of revenue and the related cash flow. The new standard allows for both retrospective and prospective methods of adoption. In August 2015, the FASB issued authoritative guidance to defer the effective date of this guidance, which for Tyco will be the first quarter of fiscal 2019, with early adoption permitted beginning the first quarter of fiscal 2018. The Company is in the process of determining the adoption method and assessing the impact the guidance is expected to have upon adoption.
In May 2015, the FASB issued authoritative guidance that is intended to improve the existing disclosure requirements for short-duration contracts for insurance entities that issue such contracts. The guidance requires additional information to be disclosed about the liability for unpaid claims and claim adjustment expenses to increase the transparency of significant estimates made in measuring those liabilities. This guidance is effective for Tyco in the first quarter of fiscal 2017, with early adoption permitted. The Company is currently assessing the impact, if any, the guidance may have upon adoption.
In July 2015, the FASB issued authoritative guidance intended to simplify the existing guidance under which an entity must measure inventory at the lower of cost or market. Under the new guidance, inventory is “measured at the lower of cost and net realizable value,” and does not apply to inventory that is measured using last-in, first-out or the retail method. Net realizable value is the estimated selling prices in the ordinary course of business, less reasonably predictable costs of completion, disposal, and transportation. This guidance is effective for Tyco in the first quarter of fiscal 2017, with early adoption permitted on a prospective basis. The Company is currently assessing the impact, if any, the guidance may have upon adoption.
In September 2015, the FASB issued authoritative guidance intended to reduce the cost and complexity of financial reporting when recognizing adjustments to provisional amounts in connection with a business combination. This guidance eliminates the requirement to restate prior period financial statements, but requires entities to present separately on the face of the income statement, or disclose in the notes, the portion of the amount recorded in current-period earnings by line item that would have been recorded in previous reporting periods if the adjustment to the provisional amounts had been recognized as of the acquisition date. This guidance is effective for Tyco in the first quarter of fiscal 2017, with early adoption permitted on a prospective basis. The Company is currently assessing the impact, if any, the guidance may have upon adoption.
In November 2015, the FASB issued authoritative guidance intended to simplify the presentation of deferred income taxes. Under the new guidance, deferred tax liabilities and deferred tax assets are to be classified as noncurrent in a classified statement of financial position. The current requirement that deferred tax liabilities and assets of a tax-paying component of an entity be offset and presented as a single amount is not affected by the amendments in this update. This guidance is effective for Tyco in the first quarter of fiscal 2018, with early adoption permitted on a prospective or retrospective basis. The Company is currently assessing the impact, if any, the guidance may have upon adoption and the timing of adopting this new guidance.
In January 2016, the FASB issued authoritative guidance addressing the recognition, measurement, presentation and disclosure of financial assets and liabilities. The guidance primarily affects the accounting for equity investments, financial liabilities under the fair value option and the presentation and disclosure requirements for financial instruments. In addition, the guidance clarifies the valuation allowance assessment when recognizing deferred tax assets resulting from unrealized losses on available-for-sale debt securities. This guidance is effective for Tyco in the first quarter of fiscal 2019, and early adoption is not
9
TYCO INTERNATIONAL PLC
NOTES TO UNAUDITED CONSOLIDATED FINANCIAL STATEMENTS (Continued)
permitted, with certain exceptions. The amendments are required to be applied by means of a cumulative-effect adjustment on the balance sheet as of the beginning of the fiscal year of adoption. The Company is currently assessing the impact, if any, the guidance may have upon adoption.
2. Divestitures
The Company has continued to assess the strategic fit of its various businesses and has pursued the divestiture of certain businesses which do not align with its long-term strategy.
Fiscal 2016
During the first quarter of fiscal 2016, the Company approved a plan to sell its Australian fire protection business, included within its ROW Integrated Solutions & Services segment. As of December 25, 2015, the sale had not been completed. The assets and liabilities of this business have been presented separately as held for sale within the Consolidated Balance Sheets for all periods presented. A pre-tax loss of approximately $57 million for the write-down to fair value, less cost to sell, was recorded in Selling, general and administrative expenses within the Company’s Consolidated Statements of Operations for the quarter ended December 25, 2015. The Company recorded a provision of $24 million for the cumulative translation losses as of December 25, 2015, which is included in the pre-tax loss described above. The Company will realize such cumulative translation losses upon closing of the transaction, which occurred during the second quarter of fiscal 2016. This business has not been presented in discontinued operations within the Consolidated Statements of Operations, as the criteria to be presented as a discontinued operation were not satisfied.
The Company recorded a pre-tax gain of $17 million resulting from the transfer to Pentair Ltd. (formerly known as Tyco Flow Control International Ltd.) of Tyco's equity interest in a joint venture related to the Company's former Flow Control business as repayment of a loan established at the time of the 2012 Separation. This gain was recorded in Income (loss) from discontinued operations, net of income taxes, within the Consolidated Statements of Operations for the quarter ended December 25, 2015.
Fiscal 2015
During the fourth quarter of fiscal 2015, the Company approved a plan to sell a business within its Global Products segment. The assets and liabilities have not been presented separately as held for sale within the Consolidated Balance Sheets as the amounts were not material to the presentation of all periods. A pre-tax loss of approximately $17 million for the write-down to fair value, less cost to sell was recorded in Selling, general and administrative expenses within the Company’s Consolidated Statements of Operations during the fourth quarter of fiscal 2015. This business has not been presented in discontinued operations as the amounts were not material to the Consolidated Financial Statements. The Company completed the transaction during the second quarter of fiscal 2016.
During fiscal 2015, the Company concluded that a business in the ROW Integrated Solutions & Services segment which it intends to sell met the criteria to be classified as held for sale. This business is accounted for as held for sale within the Consolidated Balance Sheets as of December 25, 2015 and September 25, 2015, and its results of operations have been presented as discontinued operations within the Consolidated Statements of Operations for the quarters ended December 25, 2015 and December 26, 2014. The Company expects to complete the sale of this business during the second quarter of fiscal 2016.
Divestiture Charges, net
During the first quarter of fiscal 2016, the Company recorded a net loss of $52 million in Selling, general and administrative expenses within the Company's Consolidated Statements of Operations, which included the $57 million pre-tax loss related to the Company's planned sale of its Australian fire protection business, as described above. The Company recorded a net divestiture loss of $1 million during the first quarter of fiscal 2015.
10
TYCO INTERNATIONAL PLC
NOTES TO UNAUDITED CONSOLIDATED FINANCIAL STATEMENTS (Continued)
Discontinued Operations
The components of income (loss) from discontinued operations, net of income taxes are as follows ($ in millions):
For the Quarters Ended | |||||||
December 25, 2015 | December 26, 2014 | ||||||
Net revenue | $ | 1 | $ | 5 | |||
Pre-tax loss from discontinued operations | (1 | ) | (3 | ) | |||
Pre-tax gain on discontinued operations | 17 | 1 | |||||
Income tax expense (1) | (12 | ) | — | ||||
Income (loss) from discontinued operations, net of income taxes | $ | 4 | $ | (2 | ) | ||
(1) Related to the Company’s settlement of an income tax matter in the first quarter of fiscal 2016 pertaining to its divested ADT Korea business for the 2012 period. This matter is unrelated to the liability established of $212 million during fiscal 2014 which relates to the indemnification for certain tax related matters in connection with the sale. The Company continues to maintain such liability until the matter is resolved.
Balance sheet information for the assets and liabilities of businesses classified as held for sale as of December 25, 2015 and September 25, 2015 was as follows ($ in millions):
As of | |||||||
December 25, 2015 | September 25, 2015 | ||||||
Accounts receivable, net | $ | 44 | $ | 44 | |||
Inventories | 4 | 3 | |||||
Prepaid expenses and other current assets | 24 | 22 | |||||
Deferred income taxes | 1 | 1 | |||||
Property, plant and equipment, net | — | 13 | |||||
Goodwill | 3 | 3 | |||||
Intangible assets, net | 7 | 16 | |||||
Total assets | $ | 83 | $ | 102 | |||
Accounts payable | 10 | 12 | |||||
Accrued and other current liabilities | 63 | 26 | |||||
Deferred revenue | 2 | 2 | |||||
Other liabilities | 9 | 10 | |||||
Total liabilities | $ | 84 | $ | 50 | |||
Because the Company utilizes a centralized approach to cash management and the financing of its operations, all cash that is generated by discontinued operations is routinely transferred to the Company's financing subsidiaries in continuing operations. As a result, transfers from discontinued operations within the Company's Consolidated Statement of Cash Flows reflects the net cash movements from discontinued operations to continuing operations that have occurred during the period.
11
TYCO INTERNATIONAL PLC
NOTES TO UNAUDITED CONSOLIDATED FINANCIAL STATEMENTS (Continued)
3. Restructuring and Asset Impairment Charges, Net
During fiscal 2016, the Company identified and pursued additional opportunities for cost savings through restructuring activities and workforce reductions to improve operating efficiencies across the Company's businesses. The Company expects to incur restructuring and restructuring related charges between $50 million and $75 million in fiscal 2016, which does not include repositioning charges, as described below.
The Company recorded restructuring and asset impairment charges by action as follows ($ in millions):
For the Quarters Ended | |||||||
December 25, 2015 | December 26, 2014 | ||||||
2016 actions | $ | 9 | $ | — | |||
2015 actions | 3 | 44 | |||||
2014 and prior actions | — | 14 | |||||
Total | $ | 12 | $ | 58 | |||
2016 Actions
Restructuring and asset impairment charges, net, during the quarter ended December 25, 2015 related to the 2016 actions are as follows ($ in millions):
For the Quarter Ended December 25, 2015 | |||||||||||
Employee Severance and Benefits | Facility Exit and Other Charges | Total | |||||||||
NA Integrated Solutions & Services | $ | 2 | $ | — | $ | 2 | |||||
ROW Integrated Solutions & Services | 1 | — | 1 | ||||||||
Global Products | 2 | 1 | 3 | ||||||||
Corporate and other | 3 | — | 3 | ||||||||
Total | $ | 8 | $ | 1 | $ | 9 | |||||
The rollforward of the reserves from September 25, 2015 to December 25, 2015 is as follows ($ in millions):
Balance as of September 25, 2015 | $ | — | |
Charges | 9 | ||
Utilization | (2 | ) | |
Balance as of December 25, 2015 | $ | 7 | |
Restructuring reserves for businesses that are included in Liabilities held for sale within the Consolidated Balance Sheets are excluded from the table above. See Note 2.
2015 Actions
12
TYCO INTERNATIONAL PLC
NOTES TO UNAUDITED CONSOLIDATED FINANCIAL STATEMENTS (Continued)
Restructuring and asset impairment charges, net, during the quarters ended December 25, 2015 and December 26, 2014 related to the 2015 actions are as follows ($ in millions):
For the Quarter Ended December 25, 2015 | For the Quarter Ended December 26, 2014 | ||||||
Employee Severance and Benefits | Employee Severance and Benefits | ||||||
NA Integrated Solutions & Services | $ | 2 | $ | 22 | |||
ROW Integrated Solutions & Services | — | 10 | |||||
Global Products | — | 2 | |||||
Corporate and Other | 1 | 10 | |||||
Total | $ | 3 | $ | 44 | |||
Restructuring and asset impairment charges, net, incurred cumulative to date from initiation of the 2015 actions are as follows ($ in millions):
Employee Severance and Benefits | Facility Exit and Other Charges | Charges Reflected in SG&A | Total | ||||||||||||
NA Integrated Solutions & Services | $ | 43 | $ | 3 | $ | 1 | $ | 47 | |||||||
ROW Integrated Solutions & Services | 81 | 9 | 1 | 91 | |||||||||||
Global Products | 21 | 1 | (1 | ) | 21 | ||||||||||
Corporate and Other | 21 | 1 | — | 22 | |||||||||||
Total | $ | 166 | $ | 14 | $ | 1 | $ | 181 | |||||||
The rollforward of the reserves from September 25, 2015 to December 25, 2015 is as follows ($ in millions):
Balance as of September 25, 2015 | $ | 117 | |
Charges | 5 | ||
Reversals | (2 | ) | |
Utilization | (18 | ) | |
Currency translation | (2 | ) | |
Balance as of December 25, 2015 | $ | 100 | |
Restructuring reserves for businesses that are included in Liabilities held for sale within the Consolidated Balance Sheets are excluded from the table above. See Note 2.
2014 and prior actions
The Company continues to maintain restructuring reserves related to actions initiated prior to fiscal 2015. The total amount of these reserves was $31 million and $38 million as of December 25, 2015 and September 25, 2015, respectively. The Company incurred nil and $14 million of restructuring charges and utilized $6 million and $16 million for the quarters ended December 25, 2015 and December 26, 2014, respectively, related to 2014 and prior actions. The remaining change in reserve during the quarters ended December 25, 2015 and December 26, 2014 relates to currency translation. The aggregate remaining reserves relate to employee severance and benefits as well as facility exit costs for long-term non-cancelable lease obligations primarily within the Company's NA Integrated Solutions & Services and ROW Integrated Solutions & Services segments.
13
TYCO INTERNATIONAL PLC
NOTES TO UNAUDITED CONSOLIDATED FINANCIAL STATEMENTS (Continued)
Total Restructuring Reserves
As of December 25, 2015 and September 25, 2015, restructuring reserves related to all actions were included within the Company's Consolidated Balance Sheets as follows ($ in millions):
As of | |||||||
December 25, 2015 | September 25, 2015 | ||||||
Accrued and other current liabilities | $ | 124 | $ | 140 | |||
Other liabilities | 14 | 15 | |||||
Total | $ | 138 | $ | 155 | |||
Restructuring reserves for businesses that are included in Liabilities held for sale within the Consolidated Balance Sheets are excluded from the table above. See Note 2.
Repositioning
The Company has initiated certain global actions designed to reduce its cost structure and improve future profitability by streamlining operations and better aligning functions, which the Company refers to as repositioning actions. These actions may or may not lead to a future restructuring action. During the quarters ended December 25, 2015 and December 26, 2014, the Company recorded net repositioning charges of $6 million and $17 million, respectively, primarily related to professional fees which have been reflected in Selling, general and administrative expenses within the Consolidated Statements of Operations.
4. Acquisitions
During the quarter ended December 25, 2015, cash consideration for acquisitions included in continuing operations was $138 million, which was comprised of $176 million of cash paid, including $5 million to settle pre-existing matters and $6 million for prepaid agency commissions, net of cash acquired of $27 million. This primarily related to an additional investment in the Company's Tyco UAE joint venture with its local partner Suwaidi Engineering Group ("Suwaidi") in the United Arab Emirates ("UAE") for net cash consideration of $128 million. The cash consideration for this additional investment in the UAE joint venture was comprised of $166 million of cash paid, including settlement of pre-existing matters and prepaid agency commissions net of cash acquired of $27 million. Tyco UAE is a leading provider of fire, security and integrated solutions and services in the UAE and also has operations in Qatar and Oman. Effective with the date of this transaction, the Company consolidated 100% of Tyco UAE, which is recorded in the Company's ROW Integrated Solutions & Services segment. The total enterprise fair value of the UAE joint venture was allocated as follows: $100 million of assets, $146 million of goodwill, $88 million of intangible assets and the assumption of $32 million of liabilities. The Company's proportionate share of the joint venture's net income was historically recorded in Selling, general and administrative expenses within the Consolidated Statements of Operations for periods prior to the acquisition date. As a result of this transaction, the Company recorded a net gain of $111 million which primarily relates to the Company's previously held 49% equity interest in the joint venture, which was previously accounted for under the equity method of accounting, inclusive of a charge for the settlement of pre-existing matters with the Company's former joint venture partner. The Company recorded the net gain in Selling, general and administrative expenses within the Consolidated Statements of Operations during the quarter ended December 25, 2015. The balance of the cash paid during the quarter ended December 25, 2015 related to an acquisition within the Company's ROW Integrated Solutions & Services segment which was not material.
The final determination of fair value of certain assets and liabilities related to the UAE joint venture acquisition and other acquisition closed during the first quarter of fiscal 2016 remain subject to change based on final valuations of the assets acquired and liabilities assumed. The Company does not expect the finalization of these matters to have a material effect on the purchase price allocations, which are expected to be completed within fiscal 2016. During the quarter ended December 25, 2015, the Company also finalized the determination of fair value for certain assets and liabilities relating to the fiscal 2015 acquisition of Footfall, with no material adjustment to the preliminary purchase price allocation.
During the quarter ended December 25, 2015, the Company announced it had reached a definitive agreement to acquire ShopperTrak, a leading global provider of retail consumer behavior insights and location-based analytics, for approximately $175 million in cash. The transaction closed during the second quarter of fiscal 2016. The financial results of this business will be reported in the ROW Integrated Solutions & Services segment.
14
TYCO INTERNATIONAL PLC
NOTES TO UNAUDITED CONSOLIDATED FINANCIAL STATEMENTS (Continued)
During the quarter ended December 26, 2014, total cash consideration for acquisitions included in continuing operations totaled $152 million, which was comprised of $175 million cash paid, net of $23 million cash acquired, for five acquisitions, none of which were material individually or in the aggregate. The acquisitions were integrated into the ROW Integrated Solutions & Services and Global Products segments. In connection with one of the acquisitions, the Company acquired a majority interest and recorded a nonredeemable noncontrolling interest of $29 million as of December 26, 2014.
5. Income Taxes
Tyco did not have a significant change to its unrecognized tax benefits during the quarter ended December 25, 2015.
Many of Tyco's uncertain tax positions relate to tax years that remain subject to audit by the taxing authorities in U.S. federal, state and local or foreign jurisdictions. Open tax years in significant jurisdictions included in continuing operations are as follows:
Jurisdiction | Years Open To Audit |
Australia | 2004-2015 |
Canada | 2006-2015 |
Germany | 2006-2015 |
Ireland | 2011-2015 |
Switzerland | 2005-2015 |
United Kingdom | 2013-2015 |
United States | 1997-2015 |
Based on the current status of its income tax audits, the Company believes the unrecognized tax benefits that may be resolved in the next twelve months are not expected to be material.
At each balance sheet date, the Company evaluates whether it is more likely than not that Tyco's deferred tax assets will be realized and if sufficient future taxable income will be available by assessing current period and projected operating results and other pertinent data. As of December 25, 2015, Tyco recorded deferred tax assets of approximately $294 million, which is comprised of $2.4 billion gross deferred tax assets net of $2.1 billion valuation allowances.
Tax Sharing Agreement and Other Income Tax Matters
In connection with the 2012 and 2007 Separations, Tyco entered into the 2012 and 2007 Tax Sharing Agreements, respectively, that govern the respective rights, responsibilities, and obligations of (i) Tyco, Pentair plc and ADT Corporation after the 2012 Separation and (ii) Tyco, Covidien (subsequently acquired by Medtronic plc) and TE Connectivity Ltd. after the 2007 Separation, with respect to taxes. Specifically, this includes taxes in the ordinary course of business and taxes, if any, incurred as a result of any failure of the respective distributions to qualify tax-free for U.S. federal income tax purposes within the meaning of Section 355 of the Internal Revenue Code ("the Code") or certain internal transactions undertaken in anticipation of the spin-offs to qualify for tax-favored treatment under the Code.
Under the 2012 Tax Sharing Agreement, Tyco, Pentair and ADT share (i) certain pre-Distribution income tax liabilities that arise from adjustments made by tax authorities to ADT's, Tyco Flow Control's and Tyco's income tax returns, and (ii) payments required to be made by Tyco with respect to the 2007 Tax Sharing Agreement, excluding approximately $175 million of pre-2012 Separation related tax liabilities (collectively, "Shared Tax Liabilities"). Tyco will be responsible for the first $500 million of Shared Tax Liabilities. Pentair and ADT will share 42% and 58%, respectively, of the next $225 million of Shared Tax Liabilities. Tyco, Pentair and ADT will share 52.5%, 20% and 27.5%, respectively, of Shared Tax Liabilities above $725 million. All costs and expenses associated with the management of these Shared Tax Liabilities will generally be shared 20%, 27.5% and 52.5% by Pentair, ADT and Tyco, respectively. In connection with the execution of the 2012 Tax Sharing Arrangement, Tyco established liabilities representing the fair market value of its obligations which is recorded in Other liabilities within the Company's Consolidated Balance Sheet with an offset to Tyco shareholders' equity.
Under the 2007 Tax Sharing Agreement, Tyco shares responsibility for certain of Tyco's, Covidien's and TE Connectivity's income tax liabilities, which result in cash payments, based on a sharing formula for periods prior to and including June 29, 2007. More specifically, Tyco, Covidien and TE Connectivity share 27%, 42% and 31%, respectively, of shared income tax liabilities that arise from adjustments made by tax authorities to Tyco's, Covidien's and TE Connectivity's U.S. and certain non-U.S. income tax returns. The costs and expenses associated with the management of these shared tax
15
TYCO INTERNATIONAL PLC
NOTES TO UNAUDITED CONSOLIDATED FINANCIAL STATEMENTS (Continued)
liabilities are generally shared equally among the parties. In connection with the execution of the 2007 Tax Sharing Agreement, Tyco established a net receivable from Covidien and TE Connectivity representing the amount Tyco expected to receive for pre-2007 Separation uncertain tax positions, including amounts owed to the Internal Revenue Service ("IRS"). Tyco also established liabilities representing the fair market value of its share of Covidien's and TE Connectivity's estimated obligations, primarily to the IRS, for their pre-2007 Separation taxes covered by the 2007 Tax Sharing Agreement.
Tyco assesses the shared tax liabilities and related guaranteed liabilities related to both the 2012 and 2007 Tax Sharing Agreements at each reporting period. Tyco will provide payment to Pentair and ADT under the 2012 Tax Sharing Agreement and Covidien and TE Connectivity under the 2007 Tax Sharing Agreement as the shared income tax liabilities are settled. Settlement is expected to occur as the tax audit and legal processes are completed for the impacted years and cash payments are made. Due to the nature of the unresolved adjustments described in the next paragraph, the maximum amount of future payments under the 2012 and 2007 Tax Sharing Agreements is not known. Such cash payments, when they occur, will reduce the guarantor liability as they represent an equivalent reduction of risk. Tyco also assesses the sufficiency of the 2012 and 2007 Tax Sharing Agreements guarantee liabilities on a quarterly basis and will increase the liability when it is probable that cash payments expected to be made exceed the recorded balance.
Tyco and its subsidiaries' income tax returns are examined periodically by various tax authorities. In connection with these examinations, tax authorities, including the IRS, have raised issues and proposed tax adjustments, in particular with respect to years preceding the 2007 Separation. The issues and proposed adjustments related to such years are generally subject to the sharing provisions of the 2007 Tax Sharing Agreement and Tyco's liabilities under the 2007 Tax Sharing Agreement are further subject to the sharing provisions in the 2012 Tax Sharing Agreement. Tyco has previously disclosed that in connection with U.S. federal tax audits, the IRS raised a number of issues and proposed tax adjustments for periods beginning with the 1997 tax year. Although Tyco resolved substantially all of the issues and adjustments proposed by the IRS for tax years through 2007, it was not able to resolve matters related to the treatment of certain intercompany debt transactions during the period. As a result, on June 20, 2013, Tyco received Notices of Deficiency from the IRS asserting that several of Tyco's former U.S. subsidiaries owe additional taxes of $883.3 million plus penalties of $154 million based on audits of the 1997 through 2000 tax years of Tyco and its subsidiaries as they existed at that time. In addition, Tyco received Final Partnership Administrative Adjustments for certain U.S. partnerships owned by former U.S. subsidiaries with respect to which an additional tax deficiency of approximately $30 million has been asserted. These amounts excluded interest and did not reflect the roll-forward impact on subsequent audit periods.
On January 15, 2016, Tyco entered into Stipulations of Settled Issues with the IRS intended to resolve all disputes related to the intercompany debt issues described above for the 1997 - 2000 audit cycle currently before the U.S. Tax Court. The Stipulations of Settled Issues are contingent upon the IRS Appeals Division applying the same settlement to all intercompany debt issues on appeal for subsequent audit cycles (2001 - 2007) and, if applicable, review by the United States Congress Joint Committee on Taxation.
If finalized, the tentative resolution would cover all aspects of the controversy before the U.S. Tax Court described above and before the Appeals Division of the IRS, and would result in a total cash payment to the IRS in the range of $475 million to $525 million, which includes all interest and penalties. This payment would be subject to the sharing formula in each Tax Sharing Agreement, and would be shared among Tyco, Covidien and TE Connectivity 27%, 42% and 31%, respectively, with neither ADT nor Pentair being responsible for any payment related to this amount.
Assuming the tentative resolution is finalized, Tyco does not expect to recognize any additional charges related to the resolution, as it had previously recorded sufficient reserves with respect to this controversy and its obligations under the Tax Sharing Agreements. Payment is expected to be made to the IRS, and among Tyco, Covidien and TE Connectivity, within the next six months. Accordingly, the Company has presented the liabilities related to the 2007 Tax Sharing Agreement in Accrued and other current liabilities within the Consolidated Balance Sheet as of December 25, 2015.
As noted above, Tyco has assessed its obligations under the 2007 Tax Sharing Agreement to determine that its recorded liability is sufficient to cover the indemnifications made by it under such agreement. In the absence of observable transactions for identical or similar guarantees, Tyco determined the fair value of these guarantees and indemnifications utilizing expected present value measurement techniques. Significant assumptions utilized to determine fair value included determining a range of potential outcomes, assigning a probability weighting to each potential outcome and estimating the anticipated timing of resolution. The probability weighted outcomes were discounted using Tyco's incremental borrowing rate. Until the tentative resolution is finalized, the ultimate resolution of these matters is uncertain and could result in a material adverse impact to the Company's financial position, results of operations, cash flows, or the effective tax rate in future reporting periods.
16
TYCO INTERNATIONAL PLC
NOTES TO UNAUDITED CONSOLIDATED FINANCIAL STATEMENTS (Continued)
In addition to dealing with tax liabilities for periods prior to the respective Separations, the 2012 and 2007 Tax Sharing Agreements contain sharing provisions to address the contingencies that the 2012 or 2007 Separations, or internal transactions related thereto, may be deemed taxable by U.S. or non U.S. taxing authorities. In the event the 2012 Separation is determined to be taxable and such determination was the result of actions taken after the 2012 Separations by Tyco, ADT or Pentair, the party responsible for such failure would be responsible for all taxes imposed on each company as a result thereof. If such determination is not the result of actions taken by Tyco, ADT or Pentair after the 2012 Separation, then Tyco, ADT and Pentair would be responsible for any taxes imposed on any of the companies as a result of such determination in the same manner and in the same proportions as described above. Similar provisions exist in the 2007 Tax Sharing Agreement. If either of the 2007 or 2012 Separation, or internal transactions taken in anticipation thereof, were deemed taxable, the associated liability could be significant. Tyco is responsible for all of its own taxes that are not shared pursuant to the 2012 and 2007 Tax Sharing Agreements' sharing formulas. In addition, Pentair and ADT, and Covidien and TE Connectivity are responsible for their tax liabilities that are not subject to the 2012 or 2007 Tax Sharing Agreements' sharing formula.
Each of the 2012 and 2007 Tax Sharing Agreements provides that, if any party to such agreement were to default in its obligation to another party to pay its share of the distribution taxes that arise as a result of no party's fault, each non-defaulting party to the agreement would be required to pay, equally with any other non-defaulting party to the agreement, the amounts in default. In addition, if another party to the 2012 or 2007 Tax Sharing Agreements that is responsible for all or a portion of an income tax liability were to default in its payment of such liability to a taxing authority, Tyco could be liable under applicable tax law for such liabilities and required to make additional tax payments. Accordingly, under certain circumstances, Tyco may be obligated to pay amounts in excess of its agreed-upon share of its tax liabilities under either of the 2012 or 2007 Tax Sharing Agreements.
The receivables and liabilities related to the 2012 and 2007 Tax Sharing Agreements as of December 25, 2015 and September 25, 2015, are as follows ($ in millions):
2012 Tax Sharing Agreement | 2007 Tax Sharing Agreement | ||||||||||||||
As of | As of | ||||||||||||||
December 25, 2015 | September 25, 2015 | December 25, 2015 | September 25, 2015 | ||||||||||||
Tax sharing agreement related receivables: | |||||||||||||||
Other assets | — | — | 18 | 19 | |||||||||||
— | — | 18 | 19 | ||||||||||||
Tax sharing agreement related liabilities: | |||||||||||||||
Accrued and other current liabilities | — | — | (209 | ) | (15 | ) | |||||||||
Other liabilities | (46 | ) | (46 | ) | — | (194 | ) | ||||||||
(46 | ) | (46 | ) | (209 | ) | (209 | ) | ||||||||
Net liability | $ | (46 | ) | $ | (46 | ) | $ | (191 | ) | $ | (190 | ) | |||
Other Income Tax Matters
Except for earnings that are currently distributed, no additional material provision has been made for U.S. or non-U.S. income taxes on the undistributed earnings of subsidiaries or for deferred tax liabilities for temporary differences related to investments in subsidiaries, since the earnings are expected to be permanently reinvested, the investments are essentially permanent in duration, or Tyco has concluded that no additional tax liability will arise as a result of the distribution of such earnings. A liability could arise if amounts are distributed by such subsidiaries or if such subsidiaries are ultimately disposed. It is not practicable to estimate the additional income taxes related to permanently reinvested earnings or the basis differences related to investments in subsidiaries.
17
TYCO INTERNATIONAL PLC
NOTES TO UNAUDITED CONSOLIDATED FINANCIAL STATEMENTS (Continued)
6. Earnings Per Share
The reconciliations between basic and diluted earnings per share attributable to Tyco ordinary shareholders are as follows (in millions, except per share data):
For the Quarter Ended December 25, 2015 | For the Quarter Ended December 26, 2014 | ||||||||||||||||||||
Income | Shares | Per Share Amount | Income | Shares | Per Share Amount | ||||||||||||||||
Basic earnings per share attributable to Tyco ordinary shareholders: | |||||||||||||||||||||
Income from continuing operations | $ | 72 | 424 | $ | 0.17 | $ | 164 | 420 | $ | 0.39 | |||||||||||
Share options and restricted share awards | — | 4 | — | 7 | |||||||||||||||||
Diluted earnings per share attributable to Tyco ordinary shareholders: | |||||||||||||||||||||
Income from continuing operations attributable to Tyco ordinary shareholders, giving effect to dilutive adjustments | $ | 72 | 428 | $ | 0.17 | $ | 164 | 427 | $ | 0.38 | |||||||||||
The computation of diluted earnings per share for the quarter ended December 25, 2015 excludes the effect of the potential exercise of share options to purchase approximately 6 million shares and excludes restricted stock units of approximately 2 million shares because the effect would be anti-dilutive.
The computation of diluted earnings per share for the quarter ended December 26, 2014 excludes the effect of the potential exercise of share options to purchase approximately 3 million shares and excludes restricted stock units of approximately 2 million shares because the effect would be anti-dilutive.
7. Goodwill and Intangible Assets
Goodwill
The changes in the carrying amount of goodwill by segment are as follows ($ in millions):
NA Integrated Solutions & Services | ROW Integrated Solutions & Services | Global Products | Total | ||||||||||||
Gross goodwill | $ | 2,102 | $ | 1,969 | $ | 1,809 | $ | 5,880 | |||||||
Accumulated impairment | (126 | ) | (1,068 | ) | (567 | ) | (1,761 | ) | |||||||
Carrying amount of goodwill as of September 26, 2014 | 1,976 | 901 | 1,242 | 4,119 | |||||||||||
2015 activity: | |||||||||||||||
Acquisitions / purchase accounting adjustments | 23 | 50 | 274 | 347 | |||||||||||
Currency translation | (29 | ) | (167 | ) | (36 | ) | (232 | ) | |||||||
Gross goodwill | $ | 2,096 | $ | 1,852 | $ | 2,047 | $ | 5,995 | |||||||
Accumulated impairment | (126 | ) | (1,068 | ) | (567 | ) | (1,761 | ) | |||||||
Carrying amount of goodwill as of September 25, 2015 | 1,970 | 784 | 1,480 | 4,234 | |||||||||||
2016 activity: | |||||||||||||||
Acquisitions / purchase accounting adjustments | — | 157 | — | 157 | |||||||||||
Currency translation | (5 | ) | (11 | ) | (10 | ) | (26 | ) | |||||||
Gross goodwill | $ | 2,091 | $ | 1,998 | $ | 2,037 | $ | 6,126 | |||||||
Accumulated impairment | (126 | ) | (1,068 | ) | (567 | ) | (1,761 | ) | |||||||
Carrying amount of goodwill as of December 25, 2015 | $ | 1,965 | $ | 930 | $ | 1,470 | $ | 4,365 | |||||||
18
TYCO INTERNATIONAL PLC
NOTES TO UNAUDITED CONSOLIDATED FINANCIAL STATEMENTS (Continued)
Intangible Assets
The following table sets forth the gross carrying amount and accumulated amortization of the Company's intangible assets as of December 25, 2015 and September 25, 2015 ($ in millions):
As of | |||||||||||||||
December 25, 2015 | September 25, 2015 | ||||||||||||||
Gross Carrying Amount | Accumulated Amortization | Gross Carrying Amount | Accumulated Amortization | ||||||||||||
Amortizable: | |||||||||||||||
Contracts and related customer relationships | $ | 1,287 | $ | 1,002 | $ | 1,281 | $ | 991 | |||||||
Intellectual property | 836 | 503 | 760 | 496 | |||||||||||
Other | 9 | 5 | 8 | 5 | |||||||||||
Total | $ | 2,132 | $ | 1,510 | $ | 2,049 | $ | 1,492 | |||||||
Non-Amortizable: | |||||||||||||||
Intellectual property | $ | 210 | $ | 210 | |||||||||||
Franchise rights | 76 | 76 | |||||||||||||
In-process research and development | 19 | 20 | |||||||||||||
Total | $ | 305 | $ | 306 | |||||||||||
Intangible asset amortization expense for the quarters ended December 25, 2015 and December 26, 2014 was $23 million and $21 million, respectively.
The estimated aggregate amortization expense on intangible assets is expected to be approximately $89 million for 2016, $92 million for 2017, $86 million for 2018, $80 million for 2019, and $275 million for 2020 and thereafter.
8. Debt
The carrying value of the Company's debt as of December 25, 2015 and September 25, 2015 is as follows ($ in millions):
As of | |||||||
December 25, 2015 | September 25, 2015 | ||||||
Commercial paper | $ | 151 | $ | — | |||
3.375% public notes due 2015 | — | 258 | |||||
3.75% public notes due 2018 | 67 | 67 | |||||
7.0% public notes due 2019 | — | 245 | |||||
6.875% public notes due 2021 | — | 465 | |||||
4.625% public notes due 2023 | 42 | 42 | |||||
1.375% Euro-denominated public notes due 2025 | 545 | 558 | |||||
3.9% public notes due 2026 | 745 | 745 | |||||
5.125% public notes due 2045 | 746 | 746 | |||||
Other | 2 | 20 | |||||
Total debt | 2,298 | 3,146 | |||||
Less current portion (1)(2) | 152 | 987 | |||||
Long-term debt | $ | 2,146 | $ | 2,159 | |||
_______________________________________________________________________________
(1) The current portion of debt as of December 25, 2015 is comprised of $151 million of commercial paper and $1 million of Other debt.
(2) The current portion of debt as of September 25, 2015 is comprised of $258 million notes due 2015, $245 million notes due 2019, $465 million notes due 2021 and $19 million of Other debt.
19
TYCO INTERNATIONAL PLC
NOTES TO UNAUDITED CONSOLIDATED FINANCIAL STATEMENTS (Continued)
Fair Value
The carrying amount of Tyco's debt subject to the fair value disclosure requirements as of December 25, 2015 and September 25, 2015 was $2,296 million and $3,126 million, respectively. The Company utilizes various valuation methodologies to determine the fair value of its debt, which is primarily dependent on the type of market in which the Company's debt is traded. When available, the Company uses quoted market prices to determine the fair value of its debt that is traded in active markets. As of December 25, 2015 and September 25, 2015, the fair value of the Company's debt which was actively traded was $2,318 million and $3,291 million, respectively. As of December 25, 2015 and September 25, 2015, the Company's debt that was subject to the fair value disclosure requirements was all actively traded and is classified as Level 1 in the fair value hierarchy. Additionally, the Company believes the carrying amount of its commercial paper of $151 million as of December 25, 2015 approximates fair value based on the short-term nature of such debt.
Fiscal 2016 Debt Repayment
On September 14, 2015, the Company and the Company's wholly-owned subsidiary, Tyco International Finance S.A. ("TIFSA") announced the redemption of all of the outstanding $242 million aggregate principal amount of 7.0% notes due 2019 and $462 million aggregate principal amount of 6.875% notes due 2021. On October 14, 2015, TIFSA paid cash of $876 million to complete the redemption, resulting in a loss on extinguishment of $168 million which was recorded in Other expense, net within the Consolidated Statements of Operations during the first quarter of fiscal 2016. The charge is comprised of the make-whole premium of $172 million and the write-off of unamortized debt issuance costs of $1 million, partially offset by the write-off of the unamortized premium of $5 million.
On October 15, 2015, the Company repaid $258 million aggregate principal amount of 3.375% notes which matured on such date.
Commercial Paper
From time to time, TIFSA may issue commercial paper for general corporate purposes. The maximum aggregate amount of unsecured commercial paper notes available to be issued, on a private placement basis, under the commercial paper program is $1.5 billion as of December 25, 2015. As of December 25, 2015 and September 25, 2015, TIFSA had $151 million and nil of commercial paper outstanding, respectively.
Credit Facilities
On August 7, 2015, TIFSA entered into an Amended and Restated Five-Year Senior Unsecured Credit Agreement in the aggregate amount of $1.5 billion (the “2015 Credit Agreement”). The 2015 Credit Agreement amends and restates TIFSA's existing Five-Year Senior Unsecured Credit Agreement, dated June 22, 2012 (the “2012 Credit Agreement”), which provided for revolving credit commitments in the aggregate amount of $1.0 billion, and was scheduled to expire on June 22, 2017.
As a result of entering into the 2015 Credit Agreement, the Company's committed revolving credit facility totaled $1.5 billion as of December 25, 2015. This revolving credit facility may be used for working capital, capital expenditures and general corporate purposes. As of December 25, 2015 and September 25, 2015, there were no amounts drawn under the Company's revolving credit facility. Interest under the revolving credit facility is variable and is calculated by reference to LIBOR or an alternate base rate.
TIFSA's revolving credit facility contains customary terms and conditions, and financial covenants that limit the ratio of the Company's debt to earnings before interest, taxes, depreciation, and amortization and that limit our ability to incur subsidiary debt or grant liens on its property. The indentures contain customary covenants including limits on negative pledges, subsidiary debt and sale/leaseback transactions. None of these covenants are considered restrictive to the Company's business.
20
TYCO INTERNATIONAL PLC
NOTES TO UNAUDITED CONSOLIDATED FINANCIAL STATEMENTS (Continued)
9. Financial Instruments
The Company's financial instruments consist primarily of cash and cash equivalents, accounts receivable, investments, accounts payable, debt and derivative financial instruments. The fair value of cash, accounts receivable, and accounts payable approximated book value as of December 25, 2015 and September 25, 2015. The fair value of derivative financial instruments was not material to any of the periods presented. See below for the fair value of cash equivalents and investments and Note 8 for the fair value of debt.
Derivative Instruments
In the normal course of business, Tyco is exposed to market risk arising from changes in currency exchange rates, interest rates and commodity prices. The Company may use derivative financial instruments to manage exposures to foreign currency, interest rate and commodity risks. The Company's objective for utilizing derivative financial instruments is to manage these risks using the most effective methods to eliminate or reduce the impacts of these exposures. The Company does not use derivative financial instruments for trading or speculative purposes. As of and during the three months ended December 25, 2015, the Company did not hold or enter into any commodity derivative instruments or interest rate swaps.
For derivative instruments that are designated and qualified as hedging instruments for accounting purposes, the Company documents and links the relationships between the hedging instruments and hedged items. The Company also assesses and documents at the hedge's inception whether the derivatives used in hedging transactions are effective in offsetting changes in fair values associated with the hedged items. During the quarter ended March 27, 2015, the Company designated its 2025 Euro notes as a net investment hedge of the Company’s investments in certain of its international subsidiaries that use the Euro as their functional currency and intercompany permanent loans in order to reduce the volatility caused by changes in foreign currency exchange rates of the Euro with respect to the U.S. Dollar. During the three months ended December 25, 2015, the change in the carrying value due to remeasurement of the 2025 Euro notes resulted in a $13 million gain reported in Accumulated other comprehensive loss within the Consolidated Statement of Shareholders' Equity. This hedge did not result in any hedge ineffectiveness for the three months ended December 25, 2015. During the three months ended December 26, 2014, the Company did not have hedging instruments that were designated and qualified as hedging instruments for accounting purposes.
Foreign Currency Exposures
As of December 25, 2015 and September 25, 2015, the total gross notional amount of the Company's foreign exchange contracts was $620 million and $365 million, respectively. The fair value of these derivative financial instruments and impact of such changes in the fair value was not material to the Consolidated Balance Sheets as of December 25, 2015 and September 25, 2015 or Consolidated Statements of Operations and Consolidated Statements of Cash Flows for the three months ended December 25, 2015 and December 26, 2014.
Counterparty Credit Risk
The use of derivative financial instruments exposes the Company to counterparty credit risk. Tyco has established policies and procedures to limit its exposure to counterparty credit risk, including establishing limits for credit exposure and continually assessing the creditworthiness of counterparties. As a matter of practice, the Company deals with major banks worldwide having strong investment grade long-term credit ratings. To further reduce the risk of loss, the Company generally enters into International Swaps and Derivatives Association master netting agreements with substantially all of its counterparties. The Company's derivative contracts do not contain any credit risk related contingent features and do not require collateral or other security to be furnished by the Company or the counterparties. The Company's exposure to credit risk associated with its derivative instruments is measured on an individual counterparty basis, as well as by groups of counterparties that share similar attributes. The Company does not anticipate any non-performance by any of its counterparties, and the concentration of risk with financial institutions does not present significant credit risk to the Company. The maximum amount of loss that the Company would incur as of December 25, 2015 without giving consideration to the effects of legally enforceable master netting agreements was not material.
21
TYCO INTERNATIONAL PLC
NOTES TO UNAUDITED CONSOLIDATED FINANCIAL STATEMENTS (Continued)
Cash Equivalents and Investments
The fair value of cash equivalents approximates carrying value and is included in Level 1.
Investments may include marketable securities such as U.S. government obligations, U.S. government agency and corporate debt securities, equity securities, exchange traded funds or time deposits with banks.
When available, the Company uses quoted market prices to determine the fair value of investment securities. Such investments are included in Level 1. When quoted market prices are not readily available, pricing determinations are made based on the results of market approach valuation models using observable market data such as recently reported trades, bid and offer information and benchmark securities. These investments are included in Level 2 and consist primarily of U.S. government agency securities and corporate debt securities.
Assets Measured at Fair Value on a Recurring Basis
The following table presents the Company's hierarchy for its assets measured at fair value on a recurring basis as of December 25, 2015 and September 25, 2015 ($ in millions):
Consolidated Balance Sheet Classification | |||||||||||||||||||||||
As of December 25, 2015 | Cash and Cash Equivalents | Prepaids and Other Current Assets | Other Assets | ||||||||||||||||||||
Investment Assets: | Level 1 | Level 2 | Total | ||||||||||||||||||||
Cash equivalents | $ | 31 | $ | — | $ | 31 | $ | 31 | $ | — | $ | — | |||||||||||
Available-for-sale securities: | |||||||||||||||||||||||
Exchange traded funds (fixed income) (1) | 184 | — | 184 | — | 30 | 154 | |||||||||||||||||
Exchange traded funds (equity) (1) | 83 | — | 83 | — | — | 83 | |||||||||||||||||
Trading securities: | |||||||||||||||||||||||
Exchange traded funds (equity) | 62 | — | 62 | — | 62 | — | |||||||||||||||||
$ | 360 | $ | — | $ | 360 | $ | 31 | $ | 92 | $ | 237 | ||||||||||||
Consolidated Balance Sheet Classification | |||||||||||||||||||||||
As of September 25, 2015 | Cash and Cash Equivalents | Prepaids and Other Current Assets | Other Assets | ||||||||||||||||||||
Investment Assets: | Level 1 | Level 2 | Total | ||||||||||||||||||||
Cash equivalents | $ | 909 | $ | — | $ | 909 | $ | 909 | $ | — | $ | — | |||||||||||
Available-for-sale securities: | |||||||||||||||||||||||
Exchange traded funds (fixed income) (1) | 186 | — | 186 | — | 15 | 171 | |||||||||||||||||
Exchange traded funds (equity) (1) | 77 | — | 77 | — | — | 77 | |||||||||||||||||
Trading securities: | |||||||||||||||||||||||
Exchange traded funds (equity) | 59 | — | 59 | — | 59 | — | |||||||||||||||||
$ | 1,231 | $ | — | $ | 1,231 | $ | 909 | $ | 74 | $ | 248 | ||||||||||||
(1) Classified as restricted investments. See Note 10.
During the quarters ended December 25, 2015 and December 26, 2014, the Company did not have any significant transfers between levels within the fair value hierarchy.
The Company recorded an unrealized gain of $2 million for the quarter ended December 25, 2015 within Accumulated other comprehensive loss related to the available-for-sale securities. The Company did not hold available-for-sale securities during the quarter ended December 26, 2014. Unrealized gains and losses related to trading securities were $3 million for both the quarters ended December 25, 2015 and December 26, 2014, which are recorded within Other expense (income), net within the Consolidated Statements of Operations.
22
TYCO INTERNATIONAL PLC
NOTES TO UNAUDITED CONSOLIDATED FINANCIAL STATEMENTS (Continued)
Other
The Company had $1.3 billion and $1.4 billion of intercompany loans designated as permanent in nature as of December 25, 2015 and September 25, 2015, respectively. Additionally, for the quarters ended December 25, 2015 and December 26, 2014, the Company recorded cumulative translation losses of $34 million and $70 million, respectively, through Accumulated other comprehensive loss related to these loans.
10. Commitments and Contingencies
Legacy Matters Related to Former Management
As previously reported, in recent years, the Company has definitively resolved several lawsuits involving disputes with former management, including Dennis Kozlowski, the Company's former chief executive officer, and Mark Swartz, the Company's former chief financial officer.
In the first quarter of fiscal 2015, the Company reached a definitive agreement with Mark Swartz to resolve all outstanding disputes, and received approximately $12 million in cash from Mr. Swartz, $5 million of which was shared pursuant to the terms of a legacy class action lawsuit, resulting in a net recovery of $7 million for the Company, which was recorded in Selling, general and administrative expenses within the Consolidated Statement of Operations. The cash received has been classified as restricted.
Environmental Matters
Tyco is involved in various stages of investigation and cleanup related to environmental remediation matters at a number of sites. The ultimate cost of site cleanup is difficult to predict given the uncertainties regarding the extent of the required cleanup, the interpretation of applicable laws and regulations and alternative cleanup methods. As of December 25, 2015, Tyco concluded that it was probable that it would incur remedial costs in the range of approximately $22 million to $71 million. As of December 25, 2015, Tyco concluded that the best estimate within this range is approximately $32 million, of which $11 million is included in Accrued and other current liabilities and $21 million is included in Other liabilities within the Company's Consolidated Balance Sheet.
As previously disclosed, the majority of the liabilities described above relate to ongoing remediation efforts at a facility in the Company's Global Products segment located in Marinette, Wisconsin, which the Company acquired in 1990 in connection with its acquisition of, among other things, the Ansul product line. As of December 25, 2015, the Company concluded that its remaining remediation and monitoring costs related to the Marinette facility were in the range of approximately $14 million to $46 million. The Company's best estimate within that range is approximately $22 million, of which $9 million is included in Accrued and other current liabilities and $13 million is included in Other liabilities within the Company's Consolidated Balance Sheet. Although the Company has recorded its best estimate of the costs that it will incur to remediate and monitor contamination at the Marinette facility, it is possible that technological, regulatory or enforcement developments, the results of environmental studies or other factors could change the Company's expectations with respect to future charges and cash outlays, and such changes could be material to the Company's future results of operations, financial condition or cash flows.
Asbestos Matters
The Company and certain of its subsidiaries, including Grinnell LLC (“Grinnell”), along with numerous other third parties, are named as defendants in personal injury lawsuits based on alleged exposure to asbestos containing materials. Substantially all cases pending against affiliates of the Company have been filed against Grinnell, and have typically involved product liability claims based primarily on allegations of manufacture, sale or distribution of industrial products that either contained asbestos or were used with asbestos containing components.
During the third quarter of fiscal 2014, the Company, through Grinnell, resolved disputes with certain of its historical insurers and agreed that certain insurance proceeds would be used to establish and fund a qualified settlement fund (“QSF”), within the meaning of the Internal Revenue Code, which would be used for the resolution primarily of Grinnell asbestos liabilities. It is intended that the QSF will receive future insurance payments and proceeds from third party insurers and, in addition, will fund and manage liabilities for certain historical operations of the Company, primarily related to Grinnell. On January 9, 2015, the Company completed a series of restructuring transactions related to the establishment and funding of a dedicated structure pursuant to which a subsidiary of the Company acquired the assets of Grinnell and transferred cash and other assets totaling approximately $278 million (not including $22 million received by the QSF during the quarter ended December 26, 2014 from historic third-party insurers in settlement of coverage disputes) to the structure. As part of the
23
TYCO INTERNATIONAL PLC
NOTES TO UNAUDITED CONSOLIDATED FINANCIAL STATEMENTS (Continued)
restructuring, subsidiaries in the structure assumed certain liabilities related to historic Grinnell, Scott and Figgie operations, including all historical Grinnell asbestos liabilities, and such subsidiaries purchased additional insurance by, through or from a wholly-owned subsidiary in the structure in order to supplement and enhance existing insurance assets.
The Company consolidates the qualified settlement fund and related entities that were established for the purpose of managing and resolving the liabilities described above. Although the entities in the dedicated structure serve the specific purpose of managing certain liabilities, each entity in the structure is a wholly-owned indirect subsidiary of the Company, and therefore is required to be consolidated under GAAP.
As of December 25, 2015, the Company has determined that there were approximately 3,100 claims pending against its subsidiaries, primarily Grinnell. This amount reflects the Company's current estimate of the number of viable claims made against Grinnell and includes adjustments for claims that are not actively being prosecuted, identify incorrect defendants, are duplicative of other actions or for which the Company is indemnified by third parties. Yarway Corporation is no longer a subsidiary of the Company and, as of August 2015, is no longer consolidated. Consequently, any claims pending against the Yarway Corporation are excluded from the claims pending above.
As of December 25, 2015, the Company's estimated asbestos related net liability recorded within the Company's Consolidated Balance Sheet is $27 million. The net liability within the Consolidated Balance Sheet is comprised of a liability for pending and future claims and related defense costs of $508 million, of which $19 million is recorded in Accrued and other current liabilities, and $489 million is recorded in Other liabilities. The Company also maintains separate cash, investment and other assets within the Consolidated Balance Sheet of $481 million, of which $44 million is recorded in Prepaid expenses and other current assets, and $437 million is recorded in Other assets. Assets include $6 million of cash and $267 million of investments, which have all been designated as restricted. As of September 25, 2015, the Company's estimated net liability recorded within the Company's Consolidated Balance Sheet was $28 million. The net liability was comprised of a liability for pending and future claims and related defense costs of $515 million, of which $23 million was recorded in Accrued and other current liabilities, and $492 million was recorded in Other liabilities. The Company also maintained separate cash, investment and other assets within the Consolidated Balance Sheet of $487 million, of which $38 million was recorded in Prepaid expenses and other current assets, and $449 million was recorded in Other assets. Assets included $11 million of cash and $263 million of investments, which were all designated as restricted.
The Company periodically assesses the sufficiency of its estimated liability for pending and future asbestos claims and defense costs. On a periodic basis, the Company, through the dedicated structure referred to above, evaluates actual experience regarding asbestos claims filed, settled and dismissed, amounts paid in settlements, and the recoverability of its insurance assets. If and when data from actual experience demonstrate a significant unfavorable discernible trend, the Company performs a valuation of its asbestos related liabilities and corresponding insurance assets including a comprehensive review of the underlying assumptions. In addition, the Company evaluates its ability to reasonably estimate claim activity beyond its current look-forward period (through 2056) in order to assess whether such period continues to be appropriate. In addition to claims and litigation experience, the Company considers additional qualitative and quantitative factors such as changes in legislation, the legal environment, the Company’s strategy in managing claims and obtaining insurance, including its defense strategy, and health related trends in the overall population of individuals potentially exposed to asbestos. The Company evaluates all of these factors and determines whether a change in the estimate of its liability for pending and future claims and defense costs or insurance assets is warranted.
The amounts recorded by the Company for asbestos-related liabilities and insurance-related assets are based on the Company's strategies for resolving its asbestos claims, currently available information, and a number of estimates and assumptions. Key variables and assumptions include the number and type of new claims that are filed each year, the average cost of resolution of claims, the identity of defendants, the resolution of coverage issues with insurance carriers, amount of insurance, and the solvency risk with respect to the Company's insurance carriers. Many of these factors are closely linked, such that a change in one variable or assumption will impact one or more of the others, and no single variable or assumption predominately influences the determination of the Company's asbestos-related liabilities and insurance-related assets. Furthermore, predictions with respect to these variables are subject to greater uncertainty in the later portion of the projection period. Other factors that may affect the Company's liability and cash payments for asbestos-related matters include uncertainties surrounding the litigation process from jurisdiction to jurisdiction and from case to case, reforms of state or federal tort legislation and the applicability of insurance policies among subsidiaries. As a result, actual liabilities or insurance recoveries could be significantly higher or lower than those recorded if assumptions used in the Company's calculations vary significantly from actual results.
24
TYCO INTERNATIONAL PLC
NOTES TO UNAUDITED CONSOLIDATED FINANCIAL STATEMENTS (Continued)
Yarway
As previously disclosed, on August 19, 2015, the Chapter 11 bankruptcy plan of Yarway Corporation, a former indirect wholly-owned subsidiary of the Company became effective and the Company contributed approximately $325 million in cash to the Yarway Trust and each of the Company Protected Parties (as such term is defined in the plan) received the benefit of a release from Yarway and an injunction under section 524(g) of the Bankruptcy Code permanently enjoining the assertion of Yarway asbestos claims against those parties. As a result of the effectiveness of the Chapter 11 plan, ownership of the Yarway Corporation was transferred to the Yarway Trust and it was deconsolidated from the Company. Upon deconsolidation, the Company recorded a $4 million loss, which is included in Selling, general and administrative expenses within the Company's Consolidated Statement of Operations during the year ended September 25, 2015.
Tax Matters
Tyco and its subsidiaries' income tax returns are examined periodically by various tax authorities. In connection with these examinations, tax authorities, including the IRS, have raised issues and proposed tax adjustments, in particular with respect to years preceding the 2007 Separation. The issues and proposed adjustments related to such years are generally subject to the sharing provisions of the 2007 Tax Sharing Agreement and Tyco's liabilities under the 2007 Tax Sharing Agreement are further subject to the sharing provisions in the 2012 Tax Sharing Agreement. Tyco has previously disclosed that in connection with U.S. federal tax audits, the IRS raised a number of issues and proposed tax adjustments for periods beginning with the 1997 tax year. Although Tyco resolved substantially all of the issues and adjustments proposed by the IRS for tax years through 2007, it was not able to resolve matters related to the treatment of certain intercompany debt transactions during the period. As a result, on June 20, 2013, Tyco received Notices of Deficiency from the IRS asserting that several of Tyco's former U.S. subsidiaries owe additional taxes of $883.3 million plus penalties of $154 million based on audits of the 1997 through 2000 tax years of Tyco and its subsidiaries as they existed at that time. In addition, Tyco received Final Partnership Administrative Adjustments for certain U.S. partnerships owned by former U.S. subsidiaries with respect to which an additional tax deficiency of approximately $30 million has been asserted. These amounts excluded interest and did not reflect the roll-forward impact on subsequent audit periods.
On January 15, 2016, Tyco entered into Stipulations of Settled Issues with the IRS intended to resolve all disputes related to the intercompany debt issues described above for the 1997 - 2000 audit cycle currently before the U.S. Tax Court. The Stipulations of Settled Issues are contingent upon the IRS Appeals Division applying the same settlement to all intercompany debt issues on appeal for subsequent audit cycles (2001 - 2007) and, if applicable, review by the United States Congress Joint Committee on Taxation.
If finalized, the tentative resolution would cover all aspects of the controversy before the U.S. Tax Court described above and before the Appeals Division of the IRS, and would result in a total cash payment to the IRS in the range of $475 million to $525 million, which includes all interest and penalties. This payment would be subject to the sharing formula in each Tax Sharing Agreement, and would be shared among Tyco, Covidien and TE Connectivity 27%, 42% and 31%, respectively, with neither ADT nor Pentair being responsible for any payment related to this amount.
Assuming the tentative resolution is finalized, Tyco does not expect to recognize any additional charges related to the resolution, as it had previously recorded sufficient reserves with respect to this controversy and its obligations under the Tax Sharing Agreements. Payment is expected to be made to the IRS, and among Tyco, Covidien and TE Connectivity, within the next six months. See Note 5.
Other Matters
As previously disclosed, SimplexGrinnell LP (“SG”), a subsidiary of the Company in the North America Integrated Solutions & Services segment, has been named as a defendant in lawsuits in several jurisdictions seeking damages for SG’s alleged failure to pay prevailing wages and for other pay-related claims. Through the first quarter of fiscal 2015, the Company had recorded a total of approximately $17 million in charges related to these lawsuits, which was recorded in the Cost of services within the Consolidated Statement of Operations. During the quarter ended March 27, 2015, the Company agreed in principle to settle all outstanding lawsuits for a total of approximately $14 million.
In addition to the foregoing, the Company is subject to claims and suits, including from time to time, contractual disputes and product and general liability claims, incidental to present and former operations, acquisitions and dispositions. With respect to many of these claims, the Company either self-insures or maintains insurance through third-parties, with varying deductibles. While the ultimate outcome of these matters cannot be predicted with certainty, the Company believes that the resolution of any
25
TYCO INTERNATIONAL PLC
NOTES TO UNAUDITED CONSOLIDATED FINANCIAL STATEMENTS (Continued)
such proceedings, whether the underlying claims are covered by insurance or not, will not have a material adverse effect on the Company's financial condition, results of operations or cash flows beyond amounts recorded for such matters.
11. Retirement Plans
Defined Benefit Pension Plans—The Company sponsors a number of pension plans. The following disclosures exclude the impact of plans which are immaterial individually and in the aggregate. The net periodic benefit cost for the Company's material U.S. and non-U.S. defined benefit pension plans is as follows ($ in millions):
U.S. Plans | |||||||
For the Quarters Ended | |||||||
December 25, 2015 | December 26, 2014 | ||||||
Service cost | $ | 2 | $ | 2 | |||
Interest cost | 8 | 9 | |||||
Expected return on plan assets | (12 | ) | (14 | ) | |||
Amortization of net actuarial loss | 3 | 2 | |||||
Net periodic (benefit) cost | $ | 1 | $ | (1 | ) | ||
Non-U.S. Plans | |||||||
For the Quarters Ended | |||||||
December 25, 2015 | December 26, 2014 | ||||||
Service cost | $ | 2 | $ | 2 | |||
Interest cost | 11 | 13 | |||||
Expected return on plan assets | (18 | ) | (20 | ) | |||
Amortization of net actuarial loss | 4 | 4 | |||||
Net periodic (benefit) cost | $ | (1 | ) | $ | (1 | ) | |
Effective September 26, 2015, the Company changed the approach used to measure service and interest costs for pension benefits. For fiscal 2015, the Company measured service and interest costs utilizing a single weighted-average discount rate derived from the yield curve used to measure the Company’s plan obligations. For fiscal 2016, the Company elected to measure service and interest costs by applying the specific spot rates along the yield curve over the projected cash flow period. The Company believes the new approach provides a more precise measurement of service and interest costs by improving the correlation between projected benefit cash flows to the corresponding spot rates on the yield curves. Based on current economic conditions, the Company estimates its periodic pension costs for both its U.S. and non-U.S. plans will be reduced by approximately $6 million each in fiscal 2016 as a result of the change. The Company has accounted for this change as a change in accounting estimate and, accordingly, has accounted for it on a prospective basis.
The estimated net actuarial loss for U.S. and non-U.S. pension benefit plans that will be amortized from accumulated other comprehensive loss into net periodic benefit cost over the current fiscal year is expected to be $13 million and $15 million, respectively. Amortization of net periodic benefit cost from Accumulated other comprehensive loss for the Company's pension benefit plans is recorded in Selling, general and administrative expenses, Cost of product sales, or Cost of services within the Consolidated Statements of Operations, depending on the employee job classification.
The Company's funding policy is to make contributions in accordance with the laws and customs of the various countries in which it operates and to make discretionary voluntary contributions from time to time. The Company anticipates that it will contribute at least the minimum required to its pension plans in fiscal year 2016 of $3 million for U.S. plans and $25 million for non-U.S. plans.
During the quarter ended December 25, 2015, the Company made required contributions of nil to its U.S. pension plans and $11 million to its non-U.S. pension plans. The Company did not make any voluntary contributions to its U.S. and non-U.S. plans during the quarter ended December 25, 2015.
Postretirement Benefit Plans—Net periodic postretirement benefit cost was not material for both periods.
26
TYCO INTERNATIONAL PLC
NOTES TO UNAUDITED CONSOLIDATED FINANCIAL STATEMENTS (Continued)
12. Equity and Comprehensive Income
Authorized Share Capital
As of December 25, 2015 and September 25, 2015, the Company's authorized share capital amounted to $11,000,000 and €40,000, divided into 1,000,000,000 ordinary shares with a par value of $0.01 per share, 100,000,000 preferred shares with a par value of $0.01 per share and 40,000 ordinary A shares with a par value of €1.00 per share. The authorized share capital includes 40,000 ordinary A shares with a par value of €1.00 per share in order to satisfy statutory requirements for the incorporation of all Irish public limited companies. Tyco Ireland may issue shares subject to the maximum prescribed by its authorized share capital contained in its memorandum of association. In connection with the re-domicile to Ireland, the Company canceled all the outstanding treasury shares, including shares held by subsidiaries, with an offsetting reduction in Additional paid in capital.
Issued Share Capital
The Company issued one authorized ordinary share in exchange for each ordinary share of Tyco Switzerland to the former shareholders of Tyco Switzerland. All ordinary shares issued at the effective time of the re-domicile were issued as fully paid-up and non-assessable.
Dividends
The authority to declare and pay dividends is vested in the Board of Directors. The timing, declaration and payment of future dividends to holders of the Company's ordinary shares will be determined by the Company's Board of Directors and will depend upon many factors, including the Company's financial condition and results of operations, the capital requirements of the Company's businesses, industry practice and any other relevant factors.
Under Irish law, dividends may only be paid (and share repurchases and redemptions must generally be funded) out of “distributable reserves.” The creation of distributable reserves was accomplished by way of a capital reduction, which the Irish High Court approved on December 18, 2014.
On December 8, 2015, the Company declared a quarterly dividend of $0.205 per share, payable on February 17, 2016 to shareholders of record on January 22, 2016. On September 3, 2015, the Company declared a quarterly dividend of $0.205 per share, paid on November 12, 2015 to shareholders of record on October 23, 2015.
On March 5, 2014, the Company's shareholders approved an annual cash dividend of $0.72 per ordinary share. Payment of the dividend was made in four quarterly installments of $0.18 from May 2014 through February 2015. As a result, during the quarter ended March 28, 2014, the Company recorded an accrued dividend of $332 million within Accrued and other current liabilities and a corresponding reduction to Contributed surplus within the Company's Consolidated Balance Sheet.
Share Repurchase Program
The Company's Board of Directors approved $1.75 billion and $1 billion share repurchase programs in March 2014 and September 2014, respectively. No shares were repurchased during the quarter ended December 25, 2015. During the quarter ended December 26, 2014, the Company repurchased a total of approximately 10 million shares for approximately $417 million which completed the $1.75 billion share repurchase program. As of December 25, 2015, a total of approximately $1 billion in share repurchase authority remained outstanding.
Comprehensive Income (Loss)
27
TYCO INTERNATIONAL PLC
NOTES TO UNAUDITED CONSOLIDATED FINANCIAL STATEMENTS (Continued)
Comprehensive income (loss) is comprised of the following ($ in millions):
For the Quarters Ended | |||||||
December 25, 2015 | December 26, 2014 | ||||||
Net income | $ | 76 | $ | 161 | |||
Foreign currency translation(1) | (43 | ) | (198 | ) | |||
Amortization of net actuarial losses (2) | 7 | 6 | |||||
Income tax expense | (2 | ) | (1 | ) | |||
Defined benefit and post retirement plans, net of tax | 5 | 5 | |||||
Unrealized gain on marketable securities and derivative instruments (3) | 2 | — | |||||
Income tax expense | (1 | ) | — | ||||
Unrealized gain on marketable securities and derivative instruments, net of tax | 1 | — | |||||
Total other comprehensive loss, net of tax | (37 | ) | (193 | ) | |||
Comprehensive income (loss) | 39 | (32 | ) | ||||
Less: comprehensive loss attributable to noncontrolling interests | — | (1 | ) | ||||
Comprehensive income (loss) attributable to Tyco ordinary shareholders | $ | 39 | $ | (31 | ) | ||
(1) Includes a $13 million gain related to the net investment hedge for the quarter ended December 25, 2015. The Company did not hold this net investment hedge during the quarter ended December 26, 2014. See Note 9.
(2) Reclassified to net periodic (benefit) cost. See Note 11.
(3) When sold, the gain (loss) will be reclassified to realized gain (loss) on marketable securities and derivative instruments and be recorded in Other (expense) income, net within the Consolidated Statements of Operations.
A summary of the changes in each component of Accumulated other comprehensive loss, net of tax, for the three months ended December 25, 2015 and December 26, 2014 are as follows ($ in millions):
Currency Translation Adjustments | Unrealized Gain (Loss) on Marketable Securities and Derivative Instruments | Retirement Plans | Accumulated Other Comprehensive Loss | ||||||||||||
Balance as of September 25, 2015 | $ | (1,233 | ) | $ | (9 | ) | $ | (599 | ) | $ | (1,841 | ) | |||
Other comprehensive (loss) income, net of tax | (43 | ) | 1 | — | (42 | ) | |||||||||
Amounts reclassified from accumulated other comprehensive income, net of tax | — | — | 5 | 5 | |||||||||||
Net current period other comprehensive (loss) income | $ | (43 | ) | $ | 1 | $ | 5 | $ | (37 | ) | |||||
Balance as of December 25, 2015 | $ | (1,276 | ) | $ | (8 | ) | $ | (594 | ) | $ | (1,878 | ) | |||
Currency Translation Adjustments | Retirement Plans | Accumulated Other Comprehensive Loss | |||||||||
Balance as of September 26, 2014 | $ | (693 | ) | $ | (532 | ) | $ | (1,225 | ) | ||
Other comprehensive (loss) income, net of tax | (198 | ) | — | (198 | ) | ||||||
Amounts reclassified from accumulated other comprehensive income, net of tax | — | 5 | 5 | ||||||||
Net current period other comprehensive (loss) income | $ | (198 | ) | $ | 5 | $ | (193 | ) | |||
Balance as of December 26, 2014 | $ | (891 | ) | $ | (527 | ) | $ | (1,418 | ) | ||
28
TYCO INTERNATIONAL PLC
NOTES TO UNAUDITED CONSOLIDATED FINANCIAL STATEMENTS (Continued)
13. Share Plans
During the quarter ended December 25, 2015, the Company issued its annual share-based compensation grants. The total number of awards issued was approximately 3.7 million, of which 2.6 million were stock options, 0.5 million were restricted unit awards and 0.6 million were performance share unit awards. The options and restricted stock units vest in equal annual installments over a period of 4 years, and the performance share unit awards, which are restricted share awards that vest depending upon attainment of various levels of performance, generally vest in their entirety 3 years from the grant date, and are determined by the Compensation and Human Resources Committee of the Board. The weighted-average grant-date fair value of the stock options, restricted unit awards and performance share unit awards was $7.18, $36.08 and $37.16, respectively. The weighted-average assumptions used in the Black-Scholes option pricing model included an expected stock price volatility of 26%, a risk free interest rate of 1.60%, an expected annual dividend per share of $0.82 and an expected option life of 5.48 years.
During the quarter ended December 26, 2014, the Company issued its annual share-based compensation grants. The total number of awards issued was approximately 2.4 million, of which 1.5 million were stock options, 0.4 million were restricted unit awards and 0.5 million were performance share unit awards. The weighted-average grant-date fair value of the stock options, restricted unit awards and performance share unit awards was $11.77, $43.38 and $42.95, respectively. The weighted-average assumptions used in the Black-Scholes option pricing model included an expected stock price volatility of 32%, a risk free interest rate of 1.83%, an expected annual dividend per share of $0.72 and an expected option life of 5.57 years.
The fair value of restricted stock units is determined based on the closing market price of the Company’s shares on the grant date. The fair value of performance share units is determined based on the Monte Carlo valuation model. The compensation expense recognized for all restricted share awards is net of estimated forfeitures.
14. Consolidated Segment Data
Effective for the first quarter of fiscal 2016, the Company has elected to present operating income by segment, as well as Corporate and Other, excluding restructuring and repositioning charges, net. Restructuring and repositioning charges, net, are shown in aggregate. This measure of segment operating income (loss) is consistent with how management reviews the businesses, makes investing and resource decisions and assesses operating performance. Comparative periods presented have been reclassified to conform with the current period presentation.
Selected information by segment is presented in the following tables ($ in millions):
For the Quarters Ended | |||||||
December 25, 2015 | December 26, 2014 | ||||||
Net revenue(1): | |||||||
NA Integrated Solutions & Services | $ | 953 | $ | 951 | |||
ROW Integrated Solutions & Services | 812 | 916 | |||||
Global Products | 611 | 611 | |||||
$ | 2,376 | $ | 2,478 | ||||
(1) Net revenue by operating segment excludes intercompany transactions.
29
TYCO INTERNATIONAL PLC
NOTES TO UNAUDITED CONSOLIDATED FINANCIAL STATEMENTS (Continued)
For the Quarters Ended | |||||||
December 25, 2015 | December 26, 2014 | ||||||
Operating income: | |||||||
NA Integrated Solutions & Services | $ | 132 | $ | 129 | |||
ROW Integrated Solutions & Services | 133 | 89 | |||||
Global Products | 97 | 105 | |||||
Segment operating income | 362 | 323 | |||||
Corporate and Other | (51 | ) | (49 | ) | |||
Restructuring and repositioning charges, net | (18 | ) | (75 | ) | |||
Operating income | $ | 293 | $ | 199 | |||
15. Inventory
Inventories consisted of the following ($ in millions):
As of | |||||||
December 25, 2015 | September 25, 2015 | ||||||
Purchased materials and manufactured parts | $ | 172 | $ | 165 | |||
Work in process | 76 | 84 | |||||
Finished goods | 399 | 375 | |||||
Inventories | $ | 647 | $ | 624 | |||
Inventories are recorded at the lower of cost (primarily first-in, first-out) or market value.
16. Property, Plant and Equipment
Property, plant and equipment consisted of the following ($ in millions):
As of | |||||||
December 25, 2015 | September 25, 2015 | ||||||
Land | $ | 33 | $ | 33 | |||
Buildings | 413 | 405 | |||||
Subscriber systems | 1,855 | 1,933 | |||||
Machinery and equipment | 1,263 | 1,252 | |||||
Construction in progress | 87 | 81 | |||||
Accumulated depreciation | (2,484 | ) | (2,527 | ) | |||
Property, plant and equipment, net | $ | 1,167 | $ | 1,177 | |||
17. Guarantees
Certain of the Company's subsidiaries at the business segment level have guaranteed the performance of third-parties and provided financial guarantees for uncompleted work and financial commitments. The terms of these guarantees vary with end dates ranging from the current fiscal year through the completion of such transactions and would typically be triggered in the event of nonperformance. Performance under the guarantees, if required, would not have a material effect on the Company's financial position, results of operations or cash flows.
There are certain guarantees or indemnifications extended among Tyco, Covidien, TE Connectivity, ADT and Pentair in accordance with the terms of the 2007 and 2012 Separation and Distribution Agreements and Tax Sharing Agreements. These guarantees primarily relate to certain contingent tax liabilities included in the Tax Sharing Agreements. See Note 5.
30
TYCO INTERNATIONAL PLC
NOTES TO UNAUDITED CONSOLIDATED FINANCIAL STATEMENTS (Continued)
In addition, Tyco historically provided support in the form of financial and/or performance guarantees to various Covidien, TE Connectivity, ADT and Tyco Flow Control operating entities. In connection with both the 2012 and 2007 Separations, the Company worked with the guarantee counterparties to cancel or assign these guarantees to Covidien, TE Connectivity, ADT or Pentair, as appropriate. To the extent these guarantees were not assigned prior to the Separation dates, Tyco remained as the guarantor, but was typically indemnified by the former subsidiary. The Company's obligations related to the 2012 Separation were $3 million, which were included in Other liabilities within the Company's Consolidated Balance Sheets as of both December 25, 2015 and September 25, 2015, with an offset to Tyco's shareholders' equity on the 2012 Separation date. The Company's obligations related to the 2007 Separation were $3 million, which were included in Other liabilities within the Company's Consolidated Balance Sheets as of both December 25, 2015 and September 25, 2015, with an offset to Tyco's shareholders' equity on the 2007 Separation date.
In disposing of assets or businesses, the Company or its subsidiaries often provides representations, warranties and/or indemnities to cover various risks including, for example, unknown damage to the assets, environmental risks involved in the sale of real estate, liability to investigate and remediate environmental contamination at waste disposal sites and manufacturing facilities and unidentified tax liabilities and legal fees related to periods prior to disposition. The Company has no reason to believe that these contingencies, if realized, would have a material adverse effect on the Company's financial position, results of operations or cash flows. The Company has recorded liabilities for known indemnifications included as part of environmental liabilities. See Note 10 for further information on environmental matters.
In the normal course of business, the Company is liable for contract completion and product performance. In the opinion of management, such obligations will not significantly affect the Company's financial position, results of operations or cash flows.
The changes in the carrying amount of the Company's warranty accrual from September 25, 2015 to December 25, 2015 were as follows ($ millions):
Balance as of September 25, 2015 | $ | 29 | |
Warranties issued | 3 | ||
Changes in estimates | (1 | ) | |
Settlements | (2 | ) | |
Balance as of December 25, 2015 | $ | 29 | |
Warranty accruals for businesses that are included in Liabilities held for sale within the Consolidated Balance Sheets are excluded from the table above. See Note 2.
18. Guarantor Financial Statements
TIFSA, a 100% owned subsidiary of the Company, has public debt securities outstanding which are fully and unconditionally guaranteed by Tyco and by Tyco Fire & Security Finance SCA ("TIFSCA"), a wholly owned subsidiary of Tyco and parent company of TIFSA. The following tables present condensed consolidating financial information for Tyco, TIFSCA, TIFSA and all other subsidiaries. Condensed financial information for Tyco, TIFSCA and TIFSA on a stand-alone basis is presented using the equity method of accounting for subsidiaries.
31
TYCO INTERNATIONAL PLC
NOTES TO UNAUDITED CONSOLIDATED FINANCIAL STATEMENTS (Continued)
CONDENSED CONSOLIDATING STATEMENT OF OPERATIONS
For the Quarter Ended December 25, 2015
($ in millions)
Tyco International plc | Tyco Fire & Security Finance SCA | Tyco International Finance S.A. | Other Subsidiaries | Consolidating Adjustments | Total | ||||||||||||||||||
Net revenue | $ | — | $ | — | $ | — | $ | 2,376 | $ | — | $ | 2,376 | |||||||||||
Cost of product sales | — | — | — | 962 | — | 962 | |||||||||||||||||
Cost of services | — | — | — | 536 | — | 536 | |||||||||||||||||
Selling, general and administrative expenses | 2 | — | — | 571 | — | 573 | |||||||||||||||||
Restructuring and asset impairment charges, net | — | — | — | 12 | — | 12 | |||||||||||||||||
Operating (loss) income | (2 | ) | — | — | 295 | — | 293 | ||||||||||||||||
Interest income | — | — | — | 4 | — | 4 | |||||||||||||||||
Interest expense | — | — | (23 | ) | (1 | ) | — | (24 | ) | ||||||||||||||
Other expense, net | — | — | (165 | ) | — | — | (165 | ) | |||||||||||||||
Equity in net income of subsidiaries | 18 | 16 | 179 | — | (213 | ) | — | ||||||||||||||||
Intercompany interest and fees | 60 | — | 25 | (85 | ) | — | — | ||||||||||||||||
Income from continuing operations before income taxes | 76 | 16 | 16 | 213 | (213 | ) | 108 | ||||||||||||||||
Income tax expense | — | — | — | (36 | ) | — | (36 | ) | |||||||||||||||
Income from continuing operations | 76 | 16 | 16 | 177 | (213 | ) | 72 | ||||||||||||||||
Income from discontinued operations, net of income taxes | — | — | — | 4 | — | 4 | |||||||||||||||||
Net income | 76 | 16 | 16 | 181 | (213 | ) | 76 | ||||||||||||||||
Net income attributable to Tyco ordinary shareholders | $ | 76 | $ | 16 | $ | 16 | $ | 181 | $ | (213 | ) | $ | 76 | ||||||||||
32
TYCO INTERNATIONAL PLC
NOTES TO UNAUDITED CONSOLIDATED FINANCIAL STATEMENTS (Continued)
CONDENSED CONSOLIDATING STATEMENT OF COMPREHENSIVE INCOME
For the Quarter Ended December 25, 2015
($ in millions)
Tyco International plc | Tyco Fire & Security Finance SCA | Tyco International Finance S.A. | Other Subsidiaries | Consolidating Adjustments | Total | ||||||||||||||||||
Net income | $ | 76 | $ | 16 | $ | 16 | $ | 181 | $ | (213 | ) | $ | 76 | ||||||||||
Other comprehensive (loss) income, net of tax | |||||||||||||||||||||||
Foreign currency translation | (43 | ) | — | 14 | (57 | ) | 43 | (43 | ) | ||||||||||||||
Defined benefit and post retirement plans | 5 | — | — | 5 | (5 | ) | 5 | ||||||||||||||||
Unrealized gain on marketable securities and derivative instruments, net of tax | 1 | — | — | 1 | (1 | ) | 1 | ||||||||||||||||
Total other comprehensive (loss) income, net of tax | (37 | ) | — | 14 | (51 | ) | 37 | (37 | ) | ||||||||||||||
Comprehensive income | 39 | 16 | 30 | 130 | (176 | ) | 39 | ||||||||||||||||
Less: comprehensive income attributable to noncontrolling interests | — | — | — | — | — | — | |||||||||||||||||
Comprehensive income attributable to Tyco ordinary shareholders | $ | 39 | $ | 16 | $ | 30 | $ | 130 | $ | (176 | ) | $ | 39 | ||||||||||
33
TYCO INTERNATIONAL PLC
NOTES TO UNAUDITED CONSOLIDATED FINANCIAL STATEMENTS (Continued)
CONDENSED CONSOLIDATING STATEMENT OF OPERATIONS
For the Quarter Ended December 26, 2014
($ in millions)
Tyco International plc | Tyco Fire & Security Finance SCA | Tyco International Finance S.A. | Other Subsidiaries | Consolidating Adjustments | Total | ||||||||||||||||||
Net revenue | $ | — | $ | — | $ | — | $ | 2,478 | $ | — | $ | 2,478 | |||||||||||
Cost of product sales | — | — | — | 1,022 | — | 1,022 | |||||||||||||||||
Cost of services | — | — | — | 547 | — | 547 | |||||||||||||||||
Selling, general and administrative expenses | 3 | — | 1 | 648 | — | 652 | |||||||||||||||||
Restructuring and asset impairment charges, net | — | — | — | 58 | — | 58 | |||||||||||||||||
Operating (loss) income | (3 | ) | — | (1 | ) | 203 | — | 199 | |||||||||||||||
Interest income | — | — | — | 3 | — | 3 | |||||||||||||||||
Interest expense | — | — | (24 | ) | — | — | (24 | ) | |||||||||||||||
Other income, net | — | — | 4 | — | — | 4 | |||||||||||||||||
Equity in net income of subsidiaries | 143 | 133 | 127 | — | (403 | ) | — | ||||||||||||||||
Intercompany interest and fees | 22 | — | 27 | (49 | ) | — | — | ||||||||||||||||
Income from continuing operations before income taxes | 162 | 133 | 133 | 157 | (403 | ) | 182 | ||||||||||||||||
Income tax expense | — | — | — | (19 | ) | — | (19 | ) | |||||||||||||||
Income from continuing operations | 162 | 133 | 133 | 138 | (403 | ) | 163 | ||||||||||||||||
Loss from discontinued operations, net of income taxes | — | — | — | (2 | ) | — | (2 | ) | |||||||||||||||
Net income | 162 | 133 | 133 | 136 | (403 | ) | 161 | ||||||||||||||||
Less: noncontrolling interest in subsidiaries net loss | — | — | — | (1 | ) | — | (1 | ) | |||||||||||||||
Net income attributable to Tyco ordinary shareholders | $ | 162 | $ | 133 | $ | 133 | $ | 137 | $ | (403 | ) | $ | 162 | ||||||||||
34
TYCO INTERNATIONAL PLC
NOTES TO UNAUDITED CONSOLIDATED FINANCIAL STATEMENTS (Continued)
CONDENSED CONSOLIDATING STATEMENT OF COMPREHENSIVE INCOME (LOSS)
For the Quarter Ended December 26, 2014
($ in millions)
Tyco International plc | Tyco Fire & Security Finance SCA | Tyco International Finance S.A. | Other Subsidiaries | Consolidating Adjustments | Total | ||||||||||||||||||
Net income | $ | 162 | $ | 133 | $ | 133 | $ | 136 | $ | (403 | ) | $ | 161 | ||||||||||
Other comprehensive (loss) income, net of tax | |||||||||||||||||||||||
Foreign currency translation | (198 | ) | — | (1 | ) | (197 | ) | 198 | (198 | ) | |||||||||||||
Defined benefit and post retirement plans | 5 | — | — | 5 | (5 | ) | 5 | ||||||||||||||||
Total other comprehensive loss, net of tax | (193 | ) | — | (1 | ) | (192 | ) | 193 | (193 | ) | |||||||||||||
Comprehensive (loss) income | (31 | ) | 133 | 132 | (56 | ) | (210 | ) | (32 | ) | |||||||||||||
Less: comprehensive loss attributable to noncontrolling interests | — | — | — | (1 | ) | — | (1 | ) | |||||||||||||||
Comprehensive (loss) income attributable to Tyco ordinary shareholders | $ | (31 | ) | $ | 133 | $ | 132 | $ | (55 | ) | $ | (210 | ) | $ | (31 | ) | |||||||
35
TYCO INTERNATIONAL PLC
NOTES TO UNAUDITED CONSOLIDATED FINANCIAL STATEMENTS (Continued)
CONDENSED CONSOLIDATING BALANCE SHEET
As of December 25, 2015
($ in millions)
Tyco International plc | Tyco Fire & Security Finance SCA | Tyco International Finance S.A. | Other Subsidiaries | Consolidating Adjustments | Total | ||||||||||||||||||
Assets | |||||||||||||||||||||||
Current Assets: | |||||||||||||||||||||||
Cash and cash equivalents | $ | — | $ | — | $ | — | $ | 301 | $ | — | $ | 301 | |||||||||||
Accounts receivable, net | — | — | — | 1,719 | — | 1,719 | |||||||||||||||||
Inventories | — | — | — | 647 | — | 647 | |||||||||||||||||
Intercompany receivables | 15 | — | 451 | 7,610 | (8,076 | ) | — | ||||||||||||||||
Prepaid expenses and other current assets | — | — | 67 | 786 | — | 853 | |||||||||||||||||
Deferred income taxes | — | — | — | 62 | — | 62 | |||||||||||||||||
Assets held for sale | — | — | — | 83 | — | 83 | |||||||||||||||||
Total current assets | 15 | — | 518 | 11,208 | (8,076 | ) | 3,665 | ||||||||||||||||
Property, plant and equipment, net | — | — | — | 1,167 | — | 1,167 | |||||||||||||||||
Goodwill | — | — | — | 4,365 | — | 4,365 | |||||||||||||||||
Intangible assets, net | — | — | — | 927 | — | 927 | |||||||||||||||||
Investment in subsidiaries | 10,881 | 11,142 | 16,146 | — | (38,169 | ) | — | ||||||||||||||||
Intercompany loans receivable | — | — | 2,942 | 5,086 | (8,028 | ) | — | ||||||||||||||||
Other assets | 1 | — | 41 | 1,265 | — | 1,307 | |||||||||||||||||
Total Assets | $ | 10,897 | $ | 11,142 | $ | 19,647 | $ | 24,018 | $ | (54,273 | ) | $ | 11,431 | ||||||||||
Liabilities and Equity | |||||||||||||||||||||||
Current Liabilities: | |||||||||||||||||||||||
Loans payable and current maturities of long-term debt | $ | — | $ | — | $ | 151 | $ | 1 | $ | — | $ | 152 | |||||||||||
Accounts payable | 1 | — | — | 788 | — | 789 | |||||||||||||||||
Accrued and other current liabilities | 88 | — | 258 | 1,491 | — | 1,837 | |||||||||||||||||
Deferred revenue | — | — | — | 349 | — | 349 | |||||||||||||||||
Intercompany payables | 3,639 | — | 3,974 | 463 | (8,076 | ) | — | ||||||||||||||||
Liabilities held for sale | — | — | — | 84 | — | 84 | |||||||||||||||||
Total current liabilities | 3,728 | — | 4,383 | 3,176 | (8,076 | ) | 3,211 | ||||||||||||||||
Long-term debt | — | — | 2,145 | 1 | — | 2,146 | |||||||||||||||||
Intercompany loans payable | 3,160 | — | 1,926 | 2,942 | (8,028 | ) | — | ||||||||||||||||
Deferred revenue | — | — | — | 292 | — | 292 | |||||||||||||||||
Other liabilities | — | — | 51 | 1,685 | — | 1,736 | |||||||||||||||||
Total Liabilities | 6,888 | — | 8,505 | 8,096 | (16,104 | ) | 7,385 | ||||||||||||||||
Tyco Shareholders' Equity: | |||||||||||||||||||||||
Ordinary shares | 4 | — | — | — | — | 4 | |||||||||||||||||
Ordinary shares held in treasury | (14 | ) | — | — | — | — | (14 | ) | |||||||||||||||
Other shareholders' equity | 4,019 | 11,142 | 11,142 | 15,885 | (38,169 | ) | 4,019 | ||||||||||||||||
Total Tyco Shareholders' Equity | 4,009 | 11,142 | 11,142 | 15,885 | (38,169 | ) | 4,009 | ||||||||||||||||
Nonredeemable noncontrolling interest | — | — | — | 37 | — | 37 | |||||||||||||||||
Total Equity | 4,009 | 11,142 | 11,142 | 15,922 | (38,169 | ) | 4,046 | ||||||||||||||||
Total Liabilities and Equity | $ | 10,897 | $ | 11,142 | $ | 19,647 | $ | 24,018 | $ | (54,273 | ) | $ | 11,431 | ||||||||||
36
TYCO INTERNATIONAL PLC
NOTES TO UNAUDITED CONSOLIDATED FINANCIAL STATEMENTS (Continued)
CONDENSED CONSOLIDATING BALANCE SHEET
As of September 25, 2015
($ in millions)
Tyco International plc | Tyco Fire & Security Finance SCA | Tyco International Finance S.A. | Other Subsidiaries | Consolidating Adjustments | Total | ||||||||||||||||||
Assets | |||||||||||||||||||||||
Current Assets: | |||||||||||||||||||||||
Cash and cash equivalents | $ | — | $ | — | $ | — | $ | 1,401 | $ | — | $ | 1,401 | |||||||||||
Accounts receivable, net | — | — | — | 1,732 | — | 1,732 | |||||||||||||||||
Inventories | — | — | — | 624 | — | 624 | |||||||||||||||||
Intercompany receivables | 15 | — | 332 | 6,508 | (6,855 | ) | — | ||||||||||||||||
Prepaid expenses and other current assets | — | — | 63 | 691 | — | 754 | |||||||||||||||||
Deferred income taxes | — | — | — | 62 | — | 62 | |||||||||||||||||
Assets held for sale | — | — | — | 102 | — | 102 | |||||||||||||||||
Total current assets | 15 | — | 395 | 11,120 | (6,855 | ) | 4,675 | ||||||||||||||||
Property, plant and equipment, net | — | — | — | 1,177 | — | 1,177 | |||||||||||||||||
Goodwill | — | — | — | 4,234 | — | 4,234 | |||||||||||||||||
Intangible assets, net | — | — | — | 863 | — | 863 | |||||||||||||||||
Investment in subsidiaries | 10,885 | 11,148 | 16,001 | — | (38,034 | ) | — | ||||||||||||||||
Intercompany loans receivable | — | — | 2,942 | 5,066 | (8,008 | ) | — | ||||||||||||||||
Other assets | 1 | — | 44 | 1,327 | — | 1,372 | |||||||||||||||||
Total Assets | $ | 10,901 | $ | 11,148 | $ | 19,382 | $ | 23,787 | $ | (52,897 | ) | $ | 12,321 | ||||||||||
Liabilities and Equity | |||||||||||||||||||||||
Current Liabilities: | |||||||||||||||||||||||
Loans payable and current maturities of long-term debt | $ | — | $ | — | $ | 967 | $ | 20 | $ | — | $ | 987 | |||||||||||
Accounts payable | 1 | — | — | 773 | — | 774 | |||||||||||||||||
Accrued and other current liabilities | 88 | — | 61 | 1,512 | — | 1,661 | |||||||||||||||||
Deferred revenue | — | — | — | 380 | — | 380 | |||||||||||||||||
Intercompany payables | 3,616 | — | 2,892 | 347 | (6,855 | ) | — | ||||||||||||||||
Liabilities held for sale | — | — | — | 50 | — | 50 | |||||||||||||||||
Total current liabilities | 3,705 | — | 3,920 | 3,082 | (6,855 | ) | 3,852 | ||||||||||||||||
Long-term debt | — | — | 2,158 | 1 | — | 2,159 | |||||||||||||||||
Intercompany loans payable | 3,155 | — | 1,911 | 2,942 | (8,008 | ) | — | ||||||||||||||||
Deferred revenue | — | — | — | 303 | — | 303 | |||||||||||||||||
Other liabilities | — | — | 245 | 1,686 | — | 1,931 | |||||||||||||||||
Total Liabilities | 6,860 | — | 8,234 | 8,014 | (14,863 | ) | 8,245 | ||||||||||||||||
Tyco Shareholders' Equity: | |||||||||||||||||||||||
Ordinary shares | 4 | — | — | — | — | 4 | |||||||||||||||||
Other shareholders' equity | 4,037 | 11,148 | 11,148 | 15,738 | (38,034 | ) | 4,037 | ||||||||||||||||
Total Tyco Shareholders' Equity | 4,041 | 11,148 | 11,148 | 15,738 | (38,034 | ) | 4,041 | ||||||||||||||||
Nonredeemable noncontrolling interest | — | — | — | 35 | — | 35 | |||||||||||||||||
Total Equity | 4,041 | 11,148 | 11,148 | 15,773 | (38,034 | ) | 4,076 | ||||||||||||||||
Total Liabilities and Equity | $ | 10,901 | $ | 11,148 | $ | 19,382 | $ | 23,787 | $ | (52,897 | ) | $ | 12,321 | ||||||||||
37
TYCO INTERNATIONAL PLC
NOTES TO UNAUDITED CONSOLIDATED FINANCIAL STATEMENTS (Continued)
CONDENSED CONSOLIDATING STATEMENT OF CASH FLOWS
For the Three Months Ended December 25, 2015
($ in millions)
Tyco International plc | Tyco Fire & Security Finance SCA | Tyco International Finance S.A. | Other Subsidiaries | Consolidating Adjustments | Total | ||||||||||||||||||
Cash Flows From Operating Activities: | |||||||||||||||||||||||
Net cash provided by operating activities | $ | 87 | $ | — | $ | 968 | $ | (866 | ) | $ | — | $ | 189 | ||||||||||
Net cash provided by discontinued operating activities | — | — | — | 2 | — | 2 | |||||||||||||||||
Cash Flows From Investing Activities: | |||||||||||||||||||||||
Capital expenditures | — | — | — | (68 | ) | — | (68 | ) | |||||||||||||||
Acquisition of businesses, net of cash acquired | — | — | — | (138 | ) | — | (138 | ) | |||||||||||||||
Acquisition of dealer generated customer accounts and bulk account purchases | — | — | — | (4 | ) | — | (4 | ) | |||||||||||||||
Net decrease in intercompany loans | — | — | 15 | — | (15 | ) | — | ||||||||||||||||
Sales and maturities of investments | — | — | — | 1 | — | 1 | |||||||||||||||||
Purchases of investments | — | — | — | (7 | ) | — | (7 | ) | |||||||||||||||
Decrease in restricted cash | — | — | — | 5 | — | 5 | |||||||||||||||||
Net cash provided by (used in) investing activities | — | — | 15 | (211 | ) | (15 | ) | (211 | ) | ||||||||||||||
Cash Flows From Financing Activities: | |||||||||||||||||||||||
Proceeds from issuance of short-term debt | — | — | 817 | — | — | 817 | |||||||||||||||||
Repayment of short-term debt | — | — | (666 | ) | — | — | (666 | ) | |||||||||||||||
Repayment of current portion of long-term debt | — | — | (1,134 | ) | — | — | (1,134 | ) | |||||||||||||||
Proceeds from exercise of share options | 11 | — | — | — | — | 11 | |||||||||||||||||
Dividends paid | (87 | ) | — | — | — | — | (87 | ) | |||||||||||||||
Net intercompany loan repayments | — | — | — | (15 | ) | 15 | — | ||||||||||||||||
Transfer from discontinued operations | — | — | — | 2 | — | 2 | |||||||||||||||||
Other | (11 | ) | — | — | (1 | ) | — | (12 | ) | ||||||||||||||
Net cash used in financing activities | (87 | ) | — | (983 | ) | (14 | ) | 15 | (1,069 | ) | |||||||||||||
Net cash used in discontinued financing activities | — | — | — | (2 | ) | — | (2 | ) | |||||||||||||||
Effect of currency translation on cash | — | — | — | (9 | ) | — | (9 | ) | |||||||||||||||
Net decrease in cash and cash equivalents | — | — | — | (1,100 | ) | — | (1,100 | ) | |||||||||||||||
Cash and cash equivalents at beginning of period | — | — | — | 1,401 | — | 1,401 | |||||||||||||||||
Cash and cash equivalents at end of period | $ | — | $ | — | $ | — | $ | 301 | $ | — | $ | 301 | |||||||||||
38
TYCO INTERNATIONAL PLC
NOTES TO UNAUDITED CONSOLIDATED FINANCIAL STATEMENTS (Continued)
CONDENSED CONSOLIDATING STATEMENT OF CASH FLOWS
For the Three Months Ended December 26, 2014
($ in millions)
Tyco International plc | Tyco Fire & Security Finance SCA | Tyco International Finance S.A. | Other Subsidiaries | Consolidating Adjustments | Total | ||||||||||||||||||
Cash Flows From Operating Activities: | |||||||||||||||||||||||
Net cash (used in) provided by operating activities | $ | (34 | ) | $ | — | $ | 72 | $ | 57 | $ | — | $ | 95 | ||||||||||
Net cash provided by discontinued operating activities | — | — | — | 1 | — | 1 | |||||||||||||||||
Cash Flows From Investing Activities: | |||||||||||||||||||||||
Capital expenditures | — | — | — | (66 | ) | — | (66 | ) | |||||||||||||||
Proceeds from disposal of assets | — | — | — | 1 | — | 1 | |||||||||||||||||
Acquisition of businesses, net of cash acquired | — | — | — | (152 | ) | — | (152 | ) | |||||||||||||||
Acquisition of dealer generated customer accounts and bulk account purchases | — | — | — | (4 | ) | — | (4 | ) | |||||||||||||||
Net increase in intercompany loans | — | — | (72 | ) | — | 72 | — | ||||||||||||||||
Sales and maturities of investments | — | — | — | 275 | — | 275 | |||||||||||||||||
Purchases of investments | — | — | — | (1 | ) | — | (1 | ) | |||||||||||||||
Increase in restricted cash | — | — | — | (45 | ) | — | (45 | ) | |||||||||||||||
Other | — | — | — | (1 | ) | — | (1 | ) | |||||||||||||||
Net cash (used in) provided by investing activities | — | (72 | ) | 7 | 72 | 7 | |||||||||||||||||
Net cash used in discontinued investing activities | — | — | (15 | ) | — | (15 | ) | ||||||||||||||||
Cash Flows From Financing Activities: | |||||||||||||||||||||||
Proceeds from exercise of share options | 27 | — | — | 6 | — | 33 | |||||||||||||||||
Dividends paid | (75 | ) | — | — | — | — | (75 | ) | |||||||||||||||
Repurchase of ordinary shares by treasury | — | — | — | (417 | ) | — | (417 | ) | |||||||||||||||
Net intercompany loan borrowings (repayments) | 84 | — | — | (12 | ) | (72 | ) | — | |||||||||||||||
Transfer to discontinued operations | — | — | — | (14 | ) | — | (14 | ) | |||||||||||||||
Payment of contingent consideration | — | — | — | (23 | ) | — | (23 | ) | |||||||||||||||
Other | (2 | ) | — | — | (13 | ) | — | (15 | ) | ||||||||||||||
Net cash provided by (used in) financing activities | 34 | — | — | (473 | ) | (72 | ) | (511 | ) | ||||||||||||||
Net cash provided by discontinued financing activities | — | — | — | 14 | — | 14 | |||||||||||||||||
Effect of currency translation on cash | — | — | — | (10 | ) | — | (10 | ) | |||||||||||||||
Net decrease in cash and cash equivalents | — | — | — | (419 | ) | — | (419 | ) | |||||||||||||||
Cash and cash equivalents at beginning of period | — | — | — | 892 | — | 892 | |||||||||||||||||
Cash and cash equivalents at end of period | $ | — | $ | — | $ | — | $ | 473 | $ | — | $ | 473 | |||||||||||
39
TYCO INTERNATIONAL PLC
NOTES TO UNAUDITED CONSOLIDATED FINANCIAL STATEMENTS (Continued)
19. Subsequent Events
On January 24, 2016, Tyco entered into an Agreement and Plan of Merger (the “Merger Agreement”) with Johnson Controls, Inc., a Wisconsin corporation (“JCI”), and certain other parties named therein, including Jagara Merger Sub LLC, a Wisconsin limited liability company and indirect wholly owned subsidiary of Tyco (“Merger Sub”). Pursuant to the Merger Agreement and subject to the terms and conditions set forth therein, Merger Sub will merge with and into JCI (the “Merger”), with JCI surviving the Merger as an indirect wholly owned subsidiary of Tyco. At the effective time of the Merger, Tyco will change its name to “Johnson Controls plc” and will trade under the ticker symbol “JCI.” Following such time, Tyco is referred to below as the “Combined Company.”
As a result of the Merger, each outstanding share of JCI common stock (the “JCI Shares”), other than shares held by JCI, its subsidiaries, Tyco or Merger Sub, will be converted into the right to receive (subject to proration as described below), at the holder’s election, either: (i) one (1) (the “Exchange Ratio”) ordinary share of the Combined Company (the “Share Consideration”); or (ii) an amount in cash equal to $34.88 (the “Cash Consideration”). Elections will be prorated so that JCI shareholders will receive in the aggregate approximately $3.864 billion of cash in the Merger (the “Aggregate Cash Consideration”). Holders that do not make an election will be treated as having elected to receive the Share Consideration. The Exchange Ratio takes into account the effects of a Tyco share consolidation contemplated by the Merger Agreement whereby, immediately prior to the Merger, every issued and unissued ordinary share of Tyco (each, a “Tyco Share”) will be consolidated into 0.955 of a share of Tyco.
The completion of the Merger is subject to certain closing conditions, including, among others, (i) the approval and adoption of the Merger Agreement by holders of two-thirds of the JCI Shares entitled to vote on such matter, (ii) the approval by the Tyco shareholders, at a special meeting of the Tyco shareholders (the “Tyco Special Meeting”) of (A) the issuance of Tyco shares in connection with the Merger, (B) the Tyco share consolidation and (C) the increase in Tyco’s authorized share capital, in each case, by a majority of the votes cast on these matters at the Tyco Special Meeting, and of certain amendments to Tyco’s articles of association, including a change of its name to “Johnson Controls plc,” by at least 75% of the votes cast on these matters at the Tyco Special Meeting (clause (ii), collectively, the “Tyco Shareholder Approvals”), (iii) the expiration or termination of any waiting period applicable to the Merger under the Hart-Scott-Rodino Antitrust Improvements Act of 1976, as amended, the consent of, or filing with, certain specified antitrust authorities, and certain other customary regulatory approvals, and (iv) Tyco’s obtaining the financing required to close the Merger on the terms set forth in the Merger Agreement.
The Merger Agreement contains specified termination rights, including, among others, the right of either party to terminate the Merger Agreement (i) if the requisite shareholder approvals have not been obtained, (ii) if the board of directors of the other party effects a change of recommendation, (iii) if the closing has not occurred by October 24, 2016, subject to extension to January 24, 2017 in certain circumstances, (iv) in response to certain intervening events (subject to the limitations set forth in the Merger Agreement) or (v) if there is a material breach by the other party of any of its representations, warranties or covenants, subject to certain conditions.
Tyco expects to finance the cash consideration for the Merger and fees and expenses related to the transactions with up to $4 billion of debt financing. Citigroup Global Markets, Inc. (“CGMI”) is providing committed bridge financing in connection with the Merger.
In connection with the contemplated debt financing, TIFSA entered into a commitment letter (the “Term Loan Commitment Letter”) with CGMI, dated as of January 24, 2016, pursuant to which CGMI has, subject to the terms and conditions set forth in the Term Loan Commitment Letter, (i) agreed to use commercially reasonable efforts to arrange a syndicate of lenders that will participate in a three-and-a-half year senior unsecured term loan facility (the “Term Facility,” and the provision of such funds as set forth in the Term Loan Commitment Letter, the “Term Financing”) in an aggregate principal amount of up to $4 billion and (ii) committed to provide up to $400 million of the Term Facility. The Term Facility is available to finance all or a portion of the cash consideration for the Merger and to pay fees and expenses related to the transactions. The borrower under the Term Facility will be Tyco International Holding S.a.r.l. (the “Borrower”), a Luxembourg company and a direct wholly-owned subsidiary of TIFSA.
In connection with the contemplated debt financing, TIFSA also entered into a commitment letter (the “Bridge Commitment Letter”) with CGMI, dated as of January 24, 2016, pursuant to which CGMI has committed to provide to the Borrower, subject to the terms and conditions set forth in the Bridge Commitment Letter, the full amount of a 364-day $4 billion senior unsecured bridge loan facility (the “Bridge Facility,” and the provision of such funds as set forth in the Bridge Commitment Letter, the “Bridge Financing”). The Bridge Facility is available to finance all or a portion of the cash consideration for the Merger and to pay fees and expenses related to the transactions to the extent that the Term Facility is not available to finance such amounts.
40
TYCO INTERNATIONAL PLC
NOTES TO UNAUDITED CONSOLIDATED FINANCIAL STATEMENTS (Continued)
The commitments with respect to both the Term Financing and the Bridge Financing are subject to certain customary closing conditions, including, in the case of the Term Financing, the receipt of commitments from other lenders for the remainder of the Term Facility not committed by CGMI, and in the case of both the Term Financing and the Bridge Financing, the consummation of the Merger in accordance with the terms of the Merger Agreement. Both the Term Facility and the Bridge Facility will contain certain representations and warranties, certain affirmative covenants, certain negative covenants, a financial covenant, and events of default, in each case applicable to the Borrower and, where appropriate, its subsidiaries, that are customarily required for similar financings. In addition, the Bridge Financing will be subject to certain customary mandatory commitment reduction and prepayment events triggered by receipt of proceeds of debt and equity issuances and material asset sales, subject to customary exceptions, and the commitments for the Bridge Financing will be automatically reduced by the amount of commitments for the Term Facility, once the Borrower enters into definitive agreements for such term financing.
41
Item 2. Management's Discussion and Analysis of Financial Condition and Results of Operations
Results of Operations
The following discussion and analysis of the Company's financial condition and results of operations should be read together with our unaudited Consolidated Financial Statements and the related notes included elsewhere in this Quarterly Report. This discussion and analysis contains forward-looking statements that involve risks, uncertainties and assumptions. The Company's actual results may differ materially from those anticipated in these forward-looking statements as a result of many factors, including but not limited to those under the headings "Risk Factors" and "Forward-Looking Information".
Organization
The unaudited Consolidated Financial Statements include the consolidated results of Tyco International plc and its subsidiaries (hereinafter collectively referred to as "we", the "Company", "Tyco Ireland" or "Tyco"). The financial statements have been prepared in United States dollars ("USD"), in accordance with accounting principles generally accepted in the United States ("GAAP").
References to 2016 and 2015 are to Tyco's fiscal quarters ending December 25, 2015 and December 26, 2014, respectively, unless otherwise indicated. The Company has a 52- or 53-week fiscal year that ends on the last Friday in September. Fiscal 2016 is a 53-week year as compared with fiscal 2015, which was 52 weeks, with the additional week occurring in the fourth quarter of fiscal 2016. Our results for the three months ended December 25, 2015 and December 26, 2014 both consisted of 13 weeks.
On May 30, 2014, Tyco entered into a Merger Agreement ("Merger Agreement") with Tyco International plc, a newly-formed Irish public limited company and a wholly-owned subsidiary of Tyco ("Tyco Ireland"). Under the Merger Agreement, Tyco merged with and into Tyco Ireland, with Tyco Ireland being the surviving company. This resulted in Tyco Ireland becoming Tyco's publicly-traded parent company and changed the jurisdiction of organization of Tyco from Switzerland to Ireland. Tyco's shareholders received one ordinary share of Tyco Ireland for each ordinary share of Tyco held immediately prior to the re-domicile to Ireland. The re-domicile to Ireland became effective on November 17, 2014.
Upon the effectiveness of the re-domicile, the ordinary shares of Tyco Ireland were listed on the New York Stock Exchange (“NYSE”) under the symbol “TYC,” the same symbol under which the ordinary shares in Tyco were previously listed and traded.
During the fourth quarter of fiscal 2015, the Company changed the name of its North America Installation & Services and Rest of World Installation & Services segments to North America Integrated Solutions & Services and Rest of World Integrated Solutions & Services, respectively. The segment reporting structure is consistent with how management reviews the businesses, makes investing and resource decisions and assesses operating performance. The name changes better reflect the Company's focus on providing technology solutions that encompass a mix of products, services and consultation that is tailored to the unique needs of each customer. No changes were made to the segment structure or underlying financial data that comprise each segment as a result of the name changes and there was no impact to previously disclosed segment information.
We operate and report financial and operating information in the following three segments:
• | North America Integrated Solutions & Services ("NA Integrated Solutions & Services") designs, sells, installs, services and monitors integrated electronic security systems and integrated fire detection and suppression systems for commercial, industrial, retail, small business, institutional and governmental customers in North America. |
• | Rest of World Integrated Solutions & Services ("ROW Integrated Solutions & Services") designs, sells, installs, services and monitors integrated electronic security systems and integrated fire detection and suppression systems for commercial, industrial, retail, residential, small business, institutional and governmental customers in the Rest of World ("ROW") regions. |
• | Global Products designs, manufactures and sells fire protection, security and life safety products, including intrusion security, anti-theft devices, breathing apparatus and access control and video management systems, for commercial, industrial, retail, residential, small business, institutional and governmental customers worldwide, including products installed and serviced by our NA and ROW Integrated Solutions & Services segments. |
We also provide general corporate services to our segments which are reported as a fourth, non-operating segment, Corporate and Other. References to the segment data are to the Company's continuing operations.
42
Certain prior period amounts have been reclassified to conform with the current period presentation.
Effective for the first quarter of fiscal 2016, the Company has elected to present operating income by segment, as well as Corporate and Other, excluding restructuring and repositioning charges, net. Restructuring and repositioning charges, net, are shown in aggregate. This measure of segment operating income (loss) is consistent with how management reviews the businesses, makes investing and resource decisions and assesses operating performance. See Note 14 to the unaudited Consolidated Financial Statements.
During the first quarter of fiscal 2016, the Company approved a plan to divest its Australian fire protection business, included in the ROW Integrated Solutions & Services segment. The Company expects to complete this divestiture during the second quarter of fiscal 2016. The assets and liabilities related to this business were classified as held for sale for all periods presented. Its results of operations are included in continuing operations, as the criteria to be presented as a discontinued operation were not satisfied.
During the second quarter of fiscal 2015, the Company approved a plan to sell a business in its ROW Integrated Solutions & Services segment which the Company expects to complete during the second quarter of fiscal 2016. The assets and liabilities of this business are classified as held for sale, and its results of operations are presented as discontinued operations for all periods presented. See Note 2 to the unaudited Consolidated Financial Statements.
Recent Transactions
On January 24, 2016, Tyco and Johnson Controls, Inc. announced that they have entered into a definitive merger agreement under which Johnson Controls, Inc., a global multi-industrial company, will combine with Tyco. See Note 19 to the unaudited Consolidated Financial Statements.
On January 15, 2016, Tyco entered into Stipulations of Settled Issues with the IRS intended to resolve all disputes related to the intercompany debt issues for the 1997 - 2000 audit cycle currently before the U.S. Tax Court. The Stipulations of Settled Issues are contingent upon the IRS Appeals Division applying the same settlement to all intercompany debt issues on appeal for subsequent audit cycles (2001 - 2007) and, if applicable, review by the United States Congress Joint Committee on Taxation. If finalized, the tentative resolution would cover all aspects of the controversy before the U.S. Tax Court described above and before the Appeals Division of the IRS, and would result in a total cash payment to the IRS in the range of $475 million to $525 million, which includes all interest and penalties. This payment would be subject to the sharing formula in each Tax Sharing Agreement, and would be shared among Tyco, Covidien and TE Connectivity 27%, 42% and 31%, respectively, with neither ADT nor Pentair being responsible for any payment related to this amount. Assuming the tentative resolution is finalized, Tyco does not expect to recognize any additional charges related to the resolution, as it had previously recorded sufficient reserves with respect to this controversy and its obligations under the Tax Sharing Agreements. Payment is expected to be made to the IRS, and among Tyco, Covidien and TE Connectivity, within the next six months. See Note 5 to the unaudited Consolidated Financial Statements.
The Company continues to make strategic acquisitions and investments to complement its core businesses. During the quarter ended December 25, 2015, the Company made an additional investment of approximately $128 million in the Company's joint venture, Tyco UAE, with its local partner Suwaidi Engineering Group in the United Arab Emirates ("UAE"). Tyco UAE is a leading provider of fire, security and integrated solutions and services in the UAE and also has operations in Qatar and Oman. Effective with the date of this transaction, the Company consolidated 100% of Tyco UAE, which is recorded in the Company's ROW Integrated Solutions & Services segment. As a result of this transaction, the Company recorded a net gain of $111 million recorded in Selling, general and administrative expenses within the Company's Consolidated Statements of Operations. See Note 4 to the unaudited Consolidated Financial Statements.
In addition, the Company announced it had reached a definitive agreement to acquire ShopperTrak, a leading global provider of retail consumer behavior insights and location-based analytics, for approximately $175 million in cash. The transaction closed during the second quarter of fiscal 2016. The financial results of this business will be reported in the ROW Integrated Solutions & Services segment. See Note 4 to the unaudited Consolidated Financial Statements.
The Company continuously assesses the strategic fit of its various businesses and pursues the divestiture of certain businesses included within the Company's portfolio which do not align with the Company's long-term strategy. During the quarter ended December 25, 2015, the Company approved a plan to sell its Australian fire protection business within its ROW Integrated Solutions & Services segment. The assets and liabilities of this business have been presented separately as held for sale within the Consolidated Balance Sheets for all periods presented. A pre-tax loss of approximately $57 million for the write-down to fair value, less cost to sell, was recorded in Selling, general and administrative expenses within the Company’s Consolidated Statements of Operations in the quarter. This business has not been presented in discontinued operations within the Consolidated Statements of Operations, as the criteria to be presented as a discontinued operation had not been met. The
43
sale of the business was completed in the second quarter of fiscal 2016. See Note 2 to the unaudited Consolidated Financial Statements.
On September 14, 2015, the Company and TIFSA announced the redemption of all of the outstanding $242 million aggregate principal amount of 7.0% notes due 2019 and $462 million aggregate principal amount of 6.875% notes due 2021. On October 14, 2015, TIFSA paid cash of $876 million to complete the redemption, resulting in a loss on extinguishment of $168 million which was recorded in Other expense, net within the Consolidated Statements of Operations during the first quarter of fiscal 2016. On October 15, 2015, the Company repaid at maturity $258 million aggregate principal amount of 3.375% notes which matured on such date. See Note 8 to the unaudited Consolidated Financial Statements.
Business Overview
We are a leading global provider of security products and services, fire detection and suppression products and services and life safety products. We utilize our extensive global footprint of approximately 900 locations, including manufacturing facilities, service and distribution centers, monitoring centers and sales offices, to provide solutions and localized expertise to our global customer base. We provide an extensive range of product and service offerings to over 3 million customers in more than 100 countries through multiple channels. Our revenues are broadly diversified across the United States and Canada (collectively “North America”); Central America and South America (collectively “Latin America”); Europe, the Middle East, and Africa (collectively “EMEA”) and the Asia-Pacific geographic areas. The following chart reflects our net revenue by geographic area for the three months ended December 25, 2015.
Three Months Ended December 25, 2015
Net Revenue by Geographic Area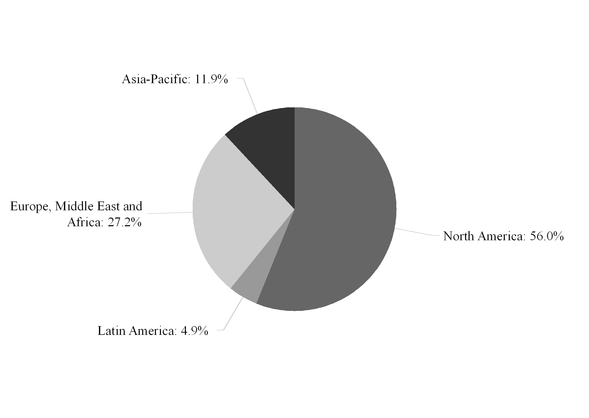
44
Our end-use customers, to whom we may sell directly or through wholesalers, distributors, commercial builders or contractors, are also broadly diversified and include:
• | Commercial customers, including residential and commercial property developers, financial institutions, food service businesses and commercial enterprises; |
• | Industrial customers, including companies in the oil and gas, power generation, mining, petrochemical and other industries; |
• | Retail and small business customers, including international, regional and local consumer outlets, from national chains to specialty stores; |
• | Institutional customers, including a broad range of healthcare facilities, academic institutions, museums and foundations; |
• | Governmental customers, including federal, state and local governments, defense installations, mass transportation networks, public utilities and other government-affiliated entities and applications; and |
• | Residential customers outside of North America, including owners of single family homes and local providers of a wide range of goods and services. |
As a global business with a varied customer base and an extensive range of products and services, our operations and results are impacted by global, regional and industry specific factors, and by political factors. Our geographic diversity and the diversity in our customer base and our products and services has helped mitigate the impact of any one industry or the economy of any single country on our consolidated operating results, financial condition and cash flows. Due to the global nature of our business and the variety of our customers, products and services, no single factor is predominantly used to forecast Company results. Rather, management monitors a number of factors to develop expectations regarding future results, including the activity of key competitors and customers, order rates for longer lead time projects, and capital expenditure budgets and spending patterns of our customers. We also monitor trends throughout the commercial and residential fire and security markets, including building codes and fire-safety standards. Our commercial installation businesses are impacted by trends in commercial construction starts, while our residential business, which is located outside of North America, is impacted by new housing starts.
Because we are a global business, with approximately 51% of our revenue generated outside the United States, and because our financial statements are prepared in U.S. Dollars, the results of our operations are impacted by changes in foreign currency exchange rates. During the quarter, the U.S. Dollar has remained strong against the currencies of most of the significant non-U.S. jurisdictions where we operate. The most significant impact on our results has been due to the strengthening of the U.S. Dollar as compared to the Euro and the Canadian Dollar, which has unfavorably impacted our revenue and operating income during fiscal 2015 and 2016.
In addition, the Company sells its products and services into high-hazard, heavy industrial end markets. Revenue from this market vertical is spread across each of the Company’s segments, with the most significant exposure in the United Kingdom in the ROW Integrated Solutions & Services segment and in the Fire Protection Products business in the Global Products segment. As a result of recent volatility in oil prices, this market vertical has seen significant changes in spending patterns, in particular with respect to capital expenditures. The revenue tied to this market vertical was unfavorably impacted during fiscal 2015, and we expect weakness in this sector to continue during fiscal 2016.
45
Results of Operations
Consolidated financial information is as follows:
For the Quarters Ended | |||||||
($ in millions) | December 25, 2015 | December 26, 2014 | |||||
Net revenue | $ | 2,376 | $ | 2,478 | |||
Net revenue decline | (4.1 | )% | N/A | ||||
Organic revenue growth | 0.1 | % | N/A | ||||
Segment operating income (1) | $ | 362 | $ | 323 | |||
Segment operating margin (1) | 15.2 | % | 13.0 | % | |||
Corporate and other (1) | $ | (51 | ) | $ | (49 | ) | |
Restructuring and repositioning charges, net | (18 | ) | (75 | ) | |||
Operating income | 293 | 199 | |||||
Operating margin | 12.3 | % | 8.0 | % | |||
Interest income | $ | 4 | $ | 3 | |||
Interest expense | (24 | ) | (24 | ) | |||
Other (expense) income, net | (165 | ) | 4 | ||||
Income tax expense | (36 | ) | (19 | ) | |||
Income from continuing operations attributable to Tyco ordinary shareholders | 72 | 164 | |||||
(1) Segment operating income and margin, as well as Corporate and Other, exclude Restructuring and repositioning charges, net. This measure of segment operating income (loss) is consistent with how management reviews the businesses, makes investing and resource decisions and assesses operating performance.
Net Revenue
Net revenue for the quarter ended December 25, 2015 decreased by $102 million, or 4.1%, to $2,376 million as compared to net revenue of $2,478 million for the quarter ended December 26, 2014. Changes in foreign currency exchange rates had an unfavorable impact of $152 million, or 6.1%, on net revenue, primarily in our ROW Integrated Solutions & Services segment, and to a lesser extent, in our Global Products segment. In addition, divestitures had an unfavorable impact of $23 million, or 0.9%, primarily in the ROW Integrated Solutions & Services segment. On an organic basis, net revenue was flat year over year, primarily as a result of growth in our NA Integrated Solutions & Services segment, offset by declines in our Global Products and ROW Integrated Solutions & Services segments. Net revenue was favorably impacted by acquisitions that contributed $71 million, or 2.9%, primarily within our Global Products and ROW Integrated Solutions & Services segments.
Cost of Revenue and Selling, General & Administrative ("SG&A")
The significant components of cost of product sales include material costs, labor and overhead costs, product shipping and warehousing costs. The significant components of cost of services include labor and employee related costs, depreciation expense, costs associated with our equipment and fleet of vehicles, telecommunication costs and material costs. The significant components of SG&A include compensation and compensation related costs, facility and maintenance expenses and professional fees. SG&A for the quarter ended December 25, 2015 includes a net gain on an equity investment of $111 million, partially offset by divestiture charges, net, of $52 million. See Notes 2 and 4 to the unaudited Consolidated Financial Statements.
Restructuring and Repositioning Charges, Net
During fiscal 2015, the Company identified and pursued opportunities for cost savings through restructuring activities and workforce reductions to improve operating efficiencies across the Company's businesses and corporate functions. In addition, the Company initiated certain global actions designed to reduce its cost structure and improve future profitability by streamlining operations and better aligning functions, which the Company refers to as repositioning actions. These actions may or may not lead to a future restructuring action. During fiscal 2015, the Company recorded restructuring and repositioning charges of $289 million, of which $75 million was recorded during the quarter ended December 26, 2014. The Company expects to incur restructuring and repositioning charges between $75 million and $100 million in fiscal 2016, of which $18 million was recorded during the quarter ended December 25, 2015. See Note 3 to the unaudited Consolidated Financial Statements.
46
Operating Income
Operating income for the quarter ended December 25, 2015 increased by $94 million, or 47.2%, to $293 million, as compared to operating income of $199 million for the quarter ended December 26, 2014. In conjunction with the additional investment in our UAE joint venture discussed in Recent Transactions above, we recorded a net gain of $111 million within Selling, general and administrative expenses relating to the Company's previously held equity method investment in the joint venture. See Note 4 to the unaudited Consolidated Financial Statements. Operating income also increased due to a $57 million reduction in restructuring and repositioning charges, net. To a lesser extent, operating income increased due to the benefit of previous productivity initiatives. These items were partially offset by $52 million of divestiture charges, net, primarily related to the write down of our Australian fire business to fair value, less cost to sell. See Note 2 to the unaudited Consolidated Financial Statements. Changes in foreign currency exchange rates also had an unfavorable impact on operating income of $14 million, or 4.8%.
Key items impacting operating income for the quarters ended December 25, 2015 and December 26, 2014, respectively, are as follows:
For the Quarters Ended | |||||||
($ in millions) | December 25, 2015 | December 26, 2014 | |||||
Divestiture charges, net | $ | 52 | $ | 1 | |||
Gain on equity investment, net | (111 | ) | — | ||||
Legacy legal gains | — | (7 | ) | ||||
Restructuring and repositioning charges, net | 18 | 75 | |||||
Unfavorable impact of foreign currency | 14 | 9 | |||||
Interest Income and Expense
Interest income was $4 million and $3 million for the quarters ended December 25, 2015 and December 26, 2014, respectively.
Interest expense was $24 million for both quarters ended December 25, 2015 and December 26, 2014.
Other (Expense) Income, net
Significant components of other expense, net for the quarters ended December 25, 2015 and December 26, 2014 are as follows:
For the Quarters Ended | |||||||
($ in millions) | December 25, 2015 | December 26, 2014 | |||||
Loss on extinguishment of debt (see Note 8 to the unaudited Consolidated Financial Statements) | $ | (168 | ) | $ | — | ||
2012 Tax Sharing Agreement income (see Note 5 to the unaudited Consolidated Financial Statements) | — | 2 | |||||
2007 Tax Sharing Agreement loss (see Note 5 to the unaudited Consolidated Financial Statements) | — | (1 | ) | ||||
Other | 3 | 3 | |||||
$ | (165 | ) | $ | 4 | |||
Effective Income Tax Rate
Our effective income tax rate was 33.3% and 10.4% during the quarters ended December 25, 2015 and December 26, 2014, respectively. The increase in our effective tax rate in the current period was primarily due to a non-recurring loss on debt extinguishment incurred in the current period for which the related deferred tax benefits will not be realized. The prior period was favorably impacted by repositioning and restructuring expenses that were primarily incurred in high tax jurisdictions.
The rate can vary from quarter to quarter due to discrete items, such as the settlement of income tax audits and changes in tax laws, as well as recurring factors such as the geographic mix of income before taxes. The Company has operations and a taxable presence in nearly 60 countries outside the U.S. All of these countries have a tax rate that is lower than the rate in the U.S. The countries in which the Company has a material presence that have lower tax rates compared to the U.S. include
47
Canada, Australia, Ireland, Germany, Switzerland and the United Kingdom. The Company's ability to obtain a benefit from lower tax rates outside the U.S. is dependent on its relative levels of income in countries outside the U.S. and on the statutory tax rates and tax laws in these countries. Based on the dispersion of the Company's non-U.S. income and management’s assessment of the likelihood and magnitude of any potential change to statutory tax rates or tax laws affecting the Company, any such changes are not expected to materially affect the Company's income tax provision or net income, aside from any one-time adjustment to reflect the impact of the change in the tax rate to the Company's deferred tax balances.
Segment Results
The following chart reflects our net revenue by operating segment, as well as the percent of net revenue by operating segment, for the quarters ended December 25, 2015 and December 26, 2014, respectively.
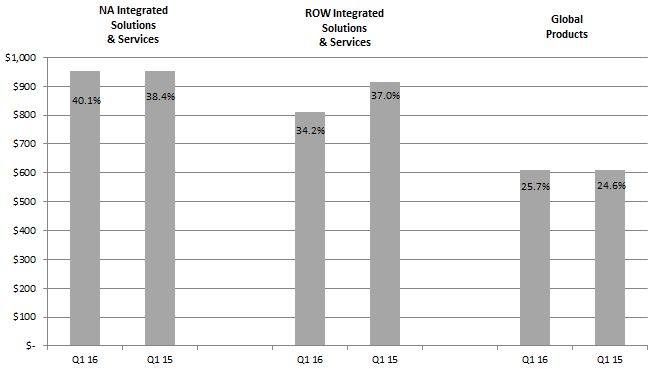
The segment discussions that follow describe the significant factors contributing to the changes in results for each of our segments included in continuing operations.
NA Integrated Solutions & Services
Financial information for NA Integrated Solutions & Services for the quarters ended December 25, 2015 and December 26, 2014 is as follows:
For the Quarters Ended | |||||||
($ in millions) | December 25, 2015 | December 26, 2014 | |||||
Net revenue | $ | 953 | $ | 951 | |||
Net revenue growth | 0.2 | % | N/A | ||||
Organic revenue growth | 1.6 | % | N/A | ||||
Segment operating income | $ | 132 | $ | 129 | |||
Segment operating margin | 13.9 | % | 13.6 | % | |||
48
Net Revenue
The change in net revenue compared to the prior periods is attributable to the following:
Factors Contributing to Year-Over-Year Change | First Quarter Fiscal 2016 Compared to First Quarter Fiscal 2015 | |||
Organic revenue growth | $ | 15 | ||
Acquisitions | 3 | |||
Impact of foreign currency | (16 | ) | ||
Total change | $ | 2 | ||
Net revenue increased $2 million, or 0.2%, to $953 million for the quarter ended December 25, 2015 as compared to $951 million for the quarter ended December 26, 2014. On an organic basis, net revenue grew by 1.6% from the comparable quarter, with growth in both integrated solutions and service revenue, and in particular, in the retail, commercial and institutional vertical markets. Net revenue was also favorably impacted by $3 million, or 0.3%, due to several acquisitions made during fiscal 2015. Changes in foreign currency exchange rates unfavorably impacted net revenue by $16 million, or 1.7%.
Segment Operating Income
Segment operating income for the quarter ended December 25, 2015 increased $3 million, or 2.3%, to $132 million, as compared to segment operating income of $129 million for the quarter ended December 26, 2014. Operating income was favorably impacted by the benefit of previous productivity initiatives partially offset by incremental investments in sales and marketing.
ROW Integrated Solutions & Services
Financial information for ROW Integrated Solutions & Services for the quarters ended December 25, 2015 and December 26, 2014 is as follows:
For the Quarters Ended | |||||||
($ in millions) | December 25, 2015 | December 26, 2014 | |||||
Net revenue | $ | 812 | $ | 916 | |||
Net revenue decline | (11.4 | )% | N/A | ||||
Organic revenue decline | (1.1 | )% | N/A | ||||
Segment operating income | $ | 133 | $ | 89 | |||
Segment operating margin | 16.4 | % | 9.7 | % | |||
Net Revenue
The change in net revenue compared to the prior periods is attributable to the following:
Factors Contributing to Year-Over-Year Change | First Quarter Fiscal 2016 Compared to First Quarter Fiscal 2015 | |||
Organic revenue decline | $ | (10 | ) | |
Acquisitions | 29 | |||
Divestitures | (22 | ) | ||
Impact of foreign currency | (101 | ) | ||
Total change | $ | (104 | ) | |
Net revenue decreased $104 million, or 11.4%, to $812 million for the quarter ended December 25, 2015 as compared to $916 million for the quarter ended December 26, 2014. Changes in foreign currency exchange rates unfavorably impacted net revenue by $101 million, or 11.0%. On an organic basis, net revenue declined by $10 million, or 1.1%, driven by a decline in integrated solutions revenue, partially offset by growth in services revenue. The organic revenue decline is primarily in the United Kingdom and the Pacific region as a result of pressure within the high-hazard, heavy industrial end markets, and to a
49
lesser extent, Asia. These declines were partially offset by organic revenue growth in Continental Europe and our growth markets. In addition, divestitures in Asia had an unfavorable impact of $22 million, or 2.4%. Net revenue was favorably impacted by $29 million, or 3.2%, due to acquisitions primarily within growth markets and retail solutions.
Segment Operating Income
Segment operating income for the quarter ended December 25, 2015 increased $44 million, or 49.4%, to $133 million as compared to segment operating income of $89 million for the quarter ended December 26, 2014. In conjunction with the additional investment in our UAE joint venture discussed in Recent Transactions above, we recorded a net gain of $111 million within Selling, general and administrative expenses relating to the Company's previously held equity method investment in the joint venture. See Note 4 to the unaudited Consolidated Financial Statements. To a lesser extent, segment operating income increased due to the benefit of previous productivity initiatives. These items were partially offset by $54 million of divestiture charges, net, primarily related to the write down of our Australian fire business to fair value, less cost to sell. See Note 2 to the unaudited Consolidated Financial Statements. In addition, changes in foreign currency exchange rates had an unfavorable impact on segment operating income of $9 million, or 6.8%.
Key items impacting segment operating income for the quarters ended December 25, 2015 and December 26, 2014, respectively, are as follows:
For the Quarters Ended | |||||||
($ in millions) | December 25, 2015 | December 26, 2014 | |||||
Divestiture charges, net | $ | 54 | $ | 1 | |||
Gain on equity investment, net | (111 | ) | — | ||||
Unfavorable impact of foreign currency | 9 | 6 | |||||
Global Products
Financial information for Global Products for the quarters ended December 25, 2015 and December 26, 2014 is as follows:
For the Quarters Ended | |||||||
($ in millions) | December 25, 2015 | December 26, 2014 | |||||
Net revenue | $ | 611 | $ | 611 | |||
Net revenue growth | — | % | N/A | ||||
Organic revenue decline | (0.5 | )% | N/A | ||||
Segment operating income | $ | 97 | $ | 105 | |||
Segment operating margin | 15.9 | % | 17.2 | % | |||
Net Revenue
The change in net revenue compared to the prior periods is attributable to the following:
Factors Contributing to Year-Over-Year Change | First Quarter Fiscal 2016 Compared to First Quarter Fiscal 2015 | |||
Organic revenue decline | $ | (3 | ) | |
Acquisitions | 39 | |||
Divestitures | (1 | ) | ||
Impact of foreign currency | (35 | ) | ||
Total change | $ | — | ||
Net revenue was $611 million for both quarters ended December 25, 2015 and December 26, 2014. On an organic basis, net revenue declined by $3 million, or 0.5%, driven by the timing of increased shipments of Scott Air-Paks in our life safety business in the comparable quarter, partially offset by organic growth in our security products and fire products businesses. Net revenue was unfavorably impacted by changes in foreign currency exchange rates of $35 million, or 5.7%. Net revenue was
50
favorably impacted during the quarter ended December 25, 2015 by $39 million, or 6.4%, from acquisitions, primarily related to the Industrial Safety Technologies acquisition within our life safety business in fiscal 2015.
Segment Operating Income
Segment operating income for the quarter ended December 25, 2015 decreased by $8 million, or 7.6% to $97 million, as compared to segment operating income of $105 million for the quarter ended December 26, 2014. Segment operating income decreased as a result of higher amortization expense primarily due to acquisitions made during the prior year. In addition, segment operating income decreased due to product mix.
Corporate and Other
Corporate expense, excluding restructuring and repositioning charges, net, was $51 million and $49 million for the quarters ended December 25, 2015 and December 26, 2014, respectively. The increase in Corporate expense is due to a legacy legal gain of $7 million in the prior comparable quarter partially offset by the benefit of previous productivity initiatives.
Key items included in corporate expense for the quarters ended December 25, 2015 and December 26, 2014, respectively, are as follows:
For the Quarters Ended | |||||||
($ in millions) | December 25, 2015 | December 26, 2014 | |||||
Legacy legal gains | $ | — | $ | (7 | ) | ||
Critical Accounting Policies and Estimates
The preparation of the unaudited Consolidated Financial Statements in conformity with U.S. GAAP requires management to use judgment in making estimates and assumptions that affect the reported amounts of assets and liabilities, disclosure of contingent assets and liabilities and the reported amounts of revenue and expenses. We believe that our accounting policies for depreciation and amortization methods of security monitoring-related assets, revenue recognition, loss contingencies, income taxes, goodwill and indefinite-lived intangible assets, long-lived assets and pension and postretirement benefits are based on, among other things, judgments and assumptions made by management that include inherent risks and uncertainties. Effective September 26, 2015, we changed the approach used to measure service and interest costs for pension benefits. For fiscal 2016, we elected to measure service and interest costs by applying the specific spot rates along the yield curve over the projected cash flow period. Management believes the new approach provides a more precise measurement of service and interest costs by improving the correlation between projected benefit cash flows to the corresponding spot rates on the yield curves. We have accounted for this change as a change in accounting estimate and, accordingly, have accounted for it on a prospective basis. See Note 11 to the unaudited Consolidated Financial Statements. During fiscal 2016, there have been no significant changes to these policies or in the underlying accounting assumptions and estimates used in the above critical accounting policies from those disclosed in the Consolidated Financial Statements and accompanying notes contained in the Company's Annual Report on Form 10-K filed with the SEC on November 13, 2015 for the fiscal year ended September 25, 2015. See Note 1 to the unaudited Consolidated Financial Statements for recently issued and adopted accounting standards.
Liquidity and Capital Resources
A fundamental objective of the Company is to have sufficient liquidity, balance sheet strength, and financial flexibility to fund the operating and capital requirements of its core businesses around the world.
The primary source of funds to finance our operations and capital expenditures is cash generated by operations. In addition, we maintain a $1.5 billion commercial paper program, backed up by a committed revolving credit facility, and have access to equity and debt capital from public and private sources. We continue to balance our operating, investing, and financing uses of cash through investments and acquisitions in our core businesses, dividends, and share repurchases. In addition, we believe our available cash, amounts available under our credit facility, commercial paper program and cash provided by operating activities will be adequate to cover our operational, capital and other business needs in the foreseeable future. To the extent it is necessary for us to finance our cash needs through the issuance of commercial paper, by accessing our committed revolving credit facility, or through other public or private sources, our cost of funding may increase depending on market conditions at the time of such borrowing.
51
As of December 25, 2015 and September 25, 2015, our cash and cash equivalents, short- and long-term debt at carrying value, and Tyco shareholder's equity are as follows:
As of | Credit Availability as of | ||||||||||
($ in millions) | December 25, 2015 | September 25, 2015 | December 25, 2015 | ||||||||
Cash and cash equivalents | $ | 301 | $ | 1,401 | $ | — | |||||
Total debt (excluding revolving credit facility) | 2,298 | 3,146 | — | ||||||||
Revolving credit facility | — | — | 1,500 | ||||||||
Total Tyco shareholders' equity | 4,009 | 4,041 | — | ||||||||
Total debt as a % of total capital (1) | 36.4 | % | 43.8 | % | N/A | ||||||
(1) Total capital represents the aggregate amount of total debt and total shareholders' equity which was $6,307 million and $7,187 million as of December 25, 2015 and September 25, 2015, respectively.
Significant uses of capital that are expected in the near- to mid-term include expenditures for (i) capital expenditures and dealer investments in annual amounts expected to approximate 3% to 3.5% of total revenues, (ii) the funding of potential tax liabilities or settlements (see Note 5 to the unaudited Consolidated Financial Statements), including with respect to the divestiture of our ADT Korea business (see Note 2 to the unaudited Consolidated Financial Statements), (iii) estimated restructuring payments, of which $124 million has been accrued as a current liability as of December 25, 2015 (see Note 3 to the unaudited Consolidated Financial Statements), and (iv) quarterly dividend payments, of which $87 million has been accrued as of December 25, 2015 (see Note 12 to the unaudited Consolidated Financial Statements). The Company intends to fund these capital uses through a combination of available cash, cash generated from operations, borrowing in the commercial paper market or under its revolving credit facility, and borrowing in public or private markets for debt securities. In addition, the Company intends, in its discretion, to pursue strategically important acquisitions, may repurchase its shares from time to time and may engage in other capital market activities, in each case depending on a number of factors, including the Company’s strategic priorities, its financial condition and results of operations, the capital requirements of the Company’s businesses, industry and capital markets factors and other relevant factors.
Sources and uses of cash
Our cash flows from operating, investing and financing from continuing operations for the three months ended December 25, 2015 and December 26, 2014 are summarized below:
For the Three Months Ended | |||||||
($ in millions) | December 25, 2015 | December 26, 2014 | |||||
Net cash provided by operating activities | $ | 189 | $ | 95 | |||
Net cash (used in) provided by investing activities | (211 | ) | 7 | ||||
Net cash used in financing activities | (1,069 | ) | (511 | ) | |||
Cash flow from operating activities
Cash flow from operating activities can fluctuate significantly from period to period as working capital needs and the timing of payments for items such as restructuring activities, asbestos activities, pension funding, income taxes and other items impact reported cash flow.
The net change in working capital decreased operating cash flow by $120 million in the three months ended December 25, 2015. The significant changes in working capital included a $48 million increase in prepaid expenses and other assets, a $41 million decrease in accrued and other liabilities, a $37 million decrease in deferred revenue, and a $34 million increase in inventories, partially offset by a $29 million decrease in accounts receivable.
The net change in working capital decreased operating cash flow by $181 million in the three months ended December 26, 2014. The significant changes in working capital included a $43 million increase in inventories, a $41 million decrease in accounts payable, a $38 million decrease in deferred revenue and a $29 million decrease in accrued and other liabilities, partially offset by a $22 million decrease in asbestos insurance assets.
During the three months ended December 25, 2015 and December 26, 2014, we paid approximately $26 million and $27 million, respectively, in cash related to restructuring activities. During the three months ended December 25, 2015 and December 26, 2014, we paid approximately $21 million and $7 million, respectively, in cash related to repositioning activities.
52
During the three months ended December 25, 2015 and December 26, 2014, we made required contributions of nil and $1 million, respectively, to our U.S. pension plans and $11 million and $5 million, respectively, to our non-U.S. pension plans. We anticipate that we will contribute at least the minimum required to our pension plans in 2016 of $3 million for our U.S. plans and $25 million for our non-U.S. plans.
Income taxes paid, net of refunds, related to continuing operations were $7 million and $26 million during the three months ended December 25, 2015 and December 26, 2014, respectively.
Net interest paid related to continuing operations was $14 million and $10 million for the three months ended December 25, 2015 and December 26, 2014, respectively.
Cash flow from investing activities
Cash flows related to investing activities consist primarily of cash used for capital expenditures and acquisitions, proceeds derived from divestitures of businesses and assets and the purchase and sales and maturities of investments.
We made capital expenditures of $68 million and $66 million for the three months ended December 25, 2015 and December 26, 2014, respectively. The level of capital expenditures in fiscal 2016 is expected to exceed the spending levels in fiscal 2015 and is also expected to exceed depreciation expense.
During the three months ended December 25, 2015, total consideration for acquisitions was $138 million, which was comprised of $176 million of cash paid, including $5 million to settle pre-existing matters and $6 million for pre-paid agency commissions, net of cash acquired of $27 million, which primarily related to our additional investment in the UAE joint venture in our ROW Integrated Solutions & Services segment. During the three months ended December 26, 2014, we paid cash for acquisitions totaling $152 million, net of $23 million cash acquired, which related to acquisitions in in our ROW Integrated Solutions & Services and Global Products segments.
During the three months ended December 25, 2015, we made net purchases of investments including restricted investments of $6 million. During the three months ended December 26, 2014, we had net proceeds from investments and restricted investments of $274 million, primarily relating to the maturity of time deposits of $275 million.
During the three months ended December 25, 2015, our restricted cash decreased by $5 million, primarily due to asbestos-related payments. During the three months ended December 26, 2014, our restricted cash increased by $45 million. This increase was primarily driven by $22 million related to the asbestos-related qualified settlement fund and $12 million of cash received from Mr. Swartz. See Note 10 to the unaudited Consolidated Financial Statements.
Cash flow from financing activities
Cash flows from financing activities relate primarily to proceeds received from incurring debt and issuing stock, and cash used to repay debt, repurchase stock and make dividend payments to shareholders.
During the three months ended December 25, 2015, we repaid a total of approximately $1,134 million of current portion of long-term debt and $666 million of short-term debt. On October 14, 2015, the Company redeemed its outstanding $242 million aggregate principal amount 7.0% notes due 2019 and $462 million aggregate principal amount 6.875% notes due 2021, which were classified as current as of September 25, 2015, for total cash of $876 million, which included a make-whole premium of $172 million. Also, on October 15, 2015, the Company repaid $258 million aggregate principal amount of 3.375% notes due 2015, which matured on such date. In addition, during the three months ended December 25, 2015, we issued commercial paper of $817 million, $666 million of which was repaid during the quarter. As of December 25, 2015 and September 25, 2015, TIFSA had commercial paper outstanding of $151 million and nil, respectively. The maximum aggregate amount of unsecured commercial paper notes available to be issued, on a private placement basis, under the commercial paper program is $1.5 billion as of December 25, 2015. During the three months ended December 26, 2014, there were no proceeds from or repayments of short-term debt. As of December 25, 2015 and September 25, 2015, there were no amounts drawn under the Company's revolving credit facility. See Note 8 to the unaudited Consolidated Financial Statements.
Pursuant to our share repurchase program, we may repurchase Tyco shares from time to time in open market purchases at prevailing market prices, in negotiated transactions off the market, or pursuant to an approved trading plan in accordance with applicable regulations. During the three months ended December 25, 2015, we did not repurchase shares. During the three months ended December 26, 2014, we repurchased approximately 10 million ordinary shares for approximately $417 million.
During the three months ended December 25, 2015 and December 26, 2014, we paid cash dividends of approximately $87 million and $75 million, respectively.
53
During the three months ended December 26, 2014, we paid contingent consideration of $23 million which related to the successful transfer of a business license in China to Tyco. No contingent consideration was paid during the three months ended December 25, 2015.
Management believes that cash generated by or available to us should be sufficient to fund our capital and operational business needs for the foreseeable future.
Commitments and Contingencies
For a detailed discussion of contingencies related to tax and litigation matters, see Notes 5 and 10 to the unaudited Consolidated Financial Statements.
Backlog
We had a backlog of unfilled orders of $4,650 million and $4,562 million as of December 25, 2015 and September 25, 2015, respectively.
The Company's backlog includes recurring revenue-in-force and long-term deferred revenue for upfront fees from its NA and ROW Integrated Solutions & Services segments. Revenue-in-force represents 12 months' revenue associated with monitoring and maintenance services under contract in the security and fire business. Backlog by segment was as follows ($ in millions):
NA Integrated Solutions & Services | ROW Integrated Solutions & Services | Global Products | Total | ||||||||||||
As of September 25, 2015 | |||||||||||||||
Backlog | $ | 1,035 | $ | 820 | $ | 195 | $ | 2,050 | |||||||
Recurring revenue in force | 1,229 | 1,013 | — | 2,242 | |||||||||||
Deferred revenue | 235 | 35 | — | 270 | |||||||||||
Total Backlog | $ | 2,499 | $ | 1,868 | $ | 195 | $ | 4,562 | |||||||
As of December 25, 2015 | |||||||||||||||
Backlog | $ | 1,057 | $ | 974 | $ | 180 | $ | 2,211 | |||||||
Recurring revenue in force | 1,224 | 954 | — | 2,178 | |||||||||||
Deferred revenue | 229 | 32 | — | 261 | |||||||||||
Total Backlog | $ | 2,510 | $ | 1,960 | $ | 180 | $ | 4,650 | |||||||
Total backlog increased $88 million, or 1.9%, to $4,650 million as of December 25, 2015 compared to $4,562 million as of September 25, 2015. Acquisitions during the first quarter of fiscal 2016 contributed approximately $158 million, or 3.5%, to total backlog, primarily related to our UAE business. This increase was partially offset by changes in foreign currency, which had an unfavorable impact to total backlog of $59 million, or 1.3%, primarily in our ROW Integrated Solutions & Services segment.
Guarantees
The Company and certain of its subsidiaries have guaranteed the performance of third-parties and provided financial guarantees for uncompleted work and financial commitments. The terms of these guarantees vary with end dates ranging from the current fiscal year through the completion of such transactions. The guarantees would typically be triggered in the event of nonperformance and we believe that performance under the guarantees, if required, would not have a material effect on our financial position, results of operations or cash flows.
There are certain guarantees or indemnifications extended among Tyco, Covidien, TE Connectivity, ADT and Pentair in accordance with the terms of the 2007 and 2012 Separation and Distribution Agreements and the Tax Sharing Agreements. The guarantees primarily relate to certain contingent tax liabilities included in the Tax Sharing Agreements. At the time of the 2007 and 2012 Separations, we recorded liabilities necessary to recognize the fair value of such guarantees and indemnifications. See Note 5 to the unaudited Consolidated Financial Statements. In addition, prior to the 2007 and 2012 Separations we provided support in the form of financial and/or performance guarantees to various Covidien, TE Connectivity, ADT and Tyco Flow Control operating entities. To the extent these guarantees were not assigned in connection with the 2007 and 2012 Separations, we remained as the guarantor, but were typically indemnified by the former subsidiary. See Note 17 to the unaudited Consolidated Financial Statements.
54
In disposing of assets or businesses, we often provide representations, warranties and/or indemnities to cover various risks including, for example, unknown damage to the assets, environmental risks involved in the sale of real estate, liability to investigate and remediate environmental contamination at waste disposal sites and manufacturing facilities, and unidentified tax and other liabilities related to periods prior to disposition. We have no reason to believe that these uncertainties would have a material adverse effect on our financial position, results of operations or cash flows. We have recorded liabilities for known indemnifications included as part of environmental liabilities. See Note 10 to the unaudited Consolidated Financial Statements.
In the normal course of business, we are liable for contract completion and product performance. We record estimated product warranty costs at the time of sale. In the opinion of management, such obligations will not significantly affect our financial position, results of operations or cash flows.
For a detailed discussion of guarantees and indemnifications, see Note 17 to the unaudited Consolidated Financial Statements.
Non-U.S. GAAP Measure
In an effort to provide investors with additional information regarding our results as determined by U.S. GAAP, we also disclose the non-U.S. GAAP measures of organic revenue growth (decline) and segment operating income (loss). We believe that these measures are useful to investors in evaluating our operating performance for the periods presented. When read in conjunction with our U.S. GAAP revenue, organic revenue growth (decline) enables investors to better evaluate our operations without giving effect to fluctuations in foreign exchange rates and acquisition and divestiture activity, either of which may be significant from period to period. When read in conjunction with our U.S. GAAP operating income, segment operating income (loss) enables investors to better evaluate our operations without giving effect to restructuring and repositioning charges, net, which may significantly vary from period to period based on the opportunities and actions undertaken by the Company given various factors including, but not limited to, the Company's operating performance and general macroeconomic conditions. In addition, organic revenue growth (decline) and segment operating income (loss) are factors we use in internal evaluations of the overall performance of our business. These measures are not financial measures under U.S. GAAP and should not be considered as a substitute for revenue and operating income (loss) as determined in accordance with U.S. GAAP, and they may not be comparable to similarly titled measures reported by other companies. Organic revenue growth (decline) presented herein is defined as revenue growth (decline) excluding the effects of foreign currency fluctuations, acquisitions and divestitures and other changes that may not reflect underlying results and trends. Our organic growth (decline) calculations incorporate an estimate of prior year reported net revenue associated with acquired entities that have been fully integrated within the first year, and exclude prior year net revenue associated with entities that do not meet the criteria for discontinued operations which have been divested within the past year ("adjusted number"). We calculate the rate of organic growth (decline) based on the adjusted number to better reflect the rate of growth (decline) of the combined business, in the case of acquisitions, or the remaining business, in the case of dispositions. We base the rate of organic growth (decline) for acquired businesses that are not fully integrated within the first year upon unadjusted historical net revenue. Foreign currency fluctuations are calculated by subtracting (i) the U.S. dollar equivalent of local currencies for the current period using monthly weighted average exchange rates for the prior period from (ii) the U.S. dollar equivalent of local currencies for the current period using monthly weighted average exchange rates for the current period. We may use organic revenue growth (decline) as a component of our compensation programs. Segment operating income (loss) excluding restructuring and repositioning charges, net, is consistent with how management reviews the businesses, makes investing and resource decisions and assesses operating performance.
55
The table below details the components of organic revenue growth (decline) and reconciles the non-U.S. GAAP measure to U.S. GAAP net revenue growth (decline).
Quarter Ended December 25, 2015
Net Revenue for the Quarter Ended December 26, 2014 | Base Year Adjustments Divestitures / Other | Adjusted Fiscal 2015 Base Revenue | Foreign Currency | Acquisitions | Organic Revenue | Organic Growth (Decline) Percentage(1) | Net Revenue for the Quarter Ended December 25, 2015 | |||||||||||||||||||||||
($ in millions) | ||||||||||||||||||||||||||||||
NA Integrated Solutions & Services | $ | 951 | $ | — | $ | 951 | $ | (16 | ) | $ | 3 | $ | 15 | 1.6 | % | $ | 953 | |||||||||||||
ROW Integrated Solutions & Services | 916 | (22 | ) | 894 | (101 | ) | 29 | (10 | ) | (1.1 | )% | 812 | ||||||||||||||||||
Global Products | 611 | (1 | ) | 610 | (35 | ) | 39 | (3 | ) | (0.5 | )% | 611 | ||||||||||||||||||
Total Net Revenue | $ | 2,478 | $ | (23 | ) | $ | 2,455 | $ | (152 | ) | $ | 71 | $ | 2 | 0.1 | % | $ | 2,376 | ||||||||||||
(1) | Organic revenue growth (decline) percentage based on adjusted fiscal 2015 base revenue. |
The tables below reconcile the non-U.S. GAAP measure of segment operating income (loss) to U.S. GAAP operating income (loss).
Quarter Ended December 25, 2015
NA Integrated Solutions & Services | ROW Integrated Solutions & Services | Global Products | Total Operating Segments | Corporate and Other | Total | ||||||||||||||||||
($ in millions) | |||||||||||||||||||||||
Segment operating income (loss) | $ | 132 | $ | 133 | $ | 97 | $ | 362 | $ | (51 | ) | $ | 311 | ||||||||||
Restructuring and repositioning charges, net | (4 | ) | (2 | ) | (4 | ) | (10 | ) | (8 | ) | (18 | ) | |||||||||||
Operating income (loss) | $ | 128 | $ | 131 | $ | 93 | $ | 352 | $ | (59 | ) | $ | 293 | ||||||||||
Quarter Ended December 26, 2014
NA Integrated Solutions & Services | ROW Integrated Solutions & Services | Global Products | Total Operating Segments | Corporate and Other | Total | ||||||||||||||||||
($ in millions) | |||||||||||||||||||||||
Segment operating income (loss) | $ | 129 | $ | 89 | $ | 105 | $ | 323 | $ | (49 | ) | $ | 274 | ||||||||||
Restructuring and repositioning charges, net | (24 | ) | (19 | ) | (7 | ) | (50 | ) | (25 | ) | (75 | ) | |||||||||||
Operating income (loss) | $ | 105 | $ | 70 | $ | 98 | $ | 273 | $ | (74 | ) | $ | 199 | ||||||||||
Forward-Looking Information
Certain statements in this report are "forward-looking statements" within the meaning of the U.S. Private Securities Litigation Reform Act of 1995. All forward-looking statements involve risks and uncertainties. In many cases forward-looking statements are identified by words, and variations of words, such as “anticipate,” “estimate,” “believe,” “commit,” “continue,” “could,” “intend,” “may,” “plan,” “potential,” “predict,” “positioned,” “should,” “will,” “expect,” “objective,” “projection,” “forecast,” “goal,” “guidance,” “outlook,” “effort,” “target” and other similar words. However, the absence of these words does not mean that the statements are not forward-looking. Any forward-looking statement contained herein, in press releases, written statements or other documents filed with the SEC, or in Tyco's communications and discussions with investors and analysts in the normal course of business through meetings, webcasts, phone calls and conference calls, regarding expectations with respect to future events, including sales, earnings, cash flows, operating and tax efficiencies, product expansion, backlog, the consummation and benefits of acquisitions and divestitures, as well as financings and repurchases of debt or equity securities, are subject to known and unknown risks, uncertainties and contingencies. Many of these risks, uncertainties and contingencies are beyond our control, and may cause actual results, performance or achievements to differ materially from anticipated results, performances or achievements. Factors that might affect such forward-looking statements include, among other things:
56
• | overall economic and business conditions, and overall demand for Tyco's goods and services; |
• | economic and competitive conditions in the industries, end markets and regions served by our businesses; |
• | changes in legal and tax requirements (including tax rate changes, new tax laws or treaties and revised tax law interpretations); |
• | our, and our employees' and agents' ability to comply with complex and continually changing laws and regulations that govern our international operations, including the U.S. Foreign Corrupt Practices Act, similar anti-bribery laws in other jurisdictions, a variety of export control, customs, privacy, currency exchange control and transfer pricing regulations, and our corporate policies governing these matters; |
• | the outcome of litigation, arbitrations and governmental proceedings; |
• | effect of income tax audits, litigation, settlements and appeals; |
• | our ability to repay or refinance our outstanding indebtedness as it matures; |
• | our ability to operate within the limitations imposed by financing arrangements and to maintain our credit ratings; |
• | interest rate fluctuations and other changes in borrowing costs, or other consequences of volatility in the capital or credit markets; |
• | other capital market conditions, including availability of funding sources; |
• | currency exchange rate fluctuations; |
• | availability of and fluctuations in the prices of key raw materials; |
• | changes affecting customers or suppliers; |
• | economic and political conditions in international markets, including governmental changes and restrictions on the ability to transfer capital across borders; |
• | our ability to achieve anticipated cost savings; |
• | our ability to predict end-user demand for new or enhanced product or service offerings; |
• | our ability to execute our portfolio refinement and acquisition strategies, including successfully integrating acquired operations; |
• | potential impairment of our goodwill, intangibles and/or our long-lived assets; |
• | our ability to realize the intended benefits of the 2012 Separation, including the integration of our commercial security and fire protection businesses; |
• | other risks associated with the 2012 Separation, for example the risk that we may be liable for certain contingent liabilities of the spun-off entities if they were to become insolvent; |
• | risks associated with our jurisdiction of incorporation, including the possibility of reduced flexibility with respect to certain aspects of capital management and corporate governance, increased or different regulatory burdens, and the possibility that we may not realize anticipated tax benefits; |
• | the possible effects on Tyco of future legislation in the United States that may limit or eliminate potential U.S. tax benefits resulting from Tyco International's incorporation outside of the United States or deny U.S. government contracts to Tyco based upon its jurisdiction of incorporation; |
• | natural events such as severe weather, fires, floods and earthquakes; and |
• | acts of terrorism, cyber-attacks or our inability to maintain adequate security related information networks and data. |
Item 3. Quantitative and Qualitative Disclosures About Market Risk
The Company's exposure to market risk from changes in interest rates, foreign currency exchange rates and commodity prices has not changed materially from our exposure discussed in the 2015 Form 10-K. In order to manage the volatility relating to our more significant market risks, we may enter into forward foreign currency exchange contracts, interest rate swaps and commodity swaps. As of and during the three months ended December 25, 2015, the Company did not hold or enter into any commodity derivative instruments or interest rate swaps.
We utilize established risk management policies and procedures in executing derivative financial instrument transactions. We do not execute transactions or hold derivative financial instruments for trading or speculative purposes. Derivative financial instruments related to non-functional currency cash flows are used with the goal of mitigating a significant portion of these exposures when it is cost effective to do so. Counterparties to derivative financial instruments are limited to financial institutions with strong investment grade long-term credit ratings.
Item 4. Controls and Procedures
The Company, under the supervision and with the participation of its management, including its Chief Executive Officer and Chief Financial Officer, carried out an evaluation of the effectiveness of the design and operation of its disclosure controls and procedures (as such term is defined under Rule 13a-15 of the Securities and Exchange Act (the Exchange Act)) as of the end of the period covered by this report. There are inherent limitations to the effectiveness of any system of disclosure controls
57
and procedures, including the possibility of human error and the circumvention or overriding of the controls and procedures. Accordingly, even effective disclosure controls and procedures can only provide reasonable assurance of achieving their control objectives. Based upon that evaluation, the Chief Executive Officer and Chief Financial Officer concluded that, as of December 25, 2015, the Company's disclosure controls and procedures were effective to provide reasonable assurance that information required to be disclosed in the reports that the Company files or submits under the Exchange Act is recorded, processed, summarized and reported within the time periods specified in the applicable rules and forms, and that it is accumulated and communicated to management, including the Chief Executive Officer and Chief Financial Officer, as appropriate, to allow timely decisions regarding required disclosure.
There has been no change in our internal control over financial reporting during the quarter ended December 25, 2015 that has materially affected, or is reasonably likely to materially affect, the Company's internal control over financial reporting.
PART II. OTHER INFORMATION
Item 1. Legal Proceedings
Legacy Matters Related to Former Management
As previously reported, in recent years, the Company has definitively resolved several lawsuits involving disputes with former management, including Dennis Kozlowski, the Company's former chief executive officer, and Mark Swartz, the Company's former chief financial officer.
In the first quarter of fiscal 2015, the Company reached a definitive agreement with Mark Swartz to resolve all outstanding disputes, and received approximately $12 million in cash from Mr. Swartz, $5 million of which was shared pursuant to the terms of a legacy class action lawsuit, resulting in a net recovery of $7 million for the Company, which was recorded in Selling, general and administrative expenses within the Consolidated Statement of Operations. The cash received has been classified as restricted.
Environmental Matters
Tyco is involved in various stages of investigation and cleanup related to environmental remediation matters at a number of sites. The ultimate cost of site cleanup is difficult to predict given the uncertainties regarding the extent of the required cleanup, the interpretation of applicable laws and regulations and alternative cleanup methods. As of December 25, 2015, Tyco concluded that it was probable that it would incur remedial costs in the range of approximately $22 million to $71 million. As of December 25, 2015, Tyco concluded that the best estimate within this range is approximately $32 million, of which $11 million is included in Accrued and other current liabilities and $21 million is included in Other liabilities within the Company's Consolidated Balance Sheet.
As previously disclosed, the majority of the liabilities described above relate to ongoing remediation efforts at a facility in the Company's Global Products segment located in Marinette, Wisconsin, which the Company acquired in 1990 in connection with its acquisition of, among other things, the Ansul product line. As of December 25, 2015, the Company concluded that its remaining remediation and monitoring costs related to the Marinette facility were in the range of approximately $14 million to $46 million. The Company's best estimate within that range is approximately $22 million, of which $9 million is included in Accrued and other current liabilities and $13 million is included in Other liabilities within the Company's Consolidated Balance Sheet. Although the Company has recorded its best estimate of the costs that it will incur to remediate and monitor contamination at the Marinette facility, it is possible that technological, regulatory or enforcement developments, the results of environmental studies or other factors could change the Company's expectations with respect to future charges and cash outlays, and such changes could be material to the Company's future results of operations, financial condition or cash flows.
Asbestos Matters
The Company and certain of its subsidiaries, including Grinnell LLC (“Grinnell”), along with numerous other third parties, are named as defendants in personal injury lawsuits based on alleged exposure to asbestos containing materials. Substantially all cases pending against affiliates of the Company have been filed against Grinnell, and have typically involved product liability claims based primarily on allegations of manufacture, sale or distribution of industrial products that either contained asbestos or were used with asbestos containing components.
During the third quarter of fiscal 2014, the Company, through Grinnell, resolved disputes with certain of its historical insurers and agreed that certain insurance proceeds would be used to establish and fund a qualified settlement fund (“QSF”),
58
within the meaning of the Internal Revenue Code, which would be used for the resolution primarily of Grinnell asbestos liabilities. It is intended that the QSF will receive future insurance payments and proceeds from third party insurers and, in addition, will fund and manage liabilities for certain historical operations of the Company, primarily related to Grinnell. On January 9, 2015, the Company completed a series of restructuring transactions related to the establishment and funding of a dedicated structure pursuant to which a subsidiary of the Company acquired the assets of Grinnell and transferred cash and other assets totaling approximately $278 million (not including $22 million received by the QSF during the quarter ended December 26, 2014 from historic third-party insurers in settlement of coverage disputes) to the structure. As part of the restructuring, subsidiaries in the structure assumed certain liabilities related to historic Grinnell, Scott and Figgie operations, including all historical Grinnell asbestos liabilities, and such subsidiaries purchased additional insurance by, through or from a wholly-owned subsidiary in the structure in order to supplement and enhance existing insurance assets.
The Company consolidates the qualified settlement fund and related entities that were established for the purpose of managing and resolving the liabilities described above. Although the entities in the dedicated structure serve the specific purpose of managing certain liabilities, each entity in the structure is a wholly-owned indirect subsidiary of the Company, and therefore is required to be consolidated under GAAP.
As of December 25, 2015, the Company has determined that there were approximately 3,100 claims pending against its subsidiaries, primarily Grinnell. This amount reflects the Company's current estimate of the number of viable claims made against Grinnell and includes adjustments for claims that are not actively being prosecuted, identify incorrect defendants, are duplicative of other actions or for which the Company is indemnified by third parties. Yarway Corporation is no longer a subsidiary of the Company and, as of August 2015, is no longer consolidated. Consequently, any claims pending against the Yarway Corporation are excluded from the claims pending above.
As of December 25, 2015, the Company's estimated asbestos related net liability recorded within the Company's Consolidated Balance Sheet is $27 million. The net liability within the Consolidated Balance Sheet is comprised of a liability for pending and future claims and related defense costs of $508 million, of which $19 million is recorded in Accrued and other current liabilities, and $489 million is recorded in Other liabilities. The Company also maintains separate cash, investment and other assets within the Consolidated Balance Sheet of $481 million, of which $44 million is recorded in Prepaid expenses and other current assets, and $437 million is recorded in Other assets. Assets include $6 million of cash and $267 million of investments, which have all been designated as restricted. As of September 25, 2015, the Company's estimated net liability recorded within the Company's Consolidated Balance Sheet was $28 million. The net liability was comprised of a liability for pending and future claims and related defense costs of $515 million, of which $23 million was recorded in Accrued and other current liabilities, and $492 million was recorded in Other liabilities. The Company also maintained separate cash, investment and other assets within the Consolidated Balance Sheet of $487 million, of which $38 million was recorded in Prepaid expenses and other current assets, and $449 million was recorded in Other assets. Assets included $11 million of cash and $263 million of investments, which were all designated as restricted.
The Company periodically assesses the sufficiency of its estimated liability for pending and future asbestos claims and defense costs. On a periodic basis, the Company, through the dedicated structure referred to above, evaluates actual experience regarding asbestos claims filed, settled and dismissed, amounts paid in settlements, and the recoverability of its insurance assets. If and when data from actual experience demonstrate a significant unfavorable discernible trend, the Company performs a valuation of its asbestos related liabilities and corresponding insurance assets including a comprehensive review of the underlying assumptions. In addition, the Company evaluates its ability to reasonably estimate claim activity beyond its current look-forward period (through 2056) in order to assess whether such period continues to be appropriate. In addition to claims and litigation experience, the Company considers additional qualitative and quantitative factors such as changes in legislation, the legal environment, the Company’s strategy in managing claims and obtaining insurance, including its defense strategy, and health related trends in the overall population of individuals potentially exposed to asbestos. The Company evaluates all of these factors and determines whether a change in the estimate of its liability for pending and future claims and defense costs or insurance assets is warranted.
The amounts recorded by the Company for asbestos-related liabilities and insurance-related assets are based on the Company's strategies for resolving its asbestos claims, currently available information, and a number of estimates and assumptions. Key variables and assumptions include the number and type of new claims that are filed each year, the average cost of resolution of claims, the identity of defendants, the resolution of coverage issues with insurance carriers, amount of insurance, and the solvency risk with respect to the Company's insurance carriers. Many of these factors are closely linked, such that a change in one variable or assumption will impact one or more of the others, and no single variable or assumption predominately influences the determination of the Company's asbestos-related liabilities and insurance-related assets. Furthermore, predictions with respect to these variables are subject to greater uncertainty in the later portion of the projection period. Other factors that may affect the Company's liability and cash payments for asbestos-related matters include uncertainties surrounding the litigation process from jurisdiction to jurisdiction and from case to case, reforms of state or
59
federal tort legislation and the applicability of insurance policies among subsidiaries. As a result, actual liabilities or insurance recoveries could be significantly higher or lower than those recorded if assumptions used in the Company's calculations vary significantly from actual results.
Yarway
As previously disclosed, on August 19, 2015, the Chapter 11 bankruptcy plan of Yarway Corporation, a former indirect wholly-owned subsidiary of the Company became effective and the Company contributed approximately $325 million in cash to the Yarway Trust and each of the Company Protected Parties (as such term is defined in the plan) received the benefit of a release from Yarway and an injunction under section 524(g) of the Bankruptcy Code permanently enjoining the assertion of Yarway asbestos claims against those parties. As a result of the effectiveness of the Chapter 11 plan, ownership of the Yarway Corporation was transferred to the Yarway Trust and it was deconsolidated from the Company. Upon deconsolidation, the Company recorded a $4 million loss, which is included in Selling, general and administrative expenses within the Company's Consolidated Statement of Operations during the year ended September 25, 2015.
Tax Matters
Tyco and its subsidiaries' income tax returns are examined periodically by various tax authorities. In connection with these examinations, tax authorities, including the IRS, have raised issues and proposed tax adjustments, in particular with respect to years preceding the 2007 Separation. The issues and proposed adjustments related to such years are generally subject to the sharing provisions of the 2007 Tax Sharing Agreement and Tyco's liabilities under the 2007 Tax Sharing Agreement are further subject to the sharing provisions in the 2012 Tax Sharing Agreement. Tyco has previously disclosed that in connection with U.S. federal tax audits, the IRS raised a number of issues and proposed tax adjustments for periods beginning with the 1997 tax year. Although Tyco resolved substantially all of the issues and adjustments proposed by the IRS for tax years through 2007, it was not able to resolve matters related to the treatment of certain intercompany debt transactions during the period. As a result, on June 20, 2013, Tyco received Notices of Deficiency from the IRS asserting that several of Tyco's former U.S. subsidiaries owe additional taxes of $883.3 million plus penalties of $154 million based on audits of the 1997 through 2000 tax years of Tyco and its subsidiaries as they existed at that time. In addition, Tyco received Final Partnership Administrative Adjustments for certain U.S. partnerships owned by former U.S. subsidiaries with respect to which an additional tax deficiency of approximately $30 million has been asserted. These amounts excluded interest and did not reflect the roll-forward impact on subsequent audit periods.
On January 15, 2016, Tyco entered into Stipulations of Settled Issues with the IRS intended to resolve all disputes related to the intercompany debt issues described above for the 1997 - 2000 audit cycle currently before the U.S. Tax Court. The Stipulations of Settled Issues are contingent upon the IRS Appeals Division applying the same settlement to all intercompany debt issues on appeal for subsequent audit cycles (2001 - 2007) and, if applicable, review by the United States Congress Joint Committee on Taxation.
If finalized, the tentative resolution would cover all aspects of the controversy before the U.S. Tax Court described above and before the Appeals Division of the IRS, and would result in a total cash payment to the IRS in the range of $475 million to $525 million, which includes all interest and penalties. This payment would be subject to the sharing formula in each Tax Sharing Agreement, and would be shared among Tyco, Covidien and TE Connectivity 27%, 42% and 31%, respectively, with neither ADT nor Pentair being responsible for any payment related to this amount.
Assuming the tentative resolution is finalized, Tyco does not expect to recognize any additional charges related to the resolution, as it had previously recorded sufficient reserves with respect to this controversy and its obligations under the Tax Sharing Agreements. Payment is expected to be made to the IRS, and among Tyco, Covidien and TE Connectivity, within the next six months. See Note 5 to the unaudited Consolidated Financial Statements.
Other Matters
As previously disclosed, SimplexGrinnell LP (“SG”), a subsidiary of the Company in the North America Integrated Solutions & Services segment, has been named as a defendant in lawsuits in several jurisdictions seeking damages for SG’s alleged failure to pay prevailing wages and for other pay-related claims. Through the first quarter of fiscal 2015, the Company had recorded a total of approximately $17 million in charges related to these lawsuits, which was recorded in the Cost of services within the Consolidated Statement of Operations. During the quarter ended March 27, 2015, the Company agreed in principle to settle all outstanding lawsuits for a total of approximately $14 million.
In addition to the foregoing, the Company is subject to claims and suits, including from time to time, contractual disputes and product and general liability claims, incidental to present and former operations, acquisitions and dispositions. With respect to many of these claims, the Company either self-insures or maintains insurance through third-parties, with varying deductibles.
60
While the ultimate outcome of these matters cannot be predicted with certainty, the Company believes that the resolution of any such proceedings, whether the underlying claims are covered by insurance or not, will not have a material adverse effect on the Company's financial condition, results of operations or cash flows beyond amounts recorded for such matters.
Item 1A. Risk Factors
Tyco's significant business risks are described in Part I, Item 1A in our 2015 Form 10-K, to which reference is made herein. Management does not believe that there have been any significant changes in the Company's risk factors since the Company filed the 2015 Form 10-K.
Item 2. Unregistered Sales of Equity Securities and Use of Proceeds
Issuer Purchases of Equity Securities
During the quarter ended December 25, 2015, no ordinary shares were repurchased on the New York Stock Exchange. In addition, the Company acquired 305,975 shares for approximately $11 million from certain employees in order to satisfy employee tax withholding requirements in connection with the vesting of restricted shares.
Item 3. Defaults Upon Senior Securities
None.
Item 4. Mine Safety Disclosures
None.
Item 5. Other Information
None.
Item 6. Exhibits
Exhibit Number | Exhibit | ||
31.1 | Certification by the Chief Executive Officer pursuant to 18 U.S.C. Section 1350, as Adopted Pursuant to Section 302 of the Sarbanes-Oxley Act of 2002 (Filed herewith). | ||
31.2 | Certification by the Chief Financial Officer pursuant to 18 U.S.C. Section 1350, as Adopted Pursuant to Section 302 of the Sarbanes-Oxley Act of 2002 (Filed herewith). | ||
32.1 | Certification by the Chief Executive Officer and Chief Financial Officer pursuant to 18 U.S.C. Section 1350, as Adopted Pursuant to Section 906 of the Sarbanes-Oxley Act of 2002 (Filed herewith). | ||
101 | Financial statements from the quarterly report on Form 10-Q of Tyco International plc for the quarter ended December 25, 2015 formatted in XBRL: (i) the Consolidated Statements of Operations, (ii) the Consolidated Statements of Comprehensive Income, (iii) the Consolidated Balance Sheets, (iv) the Consolidated Statements of Cash Flows, (v) the Consolidated Statements of Shareholders' Equity, and (vi) the Notes to Unaudited Consolidated Financial Statements. | ||
61
SIGNATURES
Pursuant to the requirements of Section 13 or 15(d) of the Securities Exchange Act of 1934, the Registrant has duly caused this report to be signed on its behalf by the undersigned, thereunto duly authorized.
TYCO INTERNATIONAL PLC | ||
By: | /s/ ROBERT E. OLSON | |
Robert E. Olson Executive Vice President and Chief Financial Officer (Principal Financial Officer) | ||
Date: January 29, 2016
62