Attached files
| file | filename |
|---|---|
| 8-K - 8-K - CONDOR HOSPITALITY TRUST, INC. | d73372d8k.htm |
Exhibit 99.1

Condor Hospitality Trust, Inc. Investor Presentation | October 2020
Safe Harbor Statement All statements included in this presentation, other than statements of historical fact, are or may be deemed to be “forward-looking statements” within the meaning of the safe harbor provisions of the U.S. Private Securities Litigation Reform Act of 1995. Forward-looking statements can be identified by words such as “anticipate,” “intend,” “plan,” “goal,” “seek,” “believe,” “project,” “estimate,” “expect,” “strategy,” “future,” “likely,” “may,” “should,” “will” and similar references to future periods. Forward-looking statements are neither historical facts nor assurances of future performance. Instead, they are based only on our current beliefs, expectations, and assumptions regarding the future of our business, future plans and strategies, projections, anticipated events and trends, the economy, and other future conditions. Because forward-looking statements relate to the future, they are subject to inherent uncertainties, risks, and changes in circumstances that are difficult to predict and many of which are outside of our control. Our actual results and financial condition may differ materially from those indicated in the forward-looking statements. In light of these uncertainties, the events anticipated by our forward-looking statements might not occur and we caution you not to place undue reliance on any of our forward-looking statements. Important factors that could cause our actual results and financial condition to differ materially from those indicated in any forward-looking statements are discussed under the heading “Risk Factors” in our publicly available reports filed with the Securities and Exchange Commission. The Company cautions that any forward-looking statement included in this presentation is made as of October 22, 2020 the date of this presentation and the Company does not undertake to update any forward-looking statement. Investor Inquiries Arinn Cavey Chief Financial Officer T: 402.316.1008 E: acavey@trustcondor.com Cover Images TownePlace Suites | Austin North Tech Ridge, TX

October 2020 Update
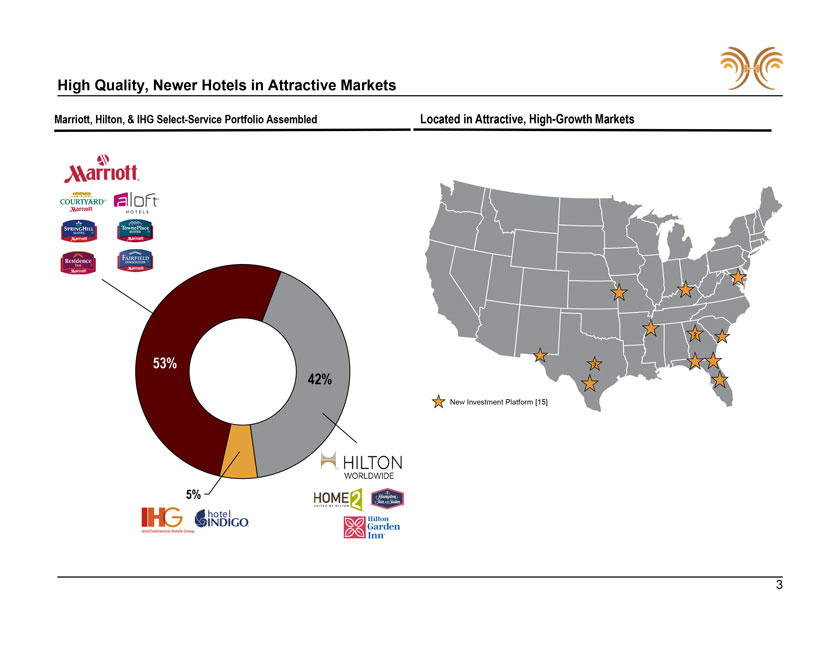
High Quality, Newer Hotels in Attractive Markets Marriott, Hilton, & IHG Select-Service Portfolio Assembled Located in Attractive, High-Growth Markets
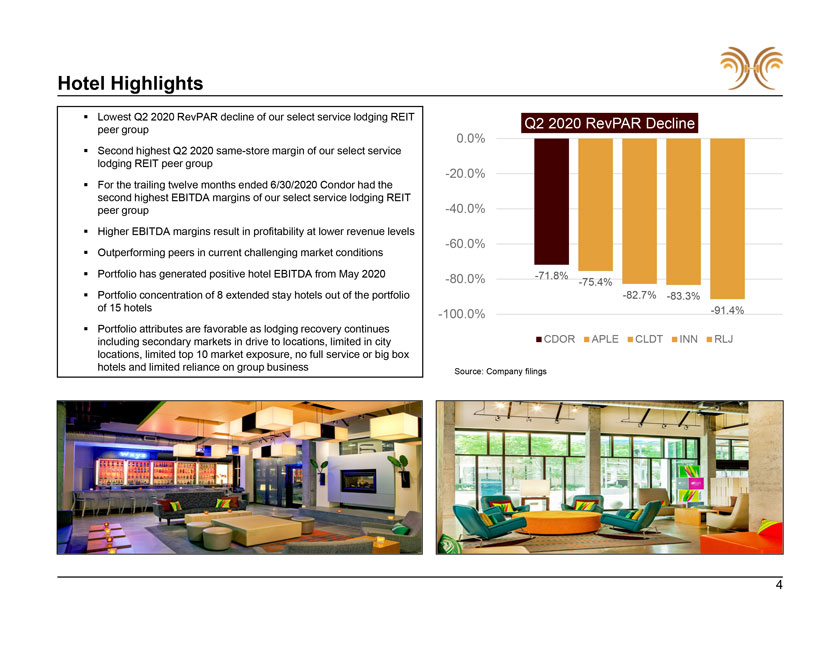
Hotel Highlights ï,§ Lowest Q2 2020 RevPAR decline of our select service lodging REIT Q2 2020 RevPAR Decline peer group 0.0% ï,§ Second highest Q2 2020 same-store margin of our select service lodging REIT peer group -20.0% ï,§ For the trailing twelve months ended 6/30/2020 Condor had the second highest EBITDA margins of our select service lodging REIT -40.0% peer group ï,§ Higher EBITDA margins result in profitability at lower revenue levels -60.0% ï,§ Outperforming peers in current challenging market conditions ï,§ Portfolio has generated positive hotel EBITDA from May 2020 -80.0% -71.8% -75.4% ï,§ Portfolio concentration of 8 extended stay hotels out of the portfolio -82.7% -83.3% of 15 hotels -91.4% -100.0% ï,§ Portfolio attributes are favorable as lodging recovery continues including secondary markets in drive to locations, limited in city CDOR APLE CLDT INN RLJ locations, limited top 10 market exposure, no full service or big box hotels and limited reliance on group business Source: Company filings
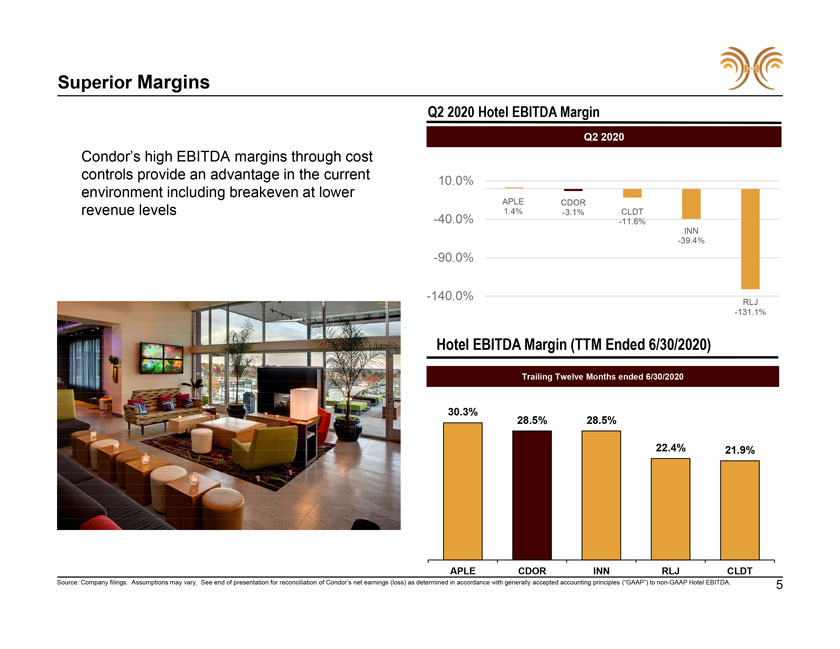
Superior Margins Q2 2020 Hotel EBITDA Margin Q2 2020 Condor’s high EBITDA margins through cost controls provide an advantage in the current 10.0% environment including breakeven at lower APLE CDOR revenue levels 1.4% -3.1% CLDT -40.0% -11.6% INN -39.4% -90.0% -140.0% RLJ -131.1% Hotel EBITDA Margin (TTM Ended 6/30/2020) Trailing Twelve Months ended 6/30/2020 30.3% 28.5% 28.5% 22.4% 21.9% APLE CDOR INN RLJ CLDT Source: Company filings. Assumptions may vary. See end of presentation for reconciliation of Condor’s net earnings (loss) as determined in accordance with generally accepted accounting principles (“GAAP”) to non-GAAP Hotel EBITDA. 5
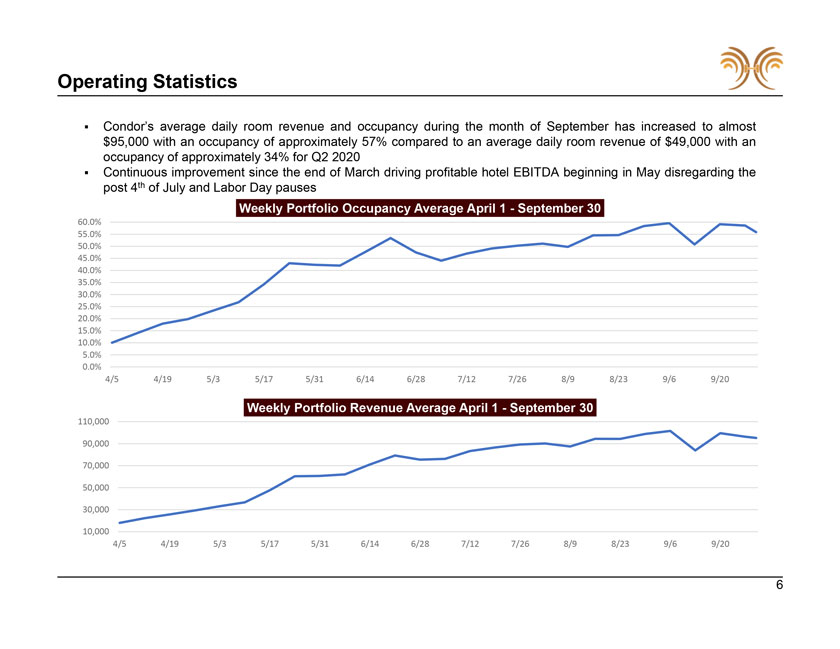
Operating Statistics ï,§ Condor’s average daily room revenue and occupancy during the month of September has increased to almost $95,000 with an occupancy of approximately 57% compared to an average daily room revenue of $49,000 with an occupancy of approximately 34% for Q2 2020ï,§ Continuous improvement since the end of March driving profitable hotel EBITDA beginning in May disregarding the post 4th of July and Labor Day pauses Weekly Portfolio Occupancy Average April 1—September 30 60.0% 55.0% 50.0% 45.0% 40.0% 35.0% 30.0% 25.0% 20.0% 15.0% 10.0% 5.0% 0.0% 4/5 4/19 5/3 5/17 5/31 6/14 6/28 7/12 7/26 8/9 8/23 9/6 9/20 Weekly Portfolio Revenue Average April 1—September 30 110,000 90,000 70,000 50,000 30,000 10,000 4/5 4/19 5/3 5/17 5/31 6/14 6/28 7/12 7/26 8/9 8/23 9/6 9/20 6
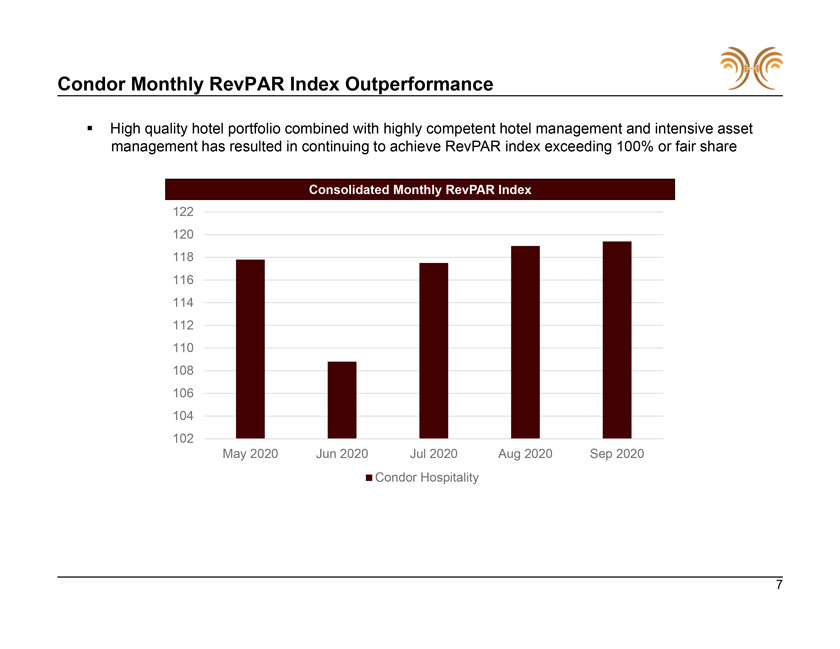
Condor Monthly RevPAR Index Outperformance ï,§ High quality hotel portfolio combined with highly competent hotel management and intensive asset management has resulted in continuing to achieve RevPAR index exceeding 100% or fair share Consolidated Monthly RevPAR Index 122 120 118 116 114 112 110 108 106 104 102 May 2020 Jun 2020 Jul 2020 Aug 2020 Sep 2020 Condor Hospitality
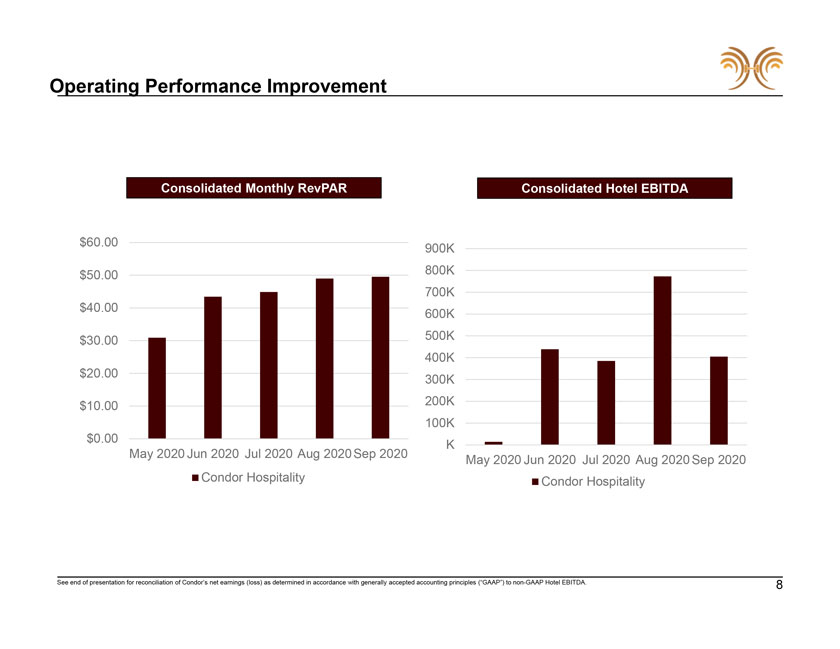
Operating Performance Improvement Consolidated Monthly RevPAR Consolidated Hotel EBITDA $60.00 900K $50.00 800K 700K $40.00 600K $30.00 500K 400K $20.00 300K $10.00 200K 100K $0.00 K May 2020 Jun 2020 Jul 2020 Aug 2020Sep 2020 May 2020 Jun 2020 Jul 2020 Aug 2020 Sep 2020 Condor Hospitality Condor Hospitality See end of presentation for reconciliation of Condor’s net earnings (loss) as determined in accordance with generally accepted accounting principles (“GAAP”) to non-GAAP Hotel EBITDA. 8
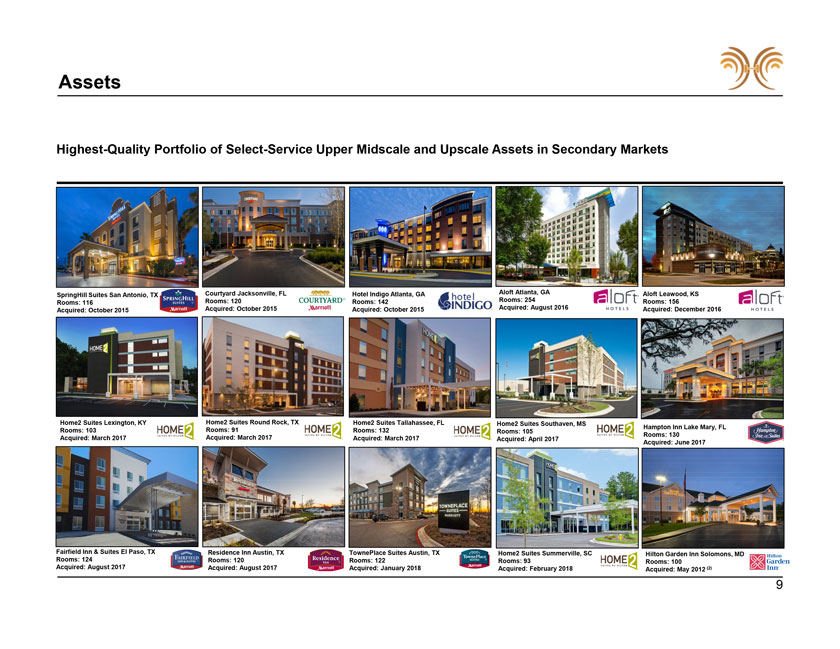
Assets Highest-Quality Portfolio of Select-Service Upper Midscale and Upscale Assets in Secondary Markets SpringHill Suites San Antonio, TX Courtyard Jacksonville, FL Hotel Indigo Atlanta, GA Aloft Atlanta, GA Aloft Leawood, KS Rooms: 116 Rooms: 120 Rooms: 142 Rooms: 254 Rooms: 156 Acquired: October 2015 Acquired: October 2015 Acquired: October 2015 Acquired: August 2016 Acquired: December 2016 Home2 Suites Lexington, KY Home2 Suites Round Rock, TX Home2 Suites Tallahassee, FL Home2 Suites Southaven, MS Hampton Inn Lake Mary, FL Rooms: 103 Rooms: 91 Rooms: 132 Rooms: 105 Rooms: 130 Acquired: March 2017 Acquired: March 2017 Acquired: March 2017 Acquired: April 2017 Acquired: June 2017 Fairfield Inn & Suites El Paso, TX Residence Inn Austin, TX TownePlace Suites Austin, TX Home2 Suites Summerville, SC Hilton Garden Inn Solomons, MD Rooms: 124 Rooms: 120 Rooms: 122 Rooms: 93 Rooms: 100 Acquired: August 2017 Acquired: August 2017 Acquired: January 2018 Acquired: February 2018 Acquired: May 2012 (2) 9
Appendix C | Non-GAAP Reconciliation
Earnings Before Interest, Taxes, Depreciation, and Amortization (“EBITDA”), EBITDAre, Adjusted EBITDAre, and Hotel EBITDA We calculate EBITDA, EBITDAre, and Adjusted EBITDAre by adding back to net earnings or loss certain non-operating expenses and certain non-cash charges which are based on historical cost accounting that we believe may be of limited significance in evaluating current performance. We believe these adjustments can help eliminate the accounting effects of depreciation and amortization and financing decisions and facilitate comparisons of core operating profitability between periods. In calculating EBITDA, we add back to net earnings or loss interest expense, loss on debt extinguishment, income tax expense, and depreciation and amortization expense. NAREIT adopted EBITDAre in order to promote an industry-wide measure of REIT operating performance. We adjust EBITDA by adding back net gain/loss on disposition of assets and impairment charges to calculate EBITDAre. To calculate Adjusted EBITDAre, we adjust EBITDAre to add back acquisition and terminated transactions expense and equity transactions expense, which are cash charges. We also add back stock –based compensation expense and gain/loss on derivatives and convertible debt, which are non-cash charges. EBITDA, EBITDAre, and Adjusted EBITDAre, as presented, may not be comparable to similarly titled measures of other companies. We believe EBITDA, EBITDAre, and Adjusted EBITDAre to be useful additional measures of our operating performance, excluding the impact of our capital structure (primarily interest expense), our asset base (primarily depreciation and amortization expense), and other items we do not believe are representative of the results from our core operations. The Company further excludes general and administrative expenses, other non-operating income or expense, and certain hotel and property operations expenses that are not allocated to individual properties in assessing hotel performance (primarily certain general liability and other insurance costs, land lease costs, and office and banking fees) from Adjusted EBITDAre to calculate Hotel EBITDA. Hotel EBITDA, as presented, may not be comparable to similarly titled measures of other companies. Hotel EBITDA is intended to isolate property level operational performance over which the Company’s hotel operators have direct control. We believe Hotel EBITDA is helpful to investors as it better communicates the comparability of our hotels’ operating results for all of the Company’s hotel properties and is used by management to measure the performance of the Company’s hotels and the effectiveness of the operators of the hotels. 11
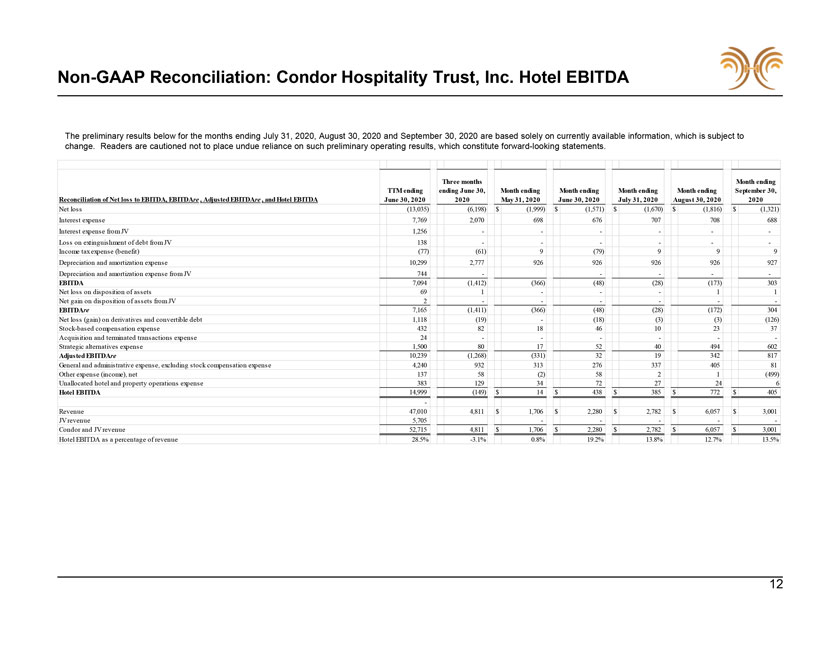
Non-GAAP Reconciliation: Condor Hospitality Trust, Inc. Hotel EBITDA The preliminary results below for the months ending July 31, 2020, August 30, 2020 and September 30, 2020 are based solely on currently available information, which is subject to change. Readers are cautioned not to place undue reliance on such preliminary operating results, which constitute forward-looking statements. Three months Month ending TTM ending ending June 30, Month ending Month ending Month ending Month ending September 30, Reconciliation of Net loss to EBITDA, EBITDAre , Adjusted EBITDAre , and Hotel EBITDA June 30, 2020 2020 May 31, 2020 June 30, 2020 July 31, 2020 August 30, 2020 2020 Net loss (13,035) (6,198) $ (1,999) $ (1,571) $ (1,670) $ (1,816) $ (1,321) Interest expense 7,769 2,070 698 676 707 708 688 Interest expense from JV 1,256 Loss on extinguishment of debt from JV 138 Income tax expense (benefit) (77) (61) 9 (79) 9 9 9 Depreciation and amortization expense 10,299 2,777 926 926 926 926 927 Depreciation and amortization expense from JV 744 -EBITDA 7,094 (1,412) (366) (48) (28) (173) 303 Net loss on disposition of assets 69 1 1 1 Net gain on disposition of assets from JV 2 -EBITDAre 7,165 (1,411) (366) (48) (28) (172) 304 Net loss (gain) on derivatives and convertible debt 1,118 (19) - (18) (3) (3) (126) Stock-based compensation expense 432 82 18 46 10 23 37 Acquisition and terminated transactions expense 24 Strategic alternatives expense 1,500 80 17 52 40 494 602 Adjusted EBITDAre 10,239 (1,268) (331) 32 19 342 817 General and administrative expense, excluding stock compensation expense 4,240 932 313 276 337 405 81 Other expense (income), net 137 58 (2) 58 2 1 (499) Unallocated hotel and property operations expense 383 129 34 72 27 24 6 Hotel EBITDA 14,999 (149) $ 14 $ 438 $ 385 $ 772 $ 405 Revenue 47,010 4,811 $ 1,706 $ 2,280 $ 2,782 $ 6,057 $ 3,001 JV revenue 5,705 -Condor and JV revenue 52,715 4,811 $ 1,706 $ 2,280 $ 2,782 $ 6,057 $ 3,001 Hotel EBITDA as a percentage of revenue 28.5% -3.1% 0.8% 19.2% 13.8% 12.7% 13.5% 12