Attached files
Table of Contents
UNITED STATES
SECURITIES AND EXCHANGE COMMISSION
WASHINGTON, D.C. 20549
FORM 10-K
| x | ANNUAL REPORT PURSUANT TO SECTION 13 OR 15(d) OF THE SECURITIES EXCHANGE ACT OF 1934 |
For the fiscal year ended December 31, 2010
OR
| ¨ | TRANSITION REPORT PURSUANT TO SECTION 13 OR 15(d) OF THE SECURITIES EXCHANGE ACT OF 1934 |
For the transition period from to
Commission file number: 001-34087
Supertel Hospitality, Inc.
(Exact name of registrant as specified in its charter)
| Virginia | 52-1889548 | |
| (State or other jurisdiction of incorporation or organization) |
(I.R.S. Employer Identification No.) | |
| 309 N. 5th St., Norfolk, NE | 68701 | |
| (Address of principal executive offices) | (Zip Code) | |
(402) 371-2520
(Registrant’s telephone number, including area code)
None
(Former name, former address and former fiscal year, if changed since last report)
Securities registered pursuant to Section 12(b) of the Act:
| Title of each class |
Name of each exchange on which registered | |
| Common Stock, $.01 par value per share |
The NASDAQ Stock Market, LLC | |
| Series A Preferred Stock, $.01 par value per share |
The NASDAQ Stock Market, LLC | |
| 10% Series B Cumulative Preferred Stock, $.01 par value per share |
The NASDAQ Stock Market, LLC |
Securities registered pursuant to Section 12(g) of the Act: None
Indicate by check mark if the registrant is a well-known seasoned issuer, as defined in Rule 405 of the Securities Act. Yes ¨ No x
Indicate by check mark if the registrant is not required to file reports pursuant to Section 13 or Section 15(d) of the Exchange Act. Yes ¨ No x
Indicate by check mark whether the registrant (1) has filed all reports required to be filed by Section 13 or 15(d) of the Securities Exchange Act of 1934 during the preceding 12 months (or for such shorter period that the registrant was required to file such reports), and (2) has been subject to such filing requirements for the past 90 days. Yes x No ¨
Indicate by check mark whether the registrant has submitted electronically and posted on its corporate Web site, if any, every Interactive Data File required to be submitted and posted pursuant to Rule 405 of Regulation S-T (§232.405 of this chapter) during the preceding 12 months (or for such shorter period that the registrant was required to submit and post such files). Yes ¨ No ¨
Indicate by check mark if disclosure of delinquent filers pursuant to Item 405 of Regulation S-K is not contained herein, and will not be contained, to the best of registrant’s knowledge, in definitive proxy or information statements incorporated by reference in Part III of this Form 10-K or any amendment to this Form 10-K. x
Indicate by check mark whether the registrant is a large accelerated filer, an accelerated filer, a non-accelerated filer, or a smaller reporting company. See definition of “accelerated filer and large accelerated filer” in Rule 12b-2 of the Exchange Act.
| Large accelerated filer | ¨ | Accelerated filer | ¨ | |||||
| Non-accelerated filer | ¨ (Do not check if a smaller reporting company) | Smaller reporting company | x | |||||
Indicate by check mark whether the registrant is a shell company (as defined in Rule 12b-2 of the Exchange Act). Yes ¨ No x
As of June 30, 2010 the aggregate market value of the registrant’s common stock held by non-affiliates of the registrant was $25.9 million based on the $1.40 closing price as reported on the Nasdaq Global Market.
Indicate the number of shares outstanding of each of the issuer’s classes of common stock, as of the latest practicable date.
| Class |
Outstanding at February 25, 2011 | |
| Common Stock, $.01 par value per share |
22,917,509 shares |
DOCUMENTS INCORPORATED BY REFERENCE
Proxy Statement for the Annual Meeting of Shareholders to be held on May 26, 2011.
Table of Contents
2
Table of Contents
| Item 1. | Business |
References to “we”, “our”, “us” and “Company” refer to Supertel Hospitality, Inc., including, as the context requires, its direct and indirect subsidiaries.
(a) Description of Business
Overview
We are a self-administered real estate investment trust (REIT), and through our subsidiaries, as of December 31, 2010 we owned 106 limited service hotels in 23 states. Our hotels operate under several national franchise and independent brands.
Our significant events for 2010 include:
| • | The Company issued an aggregate of 598,803 shares of Supertel common stock and 299,403 warrants in a private offering for aggregate gross proceeds of $1.0 million in cash; |
| • | We sold nine hotels for gross proceeds of $11.7 million and used the net proceeds to pay off the underlying mortgages and for operations; |
| • | We raised $480,000 from a standby equity distribution agreement; |
| • | Non cash impairment charges of $8.2 million were booked against hotels sold, held for sale, and held for use; and |
| • | As of December 31, 2010, we had 18 hotels classified as held for sale with a total net book value of $34.4 million. Gross proceeds from the sales are expected to be $37.8 million, and net proceeds will be used to pay off the underlying mortgages with remaining cash used for operations. |
Additionally, in March 2011, the maturity date of our credit facility with Wells Fargo Bank was extended from March 12, 2011 to September 30, 2011.
General Development of Business
We are a REIT for federal income tax purposes and we were incorporated in Virginia on August 23, 1994. Our common stock began to trade on The Nasdaq Global Market on October 30, 1996. Our Series A and Series B preferred stock began to trade on The Nasdaq Global Market on December 30, 2005 and June 3, 2008, respectively.
Through our wholly owned subsidiaries, Supertel Hospitality REIT Trust and E&P REIT Trust, we own a controlling interest in Supertel Limited Partnership and E&P Financing Limited Partnership. We conduct our business through a traditional umbrella partnership REIT, or UPREIT, in which our hotel properties are owned by our operating partnerships, Supertel Limited Partnership and E&P Financing Limited Partnership, limited partnerships, limited liability companies or other subsidiaries of our operating partnerships. We currently own, indirectly, an approximate 99% general partnership interest in Supertel Limited Partnership and a 100% partnership interest in E&P Financing Limited Partnership. In the future, these limited partnerships may issue limited partnership interests to third parties from time to time in connection with our acquisitions of hotel properties or the raising of capital.
In order for the income from our hotel property investments to constitute “rents from real properties” for purposes of the gross income tests required for REIT qualification, the income we earn cannot be derived from the
3
Table of Contents
operation of any of our hotels. Therefore, we lease each of our hotel properties to our wholly owned taxable REIT subsidiaries. Under the REIT Modernization Act (“RMA”), which became effective January 1, 2000, REITs are permitted to lease their hotels to wholly owned taxable REIT subsidiaries. We formed TRS Leasing, Inc. and its wholly owned subsidiaries TRS Subsidiary LLC; SPPR TRS Subsidiary, LLC and SPPR-BMI TRS Subsidiary, LLC (collectively the “TRS Lessee”) in accordance with the RMA. Pursuant to the RMA, the TRS Lessee is required to enter into management agreements with an “eligible independent contractor” who will manage the hotels leased by the TRS Lessee. Accordingly the hotels are leased to our taxable TRS Lessee and are managed by Royco Hotels Inc. (“Royco Hotels”) and HLC Hotels Inc. (“HLC”) pursuant to management agreements.
(b) Financial Information About Industry Segments
We are engaged primarily in the business of owning equity interests in hotel properties. Therefore, presentation of information about industry segments is not applicable. See the Consolidated Financial Statements and notes thereto included in Item 8 of this Annual Report on Form 10-K for certain financial information required in this Item 1.
(c) Narrative Description of Business
General At December 31, 2010, we owned, through our subsidiaries, 106 hotels in 23 states. The hotels are operated by Royco Hotels (95 hotels) and HLC (11 hotels).
Mission Statement Our primary objective is to consistently generate a competitive rate of return for our shareholders through a disciplined approach to real estate investing.
Sale of Hotels We may undertake the sale of one or more of the hotels from time to time in response to changes in market conditions, our current or projected return on our investment in the hotels or other factors which we deem relevant. During the year 2008, two hotels were sold, with none of our hotels being classified as held for sale as of December 31, 2008; during the year 2009, eight of our hotels were sold and 19 properties were held for sale as of December 31, 2009; and during the year 2010, nine of our hotels were sold and 18 properties were held for sale as of December 31, 2010.
Just as we carefully evaluate the hotels we plan to acquire, our asset management team periodically evaluates our existing properties to determine if an asset is likely to underperform in the market. If we determine that a property no longer is competitive in a market and has limited opportunity to be repositioned, we will look to monetize the asset in a disciplined and timely manner. The process of identifying assets for disposition is closely related to the acquisition criteria and the overall direction of the organization. Every asset is periodically reviewed by management in the context of the entire portfolio to evaluate its relative ranking against all of the properties. If an asset is determined to be underperforming our projections and is thereby no longer accretive, and has a low probability of being repositioned, we will look to dispose of the investment as soon as possible within the constraints of the market and lender’s covenants.
Internal Growth Strategy We seek to grow internally through improvements to our hotel operating results, principally through increased occupancy and average daily rates, and through reductions in operating expenses. Thus, internally generated cash flow and any residual cash flow, together with cash flow from external financing sources, will principally be used to fund ongoing capital improvements, including furniture, fixtures and equipment, to our hotels and to meet general corporate and other working capital needs as well as payment of dividends.
Acquisition Strategy Any acquisition, investment or purchase of property in excess of $5 million requires approval of the Investment Committee of our Board of Directors. Our general investment criteria are described below:
| • | hotels with proven historical cash flows of above 10% cash on cash on moderate leverage; |
4
Table of Contents
| • | hotels with brand affiliations that are producing among the best performance metrics in the sector; |
| • | hotels constructed within the last 15 years which enjoy a design consistent with contemporary standards; |
| • | hotels located in one of our existing markets where operating efficiencies can be garnered; |
| • | hotels in markets with improving demographics and stable economic drivers of growth; and |
| • | hotels containing a minimum of 80 rooms. |
Our organizational documents do not limit the types of investments we can make; however, our intent is to focus primarily on midscale without food and beverage and economy hotel properties.
Hotel Management Royco Hotels and HLC, both independent contractors, manage our hotels pursuant to hotel management agreements with TRS Lessee. The hotel management agreements provide that the management companies have control of all operational aspects of the hotels, including employee-related matters. The management companies must generally maintain each hotel under their management in good repair and condition and make routine maintenance, repairs and minor alterations. Additionally, Royco Hotels must operate the hotels in accordance with the national franchise agreements that cover the hotels, which includes, as applicable, using franchisor sales and reservation systems as well as abiding by franchisors’ marketing standards. Royco Hotels and HLC may not assign their management agreements without our consent.
The management agreements generally require TRS Lessee to fund debt service, working capital needs and capital expenditures and fund Royco Hotels’ and HLC’s third-party operating expenses, except those expenses not related to the operation of the hotels. TRS Lessee is responsible for obtaining and maintaining insurance policies with respect to the hotels.
Royco Hotels Management Fee Royco Hotels manages 95 of the hotels we owned at December 31, 2010. Royco Hotels receives a monthly base management fee and an incentive management fee, if certain financial thresholds are met or exceeded. The management agreement provides for monthly base management fees and absorbing additional operating expenses as follows:
| • | 4.25% of gross hotel income for the month for up to the first $75 million of gross hotel income for a fiscal year; |
| • | 4.00% of gross hotel income for the month for gross hotel income exceeding $75 million up to $100 million for a fiscal year; |
| • | 3.00% of gross hotel income for the month for gross hotel income exceeding $100 million for a fiscal year; |
| • | the base compensation of Royco Hotels district managers to be included in the operating expenses of TRS Lessee; and |
| • | if annual net operating income exceeds 10% of our total investment in the hotels, then Royco Hotels receives an incentive management fee of 10% of the excess of net operating income up to the first $1 million, and 20% of excess net operating income above $1 million. |
Royco Hotels Term and Termination The management agreement expires on December 31, 2011 and, unless Royco Hotels elects not to extend the term, the term of the agreement will be extended to December 31, 2016 if (i) Royco Hotels achieves average annual net operating income (“NOI”) of at least 10% of our total investment in the hotels during the four fiscal years ending December 31, 2010 and (ii) Royco Hotels does not default prior to
5
Table of Contents
December 31, 2011.
The management agreement may be terminated as follows:
| • | either of us may terminate the management agreement if NOI is not at least 8.5% of our total investment in the hotels or if we undergo a change of control; |
| • | we may terminate the agreement if Royco Hotels undergoes a change of control; |
| • | we may terminate the agreement if tax laws change to allow a hotel REIT to self manage its properties; and |
| • | by the non-defaulting party in the event of a default that has not been cured within the cure period. |
If we terminate the management agreement because we undergo a change of control, Royco Hotels undergoes a change of control due to the death of one of its principals, or due to a tax law change, then Royco Hotels will be entitled to a termination fee equal to 50% of the base management fee paid to Royco Hotels during the twelve months prior to notice of termination. Under certain circumstances, Royco Hotels will be entitled to a termination fee if we sell a hotel and do not acquire another hotel or replace the sold hotel within twelve months. The fee, if applicable, is equal to 50% of the base management fee paid with respect to the sold hotel during the prior twelve months.
In 2009 and 2010, NOI as a percentage of total hotel investment was less than 8.5%. Additionally, one of the conditions for an automatic extension of the management agreement is that an average annual NOI target of at least 10% is achieved during the four years ending December 31, 2010. Annual NOI as a percentage of total hotel investment has not exceeded 10% in 2007, 2008, 2009 and 2010.
During the fourth quarter of 2010, we solicited bids from hotel management companies to manage our hotels. We expect to complete our review process, and make our decision, if any, on a manager or managers for our hotels during the first half of 2011.
We have been advised by Royco Hotels that it believes our potential termination / nonrenewal of Royco Hotels is a breach of the management agreement between us and Royco Hotels. On December 15, 2010, Royco Hotels filed a complaint against Supertel in the District Court of Douglas County, Nebraska alleging breach of the management agreement and other complaints related to the solicitation of bids from other management companies, and seeking alleged damages. Royco Hotels has not met the NOI conditions of the agreement and consequently we do not believe that we have breached the management agreement or that any damages are due to Royco Hotels. Royco Hotels continues to manage our hotels under the management agreement.
Royco Hotels Defaults and Indemnity The following are events of default under the management agreement:
| • | the failure of Royco Hotels to diligently and efficiently operate the hotels pursuant to the management agreement; |
| • | the failure of either party to pay amounts due to the other party pursuant to the management agreement; |
| • | certain bankruptcy, insolvency or receivership events with respect to either party; |
| • | the failure of either party to perform any of their obligations under the management agreement; |
6
Table of Contents
| • | loss of the franchise license for a hotel because of Royco Hotels; |
| • | failure by Royco Hotels to pay, when due, the accounts payable for the hotels for which we have previously reimbursed Royco Hotels; and |
| • | any of the hotels fail two successive franchisor inspections if the deficiencies are within Royco Hotels’ reasonable control. |
With the exception of certain events of default as to which no grace period exists, if an event of default occurs and continues beyond the grace period set forth in the management agreement, the non-defaulting party has the option of terminating the agreement.
The management agreement provides that each party, subject to certain exceptions, indemnifies and holds harmless the other party against any liabilities stemming from certain negligent acts or omissions, breach of contract, willful misconduct or tortuous actions by the indemnifying party or any of its affiliates.
HLC Management Fee The hotel management agreement with HLC, as amended July 15, 2008, provides for HLC to operate and manage our eleven Masters Inn hotels through December 31, 2011. The agreement provides for HLC to receive management fees equal to 5.0% of the gross revenues derived from the operation of the hotels and incentive fees equal to 10% of the annual operating income of the hotels in excess of 10.5% of the Company’s investment in the hotels.
7
Table of Contents
Franchise Affiliation
Our 106 hotels owned at December 31, 2010 operate under the following national and independent brands:
| Franchise Brand |
Number of Hotels | |
| Super 8 (1) |
44 | |
| Comfort Inn/Comfort Suites (2) |
21 | |
| Hampton Inn (3) |
2 | |
| Holiday Inn Express (4) |
1 | |
| Sleep Inn (2) |
2 | |
| Days Inn (1) |
10 | |
| Ramada Limited (1) |
1 | |
| Guest House Inn/Guesthouse Inn and Suites (5) |
2 | |
| Supertel Inn (6) |
1 | |
| Savannah Suites (7) |
7 | |
| Masters Inn (6) |
11 | |
| Tara Inn (8) |
1 | |
| Baymont Inn(1) |
1 | |
| Key West Inns (9) |
1 | |
| Quality Inn (2) |
1 | |
| 106 |
| (1) | Super 8®, Ramada Limited®, Days Inn®, and Baymont Inn® are registered trademarks of Wyndham Worldwide. |
| (2) | Comfort Inn® , Comfort Suites®, Sleep Inn®, and Quality Inn® are registered trademarks of Choice Hotels International, Inc. |
| (3) | Hampton Inn® is a registered trademark of Hilton Hotels Corporation. |
| (4) | Holiday Inn Express® is a registered trademark of Six Continents Hotels, Inc. |
| (5) | Guesthouse® is a registered trademark of Guesthouse International Franchise Systems, Inc. |
| (6) | Supertel Inn® and Masters Inn® are registered trademarks of Supertel Hospitality, Inc. |
| (7) | Savannah Suites® is a registered trademark of Guest House Inn Corp. |
| (8) | Tara Inn & Suites is a registered trade name of Supertel Limited Partnership. |
| (9) | Key West Inn® is a registered trademark of Key West Inns. |
Seasonality of Hotel Business
The hotel industry is seasonal in nature. Generally, occupancy rates, revenues and operating results for hotels operating in the geographic areas in which we operate are greater in the second and third quarters of the calendar year than in the first and fourth quarters, with the exception of our hotels located in Florida, which experience peak demand in the first and fourth quarters of the year.
Competition
The hotel industry is highly competitive. Each of our hotels is located in a developed area that includes other hotel properties. The number of competitive hotel properties in a particular area could have a material adverse effect on revenues, occupancy and the average daily room rate of the hotels or at hotel properties acquired in the future. A number of our hotels have experienced increased competition in the form of newly constructed competing hotels in the local markets, and we expect the entry of new competition to continue in several additional markets over the next several years.
We may compete for investment opportunities with entities that have substantially greater financial resources than us. These entities generally may be able to accept more risk than we can prudently manage. Competition in general may reduce the number of suitable investment opportunities for us and increase the bargaining power of property owners seeking to sell. Further, we believe that competition from entities organized for purposes substantially similar to our objectives could increase significantly.
8
Table of Contents
Employees
At December 31, 2010, we had 16 employees. At December 31, 2010 Royco Hotels, manager of 95 of our hotels, and HLC, manager of 11 of our hotels, had workforces of approximately 1,468 and 196 employees, respectively, which are dedicated to the operation of the hotels.
(d) Available Information
Our executive offices are located at 309 N. 5th St, Norfolk, Nebraska 68701, our telephone number is (402) 371-2520, and we maintain an Internet website located at www.supertelinc.com. Our annual reports on Form 10-K and quarterly reports on Form 10-Q, current reports on Form 8-K, and amendments to these reports are available free of charge on our website as soon as reasonably practicable after they are filed with the SEC. We also make available the charters of our board committees and our Code of Business Conduct and Ethics on our website. Copies of these documents are available in print to any shareholder who requests them. Requests should be sent to Supertel Hospitality, Inc., 309 N. 5th St, P.O. Box 1448, Norfolk, Nebraska 68701, Attn: Corporate Secretary.
| Item 1A. | RISK FACTORS |
Risks Related to Our Business
The current economy has negatively impacted the hotel industry and our business.
The current difficulties in the credit markets, a soft economy and apprehension among consumers have negatively impacted the hotel industry and our business. In recent years, the slowing economy has caused a softening in business travel, especially among construction-related workers, a particularly strong guest group for many of our hotels. Accordingly, our financial results and growth could be harmed if the economic slowdown continues for a significant period or becomes worse.
The weak economy may impact our current borrowings.
As discussed in “Liquidity and Capital Resources” below and Note 6 of our financial statements contained herein, during March 2011 we asked for and received waivers of certain covenants from lenders. If our plans to meet our liquidity requirements in the weak economy are not successful, we may violate our future loan covenants. If we violate covenants in our indebtedness agreements, we could be required to repay all or a portion of our indebtedness before maturity at a time when we might be unable to arrange financing for such repayment on favorable terms, if at all.
The impact of the weak economy on lenders may impact our future borrowings.
The weakness of the national economy has increased the financial instability of some lenders. As a result, we expect lenders may continue to maintain tight lending standards, which could make it more difficult for us to obtain future revolving credit facilities on terms similar to the terms of our current revolving credit facilities or to obtain long-term financing on favorable terms or at all. Our financial condition and results of operations would be adversely affected if we were unable to obtain cost-effective financing.
We cannot assure you that we will qualify, or remain qualified, as a REIT.
We currently are taxed as a REIT, and we expect to qualify as a REIT for future taxable years, but we cannot assure you that we will remain qualified as a REIT. If we fail to remain qualified as a REIT, all of our earnings will be subject to federal income taxation, which will reduce the amount of cash available for distribution to our stockholders, and we will not be required to distribute our income to our stockholders.
Litigation with our primary hotel manager and any transition to one or more new managers could disrupt our hotel operations and present other risks.
9
Table of Contents
During the fourth quarter of 2010, we solicited bids from hotel management companies to manage our hotels. We expect to complete our review process, and make a decision, if any, on a manager or managers for our hotels during the first half of 2011.
Our management agreement with Royco Hotels, the manager of a majority of our hotels, terminates on December 31, 2011, and is subject to an automatic five-year extension thereafter if certain conditions are met. In addition, provisions in the management agreement permit either party to terminate the management agreement on 60 days notice if a net operating income (“NOI”) target of 8.5% of total investment in hotels is not achieved for a fiscal year. In 2009 and 2010, NOI as a percentage of total hotel investment was less than 8.5%. Additionally, one of the conditions for an automatic extension of the management agreement is that an average annual NOI target of at least 10% is achieved during the four years ending December 31, 2010. Annual NOI as a percentage of total hotel investment has not exceeded 10% in 2007, 2008, 2009 and 2010.
We have been advised by Royco Hotels that it believes our potential termination / nonrenewal of Royco Hotels is a breach of the management agreement between us and Royco Hotels. On December 15, 2010, Royco Hotels filed a complaint against us in the District Court of Douglas County, Nebraska alleging breach of the management agreement and other complaints related to the solicitation of bids from other management companies, and seeking alleged damages. Royco Hotels has not met the NOI conditions of the agreement and consequently we do not believe that we have breached the management agreement or that any damages are due to Royco Hotels. Royco Hotels continues to manage our hotels under the management agreement.
We may experience decreased occupancy and other significant disruptions at our hotels and in our operations generally due to the litigation with Royco Hotels and transition to one or more new hotel managers. In addition, any new hotel managers may operate other hotels that may compete with our hotels or divert attention away from the management of our hotels, may require management agreements with terms that are not favorable to us and may not be successful in managing our hotels.
Current economic conditions have adversely affected the valuation of our hotels which may result in further impairment charges on our properties.
We analyze our assets for impairment when events or circumstances occur that indicate an asset’s carrying value may not be recoverable. For impaired assets, we record an impairment charge equal to the excess of the property’s carrying value over its fair value. Our operating results for 2010 and 2009 included $8.2 million and $24.1 million, respectively, of impairment charges related to our hotels sold, held for sale, and held for use. As a result of continued economic weakness, we may incur additional impairment charges, which will negatively affect our results of operations. We can provide no assurance that any impairment loss recognized would not be material to our results of operations.
Our returns depend on management of our hotels by third parties.
In order to qualify as a REIT, we cannot operate any hotel or participate in the decisions affecting the daily operations of any hotel. Under the REIT Modernization Act of 1999, REITs are permitted to lease their hotels to TRSs. However, a TRS, such as TRS Lessee, may not operate or manage the leased hotels and, therefore, must enter into management agreements with third-party eligible independent contractors to manage the hotels. Thus, an independent operator under a management agreement with TRS Lessee controls the daily operations of each of our hotels.
Under the terms of the management agreements between TRS Lessee and Royco Hotels and HLC, our ability to participate in operating decisions regarding the hotels is limited. We depend on Royco Hotels and HLC to adequately operate our hotels as provided in the management agreements. We do not have the authority to require any hotel to be operated in a particular manner or to govern any particular aspect of the daily operations of any hotel (for instance, setting room rates). Thus, even if we believe our hotels are being operated inefficiently or in a manner
10
Table of Contents
that does not result in satisfactory occupancy rates, revenue per available room and average daily rates, we may not be able to force Royco Hotels or HLC to change their methods of operation of our hotels. We can only seek redress if a management company violates the terms of the management agreement with TRS Lessee, and then only to the extent of the remedies provided for under the terms of the applicable management agreement. If any of the foregoing occurs at franchised hotels, our relationship with the franchisors may be damaged, and we may be in breach of one or more of our franchise agreements. Additionally, in the event that we need to replace a management company, we may experience decreased occupancy and other significant disruptions at our hotels and in our operations generally.
Failure of the hotel industry to continue to improve or remain stable may adversely affect our ability to execute our business strategies, which, in turn, would adversely affect our ability to make distributions to our stockholders.
Our business strategy is focused in the hotel industry, and we cannot assure you that hotel industry fundamentals will continue to improve or remain stable. Economic slowdown and world events outside our control, such as terrorism, have adversely affected the hotel industry in the recent past and if these events reoccur, may adversely affect the industry in the future. In the event conditions in the hotel industry do not continue to improve or remain stable, our ability to execute our business strategies will be adversely affected, which, in turn, would adversely affect our ability to make distributions to our stockholders.
Arranging financing for acquisitions and dispositions of hotels is difficult in the current capital markets.
The capital markets are weakened as a consequence of the weak economy. Although we will continue to carefully evaluate and discuss both buying and selling opportunities, debt and equity financing could be a challenge to obtain for acquisitions and dispositions of hotels.
We face competition for the acquisition of hotels and we may not be successful in identifying or completing hotel acquisitions that meet our criteria, which may impede our growth.
One component of our business strategy is expansion through acquisitions, and we may not be successful in identifying or completing acquisitions that are consistent with our strategy, particularly in the current economy. We compete with institutional pension funds, private equity investors, REITs, hotel companies and others who are engaged in the acquisition of hotels. This competition for hotel investments may increase the price we pay for hotels and these competitors may succeed in acquiring those hotels that we seek to acquire. Furthermore, our potential acquisition targets may find our competitors to be more attractive suitors because they may have greater marketing and financial resources, may be willing to pay more or may have a more compatible operating philosophy. In addition, the number of entities competing for suitable hotels may increase in the future, which would increase demand for these hotels and the prices we must pay to acquire them. If we pay higher prices for hotels, our returns on investment and profitability may be reduced. Also, future acquisitions of hotels or hotel companies may not yield the returns we expect and may result in stockholder dilution.
Our TRS lessee structure subjects us to the risk of increased operating expenses.
Our hotel management agreements require us to bear the operating risks of our hotel properties. Our operating risks include not only changes in hotel revenues and changes in TRS Lessee’s ability to pay the rent due under the leases, but also increased operating expenses, including, among other things:
| • | wage and benefit costs; |
| • | repair and maintenance expenses; |
| • | energy costs; |
| • | property taxes; |
11
Table of Contents
| • | insurance costs; and |
| • | other operating expenses. |
Any decreases in hotel revenues or increases in operating expenses could have a material adverse effect on our earnings and cash flow.
Our debt service obligations could adversely affect our operating results, may require us to liquidate our properties and limit our ability to make distributions to our stockholders.
We seek to maintain a total stabilized debt level of no more than 40% to 55% of our aggregate property investment at cost. We, however, may change or eliminate this target at any time without the approval of our stockholders. At January 31, 2011, our debt to property investment was approximately 52.3%. In the future, we and our subsidiaries may incur substantial additional debt, including secured debt. Incurring such debt could subject us to many risks, including the risks that:
| • | our cash flow from operations will be insufficient to make required payment of principal and interest; |
| • | we may be more vulnerable to adverse economic and industry conditions; |
| • | we may be required to dedicate a substantial portion of our cash flow from operations to the repayment of our debt, thereby reducing the cash available for distribution to our stockholders, funds available for operations and capital expenditures, future investment opportunities or other purposes; |
| • | the terms of any refinancing may not be as favorable as the terms of the debt being refinanced; and |
| • | the use of leverage could adversely affect our stock price and the ability to make distributions to our stockholders. |
If we violate covenants in our indebtedness agreements, we could be required to repay all or a portion of our indebtedness before maturity at a time when we might be unable to arrange financing for such repayment on favorable terms, if at all. Our Great Western Bank and Wells Fargo Bank credit facilities contain cross-default provisions which would allow Great Western Bank and Wells Fargo Bank to declare a default and accelerate our indebtedness to them if we default on certain other loans, and such default would permit that lender to accelerate our indebtedness under any such loan.
Approximately $23.3 million of the Company’s debt is scheduled to mature in 2011. If we do not have sufficient funds to repay our debt at maturity, we intend to refinance this debt through additional debt financing, private or public offerings of debt securities, or additional equity financings. If, at the time of any refinancing, prevailing interest rates or other factors result in higher interest rates on refinancings, increases in interest expense could adversely affect our cash flow, and, consequently, our cash available for distribution to our stockholders. If we are unable to refinance our debt on acceptable terms, we may be forced to dispose of our hotel properties on disadvantageous terms, potentially resulting in losses adversely affecting cash flow from operating activities. In addition, we may place mortgages on our hotel properties to secure our line of credit or other debt. To the extent we cannot meet these debt service obligations, we risk losing some or all of those properties to foreclosure. Additionally, our debt covenants could impair our planned strategies and, if violated, result in a default of our debt obligations.
Higher interest rates could increase debt service requirements on our floating rate debt and could reduce the amounts available for distribution to our stockholders, as well as reduce funds available for our operations, future investment opportunities or other purposes. At January 31, 2011, approximately 25.3% of our debt had floating rates. We may obtain in the future one or more forms of interest rate protection—in the form of swap agreements, interest rate cap contracts or similar agreements—to “hedge” against the possible negative effects of
12
Table of Contents
interest rate fluctuations. However, we cannot assure you that any hedging will adequately mitigate the adverse effects of interest rate increases or that counterparties under these agreements will honor their obligations. In addition, we may be subject to risks of default by hedging counterparties. Adverse economic conditions could also cause the terms on which we borrow to be unfavorable.
Our ability to make distributions on our common and preferred stock is subject to fluctuations in our financial performance, operating results and capital improvement requirements.
As a REIT, we generally are required to distribute annually at least 90% of our REIT taxable income, determined without regard to the dividends paid deduction, each year to our stockholders. Downturns in our operating results and financial performance or unanticipated capital improvements to our hotel properties may affect our ability to declare or pay distributions to our stockholders. Further, we may not generate sufficient cash in order to fund distributions to our stockholders, which may require us to sell assets or borrow money to satisfy the REIT distribution requirements.
Among the factors which could adversely affect our results of operations and our distributions to stockholders are reduced net operating profits or operating losses, increased debt service requirements and capital expenditures at our hotel properties. Among the factors which could reduce our net operating profits are decreases in hotel property revenues and increases in hotel property operating expenses. Hotel property revenue can decrease for a number of reasons, including increased competition from a new supply of rooms and decreased demand for rooms. These factors can reduce both occupancy and room rates at our hotel properties.
The timing and amount of distributions are in the sole discretion of our Board of Directors, which will consider, among other factors, our actual results of operations, debt service requirements, capital expenditure requirements for our properties and our operating expenses. We suspended our quarterly common stock dividend in March 2009 to preserve our capital in a difficult economic environment. Our future dividends on our preferred stock may be reduced or also suspended if economic circumstances warrant.
We have restrictive debt covenants that could adversely affect our ability to run our business.
We file quarterly loan compliance certificates with certain of our lenders. Weakness in the economy, and the lodging industry at large, may result in our non-compliance with our loan covenants. Such non-compliance with our loan covenants may result in our lenders restricting the use of our operating funds for capital improvements to our existing hotels, including improvements required by our franchise agreements or calling the debt. We cannot assure you that our loan covenants will permit us to maintain our historic business strategy.
Our restrictive debt covenants may jeopardize our tax status as a REIT.
To maintain our REIT status, we generally must distribute at least 90% of our REIT taxable income to our stockholders annually. In addition, we are subject to a 4% non-deductible excise tax if the actual amount distributed to shareholders in a calendar year is less than a minimum amount specified under the federal income tax laws. In the event we do not comply with our debt service obligations, our lenders may limit our ability to make distributions to our shareholders, which could adversely affect our REIT status.
13
Table of Contents
Operating our hotels under franchise agreements could adversely affect distributions to our shareholders.
Eighty six of our hotels operate under third party franchise agreements and we are subject to the risks of concentrating our hotel investments in several franchise brands. These risks include reductions in business following negative publicity related to any one of our particular brands. Risks associated with our brands could adversely affect our lease revenues and the amounts available for distribution to our shareholders.
The maintenance of the franchise licenses for our hotels is subject to our franchisors’ operating standards and other terms and conditions. Our franchisors periodically inspect our hotels to ensure that we and TRS Lessee follow their standards. Failure to maintain these standards or other terms and conditions could result in a franchise license being canceled. As a condition of our continued holding of a franchise license, a franchisor could also possibly require us to make capital expenditures, even if we do not believe the capital improvements are necessary or desirable or will result in an acceptable return on our investment. Nonetheless, we may risk losing a franchise license if we do not make franchisor-required capital expenditures.
If a franchisor terminates the franchise license, we may try either to obtain a suitable replacement franchise or to operate the hotel without a franchise license. The loss of a franchise license could materially and adversely affect the operations or the underlying value of the hotel because of the loss of associated name recognition, marketing support and centralized reservation systems provided by the franchisor. Loss of a franchise license for several of our hotels could materially and adversely affect our revenues. This loss of revenues could, therefore, also adversely affect our cash available for distribution to shareholders.
Our inability to obtain financing could limit our growth.
We are required to distribute at least 90% of our REIT taxable income to our shareholders each year in order to continue to qualify as a REIT. Our debt service obligations and distribution requirements limit our ability to fund capital expenditures, acquisitions and hotel development through retained earnings. Our ability to grow through acquisitions or development of hotels will be limited if we cannot obtain debt or equity financing.
Neither our articles of incorporation nor our bylaws limit the amount of debt we can incur. Our Board of Directors can implement and modify a debt limitation policy without shareholder approval. We cannot assure you that we will be able to obtain additional equity financing or debt financing or that we will be able to obtain any financing on favorable terms.
We may not be able to complete development of new hotels on time or within budget.
We may develop hotel properties as suitable opportunities arise. New project development is subject to a number of risks that could cause increased costs or delays in our ability to generate revenue from any development hotel, reducing our cash available for distribution to shareholders. These risks include:
| • | construction delays or cost overruns that may increase project costs; |
| • | competition for suitable development sites; |
| • | receipt of zoning, land use, building, construction, occupancy and other required governmental permits and authorizations; and |
| • | substantial development costs in connection with projects that are not completed. |
We may not be able to complete the development of any projects we begin and, if completed, our development and construction activities may not be completed in a timely manner or within budget.
14
Table of Contents
We may also rehabilitate hotels that we believe are underperforming. These rehabilitation projects will be subject to the same risks as development projects.
Hotels that we develop have no operating history and may not achieve levels of occupancy that result in levels of operating income that provide us with an attractive return on our investment.
The new hotels that we may develop will have no operating history. These hotels, both during the start-up period and after they have stabilized, may not achieve anticipated levels of occupancy, average daily room rates, or gross operating margins, and could result in operating losses and reduce the amount of distributions to our shareholders.
Joint venture investments could be adversely affected by our lack of sole decision-making authority, our reliance on a co-venturer’s financial condition and disputes between us and our co-venturers.
We may co-invest in the future with third parties through partnerships, joint ventures or other entities, acquiring non-controlling interests in or sharing responsibility for managing the affairs of a property, partnership, joint venture or other entity. In such event, we would not be in a position to exercise sole decision-making authority regarding the property, partnership, joint venture or other entity. Investments in partnerships, joint ventures, or other entities may, under certain circumstances, involve risks not present were a third party not involved, including the possibility that partners or co-venturers might become bankrupt or fail to fund their share of required capital contributions. Investments in joint ventures may require that we provide the joint venture entity with the right of first offer or right of first refusal to acquire any new property we consider acquiring directly. Partners or co-venturers may have economic or other business interests or goals which are inconsistent with our business interests or goals, and may be in a position to take actions contrary to our policies or objectives. Such investments may also have the potential risk of impasses on decisions, such as a sale, because neither we nor the partner or co-venturer would have full control over the partnership or joint venture. Disputes between us and partners or co-venturers may result in litigation or arbitration that would increase our expenses and prevent our officers and/or directors from focusing their time and effort on our business. Consequently, actions by, or disputes with, partners or co-venturers might result in subjecting properties owned by the partnership or joint venture to additional risk. We may also, in certain circumstances, be liable for the actions of our third-party partners or co-venturers. For example, we may be required to guarantee indebtedness incurred by a partnership, joint venture or other entity for the purchase or renovation of a hotel property. Such a guarantee may be on a joint and several basis with our partner or co-venturer in which case we may be liable in the event such party defaults on its guaranty obligation.
Our business could be disrupted if we need to find a new manager upon termination of an existing management agreement.
If Royco Hotels, HLC, or any other hotel managers that we engage fails to materially comply with the terms of the management agreement, we have the right to terminate the management agreement. Upon termination, we would have to find another manager to manage the property. We cannot operate the hotels directly due to federal income tax restrictions. We cannot assure you that we would be able to find another manager or that, if another manager were found, we would be able to enter into a new management agreement favorable to us. In addition, any new manager may operate other hotels that may compete with our hotels or divert attention away from the management of our hotels and may not be successful in managing our hotels. Our franchisors may require us to make substantial capital improvements to the hotels prior to their approval, if required, of a new manager. There would be disruption during any change of hotel management that could adversely affect our operating results and reduce our distributions to our shareholders. For example, we are currently involved in litigation with Royco Hotels and may transition to one or more new hotel managers. Information and risks related to our litigation with Royco Hotels and transition to one or more new managers is discussed above in the risk factor titled “Litigation with our primary hotel manager and any transition to one or more new managers could disrupt our hotel operations and present other risks.”
We may not be able to sell hotels on favorable terms.
We sold nine hotels in 2010, and we sold eight hotels in 2009. At December 31, 2010, we have eighteen hotel properties held for sale. We may not be able to sell such hotels on favorable terms, and such hotels may be sold at a loss. As with acquisitions, we face competition for buyers of our hotel properties. Other sellers of hotels may have
15
Table of Contents
the financial resources to dispose of their hotels on unfavorable terms that we would be unable to accept. If we cannot find buyers for any properties that are designated for sale, we will not be able to implement our disposition strategy. In the event that we cannot fully execute our disposition strategy or realize the benefits therefrom, we may not be able to satisfy our liquidity needs (including meeting our debt service obligations) and will not be able to fully execute our growth strategy.
Geographic concentration of our hotels will make our business vulnerable to economic downturns in the Midwestern and Eastern United States.
Most of our hotels are located in the Midwestern and Eastern United States. Economic conditions in the Midwestern and Eastern United States will significantly affect our revenues and the value of our hotels. Business layoffs or downsizing, industry slowdowns, changing demographics and other similar factors may adversely affect the economic climate in these areas. Any resulting oversupply or reduced demand for hotels in the Midwestern and Eastern United States and our markets in particular would therefore have a disproportionate negative impact on our revenues and limit our ability to make distributions to stockholders.
Unanticipated expenses and insufficient demand for hotels we acquire in new geographic markets could adversely affect our profitability and our ability to make distributions to our stockholders.
As part of our business plan, we may develop or acquire hotels in geographic areas in which our management may have little or no operating experience and in which potential customers may not be familiar with our franchise brands. As a result, we may have to incur costs relating to the opening, operation and promotion of those new hotel properties that are substantially greater than those incurred in other areas. These hotels may attract fewer customers than our existing hotels, while at the same time, we may incur substantial additional costs with these new hotel properties. Unanticipated expenses and insufficient demand at a new hotel property, therefore, could adversely affect our profitability and our ability to make distributions to our stockholders.
An economic recession and industry downturn could adversely affect our results of operations.
If room supply outpaces demand, our operating margins may deteriorate and we may be unable to execute our business plan. In addition, if this trend continues, we may be unable to continue to meet our debt service obligations or to obtain necessary additional financing.
Our borrowing costs are sensitive to fluctuations in interest rates.
Higher interest rates could increase debt service requirements on our floating rate debt including any borrowings under our credit facilities. Any borrowings under our credit facilities having floating interest rates may increase due to market conditions. Adverse economic conditions could also cause the terms on which we borrow to be unfavorable. We could be required to liquidate one or more of our hotel investments at times which may not permit us to receive an attractive return on our investments in order to meet our debt service obligations.
Future acquisitions may not yield the returns expected, may result in disruptions to our business, may strain management resources, may not be efficiently integrated into operations, and may result in stockholder dilution.
Our business strategy may not ultimately be successful and may not provide positive returns on our investments. Acquisitions may cause disruptions in our operations and divert management’s attention away from day-to-day operations. If the integration of our acquisitions into our management companies’ operations is not accomplished as efficiently as planned, we will not achieve the expected operating results from the acquisitions. The issuance of equity securities in connection with any acquisition could be substantially dilutive to our stockholders.
16
Table of Contents
We depend on key personnel.
We depend on the efforts and expertise of our executive officers to drive our day-to-day operations and strategic business direction. The loss of any of their services could have an adverse effect on our operations. Our ability to replace key individuals may be difficult because of the limited number of individuals with the breadth of skills and experience needed to excel in the hotel industry. There can be no assurance that we would be able to hire, train, retain or motivate such individuals.
Risks Related to the Hotel Industry
Our ability to make distributions to our shareholders may be affected by factors in the hotel industry that are beyond our control.
Operating Risks
Our hotels are subject to various operating risks found throughout the hotel industry. Many of these risks are beyond our control. These include, among other things, the following:
| • | competitors with substantially greater marketing and financial resources than us; |
| • | over-building in our markets, which adversely affects occupancy and revenues at our hotels; |
| • | dependence on business and commercial travelers and tourism; |
| • | terrorist incidents which may deter travel; |
| • | increases in hotel operating costs, energy costs, airline fares and other expenses, which may affect travel patterns and reduce the number of business and commercial travelers and tourists; and |
| • | adverse effects of general, regional and local economic conditions. |
These factors could adversely affect the amount of rent we receive from leasing our hotels and reduce the net operating profits of TRS Lessee, which in turn could adversely affect our ability to make distributions to our shareholders. Decreases in room revenues of our hotels will result in reduced operating profits for TRS Lessee and decreased lease revenues to our company under our current percentage leases with TRS Lessee.
Competition and Financing for Acquisitions
We compete for investment opportunities with entities that have substantially greater financial resources than we do. These entities generally may be able to accept more risk than we can manage wisely. This competition may generally limit the number of suitable investment opportunities offered to us. This competition may also increase the bargaining power of property owners seeking to sell to us, making it more difficult for us to acquire new properties on attractive terms. Additionally, current economic conditions present difficult challenges to obtaining financing for acquisitions.
Seasonality of Hotel Business
The hotel industry is seasonal in nature. Generally, occupancy rates, hotel revenues, and operating results are greater in the second and third quarters than in the first and fourth quarters, with the exception of our hotels located in Florida. This seasonality can be expected to cause quarterly fluctuations in our lease revenues. Our quarterly earnings may be adversely affected by factors outside our control, including bad weather conditions and poor economic factors. As a result, we may have to enter into short-term borrowings in our first and fourth quarters in order to offset these fluctuations in revenues.
17
Table of Contents
Investment Concentration in Particular Segments of Single Industry
Our current investment strategy, adopted in 2009 as a response to near term and projected long term market trends, is to acquire interests in well-located, midscale properties with national flags, while divesting underperforming and/or non-branded hotels. Our entire business is hotel-related. Therefore, a downturn in the hotel industry in general will have a material adverse effect on our lease revenues and amounts available for distribution to our shareholders.
Capital Expenditures
Our hotels have an ongoing need for renovations and other capital improvements, including replacements, from time to time, of furniture, fixtures and equipment. The franchisors of our hotels also require periodic capital improvements as a condition of keeping the franchise licenses. The costs of all of these capital improvements could adversely affect our financial condition and reduce the amounts available for distribution to our shareholders. These renovations may give rise to the following risks:
| • | possible environmental problems; |
| • | construction cost overruns and delays; |
| • | a possible shortage of available cash to fund renovations and the related possibility that financing for these renovations may not be available to us on affordable terms; and |
| • | uncertainties as to market demand or a loss of market demand after renovations have begun. |
For the twelve months ended December 31, 2010, we spent approximately $4.3 million for capital improvements to our hotels.
Recent economic trends, the military action in Afghanistan and Iraq and prospects for future terrorist acts and military action have adversely affected the hotel industry generally, and similar future events could adversely affect the industry in the future.
Terrorist attacks and the after-effects (including the prospects for more terror attacks in the United States and abroad), combined with economic trends and the U.S. led military action in Afghanistan and Iraq, substantially reduced business and leisure travel and lodging industry RevPAR generally. We cannot predict the extent to which these factors will directly or indirectly impact your investment in our common stock, the lodging industry or our operating results in the future. Declining RevPAR at our hotels would reduce our net income and restrict our ability to fund capital improvements at our hotels and our ability to make distributions to stockholders necessary to maintain our status as a REIT. Additional terrorist attacks, acts of war or similar events could have further material adverse effects on the markets on which shares of our stock will trade, the lodging industry in general and our operations in particular.
Uninsured and underinsured losses could adversely affect our operating results and our ability to make distributions to our stockholders.
We intend to maintain comprehensive insurance on each of our hotel properties, including liability, fire and extended coverage, of the type and amount we believe are customarily obtained for or by hotel owners. There are no assurances that current coverage will continue to be available at reasonable rates. Various types of catastrophic losses, like earthquakes and floods, losses from foreign or domestic terrorist activities, may not be insurable or may not be economically insurable. Initially, we do not expect to obtain terrorism insurance on our hotel properties because it is costly. Lenders may require such insurance and our failure to obtain such insurance could constitute a default under loan agreements. Depending on our access to capital, liquidity and the value of the properties securing the affected loan in relation to the balance of the loan, a default could reduce our net income and limit our ability to obtain future financing.
In the event of a substantial loss, our insurance coverage may not be sufficient to cover the full current market value or replacement cost of our lost investment. Should an uninsured loss or a loss in excess of insured limits occur, we could lose all or a portion of the capital we have invested in a hotel, as well as the anticipated future revenue
18
Table of Contents
from the hotel. In that event, we might nevertheless remain obligated for any mortgage debt or other financial obligations related to the property. Inflation, changes in building codes and ordinances, environmental considerations and other factors might also keep us from using insurance proceeds to replace or renovate a hotel after it has been damaged or destroyed. Under those circumstances, the insurance proceeds we receive might be inadequate to restore our economic position on the damaged or destroyed property.
The hotel business is capital intensive, and our inability to obtain financing could limit our growth.
Our hotel properties will require periodic capital expenditures and renovation to remain competitive. Acquisitions or development of additional hotel properties will require significant capital expenditures. See our risk factors above concerning the impact of the weakening economy on capital markets, the hotel industry and borrowing. The lenders under some of the mortgage debt that we will assume will require us to set aside varying amounts each year for capital improvements at our hotels. We may not be able to fund capital improvements or acquisitions solely from cash provided from our operating activities because we must distribute at least 90% of our REIT taxable income, excluding net capital gains, each year to maintain our REIT tax status. Consequently, we rely upon the availability of debt or equity capital to fund hotel acquisitions and improvements. As a result, our ability to fund capital expenditures, acquisitions or hotel development through retained earnings is very limited. Our ability to grow through acquisitions or development of hotels will be limited if we cannot obtain satisfactory debt or equity financing which will depend on market conditions. Neither our charter nor our bylaws limits the amount of debt that we can incur. However, we cannot assure you that we will be able to obtain additional equity or debt financing or that we will be able to obtain such financing on favorable terms.
Noncompliance with governmental regulations could adversely affect our operating results.
Environmental Matters
Our hotel properties are subject to various federal, state and local environmental laws. Under these laws, courts and government agencies have the authority to require the owner of a contaminated property to clean up the property, even if the owner did not know of or was not responsible for the contamination. These laws also apply to persons who owned a property at the time it became contaminated. In addition to the costs of cleanup, contamination can affect the value of a property and, therefore, an owner’s ability to borrow funds using the property as collateral.
Under these environmental laws, courts and government agencies also have the authority to require that a person who sent waste to a waste disposal facility, like a landfill or an incinerator, pay for the clean-up of that facility if it becomes contaminated and threatens human health or the environment. Furthermore, court decisions have established that third parties may recover damages for injury caused by property contamination. For instance, a person exposed to asbestos while staying in a hotel may seek to recover damages if he suffers injury from the asbestos. Lastly, some of these environmental laws restrict the use of a property or place conditions on various activities at a property. One example is laws that require a business using chemicals to manage them carefully and to notify local officials that the chemicals are being used.
Our company could be responsible for the costs discussed above if it found itself in one or more of these situations. The costs to clean up a contaminated property, to defend against a claim, or to comply with environmental laws could be material and could affect the funds available for distribution to our shareholders. To determine whether any costs of this nature might be required, we commissioned Phase I environmental site assessments, or “ESAs” before we acquired our hotels, and in 2002, commissioned new ESAs for 32 of our hotels in conjunction with a refinancing of the debt obligations of those hotels. These studies typically included a review of historical information and a site visit, but not soil or groundwater testing. We obtained the ESAs to help us identify whether we might be responsible for cleanup costs or other costs in connection with our hotels. The ESAs on our hotels did not reveal any environmental conditions that are likely to have a material adverse effect on our business, assets, results of operations or liquidity. However, ESAs do not always identify all potential problems or environmental liabilities. Consequently, we may have material environmental liabilities of which we are unaware.
Americans with Disabilities Act and Other Changes in Governmental Rules and Regulations
Under the Americans with Disabilities Act of 1990, or ADA, all public accommodations must meet various
19
Table of Contents
federal requirements related to access and use by disabled persons. Compliance with the ADA’s requirements could require removal of access barriers and non-compliance could result in the U.S. government imposing fines or in private litigants obtaining damages. If we were required to make substantial modifications to our hotels, whether to comply with the ADA or other changes in governmental rules and regulations, our ability to make distributions to our shareholders and meet our other obligations could be adversely affected.
General Risks Related to the Real Estate Industry
Illiquidity of real estate investments could significantly impede our ability to respond to adverse changes in the performance of our properties and harm our financial condition.
Because real estate investments are relatively illiquid, our ability to promptly sell one or more hotel properties or investments in our portfolio in response to changing economic, financial and investment conditions may be limited. In addition, our management agreements with Royco Hotels and HLC require us to pay a termination fee upon the sale of a certain number of hotels, which will limit our ability to sell hotel properties. The real estate market is affected by many factors that are beyond our control, including:
| • | adverse changes in international, national, regional and local economic and market conditions; |
| • | changes in interest rates and in the availability, cost and terms of debt financing; |
| • | changes in governmental laws and regulations, fiscal policies and zoning ordinances and the related costs of compliance with laws and regulations, fiscal policies and ordinances; |
| • | the ongoing need for capital improvements, particularly in older structures; |
| • | changes in operating expenses; and |
| • | civil unrest, acts of God, including earthquakes, floods and other natural disasters and acts of war or terrorism, including the consequences of terrorist acts such as those that occurred on September 11, 2001, which may result in uninsured losses. |
We may decide to sell our hotel properties in the future. We cannot predict whether we will be able to sell any hotel property or investment for the price or on the terms set by us, or whether any price or other terms offered by a prospective purchaser would be acceptable to us. We also cannot predict the length of time needed to find a willing purchaser and to close the sale of a hotel property or loan.
We may be required to expend funds to correct defects or to make improvements before a hotel property can be sold. We cannot assure you that we will have funds available to correct those defects or to make those improvements. In acquiring a hotel property, we may agree to lock-out provisions that materially restrict us from selling that hotel property for a period of time or impose other restrictions, such as limitation on the amount of debt that can be placed or repaid on that hotel property. These facts and any others that would impede our ability to respond to adverse changes in the performance of our hotel properties could have a material adverse effect on our operating results and financial condition, as well as our ability to make distributions to stockholders.
Our hotels may contain or develop harmful mold, which could lead to liability for adverse health effects and costs of remediating the problem.
When excessive moisture accumulates in buildings or on building materials, mold growth may occur, particularly if the moisture problem remains undiscovered or is not addressed over a period of time. Some molds may produce airborne toxins or irritants. Concern about indoor exposure to mold has been increasing, as exposure to mold may cause a variety of adverse health effects and symptoms, including allergic or other reactions. As a result, the presence of significant mold at any of our properties could require us to undertake a costly remediation program to contain or remove the mold from the affected property, which would reduce our cash available for distribution,
20
Table of Contents
and we could face legal claims from guests. In addition, the presence of significant mold could expose us to liability from our guests, employees or our management companies and others if property damage or health concerns arise.
Risks Related to our Organization and Structure
Our failure to qualify as a REIT under the federal tax laws would result in adverse tax consequences.
The federal income tax laws governing REITs are complex.
We currently operate as a REIT under the federal income tax laws. The REIT qualification requirements are extremely complex, however, and interpretations of the federal income tax laws governing qualification as a REIT are limited. Accordingly, we cannot be certain that we would be successful in operating so that we can qualify as a REIT. At any time, new laws, interpretations, or court decisions may change the federal tax laws or the federal income tax consequences of our qualification as a REIT. We have not applied for or obtained rulings from the Internal Revenue Service that we will qualify as a REIT.
Failure to qualify as a REIT would subject us to federal income tax.
If we fail to qualify as a REIT in any taxable year, we will be subject to federal income tax on our taxable income. We might need to borrow money or sell assets in order to pay any such tax. If we cease to be a REIT, we no longer would be required to distribute most of our taxable income to our stockholders. Unless we were entitled to relief under certain federal income tax laws, we could not re-elect REIT status during the four calendar years after the year in which we failed to qualify as a REIT.
Failure to make required distributions would subject us to tax.
In order to qualify as a REIT, we generally are required to distribute at least 90% of our REIT taxable income, determined without regard to the dividends paid deduction, each year to our stockholders. To the extent that we satisfy this distribution requirement, but distribute less than 100% of our taxable income, we will be subject to federal income tax on our undistributed taxable income. In addition, we will be subject to a 4% non-deductible excise tax if the actual amount that we pay out to our stockholders in a calendar year is less than a minimum amount specified under federal tax laws. As a result, for example, of differences between cash flow and the accrual of income and expenses for tax purposes, or of nondeductible expenditures, our REIT taxable income in any given year could exceed our cash available for distribution. In addition, to the extent we may retain earnings of TRS Lessee in those subsidiaries, such amount of cash would not be available for distribution to our stockholders to satisfy the 90% distribution requirement. Accordingly, we may be required to borrow money or sell assets to make distributions sufficient to enable us to pay out enough of our taxable income to satisfy the distribution requirement and to avoid federal corporate income tax and the 4% non-deductible excise tax in a particular year.
The formation of TRS Lessee increases our overall tax liability.
TRS Lessee is subject to federal and state income tax on its taxable income, which in the case of TRS Lessee currently consists and generally will continue to consist of revenues from the hotel properties leased by TRS Lessee, net of the operating expenses for such properties and rent payments to us. Accordingly, although our ownership of TRS Lessee allows us to participate in the operating income from our hotel properties in addition to receiving rent, that operating income is fully subject to income tax. Such taxes could be substantial. The after-tax net income of TRS Lessee is available for distribution to us.
We incur a 100% excise tax on transactions with TRS Lessee that are not conducted on an arm’s-length basis. For example, to the extent that the rent paid by TRS Lessee exceeds an arm’s-length rental amount, such amount potentially is subject to the excise tax. We intend that all transactions between us and TRS Lessee will continue to be conducted on an arm’s-length basis and, therefore, that the rent paid by TRS Lessee to us will not be subject to the excise tax.
21
Table of Contents
Complying with REIT requirements may cause us to forego attractive opportunities that could otherwise generate strong risk-adjusted returns and instead pursue less attractive opportunities, or none at all.
To continue to qualify as a REIT for federal income tax purposes, we must continually satisfy tests concerning, among other things, the sources of our income, the nature and diversification of our assets, the amounts we distribute to our stockholders and the ownership of our stock. Thus, compliance with the REIT requirements may hinder our ability to operate solely on the basis of generating strong risk-adjusted returns on invested capital for our stockholders.
Complying with REIT requirements may force us to liquidate otherwise attractive investments, which could result in an overall loss on our investments.
To continue to qualify as a REIT, we must also ensure that at the end of each calendar quarter at least 75% of the value of our assets consists of cash, cash items, government securities and qualified REIT real estate assets. The remainder of our investment in securities (other than government securities and qualified real estate assets) generally cannot include more than 10% of the outstanding voting securities of any one issuer or more than 10% of the total value of the outstanding securities of any one issuer. In addition, in general, no more than 5% of the value of our assets (other than government securities and qualified real estate assets) can consist of the securities of any one issuer, and no more than 20% of the value of our total securities can be represented by securities of one or more TRSs. If we fail to comply with these requirements at the end of any calendar quarter, we must correct such failure within 30 days after the end of the calendar quarter to avoid losing our REIT status and suffering adverse tax consequences. If we fail to comply with these requirements at the end of any calendar quarter, we may be able to preserve our REIT status by benefiting from certain statutory relief provisions. Except with respect to a de minimis failure of the 5% asset test or the 10% vote or value test, we can maintain our REIT status only if the failure was due to reasonable cause and not to willful neglect. In that case, we will be required to dispose of the assets causing the failure within six months after the last day of the quarter in which we identified the failure, and we will be required to pay an additional tax of the greater of $50,000 or the product of the highest applicable tax rate (currently 35%) multiplied by the net income generated on those assets. As a result, we may be required to liquidate otherwise attractive investments.
Taxation of dividend income could make our common stock less attractive to investors and reduce the market price of our common stock.
At any time, the federal income tax laws governing REITs or the administrative interpretations of those laws may be amended. Any of those new laws or interpretations may take effect retroactively and could adversely affect us or you as a stockholder. Legislation enacted in 2003, 2006, and 2010 generally reduced the maximum rate of tax applicable to individuals, trusts and estates on dividend income from regular C corporations to 15.0% through 2012. This reduced substantially the so-called “double taxation” (that is, taxation at both the corporate and stockholder levels) that has generally applied to corporations that are not taxed as REITs. Generally, dividends from REITs do not qualify for the dividend tax reduction because, as a result of the dividends paid deduction to which REITs are entitled, REITs generally do not pay corporate level tax on income that they distribute to stockholders. As a result of that legislation, individual, trust, and estate investors could view stocks of non-REIT corporations as more attractive relative to shares of REITs than was the case previously because the dividends paid by non-REIT corporations are subject to lower tax rates for such investors.
Provisions of our charter may limit the ability of a third party to acquire control of our company.
In order to maintain our REIT qualification, no more than 50% in value of our outstanding capital stock may be owned, directly or indirectly, by five or fewer individuals (as defined in the federal income tax laws to include various kinds of entities) during the last half of any taxable year. Our articles of incorporation contain the ownership limitation, which prohibits both direct and indirect ownership of more than 9.9% of the outstanding shares of our common stock or 9.9% of any series of our preferred stock by any person, subject to several exceptions. Generally, any shares of our capital stock owned by affiliated owners will be added together for purposes of the ownership limitation.
These ownership limitations may prevent an acquisition of control of our company by a third party without our
22
Table of Contents
board of directors’ approval, even if our stockholders believe the change of control is in their best interests. Our charter authorizes our board of directors to issue shares of common stock and shares of preferred stock, and to set the preferences, rights and other terms of the preferred stock. Furthermore, our board of directors may, without any action by the stockholders, amend our charter from time to time to increase or decrease the aggregate number of shares of stock of any class or series of preferred stock that we have authority to issue. Issuances of additional shares of stock may have the effect of delaying, deferring or preventing a transaction or a change in control of our company that might involve a premium to the market price of our common stock or otherwise be in our stockholders’ best interests.
Our ownership limitation may prevent you from engaging in certain transfers of our capital stock.
If anyone transfers shares in a way that would violate the ownership limitation described above or prevent us from continuing to qualify as a REIT under the federal income tax laws, we will consider the transfer to be null and void from the outset, and the intended transferee of those shares will be deemed never to have owned the shares. Those shares instead will be transferred to a trust for the benefit of a charitable beneficiary and will be either redeemed by our company or sold to a person whose ownership of the shares will not violate the ownership limitation. Anyone who acquires shares in violation of the ownership limitation or the other restrictions on transfer in our articles of incorporation bears the risk that he will suffer a financial loss when the shares are redeemed or sold if the market price of our stock falls between the date of purchase and the date of redemption or sale.
We may be subject to the 100% prohibited transaction tax on the gain recognized on the hotels we sold.
A REIT will incur a 100% tax on the net income derived from any sale or other disposition of property that the REIT holds primarily for sale to customers in the ordinary course of a trade or business. We undertook specific disposition programs beginning in 2001 (that included the sale of 23 hotels through December 31, 2004) and 2008 (that included the sale of nineteen hotels through December 31, 2010). We held the disposed hotels for an average period of nine years and did not acquire the hotels for purposes of resale. Accordingly, we do not believe any of those hotels were held primarily for sale in the ordinary course of our trade or business. However, if the Internal Revenue Service would successfully assert that we held such hotels primarily for sale in the ordinary course of our business, the gain from such sales could be subject to a 100% prohibited transaction tax.
The ability of our board of directors to change our major corporate policies may not be in your interest.
Our board of directors determines our major corporate policies, including our acquisition, financing, growth, operations and distribution policies. Our board may amend or revise these and other policies from time to time without the vote or consent of our stockholders.
| Item 1B. | Unresolved Staff Comments |
None.
23
Table of Contents
| Item 2. | Properties |
Our Company headquarters is located in Norfolk, Nebraska in an office building owned by us. The following table sets forth certain information with respect to the hotels owned by us as of December 31, 2010:
| Hotel Brand |
Rooms | Hotel Brand |
Rooms | Hotel Brand |
Rooms | |||||||||||
| Super 8 |
Baymont Inn | Holiday Inn Express | ||||||||||||||
| Aksarben-Omaha, NE |
73 | Brooks, KY | 65 | Harlan, KY |
62 | |||||||||||
| Antigo, WI |
52 | Comfort Inn /Comfort Suites | Key West Inns | |||||||||||||
| Batesville, AR |
49 | Alexandria, VA | 150 | Key Largo, FL |
40 | |||||||||||
| Billings, MT |
106 | Beacon Marina-Solomons, MD | 60 | Masters Inn | ||||||||||||
| Boise, ID |
108 | Chambersburg, PA | 63 | Charleston, SC |
150 | |||||||||||
| Burlington, IA |
62 | Culpeper, VA | 49 | Columbia, SC (I26) |
112 | |||||||||||
| Clarinda, IA |
40 | Dover, DE | 64 | Columbia, SC (Knox Abbott) |
109 | |||||||||||
| Clinton, IA |
62 | Erlanger, KY | 145 | Doraville, GA |
88 | |||||||||||
| Columbus, GA |
74 | Farmville, VA | 51 | Garden City, GA |
128 | |||||||||||
| Columbus, NE |
63 | Fayetteville, NC | 120 | Marietta, GA |
87 | |||||||||||
| Cornhusker—Lincoln, NE |
133 | Fort Wayne, IN | 127 | Mt. Pleasant, SC |
119 | |||||||||||
| Creston, IA |
121 | Glasgow, KY | 60 | Seffner, FL (East Tampa) |
120 | |||||||||||
| El Dorado, KS |
49 | Lafayette, IN | 62 | Tampa, FL (Fairgrounds) |
127 | |||||||||||
| Fayetteville, AR |
83 | Louisville, KY | 69 | Tucker, GA |
107 | |||||||||||
| Ft. Madison, IA |
40 | Marion, IN | 62 | Tuscaloosa, AL |
151 | |||||||||||
| Green Bay, WI |
83 | Minocqua, WI | 51 | Quality Inn | ||||||||||||
| Hays, KS |
76 | Morgantown, WV | 80 | Danville, KY |
63 | |||||||||||
| Iowa City, IA |
84 | New Castle, PA | 79 | Ramada Limited | ||||||||||||
| Jefferson City, MO |
77 | Princeton, WV | 51 | Ellenton, FL |
73 | |||||||||||
| Keokuk, IA |
61 | Rocky Mount, VA | 61 | Savannah Suites | ||||||||||||
| Kirksville, MO |
61 | Sheboygan, WI | 59 | Augusta, GA |
172 | |||||||||||
| Manhattan, KS |
85 | South Bend, IN | 135 | Chamblee, GA |
120 | |||||||||||
| Menomonie, WI |
81 | Warsaw, IN | 71 | Greenville, SC |
170 | |||||||||||
| Moberly, MO |
60 | Days Inn | Jonesboro, GA |
172 | ||||||||||||
| Mt. Pleasant, IA |
55 | Alexandria, VA | 200 | Pine Street - Atlanta, GA |
164 | |||||||||||
| Muscatine, IA |
63 | Ashland, KY | 63 | Savannah, GA |
160 | |||||||||||
| Norfolk, NE |
64 | Bossier City, LA | 176 | Stone Mountain, GA |
140 | |||||||||||
| O’Neill, NE |
72 | Farmville, VA | 59 | Sleep Inn | ||||||||||||
| Omaha, NE |
116 | Fredericksburg, VA (North) | 120 | Louisville, KY |
63 | |||||||||||
| Pella, IA |
40 | Fredericksburg, VA (South) | 156 | Omaha, NE |
90 | |||||||||||
| Pittsburg, KS |
64 | Glasgow, KY | 59 | Supertel Inn | ||||||||||||
| Portage, WI |
61 | Shreveport, LA | 148 | Creston, IA |
41 | |||||||||||
| Sedalia, MO |
87 | Sioux Falls, SD (Airport) | 86 | Tara Inn & Suites | ||||||||||||
| Shawano, WI |
55 | Sioux Falls, SD (Empire) | 79 | Jonesboro, GA |
127 | |||||||||||
| Storm Lake, IA |
59 | Guest House Inn | Total | 9,355 | ||||||||||||
| Terre Haute, IN |
117 | Ellenton, FL | 63 | |||||||||||||
| Tomah, WI |
65 | Jackson, TN | 114 | |||||||||||||
| Watertown, SD |
57 | Hampton Inn | ||||||||||||||
| Wayne, NE |
40 | Cleveland, TN | 59 | |||||||||||||
| West “O”—Lincoln, NE |
82 | Shelby, NC | 76 | |||||||||||||
| West Dodge—Omaha, NE |
101 | |||||||||||||||
| West Plains, MO |
49 | |||||||||||||||
| Wichita—(Park City), KS |
59 | |||||||||||||||
| Wichita, KS |
119 | |||||||||||||||
Additional property information is found in Item 8 Schedule III of this Annual Report on Form 10-K.
24
Table of Contents
| Item 3. | Legal Proceedings |
Litigation
Various claims and legal proceedings arise in the ordinary course of business and may be pending against the Company and its properties. Based upon the information available, the Company believes that the resolution of any of these claims and legal proceedings should not have a material adverse affect on its consolidated financial position, results of operations or cash flows. Three separate lawsuits have been filed against the Company in Jefferson Circuit Court, Louisville, Kentucky; one lawsuit filed by a plaintiff on June 26, 2008, a second lawsuit filed by fourteen plaintiffs on December 15, 2008 and a third lawsuit filed by six plaintiffs on January 16, 2009. The plaintiffs in the three cases, now consolidated as one action, allege that as guests at the Company’s hotel in Louisville, Kentucky, they were exposed to carbon monoxide as a consequence of a faulty water heater at the hotel. The plaintiffs have also sued the plumbing company which performed repairs on the water heater at the hotel.
Plaintiffs are seeking to recover for damages arising out of physical and mental injury, lost wages, pain and suffering, past and future medical expenses and punitive or exemplary damages. At this time, the Company has reached agreement to settle the claims, subject to court approval for certain minor plaintiffs, and one settlement has been paid. The settlements were made with authorization from the insurers and the Company has recorded a liability for the amount of the unpaid claims and a receivable reflecting recoverability of the claim from the insurers.
The Company’s management agreement with Royco Hotels, the manager of a majority of the Company’s hotels, terminates on December 31, 2011, and is subject to an automatic five year extension thereafter if certain conditions are met. In addition, provisions in the management agreement permit either party to terminate the management agreement on 60 days notice if a net operating income (“NOI”) target of 8.5% of total investment in hotels is not achieved for a fiscal year. In 2009 and 2010, NOI as a percentage of total hotel investment was less than 8.5%. Additionally, one of the conditions for an automatic extension of the management agreement is that an average annual NOI target of at least 10% is achieved during the four years ending December 31, 2010. Annual NOI as a percentage of total hotel investment has not exceeded 10% in 2007, 2008, 2009 and 2010.
During the fourth quarter of 2010, the Company solicited bids from hotel management companies to manage the Company’s hotels. The Company expects to complete its review process, and make its decision, if any, on a manager or managers for its hotels during the first half of 2011.
The Company has been advised by Royco Hotels that it believes the Company’s potential termination / nonrenewal of Royco Hotels is a breach of the management agreement between the Company and Royco Hotels. On December 15, 2010, Royco Hotels filed a complaint against Supertel in the District Court of Douglas County, Nebraska alleging breach of the management agreement and other complaints related to the solicitation of bids from other management companies, and seeking alleged damages. Royco Hotels has not met the NOI conditions of the agreement and consequently the Company does not believe that it has breached the management agreement or that any damages are due to Royco Hotels. Royco Hotels continues to manage our hotels under the management agreement.
| Item 4. | (Removed and Reserved) |
Executive Officers of the Company as of March 7, 2011
The following are executive officers of the Company as of March 7, 2011:
Kelly A. Walters, Director, President and Chief Executive Officer. Mr. Walters joined the Company and became President and Chief Executive Officer on April 14, 2009 as the successor to Paul Schulte, the firm’s co-founder and then president. Mr. Walters, age 50, is a former Senior Vice President for North Dakota-based Investors Real Estate Trust (IRET), a self-advised equity real estate investment trust. Prior to IRET, he was Senior Vice President and Chief Investment Officer of Omaha based Magnum Resources, Inc., a privately held real estate investment and operating company. Preceding Magnum Resources, Walters was an officer and senior portfolio manager at Brown Brothers Harriman & Company in Chicago. He also held investment positions with Peter Kiewit
25
Table of Contents
Sons’ Inc. He holds a B.S.B.A. degree in banking and finance from the University of Nebraska at Omaha and an EMBA from the University of Nebraska.
Corrine L. Scarpello, Senior Vice President and Chief Financial Officer. Ms. Scarpello became Chief Financial Officer of the Company on August 31, 2009. She joined the Company in November 2005 having worked for a year as a consultant for the Company and its management company. Ms. Scarpello, age 56, previously worked for Mutual of Omaha for 17 years, serving as the Vice President of Accounting and Administration for a subsidiary and as Manager in their mergers and acquisitions department. Ms. Scarpello also has accounting and auditing experience with PricewaterhouseCoopers (formerly Coopers and Lybrand) and is a CPA. Ms. Scarpello is currently a director of Nature Technology Corp., a biotech company. Ms. Scarpello is a graduate of the University of Nebraska at Omaha.
Steven C. Gilbert, Senior Vice President and Chief Operating Officer. Mr. Gilbert joined the Company as Senior Vice President of CAP-EX in July 2001 and became Chief Operating Officer on August 27, 2009. Mr. Gilbert, age 62, had previously served as Senior Vice President of CAP-EX for Humphrey Hospitality Management, Inc. (1999-2001) and for old Supertel Hospitality, Inc. (1991-1999). Mr. Gilbert worked in various sales, purchasing and construction management positions prior to joining old Supertel Hospitality, Inc. in 1991.
David L. Walter, Senior Vice President and Treasurer. Mr. Walter joined the Company as Controller, September 1, 2004. Mr. Walter, age 63, previously served as a Vice President and Controller of Emprise Financial Corporation since March 1998. The position was managing the accounting department for the holding company and four bank charters. Mr. Walter also served the prior 26 years in Banking as Vice President, Treasurer and Controller, in functions of lending, appraising and accounting. Mr. Walter is a graduate of Newman University, Wichita, Kansas, with a Bachelor of Science in Business.
| Item 5. | Market for the Registrant’s Common Equity / Related Shareholder Matters and Issuer Purchases of Equity Securities. |
(a) Market Information
The common stock trades on the Nasdaq Global Market under the symbol “SPPR.” The closing sales price for the common stock on February 21, 2011 was $1.88 per share. The table below sets forth the high and low sales prices per share reported on the Nasdaq Global Market for the periods indicated.
| Supertel Hospitality,
Inc. Common Stock |
||||||||
| High | Low | |||||||
| 2009 |
||||||||
| First Quarter |
$ | 2.10 | $ | 0.82 | ||||
| Second Quarter |
$ | 1.85 | $ | 0.83 | ||||
| Third Quarter |
$ | 2.35 | $ | 1.47 | ||||
| Fourth Quarter |
$ | 2.24 | $ | 1.31 | ||||
| 2010 |
||||||||
| First Quarter |
$ | 1.97 | $ | 1.41 | ||||
| Second Quarter |
$ | 2.22 | $ | 1.40 | ||||
| Third Quarter |
$ | 1.60 | $ | 1.14 | ||||
| Fourth Quarter |
$ | 2.00 | $ | 1.20 | ||||
26
Table of Contents
(b) Holders
As of February 21, 2011, the approximate number of holders of record of the common stock was 128 and the approximate number of beneficial owners was 3,903.
(c) Dividends
No dividends on common stock were paid for 2009 and 2010. The actual amount of future dividends will be determined by the board of directors based on the actual results of operations, economic conditions, capital expenditure requirements and other factors that the board of directors deems relevant.
PERFORMANCE GRAPH
The following graph compares the yearly percentage change in the cumulative total shareholder return on our common stock for the period December 31, 2005 through December 31, 2010, with the cumulative total return on the SNL securities Hotel REIT Index (“Hotel REITs Index”) and the NASDAQ Composite (“NASDAQ—Total US Index”) for the same period. The Hotel REITs Index is comprised of publicly traded REITs that focus on investments in hotel properties. The NASDAQ Composite is comprised of all United States common shares traded on the NASDAQ Stock Market (previously titled NASDAQ—Total US). The comparison assumes a starting investment of $100 on December 31, 2005 in our common stock and in each of the indices shown, and assumes that all dividends are reinvested. The performance graph is not necessarily indicative of future investment performance.
27
Table of Contents
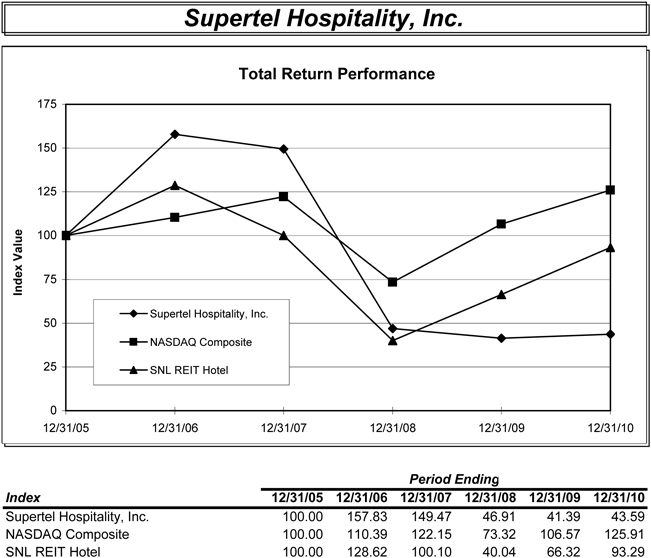
Source : SNL Financial LC, Charlottesville, VA
© 2011
| Item 6. | Selected Financial Data |
The following table sets forth our selected financial information. The selected operating data and balance sheet data have been extracted from our consolidated financial statements for each of the periods presented and should be read in conjunction with “Management’s Discussion and Analysis of Financial Condition and Results of Operations” and the consolidated financial statements and notes thereto included elsewhere in this Annual Report on Form 10-K.
28
Table of Contents
| (In thousands, except per share data) | As of and for the Years Ended December 31, | |||||||||||||||||||
| 2010 | 2009 | 2008 | 2007 | 2006 | ||||||||||||||||
| Operating data (1): |
||||||||||||||||||||
| Room rentals and other hotel services (2) |
$ | 84,114 | $ | 81,570 | $ | 90,996 | $ | 82,412 | $ | 63,335 | ||||||||||
| Net earnings (loss) from continuing operations |
(5,477 | ) | (11,044 | ) | 2,094 | 2,746 | 2,441 | |||||||||||||
| Discontinued operations |
(5,125 | ) | (16,481 | ) | 5,165 | 1,669 | 1,614 | |||||||||||||
| Net earnings (loss) |
(10,602 | ) | (27,525 | ) | 7,259 | 4,415 | 4,055 | |||||||||||||
| Noncontrolling interest |
17 | 130 | (603 | ) | (337 | ) | (334 | ) | ||||||||||||
| Net earnings (loss) attributable to controlling interests |
(10,585 | ) | (27,395 | ) | 6,656 | 4,078 | 3,721 | |||||||||||||
| Preferred stock dividends |
(1,474 | ) | (1,474 | ) | (1,160 | ) | (948 | ) | (1,215 | ) | ||||||||||
| Net earnings (loss) attributable to common shareholders |
(12,059 | ) | (28,869 | ) | 5,496 | 3,130 | 2,506 | |||||||||||||
| Adjusted EBITDA (3) |
11,573 | (1,916 | ) | 35,784 | 29,230 | 20,883 | ||||||||||||||
| FFO (4) |
(1,627 | ) | (16,892 | ) | 14,897 | 15,358 | 11,189 | |||||||||||||
| Weighted average number of shares outstanding: |
||||||||||||||||||||
| basic |
22,556 | 21,647 | 20,840 | 20,197 | 12,261 | |||||||||||||||
| diluted for EPS calculation |
22,556 | 21,647 | 20,840 | 20,217 | 12,272 | |||||||||||||||
| diluted for FFO per share calculation |
22,556 | 21,647 | 22,346 | 22,343 | 14,960 | |||||||||||||||
| Net earnings per common share from continuing operations—basic |
(0.31 | ) | (0.58 | ) | 0.03 | 0.07 | 0.08 | |||||||||||||
| Net earnings per common share from discontinued operations—basic |
(0.22 | ) | (0.75 | ) | 0.23 | 0.08 | 0.12 | |||||||||||||
| Net earnings per common share basic |
(0.53 | ) | (1.33 | ) | 0.26 | 0.15 | 0.20 | |||||||||||||
| Net earnings per common share diluted |
(0.53 | ) | (1.33 | ) | 0.26 | 0.15 | 0.20 | |||||||||||||
| FFO per share—basic |
(0.07 | ) | (0.78 | ) | 0.71 | 0.76 | 0.91 | |||||||||||||
| FFO without impairment, a non-cash item, per share—basic |
0.29 | 0.34 | 0.73 | 0.76 | 0.91 | |||||||||||||||
| FFO per share—diluted |
(0.07 | ) | (0.78 | ) | 0.70 | 0.73 | 0.83 | |||||||||||||
| FFO without impairment, a non-cash item, per share—diluted |
0.29 | 0.34 | 0.71 | 0.73 | 0.83 | |||||||||||||||
| Total assets |
256,644 | 274,395 | 321,477 | 311,025 | 202,148 | |||||||||||||||
| Total debt |
175,010 | 189,513 | 202,806 | 196,840 | 94,878 | |||||||||||||||
| Net cash flow: |
||||||||||||||||||||
| Provided by operating activities |
7,672 | 6,101 | 20,605 | 16,640 | 13,558 | |||||||||||||||
| Provided (used) by investing activities |
6,865 | 12,025 | (22,558 | ) | (104,153 | ) | (49,633 | ) | ||||||||||||
| Provided (used) by financing activities |
(14,632 | ) | (18,410 | ) | 1,499 | 83,243 | 40,348 | |||||||||||||
| Dividends per share (5) |
— | — | 0.4625 | 0.48 | 0.405 | |||||||||||||||
| Reconciliation of Weighted average number of shares for EPS diluted to FFO diluted: |
||||||||||||||||||||
| EPS diluted shares |
22,556 | 21,647 | 20,840 | 20,217 | 12,272 | |||||||||||||||
| Common stock issuable upon exercise or conversion of: |
||||||||||||||||||||
| Warrants |
— | — | — | 8 | — | |||||||||||||||
| Series A Preferred Stock (6) |
— | — | 1,506 | 2,118 | 2,688 | |||||||||||||||
| FFO diluted shares |
22,556 | 21,647 | 22,346 | 22,343 | 14,960 | |||||||||||||||
29
Table of Contents
| (In thousands, except per share data) | As of and for the Years Ended December 31, | |||||||||||||||||||
| 2010 | 2009 | 2008 | 2007 | 2006 | ||||||||||||||||
| RECONCILIATION OF NET EARNINGS (LOSS) TO ADJUSTED EBITDA |
||||||||||||||||||||
| Net earnings (loss) available to common shareholders |
$ | (12,059 | ) | $ | (28,869 | ) | $ | 5,496 | $ | 3,130 | $ | 2,506 | ||||||||
| Interest, including discontinued operations |
12,224 | 13,015 | 13,848 | 12,908 | 8,255 | |||||||||||||||
| Income tax benefit, including discontinued operations |
(1,757 | ) | (1,647 | ) | (305 | ) | (304 | ) | (107 | ) | ||||||||||
| Depreciation and amortization, including discontinued operations |
11,708 | 14,241 | 14,982 | 12,211 | 8,680 | |||||||||||||||
| EBITDA |
10,116 | (3,260 | ) | 34,021 | 27,945 | 19,334 | ||||||||||||||
| Noncontrolling interest |
(17 | ) | (130 | ) | 603 | 337 | 334 | |||||||||||||
| Preferred stock dividend |
1,474 | 1,474 | 1,160 | 948 | 1,215 | |||||||||||||||
| Adjusted EBITDA |
$ | 11,573 | $ | (1,916 | ) | $ | 35,784 | $ | 29,230 | $ | 20,883 | |||||||||
| RECONCILIATION OF NET EARNINGS (LOSS) TO FFO |
||||||||||||||||||||
| Net earnings (loss) available to common shareholders |
$ | (12,059 | ) | $ | (28,869 | ) | $ | 5,496 | $ | 3,130 | $ | 2,506 | ||||||||
| Depreciation and amortization, including discontinued operations |
11,708 | 14,241 | 14,982 | 12,211 | 8,680 | |||||||||||||||
| Net (gain) loss on disposition of continuing and discontinued assets |
(1,276 | ) | (2,264 | ) | (5,581 | ) | 17 | 3 | ||||||||||||
| FFO available to common shareholders |
$ | (1,627 | ) | $ | (16,892 | ) | $ | 14,897 | $ | 15,358 | $ | 11,189 | ||||||||
| Impairment |
8,198 | 24,148 | 250 | — | — | |||||||||||||||
| FFO without impairment, a non-cash item (7) |
$ | 6,571 | $ | 7,256 | $ | 15,147 | $ | 15,358 | $ | 11,189 | ||||||||||
| (1) | Revenues for all periods exclude revenues from hotels sold or classified as held for sale, which are classified in discontinued operations in the statements of operations. |
| (2) | Hotel revenues include room and other revenues from the operations of the hotels. |
| (3) | Adjusted EBITDA is a financial measure that is not calculated in accordance with accounting principles generally accepted in the United States of America (“GAAP”). We calculate Adjusted EBITDA by adding back to net earnings (loss) available to common shareholders certain non-operating expenses and non-cash charges which are based on historical cost accounting and we believe may be of limited significance in evaluating current performance. We believe these adjustments can help eliminate the accounting effects of depreciation and amortization and financing decisions and facilitate comparisons of core operating profitability between periods, even though Adjusted EBITDA also does not represent an amount that accrues directly to common shareholders. In calculating Adjusted EBITDA, we also add back preferred stock dividends and noncontrolling interests, which are cash charges. |
| Adjusted EBITDA doesn’t represent cash generated from operating activities determined by GAAP and should not be considered as an alternative to net income, cash flow from operations or any other operating performance measure prescribed by GAAP. Adjusted EBITDA is not a measure of our liquidity, nor is Adjusted EBITDA indicative of funds available to fund our cash needs, including our ability to make cash distributions. Neither does the measurement reflect cash expenditures for long-term assets and other items that have been and will be incurred. Adjusted EBITDA may include funds that may not be available for management’s discretionary use due to functional requirements to conserve funds for capital expenditures, property acquisitions, and other commitments and uncertainties. To compensate for this, management considers the impact of these excluded items to the extent they are material to operating decisions or the evaluation of our operating performance. Adjusted EBITDA, as presented, may not be comparable to similarly titled measures of other companies. |
30
Table of Contents
| (4) | FFO is a non-GAAP financial measure. We consider FFO to be a market accepted measure of an equity REIT’s operating performance, which is necessary, along with net earnings (loss), for an understanding of our operating results. FFO, as defined under the National Association of Real Estate Investment Trusts (NAREIT) standards, consists of net income computed in accordance with GAAP, excluding gains (or losses) from sales of real estate assets, plus depreciation and amortization of real estate assets. We believe our method of calculating FFO complies with the NAREIT definition. FFO does not represent amounts available for management’s discretionary use because of needed capital replacement or expansion, debt service obligations, or other commitments and uncertainties. FFO should not be considered as an alternative to net income (loss) (computed in accordance with GAAP) as an indicator of our liquidity, nor is it indicative of funds available to fund our cash needs, including our ability to pay dividends or make distributions. All REITs do not calculate FFO in the same manner; therefore, our calculation may not be the same as the calculation of FFO for similar REITs. |
| We use FFO as a performance measure to facilitate a periodic evaluation of our operating results relative to those of our peers, who, like us, are typically members of NAREIT. We consider FFO a useful additional measure of performance for an equity REIT because it facilitates an understanding of the operating performance of our properties without giving effect to real estate depreciation and amortization, which assume that the value of real estate assets diminishes predictably over time. Since real estate values have historically risen or fallen with market conditions, we believe that FFO provides a meaningful indication of our performance. |
| (5) | Represents dividends declared by us. The 2008 fourth quarter dividend of $0.08 was paid in February 2009, and was reported as a component of 2009 dividend payments for income tax purposes (representing $0.053 capital gain distribution and $0.027 nondividend distribution). |
| (6) | The conversion rights of the Series A preferred stock were cancelled as of February 20, 2009. |
| (7) | FFO without impairment, a non-cash item (“FFO without impairment”) |
| FFO without impairment is a non-GAAP financial measure. As a result of a significant downturn in hotel and lodging fundamentals that took place in 2008 and 2009 and the related decrease in hotel and real estate valuations, we decided that FFO available to common shareholders did not provide all of the information that allows us to better evaluate our operating performance. |
| To arrive at FFO without impairment, we adjust FFO available to common shareholders, to exclude the following items: |
| (i) | impairment charges of hotel properties that we have sold or expect to sell, included in discontinued operations; and |
| (ii) | impairment charges of hotel properties classified as held for use. |
| We believe that these items are driven by factors relating to the fundamental disruption in the global financial and real estate markets, rather than factors specific to the company or the performance of our properties or investments. |
| The impairment charges of hotel properties that were recognized in 2009 and 2010 were primarily based on valuations of hotels, which had declined due to market conditions that we no longer expected to hold for long-term investment, and/or for which we have reduced our prior expected holding periods. In order to enhance liquidity, we have declared certain properties as held for sale and may declare other properties held for sale. To the extent these properties are expected to be sold at a loss, we record an impairment charge when the loss is known. We have recognized certain of these impairment charges over several quarters in 2009 and 2010 and we believe it is reasonably likely that we will recognize similar charges and gains in the near future. |
31
Table of Contents
| However, we believe that as the financial markets stabilize, the potential for impairment charges of our hotel properties will diminish. We believe FFO without impairment provides investors with an additional measure to evaluate our operating performance as we emerge from this period of fundamental disruption in the global financial and real estate markets. |
| We analyze our operating performance primarily by revenues from our hotel properties, net of operating, administrative and financing expenses which are not directly impacted by short term fluctuations in the market value of our hotel properties. As a result, although these non-cash impairment charges have had a material impact on our financial results and are reflected in our financial statements, the removal of the effects of these items allows us to better understand the core operating performance of our properties. |
| Item 7. | Management’s Discussion and Analysis of Financial Condition and Results of Operations |
Forward-Looking Statements
Certain information both included and incorporated by reference in this management’s discussion and analysis and other sections of this Form 10-K may contain forward-looking statements within the meaning of Section 27A of the Securities Act of 1933, as amended, and Section 21E of the Securities Exchange Act of 1934, as amended, and as such may involve known and unknown risks, uncertainties and other factors which may cause our actual results, performance or achievements to be materially different from future results, performance or achievements expressed or implied by such forward-looking statements. These forward-looking statements are based on assumptions that management has made in light of experience in the business in which we operate, as well as management’s perceptions of historical trends, current conditions, expected future developments and other factors believed to be appropriate under the circumstances. These statements are not guarantees of performance or results. They involve risks, uncertainties (some of which are beyond our control) and assumptions. Management believes that these forward-looking statements are based on reasonable assumptions.
Forward-looking statements, which are based on certain assumptions and describe our future plans, strategies and expectations are generally identifiable by use of the words “may,” “will,” “should,” “expect,” “anticipate,” “estimate,” “believe,” “intend” or “project” or the negative thereof or other variations thereon or comparable terminology. Factors which could have a material adverse effect on our operations and future prospects include, but are not limited to, changes in: economic conditions generally and the real estate market specifically, legislative/regulatory changes (including changes to laws governing the taxation of real estate investment trusts), availability of capital, risks associated with debt financing, interest rates, competition, supply and demand for hotel rooms in our current and proposed market areas, policies and guidelines applicable to real estate investment trusts and other risks and uncertainties described herein, and in our filings with the SEC from time to time. These risks and uncertainties should be considered in evaluating any forward-looking statements contained or incorporated by reference herein. We caution readers not to place undue reliance on any forward-looking statements included in this report which speak only as of the date of this report.
Overview
We are a self-administered REIT, and through our subsidiaries, we owned 106 limited service hotels in 23 states at December 31, 2010. Our hotels operate under several national franchise and independent brands.
Our significant events for 2010 include:
| • | The Company issued an aggregate of 598,803 shares of Supertel common stock and 299,403 warrants in a private offering for aggregate gross proceeds of $1.0 million in cash; |
| • | We sold nine hotels for gross proceeds of $11.7 million and used the net proceeds to pay off the underlying mortgages and for operations; |
32
Table of Contents
| • | We raised $480,000 from a standby equity distribution agreement; |
| • | Non cash impairment charges of $8.2 million were booked against hotel properties; and |
| • | As of December 31, 2010, we had 18 hotels classified as held for sale with a total net book value of $34.4 million. Gross proceeds from the sales are expected to be $37.8 million, and net proceeds will be used to pay off the underlying mortgages with remaining cash used for operations. |
Additionally, in March 2011, the maturity date of our credit facility with Wells Fargo Bank was extended from March 12, 2011 to September 30, 2011.
As of December 31, 2010, the Company had 18 hotels classified as held for sale. At the beginning of 2010, the Company had 19 hotels held for sale and during the year classified an additional nine hotels as held for sale. Nine of these hotels were sold during 2010, and one of the hotels was reclassified as held for use. The reclassification of this hotel was due to changes in the property’s market condition. Since our previously filed financial statements, in addition to the hotel reclassified as held for use, two hotels were classified as held for sale. The impact of these changes was to increase income from continuing operations by $0.4 million and $0.3 million for the years ended 2009 and 2008 compared to the previously filed financial statements.
The Company’s management agreement with Royco Hotels, the manager of a majority of the Company’s hotels, terminates on December 31, 2011, and is subject to an automatic five year extension thereafter if certain conditions are met. In addition, provisions in the management agreement permit either party to terminate the management agreement on 60 days notice if a net operating income (“NOI”) target of 8.5% of total investment in hotels is not achieved for a fiscal year. In 2009 and 2010, NOI as a percentage of total hotel investment was less than 8.5%. Additionally, one of the conditions for an automatic extension of the management agreement is that an average annual NOI target of at least 10% is achieved during the four years ending December 31, 2010. Annual NOI as a percentage of total hotel investment has not exceeded 10% in 2007, 2008, 2009, and 2010.
During the fourth quarter of 2010, the Company solicited bids from hotel management companies to manage the Company’s hotels. The Company expects to complete its review process, and make its decision, if any, on a manager or managers for its hotels during the first half of 2011.
The Company has been advised by Royco Hotels that it believes the Company’s potential termination / nonrenewal of Royco Hotels is a breach of the management agreement between the Company and Royco Hotels. On December 15, 2010, Royco Hotels filed a complaint against Supertel in the District Court of Douglas County, Nebraska alleging breach of the management agreement and other complaints related to the solicitation of bids from other management companies, and seeking alleged damages. Royco Hotels has not met the NOI conditions of the agreement and consequently the Company does not believe that it has breached the management agreement or that any damages are due to Royco Hotels. Royco Hotels continues to manage our hotels under the management agreement.
We conduct our business through a traditional umbrella partnership REIT, or UPREIT, in which our hotel properties are owned by our operating partnerships, Supertel Limited Partnership and E&P Financing Limited Partnership, limited partnerships, limited liability companies or other subsidiaries of our operating partnerships. We currently own, indirectly, an approximate 99% general partnership interest in Supertel Limited Partnership and a 100% partnership interest in E&P Financing Limited Partnership.
The discussion that follows is based primarily on our consolidated financial statements as of December 31, 2010 and 2009, and results of operations for the years ended December 31, 2010, 2009 and 2008, and should be read along with the consolidated financial statements and related notes.
33
Table of Contents
RevPAR, ADR and Occupancy
The following table presents our revenue per available room (“RevPAR”), average daily rate (“ADR”) and occupancy by region for 2010 and 2009, respectively. The comparisons of same store operations are for 88 hotels owned and held in continuing operations as of January 1, 2009.
| 2010 | 2009 | |||||||||||||||||||||||||||||||
| Same Store Region |
Room Count |
RevPAR | Occupancy | ADR | Room Count |
RevPAR | Occupancy | ADR | ||||||||||||||||||||||||
| Mountain |
214 | $ | 31.75 | 65.0 | % | $ | 48.85 | 214 | $ | 31.96 | 62.1 | % | $ | 51.50 | ||||||||||||||||||
| West North Central |
2,511 | 27.95 | 58.7 | % | 47.61 | 2,511 | 28.80 | 60.0 | % | 48.02 | ||||||||||||||||||||||
| East North Central |
964 | 36.83 | 60.3 | % | 61.11 | 964 | 36.04 | 57.2 | % | 63.07 | ||||||||||||||||||||||
| Middle Atlantic/New England |
142 | 41.43 | 71.1 | % | 58.30 | 142 | 38.90 | 58.9 | % | 66.04 | ||||||||||||||||||||||
| South Atlantic |
2,369 | 28.72 | 68.2 | % | 42.10 | 2,369 | 26.61 | 58.4 | % | 45.56 | ||||||||||||||||||||||
| East South Central |
677 | 34.60 | 56.8 | % | 60.91 | 677 | 32.99 | 54.1 | % | 61.01 | ||||||||||||||||||||||
| West South Central |
456 | 29.78 | 68.8 | % | 43.31 | 456 | 25.84 | 56.9 | % | 45.38 | ||||||||||||||||||||||
| Total Same Store Hotels |
7,333 | $ | 30.47 | 62.9 | % | $ | 48.47 | 7,333 | $ | 29.54 | 58.4 | % | $ | 50.57 | ||||||||||||||||||
| States included in the Regions |
||
| Mountain |
Idaho and Montana | |
| West North Central |
Iowa, Kansas, Missouri, Nebraska and South Dakota | |
| East North Central |
Indiana and Wisconsin | |
| Middle Atlantic/New England |
Pennsylvania | |
| South Atlantic |
Delaware, Florida, Georgia, Maryland, North Carolina, South Carolina, Virginia and West Virginia | |
| East South Central |
Kentucky and Tennessee | |
| West South Central |
Arkansas and Louisiana |
34
Table of Contents
The following table presents our RevPAR, ADR and occupancy by franchise affiliation for 2010 and 2009, respectively. The comparisons of same store operations are for 88 hotels owned and held in continuing operations as of January 1, 2009.
| 2010 | 2009 | |||||||||||||||||||||||||||||||
| Same Store Brand |
Room Count |
RevPAR | Occupancy | ADR | Room Count |
RevPAR | Occupancy | ADR | ||||||||||||||||||||||||
| Limited Service |
||||||||||||||||||||||||||||||||
| Midscale w/o F&B * |
||||||||||||||||||||||||||||||||
| Comfort Inn/ Comfort Suites |
1,524 | $ | 41.90 | 62.7 | % | $ | 66.81 | 1,524 | $ | 39.97 | 56.6 | % | $ | 70.60 | ||||||||||||||||||
| Hampton Inn |
135 | 48.62 | 65.4 | % | 74.35 | 135 | 43.62 | 58.9 | % | 74.01 | ||||||||||||||||||||||
| Sleep Inn |
153 | 32.70 | 51.7 | % | 63.28 | 153 | 32.18 | 50.4 | % | 63.81 | ||||||||||||||||||||||
| Guesthouse Inn |
177 | 18.26 | 43.6 | % | 41.86 | 177 | 16.94 | 36.0 | % | 46.99 | ||||||||||||||||||||||
| Other Midscale (1) |
263 | 35.79 | 58.7 | % | 60.97 | 263 | 35.10 | 58.4 | % | 60.06 | ||||||||||||||||||||||
| Total Midscale w/o F&B * |
2,252 | $ | 39.11 | 60.2 | % | $ | 65.01 | 2,252 | $ | 37.28 | 54.9 | % | $ | 67.87 | ||||||||||||||||||
| Economy |
||||||||||||||||||||||||||||||||
| Days Inn |
870 | 33.33 | 67.1 | % | 49.70 | 870 | 29.70 | 55.2 | % | 53.83 | ||||||||||||||||||||||
| Super 8 |
3,032 | 27.48 | 59.3 | % | 46.31 | 3,032 | 28.26 | 60.1 | % | 46.99 | ||||||||||||||||||||||
| Other Economy (2) |
81 | 48.42 | 60.3 | % | 80.35 | 81 | 50.11 | 58.4 | % | 85.88 | ||||||||||||||||||||||
| Total Economy |
3,983 | $ | 29.18 | 61.0 | % | $ | 47.81 | 3,983 | $ | 29.02 | 59.0 | % | $ | 49.17 | ||||||||||||||||||
| Total Same Store Midscale/Economy |
6,235 | $ | 32.77 | 60.7 | % | $ | 53.96 | 6,235 | $ | 32.00 | 57.5 | % | $ | 55.62 | ||||||||||||||||||
| Extended Stay (3) |
1,098 | 17.41 | 75.0 | % | 23.21 | 1,098 | 15.53 | 63.3 | % | 24.52 | ||||||||||||||||||||||
| Total Same Store Hotels |
7,333 | $ | 30.47 | 62.9 | % | $ | 48.47 | 7,333 | $ | 29.54 | 58.4 | % | $ | 50.57 | ||||||||||||||||||
| 1 | Includes Ramada Limited, Baymont Inn, Quality Inn, and Holiday Inn Express brands |
| 2 | Includes Key West Inns and non franchised independent hotels |
| 3 | Includes Savannah Suites |
| * | “w/o F & B” indicates without food and beverage |
35
Table of Contents
Results of Operations
Comparison of the year ended December 31, 2010 to the year ended December 31, 2009
Operating results are summarized as follows for the years ended December 31 (table in thousands):
| 2010 | 2009 | Continuing Operations Variance |
||||||||||||||||||||||||||
| Continuing Operations |
Discontinued Operations |
Total | Continuing Operations |
Discontinued Operations |
Total | |||||||||||||||||||||||
| Revenues |
$ | 84,114 | $ | 18,266 | $ | 102,380 | $ | 81,570 | $ | 23,924 | $ | 105,494 | $ | 2,544 | ||||||||||||||
| Hotel and property operations expenses |
(64,241 | ) | (16,252 | ) | (80,493 | ) | (60,985 | ) | (20,862 | ) | (81,847 | ) | (3,256 | ) | ||||||||||||||
| Interest expense |
(9,702 | ) | (2,522 | ) | (12,224 | ) | (9,581 | ) | (3,434 | ) | (13,015 | ) | (121 | ) | ||||||||||||||
| Depreciation and amortization expense |
(11,011 | ) | (697 | ) | (11,708 | ) | (11,405 | ) | (2,836 | ) | (14,241 | ) | 394 | |||||||||||||||
| General and administrative expenses |
(3,443 | ) | (71 | ) | (3,514 | ) | (3,813 | ) | — | (3,813 | ) | 370 | ||||||||||||||||
| Impairment losses |
(2,147 | ) | (6,051 | ) | (8,198 | ) | (7,399 | ) | (16,749 | ) | (24,148 | ) | 5,252 | |||||||||||||||
| Net gains (losses) on dispositions of assets |
(66 | ) | 1,342 | 1,276 | (114 | ) | 2,378 | 2,264 | 48 | |||||||||||||||||||
| Other income |
122 | — | 122 | 134 | — | 134 | (12 | ) | ||||||||||||||||||||
| Income tax benefit (expense) |
897 | 860 | 1,757 | 549 | 1,098 | 1,647 | 348 | |||||||||||||||||||||
| $ | (5,477 | ) | $ | (5,125 | ) | $ | (10,602 | ) | $ | (11,044 | ) | $ | (16,481 | ) | $ | (27,525 | ) | $ | 5,567 | |||||||||
Revenues and Operating Expenses
Loss from continuing operations for the twelve months ended December 31, 2010 was $(5.5) million, compared to loss from continuing operations of $(11.0) million for 2009. After recognition of discontinued operations, noncontrolling interests and dividends for preferred stock shareholders, the net loss attributable to common shareholders was $(12.1) million or $(0.53) per diluted share, for the year ended December 31, 2010, compared to net loss attributable to common shareholders of $(28.9) million or $(1.33) per diluted share for 2009.
During 2010 revenues from continuing operations increased $2.5 million, or 3.1 percent. This increase is primarily due to the ongoing economic recovery.
We refer to our entire portfolio as limited service hotels, which we further describe as midscale without food and beverage hotels, economy hotels and extended stay hotels. The same store portfolio used for comparison of the twelve months ending 2010 over the same period of 2009 consists of the 88 hotels in continuing operations that were owned by the company as of January 1, 2009. The Company’s 51 same-store economy hotels reflected a 0.6 percent increase in RevPAR to $29.18 in 2010 with a 3.4 percent increase in occupancy to 61.0 percent and a decrease in ADR of 2.8 percent. The Company’s 30 same-store midscale without food and beverage hotels experienced a 4.9 percent increase in RevPAR. Occupancy rose 9.7 percent and ADR was down 4.2 percent to $65.01. The extended stay hotels are economy hotels with significantly lower ADR and RevPAR than other limited service hotels. RevPAR for the seven same-store extended stay hotels was up 12.1 percent from the prior year to $17.41. Occupancy rose 18.5 percent, and ADR decreased 5.3 percent to $23.21. The total same-store portfolio of 88 hotels for the year ended 2010, compared with the prior year, had a 3.1 percent rise in RevPAR with a 7.7 percent increase in occupancy, and a 4.2 percent decrease in ADR.
Hotel and property operations expenses from continuing operations for the year ended 2010 increased $3.3 million or 5.3 percent. The majority of the variance is caused by increased expenses due to higher occupancy, with payroll expense up $1.1 million, franchise-related fees up $0.8 million, utilities expense up $0.5 million, supplies expense up $0.4 million and repairs and maintenance up $0.4 million.
Interest Expense, Depreciation and Amortization Expense and General and Administration Expense
Interest expense from continuing operations increased by $0.1 million, due primarily to an increase in the interest rate on the revolving line of credit with Great Western Bank. The depreciation and amortization expense from
36
Table of Contents
continuing operations decreased $0.4 million for 2010 over 2009, which was caused by an overall decrease in capital expenditures during recent years. The general and administration expense from continuing operations for 2010 is down $0.4 million or 9.7 percent compared to 2009. The primary driver for this decrease is a reduction in salaries and wages caused by management changes and retirement, partially offset by an increase in professional fees.
Impairment Losses
In 2010 we had $2.1 million of impairment losses in continuing operations and $6.1 million of impairment losses in discontinued operations for the year. In 2009 we had $7.4 million of impairment losses in continuing operations and $16.7 million of impairment losses in discontinued operations for the year. Discontinued operations consist of hotels held for sale at December 31, 2010 or sold during 2009 or 2010. See Note 5 in the footnotes to the consolidated financial statements for additional information including a discussion of our impairment analysis of our hotels assets.
The impairment losses consisted of the following:
| 2010 | 2009 | |||||||||||||||||||||||
| Continuing Operations |
Discontinued Operations |
Total | Continuing Operations |
Discontinued Operations |
Total | |||||||||||||||||||
| Impairment losses, held for use |
2,147 | — | 2,147 | 7,399 | — | 7,399 | ||||||||||||||||||
| Impairment losses, held for sale |
— | 6,546 | 6,546 | — | 13,355 | 13,355 | ||||||||||||||||||
| Impairment losses, sold |
— | 421 | 421 | — | 3,461 | 3,461 | ||||||||||||||||||
| Impairment recovery |
— | (916 | ) | (916 | ) | — | (67 | ) | (67 | ) | ||||||||||||||
| $ | 2,147 | $ | 6,051 | $ | 8,198 | $ | 7,399 | $ | 16,749 | $ | 24,148 | |||||||||||||
Dispositions
In 2010, the net losses on dispositions of assets in continuing operations remained essentially unchanged from the prior year. In 2010, discontinued operations reflected a $1.3 million gain on the disposition of assets. Of this, net gains of $1.4 million are attributable to properties that have been sold; while $0.1 million of net losses on the sale of assets are attributable to assets held for sale. In 2009, we recognized net losses of approximately $0.1 million on the disposition of furniture, fixtures, and equipment in the normal course of continuing operations. Discontinued operations in 2009 included gains of $2.5 million on properties sold in 2009, offset by $0.1 million of net losses on assets held for sale.
Income Tax Benefit
The income tax benefit from continuing operations is related to the taxable loss from our taxable REIT subsidiary, the TRS Lessee. Management believes the federal and state income tax rate for the TRS Lessee will be approximately 38%. The tax benefit is a result of TRS Lessee’s losses for the years ended December 31, 2010 and 2009. The income tax benefit will vary based on the taxable earnings or loss of the TRS Lessee, a C corporation.
The income tax benefit from continuing operations increased by approximately $0.3 million during 2010 compared to the year ago period, due to an increased loss from continuing operations by the TRS Lessee in 2010.
37
Table of Contents
Comparison of the year ended December 31, 2009 to the year ended December 31, 2008
Operating results are summarized as follows for the years ended December 31 (table in thousands):
| 2009 | 2008 | Continuing Operations Variance |
||||||||||||||||||||||||||
| Continuing Operations |
Discontinued Operations |
Total | Continuing Operations |
Discontinued Operations |
Total | |||||||||||||||||||||||
| Revenues |
$ | 81,570 | $ | 23,924 | $ | 105,494 | $ | 90,996 | $ | 33,989 | $ | 124,985 | $ | (9,426 | ) | |||||||||||||
| Hotel and property operations expenses |
(60,985 | ) | (20,862 | ) | (81,847 | ) | (64,529 | ) | (26,436 | ) | (90,965 | ) | 3,544 | |||||||||||||||
| Interest expense |
(9,581 | ) | (3,434 | ) | (13,015 | ) | (9,906 | ) | (3,942 | ) | (13,848 | ) | 325 | |||||||||||||||
| Depreciation and amortization expense |
(11,405 | ) | (2,836 | ) | (14,241 | ) | (11,081 | ) | (3,901 | ) | (14,982 | ) | (324 | ) | ||||||||||||||
| General and administrative expenses |
(3,813 | ) | — | (3,813 | ) | (3,696 | ) | — | (3,696 | ) | (117 | ) | ||||||||||||||||
| Impairment losses |
(7,399 | ) | (16,749 | ) | (24,148 | ) | — | (250 | ) | (250 | ) | (7,399 | ) | |||||||||||||||
| Net gains (losses) on dispositions of assets |
(114 | ) | 2,378 | 2,264 | 1 | 5,580 | 5,581 | (115 | ) | |||||||||||||||||||
| Other income |
134 | — | 134 | 129 | — | 129 | 5 | |||||||||||||||||||||
| Income tax benefit (expense) |
549 | 1,098 | 1,647 | 180 | 125 | 305 | 369 | |||||||||||||||||||||
| $ | (11,044 | ) | $ | (16,481 | ) | $ | (27,525 | ) | $ | 2,094 | $ | 5,165 | $ | 7,259 | $ | (13,138 | ) | |||||||||||
Revenues and Operating Expenses
Loss from continuing operations for the twelve months ended December 31, 2009 reflected $(11.0) million, compared to net earnings of $2.1 million for 2008. After recognition of discontinued operations, noncontrolling interest and dividends for preferred stock shareholders, the net earnings (loss) attributable to common shareholders reflected $(28.9) million or $(1.33) per diluted share, for the year ended December 31, 2009, compared to $5.5 million or $0.26 per diluted share for 2008.
During 2009 revenues from continuing operations decreased $9.4 million or 10.4 percent. This decrease is primarily due to the effects of the economic downturn. The same store portfolio used for comparison of the twelve months ending 2009 over the same period of 2008 consists of 88 hotels in continuing operations that were owned by the company as of January 1, 2008, including nine of ten hotels purchased January 2, 2008. The Company’s 51 same-store economy hotels posted a 9.1 percent decrease in RevPAR to $29.02 in 2009 with an 8.2 percent decrease in occupancy to 59.0 percent, and a 1.0 percent decrease in ADR from $49.67 to $49.17. The Company’s 30 same-store midscale without food and beverage hotels had a 12.2 percent decrease in RevPAR and a 7.9 percent decrease in occupancy. ADR was $67.87, down 4.7 percent from 2008. The extended stay hotels are economy hotels with significantly lower ADR and RevPAR than other limited service hotels. RevPAR for the seven same store extended stay hotels was down 4.8 percent from the prior year to $15.53. Occupancy was down 2.5 percent, and ADR decreased 2.4 percent to $24.52. The total same-store portfolio of 88 hotels for the year ended 2009, compared with the prior year, had a 10.0 percent decrease in RevPAR and a 7.2 percent decrease in occupancy. ADR was down 3.1 percent from the prior year.
Hotel and property operations expenses from continuing operations for the year ended 2009 decreased $3.5 million or 5.5 percent. The decrease in occupancy was responsible for the majority of the variance, with franchise related fees down $1.1 million, payroll related expenses down $1.0 million, utilities costs down $0.5 million, supplies down $0.4 million, and management fees down $0.4 million in relation to the decreased revenue.
Interest Expense, Depreciation and Amortization Expense and General and Administration Expense
Interest expense from continuing operations decreased by $0.3 million, due primarily to lower interest rates on variable rate debt. The depreciation and amortization expense from continuing operations increased $0.3 million for 2009 over 2008, which was caused by capital improvements to the hotels. The general and administration expense from continuing operations for 2009 rose $0.1 million or 3.2 percent compared to 2008. The primary driver for this increase is an increase in payroll expense for severance pay, partially offset by a decrease in professional fees.
38
Table of Contents
Impairment Losses
See the discussion above regarding impairment charges for 2009. For 2008, we recorded an impairment charge of $0.3 million on two held for sale hotels which were subsequently sold in 2009.
Dispositions
In 2009 we recognized net losses of approximately $0.1 on the disposition of furniture, fixtures, and equipment in the normal course of continuing operations. Discontinued operations in 2009 included gains of $2.5 million on properties sold in 2009, offset by $0.1 million of net losses on assets held for sale. Discontinued operations in 2008 included gains of $5.6 million on the sale of two properties.
Income Tax Benefit
The income tax benefit from continuing operations is related to the taxable loss from our taxable REIT subsidiary, the TRS Lessee. Management believes the federal and state income tax rate for the TRS Lessee will be approximately 38%. The tax benefit is a result of TRS Lessee’s losses for the year ended December 31, 2009 and 2008. The income tax benefit will vary based on the taxable earnings of the TRS Lessee, a C corporation. The income tax benefit from continuing operations increased by approximately $0.4 million during 2009 compared to the prior period, due to an increased loss from continuing operations by the TRS Lessee in 2009 compared to 2008.
Liquidity and Capital Resources
Our income and ability to meet our debt service obligations, and make distributions to our shareholders, depends upon the operations of the hotels being conducted in a manner that maintains or increases revenue, or reduces expenses, to generate sufficient hotel operating income for TRS Lessee to pay the hotels’ operating expenses, including management fees and rents to us. We depend on rent payments from TRS Lessee to pay our operating expenses and debt service and to make distributions to shareholders.
The Company’s operating performance, as well as its liquidity position, has been and continues to be negatively affected by recent economic conditions, many of which are beyond our control. The Company anticipates that these adverse economic conditions will improve somewhat over the next year; however, in addition to our operating performance, the other sources described below will be essential to our liquidity and financial position.
Our business requires continued access to adequate capital to fund our liquidity needs. In 2010, the Company reviewed its entire portfolio, identified properties considered non-core and developed timetables for disposal of those assets deemed non-core. We focused on improving our liquidity through cash generating asset sales and disposition of assets that are not generating cash at levels consistent with our investment principles. In 2011, our foremost priorities continue to be preserving and generating capital sufficient to fund our liquidity needs. Given the deterioration and uncertainty in the economy and financial markets, management believes that access to conventional sources of capital will be challenging and management has planned accordingly. We are also working to proactively address challenges to our short-term and long-term liquidity position.
The following are the expected actual and potential sources of liquidity, which we currently believe will be sufficient to fund our near-term obligations:
| • | Cash and cash equivalents; |
| • | Cash generated from operations; |
| • | Proceeds from asset dispositions; |
| • | Proceeds from additional secured or unsecured debt financings; and/or |
| • | Proceeds from public or private issuances of debt or equity securities. |
39
Table of Contents
These sources are essential to our liquidity and financial position, and we cannot assure you that we will be able to successfully access them (particularly in the current economic environment). If we are unable to generate cash from these sources, we may have liquidity-related capital shortfalls and will be exposed to default risks. While we believe that we will have adequate capital for our near-term uses, significant issues with access to the liquidity sources identified above could lead to our insolvency.
In the near-term, the Company’s cash flow from operations is not projected to be sufficient to meet all of our liquidity needs. In response, management has identified non-core assets in our portfolio to be liquidated over a one to ten year period. Among the criteria for determining properties to be sold was the potential upside when hotel fundamentals return to stabilized levels. The 18 properties held for sale as of December 31, 2010 were determined to be less likely to participate in increased cash flow levels when markets do improve. As such, we expect these dispositions to help us (1) preserve cash, through potential disposition of properties with current or projected negative cash flow and/or other potential near-term cash outlay requirements (including debt maturities) and (2) generate cash, through the potential disposition of strategically identified non-core assets that we believe have equity value above debt.
We are actively marketing the 18 properties held for sale, which we anticipate will result in the elimination of $30.4 million of debt and generate an expected $5.2 million of proceeds for operations. We continue to receive strong interest in our 18 held for sale properties. The marketing process has been affected by deteriorating economic conditions and we have experienced some decreases in expected pricing. If this trend continues to worsen, we may be unable to complete the disposition of identified properties in a manner that would generate cash flow in line with management’s estimates as noted above. Our ability to dispose of these assets is impacted by a number of factors. Many of these factors are beyond our control, including general economic conditions, availability of financing and interest rates. In light of the current economic conditions, we cannot predict:
| • | whether we will be able to find buyers for identified assets at prices and/or other terms acceptable to us; |
| • | whether potential buyers will be able to secure financing; and |
| • | the length of time needed to find a buyer and to close the sale of a property. |
On March 26, 2010, we entered into a Standby Equity Distribution Agreement (SEDA) with Yorkville Advisors and, as of December 31, 2010, we have sold 316,384 shares resulting in net proceeds of $480,000 which were used for corporate purposes.
As our debt matures, our principal payment obligations also present significant future cash requirements. We may not be able to successfully extend, refinance or repay our debt due to a number of factors, including decreased property valuations, limited availability of credit, tightened lending standards and deteriorating economic conditions. Historically, extending or refinancing loans has required the payment of certain fees to, and expenses of, the applicable lenders. Any future extensions or refinancing will likely require increased fees due to tightened lending practices. These fees and cash flow restrictions will affect our ability to fund other liquidity uses. In addition, the terms of the extensions or refinancing may include operational and financial covenants significantly more restrictive than our current debt covenants.
The Company’s credit facility with Wells Fargo Bank ($5.3 million balance at December 31, 2010), previously due on March 12, 2011, has been extended to September 30, 2011. Also, the Company’s note payable to First National Bank of Omaha ($0.8 million balance at December 31, 2010), previously due on February 1, 2011, has been extended to March 1, 2012. The Company’s other 2011 maturities (at December 31, 2010) consist of approximately $5.4 million of principal amortization on mortgage loans and $11.8 million payable to Great Western Bank pursuant to a term loan that matures in December 2011. The Company intends to refinance or repay these 2011 maturities using its existing lines of credit, other financing, funds from operations or proceeds from the sale of hotels. If the Company is unable to repay or refinance its debt as it becomes due, then its lenders have the ability to take control of its encumbered hotel assets.
40
Table of Contents
The Company is also required to meet various financial covenants required by its existing lenders. If the Company’s future financial performance fails to meet these financial covenants, then its lenders also have the ability to take control of its encumbered hotel assets. Defaults with lenders due to failure to repay or refinance debt when due or failure to comply with financial covenants could also result in defaults under our credit facilities with Great Western Bank and Wells Fargo Bank. Our Great Western Bank and Wells Fargo Bank credit facilities contain cross-default provisions which would allow Great Western Bank and Wells Fargo Bank to declare a default and accelerate our indebtedness to them if we default on our other loans, and such default would permit that lender to accelerate our indebtedness under any such loan. If this were to happen, whether due to failure to repay or refinance debt when due or failure to comply with financial covenants, the Company’s ability to conduct business could be severely impacted as there can be no assurance that the adequacy and timeliness of cash flow would be available to meet the Company’s liquidity requirements. The Company believes it has the ability to repay its indebtedness when due with cash generated from operations, sales of hotels, refinancings or the issuance of stock, while at the same time continuing to be a substantial owner of limited service and economy hotels. If the economic environment does not improve in 2011, the Company’s plans and actions may not be sufficient and could lead to possibly failing financial debt covenant requirements.
No common stock dividends were declared during 2010. The Board of Directors continues to monitor requirements to maintain the Company’s REIT status on a quarterly basis.
Financing
At December 31, 2010, we had long-term debt of $144.6 million associated with assets held for use, consisting of notes and mortgages payable, with a weighted average term to maturity of 4.1 years and a weighted average interest rate of 6.19%. The weighted average fixed rate was 6.9%, and the weighted average variable rate was 4.6%. Debt held on properties in continuing operations is classified as held for use. Debt is classified as held for sale if the properties collateralizing it are included in discontinued operations. Debt associated with assets held for sale is classified as a short-term liability due in 2011 irrespective of whether the notes and mortgages evidencing such debt mature in 2011. Aggregate annual principal payments on debt associated with assets held for use for the next five years and thereafter, and debt associated with assets held for sale, are as follows (in thousands):
| Held For Sale | Held For Use | TOTAL | ||||||||||
| 2011 |
$ | 30,316 | $ | 15,186 | $ | 45,502 | ||||||
| 2012 |
127 | 57,723 | 57,850 | |||||||||
| 2013 |
— | 3,498 | 3,498 | |||||||||
| 2014 |
— | 4,228 | 4,228 | |||||||||
| 2015 |
— | 15,278 | 15,278 | |||||||||
| Thereafter |
— | 48,654 | 48,654 | |||||||||
| $ | 30,443 | $ | 144,567 | $ | 175,010 | |||||||
At December 31, 2010, the Company had $23.3 million of long-term debt associated with assets held for use and debt associated with assets held for sale which matures in 2011 pursuant to the notes and mortgages evidencing such debt. These 2011 maturities consist of:
| • | a $11.8 million balance on a term loan with Great Western Bank; |
| • | a $5.3 million balance on the credit facility with Wells Fargo Bank; |
| • | a $0.8 million note payable to First National Bank of Omaha; and |
| • | $5.4 million of principal amortization on mortgage loans. |
41
Table of Contents
In March 2011, the maturity date of our credit facility with Wells Fargo Bank was extended to September 30, 2011, and the maturity date of our note payable to First National Bank of Omaha was extended to March 1, 2012. The loans with Great Western Bank and Wells Fargo Bank are expected to be refinanced or repaid using our existing lines of credit, other financing, cash flows from operations or proceeds from the sale of hotels. However, certain of these alternatives are not within our control. We expect to fund the principal amortization on mortgage loans through cash flows from operations and the sale of hotels.
The remaining $22.2 million of debt due in 2011 (at December 31, 2010), as set forth in the table above, is associated with assets held for sale. This debt matures at the time of sale and is expected to be funded from the proceeds of such sales.
In January 2010, we sold our Comfort Inn located in Dublin, VA (99 rooms) for approximately $2.75 million with a negligible gain. A portion of these funds were used to pay off the Company’s borrowings from Village Bank, with the remaining $1.7 million of funds used to reduce the revolving line of credit with Great Western Bank.
In January 2010, the Company borrowed $0.8 million from First National Bank of Omaha. In March 2011, the maturity date of the note was extended to March 1, 2012. The note bears interest at 4% over the one month LIBOR with a floor of 5%. The borrowings were used to fund operations.
In March 2010, covenant modifications and other amendments were obtained for our credit facilities with Great Western Bank, General Electric Capital Corporation and Wells Fargo Bank. These changes were reflected in the notes to our financial statements included in our Form 10-K for year ended December 31, 2009.
In June 2010, we sold our Super 8 located in Kingdom City, MO, (60 rooms) for approximately $1.2 million, with a $0.5 million gain. The funds were used to reduce the balance of our revolving line of credit with Great Western Bank.
In June 2010, we sold our Masters Inn in Cave City, KY (97 rooms) for approximately $0.8 million, with a nominal net gain. The funds were used to reduce the balance of our revolving line of credit with Great Western Bank.
In June 2010, we paid off the $1.95 million note from Elkhorn Valley Bank, using funds from the revolving line of credit with Great Western Bank. In January 2011, we reborrowed the $1.95 million from Elkhorn Valley Bank. The maturity date of the note is October 1, 2011.
In July 2010, we sold our Super 8 hotel in Parsons, KS (48 rooms) for approximately $1.1 million, with a $0.1 million gain. The funds were used to reduce the balance of our revolving line of credit with Great Western Bank.
In August 2010, our credit facility with Wells Fargo Bank was amended to require maintenance of a consolidated loan to value ratio that does not exceed 85% and a minimum tangible net worth which exceeds $65 million, in each case, through the maturity of the credit facility. The amendment also: (a) extended the maturity date from August 12, 2010 to March 12, 2011; (b) required a $1.8 million principal payment (which we funded from the revolving line of credit with Great Western Bank) in exchange for a release of the deeds of trust securing the Super 8 and Supertel Inn hotels located in Neosho, Missouri; and (c) increased the interest rate from LIBOR plus 3.5% (subject to a 4.0% floor) to LIBOR plus 5.0% (subject to a 5.5% floor). In March 2011, the credit facility was also amended to: (a) require maintenance of a minimum tangible net worth which exceeds $50 million through the maturity of the credit facility; (b) extend the maturity date from March 12, 2011 to September 30, 2011; and (c) decrease the interest rate from LIBOR plus 5.0% (subject to a 5.5% floor) to LIBOR plus 4.0% (subject to a 4.5% floor).
In October 2010, we sold three hotels in Missouri (two in Neosho and one in Jane) with an aggregate of 150 rooms for approximately $2.6 million. The net proceeds were used to reduce the balance of our revolving line of credit with Great Western Bank and reduce the balance of our credit facility with Wells Fargo Bank.
In October 2010, we sold a Super 8 (101 rooms) located in Lenexa, Kansas for approximately $2.1 million.
42
Table of Contents
The funds were used to reduce the balance of our revolving line of credit and a term loan with Great Western Bank.
In November 2010, we sold a Masters Inn (120 rooms) located in Augusta, Georgia for approximately $1.1 million. The net proceeds were used to reduce the balance of a loan with General Electric Capital Corporation.
The key financial covenants for certain of our loan agreements and compliance calculations as of December 31, 2010 are discussed below (each such covenant is calculated pursuant to the applicable loan agreement). As of December 31, 2010, we were either in compliance with the financial covenants or obtained waivers for non-compliance (as discussed below). As a result, we are not in default of any of our loans.
| (dollar amounts in thousands) Great Western Bank Covenants |
December 31, 2010 Requirement |
December 31, 2010 Calculation |
||||||
| Consolidated debt service coverage ratio calculated as follows: |
³ | 1.05:1 | ||||||
| Adjusted NOI (A) / Debt service (B) |
||||||||
| Net loss per financial statements |
$ | (10,602 | ) | |||||
| Net adjustments per loan agreement |
$ | 32,478 | ||||||
| Adjusted NOI per loan agreement(A) |
$ | 21,876 | ||||||
| Interest expense per financial statements-continuing operations |
$ | 9,702 | ||||||
| Interest expense per financial statements-discontinued operations |
$ | 2,522 | ||||||
| Total interest expense per financial statements |
$ | 12,224 | ||||||
| Net adjustments per loan agreement |
$ | 5,861 | ||||||
| Debt service per loan agreement (B) |
$ | 18,085 | ||||||
| Consolidated debt service coverage ratio |
1.21:1 | |||||||
| Loan-specific debt service coverage ratio calculated as follows: |
³ | 1.20:1 | ||||||
| Adjusted NOI (A) / Debt service (B) |
||||||||
| Net loss per financial statements |
$ | (10,602 | ) | |||||
| Net adjustments per loan agreement |
$ | 14,828 | ||||||
| Adjusted NOI per loan agreement (A) |
$ | 4,226 | ||||||
| Interest expense per financial statements-continuing operations |
$ | 9,702 | ||||||
| Interest expense per financial statements-discontinued operations |
$ | 2,522 | ||||||
| Total interest expense per financial statements |
$ | 12,224 | ||||||
| Net adjustments per loan agreement |
$ | (8,606 | ) | |||||
| Debt service per loan agreement (B) |
$ | 3,618 | ||||||
| Loan-specific debt service coverage ratio |
1.17:1 | |||||||
43
Table of Contents
| Great Western Bank Covenants – continued |
December 31, 2010 Requirement |
December 31, 2010 Calculation |
||||||
| Consolidated loan to value ratio calculated as follows: |
£70.0 | % | ||||||
| Loan balance (A) / Value (B) |
||||||||
| Loan balance (A) |
$ | 175,010 | ||||||
| Value (B) |
$ | 300,406 | ||||||
| Consolidated loan to value ratio |
58.3 | % | ||||||
| Loan-specific loan to value ratio calculated as follows: |
£70.0 | % | ||||||
| Loan balance (A) / Value (B) |
||||||||
| Loan balance (A) |
$ | 37,176 | ||||||
| Value (B) |
$ | 60,227 | ||||||
| Loan-specific loan to value ratio |
61.7 | % | ||||||
The Great Western Bank credit facilities also require that we not pay dividends in excess of 75% of our funds from operations per year. On March 10, 2011, we received a waiver from Great Western Bank for non-compliance with the loan-specific debt service coverage ratio covenant set forth in the table above as of December 31, 2010.
The credit facilities with Great Western Bank were amended on March 15, 2011 to require maintenance of consolidated and loan-specific debt service coverage ratios of at least 1.05 to 1, tested quarterly, from December 31, 2010 through the maturity of the credit facilities. The credit facilities continue to require maintenance of consolidated and loan-specific loan to value ratios that do not exceed 70%, tested annually, from December 31, 2010 through the maturity of the credit facilities.
The Great Western Bank amendment also: (a) modifies the borrowing base so that the loans available to us under the credit facilities may not exceed the lesser of (i) an amount equal to 70% of the total appraised value of the hotels securing the credit facilities and (ii) an amount that would result in a loan-specific debt service coverage ratio of less than 1.05 to 1 from December 31, 2010 through December 31, 2011 and 1.50 to 1 from January 1, 2012 through the maturity of the credit facilities; (b) maintains the interest rate on the revolving credit portion of the credit facilities at 5.50% from March 15, 2011 through December 31, 2011 and prime (subject to a 5.50% floor rate) from January 1, 2012 through the maturity of the credit facilities; and (c) gives Great Western Bank the option to increase the interest rates of the credit facilities up to 4.00% any time after January 1, 2012.
| (dollar amounts in thousands) Wells Fargo Bank Covenants |
December 31,
2010 Requirement |
December 31,
2010 Calculation |
||||||
| Consolidated loan to value ratio calculated as follows: |
£85.0% | |||||||
| Loan balance (A) / Value (B) |
||||||||
| Loan balance (A) |
$ | 175,010 | ||||||
| Value (B) |
$ | 225,152 | ||||||
| Consolidated loan to value ratio |
77.7 | % | ||||||
| Consolidated tangible net worth calculated as follows: |
>$65 million | |||||||
| Consolidated shareholder equity (A) – Intangible assets (B) |
||||||||
| Total shareholders’ equity per financial statements |
$ | 55,394 | ||||||
| Redeemable noncontrolling interest per financial statements |
$ | 511 | ||||||
| Noncontrolling interest in consolidated partnership |
$ | 335 | ||||||
| Redeemable preferred stock per financial statements |
$ | 7,662 | ||||||
| Consolidated shareholder equity (A) |
$ | 63,902 | ||||||
| Intangible assets (B) |
$ | 0 | ||||||
| Consolidated tangible net worth |
$ | 63,902 | ||||||
44
Table of Contents
| Wells Fargo Bank Covenants - continued |
December 31,
2010 Requirement |
December 31,
2010 Calculation |
||||||
| Consolidated fixed charge coverage ratio calculated as follows: |
|
³0.80:1 before preferred dividends |
|
|||||
| EBITDA (A) / Fixed charges (B) |
||||||||
| Net loss per financial statements |
$ | (10,602 | ) | |||||
| Net adjustments per loan agreement |
$ | 28,959 | ||||||
| EBITDA per loan agreement (A) |
$ | 18,357 | ||||||
| Interest expense per financial statements-continuing operations |
$ | 9,702 | ||||||
| Interest expense per financial statements-discontinued operations |
$ | 2,522 | ||||||
| Total interest expense per financial statements |
$ | 12,224 | ||||||
| Net adjustments per loan agreement |
$ | 6,594 | ||||||
| Fixed charges per loan agreement (B) |
$ | 18,818 | ||||||
| Consolidated fixed charge coverage ratio |
0.98:1 | |||||||
| Consolidated fixed charge coverage ratio calculated as follows: |
|
³0.75:1 after preferred dividends |
|
|||||
| EBITDA (A) / Fixed charges (B) |
||||||||
| Net loss per financial statements |
$ | (10,602 | ) | |||||
| Net adjustments per loan agreement |
$ | 28,959 | ||||||
| EBITDA per loan agreement (A) |
$ | 18,357 | ||||||
| Interest expense per financial statements-continuing operations |
$ | 9,702 | ||||||
| Interest expense per financial statements-discontinued operations |
$ | 2,522 | ||||||
| Total interest expense per financial statements |
$ | 12,224 | ||||||
| Net adjustments per loan agreement |
$ | 5,120 |
||||||
| Fixed charges per loan agreement (B) |
$ | 17,344 |
||||||
| Consolidated fixed charge coverage ratio |
1.06:1 | |||||||
Our credit facility with Wells Fargo Bank was amended on August 12, 2010 to require maintenance of a consolidated loan to value ratio that does not exceed 85% and a minimum tangible net worth which exceeds $65 million, in each case, through the maturity of the credit facility. The amendment also: (a) extended the maturity date from August 12, 2010 to March 12, 2011; (b) required a $1.8 million principal payment (which we funded from the revolving line of credit with Great Western Bank) in exchange for a release of the deeds of trust securing the Super 8 and Supertel Inn hotels located in Neosho, Missouri; and (c) increased the interest rate from LIBOR plus 3.5% (subject to a 4.0% floor) to LIBOR plus 5.0% (subject to a 5.5% floor). On March 11, 2011, the Company received a waiver from Wells Fargo Bank for non-compliance with the consolidated tangible net worth covenant set forth in the table above as of December 31, 2010. In connection with the waiver, the credit facility was amended on March 11, 2011 to require maintenance of a minimum tangible net worth which exceeds $50 million through the maturity of the credit facility. The amendment also: (a) extended the maturity date from March 12, 2011 to September 30, 2011; and (b) decreased the interest rate from LIBOR plus 5.0% (subject to a 5.5% floor) to LIBOR plus 4.0% (subject to a 4.5% floor).
45
Table of Contents
| (dollar amounts in thousands) GE Covenants |
December 31, 2010 Requirement |
December 31, 2010 Calculation |
||||||
| Loan-specific total adjusted EBITDA calculated as follows: |
³$3.9 million | |||||||
| Net loss per financial statements |
$ | (10,602 | ) | |||||
| Net adjustments per loan agreement |
$ | 16,242 | ||||||
| Loan-specific total adjusted EBITDA |
$ | 5,640 | ||||||
| Consolidated debt service coverage ratio calculated as follows: |
³1.05:1 | |||||||
| Adjusted EBITDA (A) / Debt service (B) |
||||||||
| Net loss per financial statements |
$ | (10,602 | ) | |||||
| Net adjustments per loan agreement |
$ | 36,163 | ||||||
| Adjusted EBITDA per loan agreement (A) |
$ | 25,561 | ||||||
| Interest expense per financial statements- continuing operations |
$ | 9,702 | ||||||
| Interest expense per financial statements- discontinued operations |
$ | 2,522 | ||||||
| Total interest expense per financial statements |
$ | 12,224 | ||||||
| Net adjustments per loan agreement |
$ | 5,120 | ||||||
| Debt service per loan agreement (B) |
$ | 17,344 | ||||||
| Consolidated debt service coverage ratio |
1.47:1 | |||||||
Our credit facilities with General Electric Capital Corporation require that, commencing in 2012 and continuing for the term of the loans, we maintain, with respect to our GE-encumbered properties, a before dividend fixed charge coverage ratio (FCCR) (based on a rolling twelve month period) of 1.30:1 and after dividend FCCR (based on a rolling twelve month period) of 1.00:1. The consolidated debt service coverage ratio for the GE credit facilities increases to 1.50:1 in 2012 through the term of the loans. In connection with previous amendments and waivers, the interest rates of the loans under our credit facilities with GE have increased by 1.5%. If our FCCR with respect to our GE-encumbered properties equals or exceeds 1.30:1 before dividends and 1.00:1 after dividends for two consecutive quarters, the cumulative 1.5% increase in the interest rate of the loans will be eliminated.
If we fail to pay our indebtedness when due, fail to comply with covenants or otherwise default on our loans, unless waived, we could incur higher interest rates during the period of such loan defaults, be required to immediately pay our indebtedness and ultimately lose our hotels through lender foreclosure if we are unable to obtain alternative sources of financing with acceptable terms. Our Great Western Bank and Wells Fargo Bank credit facilities contain cross-default provisions which would allow Great Western Bank and Wells Fargo Bank to declare a default and accelerate our indebtedness to them if we default on our other loans, and such default would permit that lender to accelerate our indebtedness under any such loan. We are not in default of any of our loans.
Acquisition of Hotels
There were no acquisitions made during 2010 or 2009.
In 2008, the Company acquired seven hotels in Kentucky, two hotels in Sioux Falls, South Dakota and a hotel in Green Bay, Wisconsin. The combined purchase price of $22 million was funded by term loans of $15.6 million and $6.4 million from our existing credit facilities. The franchise brands consisted of Comfort Inn (2), Comfort Suites (1), Days Inn (4), Quality Inn (1), Sleep Inn (1) and Super 8 (1).
46
Table of Contents
Disposition of Hotels
| Sale Date 2010 |
Hotel Location |
Brand |
Rooms | Sale Price (millions) |
||||||||
| January |
Dublin, VA | Comfort Inn | 99 | $ | 2.75 | |||||||
| June |
Kingdom City, MO | Super 8 | 60 | 1.20 | ||||||||
| June |
Cave City, MO | Masters Inn | 97 | 0.80 | ||||||||
| July |
Parsons, KS | Super 8 | 48 | 1.10 | ||||||||
| October |
Neosho, MO | Booneslick | 47 | 1.00 | ||||||||
| October |
Jane, MO | Booneslick | 45 | 0.60 | ||||||||
| October |
Neosho, MO | Super 8 | 58 | 1.00 | ||||||||
| October |
Lenexa, KS | Super 8 | 101 | 2.10 | ||||||||
| November |
Augusta, GA | Masters Inn | 120 | 1.10 | ||||||||
| 675 | $ | 11.65 | ||||||||||
In 2009 a total of eight hotels with 674 rooms were sold for $17.2 million. In 2008 we sold two hotels with 160 rooms for approximately $12.0 million. Sale proceeds were used to reduce debt.
Redemption of Preferred Operating Partnership Units
We own, through our subsidiary, Supertel Hospitality REIT Trust, an approximate 99% general partnership interest in Supertel Limited Partnership, through which we own 50 of our hotels. We are the sole general partner of the limited partnership, and the remaining approximate 1% is held by limited partners who transferred property interests to us in return for limited partnership interests in Supertel Limited Partnership. These limited partners hold, as of December 31, 2010, 158,161 common operating partnership units and 51,035 preferred operating partnership units. Each limited partner of Supertel Limited Partnership may, subject to certain limitations, require that Supertel Limited Partnership redeem all or a portion of his or her common or preferred units, at any time after a specified period following the date he or she acquired the units, by delivering a redemption notice to Supertel Limited Partnership. When a limited partner tenders his or her common units to the partnership for redemption, we can, in our sole discretion, choose to purchase the units for either (1) a number of our shares of common stock equal to the number of units redeemed (subject to certain adjustments) or (2) cash in an amount equal to the market value of the number of our shares of common stock the limited partner would have received if we chose to purchase the units for common stock. We anticipate that we generally will elect to purchase the common units for common stock.
The preferred units are convertible by the holders into common units on a one-for-one basis or may be redeemed for cash at $10 per unit until October 2010. The preferred units receive a preferred dividend distribution of $1.10 per preferred unit annually, payable on a monthly basis and do not participate in the allocations of profits and losses of Supertel Limited Partnership. Supertel offered to each of the Preferred OP Unit holders the option to extend until October 24, 2011 their right to have units redeemed at $10 per unit. All holders elected to extend until October 24, 2011. In October 2009, 126,751 units were redeemed at $10 each. The holders of the remaining 51,035 units elected to extend to October 24, 2010, their right to have units redeemed at $10 per unit. There were 17,824 preferred operating partnership units redeemed during the year ended December 31, 2008.
Contractual Obligations
Below is a summary of certain obligations from continuing operations that will require capital (in thousands) as of December 31, 2010:
| Contractual Obligations |
Total | Less Than 1 Year |
1-3 Years | 3-5 Years | More than 5 Years |
|||||||||||||||
| Long-term debt, including interest |
$ | 176,175 | $ | 23,857 | $ | 72,463 | $ | 27,221 | $ | 52,634 | ||||||||||
| Land leases |
5,282 | 105 | 219 | 225 | 4,733 | |||||||||||||||
| Total contractual obligations |
$ | 181,457 | $ | 23,962 | $ | 72,682 | $ | 27,446 | $ | 57,367 | ||||||||||
We have various standing or renewable contracts with vendors. These contracts are all cancelable with immaterial or no cancellation penalties. Contract terms are generally one year or less. We also have management agreements with Royco Hotels and HLC for the management of our hotel properties.
47
Table of Contents
Other
To maintain our REIT tax status, we generally must distribute at least 90% of our taxable income to our shareholders annually. In addition, we are subject to a 4% non-deductible excise tax if the actual amount distributed to shareholders in a calendar year is less than a minimum amount specified under the federal income tax laws. We have a general dividend policy of paying out approximately 100% of annual REIT taxable income. The actual amount of any future dividends will be determined by the Board of Directors based on our actual results of operations, economic conditions, capital expenditure requirements and other factors that the Board of Directors deems relevant.
Off Balance Sheet Financing Transactions
We have not entered into any off balance sheet financing transactions.
Critical Accounting Policies
Critical accounting policies are those that are both important to the presentation of our financial condition and results of operations and require management’s most difficult, complex or subjective judgments. We have identified the following principal accounting policies that have a material effect on our consolidated financial statements:
Impairment of assets
In accordance with FASB ASC 360-10-35 Property Plant and Equipment—Overall—Subsequent Measurement, the Company analyzes its assets for impairment when events or circumstances occur that indicate the carrying amount may not be recoverable. As part of this process, the Company utilizes a two-step analysis to determine whether a trigger event (within the meaning of ASC 360-10-35) has occurred with respect to cash flow of, or a significant adverse change in business climate for, its hotel properties. Quarterly and annually the Company reviews all of its hotels to determine any property whose cash flow or operating performance significantly underperformed from budget or prior year, which the Company has set as a shortfall against budget or prior year as 15% or greater.
At year end the Company applies a second analysis on the entire held for use portfolio. The analysis estimates the expected future cash flows to identify any property whose carrying amount potentially exceeded the recoverable value. (Note that at the end of each quarter, this analysis is performed only on those properties identified in the 15% change analysis). In performing this year end analysis, the Company makes the following assumptions:
| • | Holding periods range from three to five years, for non-core assets, and ten years for those assets considered as core. |
| • | Cash flow from trailing twelve months for the individual properties multiplied by the holding period as noted above. The Company did not assume growth rates on cash flows as part of its step one analysis. |
| • | A revenue multiplier for the terminal value based on an average of historical sales from a leading industry broker of like properties was applied according to the assigned holding period. |
During the 12 months ended December 31, 2010, a trigger event as described in ASC 360-10-35 occurred for one of our held for use hotels. During the three months ended June 30, 2010, the analysis above was used to determine that a trigger event had occurred for one held for use property in which the carrying value of the hotel exceeded the sum of the undiscounted cash flows expected over its remaining anticipated holding period and from its disposition. The property was then tested to determine if the carrying amount was recoverable. When testing the recoverability for a property, in accordance with FASB ASC 360-10-35 35-29 Property Plant and Equipment—Overall—Subsequent Measurement, Estimates of Future Cash Flows Used to Test a Long-Lived Asset for
48
Table of Contents
Recoverability, the Company uses estimates of future cash flows associated with the individual properties over their expected holding period and eventual disposition. In estimating these future cash flows, the Company incorporates its own assumptions about its use of the hotel property and expected hotel performance. Assumptions used for the individual hotel were determined by management, based on discussions with our asset management group and our third party management companies. The property was then subjected to a probability-weighted cash flow analysis as described in FASB ASC 360-10-55 Property Plant and Equipment—Overall—Implementation. In this analysis, the Company completed a detailed review of the hotel’s market conditions and future prospects, which incorporated specific detailed cash flow and revenue multiplier assumptions over the remaining expected holding periods, including the probability that the property will be sold. Based on the results of this analysis, it was determined that the Company’s investment in the subject property was not fully recoverable; accordingly, impairment was recognized.
To determine the amount of impairment on the property identified above, in accordance with FASB ASC 360-10-55, the Company calculated the excess of the carrying value of the property in comparison to its fair market value as of June 30, 2010. Based on this calculation, the Company determined total impairment of $2.1 million existed as of June 30, 2010 on the held for use asset previously noted. Fair market value was determined by multiplying trailing 12 months revenue for the property by a revenue multiplier that was determined based on the Company’s experience with hotel sales in the current year as well as available industry information. As the fair market value of the property impaired for the year ending December 31, 2010, was determined in part by management estimates, a reasonable possibility exists that future changes to inputs and assumptions could affect the accuracy of management’s estimates and such future changes could lead to further possible impairment in the future. No additional held for use hotels were determined to be impaired during the 12 months ended December 31, 2010.
In accordance with ASC 360-10-35 Property Plant and Equipment—Overall—Subsequent Measurement, the Company determines the fair value of an asset held for sale based on the estimated selling price less estimated selling costs. We engage independent real estate brokers to assist us in determining the estimated selling price using a market approach. The estimated selling costs are based on our experience with similar asset sales.
Acquisition of Hotel Properties
Upon acquisition, we allocate the purchase price of asset classes based on the fair value of the acquired real estate, furniture, fixtures and equipment, and intangible assets, if any. Our investments in hotel properties are carried at cost and are depreciated using the straight-line method over an estimated useful life of 15 to 40 years for buildings and building improvements and three to twelve years for furniture, fixtures and equipment. Renovations and/or replacements that improve or extend the life of the asset are capitalized and depreciated over their estimated useful lives.
We are required to make subjective assessments as to the useful lives and classification of its properties for purposes of determining the amount of depreciation expense to reflect each year with respect to those properties. These assessments have a direct impact on our net income. Should we change the expected useful life or classification of particular assets, it would result in a change in depreciation expense and annual net income.
Accounting for Income Taxes
Income taxes are accounted for under the asset and liability method in accordance with GAAP. Deferred tax assets and liabilities are recognized for the future tax consequences attributable to differences between the financial statement carrying amount of existing assets and liabilities and their respective tax basis and for net operating loss and tax credit carry-forwards. Deferred tax assets and liabilities are measured using enacted tax rates expected to apply to taxable income in years in which those temporary differences are expected to be recovered or settled. The effect of a change in tax rates on deferred tax assets and liabilities is recognized in operations in the period that includes the enactment date. The realization of deferred tax assets is dependent upon the generation of future taxable income during the periods in which temporary differences become deductible. Management considers the scheduled reversal of deferred tax liabilities, projected future taxable income, and tax planning strategies in making this assessment. Management’s evaluation of the need for a valuation allowance must consider positive and negative evidence, and the weight given to the potential effects of such positive and negative evidence is based on the extent to which it can be objectively verified.
Related to accounting for uncertainty in income taxes, we follow a process by which the likelihood of a tax position is gauged based upon the technical merits of the position, perform a subsequent measurement related to the maximum benefit and the degree of likelihood, and determine the amount of benefit to be recognized in the financial statements, if any.
| Item 7A. | Quantitative and Qualitative Disclosures about Market Risk |
Market Risk Information
The market risk associated with financial instruments and derivative financial or commodity instruments is the risk of loss from adverse changes in market prices or rates. Our market risk arises primarily from interest rate risk relating to variable rate borrowings. Our interest rate risk management objective is to limit the impact of interest rate changes on earnings and cash flows. In order to achieve this objective, we have used both long term fixed rate loans and variable rate loans from institutional lenders to finance our hotels. We are not currently using derivative financial or commodity instruments to manage interest rate risk.
Management monitors our interest rate risk closely. The table below presents the annual maturities, weighted average interest rates on outstanding debt, excluding debt related to hotel properties held for sale, at the end of each year and fair values required to evaluate the expected cash flows under debt and related agreements, and our sensitivity to interest rate changes at December 31, 2010. Information relating to debt maturities is based on expected maturity dates and is summarized as follows (in thousands):
49
Table of Contents
| 2011 | 2012 | 2013 | 2014 | 2015 | Thereafter | Total | Fair Value | |||||||||||||||||||||||||
| Fixed Rate Debt |
$ | 10,012 | $ | 40,915 | $ | 2,443 | $ | 3,130 | $ | 14,136 | $ | 30,694 | $ | 101,330 | $ | 105,535 | ||||||||||||||||
| Average Interest Rate |
6.96 | % | 7.09 | % | 6.93 | % | 6.92 | % | 6.93 | % | 7.23 | % | 7.01 | % | — | |||||||||||||||||
| Variable Rate Debt |
$ | 5,174 | $ | 16,808 | $ | 1,056 | $ | 1,098 | $ | 1,141 | $ | 17,960 | $ | 43,237 | $ | 43,237 | ||||||||||||||||
| Average Interest Rate |
4.69 | % | 4.08 | % | 3.87 | % | 3.87 | % | 3.87 | % | 3.87 | % | 4.13 | % | — | |||||||||||||||||
As the table incorporates only those exposures that exist as of December 31, 2010, it does not consider exposures or positions that could arise after that date. As a result, our ultimate realized gain or loss with respect to interest rate fluctuations would depend on the exposures that arise after December 31, 2010.
If market rates of interest on the Company’s variable rate long-term debt fluctuate by 0.25%, interest expense would increase or decrease, depending on rate movement, future earnings and cash flows by $0.1 million annually. This assumes that the amount outstanding under the Company’s held for use variable rate debt remains at $43.2 million, the balance as of December 31, 2010.
50
Table of Contents
| Item 8. | Financial Statements and Supplementary Data |
SUPERTEL HOSPITALITY, INC. AND SUBSIDIARIES
INDEX TO CONSOLIDATED FINANCIAL STATEMENTS AND SCHEDULE III
51
Table of Contents
Report of Independent Registered Public Accounting Firm
The Board of Directors and Shareholders
Supertel Hospitality, Inc.:
We have audited the accompanying consolidated balance sheets of Supertel Hospitality, Inc. and subsidiaries (the Company) as of December 31, 2010 and 2009, and the related consolidated statements of operations, equity, and cash flows for each of the years in the three-year period ended December 31, 2010. In connection with our audits of the consolidated financial statements, we also have audited the related financial statement schedule, Schedule III – Real Estate and Accumulated Depreciation. These consolidated financial statements and the financial statement schedule are the responsibility of the Company’s management. Our responsibility is to express an opinion on these consolidated financial statements and financial statement schedule based on our audits.
We conducted our audits in accordance with the standards of the Public Company Accounting Oversight Board (United States). Those standards require that we plan and perform the audit to obtain reasonable assurance about whether the financial statements are free of material misstatement. An audit includes examining, on a test basis, evidence supporting the amounts and disclosures in the financial statements. An audit also includes assessing the accounting principles used and significant estimates made by management as well as evaluating the overall financial statement presentation. We believe that our audits provide a reasonable basis for our opinion.
In our opinion, the consolidated financial statements referred to above present fairly, in all material respects, the financial position of Supertel Hospitality, Inc. and subsidiaries as of December 31, 2010 and 2009, and the results of their operations and their cash flows for each of the years in the three-year period ended December 31, 2010, in conformity with U.S. generally accepted accounting principles. Also, in our opinion, the related financial statement schedule, when considered in relation to the basic consolidated financial statements taken as a whole, presents fairly, in all material respects, the information set forth therein.
/s/ KPMG LLP
Omaha, Nebraska
March 16, 2011
52
Table of Contents
Supertel Hospitality, Inc. and Subsidiaries
(In thousands, except per share and share data)
| As of | ||||||||
| December 31, 2010 |
December 31, 2009 |
|||||||
| ASSETS |
||||||||
| Investments in hotel properties |
$ | 295,907 | $ | 295,393 | ||||
| Less accumulated depreciation |
90,086 | 80,265 | ||||||
| 205,821 | 215,128 | |||||||
| Cash and cash equivalents |
333 | 428 | ||||||
| Accounts receivable, net of allowance for doubtful accounts of $133 and $95 |
1,717 | 2,043 | ||||||
| Prepaid expenses and other assets |
13,372 | 4,779 | ||||||
| Deferred financing costs, net |
988 | 1,414 | ||||||
| Investment in hotel properties held for sale |
34,413 | 50,603 | ||||||
| $ | 256,644 | $ | 274,395 | |||||
| LIABILITIES AND SHAREHOLDERS’ EQUITY |
||||||||
| LIABILITIES |
||||||||
| Accounts payable, accrued expenses and other liabilities |
$ | 17,732 | $ | 10,340 | ||||
| Debt related to hotel properties held for sale |
30,443 | 37,634 | ||||||
| Long-term debt |
144,567 | 151,879 | ||||||
| 192,742 | 199,853 | |||||||
| Redeemable noncontrolling interest in consolidated partnership, at redemption value |
511 | 511 | ||||||
| Redeemable preferred stock |
||||||||
| Series B, 800,000 shares authorized; $.01 par value, 332,500 shares outstanding, liquidation preference of $8,312 |
7,662 | 7,662 | ||||||
| SHAREHOLDERS’ EQUITY |
||||||||
| Preferred stock, 40,000,000 shares authorized; |
8 | 8 | ||||||
| Common stock, $.01 par value, 100,000,000 shares authorized; |
229 | 220 | ||||||
| Common stock warrants |
252 | — | ||||||
| Additional paid-in capital |
121,384 | 120,153 | ||||||
| Distributions in excess of retained earnings |
(66,479 | ) | (54,420 | ) | ||||
| Total shareholder equity |
55,394 | 65,961 | ||||||
| Noncontrolling interest in consolidated partnership, redemption value $250 and $237 |
335 | 408 | ||||||
| Total equity |
55,729 | 66,369 | ||||||
| $ | 256,644 | $ | 274,395 | |||||
See accompanying notes to consolidated financial statements.
53
Table of Contents
Supertel Hospitality, Inc. and Subsidiaries
CONSOLIDATED STATEMENTS OF OPERATIONS
(In thousands, except per share data)
| Years ended December 31, | ||||||||||||
| 2010 | 2009 | 2008 | ||||||||||
| REVENUES |
||||||||||||
| Room rentals and other hotel services |
$ | 84,114 | $ | 81,570 | $ | 90,996 | ||||||
| EXPENSES |
||||||||||||
| Hotel and property operations |
64,241 | 60,985 | 64,529 | |||||||||
| Depreciation and amortization |
11,011 | 11,405 | 11,081 | |||||||||
| General and administrative |
3,443 | 3,813 | 3,696 | |||||||||
| 78,695 | 76,203 | 79,306 | ||||||||||
| EARNINGS BEFORE NET GAINS (LOSSES) ON DISPOSITIONS OF ASSETS, OTHER INCOME, INTEREST, IMPAIRMENT LOSSES, NONCONTROLLING INTEREST AND INCOME TAX BENEFIT |
5,419 | 5,367 | 11,690 | |||||||||
| Net gains (losses) on dispositions of assets |
(66 | ) | (114 | ) | 1 | |||||||
| Other income |
122 | 134 | 129 | |||||||||
| Interest |
(9,702 | ) | (9,581 | ) | (9,906 | ) | ||||||
| Impairment losses |
(2,147 | ) | (7,399 | ) | — | |||||||
| EARNINGS (LOSS) FROM CONTINUING OPERATIONS BEFORE INCOME TAXES AND NONCONTROLLING INTEREST |
(6,374 | ) | (11,593 | ) | 1,914 | |||||||
| Income tax benefit |
(897 | ) | (549 | ) | (180 | ) | ||||||
| EARNINGS (LOSS) FROM CONTINUING OPERATIONS |
(5,477 | ) | (11,044 | ) | 2,094 | |||||||
| Earnings (loss) from discontinued operations |
(5,125 | ) | (16,481 | ) | 5,165 | |||||||
| NET EARNINGS (LOSS) |
(10,602 | ) | (27,525 | ) | 7,259 | |||||||
| Noncontrolling interest income (expense) |
17 | 130 | (603 | ) | ||||||||
| NET INCOME (LOSS) ATTRIBUTABLE TO CONTROLLING INTERESTS |
(10,585 | ) | (27,395 | ) | 6,656 | |||||||
| Preferred stock dividend |
(1,474 | ) | (1,474 | ) | (1,160 | ) | ||||||
| NET EARNINGS (LOSS) ATTRIBUTABLE TO COMMON SHAREHOLDERS |
$ | (12,059 | ) | $ | (28,869 | ) | $ | 5,496 | ||||
| NET EARNINGS (LOSS) PER COMMON SHARE - BASIC AND DILUTED |
||||||||||||
| EPS from continuing operations |
$ | (0.31 | ) | $ | (0.58 | ) | $ | 0.03 | ||||
| EPS from discontinued operations |
$ | (0.22 | ) | $ | (0.75 | ) | $ | 0.23 | ||||
| EPS Basic and Diluted |
$ | (0.53 | ) | $ | (1.33 | ) | $ | 0.26 | ||||
| AMOUNTS ATTRIBUTABLE TO COMMON SHAREHOLDERS |
||||||||||||
| Income from continuing operations, net of tax |
$ | (6,965 | ) | $ | (12,559 | ) | $ | 671 | ||||
| Discontinued operations, net of tax |
(5,094 | ) | (16,310 | ) | 4,825 | |||||||
| Net earnings (loss) |
$ | (12,059 | ) | $ | (28,869 | ) | $ | 5,496 | ||||
See accompanying notes to consolidated financial statements.
54
Table of Contents
Supertel Hospitality, Inc. and Subsidiaries
CONSOLIDATED STATEMENTS OF EQUITY
(In thousands)
| Years ended December 31, 2010, 2009, and 2008 | ||||||||||||||||||||||||||||||||
| Preferred | Common Stock | Common | Additional Paid- | Distributions in Excess of |
Total Shareholder |
Noncontrolling | Total | |||||||||||||||||||||||||
| Stock | Warrants | Stock | In Capital | Retained Earnings | Equity | Interest | Equity | |||||||||||||||||||||||||
| Balance at January 1, 2008 |
$ | 9 | $ | — | $ | 207 | $ | 112,792 | $ | (21,402 | ) | $ | 91,606 | $ | 8,222 | $ | 99,828 | |||||||||||||||
| Partner Draws |
— | — | — | — | — | — | (572 | ) | (572 | ) | ||||||||||||||||||||||
| Issuance of OP Units |
— | — | — | — | — | — | 26 | 26 | ||||||||||||||||||||||||
| Deferred compensation |
— | — | — | 12 | — | 12 | — | 12 | ||||||||||||||||||||||||
| Dividend Reinvestment Plan |
— | — | — | 1 | — | 1 | — | 1 | ||||||||||||||||||||||||
| Conversion of Preferred Stock |
(1 | ) | — | 2 | (1 | ) | — | — | — | — | ||||||||||||||||||||||
| Common dividends—$0.4625 per share |
— | — | — | — | (9,645 | ) | (9,645 | ) | — | (9,645 | ) | |||||||||||||||||||||
| Preferred dividends |
— | — | — | — | (1,160 | ) | (1,160 | ) | — | (1,160 | ) | |||||||||||||||||||||
| Net earnings |
— | — | — | — | 6,656 | 6,656 | 388 | 7,044 | ||||||||||||||||||||||||
| Balance at December 31, 2008 |
$ | 8 | $ | — | $ | 209 | $ | 112,804 | $ | (25,551 | ) | $ | 87,470 | $ | 8,064 | $ | 95,534 | |||||||||||||||
| Deferred compensation |
— | — | — | 6 | — | 6 | — | 6 | ||||||||||||||||||||||||
| Conversion of OP Units |
— | — | 11 | 7,343 | — | 7,354 | (7,354 | ) | — | |||||||||||||||||||||||
| Preferred dividends |
— | — | — | — | (1,474 | ) | (1,474 | ) | — | (1,474 | ) | |||||||||||||||||||||
| Net loss |
— | — | — | — | (27,395 | ) | (27,395 | ) | (302 | ) | (27,697 | ) | ||||||||||||||||||||
| Balance at December 31, 2009 |
$ | 8 | $ | — | $ | 220 | $ | 120,153 | $ | (54,420 | ) | $ | 65,961 | $ | 408 | $ | 66,369 | |||||||||||||||
| Deferred compensation |
— | — | — | 30 | — | 30 | — | 30 | ||||||||||||||||||||||||
| Common stock offerings |
— | 252 | 9 | 1,201 | — | 1,462 | — | 1,462 | ||||||||||||||||||||||||
| Preferred dividends |
— | — | — | — | (1,474 | ) | (1,474 | ) | — | (1,474 | ) | |||||||||||||||||||||
| Net loss |
— | — | — | — | (10,585 | ) | (10,585 | ) | (73 | ) | (10,658 | ) | ||||||||||||||||||||
| Balance at December 31, 2010 |
$ | 8 | $ | 252 | $ | 229 | $ | 121,384 | $ | (66,479 | ) | $ | 55,394 | $ | 335 | $ | 55,729 | |||||||||||||||
See accompanying notes to consolidated financial statements.
55
Table of Contents
Supertel Hospitality, Inc. and Subsidiaries
CONSOLIDATED STATEMENTS OF CASH FLOWS
(In thousands)
| Years ended December 31, | ||||||||||||
| 2010 | 2009 | 2008 | ||||||||||
| CASH FLOWS FROM OPERATING ACTIVITIES: |
||||||||||||
| Net earnings (loss) |
$ | (10,602 | ) | $ | (27,525 | ) | $ | 7,259 | ||||
| Adjustments to reconcile net earnings (loss) to net cash provided by operating activities: |
||||||||||||
| Depreciation and amortization |
11,708 | 14,241 | 14,979 | |||||||||
| Amortization of intangible assets and deferred financing costs |
487 | 595 | 569 | |||||||||
| Net gains on dispositions of assets |
(1,276 | ) | (2,264 | ) | (5,581 | ) | ||||||
| Amortization of stock option expense |
30 | 6 | 12 | |||||||||
| Provision for impairment loss |
8,198 | 24,148 | 250 | |||||||||
| Changes in operating assets and liabilities: |
||||||||||||
| (Increase) decrease in assets |
(8,267 | ) | (1,525 | ) | 1,720 | |||||||
| Increase (decrease) in liabilities |
7,394 | (1,575 | ) | 1,397 | ||||||||
| Net cash provided by operating activities |
7,672 | 6,101 | 20,605 | |||||||||
| CASH FLOWS FROM INVESTING ACTIVITIES: |
||||||||||||
| Additions to hotel properties |
(4,344 | ) | (4,484 | ) | (11,227 | ) | ||||||
| Acquisition and development of hotel properties |
— | — | (22,903 | ) | ||||||||
| Proceeds from sale of hotel assets |
11,209 | 16,509 | 11,572 | |||||||||
| Net cash (used) provided by investing activities |
6,865 | 12,025 | (22,558 | ) | ||||||||
| CASH FLOWS FROM FINANCING ACTIVITIES: |
||||||||||||
| Deferred financing costs |
(61 | ) | (431 | ) | (199 | ) | ||||||
| Principal payments on long-term debt |
(16,920 | ) | (28,834 | ) | (19,565 | ) | ||||||
| Proceeds from long-term debt |
2,417 | 15,541 | 26,467 | |||||||||
| Redemption of operating partnership units |
— | (1,267 | ) | (178 | ) | |||||||
| Distributions to minority partners |
(56 | ) | (271 | ) | (846 | ) | ||||||
| Preferred stock offering |
— | — | 7,662 | |||||||||
| Common stock offering |
1,462 | — | (72 | ) | ||||||||
| Dividends paid |
(1,474 | ) | (3,148 | ) | (11,770 | ) | ||||||
| Net cash (used) provided by financing activities |
(14,632 | ) | (18,410 | ) | 1,499 | |||||||
| Decrease in cash and cash equivalents |
(95 | ) | (284 | ) | (454 | ) | ||||||
| CASH AND CASH EQUIVALENTS, BEGINNING OF YEAR |
428 | 712 | 1,166 | |||||||||
| CASH AND CASH EQUIVALENTS, END OF YEAR |
$ | 333 | $ | 428 | $ | 712 | ||||||
| SUPPLEMENTAL CASH FLOW INFORMATION: |
||||||||||||
| Interest paid, net of amounts capitalized |
$ | 11,795 | $ | 12,487 | $ | 13,379 | ||||||
| SCHEDULE OF NONCASH INVESTING AND FINANCING ACTIVITIES |
||||||||||||
| Dividends declared |
$ | 1,474 | $ | 1,474 | $ | 10,805 | ||||||
See accompanying notes to consolidated financial statements.
56
Table of Contents
Supertel Hospitality, Inc. and Subsidiaries
NOTES TO CONSOLIDATED FINANCIAL STATEMENTS
December 31, 2010, 2009 and 2008
(Dollars in thousands, except per share data)
Note 1. Organization and Summary of Significant Accounting Policies
Description of Business
Supertel Hospitality, Inc. (SHI) was incorporated in Virginia on August 23, 1994. SHI is a self-administered real estate investment trust (REIT) for federal income tax purposes.
SHI, through its wholly owned subsidiaries, Supertel Hospitality REIT Trust and E&P REIT Trust (collectively, the “Company”) owns a controlling interest in Supertel Limited Partnership (“SLP”) and E&P Financing Limited Partnership (“E&P LP”). All of the Company’s interests in 96 properties with the exception of furniture, fixtures and equipment on 72 properties held by TRS Leasing, Inc. and its subsidiaries are held directly or indirectly by E&P LP, Supertel Limited Partnership or Solomon’s Beacon Inn Limited Partnership (SBILP) (collectively, the “Partnerships”). The Company’s interests in ten properties are held directly by either SPPR-Hotels, LLC (SHLLC), SPPR-South Bend, LLC (SSBLLC), or SPPR-BMI, LLC (SBMILLC). SHI, through Supertel Hospitality REIT Trust, is the sole general partner in Supertel Limited Partnership and at December 31, 2010 owned approximately 99% of the partnership interests in Supertel Limited Partnership. Supertel Limited Partnership is the general partner in SBILP. At December 31, 2010, Supertel Limited Partnership and SHI owned 99% and 1% interests in SBILP, respectively, and SHI owned 100% of Supertel Hospitality Management, Inc, SPPR Holdings, Inc. (SPPRHI), and SPPR-BMI Holdings, Inc. (SBMIHI). Supertel Limited Partnership and SBMIHI owned 99% and 1% of SBMILLC, respectively. Supertel Limited Partnership and SPPRHI owned 99% and 1% of SHLLC, respectively, and Supertel Limited Partnership owned 100% of SSBLLC. References to “we”, “our”, and “us” herein refer to Supertel Hospitality, Inc., including as the context requires, its direct and indirect subsidiaries.
As of December 31, 2010, the Company owned 106 limited service hotels and one office building. All of the hotels are leased to our wholly owned taxable REIT subsidiary, TRS Leasing, Inc. (“TRS”), and its wholly owned subsidiaries (collectively “TRS Lessee”), and are managed by Royco Hotels, Inc (“Royco Hotels”), and HLC Hotels, Inc. (“HLC”).
The hotel management agreement, as amended, between TRS Lessee and Royco Hotels, the manager of 95 of the Company’s hotels, provides for Royco Hotels to operate and manage the hotels through December 31, 2011, with extension to December 31, 2016 upon achievement of average annual net operating income of at least 10% of the Company’s investment in the hotels. Under the agreement, Royco Hotels receives a base management fee ranging from 4.25% to 3.0% of gross hotel revenues as revenues increase above thresholds that range from up to $75 million to over $100 million, and, an annual incentive fee of 10% of up to the first $1.0 million of annual net operating income in excess of 10% of the Company’s investment in the hotels, and 20% of the excess above $1.0 million.
On May 16, 2007, Supertel Limited Partnership acquired 15 hotels which are operated under the Masters Inn name. Three of these hotels were sold in 2009, and one was sold in 2010. In connection with the acquisition, TRS entered into a management agreement with HLC, an affiliate of the sellers of the hotels. The management agreement, as amended, provides for HLC to operate and manage the remaining 11 hotels through December 31, 2011 and receive management fees equal to 5.0% of the gross revenues derived from the operation of the hotels and incentive fees equal to 10% of the annual operating income of the hotels in excess of 10.5% of the Company’s investment in the hotels.
The management agreements generally require TRS Lessee to fund debt service, working capital needs, capital expenditures and third-party operating expenses for Royco Hotels and HLC excluding those expenses not related to the operation of the hotels. TRS Lessee is responsible for
57
Table of Contents
Supertel Hospitality, Inc. and Subsidiaries
NOTES TO CONSOLIDATED FINANCIAL STATEMENTS—CONTINUED
December 31, 2010, 2009 and 2008
(Dollars in thousands, except per share data)
obtaining and maintaining insurance policies with respect to the hotels.
Principles of Consolidation
The consolidated financial statements include the accounts of the Company, the Partnerships and the TRS Lessee. All significant intercompany balances and transactions have been eliminated in consolidation.
Estimates, Risks and Uncertainties
The preparation of the consolidated financial statements in conformity with U.S. generally accepted accounting principles requires management to make estimates and assumptions that affect the reported amounts of assets and liabilities and disclosure of contingent assets and liabilities at the date of the consolidated financial statements and revenues and expenses recognized during the reporting period. The significant estimates pertain to impairment analysis and allocation of purchase price (FASB ASC 805-10 Business Combinations—Overall). Actual results could differ from those estimates.
Because of the adverse conditions that exist in the real estate markets, as well as the credit and financial markets, it is possible that the estimates and assumptions that have been utilized in the preparation of the consolidated financial statements could change. Specifically as it relates to the Company’s business, the recent economic conditions are expected to continue to negatively affect the Company’s operating performance, as well as its liquidity position.
Liquidity
Our income and ability to meet our debt service obligations, and make distributions to our shareholders, depends upon the operations of the hotels being conducted in a manner that maintains or increases revenue, or reduces expenses, to generate sufficient hotel operating income for TRS Lessee to pay the hotels’ operating expenses, including management fees and rents to us. We depend on rent payments from TRS Lessee to pay our operating expenses and debt service and to make distributions to shareholders.
The Company’s operating performance, as well as its liquidity position, has been and continues to be negatively affected by recent economic conditions, many of which are beyond our control. The Company anticipates that these adverse economic conditions will improve somewhat over the next year; however, in addition to our operating performance, the other sources described below will be essential to our liquidity and financial position.
Our business requires continued access to adequate capital to fund our liquidity needs. In 2010, the Company reviewed its entire portfolio, identified properties considered non-core and developed timetables for disposal of those assets deemed non-core. We focused on improving our liquidity through cash generating asset sales and disposition of assets that are not generating cash at levels consistent with our investment principles. In 2011, our foremost priorities continue to be preserving and generating capital sufficient to fund our liquidity needs. Given the deterioration and uncertainty in the economy and financial markets, management believes that access to conventional sources of capital will be challenging and management has planned accordingly. We are also working to proactively address challenges to our short-term and long-term liquidity position.
The following are the expected actual and potential sources of liquidity, which we currently believe will be sufficient to fund our near-term obligations:
| • | Cash and cash equivalents; |
| • | Cash generated from operations; |
| • | Proceeds from asset dispositions; |
| • | Proceeds from additional secured or unsecured debt financings; and/or |
| • | Proceeds from public or private issuances of debt or equity securities. |
58
Table of Contents
Supertel Hospitality, Inc. and Subsidiaries
NOTES TO CONSOLIDATED FINANCIAL STATEMENTS—CONTINUED
December 31, 2010, 2009 and 2008
(Dollars in thousands, except per share data)
These sources are essential to our liquidity and financial position, and we cannot assure you that we will be able to successfully access them (particularly in the current economic environment). If we are unable to generate cash from these sources, we may have liquidity-related capital shortfalls and will be exposed to default risks. While we believe that we will have adequate capital for our near–term uses, significant issues with access to the liquidity sources identified above could lead to our insolvency.
In the near-term, the Company’s cash flow from operations is not projected to be sufficient to meet all of our liquidity needs. In response, management has identified non-core assets in our portfolio to be liquidated over a one to ten year period. Among the criteria for determining properties to be sold was potential upside when hotel fundamentals return to stabilized levels. The 18 properties held for sale as of December 31, 2010 were determined to be less likely to participate in increased cash flow levels when markets do improve. As such, we expect these dispositions to help us (1) preserve cash, through potential disposition of properties with current or projected negative cash flow and/or other potential near-term cash outlay requirements (including debt maturities) and (2) generate cash, through the potential disposition of strategically identified non-core assets that we believe have equity value above debt.
We are actively marketing the 18 properties held for sale, which we anticipate will result in the elimination of $30.4 million of debt and generate an expected $5.2 million of proceeds for operations. We continue to receive strong interest in our 18 held for sale properties. The marketing process has been affected by deteriorating economic conditions and we have experienced some decreases in expected pricing. If this trend continues to worsen, we may be unable to complete the disposition of identified properties in a manner that would generate cash flow in line with management’s estimates as noted above. Our ability to dispose of these assets is impacted by a number of factors. Many of these factors are beyond our control, including general economic conditions, availability of financing and interest rates. In light of the current economic conditions, we cannot predict:
| • | whether we will be able to find buyers for identified assets at prices and/or other terms acceptable to us; |
| • | whether potential buyers will be able to secure financing; and |
| • | the length of time needed to find a buyer and to close the sale of a property. |
On March 26, 2010, we entered into a Standby Equity Distribution Agreement (SEDA) with Yorkville Advisors and, as of December 31, 2010, we have sold 316,384 shares resulting in net proceeds of $480,000 which were used for corporate purposes.
As our debt matures, our principal payment obligations also present significant future cash requirements. We may not be able to successfully extend, refinance or repay our debt due to a number of factors, including decreased property valuations, limited availability of credit, tightened lending standards and deteriorating economic conditions. Historically, extending or refinancing loans has required the payment of certain fees to, and expenses of, the applicable lenders. Any future extensions or refinancing will likely require increased fees due to tightened lending practices. These fees and cash flow restrictions will affect our ability to fund other liquidity uses. In addition, the terms of the extensions or refinancing may include operational and financial covenants significantly more restrictive than our current debt covenants.
The Company’s credit facility with Wells Fargo Bank ($5.3 million balance at December 31, 2010), previously due on March 12, 2011, has been extended to September 30, 2011. Also, the Company’s note payable to First National Bank of Omaha ($0.8 million balance at December 31, 2010), previously due on February 1, 2011, has been extended to March 1, 2012. The Company’s other 2011 maturities (at December 31, 2010) consist of approximately $5.4 million of principal amortization on mortgage loans and $11.8 million payable to Great Western Bank pursuant to a term loan that matures in December 2011. The Company intends to refinance or repay these 2011 maturities using its existing lines of credit, other financing, funds from
59
Table of Contents
Supertel Hospitality, Inc. and Subsidiaries
NOTES TO CONSOLIDATED FINANCIAL STATEMENTS—CONTINUED
December 31, 2010, 2009 and 2008
(Dollars in thousands, except per share data)
operations or proceeds from the sale of hotels. If the Company is unable to repay or refinance its debt as it becomes due, then its lenders have the ability to take control of its encumbered hotel assets.
The Company is also required to meet various financial covenants required by its existing lenders. If the Company’s future financial performance fails to meet these financial covenants, then its lenders also have the ability to take control of its encumbered hotel assets. Defaults with lenders due to failure to repay or refinance debt when due or failure to comply with financial covenants could also result in defaults under our credit facilities with Great Western Bank and Wells Fargo Bank. Our Great Western Bank and Wells Fargo Bank credit facilities contain cross-default provisions which would allow Great Western Bank and Wells Fargo Bank to declare a default and accelerate our indebtedness to them if we default on our other loans, and such default would permit that lender to accelerate our indebtedness under any such loan. If this were to happen, whether due to failure to repay or refinance debt when due or failure to comply with financial covenants, the Company’s ability to conduct business could be severely impacted as there can be no assurance that the adequacy and timeliness of cash flow would be available to meet the Company’s liquidity requirements. The Company believes it has the ability to repay its indebtedness when due with cash generated from operations, sales of hotels, refinancings or the issuance of stock, while at the same time continuing to be a substantial owner of limited service and economy hotels. If the economic environment does not improve in 2011, the Company’s plans and actions may not be sufficient and could lead to possibly failing financial debt covenant requirements.
No common stock dividends were declared during 2010 or 2009. The Board of Directors continues to monitor requirements to maintain the Company’s REIT status on a quarterly basis.
Capitalization Policy
Development and construction costs of properties in development are capitalized including, where applicable, direct and indirect costs, including real estate taxes and interest costs. Development and construction costs and costs of significant improvements, replacements, renovations to furniture and equipment expenditures for hotel properties are capitalized while costs of maintenance and repairs are expensed as incurred.
Deferred Financing Cost
Direct costs incurred in financing transactions are capitalized as deferred costs and amortized to interest expense over the term of the related loan using the effective interest method.
Investment in Hotel Properties
Upon acquisition, the Company allocates the purchase price of assets to asset classes based on the fair value of the acquired real estate, furniture, fixtures and equipment, and intangible assets, if any. The Company’s investments in hotel properties are carried at cost and are depreciated using the straight-line method over an estimated useful life of 15 to 40 years for buildings and three to twelve years for furniture, fixtures and equipment.
The Company periodically reviews the carrying value of each hotel to determine if circumstances exist indicating impairment to the carrying value of the investment in the hotel or that depreciation periods should be modified. If facts or circumstances support the possibility of impairment, the Company will prepare an estimate of the undiscounted future cash flows, without interest charges, of the specific hotel and determine if the investment in such hotel is recoverable based on the undiscounted future cash flows. If impairment is indicated, an adjustment will be made to the carrying value of the hotel to reflect the hotel at fair value.
60
Table of Contents
Supertel Hospitality, Inc. and Subsidiaries
NOTES TO CONSOLIDATED FINANCIAL STATEMENTS—CONTINUED
December 31, 2010, 2009 and 2008
(Dollars in thousands, except per share data)
In accordance with the provisions of FASB ASC 360-10-45 Property, Plant, and Equipment—Overall—Other Presentation Matters, a hotel is considered held for sale when a contract for sale is entered into, a substantial, non refundable deposit has been committed by the purchaser, and sale is expected to occur within one year, or if management has determined to sell the property within one year. Depreciation of these properties is discontinued at that time, but operating revenues, other operating expenses and interest continue to be recognized until the date of sale. Revenues and expenses of properties that are classified as held for sale or sold are presented as discontinued operations for all periods presented in the statements of operations if the properties will be or have been sold on terms where the Company has limited or no continuing involvement with them after the sale. If active marketing ceases or the properties no longer meet the criteria to be classified as held for sale, the properties are reclassified as operating and measured at the lower of their (a) carrying amount before the properties were classified as held for sale, adjusted for any depreciation expense that would have been recognized had the properties been continuously classified as operating or (b) their fair value at the date of the subsequent decision not to sell.
Gains on sales of real estate are recognized in accordance with FASB ASC 360-20 Property, Plant, and Equipment – Real Estate Sales (“ASC 360-20”). The specific timing of the sale is measured against various criteria of ASC 360-20 related to the terms of the transactions and any continuing involvement in the form of management or financial assistance associated with the properties. If the sales criteria are not met, the gain is deferred and the finance, installment or cost recovery method, as appropriate, is applied until the sales criteria are met. To the extent we sell a property and retain a partial ownership interest in the property, we recognize gain to the extent of the third party ownership interest in accordance with ASC 360-20.
Cash and Cash Equivalents
Cash and cash equivalents include cash and various highly liquid investments with original maturities of three months or less when acquired, and are carried at cost which approximates fair value.
Revenue Recognition
Revenues from the operations of the hotel properties are recognized when earned. Sales taxes collected from customers and remitted to governmental authorities are accounted for on a net basis and therefore are excluded from revenues in the consolidated statements of operations.
Income Taxes
The Company qualifies and intends to continue to qualify as a REIT under applicable provisions of the Internal Revenue Code, as amended. In general, under such Code provisions, a trust which has made the required election and, in the taxable year, meets certain requirements and distributes to its shareholders at least 90% of its REIT taxable income will not be subject to federal income tax to the extent of the income which it distributes. Earnings and profits, which determine the taxability of dividends to shareholders, differ from net income reported for financial reporting purposes due primarily to differences in depreciation of hotel properties for federal tax purposes. Except with respect to the TRS Lessee, the Company does not believe that it will be liable for significant federal or state income taxes in future years.
Deferred income taxes relate primarily to the TRS Lessee and are accounted for using the asset and liability method. Under this method, deferred income taxes are recognized for temporary differences between the financial reporting bases of assets and liabilities of the TRS Lessee and their respective tax bases and for operating loss and tax credit carryforwards based on enacted tax rates expected to be in effect when such amounts are realized or settled. However, deferred tax assets are recognized only to the extent that it is more likely than not that they will be realized based on consideration of available evidence, including tax planning strategies and other factors.
61
Table of Contents
Supertel Hospitality, Inc. and Subsidiaries
NOTES TO CONSOLIDATED FINANCIAL STATEMENTS—CONTINUED
December 31, 2010, 2009 and 2008
(Dollars in thousands, except per share data)
Under the REIT Modernization Act (“RMA”), which became effective January 1, 2001, the Company is permitted to lease its hotels to one or more wholly owned taxable REIT subsidiaries (“TRS”) and may continue to qualify as a REIT provided that the TRS enters into management agreements with an “eligible independent contractor” that will manage the hotels leased by the TRS. The Company formed the TRS Lessee and, effective January 1, 2002, the TRS Lessee leased all of the hotel properties. The TRS Lessee is subject to taxation as a C-Corporation. The TRS Lessee has incurred operating losses for financial reporting and federal income tax purposes for 2010, 2009 and 2008.
Fair Value Measurements
We currently do not have any financial instruments that must be measured on a recurring basis under FASB ASC 820-10 Fair Value Measurements and Disclosures - Overall; however, we apply the fair value provisions of ASC 820-10-35 Fair Value Measurements and Disclosures - Overall - Subsequent Measurement, for our nonfinancial assets which include our held for sale hotels. We measure these assets using inputs from Level 3 of the fair value hierarchy.
Level 1 inputs are unadjusted quoted prices in active markets for identical assets or liabilities that we have the ability to access at the measurement date.
Level 2 inputs include quoted prices for similar assets and liabilities in active markets, quoted prices for identical or similar assets or liabilities in markets that are not active, inputs other than quoted prices that are observable for the asset or liability (i.e., interest rates, yield curves, etc.), and inputs that are derived principally from or corroborated by observable market data by correlation or other means (market corroborated inputs).
Level 3 includes unobservable inputs that reflect our assumptions about the assumptions that market participants would use in pricing the asset or liability. We develop these inputs based on the best information available, including our own data.
During the 12 months ending December 31, 2010, Level 3 inputs were used to determine impairment losses of $6.1 million on hotels in discontinued operations. This includes the recovery of previously recorded impairment for which sale price or fair value exceeded management’s previous estimates in the amount of $0.9 million on assets held for sale and sold. The Company also recorded $2.1 million in impairment loss on one held for use hotel.
During the 12 months ending December 31, 2009, Level 3 inputs were used to determine impairment losses of $16.7 million on held for sale and sold hotels which includes $3.5 million of impairment losses taken on one property classified as held for use in 2009 and reclassified as held for sale in 2010. In addition, these impairment losses include the recovery of previously recorded impairment for which fair value exceeded management’s previous estimates in the amount of $0.07 million on two assets sold in 2009. This recovery was recorded in the period the sale occurred. The Company also recorded $7.4 million in impairment loss on five held for use hotels.
In accordance with ASC 360-10-35 Property Plant and Equipment—Overall—Subsequent Measurement, the Company determines the fair value of an asset held for sale based on the estimated selling price less estimated selling costs. We engage independent real estate brokers to assist us in determining the estimated selling price using a market approach. The estimated selling costs are based on our experience with similar asset sales.
The Company estimates the fair value of its fixed rate debt and the credit spreads over variable market rates on its variable rate debt by discounting the future cash flows of each instrument at estimated market rates or credit spreads consistent with the maturity of the debt obligation with similar credit policies. Credit spreads take into consideration general market conditions and maturity. As of December 31, 2010, the carrying value and estimated fair value of the Company’s debt, excluding debt related to hotel properties held for sale, was $144.6 million and $148.8 million, respectively. The carrying value of the Company’s other financial instruments approximates fair value due to the short-term nature of these financial instruments.
Earnings Per Share
Basic earnings per share (“EPS”) is computed by dividing earnings available to common shareholders by the weighted average number of common shares outstanding. Diluted EPS is computed after adjusting the
62
Table of Contents
Supertel Hospitality, Inc. and Subsidiaries
NOTES TO CONSOLIDATED FINANCIAL STATEMENTS—CONTINUED
December 31, 2010, 2009 and 2008
(Dollars in thousands, except per share data)
numerator and denominator of the basic EPS computation for the effects of any dilutive potential common shares outstanding during the period, if any. The computation of basic and diluted earnings per common share is presented below:
| (dollars in thousands, except per share data) | For the year ended December 31, | |||||||||||
| 2010 | 2009 | 2008 | ||||||||||
| Basic Earnings per Share Calculation: |
||||||||||||
| Numerator: |
||||||||||||
| Net earnings (loss) attributable to common shareholders: |
||||||||||||
| Continuing operations |
$ | (6,965 | ) | $ | (12,559 | ) | $ | 671 | ||||
| Discontinued operations |
(5,094 | ) | (16,310 | ) | 4,825 | |||||||
| Net earnings (loss) attributable to common shareholders - total |
$ | (12,059 | ) | $ | (28,869 | ) | $ | 5,496 | ||||
| Denominator: |
||||||||||||
| Weighted average number of common shares - basic |
22,556,382 | 21,646,612 | 20,839,823 | |||||||||
| Basic Earnings Per Common Share: |
||||||||||||
| Continuing Operations |
$ | (0.31 | ) | $ | (0.58 | ) | $ | 0.03 | ||||
| Discontinued Operations |
(0.22 | ) | (0.75 | ) | 0.23 | |||||||
| Total |
$ | (0.53 | ) | $ | (1.33 | ) | $ | 0.26 | ||||
| For the year ended December 31, | ||||||||||||
| 2010 | 2009 | 2008 | ||||||||||
| Diluted Earnings per Share Calculation: |
||||||||||||
| Numerator: |
||||||||||||
| Net earnings (loss) attributable to common shareholders: |
||||||||||||
| Continuing operations |
$ | (6,965 | ) | $ | (12,559 | ) | $ | 671 | ||||
| Discontinued operations |
(5,094 | ) | (16,310 | ) | 4,825 | |||||||
| Net earnings (loss) attributable to common shareholders - total |
$ | (12,059 | ) | $ | (28,869 | ) | $ | 5,496 | ||||
| Denominator: |
||||||||||||
| Weighted average number of common shares - basic |
22,556,382 | 21,646,612 | 20,839,823 | |||||||||
| Effect of dilutive securities: |
||||||||||||
| Common stock options |
— | — | 366 | |||||||||
| Weighted average number of common shares - diluted |
22,556,382 | 21,646,612 | 20,840,189 | |||||||||
| Diluted Earnings per share: |
||||||||||||
| Continuing Operations |
$ | (0.31 | ) | $ | (0.58 | ) | $ | 0.03 | ||||
| Discontinued Operations |
(0.22 | ) | (0.75 | ) | 0.23 | |||||||
| Total |
$ | (0.53 | ) | $ | (1.33 | ) | $ | 0.26 | ||||
Preferred and Common Limited Partnership Units in SLP
At December 31, 2010, 2009, and 2008 there were 158,161, 158,161 and 1,235,806, respectively of SLP common operating units outstanding. These units have been excluded from the diluted earnings per share calculation as there would be no effect on the amounts allocated to the limited partners holding common operating units (whose units are convertible on a one-to-one basis to common shares) since their share of income (loss) would be
63
Table of Contents
Supertel Hospitality, Inc. and Subsidiaries
NOTES TO CONSOLIDATED FINANCIAL STATEMENTS—CONTINUED
December 31, 2010, 2009 and 2008
(Dollars in thousands, except per share data)
added back to income (loss). During 2009, 1,077,645 common operating units were converted into 1,077,645 shares of common stock. In addition, the 51,035, 51,035 and 177,786 shares of SLP preferred operating units held by the limited partners as of December 31, 2010, 2009 and 2008, respectively, are antidilutive.
Preferred Stock of SHI
At December 31, 2010, 2009 and 2008, there were 803,270 shares each year of Series A Preferred Stock. During 2008 there were 128,756 shares of Series A Preferred Stock converted to 227,896 shares of common stock. The shares of Series A Preferred Stock, after adjusting the numerator and denominator for the basic EPS computation, are antidilutive for the year ended December 31, 2010, 2009 and 2008, for the earnings per share computation. The exercise price of the preferred stock warrants exceeded the market price of the common stock, and therefore these shares were excluded from the computation of diluted earnings per share. The conversion rights of the Series A Preferred Stock were cancelled as of February 20, 2009. See additional information regarding preferred stock and warrants in Note 11.
At December 31, 2010 and 2009, there were 332,500 shares, each year, of Series B Cumulative Preferred Stock outstanding. The Series B Cumulative Preferred Stock is not convertible into common stock, therefore, there is no dilutive effect on earnings per share.
Stock-Based Compensation
Options
The Company has a 2006 Stock Plan (the “Plan”) which has been approved by the Company’s shareholders. The Plan authorized the grant of stock options, stock appreciation rights, restricted stock and stock bonuses for up to 200,000 shares of common stock. At the annual shareholders meeting on May 28, 2009, the shareholders of Supertel Hospitality, Inc. approved an amendment to the Supertel 2006 Stock Plan. The amendment increases the maximum number of shares reserved for issuance under the plan from 200,000 to 300,000 and changes the definition of fair market value to mean the closing price of Supertel common stock with respect to future awards under the plan.
The potential common shares represented by outstanding stock options for the year ended December 31, 2010, 2009 and 2008 totaled 255,143, 230,715, and 192,143 respectively, of which 255,143, 230,715 and 191,777 shares, respectively are assumed to be repurchased with proceeds from the exercise of stock options resulting in zero, zero, and 366 shares, respectively, that are dilutive.
Share-Based Compensation Expense
The Plan is accounted for in accordance with FASB ASC Topic 718 – 10 Compensation – Stock Compensation – Overall, requiring the measurement and recognition of compensation expense for all share-based payment awards to employees and directors based on estimated fair values. The expense recognized in the consolidated financial statements for the year ended December 31, 2010, 2009, and 2008 for share-based compensation related to employees and directors was $30, $6 and $12, respectively.
Noncontrolling Interest
Noncontrolling interest in SLP represents the limited partners’ proportionate share of the equity in the operating partnership. Supertel offered to each of the holders of SLP preferred operating units the option to extend until October 24, 2011 their right to have units redeemed at $10 per unit. All holders elected to extend until October 24, 2011. In October 2009, 126,751 units were redeemed at $10 each. The holders of the remaining 51,035 SLP
64
Table of Contents
Supertel Hospitality, Inc. and Subsidiaries
NOTES TO CONSOLIDATED FINANCIAL STATEMENTS—CONTINUED
December 31, 2010, 2009 and 2008
(Dollars in thousands, except per share data)
preferred operating units elected to extend to October 24, 2010, their right to have units redeemed at $10 per unit. During 2008, 17,824 preferred operating units of limited partnership interest were redeemed by unit holders. See additional information regarding SLP units in Note 10. There were no common operating units redeemed in 2010 or 2008. During 2009, 1,077,645 SLP common operating units of limited partnership interest were redeemed by unit holders for common shares of SHI. At December 31, 2010, the aggregate partnership interest held by the limited partners in SLP was approximately 1.0%. Income is allocated to noncontrolling interest based on the weighted average percentage ownership throughout the year.
Concentration of Credit Risk
The Company maintained a major portion of its deposits with Great Western Bank, a Nebraska Corporation at December 31, 2010, 2009 and 2008. The balance on deposit at Great Western Bank exceeded the federal deposit insurance limit; however, management believes that no significant credit risk exists with respect to the uninsured portion of this cash balance.
Note 2. Acquisitions and Development
There were no acquisitions and no properties under construction or redevelopment during 2010 or 2009.
In 2008, the Company acquired seven hotels in Kentucky, two hotels in Sioux Falls, South Dakota and a hotel in Green Bay, Wisconsin. The combined purchase price of $22 million was funded by term loans of $15.6 million and $6.4 million from our existing credit facilities. The franchise brands consisted of Comfort Inn (2), Comfort Suites (1), Days Inn (4), Quality Inn (1), Sleep Inn (1) and Super 8 (1).
Note 3. Investments in Hotel Properties
Investments in hotel properties consisted of the following at December 31:
| 2010 | 2009 | |||||||||||||||||||||||
| Held For Sale | Held For Use | TOTAL | Held For Sale | Held For Use | TOTAL | |||||||||||||||||||
| Land |
$ | 6,162 | $ | 36,813 | $ | 42,975 | $ | 9,484 | $ | 37,037 | $ | 46,521 | ||||||||||||
| Acquired below market lease intangibles |
69 | 883 | 952 | 89 | 883 | 972 | ||||||||||||||||||
| Buildings, improvements, vehicle |
29,816 | 210,587 | 240,403 | 44,518 | 211,194 | 255,712 | ||||||||||||||||||
| Furniture and equipment |
6,400 | 47,318 | 53,718 | 10,209 | 45,983 | 56,192 | ||||||||||||||||||
| Construction-in-progress |
26 | 306 | 332 | — | 296 | 296 | ||||||||||||||||||
| 42,473 | 295,907 | 338,380 | 64,300 | 295,393 | 359,693 | |||||||||||||||||||
| Less accumulated depreciation |
8,060 | 90,086 | 98,146 | 13,697 | 80,265 | 93,962 | ||||||||||||||||||
| $ | 34,413 | $ | 205,821 | $ | 240,234 | $ | 50,603 | $ | 215,128 | $ | 265,731 | |||||||||||||
Note 4. Net Gains (Losses) on Sales of Properties and Discontinued Operations
In accordance with FASB ASC 205-20 Presentation of Financial Statements – Discontinued Operations, gains, losses and impairment losses on hotel properties sold or classified as held for sale are presented in discontinued operations. Gains, losses and impairment losses for both continuing and discontinued operations are summarized as follows:
65
Table of Contents
Supertel Hospitality, Inc. and Subsidiaries
NOTES TO CONSOLIDATED FINANCIAL STATEMENTS—CONTINUED
December 31, 2010, 2009 and 2008
(Dollars in thousands, except per share data)
| 2010 | 2009 | 2008 | ||||||||||
| Continuing Operations |
||||||||||||
| Impairment losses |
$ | (2,147 | ) | $ | (7,399 | ) | $ | — | ||||
| Gain (loss) on sale of assets |
(66 | ) | (114 | ) | 1 | |||||||
| (2,213 | ) | (7,513 | ) | 1 | ||||||||
| Discontinued Operations |
||||||||||||
| Gain on sales of properties |
$ | 1,414 | $ | 2,520 | $ | 5,583 | ||||||
| Impairment losses |
(6,051 | ) | (16,749 | ) | (250 | ) | ||||||
| Loss on sale of assets |
(72 | ) | (142 | ) | (3 | ) | ||||||
| (4,709 | ) | (14,371 | ) | 5,330 | ||||||||
| Total |
$ | (6,922 | ) | $ | (21,884 | ) | $ | 5,331 | ||||
As of December 31, 2010, the Company has eighteen properties classified as held for sale. In 2010, 2009 and 2008, the Company sold nine hotels, eight hotels and two hotels, respectively, resulting in gains of $1,414, $2,520 and $5,583, respectively. In 2010, 2009, and 2008, the Company recognized net gains (losses) and impairment on the disposition of assets of approximately $(4,775), $(14,485), and $5,331.
The Company allocates interest expense to discontinued operations for debt that is to be assumed or that is required to be repaid as a result of the disposal transaction. The Company allocated $2,522, $3,434, and $3,942 to discontinued operations for the years ended December 31, 2010, 2009, and 2008, respectively.
The operating results of hotel properties included in discontinued operations are summarized as follows:
| 2010 | 2009 | 2008 | ||||||||||
| Revenues |
$ | 18,266 | $ | 23,924 | $ | 33,989 | ||||||
| Hotel and property operations expenses |
(16,252 | ) | (20,862 | ) | (26,436 | ) | ||||||
| Interest expense |
(2,522 | ) | (3,434 | ) | (3,942 | ) | ||||||
| Depreciation and amortization expense |
(697 | ) | (2,836 | ) | (3,901 | ) | ||||||
| General and administrative expense |
(71 | ) | — | — | ||||||||
| Net gain on dispositions of assets |
1,342 | 2,378 | 5,580 | |||||||||
| Impairment loss |
(6,051 | ) | (16,749 | ) | (250 | ) | ||||||
| Income tax benefit |
860 | 1,098 | 125 | |||||||||
| $ | (5,125 | ) | $ | (16,481 | ) | $ | 5,165 | |||||
As of December 31, 2010, the Company had 18 hotels classified as held for sale. At the beginning of 2010 the Company had 19 hotels held for sale and during the year classified an additional nine hotels as held for sale. Nine of these hotels were sold during 2010, and one of the hotels was reclassified as held for use. The reclassification of this hotel was due to changes in the property’s market condition. Since our previously filed financial statements, in addition to the hotel reclassified as held for use, two hotels were reclassified as held for sale. The impact of this reclassification increased income from continuing operations by $0.4 million and $0.3 million for the
66
Table of Contents
Supertel Hospitality, Inc. and Subsidiaries
NOTES TO CONSOLIDATED FINANCIAL STATEMENTS—CONTINUED
December 31, 2010, 2009 and 2008
(Dollars in thousands, except per share data)
years ended 2009 and 2008.
Note 5. Impairment Losses
In accordance with FASB ASC 360-10-35 Property Plant and Equipment – Overall—Subsequent Measurement, the Company analyzes its assets for impairment when events or circumstances occur that indicate the carrying amount may not be recoverable. As part of this process, the Company utilizes a two-step analysis to determine whether a trigger event (within the meaning of ASC 360-10-35) has occurred with respect to cash flow of, or a significant adverse change in business climate for, its hotel properties. Quarterly and annually the Company reviews all of its hotels to determine any property whose cash flow or operating performance significantly underperformed from budget or prior year, which the Company has set as a shortfall against budget or prior year as 15% or greater.
At year end the Company applies a second analysis on the entire held for use portfolio. The analysis estimates the expected future cash flows to identify any property whose carrying amount potentially exceeded the recoverable value. (Note that at the end of each quarter, this analysis is performed only on those properties identified in the 15% change analysis). In performing this year end analysis, the Company makes the following assumptions:
| • | Holding periods range from three to five years, for non-core assets, and ten years for those assets considered as core. |
| • | Cash flow from trailing twelve months for the individual properties multiplied by the holding period as noted above. The Company did not assume growth rates on cash flows as part of its step one analysis. |
| • | A revenue multiplier for the terminal value based on an average of historical sales from a leading industry broker of like properties was applied according to the assigned holding period. |
During the 12 months ended December 31, 2010, a trigger event as described in ASC 360-10-35 occurred for one of our held for use hotels. During the three months ended June 30, 2010, the analysis above was used to determine that a trigger event had occurred for one held for use property in which the carrying value of the hotel exceeded the sum of the undiscounted cash flows expected over its remaining anticipated holding period and from its disposition. The property was then tested to determine if the carrying amount was recoverable. When testing the recoverability for a property, in accordance with FASB ASC 360-10-35 35-29 Property Plant and Equipment – Overall – Subsequent Measurement, Estimates of Future Cash Flows Used to Test a Long-Lived Asset for Recoverability, the Company uses estimates of future cash flows associated with the individual properties over their expected holding period and eventual disposition. In estimating these future cash flows, the Company incorporates its own assumptions about its use of the hotel property and expected hotel performance. Assumptions used for the individual hotel were determined by management, based on discussions with our asset management group and our third party management companies. The property was then subjected to a probability-weighted cash flow analysis as described in FASB ASC 360-10-55 Property Plant and Equipment – Overall – Implementation. In this analysis, the Company completed a detailed review of the hotel’s market conditions and future prospects, which incorporated specific detailed cash flow and revenue multiplier assumptions over the remaining expected holding periods, including the probability that the property will be sold. Based on the results of this analysis, it was determined that the Company’s investment in the subject property was not fully recoverable; accordingly, impairment was recognized.
To determine the amount of impairment on the property identified above, in accordance with FASB ASC 360-10-55, the Company calculated the excess of the carrying value of the property in comparison to its fair market value as of June 30, 2010. Based on this calculation, the Company determined total impairment of $2.1 million existed as of June 30, 2010 on the held for use asset previously noted. Fair market value was determined by
67
Table of Contents
Supertel Hospitality, Inc. and Subsidiaries
NOTES TO CONSOLIDATED FINANCIAL STATEMENTS—CONTINUED
December 31, 2010, 2009 and 2008
(Dollars in thousands, except per share data)
multiplying trailing 12 months revenue for the property by a revenue multiplier that was determined based on the Company’s experience with hotel sales in the current year as well as available industry information. As the fair market value of the property impaired for the year ending December 31, 2010, was determined in part by management estimates, a reasonable possibility exists that future changes to inputs and assumptions could affect the accuracy of management’s estimates and such future changes could lead to further possible impairment in the future. No additional held for use hotels were determined to be impaired during the year ended December 31, 2010.
Note 6. Long-Term Debt
Long-term debt consisted of the following notes and mortgages payable at December 31:
| 2010 | 2009 | |||||||
| Mortgage loan payable to Greenwich Capital Financial Products, Inc. (“Greenwich”), evidenced by a promissory note dated November 26, 2002, in the amount of $40 million. The note bears interest at 7.50% per annum. Monthly principal and interest payments are payable through maturity on December 1, 2012, at which point the remaining principal and accrued interest are due. | $ | 30,972 | $ | 32,423 | ||||
| Loan payable to Village Bank (formerly known as Southern Community Bank & Trust) evidenced by a promissory note in the amount of $2.7 million dated November 1, 2004. The note bears interest at an interest rate of 7.57%, effective November 1, 2007, based on the three year Treasury Rate plus 3.75%. Principal and interest payments are due in monthly installments to November 1, 2024. A principal payment was made on this loan in October 2009 the amount of $1.3 million, using proceeds from the sale of the Comfort Inn in Dahlgren, Virginia. This loan was paid in full in January 2010 with proceeds from the sale of a Comfort Inn in Dublin, Virginia. | — | $ | 993 | |||||
| Revolving credit facility from Great Western Bank evidenced by a promissory note dated December 3, 2008. The revolving line of credit has a limit of $20 million with interest payable monthly. The credit facility was amended on March 29, 2010 to increase the interest rate to 5.5% from March 29, 2010 through June 30, 2011 and prime (subject to a 5.5% floor rate) from July 1, 2011 through the maturity of the credit facility. The credit facility was further amended on March 15, 2011 to maintain the interest rate at 5.5% from March 15, 2011 through December 31, 2011 and prime (subject to a 5.5% floor rate) from January 1, 2012 through the maturity of the credit facility. Great Western Bank has the option to increase the interest rate of the credit facility up to 4.0% any time after January 1, 2012. The principal balance of the loan is due and payable on February 22, 2012. | $ | 15,793 | $ | 19,016 | ||||
68
Table of Contents
Supertel Hospitality, Inc. and Subsidiaries
NOTES TO CONSOLIDATED FINANCIAL STATEMENTS—CONTINUED
December 31, 2010, 2009 and 2008
(Dollars in thousands, except per share data)
| 2010 | 2009 | |||||||
| Mortgage loan payable to Great Western Bank, evidenced by a promissory note dated December 3, 2008, in the amount of $14 million. The note bears interest at 5.5% per annum. Great Western Bank has the option to increase the interest rate of the loan up to 4.0% any time after January 1, 2012. A payment of $1.4 million was made in October, 2010, using partial proceeds from the sale of a Super 8 in Lenexa, Kansas. Principal and interest payments are due in monthly installments with the outstanding principal and interest payable in full on December 5, 2011. | $ | 11,832 | $ | 13,617 | ||||
| Mortgage loan payable to Great Western Bank, evidenced by a promissory note dated May 5, 2009 in the amount of $10 million. The note bears interest at 5.5% per annum. Great Western Bank has the option to increase the interest rate of the loan up to 4.0% any time after January 1, 2012. Principal and interest payments are due in monthly installments with the outstanding principal and interest payable in full on May 5, 2012. | $ | 9,551 | $ | 9,842 | ||||
| Credit facility from Wells Fargo Bank for up to $12 million evidenced by a promissory note dated September 28, 2007. The Company exercised the option to fix the interest rate at l.75% over the one, three, six or twelve month LIBOR. Interest payments are due in monthly installments. The note was modified on March 16, 2009 to reduce the amount available for borrowing to $9.5 million and eliminate the revolving feature, as well as to increase the 1.75% interest over LIBOR to 3.50%. A $0.5 million paydown was made on August 5, 2009. On September 28, 2009, the Company further amended the credit facility to extend the maturity date to November 12, 2009. An additional amendment was made on November 12, 2009, to extend the maturity to May 12, 2010, with monthly principal payments of $75 to begin December 1, 2009 as well as a floor rate being inserted at 4%. On March 31, 2010, the maturity of the note was extended to August 12, 2010. On August 12, 2010 the credit facility was amended to extend the maturity date to March 12, 2011 and increase the interest rate from LIBOR plus 3.5% (subject to a 4.0% floor) to LIBOR plus 5.0% (subject to a 5.5% floor). In addition a $1.8 million principal payment was made in exchange for a release of the deeds of trust securing the Super 8 and Supertel Inn hotels located in Neosho, Missouri. A principal payment of $0.6 million was made in October 2010 using proceeds from the sale of a Supertel Inn in Jane, Missouri. On March 11, 2011, the maturity of the note was extended to September 30, 2011 and the interest rate was decreased from LIBOR plus 5.0% (subject to a 5.5% floor) to LIBOR plus 4.0% (subject to a 4.5% floor). The rate as of December 31, 2010 was 5.5%. | $ | 5,294 | $ | 8,914 | ||||
| Mortgage loan payable to Citigroup Global Markets Realty Corp., evidenced by a promissory note dated November 7, 2005, in the amount of $14.8 million. The note bears interest at 5.97% per annum. Principal and interest payments are due in monthly installments with the outstanding principal and interest payable in full on November 11, 2015. | $ | 13,373 | $ | 13,696 | ||||
69
Table of Contents
Supertel Hospitality, Inc. and Subsidiaries
NOTES TO CONSOLIDATED FINANCIAL STATEMENTS—CONTINUED
December 31, 2010, 2009 and 2008
(Dollars in thousands, except per share data)
| 2010 | 2009 | |||||||
| Mortgage loan payable to GE Capital Franchise Finance Corporation (“GECC”), evidenced by a promissory note dated December 31, 2007, in the amount of $7.9 million. The note bears interest at three-month LIBOR plus 2.00% (reset monthly). Monthly interest payments are due through February 1, 2010. Commencing on March 1, 2010 until and including February 1, 2011, consecutive monthly installments of interest and principal equal to one-twelfth of one percent (1%) of the loan amount are due. The principal balance of the loan is due and payable on February 1, 2018. The following principal payments have been made on this loan: a payment of $0.7 million, in August 2009, using partial proceeds from the sale of a Masters Inn in Kissimmee, Florida; a payment of $0.5 million, in August of 2009, using partial proceeds from the sale of a Comfort Inn in Ellsworth, Maine; a payment of $1.1 million, in August 2009, using partial proceeds from the sale of a Masters Inn in Orlando, Florida; and a payment of $0.2 million in October, 2009, using partial proceeds from the sale of a Masters Inn in Kissimmee, Florida . On March 16, 2009, the note was amended to increase the interest rate by 100 basis points. It was further amended on November 9, 2009, to increase the interest rate by an additional 0.5%. The rate as of December 31, 2010, was 3.80%. | $ | 5,268 | $ | 5,319 | ||||
| Mortgage loan payable to GECC, evidenced by a promissory note dated August 18, 2006, in the amount of $17.9 million. The note bears interest at three-month LIBOR plus 1.70% (reset monthly) and is convertible to a fixed rate equal to the seven-year weekly U.S. dollar interest rate swap plus 1.98% between the seventh and thirty-sixth months of the loan. Interest only payments were due until the Company exercised the conversion provision on May 1, 2008. Thereafter, monthly installments of principal and interest are due until September 1, 2016 when the remaining principal balance is due. On March 16, 2009, the note was amended to increase the interest rate by 100 basis points. It was further amended on November 9, 2009, to increase the interest rate by an additional 0.5%. The rate as of December 31, 2010 was 7.17%. | $ | 16,718 | $ | 17,067 | ||||
| Mortgage loan payable to GECC, evidenced by a promissory note dated January 5, 2007, in the amount of $15.6 million. The note bears interest at three-month LIBOR plus 1.70% (reset monthly) and is convertible to a fixed rate equal to the seven-year weekly U.S. dollar interest rate swap plus 1.98% between the seventh and thirty-sixth months of the loan. Interest only payments were due until the Company exercised the conversion provision on May 1, 2008. Thereafter, monthly installments of principal and interest are due until February 1, 2017 when the remaining principal balance is due. A principal payment of $1.5 million was made in August 2009, using proceeds from the sale of a Comfort Inn in Ellsworth, Maine. On March 16, 2009, the note was amended to increase the interest rate by 100 basis points. It was further amended on November 9, 2009, to increase the interest rate by an additional 0.5%. The rate as of December 31, 2010 was 7.17%. | $ | 13,061 | $ | 13,420 | ||||
70
Table of Contents
Supertel Hospitality, Inc. and Subsidiaries
NOTES TO CONSOLIDATED FINANCIAL STATEMENTS—CONTINUED
December 31, 2010, 2009 and 2008
(Dollars in thousands, except per share data)
| 2010 | 2009 | |||||||
| Mortgage loan payable to GECC, evidenced by a promissory note dated February 6, 2007, in the amount of $3.4 million. The note bears interest at three-month LIBOR plus 1.70% (reset monthly) and is convertible to a fixed rate equal to the seven-year weekly U.S. dollar interest rate swap plus 1.98% between the seventh and thirty-sixth months of the loan. Interest only payments were due until the Company exercised the conversion provision on May 1, 2008. Thereafter, monthly installments of principal and interest are due until March 1, 2017 when the remaining principal balance is due. On March 16, 2009, the note was amended to increase the interest rate by 100 basis points. It was further amended on November 9, 2009, to increase the interest rate by an additional 0.5%. The rate as of December 31, 2010 was 7.17%. | $ | 3,239 | $ | 3,301 | ||||
| Mortgage loan payable to GECC, evidenced by a promissory note dated May 16, 2007, in the amount of $27.8 million. The note bears interest at three-month LIBOR plus 1.70% (reset monthly) and is convertible to a fixed rate equal to the seven-year weekly U.S. dollar interest rate swap plus 1.98% between the seventh and thirty-sixth months of the loan. Interest only payments were due until the Company exercised the conversion provision on May 1, 2008. Thereafter, monthly installments of principal and interest are due until June 1, 2017, when the remaining principal balance is due. The following principal payments have been made on this loan: $0.7 million in July 2009, $2.2 million in August 2009, and $1.2 million in October 2009, each using proceeds from the sale of three separate Masters Inns in Florida. An additional payment of $ 0.9 million was made in November 2010, using proceeds from the sale of a Masters Inn in Georgia. The principal amount owing on this loan includes $128 of prepayment fees related to the November 2010 principal payments. In December 2010, GECC agreed to forbear from requiring payment of such prepayment fees until January 1, 2012. On March 16, 2009, the note was amended to increase the interest rate by 100 basis points. It was further amended on November 9, 2009, to increase the interest rate by an additional 0.5%. The rate as of December 31, 2010 was 7.69%. | $ | 20,994 | $ | 22,480 | ||||
| Mortgage loan payable to Wachovia Bank, evidenced by a promissory note dated February 4, 1998 with an original principal amount of $2.5 million, assumed as of April 4, 2007 with a remaining principal amount of $2.0 million. The note bears interest at 7.375% per annum. Principal and interest payments are due in monthly installments with the outstanding principal and interest payable in full on March 1, 2020. | $ | 1,597 | $ | 1,704 | ||||
| Mortgage loan payable to Wachovia Bank, evidenced by a promissory note dated February 4, 1998 with an original principal amount of $2.8 million, assumed as of April 4, 2007 with a remaining principal amount of $2.2 million. The note bears interest at 7.375% per annum. Principal and interest payments are due in monthly installments with the outstanding principal and interest payable in full on March 1, 2020. | $ | 1,756 | $ | 1,874 | ||||
71
Table of Contents
Supertel Hospitality, Inc. and Subsidiaries
NOTES TO CONSOLIDATED FINANCIAL STATEMENTS—CONTINUED
December 31, 2010, 2009 and 2008
(Dollars in thousands, except per share data)
| 2010 | 2009 | |||||||
| Mortgage loan payable to Wachovia Bank, evidenced by a promissory note dated February 4, 1998 with an original principal amount of $4.2 million, assumed as of April 4, 2007 with a remaining principal amount of $3.3 million. The note bears interest at 7.375% per annum. Principal and interest payments are due in monthly installments with the outstanding principal and interest payable in full on March 1, 2020. | $ | 2,671 | $ | 2,850 | ||||
| Mortgage loan payable to Wachovia Bank, evidenced by a promissory note dated February 4, 1998 with an original principal amount of $5.1 million, assumed as of April 4, 2007 with a remaining principal amount of $4.0 million. The note bears interest at 7.375% per annum. Principal and interest payments are due in monthly installments with the outstanding principal and interest payable in full on March 1, 2020. | $ | 3,260 | $ | 3,479 | ||||
| Mortgage Loan payable to GECC, evidenced by a promissory note in the amount of $6.8 million, dated January 2, 2008. The interest rate is based on the 90-day London Interbank Offered Rate plus a margin of 200 basis points. The rate as of December 31, 2010 was 3.80%. Monthly interest payments are due through February 1, 2010. Interest and principal payments (equal to one-twelfth of one percent of the loan amount) are then due in monthly installments in the third year of the loan. The payment of principal and interest then in effect will be due monthly until the maturity of the note on February 1, 2018. On March 16, 2009, the note was amended to increase the interest rate by 100 basis points. It was further amended on November 9, 2009, to increase the interest rate by an additional 0.5%. | $ | 6,709 | $ | 6,765 | ||||
| Mortgage Loan payable to GECC, evidenced by a promissory note in the amount of $3.4 million, dated January 2, 2008. The interest rate is based on the 90-day London Interbank Offered Rate plus a margin of 200 basis points. The rate as of December 31, 2010 was 3.80%. Monthly interest payments are due through February 1, 2010. Interest and principal payments (equal to one-twelfth of one percent of the loan amount) are then due in monthly installments in the third year of the loan. The payment of principal and interest then in effect will be due monthly until the maturity of the note on February 1, 2018. On March 16, 2009, the note was amended to increase the interest rate by 100 basis points. It was further amended on November 9, 2009, to increase the interest rate by an additional 0.5%. | $ | 3,352 | $ | 3,380 | ||||
| Mortgage Loan payable to GECC, evidenced by a promissory note in the amount of $1.1 million, dated January 2, 2008. The interest rate is based on the 90-day London Interbank Offered Rate plus a margin of 200 basis points. The rate as of December 31, 2010 was 3.80%. Monthly interest payments are due through February 1, 2010. Interest and principal payments (equal to one-twelfth of one percent of the loan amount) are then due in monthly installments in the third year of the loan. The payment of principal and interest then in effect will be due monthly until the maturity of the note on February 1, 2018. On March 16, 2009, the note was amended to increase the interest rate by 100 basis points. It was further amended on November 9, 2009, to increase the interest rate by an additional 0.5%. | $ | 1,091 | $ | 1,100 | ||||
72
Table of Contents
Supertel Hospitality, Inc. and Subsidiaries
NOTES TO CONSOLIDATED FINANCIAL STATEMENTS—CONTINUED
December 31, 2010, 2009 and 2008
(Dollars in thousands, except per share data)
| 2010 | 2009 | |||||||
| Mortgage Loan payable to GECC, evidenced by a promissory note in the amount of $4.4 million, dated January 2, 2008. The interest rate is based on the 90-day London Interbank Offered Rate plus a margin of 200 basis points. The rate as of December 31, 2010 was 3.80%. Monthly interest payments are due through February 1, 2010. Interest and principal payments (equal to one-twelfth of one percent of the loan amount) are then due in monthly installments in the third year of the loan. The payment of principal and interest then in effect will be due monthly until the maturity of the note on February 1, 2018. On March 16, 2009, the note was amended to increase the interest rate by 100 basis points. It was further amended on November 9, 2009, to increase the interest rate by an additional 0.5%. | $ | 4,319 | $ | 4,355 | ||||
| Mortgage Loan payable to GECC, evidenced by a promissory note in the amount of $2.5 million, dated January 31, 2008. The interest rate is based on the 90-day London Interbank Offered Rate plus a margin of 256 basis points. The rate as of December 31, 2010 was 4.36%. Monthly interest payments are due through February 1, 2010. Interest and principal payments (equal to one-twelfth of one percent of the loan amount) are then due in monthly installments in the third year of the loan. The payment of principal and interest then in effect will be due monthly until the maturity of the note on February 1, 2018. On March 16, 2009, the note was amended to increase the interest rate by 100 basis points. It was further amended on November 9, 2009, to increase the interest rate by an additional 0.5%. | $ | 2,449 | $ | 2,470 | ||||
| Mortgage Loan payable to Elkhorn Valley Bank in Norfolk, Nebraska, evidenced by a promissory note in the amount of $1.0 million, dated March 19, 2009. The note bears interest at 6.5% per annum. Monthly principal and interest payments are due through March 2014, with the balance of the loan payable on April 1, 2014. | $ | 871 | $ | 948 | ||||
| Line of credit from Elkhorn Valley Bank, evidenced by a note dated December 22, 2009, with a limit of $1.95 million. The note bears interest at 6.75% per annum. Interest payments are due on the outstanding balance through May 15, 2010. At that time, in addition to monthly interest, principal payments are to be made as follows: $40 in June, $50 in July, $60 in August, and $70 in September, with remaining principal and interest to be paid in October 2010. In June 2010, the note was paid in full using funds from the revolving line of credit with Great Western Bank. On January 26, 2011, the Company reborrowed the $1.95 million from Elkhorn Valley Bank pursuant to a promissory note that bears interest at 5.9% per annum and matures on October 1, 2011. | — | $ | 500 | |||||
| Mortgage Loan payable to First National Bank of Omaha, evidenced by a promissory note in the amount of $0.8 million, dated January 26, 2010. The interest rate is based on the one month London Interbank Offered Rate plus 4.0 percentage points with a 5.0% floor. The rate as of December 31, 2010 was 5.0%. Monthly interest payments are due through February 2011, with the balance of the loan due on February 1, 2011. On March 1, 2011, the maturity of the note was extended to March 1, 2012. | $ | 840 | — | |||||
| $ | 175,010 | $ | 189,513 | |||||
The long-term debt is secured by 106 and 111 of the Company’s hotel properties, for the years ended 2010 and 2009, respectively. The Company’s debt agreements contain requirements as to the maintenance of minimum
73
Table of Contents
Supertel Hospitality, Inc. and Subsidiaries
NOTES TO CONSOLIDATED FINANCIAL STATEMENTS—CONTINUED
December 31, 2010, 2009 and 2008
(Dollars in thousands, except per share data)
EBITDA levels, minimum levels of debt service and fixed charge coverage and required loan-to-value ratios and net worth, and place certain restrictions on distributions.
The key financial covenants for certain of our loan agreements and compliance calculations as of December 31, 2010 are discussed below (each such covenant is calculated pursuant to the applicable loan agreement). As of December 31, 2010, we were either in compliance with the financial covenants or obtained waivers for non-compliance (as discussed below). As a result, we are not in default of any of our loans.
(dollar amounts in thousands)
| Great Western Bank Covenants |
December 31,
2010 Requirement |
December 31,
2010 Calculation |
||||||
| Consolidated debt service coverage ratio calculated as follows: |
³1.05:1 | |||||||
| Adjusted NOI (A) / Debt service (B) |
||||||||
| Net loss per financial statements |
$ | (10,602 | ) | |||||
| Net adjustments per loan agreement |
$ | 32,478 | ||||||
| Adjusted NOI per loan agreement(A) |
$ | 21,876 | ||||||
| Interest expense per financial statements-continuing operations |
$ | 9,702 | ||||||
| Interest expense per financial statements-discontinued operations |
$ | 2,522 | ||||||
| Total interest expense per financial statements |
$ | 12,224 | ||||||
| Net adjustments per loan agreement |
$ | 5,861 | ||||||
| Debt service per loan agreement (B) |
$ | 18,085 | ||||||
| Consolidated debt service coverage ratio |
1.21:1 | |||||||
| Loan-specific debt service coverage ratio calculated as follows: |
³1.20:1 | |||||||
| Adjusted NOI (A) / Debt service (B) |
||||||||
| Net loss per financial statements |
$ | (10,602 | ) | |||||
| Net adjustments per loan agreement |
$ | 14,828 | ||||||
| Adjusted NOI per loan agreement (A) |
$ | 4,226 | ||||||
| Interest expense per financial statements-continuing operations |
$ | 9,702 | ||||||
| Interest expense per financial statements-discontinued operations |
$ | 2,522 | ||||||
| Total interest expense per financial statements |
$ | 12,224 | ||||||
| Net adjustments per loan agreement |
$ | (8,606 | ) | |||||
| Debt service per loan agreement (B) |
$ | 3,618 | ||||||
| Loan-specific debt service coverage ratio |
1.17:1 | |||||||
74
Table of Contents
Supertel Hospitality, Inc. and Subsidiaries
NOTES TO CONSOLIDATED FINANCIAL STATEMENTS—CONTINUED
December 31, 2010, 2009 and 2008
(Dollars in thousands, except per share data)
| Great Western Bank Covenants - continued |
December 31, 2010 Requirement |
December 31, 2010 Calculation |
||||||
| Consolidated loan to value ratio calculated as follows: |
£70.0 | % | ||||||
| Loan balance (A) / Value (B) |
||||||||
| Loan balance (A) |
$ | 175,010 | ||||||
| Value (B) |
$ | 300,406 | ||||||
| Consolidated loan to value ratio |
58.3 | % | ||||||
| Loan-specific loan to value ratio calculated as follows: |
£70.0 | % | ||||||
| Loan balance (A) / Value (B) |
||||||||
| Loan balance (A) |
$ | 37,176 | ||||||
| Value (B) |
$ | 60,227 | ||||||
| Loan-specific loan to value ratio |
61.7 | % | ||||||
The Great Western Bank credit facilities also require that we not pay dividends in excess of 75% of our funds from operations per year. On March 10, 2011, we received a waiver from Great Western Bank for non-compliance with the loan-specific debt service coverage ratio covenant set forth in the table above as of December 31, 2010.
The credit facilities with Great Western Bank were amended on March 15, 2011 to require maintenance of consolidated and loan-specific debt service coverage ratios of at least 1.05 to 1, tested quarterly, from December 31, 2010 through the maturity of the credit facilities. The credit facilities continue to require maintenance of consolidated and loan-specific loan to value ratios that do not exceed 70%, tested annually, from December 31, 2010 through the maturity of the credit facilities.
The Great Western Bank amendment also: (a) modifies the borrowing base so that the loans available to us under the credit facilities may not exceed the lesser of (i) an amount equal to 70% of the total appraised value of the hotels securing the credit facilities and (ii) an amount that would result in a loan-specific debt service coverage ratio of less than 1.05 to 1 from December 31, 2010 through December 31, 2011 and 1.50 to 1 from January 1, 2012 through the maturity of the credit facilities; (b) maintains the interest rate on the revolving credit portion of the credit facilities at 5.50% from March 15, 2011 through December 31, 2011 and prime (subject to a 5.50% floor rate) from January 1, 2012 through the maturity of the credit facilities; and (c) gives Great Western Bank the option to increase the interest rates of the credit facilities up to 4.00% any time after January 1, 2012.
(dollar amounts in thousands)
| Wells Fargo Bank Covenants |
December 31, 2010 Requirement |
December 31, 2010 Calculation |
||||||
| Consolidated loan to value ratio calculated as follows: |
£85.0 | % | ||||||
| Loan balance (A) / Value (B) |
||||||||
| Loan balance (A) |
$ | 175,010 | ||||||
| Value (B) |
$ | 225,152 | ||||||
| Consolidated loan to value ratio |
77.7 | % | ||||||
75
Table of Contents
Supertel Hospitality, Inc. and Subsidiaries
NOTES TO CONSOLIDATED FINANCIAL STATEMENTS—CONTINUED
December 31, 2010, 2009 and 2008
(Dollars in thousands, except per share data)
| Wells Fargo Bank Covenants – continued |
December 31, 2010 Requirement |
December 31, 2010 Calculation |
||||||
| Consolidated tangible net worth calculated as follows: |
>$65 million | |||||||
| Consolidated shareholder equity (A) – Intangible assets (B) |
||||||||
| Total shareholders’ equity per financial statements |
$ | 55,394 | ||||||
| Redeemable noncontrolling interest per financial statements |
$ | 511 | ||||||
| Noncontrolling interest in consolidated partnership |
$ | 335 | ||||||
| Redeemable preferred stock per financial statements |
$ | 7,662 | ||||||
| Consolidated shareholder equity (A) |
$ | 63,902 | ||||||
| Intangible assets (B) |
$ | 0 | ||||||
| Consolidated tangible net worth |
$ | 63,902 | ||||||
| Consolidated fixed charge coverage ratio calculated as follows: |
³0.80:1 before | |||||||
| EBITDA (A) / Fixed charges (B) |
preferred dividends | |||||||
| Net loss per financial statements |
$ | (10,602 | ) | |||||
| Net adjustments per loan agreement |
$ | 28,959 | ||||||
| EBITDA per loan agreement (A) |
$ | 18,357 | ||||||
| Interest expense per financial statements-continuing operations |
$ | 9,702 | ||||||
| Interest expense per financial statements-discontinued operations |
$ | 2,522 | ||||||
| Total interest expense per financial statements |
$ | 12,224 | ||||||
| Net adjustments per loan agreement |
$ | 6,594 | ||||||
| Fixed charges per loan agreement (B) |
$ | 18,818 | ||||||
| Consolidated fixed charge coverage ratio |
0.98:1 | |||||||
76
Table of Contents
Supertel Hospitality, Inc. and Subsidiaries
NOTES TO CONSOLIDATED FINANCIAL STATEMENTS—CONTINUED
December 31, 2010, 2009 and 2008
(Dollars in thousands, except per share data)
| Wells Fargo Bank Covenants – continued |
December 31, 2010 Requirement |
December 31, 2010 Calculation |
||||||
| Consolidated fixed charge coverage ratio calculated as follows: |
³0.75:1 after | |||||||
| EBITDA (A) / Fixed charges (B) |
preferred dividends | |||||||
| Net loss per financial statements |
$ | (10,602 | ) | |||||
| Net adjustments per loan agreement |
$ | 28,959 | ||||||
| EBITDA per loan agreement (A) |
$ | 18,357 | ||||||
| Interest expense per financial statements-continuing operations |
$ | 9,702 | ||||||
| Interest expense per financial statements-discontinued operations |
$ | 2,522 | ||||||
| Total interest expense per financial statements |
$ | 12,224 | ||||||
| Net adjustments per loan agreement |
$ | 5,120 | ||||||
| Fixed charges per loan agreement (B) |
$ | 17,344 | ||||||
| Consolidated fixed charge coverage ratio |
1.06:1 | |||||||
Our credit facility with Wells Fargo Bank was amended on August 12, 2010 to require maintenance of a consolidated loan to value ratio that does not exceed 85% and a minimum tangible net worth which exceeds $65 million, in each case, through the maturity of the credit facility. The amendment also: (a) extended the maturity date from August 12, 2010 to March 12, 2011; (b) required a $1.8 million principal payment (which we funded from the revolving line of credit with Great Western Bank) in exchange for a release of the deeds of trust securing the Super 8 and Supertel Inn hotels located in Neosho, Missouri; and (c) increased the interest rate from LIBOR plus 3.5% (subject to a 4.0% floor) to LIBOR plus 5.0% (subject to a 5.5% floor). On March 11, 2011, the Company received a waiver from Wells Fargo Bank for non-compliance with the consolidated tangible net worth covenant set forth in the table above as of December 31, 2010. In connection with the waiver, the credit facility was amended on March 11, 2011 to require maintenance of a minimum tangible net worth which exceeds $50 million through the maturity of the credit facility. The amendment also: (a) extended the maturity date from March 12, 2011 to September 30, 2011; and (b) decreased the interest rate from LIBOR plus 5.0% (subject to a 5.5% floor) to LIBOR plus 4.0% (subject to a 4.5% floor).
(dollar amounts in thousands)
| GE Covenants |
December 31,
2010 Requirement |
December 31, 2010 Calculation |
||||||
| Loan-specific total adjusted EBITDA calculated as follows: |
³$3.9 million | |||||||
| Net loss per financial statements |
$ | (10,602 | ) | |||||
| Net adjustments per loan agreement |
$ | 16,242 | ||||||
| Loan-specific total adjusted EBITDA |
$ | 5,640 | ||||||
77
Table of Contents
Supertel Hospitality, Inc. and Subsidiaries
NOTES TO CONSOLIDATED FINANCIAL STATEMENTS—CONTINUED
December 31, 2010, 2009 and 2008
(Dollars in thousands, except per share data)
| GE Covenants - continued |
December 31,
2010 Requirement |
December 31, 2010 Calculation |
||||||
| Consolidated debt service coverage ratio calculated as follows: |
³1.05:1 | |||||||
| Adjusted EBITDA (A) / Debt service (B) |
||||||||
| Net loss per financial statements |
$ | (10,602 | ) | |||||
| Net adjustments per loan agreement |
$ | 36,163 | ||||||
| Adjusted EBITDA per loan agreement (A) |
$ | 25,561 | ||||||
| Interest expense per financial statements-continuing operations |
$ | 9,702 | ||||||
| Interest expense per financial statements-discontinued operations |
$ | 2,522 | ||||||
| Total interest expense per financial statements |
$ | 12,224 | ||||||
| Net adjustments per loan agreement |
$ | 5,120 | ||||||
| Debt service per loan agreement (B) |
$ | 17,344 | ||||||
| Consolidated debt service coverage ratio |
1.47:1 | |||||||
Our credit facilities with General Electric Capital Corporation require that, commencing in 2012 and continuing for the term of the loans, we maintain, with respect to our GE-encumbered properties, a before dividend fixed charge coverage ratio (FCCR) (based on a rolling twelve month period) of 1.30:1 and after dividend FCCR (based on a rolling twelve month period) of 1.00:1. The consolidated debt service coverage ratio for the GE credit facilities increases to 1.50:1 in 2012 through the term of the loans. In connection with previous amendments and waivers, the interest rates of the loans under our credit facilities with GE have increased by 1.5%. If our FCCR with respect to our GE-encumbered properties equals or exceeds 1.30:1 before dividends and 1.00:1 after dividends for two consecutive quarters, the cumulative 1.5% increase in the interest rate of the loans will be eliminated.
If we fail to pay our indebtedness when due, fail to comply with covenants or otherwise default on our loans, unless waived, we could incur higher interest rates during the period of such loan defaults, be required to immediately pay our indebtedness and ultimately lose our hotels through lender foreclosure if we are unable to obtain alternative sources of financing with acceptable terms. Our Great Western Bank and Wells Fargo Bank credit facilities contain cross-default provisions which would allow Great Western Bank and Wells Fargo Bank to declare a default and accelerate our indebtedness to them if we default on our other loans, and such default would permit that lender to accelerate our indebtedness under any such loan. We are not in default of any of our loans.
Debt held on properties in continuing operations is classified as held for use. Debt is classified as held for sale if the properties collateralizing it are included in discontinued operations. Debt associated with assets held for sale is classified as a short-term liability due in 2011 irrespective of whether the notes and mortgages evidencing such debt mature in 2011. Aggregate annual principal payments on debt associated with assets held for use for the next five years and thereafter, and debt associated with assets held for sale, are as follows:
78
Table of Contents
Supertel Hospitality, Inc. and Subsidiaries
NOTES TO CONSOLIDATED FINANCIAL STATEMENTS—CONTINUED
December 31, 2010, 2009 and 2008
(Dollars in thousands, except per share data)
| Held For Sale | Held For Use | TOTAL | ||||||||||
| 2011 |
$ | 30,316 | $ | 15,186 | $ | 45,502 | ||||||
| 2012 |
127 | 57,723 | 57,850 | |||||||||
| 2013 |
— | 3,498 | 3,498 | |||||||||
| 2014 |
— | 4,228 | 4,228 | |||||||||
| 2015 |
— | 15,278 | 15,278 | |||||||||
| Thereafter |
— | 48,654 | 48,654 | |||||||||
| $ | 30,443 | $ | 144,567 | $ | 175,010 | |||||||
At December 31, 2010 and 2009, the estimated fair values of long-term debt, excluding debt related to hotel properties held for sale, were approximately $148.8 million and $155.4 million, respectively. The fair values were estimated by discounting future cash payments to be made at rates that approximate rates currently offered for loans with similar maturities.
Note 7. Income Taxes
The RMA was included in the Tax Relief Extension Act of 1999, which was enacted into law on December 17, 1999. The RMA includes numerous amendments to the provisions governing the qualification and taxation of REITs, and these amendments were effective January 1, 2001. One of the principal provisions included in the Act provides for the creation of TRS. TRS’s are corporations that are permitted to engage in nonqualifying REIT activities. A REIT is permitted to own up to 100% of the voting stock in a TRS. Previously, a REIT could not own more than 10% of the voting stock of a corporation conducting nonqualifying activities. Relying on this legislation, in November 2001, the Company formed the TRS Lessee.
As a REIT, the Company generally will not be subject to corporate level federal income tax on taxable income it distributes currently to stockholders. If the Company fails to qualify as a REIT in any taxable year, it will be subject to federal income taxes at regular corporate rates (including any applicable alternative minimum tax) and may not be able to qualify as a REIT for four subsequent taxable years. Even if the Company qualifies for taxation as a REIT, it may be subject to certain state and local taxes on its income and property and to federal income and excise taxes on its undistributed taxable income. In addition, taxable income of a TRS is subject to federal, state and local income taxes.
In connection with the Company’s election to be taxed as a REIT, it has also elected to be subject to the “built-in gain” rules on the assets formerly held by the old Supertel. Under these rules, taxes will be payable at the time and to the extent that the net unrealized gains on assets at the date of conversion to REIT status are recognized in taxable dispositions of such assets in the ten-year period following conversion.
At December 31, 2010, the income tax bases of the Company’s assets and liabilities excluding those of TRS were approximately $263,706 and $166,997, respectively; at December 31, 2009, they were approximately $276,026 and $176,234, respectively.
The TRS net operating loss carryforward from December 31, 2010 as determined for federal income tax purposes was approximately $10.0 million. The availability of such loss carryforward will begin to expire in 2022.
Income tax benefit from continuing operations for the years ended December 31, 2010, 2009 and 2008 consists of the following:
79
Table of Contents
Supertel Hospitality, Inc. and Subsidiaries
NOTES TO CONSOLIDATED FINANCIAL STATEMENTS—CONTINUED
December 31, 2010, 2009 and 2008
(Dollars in thousands, except per share data)
| 2010 | 2009 | 2008 | ||||||||||||||||||||||||||||||||||
| Federal | State | Total | Federal | State | Total | Federal | State | Total | ||||||||||||||||||||||||||||
| Current |
$ | — | $ | — | $ | — | $ | — | $ | — | $ | — | $ | — | $ | — | $ | — | ||||||||||||||||||
| Deferred |
(753 | ) | (144 | ) | (897 | ) | (449 | ) | (100 | ) | (549 | ) | (154 | ) | (26 | ) | (180 | ) | ||||||||||||||||||
| Total income tax benefit |
$ | (753 | ) | $ | (144 | ) | $ | (897 | ) | $ | (449 | ) | $ | (100 | ) | $ | (549 | ) | $ | (154 | ) | $ | (26 | ) | $ | (180 | ) | |||||||||
The actual income tax benefit from continuing operations of the TRS for the years ended December 31, 2010, 2009 and 2008 differs from the “expected” income tax benefit (computed by applying the appropriate U.S. federal income tax rate of 34% to earnings before income taxes) as a result of the following:
| 2010 | 2009 | 2008 | ||||||||||
| Computed “expected” income tax benefit |
$ | (845 | ) | $ | (479 | ) | $ | (146 | ) | |||
| State income taxes, net Federal income tax benefit |
(100 | ) | (66 | ) | (17 | ) | ||||||
| Other |
48 | (4 | ) | (17 | ) | |||||||
| Total income tax benefit |
$ | (897 | ) | $ | (549 | ) | $ | (180 | ) | |||
The continuing and discontinued combined tax effects of temporary differences that give rise to significant portions of the deferred tax assets and the deferred tax liability at December 31, 2010, 2009 and 2008 are as follows:
| 2010 | 2009 | 2008 | ||||||||||
| Deferred Tax Assets: |
||||||||||||
| Expenses accrued for consolidated financial statement purposes, nondeductible for tax return purposes |
$ | 297 | $ | 281 | $ | 273 | ||||||
| Net operating losses carried forward for federal income tax purposes |
3,827 | 2,511 | 1,289 | |||||||||
| Total deferred tax assets |
4,124 | 2,792 | 1,562 | |||||||||
| Deferred Tax Liabilities: |
||||||||||||
| Tax depreciation in excess of book depreciation |
418 | 843 | 1,260 | |||||||||
| Total deferred tax liabilities |
418 | 843 | 1,260 | |||||||||
| Net deferred tax assets |
$ | 3,706 | $ | 1,949 | $ | 302 | ||||||
The TRS has estimated its income tax benefit using a combined federal and state rate of approximately 38%. As of the year ended 2010, 2009 and 2008 the TRS had a deferred tax asset of $4.1 million, $2.8 million and $1.6 million, respectively, primarily due to current and past years’ tax net operating losses. These loss carryforwards
80
Table of Contents
Supertel Hospitality, Inc. and Subsidiaries
NOTES TO CONSOLIDATED FINANCIAL STATEMENTS—CONTINUED
December 31, 2010, 2009 and 2008
(Dollars in thousands, except per share data)
will begin to expire in 2022 through 2030. In assessing the realizability of deferred tax assets, the Company considers whether it is more likely than not that some portion or all of the deferred tax assets will not be realized. The ultimate realization of deferred tax assets is dependent upon the generation of future taxable income. The Company considers projected scheduled reversal of deferred income tax liabilities, projected future taxable income, and tax planning strategies in making this assessment. These estimates of future taxable income inherently require significant judgment. Management uses historical experience and short and long-range business forecasts to develop such estimates. Further, we employ various prudent and feasible tax planning strategies to facilitate the recoverability of future deductions. To the extent management does not consider it more likely than not that a deferred tax asset will be recovered, a valuation allowance is established. The valuation of deferred tax assets requires judgment in assessing the likely future tax consequences of events that have been recognized in our financial statements or tax returns and future profitability. Our accounting for deferred tax consequences represents our best estimate of those future events. Changes in our current estimates, due to unanticipated events or otherwise, could have a material impact on our financial condition and results of operations. Based on consideration of these items, management has determined that no valuation allowance is required.
Income taxes are accounted for under the asset and liability method. The Company uses an estimate of its annual effective rate based on the facts and circumstances at the time while the actual effective rate is calculated at year end. Deferred tax assets and liabilities are recognized for the future tax consequences attributable to differences between the financial statement carrying amounts of existing assets and liabilities and their respective tax bases and operating loss and tax credit carry forwards. Deferred tax assets and liabilities are measured using enacted tax rates expected to apply to taxable income in the years in which those temporary differences are expected to be recovered or settled. The effect on deferred tax assets and liabilities of a change in tax rates is recognized in income in the period that includes the enactment date. In assessing the realizability of deferred tax assets, management considers whether it is more likely than not that some portion or all of the deferred tax assets will not be realized. There is no valuation allowance at December 31, 2010, 2009 or 2008.
Dividends Paid
There were no dividends paid during the year ended December 31, 2010. Dividends paid were $0.08 per share during the year ended December 31, 2009; of which $0.053 represented capital gain distribution and $0.027 represented a nondividend distribution to shareholders. Dividends paid were $0.51 during the year ended December 31, 2008; of which $0.206 represented ordinary income, $0.093 represented capital gain distribution and $0.211 represented a nondividend distribution to shareholders.
Note 8. Commitments and Contingencies and Other Related Party Transactions
Royco Hotels, Inc. (“Royco Hotels”) and HLC Hotels, Inc. (“HLC”), independent contractors, manage our hotels pursuant to hotel management agreements with TRS Lessee. The management agreements provide that the management companies have control of all operational aspects of the hotels, including employee-related matters. Royco Hotels and HLC must generally maintain each hotel in good repair and condition and make routine maintenance, repairs and minor alterations. Additionally, Royco Hotels and HLC must operate the hotels in accordance with third party franchise agreements that cover the hotels, which includes using franchisor sales and reservation systems as well as abiding by franchisors’ marketing standards. Royco Hotels and HLC may not assign their management agreements without our consent.
The management agreements generally require TRS Lessee to fund debt service, working capital needs, capital expenditures and to reimburse the management companies for all budgeted direct operating costs and expenses incurred in the operation of the hotels. TRS Lessee is responsible for obtaining and maintaining insurance policies with respect to the hotels.
Royco Hotels Management Agreement
Royco Hotels manages 95 of the hotels owned by the Company at December 31, 2010. Royco Hotels receives a monthly base management fee and an incentive management fee, if certain financial thresholds are met or exceeded. See “Litigation” below with respect to litigation between Royco Hotels and the Company. The management agreement, as amended effective January 1, 2007, provides for monthly base management fees as follows:
| • | 4.25% of gross hotel income for the month for up to the first $75 million of gross hotel income for a fiscal year; |
81
Table of Contents
Supertel Hospitality, Inc. and Subsidiaries
NOTES TO CONSOLIDATED FINANCIAL STATEMENTS—CONTINUED
December 31, 2010, 2009 and 2008
(Dollars in thousands, except per share data)
| • | 4.00% of gross hotel income for the month for gross hotel income exceeding $75 million up to $100 million for a fiscal year; and |
| • | 3.00% of gross hotel income for the month for gross hotel income exceeding $100 million for a fiscal year. |
If annual net operating income exceeds 10% of our total investment in the hotels, then Royco Hotels receives an incentive management fee of 10% of the excess of net operating income up to the first $1 million, and 20% of excess net operating income above $1 million.
The management agreement expires on December 31, 2011 and, unless Royco Hotels elects not to extend the term, the term of the agreement will be extended to December 31, 2016 if (i) Royco Hotels achieves average annual net operating income of at least 10% of our total investment in the hotels during the four fiscal years ending December 31, 2010 and (ii) Royco Hotels does not default prior to December 31, 2011.
The management agreement may be terminated as follows:
| • | either party may terminate the management agreement if net operating income is not at least 8.5% of the Company’s total investment in the hotels or if the Company undergoes a change of control; |
| • | the Company may terminate the agreement if Royco Hotels undergoes a change of control; |
| • | the Company may terminate the agreement if tax laws change to allow a hotel REIT to self manage its properties; and |
| • | by the non-defaulting party in the event of a default that has not been cured within the cure period. |
If the Company terminates the management agreement because the Company undergoes a change of control, Royco Hotels undergoes a change of control due to the death of one of its principals, or due to a tax law change, then Royco Hotels will be entitled to a termination fee equal to 50% of the base management fee paid to Royco Hotels during the twelve months prior to notice of termination. Under certain circumstances, Royco Hotels will be entitled to a termination fee if the Company sells a hotel and does not acquire another hotel or replace the sold hotel within twelve months. The fee, if applicable, is equal to 50% of the base management fee paid with respect to the sold hotel during the prior twelve months.
The following are events of default under the management agreement:
| • | the failure of Royco Hotels to diligently and efficiently operate the hotels pursuant to the management agreement; |
| • | the failure of either party to pay amounts due to the other party pursuant to the management agreement; |
| • | certain bankruptcy, insolvency or receivership events with respect to either party; |
| • | the failure of either party to perform any of their obligations under the management agreement; |
82
Table of Contents
Supertel Hospitality, Inc. and Subsidiaries
NOTES TO CONSOLIDATED FINANCIAL STATEMENTS—CONTINUED
December 31, 2010, 2009 and 2008
(Dollars in thousands, except per share data)
| • | loss of the franchise license for a hotel because of Royco Hotels; |
| • | failure by Royco Hotels to pay, when due, the accounts payable for the hotels for which we have previously reimbursed Royco Hotels; and |
| • | any of the hotels fail two successive franchisor inspections if the deficiencies are within Royco Hotels’ reasonable control. |
With the exception of certain events of default as to which no grace period exists, if an event of default occurs and continues beyond the grace period set forth in the management agreement, the non-defaulting party has the option of terminating the agreement.
The management agreement provides that each party, subject to certain exceptions, indemnifies and holds harmless the other party against any liabilities stemming from certain negligent acts or omissions, breach of contract, willful misconduct or tortuous actions by the indemnifying party or any of its affiliates.
HLC Management Agreement
The hotel management agreement with HLC, as amended July 15, 2008, provides for HLC to operate and manage our eleven Masters Inn hotels through December 31, 2011. The agreement provides for HLC to receive management fees equal to 5.0% of the gross revenues derived from the operation of the hotels and incentive fees equal to 10% of the annual operating income of the hotels in excess of 10.5% of the Company’s investment in the hotels.
Litigation
Various claims and legal proceedings arise in the ordinary course of business and may be pending against the Company and its properties. Based upon the information available, the Company believes that the resolution of any of these claims and legal proceedings should not have a material adverse affect on its consolidated financial position, results of operations or cash flows. Three separate lawsuits have been filed against the Company in Jefferson Circuit Court, Louisville, Kentucky; one lawsuit filed by a plaintiff on June 26, 2008, a second lawsuit filed by fourteen plaintiffs on December 15, 2008 and a third lawsuit filed by six plaintiffs on January 16, 2009. The plaintiffs in the three cases, now consolidated as one action, allege that as guests at the Company’s hotel in Louisville, Kentucky, they were exposed to carbon monoxide as a consequence of a faulty water heater at the hotel. The plaintiffs have also sued the plumbing company which performed repairs on the water heater at the hotel.
Plaintiffs are seeking to recover for damages arising out of physical and mental injury, lost wages, pain and suffering, past and future medical expenses and punitive or exemplary damages. At this time, the company has reached agreement to settle the claims, subject to court approval for certain minor plaintiffs, and one settlement has been paid. The settlements were made with authorization from the insurers and the Company has recorded a liability for the amount of the unpaid claims and a receivable reflecting recoverability of the claim from the insurers.
The Company’s management agreement with Royco Hotels, the manager of a majority of the Company’s hotels, terminates on December 31, 2011, and is subject to an automatic five year extension thereafter if certain conditions are met. In addition, provisions in the management agreement permit either party to terminate the management agreement on 60 days notice if a net operating income (“NOI”) target of 8.5% of total investment in hotels is not achieved for a fiscal year. In 2009 and 2010, NOI as a percentage of total hotel investment was less than 8.5%. Additionally, one of the conditions for an automatic extension of the management agreement is that an average annual NOI target of at least 10% is achieved during the four years ending December 31, 2010. Annual NOI as a
83
Table of Contents
Supertel Hospitality, Inc. and Subsidiaries
NOTES TO CONSOLIDATED FINANCIAL STATEMENTS—CONTINUED
December 31, 2010, 2009 and 2008
(Dollars in thousands, except per share data)
percentage of total hotel investment has not exceeded 10% in 2007, 2008, 2009 and 2010.
During the fourth quarter of 2010, the Company solicited bids from hotel management companies to manage the Company’s hotels. The Company expects to complete its review process, and make its decision, if any, on a manager or managers for its hotels during the first half of 2011.
The Company has been advised by Royco Hotels that it believes the Company’s potential termination / nonrenewal of Royco Hotels is a breach of the management agreement between the Company and Royco Hotels. On December 15, 2010, Royco Hotels filed a complaint against Supertel in the District Court of Douglas County, Nebraska alleging breach of the management agreement and other complaints related to the solicitation of bids from other management companies, and seeking alleged damages. Royco Hotels has not met the NOI conditions of the agreement and consequently the Company does not believe that it has breached the management agreement or that any damages are due to Royco Hotels. Royco Hotels continues to manage our hotels under the management agreement.
Other
In November 2004, the Company obtained a $2.7 million loan from Village Bank, formerly known as Southern Community Bank & Trust. The Village Bank loan was paid in full January, 2010. George R. Whittemore, Director of the Company, is a member of the Board of Directors of Village Bank. Further information about the loan from Village Bank is presented in Note 6.
The Company assumed land lease agreements in conjunction with the purchase of three hotels. One lease requires monthly payments of the greater of $2 or 5% of room revenue through November 2091. A second lease requires monthly payments of $1 through 2017 with approximately $1 annual increase beginning January 1, 2018, with additional increases in 2033, 2043, 2053 and 2063. A third lease requires annual payments of $34, with approximately $3 increases every five years throughout twelve renewal periods. Land lease expense from continuing operations totaled approximately $111, $109 and $104 in 2010, 2009 and 2008, respectively, and is included in property operating expense. The Company entered into an office lease agreement in May of 2010 and incurred office lease expense of $14 during 2010. No office lease expense was incurred during 2009 or 2008.
As of December 31, 2010, the future minimum lease payments applicable to non-cancellable operating leases are as follows:
| Lease rents | ||||
| 2011 |
105 | |||
| 2012 |
108 | |||
| 2013 |
111 | |||
| 2014 |
112 | |||
| 2015 |
113 | |||
| Thereafter |
4,733 | |||
| $ | 5,282 | |||
The Company as of December 31, 2010 has agreements with three restaurants and two cell tower operators for leased space at our hotel locations related to continuing operations. The restaurant leases have maturity dates ranging from 2011 to 2020 and cell tower leases have maturity dates ranging from 2011 to 2014. Several of the restaurant leases have escalation clauses. Three of the escalations are based on percentages of gross sales and one is
84
Table of Contents
Supertel Hospitality, Inc. and Subsidiaries
NOTES TO CONSOLIDATED FINANCIAL STATEMENTS—CONTINUED
December 31, 2010, 2009 and 2008
(Dollars in thousands, except per share data)
based on increases in the Consumer Price Index for all Urban Consumers. The restaurant and cell tower lease income from continuing operations totaled approximately $285, $284 and $265 in 2010, 2009 and 2008, respectively, and is included in room rentals and other hotel services.
As of December 31, 2010, the future minimum lease receipts from the non-cancellable restaurants and cell tower leases are as follows:
| 2011 |
81 | |||
| 2012 |
55 | |||
| 2013 |
44 | |||
| 2014 |
44 | |||
| 2015 |
30 | |||
| Thereafter |
150 | |||
| $ | 404 | |||
Note 9. Redeemable Preferred Stock
On June 3, 2008 the Company offered and sold 332,500 shares of 10.0% Series B Cumulative Preferred Stock. The shares were sold for $25.00 per share and bear a liquidation preference of $25.00 per share. Underwriting and other costs of the offering totaled approximately $0.6 million to the Company. The net proceeds plus additional cash were used by the Company to pay an $8.5 million bridge loan with General Electric Capital Corporation. At December 31, 2010, 332,500 shares of 10.0% Series B preferred stock remained outstanding.
Dividends on the Series B preferred stock are cumulative and are payable quarterly in arrears on each March 31, June 30, September 30 and December 31, or, if not a business day, the next succeeding business day, at the annual rate of 10.0% of the $25.00 liquidation preference per share, equivalent to a fixed annual amount of $2.50 per share. Dividends on the Series B preferred stock accrue whether or not the Company has earnings, whether or not there are funds legally available for the payment of such dividends, whether or not such dividends are declared and whether or not such dividends are prohibited by agreement. Accrued but unpaid dividends on the Series B preferred stock will not bear interest.
The Series B preferred stock will, with respect to dividend rights and rights upon the Company’s liquidation, dissolution or winding up, rank senior to the Company’s common stock, senior to all classes or series of preferred stock issued by the Company and ranking junior to the Series B preferred stock with respect to dividend rights or rights upon the Company’s liquidation, dissolution or winding up, on a parity with the Company’s Series A preferred stock and with all classes or series of preferred stock issued by the Company and ranking on a parity with the Series B preferred stock with respect to dividend rights or rights upon the Company’s liquidation, dissolution or winding up and junior to all of the Company’s existing and future indebtedness.
The Company will not pay any distributions, or set aside any funds for the payment of distributions, on its common shares, unless it has also paid (or set aside for payment) the full cumulative distributions on the preferred shares for the current and all past dividend periods. The Series B preferred stock has no stated maturity and is not subject to any sinking fund or mandatory redemption.
The Series B preferred stock is not redeemable prior to June 3, 2013, except in certain limited circumstances relating to the maintenance of the Company’s ability to qualify as a REIT as provided in the Company’s articles of incorporation or a change of control (as defined in the Company’s amendment to its
85
Table of Contents
Supertel Hospitality, Inc. and Subsidiaries
NOTES TO CONSOLIDATED FINANCIAL STATEMENTS—CONTINUED
December 31, 2010, 2009 and 2008
(Dollars in thousands, except per share data)
articles of incorporation establishing the Series B preferred stock). The Company may redeem the Series B preferred stock, in whole or in part, at any time or from time to time on or after June 3, 2013 for cash at a redemption price of $25.00 per share, plus all accrued and unpaid dividends. Also, upon a change of control, each outstanding share of the Company’s Series B preferred stock will be redeemed for cash at a redemption price of $25.00 per share, plus all accrued and unpaid dividends. At December 31, 2010, no events have occurred that would lead the Company to believe redemption of the preferred stock, due to a change of control or failure to maintain its REIT qualification, is probable.
Note 10. Noncontrolling Interest of Common and Preferred Units in SLP
At December 31, 2010, 158,161 of SLP’s common operating partnership units (“Common OP Units”) were outstanding. The redemption values for the Common OP Units are $250 and $237 for 2010 and 2009 respectively. Each limited partner of SLP may, subject to certain limitations, require that SLP redeem all or a portion of his or her Common OP Units, at any time after a specified period following the date the units were acquired, by delivering a redemption notice to SLP. When a limited partner tenders Common OP Units to SLP for redemption, the Company can, in its sole discretion, choose to purchase the units for either (1) a number of shares of Company common stock equal to the number of units redeemed (subject to certain adjustments) or (2) cash in an amount equal to the market value of the number of shares of Company common stock the limited partner would have received if the Company chose to purchase the units for common stock. During 2009, 1,077,645 Common OP Units were redeemed for common shares of SHI.
At December 31, 2010, 51,035 of SLP’s preferred operating partnership units (“Preferred OP Units”) were outstanding. The redemption value for the Preferred OP Units is $511 for December 31, 2010. The Preferred OP Units receive a preferred dividend distribution of $1.10 per preferred unit annually, payable on a monthly basis and do not participate in the allocations of profits and losses of SLP. Distributions to holders of Preferred OP Units have priority over distributions to holders of Common OP Units. Supertel offered to each of the Preferred OP Unit holders the option to extend until October 24, 2011 their right to have units redeemed at $10 per unit. All holders elected to extend until October 24, 2011. In October 2009, 126,751 units were redeemed at $10 each. The holders of the remaining 51,035 units elected to extend to October 24, 2010, their right to have units redeemed at $10 per unit. The remaining 51,035 units will continue to be carried outside of permanent equity at redemption value.
Noncontrolling Interest Reconciliation of Common and Preferred Units
| Redeemable Noncontrolling Interest |
Noncontrolling Interest |
Total Noncontrolling Interest |
||||||||||
| Balance at January 1, 2008 |
$ | 1,956 | $ | 8,222 | $ | 10,178 | ||||||
| Partner draws |
(215 | ) | (572 | ) | (787 | ) | ||||||
| Conversion of OP units |
(178 | ) | — | (178 | ) | |||||||
| Issuance of OP units |
— | 26 | 26 | |||||||||
| Noncontrolling interest expense |
215 | 388 | 603 | |||||||||
| Balance at December 31, 2008 |
$ | 1,778 | $ | 8,064 | $ | 9,842 | ||||||
| Partner draws |
(172 | ) | — | (172 | ) | |||||||
| Conversion of OP units |
— | (7,354 | ) | (7,354 | ) | |||||||
| Reclassification of OP units to current liability |
(1,267 | ) | — | (1,267 | ) | |||||||
| Noncontrolling interest expense (income) |
172 | (302 | ) | (130 | ) | |||||||
| Balance at December 31, 2009 |
$ | 511 | $ | 408 | $ | 919 | ||||||
| Partner draws |
(56 | ) | — | (56 | ) | |||||||
| Noncontrolling interest expense (income) |
56 | (73 | ) | (17 | ) | |||||||
| Balance at December 31, 2010 |
$ | 511 | $ | 335 | $ | 846 | ||||||
Note 11. Common and Preferred Stock
The Company’s common stock is duly authorized, full paid and non-assessable. At December 31, 2010 and 2009, members of the Board of Directors and executive officers owned approximately 19% and 20%,
86
Table of Contents
Supertel Hospitality, Inc. and Subsidiaries
NOTES TO CONSOLIDATED FINANCIAL STATEMENTS—CONTINUED
December 31, 2010, 2009 and 2008
(Dollars in thousands, except per share data)
respectively, of the Company’s outstanding common stock.
At December 31, 2010, 158,161 of SLP’s common operating partnership units (“Common OP Units”) and 51,035 of SLP’s preferred operating partnership units (“Preferred OP Units”) were outstanding. The combined redemption value for the Common OP Units and Preferred OP Units are $761 and $748 as of December 31, 2010 and 2009, respectively. Each limited partner of SLP may, subject to certain limitations, require that SLP redeem all or a portion of his or her Common OP Units or Preferred OP Units, at any time after a specified period following the date the units were acquired, by delivering a redemption notice to SLP. When a limited partner tenders Common OP Units to SLP for redemption, the Company can, in its sole discretion, choose to purchase the units for either (1) a number of shares of Company common stock equal to the number of units redeemed (subject to certain adjustments) or (2) cash in an amount equal to the market value of the number of shares of Company common stock the limited partner would have received if the Company chose to purchase the units for common stock. The Preferred OP Units are convertible by the holders into Common OP Units on a one-for-one basis or may be redeemed for cash at $10 per unit until October 2010. The Preferred OP Units receive a preferred dividend distribution of $1.10 per preferred unit annually, payable on a monthly basis and do not participate in the allocations of profits and losses of SLP. During 2009, 1,077,645 Common OP Units of limited partnership interest were redeemed for common shares of SHI. During 2010 and 2008, no Common OP Units were redeemed for common shares of SHI. Supertel offered to each of the Preferred OP Unit holders the option to extend until October 24, 2011 their right to have units redeemed at $10 per unit. All holders elected to extend until October 24, 2011. In October 2009, 126,751 units were redeemed at $10 each. The holders of the remaining 51,035 units elected to extend to October 24, 2010, their right to have units redeemed at $10 per unit. There were 17,824 Preferred OP Units redeemed for cash in December 2008.
On December 30, 2005 the Company offered and sold 1,521,258 shares of 8% Series A preferred stock. The shares were sold for $10.00 per share and bear a liquidation preference of $10.00 per share. Underwriting and other costs of the offering totaled $1.2 million. The proceeds were used to reduce borrowings under the Company’s revolving credit facility with Great Western Bank. At December 31, 2010, 2009 and 2008, 803,270 shares each year of Series A preferred stock remained outstanding.
Dividends on the Series A preferred stock are cumulative and are payable monthly in arrears on the last day of each month, at the annual rate of 8% of the $10.00 liquidation preference per share, equivalent to a fixed annual amount of $.80 per share. Dividends on the Series A preferred stock accrue regardless of whether or not the Company has earnings, whether there are funds legally available for the payment of such dividends and whether or not such dividends are declared. Unpaid dividends will accumulate and bear additional dividends at 8%, compounded monthly.
The Series A preferred stock with respect to dividend rights and rights upon the Company’s liquidation, dissolution or winding up, ranks senior to all classes or series of the Company’s common stock, senior or on parity with all other classes or series of preferred stock and junior to all of the Company’s existing and future indebtedness. Upon liquidation all Series A preferred stock will be entitled to $10.00 per share plus accrued but unpaid dividends. The Company will not pay any distributions, or set aside any funds for the payment of distributions, on its common shares unless it has also paid (or set aside for payment) the full cumulative distributions on the preferred shares for the current and all past dividend periods. The outstanding preferred shares do not have any maturity date, and are not subject to mandatory redemption.
Previously, each share of Series A preferred stock was convertible in whole or in part, at any time at the option of the holders thereof, into common stock at a conversion price of $5.66 per share of common stock
87
Table of Contents
Supertel Hospitality, Inc. and Subsidiaries
NOTES TO CONSOLIDATED FINANCIAL STATEMENTS—CONTINUED
December 31, 2010, 2009 and 2008
(Dollars in thousands, except per share data)
(equivalent to a conversion rate of 1.77 shares of common stock for each share of Series A convertible preferred stock) subject to certain adjustments. The conversion rights of the Series A preferred stock were cancelled as of February 20, 2009. The Company may not optionally redeem the Series A preferred shares prior to January 1, 2009, except in limited circumstances to preserve its status as a REIT.
The conversion rights of the holders of the Series A preferred stock were subject to cancellation on or after December 31, 2008 if the closing price of the Company common stock on the Nasdaq Global Market exceeds $7.36 for at least 20 trading days within any period of 30 consecutive trading days. The Company issued a conversion cancellation notice to holders of the Series A convertible preferred stock and the conversion rights were cancelled as of February 20, 2009. The Series A preferred stock will be redeemable on or after January 1, 2009 for cash, at the Company’s option, in whole or from time to time in part, at $10.00 per share, plus accrued and unpaid dividends to the redemption date.
On December 30, 2005, the Company issued warrants to Anderson & Strudwick Incorporated, the selling agent for the Company in its public offering of the Series A Preferred Stock, to purchase 126,311 shares of Series A preferred stock. The warrants were exercisable until December 31, 2010 at $12.00 per share of Series A preferred stock. The warrants could not be sold, transferred, pledged, assigned or hypothecated for a period of one year after their issuance, except to officers of the selling agent. During 2007 the warrants were fully exercised.
On May 10, 2010, the Company consummated the sale of 598,803 shares of its common stock and 299,403 warrants to purchase up to an additional 299,403 shares of the Company’s common stock for aggregate gross proceeds of $1.0 million, pursuant to the terms of a Private Placement Memorandum with accredited investors as defined in Rule 501 of Regulation D promulgated under the Securities Act of 1933, as amended. The warrants are exercisable for a period of three years from the date of issuance at an exercise price of $2.50.
During 2010 we sold 316,384 shares of common stock using a Standby Equity Distribution Agreement. Net proceeds of $480,000 were used for corporate purposes.
The Company also has Series B preferred stock outstanding. See Note 9.
Note 12. Stock-Based Compensation
Upon initial issuance of stock options on May 25, 2006, the Company adopted the provisions of FASB ASC 718-10-30 Compensation – Stock Compensation – Overall – Initial Measurement, which requires the measurement and recognition of compensation expense for all share-based payment awards to employees and directors based on estimated fair values.
Options
The Company has a 2006 Stock Plan (the “Plan”) which has been approved by the Company’s shareholders. The Plan authorized the grant of stock options, stock appreciation rights, restricted stock and stock bonuses for up to 200,000 shares of common stock. At the annual shareholders meeting on May 28, 2009, the shareholders of Supertel Hospitality, Inc. approved an amendment to the Supertel 2006 Stock Plan. The amendment increases the maximum number of shares reserved for issuance under the plan from 200,000 to 300,000 and changes the definition of fair market value to mean the closing price of Supertel common stock with respect to future awards under the plan.
As of December 31, 2010, 255,143 stock options have been awarded under the Plan. The exercise price is equal to the average of the high and low sales price of the stock as reported on the National Association of Securities Dealers Automated Quotation system (NASDAQ) on the grant date. A total of 255,143 shares of common stock have been reserved for issuance pursuant to the Plan with respect to the granted options. There is no intrinsic value for the vested options as of December 31, 2010. The following table summarizes the options awarded:
88
Table of Contents
Supertel Hospitality, Inc. and Subsidiaries
NOTES TO CONSOLIDATED FINANCIAL STATEMENTS—CONTINUED
December 31, 2010, 2009 and 2008
(Dollars in thousands, except per share data)
| Options Grant Date | ||||||||||||
| 12/05/10 | 11/17/09 | 05/22/08 | ||||||||||
| Awarded Options |
95,500 | 90,000 | 30,000 | |||||||||
| Exercise Price |
$ | 1.42 | $ | 1.54 | $ | 5.28 | ||||||
| Date Vested |
06/30/11 | 06/30/10 | 12/31/08 | |||||||||
| Expiration Date |
12/2/2014 | 11/17/2013 | 5/22/2012 | |||||||||
The Company records compensation expense for stock options based on the estimated fair value of the options on the date of grant using the Black-Scholes option-pricing model. The Company uses historical data among other factors to estimate the expected price volatility, the expected option life, the dividend rate and expected forfeiture rate. The risk-free rate is based on the U.S. Treasury yield in effect at the time of grant for the estimated life of the option. The following table summarizes the estimates used in the Black-Scholes option-pricing model related to the 2010, 2009, and 2008 grants:
| Grant Date | ||||||||||||
| 12/02/10 | 11/17/09 | 05/22/08 | ||||||||||
| Volatility |
50.00 | % | 45.00 | % | 20.00 | % | ||||||
| Expected dividend yield |
6.33 | % | 6.33 | % | 6.54 | % | ||||||
| Expected term (in years) |
3.79 | 3.81 | 4.00 | |||||||||
| Risk free interest rate |
1.27 | % | 1.74 | % | 3.04 | % | ||||||
The following table summarizes the Company’s activities with respect to its stock options for the year ended December 31, 2010 as follows (in thousands, except per share and share data):
| Shares | Weighted- Average Exercise Price |
Aggregate Fair Value |
Weighted- Average Remaining Contractual Term |
Aggregate Intrinsic Value |
||||||||||||||||
| Outstanding at December 31, 2009 |
230,715 | $ | 4.45 | $ | 126 | |||||||||||||||
| Granted |
95,500 | 1.42 | 33 | |||||||||||||||||
| Exercised |
— | — | — | |||||||||||||||||
| Forfeited or expired |
71,072 | 6.06 | 50 | |||||||||||||||||
| Outstanding at December 31, 2010 |
255,143 | $ | 2.87 | $ | 109 | 2.71 | $ | 18,880 | ||||||||||||
| Exercisable at December 31, 2010 |
159,643 | $ | 3.74 | $ | 76 | 2.43 | $ | 3,600 | ||||||||||||
Share-Based Compensation Expense
The expense recognized in the consolidated financial statements for the share-based compensation related to employees and directors for the years ended December 31, 2010, 2009 and 2008 was $30, $6 and $12, respectively. At December 31, 2010, we had $29 of total unrecognized compensation expense, net of estimated forfeitures, related to stock options granted in 2010 that vest as of June 30, 2011. We recognize compensation expense using the straight-line method over the vesting period. During 2010, 2009 and 2008, the company’s options granted were 95,500, 90,000 and 30,000 respectively, with a weighted average grant date fair value per option of $0.35, $0.35 and $0.40, respectively. The total intrinsic value of options exercised was $0 for all three fiscal years 2010, 2009 and 2008. The closing market price of our common stock on the last day of 2010 was $1.58 per share.
Note 13. Supplementary Data
The following tables present our unaudited quarterly results of operations for 2010 and 2009:
89
Table of Contents
Supertel Hospitality, Inc. and Subsidiaries
NOTES TO CONSOLIDATED FINANCIAL STATEMENTS—CONTINUED
December 31, 2010, 2009 and 2008
(Dollars in thousands, except per share data)
| Quarters Ended (unaudited) | ||||||||||||||||||||
| March 31, 2010 |
June 30, 2010 |
September 30, 2010 |
December 31, 2010 |
YTD 2010 | ||||||||||||||||
| 2010 |
||||||||||||||||||||
| Revenues |
$ | 17,425 | $ | 23,062 | $ | 24,433 | $ | 19,194 | $ | 84,114 | ||||||||||
| Expenses |
18,285 | 20,308 | 21,255 | 18,847 | 78,695 | |||||||||||||||
| Earnings (loss) before net losses on disposition of assets, other income, interest noncontrolling interest and income tax expense (benefit) |
(860 | ) | 2,754 | 3,178 | 347 | 5,419 | ||||||||||||||
| Net losses on dispositions of assets |
(16 | ) | (23 | ) | (16 | ) | (11 | ) | (66 | ) | ||||||||||
| Other income |
27 | 34 | 31 | 30 | 122 | |||||||||||||||
| Interest |
(2,408 | ) | (2,415 | ) | (2,383 | ) | (2,496 | ) | (9,702 | ) | ||||||||||
| Impairment losses |
— | (2,147 | ) | — | — | (2,147 | ) | |||||||||||||
| Earnings (loss) from continuing operations before income taxes |
(3,257 | ) | (1,797 | ) | 810 | (2,130 | ) | (6,374 | ) | |||||||||||
| Income tax expense (benefit) |
(680 | ) | 104 | 151 | (472 | ) | (897 | ) | ||||||||||||
| Earnings (loss) from continuing operations |
(2,577 | ) | (1,901 | ) | 659 | (1,658 | ) | (5,477 | ) | |||||||||||
| Discontinued operations |
(440 | ) | (1,774 | ) | (750 | ) | (2,161 | ) | (5,125 | ) | ||||||||||
| Net loss |
(3,017 | ) | (3,675 | ) | (91 | ) | (3,819 | ) | (10,602 | ) | ||||||||||
| Noncontrolling interest |
7 | 11 | (13 | ) | 12 | 17 | ||||||||||||||
| Net loss attributable to controlling interests |
(3,010 | ) | (3,664 | ) | (104 | ) | (3,807 | ) | (10,585 | ) | ||||||||||
| Preferred stock dividend |
(368 | ) | (369 | ) | (368 | ) | (369 | ) | (1,474 | ) | ||||||||||
| Net loss attributable to common shareholders |
$ | (3,378 | ) | $ | (4,033 | ) | $ | (472 | ) | $ | (4,176 | ) | $ | (12,059 | ) | |||||
| NET EARNINGS (LOSS) PER COMMON SHARE—BASIC AND DILUTED |
||||||||||||||||||||
| EPS from continuing operations |
$ | (0.13 | ) | $ | (0.10 | ) | $ | 0.01 | $ | (0.09 | ) | $ | (0.31 | ) | ||||||
| EPS from discontinued operations |
$ | (0.02 | ) | $ | (0.08 | ) | $ | (0.03 | ) | $ | (0.09 | ) | $ | (0.22 | ) | |||||
| EPS Basic and Diluted |
$ | (0.15 | ) | $ | (0.18 | ) | $ | (0.02 | ) | $ | (0.18 | ) | $ | (0.53 | ) | |||||
90
Table of Contents
Supertel Hospitality, Inc. and Subsidiaries
NOTES TO CONSOLIDATED FINANCIAL STATEMENTS—CONTINUED
December 31, 2010, 2009 and 2008
(Dollars in thousands, except per share data)
| Quarters Ended (unaudited) | ||||||||||||||||||||
| March 31, 2009 |
June 30, 2009 |
September 30, 2009 |
December 31, 2009 |
YTD 2009 | ||||||||||||||||
| 2009 |
||||||||||||||||||||
| Revenues |
$ | 18,330 | $ | 22,293 | $ | 22,928 | $ | 18,019 | $ | 81,570 | ||||||||||
| Expenses |
18,204 | 19,385 | 20,681 | 17,933 | 76,203 | |||||||||||||||
| Earnings before net losses on disposition of assets, other income, interest noncontrolling interest and income tax expense (benefit) |
126 | 2,908 | 2,247 | 86 | 5,367 | |||||||||||||||
| Net losses on dispositions of assets |
(26 | ) | (26 | ) | (24 | ) | (38 | ) | (114 | ) | ||||||||||
| Other income |
38 | 34 | 28 | 34 | 134 | |||||||||||||||
| Interest |
(2,307 | ) | (2,437 | ) | (2,420 | ) | (2,417 | ) | (9,581 | ) | ||||||||||
| Impairment losses |
— | — | — | (7,399 | ) | (7,399 | ) | |||||||||||||
| Earnings (loss) from continuing operations before income taxes |
(2,169 | ) | 479 | (169 | ) | (9,734 | ) | (11,593 | ) | |||||||||||
| Income tax expense (benefit) |
(633 | ) | 97 | (177 | ) | 164 | (549 | ) | ||||||||||||
| Earnings (loss) from continuing operations |
(1,536 | ) | 382 | 8 | (9,898 | ) | (11,044 | ) | ||||||||||||
| Discontinued operations |
(889 | ) | 961 | (1,017 | ) | (15,536 | ) | (16,481 | ) | |||||||||||
| Net earnings (loss) |
(2,425 | ) | 1,343 | (1,009 | ) | (25,434 | ) | (27,525 | ) | |||||||||||
| Noncontrolling interest |
87 | (69 | ) | (38 | ) | 150 | 130 | |||||||||||||
| Net income (loss) attributable to controlling interests |
(2,338 | ) | 1,274 | (1,047 | ) | (25,284 | ) | (27,395 | ) | |||||||||||
| Preferred stock dividend |
(369 | ) | (369 | ) | (368 | ) | (368 | ) | (1,474 | ) | ||||||||||
| Net earnings (loss) attributable to common shareholders |
$ | (2,707 | ) | $ | 905 | $ | (1,415 | ) | $ | (25,652 | ) | $ | (28,869 | ) | ||||||
| NET EARNINGS (LOSS) PER COMMON SHARE—BASIC AND DILUTED |
||||||||||||||||||||
| EPS from continuing operations * |
$ | (0.09 | ) | $ | (0.00 | ) | $ | (0.02 | ) | $ | (0.47 | ) | $ | (0.58 | ) | |||||
| EPS from discontinued operations * |
$ | (0.04 | ) | $ | 0.04 | $ | (0.04 | ) | $ | (0.70 | ) | $ | (0.75 | ) | ||||||
| EPS Basic and Diluted |
$ | (0.13 | ) | $ | 0.04 | $ | (0.06 | ) | $ | (1.17 | ) | $ | (1.33 | ) | ||||||
|
* Quarterly EPS data does not add to total year, due to rounding |
| |||||||||||||||||||
91
Table of Contents
Supertel Hospitality, Inc. and Subsidiaries
NOTES TO CONSOLIDATED FINANCIAL STATEMENTS—CONTINUED
December 31, 2010, 2009 and 2008
(Dollars in thousands, except per share data)
Note 14. Subsequent Events
On January 26, 2011, the Company borrowed $1.95 million from Elkhorn Valley Bank. The promissory note bears interest at 5.9% per annum and matures on October 1, 2011. The loan is secured by Super 8 hotels located in Watertown, South Dakota and Park City, Kansas.
On March 1, 2011, the maturity date of the $0.8 million promissory note to First National Bank of Omaha was extended to March 1, 2012.
On March 10, 2011, the Company received a waiver from Great Western Bank for non-compliance with the loan-specific debt service coverage ratio covenant set forth in the credit facilities with Great Western Bank as of December 31, 2010. Additional information regarding the waiver is included in Note 6 to these Consolidated Financial Statements.
The credit facilities with Great Western Bank were amended on March 15, 2011 to require maintenance of consolidated and loan-specific debt service coverage ratios of at least 1.05 to 1, tested quarterly, from December 31, 2010 through the maturity of the credit facilities. The credit facilities continue to require maintenance of consolidated and loan-specific loan to value ratios that do not exceed 70%, tested annually, from December 31, 2010 through the maturity of the credit facilities.
The Great Western Bank amendment also: (a) modifies the borrowing base so that the loans available to the Company under the credit facilities may not exceed the lesser of (i) an amount equal to 70% of the total appraised value of the hotels securing the credit facilities and (ii) an amount that would result in a loan-specific debt service coverage ratio of less than 1.05 to 1 from December 31, 2010 through December 31, 2011 and 1.50 to 1 from January 1, 2012 through the maturity of the credit facilities; (b) maintains the interest rate on the revolving credit portion of the credit facilities at 5.50% from March 15, 2011 through December 31, 2011 and prime (subject to a 5.50% floor rate) from January 1, 2012 through the maturity of the credit facilities; and (c) gives Great Western Bank the option to increase the interest rates of the credit facilities up to 4.00% any time after January 1, 2012.
On March 11, 2011, the Company received a waiver from Wells Fargo Bank for non-compliance with the consolidated tangible net worth covenant set forth in its credit facility with Wells Fargo Bank as of December 31, 2010. Additional information regarding the waiver is included in Note 6 to these Consolidated Financial Statements. In connection with the waiver, the credit facility was amended on March 11, 2011 to: (a) reduce the consolidated tangible net worth covenant from $65 million to $50 million; (b) extend the maturity date from March 12, 2011 to September 30, 2011; and (c) decrease the interest rate from LIBOR plus 5.0% (subject to a 5.5% floor) to LIBOR plus 4.0% (subject to a 4.5% floor).
92
Table of Contents
Supertel Hospitality, Inc. and Subsidiaries
SCHEDULE III – REAL ESTATE AND ACCUMULATED DEPRECIATION
As of December 31, 2010
| Initial Cost | Additions, (Dispositions), (Impairments), Subsequent to Acquisition |
Gross Amount at December 31, 2010 | ||||||||||||||||||||||||||||||||||
| Hotel and Location |
Encum- brance |
Land | Buildings & Improvements |
Land | Buildings & Improvements |
Land | Buildings & Improvements |
Accumulated Depreciation |
Net Book Value |
|||||||||||||||||||||||||||
| Comfort Inn |
||||||||||||||||||||||||||||||||||||
| Minocqua, Wisconsin |
GWB | $ | 214,505 | $ | 1,458,389 | $ | — | $ | 368,972 | $ | 214,505 | $ | 1,827,361 | $ | (920,269 | ) | $ | 1,121,597 | ||||||||||||||||||
| Sheboygan, Wisconsin |
GWB | 286,970 | 1,716,782 | — | 384,299 | 286,970 | 2,101,081 | (1,065,569 | ) | 1,322,482 | ||||||||||||||||||||||||||
| Chambersburg, Pennsylvania |
GRW | 89,000 | 2,346,362 | — | 356,098 | 89,000 | 2,702,460 | (1,091,443 | ) | 1,700,017 | ||||||||||||||||||||||||||
| Culpeper, Virginia |
GRW | 182,264 | 2,142,652 | — | 595,568 | 182,264 | 2,738,220 | (1,098,860 | ) | 1,821,624 | ||||||||||||||||||||||||||
| Farmville, Virginia |
GRW | 253,618 | 2,162,087 | — | 592,099 | 253,618 | 2,754,186 | (1,292,289 | ) | 1,715,515 | ||||||||||||||||||||||||||
| Morgantown, West Virginia |
GRW | 398,322 | 3,853,651 | — | 934,706 | 398,322 | 4,788,357 | (2,153,786 | ) | 3,032,893 | ||||||||||||||||||||||||||
| New Castle, Pennsylvania |
GRW | 56,648 | 4,101,254 | — | 702,996 | 56,648 | 4,804,250 | (1,893,833 | ) | 2,967,065 | ||||||||||||||||||||||||||
| Princeton, West Virginia |
GRW | 387,567 | 1,774,501 | — | 709,251 | 387,567 | 2,483,752 | (1,239,044 | ) | 1,632,275 | ||||||||||||||||||||||||||
| Rocky Mount, Virginia |
GRW | 193,841 | 2,162,429 | — | 204,400 | 193,841 | 2,366,829 | (1,049,511 | ) | 1,511,159 | ||||||||||||||||||||||||||
| Solomons, Maryland |
GRW | 2,303,990 | 2,988,255 | — | 1,975,470 | 2,303,990 | 4,963,725 | (2,656,695 | ) | 4,611,020 | ||||||||||||||||||||||||||
| Erlanger, Kentucky |
GWB | 750,000 | 2,822,201 | (65,855 | ) | 420,122 | 684,145 | 3,242,323 | (885,628 | ) | 3,040,840 | |||||||||||||||||||||||||
| Fayetteville, North Carolina |
CITI | 725,000 | 3,910,514 | — | 472,538 | 725,000 | 4,383,052 | (1,112,994 | ) | 3,995,058 | ||||||||||||||||||||||||||
| Fayetteville Car Wash, North Carolina |
CITI | — | 164,128 | — | 8,706 | — | 172,834 | (63,138 | ) | 109,696 | ||||||||||||||||||||||||||
| Alexandria, Virginia |
WF BMI | 2,500,000 | 9,373,060 | — | 1,633,645 | 2,500,000 | 11,006,705 | (1,567,064 | ) | 11,939,641 | ||||||||||||||||||||||||||
| Glasgow, Kentucky |
GE 3CI | 500,000 | 2,456,305 | — | 523,625 | 500,000 | 2,979,930 | (402,477 | ) | 3,077,453 | ||||||||||||||||||||||||||
| Super 8 |
||||||||||||||||||||||||||||||||||||
| Creston, Iowa |
GRW | 56,000 | 840,580 | 89,607 | 2,377,472 | 145,607 | 3,218,052 | (1,827,635 | ) | 1,536,024 | ||||||||||||||||||||||||||
| Columbus, Nebraska |
GWB | 51,716 | 571,178 | 51,666 | 741,239 | 103,382 | 1,312,417 | (917,248 | ) | 498,551 | ||||||||||||||||||||||||||
| O’Neill, Nebraska |
GRW | 75,000 | 667,074 | 46,075 | 1,140,531 | 121,075 | 1,807,605 | (1,047,641 | ) | 881,039 | ||||||||||||||||||||||||||
| Omaha, Nebraska |
GWB | 164,034 | 1,053,620 | — | 1,270,096 | 164,034 | 2,323,716 | (1,669,219 | ) | 818,531 | ||||||||||||||||||||||||||
| Lincoln, Nebraska (West “O”) |
GWB | 139,603 | 1,234,988 | 63,153 | 988,232 | 202,756 | 2,223,220 | (1,464,688 | ) | 961,288 | ||||||||||||||||||||||||||
| Lincoln, Nebraska (Cornhusker) |
GWB | 226,174 | 1,068,520 | 271,817 | 1,943,697 | 497,991 | 3,012,217 | (1,827,464 | ) | 1,682,744 | ||||||||||||||||||||||||||
| Keokuk, Iowa |
GRW | 55,000 | 642,783 | 71,175 | 651,109 | 126,175 | 1,293,892 | (913,544 | ) | 506,523 | ||||||||||||||||||||||||||
| Iowa City, Iowa |
GRW | 227,290 | 1,280,365 | — | 617,363 | 227,290 | 1,897,728 | (1,380,994 | ) | 744,024 | ||||||||||||||||||||||||||
| Omaha, Nebraska (Ak-sar-ben) |
GWB | 203,453 | 1,054,497 | — | 366,738 | 203,453 | 1,421,235 | (993,072 | ) | 631,616 | ||||||||||||||||||||||||||
| Kirksville, Missouri |
GWB | 151,225 | 830,457 | — | 365,094 | 151,225 | 1,195,551 | (815,571 | ) | 531,205 | ||||||||||||||||||||||||||
| Burlington, Iowa |
GRW | 145,000 | 867,116 | — | 383,872 | 145,000 | 1,250,988 | (866,262 | ) | 529,726 | ||||||||||||||||||||||||||
| Sedalia, Missouri |
GWB | 185,025 | 917,809 | — | 713,711 | 185,025 | 1,631,520 | (1,034,512 | ) | 782,033 | ||||||||||||||||||||||||||
| Hays, Kansas |
GWB | 317,762 | 1,133,765 | 19,519 | 497,858 | 337,281 | 1,631,623 | (1,108,349 | ) | 860,555 | ||||||||||||||||||||||||||
| Moberly, Missouri |
GWB | 60,000 | 1,075,235 | — | 445,426 | 60,000 | 1,520,661 | (1,027,708 | ) | 552,953 | ||||||||||||||||||||||||||
| Pittsburg, Kansas |
GRW | 130,000 | 852,131 | — | 302,879 | 130,000 | 1,155,010 | (823,115 | ) | 461,895 | ||||||||||||||||||||||||||
| Manhattan, Kansas |
GWB | 261,646 | 1,254,175 | (10,000 | ) | 609,142 | 251,646 | 1,863,317 | (1,184,199 | ) | 930,764 | |||||||||||||||||||||||||
| Clinton, Iowa |
GRW | 135,153 | 805,067 | (46,089 | ) | 357,896 | 89,064 | 1,162,963 | (783,125 | ) | 468,902 | |||||||||||||||||||||||||
| Mt. Pleasant, Iowa |
GRW | 85,745 | 536,064 | 21,507 | 533,116 | 107,252 | 1,069,180 | (719,256 | ) | 457,176 | ||||||||||||||||||||||||||
| Wichita, Kansas |
GWB | 435,087 | 1,806,979 | — | 756,371 | 435,087 | 2,563,350 | (1,717,853 | ) | 1,280,584 | ||||||||||||||||||||||||||
93
Table of Contents
Supertel Hospitality, Inc. and Subsidiaries
SCHEDULE III—REAL ESTATE AND ACCUMULATED DEPRECIATION—CONTINUED
As of December 31, 2010
| Initial Cost | Additions, (Dispositions), (Impairments), Subsequent to Acquisition |
Gross Amount at December 31, 2010 | ||||||||||||||||||||||||||||||||||
| Hotel and Location |
Encum- brance |
Land | Buildings & Improvements |
Land | Buildings & Improvements |
Land | Buildings & Improvements |
Accumulated Depreciation |
Net Book Value |
|||||||||||||||||||||||||||
| Super 8—continued |
||||||||||||||||||||||||||||||||||||
| Pella, Iowa |
GRW | 61,853 | 664,610 | — | 179,642 | 61,853 | 844,252 | (559,643 | ) | 346,462 | ||||||||||||||||||||||||||
| Storm Lake, Iowa |
GRW | 90,033 | 819,202 | 41,344 | 636,087 | 131,377 | 1,455,289 | (827,623 | ) | 759,043 | ||||||||||||||||||||||||||
| West Plains, Missouri |
GWB | 112,279 | 861,178 | — | 205,481 | 112,279 | 1,066,659 | (676,619 | ) | 502,319 | ||||||||||||||||||||||||||
| Jefferson City, Missouri |
GWB | 264,707 | 1,206,886 | — | 397,857 | 264,707 | 1,604,743 | (996,152 | ) | 873,298 | ||||||||||||||||||||||||||
| El Dorado, Kansas |
FNB | 96,764 | 418,333 | 467 | 653,232 | 97,231 | 1,071,565 | (657,700 | ) | 511,096 | ||||||||||||||||||||||||||
| Wayne, Nebraska |
GWB | 79,127 | 685,135 | — | 196,349 | 79,127 | 881,484 | (539,507 | ) | 421,104 | ||||||||||||||||||||||||||
| Batesville, Arkansas |
GWB | 81,483 | 811,371 | — | 253,910 | 81,483 | 1,065,281 | (612,674 | ) | 534,090 | ||||||||||||||||||||||||||
| Fayetteville, Arkansas |
GWB | 255,731 | 1,549,271 | — | 336,768 | 255,731 | 1,886,039 | (1,074,703 | ) | 1,067,067 | ||||||||||||||||||||||||||
| Omaha, Nebraska (West Dodge) |
GWB | 593,518 | 1,758,275 | — | 400,131 | 593,518 | 2,158,406 | (1,191,201 | ) | 1,560,723 | ||||||||||||||||||||||||||
| Watertown, South Dakota |
EVB | 51,237 | 1,296,312 | — | 580,395 | 51,237 | 1,876,707 | (990,558 | ) | 937,386 | ||||||||||||||||||||||||||
| Norfolk, Nebraska |
GRW | 226,971 | 1,587,581 | — | 564,861 | 226,971 | 2,152,442 | (1,049,008 | ) | 1,330,405 | ||||||||||||||||||||||||||
| Park City, Kansas |
EVB | 275,962 | 891,933 | — | 534,922 | 275,962 | 1,426,855 | (766,135 | ) | 936,682 | ||||||||||||||||||||||||||
| Muscatine, Iowa |
GWB | 204,890 | 1,616,090 | — | 358,533 | 204,890 | 1,974,623 | (1,000,636 | ) | 1,178,877 | ||||||||||||||||||||||||||
| Fort Madison, Iowa |
GWB | 104,855 | 871,075 | — | 269,094 | 104,855 | 1,140,169 | (591,798 | ) | 653,226 | ||||||||||||||||||||||||||
| Portage, Wisconsin |
GRW | 203,032 | 1,839,321 | — | 341,448 | 203,032 | 2,180,769 | (1,012,457 | ) | 1,371,344 | ||||||||||||||||||||||||||
| Antigo, Wisconsin |
GWB | 234,605 | 1,485,579 | (13,506 | ) | 306,995 | 221,099 | 1,792,574 | (873,672 | ) | 1,140,001 | |||||||||||||||||||||||||
| Shawano, Wisconsin |
GRW | 244,935 | 1,672,123 | — | 295,722 | 244,935 | 1,967,845 | (951,960 | ) | 1,260,820 | ||||||||||||||||||||||||||
| Tomah, Wisconsin |
GWB | 211,975 | 2,079,714 | (59,834 | ) | 459,046 | 152,141 | 2,538,760 | (1,125,432 | ) | 1,565,469 | |||||||||||||||||||||||||
| Menomonie, Wisconsin |
GRW | 451,520 | 2,398,446 | — | 382,220 | 451,520 | 2,780,666 | (1,180,959 | ) | 2,051,227 | ||||||||||||||||||||||||||
| Clarinda, Iowa |
GWB | 75,000 | 1,276,923 | — | 131,326 | 75,000 | 1,408,249 | (289,417 | ) | 1,193,832 | ||||||||||||||||||||||||||
| Billings, Montana |
GE MOA | 518,000 | 4,807,220 | — | 152,610 | 518,000 | 4,959,830 | (650,668 | ) | 4,827,162 | ||||||||||||||||||||||||||
| Boise, Idaho |
GE MOA | 612,000 | 5,709,976 | — | 111,510 | 612,000 | 5,821,486 | (725,391 | ) | 5,708,095 | ||||||||||||||||||||||||||
| Columbus, Georgia |
GE MOA | 441,000 | 4,173,299 | (223,155 | ) | (2,023,604 | ) | 217,845 | 2,149,695 | (199,866 | ) | 2,167,674 | ||||||||||||||||||||||||
| Terre Haute, Indiana |
GE MOA | 547,000 | 4,976,600 | — | 309,290 | 547,000 | 5,285,890 | (753,897 | ) | 5,078,993 | ||||||||||||||||||||||||||
| Green Bay, Wisconsin |
GE-GB | 570,000 | 2,784,052 | — | 78,583 | 570,000 | 2,862,635 | (341,280 | ) | 3,091,355 | ||||||||||||||||||||||||||
| Sleep Inn |
||||||||||||||||||||||||||||||||||||
| Omaha, Nebraska |
WF | 400,000 | 3,275,773 | — | 430,655 | 400,000 | 3,706,428 | (873,248 | ) | 3,233,180 | ||||||||||||||||||||||||||
| Louisville, Kentucky |
GE LSI | 350,000 | 1,288,002 | — | 496,723 | 350,000 | 1,784,725 | (323,336 | ) | 1,811,389 | ||||||||||||||||||||||||||
| Holiday Inn Express |
||||||||||||||||||||||||||||||||||||
| Harlan, Kentucky |
GRW | — | 2,949,276 | — | 864,177 | — | 3,813,453 | (1,585,313 | ) | 2,228,140 | ||||||||||||||||||||||||||
| Quality Inn |
||||||||||||||||||||||||||||||||||||
| Danville, Kentucky |
GRW | 155,717 | 2,971,403 | — | 804,560 | 155,717 | 3,775,963 | (1,678,407 | ) | 2,253,273 | ||||||||||||||||||||||||||
94
Table of Contents
Supertel Hospitality, Inc. and Subsidiaries
SCHEDULE III—REAL ESTATE AND ACCUMULATED DEPRECIATION—CONTINUED
As of December 31, 2010
| Initial Cost | Additions, (Dispositions), (Impairments), Subsequent to Acquisition |
Gross Amount at December 31, 2010 | ||||||||||||||||||||||||||||||||||
| Hotel and Location |
Encum- brance |
Land | Buildings
& Improvements |
Land | Buildings
& Improvements |
Land | Buildings
& Improvements |
Accumulated Depreciation |
Net Book Value |
|||||||||||||||||||||||||||
| Hampton Inn |
||||||||||||||||||||||||||||||||||||
| Cleveland, Tennessee |
GRW | 212,914 | 2,370,499 | — | 995,579 | 212,914 | 3,366,078 | (1,596,955 | ) | 1,982,037 | ||||||||||||||||||||||||||
| Shelby, North Carolina |
GRW | 253,921 | 2,782,042 | — | 1,117,839 | 253,921 | 3,899,881 | (1,978,660 | ) | 2,175,142 | ||||||||||||||||||||||||||
| Comfort Suites |
||||||||||||||||||||||||||||||||||||
| Dover, Delaware |
GRW | 337,113 | 5,179,187 | — | 114,107 | 337,113 | 5,293,294 | (2,094,882 | ) | 3,535,525 | ||||||||||||||||||||||||||
| Ft. Wayne, Indiana |
CITI | 1,200,000 | 4,803,605 | — | 749,026 | 1,200,000 | 5,552,631 | (1,629,752 | ) | 5,122,879 | ||||||||||||||||||||||||||
| Lafayette, Indiana |
CITI | 850,000 | 3,473,808 | — | 553,851 | 850,000 | 4,027,659 | (738,476 | ) | 4,139,183 | ||||||||||||||||||||||||||
| Marion, Indiana |
CITI | 430,000 | 1,945,383 | — | 381,855 | 430,000 | 2,327,238 | (784,680 | ) | 1,972,558 | ||||||||||||||||||||||||||
| South Bend, Indiana |
GE SB | 500,000 | 11,512,314 | — | 412,400 | 500,000 | 11,924,714 | (2,442,238 | ) | 9,982,476 | ||||||||||||||||||||||||||
| Warsaw, Indiana |
CITI | 650,000 | 2,500,570 | — | 241,727 | 650,000 | 2,742,297 | (796,386 | ) | 2,595,911 | ||||||||||||||||||||||||||
| Louisville, Kentucky |
GE 3CI | 500,000 | 2,186,715 | — | 759,430 | 500,000 | 2,946,145 | (516,215 | ) | 2,929,930 | ||||||||||||||||||||||||||
| Ramada Ltd |
||||||||||||||||||||||||||||||||||||
| Ellenton, Florida |
GRW | 546,945 | 2,293,464 | — | 923,613 | 546,945 | 3,217,077 | (1,556,429 | ) | 2,207,593 | ||||||||||||||||||||||||||
| Guest House Inn |
||||||||||||||||||||||||||||||||||||
| Ellenton, Florida |
GRW | 290,373 | 2,102,371 | — | 239,249 | 290,373 | 2,341,620 | (924,790 | ) | 1,707,203 | ||||||||||||||||||||||||||
| Jackson, Tennessee |
GRW | 261,506 | 3,430,541 | (69,292 | ) | (962,091 | ) | 192,214 | 2,468,450 | (1,096,325 | ) | 1,564,339 | ||||||||||||||||||||||||
| Tara Inn & Suites |
||||||||||||||||||||||||||||||||||||
| Jonesboro, Georgia |
GWB | 685,000 | 5,357,276 | (473,167 | ) | (3,401,147 | ) | 211,833 | 1,956,129 | (362,962 | ) | 1,805,000 | ||||||||||||||||||||||||
| Baymont Inn |
||||||||||||||||||||||||||||||||||||
| Brooks, Kentucky |
GE 3CI | 500,000 | 2,008,474 | (212,952 | ) | (552,349 | ) | 287,048 | 1,456,125 | (244,917 | ) | 1,498,256 | ||||||||||||||||||||||||
| Days Inn |
||||||||||||||||||||||||||||||||||||
| Farmville, Virginia |
GRW | 384,591 | 1,967,727 | — | 443,063 | 384,591 | 2,410,790 | (1,059,979 | ) | 1,735,402 | ||||||||||||||||||||||||||
| Alexandria, Virginia |
WF BMI | 2,500,000 | 6,544,271 | — | 1,613,579 | 2,500,000 | 8,157,850 | (1,262,202 | ) | 9,395,648 | ||||||||||||||||||||||||||
| Fredericksburg South, Virginia |
WF BMI | 1,510,000 | 1,786,979 | (455,900 | ) | 248,117 | 1,054,100 | 2,035,096 | (429,196 | ) | 2,660,000 | |||||||||||||||||||||||||
| Shreveport, Louisiania |
WF BMI | 1,250,000 | 2,964,484 | — | 1,203,220 | 1,250,000 | 4,167,704 | (775,625 | ) | 4,642,079 | ||||||||||||||||||||||||||
| Bossier City, Louisiania |
WF | 1,025,000 | 5,117,686 | — | 1,313,255 | 1,025,000 | 6,430,941 | (1,039,513 | ) | 6,416,428 | ||||||||||||||||||||||||||
| Fredericksburg North, Virginia |
WF | 650,000 | 3,142,312 | (204,499 | ) | (105,624 | ) | 445,501 | 3,036,688 | (632,189 | ) | 2,850,000 | ||||||||||||||||||||||||
| Ashland, Kentucky |
GE 2DI | 320,000 | 1,303,003 | — | 404,692 | 320,000 | 1,707,695 | (302,505 | ) | 1,725,190 | ||||||||||||||||||||||||||
| Glasgow, Kentucky |
GE 2DI | 425,000 | 2,206,805 | — | 158,137 | 425,000 | 2,364,942 | (294,020 | ) | 2,495,922 | ||||||||||||||||||||||||||
| Sioux Falls, Airport |
GE SF | — | 2,397,714 | — | 201,551 | — | 2,599,265 | (356,147 | ) | 2,243,118 | ||||||||||||||||||||||||||
| Sioux Falls, Empire |
GE SF | 480,000 | 1,988,692 | — | 220,026 | 480,000 | 2,208,718 | (312,691 | ) | 2,376,027 | ||||||||||||||||||||||||||
95
Table of Contents
Supertel Hospitality, Inc. and Subsidiaries
SCHEDULE III—REAL ESTATE AND ACCUMULATED DEPRECIATION—CONTINUED
As of December 31, 2010
| Initial Cost | Additions, (Dispositions), (Impairments), Subsequent to Acquisition |
Gross Amount at December 31, 2010 | ||||||||||||||||||||||||||||||||||
| Hotel and Location |
Encum- brance |
Land | Buildings
& Improvements |
Land | Buildings
& Improvements |
Land | Buildings
& Improvements |
Accumulated Depreciation |
Net Book Value |
|||||||||||||||||||||||||||
| Extended Stay-Savannah Suites |
||||||||||||||||||||||||||||||||||||
| Atlanta, Georgia |
GE PINE* | 1,865,000 | 3,997,960 | (981,833 | ) | (1,865,688 | ) | 883,167 | 2,132,272 | (296,128 | ) | 2,719,311 | ||||||||||||||||||||||||
| Augusta, Georgia |
GE SS | 750,000 | 3,816,246 | — | 201,719 | 750,000 | 4,017,965 | (662,493 | ) | 4,105,472 | ||||||||||||||||||||||||||
| Chamblee, Georgia |
GE SS | 1,650,000 | 3,563,648 | — | 110,459 | 1,650,000 | 3,674,107 | (647,895 | ) | 4,676,212 | ||||||||||||||||||||||||||
| Greenville, South Carolina |
GE SS | 550,000 | 3,408,375 | (255,316 | ) | (1,563,465 | ) | 294,684 | 1,844,910 | (228,770 | ) | 1,910,824 | ||||||||||||||||||||||||
| Jonesboro, Georgia |
GE SS | 875,000 | 2,978,463 | (394,903 | ) | (1,298,804 | ) | 480,097 | 1,679,659 | (191,199 | ) | 1,968,557 | ||||||||||||||||||||||||
| Savannah, Georgia |
GE SS | 1,250,000 | 4,052,678 | — | 106,967 | 1,250,000 | 4,159,645 | (575,253 | ) | 4,834,392 | ||||||||||||||||||||||||||
| Stone Mountain, Georgia |
GE SS | 725,000 | 3,840,600 | — | 118,101 | 725,000 | 3,958,701 | (643,145 | ) | 4,040,556 | ||||||||||||||||||||||||||
| Supertel Inn |
||||||||||||||||||||||||||||||||||||
| Creston, Iowa |
GWB | 234,866 | 2,708,224 | — | 11,543 | 234,866 | 2,719,767 | (605,819 | ) | 2,348,814 | ||||||||||||||||||||||||||
| Key West Inns |
||||||||||||||||||||||||||||||||||||
| Key Largo, Florida |
GRW | 339,425 | 3,238,530 | — | 1,312,866 | 339,425 | 4,551,396 | (1,843,065 | ) | 3,047,756 | ||||||||||||||||||||||||||
| Masters |
||||||||||||||||||||||||||||||||||||
| Columbia-I26, South Carolina |
GE Masters | 450,000 | 1,395,861 | (103,319 | ) | (164,000 | ) | 346,681 | 1,231,861 | (178,542 | ) | 1,400,000 | ||||||||||||||||||||||||
| Columbia-Knox Abbot Dr, South Carolina |
GE Masters | — | 1,474,612 | — | 41,659 | — | 1,516,271 | (258,771 | ) | 1,257,500 | ||||||||||||||||||||||||||
| Charleston North, South Carolina |
GE Masters | 700,000 | 2,895,079 | (277,204 | ) | (854,929 | ) | 422,796 | 2,040,150 | (302,945 | ) | 2,160,001 | ||||||||||||||||||||||||
| Doraville, Georgia |
GE Masters | 420,000 | 1,523,435 | (216,610 | ) | (590,442 | ) | 203,390 | 932,993 | (163,883 | ) | 972,500 | ||||||||||||||||||||||||
| Garden City, Georgia |
GE Masters | 570,000 | 2,443,603 | (254,039 | ) | (813,358 | ) | 315,961 | 1,630,245 | (261,206 | ) | 1,685,000 | ||||||||||||||||||||||||
| Marietta, Georgia |
GE Masters | 400,000 | 1,836,260 | (167,531 | ) | (570,242 | ) | 232,469 | 1,266,018 | (193,487 | ) | 1,305,000 | ||||||||||||||||||||||||
| Mt Pleasant, South Carolina |
GE Masters | 725,000 | 5,112,136 | (266,578 | ) | (1,613,071 | ) | 458,422 | 3,499,065 | (419,987 | ) | 3,537,500 | ||||||||||||||||||||||||
| Tampa East, Florida |
GE Masters | 192,416 | 3,413,132 | (123,228 | ) | (2,100,002 | ) | 69,188 | 1,313,130 | (314,817 | ) | 1,067,501 | ||||||||||||||||||||||||
| Tampa Fairgrounds, Florida |
GE Masters | 580,000 | 3,018,614 | (263,045 | ) | (1,131,236 | ) | 316,955 | 1,887,378 | (281,833 | ) | 1,922,500 | ||||||||||||||||||||||||
| Tucker, Georgia |
GE Masters | 510,000 | 2,699,751 | (145,378 | ) | (603,143 | ) | 364,622 | 2,096,608 | (252,511 | ) | 2,208,719 | ||||||||||||||||||||||||
| Tuscaloosa Alabama |
GE Masters | 740,000 | 4,025,844 | (284,238 | ) | (1,252,697 | ) | 455,762 | 2,773,147 | (356,409 | ) | 2,872,500 | ||||||||||||||||||||||||
| Subtotal Hotel Properties |
48,749,902 | 263,458,905 | (4,891,141 | ) | 28,408,202 | 43,858,761 | 291,867,107 | (96,619,207 | ) | 239,106,661 | ||||||||||||||||||||||||||
| Construction in Progress |
— | — | — | 331,642 | — | 331,642 | 331,642 | |||||||||||||||||||||||||||||
| Office building |
EVB | 68,765 | 1,516,627 | — | 737,290 | 68,765 | 2,253,917 | (1,526,819 | ) | 795,863 | ||||||||||||||||||||||||||
| Total |
$ | 48,818,667 | $ | 264,975,532 | $ | (4,891,141 | ) | $ | 29,477,134 | $ | 43,927,526 | $ | 294,452,666 | $ | (98,146,026 | ) | $ | 240,234,166 | ||||||||||||||||||
| * | Atlanta Land includes value of land lease |
96
Table of Contents
Supertel Hospitality, Inc. and Subsidiaries
SCHEDULE III – REAL ESTATE AND ACCUMULATED DEPRECIATION—CONTINUED
As of December 31, 2010
Encumbrance codes refer to the following lenders:
| GRW | Greenwich Capital Loan | EVB | Elkhorn Valley Bank | |||
| GWB | Great Western Bank | CITI | Citigroup Global Markets Realty | |||
| GE SB | GE Capital Franchise Finance | WF | Wells Fargo Bank | |||
| GE SS | GE Capital Corporation | WF BMI | Wells Fargo Bank | |||
| GE Pine | GE Capital Corporation | GE MOA | GE Capital Corporation | |||
| GE Masters | GE Capital Corporation | GE SF | GE Capital Corporation | |||
| GE GB | GE Capital Corporation | GE 3CI | GE Capital Corporation | |||
| GE LSI | GE Capital Corporation | GE 2 DI | GE Capital Corporation | |||
97
Table of Contents
Supertel Hospitality, Inc. and Subsidiaries
NOTES TO SCHEDULE III—REAL ESTATE AND ACCUMULATED DEPRECIATION
AS OF DECEMBER 31, 2010
| ASSET BASIS |
Total | |||||
| (a) | Balance at January 1, 2008 | $ | 376,239,780 | |||
| Additions to buildings and improvements | $ | 34,157,694 | ||||
| Disposition of buildings and improvements | (9,275,478 | ) | ||||
| Impairment loss | (250,000 | ) | ||||
| Balance at December 31, 2008 | $ | 400,871,996 | ||||
| Additions to buildings and improvements | $ | 4,485,009 | ||||
| Disposition of buildings and improvements | (18,942,418 | ) | ||||
| Impairment loss | (26,722,187 | ) | ||||
| Balance at December 31, 2009 | $ | 359,692,400 | ||||
| Additions to buildings and improvements | $ | 4,344,356 | ||||
| Disposition of buildings and improvements | (17,101,252 | ) | ||||
| Impairment loss | (8,555,306 | ) | ||||
| Balance at December 31, 2010 | $ | 338,380,198 | ||||
| ACCUMULATED DEPRECIATION |
Total | |||||
| (b) | Balance at January 1, 2008 | $ | 75,295,053 | |||
| Depreciation for the period ended December 31, 2008 | $ | 14,979,630 | ||||
| Depreciation on assets sold or disposed | (3,283,741 | ) | ||||
| Balance at December 31, 2008 | $ | 86,990,942 | ||||
| Depreciation for the period ended December 31, 2009 | $ | 14,242,727 | ||||
| Depreciation on assets sold or disposed | (4,697,660 | ) | ||||
| Impairment loss | (2,574,353 | ) | ||||
| Balance at December 31, 2009 | $ | 93,961,656 | ||||
| Depreciation for the period ended December 31, 2010 | $ | 11,710,060 | ||||
| Depreciation on assets sold or disposed | (7,168,962 | ) | ||||
| Impairment loss | (356,732 | ) | ||||
| Balance at December 31, 2010 | $ | 98,146,022 | ||||
| (c) | The aggregate cost of land, buildings, furniture and equipment for Federal income tax purposes is approximately $370 million. |
| (d) | Depreciation is computed based upon the following useful lives: |
Buildings and improvements 15 - 40 years
Furniture and equipment 3 - 12 years
| (e) | The Company has mortgages payable on the properties as noted. Additional mortgage information can be found in Note 6 to the consolidated financial statements. |
98
Table of Contents
| Item 9. | Changes in and Disagreements with Accountants on Accounting and Financial Disclosure |
None.
| Item 9A. | Controls and Procedures |
Evaluation was performed under the supervision of management, with the participation of our Chief Executive Officer and Chief Financial Officer, of the effectiveness of the design and operation of our disclosure controls and procedures as defined in Rule 13a-15 of the rules promulgated under the Securities and Exchange Act of 1934, as amended. Based on that evaluation, the Chief Executive Officer and Chief Financial Officer have concluded that as of the end of the period covered by this report, the Company’s disclosure controls and procedures were effective to provide reasonable assurance that information required to be disclosed by the Company in the reports the Company files or submits under the Securities Exchange Act of 1934 was (1) accumulated and communicated to management, including the Company’s Chief Executive Officer and Chief Financial Officer, to allow timely decisions regarding required disclosures and (2) recorded, processed, summarized and reported, within the time periods specified in the Commission’s rules and forms. No changes in the Company’s internal controls over financial reporting occurred during the last fiscal quarter covered by this report that have materially affected, or are reasonably likely to materially affect, the Company’s internal control over financial reporting.
Management’s Report On Internal Control Over Financial Reporting
The Company’s management is responsible for establishing and maintaining adequate internal control over financial reporting as such term is defined in Securities Exchange Act Rule 13a-15(f). The Company carried out an evaluation under the supervision and with the participation of the Company’s management, including the Company’s Chief Executive Officer and Chief Financial Officer, of the effectiveness of the Company’s internal control over financial reporting. The Company’s management used the framework in Internal Control—Integrated Framework issued by the Committee of Sponsoring Organizations (COSO) to perform this evaluation. Based on that evaluation, the Company’s management concluded that the Company’s internal control over financial reporting was effective as of December 31, 2010.
This annual report does not include an attestation report of our registered public accounting firm regarding internal control over financial reporting. Internal control over financial reporting was not subject to attestation by our registered public accounting firm pursuant to rules of the Securities and Exchange Commission that permit us to provide only management’s report in this annual report.
| Item 9B. | Other Information |
Because this Annual Report on Form 10-K is being filed within four business days after the applicable triggering events, the information below is being disclosed under this Item 9B instead of under Item 1.01 (Entry into a Material Definitive Agreement) of Form 8-K.
The Company received a waiver for non-compliance with a financial covenant with Great Western Bank on March 10, 2011, and the Company’s loans with Great Western Bank were further amended on March 15, 2011, as described in, and incorporated herein by reference from, Item 7 of this Annual Report on Form 10-K under “Management’s Discussion and Analysis of Financial Condition and Results of Operations—Liquidity and Capital Resources.”
99
Table of Contents
| Item 10. | Directors, Executive Officers and Corporate Governance |
Information concerning the directors and executive officers of the Company is incorporated by reference from information relating to executive officers of the Company set forth in Part I of this Form 10-K and to the Company’s Proxy Statement for the 2011 Annual Meeting of Stockholders (the “2011 Proxy Statement”) under the captions “Corporate Governance” and “Election of Directors.”
The Company has adopted a Code of Business Conduct and Ethics that applies to the Company’s Chief Executive Officer and Chief Financial Officer and has posted the Code of Business Conduct and Ethics on its Web site. The Company intends to satisfy the disclosure requirement under Item 10 of Form 8-K relating to amendments to or waivers from any provision of the Code of Business Conduct and Ethics applicable to the Company’s Chief Executive Officer and Chief Financial Officer by posting that information on the Company’s Web site at www.supertelinc.com.
| Item 11. | Executive Compensation |
Information regarding executive and director compensation is incorporated by reference to the 2011 Proxy Statement under the captions “Compensation Discussion and Analysis,” “Compensation Committee Report,” “Summary Compensation Table,” “Grants of Plan-Based Awards,” “Outstanding Equity Awards at Fiscal Year-end,” and “Director Compensation.”
| Item 12. | Security Ownership of Certain Beneficial Owners and Management and Related Stockholder Matters |
Information regarding the stock ownership of each person known to the Company to be the beneficial owner of more than 5% of the Common Stock, of each director and executive officer of Supertel Hospitality, Inc., and all directors and executive officers as a group, is incorporated by reference to the 2011 Proxy Statement under the caption “Ownership of the Company’s Common Stock By Management and Certain Beneficial Owners.”
Equity Compensation Plan Information
The following table provides information about the Company’s common stock that may be issued upon exercise of options, warrants and rights under existing equity compensation plans as of December 31, 2010.
| Plan category |
Number of securities to be issued upon exercise of outstanding options, warrants and rights (a) |
Weighted-average exercise price of outstanding options, warrants and rights (b) |
Number of securities remaining available for future issuance under equity compensation (including securities plans reflected in column(a)) (c) |
|||||||||
| Equity compensation plans approved by security holders |
255,143 | $ | 2.87 | 42,000 | ||||||||
| Equity compensation plans not approved by security holders |
— | — | — | |||||||||
| Total |
255,143 | $ | 2.87 | 42,000 | ||||||||
| Item 13. | Certain Relationships and Related Transactions, and Director Independence |
100
Table of Contents
The information required by this item is incorporated by reference to the 2011 Proxy Statement under the caption “Corporate Governance.”
| Item 14. | Principal Accountant Fees and Services |
The information required by this item is incorporated by reference to the 2011 Proxy Statement under the caption “Independent Public Registered Accounting Firm.”
| Item 15. | Exhibits and Financial Statement Schedules |
(a) Financial Statements and Schedules.
Exhibits.
| 3.1(b) | Second Amended and Restated Articles of Incorporation of the Company, as amended (incorporated herein by reference to Exhibit 3.1 to the Company’s Quarterly Report on Form 10-Q for the quarter ended June 30, 2008). | |
| 3.2 | Bylaws of the Company (incorporated herein by reference to Exhibit 3.1 to the Company’s Current Report on Form 8-K dated December 6, 2007). | |
| 10.1* | Third Amended and Restated Agreement of Limited Partnership of Supertel Limited Partnership, as amended. | |
| 10.2 | Form of Master Lease Agreement made as of January 1, 2002 by and between Supertel Limited Partnership, E&P Financing Limited Partnership, Solomons Beacon Inn Limited Partnership and TRS Leasing, Inc. (incorporated herein by reference to Exhibit 10.2 to the Company’s Annual Report on Form 10-K for the year ended December 31, 2006). | |
| 10.3 | Loan Agreement dated as of November 26, 2002 by and among Solomons Beacon Inn Limited Partnership, TRS Subsidiary, LLC and Greenwich Capital Financial Products, Inc. (incorporated herein by reference to Exhibit 10.3 to the Company’s Annual Report on Form 10-K for the year ended December 31, 2007). | |
| 10.4 | Promissory Note dated as of November 26, 2002 between Solomons Beacon Inn Limited Partnership, TRS Subsidiary, LLC and Greenwich Capital Financial Products, Inc. (incorporated herein by reference to Exhibit 10.4 to the Company’s Annual Report on Form 10-K for the year ended December 31, 2007). | |
| 10.5 | Guaranty of Recourse Obligations dated as of November 26, 2002 made by the Company in favor of Greenwich Capital Financial Products, Inc. (incorporated herein by reference to Exhibit 10.5 to the Company’s Annual Report on Form 10-K for the year ended December 31, 2007). | |
101
Table of Contents
| 10.6 | Pledge and Security Agreement dated as of November 26, 2002 by the Company, Supertel Limited Partnership, TRS Leasing, Inc. and Solomons GP, LLC, for the benefit of Greenwich Capital Financial Products, Inc. (incorporated herein by reference to Exhibit 10.6 to the Company’s Annual Report on Form 10-K for the year ended December 31, 2007). | |
| 10.7 | Master Lease Agreement dated as of November 26, 2002 between Solomons Beacon Inn Limited Partnership and TRS Subsidiary, LLC. (incorporated herein by reference to Exhibit 10.7 to the Company’s Annual Report on Form 10-K for the year ended December 31, 2007). | |
| 10.8 | First Amended and Restated Master Lease Agreement dated as of November 26, 2002 between Supertel Limited Partnership, E&P Financing Limited Partnership, TRS Leasing, Inc. and Solomons Beacon Inn Limited Partnership. (incorporated herein by reference to Exhibit 10.8 to the Company’s Annual Report on Form 10-K for the year ended December 31, 2007). | |
| 10.9 | Hotel Management Agreement dated as of August 1, 2004 between TRS Leasing, Inc., TRS Subsidiary, LLC and Royco Hotels, Inc. (incorporated herein by reference to Exhibit 10.9 to the Company’s Annual Report on Form 10-K for the year ended December 31, 2009). | |
| 10.10 | Amendment dated January 1, 2007 to Hotel Management Agreement dated August 1, 2004 by and between Royco Hotels, Inc., TRS Leasing, Inc., TRS Subsidiary, LLC and SPPR TRS Subsidiary, LLC (incorporated herein by reference to Exhibit 10.1 to the Company’s Current Report on Form 8-K dated January 1, 2007). | |
| 10.11 | Management Agreement dated May 16, 2007 between TRS Leasing, Inc. and HLC Hotels, Inc. (incorporated herein by reference to Exhibit 10.1 to the Company’s Current Report on Form 8-K dated May 16, 2007). | |
| 10.12 | Amendment to Management Agreement dated July 15, 2008 between TRS Leasing, Inc. and HLC Hotels, Inc. (incorporated herein by reference to Exhibit 10.1 to the Company’s Quarterly Report on Form 10-Q for the quarter ended June 30, 2008). | |
| 10.13 | Amended and Restated Loan Agreement dated December 3, 2008 by and between the Company and Great Western Bank (incorporated herein by reference to Exhibit 10.1 to the Company’s Current Report on Form 8-K dated December 3, 2008). | |
| 10.14 | First Amendment dated February 4, 2009 between the Company and Great Western Bank (incorporated by reference to Exhibit 10.1 to the Company’s Form 10-Q for the quarter ended March 31, 2009). | |
| 10.15 | Second Amendment to Amended and Restated Loan Agreement dated as of March 29, 2010 by and between the Company and Great Western Bank (incorporated herein by reference to Exhibit 10.1 to the Company’s Quarterly Report on Form 10-Q for the quarter ended March 31, 2010). | |
| 10.16 | Promissory Notes, Loan Agreement and form of Deed to Secure Debt, Assignment of Rents and Leases, Security Agreement and Fixture Filing dated August 18, 2006 by Supertel Limited Partnership to and for the benefit of General Electric Capital Corporation (incorporated herein by reference to Exhibit 10.1 to the Company’s Current Report on Form 8-K dated August 17, 2006). | |
| 10.17 | Unconditional Guaranty of Payment and Performance dated August 18, 2006 by the Company to and for the benefit of General Electric Capital Corporation (incorporated herein by reference to Exhibit 10.2 to the Company’s Current Report on Form 8-K dated August 17, 2006). | |
| 10.18 | Amendment No. 1 to the Promissory Note dated August 18, 2006 by Supertel Limited Partnership to and for the benefit of General Electric Capital Corporation (incorporated herein by reference to Exhibit 10.1 to the Company’s Current Report on Form 8-K dated May 1, 2008). | |
102
Table of Contents
| 10.19 | Promissory Note, Loan Agreement and form of Mortgage, Assignment of Rents and Leases, Security Agreement and Fixture Filing dated January 5, 2007 by Supertel Limited Partnership to and for the benefit of General Electric Capital Corporation (incorporated herein by reference to Exhibit 10.2 to the Company’s Current Report on Form 8-K dated January 5, 2007). | |
| 10.20 | Amendment No. 1 to the Promissory Note dated January 5, 2007 by Supertel Limited Partnership to and for the benefit of General Electric Capital Corporation (incorporated herein by reference to Exhibit 10.2 to the Company’s Current Report on Form 8-K dated May 1, 2008). | |
| 10.21 | Promissory Notes, Loan Agreement and form of Deed to Secure Debt, Assignment of Rents and Leases, Security Agreement and Fixture Filing dated May 16, 2007 by Supertel Limited Partnership to and for the benefit of General Electric Capital Corporation (incorporated herein by reference to Exhibit 10.2 to the Company’s Current Report on Form 8-K dated May 16, 2007). | |
| 10.22 | Unconditional Guaranty of Payment and Performance dated May 16, 2007 by the Company to and for the benefit of General Electric Capital Corporation (incorporated herein by reference to Exhibit 10.3 to the Company’s Current Report on Form 8-K dated May 16, 2007). | |
| 10.23 | Amendment No. 1 to the Promissory Note dated May 16, 2007 by Supertel Limited Partnership to and for the benefit of General Electric Capital Corporation (incorporated herein by reference to Exhibit 10.4 to the Company’s Current Report on Form 8-K dated May 1, 2008). | |
| 10.24 | Loan Modification Agreements dated as of September 30, 2009 by and between General Electric Capital Corporation, the Company, Supertel Limited Partnership, Supertel Hospitality REIT Trust and SPPR-South Bend, LLC, (incorporated herein by reference to Exhibits 10.1 and 10.2 to the Company’s Quarterly Report on Form 10-Q for the quarter ended September 30, 2009). | |
| 10.25 | Covenant Waiver dated as of November 9, 2009 by General Electric Capital Corporation to the Company, Supertel Limited Partnership, Supertel Hospitality REIT Trust and SPPR-South Bend, LLC. (incorporated herein by reference to Exhibit 10.24 to the Company’s Annual Report on Form10-K for the year ended December 31, 2009). | |
| 10.26 | Loan Modification Agreement dated as of March 25, 2010 by and between General Electric Capital Corporation, Supertel Limited Partnership, SPPR-South Bend, LLC, Supertel Hospitality REIT Trust and the Company (incorporated herein by reference to Exhibit 10.2 to the Company’s Quarterly Report on Form 10-Q for the quarter ended March 31, 2010). | |
| 10.27 | Unconditional Guaranties of Payment and Performance dated March 16, 2009, by the Company and Supertel Hospitality REIT Trust to and for the benefit of General Electric Capital Corporation (incorporated herein by reference to Exhibit 10.3 to the Company’s Quarterly Report on Form 10-Q for the quarter ended March 31, 2009). | |
| 10.28 | Global Amendment and Consent dated March 16, 2009 between Supertel Limited Partnership, SPPR-South Bend, LLC and General Electric Capital Corporation (incorporated herein by reference to Exhibit 10.2 to the Company’s Quarterly Report on Form 10-Q for the quarter ended March 31, 2009). | |
| 10.29 | Standby Equity Distribution Agreement dated as of March 26, 2010 between YA Global Master SPV Ltd. and the Company (incorporated herein by reference to Exhibit 10.1 to the Company’s Current Report on Form 8-K dated March 26, 2010). | |
| 10.30* | Employment Agreement dated as of September 1, 2005 by and between the Company and Don Heimes. | |
| 10.31 | The Company’s 2006 Stock Plan (incorporated herein by reference to Exhibit 10.1 to the Company’s Quarterly Report on Form 10-Q for the quarter ended March 31, 2006). | |
103
Table of Contents
| 10.32 | Form of Stock Option Agreement (incorporated herein by reference to Exhibit 10.1 to the Company’s Quarterly Report on Form 10-Q for the quarter ended June 30, 2006). | |
| 10.33 | Amendment dated May 28, 2009, to the Company’s 2006 Stock Plan (incorporated herein by reference to Exhibit 10.1 to the Company’s Current Report on Form 8-K dated May 28, 2009). | |
| 10.34 | Employment Agreement of Kelly Walters, dated November 17, 2009 (incorporated herein by reference to Exhibit 10.1 to the Company’s Current Report on Form 8-K dated November 17, 2009). | |
| 10.35 | Employment Agreement of Steven C. Gilbert, dated November 17, 2009 (incorporated herein by reference to Exhibit 10.2 to the Company’s Current Report on Form 8-K dated November 17, 2009). | |
| 10.36 | Employment Agreement of Corrine L. Scarpello, dated November 17, 2009 (incorporated herein by reference to Exhibit 10.3 to the Company’s Current Report on Form 8-K dated November 17, 2009). | |
| 10.37 | Employment Agreement of David L. Walter dated November 17, 2009 (incorporated herein by reference to Exhibit 10.4 to the Company’s Current Report on Form 8-K dated November 17, 2009). | |
| 10.38 | Director and Named Executive Officers Compensation is incorporated herein by reference to the sections entitled “Compensation Discussion and Analysis”, “Compensation Committee Report”, “Summary Compensation Table”, “Grants of Plan-Based Awards for Fiscal Year 2009”, “Outstanding Equity Awards at Fiscal Year-End”, and “Director Compensation” in the Company’s Proxy Statement for the Annual Meeting of Stockholders on May 26, 2011. | |
| 21.0* | Subsidiaries. | |
| 23.1* | Consent of KPMG LLP. | |
| 31.1* | Section 302 Certification of Chief Executive Officer. | |
| 31.2* | Section 302 Certification of Chief Financial Officer. | |
| 32.1* | Section 906 Certifications. | |
Pursuant to Item 601 (b)(4) of Regulation S-K, certain instruments with respect to the Company’s long-term debt are not filed with this Form 10-K. The Company will furnish a copy of any such long-term debt agreement to the Securities and Exchange Commission upon request.
Management contracts and compensatory plans are set forth as Exhibits 10.30 through 10.38.
| * | Filed herewith. |
104
Table of Contents
SIGNATURES
Pursuant to the requirements of Section 13 or 15(d) of the Securities Exchange Act of 1934, the registrant has duly caused this report to be signed on its behalf by the undersigned, thereunto duly authorized.
| SUPERTEL HOSPITALITY, INC. | ||||
| By: | /S/ KELLY A. WALTERS | |||
| March 16, 2011 |
Kelly A. Walters | |||
| President and Chief Executive Officer | ||||
Pursuant to the requirements of the Securities Exchange Act of 1934, this report has been signed below by the following persons on behalf of the registrant and in the capacities indicated and on the date indicated above.
| By: |
/S/ KELLY A. WALTERS |
By: | /S/ JEFFREY M. ZWERDLING | |||
| Kelly A. Walters President and Chief Executive Officer (principal executive officer) |
Jeffrey M. Zwerdling Director | |||||
| By: |
/S/ CORRINE L. SCARPELLO |
By: | /S/ ALLEN L. DAYTON | |||
| Corrine L. Scarpello Chief Financial Officer and Corporate Secretary (principal financial and accounting officer) |
Allen L. Dayton Director | |||||
| By: |
/S/ WILLIAM C. LATHAM |
By: | /S/ GEORGE R. WHITTEMORE | |||
| William C. Latham Chairman of the Board |
George R. Whittemore Director | |||||
| By: |
/S/ KELLY A. WALTERS |
By: | /S/ PATRICK J. JUNG | |||
| Kelly A. Walters Director |
Patrick J. Jung Director | |||||
| By: |
/S/ STEVE H. BORGMANN |
By: | /S/ RICHARD A. FRANDEEN | |||
| Steve H. Borgmann Director |
Richard A. Frandeen Director | |||||
| By: |
/S/ PAUL J. SCHULTE |
|||||
| Paul J. Schulte Director |
||||||
105