Attached files
| file | filename |
|---|---|
| EX-99.1 - EX-99.1 - Black Creek Diversified Property Fund Inc. | dpf-20200930ex991389d2b.htm |
| 8-K - 8-K - Black Creek Diversified Property Fund Inc. | dpf-20200930x8k.htm |
Exhibit 99.2
October 15, 2020
Dear Valued Shareholders,
Given continued disruptions of COVID-19 (COVID) throughout the global economy and commercial real estate, we want to provide you with an update regarding Black Creek Diversified Property Fund (DPF) as of the end 3Q2020. Despite the uncertainty that still exists around us, we are pleased with the performance of our fund over the past quarter and throughout 2020.
DPF’s total return for the quarter ending September 30, 2020 was 1.54%, comprised of quarterly distributions totaling $0.09375 per share, which equate to an annualized yield of 4.98%1. NAV per share increased from $7.50 as of the end of 2Q2020 to $7.522. Our trailing one-year total return is 7.58% and our annualized return since NAV inception3 is 6.66%, with less volatility than stock and bond markets4.
The primary driver of our positive 3Q2020 performance was the continued resilience of income being generated from our portfolio. In addition, positive leasing activity and other market factors led to appreciation at certain properties, which was partially offset by tapered leasing and market rent growth expectations at other properties in light of continued market impacts from COVID, thus highlighting the benefits of a diversified investment strategy.
Our rent collections throughout the third quarter have increased from prior periods and continue to exceed broader sector averages5 which reflects the defensive nature of our assets and stability of income in the face of an economic crisis. Importantly, our most meaningful increase in collections was associated with our retail portfolio, from 86.3% in 2Q2020 to 94.9% in 3Q2020, before factoring in rent deferral agreements (or to 98.4% including retail rent deferral agreements). This is largely driven by the fact that all of our retail tenants are now open for business again, with increasing traffic counts at our properties, resulting in a dramatic drop in rent deferral requests that we received in 3Q 2020. A detailed summary of our third quarter rent collections and other summary statistics are shown below.
3Q2020 Collection Data | |
Rent Collections Before Forbearance6 | |
Office | 98.9% |
Retail | 94.9% |
Industrial | 97.8% |
Multifamily | 98.3% |
Total | 97.2% |
Rent Collections After Forbearance7 | |
Total | 98.7% |
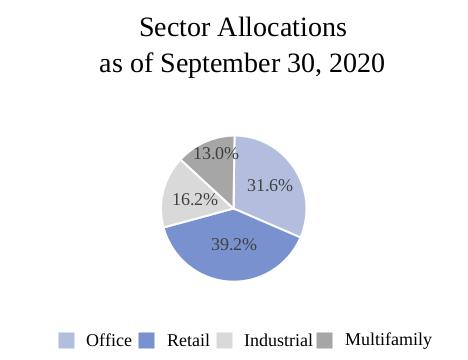
DPF remains an active buyer of institutional quality, income-producing and defensive real estate, particularly within the industrial and multifamily sectors which we believe should provide increased appreciation potential for the fund over time and complement our retail and office investment allocations that provide for higher income potential. Accordingly, in the third quarter we acquired a newly constructed, class A industrial building located in the San Francisco Bay Area for $48.5 million, increasing our industrial allocation from 11.0% as of December 31, 2019 to 16.2% as of September 30, 2020.
While the effects and duration of COVID are still uncertain, we continue to believe that our portfolio composition is well positioned to weather the pandemic. We maintain our conviction in our disciplined investment strategy, asset allocation and underlying tenant composition and as always, we appreciate the continued trust you have placed in DPF.
Sincerely,
The Black Creek Team
Forward-Looking Statements
This letter includes certain statements that are intended to be deemed “forward-looking statements” within the meaning of, and to be covered by the safe harbor provisions contained in, Section 27A of the Securities Act of 1933, as amended, and Section 21E of the Securities Exchange Act of 1934, as amended. Such forward-looking statements are generally identifiable by the use of the words “may,” “will,” “should,” “expect,” “anticipate,” “estimate,” “believe,” “intend,” “project,” “continue,” or other similar words or terms. These statements are based on certain assumptions and analyses made in light of our experience and our perception of historical trends, current conditions, expected future developments and other factors we believe are appropriate. Such statements are subject to a number of assumptions, risks and uncertainties that may cause our actual results, performance or achievements to be materially different from future results, performance or achievements expressed or implied by these forward-looking statements. Readers are cautioned not to place undue reliance on these forward-looking statements. Among the factors that may cause results to vary are the negative impact of COVID-19 on our financial condition and results of operations being more significant than expected, the negative impact of COVID-19 on our tenants being more significant than expected, general economic and business (particularly real estate and capital market) conditions being less favorable than expected, the business opportunities that may be presented to and pursued by us, changes in laws or regulations (including changes to laws governing the taxation of real estate investment trusts (“REITs”)), risk of acquisitions, availability and creditworthiness of prospective tenants, availability of capital (debt and equity), interest rate fluctuations, competition, supply and demand for properties in current and any proposed market areas in which we invest, our tenants’ ability and willingness to pay rent at current or increased levels, accounting principles, policies and guidelines applicable to REITs, environmental, regulatory and/or safety requirements, tenant bankruptcies and defaults, the availability and cost of comprehensive insurance, including coverage for terrorist acts, and other factors, many of which are beyond our control. For a further discussion of these factors and other risk factors that could lead to actual results materially different from those described in the forward-looking statements, see “Risk Factors” under Item 1A of Part 1 of DPF’s Annual Report on Form 10-K for the year ended December 31, 2019 and subsequent periodic and current reports filed with the SEC. We undertake no obligation to publicly update or revise any forward-looking statements, whether as a result of future events, new information or otherwise.
1 Represents annualized distribution rate for Class I shares. Annualized distribution rate for Class S shares is 4.13%, for Class T shares is 4.13%, for Class D shares is 4.73% and for Class E shares is 4.98%. Reflects the current quarter’s distribution annualized minus distribution fees annualized, if applicable, and divided by NAV. The amount of distributions DPF may make is uncertain and is not guaranteed.
2 See DPF’s Current Report on Form 8-K, filed with the SEC on October 15, 2020 for important additional information concerning the calculation of our NAV as of September 30, 2020.
3 NAV inception was September 30, 2012, which is when we first sold shares of our common stock after converting to an NAV-based REIT on July 12, 2012.
4 Total returns presented are based on the historical NAV and distributions per share of Class I shares. Performance varies by share class. For the quarter ended September 30, 2020, Class S shares (without sales load) returned 1.32%, Class S shares (with sales load) returned -2.11%, Class T shares (without sales load) returned 1.32%, Class T shares (with sales load) returned -2.11%, Class D shares returned 1.47%, and Class E shares returned 1.54%. During the same trailing one-year period, Class S shares (without sales load) returned 6.68%, Class S shares (with sales load) returned 3.07%, Class T shares (without sales load) returned 6.68%, Class T shares (with sales load) returned 3.07%, Class D shares returned 7.32%, and Class E shares returned 7.58%. During the same since NAV inception period, Class S shares (without sales load) returned 5.67% annualized, Class S shares (with sales load) returned 5.28% annualized, Class T shares (without sales load) returned 5.67% annualized, Class T shares (with sales load) returned 5.28% annualized, Class D shares returned 6.23% annualized, and Class E shares returned 6.72% annualized.
The historical returns since “NAV inception” show share performance since September 30, 2012, which is when DPF first sold Class A, W and I shares after converting to a NAV REIT on July 12, 2012. Subsequently, as a result of a share restructuring effective as of September 1, 2017, DPF’s outstanding Class A, W and I shares changed to Class T, Class D and a new version of Class I shares, respectively. DPF also created a new Class S share, with the same NAV per share and class-specific expenses as Class T shares. Accordingly, the presented returns of Class T and Class S shares reflect the performance of Class A shares since NAV inception through the restructuring date; the return of Class D shares shown reflects the performance of Class W shares since NAV inception through the restructuring date; and the return of the new version of Class I shares reflects the performance of the prior Class I shares since NAV inception through the restructuring date. In connection with the restructuring, DPF also revised its fee structure with its advisor and dealer manager and its NAV methodology, which will affect returns going forward. Please see DPF’s definitive proxy statement filed with the Securities and Exchange Commission on June 7, 2017, for more information about the fee changes and our pro forma estimates of how those fee changes would have affected returns on DPF shares in the years 2013-2016. Investors in DPF’s fixed price offerings prior to NAV inception on 09/30/12 are likely to have a lower return. Since NAV inception returns are annualized utilizing a compounding method consistent with the IPA Practice Guideline 2018.
The returns have been prepared using unaudited data and valuations of the underlying investments in DPF’s portfolio, which are estimates of fair value and form the basis for DPF’s NAV. Valuations based upon unaudited or estimated reports from the underlying investments may be subject to later adjustments or revisions, may not correspond to realized value and may not accurately reflect the price at which assets could be liquidated on any given day.
5 NAREIT REIT Industry September 2020 Rent Collections: https://www.reit.com/data-research/research/nareit-research/reit-industry-september-2020-rent-collections
6 Percentages reflect rent received through October 7, 2020.
7 Percentages reflect rent received or deferred across sectors through October 7, 2020 and after accounting for forbearance agreements that we chose to execute with many of our otherwise successful tenants, allowing them to defer certain rent until 2021.
8 Amount excludes our multi-family properties as the majority of leases at such properties expire within 12 months.
9 Calculated as outstanding principal balance of our borrowings less cash and cash equivalents, divided by the fair value of our real property and debt-related investments not associated with the DST Program (determined in accordance with our valuation procedures). Amounts represent balances as of September 30, 2020.