Attached files
UNITED
STATES
SECURITIES
AND EXCHANGE COMMISSION
WASHINGTON, D.C. 20549
FORM 10-K
| ☒ | ANNUAL REPORT PURSUANT TO SECTION 13 OR 15(d) OF THE SECURITIES EXCHANGE ACT OF 1934 |
FOR THE FISCAL YEAR ENDED DECEMBER 31, 2015
OR
| ☐ | TRANSITION REPORT PURSUANT TO SECTION 13 OR 15(d) OF THE SECURITIES EXCHANGE ACT OF 1934 |
Commission file number: 000-52596
Dividend Capital Diversified Property Fund Inc.
(Exact name of registrant as specified in its charter)
| Maryland | 30-0309068 |
|
(State or other jurisdiction of incorporation or organization) |
(I.R.S. Employer Identification No.) |
| 518 Seventeenth Street, 17th Floor, Denver, CO | 80202 |
| (Address of principal executive offices) | (Zip Code) |
(303) 228-2200
(Registrant’s telephone number, including area code)
Securities registered pursuant to Section 12(b) of the Act:
None
Securities registered pursuant to Section 12(g) of the Act:
Title of each class
Unclassified Shares of Common Stock, $0.01 par value
Class A Shares of Common Stock, $0.01 par value
Class W Shares of Common Stock, $0.01 par value
Class I Shares of Common Stock, $0.01 par value
Indicate by check mark if the registrant is a well-known seasoned issuer, as defined in Rule 405 of the Securities Act. Yes ☐ No ☒
Indicate by check mark if the registrant is not required to file reports pursuant to Section 13 or Section 15(d) of the Act. Yes ☐ No ☒
Indicate by check mark whether the registrant (1) has filed all reports required to be filed by Section 13 or 15(d) of the Securities Exchange Act of 1934 during the preceding 12 months (or for such shorter period that the registrant was required to file such reports), and (2) has been subject to such filing requirements for the past 90 days. Yes ☒ No ☐
Indicate by check mark whether the registrant has submitted electronically and posted on its corporate Web site, if any, every Interactive Data File required to be submitted and posted pursuant to Rule 405 of Regulation S-T (§232.405) during the preceding 12 months (or such shorter period that the registrant was required to submit and post such files). Yes ☒ No ☐
Indicate by check mark if disclosure of delinquent filers pursuant to Item 405 of Regulation S-K (§229.405 of this chapter) is not contained herein, and will not be contained, to the best of registrant’s knowledge, in definitive proxy or information statements incorporated by reference in Part III of this Form 10-K or any amendment to this Form 10-K. ☒
Indicate by check mark whether the registrant is a large accelerated filer, an accelerated filer, a non-accelerated filer, or a smaller reporting company. See the definitions of “large accelerated filer”, “accelerated filer” and “smaller reporting company” in Rule 12b-2 of the Exchange Act. (Check one):
| Large accelerated filer | ☐ | Accelerated filer | ☐ |
| Non-accelerated filer | ☒ (Do not check if a smaller reporting company) | Smaller reporting company | ☐ |
Indicate by check mark whether the registrant is a shell company (as defined in Rule 12b-2 of the Exchange Act). Yes ¨ No x
There is no established market for the Registrant’s shares of common stock. The Registrant publishes a daily net asset value (“NAV”), based on procedures and methodologies established by its board of directors, with an NAV on June 30, 2015, the last business day of the Registrant’s most recently completed second fiscal quarter, of $7.38 per share for its unclassified shares of common stock (referred to as “Class E” shares) and each of its Class A, Class W and Class I classes of common stock. As of December 31, 2015, the daily NAV was $7.47 per share for each of its Class E, Class A, Class W and Class I classes of common stock.
There were approximately 157,819,161 outstanding shares of Class E common stock, 1,362,971 outstanding shares of Class A common stock, 1,193,192 outstanding shares of Class W common stock, and 21,691,826 outstanding shares of Class I common stock, held by non-affiliates, as of June 30, 2015, the last business day of the Registrant’s most recently completed second fiscal quarter.
As of February 24, 2016, 137,328,662 shares of Class E common stock, 1,842,548 shares of Class A common stock, 2,051,615 shares of Class W common stock, and 23,204,899 shares of Class I common stock of the Registrant, each with a par value $0.01 per share, were outstanding.
DIVIDEND CAPITAL DIVERSIFIED PROPERTY FUND INC.
ANNUAL REPORT ON FORM 10-K
For the Year Ended December 31, 2015
TABLE OF CONTENTS
| - 1 - |
Cautionary Statement Regarding Forward-Looking Statements
This Annual Report on Form 10-K includes certain statements that may be deemed to be “forward-looking statements” within the meaning of Section 27A of the Securities Act of 1933, as amended, or the “Securities Act,” and Section 21E of the Securities Exchange Act of 1934, as amended, or the “Exchange Act.” Such forward-looking statements relate to, without limitation, our future capital expenditures, distributions and acquisitions (including the amount and nature thereof), other developments and trends of the real estate industry, business strategies, and the expansion and growth of our operations. These statements are based on certain assumptions and analyses made by us in light of our experience and our perception of historical trends, current conditions, expected future developments and other factors we believe are appropriate. We intend such forward-looking statements to be covered by the safe harbor provisions for forward-looking statements contained in Section 27A of the Securities Act and Section 21E of the Exchange Act. Such statements are subject to a number of assumptions, risks and uncertainties which may cause our actual results, performance or achievements to be materially different from future results, performance or achievements expressed or implied by these forward-looking statements. Forward-looking statements are generally identifiable by the use of the words “may,” “will,” “should,” “expect,” “anticipate,” “estimate,” “believe,” “intend,” “project,” “continue,” or the negative of these words, or other similar words or terms. Readers are cautioned not to place undue reliance on these forward-looking statements.
Some of the risks and uncertainties that may cause our actual results, performance or achievements to differ materially from those expressed or implied by forward-looking statements include, among others, the following:
| · | the impact of macroeconomic trends, such as the unemployment rate and availability of credit, which may have a negative effect on the following, among other things: |
| · | the fundamentals of our business, including overall market occupancy, tenant space utilization, and rental rates; |
| · | the financial condition of our tenants, some of which are financial, legal and other professional firms, our lenders, and institutions that hold our cash balances and short-term investments, which may expose us to increased risks of breach or default by these parties; and |
| · | the value of our real estate assets, which may limit our ability to dispose of assets at attractive prices or obtain or maintain debt financing secured by our properties or on an unsecured basis; |
| · | general risks affecting the real estate industry (including, without limitation, the inability to enter into or renew leases, dependence on tenants’ financial condition, and competition from other developers, owners and operators of real estate); |
| · | our ability to effectively raise and deploy proceeds from our ongoing public offering of Class A, Class W and Class I shares; |
| · | risks associated with the availability and terms of debt and equity financing and the use of debt to fund acquisitions and developments, including the risk associated with interest rates impacting the cost and/or availability of financing; |
| · | the business opportunities that may be presented to and pursued by us, changes in laws or regulations (including changes to laws governing the taxation of real estate investment trusts (“REITs”)); |
| · | conflicts of interest arising out of our relationships with Dividend Capital Total Advisors Group LLC (our “Sponsor”), Dividend Capital Total Advisors LLC (our “Advisor”), and their affiliates; |
| · | changes in accounting principles, policies and guidelines applicable to REITs; |
| · | environmental, regulatory and/or safety requirements; and |
| · | the availability and cost of comprehensive insurance, including coverage for terrorist acts. |
For further discussion of these and other factors, see “Item 1A. Risk Factors” in this Annual Report on Form 10-K. We undertake no obligation to publicly update or revise any forward-looking statements, whether as a result of future events, new information or otherwise.
| - 2 - |
| ITEM 1. | BUSINESS |
Overview
Dividend Capital Diversified Property Fund Inc. is a Maryland corporation formed on April 11, 2005 to invest in a diverse portfolio of real property and real estate-related investments. As used herein, “the Company,” “we,” “our” and “us” refer to Dividend Capital Diversified Property Fund Inc. and its consolidated subsidiaries and partnerships except where the context otherwise requires.
We believe we have operated in such a manner as to qualify as a real estate investment trust (“REIT”) for federal income tax purposes, commencing with the taxable year ended December 31, 2006, when we first elected REIT status. We utilize an Umbrella Partnership Real Estate Investment Trust (“UPREIT”) organizational structure to hold all or substantially all of our assets through our operating partnership, Dividend Capital Total Realty Operating Partnership, LP (our “Operating Partnership”). Furthermore, our Operating Partnership wholly owns a taxable REIT subsidiary, DCTRT Leasing Corp. (the “TRS”), through which we execute certain business transactions that might otherwise have an adverse impact on our status as a REIT if such business transactions were to occur directly or indirectly through our Operating Partnership.
Our Portfolio
We are currently invested in a diverse portfolio of real properties and, to a lesser extent, real estate-related debt investments. Our investment in real property consists of office, industrial, and retail properties located in the United States. As of December 31, 2015, our real property portfolio was approximately 90.1% leased. Additionally, we are invested in certain real estate-related debt investments, including originating and participating in mortgage loans secured by real estate (herein referred to as “debt related investments”).
As of December 31, 2015, we had total gross investments with an estimated fair value of approximately $2.4 billion (calculated in accordance with our valuation procedures), comprised of approximately $2.4 billion in gross investments in real property and approximately $15.7 million in net debt related investments.
As of December 31, 2015, we had four reportable operating segments: office property, industrial property, retail property and debt related investments. Operating results from our business segments are discussed further in “Item 7. Management’s Discussion and Analysis of Financial Condition and Results of Operations” and Note 13 to our financial statements beginning on page F-1 of this Annual Report on Form 10-K.
Whenever we refer to the “fair value” of our real estate investments in this Annual Report on Form 10-K, we are referring to the fair value as determined pursuant to our valuation procedures, unless stated otherwise.
Our Advisor
We are managed by our Advisor, which is wholly owned by our Sponsor. Our Advisor was formed as a Delaware limited liability company in April 2005. Subject to oversight by our board of directors, we rely on our Advisor to manage our day-to-day activities and to implement our investment strategy. In addition, subject to the oversight, review and approval of our board of directors, our Advisor undertakes to, among other things, research, identify, review and make investments in and dispositions of real property and real estate-related investments on our behalf consistent with our investment policies and objectives. Our Advisor performs its duties and responsibilities under an advisory agreement with us (the “Advisory Agreement”) as a fiduciary of ours and our stockholders. The term of the Advisory Agreement is for one year, subject to renewals by our board of directors for an unlimited number of successive one-year periods. The current term of the Advisory Agreement expires on June 30, 2016. Our officers and our two interested directors are all employees of an affiliate of our Advisor.
Our Offerings
On July 12, 2012, we commenced an ongoing public offering of up to $3,000,000,000 of our shares of common stock, of which $2,250,000,000 of shares were expected to be offered to the public in a primary offering and $750,000,000 of shares were expected to be offered to our stockholders pursuant to an amended and restated distribution reinvestment plan (subject to our right to reallocate such amounts) (the “Prior Offering”). We terminated the Prior Offering on September 15, 2015.
| - 3 - |
On September 16, 2015, we commenced a follow-on ongoing public offering of up to $1,000,000,000 of our shares of common stock, of which $750,000,000 of shares are expected to be offered to the public in a primary offering and $250,000,000 of shares are expected to be offered to stockholders of the Company pursuant to its distribution reinvestment plan (subject to the our right to reallocate such amounts) (the “Follow-On Offering”). In the Follow-On Offering, we are offering to the public three classes of shares: Class A shares, Class W shares and Class I shares with net asset value (“NAV”) based pricing. We are offering to sell any combination of Class A shares, Class W shares and Class I shares with a dollar value up to the maximum offering amount.
Dividend Capital Securities LLC, which we refer to as our “Dealer Manager,” is distributing the shares of our common stock in the Class A, Class W and Class I offering on a “best efforts” basis. Our Dealer Manager is an entity related to our Advisor and is a member of the Financial Industry Regulatory Authority, Inc., or FINRA. Our Dealer Manager coordinates our distribution effort and manages our relationships with participating broker-dealers and financial advisors and provides assistance in connection with compliance matters relating to marketing the offering.
We also continue to sell shares of our unclassified common stock, which we refer to as “Class E” shares, pursuant to our distribution reinvestment plan offering.
As of December 31, 2015, we had approximately 137,275,396 Class E shares, 1,703,109 Class A shares, 1,811,277 Class W shares, and 23,334,275 Class I shares outstanding.
Our Classes of Common Stock
We have four classes of common stock: Class E, Class A, Class W and Class I shares. The payment of class-specific expenses results in different amounts of distributions being paid with respect to each class of shares. In addition, as a result of the different ongoing fees and expenses allocable to each share class, each share class could have a different NAV per share. If the NAV of our classes are different, then changes to our assets and liabilities that are allocable based on NAV may also be different for each class. Our four classes of common stock also have different rights upon liquidation to the extent that their NAV per share differs. In the event of a liquidation event, our assets, or the proceeds therefrom, will be distributed ratably in proportion to the respective NAV for each class until the NAV for each class has been paid. Other than differing allocable fees and expenses and liquidation rights, Class E shares, Class A shares, Class W shares, and Class I shares have identical rights and privileges.
Our Operating Partnership
We own all of our interests in our investments through our Operating Partnership or its subsidiaries. We are the sole general partner of our Operating Partnership. In addition, we have contributed 100% of the proceeds received from our offerings of common stock to our Operating Partnership in exchange for partnership units representing our interest as a limited partner of the Operating Partnership. As of December 31, 2015, we held a 92.8% limited partnership interest in the Operating Partnership. We refer to partnership units in the Operating Partnership as “OP Units.” As of December 31, 2015, our Operating Partnership had outstanding OP Units held by third-party investors representing approximately a 7.2% limited partnership interest. These units were issued by the Operating Partnership in connection with its exercise of options to acquire certain fractional interests in real estate that were previously sold to such investors pursuant to private placements previously conducted by the Operating Partnership. The holders of OP Units (other than us) generally have the right to cause the Operating Partnership to redeem all or a portion of their OP Units for, at our sole discretion, shares of our common stock, cash, or a combination of both.
Our Operating Partnership has classes of OP Units that correspond to our four classes of common stock: Class E OP Units, Class A OP Units, Class W OP Units and Class I OP Units. The OP Units of each class are economically equivalent to the same respective class of our common stock. We sometimes refer to our Class E shares, Class A shares, Class W shares and Class I shares, along with the OP Units held by third parties, collectively as “Fund Interests” because they all represent interests held by investors in our Operating Partnership, through which we own all of our investments and conduct all of our operations. We sometimes refer to the NAV of all of the Fund Interests as the “Aggregate Fund NAV.”
Net Asset Value Calculation and Valuation Procedures
Our board of directors, including a majority of our independent directors, has adopted valuation procedures that contain a comprehensive set of methodologies to be used in connection with the calculation of our NAV. One fundamental element of the valuation process, the valuation of our real property portfolio, is managed by Altus Group U.S., Inc., an independent valuation firm approved by our board of directors, including a majority of our independent directors (the “Independent Valuation Firm”). Altus Group is a multidisciplinary provider of independent, commercial real estate consulting and advisory services in multiple offices around the world, including Canada, the U.K., Australia, the United States and Asia Pacific. Altus Group is engaged in the business of valuing commercial real estate properties and is not affiliated with us or the Advisor.
| - 4 - |
Our NAV is calculated for each of our share classes after the end of each business day that the New York Stock Exchange is open for unrestricted trading by ALPS Fund Services Inc., a third-party firm approved by our board of directors, including a majority of our independent directors (our “NAV Accountant”). Our NAV is not audited by our independent registered public accounting firm. See “Item 5. Market for Registrant’s Common Equity, Related Stockholder Matters and Issuer Purchases of Equity Securities” and Exhibit 99.1 of this Annual Report on Form 10-K for a more detailed description of our valuation procedures and valuation components, and our NAV as of December 31, 2015.
Investment Objectives
Our primary investment objectives are:
| · | providing current income to our stockholders in the form of quarterly cash distributions; |
| · | preserving and protecting our stockholders’ capital investments; |
| · | realizing capital appreciation in our share price from active investment management and asset management; and |
| · | providing portfolio diversification in the form of multi-asset class investing in direct real estate. |
There is no assurance that we will attain our investment objectives. Our charter places numerous limitations on us with respect to the manner in which we may invest our funds. In most cases these limitations cannot be changed unless our charter is amended, with the approval of our stockholders.
Investment Strategy
Our investment strategy is designed to focus on generating income to support the quarterly dividend, protecting capital and growing net asset value over time. We seek to leverage our extensive knowledge of targeted real estate markets and property types to capitalize on opportunities where there is a disconnect between our assessment of an investment’s intrinsic value relative to its market value. In addition, we seek to optimize the value of our portfolio through strategic financing, diligent asset management and selective asset disposition.
We believe that the real estate market is cyclical, with different demand for property types at different times. Although we do not invest for the short term, we are active portfolio managers and we will seek to take advantage of opportunities to acquire or dispose of assets presented to us by real estate markets. One reason we focus on multiple property types and markets is to increase our ability to take advantage of these market cycles. We believe that the more opportunities we see in which to invest our capital, the more selective we can be in choosing strategic and accretive investments, which we believe may result in attractive total returns for our stockholders. Seeing more opportunities also may allow us to be consistent and meaningful investors throughout different cycles. When we believe one market is overvalued, we patiently wait and focus on another market that we believe is overlooked.
We also believe that value generally is based on the investment’s ability to produce cash flow and not what the next buyer will pay at any point in time. We generally focus on select, targeted markets that exhibit characteristics of being supply-constrained with strong demand from tenants seeking quality space.
We may target investments in four primary property categories of office, industrial, retail and multifamily. Although we may own properties in each of these categories, we are not tied to specific allocation targets and we may not always have significant holdings, or any holdings at all, in each category. For example, we do not currently own multifamily investments, although we intend to consider multifamily investment opportunities in the future. Also, through the disposition of assets, our ownership of industrial assets has declined to less than 5% of our portfolio as of December 31, 2015. Our recent investment strategy has primarily been focused on multi-tenant office and necessity-oriented retail investments located in what we believe are strong markets poised for long-term growth. We currently intend that our near term investment strategy will continue to focus on these multi-tenant office and necessity-oriented retail investments. We may also look for opportunities to increase our holdings of industrial assets over the next year. However, there can be no assurance that we will be successful in this investment strategy, including with respect to any particular asset class. To a lesser extent we may invest in other types of real estate including, but not limited to, hospitality, medical offices, student housing and unimproved land. We anticipate that the majority of our real property investments will be made in the United States, although we may also invest in Canada and Mexico, and potentially elsewhere on a limited basis, to the extent that opportunities exist that may help us meet our investment objectives.
| - 5 - |
To provide diversification to our portfolio, we have invested and may continue to invest in real estate-related debt, which will generally include mortgage loans secured by real estate, mezzanine debt and other related investments. Any investments in real estate-related securities generally will focus on equity issued by public and private real estate companies and certain other securities, with the primary goal of such investments being the preservation of liquidity in support of our share redemption programs.
In 2015, we disposed of approximately $496.2 million of assets and we acquired approximately $341.3 million of assets. The assets that we sold were generally higher-yielding than the new assets we acquired, although we believe the acquired assets exhibit greater potential for future revenue growth. We believe that market conditions may cause us to continue to explore in certain markets the disposition of higher-yielding assets and in certain target markets the acquisition of assets that may generate lower yields but with greater growth potential. Although there can be no assurance that we will continue to pursue this strategy or be successful in its execution, for some period of time this may mean that higher-yielding assets are sold from our portfolio in exchange for assets that initially may produce lower current income but which we believe will generate increased income over time through increased tenant demand and rental rate growth in order to generate long term growth in net asset value.
Diversification Across Real Estate Investment Types
Our objective is to build a high-quality, diversified real estate portfolio. Although there can be no assurance that we will achieve this objective, we intend to diversify our portfolio by key portfolio attributes including, but not limited to, (1) property type, (2) target market, with consideration given to geographic concentrations, (3) average lease terms and portfolio occupancy expectations, (4) tenant concentrations, including credit and exposure to particular businesses or industries and (5) debt profile with the goal of maximizing flexibility while seeking to minimize cost and mitigate the risks associated with changes in interest rates and debt maturities.
Real Property
We generally utilize a long-term hold strategy for strategic investments within our portfolio of real estate assets. The majority of our current portfolio consists of primarily “core” or “core-plus” properties that have significant operating histories and existing leases whereby a significant portion of the total investment return is expected to be derived from current income. In addition, we have invested in a relatively smaller proportion of “value added” opportunities that have arisen in circumstances where we have determined that a real property may be situationally undervalued or where product re-positioning, capital expenditures and/or improved property management may increase cash flows, and where the total investment return is generally expected to have a relatively larger component derived from capital appreciation. As described above, although we do not invest for the short term, we are active portfolio managers and we will seek to take advantage of opportunities to acquire or dispose of assets presented to us by the real estate market. As of December 31, 2015, we had invested in a total of 60 operating properties located in 21 geographic markets throughout the United States at a total gross investment amount of approximately $2.4 billion aggregating approximately 10.1 million net rentable square feet. Furthermore, we have invested in a small number of “opportunistic” real property investments, and may pursue similar opportunities in the future, that are either under-leased at acquisition or present expansion or re-development opportunities, where we may realize a significant portion of the total investment return from value appreciation.
Debt Related Investments
To date, our debt related investments have consisted primarily of (i) originations of and participations in commercial mortgage loans secured by real estate, (ii) B-notes, and (iii) mezzanine debt and other related investments secured by equity interests in entities that indirectly own real properties. As of December 31, 2015, we had three distinct debt related investments secured by real properties located in three geographic markets with a total net investment amount of approximately $15.7 million.
| - 6 - |
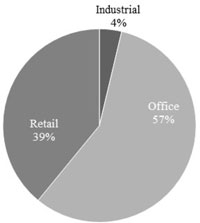
Diversification Across Real Property Sectors
Through our investments in real properties and debt related investments, we made direct investments, via equity interests and/or joint ventures, in real properties in multiple sectors, including office, industrial, and retail. In the future, we may also invest in multifamily, hospitality, and other real property types.
The chart below describes the diversification of our investment portfolio across real property type. Percentages in the chart correspond to the fair value as of December 31, 2015.
| - 7 - |
Diversification Across Geographic Regions
Through our investments in real property and debt related investments, we also seek diversification across multiple geographic regions primarily located in the United States. The chart below shows the current allocations of our real property investments across geographic regions within the continental United States. Percentages in the chart correspond to our fair value as of December 31, 2015. Any market for which we do not show a corresponding percentage of our total fair value comprises 1% or less of the total fair value of our real property portfolio. As of December 31, 2015, our real property investments were geographically diversified across 21 markets. Our debt related investments are located in three additional markets resulting in a combined portfolio allocation across 24 markets.
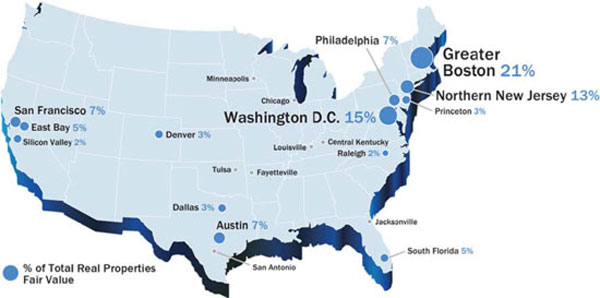
To date, and for the foreseeable future, the majority of our real property investments will be made in the United States, although we may also invest in Canada and Mexico, and potentially elsewhere on a limited basis, to the extent opportunities exist that may help us meet our investment objectives.
Diversification Across Tenant Profiles and Lease Terms
We believe that the tenant base that occupies our real property assets is generally stable and well-diversified. As of December 31, 2015, our consolidated operating real properties had leases with approximately 550 tenants. We intend to maintain a well-diversified mix of tenants to limit our exposure to any single tenant or industry. Our diversified investment strategy inherently provides for tenant diversity, and we continue to monitor our exposure relative to our larger tenant industry sectors. The following table describes our top ten tenant industry sectors based on annualized base rent as of December 31, 2015 (dollar and square footage amounts in thousands).
| Industry Sector | Number of Leases | Annualized Base Rent (1) | % of Annualized Base Rent | Occupied Square Feet | % of Occupied Square Feet | |||||||||||||||
| Professional, Scientific and Technical Services | 112 | $ | 29,096 | 15.8 | % | 1,199 | 13.1 | % | ||||||||||||
| Securities, Commodity Contracts, and Other Financial Investments and Related Activities | 30 | 25,835 | 14.0 | % | 687 | 7.5 | % | |||||||||||||
| Food and Beverage Stores | 41 | 24,407 | 13.2 | % | 1,649 | 18.1 | % | |||||||||||||
| Publishing Information (except Internet) | 3 | 19,033 | 10.3 | % | 413 | 4.5 | % | |||||||||||||
| Computer and Electronic Product Manufacturing | 8 | 6,820 | 3.7 | % | 435 | 4.8 | % | |||||||||||||
| Clothing and Clothing Accessories Stores | 32 | 6,591 | 3.6 | % | 425 | 4.7 | % | |||||||||||||
| Food Services and Drinking Places | 78 | 6,175 | 3.3 | % | 222 | 2.4 | % | |||||||||||||
| Credit Intermediation and Related Activities | 36 | 5,613 | 3.0 | % | 190 | 2.1 | % | |||||||||||||
| Chemical Manufacturing | 3 | 5,403 | 2.9 | % | 461 | 5.1 | % | |||||||||||||
| Ambulatory Health Care Services | 53 | 4,928 | 2.7 | % | 208 | 2.3 | % | |||||||||||||
| Other (2) | 318 | 50,551 | 27.5 | % | 3,231 | 35.4 | % | |||||||||||||
| Total | 714 | $ | 184,452 | 100.0 | % | 9,120 | 100.0 | % | ||||||||||||
| (1) | Annualized base rent represents the annualized monthly base rent of executed leases as of December 31, 2015. |
| (2) | Other industry sectors include 47 additional sectors. |
| - 8 - |
Our properties are generally leased to tenants for the longer term and as of December 31, 2015, the weighted average remaining term of our leases was approximately 4.5 years, based on annualized base rent, and 7.0 years, based on leased square footage. See “Item 7. Management’s Discussion and Analysis of Financial Condition and Results of Operations” of this Annual Report on Form 10-K for a schedule of expiring leases for our consolidated operating properties by annualized base rent and square footage as of December 31, 2015.
Tenant Concentration
Rental revenue from our lease with Charles Schwab & Co., Inc. (“Charles Schwab”), as master tenant of one of our office properties, represented approximately 11.5% of our total revenue from continuing operations for the year ended December 31, 2015. However, ten of Charles Schwab’s subleases that comprise approximately 4.2% of our annualized base rent as of December 31, 2015 will become our direct tenants following the expiration of our lease with Charles Schwab in 2017. These subleases will expire between January 2020 and December 2023. For the year ended December 31, 2015, with respect to our entire real property and debt related investment portfolio, we did not earn revenues from any other single tenant or borrower in excess of 10% of our total revenue. See “Concentration of Credit Risk” in Note 3 to our financial statements beginning on page F-1 of this Annual Report on Form 10-K for information regarding the top five tenants as a percentage of consolidated annual base rent and occupied square feet.
Leverage
We use financial leverage to provide additional funds to support our investment activities. We calculate our leverage for reporting purposes as our total borrowings, calculated on the basis of accounting principles generally accepted in the United States (“GAAP”), divided by the fair value of our real property and debt related investments. Based on this methodology, our leverage was 45.3% as of December 31, 2015, compared to 47.0% as of December 31, 2014. There are other methods of calculating our overall leverage ratio that may differ from this methodology, such as the methodology used in determining our compliance with corporate borrowing covenants. Our current leverage target is between 40-60%. Although we will generally work to maintain the targeted leverage ratio over the near term, we may change our targeted leverage ratio from time to time. In addition, we may vary from our target leverage ratio from time to time, and there are no assurances that we will maintain the targeted range disclosed above or achieve any other leverage ratio that we may target in the future. Our board of directors may from time to time modify our borrowing policy in light of then-current economic conditions, the relative costs of debt and equity capital, the fair values of our properties, general conditions in the market for debt and equity securities, growth and acquisition opportunities or other factors.
Competition
We believe that the current market for investing in real property and debt related investments continues to be extremely competitive and we continue to see a flight to quality for both equity and debt capital. Higher quality investments located in desirable markets are subject to strong competition. We compete with many different types of companies engaged in real estate investment activities, including other REITs, pension funds and their advisors, foreign investors, bank and insurance company investment accounts, real estate limited partnerships, various forms of banks and specialty finance companies, mutual funds, private equity funds, hedge funds, individuals and other entities. Some of these competitors, including larger REITs, have substantially greater financial and other resources than we do and generally may be able to accept more risk and leverage. They may also possess significant competitive advantages that result from, among other things, a lower cost of capital and enhanced operating efficiencies.
In addition to competing for attractive investment opportunities, the current leasing and operating environment is also extremely competitive. Improving real estate fundamentals, such as vacancy and rental rates, generally have provided us with opportunities to increase rental rates across many of our markets. However, we continue to compete with similar owners and operators of commercial real estate and, as a result, we may have to provide free rent, incur charges for tenant improvements or offer other inducements in order to compete, all of which may have an adverse impact on our results of operations.
Conflicts of Interest
We are subject to various conflicts of interest arising out of our relationship with our Advisor and other affiliates, including: (i) conflicts related to the compensation arrangements between our Advisor, certain affiliates and us, (ii) conflicts with respect to the allocation of the time of our Advisor and its key personnel and (iii) conflicts with respect to the allocation of investment and leasing opportunities. Our independent directors have an obligation to function on our behalf in all situations in which a conflict of interest may arise and have a fiduciary obligation to act on behalf of our stockholders. See “Item 13. Certain Relationships and Related Transactions, and Director Independence” of this Annual Report on Form 10-K for a description of the conflicts of interest that arise as a result of our relationships with our Advisor and its affiliates.
| - 9 - |
Compliance with Federal, State and Local Environmental Laws
Properties that we may acquire, and the properties underlying our investments, are subject to various federal, state and local environmental laws, ordinances and regulations. Under these laws, ordinances and regulations, a current or previous owner of real estate (including, in certain circumstances, a secured lender that succeeds to ownership or control of a property) may become liable for the costs of removal or remediation of certain hazardous or toxic substances or petroleum product releases at, on, under or in its property. These laws typically impose cleanup responsibility and liability without regard to whether the owner or control party knew of or was responsible for the release or presence of the hazardous or toxic substances. The costs of investigation, remediation or removal of these substances may be substantial and could exceed the value of the property. An owner or control party of a site may be subject to common law claims by third parties based on damages and costs resulting from environmental contamination emanating from a site. Certain environmental laws also impose liability in connection with the handling of or exposure to materials containing asbestos. These laws allow third parties to seek recovery from owners of real properties for personal injuries associated with materials containing asbestos. Our operating costs and the values of these assets may be adversely affected by the obligation to pay for the cost of complying with existing environmental laws, ordinances and regulations, as well as the cost of complying with future legislation, and our income and ability to make distributions to our stockholders could be affected adversely by the existence of an environmental liability with respect to our properties. We will endeavor to ensure our properties are in compliance in all material respects with all federal, state and local laws, ordinances and regulations regarding hazardous or toxic substances or petroleum products.
Employees
The Advisory Agreement provides that our Advisor will assume principal responsibility for managing our affairs, and as a result we have no employees. See “Item 10. Directors, Executive Officers and Corporate Governance” of this Annual Report on Form 10-K for additional discussion regarding our directors and executive officers.
Available Information
This Annual Report on Form 10-K,
our Quarterly Reports on Form 10-Q, our Current Reports on Form 8-K, as well as any amendments to those reports, and
proxy statements that we file with the Securities and Exchange Commission (the “Commission”) are available free of
charge as soon as reasonably practicable through our website at www.dividendcapitaldiversified.com. The information
contained on our website is not incorporated into this Annual Report on Form 10-K.
| ITEM 1A. | RISK FACTORS |
RISKS RELATED TO INVESTING IN SHARES OF OUR COMMON STOCK
There is no public trading market for the shares of our common stock and we do not anticipate that there will be a public trading market for our shares; therefore, your ability to dispose of your shares will likely be limited to redemption or repurchase by us. If you do sell your shares to us, you may receive less than the price you paid.
There is no public market for the shares of our common stock and we currently have no obligation or plans to apply for listing on any public securities market. Therefore, redemption or repurchase of shares by us will likely be the only way for you to dispose of your shares. Under our share redemption programs, we will redeem shares at a price equal to the NAV per share of the class of shares being redeemed on the date of redemption, and not based on the price at which you initially purchased your shares. Pursuant to tender offers, we may purchase our shares at a discount to NAV. We may redeem Class A, Class W or Class I shares if holders of such shares fail to maintain a minimum balance of $2,000 in shares, even if your failure to meet the minimum balance is caused solely by a decline in our NAV. Subject to limited exceptions, Class A, Class W or Class I shares redeemed within 365 days of the date of purchase will be subject to a short-term trading discount equal to 2% of the gross proceeds otherwise payable with respect to the redemption, which will inure indirectly to the benefit of our remaining stockholders. As a result of this and the fact that our NAV will fluctuate, you may receive less than the price you paid for your shares upon redemption or repurchase by us.
| - 10 - |
Our ability to redeem or repurchase your shares is limited, and our board of directors may modify, suspend or terminate our share redemption programs at any time.
Generally, our Class A, Class W and Class I share redemption program imposes a quarterly cap on aggregate net redemptions of our Class A, Class W and Class I share classes equal to the amount of shares of such classes with a value (based on the redemption price per share on the day the redemption is effected) of up to 5% of the aggregate NAV of the outstanding shares of such classes as of the last day of the previous calendar quarter.
Our current Class E share redemption program is even more limited. On an ongoing basis, it is only available for redemptions in connection with the death or disability of a stockholder. With respect to all other Class E stockholders, our board of directors evaluates each quarter whether to make liquidity available through our Class E share redemption program or through a tender offer process. Although no assurances can be made, our board of directors currently intends to make liquidity available to Class E stockholders each quarter (other than liquidity made available in the event of the death or disability of a stockholder through the Class E share redemption program) in an amount that is the greater of (A) (i) funds received from the sale of Class E shares under our distribution reinvestment plan during such calendar quarter, plus (ii) 50% of the difference between (a) the proceeds (net of sales commissions) received by us from the sale of Class A, Class W and Class I shares in any public primary offering and under our distribution reinvestment plan during the most recently completed calendar quarter, and (b) the dollar amount used to redeem Class A, Class W and Class I shares during the most recently completed calendar quarter pursuant to the Class A, Class W and Class I share redemption program, less (iii) funds used for redemptions of Class E shares in the most recently completed quarter due to qualifying death or disability requests of a stockholder during such calendar quarter and (B) the amount that would result in repurchases or redemptions, during any consecutive twelve month period, at least equal to five percent of the number of Class E shares outstanding at the beginning of such twelve-month period (the “Class E Liquidity Amount”), regardless of whether such liquidity will be made available through the Class E share redemption program or a tender offer, and excluding liquidity made available in the event of the death or disability of a stockholder through the Class E share redemption program. Our board of directors may at any time decide to reduce or eliminate the Class E Liquidity Amount.
The vast majority of our assets will consist of properties which cannot generally be readily liquidated on short notice without impacting our ability to realize full value upon their disposition. Therefore, we may not always have a sufficient amount of cash to immediately satisfy redemption requests. Our board of directors may modify, suspend or terminate our share redemption programs and also may elect not to make liquidity available to Class E stockholders through a tender offer process. As a result, your ability to have your shares redeemed or purchased by us may be limited, and our shares should be considered as having only limited liquidity and at times may be illiquid. See “Item 5. Market for Registrant’s Common Equity, Related Stockholder Matters and Issuer Purchases of Equity Securities – Share Redemption Program and Other Redemptions” of this Annual Report on Form 10-K.
Our capacity under our share redemption programs to redeem shares may be further limited if we experience a concentration of investors.
The current limitations of our share redemption programs are based, in part, on the number of outstanding shares. Thus, the ability of a single investor, or of a group of investors acting similarly, to redeem all of their shares may be limited if they own a large percentage of our shares. Similarly, if a single investor, or a group of investors acting in concert or independently, owns a large percentage of our shares, a significant redemption request by such investor or investors could significantly further limit our ability to satisfy redemption requests of other investors of such classes. Such concentrations could arise in a variety of circumstances, especially with respect to the Class A, Class W and Class I share redemption program while we have relatively few outstanding Class A, Class W and Class I shares. For example, we could sell a large number of our shares to one or more institutional investors, either in a public offering or in a private placement. In addition, we may issue a significant number of our shares in connection with an acquisition of another company or a portfolio of properties to a single investor or a group of investors that may request redemption at similar times following the acquisition. As of December 31, 2015, based on the NAV per share of $7.47 on that date, we had outstanding approximately $1.0 billion in Class E shares, $12.7 million in Class A shares, $13.5 million in Class W shares, and $170.9 million in Class I shares.
A portion of the proceeds raised in the Class A, Class W and Class I offering are expected to be used to redeem Class E shares, and such portion of the proceeds may be substantial.
We currently expect to use a portion of the proceeds from the Class A, Class W and Class I offering to enhance liquidity for our Class E stockholders through self-tender offers and our Class E share redemption program. On an ongoing basis, our current Class E share redemption program is only available for redemptions in the event of the death or disability of a stockholder. Unless approved by our board of directors, we will not make, during any consecutive twelve-month period, redemptions in the event of the death or disability of a stockholder that exceed five percent of the number of Class E shares of common stock outstanding at the beginning of such twelve-month period. However, with respect to all other Class E stockholders, our board of directors evaluates each quarter whether to make liquidity available through the Class E share redemption program or through a tender offer process. Our board of directors currently intends to make liquidity available to Class E stockholders each quarter (other than liquidity made available in the event of the death or disability of a stockholder through the Class E share redemption program) in the Class E Liquidity Amount, regardless of whether such liquidity will be made available through the Class E share redemption program or a tender offer, and excluding liquidity made available in the event of the death or disability of a stockholder through the Class E share redemption program. However, our board of directors may from time to time authorize funds for redemptions of Class E shares in greater or lower amounts. Our board of directors may at any time decide to reduce or eliminate the Class E Liquidity Amount.
| - 11 - |
There is significant pent up demand from Class E holders to have their shares purchased pursuant to a tender offer or to have their shares redeemed under our Class E share redemption program, and we plan to use a portion of the proceeds from the Class A, Class W and Class I offering to purchase or redeem Class E shares. As a result, we may have fewer offering proceeds available to retire debt or acquire additional properties, which may result in reduced liquidity and profitability or restrict our ability to grow our NAV.
For example, on July 7, 2015, we commenced a modified “Dutch Auction” tender offer to purchase for cash up to $115.0 million of Class E shares. In accordance with rules promulgated by the Commission, we had the option to increase the number of shares accepted for payment by up to 2% of the outstanding Class E shares without amending the tender offer. We ultimately accepted for purchase approximately 17.2 million Class E shares of common stock, at a purchase price of $7.25 per share for an aggregate cost of approximately $124.4 million. The tender offer terminated on August 5, 2015. On November 12, 2015, we commenced another self-tender offer to purchase for cash up to $20 million of Class E shares. We ultimately purchased approximately 13.0% of Class E shares requested to be purchased for an aggregate cost of approximately $20.0 million of Class E shares at $7.39 per share pursuant to the tender offer, which terminated on December 23, 2015. For the years ended December 31, 2015 and 2014, we redeemed 15.9% and 15.4%, respectively, of Class E shares requested to be redeemed on average pursuant to our Class E share redemption program.
With respect to liquidity for our Class E stockholders, our long-term goal is to raise sufficient proceeds in the Class A, Class W and Class I offering so as to be able to accommodate those holders of Class E shares who would like to have their shares purchased pursuant to a tender offer or to have their shares redeemed under our Class E share redemption program. However, if we are not successful over time in generating liquidity to holders of our Class E shares through our self-tender offers and the Class E share redemption program, we may explore additional liquidity strategies for our Class E stockholders. There can be no assurances that we will be successful in achieving liquidity strategies for our Class E stockholders within any certain time frame or at all. In any event, our board of directors will seek to act in the best interest of the Company as a whole, taking into consideration all classes of stockholders.
You will not have the opportunity to evaluate future investments we will make with the proceeds raised in our Class A, Class W and Class I offering prior to purchasing shares of our common stock.
We have not identified future investments that we will make with the proceeds of our Class A, Class W and Class I offering. As a result, you will not be able to evaluate the economic merits, transaction terms or other financial or operational data concerning our future investments prior to purchasing shares of our common stock. You must rely on our Advisor and our board of directors to implement our investment policies, to evaluate our investment opportunities and to structure the terms of our investments. Because you cannot evaluate all of the investments we will make in advance of purchasing shares of our common stock, this additional risk may hinder your ability to achieve your own personal investment objectives related to portfolio diversification, risk-adjusted investment returns and other objectives.
We may raise significantly less than the maximum offering amounts in our ongoing public offerings.
We presently intend to conduct ongoing public offerings of our Class A, Class W and Class I shares of common stock pursuant to registration statements filed with the Commission. However, we may raise significantly less than the maximum amounts offered pursuant to such registration statements. The less capital we raise, the less capital we will have available to make investments in accordance with our investment strategy and policies, to provide liquidity to our stockholders and for general corporate purposes (which may include repayment of our debt or any other corporate purposes we deem appropriate).
Furthermore, the estimated use of proceeds figures presented in such registration statements and the related offering prospectuses are estimates based on a maximum raise that are derived at the beginning of each offering and are not updated throughout the offering. The actual percentage of net proceeds available to us will depend on a number of factors, including the amount of capital we raise, the actual offering costs and the portion of capital raised with respect to which we pay a primary dealer fee. For example, if we raise less than the maximum amount offered pursuant to a registration statement, we would expect the percentage of net offering proceeds available to us to be less than the estimated use of proceeds figures presented in the registration statement and related offering prospectus because many offering costs are fixed and do not depend on the amount of capital raised in the offering. In our prior offering of Class A, W and I shares that terminated on September 15, 2015, before class-specific expenses, we raised total gross proceeds of approximately $183.0 million, of which approximately 89% in net proceeds was available to us for investment, redemptions, tender offers, and other corporate purposes.
| - 12 - |
Even if we are able to raise substantial funds in our Class A, Class W and Class I offering, investors in our common stock are subject to the risk that our offering, business and operating plans may change.
Although we intend to operate as a perpetual-life REIT with an ongoing offering and share redemption programs (or self-tender offers), this is not a requirement of our charter. Even if we are able to raise substantial funds in the Class A, Class W and Class I offering, if circumstances change such that our board of directors believes it is in the best interest of our stockholders to terminate our Class A, Class W and Class I offering or to terminate our share redemption programs (or stop conducting self-tender offers), we may do so without stockholder approval. Our board of directors may also change our investment objectives, borrowing policies, or other corporate policies without stockholder approval. In addition, we may change the way our fees and expenses are incurred and allocated to different classes of stockholders if the tax rules applicable to REITs change such that we could do so without adverse tax consequences. Our board of directors may decide that certain significant transactions that require stockholder approval such as dissolution, merger into another entity, consolidation or the sale or other disposition of all or substantially all of our assets, are in the best interests of our stockholders. Holders of all classes of our common stock have equal voting rights with respect to such matters and will vote as a single group rather than on a class-by-class basis. Accordingly, investors in our common stock are subject to the risk that our offering, business and operating plans may change.
Valuations and appraisals of our properties, real estate-related assets and real estate-related liabilities are estimates of value and may not necessarily correspond to realizable value.
The valuation methodologies used to value our properties and certain real estate-related assets involve subjective judgments regarding such factors as comparable sales, rental revenue and operating expense data, the capitalization or discount rate, and projections of future rent and expenses based on appropriate analysis. In addition, we generally do not undertake to mark-to-market our debt investments or real estate-related liabilities, but rather these assets and liabilities are usually included in our determination of NAV at an amount determined in accordance with GAAP. As a result, valuations and appraisals of our properties, real estate-related assets and real estate-related liabilities are only estimates of current market value. Ultimate realization of the value of an asset or liability depends to a great extent on economic and other conditions beyond our control and the control of the Independent Valuation Firm and other parties involved in the valuation of our assets and liabilities. Further, these valuations may not necessarily represent the price at which an asset or liability would sell, because market prices of assets and liabilities can only be determined by negotiation between a willing buyer and seller. Valuations used for determining our NAV also are generally made without consideration of the expenses that would be incurred in connection with disposing of assets and liabilities. Therefore, the valuations of our properties, our investments in real estate-related assets and our liabilities may not correspond to the timely realizable value upon a sale of those assets and liabilities. Our NAV does not currently represent enterprise value and may not accurately reflect the actual prices at which our assets could be liquidated on any given day, the value a third party would pay for all or substantially all of our shares, or the price that our shares would trade at on a national stock exchange. There will be no retroactive adjustment in the valuation of such assets or liabilities, the price of our shares of common stock, the price we paid to redeem shares of our common stock or NAV-based fees we paid to our Advisor and our Dealer Manager to the extent such valuations prove to not accurately reflect the true estimate of value and are not a precise measure of realizable value. Because the price you will pay for shares of our common stock in our offerings, and the price at which your shares may be redeemed or repurchased by us pursuant to our share redemption programs or self-tender offers, are based on our estimated NAV per share, you may pay more than realizable value or receive less than realizable value for your investment.
In order to disclose a daily NAV, we are reliant on the parties that we engage for that purpose, in particular the Independent Valuation Firm and the appraisers that we hire to value and appraise our real estate portfolio.
In order to disclose a daily NAV, our board of directors, including a majority of our independent directors, has adopted valuation procedures and caused us to engage independent third parties such as the Independent Valuation Firm, to value our real estate portfolio on a daily basis, and independent appraisal firms, to provide periodic appraisals with respect to our properties. We have also engaged a firm to act as the NAV Accountant and may engage other independent third parties or our Advisor to value other assets or liabilities. Although our board of directors, with the assistance of our Advisor, oversees all of these parties and the reasonableness of their work product, we will not independently verify our NAV or the components thereof, such as the appraised values of our properties. Our management’s assessment of the market values of our properties may also differ from the appraised values of our properties as determined by the Independent Valuation Firm. If the parties engaged by us to determine our daily NAV are unable or unwilling to perform their obligations to us, our NAV could be inaccurate or unavailable, and we could decide to suspend our offerings and our share redemption programs.
| - 13 - |
Our NAV is not subject to GAAP, will not be independently audited and will involve subjective judgments by the Independent Valuation Firm and other parties involved in valuing our assets and liabilities.
Our valuation procedures and our NAV are not subject to GAAP and will not be subject to independent audit. Our NAV may differ from equity (net assets) reflected on our audited financial statements, even if we are required to adopt a fair value basis of accounting for GAAP financial statement purposes. Additionally, we are dependent on our Advisor to be reasonably aware of material events specific to our properties (such as tenant disputes, damage, litigation and environmental issues) that may cause the value of a property to change materially and to promptly notify the Independent Valuation Firm so that the information may be reflected in our real estate portfolio valuation. In addition, the implementation and coordination of our valuation procedures include certain subjective judgments of our Advisor, such as whether the Independent Valuation Firm should be notified of events specific to our properties that could affect their valuations, as well as of the Independent Valuation Firm and other parties we engage, as to whether adjustments to asset and liability valuations are appropriate. Accordingly, you must rely entirely on our board of directors to adopt appropriate valuation procedures and on the Independent Valuation Firm and other parties we engage in order to arrive at our NAV, which may not correspond to realizable value upon a sale of our assets.
No rule or regulation requires that we calculate our NAV in a certain way, and our board of directors, including a majority of our independent directors, may adopt changes to the valuation procedures.
There are no existing rules or regulatory bodies that specifically govern the manner in which we calculate our NAV. As a result, it is important that you pay particular attention to the specific methodologies and assumptions we use to calculate our NAV. Other public REITs may use different methodologies or assumptions to determine their NAV. In addition, each year our board of directors, including a majority of our independent directors, will review the appropriateness of our valuation procedures and may, at any time, adopt changes to the valuation procedures. For example, we generally do not undertake to mark-to-market our debt investments or real estate-related liabilities, but rather these assets and liabilities are usually included in our determination of NAV at an amount determined in accordance with GAAP. As a result, the realizable value of specific debt investments and real property assets encumbered by debt that are used in the calculation of our NAV may be higher or lower than the value that would be derived if such debt investments or property-related liabilities were marked to market. In some cases such difference may be significant. We also do not currently include any enterprise value or real estate acquisition costs in our assets calculated for purposes of our NAV. If we acquire real property assets as a portfolio, we may pay a premium over the amount that we would pay for the assets individually. Our board of directors may change these or other aspects of our valuation procedures, which changes may have an adverse effect on our NAV and the price at which you may sell shares to us under our share redemption programs (or self-tender offers). See “Item 5. Market for Registrant’s Common Equity, Related Stockholder Matters and Issuer Purchases of Equity Securities — Net Asset Value Calculation” and our valuation procedures attached as Exhibit 99.1 to this Annual Report on Form 10-K for more details regarding our valuation methodologies, assumptions and procedures.
Our NAV per share may suddenly change if the valuations of our properties materially change from prior valuations or the actual operating results materially differ from what we originally budgeted.
It is possible that the annual appraisals of our properties may not be spread evenly throughout the year and may differ from the most recent daily valuation. As such, when these appraisals are reflected in our Independent Valuation Firm’s valuation of our real estate portfolio, there may be a sudden change in our NAV per share for each class of our common stock. Property valuation changes can occur for a variety reasons, such as local real estate market conditions, the financial condition of our tenants, or lease expirations. For example, we regularly face lease expirations across our portfolio, and as we move further away from lease commencement toward the end of a lease term, the valuation of the underlying property will be expected to drop depending on the likelihood of a renewal or a new lease on similar terms. Such a valuation drop can be particularly significant when closer to a lease expiration, especially for single tenant buildings or where an individual tenant occupies a large portion of a building. We are at the greatest risk of these valuation changes during periods in which we have a large number of lease expirations as well as when the lease of a significant tenant is closer to expiration. Similarly, if a tenant will have an option in the future to purchase one of our properties from us at a price that is less than the current valuation of the property, then if the value of the property exceeds the option price, the valuation will be expected to decline and begin to approach the purchase price as the date of the option approaches. In addition, actual operating results may differ from what we originally budgeted, which may cause a sudden increase or decrease in the NAV per share amounts. We accrue estimated income and expenses on a daily basis based on annual budgets as adjusted from time to time to reflect changes in the business throughout the year. On a periodic basis, we adjust the income and expense accruals we estimated to reflect the income and expenses actually earned and incurred. We will not retroactively adjust the NAV per share of each class for any adjustments. Therefore, because actual results from operations may be better or worse than what we previously budgeted, the adjustment to reflect actual operating results may cause the NAV per share for each class of our common stock to increase or decrease.
| - 14 - |
New acquisitions may be valued for purposes of our NAV at less than what we pay for them, which would dilute our NAV.
Pursuant to our valuation procedures, the acquisition price of newly acquired properties will serve as our appraised value for the year of acquisition, and thereafter will be part of the rotating appraisal cycle such that they are appraised at least every calendar year. This is true whether the acquisition is funded with cash, equity or a combination thereof. However, the Independent Valuation Firm always has the ability to adjust property valuations for purposes of our NAV from the most recent appraised value. Similarly, if the Independent Valuation Firm believes that the purchase price for a recent acquisition does not reflect the current value of the property, the Independent Valuation Firm has the ability to adjust the valuation for purposes of our NAV downwards immediately after acquisition. Even if the Independent Valuation Firm does not adjust the valuation downwards immediately following the acquisition, when we obtain an appraisal on the property, it may not appraise at a value equal to the purchase price. Accordingly, the value of a new acquisition as established under our NAV procedures could be less than what we pay for it, which could negatively affect our NAV. Large portfolio acquisitions, in particular, may require a “portfolio premium” to be paid by us in order to be a competitive bidder, and this “portfolio premium” may not be taken into consideration in calculating our NAV. In addition, acquisition expenses we incur in connection with new acquisitions will negatively impact our NAV. We may make acquisitions (with cash or equity) of any size without stockholder approval, and such acquisitions may be dilutive to our NAV.
The NAV per share that we publish may not necessarily reflect changes in our NAV that are not immediately quantifiable.
From time to time, we may experience events with respect to our investments that may have a material impact on our NAV. For example, and not by way of limitation, changes in governmental rules, regulations and fiscal policies, environmental legislation, acts of God, terrorism, social unrest, civil disturbances and major disturbances in financial markets may cause the value of a property to change materially. The NAV per share of each class of our common stock as published on any given day may not reflect such extraordinary events to the extent that their financial impact is not immediately quantifiable. As a result, the NAV per share that we publish may not necessarily reflect changes in our NAV that are not immediately quantifiable, and the NAV per share of each class published after the announcement of a material event may differ significantly from our actual NAV per share for such class until such time as the financial impact is quantified and our NAV is appropriately adjusted in accordance with our valuation procedures. The resulting potential disparity in our NAV may inure to the benefit of redeeming stockholders or non-redeeming stockholders and new purchasers of our common stock, depending on whether our published NAV per share for such class is overstated or understated.
The realizable value of specific properties may change before the value is adjusted by the Independent Valuation Firm and reflected in the calculation of our NAV.
Our valuation procedures generally provide that the Independent Valuation Firm will adjust a real property’s valuation, as necessary, based on known events that have a material impact on the most recent value (adjustments for non-material events may also be made). We are dependent on our Advisor to be reasonably aware of material events specific to our properties (such as tenant disputes, damage, litigation and environmental issues, as well as positive events such as new lease agreements) that may cause the value of a property to change materially and to promptly notify the Independent Valuation Firm so that the information may be reflected in our real estate portfolio valuation. Events may transpire that, for a period of time, are unknown to us or the Independent Valuation Firm that may affect the value of a property, and until such information becomes known and is processed, the value of such asset may differ from the value used to determine our NAV. In addition, although we may have information that suggests a change in value of a property may have occurred, there may be a delay in the resulting change in value being reflected in our NAV until such information is appropriately reviewed, verified and processed. For example, we may receive an unsolicited offer, from an unrelated third party, to sell one of our assets at a price that is materially different than the price included in our NAV. Or, we may be aware of a new lease, lease expiry, or entering into a contract for capital expenditure. Where possible, adjustments generally are made based on events evidenced by proper final documentation. It is possible that an adjustment to the valuation of a property may occur prior to final documentation if the Independent Valuation Firm determines that events warrant adjustments to certain assumptions that materially affect value. However, to the extent that an event has not yet become final based on proper documentation, its impact on the value of the applicable property may not be reflected (or may be only partially reflected) in the calculation of our NAV.
Because we generally do not mark our debt investments or real estate-related liabilities to market, the realizable value of specific debt investments and real property assets that are encumbered by debt may be higher or lower than the value used in the calculation of our NAV.
We generally do not undertake to mark-to-market our debt investments or real estate-related liabilities, but rather these assets and liabilities are usually included in our determination of NAV at an amount determined in accordance with GAAP. As a result, the realizable value of specific debt investments and real property assets that are encumbered by debt used in the calculation of our NAV may be higher or lower than the value that would be derived if such debt investments or liabilities were marked to market. In some cases such difference may be significant. For example, in Note 8 to our financial statements beginning on page F-1 of this Annual Report on Form 10-K for the year ended December 31, 2015, we disclosed that the estimated fair value of our debt liabilities, net of the fair value of our debt investments, was $3.6 million lower than the GAAP carrying balance, meaning that if we used the fair value of our debt rather than the carrying balance, our NAV would have been higher by approximately $3.6 million as of December 31, 2015. We record all derivative instruments at fair value, which we do not expect to be significantly different from the realizable value of our derivative instruments used in the calculation of our NAV.
| - 15 - |
Due to daily fluctuations in our NAV, the price at which your purchase is executed could be higher than our NAV per share at the time you submit your purchase order, and the price at which your redemption is executed could be lower than our NAV per share at the time you submit your redemption request.
The purchase and redemption price for shares of our common stock will be determined at the end of each business day based on our NAV and will not be based on any established trading price. In our Class A, Class W and Class I offering, each accepted purchase order will be executed at a price equal to our NAV per share for the class of shares being purchased next determined after the purchase order is received in good order, plus, for Class A shares sold in the primary offering only, any applicable selling commissions. For example, if a purchase order is received in good order on a business day and before the close of business (4:00 p.m. Eastern time) on that day, the purchase order will be executed at a purchase price equal to our NAV per share for the class of shares being purchased determined after the close of business on that day, plus, for Class A shares sold in the primary offering only, any applicable selling commissions. If a purchase order is received in good order on a business day, but after the close of business on that day, the purchase order will be executed at a purchase price equal to our NAV per share for the class of shares being purchased determined after the close of business on the next business day, plus, for Class A shares sold in the primary offering only, any applicable selling commissions. Similarly, redemption requests received in good order will be effected at a redemption price equal to the next-determined NAV per share for the class of shares being redeemed (subject to a 2% short-term trading discount in certain circumstances). In addition, there may be a delay between your purchase or redemption decision and the execution date caused by time necessary for you and your participating broker-dealer to put a purchase order or redemption request in “good order,” which means, for these purposes, that all required information has been completed, all proper signatures have been provided, and, for purchase orders, funds for payment have been provided. As a result of this process, you will not know the purchase or redemption price at the time you submit your purchase order or redemption request. The purchase price per share at which your purchase order is executed could be higher than the NAV per share on the date you submitted your purchase order, and the redemption price per share at which your redemption request is executed could be lower than the NAV per share on the date you submitted your redemption request.
Our NAV and the NAV of your shares may be diluted in connection with our Class A, Class W and Class I offering and future securities offerings.
In connection with the Class A, Class W and Class I offering, we incur fees and expenses. Excluding selling commissions (which are effectively paid by purchasers of Class A shares in the primary offering at the time of purchase, because the purchase price of such shares is equal to the NAV per Class A share plus the selling commission, and therefore have no effect on our NAV), we expect to incur up to $5 million in primary dealer fees and approximately $12.8 million in organization and offering expenses, which will decrease the amount of cash we have available for operations and new investments. In addition, because the prices of shares sold in the Class A, Class W and Class I offering are based on our NAV, the offering may be dilutive if our NAV procedures do not fully capture the value of our shares and/or we do not utilize the proceeds accretively.
In the future we may conduct other offerings of common stock (whether existing or new classes), preferred stock, debt securities or of interests in our Operating Partnership. We may also amend the terms of the Class A, Class W and Class I offering. We may structure or amend such offerings to attract institutional investors or other sources of capital in connection with efforts to provide additional Class E liquidity or otherwise. The terms of the Class A, Class W and Class I offering will reduce the NAV of your shares over time in accordance with our valuation procedures and the terms of the Class A, Class W and Class I offering and future offerings (such as the offering price and the distribution fees and expenses) may negatively impact our ability to pay distributions and your overall return.
Investors do not have the benefit of an independent due diligence review in connection with our Class A, Class W and Class I offering which increases the risk of your investment.
Because our Advisor and our Dealer Manager are related, investors do not have the benefit of an independent due diligence review and investigation in connection with the Class A, Class W and Class I offering of the type normally performed by an unrelated, independent underwriter in connection with a securities offering. In addition, DLA Piper LLP (US) has acted as counsel to us, our Advisor and our Dealer Manager in connection with the Class A, Class W and Class I offering and, therefore, investors do not have the benefit of a due diligence review that might otherwise be performed by independent counsel. Under applicable legal ethics rules, DLA Piper LLP (US) may be precluded from representing us due to a conflict of interest between us and our Dealer Manager. If any situation arises in which our interests are in conflict with those of our Dealer Manager or its related parties, we would be required to retain additional counsel and may incur additional fees and expenses. The lack of an independent due diligence review and investigation increases the risk of your investment.
| - 16 - |
Our investors may be at a greater risk of loss than our Advisor and members of our management team.
We have taken certain actions to increase the stock ownership in our Company by our management team, our Advisor and our directors over the past couple of years, including the implementation of certain stock-based awards. As of February 24, 2016, our Advisor and members of our management team own approximately $8.6 million of stock or in stock-based awards (excluding certain options granted to our independent directors but including unvested shares). While we have improved and expect to continue to grow stock ownership by management, our Advisor and our directors, the current level of ownership may be less than the management teams of other public real estate companies and as result, our investors may be at a greater risk of loss than our Advisor and other members of our management, especially as compared to these other companies in which stock ownership by management and directors may be significantly greater.
The availability and timing of cash distributions to you is uncertain.
We currently make and expect to continue to make quarterly distributions to our stockholders. However, the payment of class-specific expenses results in different amounts of distributions being paid with respect to each class of shares. In addition, we bear all expenses incurred in our operations, which reduce the amount of cash available for distribution to our stockholders. Distributions may also be negatively impacted by the failure to deploy our net proceeds on an expeditious basis, the inability to find suitable investments that are not dilutive to our distributions, the poor performance of our investments, an increase in expenses for any reason (including expending funds for redemptions) and due to numerous other factors. Any request by the holders of our OP Units to redeem some or all of their OP Units for cash may also impact the amount of cash available for distribution to our stockholders. In addition, our board of directors, in its discretion, may retain any portion of such funds for working capital. We cannot assure you that sufficient cash will be available to make distributions to our stockholders or that the amount of distributions will not either decrease or fail to increase over time. From time to time, we may adjust our distribution level and we may make such an adjustment at any time.
We may have difficulty funding our distributions with funds provided by our operations.
Although our distributions during 2015, 2014 and 2013 were fully funded from our operations, in the future we may fund distributions from other sources. Our long-term strategy is to fund the payment of quarterly distributions to our stockholders entirely from our operations. However, if we are unsuccessful in investing the capital we raise in our Class A, Class W and Class I offering or which is generated from the sale of existing assets on an effective and efficient basis that is accretive to our distribution level, we may be required to fund our quarterly distributions to our stockholders from a combination of our operations and financing activities, which include net proceeds of our Class A, Class W and Class I offering and borrowings (including borrowings secured by our assets), or to reduce the level of our quarterly distributions. Using certain of these sources may result in a liability to us, which would require a future repayment. The use of these sources for distributions and the ultimate repayment of any liabilities incurred could adversely impact our ability to pay distributions in future periods, decrease the amount of cash we have available for new investments, repayment of debt, share redemptions or repurchases and other corporate purposes, and potentially reduce your overall return and adversely impact and dilute the value of your investment in shares of our common stock. We may pay distributions from sources other than cash flow from operations, including, without limitation, the sale of assets, borrowings or offering proceeds. Our ability to pay distributions at the current level also likely will be impacted by the expiration of certain large leases in our portfolio, and, as a result, we may be required to reduce the level of our quarterly distributions. To the extent that we sell higher yielding assets in exchange for assets that may initially produce less income in exchange for the potential ability for longer term appreciation, this may also put pressure on our ability to sustain our current distribution level. If our quarterly distributions exceed cash flow generated from our operations, it may cause a decrease in our NAV if not offset by other effects.
If we raise substantial offering proceeds in a short period of time, we may not be able to invest all of the net offering proceeds promptly, which may cause our distributions and the long-term returns to our investors to be lower than they otherwise would.
We could suffer from delays in locating suitable investments. The more money we raise in our Class A, Class W and Class I offering, the more difficult it will be to invest the net offering proceeds promptly. Therefore, the large size of our Class A, Class W and Class I offering increases the risk of delays in investing our net offering proceeds. Our reliance on our Advisor to locate suitable investments for us at times when the management of our Advisor is simultaneously seeking to locate suitable investments for other entities sponsored or advised by affiliates of the Sponsor could also delay the investment of the proceeds of our Class A, Class W and Class I offering. Delays we encounter in the selection, acquisition and development of income-producing properties would likely negatively affect our NAV, limit our ability to pay distributions to you and reduce your overall returns.
| - 17 - |
We are required to pay substantial compensation to our Advisor and its affiliates, which may be increased or decreased during our Class A, Class W and Class I offering or future offerings by a majority of our board of directors, including a majority of the independent directors.
Pursuant to our agreements with our Advisor and its affiliates, we are obligated to pay substantial compensation to our Advisor and its affiliates. Subject to limitations in our charter, the fees, compensation, income, expense reimbursements, interests and other payments that we are required to pay to our Advisor and its affiliates may increase or decrease during our Class A, Class W and Class I offering or future offerings if such change is approved by a majority of our board of directors, including a majority of the independent directors. These payments to our Advisor and its affiliates will decrease the amount of cash we have available for operations and new investments and could negatively impact our NAV, our ability to pay distributions and your overall return.
The performance component of the advisory fee is calculated on the basis of the overall non-compounded investment return provided to holders of Fund Interests over a calendar year, so it may not be consistent with the return on your shares.
The performance component of the advisory fee is calculated on the basis of the overall non-compounded investment return provided to holders of Fund Interests (i.e., our Class E shares, Class A shares, Class W shares and Class I shares, along with the OP Units held by third parties) over a calendar year such that our Advisor will receive 25% of the overall return in excess of 6%; provided that in no event will the performance component exceed 10% of the overall return for such year. The overall non-compounded investment return provided to holders of Fund Interests over any applicable period is a dollar amount defined as the product of (i) the amount, if any, by which (A) the sum of (1) the weighted-average distributions per Fund Interest over the applicable period, and (2) the ending weighted-average NAV per Fund Interest, exceeds (B) the beginning weighted-average NAV per Fund Interest and (ii) the weighted-average number of Fund Interests outstanding during the applicable period. The weighted-average NAV per Fund Interest calculated on the last trading day of a calendar year shall be the amount against which changes in weighted-average NAV per Fund Interest are measured during the subsequent calendar year. However, the performance component will not be earned on any increase in the weighted-average NAV per Fund Interest except to the extent that it exceeds the historically highest year-end weighted-average NAV per Fund Interest since the commencement of our daily NAV calculations ($7.47 as of December 31, 2015). The foregoing NAV thresholds are subject to adjustment by our board of directors. Therefore, payment of the performance component of the advisory fee (1) is contingent upon the overall return to the holders of Fund Interests exceeding the 6% return, (2) will vary in amount based on our actual performance, (3) cannot cause the overall return to the holders of Fund Interests for the year to be reduced below 6%, and (4) is payable to our Advisor if the overall return to the holders of Fund Interests exceeds the 6% return in a particular calendar year, even if the overall return to the holders of Fund Interests on a cumulative basis over any longer or shorter period has been less than 6% per annum. Additionally, our Advisor will provide us with a waiver of a portion of its fees generally equal to the amount of the performance component that would have been payable with respect to the Class E shares and the Class E OP Units held by third parties until the NAV of such shares or units exceeds $10.00 per share or unit, the benefit of which will be shared among all holders of Fund Interests.
As a result, the performance component is not directly tied to the performance of the shares you purchase, the class of shares you purchase, or the time period during which you own your shares. The performance component may be payable to our Advisor even if the NAV of your shares at the end of the calendar year is below your purchase price, and the thresholds at which increases in NAV count towards the overall return to the holders of Fund Interests are not based on your purchase price. Because of the class-specific expenses consisting of the dealer manager fee and the distribution fee, which differ among classes, we do not expect the overall return of each class of Fund Interests to ever be the same. However, if and when the performance fee is payable, the expense will be allocated among all holders of Fund Interests ratably according to the NAV of their units or shares, regardless of the different returns achieved by different classes of Fund Interests during the year. Further, stockholders who redeem their shares during a given year may redeem their shares at a lower NAV per share as a result of an accrual for the estimated performance component of the advisory fee, even if no performance component is ultimately payable to our Advisor at the end of such calendar year. In addition, if the weighted-average NAV per Fund Interest remains above certain threshold levels, our Advisor’s ability to earn the performance fee in any year will not be affected by poor performance in prior years, and our Advisor will not be obligated to return any portion of advisory fees paid based on our subsequent performance.
Payment of fees and expenses to our Advisor, the property manager and our Dealer Manager reduces the cash available for distribution and increases the risk that you will not be able to recover the amount of your investment in our shares.
The Advisor, the property manager (which is an affiliate of our Advisor) and our Dealer Manager perform services for us, including, among other things, the selection and acquisition of our investments, the management of our assets, the disposition of our assets, the financing of our assets and certain administrative services. We pay our Advisor, the property manager and our Dealer Manager fees and expense reimbursements for these services, which will reduce the amount of cash available for further investments or distribution to our stockholders.
| - 18 - |
We are dependent upon our Advisor and its affiliates to conduct our operations and our Class A, Class W and Class I offering; thus, adverse changes in their financial health or our relationship with them could cause our operations to suffer.
We are dependent upon our Advisor and its affiliates to conduct our operations and our Class A, Class W and Class I offering. Thus, adverse changes to our relationship with, or the financial health of, our Advisor and its affiliates, including changes arising from litigation, could hinder their ability to successfully manage our operations and our portfolio of investments.
If we internalize our management functions, the percentage of our outstanding common stock owned by our other stockholders could be reduced, we could incur other significant costs associated with being self-managed, and any internalization could have other adverse effects on our business and financial condition.
At some point in the future, we may consider internalizing the functions performed for us by our Advisor, although we do not currently intend to do so. The method by which we could internalize these functions could take many forms. We may hire our own group of executives and other employees or we may acquire our Advisor or its respective assets, including its existing workforce. Any internalization transaction could result in significant payments to the owners of our Advisor, including in the form of our stock which could reduce the percentage ownership of our then existing stockholders and concentrate ownership in the owner of our Advisor. In addition, there is no assurance that internalizing our management functions will be beneficial to us and our stockholders. For example, we may not realize the perceived benefits because of the costs of being self-managed or we may not be able to properly integrate a new staff of managers and employees or we may not be able to effectively replicate the services provided previously by our Advisor or its affiliates. Internalization transactions have also, in some cases, been the subject of litigation. Even if these claims are without merit, we could be forced to spend significant amounts of money defending claims which would reduce our NAV and the amount of funds available for us to invest in real estate assets or to pay distributions.
If we were to internalize our management or if another investment program, whether sponsored or advised by affiliates of our Sponsor or otherwise, hires the employees of our Advisor or its affiliates in connection with its own internalization transaction or otherwise, our ability to conduct our business may be adversely affected.
We rely on persons employed by our Advisor or its affiliates to manage our day-to-day operating and acquisition activities. If we were to effectuate an internalization of our Advisor, we may not be able to retain all of the employees of our Advisor or its affiliates or to maintain relationships with other entities sponsored or advised by affiliates of our Sponsor. In addition, some of the employees of our Advisor or its affiliates may provide services to one or more other investment programs. These programs or third parties may decide to retain some or all of the key employees in the future. If this occurs, these programs could hire certain of the persons currently employed by our Advisor or its affiliates who are most familiar with our business and operations, thereby potentially adversely impacting our business.
We have broad authority to incur debt, and high debt levels could hinder our ability to make distributions and could decrease the value of your investment in shares of our common stock.
Under our charter, we have a limitation on borrowing which precludes us from borrowing in excess of 300% of the value of our net assets, provided that we may exceed this limit if a higher level of borrowing is approved by a majority of our independent directors. High debt levels would cause us to incur higher interest charges, would result in higher debt service payments, could be accompanied by restrictive covenants, and would generally make us subject to the risks associated with leverage. These factors could limit the amount of cash we have available to distribute and could result in a decline in our NAV and in the value of your investment in shares of our common stock.
An investment in Class A, Class W or Class I shares will be impacted by class-specific expenses of other offerings.
The dealer manager fee and distribution fee are allocated on a class-specific basis, which means that the expenses are borne by all holders of the applicable class. For example, an investor who acquired Class A shares in a private offering will be allocated a proportional share of the dealer manager fee and distribution fee we pay with respect to Class A shares sold in our ongoing public offering of Class A, Class W and Class I shares. Such Class A expenses are allocated among all Class A shares ratably, regardless of how each Class A stockholder acquired his or her shares. As a result, purchasers of Class A, Class W or Class I shares in our ongoing public offering will be impacted by class-specific expenses that we pay with respect to any of our outstanding Class A, Class W and Class I shares, respectively, regardless of how or when those shares were issued. Specifically, we intend to operate as a perpetual-life REIT, which means that we intend to offer Class A, Class W and Class I shares continuously. In order to do so, from time to time we will be required to file a new registration statement to register additional Class A, Class W and Class I shares of common stock with the Commission. The dealer manager fee and distribution fee that are payable to our Dealer Manager on an ongoing basis with respect to any offering (i.e., pursuant to our current registration statement for such offering) will cease when total underwriting compensation in such offering equals the FINRA limitation of 10% of the gross proceeds from the primary portion of such offering. However, the dealer manager fee and distribution fee will be payable with respect to other public offerings, and investors in our Class A, Class W and Class I offering will be allocated a proportional share of such class-specific expenses. Accordingly, with respect to the shares that you own, you should expect to be allocated the maximum dealer manager fee and distribution fee for as long as you own your shares.
| - 19 - |
We are exposed to risks arising from a small number of tenants comprising a significant portion of our income.
As of December 31, 2015, a significant portion of our annualized base rent comes from three tenants. As a result, we are particularly exposed to their ability and willingness to perform according to the contractual terms of their existing leases and to renew when the leases expire. When the leases expire, we may be forced to lower the rental rates or offer other concessions in order to retain the tenants. Any reduction in the rental rates or other lease terms may have a meaningful impact to our operating results. Further, if our significant tenants choose not to renew at all, we will likely suffer from periods of receiving no rent while we seek replacement tenants, and incur costs related to finding replacement tenants. Our two most significant leases, together comprising approximately 23.1% of our annualized base rent as of December 31, 2015, will expire between December 2016 and September 2017. One of these leases includes ten subleases comprising approximately 4.2% of our annualized base rent as of December 31, 2015, which are scheduled to expire between January 2020 and December 2023. Based on market information as of December 31, 2015, we have obtained third-party estimates that current market rental rates, on a weighted-average basis utilizing annualized base rent as of December 31, 2015, are approximately 14% lower than the in-place rents. Accordingly, if market rents do not increase significantly, replicating the cash flows from these leases would be very difficult. Our third most significant lease, comprising approximately 8.7% of our annualized base rent as of December 31, 2015, was subject to a purchase option. The tenant of this lease exercised the purchase option during January 2016 to acquire the office property on February 18, 2016. As a result, we no longer have this lease subsequent to February 18, 2016. For a more detailed discussion of the purchase option and the disposition of the office property, see “Item 7. Management’s Discussion and Analysis of Financial Condition and Results of Operations—Subsequent Events” of this Annual Report on Form 10-K. These factors could adversely affect our results of operations, financial condition, NAV and ability to pay distributions to our stockholders.
We are active portfolio managers and will incur transaction and transition costs each time that we acquire or dispose of an asset.
We believe that the real estate market is cyclical, with different demand for property types at different times. Although we do not invest for the short term, we are active portfolio managers and we will seek to take advantage of opportunities to acquire or dispose of assets presented to us by the real estate markets. Each time that we acquire or dispose of an asset, we incur associated transaction costs which may include, but are not limited to, broker fees, attorney fees, regulatory filings, taxes and disposition fees paid to our Advisor. In addition, each time that we sell an income-generating asset, our operating results will be negatively impacted unless and until we are able to reinvest the proceeds in an investment with an equal or greater yield, which we may be unable to do. Accordingly, in order for us to provide positive returns to our stockholders from active portfolio management, the benefits of active management must outweigh the associated transaction and transition costs. We may be unable to achieve this. These factors could adversely affect our results of operations, financial condition, NAV and ability to pay distributions to our stockholders.
The U.S. Department of Labor (“DOL”) has proposed to amend the definition of “fiduciary” under ERISA and the Code, which could affect the marketing of investments in our shares.
The DOL has proposed to amend the definition of “fiduciary” under ERISA and the Code. The proposed amendment would broaden the definition of “fiduciary” and make a number of changes to the prohibited transaction exemptions relating to investments by employee benefit plans subject to Title I of ERISA or retirement plans or accounts subject to Section 4975 of the Code (including IRAs). The DOL has said that the proposed changes will become effective eight months after the regulation is finalized and will be prospective only. If and when the proposed changes are finalized, they could have a significant effect on the marketing of investments in our shares to such plans or accounts.
| - 20 - |
RISKS RELATED TO CONFLICTS OF INTEREST
Our Advisor faces a conflict of interest because the fees it receives for services performed are based on our NAV, the procedures for which our Advisor will assist our board of directors in developing, overseeing, implementing and coordinating.
The Advisor assists our board of directors in developing, overseeing, implementing and coordinating our NAV procedures. It assists our Independent Valuation Firm in valuing our real property portfolio by providing the firm with property-level information, including (i) historical and projected operating revenues and expenses of the property; (ii) lease agreements on the property; and (iii) the revenues and expenses of the property. Our Independent Valuation Firm assumes and relies upon the accuracy and completeness of all such information, does not undertake any duty or responsibility to verify independently any of such information and relies upon us and our Advisor to advise if any material information previously provided becomes inaccurate or was required to be updated during the period of its review. In addition, our Advisor may have some discretion with respect to valuations of certain assets and liabilities, which could affect our NAV. Because our Advisor is paid fees for its services based on our NAV, our Advisor could be motivated to influence our NAV and NAV procedures such that they result in an NAV exceeding realizable value, due to the impact of higher valuations on the compensation to be received by our Advisor. Our Advisor may also benefit by us retaining ownership of our assets at times when our stockholders may be better served by the sale or disposition of our assets in order to avoid a possible reduction in our NAV that could result from a distribution of the proceeds. If our NAV is calculated in a way that is not reflective of our actual NAV, then the purchase price of shares of our common stock on a given date may not accurately reflect the value of our portfolio, and your shares may be worth less than the purchase price.
Our Advisor’s product specialists may recommend that we enter into transactions with entities that have a relationship or affiliation with them, and our stockholders will not be able to assess our Advisor’s product specialists’ qualifications when deciding whether to make an investment in shares of our common stock.
Our Advisor utilizes third-party and affiliated product specialists to assist in fulfilling its responsibilities to us. The strategic alliances between our Advisor and the product specialists provide, in accordance with industry standards, that the product specialists must adhere to a standard of care of commercial reasonableness when performing services on our behalf. Our Advisor’s product specialists generally do not owe fiduciary duties to us and may have time constraints and other conflicts of interest due to relationships or affiliations they have with other entities. As a result, these product specialists may recommend that we enter into transactions with such entities, in which case we will not have the benefit of arm’s-length negotiations of the type normally conducted between unrelated parties. Our stockholders will not be able to assess the qualifications of our Advisor’s product specialists when deciding whether to make an investment in shares of our common stock. Therefore, our stockholders may not be able to determine whether our Advisor’s product specialists are sufficiently qualified or otherwise desirable to work with.
Our Advisor’s management personnel and product specialists face conflicts of interest relating to time management and there can be no assurance that our Advisor’s management personnel and product specialists will devote adequate time to our business activities or that our Advisor will be able to hire adequate additional employees.
All of our Advisor’s management personnel, other employees, affiliates and related parties may also provide services to other entities sponsored or advised by affiliates of our Sponsor, including, but not limited to, Industrial Property REIT Inc. (“IPT”) and Logistics Property Trust Inc. (“LPT”). We are not able to estimate the amount of time that such management personnel and product specialists will devote to our business. As a result, certain of our Advisor’s management personnel and product specialists may have conflicts of interest in allocating their time between our business and their other activities which may include advising and managing various other real estate programs and ventures, which may be numerous and may change as programs are closed or new programs are formed. During times of significant activity in other programs and ventures, the time they devote to our business may decline and be less than we would require. There can be no assurance that our Advisor’s affiliates will devote adequate time to our business activities or that our Advisor will be able to hire adequate additional employees to perform the tasks currently being performed by our Advisor’s affiliates should the amount of time devoted to our business activities by such affiliates prove to be insufficient.
Our Advisor and its affiliates, including our officers and two of our directors, face conflicts of interest caused by compensation arrangements with us and other entities sponsored or advised by affiliates of our Sponsor, which could result in actions that are not in our stockholders’ best interests.
Some of our executive officers, two of our directors and other key personnel are also officers, directors, managers, key personnel and/or holders of an ownership interest in our Advisor, our Dealer Manager, our property manager and/or other entities related to our Sponsor. Our Advisor and its affiliates receive substantial fees from us in return for their services and these fees could influence their advice to us. Among other matters, the compensation arrangements could affect their judgment with respect to:
| · | the continuation, renewal or enforcement of our agreements with our Advisor and its affiliates, including the Advisory Agreement, the property management agreement and the agreement with our Dealer Manager; | |
| - 21 - |
| · | recommendations to our board of directors with respect to developing, overseeing, implementing and coordinating our NAV procedures, or the decision to adjust the value of certain of our assets or liabilities if our Advisor is responsible for valuing them; |
| · | public offerings of equity by us, which may result in increased advisory fees for our Advisor; |
| · | competition for tenants from entities sponsored or advised by affiliates of our Sponsor that own properties in the same geographic area as us; |
| · | asset sales, which may allow our Advisor to earn disposition fees and commissions; and |
| · | investments in assets subject to product specialist agreements with affiliates of our Advisor. |
Further, certain advisory fees paid to our Advisor and management and leasing fees paid to the property manager are paid irrespective of the quality of the underlying real estate or property management services during the term of the related agreement. Our Advisor may also be entitled to a disposition fee and a commission upon a property sale, each equal to a percentage of the sales price. These fees and commissions may incentivize our Advisor to recommend the sale of an asset or assets that may not be in our best interests at the time. The premature sale of an asset may add concentration risk to the portfolio or may be at a price lower than if we held the asset. Moreover, our Advisor has considerable discretion with respect to the terms and timing of disposition and leasing transactions. In evaluating investments and other management strategies, the opportunity to earn these fees may lead our Advisor to place undue emphasis on criteria relating to its compensation at the expense of other criteria, such as preservation of capital, in order to achieve higher short-term compensation. Considerations relating to compensation to our Advisor and its affiliates from us and other entities sponsored or advised by affiliates of our Sponsor could result in decisions that are not in our stockholders’ best interests, which could hurt our ability to pay our stockholders distributions or result in a decline in the value of our stockholders’ investment. Conflicts of interest such as those described above have contributed to stockholder litigation against certain other externally managed REITs that are not affiliated with us or our Sponsor.
When considering whether to recommend investments through a joint venture or other co-ownership arrangement, the fee arrangements between our Advisor and the proposed joint venture partner may incentivize our Advisor to recommend investing a greater proportion of our resources in joint venture investments than may be in our stockholders’ best interests.
When we invest in assets through joint ventures or other co-ownership arrangements, our Advisor may, directly or indirectly (including, without limitation, through us or our subsidiaries), receive fees from our joint venture partners and co-owners of our properties for the services our Advisor provides to them with respect to their proportionate interests. Fees received from joint venture entities or partners and paid, directly or indirectly (including without limitation, through us or our subsidiaries), to our Advisor may be more or less than similar fees that we pay to our Advisor pursuant to the Advisory Agreement. Because our Advisor may receive fees from our joint venture partners and co-owners in connection with our joint venture or other co-ownership arrangements, our Advisor may be incentivized to recommend a higher level of investment through joint ventures than may otherwise be in the best interests of our stockholders.
The time and resources that entities sponsored or advised by affiliates of our Sponsor devote to us may be diverted and we may face additional competition due to the fact that these entities are not prohibited from raising money for another entity that makes the same types of investments that we target.
Entities sponsored or advised by affiliates of our Sponsor are not prohibited from raising money for another investment entity that makes the same types of investments as those we target. As a result, the time and resources they could devote to us may be diverted. For example, our Dealer Manager is currently involved in other public offerings for other entities sponsored or advised by affiliates of our Sponsor, including IPT and LPT. In addition, we may compete with any such investment entity for the same investors and investment opportunities. We may also co-invest with any such investment entity. Even though all such co-investments will be subject to approval by our independent directors, they could be on terms not as favorable to us as those we could achieve co-investing with an unrelated third party.
| - 22 - |
Our Advisor may have conflicting fiduciary obligations if we acquire properties with an entity sponsored or advised by one of its affiliates or other related entities; as a result, in any such transaction we may not have the benefit of arm’s-length negotiations of the type normally conducted between unrelated parties.
Our Advisor may cause us to acquire an interest in a property from, or through a joint venture with, an entity sponsored or advised by one of its affiliates or to dispose of an interest in a property to such an entity. In these circumstances, our Advisor will have a conflict of interest when fulfilling its fiduciary obligation to us. In any such transaction we may not have the benefit of arm’s-length negotiations of the type normally conducted between unrelated parties.
The fees we pay to entities sponsored or advised by affiliates of our Sponsor in connection with our offerings of securities and in connection with the management of our investments were not determined on an arm’s length basis, and therefore, we do not have the benefit of arm’s length negotiations of the type normally conducted between unrelated parties.
Our Advisor, our Dealer Manager and other of our Advisor’s affiliates have earned and will continue to earn fees, commissions and expense reimbursements from us. The fees, commissions and expense reimbursements paid and to be paid to our Advisor, our Dealer Manager and other of our Advisor’s affiliates for services they provided us in connection with past offerings and in connection with our Class A, Class W and Class I offering were not determined on an arm’s length basis. As a result, the fees have been determined without the benefit of arm’s length negotiations of the type normally conducted between unrelated parties.
We may compete with other entities or programs sponsored or advised by affiliates of our Sponsor, including IPT and LPT, for opportunities to acquire or sell investments, which may have an adverse impact on our operations.
We may compete with other entities or programs sponsored or advised by affiliates of our Sponsor, whether existing or created in the future, including IPT and LPT, for opportunities to acquire, finance or sell certain types of real properties. We may also buy, finance or sell real properties at the same time that other entities or programs sponsored or advised by affiliates of our Sponsor, including IPT and LPT, are buying, financing or selling properties. In this regard, there is a risk that our Advisor will advise us to purchase a real property that provides lower returns to us than a real property purchased by an entity or program sponsored or advised by an affiliate of our Sponsor, including IPT and LPT. Certain programs sponsored or advised by affiliates of our Sponsor own and/or manage real properties in geographic areas in which we expect to own real properties. Therefore, our real properties may compete for tenants with other real properties owned and/or managed by other programs sponsored or advised by affiliates of our Sponsor, including IPT and LPT. Our Advisor may face conflicts of interest when evaluating tenant leasing opportunities for our real properties and other real properties owned and/or managed by programs sponsored or advised by affiliates of our Sponsor, including IPT and LPT, and these conflicts of interest may have an adverse impact on our ability to attract and retain tenants.
Programs sponsored or advised by affiliates of our Sponsor may be given priority over us with respect to the acquisition of certain types of investments. As a result of our potential competition with these programs, certain investment opportunities that would otherwise be available to us may not in fact be available. For example, in recognition of the fact that we also desire to acquire industrial properties and have a separate day-to-day acquisition team, the Sponsor and our Advisor have agreed, subject to changes approved or required by our conflicts resolution committee, that (1) if an industrial property opportunity is a widely-marketed, brokered transaction, we, on the one hand, and LPT and/or IPT, on the other hand, may simultaneously and independently pursue such transaction, and (2) if an industrial property is not a widely-marketed, brokered transaction, then, as between us, on the one hand, and LPT and/or IPT, on the other hand, the management team and employees of each company generally are free to pursue any industrial opportunity at any time, subject to certain allocations if non-widely-marketed transactions are first sourced by certain shared employees, managers or directors. One of our independent directors, Mr. Charles Duke, is also an independent director for IPT and LPT. If there are any transactions or policies affecting us and IPT or us and LPT, Mr. Duke will recuse himself from making any such decisions for as long as he holds both positions.
We may also compete with other entities or programs sponsored or advised by affiliates of our Sponsor for opportunities to acquire, finance or sell certain types of debt related investments. As a result of our potential competition with other entities or programs sponsored or advised by affiliates of our Sponsor, certain investment opportunities that would otherwise be available to us may not in fact be available. This competition may also result in conflicts of interest that are not resolved in our favor.
We have purchased and may in the future purchase real estate assets from third parties who have existing or previous business relationships with affiliates or other related entities of our Sponsor; as a result, in any such transaction, we may not have the benefit of arm’s-length negotiations of the type normally conducted between unrelated parties.
We have purchased and may in the future purchase assets from third parties that have existing or previous business relationships with affiliates of our Sponsor. Affiliates of our Sponsor who also perform or have performed services for such third parties may have had or have a conflict in representing our interests in these transactions on the one hand and in preserving or furthering their respective relationships with such third parties on the other hand. In any such transaction, we will not have the benefit of arm’s-length negotiations of the type normally conducted between unrelated parties.
| - 23 - |
A conflict of interest may arise between our Class E investors and our Class A, Class W and Class I investors.
We do not intend to pursue a “Liquidity Event” with respect to our Class A, Class W and Class I shares within any period of time. A “Liquidity Event” includes, but is not limited to, (a) a listing of our common stock on a national securities exchange (or the receipt by our stockholders of securities that are listed on a national securities exchange in exchange for our common stock); (b) our sale, merger or other transaction in which our stockholders either receive, or have the option to receive, cash, securities redeemable for cash, and/or securities of a publicly traded company; or (c) the sale of all or substantially all of our assets where our stockholders either receive, or have the option to receive, cash or other consideration. Although we will not be precluded from pursuing a Liquidity Event (or series thereof) if our board of directors determines that is in the best interest of our stockholders, we intend to operate as a perpetual-life REIT. With respect to our Class E stockholders, our long-term goal is to raise sufficient proceeds in our ongoing primary offering so as to be able to accommodate those holders of Class E shares who would like us to purchase or redeem their shares.
Our board of directors currently intends to make liquidity available to Class E stockholders each quarter (other than liquidity made available in the event of the death or disability of a stockholder through the Class E share redemption program) in the Class E Liquidity Amount, regardless of whether such liquidity will be made available through the Class E share redemption program or a tender offer, and excluding liquidity made available in the event of the death or disability of a stockholder through the Class E share redemption program. Our current Class E share redemption program is only available in the event of the death or disability of a stockholder and requests for redemption under the Class E share redemption program may only be made during a limited window each quarter. The board of directors will evaluate each quarter whether to make liquidity available to Class E stockholders through the Class E share redemption program or through a tender offer process. However, if we are not successful over time in generating liquidity to holders of our Class E shares through our self-tender offers and the Class E share redemption program, we may explore additional liquidity strategies for our Class E stockholders. There can be no assurances that we will seek or be successful in achieving liquidity strategies for our Class E stockholders within any certain time frame or at all. In any event, our board of directors will seek to act in the best interest of the Company as a whole, taking into consideration all classes of stockholders.
Our different intentions with respect to liquidity strategies for our Class A, Class W and Class I stockholders and our Class E stockholders may, in certain situations, lead to conflicts of interests between the groups of stockholders. In such situations, this may not result in the best course of action for any particular stockholder.
RISKS RELATED TO ADVERSE CHANGES IN GENERAL ECONOMIC CONDITIONS
Changes in global economic and capital market conditions, including periods of generally deteriorating real estate industry fundamentals, may significantly affect our results of operations and returns to our stockholders.
We are subject to risks generally incident to the ownership of real property including changes in global, national, regional or local economic, demographic, political, real estate, or capital market conditions and other factors particular to the locations of our respective real property investments. We are unable to predict future changes in these market conditions. For example, an economic downturn or rise in interest rates could make it more difficult for us to lease properties or dispose of them. In addition, rising interest rates could make alternative interest bearing and other investments more attractive and, therefore, potentially lower the relative value of our existing real estate investments.
In addition, we believe the risks associated with our business are more severe during periods of economic slowdown or recession if these periods are accompanied by deteriorating fundamentals and declining values in the real estate industry. Because all of our debt related investments outstanding as of December 31, 2015 and debt related investments we may make in the future might consist of mortgages secured by real property, these same conditions could also adversely affect the underlying borrowers and collateral of assets that we own. Declining real estate values and deteriorating real estate fundamentals would also likely reduce the level of new mortgage loan originations, since borrowers often use increases in the value of their existing properties to support the purchase of, or investment in, additional properties. Furthermore, borrowers may not be able to pay principal and interest on such loans. Declining real estate values would also significantly increase the likelihood that we would incur losses on our debt investments in the event of a default because the value of our collateral may be insufficient to cover some or all of our basis in the investment.
We have recorded impairments of four real properties, significant other-than-temporary impairment charges related to our real estate-related securities holdings, and provisions for losses on our debt related investments, as a result of such conditions that occurred recently. Please refer to our financial statements beginning on page F-1 of this Annual Report on Form 10-K for additional information. To the extent that there is a general economic slowdown or real estate fundamentals deteriorate, it may have a significant and adverse impact on our revenues, results from operations, financial condition, liquidity, overall business prospects and ultimately our ability to make distributions to our stockholders.
| - 24 - |
Uncertainty and volatility in the credit markets could affect our ability to obtain debt financing on reasonable terms, or at all, which could reduce the number of properties we may be able to acquire and the amount of cash distributions we can make to our stockholders.
The U.S. and global credit markets recently experienced severe dislocations and liquidity disruptions, which caused volatility in the credit spreads on prospective debt financings and constrained the availability of debt financing due to the reluctance of lenders to offer financing at high leverage ratios. Similar conditions in the future could adversely impact our ability to access additional debt financing on reasonable terms or at all, which may adversely affect investment returns on future acquisitions or our ability to make acquisitions.
If mortgage debt is unavailable on reasonable terms as a result of increased interest rates, increased credit spreads, decreased liquidity or other factors, we may not be able to finance the initial purchase of properties. In addition, when we incur mortgage debt on properties, we run the risk of being unable to refinance such debt upon maturity, or of being unable to refinance on favorable terms.
If interest rates are higher or other financing terms, such as principal amortization, the need for a corporate guaranty, or other terms are not as favorable when we refinance debt or issue new debt, our income could be reduced. To the extent we are unable to refinance debt on reasonable terms, at appropriate times or at all, we may be required to sell properties on terms that are not advantageous to us, or could result in the foreclosure of such properties. If any of these events occur, our cash flow would be reduced. This, in turn, would reduce cash available for distribution to our stockholders and may hinder our ability to raise more capital by issuing securities or borrowing more money.
Economic events that may cause our stockholders to request that we redeem their shares may materially adversely affect our cash flow and our ability to achieve our investment objectives.
Future economic events affecting the U.S. economy generally, or the real estate sector specifically, could cause our stockholders to seek to sell their shares to us pursuant to our share redemption programs or self-tender offers. Generally, our Class A, Class W and Class I share redemption program imposes a quarterly cap on the aggregate net redemptions of our Class A, Class W and Class I share classes equal to the amount of shares of such classes with a value (based on the redemption price per share on the day the redemption is effected) of up to 5% of the aggregate NAV of the outstanding shares of such classes as of the last day of the previous calendar quarter. Our current Class E share redemption program is even more limited. On an ongoing basis, it is only available for redemptions in connection with the death or disability of a stockholder. With respect to all other Class E stockholders, although no assurances can be made, our board of directors currently intends to make liquidity available to Class E stockholders each quarter (other than liquidity made available in the event of the death or disability of a stockholder through the Class E share redemption program) in the Class E Liquidity Amount. Even if we are able to satisfy all resulting redemption or repurchase requests, our cash flow could be materially adversely affected. In addition, if we determine to sell valuable assets to satisfy redemption or repurchase requests, our ability to achieve our investment objectives, including, without limitation, diversification of our portfolio by property type and location, moderate financial leverage, conservative operating risk and an attractive level of current income, could be materially adversely affected.
Inflation or deflation may adversely affect our financial condition and results of operations.
Although neither inflation nor deflation has materially impacted our operations in the recent past, increased inflation could have an adverse impact on our floating rate mortgages, interest rates and general and administrative expenses, as these costs could increase at a rate higher than our rental and other revenue. Inflation could also have an adverse effect on consumer spending which could impact our tenants’ sales and, in turn, our percentage rents, where applicable. Conversely, deflation could lead to downward pressure on rents and other sources of income.
The failure of any banking institution in which we deposit our funds could have an adverse effect on our results of operations, financial condition and ability to pay distributions to our stockholders.
Currently, the Federal Deposit Insurance Corporation, or FDIC, generally, only insures amounts up to $250,000 per depositor per insured bank. A small proportion of our cash and cash equivalents, primarily those used to fund property-level working capital needs, are currently held in FDIC-insured bank accounts. The significant majority of our idle cash is currently invested in a combination of AAA-rated money market mutual funds, which in turn are primarily invested in short-term, high credit quality commercial paper, U.S. government funds and Treasury funds. To the extent that we have deposited funds with banking institutions, then if any of such institutions ultimately fail, we would lose the amount of our deposits over the then current FDIC insurance limit. The loss of our deposits could reduce the amount of cash we have available to distribute or invest and would likely result in a decline in the value of your investment.
| - 25 - |
We intend to disclose funds from operations (“FFO”) and Company-defined funds from operations (“Company-Defined FFO”), each a non-GAAP financial measure, in future communications with investors, including documents filed with the Commission. However, FFO and Company-Defined FFO are not equivalent to our net income or loss as determined under GAAP, and are not complete measures of our financial position and results of operations.
We use, and we disclose to investors, FFO and Company-Defined FFO, which are considered non-GAAP financial measures. For a discussion of FFO and Company-Defined FFO, including definitions, reconciliations to GAAP net income, and their inherent limitations, see “How We Measure Our Performance” in “Item 7. Management’s Discussion and Analysis of Financial Condition and Results of Operations” included in this Annual Report on Form 10-K. FFO and Company-Defined FFO are not equivalent to our net income or loss as determined in accordance with GAAP. FFO and Company-Defined FFO and GAAP net income differ because FFO and Company-Defined FFO exclude gains or losses from sales of property and impairment of depreciable real estate, and add back real estate-related depreciation and amortization. Company-Defined FFO is also adjusted for gains and losses on real estate securities, gains and losses associated with provisions for loss on debt-related investments, acquisition-related expenses, gains and losses on derivatives and gains and losses associated with extinguishment of debt and financing commitments.
No single measure can provide investors with sufficient information and investors should consider all of our disclosures as a whole in order to adequately understand our financial position, liquidity and results of operations. Because of the differences between FFO and Company-Defined FFO and GAAP net income or loss, FFO and Company-Defined FFO may not be accurate indicators of our operating performance, especially during periods in which we are acquiring properties. In addition, FFO and Company-Defined FFO are not necessarily indicative of cash flow available to fund cash needs and investors should not consider FFO and Company-Defined FFO as alternatives to cash flows from operations or an indication of our liquidity, or indicative of funds available to fund our cash needs, including our ability to make distributions to our stockholders. Neither the Commission nor any other regulatory body has passed judgment on the acceptability of the adjustments that we use to calculate FFO and Company-Defined FFO. Also, because not all companies calculate these types of measures the same way, comparisons with other companies may not be meaningful.
RISKS RELATED TO OUR GENERAL BUSINESS OPERATIONS AND OUR CORPORATE STRUCTURE
We depend on our Advisor and its key personnel; if any of such key personnel were to cease employment with our Advisor, our business could suffer.
Our ability to make distributions and achieve our investment objectives is dependent upon the performance of our Advisor in the acquisition, disposition and management of real properties, and debt related investments, the selection of tenants for our real properties, the determination of any financing arrangements and other factors. In addition, our success depends to a significant degree upon the continued contributions of certain of our Advisor’s key personnel, including John A. Blumberg, Eileen Hallquist, Jeffrey L. Johnson, Andrea L. Karp, Richard D. Kincaid, J. Michael Lynch, Lainie P. Minnick, Gregory M. Moran, James R. Mulvihill, Taylor M. Paul, Gary M. Reiff, M. Kirk Scott, Jeffrey W. Taylor, Joshua J. Widoff, and Evan H. Zucker, each of whom would be difficult to replace. We currently do not have, nor do we expect to obtain key man life insurance on any of our Advisor’s key personnel. If our Advisor were to lose the benefit of the experience, efforts and abilities of one or more of these individuals, our operating results and NAV could suffer.
Our board of directors determines our major policies and operations, which increases the uncertainties faced by our stockholders.
Our board of directors determines our major policies, including our policies regarding acquisitions, dispositions, financing, growth, debt capitalization, REIT qualification, redemptions and distributions. Our board of directors may amend or revise these and other policies without a vote of the stockholders. Under the Maryland General Corporation Law and our charter, our stockholders have a right to vote only on limited matters. Our board of directors’ broad discretion in setting policies and our stockholders’ inability to exert control over those policies increases the uncertainty and risks our stockholders face, especially if our board of directors and our stockholders disagree as to what course of action is in our stockholders’ best interests.
Our UPREIT structure may result in potential conflicts of interest with limited partners in the Operating Partnership whose interests may not be aligned with those of our stockholders.
Limited partners in the Operating Partnership have the right to vote on certain amendments to the agreement that governs the Operating Partnership, as well as on certain other matters. Persons holding such voting rights may exercise them in a manner that conflicts with our stockholders’ interests. As general partner of the Operating Partnership, we are obligated to act in a manner that is in the best interests of all partners of the Operating Partnership. Circumstances may arise in the future when the interests of limited partners in the Operating Partnership may conflict with the interests of our stockholders. These conflicts may be resolved in a manner stockholders believe is not in their best interests.
| - 26 - |
We may assume unknown liabilities in connection with acquisitions which could result in unexpected liabilities and expenses.
In connection with an acquisition, we may receive certain assets or interests in certain assets subject to existing liabilities, some of which may be unknown to us at the time of the acquisition. Unknown liabilities might include liabilities for cleanup or remediation of undisclosed environmental conditions, claims of tenants, vendors or other persons dealing with the entities prior to this offering (including those that had not been asserted or threatened prior to this offering), tax liabilities, and accrued but unpaid liabilities incurred in the ordinary course of business. If we acquire an entity, that entity may be subject to liabilities that become our responsibility upon acquisition of the entity. Our recourse with respect to such liabilities may be limited. Depending upon the amount or nature of such liabilities, our business, financial condition and results of operations, our ability to make distributions to our stockholders and the NAV of our shares may be adversely affected.
Tax protection agreements could limit our ability to sell or otherwise dispose of property contributed to the Operating Partnership.
In connection with contributions of property to the Operating Partnership, our Operating Partnership may enter into a tax protection agreement with the contributor of such property that provides that if we dispose of any interest in the contributed property in a taxable transaction within a certain time period, subject to certain exceptions, we may be required to indemnify the contributor for its tax liabilities attributable to the built-in gain that exists with respect to such property interests, and the tax liabilities incurred as a result of such tax protection payment. Therefore, although it may be in our stockholders’ best interests that we sell the contributed property, it may be economically prohibitive for us to do so because of these obligations.
Tax protection agreements may require our Operating Partnership to maintain certain debt levels that otherwise would not be required to operate our business.
Under a tax protection agreement, our Operating Partnership may provide the contributor of property the opportunity to guarantee debt or enter into a deficit restoration obligation. If we fail to make such opportunities available, we may be required to deliver to such contributor a cash payment intended to approximate the contributor’s tax liability resulting from our failure to make such opportunities available to that contributor and the tax liabilities incurred as a result of such tax protection payment. These obligations may require the Operating Partnership to maintain more or different indebtedness than we would otherwise require for our business.
Certain provisions in the partnership agreement of our Operating Partnership may delay or defer an unsolicited acquisition of us or a change of our control.
Provisions in the partnership agreement of our Operating Partnership may delay or defer an unsolicited acquisition of us or changes of our control. These provisions include, among others, redemption rights of qualifying parties and the rights of the limited partners to consent to transfers of the general partnership interest and mergers under specified circumstances. These provisions could discourage third parties from making proposals involving an unsolicited acquisition of us or a change of our control, although some stockholders might consider such proposals, if made, desirable.
The Operating Partnership’s private placements of beneficial interests in specific Delaware statutory trusts under its DST Program could subject us to liabilities from litigation or otherwise.
On March 2, 2016, we, through the Operating Partnership, initiated a program to raise capital in private placements exempt from registration under the Securities Act through the sale of beneficial interests (“Interests”) in specific Delaware statutory trusts holding real properties, including properties currently indirectly owned by the Operating Partnership (the “DST Program”). These Interests may serve as replacement properties for investors seeking to complete like-kind exchange transactions under Section 1031 of the Code. All of the Interests sold to investors pursuant to such private placements will be leased-back by the Operating Partnership or a wholly owned subsidiary thereof, as applicable, and fully guaranteed by our Operating Partnership. Additionally, the Operating Partnership will be given a fair market value purchase option (“FMV Option”) giving it the right, but not the obligation, to acquire the Interests from the investors at a later time in exchange for OP Units. Investors who acquired Interests pursuant to such private placements may have done so seeking certain tax benefits that depend on the interpretation of, and compliance with, federal and state income tax laws and regulations. As the general partner of the Operating Partnership, we may become subject to liability, from litigation or otherwise, as a result of such transactions, including in the event an investor fails to qualify for any desired tax benefits.
| - 27 - |
The Operating Partnership’s private placements of beneficial interests in specific Delaware statutory trusts under its DST Program will not shield us from risks related to the performance of the real properties held through such structures.
Pursuant to the DST Program, the Operating Partnership intends to place certain of its existing real properties and/or acquire new properties to place into Delaware statutory trusts and then sell interests, via its taxable REIT subsidiary (TRS), in such trusts to third-party investors. We will hold long-term leasehold interests in the property pursuant to master leases that are fully guaranteed by our Operating Partnership, while the third-party investors indirectly hold, in most cases, all of the interests in the real estate. Although we will hold a fair market value purchase option (the FMV Option) to reacquire the real estate, the purchase price will be based on the then-current fair market value of the third-party investor’s interest in the real estate, which will be greatly impacted by the rental terms fixed by the long-term master lease. The lease effectively fixes our costs to sublease the property to occupying tenants until the earlier of the expiration of the master lease or our exercise of the FMV Option, while we bear the risk that the underlying cash flow from the property may be less than the master lease payments. Therefore, even though we will no longer own the underlying real estate, because of the fixed terms of the long-term master lease guaranteed by our Operating Partnership, negative performance by the underlying properties could affect cash available for distributions to our stockholders and will likely have an adverse effect on our results of operations and NAV.
We may own beneficial interests in trusts owning real property that will be subject to the agreements under our DST Program, which may have an adverse effect on our results of operations, relative to if the DST Program agreements did not exist.
In connection with the launch of our DST Program, we may own beneficial interests in trusts owning real property that are subject to the terms of the agreements provided by our DST Program. The DST Program agreements may limit our ability to encumber, lease or dispose of our beneficial interests. Such agreements could affect our ability to turn our beneficial interests into cash and could affect cash available for distributions to our stockholders. The DST Program agreements, and in some cases the financing documents, used in connection with the DST Program could also impair our ability to take actions that would otherwise be in the best interests of our stockholders and, therefore, may have an adverse effect on our results of operations and NAV, relative to if the DST Program agreements did not exist.
Cash redemptions to holders of OP Units will reduce cash available for distribution to our stockholders or to honor their redemption or repurchase requests under our share redemption programs or self-tender offers.
The holders of OP Units (other than us) generally have the right to cause the Operating Partnership to redeem all or a portion of their OP Units for, at our sole discretion, shares of our common stock, cash, or a combination of both. Our election to redeem OP Units for cash may reduce funds available for distribution to our stockholders or to honor our stockholders’ redemption or repurchase requests under our share redemption programs or self-tender offers.
Maryland law and our organizational documents limit our stockholders’ right to bring claims against our officers and directors.
Maryland law provides that a director will not have any liability as a director so long as he or she performs his or her duties in good faith, in a manner he or she reasonably believes to be in our best interests, and with the care that an ordinarily prudent person in a like position would use under similar circumstances. In addition, our charter provides that, subject to the applicable limitations set forth therein or under Maryland law, no director or officer will be liable to us or our stockholders for monetary damages. Our charter also provides that we will generally indemnify our directors, our officers, our Advisor and its affiliates for losses they may incur by reason of their service in those capacities unless their act or omission was material to the matter giving rise to the proceeding and was committed in bad faith or was the result of active and deliberate dishonesty, they actually received an improper personal benefit in money, property or services or, in the case of any criminal proceeding, they had reasonable cause to believe the act or omission was unlawful. Moreover, we have entered into separate indemnification agreements with each of our independent directors and executive officers. As a result, we and our stockholders have more limited rights against these persons than might otherwise exist under common law. In addition, we are obligated to fund the defense costs incurred by these persons in some cases. However, our charter does provide that we may not indemnify our directors, our Advisor and its affiliates for any liability or loss suffered by them unless they have determined that the course of conduct that caused the loss or liability was in our best interests, they were acting on our behalf or performing services for us, the liability or loss was not the result of negligence or misconduct by our non-independent directors, our Advisor and its affiliates or gross negligence or willful misconduct by our independent directors, and the indemnification is recoverable only out of our net assets and not from the stockholders.
| - 28 - |
Your interest will be diluted if we or the Operating Partnership issue additional securities.
Existing stockholders and new investors purchasing shares of common stock do not have preemptive rights to any shares issued by us in the future. Under our charter, we have authority to issue a total of 1,200,000,000 shares of capital stock. Of the total number of shares of capital stock authorized (a) 1,000,000,000 shares are designated as common stock, 400,000,000 of which are unclassified (however, we refer to them herein as Class E shares to more easily distinguish them from the shares offered in our Class A, Class W and Class I offering), 200,000,000 of which are classified as Class A shares, 200,000,000 of which are classified as Class W shares, and 200,000,000 of which are classified as Class I shares and (b) 200,000,000 shares are designated as preferred stock. Our board of directors may amend our charter to increase the aggregate number of authorized shares of capital stock or the number of authorized shares of capital stock of any class or series without stockholder approval. We intend to operate as a perpetual-life REIT, and investors will likely experience dilution of their equity investment in us as a result of our ongoing Class A, Class W and Class I offering, including the distribution reinvestment plan, our ongoing Class E distribution reinvestment plan and future public offerings. Investors will also experience dilution if we issue securities in one or more private offerings, issue equity compensation pursuant to our equity incentive plans, issue shares to our Advisor in lieu of cash payments or reimbursements under the Advisory Agreement, or redeem OP Units for shares of common stock. In addition, we may in the future cause the Operating Partnership to issue a substantial number of additional OP Units in order to raise capital, acquire properties, or consummate a merger, business combination or another significant transaction. OP Units may generally be converted into shares of our common stock, thereby diluting the percentage ownership interest of other stockholders. Ultimately, any additional issuance by us of equity securities or by the Operating Partnership of OP Units will dilute your indirect interest in the Operating Partnership, through which we own all of our interests in our investments.
We may issue preferred stock or new classes of OP Units, which issuance could adversely affect those stockholders who purchased shares of our common stock in our public offerings.
If we ever created and issued preferred stock or one or more new classes of OP Units with a distribution preference over common stock, payment of any distribution preferences on outstanding preferred stock or OP Units would reduce the amount of funds available for the payment of distributions on our common stock. Further, holders of preferred stock are normally entitled and holders of new classes of OP Units could be entitled to receive a preference payment in the event we liquidate, dissolve or wind up before any payment is made to our common stockholders, likely reducing the amount common stockholders would otherwise receive upon such an occurrence. Holders of preferred stock or new classes of OP Units could be given other preferential rights, such as preferential redemption rights or preferential tax protection agreements, that could reduce the amount of funds available for the payment of distributions on our common stock or otherwise negatively affect our common stockholders. In addition, under certain circumstances, the issuance of preferred stock, a new class of OP Units, or a separate class or series of common stock may render more difficult or tend to discourage:
| · | a merger, offer or proxy contest; |
| · | the assumption of control by a holder of a large block of our securities; |
| · | the removal of incumbent management; and/or |
| · | liquidity options that otherwise may be available. |
We are not limited to making acquisitions with cash or borrowings.
We are not limited to making acquisitions with cash or borrowings. We may also make investments through either public or private offerings of equity securities from us or the Operating Partnership, and we intend to do so when attractive acquisition opportunities are available. We are not limited in the number or size of investments we may make with equity issuances, and we may effect a merger, business combination or another significant transaction through equity issuances. Such issuances may be comprised of existing classes of shares of our common stock or OP Units in the Operating Partnership, new classes of shares of our common stock or OP Units in the Operating Partnership with preferential terms compared to those of our existing investors (such as preferred stock, preferred OP Units, or contractual obligations to provide protection from adverse tax consequences), or tenancy-in-common interests. We and our Operating Partnership may, with the approval of a majority of our independent directors, agree to pay additional fees to our Advisor, the dealer manager and their affiliates in connection with any such transactions, which may negatively affect the NAV of your shares, our ability to pay distributions and your overall return.
The limit on the percentage of shares of our common stock that any person may own may discourage a takeover or business combination that may have benefited our stockholders.
Our charter restricts the direct or indirect ownership by one person or entity to no more than 9.8% of the value of our then outstanding capital stock (which includes common stock and any preferred stock we may issue) and no more than 9.8% of the value or number of shares, whichever is more restrictive, of our then outstanding common stock. This restriction may discourage a change of control of us and may deter individuals or entities from making tender offers for shares of our common stock on terms that might be financially attractive to stockholders or which may cause a change in our management. This ownership restriction may also prohibit business combinations that would have otherwise been approved by our board of directors and our stockholders. In addition to deterring potential transactions that may be favorable to our stockholders, these provisions may also decrease our stockholders’ ability to sell their shares of our common stock.
| - 29 - |
Although we are not currently afforded the full protection of the Maryland General Corporation Law relating to deterring or defending hostile takeovers, our board of directors could opt into these provisions of Maryland law in the future, which may discourage others from trying to acquire control of us and may prevent our stockholders from receiving a premium price for their stock in connection with a business combination.
Under Maryland law, “business combinations” between a Maryland corporation and certain interested stockholders or affiliates of interested stockholders are prohibited for five years after the most recent date on which the interested stockholder becomes an interested stockholder. These business combinations include a merger, consolidation, share exchange, or, in circumstances specified in the statute, an asset transfer or issuance or reclassification of equity securities. Also under Maryland law, control shares of a Maryland corporation acquired in a control share acquisition have no voting rights except to the extent approved by a vote of two-thirds of the votes entitled to be cast on the matter. Shares owned by the acquirer, an officer of the corporation or an employee of the corporation who is also a director of the corporation are excluded from the vote on whether to accord voting rights to the control shares. Should our board of directors opt into these provisions of Maryland law, it may discourage others from trying to acquire control of us and increase the difficulty of consummating any offer. Similarly, provisions of Title 3, Subtitle 8 of the Maryland General Corporation Law could provide similar anti-takeover protection.
Our charter includes a provision regarding tender offers that may discourage a stockholder from launching a tender offer for our shares.
Our charter provides that any person making a tender offer that is not otherwise subject to Regulation 14D of the Exchange Act, including any “mini-tender” offer, must comply with most of the provisions of Regulation 14D of the Exchange Act, including the notice and disclosure requirements. In addition, the offeror must provide us notice of such tender offer at least 10 business days before initiating the tender offer. If the offeror does not comply with the provisions set forth above, we will have the right to redeem that offeror’s shares, if any, and any shares acquired in such tender offer. In addition, the non-complying offeror will be responsible for all of our expenses in connection with that offeror’s noncompliance. This provision of our charter may discourage a stockholder from initiating a tender offer for our shares.
We depend on our relationships with lenders, joint venture partners, and property managers to conduct our business. If we fail to honor any of our contractual obligations, there could be a material and adverse impact on our ability to raise capital or manage our portfolio.
If we are viewed as developing underperforming properties, suffer sustained losses on our investments, default on a significant level of loans or experience significant foreclosure of our properties, our reputation could be damaged. Damage to our reputation could make it more difficult to successfully develop or acquire properties in the future and to continue to grow and expand our relationships with our lenders, joint venture partners, tenants and third-party management clients, which could adversely affect our business, financial condition, NAV, results of operations and ability to make distributions.
RISKS RELATED TO INVESTMENTS IN REAL PROPERTY
Real properties are illiquid investments, and we may be unable to adjust our portfolio in response to changes in economic or other conditions or sell a property if or when we decide to do so.
Real properties are illiquid investments and we may be unable to adjust our portfolio in response to changes in economic or other conditions. In addition, the real estate market is affected by many factors, such as general economic conditions, availability of financing, interest rates and other factors, including supply and demand, that are beyond our control. We cannot predict whether we will be able to sell any real property for the price or on the terms set by us, or whether any price or other terms offered by a prospective purchaser would be acceptable to us. We cannot predict the length of time needed to find a willing purchaser and to close the sale of a real property. In addition, we may acquire real properties that are subject to contractual “lock-out” provisions that could restrict our ability to dispose of the real property for a period of time.
We may also be required to expend funds to correct defects or to make improvements before a property can be sold. We cannot assure you that we will have funds available to correct such defects or to make such improvements.
| - 30 - |
In acquiring a real property, we may agree to restrictions that prohibit the sale of that real property for a period of time or impose other restrictions, such as a limitation on the amount of debt that can be placed or repaid on that real property. Our real properties may also be subject to resale restrictions. All of these provisions would restrict our ability to sell a property.
We are dependent on tenants for revenue, and our inability to lease our real properties or to collect rent from our tenants may adversely affect our results of operations, NAV and returns to our stockholders.
Our revenues from our real property investments are dependent on our ability to lease our real properties and the creditworthiness of our tenants and would be adversely affected by the loss of or default by one or more significant lessees. Furthermore, certain of our assets may utilize leases with payments directly related to tenant sales, where the amount of rent that we charge a tenant is calculated as a percentage of such tenant’s revenues over a fixed period of time, and a reduction in sales can reduce the amount of the lease payments required to be made to us by tenants leasing space in such assets. The success of those real properties depends on the financial stability of the respective tenants. The financial results of our tenants can depend on several factors, including but not limited to the general business environment, interest rates, inflation, the availability of credit, taxation and overall consumer confidence. The recent economic downturn has, and may continue to, impact all of these factors, some to a greater degree than others.
In addition, our ability to increase our revenues and operating income partially depends on steady growth of demand for the products and services offered by the tenants located in the assets that we own and manage. A drop in demand, as a result of a slowdown in the U.S. and global economy or otherwise, could result in a reduction in tenant performance and consequently, adversely affect our results of operations, NAV and returns to our stockholders. Inflation could also have an adverse effect on consumer spending which could impact our tenants’ sales and, in turn, our percentage rents, where applicable. Conversely, deflation could lead to downward pressure on rents and other sources of income.
If indicators of impairment exist in any of our real properties, for example, we experience negative operating trends such as prolonged vacancies or operating losses, we may not recover some or all of our investment. Please refer to our financial statements beginning on page F-1 of this Annual Report on Form 10-K for historical information regarding our impairments.
Lease payment defaults by tenants could cause us to reduce the amount of distributions to our stockholders and could force us to find an alternative source of funds to make mortgage payments on any mortgage loans. In the event of a tenant default, we may also experience delays in enforcing our rights as landlord and may incur substantial costs in protecting our investment and re-leasing our real property. If a lease is terminated, we may be unable to lease the real property for the rent previously received or sell the real property without incurring a loss.
If the market for commercial real estate experiences increased vacancy rates, particularly in certain large metropolitan areas, it could result in lower revenues for us.
In the past decade, there have been global economic downturns that negatively impacted the commercial real estate market in the U.S., particularly in certain large metropolitan areas, and resulted in, among other things, increased tenant defaults under leases, generally lower demand for rentable space, and an oversupply of rentable space, all of which could lead to increased concessions, tenant improvement expenditures or reduced rental rates to maintain occupancies. We believe that the risks associated with our business could be more severe if the economy deteriorates again or if commercial real estate values decline. Our revenues will decline and our NAV and ability to pay distributions will be negatively impacted if our commercial properties experience higher vacancy rates or decline in value.
A real property that incurs a vacancy could be difficult to sell or re-lease.
A real property may incur a vacancy either by the continued default of a tenant under its lease or the expiration of the lease. In addition, certain of the real properties we acquire may have some vacancies at the time of closing. Certain other real properties may be specifically suited to the particular needs of a tenant and such real property may become vacant. Certain of our leases with retail tenants contain provisions giving the particular tenant the exclusive right to sell particular types of merchandise or provide specific types of services within the particular retail center. These provisions may limit the number and types of prospective tenants interested in leasing space in a particular retail property. Therefore, we may have difficulty obtaining a new tenant for any vacant space we have in our real properties. If the vacancy continues for a long period of time, we would suffer reduced revenues, which could materially and adversely affect our liquidity and NAV, and result in lower cash distributions to our stockholders. In addition, the resale value of the real property could be diminished because the market value may depend principally upon the value of the leases of such real property.
| - 31 - |
Adverse economic and other conditions in the regions where our assets are located may have a significant adverse impact on our financial results.
A deterioration of general economic or other relevant conditions, changes in governmental laws and regulations, acts of nature, demographics or other factors in any of the states or the geographic region in which our assets are located could result in the loss of a tenant, a decrease in the demand for our properties and a decrease in our revenues from those markets, which in turn may have a disproportionate and material adverse effect on our results of operations and financial condition. In addition, some of our investments are located in areas that are more susceptible to natural disasters, and therefore, our tenants and properties are particularly susceptible to revenue loss, cost increase or damage caused by earthquakes or other severe weather conditions or natural disasters. Any significant loss due to a natural disaster may not be covered by insurance and may lead to an increase in the cost of insurance and expenses for our tenants, or could limit the future availability of such insurance, which could limit our tenants’ ability to satisfy their obligations to us.
In addition, our results of operations depend substantially on our ability to lease the areas available in the assets that we own as well as the price at which we lease such space. Adverse conditions in the regions and specific markets where we operate may reduce our ability to lease our properties, reduce occupancy levels, restrict our ability to increase lease prices and force us to lower lease prices and/or offer tenant incentives. Should our assets fail to generate sufficient revenues for us to meet our obligations, our financial condition and results of operations, as well as our NAV and ability to make distributions, could be adversely affected.
Properties that have significant vacancies, especially value-add or other types of discounted real estate assets, may experience delays in leasing up or could be difficult to sell, which could diminish our return on these properties and the return on your investment.
Our investments in value-add properties or other types of discounted properties may have significant vacancies at the time of acquisition. If vacancies continue for a prolonged period of time beyond the expected lease-up stage that we anticipate will follow any redevelopment or repositioning efforts, we may suffer reduced revenues, resulting in less cash available for distributions to our stockholders. In addition, the resale value of the property could be diminished because the market value of a particular property depends principally upon the value of the cash flow generated by the leases associated with that property. Such a reduction on the resale value of a property could also reduce our NAV and the overall return on your investment.
Changes in supply of or demand for similar real properties in a particular area may increase the price of real property assets we seek to purchase or adversely affect the value of the real property assets that we own.
The real estate industry is subject to market forces and we are unable to predict certain market changes including changes in supply of or demand for similar real properties in a particular area. For example, if demand for the types of real property assets in which we seek to invest were to sharply increase or supply of those assets were to sharply decrease, the prices of those assets could rise significantly. Any potential purchase of an overpriced asset could decrease our rate of return on these investments and result in lower operating results and overall returns to our stockholders. Likewise, a sharp increase in supply could adversely affect leasing rates and occupancy, which could lower operating results, our NAV and overall returns to our stockholders.
Actions of our joint venture partners could adversely impact our performance.
We have entered into and may continue to enter into joint ventures with third parties, including entities that are affiliated with our Advisor or entities sponsored or advised by affiliates of our Sponsor. We have purchased and developed and may also continue to purchase and develop properties in joint ventures or in partnerships, co-tenancies or other co-ownership arrangements with the sellers of the properties, affiliates of the sellers, developers or other persons. Such investments may involve risks not otherwise present with a direct investment in real estate, including, for example:
| · | the possibility that our venture partner, co-tenant or partner in an investment might become bankrupt or otherwise be unable to meet its capital contribution obligations; |
| · | that such venture partner, co-tenant or partner may at any time have economic or business interests or goals which are or which become inconsistent with our business interests or goals; |
| · | that such venture partner, co-tenant or partner may be in a position to take action contrary to our instructions or requests or contrary to our policies or objectives; |
| · | that actions by such venture partner, co-tenant or partner could adversely affect our reputation, negatively impacting our ability to conduct business; or | |
| - 32 - |
| · | that such venture partner, co-tenant or partner has legal or other effective control over the asset. |
Actions by a joint venture partner or co-tenant might have the result of subjecting the property to liabilities in excess of those contemplated and may have the effect of reducing our stockholders’ returns.
Under certain joint venture arrangements, neither venture partner may have the power to control the venture, and an impasse could be reached, which might have a negative influence on the joint venture and decrease potential returns to our stockholders. In the event that a venture partner has a right of first refusal to buy out the other partner, it may be unable to finance such a buy-out at that time. It may also be difficult for us to sell our interest in any such joint venture or partnership or as a co-tenant in a particular property. In addition, to the extent that our venture partner or co-tenant is an affiliate of our Advisor or an entity sponsored or advised by affiliates of our Sponsor, certain conflicts of interest will exist.
We compete with numerous other parties or entities for real property investments and tenants, and we may not compete successfully.
We compete with numerous other persons or entities seeking to buy real property assets or to attract tenants to real properties we already own, which may have a negative impact on our ability to acquire real property assets or attract tenants on favorable terms, if at all, and the returns on our real property assets. These persons or entities may have greater experience and financial strength than us. For example, our competitors may be willing to offer space at rental rates below our rates, causing us to lose existing or potential tenants and pressuring us to reduce our rental rates to retain existing tenants or convince new tenants to lease space at our properties. Similarly, the opening of new competing assets near the assets that we own may hinder our ability to renew our existing leases or to lease to new tenants, because the proximity of new competitors may divert existing or new tenants to such competitors. In addition, if market rental rates decline during the term of an existing lease, we may be unable to renew or find a new tenant without lowering the rental rate. Each of these factors could adversely affect our results of operations, financial condition, NAV and ability to pay distributions to our stockholders.
Delays in the acquisition, development and construction of real properties or debt investments may have adverse effects on portfolio diversification, results of operations and returns to our stockholders.
Delays we encounter in selecting, acquiring and developing additional real properties or debt investments could adversely affect our stockholders’ returns. The uncertain state of the real estate markets in recent years and the resulting incentives of lenders and sellers to retain their investments had previously led to generally lower transaction volume in the broader real estate market and for us, in part due to pricing and valuation uncertainties. It is possible that such disruptions and uncertainties may reoccur. Alternatively, increased competition for high quality investments may also limit our ability to make incremental accretive investments in real properties and debt investments. These factors may continue to have a negative effect on our stockholders’ returns, and may also hinder our ability to reach our portfolio diversification objectives.
In addition, where properties are acquired prior to the start of construction or during the early stages of construction, it will typically take several months to complete construction and rent available space. Therefore, we may not receive any income from these properties for a significant period of time following acquisition, and distributions to our stockholders could suffer. Delays in the completion of construction could give tenants the right to terminate preconstruction leases for space at a newly developed project. We may incur additional risks when we make periodic progress payments or other advances to builders prior to completion of construction. Each of those factors could result in increased costs of a project or loss of our investment. In addition, we will be subject to normal lease-up risks relating to newly constructed projects. Furthermore, the price we agree to for a real property will be based on our projections of rental income and expenses and estimates of the fair market value of the real property upon completion of construction. If our projections are inaccurate, we may pay too much for a property.
We may be unable to achieve our diversification goals or to realize benefits from diversification.
Our objective is to build a high-quality, diversified real estate portfolio. Although there can be no assurance that we will achieve this objective, we intend to diversify our portfolio by key portfolio attributes including, but not limited to, (1) property type, (2) target market, with consideration given to geographic concentrations, (3) average lease terms and portfolio occupancy expectations, (4) tenant concentrations, including credit and exposure to particular businesses or industries and (5) debt profile with the goal of maximizing flexibility while seeking to minimize cost and mitigate the risks associated with changes in interest rates and debt maturities. However, we may not successfully implement our diversification strategy. For example, although we may target investments in four primary property categories of office, industrial, retail and multifamily, we currently do not own any multifamily investments and have recently sold a large portion of our industrial holdings. Even if we do fully achieve our diversification goals, it is possible our diversified portfolio will not perform as well as a portfolio that is concentrated in a particular type of real estate.
| - 33 - |
We may alter our exposure to various property categories and we may not always own properties in each category.
We may target investments in four primary property categories of office, industrial, retail and multifamily. Although we aim to diversify our real estate portfolio by owning properties in each of these categories, we may not always have significant holdings, or any holdings at all, in each category. For example, we currently have no multifamily investments and have recently sold a large portion of our industrial holdings. We may elect to increase or decrease our holdings in each category at any time and we may change our target property categories at any time. If we decrease or eliminate our holdings in any property category or cease to target any of the four property categories our real estate portfolio will be less diversified and we may not realize the benefits of diversification.
We are subject to the risk that, with respect to assets that we have acquired and may acquire based on growth potential, such growth potential is not realized.
In 2015, we disposed of approximately $496.2 million of assets and we acquired approximately $341.3 million of assets. The assets that we sold were generally higher-yielding than the new assets we acquired, although we believe the acquired assets exhibit greater potential for revenue growth going forward. We believe that market conditions may cause us to continue to explore in certain markets the disposition of higher-yielding assets and in certain target markets the acquisition of assets that may generate lower yields but with greater growth potential. Although there can be no assurance that we will pursue this strategy or be successful in its execution, this may mean that, for some period of time, higher-yielding assets are sold from our portfolio in exchange for assets that initially may produce lower current income but which we believe will generate increased income over time through increased tenant demand and rental rate growth in order to generate long term growth in NAV. With respect to such assets, we are subject to the risk that the expected growth potential is not realized. This may result from a variety of factors, including but not limited to unanticipated changes in local market conditions or increased competition for similar properties in the same market. Acquiring properties that do not realize their expected growth potential, or properties that take longer than expected to realize their growth potential, would likely negatively affect our NAV, limit our ability to pay distributions to you and reduce your overall returns.
Our real properties are subject to property and other taxes that may increase in the future, which could adversely affect our cash flow.
Our real properties are subject to real and personal property and other taxes that may increase as tax rates change and as the properties are assessed or reassessed by taxing authorities. Certain of our leases provide that the property taxes, or increases therein, are charged to the lessees as an expense related to the real properties that they occupy while other leases will generally provide that we are responsible for such taxes. In any case, as the owner of the properties, we are ultimately responsible for payment of the taxes to the applicable governmental authorities. If property taxes increase, our tenants may be unable to make the required tax payments, ultimately requiring us to pay the taxes even if otherwise stated under the terms of the lease. If we fail to pay any such taxes, the applicable taxing authorities may place a lien on the property and the property may be subject to a tax sale. In addition, we will generally be responsible for property taxes related to any vacant space.
We are subject to litigation that could adversely affect our results of operations
We are a defendant from time to time in lawsuits and/or regulatory proceedings relating to our business. Unfavorable outcomes resulting from such lawsuits and/or regulatory proceedings could adversely impact our business, financial condition, NAV or results of operations.
Uninsured losses or premiums for insurance coverage relating to real property may adversely affect our returns.
There are types of losses, generally catastrophic in nature, such as losses due to wars, acts of terrorism, earthquakes, floods, hurricanes, pollution or environmental matters that are uninsurable or not economically insurable, or may be insured subject to limitations, such as large deductibles or co-payments. Risks associated with potential acts of terrorism could sharply increase the premiums we pay for coverage against property and casualty claims. Additionally, mortgage lenders sometimes require commercial property owners to purchase specific coverage against terrorism as a condition for providing mortgage loans. These policies may not be available at a reasonable cost, if at all, which could inhibit our ability to finance or refinance our real properties. In such instances, we may be required to provide other financial support, either through financial assurances or self-insurance, to cover potential losses. Changes in the cost or availability of insurance could expose us to uninsured casualty losses. In the event that any of our real properties incurs a casualty loss that is not fully covered by insurance, the value of our assets will be reduced by any such uninsured loss. In addition, we could be held liable for indemnifying possible victims of an accident. We cannot assure our stockholders that funding will be available to us for the repair or reconstruction of damaged real property in the future or for liability payments to accident victims.
| - 34 - |
The real estate industry is subject to extensive regulation, which may result in higher expenses or other negative consequences that could adversely affect us.
Our activities are subject to federal, state and municipal laws, and to regulations, authorizations and license requirements with respect to, among other things, zoning, environmental protection and historical heritage, all of which may affect our business. We may be required to obtain licenses and permits with different governmental authorities in order to acquire and manage our assets.
In addition, the Dodd-Frank Wall Street Reform and Consumer Protection Act (the “Dodd-Frank Act”), which generally took effect in 2011, contains a sweeping overhaul of the regulation of financial institutions and the financial markets. Key provisions of the Dodd-Frank Act require extensive rulemaking by the Commission and the U.S. Commodity Futures Trading Commission, some of which remains ongoing. Thus, the full impact of the Dodd-Frank Act on our business cannot be fully assessed until all final implementing rules and regulations are promulgated.
Various aspects of the Dodd-Frank Act may have a significant impact on our business, including, without limitation, provisions of the legislation that increase regulation of and disclosure requirements related to investment advisors, swap transactions and hedging policies, corporate governance and executive compensation, investor protection and enforcement provisions, and asset-backed securities.
For example, but not by way of limitation, the Dodd-Frank Act and the rulemaking thereunder provides for significantly increased regulation of the derivatives markets and transactions that affect our interest rate hedging activities, including: (i) regulatory reporting, (ii) subject to limited exemptions, mandated clearing through central counterparties and execution on regulated exchanges or execution facilities, and (iii) margin and collateral requirements. While the full impact of the Dodd-Frank Act on our interest rate hedging activities cannot be fully assessed until all final implementing rules and regulations are promulgated, the foregoing requirements may affect our ability to enter into hedging or other risk management transactions, may increase our costs in entering into such transactions, and/or may result in us entering into such transactions on less favorable terms than prior to effectiveness of the Dodd-Frank Act. For example, subject to an exception for “end-users” of swaps upon which we may seek to rely, we may be required to clear certain interest rate hedging transactions by submitting them to a derivatives clearing organization. In addition, to the extent we are required to clear any such transactions, we will be required to, among other things, post margin in connection with such transactions. The occurrence of any of the foregoing events may have an adverse effect on our business and our stockholders’ return.
In addition, public authorities may enact new and more stringent standards, or interpret existing laws and regulations in a more restrictive manner, which may force companies in the real estate industry, including us, to spend funds to comply with these new rules. Any such action on the part of public authorities may adversely affect our results from operations.
In the event of noncompliance with such laws, regulations, licenses and authorizations, we may face the payment of fines, project shutdowns, cancellation of licenses, and revocation of authorizations, in addition to other civil and criminal penalties.
Costs of complying with governmental laws and regulations related to environmental protection and human health and safety may be high.
All real property and the operations conducted on the real property are subject to federal, state and local laws and regulations relating to environmental protection and human health and safety. Some of these laws and regulations may impose joint and several liability on tenants, owners or operators for the costs to investigate or remediate contaminated properties, regardless of fault or whether the acts causing the contamination were legal.
Under various federal, state and local environmental laws, a current or previous owner or operator of real property may be liable for the cost of removing or remediating hazardous or toxic substances on such real property. Such laws often impose liability whether or not the owner or operator knew of, or was responsible for, the presence of such hazardous or toxic substances. Third parties may also sue the owner or operator of a site for damages based on personal injury, natural resources or property damage or other costs, including investigation and clean-up costs resulting from the environmental contamination. In addition, the presence of hazardous substances, or the failure to properly remediate these substances, may adversely affect our ability to sell, rent or pledge such real property as collateral for future borrowings. Environmental laws also may impose restrictions on the manner in which real property may be used or businesses may be operated. A property owner who violates environmental laws may be subject to sanctions, which may be enforced by government agencies or, in certain circumstances, private parties. Some of these laws and regulations have been amended so as to require compliance with new or more stringent standards as of future dates. Compliance with new or more stringent laws or regulations or stricter interpretation of existing laws may require us to incur material expenditures. Future laws, ordinances or regulations may impose material environmental liability. Our tenants’ operations, the existing condition of land when we buy it, operations in the vicinity of our real properties, such as the presence of underground storage tanks, or activities of unrelated third parties may affect our real properties. In addition, there are various local, state and federal fire, health, life-safety and similar regulations with which we may be required to comply, and which may subject us to liability in the form of fines or damages for noncompliance. In connection with the acquisition and ownership of our real properties, we may be exposed to such costs in connection with such regulations. The cost of defending against environmental claims, of any damages or fines we must pay, of compliance with environmental regulatory requirements or of remediating any contaminated real property could materially and adversely affect our business, lower the value of our assets or results of operations and, consequently, lower our NAV and the amounts available for distribution to our stockholders.
| - 35 - |
Environmental laws in the U.S. also require that owners or operators of buildings containing asbestos properly manage and maintain the asbestos, adequately inform or train those who may come into contact with asbestos and undertake special precautions, including removal or other abatement, in the event that asbestos is disturbed during building renovation or demolition. These laws may impose fines and penalties on building owners or operators who fail to comply with these requirements and may allow third parties to seek recovery from owners or operators for personal injury associated with exposure to asbestos. Some of our properties may contain asbestos-containing building materials.
From time to time, we may acquire properties, or interests in properties, with known adverse environmental conditions where we believe that the environmental liabilities associated with these conditions are quantifiable and that the acquisition will yield a superior risk-adjusted return. In such an instance, we will underwrite the costs of environmental investigation, clean-up and monitoring into the cost. Further, in connection with property dispositions, we may agree to remain responsible for, and to bear the cost of, remediating or monitoring certain environmental conditions on the properties.
Generally, our properties are subject to a Phase I or similar environmental assessment by independent environmental consultants prior to or in connection with our acquisition of such properties. Phase I assessments are intended to discover and evaluate information regarding the environmental condition of the surveyed property and surrounding properties. Phase I assessments generally include a historical review, a public records review, an investigation of the surveyed site and surrounding properties, and preparation and issuance of a written report, but do not include soil sampling or subsurface investigations and typically do not include an asbestos survey. We cannot give any assurance that an environmental liability that we believe would have a material adverse effect on our business, financial condition or results of operations taken as a whole, will not currently exist at the time of acquisition or may not arise in the future, with respect to any of our properties. Material environmental conditions, liabilities or compliance concerns may arise after an environmental assessment has been completed. Moreover, there can be no assurance that future laws, ordinances or regulations will not impose any material environmental liability, or that the then current environmental condition of our properties will not be affected by tenants, by the condition of land or operations in the vicinity of such properties (such as releases from underground storage tanks), or by third parties unrelated to us.
The costs associated with complying with the Americans with Disabilities Act may reduce the amount of cash available for distribution to our stockholders.
Investment in real properties may also be subject to the Americans with Disabilities Act of 1990, as amended. Under this act, all places of public accommodation are required to comply with federal requirements related to access and use by disabled persons. The act has separate compliance requirements for “public accommodations” and “commercial facilities” that generally require that buildings and services be made accessible and available to people with disabilities. The act’s requirements could require us to remove access barriers and our failure to comply with the act’s requirements could result in the imposition of injunctive relief, monetary penalties or, in some cases, an award of damages. We will attempt to acquire properties that comply with the act or place the burden on the seller or other third party, such as a tenant, to ensure compliance with the act. We cannot assure our stockholders that we will be able to acquire properties or allocate responsibilities in this manner. Any monies we use to comply with the act will reduce our NAV and the amount of cash available for distribution to our stockholders.
We may not have funding for future tenant improvements, which may adversely affect the value of our assets, our results of operations and returns to our stockholders.
When a tenant at one of our real properties does not renew its lease or otherwise vacates its space in one of our buildings, it is likely that, in order to attract one or more new tenants, we will be required to expend substantial funds to construct new tenant improvements in the vacated space. We expect to invest the net proceeds from our Class A, Class W and Class I offering in real estate-related investments, and we do not anticipate that we will maintain permanent working capital reserves. We do not currently have an identified funding source to provide funds that may be required in the future for tenant improvements and tenant refurbishments in order to attract new tenants. If we do not establish sufficient reserves for working capital or obtain adequate financing to supply necessary funds for capital improvements or similar expenses, we may be required to defer necessary or desirable improvements to our real properties. If we defer such improvements, the applicable real properties may decline in value, and it may be more difficult for us to attract or retain tenants to such real properties or the amount of rent we can charge at such real properties may decrease. We cannot assure our stockholders that we will have any sources of funding available to us for the repair or reconstruction of damaged real property in the future.
| - 36 - |
Lease agreements may have specific provisions that create risks to our business and may adversely affect us.
Our lease agreements are regulated by local, municipal, state and federal laws, which may grant certain rights to tenants, such as the compulsory renewal of their lease by filing lease renewal actions when certain legal conditions are met. A lease renewal action may represent two principal risks for us: (i) if we plan to vacate a given unit in order to change or adapt an asset’s mix of tenants, the tenant could remain in that unit by filing a lease renewal action and interfere with our strategy; and (ii) if we desire to increase the lease price for a specific unit, this increase may need to be approved in the course of a lease renewal action, and the final value could be decided at the discretion of a judge. We would then be subject to the court’s interpretation and decision, and could be forced to accept an even lower price for the lease of the unit. The compulsory renewal of our lease agreements and/or the judicial review of our lease prices may adversely affect our cash flow and our operating results.
Certain of our lease agreements may not be “triple net leases,” under which the lessee undertakes to pay all the expenses of maintaining the leased property, including insurance, taxes, utilities and repairs. We will be exposed to higher maintenance, tax, and property management expenses with respect to all of our leases that are not “triple net.”
Operating expenses, such as expenses for fuel, utilities, labor, building materials and insurance are not fixed and may increase in the future. There is no guarantee that we will be able to pass such increases on to our tenants. To the extent such increases cannot be passed on to our tenants, any such increases would cause our cash flow, NAV and operating results to decrease.
We depend on the availability of public utilities and services, especially for water and electric power. Any reduction, interruption or cancellation of these services may adversely affect us.
Public utilities, especially those that provide water and electric power, are fundamental for the sound operation of our assets. The delayed delivery or any material reduction or prolonged interruption of these services could allow certain tenants to terminate their leases or result in an increase in our costs, as we may be forced to use backup generators, which also could be insufficient to fully operate our facilities and could result in our inability to provide services. Accordingly, any interruption or limitation in the provision of these essential services may adversely affect us.
RISKS RELATED TO INVESTMENTS IN REAL ESTATE-RELATED DEBT AND SECURITIES
The mortgage loans in which we invest will be subject to the risk of delinquency, foreclosure and loss, which could result in losses to us.
Commercial mortgage loans are secured by commercial property and are subject to risks of delinquency and foreclosure and risks of loss. The ability of a borrower to repay a loan secured by a property typically is dependent primarily upon the successful operation of such property rather than upon the existence of independent income or assets of the borrower. If the net operating income of the property is reduced, the borrower’s ability to repay the loan may be impaired. Net operating income of an income-producing property can be affected by, among other things: tenant mix, success of tenant businesses, property management decisions, property location and condition, competition from comparable types of properties, changes in laws that increase operating expenses or limit rents that may be charged, any need to address environmental contamination at the property, the occurrence of any uninsured casualty at the property, changes in national, regional or local economic conditions and/or specific industry segments, current and potential future capital markets uncertainty, declines in regional or local real estate values, declines in regional or local rental or occupancy rates, increases in interest rates, real estate tax rates and other operating expenses, changes in governmental rules, regulations and fiscal policies, including environmental legislation, acts of God, terrorism, social unrest and civil disturbances.
In the event of any default under a mortgage loan held directly by us, we will bear a risk of loss of principal to the extent of any deficiency between the value of the collateral and the principal and accrued interest of the mortgage loan, which could have a material adverse effect on our cash flow from operations and results from operations and limit amounts available for distribution to our stockholders. In the event of the bankruptcy of a mortgage loan borrower, the mortgage loan to such borrower will be deemed to be secured only to the extent of the value of the underlying collateral at the time of bankruptcy (as determined by the bankruptcy court), and the lien securing the mortgage loan will be subject to the avoidance powers of the bankruptcy trustee or debtor-in-possession to the extent the lien is unenforceable under state law. Foreclosure of a mortgage loan can be an expensive and lengthy process, which could have a substantial adverse effect on our anticipated return on the foreclosed mortgage loan. In addition, if we foreclose on a particular property, we could become, as owner of the property, subject to liabilities associated with such property, including liabilities related to taxes and environmental matters.
| - 37 - |
The mezzanine loans and B-notes in which we invest involve greater risks of loss than senior loans secured by income-producing real properties.
We invest in mezzanine loans and B-notes that substantially take the form of subordinated loans secured by second mortgages on the underlying real property or loans secured by a pledge of the ownership interests of either the entity owning the real property or the entity that owns the interest in the entity owning the real property. These types of investments involve a higher degree of risk than long-term senior mortgage loans secured by income-producing real property because the investment may become unsecured as a result of foreclosure by the senior lender. In the event of a bankruptcy of the entity providing the pledge of its ownership interests as security, we may not have full recourse to the assets of such entity, or the assets of the entity may not be sufficient to satisfy our mezzanine loan in whole or in part. In addition, there may be significant delays and costs associated with the process of foreclosing on collateral securing or supporting these investments. If a borrower defaults on our mezzanine loan or debt senior to our loan, or in the event of a borrower bankruptcy, our mezzanine loan will be satisfied only after the senior debt. As a result, we may not recover some or all of our investment. In addition, mezzanine loans may have higher loan-to-value ratios than conventional mortgage loans, resulting in less equity in the real property and increasing the risk of loss of principal. Further, even if we are successful in foreclosing on the equity interests serving as collateral for our mezzanine loans, such foreclosure will result in us inheriting all of the liabilities of the underlying mortgage borrower, including the senior mortgage on the applicable property. This may result in both increased costs to us and a negative impact on our overall debt covenants and occupancy levels. In many cases a significant restructuring of the senior mortgage may be required in order for us to be willing to retain longer term ownership of the property. If we are unsuccessful in restructuring the underlying mortgage debt in these scenarios, the mortgage lender ultimately may foreclose on the property causing us to lose any remaining investment. Please refer to our financial statements beginning on page F-1 of this Annual Report on Form 10-K for historical information regarding our losses on debt-related investments.
A portion of our debt related investments may be considered illiquid, and we may not be able to adjust our portfolio in response to changes in economic and other conditions.
Certain of the debt related investments that we have purchased or may purchase in the future in connection with privately negotiated transactions are not or may not be registered under the relevant securities laws, resulting in a prohibition against their transfer, sale, pledge or other disposition except in a transaction that is exempt from the registration requirements of, or is otherwise effected in accordance with, those laws. As a result, our ability to vary our portfolio in response to changes in economic and other conditions may be limited. In addition, due to current credit market conditions, certain of our registered securities may not be as liquid as when originally purchased.
Bridge loans may involve a greater risk of loss than conventional mortgage loans.
We may provide bridge loans secured by first lien mortgages on properties to borrowers who are typically seeking short-term capital to be used in an acquisition, development or refinancing of real estate. The borrower may have identified an undervalued asset that has been undermanaged or is located in a recovering market. If the market in which the asset is located fails to recover according to the borrower’s projections, or if the borrower fails to improve the quality of the asset’s management or the value of the asset, the borrower may not receive a sufficient return on the asset to satisfy the bridge loan, and we may not recover some or all of our investment.
In addition, owners usually borrow funds under a conventional mortgage loan to repay a bridge loan. We may, therefore, be dependent on a borrower’s ability to obtain permanent financing to repay our bridge loan, which could depend on market conditions and other factors. Bridge loans, like other loans secured directly or indirectly by property, are subject to risks of borrower defaults, bankruptcies, fraud, losses and special hazard losses that are not covered by standard hazard insurance. In the event of any default under bridge loans held by us, we bear the risk of loss of principal and nonpayment of interest and fees to the extent of any deficiency between the value of the mortgage collateral and the principal amount of the bridge loan. Any such losses with respect to our investments in bridge loans could have an adverse effect on our NAV, results of operations, and financial condition.
Interest rate and related risks may cause the value of our real estate-related securities investments to be reduced.
Interest rate risk is the risk that fixed-income securities such as preferred and debt securities, and to a lesser extent dividend paying common stocks, will decline in value because of changes in market interest rates. Generally, when market interest rates rise, the market value of such securities will decline, and vice versa. In addition, during periods of rising interest rates, the average life of certain types of securities may be extended because of slower than expected principal payments. This may lock in a below-market interest rate, increase the security’s duration and reduce the value of the security. This is known as extension risk. During periods of declining interest rates, an issuer may be able to exercise an option to prepay principal earlier than scheduled, which is generally known as call or prepayment risk. If this occurs, we may be forced to reinvest in lower yielding securities. This is known as reinvestment risk. Preferred and debt securities frequently have call features that allow the issuer to repurchase the security prior to its stated maturity. An issuer may redeem an obligation if the issuer can refinance the debt at a lower cost due to declining interest rates or an improvement in the credit standing of the issuer. To the extent we invest in real estate-related securities going forward, these risks may reduce the value of such investments.
| - 38 - |
Investments in real estate-related securities are subject to specific risks relating to the particular issuer of the securities and may be subject to the general risks of investing in subordinated real estate-related securities.
We may invest in real estate-related common equity, preferred equity and debt securities of both publicly traded and private real estate companies. Investments in real estate-related securities will involve special risks relating to the particular issuer of the securities, including the financial condition and business outlook of the issuer. Issuers of real estate-related securities generally invest in real estate or real estate-related assets and are subject to the inherent risks associated with real estate-related debt investments discussed in this Annual Report on Form 10-K.
Real estate-related securities may be unsecured and subordinated to other obligations of the issuer. As a result, investments in real estate-related securities are subject to risks of (i) limited liquidity in the secondary trading market, (ii) substantial market price volatility, (iii) subordination to the prior claims of banks and other senior lenders to the issuer and preferred equity holders, (iv) the operation of mandatory sinking fund or call/redemption provisions during periods of declining interest rates that could cause the issuer to reinvest redemption proceeds in lower yielding assets, (v) the possibility that earnings of the issuer may be insufficient to meet its debt service and distribution obligations and (vi) the declining creditworthiness and potential for insolvency of the issuer during periods of rising interest rates and economic downturn. These risks may adversely affect the value of outstanding real estate-related securities and the ability of the issuers thereof to pay dividends.
We may make investments in non-U.S. dollar denominated securities, which will be subject to currency rate exposure and risks associated with the uncertainty of foreign laws and markets.
Some of our real estate-related securities investments may be denominated in foreign currencies, and therefore, we expect to have currency risk exposure to any such foreign currencies. A change in foreign currency exchange rates may have an adverse impact on returns on our non-U.S. dollar denominated investments.
Although we may hedge our foreign currency risk subject to the REIT income qualification tests, we may not be able to do so successfully and may incur losses on these investments as a result of exchange rate fluctuations. To the extent that we invest in non-U.S. dollar denominated securities, in addition to risks inherent in the investment in securities generally discussed in this Annual Report on Form 10-K, we will also be subject to risks associated with the uncertainty of foreign laws and markets including, but not limited to, unexpected changes in regulatory requirements, political and economic instability in certain geographic locations, difficulties in managing international operations, currency exchange controls, potentially adverse tax consequences, additional accounting and control expenses and the administrative burden of complying with a wide variety of foreign laws.
RISKS ASSOCIATED WITH DEBT FINANCING
We incur mortgage indebtedness and other borrowings, which may increase our business risks, and could hinder our ability to make distributions to our stockholders.
We have financed and may continue to finance a portion of the purchase price of certain of our investments by borrowing funds. As of December 31, 2015, our leverage ratio is approximately 45.3% of the fair value of our real property and debt related investments (determined in accordance with our valuation procedures) inclusive of property and entity-level debt. Our current leverage target is between 40-60%. Although we will generally work to maintain the targeted leverage ratio over the near term, we may change our targeted leverage ratio from time to time. In addition, we may vary from our target leverage ratio from time to time, and there are no assurances that we will maintain the targeted range disclosed above or achieve any other leverage ratio that we may target in the future. Our board of directors may from time to time modify our borrowing policy in light of then-current economic conditions, the relative costs of debt and equity capital, the fair values of our properties, general conditions in the market for debt and equity securities, growth and acquisition opportunities or other factors.
Under our charter, we have a limitation on borrowing that precludes us from borrowing in excess of 300% of the value of our net assets unless approved by a majority of the independent directors and disclosed to stockholders in our next quarterly report along with justification for the excess. Net assets for purposes of this calculation are defined to be our total assets (other than intangibles), valued at cost prior to deducting depreciation or other non-cash reserves, less total liabilities. Generally speaking, the preceding calculation is expected to approximate 75% of the aggregate cost of our real property assets and debt related investments before non-cash reserves and depreciation. In addition, we have incurred and may continue to incur mortgage debt secured by some or all of our real properties to obtain funds to acquire additional real properties or for working capital. We may also borrow funds to satisfy the REIT tax qualification requirement that we distribute at least 90% of our annual REIT taxable income to our stockholders. Furthermore, we may borrow funds if we otherwise deem it necessary or advisable to ensure that we maintain our qualification as a REIT for federal income tax purposes.
| - 39 - |
High debt levels would generally cause us to incur higher interest charges, and could result in higher debt service payments and could be accompanied by restrictive covenants. If there is a shortfall between the cash flow from a property and the cash flow needed to service mortgage debt on that property, then the amount available for distributions to our stockholders may be reduced. In addition, incurring mortgage debt increases the risk of loss of a property since defaults on indebtedness secured by a property may result in lenders initiating foreclosure action. In that case, we could lose the property securing the loan that is in default or be forced to sell the property at an inopportune time, thus reducing the value of our investments. For tax purposes, a foreclosure on any of our properties will be treated as a sale of the property for a purchase price equal to the outstanding balance of the debt secured by the mortgage. If the outstanding balance of the debt secured by the mortgage exceeds our tax basis in the property, we will recognize taxable income on foreclosure, but we would not receive any cash proceeds. We and our Operating Partnership have historically given certain full, partial or limited guarantees, and may continue to give full, partial or limited guarantees in the future, to lenders of mortgage debt on behalf of the entities that own our properties. When we give a guarantee on behalf of an entity that owns one of our properties, we are responsible to the lender for satisfaction of the debt if it is not paid by such entity. If any mortgage contains cross-collateralization or cross-default provisions, a default on a single property could affect multiple properties. If any of our properties are foreclosed upon due to a default, our NAV, liquidity and ability to pay cash distributions to our stockholders will be adversely affected.
Increases in interest rates could increase the amount of our debt payments and therefore adversely impact our operating results.
We currently utilize a significant amount of variable rate debt financing. To the extent we do not have derivative instruments to hedge exposure to changes in interest rates, increases in interest rates would increase our interest costs, which would reduce our cash flows and our ability to make distributions to our stockholders. If we need to repay existing debt during periods of rising interest rates, we could be required to liquidate one or more of our real property or debt related investments at times, which may not permit realization of the maximum return on such investments.
Our derivative instruments used to hedge against interest rate fluctuations may not be successful in mitigating our risks associated with interest rates and could reduce the overall returns on our investments.
We utilize derivative instruments to hedge exposure to changes in interest rates on certain of our loans secured by our real properties, but no hedging strategy can protect us completely. We may use derivative instruments, such as forward starting swaps, to hedge interest rate risks associated with debt incurrences that we anticipate may occur. However, if we fail to accurately forecast such debt incurrences we will be subject to interest rate risk without successfully hedging the underlying transaction. Furthermore, the use of derivative instruments may cause us to forgo the benefits of otherwise favorable fluctuations in interest rates, since derivative instruments may prevent us from realizing the full benefits of lower borrowing cost in an environment of declining interest rates.
In addition, derivative instruments may not mitigate all of the risk associated with fluctuations in borrowing costs. Derivative instruments are generally used to hedge fluctuations in benchmark interest rates, such as London Interbank Offered Rate (“LIBOR”) and U.S. treasury security-based interest rates. However, there are other components of borrowing costs that may comprise the “spread” that lenders apply to the benchmark interest rates. The “spread” that lenders apply to benchmark interest rates when making loans may fluctuate from time to time. Fluctuations in the “spread” may be attributable to volatility in the credit markets or borrower-specific credit risk. When we enter into derivative instruments in anticipation of certain debt incurrences, such derivative instruments do not mitigate the risks of fluctuations in “spread” which could exacerbate the risks described above.
We cannot assure our stockholders that our hedging strategy and the derivatives that we use will adequately offset all of our risk related to interest rate volatility or that our hedging of these risks will not result in losses. These derivative instruments may also generate income that may not be treated as qualifying REIT income for purposes of the 75% or 95% REIT income tests. For additional discussion of our hedging program and the related impact on our results of operations, see Note 6 to our financial statements beginning on page F-1 of this Annual Report on Form 10-K.
We assume the credit risk of our counterparties with respect to derivative transactions.
We may enter into derivative contracts for risk management purposes to hedge our exposure to cash flow variability caused by changing interest rates on our future variable rate real estate loans receivable and variable rate notes payable. These derivative contracts generally are entered into with bank counterparties and are not traded on an organized exchange or guaranteed by a central clearing organization. We would therefore assume the credit risk that our counterparties will fail to make periodic payments when due under these contracts or become insolvent. If a counterparty fails to make a required payment, becomes the subject of a bankruptcy case, or otherwise defaults under the applicable contract, we would have the right to terminate all outstanding derivative transactions with that counterparty and settle them based on their net market value or replacement cost. In such an event, we may be required to make a termination payment to the counterparty, or we may have the right to collect a termination payment from such counterparty. We assume the credit risk that the counterparty will not be able to make any termination payment owing to us. We may not receive any collateral from a counterparty, or we may receive collateral that is insufficient to satisfy the counterparty’s obligation to make a termination payment. Default by a counterparty may result in the loss of unrealized profits and may force us to enter into a replacement transaction at the then current market price.
| - 40 - |
We assume the risk that our derivative counterparty may terminate transactions early.
If we fail to make a required payment or otherwise default under the terms of a derivative contract, the counterparty would have the right to terminate all outstanding derivative transactions between us and that counterparty and settle them based on their net market value or replacement cost. In certain circumstances, the counterparty may have the right to terminate derivative transactions early even if we are not defaulting. If our derivative transactions are terminated early, it may not be possible for us to replace those transactions with another counterparty, on as favorable terms or at all.
We may be required to collateralize our derivative transactions.
We may be required to secure our obligations to our counterparties under our derivative contracts by pledging collateral to our counterparties. That collateral may be in the form of cash, securities or other assets. If we default under a derivative contract with a counterparty, or if a counterparty otherwise terminates one or more derivative contracts early, that counterparty may apply such collateral toward our obligation to make a termination payment to the counterparty. If we have pledged securities or other assets, the counterparty may liquidate those assets in order to satisfy our obligations. If we are required to post cash or securities as collateral, such cash or securities will not be available for use in our business. Cash or securities pledged to counterparties may be repledged by counterparties and may not be held in segregated accounts. Therefore, in the event of a counterparty insolvency, we may not be entitled to recover some or all collateral pledged to that counterparty, which could result in losses and have an adverse effect on our operations.
We have entered into loan agreements that contain restrictive covenants relating to our operations, which could limit our ability to make distributions to our stockholders.
When providing financing, a lender typically imposes restrictions on us that may affect our distribution and operating policies and our ability to incur additional debt. Our loan agreements include restrictions, covenants, customary market carve-outs and/or guarantees by us. Certain financial covenants include tests of our general liquidity and debt servicing capability as well as certain collateral specific performance and valuation ratios. In addition, our loan agreements may contain covenants that limit our ability to further mortgage the property, discontinue insurance coverage, or replace our Advisor as our advisor. Further, our loan agreements may limit our ability to replace the property manager or terminate certain operating or lease agreements related to the property. These or other limitations may adversely affect our flexibility and our ability to achieve our investment objectives and make distributions to our stockholders. There can be no assurance that we will be able to comply with these covenants in the future, or that if we violate a covenant the lender would be willing to provide a waiver of such covenant. Violation of these covenants could result in the acceleration of maturities under the default provisions of our loan agreements. As of December 31, 2015, we were in compliance with all financial covenants.
We have entered into, and may continue to enter into, financing arrangements involving balloon payment obligations, which may adversely affect our ability to refinance or sell properties on favorable terms, and to make distributions to our stockholders.
Most of our current mortgage financing arrangements require us to make a lump-sum or “balloon” payment at maturity. Our ability to make a balloon payment at maturity will be uncertain and may depend upon our ability to obtain additional financing or our ability to sell the particular property. At the time the balloon payment is due, we may or may not be able to refinance the balloon payment on terms as favorable as the original loan or to sell the particular property at a price sufficient to make the balloon payment. The effect of a refinancing or sale could affect the rate of return to our stockholders and the projected time of disposition of our assets. In an environment of increasing mortgage rates, if we place mortgage debt on properties, we run the risk of being unable to refinance such debt if mortgage rates are higher at the time a balloon payment is due. In addition, payments of principal and interest made to service our debts, including balloon payments, may leave us with insufficient cash to pay the distributions that we are required to pay to maintain our qualification as a REIT.
| - 41 - |
RISKS RELATED TO OUR TAXATION AS A REIT
Failure to qualify as a REIT could adversely affect our operations and our ability to make distributions.
If we were to fail to qualify as a REIT for any taxable year, we would be subject to U.S. federal income tax on our taxable income at corporate rates. In addition, we would generally be disqualified from treatment as a REIT for the four taxable years following the year in which we lose our REIT status. Losing our REIT status would reduce our net earnings available for investment or distribution to stockholders because of the additional tax liability. In addition, distributions to stockholders would no longer be deductible in computing our taxable income and we would no longer be required to make distributions. To the extent that distributions had been made in anticipation of our qualifying as a REIT, we might be required to borrow funds or liquidate some investments in order to pay the applicable corporate income tax. In addition, although we intend to operate in a manner as to qualify as a REIT, it is possible that future economic, market, legal, tax or other considerations may cause our board of directors to recommend that we revoke our REIT election.
Failure of our Operating Partnership to be taxable as a partnership could cause us to fail to qualify as a REIT and we could suffer other adverse tax consequences.
We believe that the Operating Partnership will continue to be treated for federal income tax purposes as a partnership and not as an association or as a publicly traded partnership taxable as a corporation. If the Internal Revenue Service were successfully to determine that the Operating Partnership was properly treated as a corporation, the Operating Partnership would be required to pay U.S. federal income tax at corporate rates on its net income, its partners would be treated as stockholders of the Operating Partnership and distributions to partners would constitute distributions that would not be deductible in computing the Operating Partnership’s taxable income. In addition, we could fail to qualify as a REIT, with the resulting consequences described above.
To continue to qualify as a REIT, we must meet annual distribution requirements, which may result in us distributing amounts that may otherwise be used for our operations.
To maintain the favorable tax treatment accorded to REITs, we normally will be required each year to distribute to our stockholders at least 90% of our real estate investment trust taxable income, determined without regard to the deduction for distributions paid and by excluding net capital gains. We are subject to U.S. federal income tax on our undistributed taxable income and net capital gain and to a 4% nondeductible excise tax on any amount by which distributions we pay with respect to any calendar year are less than the sum of (i) 85% of our ordinary income, (ii) 95% of our capital gain net income and (iii) 100% of our undistributed income from prior years. These requirements could cause us to distribute amounts that otherwise would be spent on acquisitions of properties and it is possible that we might be required to borrow funds or sell assets to fund these distributions. Additionally, it is possible that we might not always be able to make distributions sufficient to meet the annual distribution requirements and to avoid corporate income taxation on the earnings that we distribute.
From time to time, we may generate taxable income greater than our taxable income for financial reporting purposes, or differences in timing between the recognition of taxable income and the actual receipt of cash may occur. If we do not have other funds available in these situations, we could be required to borrow funds on unfavorable terms, sell investments at disadvantageous prices or distribute amounts that would otherwise be invested in future acquisitions to make distributions sufficient to enable us to pay out enough of our taxable income to satisfy the REIT distribution requirement and to avoid corporate income tax and the 4% excise tax in a particular year. These alternatives could increase our costs or reduce our equity. Thus, compliance with the REIT requirements may hinder our ability to grow, which could adversely affect the value of our common stock.
Recharacterization of sale-leaseback transactions may cause us to lose our REIT status.
We may purchase real properties and lease them back to the sellers of such properties. If we were to attempt to structure a sale-leaseback transaction such that the lease would be characterized as a “true lease” that would allow us to be treated as the owner of the property for federal income tax purposes, we cannot assure our stockholders that the IRS will not challenge such characterization. In the event that any such sale-leaseback transaction is challenged and recharacterized as a financing transaction or loan for U.S. federal income tax purposes, deductions for depreciation and cost recovery relating to such property would be disallowed. If a sale-leaseback transaction were so recharacterized, we might fail to satisfy the REIT qualification “asset tests” or the “income tests” and, consequently, lose our REIT status effective with the year of recharacterization. Alternatively, the amount of our REIT taxable income could be recalculated, which might also cause us to fail to meet the distribution requirement for a taxable year.
| - 42 - |
Our stockholders may have current tax liability on distributions if our stockholders elect to reinvest in shares of our common stock.
Even if our stockholders participate in our distribution reinvestment plan, our stockholders will be deemed to have received, and for U.S. federal income tax purposes will be taxed on, the amount reinvested in shares of our common stock to the extent the amount reinvested was not a tax-free return of capital. As a result, our stockholders that are not tax-exempt entities may have to use funds from other sources to pay their tax liability on the value of the common stock received.
Distributions payable by REITs do not qualify for the reduced tax rates that apply to other corporate distributions.
The current maximum U.S. federal income tax rate for distributions payable by corporations to domestic stockholders that are individuals, trusts or estates is 20%. Distributions payable by REITs, however, generally are taxed at the ordinary income tax rate applicable to the individual recipient, rather than the maximum 20% preferential rate. The more favorable rates applicable to regular corporate distributions could cause investors who are individuals to perceive investments in REITs to be relatively less attractive than investments in the stocks of non-REIT corporations that pay distributions, which could adversely affect the value of the stock of REITs, including our common stock.
If we were considered to have actually or constructively paid a “preferential dividend” to certain of our stockholders, our status as a REIT could be adversely affected.
For taxable years ending on or before December 31, 2014, in order for distributions to be counted as satisfying the annual distribution requirement for REITs, and to provide us with a REIT-level tax deduction, the distributions must not have been “preferential dividends.” A dividend is not a preferential dividend if the distribution is (1) pro rata among all outstanding shares within a particular class, and (2) in accordance with the preferences among different classes of shares as set forth in our organizational documents. For the taxable year that began on January 1, 2015 and all future taxable years, so long as we continue to be a “publicly offered REIT” (i.e., a REIT which is required to file annual and periodic reports with the SEC under the Exchange Act), the preferential dividend rule will not apply to us.
In certain circumstances, we may be subject to federal and state income taxes as a REIT, which would reduce our cash available for distribution to our stockholders.
We may be subject to taxes on our income or property even if we qualify as a REIT for federal income tax purposes, including those described below.
| · | In order to qualify as a REIT, we are required to distribute annually at least 90% of our REIT taxable income (determined without regard to the dividends-paid deduction or net capital gain) to our stockholders. If we satisfy the distribution requirement but distribute less than 100% of our REIT taxable income, we will be subject to corporate income tax on the undistributed income. |
| · | We will be required to pay a 4% nondeductible excise tax on the amount, if any, by which the distributions we make to our stockholders in any calendar year are less than the sum of 85% of our ordinary income, 95% of our capital gain net income and 100% of our undistributed income from previous years. |
| · | If we have net income from the sale of foreclosure property that we hold primarily for sale to customers in the ordinary course of business or other non-qualifying income from foreclosure property, we will be required to pay a tax on that income at the highest corporate income tax rate. |
| · | Any gain we recognize on the sale of a property, other than foreclosure property, that we hold primarily for sale to customers in the ordinary course of business, would be subject to the 100% “prohibited transaction” tax unless the sale qualified for a statutory safe harbor that requires, among other things, a two year holding period. |
Our board of directors is authorized to revoke our REIT election without stockholder approval, which may cause adverse consequences to our stockholders.
Our charter authorizes our board of directors to revoke or otherwise terminate our REIT election, without the approval of our stockholders, if it determines that it is not in our best interest to qualify as a REIT. In this event, we would become subject to U.S. federal income tax on our taxable income and we would no longer be required to distribute most of our net income to our stockholders, which may cause a reduction in the total return to our stockholders.
| - 43 - |
Distributions to tax-exempt investors may be classified as unrelated business taxable income.
Neither ordinary nor capital gain distributions with respect to our common stock nor gain from the sale of common stock should generally constitute unrelated business taxable income to a tax-exempt investor. However, there are certain exceptions to this rule. In particular:
| · | part of the income and gain recognized by certain qualified employee pension trusts with respect to our common stock may be treated as unrelated business taxable income if shares of our common stock are predominately held by qualified employee pension trusts, we are required to rely on a special look-through rule for purposes of meeting one of the REIT share ownership tests, and we are not operated in a manner to avoid treatment of such income or gain as unrelated business taxable income; |
| · | part of the income and gain recognized by a tax-exempt investor with respect to our common stock would constitute unrelated business taxable income if the investor incurs debt in order to acquire the common stock; and |
| · | part or all of the income or gain recognized with respect to our common stock by social clubs, voluntary employee benefit associations, supplemental unemployment benefit trusts and qualified group legal services plans that are exempt from federal income taxation under Sections 501(c)(7), (9), (17), or (20) of the Code may be treated as unrelated business taxable income. |
The stock ownership limit imposed by the Code for REITs and our charter may restrict our business combination opportunities and you may be restricted from acquiring or transferring certain amounts of our capital stock.
To maintain our status as a REIT under the Code, not more than 50% in value of our outstanding stock may be owned, directly or indirectly, by five or fewer individuals (as defined in the Code to include certain entities) at any time during the last half of each taxable year after our first year in which we qualify as a REIT. Our charter, with certain exceptions, authorizes our board of directors to take the actions that are necessary and desirable to preserve our qualification as a REIT. Unless an exemption is granted by our board of directors, no person (as defined to include entities) may own more than 9.8% in value of our capital stock or more than 9.8% in value or in number of shares, whichever is more restrictive, of our common stock following the completion of our public offerings. In addition, our charter will generally prohibit beneficial or constructive ownership of shares of our capital stock by any person who owns, actually or constructively, an interest in any of our tenants that would cause us to own, actually or constructively, more than a 9.9% interest in any of our tenants. Our board of directors may grant an exemption in its sole discretion, subject to such conditions, representations and undertakings as it may determine. These ownership limitations in our charter are common in REIT charters and are intended, among other purposes, to assist us in complying with the tax law requirements and to minimize administrative burdens. However, these ownership limits might also delay or prevent a transaction or a change in our control that might involve a premium price for our common stock or otherwise be in the best interests of our stockholders.
The tax on prohibited transactions will limit our ability to engage in transactions, including certain methods of syndicating and securitizing mortgage loans, that would be treated as sales for federal income tax purposes.
A REIT’s net income from prohibited transactions is subject to a 100% tax. In general, prohibited transactions are sales or other dispositions of property, other than foreclosure property, but including mortgage loans that are held primarily for sale to customers in the ordinary course of business. We might be subject to this tax if we were to syndicate, dispose of, or securitize loans in a manner that was treated as a sale of the loans for U.S. federal income tax purposes. Therefore, to avoid the prohibited transactions tax, we may choose not to engage in certain sales of loans at the REIT level and may limit the structures we utilize for our securitization transactions, even though the sales or structures otherwise might be beneficial to us.
In addition, the Code provides a safe harbor that, if met, allows us to avoid being treated as engaged in a prohibited transaction. In order to meet the safe harbor, (i) we must have held the property for at least 2 years (and, in the case of property which consists of land or improvements not acquired through foreclosure, we must have held the property for 2 years for the production of rental income), (ii) we must not have made aggregate expenditures includible in the basis of the property during the 2-year period preceding the date of sale that exceed 30% of the net selling price of the property, and (iii) during the taxable year the property is disposed of, we must not have made more than 7 property sales or, alternatively, the aggregate adjusted basis or fair market value of all the properties sold by us during the taxable year must not exceed 10% of the aggregate adjusted basis or 10% of the fair market value, respectively, of all our assets as of the beginning of the taxable year (with the 10% thresholds increased to 20% in certain circumstances). If the 7-sale limitation in (iii) above is not satisfied, substantially all of the marketing and development expenditures with respect to the property must be made through an independent contractor from whom we do not derive or receive any income. We will endeavor to avoid engaging in prohibited transactions or we will attempt to comply with the safe harbor provisions. There is no assurance, however, that we will not engage in prohibited transactions.
| - 44 - |
Legislative or regulatory action could adversely affect investors.
In recent years, numerous legislative, judicial and administrative changes have been made to the U.S. federal income tax laws applicable to investments in REITs and similar entities. Additional changes to tax laws are likely to continue to occur in the future, and we cannot assure our stockholders that any such changes will not adversely affect the taxation of a stockholder. Any such changes could have an adverse effect on an investment in shares of our common stock. We urge our stockholders to consult with their own tax advisor with respect to the status of legislative, regulatory or administrative developments and proposals and their potential effect on an investment in shares of our common stock.
Recharacterization of transactions under the Operating Partnership’s private placements could result in a 100% tax on income from prohibited transactions, which would diminish our cash distributions to our stockholders.
The Internal Revenue Service could recharacterize transactions under the Operating Partnership’s private placements such that the Operating Partnership could be treated as the bona fide owner, for tax purposes, of properties acquired and resold by the entity established to facilitate the transaction. Such recharacterization could result in the income realized on these transactions by the Operating Partnership being treated as gain on the sale of property that is held as inventory or otherwise held primarily for the sale to customers in the ordinary course of business. In such event, such gain could constitute income from a prohibited transaction and might be subject to a 100% tax. If this occurs, our ability to pay cash distributions to our stockholders will be adversely affected.
Qualifying as a REIT involves highly technical and complex provisions of the Code.
Qualification as a REIT involves the application of highly technical and complex Code provisions for which only limited judicial and administrative authorities exist. Even a technical or inadvertent violation could jeopardize our REIT qualification. Our continued qualification as a REIT will depend on our satisfaction of certain asset, income, organizational, distribution, stockholder ownership and other requirements on a continuing basis. In addition, our ability to satisfy the requirements to qualify as a REIT depends in part on the actions of third parties over which we have no control or only limited influence, including in cases where we own an equity interest in an entity that is classified as a partnership for U.S. federal income tax purposes.
Foreign investors may be subject to FIRPTA on the sale of common shares if we are unable to qualify as a “domestically controlled qualified investment entity.”
A foreign person (subject to certain exceptions) disposing of a U.S. real property interest, including shares of a U.S. corporation whose assets consist principally of U.S. real property interests, is generally subject to a tax, known as FIRPTA, on the gain recognized on the disposition. FIRPTA does not apply, however, to the disposition of stock in a REIT if the REIT is a “domestically controlled qualified investment entity” (as defined in section 897(h)(4)(B) of the Code). A domestically controlled qualified investment entity includes a REIT in which, at all times during a specified testing period, less than 50% in value of its shares is held directly or indirectly by non-U.S. holders. We cannot assure our stockholders that we will qualify as a domestically controlled qualified investment entity. If we were to fail to so qualify, gain realized by a foreign investor on a sale of our common stock would be subject to FIRPTA unless our common stock was traded on an established securities market and the foreign investor did not at any time during a specified testing period directly or indirectly own more than 10% of the value of our outstanding common stock. Regardless of our status as a domestically controlled qualified investment entity, capital gain distributions attributable to a disposition of a U.S. real property interest will generally be subject to tax under FIRPTA in the hands of non-U.S. investors.
INVESTMENT COMPANY RISKS
Avoiding registration as an investment company imposes limits on our operations, and failure to avoid registration reduces the value of your investment.
We conduct our operations so as not to become regulated as an investment company under the Investment Company Act of 1940, as amended, which we refer to as the “Investment Company Act.” To do so, we will have to continue to monitor the value of our securities in comparison with the value of our other assets and make sure that the value of our securities does not exceed 40% of the value of all of our assets on an unconsolidated basis. As a result, we may be unable to sell assets we would otherwise want to sell and may be unable to purchase securities we would otherwise want to purchase.
| - 45 - |
If we were obligated to register as an investment company, we would have to comply with a variety of substantive requirements under the Investment Company Act that impose, among other things:
| · | limitations on capital structure; |
| · | restrictions on specified investments; |
| · | prohibitions on transactions with affiliates; and |
| · | compliance with reporting, record keeping, voting, proxy disclosure and other rules and regulations that would significantly increase our operating expenses. |
Registration with the Commission as an investment company would be costly, would subject our company to a host of complex regulations, and would divert the attention of management from the conduct of our business.
Further, if it were established that we were an unregistered investment company, there would be a risk that we would be subject to monetary penalties and injunctive relief in an action brought by the Commission, that we would be unable to enforce contracts with third parties, and that third parties could seek to obtain rescission of transactions undertaken during the period it was established that we were an unregistered investment company. Any such results would be likely to have a material adverse effect on us.
RETIREMENT PLAN RISKS
If you fail to meet the fiduciary and other standards under the Employee Retirement Income Security Act of 1974, as amended, or “ERISA,” or the Code as a result of an investment in our stock, you could be subject to criminal and civil penalties.
There are special considerations that apply to employee benefit plans subject to ERISA (such as profit-sharing, section 401(k) or pension plans) and other retirement plans or accounts subject to Section 4975 of the Code (such as an IRA) that are investing in our shares. If you are investing the assets of such a plan or account in our common stock, you should satisfy yourself that:
| · | your investment is consistent with your fiduciary and other obligations under ERISA and the Code; |
| · | your investment is made in accordance with the documents and instruments governing the plan or IRA, including the plan’s or account’s investment policy; |
| · | your investment satisfies the prudence and diversification requirements of Sections 404(a)(1)(B) and 404(a)(1)(C) of ERISA and other applicable provisions of ERISA and the Code; |
| · | your investment in our shares, for which no trading market may exist, is consistent with the liquidity needs of the plan or IRA; |
| · | your investment will not produce an unacceptable amount of “unrelated business taxable income” for the plan or IRA; |
| · | you will be able to comply with the requirements under ERISA and the Code to value the assets of the plan or IRA annually; and |
| · | your investment will not constitute a prohibited transaction under Section 406 of ERISA or Section 4975 of the Code. |
With respect to the annual valuation requirements described above, we expect to provide an estimated value of our net assets per share annually to those fiduciaries (including IRA trustees and custodians) who request it. Although this estimate will be based upon determinations of the NAV of our shares in accordance with our valuation procedures, no assurance can be given that such estimated value will satisfy the applicable annual valuation requirements under ERISA and the Code. The Department of Labor or the Internal Revenue Service may determine that a plan fiduciary or an IRA custodian is required to take further steps to determine the value of our common shares. In the absence of an appropriate determination of value, a plan fiduciary or an IRA custodian may be subject to damages, penalties or other sanctions.
Failure to satisfy the fiduciary standards of conduct and other applicable requirements of ERISA and the Code may result in the imposition of civil and criminal penalties, and can subject the fiduciary to claims for damages or for equitable remedies, including liability for investment losses. In addition, if an investment in our shares constitutes a prohibited transaction under ERISA or the Code, the fiduciary or IRA owner who authorized or directed the investment may be subject to the imposition of excise taxes with respect to the amount invested. Additionally, the investment transaction may have to be undone. In the case of a prohibited transaction involving an IRA owner, the IRA may be disqualified as a tax-exempt account and all of the assets of the IRA may be deemed distributed and subjected to tax. ERISA plan fiduciaries and IRA owners should consult with counsel before making an investment in our shares.
| - 46 - |
If our assets are deemed to be plan assets, our Advisor and we may be exposed to liabilities under Title I of ERISA and the Code.
In some circumstances where an ERISA
plan holds an interest in an entity, the assets of the entity are deemed to be ERISA plan assets unless an exception applies.
This is known as the “look-through rule.” Under those circumstances, the obligations and other responsibilities of
plan sponsors, plan fiduciaries and plan administrators, and of parties in interest and disqualified persons, under Title I of
ERISA and Section 4975 of the Code, as applicable, may be applicable, and there may be liability under these and other provisions
of ERISA and the Code. We believe that our assets should not be treated as plan assets because the shares should qualify as “publicly-offered
securities” that are exempt from the look-through rules under applicable Treasury Regulations. We note, however, that because
certain limitations are imposed upon the transferability of shares so that we may qualify as a REIT, and perhaps for other reasons,
it is possible that this exemption may not apply. If that is the case, and if our Advisor or we are exposed to liability under
ERISA or the Code, our performance and results of operations could be adversely affected. Prior to making an investment in us,
you should consult with your legal and other advisors concerning the impact of ERISA and the Code on your investment and our performance.
| ITEM 1B. | UNRESOLVED STAFF COMMENTS |
None.
| ITEM 2. | PROPERTIES |
As of December 31, 2015, we held the majority ownership in 60 real properties, all of which were operating properties. The properties are located in 21 distinct geographical markets throughout the United States and comprise approximately 10.1 million net rentable square feet. As of December 31, 2015, our operating properties were subject to mortgage notes with an aggregate principal amount outstanding of approximately $588.8 million. For additional discussion of our borrowings, see Note 5 to our financial statements beginning on page F-1 of this Annual Report on Form 10-K.
Geographic Distribution
The following map describes the geographic distribution and types of our 60 operating properties by market as of December 31, 2015.
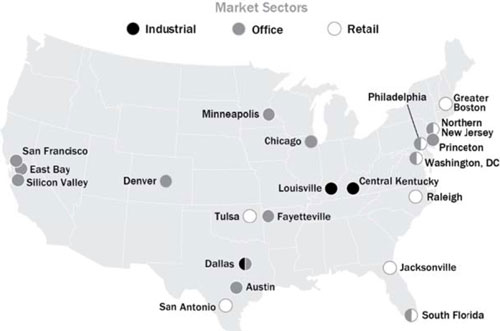
| - 47 - |
The following table describes our 60 operating properties, by market, which are presented on a consolidated basis for purposes of financial reporting as of December 31, 2015 (dollar amounts and square footage amounts in thousands).
| Market | Number of Properties | Gross Investment Amount (1) | Net Rentable Square Feet | Secured Indebtedness (2) | % of Gross Investment Amount | % of Total Net Rentable Square Feet | % Leased (3) | ||||||||||||||||
| Office Properties: | |||||||||||||||||||||||
| Washington, DC | 3 | $ | 282,939 | 878 | $ | 45,041 | 11.9 | % | 8.7 | % | 78.4 | % | |||||||||||
| Northern New Jersey | 1 | 224,545 | 594 | 107,248 | 9.4 | % | 5.9 | % | 100.0 | % | |||||||||||||
| Austin, TX | 3 | 153,419 | 585 | — | 6.4 | % | 5.8 | % | 99.3 | % | |||||||||||||
| East Bay, CA | 1 | 145,339 | 405 | — | 6.1 | % | 4.0 | % | 100.0 | % | |||||||||||||
| San Francisco, CA | 1 | 120,238 | 264 | 56,134 | 5.1 | % | 2.6 | % | 91.6 | % | |||||||||||||
| South Florida | 2 | 82,130 | 363 | — | 3.5 | % | 3.6 | % | 92.2 | % | |||||||||||||
| Denver, CO | 1 | 82,106 | 257 | — | 3.5 | % | 2.5 | % | 89.6 | % | |||||||||||||
| Princeton, NJ | 1 | 51,233 | 167 | — | 2.2 | % | 1.6 | % | 100.0 | % | |||||||||||||
| Chicago, IL | 2 | 43,745 | 307 | 29,190 | 1.8 | % | 3.0 | % | 76.1 | % | |||||||||||||
| Philadelphia, PA | 1 | 43,482 | 173 | 24,000 | 1.8 | % | 1.7 | % | 81.7 | % | |||||||||||||
| Silicon Valley, CA | 1 | 41,912 | 143 | 23,500 | 1.8 | % | 1.4 | % | 91.8 | % | |||||||||||||
| Dallas, TX | 1 | 35,875 | 155 | — | 1.5 | % | 1.5 | % | 91.1 | % | |||||||||||||
| Minneapolis/St Paul, MN | 1 | 29,515 | 107 | — | 1.2 | % | 1.1 | % | 100.0 | % | |||||||||||||
| Fayetteville, AR | 1 | 11,695 | 63 | — | 0.5 | % | 0.6 | % | 100.0 | % | |||||||||||||
| Total/Weighted Average | 20 | 1,348,173 | 4,461 | 285,113 | 56.7 | % | 44.0 | % | 91.0 | % | |||||||||||||
| Industrial Properties: | |||||||||||||||||||||||
| Dallas, TX | 1 | 35,746 | 446 | 22,700 | 1.6 | % | 4.4 | % | 35.1 | % | |||||||||||||
| Central Kentucky | 1 | 28,296 | 727 | — | 1.2 | % | 7.2 | % | 100.0 | % | |||||||||||||
| Louisville, KY | 4 | 27,273 | 736 | — | 1.1 | % | 7.3 | % | 88.5 | % | |||||||||||||
| Total/Weighted Average | 6 | 91,315 | 1,909 | 22,700 | 3.9 | % | 18.9 | % | 80.4 | % | |||||||||||||
| Retail Properties: | |||||||||||||||||||||||
| Greater Boston | 26 | 545,382 | 2,280 | 84,702 | 22.9 | % | 22.5 | % | 94.0 | % | |||||||||||||
| Philadelphia, PA | 1 | 105,126 | 426 | 67,800 | 4.4 | % | 4.2 | % | 99.1 | % | |||||||||||||
| Washington, DC | 1 | 62,533 | 233 | 70,000 | 2.6 | % | 2.3 | % | 99.3 | % | |||||||||||||
| Northern New Jersey | 1 | 58,484 | 223 | — | 2.5 | % | 2.2 | % | 94.6 | % | |||||||||||||
| Raleigh, NC | 1 | 45,553 | 142 | 26,200 | 1.9 | % | 1.4 | % | 99.2 | % | |||||||||||||
| South Florida | 1 | 37,898 | 124 | 10,834 | 1.6 | % | 1.2 | % | 100.0 | % | |||||||||||||
| Tulsa, OK | 1 | 34,147 | 101 | — | 1.4 | % | 1.0 | % | 100.0 | % | |||||||||||||
| San Antonio, TX | 1 | 32,069 | 161 | 21,500 | 1.3 | % | 1.6 | % | 89.6 | % | |||||||||||||
| Jacksonville, FL | 1 | 19,494 | 73 | — | 0.8 | % | 0.7 | % | 20.3 | % | |||||||||||||
| Total/Weighted Average | 34 | 940,686 | 3,763 | 281,036 | 39.4 | % | 37.1 | % | 93.9 | % | |||||||||||||
| Grand Total/Weighted Average | 60 | $ | 2,380,174 | 10,133 | $ | 588,849 | 100.0 | % | 100.0 | % | 90.1 | % | |||||||||||
| (1) | “Gross Investment Amount” as used here and throughout this document represents the allocated gross basis of real property, inclusive of the effect of gross intangible lease liabilities totaling approximately $95.3 million and before accumulated depreciation and amortization of approximately $506.0 million as of December 31, 2015. Table includes amounts related to properties classified as held for sale in our financial statements beginning on page F-1 of this Annual Report on Form 10-K. |
| (2) | Does not include our GAAP mark-to-market adjustment, fair value adjustment, or principal amortization related to troubled debt restructurings. |
| (3) | Percentage leased is based on executed leases as of December 31, 2015. |
Lease Expirations
As of December 31, 2015, the weighted average remaining term of our leases was approximately 4.5 years, based on annualized base rent, and 7.0 years, based on leased square footage. See “Item 7. Management’s Discussion and Analysis of Financial Condition and Results of Operations” of this Annual Report on Form 10-K for a schedule of expiring leases for our consolidated operating properties by annual minimum rents as of December 31, 2015.
| - 48 - |
Tenant Information
The following table describes our top ten tenants based on annualized base rent and their industry sectors as of December 31, 2015 (dollar and square footage amounts in thousands).
| Tenant | Locations | Industry | Annualized Base Rent (1) | % of Total Annualized Base Rent | Square Feet | % of Total Portfolio Square Feet | ||||||||||||||||
| 1 | Charles Schwab & Co., Inc. | 2 | Securities, Commodities, Fin. Inv./Rel. Activities | $ | 23,408 | 12.8 | % | 602 | 6.6 | % | ||||||||||||
| 2 | Sybase | 1 | Publishing Information (except Internet) | 18,692 | 10.3 | % | 405 | 4.5 | % | |||||||||||||
| 3 | Northrop Grumman (2) | 1 | Professional, Scientific and Technical Services | 15,901 | 8.7 | % | 575 | 6.3 | % | |||||||||||||
| 4 | Stop & Shop | 16 | Food and Beverage Stores | 14,983 | 8.2 | % | 911 | 10.1 | % | |||||||||||||
| 5 | Novo Nordisk | 1 | Chemical Manufacturing | 4,535 | 2.5 | % | 167 | 1.8 | % | |||||||||||||
| 6 | Seton Health Care | 1 | Hospitals | 4,339 | 2.4 | % | 156 | 1.7 | % | |||||||||||||
| 7 | Shaw’s Supermarket | 4 | Food and Beverage Stores | 3,944 | 2.2 | % | 240 | 2.7 | % | |||||||||||||
| 8 | I.A.M. National Pension Fund | 1 | Funds, Trusts and Other Financial Vehicles | 3,023 | 1.7 | % | 63 | 0.7 | % | |||||||||||||
| 9 | TJX Companies | 7 | Clothing and Clothing Accessories Stores | 2,969 | 1.6 | % | 299 | 3.3 | % | |||||||||||||
| 10 | Home Depot | 1 | Building Material and Garden Equipment and Supplies Dealers | 2,470 | 1.4 | % | 102 | 1.1 | % | |||||||||||||
| 35 | $ | 94,264 | 51.8 | % | 3,520 | 38.8 | % | |||||||||||||||
| (1) | Annualized base rent represents the annualized monthly base rent of executed leases as of December 31, 2015. |
| (2) | Northrop Grumman exercised a purchase option to acquire the office property (“Colshire) that they leased from us on February 18, 2016. As a result, Northrop Grumman is no longer our tenant. Prior to acquiring Colshire from us, Northrop Grumman’s lease would have expired in 2016. For a more detailed discussion of the purchase option and the related property disposition, see “Item 7. Management’s Discussion and Analysis of Financial Condition and Results of Operations—Subsequent Events” of this Annual Report on Form 10-K. Subsequent to the disposition of Colshire, Alliant Techsystems Inc., a tenant in the computer and electronic product manufacturing industry, became our 10th largest tenant with an annualized base rent of approximately $2.4 million as of December 31, 2015, comprising approximately 107,000 square feet in one of our office properties. |
| ITEM 3. | LEGAL PROCEEDINGS |
None.
| ITEM 4. | MINE SAFETY DISCLOSURES |
Not applicable.
| - 49 - |
| ITEM 5. | MARKET FOR REGISTRANT’S COMMON EQUITY, RELATED STOCKHOLDER MATTERS AND ISSUER PURCHASES OF EQUITY SECURITIES |
Market Information
There is no public market for shares of our common stock and we currently have no obligation or plans to apply for listing on any public trading market. The prices at which our shares of common stock are sold pursuant to our public offerings, or redeemed pursuant to our share redemption programs, are based on the daily NAV per share determined in accordance with our valuation procedures, as described further below. We may repurchase shares of our common stock pursuant to self-tender offers at a discount to NAV.
We commenced calculating a daily NAV on July 12, 2012. The following table presents the high and low NAV per share of each class of common stock for each quarter within the two most recent fiscal years (to date, our classes have had the same NAV on each day):
| Quarter | Low | High | ||||
| First Quarter 2014 | $ | 6.93 | $ | 6.96 | ||
| Second Quarter 2014 | $ | 6.96 | $ | 7.00 | ||
| Third Quarter 2014 | $ | 7.00 | $ | 7.09 | ||
| Fourth Quarter 2014 | $ | 7.08 | $ | 7.19 | ||
| First Quarter 2015 | $ | 7.13 | $ | 7.31 | ||
| Second Quarter 2015 | $ | 7.28 | $ | 7.38 | ||
| Third Quarter 2015 | $ | 7.36 | $ | 7.44 | ||
| Fourth Quarter 2015 | $ | 7.40 | $ | 7.47 | ||
Performance Graph
The following graph is a comparison of the cumulative return of our shares of common stock calculated on a weighted average basis (after class-specific expenses), against the National Council of Real Estate Investment Fiduciaries Fund Index-Open-End Diversified Core Equity (“ODCE”) and Standard and Poor’s 500 Index (“S&P 500”), as peer group indices. The graph assumes that $100 was invested on September 30, 2012 in shares of our common stock and each index assuming that all dividends were reinvested. There can be no assurance that the performance of our shares will continue in line with the same or similar trends depicted in the following graph. Our total return since July 12, 2012, the date we initiated daily NAV pricing, was 32.1%, or 8.9% annualized. Our total return for the year ended December 31, 2015 was 9.38% on a weighted-average basis across our multiple share classes.
| - 50 - |
This performance and the chart below do not reflect selling commissions of up to 3.0% of the public offering price per share applicable to Class A shares sold in our primary offering.
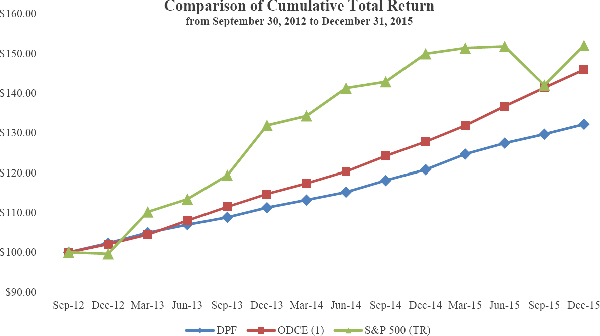
| (1) | The ODCE is an equal weighted, time weighted index of open-end core real estate funds reported net of fees. The term core typically reflects lower risk investment strategies, utilizing low leverage and generally represented by equity ownership positions in stable U.S. operating properties. Funds are weighted equally, regardless of size. While funds used in this benchmark have characteristics that differ from the Company (including differing management fees), our management feels that the ODCE is an appropriate and accepted index for the purpose of evaluating returns on investments in direct real estate funds. Investors cannot invest in this index. The Company has the ability to utilize higher leverage than is allowed for the funds in this index, which could increase the Company’s volatility relative to the index. |
The following table shows the return, by share class, of each of our classes of common stock for the year ended December 31, 2015.
| Share Class | Weighted average number of shares outstanding during period (in thousands) | Return | ||||||
| Class E | 153,743 | 9.40 | % | |||||
| Class A (1) | 1,367 | 8.23 | % | |||||
| Class W | 1,297 | 8.76 | % | |||||
| Class I | 19,531 | 9.29 | % | |||||
| Total / Weighted Average | 175,938 | 9.38 | % | |||||
| (1) | Does not reflect selling commission of up to 3.0% of the public offering price per share, applicable to Class A shares purchased in our primary offering. |
Net Asset Value Calculation
Our board of directors, including a majority of our independent directors, has adopted valuation procedures that contain a comprehensive set of methodologies to be used in connection with the calculation of our NAV on a daily basis. One fundamental element of the valuation process, the valuation of our real property portfolio, is managed by Altus Group U.S., Inc., an independent valuation firm (“the Independent Valuation Firm”) approved by our board of directors, including a majority of our independent directors. See Exhibit 99.1 of this Annual Report on Form 10-K for a description of our valuation procedures, including important disclosure regarding real property valuations provided by the Independent Valuation Firm.
The following table sets forth the components of NAV for the Company as of December 31, 2015 and September 30, 2015 (amounts in thousands except per share information). As used below, “Fund Interests” means our Class E shares, Class A shares, Class W shares, and Class I shares, along with the OP Units held by third parties, and “Aggregate Fund NAV” means the NAV of all of the Fund Interests.
| - 51 - |
As of December 31, 2015 | As of September 30, 2015 | |||||||
| Office properties | $ | 1,378,635 | $ | 1,356,600 | ||||
| Industrial properties | 90,250 | 88,050 | ||||||
| Retail properties | 950,925 | 872,300 | ||||||
| Real properties | $ | 2,419,810 | $ | 2,316,950 | ||||
| Debt related investments | 15,722 | 27,775 | ||||||
| Total Investments | $ | 2,435,532 | $ | 2,344,725 | ||||
| Cash and other assets, net of other liabilities | (14,069 | ) | (26,734 | ) | ||||
| Debt obligations | (1,098,853 | ) | (997,517 | ) | ||||
| Outside investors’ interests | (4,771 | ) | (4,498 | ) | ||||
| Aggregate Fund NAV | $ | 1,317,839 | $ | 1,315,976 | ||||
| Total Fund Interests outstanding | 176,490 | 177,468 | ||||||
| NAV per Fund Interest | $ | 7.47 | $ | 7.42 | ||||
When the fair value of our real estate assets is calculated for the purposes of determining our NAV per share, the calculation is done using the fair value methodologies detailed within the Financial Accounting Standards Board (“FASB”) Accounting Standards Codification under Topic 820, Fair Value Measurements and Disclosures (“ASC Topic 820”). However, our valuation procedures and our NAV are not subject to GAAP and will not be subject to independent audit. In the determination of our NAV, the value of certain of our assets and liabilities are generally determined based on their carrying amounts under GAAP; however, those principles are generally based upon historic cost and therefore may not be determined in accordance with ASC Topic 820. Readers should refer to our audited financial statements for our net book value determined in accordance with GAAP from which one can derive our net book value per share by dividing our stockholders’ equity by shares of our common stock outstanding as of the date of measurement.
Our valuation procedures, which address specifically each category of our assets and liabilities and are applied separately from the preparation of our financial statements in accordance with GAAP, involve adjustments from historical cost. There are certain factors which cause NAV to be different from net book value on a GAAP basis. Most significantly, the valuation of our real estate assets, which is the largest component of our NAV calculation, will be provided to us by the Independent Valuation Firm on a daily basis. For GAAP purposes, these assets are generally recorded at depreciated or amortized cost. We generally do not undertake to mark-to-market our debt investments or real estate-related liabilities, but rather these assets and liabilities are usually included in our determination of NAV at amounts determined in accordance with GAAP, which amounts have been and could in the future be materially different from the amount of these assets and liabilities if we were to undertake to mark-to-market our debt. Also for NAV purposes, we mark-to-market our hedging instruments on a frequency that management determines to be practicable under the circumstances and currently we seek to mark-to-market our hedging instruments on a weekly basis. However, our NAV policies and procedures allow for that frequency to change to be more or less frequent. Other examples that will cause our NAV to differ from our GAAP net book value include the straight-lining of rent, which results in a receivable for GAAP purposes that is not included in the determination of our NAV, and, for purposes of determining our NAV, the assumption of a value of zero in certain instances where the balance of a loan exceeds the value of the underlying real estate properties, where GAAP net book value would reflect a negative equity value for such real estate properties, even if such loans are non-recourse. Third party appraisers may value our individual real estate assets using appraisal standards that deviate from fair value standards under GAAP. The use of such appraisal standards may cause our NAV to deviate from GAAP fair value principles. We did not develop our valuation procedures with the intention of complying with fair value concepts under GAAP and, therefore, there could be differences between our fair values and the fair values derived from the principal market or most advantageous market concepts of establishing fair value under GAAP.
We include no discounts to our NAV for the illiquid nature of our shares, including the limitations on your ability to redeem shares under our share redemption programs or self-tender offers and our ability to suspend or terminate our share redemption programs or self-tender offers at any time. Our NAV generally does not consider exit costs (e.g. selling costs and commissions related to the sale of a property) that would likely be incurred if our assets and liabilities were liquidated or sold. While we may use market pricing concepts to value individual components of our NAV, our per share NAV is not derived from the market pricing information of open-end real estate funds listed on stock exchanges.
Please note that our NAV is not a representation, warranty or guarantee that: (1) we would fully realize our NAV upon a sale of our assets; (2) shares of our common stock would trade at our per share NAV on a national securities exchange; and (3) a stockholder would be able to realize the per share NAV if such stockholder attempted to sell his or her shares to a third party.
| - 52 - |
The December 31, 2015 valuation for our real properties was provided by the Independent Valuation Firm in accordance with our valuation procedures and determined starting with the appraised value. The aggregate real property valuation of $2.42 billion compares to a GAAP basis of real properties (before accumulated amortization and depreciation and the impact of intangible lease liabilities) of $2.29 billion, representing an increase of approximately $133.2 million or 5.8%. Certain key assumptions that were used by our Independent Valuation Firm in the discounted cash flow analysis are set forth in the following table based on weighted averages by property type.
| Office | Industrial | Retail | Weighted Average Basis | |||||||||||||
| Exit capitalization rate | 6.77 | % | 7.35 | % | 6.48 | % | 6.68 | % | ||||||||
| Discount rate / internal rate of return (“IRR”) | 7.47 | % | 7.93 | % | 7.00 | % | 7.30 | % | ||||||||
| Annual market rent growth rate | 2.82 | % | 2.98 | % | 2.93 | % | 2.87 | % | ||||||||
| Average holding period (years) | 10.7 | 10.7 | 10.3 | 10.5 | ||||||||||||
A change in the rates used would impact the calculation of the value of our real properties. For example, assuming all other factors remain constant, an increase in the weighted-average annual discount rate/IRR and the exit capitalization rate of 0.25% would reduce the value of our real properties by approximately 1.95% and 2.15%, respectively.
The following table sets forth the quarterly changes to the components of NAV for the Company and the reconciliation of NAV changes for each class of shares (amounts in thousands, except per share information):
| Total | Class E Common Stock | Class A Common Stock | Class W Common Stock | Class I Common Stock | Class E OP Units | |||||||||||||||||||
| NAV as of September 30, 2015 | $ | 1,315,976 | $ | 1,034,058 | $ | 10,735 | $ | 10,513 | $ | 165,291 | $ | 95,379 | ||||||||||||
| Fund level changes to NAV | ||||||||||||||||||||||||
| Realized/unrealized gains on net assets | 4,239 | 3,311 | 37 | 38 | 550 | 303 | ||||||||||||||||||
| Income accrual | 25,131 | 19,666 | 220 | 218 | 3,222 | 1,805 | ||||||||||||||||||
| Dividend accrual | (15,997 | ) | (12,589 | ) | (108 | ) | (122 | ) | (2,021 | ) | (1,157 | ) | ||||||||||||
| Advisory fee | (3,851 | ) | (3,014 | ) | (34 | ) | (33 | ) | (493 | ) | (277 | ) | ||||||||||||
| Performance based fee | (187 | ) | (146 | ) | (2 | ) | (2 | ) | (24 | ) | (13 | ) | ||||||||||||
| Class specific changes to NAV | ||||||||||||||||||||||||
| Dealer Manager fee | (77 | ) | — | (17 | ) | (17 | ) | (43 | ) | — | ||||||||||||||
| Distribution fee | (15 | ) | — | (15 | ) | — | — | — | ||||||||||||||||
| NAV as of December 31, 2015 | ||||||||||||||||||||||||
| before share/unit sale/redemption activity | $ | 1,325,219 | $ | 1,041,286 | $ | 10,816 | $ | 10,595 | $ | 166,482 | $ | 96,040 | ||||||||||||
| Share/unit sale/redemption activity | ||||||||||||||||||||||||
| Shares/units sold | 17,244 | 4,034 | 1,915 | 2,927 | 8,368 | — | ||||||||||||||||||
| Shares/units redeemed | (24,624 | ) | (20,205 | ) | (16 | ) | — | (3,974 | ) | (429 | ) | |||||||||||||
| NAV as of December 31, 2015 | $ | 1,317,839 | $ | 1,025,115 | $ | 12,715 | $ | 13,522 | $ | 170,876 | $ | 95,611 | ||||||||||||
| Shares/units outstanding as of September 30, 2015 (1) | 177,468 | 139,437 | 1,448 | 1,418 | 22,299 | 12,866 | ||||||||||||||||||
| Shares/units sold | 2,323 | 545 | 257 | 393 | 1,128 | — | ||||||||||||||||||
| Shares/units redeemed | (3,301 | ) | (2,707 | ) | (2 | ) | — | (534 | ) | (58 | ) | |||||||||||||
| Shares/units outstanding as of December 31, 2015 (1) | 176,490 | 137,275 | 1,703 | 1,811 | 22,893 | 12,808 | ||||||||||||||||||
| NAV per share/unit as of September 30, 2015 | $ | 7.42 | $ | 7.42 | $ | 7.42 | $ | 7.42 | $ | 7.42 | ||||||||||||||
| Change in NAV per share | 0.05 | 0.05 | 0.05 | 0.05 | 0.05 | |||||||||||||||||||
| NAV per share/unit as of December 31, 2015 | $ | 7.47 | $ | 7.47 | $ | 7.47 | $ | 7.47 | $ | 7.47 | ||||||||||||||
| (1) | Amounts reported do not include approximately 441,000 restricted stock units granted to our Advisor that remain unvested as of both September 30, 2015 and December 31, 2015. |
Holders
As of February 24, 2016, we had (i) approximately 137.3 million shares of our Class E common stock outstanding held by a total of approximately 27,000 stockholders, (ii) approximately 1.8 million shares of our Class A common stock outstanding held by a total of approximately 300 stockholders, (iii) approximately 2.1 million shares of our Class W common stock outstanding held by a total of approximately 300 stockholders, and (iv) approximately 23.2 million shares of our Class I common stock outstanding held by a total of approximately 2,000 stockholders. As of February 24, 2016, we had approximately 12.7 million Class E OP Units outstanding issued to approximately 200 third parties in connection with our Operating Partnership’s private placement offerings.
| - 53 - |
Distributions
We intend to continue to accrue distributions daily and make distributions to our stockholders on a quarterly basis following the end of each calendar quarter. We began making such distributions following the first calendar quarter after the quarter in which the minimum offering requirements were met for our initial public offering. However, we reserve the right to adjust the periods during which distributions accrue and are paid.
Our ability to pay distributions at the current level also likely will be impacted by the expiration of certain large leases in our portfolio, and, as a result, we may be required to reduce the level of our quarterly distributions. To the extent that we sell higher yielding assets in exchange for assets that may initially produce less income in exchange for the potential ability for longer term appreciation, this may also put pressure on our ability to sustain our current distribution level. If our quarterly distributions exceed cash flow generated from our operations, it may cause a decrease in our NAV if not offset by other effects.
Our board of directors determines the level of our distributions each quarter. In determining the appropriate level of a distribution, our board of directors considers a number of factors, including the current and anticipated market conditions, current and anticipated future performance and make-up of our investments, our overall financial projections and expected future cash needs, and distributions required to satisfy requirements for qualification as a REIT. We can give no assurance that the board of directors will continue to set distributions at current levels and our distribution levels may change from time to time. Depending on the distribution level relative to cash flow generated from our portfolio, if our quarterly distributions exceed cash flow generated from our operations, it may cause a decrease in our NAV if not offset by other effects.
In connection with a distribution to our stockholders, our board has historically authorized, and intends to continue to authorize, a quarterly distribution of a certain dollar amount per share of our common stock before or on the first day of each quarter. We then calculate each stockholder’s specific distribution amount for the quarter using daily record and declaration dates and each stockholder’s distributions begin to accrue on the date and time that they become a record owner of our common stock, subject to our board of directors declaring a distribution for record owners as of such date and time. We accrue the amount of declared distributions as our liability on a daily basis, and such liability is accounted for in determining the NAV.
We are required to make distributions sufficient to satisfy the requirements for qualification as a REIT for federal income tax purposes. Generally, income distributed will not be taxable to us under the Code if we distribute at least 90% of our taxable income each year (computed without regard to the dividends paid deduction and our net capital gain). In addition, if we fail to distribute during each calendar year at least the sum of (a) 85% of our ordinary income for such year, (b) 95% of our capital gain net income for such year, and (c) any undistributed taxable income from prior periods, we will be subject to a 4% excise tax on the excess of the required distribution over the sum of (i) the amounts actually distributed by us, plus (ii) retained amounts on which we pay income tax at the corporate level. Distributions will be authorized at the discretion of the board of directors, in accordance with our earnings, cash flow and general financial condition. The board’s discretion will be directed, in substantial part, by its obligation to cause us to comply with the REIT requirements. Because we may receive income from interest or rents at various times during our fiscal year, distributions may not reflect our income earned in that particular distribution period and may be made in advance of actual receipt of funds in an attempt to make distributions relatively uniform. We are authorized to borrow money, issue new securities or sell assets in order to make distributions. There are no restrictions on the ability of the Operating Partnership to transfer funds to us.
For a summary of distributions that had been paid by us for the years ended December 31, 2015 and 2014 and declared for the first quarter of 2016, refer to Note 10 to our financial statements beginning on page F-1 of this Annual Report on Form 10-K.
| - 54 - |
The following table sets forth the amounts and sources of distributions declared for the three and twelve months ended December 31, 2015 and 2014 (dollar amounts in thousands):
| For the Three Months Ended | For the Year Ended | |||||||||||||||||||||||||||||||
| Distributions: | December 31, 2015 | % of Total Distributions | December 31, 2014 | % of Total Distributions | December 31, 2015 | % of Total Distributions | December 31, 2014 | % of Total Distributions | ||||||||||||||||||||||||
| Common stock distributions paid in cash | $ | 9,787 | 60.6 | % | $ | 10,425 | 62.2 | % | $ | 41,968 | 61.6 | % | $ | 41,381 | 61.9 | % | ||||||||||||||||
| Other cash distributions (1) | 1,274 | 7.9 | % | 1,069 | 6.4 | % | 4,996 | 7.3 | % | 4,620 | 6.9 | % | ||||||||||||||||||||
| Total cash distributions | $ | 11,061 | 68.5 | % | $ | 11,494 | 68.6 | % | $ | 46,964 | 68.9 | % | $ | 46,001 | 68.8 | % | ||||||||||||||||
| Common stock distributions reinvested
in common shares | 5,093 | 31.5 | % | 5,262 | 31.4 | % | 21,177 | 31.1 | % | 20,855 | 31.2 | % | ||||||||||||||||||||
| Total distributions | $ | 16,154 | 100.0 | % | $ | 16,756 | 100.0 | % | $ | 68,141 | 100.0 | % | $ | 66,856 | 100.0 | % | ||||||||||||||||
| Sources of distributions: | ||||||||||||||||||||||||||||||||
| Cash flow from operations (2) | $ | 16,154 | 100.0 | % | $ | 16,756 | 100.0 | % | $ | 68,141 | 100.0 | % | $ | 66,856 | 100.0 | % | ||||||||||||||||
| Financial performance metric: | ||||||||||||||||||||||||||||||||
| NAREIT-defined FFO (3) | $ | 21,403 | 132.5 | % | $ | 23,615 | 140.9 | % | $ | 88,171 | 129.4 | % | $ | 91,323 | 136.6 | % | ||||||||||||||||
| (1) | Other cash distributions include (i) distributions declared for OP Units for the respective period, (ii) regular distributions made during the period to our joint venture partners that are noncontrolling interest holders, which exclude distributions of disposition proceeds related to properties sold by the joint ventures, and (iii) dealer manager and distribution fees we pay to our dealer manager with respect to the Class A, Class W and Class I shares. |
| (2) | Expenses associated with the acquisition of real property are recorded to earnings and as a deduction to our cash from operations. We incurred acquisition-related expenses of approximately $1.4 million and $2.6 million for the three and twelve months ended December 31, 2015, respectively, and $244,000 and $1.2 million for the three and twelve months ended December 31, 2014, respectively. |
| (3) | FFO is an operating metric and should not be used as a liquidity measure. However, management believes the relationship between FFO and distributions may be meaningful for investors to better understand the sustainability of our operating performance compared to distributions made. For a discussion of FFO and Company-Defined FFO, including definitions, reconciliations to GAAP net income, and their inherent limitations, see “How We Measure Our Operating Performance” in “Item 7. Management’s Discussion and Analysis of Financial Condition and Results of Operations” included in this Annual Report on Form 10-K. |
Distribution Reinvestment Plan
Our distribution reinvestment plan allows stockholders to elect to have their cash distributions attributable to the class of shares owned automatically reinvested in additional shares of the same class. The per share purchase price for shares purchased pursuant to the distribution reinvestment plan is equal to our NAV per share applicable to the class of shares purchased, calculated as of the distribution date. A stockholder may terminate participation in our distribution reinvestment plan at any time, without penalty, by delivering to us a written notice. Such notice must be received by us at least one business day prior to a distribution date in order for a stockholder’s termination to be effective for such distribution date (i.e., a termination notice will be effective the day after it is received and will not affect participation in our distribution reinvestment plan for any prior date).
We reserve the right to amend any aspect of our distribution reinvestment plan without the consent of our stockholders, provided that notice of any material amendment is sent to participants at least 10 days prior to the effective date of that amendment. Our board of directors may amend, suspend or terminate the distribution reinvestment plan for any reason at any time upon 10 days’ prior notice to participants. We may provide notice by including such information (a) in a Current Report on Form 8-K or in our annual or quarterly reports, all publicly filed with the Commission or (b) in a separate mailing to the participants.
Share Redemption Programs and Other Redemptions or Repurchases
We have adopted a Class E Share Redemption Program (the “Class E SRP”), whereby eligible Class E stockholders may request that we redeem all or any portion of their Class E shares in accordance with the procedures and subject to certain conditions and limitations described below. We also have a separate Class A, W and I Share Redemption Program (the “Class AWI SRP”) for holders of our Class A, Class W or Class I shares, described below. Our board of directors may modify, suspend or terminate our share redemption programs if it deems such action to be in the best interest of our stockholders. We also conduct self-tender offers from time to time.
| - 55 - |
Class E Share Redemption Program
Under the Class E SRP, we redeem Class E shares on a quarterly basis. If a redemption request with respect to Class E shares is made and accepted, the redemption price per share is equal to the NAV per Class E share on the date of redemption. Pursuant to an amendment to the Class E SRP effective on December 12, 2015, redemptions are only available with respect to Class E shares of common stock in the event of the death or disability of a stockholder subject to the following limitation: unless approved by the board of directors, we will not make, during any consecutive twelve-month period, redemptions in the event of the death or disability of a stockholder that exceed five percent of the number of Class E shares of common stock outstanding at the beginning of such twelve-month period. Prior to this time, redemptions were not limited to requests made in the event of the death or disability of a stockholder. With respect to Class E stockholders desiring liquidity other than in connection with an event of death or disability, our board of directors evaluates each quarter whether to make liquidity available through the Class E SRP or through a tender offer process. In order to make such liquidity available through the Class E SRP, our board of directors would need to amend the Class E SRP.
Self-Tender Offers
As set forth above, with respect to Class E stockholders desiring liquidity other than in connection with an event of death or disability, our board of directors evaluates each quarter whether to make liquidity available through the Class E SRP or through a tender offer process. In order to provide additional liquidity to Class E stockholders, from time to time we may conduct self-tender offers for Class E shares. Although there can be no assurance, our board of directors currently intends to make liquidity available to Class E stockholders each quarter (other than liquidity made available in the event of the death or disability of a stockholder through the Class E SRP) in the Class E Liquidity Amount. Our board of directors may at any time decide to reduce or eliminate the Class E Liquidity Amount or cease making Class E liquidity available through self-tender offers.
Class A, Class W and Class I Share Redemption Program
Under the Class AWI SRP, on each day the New York Stock Exchange is open for trading (a business day), stockholders may request that we redeem all or any portion of their Class A, Class W and Class I shares. Redemption requests received in good order by our transfer agent or a fund intermediary on a business day and before the close of business (4:00 p.m. Eastern time) on that day will be effected at a redemption price equal to our NAV per share for the class of shares being redeemed calculated after the close of business on that day. Subject to limited exceptions, shares redeemed within 365 days of the date of purchase will be redeemed at NAV per share for the class of shares being redeemed less a short-term trading discount equal to 2% of the gross proceeds otherwise payable with respect to the redemption.
A quarterly cap is imposed on the aggregate “net redemptions” of our Class A, Class W and Class I share classes equal to the amount of shares of such classes with a value (based on the redemption price per share on the day the redemption is effected) of up to 5% of the aggregate NAV of the outstanding shares of such classes as of the last day of the previous calendar quarter. Here, we use the term “net redemptions” to mean, for any quarter, the excess of our share redemptions (capital outflows) of our Class A, Class W and Class I share classes over the share purchases net of sales commissions (capital inflows) of such classes in any ongoing public offering of Class A, Class W or Class I shares, whether in a primary offering or pursuant to a distribution reinvestment plan.
For each future quarter, our board of directors reserves the right to choose whether the quarterly cap will be applied to “gross redemptions,” meaning, for any class and any quarter, amounts paid to redeem shares of such class since the beginning of such calendar quarter, or “net redemptions.” In order for the board of directors to change the application of the quarterly cap from net redemptions to gross redemptions or vice versa, we will notify stockholders through a prospectus supplement and/or a special or periodic report filed with the Commission, as well as in a press release or on our website, at least 10 days before the first business day of the quarter for which the new test will apply.
In addition, for each future quarter, our board of directors reserves the right to choose whether the quarterly cap and the “net redemptions” test will be applied to our Class A, Class W and Class I shares on a class-specific basis rather than on the aggregate basis described above. If our board of directors chooses to have the quarterly cap and the “net redemptions” test apply on a class-specific basis, then “net redemptions” of our Class A, Class W and Class I share classes will mean, for any class and any quarter, the excess of our share redemptions (capital outflows) of such class over the share purchases net of sales commissions (capital inflows) of such class in any ongoing public offering of Class A, Class W or Class I shares, whether in a primary offering or pursuant to a distribution reinvestment plan. Further, the quarterly cap will mean a quarterly cap on the “net redemptions” of each of our Class A, Class W and Class I share classes equal to the amount of shares of such class with an aggregate value (based on the redemption price per share on the day the redemption is effected) of up to 5% of the NAV of the outstanding shares of such class as of the last day of the previous calendar quarter. In order for the board of directors to change the application of the quarterly cap and the “net redemptions” test from being applied to our Class A, Class W and Class I shares on an aggregate basis among Class A, Class W and Class I shares, taken together, to a class-specific basis, or vice versa, we will notify stockholders through a prospectus supplement and/or a special or periodic report filed with the Commission, as well as in a press release or on our website, at least 10 days before the first business day of the quarter for which the new test will apply.
| - 56 - |
The AWI SRP clarifies that no assurance can be given that we will maintain the allocation to liquid assets intended to generally be maintained under normal circumstances, as described in the plan.
For the three months ended December 31, 2015, we redeemed (i) approximately 2.7 million Class E shares pursuant to a self-tender offer for approximately $20.1 million and (ii) approximately 520,000 shares of common stock pursuant to the Class E SRP and AWI SRP for approximately $3.9 million, as described further in the table below.
| Period | Total Number of Shares Redeemed or Repurchased |
Average Price Paid per Share |
Total Number of Shares Purchased as Part of Publicly Announced Plans or Programs |
Maximum Number of Shares that May Yet Be Purchased Pursuant to the Program (1) |
||||||
| October 1 - October 31, 2015 | 123,631 | $ | 7.40 | 123,631 | — | |||||
| November 1 - November 30, 2015 | 48,131 | 7.38 | 48,131 | — | ||||||
| December 1 - December 31, 2015 (2) | 3,070,535 | 7.40 | 3,070,535 | — | ||||||
| Total | 3,242,297 | $ | 7.40 | 3,242,297 | — | |||||
| (1) | Redemptions and repurchases are limited under the Class E SRP and the Class AWI SRP as described above and pursuant to the terms of self-tender offers announced from time to time. We redeemed all Class A, W, and I shares that were requested to be redeemed during the three months ended December 31, 2015. As of December 31, 2015, we had capacity under the Class AWI SRP to redeem up to an aggregate of $18.6 million of Class A, W, and I shares. Pursuant to the Class AWI SRP, this capacity resets at the beginning of each quarter. |
| (2) | Number of shares represents (i) approximately 2.7 million Class E shares repurchased at $7.39 per share for an aggregate cost of approximately $20.1 million pursuant to a self-tender offer and (ii) approximately 349,000 shares redeemed pursuant to the Class E SRP and the Class AWI SRP, as discussed above. |
| - 57 - |
Below is a summary of Class E common stock repurchases pursuant to our self-tender offers and repurchases pursuant to the Class E SRP for each quarter during 2015 and 2014 (number of shares in thousands).
| For the Quarter Ended: | Number of Class E Shares Requested for Redemption or Purchase | Number of Class E Shares Redeemed or Purchased | Percentage of Class E Shares Requested for Redemption Redeemed or for Purchase Purchased | Price Paid per Share | ||||||||||||
| March 31, 2014 | ||||||||||||||||
| Class E SRP – Ordinary Redemptions | 17,292 | 1,163 | 6.7 | % | $ | 6.96 | ||||||||||
| Class E SRP – Death or Disability Redemptions | 682 | 682 | 100.0 | % | 6.96 | |||||||||||
| Total / Average | 17,974 | 1,845 | 10.3 | % | 6.96 | |||||||||||
| June 30, 2014 | ||||||||||||||||
| Class E SRP – Ordinary Redemptions | 16,307 | 4,577 | 28.1 | % | 7.00 | |||||||||||
| Class E SRP – Death or Disability Redemptions | 589 | 589 | 100.0 | % | 7.00 | |||||||||||
| Total / Average | 16,896 | 5,166 | 30.6 | % | 7.00 | |||||||||||
| September 30, 2014 | ||||||||||||||||
| Class E SRP – Ordinary Redemptions | 17,027 | 1,471 | 8.6 | % | 7.09 | |||||||||||
| Class E SRP – Death or Disability Redemptions | 570 | 570 | 100.0 | % | 7.09 | |||||||||||
| Total / Average | 17,597 | 2,041 | 11.6 | % | 7.09 | |||||||||||
| December 31, 2014 | ||||||||||||||||
| Class E SRP – Ordinary Redemptions | 18,300 | 1,356 | 7.4 | % | 7.16 | |||||||||||
| Class E SRP – Death or Disability Redemptions | 607 | 608 | 100.2 | % | 7.16 | |||||||||||
| Total / Average | 18,907 | 1,964 | 10.4 | % | 7.16 | |||||||||||
| Average 2014 | 17,844 | 2,754 | 15.4 | % | $ | 7.04 | ||||||||||
| March 31, 2015 | ||||||||||||||||
| Class E SRP – Ordinary Redemptions | 18,570 | 1,104 | 5.9 | % | $ | 7.30 | ||||||||||
| Class E SRP – Death or Disability Redemptions | 426 | 426 | 100.0 | % | 7.30 | |||||||||||
| Total / Average | 18,996 | 1,530 | 8.1 | % | 7.30 | |||||||||||
| June 30, 2015 | ||||||||||||||||
| Class E SRP – Ordinary Redemptions | 20,031 | 4,379 | 21.9 | % | 7.38 | |||||||||||
| Class E SRP – Death or Disability Redemptions | 626 | 626 | 100.0 | % | 7.38 | |||||||||||
| Total / Average | 20,657 | 5,005 | 24.2 | % | 7.38 | |||||||||||
| September 30, 2015 | ||||||||||||||||
| Class E SRP – Ordinary Redemptions | 12,456 | 1,393 | 11.2 | % | 7.42 | |||||||||||
| Class E SRP – Death or Disability Redemptions | 452 | 452 | 100.0 | % | 7.42 | |||||||||||
| Self-Tender Offer Purchases (1) | 17,153 | 17,153 | 100.0 | % | 7.25 | |||||||||||
| Total / Average | 30,061 | 18,998 | 63.2 | % | 7.27 | |||||||||||
| December 31, 2015 | ||||||||||||||||
| Self-Tender Offer Purchases (2) | 20,758 | 2,707 | 13.0 | % | 7.39 | |||||||||||
| Total / Average | 20,758 | 2,707 | 13.0 | % | 7.39 | |||||||||||
| Average 2015 | 22,618 | 7,060 | 31.2 | % | $ | 7.30 | ||||||||||
| (1) | Amounts represent Class E shares properly tendered and not properly withdrawn at or below the final purchase price of $7.25 per share of a modified “Dutch auction” tender offer, which we completed on August 12, 2015. An additional 6,863 Class E shares were submitted for redemption at prices higher than the final purchase price, and were therefore not properly tendered. |
| (2) | Amounts represent Class E shares purchased pursuant to a self-tender offer, which we completed on December 23, 2015. |
During 2015, we satisfied 100% of the redemption requests received pursuant to our Class AWI SRP; we redeemed approximately 23,000 Class A shares for an average price of approximately $7.29 per share, approximately 20,000 Class W shares for an average price of approximately $7.32 per share, and approximately 873,000 Class I shares for an average price of approximately $7.37 per share. During 2014, we satisfied 100% of the redemption requests received pursuant to our Class AWI SRP; we redeemed approximately 2,000 Class W shares for an average price of approximately $6.94 per share and approximately 648,000 Class I shares for an average price of approximately $7.04 per share.
| - 58 - |
Securities Authorized for Issuance under Equity Compensation Plans
The following table gives information regarding our equity incentive plans as of December 31, 2015.
| Equity Compensation Plans Information | ||||||||||||
| Plan Category | Number of Securities To Be Issued Upon Exercise of Outstanding Options, Warrants, and Rights | Weighted-Average Exercise Price of Outstanding Options, Warrants, and Rights (1) | Number
of Securities Remaining Available for Future Issuance Under Equity Compensation Plans (2) | |||||||||
| Equity compensation plans approved by security holders | (94,116 | )(3) | $ | 11.00 | 1,815,938 | |||||||
| Equity compensation plans not approved by security holders | — | — | 1,989,318 | |||||||||
| Total / Weighted Average | (94,116 | ) | $ | 11.00 | 3,805,256 | |||||||
| (1) | Weighted-average exercise price represents the option strike price for 90,000 options to purchase Class E shares for $11.00 issued to our three independent directors. Restricted stock units (“RSUs”) with respect to Class I shares of our common stock that were granted to our independent directors and had not been settled as of December 31, 2015, are included in the number of securities to be issued upon exercise of outstanding options, warrants, and rights but are not reflected in the weighted-average exercise price of outstanding options, warrants, and rights. |
| (2) | We have two equity incentive plans. Under each plan, an aggregate maximum of 5.0 million shares may be issued upon grant, vesting or exercise of awards, although the board of directors, as of December 31, 2015, has only authorized and reserved for issuance a total of 2.0 million shares of our common stock under each plan. |
| (3) | As of December 31, 2015, includes (i) options to purchase 90,000 Class E shares of our common stock that were granted to our independent directors and had vested but had not yet been exercised, and (ii) 4,116 RSUs with respect to Class I shares of our common stock that were granted to our independent directors and had not yet vested. |
Unregistered Issuance of Securities
No equity securities were sold in unregistered transactions during the three months ended December 31, 2015.
| - 59 - |
| ITEM 6. | SELECTED FINANCIAL DATA |
The following table sets forth selected financial data relating to our historical financial condition and results of operations for each of the five years ended December 31, 2015. The financial data in the table is qualified in its entirety by, and should be read in conjunction with, “Item 7. Management’s Discussion and Analysis of Financial Condition and Results of Operations” and our financial statements and related notes beginning on page F-1 of this Annual Report on Form 10-K. The amounts in the table are in thousands except per share and footnote information.
| As of or For the Year Ended December 31, | ||||||||||||||||||||
| 2015 | 2014 | 2013 | 2012 | 2011 | ||||||||||||||||
| Statement of Operations Data: | ||||||||||||||||||||
| Total revenue | $ | 225,200 | $ | 231,597 | $ | 217,777 | $ | 216,325 | $ | 218,857 | ||||||||||
| Total operating expenses, excluding acquisition-related expenses and gains and losses on real property, debt related investments, and real estate securities | (170,507 | ) | (167,018 | ) | (155,740 | ) | (156,550 | ) | (162,885 | ) | ||||||||||
| Acquisition-related expenses net of other gains | (2,644 | ) | (1,205 | ) | (536 | ) | (325 | ) | (610 | ) | ||||||||||
| Impairments and provisions for loss on real property, real estate-related debt investments and real estate securities (1) | (8,124 | ) | (9,500 | ) | (2,600 | ) | — | (26,406 | ) | |||||||||||
| Gain on sale of real property (2) | 134,218 | 10,914 | — | — | — | |||||||||||||||
| Interest expense | (47,508 | ) | (61,903 | ) | (65,325 | ) | (69,844 | ) | (74,406 | ) | ||||||||||
| Income (loss) from continuing operations (3) | 131,659 | 3,990 | (9,084 | ) | (14,961 | ) | (43,056 | ) | ||||||||||||
| Discontinued operations (4) | — | 30,004 | 65,554 | (7,410 | ) | (21,510 | ) | |||||||||||||
| Net income (loss) | 131,659 | 33,994 | 56,470 | (22,371 | ) | (64,566 | ) | |||||||||||||
| Net (income) loss attributable to noncontrolling interests | (7,404 | ) | (4,802 | ) | (4,002 | ) | 110 | 6,886 | ||||||||||||
| Net income (loss) attributable to common stockholders | $ | 124,255 | $ | 29,192 | $ | 52,468 | $ | (22,261 | ) | $ | (57,680 | ) | ||||||||
| Comprehensive Income (Loss) Data: | ||||||||||||||||||||
| Net income (loss) | $ | 131,659 | $ | 33,994 | $ | 56,470 | $ | (22,371 | ) | $ | (64,566 | ) | ||||||||
| Net unrealized change from available-for-sale securities | — | (211 | ) | — | (1,426 | ) | 1,260 | |||||||||||||
| Net unrealized change from cash flow hedging derivatives | (977 | ) | 721 | 4,975 | 3,963 | 2,837 | ||||||||||||||
| Total other comprehensive (loss) income | (977 | ) | 510 | 4,975 | 2,537 | 4,097 | ||||||||||||||
| Comprehensive income (loss) | $ | 130,682 | $ | 34,504 | $ | 61,445 | $ | (19,834 | ) | $ | (60,469 | ) | ||||||||
| Per Share Data: | ||||||||||||||||||||
| Net income (loss) per basic and diluted common share: | ||||||||||||||||||||
| Continuing operations | $ | 0.70 | $ | 0.02 | $ | (0.05 | ) | $ | (0.08 | ) | $ | (0.22 | ) | |||||||
| Discontinued operations | $ | — | $ | 0.14 | $ | 0.34 | $ | (0.04 | ) | $ | (0.09 | ) | ||||||||
| Common Stock Distributions | ||||||||||||||||||||
| Common stock distributions declared | $ | 63,145 | $ | 62,236 | $ | 62,330 | $ | 84,259 | $ | 105,704 | ||||||||||
| Weighted average common stock distributions declared per share | $ | 0.3582 | $ | 0.3492 | $ | 0.3499 | $ | 0.4625 | $ | 0.5750 | ||||||||||
| Other Information: | ||||||||||||||||||||
| Weighted average number of common shares outstanding: | ||||||||||||||||||||
| Basic | 175,938 | 178,273 | 178,196 | 181,982 | 183,813 | |||||||||||||||
| Diluted | 188,789 | 190,991 | 191,932 | 197,244 | 197,377 | |||||||||||||||
| Number of common shares outstanding at end of period | 164,124 | 178,400 | 176,007 | 178,128 | 182,331 | |||||||||||||||
| Number of diluted shares outstanding at end of period | 176,932 | 190,547 | 189,278 | 192,303 | 198,529 | |||||||||||||||
| Balance Sheet Data: | ||||||||||||||||||||
| Real estate, before accumulated depreciation (5) | $ | 2,380,174 | $ | 2,472,926 | $ | 2,570,480 | $ | 2,819,550 | $ | 2,724,684 | ||||||||||
| Total assets | $ | 1,967,208 | $ | 2,148,133 | $ | 2,305,409 | $ | 2,659,254 | $ | 2,670,419 | ||||||||||
| Total debt obligations (6) | $ | 1,104,086 | $ | 1,198,267 | $ | 1,323,472 | $ | 1,619,452 | $ | 1,481,503 | ||||||||||
| Total liabilities | $ | 1,241,257 | $ | 1,384,153 | $ | 1,500,398 | $ | 1,817,727 | $ | 1,671,150 | ||||||||||
| Cash Flow Data: | ||||||||||||||||||||
| Net cash provided by operating activities | $ | 105,530 | $ | 87,229 | $ | 86,589 | $ | 94,487 | $ | 94,342 | ||||||||||
| Net cash (used in) provided by investing activities | $ | 74,421 | $ | (15,102 | ) | $ | 72,847 | $ | (39,465 | ) | $ | 89,457 | ||||||||
| Net cash used in financing activities | $ | (178,643 | ) | $ | (82,444 | ) | $ | (171,530 | ) | $ | (146,597 | ) | $ | (138,911 | ) | |||||
| Supplemental Information | ||||||||||||||||||||
| FFO attributable to common stockholders (3)(7) | $ | 82,170 | $ | 85,246 | $ | 85,216 | $ | 82,851 | $ | 65,237 | ||||||||||
| Company-defined FFO attributable to common stockholders (7) | $ | 85,719 | $ | 86,430 | $ | 88,044 | $ | 88,402 | $ | 90,680 | ||||||||||
| - 60 - |
| (1) | Impairments and provisions for loss on real property, real estate-related debt investments and real estate securities include (i) real property impairment of $8.1 million, $9.5 million, and $2.6 million during 2015, 2014, and 2013, respectively, (ii) provisions for loan loss, net of reversals, of $23.0 million during 2011, and (iii) other than temporary impairment on securities of $3.4 million during 2011. Real property impairment losses of $5.7 million and $23.5 million recorded during the years ended December 31, 2012 and 2011, respectively, relate to properties that we have disposed of and are included within discontinued operations. |
| (2) | Beginning with the year ended December 31, 2014, as the result of adopting new accounting guidance, we present the aggregate net gains related to disposals of properties that are not classified as discontinued operations within continuing operations. See “Discontinued Operations” in Note 3 to our financial statements beginning on page F-1 of this Annual Report on Form 10-K for information regarding the adoption of new accounting guidance related to discontinued operations. |
| (3) | Income (loss) from continuing operations and FFO attributable to common stockholders includes losses on extinguishment of debt of $1.2 million, $2.5 million, and $5.7 million in 2015, 2013, and 2012, respectively. |
| (4) | After December 31, 2013, a discontinued operation is a component (or group of components) of the entity, the disposal of which would represent a strategic shift that has (or will have) a major effect on the entity’s operations and financial results, when such component (or group of components) have been disposed of or classified as held for sale. Through December 31, 2013, discontinued operations represent properties that we have either disposed of or have classified as held for sale if both the operations and cash flows of the property have been or will be eliminated from our ongoing operations as a result of the disposal transaction and if we will not have any significant continuing involvement in the operations of the property after the disposal transaction. Discontinued operations includes the results of (i) 12 properties classified as held for sale as of December 31, 2013, (ii) 13 properties disposed of during 2013, (iii) three properties disposed of during 2012, and (iv) five properties disposed of during 2011. |
| (5) | Real estate, before accumulated depreciation includes approximately $30.4 million and $193.6 million that we classified within assets held for sale as of December 31, 2014 and 2013, respectively. |
| (6) | Total debt obligations includes approximately $80.4 million that we classified within liabilities related to assets held for sale as of December 31, 2013. |
| (7) | FFO and Company-Defined FFO are defined, reconciled to GAAP net income, and discussed in “How We Measure Our Performance – Funds From Operations” in “Item 7. Management’s Discussion and Analysis of Financial Condition and Results of Operations” included in this Annual Report on Form 10-K. |
| - 61 - |
| ITEM 7. | MANAGEMENT’S DISCUSSION AND ANALYSIS OF FINANCIAL CONDITION AND RESULTS OF OPERATIONS |
This section of our Annual Report on Form 10-K provides an overview of what management believes to be the key elements for understanding (i) our company and how we manage our business, (ii) how we measure our performance and our operating results, (iii) our liquidity and capital resources, and (iv) the financial statements that follow beginning on page F-1 of this Annual Report on Form 10-K. The following discussion and analysis should be read together with our consolidated financial statements and notes thereto included in this Annual Report on Form 10-K. The following information contains forward-looking statements, which are subject to risks and uncertainties. Should one or more of these risks or uncertainties materialize, actual results may differ materially from those expressed or implied by the forward-looking statements. See “Cautionary Statement Regarding Forward-Looking Statements” above for a description of these risks and uncertainties.
Overview
Dividend Capital Diversified Property Fund Inc. is a Maryland corporation formed on April 11, 2005 to invest in a diverse portfolio of real property and real estate related investments. As used herein, “the Company,” “we,” “our” and “us” refer to Dividend Capital Diversified Property Fund Inc. and its consolidated subsidiaries and partnerships except where the context otherwise requires.
We believe we have operated in such a manner as to qualify as a real estate investment trust (“REIT”) for federal income tax purposes, commencing with the taxable year ended December 31, 2006, when we first elected REIT status. We utilize an Umbrella Partnership Real Estate Investment Trust (“UPREIT”) organizational structure to hold all or substantially all of our assets through our operating partnership, Dividend Capital Total Realty Operating Partnership LP (our “Operating Partnership”). Furthermore, our Operating Partnership wholly owns a taxable REIT subsidiary, DCTRT Leasing Corp. (the “TRS”), through which we execute certain business transactions that might otherwise have an adverse impact on our status as a REIT if such business transactions were to occur directly or indirectly through our Operating Partnership. We are an externally managed REIT and have no employees. Our day-to-day activities are managed by Dividend Capital Total Advisors LLC (our “Advisor”), a related party, under the terms and conditions of an advisory agreement (the “Advisory Agreement”).
On July 12, 2012, the Commission declared effective our Registration Statement on Form S-11 (the “Prior Registration Statement”). The Prior Registration Statement applied to the offer and sale (the “Prior Offering”) of up to $3,000,000,000 of our shares of common stock, of which $2,250,000,000 of shares were expected to be offered to the public in a primary offering and $750,000,000 of shares were expected to be offered to our stockholders pursuant to an amended and restated distribution reinvestment plan (subject to our right to reallocate such amounts). In the Prior Offering, we offered to the public three classes of shares: Class A shares, Class W shares and Class I shares with net asset value (“NAV”) based pricing. See “Item 5. Market for Registrant’s Common Equity, Related Stockholder Matters and Issuer Purchases of Equity Securities” and Exhibit 99.1 of this Annual Report on Form 10-K, for a description of our valuation procedures and valuation components, including important disclosure regarding real property valuations provided by Altus Group U.S., Inc., an independent valuation firm (“the Independent Valuation Firm”). Our NAV is not audited by our independent registered public accounting firm. On September 15, 2015, we terminated the Prior Offering. Through September 15, 2015, the date our Prior Offering terminated, we had raised gross proceeds of approximately $183.0 million from the sale of approximately 25.8 million shares in the Prior Offering, including approximately $3.4 million through our distribution reinvestment plan.
On September 16, 2015, the Commission declared effective our Registration Statement on Form S-11 (the “Follow-On Registration Statement”). The Follow-On Registration Statement applies to the Company’s follow-on “best efforts” offering of up to $1,000,000,000 of the Company’s Class A, Class I and Class W shares of common stock, of which $750,000,000 of shares are expected to be offered to the public in a primary offering and $250,000,000 of shares are expected to be offered to stockholders of the Company pursuant to its distribution reinvestment plan (subject to the Company’s right to reallocate such amounts) (the “Follow-On Offering”). As of December 31, 2015, we had 1,703,109 Class A shares, 1,811,277 Class W shares, and 23,334,275 Class I shares outstanding.
We will also continue to sell shares of our unclassified common stock, which we refer to as “Class E” shares, pursuant to our distribution reinvestment plan offering registered on our Registration Statement on Form S-3 (Registration Number 333-162636) (the “Class E DRIP Offering”).
The primary sources of our revenue and earnings include rent received from customers under longer-term operating leases at our properties, including reimbursements from customers for certain operating costs, and interest payments from our debt related investments. Our primary expenses include rental expenses, depreciation and amortization expenses, general and administrative expenses, advisory fees and interest expenses.
| - 62 - |
Our current investments include:
| (1) | Investments in real properties, consisting of office, industrial, and retail properties, located in the United States; and |
| (2) | Certain debt related investments, including originating and participating in whole mortgage loans secured by commercial real estate (herein referred to as “debt related investments”). |
As of December 31, 2015, we had total gross investments with an estimated fair value of approximately $2.4 billion (calculated in accordance with our valuation procedures), comprising:
| (1) | 60 operating properties located in 21 geographic markets in the United States, aggregating approximately 10.1 million net rentable square feet, which were approximately 90.1% leased. Our operating real property portfolio consists of: |
| · | 20 office properties located in 14 geographic markets, aggregating approximately 4.5 million net rentable square feet, with an aggregate fair value of approximately $1.4 billion; |
| · | 34 retail properties located in nine geographic markets, aggregating approximately 3.8 million net rentable square feet, with an aggregate fair value of approximately $950.9 million; and |
| · | 6 industrial properties located in three geographic markets, aggregating approximately 1.9 million net rentable square feet, with an aggregate fair value of approximately $90.3 million. |
| (2) | Approximately $15.7 million in net debt related investments, all of which are structured as mortgage notes. |
Consistent with our investment strategy, we currently have four business segments, consisting of investments in (i) office property, (ii) industrial property, (iii) retail property, and (iv) real estate-related debt (which we refer to as “debt related investments”). We may have additional segments in the future to the extent we enter into additional real property sectors, such as multifamily, hospitality, and other real property types. For a discussion of our business segments and the associated revenue and net operating income by segment, see Note 13 to our financial statements beginning on page F-1 of this Annual Report on Form 10-K.
Any future and near-term obligations are expected to be funded primarily through the use of cash on hand, cash generated from operations, proceeds from our public offerings and other equity offerings, proceeds from the sale of existing investments, and the issuance and assumption of debt obligations.
| · | Cash on hand — As of December 31, 2015, we had approximately $15.8 million of cash and cash equivalents. |
| · | Cash available under our credit facility — As of December 31, 2015, the unused portion of our line of credit was approximately $230.8 million, all of which was available to us. |
| · | Cash generated from operations — During the year ended December 31, 2015, we generated approximately $105.5 million from operations of our real properties and income from debt related investments. |
| · | Proceeds from offerings of equity securities — We currently maintain a public offering of our shares of common stock. During the year ended December 31, 2015, we raised approximately $86.5 million in proceeds from the sale of Class A, W and I shares in our Prior Offering and Follow-On Offering, including approximately $3.5 million under the distribution reinvestment plan. Approximately $50.8 million of the proceeds from the sale of Class A, W and I shares was raised pursuant to a selected dealer agreement, which we refer to as our “Managed Offering.” Additionally, during the year ended December 31, 2015, we received approximately $17.9 million in proceeds from the Class E DRIP Offering. |
| · | Proceeds from sales and repayments of existing investments — During the year ended December 31, 2015, we sold 17 operating properties and a land parcel for approximately $496.2 million. After buyer credits, closing costs, the assumption of a related mortgage note, and the reclassification of certain proceeds to restricted cash, we received net proceeds of $359.8 million. Subsequent to December 31, 2015, we sold three operating properties for approximately $170.1 million. In addition, during the year ended December 31, 2015, seven of our debt related investments with aggregate principal balances of $81.5 million were repaid to us in full. |
We believe that our existing cash balance, cash generated from operations, proceeds from our public offerings and our ability to sell investments and to issue debt obligations remains adequate to meet our expected capital obligations for the next twelve months.
Launch of Private Placements of Delaware Statutory Trust Interests
In March 2016, we, through the Operating Partnership, initiated a program to raise capital in private placements exempt from registration under the Securities Act of 1933, as amended (“Private Placements”) through the sale of beneficial interests (“Interests”) in specific Delaware statutory trusts holding real properties, including properties currently indirectly owned by the Operating Partnership (the “DST Program”). From 2006 through 2009, we, through our subsidiaries conducted similar private placement offerings of fractional interests in which it raised a total of $183.1 million in gross proceeds. These fractional interests were all subsequently acquired by the Operating Partnership in exchange for an aggregate of 17.7 million OP Units.
| - 63 - |
Each Private Placement will offer Interests in one or more real properties placed into one or more Delaware statutory trust(s) by the Operating Partnership or its affiliates (“DST Properties”). We anticipate that these Interests may serve as replacement properties for investors seeking to complete like-kind exchange transactions under Section 1031 of the Internal Revenue Code of 1986, as amended. Additionally, any Interests sold to investors pursuant to such Private Placements will be leased-back by an indirect wholly owned subsidiary of the Operating Partnership on a long term basis of up to 29 years. The lease agreements are expected to be fully guaranteed by the Operating Partnership. Additionally, the Operating Partnership will retain a fair market value purchase option (“FMV Option”) giving it the right, but not the obligation, to acquire the Interests from the investors at a later time in exchange for OP Units. Please see “Subsequent Events” below for more information about the DST Program.
Similar to our prior private placement offerings, we expect that the DST Program will give us the opportunity to expand and diversify our capital raise strategies by offering what we believe to be an attractive and unique investment product for investors that may be seeking replacement properties to complete like-kind exchange transactions under Section 1031 of the Code. We expect to use the net proceeds of these private placements to make investments in accordance with our investment strategy and policies, to provide liquidity to our investors and for general corporate purposes (which may include repayment of our debt or any other corporate purposes we deem appropriate). The specific amounts of the net proceeds that are used for such purposes, and the priority of such uses, will depend on the amount and timing of receipts of such proceeds and what we deemed to be the best use of such proceeds at such time.
One consideration that we reviewed in connection with the DST Program was the nature and extent of the long-term master lease obligation guaranteed by our Operating Partnership, which may cause us to subsidize the master lease payments to DST Program investors if the underlying cash flows from the property are not sufficient cover such lease payments. If cash flows from the underlying property were not sufficient to fund the required master lease payments, we would need to source funding from alternative sources and the difference between such amounts would reduce our NAV, cash flows from operations and net income.
Since we will sublease all of the properties sold to investors under the DST Program, we will not recognize a sale of the underlying property and we will report the proceeds from the sale of these Interests as a financing obligation in accordance with GAAP. We will account for the rental payments made pursuant to leases to DST Program investors as interest expense using the interest method whereby we will record a portion of the rental payment as interest expense and a portion as an accretion or amortization of the outstanding balance of the financing obligation. As a result, the DST Program will increase our liabilities reported on our balance sheets as we received proceeds from the sale of Interests and increase interest expense reported on our statements of income during the time that Interests remain outstanding and we make rental payments to third-party investors. However, the financing obligation and related interest expense will not have a material impact on our financial covenants related to our unsecured borrowing credit facilities, since such credit facilities do not consider such financing obligations as borrowings for purposes of determining our compliance with our leverage ratio or fixed-charge coverage ratios. Due to our ability to exercise the FMV Option to acquire Interest at a later time, we do not intend to include the financing obligation resulting from the DST Program as a borrowing for purposes of reporting our overall leverage. If we elect to exercise our FMV Option to acquire the Interests from the investors at a later time in exchange for OP Units, we will eliminate the financing obligation and record the related OP Units issued as noncontrolling interests. If we do not exercise our FMV Option we will continue to recognize these Interests as a financing obligation and record interest expense associated with our rental payments to DST Program Investors until the expiration of our lease with the DST Program investors.
Current Business Environment
The US economy produced strong enough gains across several factors in 2015 to convince the Federal Reserve to raise interest rates for the first time since 2006. During 2015, gross domestic product (“GDP”) grew at an estimated annualized rate of 2.4%, equal to the 2.4% growth in 2014. Increases in consumer spending and fixed investments by manufacturers were all sufficient to offset the disruption caused by lower oil and commodities prices. The consumer price index increased 0.7% in 2015 which compares to an increase of 0.8% in 2014. Excluding food and energy items, the consumer price index increased 2.1% in 2015, compared to 1.6% in 2014. The unemployment rate was 5.0% at the end of 2015 compared with 5.6% at the end of 2014. The economy on average created over 220,000 new jobs per month in 2015, with real earnings increasing 1.8% in 2015 compared to 1.0% in 2014. Looking toward 2016, the Federal Reserve estimates GDP growth for 2016 between 2.3% and 2.5%, along with a positive outlook for other macroeconomic factors.
| - 64 - |
The results in the US economy occurred against the backdrop of significant events in the global economy that could continue to have an impact in 2016. China’s economic growth slowed considerably in 2015, causing a decrease in Chinese demand for imports which, in turn, negatively affected the economies of many countries around the world whose trade with China accounts for a meaningful portion of their respective GDP. The European economy also struggled to gain momentum, causing policy makers to lower interest rates and increase quantitative easing in an effort to increase historically low inflation rates. Finally, the price of oil and commodities declined significantly in 2015, negatively impacting both oil and commodity-based economies as well as industries focused on those sectors. All of these factors contributed to a strengthening of the US dollar against most global currencies, which makes the price of US goods more expensive and could therefore reduce global demand for US goods and services.
Despite global uncertainties, US real estate continues to be a target investment for both domestic and foreign sources of capital. The continued modest growth of the US economy has led to improving real estate fundamentals that favor landlords. In general, new supply has been limited; the multifamily sector has been active in development while the office, industrial, and retail sectors have all kept their new supply at or below historical averages. Occupancy rates generally are increasing across the sectors, which is providing owners of real estate in many markets the opportunity to increase rental rates. In conjunction with these fundamentals, the global uncertainty has increased capital flows into US real estate while working to keep interest rates at historically low levels. The combined effect of these forces has increased real estate transaction volume and competitive pricing. Transaction volumes in the real estate sector during 2015 increased 23% compared to 2014 and are at the highest levels since the prior cycle’s peak in 2007. This has affected pricing, with yields falling for the broad real estate sector in 2015 as compared to 2014.
We are seeing these trends in our daily activities. We are generally encountering more opportunities to increase rental rates across many of our markets and believe these opportunities will continue in 2016, although certain sectors and/or markets may be disproportionately impacted by the strengthening US dollar and/or continued weakness in the oil and gas sector. For example, the strengthening US dollar could increase imports yet decrease manufacturing production, both of which could influence the fundamentals and valuation of industrial real estate. In addition, continued volatility in the oil and commodities markets could affect markets that have a large percentage of employment tied to those industries, such as Houston, TX. In our transactions, we frequently find ourselves competing with many investors for properties that we find attractive and we believe the investor demand for high quality real estate currently exceeds the amount of supply. With transaction volumes rising, there are several opportunities to invest capital into commercial real estate but we believe being selective and disciplined is paramount to making successful investments.
Significant Transactions During the Year Ended December 31, 2015
Investment Activity
Dispositions of Real Properties
During the year ended December 31, 2015, we completed (i) the disposition of 17 wholly owned properties aggregating approximately 3.1 million net rentable square feet for an aggregate sales price of approximately $488.7 million, and (ii) the sale of a wholly owned land parcel for a sales price of approximately $7.6 million. Of these sales, the most significant is the sale of a portfolio of 12 wholly owned office and industrial properties comprising approximately 2.7 million net rentable square feet to an unrelated third party for a contract sales price of approximately $398.6 million on March 11, 2015. For additional information on these dispositions, see Note 3 to our financial statements beginning on page F-1 of this Annual Report on Form 10-K.
| - 65 - |
Acquisitions of Real Properties
The following table summarizes our acquisitions of real properties during the year ended December 31, 2015 (dollar amounts and square footage in thousands):
| Real Property | Property Type |
Market | Number of Properties |
Date of Acquisition | Acquired Ownership |
Contract Price | Net Rentable Square Feet |
Percent Leased at Acquisition |
|||
| Bank of America Tower | Office | South Florida | 1 | December 11, 2015 | 100% | $ | 35,750 | 110 | 87 | % | |
| Yale Village | Retail | Tulsa, OK | 1 | December 9, 2015 | 100% | 31,800 | 101 | 100 | % | ||
| Chester Springs | Retail | Northern New Jersey | 1 | October 8, 2015 | 100% | 53,781 | 223 | 95 | % | ||
| Venture Corporate Center | Office | South Florida | 1 | August 6, 2015 | 100% | 45,750 | 253 | 97 | % | ||
| Shenandoah | Retail | South Florida | 1 | August 6, 2015 | 100% | 32,670 | 124 | 100 | % | ||
| City View | Office | Austin, TX | 1 | April 24, 2015 | 100% | 68,750 | 274 | 99 | % | ||
| South Cape | Retail | Greater Boston (1) | 1 | March 18, 2015 | 100% | 35,450 | 143 | 92 | % | ||
| Rialto | Office | Austin, TX | 1 | January 15, 2015 | 100% | 37,300 | 155 | 94 | % | ||
| Total 2015 real property acquisitions | 8 | $ | 341,251 | 1,383 | 96 | % | |||||
| (1) | Our Greater Boston market comprises the greater metro area around Boston, MA. As of December 31, 2015, properties in our Greater Boston market are located in the following states: Massachusetts, Connecticut, New Hampshire, and Rhode Island. |
Debt Related Investments
The table below summarizes the repayments of debt related investments that we received during the years ended December 31, 2015, 2014, and 2013 (amounts in thousands).
| Description | Number of Debt Related Investment Repaid | Debt Related Investment Principal Repayments | Early Repayment Fees | Repayment of Borrowings Secured by Debt Related Investments | Net Cash Proceeds from Repayments | |||||||||||||||
| 2015 Repayments (1) | 7 | $ | 81,487 | $ | 2,586 | $ | (11,228 | ) | $ | 72,845 | ||||||||||
| 2014 Repayments | 3 | 29,685 | 244 | (7,125 | ) | 22,804 | ||||||||||||||
| 2013 Repayments | 4 | 73,712 | 435 | (46,183 | ) | 27,964 | ||||||||||||||
| Total Repayments For the Years Ended December 31 2015, 2014, and 2013 | 14 | $ | 184,884 | $ | 3,265 | $ | (64,536 | ) | $ | 123,613 | ||||||||||
(1) The cash proceeds from repayment of the mezzanine debt investment includes repayment of accrued interest of approximately $6.4 million.
Financing Activity
Share Redemption Programs and Other Redemptions and Repurchases
Self-Tender Offers — To provide additional liquidity to Class E stockholders, on August 12, 2015, we completed a modified “Dutch Auction” tender offer, pursuant to which we accepted for purchase approximately 17.2 million Class E shares of common stock, at a purchase price of $7.25 per share for an aggregate cost of approximately $124.4 million.
We completed a second self-tender offer on December 23, 2015, pursuant to which we accepted for purchase approximately 2.7 million Class E shares of common stock, at a purchase price of $7.39 per share for an aggregate cost of approximately $20.1 million. Going forward, our board of directors will evaluate each quarter whether to make liquidity available to Class E stockholders through the Class E share redemption program or through a tender offer process.
| - 66 - |
Amendment to Class E SRP — In connection with the second self-tender offer described above, on November 12, 2015, the Company’s board of directors approved an Amended and Restated Class E Share Redemption Program (the “Amended Class E SRP”), which became effective on December 12, 2015. Under the Amended Class E SRP, redemptions are only available with respect to Class E shares of common stock in the event of the death or disability of a stockholder subject to the following limitation: unless approved by the board of directors, we will not make, during any consecutive 12-month period, redemptions in the event of the death or disability of a stockholder that exceed 5% of the number of Class E shares of common stock outstanding at the beginning of such 12-month period. Ordinary redemptions are no longer available under the Amended Class E SRP.
Recast of Credit Facility
During the year ended December 31, 2015, we amended and restated our $620 million senior unsecured term loan and revolving line of credit (the “Old Facility”) to provide for a $550 million senior unsecured term loan and revolving line of credit, with a syndicate of lenders led by Bank of America, N.A., as Administrative Agent (collectively, the “Amended Facility”), consisting of a $400 million revolving credit facility (the “Revolving Credit Facility”) and a $150 million term loan (the “$150 Million Term Loan”). The Amended Facility provides us with the ability from time to time to increase the size of the Amended Facility up to a total of $900 million less the amount of any prepayments under the $150 Million Term Loan, subject to receipt of lender commitments and other conditions. As of December 31, 2015, we had outstanding borrowings of $150.0 million and $167.0 million under the $150 Million Term Loan and the Revolving Credit Facility, respectively. For additional discussion of the recast of the Amended Facility, see Note 5 to our financial statements beginning on page F-1 of this Annual Report on Form 10-K.
New Credit Agreement
During the year ended December 31, 2015, we entered into an unsecured credit agreement providing for a $200 million term loan with a syndicate of six lenders led by Wells Fargo Bank and National Association, which matures in February 2022 (the “$200 Million Term Loan”). As of December 31, 2015, we had outstanding borrowings of $200.0 million under the $200 Million Term Loan. For additional discussion of the $200 Million Term Loan, see Note 5 to our financial statements beginning on page F-1 of this Annual Report on Form 10-K.
Assumption and Defeasance of Mortgage Note
Upon the disposition of a portfolio of 12 office and industrial properties during the year ended December 31, 2015, the buyer assumed approximately $128.0 million of a mortgage note borrowing from us, which is scheduled to mature in July 2020 and bears interest at 5.46%. In addition, we were released of our obligations on $44.8 million of the mortgage note borrowing that was not assumed by the buyer through a defeasance process. Accordingly, we incurred defeasance costs of approximately $8.6 million, which are included within gain on sale of real property in the statements of income included in our financial statements beginning on page F-1 of this Annual Report on Form 10-K. Upon such defeasance, we derecognized the associated borrowing, which was assumed by an unrelated successor borrower.
Notable Mortgage Note Borrowings and Other Secured Borrowings
Repayment of Mortgage Notes and Other Secured Borrowings — During the year ended December 31, 2015, we repaid certain mortgage note borrowings in full during the respective free-prepayment periods prior to their scheduled maturities and repaid the borrowings under our repurchase facility in full using proceeds from our term loans and our revolving credit facility. The table below summarizes our repayment of mortgage note borrowings and the borrowings under our repurchase facility (amounts in thousands).
| Debt Obligation | Number of Debt Obligations Repaid | Balance Repaid | Stated Interest Rate (1) |
Collateral Type | |||||
| Mortgage notes | 10 | $ | 126,387 | 6.09% | Real Properties | ||||
| Repurchase facility | 1 | 37,023 | 2.84% | Debt Related Investments | |||||
| Total/weighted average borrowings | 11 | $ | 163,410 | 5.35% | |||||
| (1) | We had effectively fixed the stated interest rates of certain of our borrowings by using interest rate swaps. |
Borrowing Under Mortgage Notes — During the year ended December 31, 2015, we received proceeds from a new mortgage note borrowing of approximately $70.0 million bearing interest at a fixed rate of 3.80%, which matures in November 2025 and is non-amortizing. The mortgage note is secured by a retail property in the Washington, DC market.
| - 67 - |
How We Measure Our Operating Performance
Funds From Operations
FFO Definition (“FFO”)
We believe that FFO, as defined by the National Association of Real Estate Investment Trusts (“NAREIT”), is a meaningful supplemental measure of our operating performance because historical cost accounting for real estate assets in accordance with GAAP implicitly assumes that the value of real estate assets diminishes predictably over time, as reflected through depreciation and amortization expense. However, since real estate values have historically risen or fallen with market and other conditions, many industry investors and analysts have considered presentation of operating results for real estate companies that use historical cost accounting to be insufficient. Thus, NAREIT created FFO as a supplemental measure of operating performance for real estate investment trusts that consists of net income (loss), calculated in accordance with GAAP, plus real estate-related depreciation and amortization and impairment of depreciable real estate, less gains (or losses) from dispositions of real estate held for investment purposes.
The following unaudited table presents a reconciliation of FFO to net income (loss) for the three months and years ended December 31, 2015, 2014, and 2013 (amounts in thousands, except per share information).
| For the Three Months Ended | For the Year Ended | |||||||||||||||||||||||
| December 31, | December 31, | |||||||||||||||||||||||
| 2015 | 2014 | 2013 | 2015 | 2014 | 2013 | |||||||||||||||||||
| Reconciliation of net earnings to FFO: | ||||||||||||||||||||||||
| Net income (loss) attributable to common stockholders | $ | 730 | $ | 5,303 | $ | (1,367 | ) | $ | 124,255 | $ | 29,192 | $ | 52,468 | |||||||||||
| Add (deduct) NAREIT-defined adjustments: | ||||||||||||||||||||||||
| Depreciation and amortization expense | 21,710 | 22,514 | 25,093 | 83,114 | 88,994 | 108,191 | ||||||||||||||||||
| Gain on disposition of real property (1) | (984 | ) | (4,452 | ) | (5,580 | ) | (134,218 | ) | (40,592 | ) | (74,306 | ) | ||||||||||||
| Impairment of real estate property | — | — | 2,600 | 8,124 | 9,500 | 2,600 | ||||||||||||||||||
| Noncontrolling interests’ share of net income (loss) | 47 | 397 | (85 | ) | 7,404 | 4,802 | 4,002 | |||||||||||||||||
| Noncontrolling interests’ share of FFO | (1,635 | ) | (1,648 | ) | (1,687 | ) | (6,509 | ) | (6,650 | ) | (7,739 | ) | ||||||||||||
| FFO attributable to common shares-basic | 19,868 | 22,114 | 18,974 | 82,170 | 85,246 | 85,216 | ||||||||||||||||||
| FFO attributable to dilutive OP Units | 1,535 | 1,501 | 1,431 | 6,001 | 6,077 | 6,575 | ||||||||||||||||||
| FFO attributable to common shares-diluted | $ | 21,403 | $ | 23,615 | $ | 20,405 | $ | 88,171 | $ | 91,323 | $ | 91,791 | ||||||||||||
| FFO per share-basic and diluted | $ | 0.12 | $ | 0.12 | $ | 0.11 | $ | 0.47 | $ | 0.48 | $ | 0.48 | ||||||||||||
| Weighted average number of shares outstanding | ||||||||||||||||||||||||
| Basic | 166,352 | 179,926 | 177,548 | 175,938 | 178,273 | 178,196 | ||||||||||||||||||
| Diluted | 179,203 | 192,137 | 190,942 | 188,789 | 190,991 | 191,932 | ||||||||||||||||||
| (1) | Include amounts attributable to discontinued operations for periods presented of 2014 and 2013. |
Company-Defined FFO
As part of its guidance concerning FFO, NAREIT has stated that the “management of each of its member companies has the responsibility and authority to publish financial information that it regards as useful to the financial community.” As a result, modifications to FFO are common among REITs as companies seek to provide financial measures that meaningfully reflect the specific characteristics of their businesses. In addition to the NAREIT definition of FFO and other GAAP measures, we provide a Company-Defined FFO measure that we believe is helpful in assisting management and investors assess the sustainability of our operating performance. As described further below, our Company-Defined FFO presents a performance metric that adjusts for items that we do not believe to be related to our ongoing operations. In addition, these adjustments are made in connection with calculating certain of the Company’s financial covenants including its interest coverage ratio and fixed charge coverage ratio and therefore we believe this metric will help our investors better understand how certain of our lenders view and measure the financial performance of the Company and ultimately its compliance with these financial covenants. However, no single measure can provide users of financial information with sufficient information and only our disclosures read as a whole can be relied upon to adequately portray our financial position, liquidity and results of operations.
| - 68 - |
Our Company-Defined FFO is derived by adjusting FFO for the following items: acquisition-related expenses, gains and losses associated with extinguishment of debt and financing commitments, and gains and losses on derivatives. Management’s evaluation of our future operating performance excludes these items based on the following economic considerations:
Acquisition-related expenses — For GAAP purposes, expenses associated with efforts to acquire real properties, including efforts related to acquisition opportunities that are not ultimately completed, are recorded to earnings. We believe by excluding acquisition-related expenses, Company-Defined FFO provides useful supplemental information for management and investors when evaluating the sustainability of our operating performance, because these types of expenses are directly correlated to our investment activity rather than our ongoing operating activity.
Losses on extinguishment of debt and financing commitments — Losses on extinguishment of debt and financing commitments represent losses incurred as a result of the early retirement of debt obligations and breakage costs and fees incurred related to rate lock agreements with prospective lenders. Such losses may be due to dispositions of assets, the repayment of debt prior to its contractual maturity or the nonoccurrence of forecasted financings. Our management believes that any such losses are not related to our ongoing operations. Accordingly, we believe by excluding losses on extinguishment of debt and financing commitments, Company-Defined FFO provides useful supplemental information for management and investors when evaluating the sustainability of our operating performance.
Gains and losses on derivatives —Gains and losses on derivatives represent the gains or losses on the fair value of derivative instruments due to hedge ineffectiveness. As these gains or losses relate to underlying long-term assets and liabilities, where we are not speculating or trading assets, our management believes that any such gains or losses are not reflective of our ongoing operations. Accordingly, we believe by excluding unrealized gains or losses on derivatives, Company-Defined FFO provides useful supplemental information for management and investors when evaluating the sustainability of our operating performance.
We also believe that Company-Defined FFO allows investors and analysts to compare the performance of our portfolio with other REITs that are not currently affected by the adjusted items. In addition, as many other REITs adjust FFO to exclude the items described above, we believe that our calculation and reporting of Company-Defined FFO may assist investors and analysts in comparing our performance with that of other REITs. However, because Company-Defined FFO excludes items that are an important component in an analysis of our historical performance, such supplemental measure should not be construed as a complete historical performance measure and may exclude items that have a material effect on the value of our common stock.
| - 69 - |
The following unaudited tables present a reconciliation of Company-Defined FFO to FFO for the three months and years ended December 31, 2015, 2014, and 2013 (amounts in thousands, except per share information).
| For the Three Months Ended | For the Year Ended | |||||||||||||||||||||||
| December 31, | December 31, | |||||||||||||||||||||||
| 2015 | 2014 | 2013 | 2015 | 2014 | 2013 | |||||||||||||||||||
| Reconciliation of FFO to Company-Defined FFO: | ||||||||||||||||||||||||
| FFO attributable to common shares-basic | $ | 19,868 | $ | 22,114 | $ | 18,974 | $ | 82,170 | $ | 85,246 | $ | 85,216 | ||||||||||||
| Add (deduct) our adjustments: | ||||||||||||||||||||||||
| Acquisition-related expenses | 1,385 | 243 | 537 | 2,644 | 1,205 | 536 | ||||||||||||||||||
| Gain on derivatives | (3 | ) | — | — | (3 | ) | — | — | ||||||||||||||||
| Loss on extinguishment of debt and financing commitments | — | — | 1,808 | 1,168 | 63 | 2,507 | ||||||||||||||||||
| Noncontrolling interests’ share of NAREIT-defined FFO | 1,635 | 1,648 | 1,687 | 6,509 | 6,650 | 7,739 | ||||||||||||||||||
| Noncontrolling interests’ share of Company-Defined FFO | (1,734 | ) | (1,664 | ) | (1,851 | ) | (6,769 | ) | (6,734 | ) | (7,954 | ) | ||||||||||||
| Company-Defined FFO attributable to common shares-basic | 21,151 | 22,341 | 21,155 | 85,719 | 86,430 | 88,044 | ||||||||||||||||||
| Company-Defined FFO attributable to dilutive OP Units | 1,634 | 1,516 | 1,596 | 6,261 | 6,161 | 6,790 | ||||||||||||||||||
| Company-Defined FFO attributable to common shares-diluted | $ | 22,785 | $ | 23,857 | $ | 22,751 | $ | 91,980 | $ | 92,591 | $ | 94,834 | ||||||||||||
| Company-Defined FFO per share-basic and diluted | $ | 0.13 | $ | 0.12 | $ | 0.12 | $ | 0.49 | $ | 0.48 | $ | 0.49 | ||||||||||||
| Weighted average number of shares outstanding | ||||||||||||||||||||||||
| Basic | 166,352 | 179,926 | 177,548 | 175,938 | 178,273 | 178,196 | ||||||||||||||||||
| Diluted | 179,203 | 192,137 | 190,942 | 188,789 | 190,991 | 191,932 | ||||||||||||||||||
Limitations of FFO and Company-Defined FFO
FFO (both NAREIT-defined and Company-Defined) is presented herein as a supplemental financial measure and has inherent limitations. We do not use FFO or Company-Defined FFO as, nor should they be considered to be, an alternative to net income (loss) computed under GAAP as an indicator of our operating performance, or as an alternative to cash from operating activities computed under GAAP, or as an indicator of liquidity or our ability to fund our short or long-term cash requirements, including distributions to stockholders. Management uses FFO and Company-Defined FFO as indications of our future operating performance and as a guide to making decisions about future investments. Our FFO and Company-Defined FFO calculations do not present, nor do we intend them to present, a complete picture of our financial condition and operating performance. In addition, other REITs may define FFO and an adjusted FFO metric differently and choose to treat acquisition-related expenses and potentially other accounting line items in a manner different from us due to specific differences in investment strategy or for other reasons; therefore, comparisons with other REITs may not be meaningful.
Our Company-Defined FFO calculation is limited by its exclusion of certain items previously discussed, but we continuously evaluate our investment portfolio and the usefulness of our Company-Defined FFO measure in relation thereto. We believe that net income (loss) computed under GAAP remains the primary measure of performance and that FFO or Company-Defined FFO are only meaningful when they are used in conjunction with net income (loss) computed under GAAP. Further, we believe that our consolidated financial statements, prepared in accordance with GAAP, provide the most meaningful picture of our financial condition and operating performance.
| - 70 - |
Specifically with respect to fees and expenses associated with the acquisition of real property, which are excluded from Company-Defined FFO, such fees and expenses are characterized as operational expenses under GAAP and included in the determination of net income (loss) and income (loss) from operations, both of which are performance measures under GAAP. The purchase of operating properties is a key strategic objective of our business plan focused on generating operating income and cash flow in order to fund our obligations and to make distributions to investors. However, as the corresponding acquisition-related costs are paid in cash, these acquisition-related costs negatively impact our GAAP operating performance and our GAAP cash flows from operating activities during the period in which efforts are undertaken to acquire properties. In addition, if we acquire a property after all offering proceeds from our public offerings have been invested, there will not be any offering proceeds to pay the corresponding acquisition-related costs. Accordingly, such costs will then be paid from other sources of cash such as additional debt proceeds, operational earnings or cash flow, net proceeds from the sale of properties, or other ancillary cash flows. Among other reasons as previously discussed, the treatment of acquisition-related costs is a reason why Company-Defined FFO is not a complete indicator of our overall financial performance, especially during periods in which efforts are undertaken to acquire properties. Note that, pursuant to our valuation procedures, acquisition-related expenses result in an immediate decrease to our NAV.
FFO and Company-Defined FFO may not be useful performance measures as a result of the various adjustments made to net income for the charges described above to derive such performance measures. Specifically, we intend to operate as a perpetual-life vehicle and, as such, it is likely for our operating results to be negatively affected by certain of these charges in the future, specifically acquisition-related expenses, as it is currently contemplated as part of our business plan to acquire additional investment properties which would result in additional-acquisition related expenses. Any change in our operational structure would cause the non-GAAP measure to be re-evaluated as to the relevance of any adjustments included in the non-GAAP measure. As a result, we caution investors against using FFO or Company-Defined FFO to determine a price to earnings ratio or yield relative to our NAV.
Further, FFO or Company-Defined FFO is not comparable to the performance measure established by the Investment Program Association (the “IPA”), referred to as “modified funds from operations,” or “MFFO,” as MFFO makes further adjustments including certain mark-to-market items and adjustments for the effects of straight-line rent. As such, FFO and Company-Defined FFO may not be comparable to the MFFO of non-listed REITs that disclose MFFO in accordance with the IPA standard. More specifically, Company-Defined FFO has limited comparability to the MFFO and other adjusted FFO metrics of those REITs that do not intend to operate as perpetual-life vehicles as such REITs have a defined acquisition stage. Because we do not have a defined acquisition stage, we may continue to acquire real estate and real estate-related investments for an indefinite period of time. Therefore, Company-Defined FFO may not reflect our future operating performance in the same manner that the MFFO or other adjusted FFO metrics of a REIT with a defined acquisition stage may reflect its operating performance after the REIT had completed its acquisition stage.
Neither the Commission nor any other regulatory body, nor NAREIT, has adopted a set of standardized adjustments that includes the adjustments that we use to calculate Company-Defined FFO. In the future, the Commission or another regulatory body, or NAREIT, may decide to standardize the allowable adjustments across the non-listed REIT industry at which point we may adjust our calculation and characterization of Company-Defined FFO.
Net Operating Income (“NOI”)
We also use NOI as a supplemental financial performance measure because NOI reflects the specific operating performance of our real properties and debt related investments and excludes certain items that are not considered to be controllable in connection with the management of each property, such as other-than-temporary impairment, losses related to provisions for losses on debt related investments, gains or losses on derivatives, acquisition-related expenses, losses on extinguishment of debt and financing commitments, interest income, depreciation and amortization, general and administrative expenses, advisory fees, interest expense and noncontrolling interests. However, NOI should not be viewed as an alternative measure of our operating financial performance as a whole, since it does exclude such items that could materially impact our results of operations. Further, our NOI may not be comparable to that of other real estate companies, as they may use different methodologies for calculating NOI. Therefore, we believe net income, as defined by GAAP, to be the most appropriate measure to evaluate our overall financial performance. We present NOI in the tables below, and include a reconciliation to GAAP in Note 13 to our financial statements beginning on page F-1 of this Annual Report on Form 10-K.
Our Operating Results
Our net income attributable to common stockholders increased to approximately $124.3 million for the year ended December 31, 2015 from approximately $29.2 million for the year ended December 31, 2014. The increase was primarily a result of (i) an increase in gain on sale of real property, largely driven by the disposition of a portfolio of 12 office and industrial properties during the year ended December 31, 2015, and (ii) a decrease in interest expense, partially offset by a decrease in real property NOI from continuing operations as a result of the disposition activity.
Our net income attributable to common stockholders decreased to approximately $29.2 million for the year ended December 31, 2014 from approximately $52.5 million for the year ended December 31, 2013. The decrease was primarily a result of (i) a decrease in income from discontinued operations, largely resulting from gains realized from disposition of real properties, and (ii) an increase in impairment of real estate property, partially offset by (i) an increase in real property NOI from continuing operations and (ii) a decrease in debt related income.
| - 71 - |
The following series of tables and discussions describe in more detail our results of operations, including those items specifically mentioned above, for the year ended December 31, 2015 compared to the year ended December 31, 2014 and for the year ended December 31, 2014 compared to the year ended December 31, 2013.
Three-Year Comparison
Our results of rental activities are presented in two groups: (i) all operating properties that we acquired prior to January 1, 2013 and owned through December 31, 2015 (the “Same Store Portfolio”), providing meaningful comparisons for 2015, 2014 and 2013, and (ii) all other operating properties, which were acquired or disposed during the same period, excluding dispositions classified as discontinued operations (the “Non-Same Store Portfolio”). The Same Store Portfolio includes 48 properties, comprising approximately 7.9 million square feet. The following table illustrates the changes in rental revenues, rental expenses, debt-related investment income, and net operating income for the year ended December 31, 2015 compared to the year ended December 31, 2014 and for the year ended December 31, 2014 compared to the year ended December 31, 2013 (dollar amounts in thousands).
| For
the Twelve Months Ended December 31, | Amount | For
the Twelve Months Ended December 31, | Amount | |||||||||||||||||||||||||||||
| 2015 | 2014 | Changed | % Change | 2014 | 2013 | Changed | % Change | |||||||||||||||||||||||||
| Revenue | ||||||||||||||||||||||||||||||||
Base
rental revenue - Same | $ | 139,280 | $ | 138,204 | $ | 1,076 | 1 | % | $ | 138,204 | $ | 135,154 | $ | 3,050 | 2 | % | ||||||||||||||||
| Average % leased | 89.2 | % | 92.9 | % | -3.7 | % | -4 | % | 92.9 | % | 95.5 | % | -2.7 | % | -3 | % | ||||||||||||||||
| Other rental revenue - Same Store Portfolio | 24,429 | 25,024 | (595 | ) | -2 | % | 25,024 | 23,723 | 1,301 | 5 | % | |||||||||||||||||||||
| Total rental revenue - Same Store Portfolio | 163,709 | 163,228 | 481 | 0 | % | 163,228 | 158,877 | 4,351 | 3 | % | ||||||||||||||||||||||
Rental revenue - Non-Same Store Portfolio (2) | 54,569 | 60,973 | (6,404 | ) | -11 | % | 60,973 | 48,451 | 12,522 | 26 | % | |||||||||||||||||||||
| Total continuing rental revenue | 218,278 | 224,201 | (5,923 | ) | -3 | % | 224,201 | 207,328 | 16,873 | 8 | % | |||||||||||||||||||||
| Debt related income | 6,922 | 7,396 | (474 | ) | -6 | % | 7,396 | 10,449 | (3,053 | ) | -29 | % | ||||||||||||||||||||
| Total continuing revenues | $ | 225,200 | $ | 231,597 | $ | (6,397 | ) | -3 | % | $ | 231,597 | $ | 217,777 | $ | 13,820 | 6 | % | |||||||||||||||
| Rental Expenses | ||||||||||||||||||||||||||||||||
| Same Store Portfolio | $ | 41,334 | $ | 38,997 | $ | 2,337 | 6 | % | $ | 38,997 | $ | 36,647 | $ | 2,350 | 6 | % | ||||||||||||||||
| Non-Same Store Portfolio | 18,256 | 12,000 | 6,256 | 52 | % | 12,000 | 7,025 | 4,975 | 71 | % | ||||||||||||||||||||||
| Total rental expenses | $ | 59,590 | $ | 50,997 | $ | 8,593 | 17 | % | $ | 50,997 | $ | 43,672 | $ | 7,325 | 17 | % | ||||||||||||||||
| Net Operating Income | ||||||||||||||||||||||||||||||||
Real property - Same Store Portfolio (3) | $ | 122,375 | $ | 124,231 | $ | (1,856 | ) | -1 | % | $ | 124,231 | $ | 122,230 | $ | 2,001 | 2 | % | |||||||||||||||
Real property - Non-Same Store Portfolio (2) | 36,313 | 48,973 | (12,660 | ) | -26 | % | 48,973 | 41,426 | 7,547 | 18 | % | |||||||||||||||||||||
| Debt related income | 6,922 | 7,396 | (474 | ) | -6 | % | 7,396 | 10,449 | (3,053 | ) | -29 | % | ||||||||||||||||||||
| Total net operating income (4) | $ | 165,610 | $ | 180,600 | $ | (14,990 | ) | -8 | % | $ | 180,600 | $ | 174,105 | $ | 6,495 | 4 | % | |||||||||||||||
| (1) | Base rental revenue represents contractual base rental revenue earned by us from our tenants and does not include the impact of certain GAAP adjustments to rental revenue, such as straight-line rent adjustments, amortization of above-market intangible lease assets or the amortization of below-market lease intangible liabilities. Such GAAP adjustments and other rental revenue such as expense recovery revenue are included in the line item referred to as “other rental revenue.” |
| (2) | Excludes results from properties classified as discontinued operations in our financial statements. |
| (3) | Our same store NOI includes certain non-cash GAAP adjustments for rental revenue for straight line rent and amortization of above market lease assets and below market lease liabilities that caused an (decrease) increase to GAAP NOI of approximately ($4.6 million), ($1.3 million) and $158,000 for the years ended December 31, 2015, 2014, and 2013, respectively. |
| (4) | For a discussion as to why we view net operating income to be an appropriate supplemental performance measure, refer to “Net Operating Income (“NOI”)” included above in this “Item 7. Management’s Discussion and Analysis of Financial Condition and Results of Operations.” For a reconciliation to GAAP, refer to Note 13 to our financial statements beginning on page F-1 of this Annual Report on Form 10-K. |
| - 72 - |
Net Operating Income
Base Rental Revenue - Same Store
The table below presents the factors contributing to the increase in our same store base rental revenue for the twelve months ended December 31, 2015 and 2014 (dollar amounts other than annualized base rent per square foot in thousands):
| Same Store Portfolio | Base Rent for the Twelve Months Ended December 31, | Average Percentage Leased for the Twelve Months ended December 31, | Annualized Base Rent per Square Foot for the Twelve Months ended December 31(1), | |||||||||||||||||||||||||
| 2015 | 2014 | $ Change | 2015 | 2014 | 2015 | 2014 | ||||||||||||||||||||||
| Office | $ | 89,111 | $ | 88,670 | $ | 441 | 92.4 | % | 96.6 | % | $ | 30.63 | $ | 29.17 | ||||||||||||||
| Industrial | 4,920 | 5,024 | (104 | ) | 76.5 | % | 84.3 | % | 3.37 | 3.12 | ||||||||||||||||||
| Retail | 45,249 | 44,510 | 739 | 94.1 | % | 94.5 | % | 16.87 | 16.53 | |||||||||||||||||||
| Total base rental revenue - same store | $ | 139,280 | $ | 138,204 | $ | 1,076 | 89.2 | % | 92.9 | % | $ | 19.76 | $ | 18.82 | ||||||||||||||
| (1) | Represents contractual base rent and does not include the impact of tenant concessions, such as free rent and tenant reimbursements. |
Base rental revenue in our same store office and retail portfolios increased for the year ended December 31, 2015, compared to the year ended December 31, 2014, primarily due to (i) an increase in average base rent per square foot and (ii) the expiration of rental concessions, partially offset by a decrease in the average leased square feet for the year ended December 31, 2015 driven by the vacancy of a 178,000 square feet single tenant office property in March 2015 located in the Washington, DC market, compared to the year ended December 31, 2014.
Base rental revenue in our same store industrial portfolio increased for the year ended December 31, 2015, compared to the year ended December 31, 2014, primarily due to a decrease in the average leased square feet for the year ended December 31, 2014 driven by the vacancy of a 122,000 square feet industrial property in January 2015, partially offset by an increase in average base rent per square foot.
The table below presents the factors contributing to the increase in our same store base rental revenue for the twelve months ended December 31, 2014 and 2013 (dollar amounts other than annualized base rent per square foot in thousands):
| Same Store Portfolio | Base Rent for the Twelve Months Ended December 31, | Average Percentage Leased for the Twelve Months ended December 31, | Annualized Base Rent per Square Foot for the Twelve Months ended December 31(1), | |||||||||||||||||||||||||
| 2014 | 2013 | $ Change | 2014 | 2013 | 2014 | 2013 | ||||||||||||||||||||||
| Office | $ | 88,670 | $ | 83,745 | $ | 4,925 | 96.6 | % | 94.0 | % | $ | 29.17 | $ | 28.30 | ||||||||||||||
| Industrial | 5,024 | 7,698 | (2,674 | ) | 84.3 | % | 98.8 | % | 3.12 | 4.08 | ||||||||||||||||||
| Retail | 44,510 | 43,711 | 799 | 94.5 | % | 95.0 | % | 16.53 | 16.14 | |||||||||||||||||||
| Total base rental revenue - same store | $ | 138,204 | $ | 135,154 | $ | 3,050 | 92.9 | % | 95.5 | % | $ | 18.82 | $ | 17.90 | ||||||||||||||
| (1) | Represents contractual base rent and does not include the impact of tenant concessions, such as free rent and tenant reimbursements. |
Base rental revenue in our same store office and retail portfolios increased for the year ended December 31, 2014, compared to the year ended December 31, 2013, primarily due to (i) an increase in the average leased square feet in the same store office portfolio and (ii) an increase in average base rent per square foot, partially offset by a decrease in the average leased square feet in the same store retail portfolio for the year ended December 31, 2014, compared to the year ended December 31, 2013. Base rental revenue in our same store industrial portfolio decreased for the year ended December 31, 2014, compared to the year ended December 31, 2013, primarily due to tenant early termination in December 2013 of approximately 286,000 square feet at an industrial property located in the Dallas, TX market.
| - 73 - |
Other Rental Revenue - Same Store
Same store other rental revenue decreased for the year ended December 31, 2015, compared to the same period in 2014, primarily due to (i) a decrease in our straight line rent adjustment within our same store portfolio due to rent increases and the expiration of rental concessions, and (ii) a decrease in below market rent adjustment due to lease expirations during the year ended December 31, 2015, partially offset by (i) lease termination payments of approximately $1.5 million related to tenants in our retail and office portfolios that we received during the year ended December 31, 2015 and (ii) an increase in recoverable revenue due to an increase in snow removal costs incurred by properties in our Greater Boston market.
Same store other rental revenue increased for the year ended December 31, 2014 compared to the same period in 2013, primarily due to an increase in recovery income driven by general increases in rental expenses, partially offset by a decrease in straight-line rent adjustment due to the expiration of rental concessions for the year ended December 31, 2014, compared to the year ended December 31, 2013.
Rental Expenses - Same Store
The majority of the increase in repairs and maintenance expenses of the Same Store Portfolio for the year ended December 31, 2015, compared to the year ended December 31, 2014, is attributable to snow removal costs incurred by properties in our Greater Boston market.
Real estate taxes increased for the year ended December 31, 2015 from the year ended December 31, 2014, primarily driven by a tenant’s vacancy from a single-tenant office property. Prior to the vacancy, the tenant was fully responsible for the payment of the property taxes of the office property. Subsequent to the tenant’s vacancy, we were responsible for the payment of the property tax. Real estate taxes increased for the year ended December 31, 2014 from the year ended December 31, 2013, primarily driven by an increase in the appraised value of certain office and retail properties.
The table below presents the amounts recorded and changes in rental expense of our Same Store Portfolio for the twelve months ended December 31, 2015 and 2014 (dollar amounts in thousands):
| For the Twelve Months ended December 31, | For the Twelve Months ended December 31, | |||||||||||||||||||||||||||||||
| 2015 | 2014 | $ Change | % Change | 2014 | 2013 | $ Change | % Change | |||||||||||||||||||||||||
| Real estate taxes | $ | 16,051 | $ | 15,458 | $ | 593 | 3.8 | % | 15,458 | $ | 14,821 | $ | 637 | 4.3 | % | |||||||||||||||||
| Repairs and maintenance | 12,475 | 10,287 | 2,188 | 21.3 | % | 10,287 | 9,743 | 544 | 5.6 | % | ||||||||||||||||||||||
| Utilities | 5,498 | 6,032 | (534 | ) | -8.9 | % | 6,032 | 5,319 | 713 | 13.4 | % | |||||||||||||||||||||
| Property management fees | 3,093 | 2,956 | 137 | 4.6 | % | 2,956 | 2,706 | 250 | 9.2 | % | ||||||||||||||||||||||
| Insurance | 889 | 975 | (86 | ) | -8.8 | % | 975 | 1,040 | (65 | ) | -6.3 | % | ||||||||||||||||||||
| Other | 3,328 | 3,289 | 39 | 1.2 | % | 3,289 | 3,018 | 271 | 9.0 | % | ||||||||||||||||||||||
| Total same store rental expense | $ | 41,334 | $ | 38,997 | $ | 2,337 | 6.0 | % | 38,997 | $ | 36,647 | $ | 2,350 | 6.4 | % | |||||||||||||||||
Real Property – Non-Same Store Portfolio
Prior to 2014, pursuant to the applicable accounting guidance at the time, we presented the results of all real property disposed of in 2013 or classified as held for sale as of December 31, 2013 as discontinued operations. Commencing in 2014, we adopted a new accounting standard that defines discontinued operations as a disposal of a component of our business that represents a strategic shift that has (or will have) a major effect on our operations and financial results. Since our adoption of this new accounting standard, we have not classified any of our dispositions as discontinued operations. We applied this accounting standard prospectively. As such, we continue to present results reported as discontinued operations in 2013 as discontinued operations in our accompanying statements of income. Furthermore, we report the 2014 operating results of 12 industrial properties that we classified as held for sale as of December 31, 2013 as discontinued operations in 2014. Other than this industrial portfolio, we include the operating results of all dispositions in 2014 and 2015 in our continuing operations. Had the new accounting guidance regarding discontinued operations applied to 2013, we would have included total additional rental revenue of $969,000 and $39.0 million and net operating income $629,000 and $25.0 million for 2014 and 2013, respectively, in our continuing operations. See Note 2 and Note 3 to our financial statements beginning on page F-1 of this Annual Report on Form 10-K for a discussion of our adoption of the accounting standard and a more detailed discussion of our discontinued operations.
| - 74 - |
The increase in rental revenue and NOI in our Non-Same Store Portfolio resulted from our acquisition of eight, three and one real properties in 2015, 2014 and 2013, respectively. The disposition of five real properties in 2015 and five real properties in 2014 that we included in continuing operations offset the impact of these acquisitions to our Non-Same Store Portfolio rental revenue and NOI. See our discussion under “—Significant Transactions During the Year Ended December 31, 2015—Investment Activity” for further discussion of acquisition and disposition activity, including dispositions that we present in discontinued operations.
Debt Related Income
Debt related income decreased for the year ended December 31, 2015 compared to the same period in 2014 and decreased for the year ended December 31, 2014 compared to the same period in 2013. The decrease is primarily attributable to the repayments of debt related investments during the three years. The decrease for the year ended December 31, 2015 compared to 2014 is partially offset by the investment of approximately $6.4 million in debt related investments during the same period. The increase for the year ended December 31, 2014 compared to the same period in 2013 is partially offset by the investment of approximately $15.2 million in debt related investments for the years ended December 31, 2014 and 2013. For a detailed discussion of the repayments of debt related investments, see “- Significant Transactions During the Year Ended December 31, 2015.”
Other Operating Expenses
Real Estate Depreciation and Amortization Expense
Depreciation and amortization expense decreased by $5.9 million, or 7%, for the year ended December 31, 2015, compared to the same period in 2014, primarily due to our disposition of real properties during 2015 and 2014.
Depreciation and amortization expense, including discontinued operations, decreased by $19.2 million, or 18%, for the year ended December 31, 2014, compared to the same period in 2013. We recognized $89.0 million depreciation and amortization expense for the year ended December 31, 2014, all from continuing operations. We recognized $108.2 million of depreciation and amortization expense for the year ended December 31, 2013, which included $21.0 million recorded within discontinued operations. The decrease is primarily due to our disposition of real properties during 2014 and 2013.
General and Administrative Expenses
General and administrative expenses stayed relatively stable for the year ended December 31, 2015, compared to the same period in 2014.
General and administrative expenses increased by approximately $1.3 million, or 14%, for the year ended December 31, 2014, compared to the same period in 2013. The increase is primarily due to an increase in costs related to 2014 acquisition activity and the related reimbursement paid to our Advisor, and increased personnel costs due to the addition of our president in July 2013.
Advisory Fees
In connection with the commencement of the Prior Offering in 2012, we amended our Advisory Agreement with our Advisor to eliminate acquisition fees and tie the advisory fee earned by our Advisor to our NAV. In addition, our current advisory fees paid to our Advisor include a performance-based component for which our Advisor receives an additional fee equal to 25% of the total investment return to our Class A, W and I stockholders in a given year in excess of 6% as an incentive to reward sustainable total investment return performance to our stockholders. However, our Advisor will not receive a performance fee based on Class E shares until their NAV exceeds $10 per share. We designed the amended advisory fee structure to benefit stockholders by reducing day-to-day management fees paid to our Advisor, while incentivizing the Advisor to maximize stockholder value, whether or not new capital is raised.
During the years ended December 31, 2015 and 2014, our Advisor earned a performance-based fee component included in its advisory fee of $1.3 million and $405,000, respectively, as a result of our total weighted average return of 9.4% and 8.6%, respectively. The increase in the performance-based fee component of our advisory fees of $855,000 accounted for the majority of our increase in advisory fee in 2015 when compared to 2014. In addition, an increase in our overall NAV that resulted from our NAV per share climbing from $6.93 to $7.47 from December 31, 2013 through December 31, 2015, partially offset by net redemptions of our common stock reducing our total NAV, also contributed to the increase in our advisory fees.
The $799,000 increase in advisory fees in 2014 compared to 2013 resulted from (i) the performance based fee in 2014 increasing from $93,000 in 2013 to $405,000 in 2014 and (ii) an increase in our overall NAV resulting from our NAV per share climbing from $6.70 to $7.16 from December 31, 2012 through December 31, 2014, partially offset by net redemptions of our common stock reducing our total NAV.
| - 75 - |
See Note 11 to our financial statements beginning on page F-1 of this Annual Report on Form 10-K for further discussion of all fees and reimbursements that we pay to our Advisor.
Impairment of Real Estate Property
During 2015, 2014 and 2013, we recorded real property impairment charges of $8.1 million, $9.5 million and $2.6 million, respectively. These impairment charges resulted from our decision to consider various disposition strategies for three properties that we no longer considered strategic to our overall investment objectives. We later sold all three of these properties. The shortened hold period for future cash flows from these properties triggered the impairment losses. See Note 3 to our financial statements beginning on page F-1 of this Annual Report on Form 10-K for further discussion of these impairment charges.
In the calculation of our NAV, our real estate assets are carried at fair value using valuation methodologies consistent with ASC Topic 820, Fair Value Measurements and Disclosures. As a result, the timing of valuation changes recorded in our NAV will not necessarily be the same as for impairment charges recorded to our financial statements prepared pursuant to GAAP.
Other Income (Expenses)
Interest Expense
Interest expense decreased for the year ended December 31, 2015, compared to the same period in 2014, and decreased for the year ended December 31, 2014, compared to the same period in 2013, due to lower average borrowings and lower average interest rates.
The following table further describes our interest expense by debt obligation, and includes amortization of deferred financing costs, amortization related to our derivatives, and amortization of discounts and premiums (amounts in thousands):
| For the Year Ended December 31, | ||||||||||||
| 2015 | 2014 | 2013 | ||||||||||
| Debt Obligation | ||||||||||||
| Mortgage notes (1) | $ | 35,529 | $ | 50,772 | $ | 65,201 | ||||||
| Line of credit and other unsecured borrowings | 11,258 | 8,843 | 8,610 | |||||||||
| Other secured borrowings | 477 | 1,375 | 2,973 | |||||||||
| Financing obligations | 244 | 1,210 | 1,205 | |||||||||
| Total interest expense | $ | 47,508 | $ | 62,200 | $ | 77,989 | ||||||
| (1) | Includes interest expense attributable to discontinued operations of $296,000 and $12.7 million for the years ended December 31, 2014 and 2013, respectively. |
Gain on Sale of Real Property
During the years ended December 31, 2015, 2014, and 2013, we recorded gain on sale of real property of approximately $134.2 million, $40.5 million, and $74.3 million, respectively. For a detailed discussion of the real properties we disposed of during the three years, see Note 3 to our financial statements beginning on page F-1 of this Annual Report on Form 10-K.
Loss on Extinguishment of Debt and Financing Commitments
During the year ended December 31, 2015, we recorded approximately $1.2 million of loss on extinguishment of debt and financing commitments, primarily resulting from (i) deferred financing costs written off due to the amendment and restatement of the Old Facility on January 13, 2015 (see “Significant Transactions During the Year Ended December 31, 2015 – Financing Activity – Recast of Credit Facility” above and Note 5 to our financial statements beginning on page F-1 of this Annual Report on Form 10-K for more information regarding the recast of the Old Facility), and (ii) accelerated amortization of deferred financing costs upon the repayment of borrowings under our repurchase facilities earlier than we had originally expected.
During the year ended December 31, 2013, we recorded approximately $2.5 million of loss on extinguishment of debt and financing commitments, primarily resulting from (i) the recognition of derivative hedge losses previously included in our accumulated other comprehensive loss (“OCI”) related to loans that were assumed by the buyer of an industrial portfolio subsequent to December 31, 2013, and (ii) the accelerated amortization of deferred financing costs upon the repayment of borrowings under our repurchase facilities earlier than we had originally expected.
| - 76 - |
Liquidity Outlook
We believe our existing cash balance, our available credit under the Amended Facility, cash from operations, additional proceeds from our public offerings, proceeds from the sale of existing investments, and prospective debt or equity issuances will be sufficient to meet our liquidity and capital needs for the foreseeable future, including the next 12 months. Our capital requirements over the next 12 months are anticipated to include, but are not limited to, operating expenses, distribution payments, debt service payments, including debt maturities of approximately $285.1 million, of which approximately $107.2 million are subject to extension options beyond December 31, 2016, redemption payments, potential issuer tender offers, acquisitions of real property and debt related investments. Subsequent to December 31, 2015, we repaid approximately $74.2 million of debt that was scheduled to mature over the next 12 months. Borrowings that are subject to extension options are also subject to certain lender covenants and restrictions that we must meet to extend the initial maturity date. We currently believe that we will qualify for these extension options. However, we cannot guarantee that we will meet the requirements to extend the notes upon initial maturity. In the event that we do not qualify to extend the notes, we expect to repay them with proceeds from new borrowings or available proceeds from our Revolving Credit Facility.
In order to maintain a reasonable level of liquidity for redemptions of Class A, Class W and Class I shares pursuant to our Second Amended and Restated Class A, W and I Share Redemption Program (the “Class AWI SRP”), we intend to generally maintain under normal circumstances the following aggregate allocation to sources of liquidity, which include liquid assets and capacity under our borrowing facilities: (1) 10% of the aggregate NAV of our outstanding Class A, Class W and Class I shares up to $1 billion of collective Class A, Class W and Class I share NAV, and (2) 5% of the aggregate NAV of our outstanding Class A, Class W and Class I shares in excess of $1 billion of collective Class A, Class W and Class I share NAV. However, as set forth in the Class AWI SRP, no assurance can be given that we will maintain this allocation to liquid assets. Our board of directors has the right to modify, suspend or terminate our Class AWI SRP if it deems such action to be in the best interest of our stockholders. As of December 31, 2015, the aggregate NAV of our outstanding Class A, Class W and Class I shares was approximately $197.2 million.
As of December 31, 2015, we had approximately $15.8 million of cash compared to $14.5 million as of December 31, 2014. The following discussion summarizes the sources and uses of our cash during the year ended December 31, 2015, which resulted in the net cash increase of approximately $1.3 million.
Operating Activities
Net cash provided by operating activities increased by approximately $18.3 million to $105.5 million for the year ended December 31, 2015, compared to net cash provided by operating activities of approximately $87.2 million for the same period in 2014. This increase resulted from (i) the receipt of approximately $6.4 million in accrued interest upon payoff of a mezzanine debt investment, (ii) the expiration of rent concessions, (iii) scheduled rent escalations, and (iv) normal fluctuations in the timing of tenant cash receipts.
Lease Expirations
Our primary source of funding for our property-level operating expenses and debt service payments is rent collected pursuant to our tenant leases. Our properties are generally leased to tenants for the longer term and as of December 31, 2015, the weighted average remaining term of our leases was approximately 4.5 years, based on annualized base rent, and 7.0 years, based on leased square footage. The following is a schedule of expiring leases for our consolidated operating properties by annualized base rent and square footage as of December 31, 2015 and assuming no exercise of lease renewal options (dollar and square footage amounts in thousands).
| Lease Expirations | |||||||||||||||||||||||
| Year (1) | Number
of Leases Expiring | Annualized
Base Rent (2) | % | Square Feet | % | ||||||||||||||||||
| 2016 (3) (4) | 104 | $ | 21,925 | 12.0 | % | 917 | 10.1 | % | |||||||||||||||
| 2017 | 95 | 43,730 | 23.7 | % | 1,398 | 15.3 | % | ||||||||||||||||
| 2018 | 126 | 13,443 | 7.3 | % | 680 | 7.5 | % | ||||||||||||||||
| 2019 | 107 | 24,945 | 13.5 | % | 1,237 | 13.6 | % | ||||||||||||||||
| 2020 | 111 | 24,229 | 13.1 | % | 1,259 | 13.8 | % | ||||||||||||||||
| 2021 | 49 | 15,704 | 8.5 | % | 1,577 | 17.2 | % | ||||||||||||||||
| 2022 | 32 | 9,105 | 4.9 | % | 516 | 5.7 | % | ||||||||||||||||
| 2023 | 29 | 15,364 | 8.3 | % | 626 | 6.9 | % | ||||||||||||||||
| 2024 | 24 | 4,977 | 2.7 | % | 333 | 3.7 | % | ||||||||||||||||
| 2025 | 15 | 3,726 | 2.0 | % | 199 | 2.1 | % | ||||||||||||||||
| Thereafter | 22 | 7,304 | 4.0 | % | 378 | 4.1 | % | ||||||||||||||||
| Total | 714 | $ | 184,452 | 100.0 | % | 9,120 | 100.0 | % | |||||||||||||||
| - 77 - |
| (1) | The lease expiration year does not include the consideration of any renewal or extension options. Also, the lease expiration year is based on noncancellable lease terms and does not extend beyond any early termination rights that the tenant may have under the lease. |
| (2) | Annualized base rent represents the annualized monthly base rent of leases executed as of December 31, 2015. |
| (3) | Includes 17 leases with annualized base rent of approximately $423,000 that are on a month-to-month basis. |
| (4) | Includes our lease with Northrop Grumman, which leased 100% of an office property comprising approximately 575,000 square feet, located in the Washington, DC market (“Colshire”). Northrop Grumman exercised a purchase option during January 2016 to acquire Colshire on February 18, 2016. As a result, Northrop Grumman is no longer our tenant. Excluding the Northrop Grumman lease, we would have 103 leases expiring during 2016, with total annualized base rent of approximately $6.0 million or approximately 3.3% of total portfolio annualized base rent, comprising approximately 342,000 square feet or approximately 3.8% of total portfolio square feet. For a more detailed discussion of the purchase option and the disposition of Colshire, see “- Subsequent Events” below. |
Our two most significant leases, together comprising approximately 23.1% of our annualized base rent as of December 31, 2015, will expire between December 2016 and September 2017. One of these leases includes 10 subleases comprising approximately 4.2% of our annualized base rent as of December 31, 2015, which are scheduled to expire between January 2020 and December 2023. Based on market information as of December 31, 2015, we have obtained third-party estimates that current market rental rates, on a weighted-average basis utilizing annualized base rent as of December 31, 2015, are approximately 14% lower than the in-place rents. Accordingly, if market rents do not increase significantly, replicating the cash flows from these leases would be very difficult. When the leases expire we may be forced to lower the rental rates or offer other concessions in order to attract new tenants. In addition, we could be required to expend substantial funds to construct new tenant improvements in the vacated space.
During the year ended December 31, 2015, we signed new leases for approximately 460,000 square feet and renewal leases for approximately 646,000 square feet. Tenant improvements and leasing commissions related to these leases were approximately $5.4 million and $3.0 million, respectively, or $4.89 and $2.71 per square foot, respectively. Of these leases, approximately 769,000 square feet were considered comparable leases, with average straight line rent growth of 23.1%, and tenant improvements and incentives of approximately $6.91 per square foot. Comparable leases comprise leases for which prior leases were in place for the same suite within 12 months of executing a new lease. Comparable leases must have terms of at least six months and the square footage of the suite occupied by the prior tenant cannot be more or less than 50% different from the size of the new lease’s suite.
Investing Activities
We had net cash provided by investing activities of approximately $74.4 million for the year ended December 31, 2015, compared to net cash used in investing activities of approximately $15.1 million for the year ended December 31, 2014. The change is primarily due to (i) an increase in proceeds from disposition of real properties during the year ended December 31, 2015, compared to the year ended December 31, 2014, and (ii) the payoff of seven debt related investments during the year ended December 31, 2015, partially offset by (i) an increase in cash paid to acquire operating properties during the year ended December 31, 2015 compared to the year ended December 31, 2014, and (ii) an increase in capital expenditures in real property during the year ended December 31, 2015.
Financing Activities
Net cash used in financing activities increased approximately $96.2 million to approximately $178.6 million for the year ended December 31, 2015 from $82.4 million for the year ended December 31, 2014. The increase is primarily due to the repurchase of our common shares pursuant to self-tender offers and the redemption of our common shares pursuant to our share redemption programs during the year ended December 31, 2015, partially offset by net borrowing activities.
During the year ended December 31, 2015 and 2014, we raised approximately $86.5 million and $77.9 million in proceeds from the sale of Class A, W, and I shares, respectively, including approximately $3.5 million and $1.0 million under the distribution reinvestment plan, respectively. We have offered and will continue to offer Class E shares of common stock through the Class E DRIP Offering. The amount raised under the Class E DRIP Offering decreased by approximately $1.9 million to approximately $17.9 million for the year ended December 31, 2015, from approximately $19.8 million for the year ended December 31, 2014.
Distributions
To obtain the favorable tax treatment accorded to REITs, we normally will be required each year to distribute to our stockholders at least 90% of our real estate investment trust taxable income, determined without regard to the deduction for distributions paid and by excluding net capital gains. The payment of distributions is determined by our board of directors and may be adjusted at its discretion at any time. Distribution levels are set by our board of directors at a level it believes to be appropriate and sustainable based upon a review of a variety of factors including the current and anticipated market conditions, current and anticipated future performance and make-up of our investments, our overall financial projections and expected future cash needs.
| - 78 - |
Distributions declared payable to common stockholders increased approximately $909,000 to approximately $63.1 million for the year ended December 31, 2015 from approximately $62.2 million for the same period in 2014. Such distributions were paid following the respective quarters for which they were declared. Approximately $42.0 million and $41.4 million, respectively, were paid in cash and approximately $21.2 million and $20.8 million, respectively, were reinvested in shares of our common stock pursuant to our distribution reinvestment plan during the years ended December 31, 2015 and 2014.
On December 15, 2015, our board of directors authorized for each class of common stock a dividend of $0.09 per share, subject to adjustment for class-specific expenses, for the quarter ending March 31, 2016. The dividend will be payable to stockholders of record as of the close of business on each day during the period from January 1, 2016 to March 31, 2016, pro-rated for the period of ownership. The dividend will accrue daily and be paid no later than April 30, 2016.
Redemptions and Repurchases
During the years ended December 31, 2015 and 2014, we redeemed or repurchased approximately 29.2 million and 11.7 million shares of common stock for approximately $212.9 million and approximately $82.1 million, respectively. The increase in cash used for redemptions is primarily due to (i) repurchases pursuant to our self-tender offers during the year ended December 31, 2015, and (ii) an increase in the cash used for redemptions pursuant to our Class AWI SRP, partially offset by a decrease in the cash used for redemptions pursuant to our Class E SRP.
During the year ended December 31, 2015, we completed two self-tender offers, including (i) a modified “Dutch Auction” tender offer, pursuant to which we accepted for purchase approximately 17.2 million Class E shares of common stock for an aggregate cost of approximately $124.4 million, and (ii) a self-tender offer, pursuant to which we accepted for purchase approximately 2.7 million Class E shares of common stock for an aggregate cost of approximately $20.1 million. During the years ended December 31 2015 and 2014, we redeemed approximately 916,000 and 650,000 Class A, Class W, and Class I shares, respectively, pursuant to our Class AWI SRP for a total of approximately $6.8 million and $4.6 million, respectively. During the years ended December 31, 2015 and 2014, we redeemed approximately 8.4 million and 11.0 million Class E shares of common stock pursuant to our Class E SRP for approximately $61.7 million and $77.5 million, respectively. See “Item 5. Market for Registrant’s Common Equity, Related Stockholder Matters and Issuer Purchases of Equity Securities — Share Redemption Programs and Other Redemptions or Repurchases” of this Annual Report on Form 10-K for a description of our share redemption programs and other redemptions and repurchases.
In addition to the above-mentioned redemptions, during the years ended December 31, 2015 and 2014, we redeemed approximately 360,000 and 1.1 million OP Units, respectively, from our OP Unit holders for approximately $2.7 million and $7.9 million, respectively.
Off-Balance Sheet Arrangements
As of December 31, 2015, we had no material off-balance sheet arrangements that had or are reasonably likely to have a current or future effect on our financial condition, revenues, or expenses, results of operations, liquidity, capital expenditures or capital resources. There are no lines of credit, side agreements, or any other derivative financial instruments related to or between our unconsolidated joint venture and us, and we believe we have no material exposure to financial guarantees.
Contractual Obligations
The following table reflects our contractual obligations as of December 31, 2015, specifically our obligations under mortgage note agreements (amounts in thousands).
| Payments due by period | |||||||||||||||
| Contractual Obligations | Total | Less than 1 year | 1-3 years | 3-5 years | More than 5 years | ||||||||||
| Borrowings (1) | $ | 1,242,879 | $ | 327,077 | $ | 399,430 | $ | 193,930 | $ | 322,442 | |||||
| (1) | Includes principal and interest payments due for our mortgage notes and other unsecured borrowing obligations. |
Subsequent Events
The following dispositions and financing transactions occurred subsequent to December 31, 2015.
| - 79 - |
Self-Tender Offer
On February 5, 2016, we commenced a self-tender offer to purchase for cash up to $30 million of our Class E shares, subject to our ability to increase the number of shares accepted for payment in the offer by up to but not more than 2% of our outstanding Class E shares (resulting in a commensurate increase in the dollar volume by up to approximately $20.3 million, without amending or extending the offer in accordance with rules promulgated by the Commission, at a purchase price of $7.39 per share, net to the seller in cash, less any applicable withholding taxes and without interest. The offer was made upon the terms and subject to the conditions set forth in the Offer to Purchase, dated February 5, 2016, and in the related Letter of Transmittal, filed with the Commission on Schedule TO on February 5, 2016. The offer will expire at 5:00 p.m. Central Time, on Monday, March 14, 2016.
Repayments of Mortgage Notes
Subsequent to December 31, 2015, we repaid three mortgage note borrowings in full using proceeds from our Revolving Credit Facility. The following table describes our repayment of mortgage note borrowings subsequent to December 31, 2015 (dollar amounts in thousands):
| Debt Obligation | Repayment Date |
Balance
as of December 31, 2015 |
Interest Rate Fixed or Floating | Stated
Interest Rate as of December 31, 2015 |
Contractual
Maturity Date |
Collateral Type | Collateral
Market | ||||||
| 1300 Connecticut | 1/12/16 | $ | 45,041 | Fixed | 6.81% | 4/10/16 | Office Property | Washington, DC | |||||
| Washington Commons | 2/1/16 | 21,300 | Fixed | 5.94% | 2/1/16 | Office Property | Chicago, IL | ||||||
| 40 Boulevard (1) | 3/1/16 | 7,890 | Floating | 3.43% | 3/11/16 | Office Property | Chicago, IL | ||||||
| Total/weighted average | $ | 74,231 | 6.20% | ||||||||||
| (1) | The mortgage note is subject to an interest rate of 3.0% over one-month LIBOR. |
Termination of Purchase Option
As discussed in Item 1A and Item 2 of Part I of this Annual Report on Form 10-K, “Colshire,” an office property located in the Washington, DC area, was subject to a purchase option held by the tenant with an exercise price of approximately $158.4 million (the “Colshire Purchase Option”). The tenant exercised the purchase option during January 2016. We subsequently disposed of the office property during February 2016, as further discussed below.
Disposition of Real Property
The followings table describes our disposition of real properties subsequent to December 31, 2015 (square footage amounts and dollar amounts in thousands):
| As of December 31, 2015 | ||||||||||||||||||
| Real Property | Property Type |
Market | Ownership | Net Rentable Square Feet |
Percentage Leased |
Net Basis | Disposition Date | Contract Sales Price | ||||||||||
| Colshire Drive (1) | Office | Washington, DC | 100% | 575 | 100% | $ | 118,558 | 2/18/16 | $ | 158,400 | ||||||||
| 40 Boulevard (2) | Office | Chicago, IL | 80% | 107 | 66% | 9,505 | 3/1/16 | 9,850 | ||||||||||
| Washington Commons (2) | Office | Chicago, IL | 80% | 200 | 81% | 16,978 | 3/1/16 | 18,000 | ||||||||||
Total subsequent real property dispositions |
882 | 92% | $ | 145,041 | $ | 186,250 | ||||||||||||
| (1) | The office property was subject to the Colshire Purchase Option. |
| (2) | The office properties were consolidated in our consolidated financial statements included in this Annual Report on Form 10-K. We held these properties through a joint venture in which we are not the managing partner. |
Launch of Private Placements of Delaware Statutory Trust Interests
Private Placements
In March 2016, we, through the Operating Partnership, initiated a program to raise capital in private placements exempt from registration under the Securities Act of 1933, as amended (“Private Placements”) through the sale of beneficial interests (“Interests”) in specific Delaware statutory trusts holding real properties, including properties currently indirectly owned by the Operating Partnership (the “DST Program”). From 2006 through 2009, we, through our subsidiaries conducted similar private placement offerings of fractional interests in which it raised a total of $183.1 million in gross proceeds. These fractional interests were all subsequently acquired by the Operating Partnership in exchange for an aggregate of 17.7 million OP Units.
| - 80 - |
Each Private Placement will offer Interests in one or more real properties placed into one or more Delaware statutory trust(s) by the Operating Partnership or its affiliates (“DST Properties”). We anticipate that these Interests may serve as replacement properties for investors seeking to complete like-kind exchange transactions under Section 1031 of the Internal Revenue Code of 1986, as amended (the “Code”). Additionally, any Interests sold to investors pursuant to such Private Placements will be leased-back by an indirect wholly owned subsidiary of the Operating Partnership on a long term basis of up to 29 years. The lease agreements are expected to be fully guaranteed by the Operating Partnership. Additionally, the Operating Partnership will retain a fair market value purchase option (“FMV Option”) giving it the right, but not the obligation, to acquire the Interests from the investors at a later time in exchange for OP Units.
Dealer Manager Agreement
In connection with the DST Program, in March 2016, Dividend Capital Exchange LLC (“DCX”), a wholly owned subsidiary of our taxable REIT subsidiary that is wholly owned by the Operating Partnership, entered into a Dealer Manager Agreement with our Dealer Manager, pursuant to which the Dealer Manager agreed to conduct Private Placements for Interests reflecting an indirect ownership of up to $500 million of Interests. DCX will pay certain up-front fees and reimburse certain related expenses to the Dealer Manager with respect to capital raised through any such Private Placements. DCX is obligated to pay the Dealer Manager a dealer manager fee of up to 1.5% of gross equity proceeds raised and a commission of up to 5% of gross equity proceeds raised through the Private Placements. The Dealer Manager may re-allow such commissions and a portion of such dealer manager fee to participating broker dealers.
In addition, we, or our subsidiaries, are obligated to pay directly or reimburse the Advisor and the Dealer Manager if they pay on our behalf, any organization and offering expenses (other than selling commissions and the dealer manager fee) as and when incurred. These expenses may include reimbursements for the bona fide due diligence expenses of participating broker-dealers, supported by detailed and itemized invoices, and similar diligence expenses of investment advisers, legal fees of the Dealer Manager, reimbursements for customary travel, lodging, meals and reasonable entertainment expenses of registered persons associated with the Dealer Manager, the cost of educational conferences held by us, including costs reimbursement for registered persons associated with the Dealer Manager and registered representatives of participating broker-dealers to attend educational conferences sponsored by us, and attendance fees and costs reimbursement for registered persons associated with the Dealer Manager to attend seminars conducted by participating broker-dealers and promotional items.
We intend to recoup the costs of the selling commissions and dealer manager fees described above through a purchase price “mark-up” of the initial estimated fair value of the DST Properties to be sold to investors, thereby placing the economic burden of these up-front fees on the investors purchasing such Interests. In addition, to offset some or all of our organization and offering expenses associated with the Private Placements, we will add a purchase price mark-up of the estimated fair value of the DST Properties to be sold to investors in the amount of 1.5% of the gross equity proceeds. Collectively, these purchase price mark-ups total up to 8% of the gross equity proceeds raised in the Private Placements. Additionally, we will be paid, by investors purchasing Interests, a non-accountable reimbursement equal to 1.0% of gross equity proceeds for real estate transaction costs that we expect to incur in selling or buying these Interests. Also, investors purchasing Interests will be required to pay their own respective closing costs upon the initial sale of the interests.
Advisory Agreement
In connection with the DST Program, we, the Operating Partnership and the Advisor entered into the Ninth Amended and Restated Advisory Agreement, dated as of March 2, 2016 (the “Amended Advisory Agreement”). The Amended Advisory Agreement amends the prior advisory agreement by providing that the fixed component of the advisory fee paid to the Advisor, in consideration for the asset management services it provides on the our behalf, is now a fixed component that accrues daily in an amount equal to 1/365th of 1.15% of (a) the “Aggregate Fund NAV” (i.e., the aggregate net asset value or “NAV” of our Class E shares, Class A shares, Class W shares and Class I shares, along with the OP Units held by third parties) for such day and (b) the consideration received by us or our affiliate for selling Interests in DST Properties to third party investors, net of up-front fees and expense reimbursements payable out of gross sale proceeds from the sale of such Interests, including but not limited to sales commissions, dealer manager fees and non-accountable expense allowances. Before this amendment, the Advisor was paid based on the amount of equity outstanding, and while the Private Placement is intended to raise capital for us, cash proceeds are received the day the Interests are sold but OP Units may not be issued for several years, if at all. This amendment clarifies that the Advisor will earn compensation for managing proceeds raised in the Private Placement. We will continue to pay the Advisor a development management fee equal to 4.0% of the cost to develop, construct or improve any properties, regardless of whether they are held in fee simple or DST Properties held through leasehold interests (though we may make only minor, non-structural modifications to DST Properties). The Amended Advisory Agreement also clarifies that we must reimburse the Advisor for any private offering organization and offering expenses, such as those of the DST Program, it incurs on our behalf, including Advisor personnel costs, unless it has agreed to receive a fee in lieu of reimbursement.
| - 81 - |
Limited Partnership Agreement
In connection with the launch of the DST Program, the Company, on behalf of itself as general partner and on behalf of all the limited partners thereto, entered into the Fifth Amended and Restated Limited Partnership Agreement of the Operating Partnership, dated as of March 2, 2016 (the “Amended and Restated Operating Partnership Agreement”). The Amended and Restated Operating Partnership Agreement amends the prior operating partnership agreement by establishing two series of Class E OP Units, with different redemption and registration rights. The currently existing third-party holders of Class E OP Units will now hold Series 1 Class E OP Units, and will continue to have the same redemption and registration rights they had previously, which include the right, in certain circumstances to require the Operating Partnership to redeem the OP Units for Class E shares of the Company or cash. Any purchasers of Interests in the DST Program that ultimately acquire OP Units through the FMV Option will acquire Series 2 Class E OP Units, which will have similar redemption and registration rights to those of the holders of Series 1 Class E OP Units, except that their redemption rights will in certain circumstances require the Operating Partnership to redeem the OP Units for Class I shares of the Company. In addition, the Amended and Restated Operating Partnership Agreement provides that a redemption fee of 1.5% of the shares otherwise payable to a limited partner upon redemption of Series 2 Class E Units will be paid to the Manager (defined below).
Delaware Statutory Trust Agreement
DCX Manager LLC (the “Manager”), an affiliate of the Advisor, will be engaged to act as the manager of each Delaware statutory trust holding a DST Property. While the intention is to sell 100% of the interests to third parties, DCX may hold an interest for a period of time and therefore could be subject to the following description of fees and reimbursements paid to the Manager. The trust manager will have primary responsibility for performing administrative actions in connection with the trust and any DST Property and has the sole power to determine when it is appropriate for a trust to sell a DST Property. The trust manager will be entitled to the following payments from the trust: (i) a management fee equal to a stated percentage (e.g., 1.0%) of the gross rents payable to the trust, with such amount to be set on a deal-by-deal basis, (ii) a disposition fee of 1.0% of the gross sales price of any DST Property sold to a third party, and (iii) reimbursement of certain expenses associated with the establishment, maintenance and operation of the trust and DST Properties.
Additionally, the Manager or its affiliate may earn a 1.0% loan fee for any financing arrangement sourced, negotiated and executed in connection with the DST Program. This loan fee only is payable to the Manager by new investors that purchase Interests and therefore is not paid by the Company or its affiliates.
Inflation
Substantially all of our leases provide for separate real estate tax and operating expense escalations over a base amount. In addition, many of our leases provide for fixed base rent increases or indexed rent increases. We believe that inflationary increases in costs may be at least partially offset by the contractual rent increases and operating expense escalations in our leases. To date, we believe that inflation has not had a material impact to our operations or overall liquidity.
Critical Accounting Policies and Estimates
The preparation of financial statements in conformity with accounting principles generally accepted in the United States of America requires management to make estimates and assumptions that affect the financial statements and disclosures. Some of these estimates and assumptions require application of difficult, subjective, and/or complex judgment, often about the effect of matters that are inherently uncertain and that may change in subsequent periods. We are required to make such estimates and assumptions when applying the following accounting policies.
Investments in Real Property
Costs associated with the acquisition of real property, including acquisition fees paid to our Advisor, are expensed as incurred. In addition, we estimate the fair value of contingent consideration and contingencies related to acquisitions of real property in determining the total cost of the property acquired. Subsequent changes in the fair value of such contingent consideration are recorded either as a gain or loss in our consolidated statements of income. Contingencies are subsequently adjusted through the consolidated statements of income when new information becomes available indicating that settlement of a contingent liability is probable and can be estimated at an amount greater than the acquisition date fair value, or the contingency is resolved, in which case the contingent asset or liability is derecognized.
| - 82 - |
Costs associated with the development and improvement of our real property assets are capitalized as incurred. Costs incurred in making repairs and maintaining real estate assets are expensed as incurred. During the land development and construction periods, we capitalize interest costs, insurance, real estate taxes and certain general and administrative costs if such costs are incremental and identifiable to a specific activity to get the asset ready for its intended use. The results of operations for acquired real property are included in our accompanying statements of income from their respective acquisition dates.
Upon acquisition, the total cost of a property is allocated to land, building, building and land improvements, tenant improvements and intangible lease assets and liabilities. The purchase price allocation of the total cost to land, building, building improvements, tenant improvements, intangible lease assets and intangible lease liabilities is based on our estimate of the property’s as-if vacant fair value. The as-if vacant fair value is calculated by using all available information such as the replacement cost of such asset, appraisals, property condition reports, market data and other related information. The difference between the fair value and the face value of debt assumed in an acquisition is recorded as an adjustment to the purchase price allocation. The allocation of the total cost of a property to an intangible lease asset includes the value associated with the in-place leases, which may include lost rent, leasing commissions, tenant improvements, legal and other costs.
We record acquired “above-market” and “below-market” leases at their fair value equal to the difference between the contractual amounts to be paid pursuant to each in-place lease and our estimate of fair market lease rates for each corresponding in-place lease, measured over a period equal to the remaining term of the lease for above-market leases and the remaining term of the lease plus the term of any below-market fixed-rate renewal option periods for below-market leases. In addition, we allocate a portion of the purchase price of an acquired property to the estimated value of customer relationships, if any. As of December 31, 2015, we had not recognized any estimated value to customer relationships.
The following table summarizes the amounts that we have incurred in amortization expense for intangible lease assets and adjustments to rental revenue for above-market lease assets and below-market lease liabilities for the years ended December 31, 2015, 2014 and 2013 (amounts in thousands).
| For the Year Ended December 31, | ||||||||||||
| 2015 | 2014 | 2013 | ||||||||||
| Above-market lease assets | $ | (5,216 | ) | $ | (6,708 | ) | $ | (7,293 | ) | |||
| Below-market lease liabilities | 6,029 | 7,324 | 7,537 | |||||||||
| Net increase to rental revenue | $ | 813 | $ | 616 | $ | 244 | ||||||
| Intangible lease asset amortization | $ | (44,260 | ) | $ | (48,937 | ) | $ | (62,325 | ) | |||
We expense any unamortized intangible lease asset or record an adjustment to rental revenue for any unamortized above-market lease asset or below-market lease liability when a tenant terminates a lease before the stated lease expiration date. We recorded an insignificant amount of adjustments related to write-offs of unamortized intangible lease assets and liabilities due to early lease terminations during the years ended December 31, 2015, 2014 and 2013.
Real property assets, including land, building, building and land improvements, tenant improvements, lease commissions, and intangible lease assets and liabilities are stated at historical cost less accumulated depreciation and amortization. Depreciation and amortization are computed on a straight-line basis over their estimated useful lives as described in the following table.
| Description | Depreciable Life | |
| Land | Not depreciated | |
| Building | 40 years | |
| Building and land improvements | 5-40 years | |
| Tenant improvements | Lesser of useful life or lease term | |
| Lease commissions | Over lease term | |
| Intangible in-place lease assets | Over lease term | |
| Above-market lease assets | Over lease term | |
| Below-market lease liabilities | Over lease term, including below-market fixed-rate renewal options |
| - 83 - |
The following table presents expected amortization during the next five years and thereafter related to the acquired above-market lease assets, below-market lease liabilities and acquired in-place lease intangibles, for properties owned as of December 31, 2015 (amounts in thousands).
| For the Year Ended December 31, | ||||||||||||||||||||||||||||
| 2016 | 2017 | 2018 | 2019 | 2020 | Thereafter | Total | ||||||||||||||||||||||
| Acquired above-market lease assets | $ | (5,087 | ) | $ | (2,495 | ) | $ | (719 | ) | $ | (633 | ) | $ | (238 | ) | $ | (569 | ) | $ | (9,741 | ) | |||||||
| Acquired below-market lease liabilities | 5,787 | 5,114 | 4,509 | 3,783 | 3,077 | 43,349 | 65,619 | |||||||||||||||||||||
| Net rental revenue increase | $ | 700 | $ | 2,619 | $ | 3,790 | $ | 3,150 | $ | 2,839 | $ | 42,780 | $ | 55,878 | ||||||||||||||
| Acquired in-place lease intangibles | $ | 45,472 | $ | 27,756 | $ | 16,721 | $ | 11,568 | $ | 6,649 | $ | 20,527 | $ | 128,693 | ||||||||||||||
Discontinued Operations and Held for Sale
Beginning with the year ended December 31, 2014, a discontinued operation is defined as a component (or group of components) of the entity, the disposal of which would represent a strategic shift that has (or will have) a major effect on the entity’s operations and financial results, when such a component (or group of components) has been disposed of or classified as held for sale. Through December 31, 2013, we present the results of operations and the respective aggregate net gains (losses) of any property or group of properties that were disposed or classified as held for sale as of the end of each year when the operations and cash flows have been (or will be) eliminated from our ongoing operations and we will not have any significant continuing involvement. Interest expense is included in discontinued operations only if it is directly attributable to these operations or properties. The results of operations of properties that have been classified as discontinued operations are reported as discontinued operations for all periods presented. We classify real property as held for sale when our management commits to a plan to sell the property, the plan has appropriate approvals, the sale of the property is probable, and certain other criteria are met. At such time, the respective assets and liabilities are presented separately on our balance sheets and depreciation is no longer recognized. Assets held for sale are reported at the lower of their carrying amount or their estimated fair value less the costs to sell the assets. We recognize an impairment loss for assets held for sale if the current net book value of the property exceeds its fair value less selling costs. As of December 31, 2014 and 2013, one and 12 of our properties were classified as held for sale, respectively.
Impairment — Real Property
We review our investments in real property that are classified as held and used individually on a quarterly basis, and more frequently when such an evaluation is warranted, to determine their appropriate classification, as well as whether there are indicators of impairment.
As of December 31, 2015, all of our properties were classified as held and used. These held and used assets are reviewed for indicators of impairment, which may include, among others, vacancy, each tenant’s inability to make rent payments, operating losses or negative operating trends at the property level, notification by a tenant that it will not renew its lease, a decision to dispose of a property, including a change in estimated holding periods, or adverse changes in the fair value of any of our properties. If indicators of impairment exist on a held and used asset, we compare the future estimated undiscounted cash flows from the expected use of the property to its net book value to determine if impairment exists. If the sum of the future estimated undiscounted cash flows is greater than the current net book value, we conclude no impairment exists. If the sum of the future estimated undiscounted cash flows is less than its current net book value, we recognize an impairment loss for the difference between the net book value of the property and its estimated fair value. If our assumptions, projections or estimates regarding a property change in the future, we may have to record an impairment charge to reduce or further reduce the net book value of the property.
During the year ended December 31, 2015, we recorded approximately $1.6 million of impairment charges related to a wholly owned retail property (“Mt. Nebo”), which we later sold during 2015, and a $6.5 million impairment charge related to a consolidated office property located in the Chicago, IL market, which we acquired in February 2007 and we hold through a joint venture in which we are not the managing partner. We have an 80% ownership interest in the office property. During the year ended December 31, 2014, we recorded a $9.5 million impairment related to Mt. Nebo.
New Accounting Pronouncements
For our consideration of new accounting pronouncements, see Note 2 to our financial statements beginning on page F-1 of this Annual Report on Form 10-K.
| - 84 - |
| ITEM 7A. | QUANTITATIVE AND QUALITATIVE DISCLOSURES ABOUT MARKET RISK |
Market risk is the adverse effect on the value of assets and liabilities that results from a change in the applicable market resulting from a variety of factors such as perceived risk, interest rate changes, inflation and overall general economic changes. Accordingly, we manage our market risk by matching projected cash inflows from operating, investing and financing activities with projected cash outflows for debt service, acquisitions, capital expenditures, distributions to stockholders and unit holders, and other cash requirements. Our outstanding borrowings are directly impacted by changes in market conditions. This impact is largely mitigated by the fact that the majority of our outstanding borrowings have fixed interest rates, which minimize our exposure to the risk that fluctuating interest rates may pose to our operating results and liquidity.
As of December 31, 2015, the fair value of our fixed rate mortgage debt was $576.4 million and the carrying value of our fixed rate mortgage debt was $579.2 million. The fair value estimate of our fixed rate mortgage debt was estimated using a discounted cash flow analysis utilizing rates we would expect to pay for debt of a similar type and remaining maturity if the loans were originated as of December 31, 2015. As we expect to hold our fixed rate instruments to maturity and the amounts due under such instruments would be limited to the outstanding principal balance and any accrued and unpaid interest, we do not expect that fluctuations in interest rates, and the resulting change in fair value of our fixed rate instruments, would have a significant impact on our operations.
As of December 31, 2015, we had approximately $149.5 million of unhedged variable rate borrowings outstanding indexed to LIBOR rates. If the LIBOR rates relevant to our remaining variable rate borrowings were to increase 10%, we estimate that our annual interest expense would increase by approximately $64,000 based on our outstanding floating-rate debt as of December 31, 2015.
We may seek to limit the impact of interest rate changes on earnings and cash flows and to lower our overall borrowing costs by selectively utilizing derivative instruments to hedge exposures to changes in interest rates on loans secured by our assets. We maintain risk management control systems to monitor interest rate cash flow risk attributable to both our outstanding and forecasted debt obligations as well as our potential offsetting hedge positions. While this hedging strategy is designed to minimize the impact on our net income (loss) and funds from operations from changes in interest rates, the overall returns on our investments may be reduced. Our board of directors has established policies and procedures regarding our use of derivative instruments for hedging or other purposes.
| ITEM 8. | FINANCIAL STATEMENTS AND SUPPLEMENTARY DATA |
The report of the independent registered public accounting firm and the financial statements listed in the accompanying index are included in “Item 15. Exhibits and Financial Statement Schedules” of this Annual Report on Form 10-K. See “Index to Consolidated Financial Statements” on page F-1 of this Annual Report on Form 10-K.
| ITEM 9. | CHANGES IN AND DISAGREEMENTS WITH ACCOUNTANTS ON ACCOUNTING AND FINANCIAL DISCLOSURE |
None.
| ITEM 9A. | CONTROLS AND PROCEDURES |
Disclosure Controls and Procedures
As of December 31, 2015, the end of the period covered by this Annual Report on Form 10-K, we conducted an evaluation of the effectiveness of our disclosure controls and procedures, under the supervision and with the participation of our Chief Executive Officer (principal executive officer) and our Chief Financial Officer (principal financial officer). Based upon this evaluation, our Chief Executive Officer and our Chief Financial Officer have concluded that our disclosure controls and procedures were effective as of December 31, 2015, to provide reasonable assurance that information required to be disclosed by us in the reports filed or submitted by us under the Exchange Act is recorded, processed, summarized and reported within the time periods specified in the Commission’s rules and forms and that information is accumulated and communicated to management, including our Chief Executive Officer and our Chief Financial Officer, as appropriate to allow timely decisions regarding required disclosures.
Management’s Annual Report on Internal Control over Financial Reporting
Management is responsible for establishing and maintaining adequate internal control over financial reporting, as defined in Exchange Act Rules 13a-15(f) and 15d-15(f).
| - 85 - |
Our internal control over financial reporting is a process designed under the supervision and with the participation of our Chief Executive Officer and our Chief Financial Officer.
During 2015, management conducted an evaluation of the effectiveness of our internal control over financial reporting, based upon criteria established in Internal Control — Integrated Framework, issued by the Committee of Sponsoring Organizations of the Treadway Commission (2013 framework). This evaluation included a review of the documentation of controls, evaluation of the design effectiveness of controls, testing of the operating effectiveness of controls, and a conclusion on this evaluation. Based upon this evaluation, management determined that our internal control over financial reporting is effective as of December 31, 2015.
Changes in Internal Control over Financial Reporting
There have been no changes in our internal control over financial reporting processes that occurred during the quarter ended December 31, 2015, that have materially affected, or are reasonably likely to materially affect, our internal control over financial reporting.
| ITEM 9B. | OTHER INFORMATION |
Distribution Reinvestment Plan Suitability Requirement
Pursuant to the terms of our distribution reinvestment plan (“DRP”), participants in the DRP must promptly notify us if at any time they fail to meet the current suitability requirements for making an investment in us.
The current suitability standards require that Class E stockholders participating in the DRP other than investors in Arizona, California, Ohio and Oregon have either:
| · | a net worth (exclusive of home, home furnishings and automobiles) of $150,000 or more; or |
| · | a net worth (exclusive of home, home furnishings and automobiles) of at least $45,000 and had during the last tax year, or estimate that such investor will have during the current tax year, a minimum of $45,000 annual gross income. |
The current suitability standards require that Class E stockholders participating in the DRP in Arizona, California, Ohio and Oregon must have either:
| · | a net worth (exclusive of home, home furnishings and automobiles) of $250,000 or more; or |
| · | a net worth (exclusive of home, home furnishings and automobiles) of at least $70,000 and had during the last tax year, or estimate that such investor will have during the current tax year, a minimum of $70,000 annual gross income. |
In addition, Class E stockholders participating in the DRP in Ohio and Oregon must have a net worth of at least 10 times their investment in us and any of our affiliates (namely, Logistics Property Trust Inc. and Industrial Property Trust Inc.).
The current suitability standards for Class A, Class W and Class I stockholders participating in the DRP are listed in the section entitled “Suitability Standards” in our current Class A, Class W and Class I public offering prospectus on file at www.sec.gov and on our website at www.dividendcapitaldiversified.com.
Stockholders can notify us of any changes to their ability to meet the suitability requirements or change their DRP election by contacting us at Dividend Capital Diversified Property Fund Inc., Investor Relations, 518 17th Street, Suite 1700, Denver, Colorado 80202, Telephone: (303) 228-2200.
| - 86 - |
| ITEM 10. | DIRECTORS, EXECUTIVE OFFICERS AND CORPORATE GOVERNANCE |
Board of Directors
Our board of directors consists of five directors, three of whom are independent directors, as determined by our board of directors. Our charter and bylaws provide that a majority of the entire board of directors may establish, increase, or decrease the number of directors, provided that the number of directors shall never be less than three nor more than 15. The foregoing is the exclusive means of fixing the number of directors.
Set forth below is certain information about our directors, including their respective position, age, biographical information, directorships held in the previous five years, and the experience, qualifications, attributes, and/or skills that led the board of directors to determine that the person should serve as our director. All of our directors have terms expiring on the date of the 2016 annual meeting of stockholders or until his or her successor is elected and qualified. For information regarding each director’s beneficial ownership of shares of our common stock, see “Item 12. Security Ownership of Certain Beneficial Owners and Management and Related Stockholder Matters” in this Annual Report on Form 10-K.
|
Richard D. Kincaid Chairman of the board of directors
Age: 54
Director since 2012
Member of audit committee Member of investment committee |
Richard D. Kincaid has served as our Chairman of the board of directors since September 2012. Prior to joining our board of directors, Mr. Kincaid was a Trustee and the President of Equity Office Properties Trust from November 2002, and the Chief Executive Officer from April 2003, until Equity Office Properties Trust was acquired by the Blackstone Group in February 2007. From March 1997 until November 2002, Mr. Kincaid was Executive Vice President of Equity Office Properties Trust and was Chief Operating Officer from September 2001 until November 2002. He also was Chief Financial Officer of Equity Office Properties Trust from March 1997 until August 2002, and Senior Vice President from October 1996 until March 1997.
Prior to joining Equity Office Properties Trust in 1995, Mr. Kincaid was Senior Vice President of Finance for Equity Group Investments, Inc., where he oversaw debt financing activities for the public and private owners of real estate controlled by Mr. Samuel Zell. During his tenure at Equity Group Investments and Equity Office Properties Trust, Mr. Kincaid supervised more than $11 billion in financing transactions, including property level loans encumbering office buildings, apartments, and retail properties, as well as unsecured debt, convertible debt securities, and preferred stock. Prior to joining Equity Group Investments in 1990, Mr. Kincaid held positions with Barclays Bank PLC and The First National Bank of Chicago. Richard Kincaid is currently the President and Founder of the BeCause Foundation. The BeCause Foundation is a nonprofit corporation that heightens awareness about a number of complex social problems and promotes change through the power of film. Mr. Kincaid is also an active private investor in early stage companies. Mr. Kincaid is on the board of directors of Rayonier Inc. (NYSE: RYN), an international real estate investment trust (“REIT”) that specializes in timber and specialty fibers. He also serves on the board of directors of Strategic Hotels and Resorts (NYSE: BEE), an owner of upscale and luxury hotels in North America and Europe. He also serves on the board of directors of the Street Medicine Institute. Mr. Kincaid received his Master’s Degree in Business Administration from the University of Texas, and his Bachelor’s Degree from Wichita State University. |
|
We believe that Mr. Kincaid’s qualifications to serve on our board of directors include his significant leadership experience as a Trustee, the President and the Chief Executive Officer of Equity Office Properties Trust and his director positions with other public companies. He also has demonstrated strategic insight with respect to large, growing real estate companies, as he developed the financial, technology and integration strategies for Equity Office Properties Trust during its tremendous growth, which included nearly $17 billion in acquisitions. We believe that his leadership and experience are valuable additions to our board in connection with our new offering and our transition to a perpetual-life REIT. |
| - 87 - |
|
John A. Blumberg Director
Age: 56
Director since 2006
Chairman of investment committee |
John A. Blumberg has served as a director of our board of directors since January 2006 and also as our Chairman of the board of directors from January 2006 to September 2012. Mr. Blumberg has also been a manager of our Advisor since April 2005. From October 2009 to March 2010, Mr. Blumberg served as the Chairman of the board of directors of Industrial Income Trust Inc. (“Industrial Income Trust”), a Denver, Colorado-based REIT focusing on industrial real estate which was sold in November 2015. He is also a manager of Industrial Income Advisors LLC, the former advisor to Industrial Income Trust. Mr. Blumberg is also a manager of Industrial Property Advisors LLC, the advisor to Industrial Property Trust Inc. (“Industrial Property Trust”), a Denver, Colorado-based REIT, and of Logistics Property Advisors LLC, the advisor to Logistics Property Trust Inc. (“Logistics Property Trust”), a Denver, Colorado-based REIT.
Mr. Blumberg is a principal of both Dividend Capital Group LLC and Black Creek Group LLC, a Denver based real estate investment firm which he co-founded in 1993. In 2014, Mr. Blumberg joined the Board of Directors for Rayonier Inc. Since 2006, Mr. Blumberg has also been chairman of Mexico Retail Properties, a fully integrated retail real estate company that acquires, develops and manages retail properties throughout Mexico. Mr. Blumberg has been active in real estate acquisition, development and redevelopment activities since 1993 and, as of December 31, 2014, with affiliates, has overseen directly, or indirectly through affiliated entities, the acquisition, development, redevelopment, financing and sale of real properties having combined value of approximately $15.4 billion. Prior to co-founding Black Creek Group LLC, Mr. Blumberg was President of JJM Investments, which owned over 100 shopping center properties in Texas. During the 12 years prior to joining JJM Investments, Mr. Blumberg served in various positions with Manufacturer’s Hanover Real Estate, Inc., Chemical Bank and Chemical Real Estate, Inc., most recently as President of Chemical Real Estate, Inc. Mr. Blumberg holds a Bachelor’s Degree from the University of North Carolina at Chapel Hill.
We believe that Mr. Blumberg’s qualifications to serve on our board of directors are demonstrated by his extensive experience in real estate investments, including his over 20 years of experience with Black Creek Group LLC as a co-founder of the company, his position as a principal of Dividend Capital Group LLC, his leadership experience as an executive officer of, and an advisor to, non-traded REITs and other real estate investment companies, and his experience in real estate investment banking. |
|
Charles B. Duke Director
Age: 58
Director since 2006
Chairman of audit committee Member of investment committee |
Charles B. Duke has served as an independent director of our board of directors since January 2006. Mr. Duke also served as an independent director on the board of directors of Industrial Income Trust from December 2009 to November 2015 and an independent director on the board of directors of Logistics Property Trust since February 2016. Mr. Duke has also served as an Independent Director on the board of Industrial Property Trust since March 2013. Mr. Duke is currently founder and Chief Executive Officer of To-Table Inc. (“To-Table”), a retailer of specialty gourmet foods. Prior to founding To-Table in November 2014, Mr. Duke was involved in the management of two ink jet cartridge remanufacturers and aftermarket suppliers: Mr. Duke served as Executive Vice President of IJR, Inc. in Phoenix, Arizona, from October 2012 to July 2014, and as the founder, President and Chief Executive Officer of Legacy Imaging, Inc. from 1996 through 2012. Mr. Duke has been active in entrepreneurial and general business activities since 1980 and has held several executive and management roles throughout his career, including founder, president, and owner of Careyes Corporation, a private bank, registered investment advisor and a member of the Financial Industry Regulatory Authority (“FINRA”) based in Denver, Colorado, Chief Financial Officer at Particle Measuring Systems, a global technology leader in the environmental monitoring industry based in Boulder, Colorado, and Vice President of Commercial Loans at Colorado National Bank. Mr. Duke also spent four years with Kirkpatrick Pettis, the investment-banking subsidiary of Mutual of Omaha, as Vice President of Corporate Finance, involved in primarily mergers and acquisitions, financing, and valuation activities. Mr. Duke graduated from Hamilton College in 1980 with a Bachelor’s Degree in Economics and English.
We believe that Mr. Duke’s qualifications to serve on our board of directors include his considerable experience in financial matters, including specifically his experience as founder and president of a private bank and as Chief Financial Officer of a significant organization, and we believe his business management experience is valuable in terms of providing director leadership. |
| - 88 - |
|
Daniel J. Sullivan Director
Age: 50
Director since 2006
Member of audit committee Member of investment committee Member of conflicts resolution committee |
Daniel J. Sullivan has served as an independent director of our board of directors since January 2006. Since 2003, Mr. Sullivan has been a private consultant and an author. From 2003 to 2013, Mr. Sullivan was also the assistant editor of Humanitas, an academic journal published by the National Humanities Institute. Prior to that, from 1998 to 2002, he was Director of Business Development at Jordan Industries Inc. Mr. Sullivan has eighteen years of international business, consulting, and private equity investment experience, including over four years, from 1987 through 1991, in the real estate industry as an appraiser, property analyst, and investment banker with Manufacturers Hanover Real Estate Investment Banking Group in New York. During that time, Mr. Sullivan participated in the structuring and private placement of over $1 billion in long term, fixed-rate, and multi-property mortgage financings for the bank’s corporate clients. Mr. Sullivan holds a Master of Arts Degree in Political Theory from The Catholic University of America in Washington, DC and a Bachelor of Arts Degree in History from Boston College in Chestnut Hill, Massachusetts. We believe that Mr. Sullivan’s diverse background in education, journalism, international business, consulting, and private equity investment adds a unique perspective to our board of directors in fulfilling its duties. His qualifications to serve on our board are also demonstrated by his experience in international business, finance, and real estate investments. |
|
John P. Woodberry Director
Age: 53
Director since 2006
Member of conflicts resolution committee Member of investment committee |
John P. Woodberry has served as an independent director of our board of directors since January 2006. Mr. Woodberry has been active in finance and investing activities since 1991. From 2007 to 2012, Mr. Woodberry served as the Portfolio Manager for the India and Capital Markets Group of Passport Capital, LLC, a San Francisco-based hedge fund. From 2004 to 2007, Mr. Woodberry was the President and Portfolio Manager of Independence Capital Asset Partners, LLC. Previously, from 2001 to 2004, Mr. Woodberry was a Senior Research Analyst at Cobalt Capital, LLC, a New York City-based hedge fund. From 1998 to 2001, Mr. Woodberry worked for Minute Man Capital Management, LLC and Trident Investment Management, LLC, each a New York City-based hedge fund. From 1995 to 1998, Mr. Woodberry worked at Templeton Investment Council Ltd. Mr. Woodberry has a Master’s Degree in Business Administration from Harvard Business School and a Bachelor of Arts Degree from Stanford University.
We believe that Mr. Woodberry’s qualifications to serve on our board of directors include his depth of experience in finance, capital markets, and investment management. His managerial roles at various hedge funds, including his experience as President and Portfolio Manager of Independence Capital Asset Partners, LLC, provide him with leadership experience that we believe is valuable to our board of directors in fulfilling its duties. |
Executive Officers
The following table shows the names and ages of our current executive officers and the positions held by each individual. A description of the business experience of each individual for at least the past five years follows the table. All officers serve at the discretion of our board of directors.
| Name | Age | Position |
| Jeffrey L. Johnson | 56 | Chief Executive Officer |
| J. Michael Lynch | 63 | President |
| M. Kirk Scott | 37 | Chief Financial Officer and Treasurer |
| Joshua J. Widoff | 45 | Executive Vice President, General Counsel and Secretary |
| Gregory M. Moran | 43 | Executive Vice President |
| - 89 - |
Jeffrey L. Johnson has served as our Chief Executive Officer since January 2013. Mr. Johnson served as Managing Principal of Lakeshore Holdings, LLC, a private equity real estate firm that he founded, from 2007 through December 2012. Mr. Johnson has also served as the Chief Executive Officer of our Advisor since January 2013. From December 2009 to June 2011, he also served as founder and Managing Principal of Reunion Office Holdings, LLC, a private equity real estate firm, and from January 2009 to November 2009, he served as Chief Investment Officer and Managing Director of Transwestern Investment Company, a private equity real estate firm now known as Pearlmark Real Estate Partners. From 2003 until Equity Office Properties Trust was acquired by the Blackstone Group in February 2007, Mr. Johnson served as Chief Investment Officer, Executive Vice President and Chairman of the Investment Committee of Equity Office Properties Trust. Equity Office Properties Trust was a publicly traded REIT and at that time was the largest publicly traded owner and manager of office properties in the United States. While at Equity Office Properties Trust, Mr. Johnson restructured the investment group and implemented an investment strategy that resulted in over $12.5 billion in transaction volume, providing capital for a $2.6 billion stock repurchase. From 1990 to 1999, Mr. Johnson was a senior executive at Equity Office Properties Trust and its predecessor entities, most recently serving as Chief Investment Officer. Mr. Johnson was instrumental in completing Equity Office Property Trust’s initial public offering in July 1997, setting investment strategies and completing over $9 billion of real estate operating company transactions and property acquisitions. From 1990 to 1996, he was a senior acquisitions officer where he was responsible for acquiring over $1.2 billion of office properties. From 2000 through 2003, Mr. Johnson served as a Managing Director, founding Partner and Co-Head of U.S. Investments for Lehman Brothers Holdings, Inc.’s real estate private equity group, where he was one of six founding members that raised a $1.6 billion first-time fund, built an international investment group and executed a process that resulted in $580 million of equity investments, in over $6.9 billion of real estate, during the fund’s first 30 months.
During his career, Mr. Johnson has overseen acquisition and disposition activity in various real estate and real estate-related investments, including core office properties, development projects, joint ventures, international investments, mezzanine loans and multi-asset class portfolio transactions. He has also been instrumental in numerous significant public and private capital markets and mergers and acquisitions transactions. Mr. Johnson serves on the Northwestern University Kellogg Real Estate Advisory Board. Mr. Johnson is also a member of each of the Urban Land Institute and the Chicago Commonwealth Club. Mr. Johnson received his Master’s Degree in Business Administration from Northwestern University’s Kellogg Graduate School of Management and his Bachelor’s Degree from Denison University.
J. Michael Lynch has served as our President since July 2013. Mr. Lynch has over 30 years of real estate development and investment experience. Prior to joining us, Mr. Lynch served as Chief Investment Officer of Arden Realty, Inc., a GE Capital Real Estate Company, from May 2007 to June 2013. While with Arden Realty, Mr. Lynch oversaw capital market activities for a $4.5 billion office and industrial portfolio and led a team responsible for approximately $2 billion in acquisition and disposition activity. From May 2004 to March 2007, he served as Senior Vice President of Investments for Equity Office Properties Trust. While at Equity Office Properties Trust, Mr. Lynch managed office investment activity in major cities in the Western U.S. and development activity throughout the U.S. and completed transactions valued at over $1.5 billion of core and core-plus properties.
Mr. Lynch serves as an Advisory Board member for American Homes 4 Rent. Mr. Lynch received his Bachelor of Science Degree in Economics, cum laude, from Mount Saint Mary’s College and his Master’s Degree in Architecture from Virginia Polytechnic Institute.
M. Kirk Scott has served as our Chief Financial Officer and Treasurer since April 2009 and served as our Vice President and Controller from April 2008 to September 2011. Since joining us in April 2008, Mr. Scott has overseen and developed investor and lender relations, finance, financial reporting, accounting, budgeting, forecasting, internal audit, securities and tax compliance, lender relations and other related areas of responsibilities. Prior to joining us in 2008, Mr. Scott was Controller of Denver-based NexCore Group, a fully-integrated real estate development and operating company primarily focused within the medical office sector that has developed or acquired over 4.7 million square feet of facilities. Within his capacity as Controller, Mr. Scott directed and oversaw the accounting, financial reporting and compliance, budgeting, forecasting and investor relation functions for the NexCore Group. From 2002 until 2006, Mr. Scott was Assistant Controller at Dividend Capital Group LLC and DCT Industrial Trust Inc. (NYSE: DCT) during that company’s growth from inception to more than $2 billion in assets under management where he was responsible for establishing the organization’s accounting and financial reporting function including compliance with the rules and regulations of the Commission, FINRA, the Internal Revenue Service and various state blue sky laws. Prior thereto, Mr. Scott was an auditor with KPMG focused on various real estate assignments. Mr. Scott holds a Bachelor’s Degree in Accounting, cum laude, from the University of Wyoming.
Joshua J. Widoff has served as Executive Vice President, General Counsel and Secretary since October 2010, and served as Senior Vice President, Secretary and General Counsel from September 2007 to October 2010. He also served as the Executive Vice President, General Counsel and Secretary of Industrial Income Trust from November 2013 until November 2015, and as its Senior Vice President, General Counsel and Secretary from May 2009 to December 2013. Mr. Widoff has served as the Executive Vice President, General Counsel and Secretary of Industrial Property Trust since September 2012 and as the Executive Vice President, General Counsel and Secretary of Logistics Property Trust since November 2014. Mr. Widoff is also the Executive Vice President, General Counsel and Secretary of DC Industrial Liquidating Trust, a Maryland trust. He has also served as a Managing Director of Black Creek Group LLC, a Denver-based private equity real estate firm, since September 2007, and as Executive Vice President of Dividend Capital Group LLC since October 2010. Prior to joining us in September 2007, Mr. Widoff was a partner from October 2002 to July 2007 at the law firm of Brownstein Hyatt Farber Schreck, P.C., where he was active in the management of the firm, serving as chairman of both the firm’s Associate and Recruiting Committees and overseeing an integrated team of attorneys and paralegals servicing clients primarily in the commercial real estate business. During more than a dozen years of private practice, he managed transactions involving the acquisition, development, leasing, financing and disposition of various real estate assets, including vacant land, apartment and office buildings, hotels, casinos, industrial/warehouse facilities and shopping centers. He also participated in asset and stock acquisition transactions, convertible debt financings, private offerings and complex joint venture negotiations. Mr. Widoff served as general business counsel on a variety of contract and operational issues to a wide range of clients in diverse businesses. Mr. Widoff currently serves as a Vice-Chair and Commissioner for the Denver Urban Renewal Authority. Mr. Widoff received his Bachelor’s Degree from Trinity University in Texas and his Juris Doctor Degree from the University of Colorado School of Law.
| - 90 - |
Gregory M. Moran has served as Executive Vice President since July 2013. Mr. Moran also has served as a Vice President of Investments of Dividend Capital Group LLC and Dividend Capital Total Advisors Group LLC since August 2005. Mr. Moran has been an active participant in the institutional real estate community since 1998. From December 2001 through July 2005, Mr. Moran was a Portfolio Manager in the Real Estate Investment Group for the Public Employees’ Retirement Association of Colorado where he was directly involved in the ongoing management of a global real estate investment portfolio with over $2 billion of invested equity. Mr. Moran was responsible for sourcing and underwriting new investment opportunities, ongoing asset management of existing portfolio investments and relationship management for over a dozen joint venture partners and advisors of the fund. From September 1998 through December 2001, Mr. Moran worked in the Capital Markets Group at Sonnenblick Goldman Company, most recently as a Vice President. During this time, Mr. Moran was responsible for raising and structuring debt and equity investments in commercial real estate projects on behalf of public and private real estate investment companies. Mr. Moran received his Bachelor’s Degree in Business Administration and Master’s Degree in Professional Accounting from the University of Texas at Austin — McCombs School of Business. He is also a CFA Charterholder, and a member of the CFA Institute, Urban Land Institute and Pension Real Estate Association.
Section 16(a) Beneficial Ownership Reporting Compliance
Section 16(a) of the Exchange Act requires our directors, our officers, and certain beneficial owners, or, collectively, reporting persons, to file reports of holdings and transactions in our shares of common stock with the Commission. To our knowledge, based solely on review of copies of such reports, during the year ended December 31, 2015, all of such reporting persons complied with all Section 16(a) filing requirements applicable to them.
CORPORATE GOVERNANCE
Board Leadership Structure
We separate the roles of Chief Executive Officer and Chairman of our board of directors because we currently believe that the different roles can best be filled by different people who have different experiences and perspectives. Mr. Jeffrey L. Johnson, as our Chief Executive Officer, is responsible for the execution of our business strategy and day-to-day operations. One of our interested directors, Mr. Kincaid, serves as Chairman of our board of directors, and, in such capacity, is responsible for presiding over our board of directors in its identification and execution of our operational and investment objectives, and oversight of our management team. We believe that Mr. Kincaid’s experience and background make him highly qualified to lead our board of directors in the fulfillment of its duties.
As an interested director, Mr. Kincaid may not participate as a director in determining the compensation of our Advisor, the renewal of the Advisory Agreement, or any other transactions or arrangements that we may enter into with regard to our Advisor or its affiliates. Our independent directors maintain authority with regard to any and all transactions and arrangements made with our Advisor. For additional discussion regarding the role that our independent directors play with regard to transactions and arrangements made with our Advisor see “Certain Relationships and Related Party Transactions” in “Item 13. Certain Relationships and Related Transactions, and Director Independence” in this Annual Report on Form 10-K.
Code of Business Conduct and Ethics
Our board of directors has adopted a Code of Business Conduct and Ethics, which applies to all employees of our Advisor, and our officers and directors, including our Chief Executive Officer and our Chief Financial Officer. Additionally, our board of directors has adopted a code of ethics specifically for the unique and critical roles of our Chief Executive Officer and our Senior Financial Officers, including our Chief Financial Officer. Copies of the Code of Business Conduct and Ethics and the Code of Ethics for our Chief Executive Officer and our Senior Financial Officers may be found on our website at www.dividendcapitaldiversified.com. Our board of directors must approve any amendment to or waiver of the Code of Business Conduct and Ethics as well as the Code of Ethics for our Chief Executive Officer and our Senior Financial Officers. We presently intend to disclose amendments and waivers, if any, of the Code of Business Conduct and Ethics on our website.
| - 91 - |
Our Internet address is www.dividendcapitaldiversified.com. We make available, free of charge through a link on our website, our annual reports on Form 10-K, quarterly reports on Form 10-Q, current reports on Form 8-K, and amendments to such reports, if any, as filed with the Commission as soon as reasonably practicable after such filing. You may also obtain these documents in print by writing us at 518 Seventeenth Street, 17th Floor, Denver, Colorado 80202, Attention: Investor Relations.
Audit Committee
The members of our audit committee are Messrs. Duke, Kincaid and Sullivan. Messrs. Duke and Sullivan are each an independent director and Mr. Kincaid is an interested director. The board of directors has determined that each member of our audit committee is financially literate as such qualification is interpreted by our board of directors. Our board of directors has determined that Mr. Duke qualifies as an “Audit Committee Financial Expert” as defined by the rules of the Commission.
ITEM 11. EXECUTIVE COMPENSATION
Compensation of Directors
We pay each of our independent directors $8,750 per quarter plus $2,000 for each regular board of directors meeting attended in person, $1,000 for each regular board of directors meeting attended by telephone, and $2,000 for each committee meeting and each special board of directors meeting attended in person or by telephone. We also pay the chairman of the audit committee an annual retainer of $7,500 (prorated for a partial term). All directors receive reimbursement of reasonable out-of-pocket expenses incurred in connection with attending board meetings. If a director is also one of our officers, we will not pay additional compensation for services rendered as a director. The amount and form of compensation payable to our independent directors for their service to us is determined by our independent directors, based upon recommendations from our Advisor. Certain of our executive officers may, in their capacities as officers and/or employees our Advisor, participate in recommending compensation for our directors.
RSU Awards
In addition, at each annual meeting of stockholders the independent directors will automatically, upon election, receive an award (“Annual Award”), pursuant to either the Equity Incentive Plan or the Secondary Plan (as defined in “Item 12. Security Ownership of Certain Beneficial Owners and Management and Related Stockholder Matters – Equity Incentive Plans” of this Annual Report on Form 10-K), of $10,000 in restricted stock units (“RSUs”) with respect to Class I shares of our common stock, with the number of RSUs based on the NAV per Class I share as of the end of the day of the annual meeting. Independent directors appointed after an annual meeting will, upon appointment, receive a pro rata Annual Award, with the number of RSUs based on the Class I NAV as of the end of the day of appointment and reflecting the number of days remaining until the one-year anniversary of the prior annual meeting of stockholders (or, if earlier and if scheduled as of the day of appointment, the date of the next scheduled annual meeting of stockholders).
RSUs will vest if and when the director completes the term for which he or she was elected/appointed. Unvested awards will also vest in the event of death or disability of the director or upon a change of control of our company. Unvested awards will be forfeited if the director’s term in office terminates prematurely for any other reason. The directors may elect to defer settlement of vested awards in shares pursuant to Section 409A of the Code.
| - 92 - |
The following table sets forth information concerning the compensation of our independent directors for the year ended December 31, 2015:
| Name | Fees Earned or Paid in Cash(1) | Stock Awards (1) | Total | ||||||
| Charles B. Duke | $ | 78,500 | $ | 10,383 | $ | 88,883 | |||
| Daniel J. Sullivan | 71,000 | 10,383 | 81,383 | ||||||
| John P. Woodberry | 61,000 | 10,383 | 71,383 | ||||||
| Total | $ | 210,500 | $ | 31,149 | $ | 241,649 | |||
| (1) | This column reflects fees earned in 2015. In addition, the following amounts were earned in 2014 and paid in 2015: $20,625 for Mr. Duke, $18,750 for Mr. Sullivan and $14,750 for Mr. Woodberry. |
| (2) | Includes (i) the amortized portion of an Annual Award which was made on June 25, 2014 to each independent director then in office and fully vested on June 24, 2015, with the number of RSUs based on the Class I NAV as of the end of the day on June 25, 2014 (“2014 Director RSU Grant”), (ii) the amortized portion of an Annual Award which was made on June 25, 2015 to each independent director then in office and will fully vest on June 23, 2016, with the number of RSUs based on the Class I NAV as of the end of the day on June 25, 2015, and (iii) the dividend equivalents related to the 2014 Director RSU Grant, which was accrued over the one-year period between June 25, 2014 and June 24, 2015 and fully vested on June 24, 2015, the date the 2014 Director RSU Grant fully vested. |
Executive Compensation
Compensation Discussion and Analysis
Because our Advisory Agreement provides that our Advisor assumes principal responsibility for managing our affairs, we have no employees, and our executive officers, in their capacities as such, do not receive compensation from us, nor do they work exclusively on our affairs. In their capacities as officers or employees of our Advisor or its affiliates, they devote such portion of their time to our affairs as is required for the performance of the duties of our Advisor under the Advisory Agreement. The compensation received by our executive officers is not paid or determined by us, but rather by an affiliate of our Advisor based on all of the services provided by these individuals. See “Certain Relationships and Related Party Transactions” in “Item 13. Certain Relationships and Related Transactions, and Directors Independence” of this Annual Report on Form 10-K for a summary of the fees and expenses payable to our Advisor and its affiliates.
Compensation Committee Report
We do not currently have a compensation committee, however, our compensation committee, if formed, would be comprised entirely of independent directors. In lieu of a formal compensation committee, our independent directors perform an equivalent function. Our independent directors have reviewed and discussed the Compensation Discussion and Analysis contained in “Item 11. Executive Compensation” of this Annual Report on Form 10-K (the “CD&A”) with management. Based on the independent directors’ review of the CD&A and their discussions of the CD&A with management, the independent directors recommended to the board of directors, and the board of directors has approved, that the CD&A be included in this Annual Report on Form 10-K.
| INDEPENDENT DIRECTORS: | |
|
Charles B. Duke Daniel J. Sullivan John P. Woodberry |
The foregoing report shall not be deemed to be “soliciting material” or incorporated by reference by any general statement incorporating by reference this Annual Report on Form 10-K into any filing under the Securities Act of 1933, as amended (the “Securities Act”), or under the Exchange Act, except to the extent that we specifically incorporate this information by reference, and shall not otherwise be deemed filed under such Acts.
Compensation Committee Interlocks and Insider Participation
We do not currently have a compensation committee, however, we intend that our compensation committee, if formed, would be comprised entirely of independent directors. In lieu of a formal compensation committee, our independent directors perform an equivalent function. None of our independent directors served as one of our officers or employees or as an officer or employee of any of our subsidiaries during the fiscal year ended December 31, 2015, or formerly served as one of our officers or as an officer of any of our subsidiaries. In addition, during the fiscal year ended December 31, 2015, none of our executive officers served as a director or member of a compensation committee (or other board committee performing equivalent functions or, in the absence of any such committee, the entire board of directors) of any entity that has one or more executive officers or directors serving as a member of our board of directors.
| - 93 - |
We do not expect that any of our executive officers will serve as a director or member of the compensation committee of any entity whose executive officers include a member of our compensation committee, if formed.
| ITEM 12. | SECURITY OWNERSHIP OF CERTAIN BENEFICIAL OWNERS AND MANAGEMENT AND RELATED STOCKHOLDER MATTERS |
Security Ownership of Certain Beneficial Owners and Management
The following table shows, as of January 31, 2016, the amount of each class of our common stock beneficially owned (unless otherwise indicated) by (i) any person who is known by us to be the beneficial owner of more than five percent of the outstanding shares of such class, (ii) our directors, (iii) our executive officers, and (iv) all of our directors and executive officers as a group.
Unless otherwise indicated below, each person or entity has an address in care of our principal executive offices at 518 Seventeenth Street, 17th Floor, Denver, Colorado 80202.
| Name and Address of Beneficial Owner (1) | Amount and Nature of Beneficial Ownership |
Percent of Common Stock of Applicable Class | |||
| Dividend Capital Total Advisors LLC (2) | 20,000 | Class E shares | * | ||
| 20,202 | Class I shares | * | |||
| John A. Blumberg (Director) (2) | 36,822 | Class I shares | * | ||
| Charles B. Duke (Independent Director) | 30,000 | Class E shares (3) | * | ||
| 2,200 | Class I shares | * | |||
| Richard D. Kincaid (Chairman and Director) | 45,589 | Class I shares | * | ||
| Daniel J. Sullivan (Independent Director) | 30,000 | Class E shares (3) | * | ||
| 2,280 | Class I shares | * | |||
| John P. Woodberry (Independent Director) | 30,000 | Class E shares (3) | * | ||
| 7,200 | Class I shares | * | |||
| Jeffrey L. Johnson (Chief Executive Officer) | 156,081 | Class I shares | * | ||
| J. Michael Lynch (President and Chief Operating Officer) | 54,062 | Class I shares | * | ||
| M. Kirk Scott (Chief Financial Officer and Treasurer) | 49,965 | Class I shares | * | ||
| Joshua J. Widoff (Executive Vice President, General Counsel and Secretary) |
12,656 | Class I shares | * | ||
| Gregory M. Moran (Executive Vice President) | 3,707 | Class I shares | * | ||
| Beneficial ownership of Common Stock by all directors and executive officers as a group (10 persons) (2) |
110,000 | Class E shares (4) | * | ||
| 390,763 | Class I shares | 1.8% | |||
| * | Less than 1%. |
| (1) | Except as otherwise indicated below, each beneficial owner has the sole power to vote and dispose of all common stock held by that beneficial owner. Beneficial ownership is determined in accordance with Rule 13d-3 under the Exchange Act. Common stock issuable pursuant to options, to the extent such options are exercisable within 60 days, is treated as beneficially owned and outstanding for the purpose of computing the percentage ownership of the person holding the option, but is not treated as outstanding for the purpose of computing the percentage ownership of any other person. |
| (2) | Our Advisor and the parent of our Advisor are presently each directly or indirectly controlled by one or more of the following and/or their affiliates: John A. Blumberg, James R. Mulvihill, and Evan H. Zucker. |
| (3) | On April 3, 2006, pursuant to the terms of our equity incentive plan, each of our independent directors was automatically granted a non-qualified option to purchase 10,000 Class E shares of common stock. Each such option has a maximum term of ten years and will vest according to the following schedule: 20% of the covered shares on the date of grant, and an additional 20% of such shares on each of the first four anniversaries of the date of grant, subject in each case to the director continuing to serve on our board of directors as of such vesting date. On August 27, 2007, August 21, 2008, June 29, 2009, and June 29, 2010, respectively, each of our independent directors was granted an option to purchase 5,000 Class E shares of common stock. These options fully vested two years after the grant date. |
| (4) | Includes 20,000 Class E shares held by our Advisor and vested options to purchase 90,000 Class E shares of common stock held by our independent directors. |
| - 94 - |
Equity Incentive Plans
Second Amended and Restated Equity Incentive Plan
On March 12, 2015, our board of directors adopted the Second Amended and Restated Equity Incentive Plan (the “Equity Incentive Plan”). The Equity Incentive Plan was approved by our stockholders on June 23, 2015. The Equity Incentive Plan provides for the granting of cash-based awards and stock-based awards, including stock options, stock appreciation rights, restricted stock, and stock units to our employees (if we have any in the future), our independent directors, employees of the Advisor or its affiliates, other advisors and consultants of ours and of the Advisor selected by the plan administrator for participation in the Equity Incentive Plan, and any prospective director, officer, employee, consultant, or advisor of the Company and the Advisor. Any such stock-based awards, including stock options, stock appreciation rights, restricted stock, and stock units will provide for exercise prices, where applicable, that are not less than the fair market value of shares of our common stock on the date of the grant.
Our board of directors administers the Equity Incentive Plan as the plan administrator, with sole authority to select participants, determine the types of awards to be granted and determine all the terms and conditions of the awards, including whether the grant, vesting or settlement of awards may be subject to the attainment of one or more performance goals. No awards will be granted under the Equity Incentive Plan if the grant, vesting and/or exercise of the awards would jeopardize our status as a REIT for tax purposes or otherwise violate the ownership and transfer restrictions imposed under our charter. Unless determined by the plan administrator, no award granted under the Equity Incentive Plan will be transferable except through the laws of descent and distribution.
An aggregate maximum of 5.0 million shares of our common stock may be issued upon grant, vesting or exercise of awards under the Equity Incentive Plan, although the board of directors, to date, has only authorized and reserved for issuance a total of 2.0 million shares of our common stock under the Equity Incentive Plan. In addition, to any individual in any single calendar year no more than 200,000 shares may be made subject to stock options or stock appreciation rights under the Equity Incentive Plan and no more than 200,000 shares may be made subject to other stock-based awards under the Equity Incentive Plan. Further, no more than $1.0 million may be paid under a cash-based award to any individual in a single calendar year.
If any shares subject to an award are forfeited or cancelled, or if an award is settled in cash, terminates unearned or expires, in each case, without a distribution of shares, the shares with respect to such award shall, to the extent of any such forfeiture, cancellation, cash settlement, termination or expiration, again be available for awards under the Equity Incentive Plan. By contrast, if shares are surrendered or withheld as payment of the exercise price of an award or withholding taxes in respect of an award, the shares with respect to such award shall, to the extent of any such surrender or withholding, no longer be available for awards under the Equity Incentive Plan. In the event of certain corporate transactions affecting our common stock, such as, for example, a reorganization, recapitalization, merger, spin-off, split-off, stock dividend or extraordinary dividend, our board of directors will have the sole authority to determine whether and in what manner to equitably adjust the number and type of shares and the exercise prices applicable to outstanding awards under the plan, the number and type of shares reserved for future issuance under the plan, and, if applicable, performance goals applicable to outstanding awards under the plan. Fractional shares that result from any adjustment will be disregarded.
Under the Equity Incentive Plan, the plan administrator will determine the treatment of awards in the event of a change in our control. The Equity Incentive Plan will automatically expire on March 12, 2025, unless earlier terminated by our board of directors. Our board of directors may terminate the Equity Incentive Plan at any time. The expiration or other termination of the Equity Incentive Plan will have no adverse impact on any award that is outstanding at the time the Equity Incentive Plan expires or is terminated without the consent of the holder of the outstanding award. Our board of directors may amend the Equity Incentive Plan at any time, but no amendment will adversely affect any award on a retroactive basis without the consent of the holder of the outstanding award, and no amendment to Equity Incentive Plan will be effective without the approval of our stockholders if such approval is required by any law, regulation or rule applicable to the Equity Incentive Plan. The same is true for any amendment to remove the prohibition on repricing. No amendment will be made that could jeopardize the status of the Company as a REIT under the Code.
Secondary Equity Incentive Plan
On March 12, 2015, the board of directors also adopted the Amended and Restated Secondary Equity Incentive Plan (the “Secondary Plan”). The Secondary Plan was approved by our stockholders on June 23, 2015. The Secondary Plan is substantially similar to the Equity Incentive Plan, except that under the Secondary Plan, an eligible participant is any person, trust, association or entity to which the plan administrator desires to grant an award. An aggregate maximum of 5.0 million shares may be issued upon grant, vesting or exercise of awards under the Secondary Plan, although the board of directors, to date, has only authorized and reserved for issuance a total of 2.0 million shares of our common stock under the Secondary Plan.
| - 95 - |
The following table gives information regarding our equity incentive plans as of December 31, 2015.
| Equity Compensation Plans Information | ||||||||||||
| Plan Category | Number
of Securities To Be Issued Upon Exercise of Outstanding Options, Warrants, and Rights | Weighted-Average Exercise Price of Outstanding Options, Warrants, and Rights (1) | Number of Securities Remaining Available for Future Issuance Under Equity Compensation Plans (2) | |||||||||
| Equity compensation plans approved by security holders | (94,116 | )(3) | $ | 11.00 | 1,815,938 | |||||||
| Equity compensation plans not approved by security holders | — | — | 1,989,318 | |||||||||
| Total / Weighted Average | (94,116 | ) | $ | 11.00 | 3,805,256 | |||||||
| (1) | Weighted-average exercise price represents the option strike price for 90,000 options to purchase Class E shares for $11.00 issued to our three independent directors. Restricted stock units (“RSUs”) with respect to Class I shares of our common stock that were granted to our independent directors and had not been settled as of December 31, 2015, are included in the number of securities to be issued upon exercise of outstanding options, warrants, and rights but are not reflected in the weighted-average exercise price of outstanding options, warrants, and rights. |
| (2) | We have two equity incentive plans. Under each plan, an aggregate maximum of 5.0 million shares may be issued upon grant, vesting or exercise of awards, although the board of directors, as of December 31, 2015, has only authorized and reserved for issuance a total of 2.0 million shares of our common stock under each plan. |
| (3) | As of December 31, 2015, includes (i) options to purchase 90,000 Class E shares of our common stock that were granted to our independent directors and had vested but had not yet been exercised, and (ii) 4,116 RSUs with respect to Class I shares of our common stock that were granted to our independent directors and had not yet vested. |
| ITEM 13. | CERTAIN RELATIONSHIPS AND RELATED TRANSACTIONS, AND DIRECTOR INDEPENDENCE |
Advisory Agreement
We rely on our Advisor to manage our day-to-day activities and to implement our investment strategy. We, the Operating Partnership, and our Advisor are party to an Eighth Amended and Restated Advisory Agreement, dated as of July 12, 2012, which we refer to herein as the “Advisory Agreement”. On June 11, 2015, we, the Operating Partnership and our Advisor agreed to renew the Advisory Agreement effective as of June 30, 2015 for an additional one-year term expiring June 30, 2016. The terms of the Advisory Agreement otherwise remain unchanged. The current term of the Advisory Agreement is one year and expires on June 30 of each calendar year, subject to renewals by our board of directors for an unlimited number of successive one-year periods. Our officers and our interested directors are all employees or principals of our Advisor. Our Advisor is presently directly or indirectly majority owned, controlled, and/or managed by John A. Blumberg, James R. Mulvihill, Evan H. Zucker, and/or their affiliates.
Under the terms of the Advisory Agreement, our Advisor uses its best efforts, subject to the oversight, review, and approval of the board of directors, to perform the following:
| · | Participate in formulating an investment strategy and asset allocation framework consistent with achieving our investment objectives; |
| · | Assist our board of directors in developing, overseeing, implementing, and coordinating our daily NAV procedures; |
| · | Provide information about our properties and other assets and liabilities to the independent valuation firm and other parties involved in determining our daily NAV; |
| · | Research, identify, review, and recommend to our board of directors for approval real property and real estate-related acquisitions and dispositions consistent with our investment policies and objectives; |
| · | Structure the terms and conditions of transactions pursuant to which acquisitions and dispositions of real properties and real estate-related investments will be made; |
| · | Actively oversee and manage our real property and real estate-related investment portfolios for purposes of meeting our investment objectives; |
| · | Manage our day-to-day affairs, including financial accounting and reporting, investor relations, marketing, informational systems, and other administrative services on our behalf; |
| · | Select joint venture partners and product specialists, structure corresponding agreements, and oversee and monitor these relationships; and |
| · | Arrange for financing and refinancing of our assets. |
| - 96 - |
The independent directors will evaluate the performance of our Advisor before renewing the Advisory Agreement. The Advisory Agreement may be terminated:
| · | Immediately by us for “cause” (as defined in the Advisory Agreement) or upon the bankruptcy of our Advisor; |
| · | Without cause or penalty by a majority of our independent directors upon 60 days’ written notice; or |
| · | With “good reason” (as defined in the Advisory Agreement) by our Advisor upon 60 days’ written notice. |
In the event of the termination of the Advisory Agreement, our Advisor will cooperate with us and take all reasonable steps requested to assist our board of directors in making an orderly transition of the advisory function. Before selecting a successor advisor, our board of directors must determine that any successor advisor possesses sufficient qualifications to perform the advisory function and to justify the compensation it would receive from us.
Compensation to our Advisor
Our Advisor and its affiliates are paid fees and reimbursed certain expenses in connection with services they provide to us. In connection with our current public offering, we entered into the Advisory Agreement, which modified the fees and expense reimbursements payable to our Advisor. In the event the Advisory Agreement is terminated, our Advisor will be paid all accrued and unpaid fees and expense reimbursements earned prior to the date of termination. We will not reimburse our Advisor or its affiliates for services for which our Advisor or its affiliates are entitled to compensation in the form of a separate fee. Our Advisor may also, directly or indirectly (including, without limitation, through us or our subsidiaries), receive fees from our joint venture partners or co-owners of our properties for services provided to them with respect to their proportionate interests. Fees received from joint venture partners or co-owners of our properties and paid, directly or indirectly (including without limitation, through us or our subsidiaries), to our Advisor may be more or less than similar fees that we pay to our Advisor pursuant to the Advisory Agreement.
The following table summarizes all of the compensation and fees, including reimbursement of expenses, that are payable by us to our Advisor.
| · | Advisory Fees — Advisor |
In consideration for the asset management services it provides on our behalf, we pay our Advisor an advisory fee equal to: (1) a fixed component that accrues daily in an amount equal to 1/365th of 1.15% of the “Aggregate Fund NAV” (defined as the aggregate NAV of our Class E shares, Class A shares, Class W shares, and Class I shares, along with the OP Units in our Operating Partnership held by third parties) for such day, which is payable monthly in arrears, and (2) a performance component calculated on the basis of the overall non-compounded investment return provided to holders of “Fund Interests” (defined as our Class E shares, Class A shares, Class W shares, and Class I shares, along with the OP Units in our Operating Partnership held by third parties) such that our Advisor receives 25% of the overall return in excess of 6%; provided that in no event may the performance component exceed 10% of the overall return for such year, and subject to certain other limitations.
We also pay our Advisor a development management fee equal to 4.0% of the cost to develop, construct, or improve any real property assets.
In addition, we pay our Advisor a fee of 1.0% of the total consideration we receive upon the sale of real property assets.
Further, for providing a substantial amount of services in connection with the sale of a property, as determined by a majority of our independent directors, we pay our Advisor up to 50.0% of the reasonable, customary, and competitive commission paid for the sale of a comparable real property, provided that such amount shall not exceed 1.0% of the contract price of the property sold and, when added to all other real estate commissions paid to unaffiliated parties in connection with the sale, may not exceed the lesser of a competitive real estate commission or 6.0% of the sales price of the property.
|
| · | Expense Reimbursement — Advisor | Subject to certain limitations, we reimburse our Advisor for all of the costs it incurs in connection with the services it provides to us, including, without limitation, our allocable share of our Advisor’s overhead, which includes but is not limited to our Advisor’s rent, utilities, and personnel costs, as well as a portion of the compensation payable to our principal executive officer and our principal financial officer. We do not reimburse our Advisor or its affiliates for services for which our Advisor or its affiliates are entitled to compensation in the form of a separate fee. |
| - 97 - |
| · | Issuer Organization and Offering Expense Reimbursement — Advisor or its affiliates, including our Dealer Manager | We pay directly, or reimburse our Advisor and our Dealer Manager if they pay on our behalf, any organization and offering expenses (other than selling commissions, the dealer manager fee, distribution fees, the primary dealer fee, supplemental fees and commissions, and certain other amounts) as and when incurred. After the termination of the current primary offering and again after termination of the offering under our distribution reinvestment plan, our Advisor has agreed to reimburse us to the extent that total cumulative organization and offering expenses (including selling commissions, the primary dealer fee, the dealer manager fee, and distribution fees) that we incur exceed 15% of our gross proceeds from the applicable offering.
|
| · | Additional Underwriting Compensation – our Dealer Manager or our Advisor | We pay directly, or reimburse our Advisor and our Dealer Manager if they pay on our behalf, certain additional items of underwriting compensation including legal fees of our Dealer Manager, reimbursements for customary travel, lodging, meals and reasonable entertainment expenses of registered persons associated with our Dealer Manager, the cost of educational conferences held by us, including costs reimbursement for registered persons associated with our Dealer Manager and registered representatives of participating broker-dealers to attend educational conferences sponsored by us, attendance fees and costs reimbursement for registered persons associated with our Dealer Manager to attend seminars conducted by participating broker-dealers, and promotional items. In addition to this additional underwriting compensation, our Advisor may also pay our Dealer Manager additional amounts to fund certain of our Dealer Manager’s costs and expenses related to the distribution of this offering, which will not be reimbursed by us. Also, our Dealer Manager may pay supplemental fees or commissions to participating broker-dealers and servicing broker-dealers with respect to Class I shares sold in the primary offering, which will not be reimbursed by us. |
Property Management Agreement
We are a party to a property management agreement dated January 9, 2006, or the “Property Management Agreement”, with Dividend Capital Property Management LLC, or the “Property Manager”. Under the Property Management Agreement, the Property Manager may perform certain property management services for us and our Operating Partnership. The Property Manager is an affiliate of our Advisor and was organized in April 2002 to lease and manage real properties acquired by Dividend Capital-affiliated entities or other third parties. Pursuant to the Property Management Agreement, we will pay the Property Manager a property management fee equal to a market-based percentage of the annual gross revenues of each of our real properties managed by the Property Manager. The actual percentage will be variable and is dependent upon geographic location and product type (such as office, industrial, retail, multifamily, hospitality, and other property types). In addition, we may pay the Property Manager a separate fee for the one-time initial lease-up of newly constructed real properties it manages for us in an amount not to exceed the fee customarily charged in arm’s-length transactions by others rendering similar services in the same geographic area for similar real properties as determined by a survey of brokers and agents in such area. Historically, we have primarily relied on third-party property managers, and we have not paid any significant amount of a property management fee to the Property Manager. The Property Manager is presently directly or indirectly majority owned, controlled, and/or managed by Mr. Blumberg, James R. Mulvihill, Evan H. Zucker, and/or their affiliates.
Dealer Manager Agreement
We entered into a dealer manager agreement dated July 12, 2012, or the “Prior Dealer Manager Agreement,” with our Dealer Manager in connection with the Prior Offering. Pursuant to the Prior Dealer Manager Agreement, our Dealer Manager served as the dealer manager for the Prior Offering. Our Dealer Manager is an entity related to our Advisor and a member firm of FINRA.
Under the Prior Dealer Manager Agreement, our Dealer Manager provided certain sales, promotional, and marketing services to us in connection with the distribution of the shares of common stock offered pursuant to our Prior Offering prospectus. Pursuant to the Prior Dealer Manager Agreement, we paid our Dealer Manager a sales commission of up to 3.0% of the NAV per Class A share sold in the primary offering, subject to the reduction of the sales commission in certain circumstances, and a distribution fee which accrued daily in an amount equal to 1/365th of 0.50% of the amount of our NAV per share for our Class A shares for such day. We also paid our Dealer Manager a dealer manager fee which accrued daily in an amount equal to 1/365th of 0.60% of our NAV per share for each of our Class A and Class W shares and in an amount equal to 1/365th of 0.10% of our NAV per share for our Class I shares for such day. We will continue paying such dealer manager fees and distribution fee with respect to shares sold in the Prior Offering until the earlier to occur of the following: (i) a listing of the class of such shares on a national securities exchange, (ii) following the completion of the Prior Offering, total underwriting compensation in the Prior Offering equaling 10% of the gross proceeds from the primary portion of the Prior Offering, or (iii) such shares no longer being outstanding. The sales commissions, distribution fees, and dealer manager fees may all be reallowed to participating broker dealers who are members of FINRA. Our Dealer Manager may also receive a portion of the organization and offering expense reimbursement amounts described above under “— Compensation to our Advisor”. Our Dealer Manager is presently directly or indirectly majority owned by John A. Blumberg, James R. Mulvihill, Evan H. Zucker, and/or their affiliates.
| - 98 - |
Pursuant to an amendment to our Prior Dealer Manager Agreement entered into on May 31, 2013, from time to time we could agree to pay our Dealer Manager a primary dealer fee in the amount of up to 5.0% of the gross proceeds raised from the sale of Class I shares in the primary portion of the Prior Offering, provided that the total gross proceeds raised with respect to which the primary dealer fee could apply could not exceed $300,000,000. Pursuant to this amendment, our Dealer Manager retained 0.5% of such gross proceeds and reallowed the remainder of the primary dealer fee to the participating broker-dealers involved in selling such Class I shares based on the portion of the gross proceeds raised from their customers. The primary dealer fee is considered underwriting compensation (as defined in accordance with, and subject to the underwriting compensation limits of, applicable FINRA rules).
On September 16, 2015, the Company entered into a Second Amended and Restated Dealer Manager Agreement (the “Second Amended Dealer Manager Agreement”) with our Dealer Manager in connection with the Follow-On Offering. Pursuant to the Second Amended Dealer Manager Agreement, our Dealer Manager serves as the dealer manager for the Follow-On Offering.
The Second Amended Dealer Manager Agreement is an amendment and restatement of the Prior Dealer Manager Agreement. The purpose of the Second Amended Dealer Manager Agreement is to engage our Dealer Manager with respect to the Follow-On Offering. As amended, the Second Amended Dealer Manager Agreement may be made to apply to future offerings by naming them in a schedule to the agreement, with the consent of the Company and our Dealer Manager. Pursuant to the Second Amended Dealer Manager Agreement, we pay (i) selling commissions on Class A shares sold in the primary offering of up to 3.0% of the public offering price per share, (ii) a dealer manager fee which accrues daily in an amount equal to 1/365th of 0.6% of our NAV per share of Class A and Class W shares outstanding and an amount equal to 1/365th of 0.1% of our NAV per share of Class I shares outstanding on such day on a continuous basis, and (iii) a distribution fee which accrues daily in an amount equal to 1/365th of 0.5% of our NAV per Class A share outstanding on such day on a continuous basis. Subject to FINRA limitations on underwriting compensation, we will continue to pay the dealer manager fee and distribution fee until the earlier to occur of the following: (i) a listing of the class of such shares on a national securities exchange or (ii) such shares no longer being outstanding.
Pursuant to the Second Amended Dealer Manager Agreement, from time to time we may agree to pay our Dealer Manager a primary dealer fee in the amount of up to 5.0% of the gross proceeds raised from the sale of Class I shares in the primary portion of the Follow-On Offering, provided that the total gross proceeds raised with respect to which the primary dealer fee will apply may not exceed $100,000,000. Pursuant to this agreement, our Dealer Manager retains 0.5% of such gross proceeds and reallows the remainder of the primary dealer fee to the participating broker-dealers involved in selling such Class I shares based on the portion of the gross proceeds raised from their customers. The primary dealer fee is considered underwriting compensation (as defined in accordance with, and subject to the underwriting compensation limits of, applicable FINRA rules).
As of December 31, 2015, we have paid a primary dealer fee of $2.5 million with respect to $50.8 million of the total gross proceeds raised in our public offering. The maximum primary dealer fee we will pay our Dealer Manager pursuant to the Second Amended Dealer Manager Agreement is $5 million, although in the future we may enter into subsequent amendments to the Second Amended Dealer Manager Agreement to provide for additional primary dealer fee payments.
Compensation to our Advisor and its Affiliates
In connection with the commencement of the Prior Offering in 2012, we amended our Advisory Agreement with our Advisor to eliminate acquisition fees and tie the advisory fee earned by our Advisor to our NAV. In addition, our current advisory fees paid to our Advisor include a performance-based component for which our Advisor receives an additional fee equal to 25% of the total investment return to our Class A, W and I stockholders in a given year in excess of 6% as an incentive to reward sustainable total investment return performance to our stockholders. However, our Advisor will not receive a performance fee based on Class E shares until their NAV exceeds $10 per share. We designed the amended advisory fee structure to benefit stockholders by reducing day-to-day management fees paid to our Advisor, while incentivizing the Advisor to maximize stockholder value, whether or not new capital is raised.
See Note 11 to our financial statements beginning on page F-1 of this Annual Report on Form 10-K for further discussion of all fees and reimbursements that we pay to our Advisor.
| - 99 - |
The table below provides information regarding fees and expenses paid or payable to our Advisor, our Dealer Manager, and their affiliates in connection with their services provided to us. The table includes amounts incurred and payable for the year ended December 31, 2015 (amounts in thousands).
| For the Year Ended December 31, | ||||||||
| 2015 | 2014 | |||||||
| Advisory fees (1) | $ | 17,083 | $ | 15,919 | ||||
| Other reimbursements paid to our Advisor (2) | 9,008 | 8,287 | ||||||
| Other reimbursements paid to our Dealer Manager | 441 | 591 | ||||||
| Advisory fees related to the disposition of real properties | 4,962 | 2,064 | ||||||
| Development management fee | 88 | 181 | ||||||
| Dealer manager, distribution and primary dealer fees (3) | 2,962 | 2,533 | ||||||
| Total | $ | 34,544 | $ | 29,575 | ||||
| (1) | Amounts reported for the years ended December 31, 2015 and 2014 include approximately $1.1 million and approximately $653,000, respectively, that we were not obligated to pay in consideration of the issuance of Company RSUs to our Advisor. The Restricted Stock Unit Agreements with our Advisor are discussed further in Note 11 to our financial statements beginning on page F-1 of this Annual Report on Form 10-K. |
| (2) | Amount reported for the year ended December 31, 2015 includes $319,500 to reimburse a portion of the salary and benefits for our principal executive officer, Jeffrey L. Johnson, and $555,000 to reimburse a portion of the salary and benefits for our principal financial officer, M. Kirk Scott, for services provided to us, for which we do not pay our Advisor a fee. Amount reported for the year ended December 31, 2014 includes $333,000 to reimburse a portion of the salary and benefits for our principal executive officer, Jeffrey L. Johnson, and $499,184 to reimburse a portion of the salary and benefits for our principal financial officer, M. Kirk Scott, for services provided to us, for which we do not pay our Advisor a fee. Our principal executive officer and principal financial officer receive significant additional compensation from our Advisor or its affiliates that we do not reimburse. |
| (3) | Amounts reported include primary dealer fees we paid to our Dealer Manager based on the gross proceeds raised by participating broker-dealers pursuant to certain selected dealer agreements. Of the primary dealer fee earned during the years ended December 31, 2015, 2014, and 2013, our Dealer Manager reallowed approximately $2.3 million, $2.0 million, and $1.2 million, respectively, to participating third-party broker-dealers and retained approximately $254,000, $220,000, and $136,000, respectively. |
Our independent directors evaluate at least annually whether the compensation that we contract to pay to our Advisor and its affiliates is reasonable in relation to the nature and quality of services performed and that such compensation is within the limits prescribed by our charter. Our independent directors also supervise the performance of our Advisor and its affiliates and the compensation we pay to them to determine that the provisions of our compensation arrangements are carried out. Our board of directors also reviews all of our general and administrative expenses on at least an annual basis, which includes certain amounts reimbursed by us to our Advisor.
Please also see Note 2 to our financial statements beginning on page F-1 of this Annual Report on Form 10-K for information regarding restricted stock grants to certain employees of our Advisor and its affiliates, none of which are our named executive officers.
Product Specialists
During the year ended December 31, 2012, our Advisor entered into a product specialist agreement with BCG TRT Advisors LLC (“BCG”), in connection with advisory services related to our investments in real estate securities assets. Pursuant to this agreement, a portion of the asset management fee that our Advisor receives from us related to real estate securities investments is reallowed to BCG in exchange for services provided. Approximately $24,000 was incurred related to services provided by BCG during the year ended December 31, 2015.
Policies and Procedures for Conflict Resolution and Review of Related Party Transactions
We are subject to potential conflicts of interest arising out of our relationship with our Advisor and its affiliates. These conflicts may relate to compensation arrangements, the allocation of investment and leasing opportunities, the terms and conditions on which various transactions might be entered into by us and our Advisor or its affiliates, and other situations in which our interests may differ from those of our Advisor or its affiliates. On September 27, 2010, our board of directors adopted amended conflicts of interest resolutions procedures. Our charter also contains certain requirements relating to board and independent director approval of transactions between us, on the one hand, and our Advisor or any of its affiliates, on the other hand.
| - 100 - |
Independent Directors
Our independent directors evaluate at least annually whether the compensation that we contract to pay to our Advisor and its affiliates is reasonable in relation to the nature and quality of services performed and to our investment performance and that such compensation is within the limits prescribed by our charter. In addition, our independent directors, acting as a group, will resolve potential conflicts of interest whenever they determine that the exercise of independent judgment by the board of directors or our Advisor or its affiliates could reasonably be compromised. However, the independent directors may not take any action which, under Maryland law, must be taken by the entire board of directors or which is otherwise not within their authority. The independent directors, as a group, are authorized to retain their own legal and financial advisors. Those conflict of interest matters that cannot be delegated to our independent directors, as a group, under Maryland law must be acted upon by both the board of directors and the independent directors.
Acquisitions Involving Affiliates and Other Related Entities
We will not purchase or lease real properties in which our Sponsor, our Advisor, any of our directors, or any of their affiliates has an interest without a determination by a majority of our directors (including a majority of our independent directors) not otherwise interested in the transaction that such transaction is fair and reasonable to us and at a price to us no greater than the cost of the property to our Sponsor, our Advisor, such director or such affiliate unless there is substantial justification for any amount that exceeds such cost and such excess amount is determined to be reasonable. In no event will we acquire any such property at an amount in excess of its appraised value. We will not sell or lease real properties to our Sponsor, our Advisor, our directors or any of their affiliates unless a majority of the directors not otherwise interested in the transaction (including a majority of the independent directors not otherwise interested in the transaction) determine that the transaction is fair and reasonable to us.
Mortgage Loans Involving Affiliates
Our charter prohibits us from investing in or making mortgage loans in which the transaction is with our Sponsor, our Advisor, our directors, or any of their affiliates unless an independent expert appraises the underlying property. We must keep the appraisal for at least five years and make it available for inspection and duplication by any of our stockholders. In addition, we must obtain a mortgagee’s or owner’s title insurance policy or commitment as to the priority of the mortgage or the condition of the title. Our charter prohibits us from making or investing in any mortgage loans that are subordinate to any lien or other indebtedness of our Sponsor, our Advisor, our directors, or any of their affiliates.
Issuance of Options and Warrants to Certain Affiliates
Our charter prohibits the issuance of options or warrants to purchase our common stock to our Sponsor, our Advisor, our directors, or any of their affiliates (i) on terms more favorable than we would offer such options or warrants to unaffiliated third parties or (ii) in excess of an amount equal to 10% of our outstanding common stock on the date of grant.
Repurchase of Shares of Common Stock
Our charter prohibits us from paying a fee to our Sponsor, our Advisor, our directors, or any of their affiliates in connection with our repurchase of our common stock.
Loans and Expense Reimbursements Involving Affiliates
Except with respect to certain mortgage loans as described above or loans to wholly owned subsidiaries, we will not make any loans to our Sponsor, our Advisor, our directors, or any of their affiliates. In addition, we will not borrow from these parties unless a majority of the directors not otherwise interested in the transaction (including a majority of the independent directors not otherwise interested in the transaction) approve the transaction as being fair, competitive, and commercially reasonable, and no less favorable to us than comparable loans between unaffiliated parties. These restrictions on loans will only apply to advances of cash that are commonly viewed as loans, as determined by our board of directors. By way of example only, the prohibition on loans would not restrict advances of cash for legal expenses or other costs incurred as a result of any legal action for which indemnification is being sought, nor would the prohibition limit our ability to advance reimbursable expenses incurred by directors or our Advisor or its affiliates.
DIRECTOR INDEPENDENCE
Our charter defines an “independent director” as a person who has not been, directly or indirectly, associated with our Sponsor (as defined in our charter) or our Advisor, within the previous two years by virtue of:
| · | ownership interests in our Sponsor, our Advisor, or any of their affiliates; |
| · | employment by our Sponsor, our Advisor, or any of their affiliates; |
| - 101 - |
| · | service as an officer or director of our Sponsor, our Advisor, or any of their affiliates; |
| · | performance of services, other than as a director for us; |
| · | service as a director or trustee of more than three real estate investment trusts organized by our Sponsor or advised by our Advisor; or |
| · | maintenance of a material business or professional relationship with our Sponsor, our Advisor, or any of their affiliates. |
We refer to our directors who are not independent as our “interested directors.” Our charter sets forth the material business or professional relationships that cause a person to be associated with us and therefore not eligible to serve as an independent director. A business or professional relationship is per se material if the prospective independent director received more than five percent of his annual gross income in the last two years from our Sponsor, our Advisor, or any affiliate of our Sponsor or Advisor, or if more than five percent of his net worth, on a fair market value basis, has come from our Sponsor, our Advisor, or any affiliate of our Sponsor or Advisor.
Our board of directors has determined that Messrs. Charles B. Duke, Daniel J. Sullivan, and John P. Woodberry are independent within the meaning of the applicable (i) provisions set forth in our charter, (ii) requirements set forth in the Exchange Act and the applicable Commission rules, and (iii) although our shares are not listed on the New York Stock Exchange (“NYSE”), independence rules set forth in the NYSE Listed Company Manual. To be considered independent under the NYSE rules, our board of directors must determine that a director does not have a material relationship with us and/or our consolidated subsidiaries (either directly or as a partner, stockholder, or officer of an organization that has a relationship with any of those entities).
Committee Independence
Audit Committee. The members of our audit committee are Messrs. Duke, Kincaid and Sullivan. Messrs. Duke and Sullivan are each an independent director and Mr. Kincaid is an interested director.
Investment Committee. The members of our investment committee are Messrs. Blumberg, Kincaid, Duke, Sullivan, and Woodberry. Messrs. Duke, Sullivan, and Woodberry are each an independent director, and Messrs. Kincaid and Blumberg are each an interested director.
Conflicts Resolution Committee. The members of our conflicts resolution committee are Messrs. Sullivan and Woodberry, each of whom is an independent director.
Compensation Committee. We do not have a standing compensation committee. Our board of directors may establish a compensation committee in the future to administer our equity incentive plans. A compensation committee, if formed, will consist entirely of our independent directors.
Nominating Committee. We do not have a standing nominating committee. Our board of directors has determined that it is appropriate for us not to have a nominating committee because all of the matters for which a nominating committee would be responsible are presently considered by our entire board of directors.
| - 102 - |
| ITEM 14. | PRINCIPAL ACCOUNTANT FEES AND SERVICES |
During the year ended December 31, 2015, we engaged KPMG LLP to provide us with audit services. Services provided included the audit of annual financial statements, review of unaudited quarterly financial information, review and consultation regarding filings with the Commission, and consultation on financial accounting and reporting matters.
Total fees billed to us by KPMG LLP for the years ended December 31, 2015 and 2014 were $844,415 and $894,915, respectively, and consisted of the following:
| Fiscal Year 2015 | Fiscal Year 2014 | |||||||
| Audit Fees | $ | 844,415 | $ | 894,915 | ||||
| Audit-Related Fees | — | — | ||||||
| Tax Fees | — | — | ||||||
| All Other Fees | — | — | ||||||
| Total | $ | 844,415 | $ | 894,915 | ||||
All fees were determined to be “Audit Fees”. Audit Fees are fees incurred for the audits of the consolidated financial statements, consultation on audit-related matters, and required review of Commission filings. This category also includes review of, and consents for, filings with the Commission related to our public offerings.
The audit committee of our board of directors has considered all services provided by KPMG LLP to us and concluded that this involvement is compatible with maintaining the independent registered public accounting firm’s independence.
The audit committee of our board of directors is responsible for appointing our independent registered public accounting firm and approving the terms of the independent registered public accounting firm’s services. The audit committee charter imposes a duty on the audit committee to pre-approve all auditing services performed for us by our independent registered public accounting firm, as well as all permitted non-audit services. The audit committee may, in its discretion, delegate to one or more of its members the authority to pre-approve any audit or non-audit services to be performed by the independent registered public accounting firm, provided any such approval is presented to and approved by the full audit committee at its next scheduled meeting. All fees for services provided by KPMG LLP in 2015 and 2014 were pre-approved by the audit committee of our board of directors.
| - 103 - |
| ITEM 15. | EXHIBITS AND FINANCIAL STATEMENT SCHEDULES |
(a) Financial Statements and Schedules.
Reference is made to the “Index to Consolidated Financial Statements” on page F-1 of this Annual Report on Form 10-K and the consolidated financial statements included therein, beginning on page F-2.
All other financial statement schedules are not required under the related instructions, or they have been omitted either because they are not significant or the required information has been disclosed in the consolidated financial statements and the notes related thereto.
(b) Exhibits
The following exhibits are filed as part of this Annual Report on Form 10-K:
| Exhibit Number |
Description |
| 3.1 | Articles of Restatement, incorporated by reference to Exhibit 3.1 to the Company’s Annual Report on Form 10-K, filed March 21, 2012 |
| 3.2 | Articles of Amendment, incorporated by reference to Exhibit 3.1 to the Company’s Current Report on Form 8-K, filed July 12, 2012 |
| 3.3 | Articles Supplementary (Class A shares), incorporated by reference to Exhibit 3.2 to the Company’s Current Report on Form 8-K, filed July 12, 2012 |
| 3.4 | Articles Supplementary (Class W shares), incorporated by reference to Exhibit 3.3 to the Company’s Current Report on Form 8-K, filed July 12, 2012 |
| 3.5 | Articles Supplementary (Class I shares), incorporated by reference to Exhibit 3.4 to the Company’s Current Report on Form 8-K, filed July 12, 2012 |
| 3.6 | Certificate of Correction to Articles of Restatement, incorporated by reference to Exhibit 3.1 to the Company’s Current Report on Form 8-K, filed on March 26, 2014 |
| 3.7 | Sixth Amended and Restated Bylaws, incorporated by reference to Exhibit 3.1 to the Company’s Current Report on Form 8-K, filed December 8, 2014 |
| 4.1 | Fourth Amended and Restated Distribution Reinvestment Plan, incorporated by reference to Exhibit 4.1 to the Company’s Current Report on Form 8-K, filed July 12, 2012 |
| 4.2 | Second Amended and Restated Class E Share Redemption Program, incorporated by reference to Exhibit 99.1 to the Company’s Current Report on Form 8-K, filed December 16, 2015 |
| 4.3 | Statement regarding transfer restrictions, preferences, limitations, and rights of holders of shares of common stock (to appear on stock certificate or to be sent upon request and without charge to stockholders issued shares without certificates), incorporated by reference to Exhibit 4.5 to Post-Effective Amendment No. 3 to the Company’s Registration Statement on Form S-11 (No. 333-175989), filed April 15, 2013 |
| 4.4 | Second Amended and Restated Class A, W and I Share Redemption Program, incorporated by reference to Exhibit 4.1 to the Company’s Current Report on Form 8-K, filed December 17, 2014 |
| 10.1 | Eighth Amended and Restated Advisory Agreement, incorporated by reference to Exhibit 10.1 to the Company’s Current Report on Form 8-K, filed July 12, 2012 |
| 10.2 | Fourth Amended and Restated Operating Partnership Agreement of Dividend Capital Total Realty Operating Partnership LP, incorporated by reference to Exhibit 10.2 to the Company’s Current Report on Form 8-K, filed July 12, 2012 |
| 10.3 | Amendment No. 1 to Fourth Amended and Restated Operating Partnership Agreement of Dividend Capital Total Realty Operating Partnership LP, incorporated by reference to Exhibit 10.1 to the Company’s Quarterly Report on Form 10-Q, filed November 13, 2012 |
| 10.4 | Property Management Agreement between the Company (f/k/a Dividend Capital Total Realty Trust Inc.) and Dividend Capital Property Management LLC, incorporated by reference to Exhibit 10.3 to Amendment No. 5 to the Company’s Registration Statement on Form S-11, Commission File No. 333-125338, filed January 13, 2006 |
| 10.5 | Form of Management Agreement between various affiliates of the Company (f/k/a Dividend Capital Total Realty Trust Inc.) and KeyPoint Partners LLC, as property manager (New England Retail Portfolio), incorporated by reference to Exhibit 10.27 to the Company’s Quarterly Report on Form 10-Q, filed August 14, 2007 |
| 10.6 | Dividend Capital Fixed Rate Office Portfolio Loan Agreement between TRT Lending Subsidiary I, LLC and Wells Fargo Bank, National Association, dated June 25, 2010, incorporated by reference to Exhibit 10.2 to the Company’s Quarterly Report on Form 10-Q, filed August 13, 2010 |
| 10.7 | Side Letter Agreement Related to Mortgage, Assignment of Leases and Rents, Security Agreement and Fixture Filing by and among the Company (f/k/a Dividend Capital Total Realty Trust Inc.) and New York Life Insurance Company, dated June 25, 2010, incorporated by reference to Exhibit 10.5.1 to the Company’s Quarterly Report on Form 10-Q, filed August 13, 2010 |
| 10.8 | Amended and Restated Credit and Term Loan Agreement, incorporated by reference to Exhibit 1.1 to the Company’s Current Report on Form 8-K, filed January 13, 2015 |
| - 104 - |
| 10.9 | Credit Agreement, incorporated by reference to Exhibit 1.1 to the Company’s Current Report on Form 8-K, filed March 2, 2015 |
| 10.10 | Second Amended and Restated Dealer Manager Agreement, incorporated by reference to Exhibit 1.1 to the Company’s Current Report on Form 8-K, filed September 16, 2015. |
| 10.11 | Restricted Stock Unit Agreement between the Company and Dividend Capital Total Advisors LLC, dated April 7, 2014, incorporated by reference to Exhibit 10.14 to Post-Effective Amendment No. 8 to the Company’s Registration Statement on Form S-11 (File No. 333-175989), filed April 11, 2014 |
| 10.12 | Selected Dealer Agreement with Raymond James & Associates, Inc., dated March 26, 2015, incorporated by reference to Exhibit 1.2 to the Company’s Current Report on Form 8-K, filed March 26, 2015 |
| 10.13 | Form of Indemnification Agreement for officers and directors, incorporated by reference to Exhibit 10.4 to Amendment No. 5 to the Company’s Registration Statement on Form S-11, Commission File No. 333-125338, filed January 13, 2006 |
| 10.14 | Second Amended and Restated Equity Incentive Plan, incorporated by reference to Exhibit 10.1 to the Company’s Current Report on Form 8-K, filed June 24, 2015 |
| 10.15 | Amended and Restated Secondary Equity Incentive Plan, incorporated by reference to Exhibit 10.2 to the Company’s Current Report on Form 8-K, filed June 24, 2015 |
| 10.16 | Form of Director Option Agreement, incorporated by reference to Exhibit 99.1 to the Company’s Current Report on Form 8-K, filed April 7, 2006 |
| 10.17 | Form of Independent Director Restricted Stock Unit Agreement, incorporated by reference to Exhibit 10.17 to the Company’s Annual Report on Form 10-K, filed March 10, 2014 |
| 10.18 | Purchase and Sale Contract by and between TRT NOIP Doolittle – Redondo Beach LP, TRT NOIP Sheila - Commerce LP, TRT NOIP Corporate Center Drive – Newbury Park LP, TRT NOIP Sylvan Way – Parsippany LLC, TRT NOIP Sw 80 - Plantation LLC, TRT NOIP Connection – Irving LP, TRT NOIP Maple – El Segundo LP, TRT NOIP Glenville - Richardson LP, TRT NOIP Columbia - Richfield LLC, TRT NOIP Corporate Drive – Dixon LLC, TRT NOIP Eagle LP, TRT NOIP East 28 – Aurora LLC, GPT Doolittle Drive Owner LP, GPT Sheila Street Owner LP, GPT Corporate Center-Thousand Oaks Owner LP, GPT Sylvan Way Owner LLC, GPT SW 80th Street Owner LLC, GPT Maple Avenue Owner LP, GPT Connection Drive Owner LLC, GPT Glenville Drive Owner LLC, GPT Columbia Road Owner LLC, GPT Corporate Drive-Dixon Owner LLC, GPT Vickery Drive Owner LLC, and GPT 28th Avenue Aurora Owner LLC, dated December 9, 2014, incorporated by reference to Exhibit 10.15 to Pre-Effective Amendment No. 1 to the Company’s Registration Statement on Form S-11 (File No. 333-197767), filed January 29, 2015 |
| 10.19 | Amended and Restated Purchase and Sale Contract between TRT NOIP Sheila – Commerce LP, TRT NOIP Corporate Center Drive – Newbury Park LP, TRT NOIP Connection – Irving LP, TRT NOIP Glenville – Richardson LP, TRT NOIP Columbia – Richfield LLC, TRT NOIP Eagle LP, TRT NOIP East 28 – Aurora LLC, GPT Sheila Street Owner LP, GPT Corporate Center-Thousand Oaks Owner LP, GPT Connection Drive Owner LLC, GPT Columbia Road Owner LLC, GPT Vickery Drive Owner LLC, and GPT 28th Avenue Aurora Owner LLC, dated January 15, 2015, incorporated by reference to Exhibit 10.16 to Pre-Effective Amendment No. 1 to the Company’s Registration Statement on Form S-11 (File No. 333-197767), filed January 29, 2015 |
| 10.20 | Amended and Restated Purchase and Sale Contract between TRT NOIP Doolittle – Redondo Beach LP, TRT NOIP Sw 80 – Plantation LLC, TRT NOIP Corporate Drive – Dixon LLC, GPT Doolittle Drive Owner LP, GPT SW 80th Street Owner LLC, and GPT Corporate Drive-Dixon Owner LLC, dated January 15, 2015, incorporated by reference to Exhibit 10.17 to Pre-Effective Amendment No. 1 to the Company’s Registration Statement on Form S-11 (File No. 333-197767), filed January 29, 2015 |
| 10.21 | Amended and Restated Purchase and Sale Contract by and between TRT NOIP Sylvan Way – Parsippany LLC, TRT NOIP Maple – El Segundo LP, GPT Sylvan Way Owner LLC, and GPT Maple Avenue Owner LP, dated January 15, 2015, incorporated by reference to Exhibit 10.18 to Pre-Effective Amendment No. 1 to the Company’s Registration Statement on Form S-11 (File No. 333-197767), filed January 29, 2015 |
| 10.22 | Restricted Stock Unit Agreement between the Company and Dividend Capital Total Advisors LLC, dated February 25, 2015 (relating to 135,359 restricted stock units), incorporated by reference to Exhibit 10.2 to the Company’s Current Report on Form 8-K, filed March 2, 2015 |
| 10.23 | Restricted Stock Unit Agreement between the Company and Dividend Capital Total Advisors LLC, dated February 25, 2015 (relating to 88,788 restricted stock units), incorporated by reference to Exhibit 10.3 to the Company’s Current Report on Form 8-K, filed March 2, 2015 |
| 10.24 | Restricted Stock Unit Agreement between the Company and Dividend Capital Total Advisors LLC, dated February 4, 2016 (relating to 124,451 restricted stock units), incorporated by reference to Exhibit 10.1 to the Company’s Current Report on Form 8-K, filed February 5, 2016. |
| 21 | Subsidiaries of the registrant* |
| 23.1 | Consent of KPMG LLP* |
| 31.1 | Rule 13a-14(a) Certification of Principal Executive Officer* |
| 31.2 | Rule 13a-14(a) Certification of Principal Financial Officer* |
| 32.1 | Certification of Principal Executive Officer pursuant to 18 U.S.C. Section 1350, as adopted pursuant to Section 906 of the Sarbanes-Oxley Act of 2002* |
| 32.2 | Certification of Principal Financial Officer pursuant to 18 U.S.C. Section 1350, as adopted pursuant to Section 906 of the Sarbanes-Oxley Act of 2002* |
| 99.1 | Valuation Procedures, incorporated by reference to Exhibit 99.1 to the Company’s Annual Report on Form 10-K, filed March 3, 2015 |
| 99.2 | Consent of Altus Group U.S., Inc.* |
| - 105 - |
| 101.1 | The following information from this Annual Report on Form 10-K for the year ended December 31, 2015, formatted in XBRL (eXtensible Business Reporting Language): (i) Consolidated Balance Sheets; (ii) Consolidated Statements of Income; (iii) Consolidated Statements of Stockholders’ Equity; and (iv) Consolidated Statements of Cash Flows* |
| * | Filed or furnished herewith. |
| - 106 - |
INDEX TO CONSOLIDATED FINANCIAL STATEMENTS
| F-1 |
Report of Independent Registered Public Accounting Firm
The Board of Directors and Stockholders
Dividend Capital Diversified Property Fund Inc.:
We have audited the accompanying consolidated balance sheets of Dividend Capital Diversified Property Fund Inc. and subsidiaries (the Company) as of December 31, 2015 and 2014, and the related consolidated statements of income, comprehensive income, equity, and cash flows for each of the years in the three-year period ended December 31, 2015. These consolidated financial statements are the responsibility of the Company’s management. Our responsibility is to express an opinion on these consolidated financial statements based on our audits.
We conducted our audits in accordance with the standards of the Public Company Accounting Oversight Board (United States). Those standards require that we plan and perform the audit to obtain reasonable assurance about whether the financial statements are free of material misstatement. An audit includes examining, on a test basis, evidence supporting the amounts and disclosures in the financial statements. An audit also includes assessing the accounting principles used and significant estimates made by management, as well as evaluating the overall financial statement presentation. We believe that our audits provide a reasonable basis for our opinion.
In our opinion, the consolidated financial statements referred to above present fairly, in all material respects, the financial position of Dividend Capital Diversified Property Fund Inc. and subsidiaries as of December 31, 2015 and 2014, and the results of their operations and their cash flows for each of the years in the three-year period ended December 31, 2015, in conformity with U.S. generally accepted accounting principles.
As discussed in Note 2 to the consolidated financial statements, the Company has changed its method for reporting discontinued operations as of January 1, 2014 due to the adoption of FASB Accounting Standards Update No. 2014-08, Reporting Discontinued Operations and Disclosures of Disposals of Components of an Entity.
| /s/ KPMG LLP |
Denver, Colorado
March 3, 2016
| F-2 |
PART I. FINANCIAL INFORMATION
ITEM 1. FINANCIAL STATEMENTS
DIVIDEND CAPITAL DIVERSIFIED PROPERTY FUND INC.
(In thousands, except share and footnoted information)
| As of December 31, | ||||||||
| 2015 | 2014 | |||||||
| ASSETS | ||||||||
| Investments in real property | $ | 2,380,174 | $ | 2,442,509 | ||||
| Accumulated depreciation and amortization | (505,957 | ) | (513,083 | ) | ||||
| Net investments in real property (1) | 1,874,217 | 1,929,426 | ||||||
| Debt related investments, net | 15,722 | 94,951 | ||||||
| Net investments | 1,889,939 | 2,024,377 | ||||||
| Cash and cash equivalents | 15,769 | 14,461 | ||||||
| Restricted cash | 18,394 | 27,452 | ||||||
| Other assets, net | 43,106 | 59,916 | ||||||
| Assets held for sale | — | 21,927 | ||||||
| Total Assets | $ | 1,967,208 | $ | 2,148,133 | ||||
| LIABILITIES AND EQUITY | ||||||||
| Liabilities: | ||||||||
| Accounts payable and accrued expenses | $ | 39,645 | $ | 49,974 | ||||
| Mortgage notes and other secured borrowings (2) | 587,086 | 853,267 | ||||||
| Unsecured borrowings | 517,000 | 345,000 | ||||||
| Intangible lease liabilities, net | 63,874 | 86,243 | ||||||
| Other liabilities | 33,652 | 47,789 | ||||||
| Liabilities associated with assets held for sale | — | 1,880 | ||||||
| Total Liabilities | 1,241,257 | 1,384,153 | ||||||
| Equity: | ||||||||
| Stockholders’ equity: | ||||||||
| Common stock, $0.01 par value; 1,000,000,000 shares authorized; 164,124,057 and 178,399,679 shares issued and outstanding, as of December 31, 2015 and December 31, 2014, respectively (3) | 1,641 | 1,784 | ||||||
| Additional paid-in capital | 1,470,859 | 1,586,444 | ||||||
| Distributions in excess of earnings | (832,681 | ) | (893,791 | ) | ||||
| Accumulated other comprehensive loss | (11,014 | ) | (10,120 | ) | ||||
| Total stockholders’ equity | 628,805 | 684,317 | ||||||
| Noncontrolling interests | 97,146 | 79,663 | ||||||
| Total Equity | 725,951 | 763,980 | ||||||
| Total Liabilities and Equity | $ | 1,967,208 | $ | 2,148,133 | ||||
| (1) | Includes approximately $76.9 million and $82.7 million, after accumulated depreciation and amortization, in consolidated real property variable interest entity investments as of December 31, 2015 and 2014, respectively. |
| (2) | Includes approximately $50.1 million and $59.4 million in consolidated mortgage notes in variable interest entity investments as of December 31, 2015 and 2014, respectively. |
| (3) | Includes 137,275,396 shares of Class E common stock, 1,703,109 shares of Class A common stock, 1,811,277 shares of Class W common stock, and 23,334,275 shares of Class I common stock issued and outstanding as of December 31, 2015, and 163,067,835 shares of Class E common stock, 1,187,215 shares of Class A common stock, 1,116,698 shares of Class W common stock, and 13,027,931 shares of Class I common stock issued and outstanding as of December 31, 2014. |
The accompanying notes are an integral part of these consolidated financial statements.
| F-3 |
DIVIDEND CAPITAL DIVERSIFIED PROPERTY FUND INC.
CONSOLIDATED STATEMENTS OF INCOME
(In thousands, except per share and footnoted information)
| For the Year Ended December 31, | ||||||||||||
| 2015 | 2014 | 2013 | ||||||||||
| REVENUE: | ||||||||||||
| Rental revenue | $ | 218,278 | $ | 224,201 | $ | 207,328 | ||||||
| Debt related income | 6,922 | 7,396 | 10,449 | |||||||||
| Total Revenue | 225,200 | 231,597 | 217,777 | |||||||||
| EXPENSES: | ||||||||||||
| Rental expense | 59,590 | 50,997 | 43,672 | |||||||||
| Real estate depreciation and amortization expense | 83,114 | 88,994 | 87,174 | |||||||||
| General and administrative expenses (1) | 10,720 | 11,108 | 9,774 | |||||||||
| Advisory fees, related party | 17,083 | 15,919 | 15,120 | |||||||||
| Acquisition-related expenses | 2,644 | 1,205 | 536 | |||||||||
| Impairment of real estate property (2) | 8,124 | 9,500 | 2,600 | |||||||||
| Total Operating Expenses | 181,275 | 177,723 | 158,876 | |||||||||
| Other Income (Expenses): | ||||||||||||
| Interest and other income (expense) | 2,192 | 1,168 | (153 | ) | ||||||||
| Interest expense | (47,508 | ) | (61,903 | ) | (65,325 | ) | ||||||
| Loss on extinguishment of debt and financing commitments | (1,168 | ) | (63 | ) | (2,507 | ) | ||||||
| Gain on sale of real property (3) | 134,218 | 10,914 | — | |||||||||
| Income (loss) from continuing operations | 131,659 | 3,990 | (9,084 | ) | ||||||||
| Discontinued operations (4) | — | 30,004 | 65,554 | |||||||||
| Net income | 131,659 | 33,994 | 56,470 | |||||||||
| Net income attributable to noncontrolling interests | (7,404 | ) | (4,802 | ) | (4,002 | ) | ||||||
| NET INCOME ATTRIBUTABLE TO COMMON STOCKHOLDERS | $ | 124,255 | $ | 29,192 | $ | 52,468 | ||||||
| Net income (loss) per basic and diluted common share: | ||||||||||||
| Continuing operations | $ | 0.70 | $ | 0.02 | $ | (0.05 | ) | |||||
| Discontinued operations | $ | — | $ | 0.14 | $ | 0.34 | ||||||
| NET INCOME PER BASIC AND DILUTED COMMON SHARE | $ | 0.70 | $ | 0.16 | $ | 0.29 | ||||||
| WEIGHTED AVERAGE NUMBER OF COMMON SHARES OUTSTANDING | ||||||||||||
| Basic | 175,938 | 178,273 | 178,196 | |||||||||
| Diluted | 188,789 | 190,991 | 191,932 | |||||||||
| (1) | Includes approximately $7.1 million, $6.8 million and $4.7 million paid to our Advisor and its affiliates for reimbursable expenses during the years ended December 31, 2015, 2014, and 2013, respectively. |
| (2) | Includes approximately $125,000 paid to our Advisor for advisory fees associated with the disposition of real properties during the year ended December 31, 2015. |
| (3) | Includes approximately $4.8 million and $419,000 paid to our Advisor for advisory fees associated with the disposition of real properties during the years ended December 31, 2015 and 2014, respectively. |
| (4) | Includes approximately $1.6 million and $2.6 million paid to our Advisor for fees associated with the disposition of real properties during the years ended December 31, 2014 and 2013, respectively. |
The accompanying notes are an integral part of these consolidated financial statements.
| F-4 |
DIVIDEND CAPITAL DIVERSIFIED PROPERTY FUND INC.
CONSOLIDATED STATEMENTS OF COMPREHENSIVE INCOME
(In thousands)
| For the Year Ended December 31, | ||||||||||||
| 2015 | 2014 | 2013 | ||||||||||
| Net Income | $ | 131,659 | $ | 33,994 | $ | 56,470 | ||||||
| Other Comprehensive (Loss) Income: | ||||||||||||
| Net unrealized change from available-for-sale securities | — | (211 | ) | — | ||||||||
| Change from cash flow hedging derivatives | (977 | ) | 721 | 4,975 | ||||||||
| Total Other Comprehensive (Loss) Income | (977 | ) | 510 | 4,975 | ||||||||
| Comprehensive income | 130,682 | 34,504 | 61,445 | |||||||||
| Comprehensive income attributable to noncontrolling interests | (7,321 | ) | (4,637 | ) | (3,577 | ) | ||||||
| COMPREHENSIVE INCOME ATTRIBUTABLE TO COMMON STOCKHOLDERS | $ | 123,361 | $ | 29,867 | $ | 57,868 | ||||||
The accompanying notes are an integral part of these consolidated financial statements.
| F-5 |
DIVIDEND CAPITAL DIVERSIFIED PROPERTY FUND INC.
CONSOLIDATED STATEMENTS OF EQUITY
(In thousands)
| Stockholders’ Equity | ||||||||||||||||||||||||||||
| Accumulated | ||||||||||||||||||||||||||||
| Additional | Distributions | Other | ||||||||||||||||||||||||||
| Common Stock | Paid-in | in Excess of | Comprehensive | Noncontrolling | Total | |||||||||||||||||||||||
| Shares | Amount | Capital | Earnings | Loss | Interests | Equity | ||||||||||||||||||||||
| Balances, December 31, 2012 | 178,128 | $ | 1,781 | $ | 1,610,996 | $ | (850,885 | ) | $ | (16,196 | ) | $ | 95,831 | $ | 841,527 | |||||||||||||
| Comprehensive income (loss): | ||||||||||||||||||||||||||||
| Net income | — | — | — | 52,468 | — | 4,002 | 56,470 | |||||||||||||||||||||
| Unrealized change from cash flow hedging derivatives | — | — | — | — | 4,621 | 354 | 4,975 | |||||||||||||||||||||
| Common stock: | ||||||||||||||||||||||||||||
| Issuance of common stock, net of offering costs | 7,864 | 78 | 48,611 | — | — | — | 48,689 | |||||||||||||||||||||
| Redemptions of common stock | (9,985 | ) | (99 | ) | (68,432 | ) | — | — | — | (68,531 | ) | |||||||||||||||||
| Distributions declared on common stock | — | — | — | (62,330 | ) | — | — | (62,330 | ) | |||||||||||||||||||
| Noncontrolling interests: | ||||||||||||||||||||||||||||
| Contributions of noncontrolling interests | — | — | — | — | — | 212 | 212 | |||||||||||||||||||||
| Distributions declared to noncontrolling interests | — | — | — | — | — | (5,446 | ) | (5,446 | ) | |||||||||||||||||||
| Redemptions of noncontrolling interests | — | — | (5,549 | ) | — | 781 | (1,408 | ) | (6,176 | ) | ||||||||||||||||||
| Buyout of noncontrolling interest | — | — | (2,740 | ) | — | — | (1,639 | ) | (4,379 | ) | ||||||||||||||||||
| Balances, December 31, 2013 | 176,007 | $ | 1,760 | $ | 1,582,886 | $ | (860,747 | ) | $ | (10,794 | ) | $ | 91,906 | $ | 805,011 | |||||||||||||
| Comprehensive income (loss): | ||||||||||||||||||||||||||||
| Net income | — | — | — | 29,192 | — | 4,802 | 33,994 | |||||||||||||||||||||
| Net unrealized change from available-for-sale securities | — | — | — | — | (196 | ) | (15 | ) | (211 | ) | ||||||||||||||||||
| Unrealized change from cash flow hedging derivatives | — | — | — | — | 671 | 50 | 721 | |||||||||||||||||||||
| Common stock: | ||||||||||||||||||||||||||||
| Issuance of common stock, net of offering costs | 13,923 | 140 | 86,961 | — | — | — | 87,101 | |||||||||||||||||||||
| Issuance of common stock, stock-based compensation plans | 136 | 1 | 776 | — | — | — | 777 | |||||||||||||||||||||
| Redemptions of common stock | (11,666 | ) | (117 | ) | (82,119 | ) | — | — | — | (82,236 | ) | |||||||||||||||||
| Amortization of stock-based compensation | — | — | 30 | — | — | — | 30 | |||||||||||||||||||||
| Distributions declared on common stock | — | — | — | (62,236 | ) | — | — | (62,236 | ) | |||||||||||||||||||
| Noncontrolling interests: | ||||||||||||||||||||||||||||
| Contributions of noncontrolling interests | — | — | — | — | — | 104 | 104 | |||||||||||||||||||||
| Distributions declared to noncontrolling interests | — | — | — | — | — | (9,390 | ) | (9,390 | ) | |||||||||||||||||||
| Redemptions of noncontrolling interests | — | — | (1,121 | ) | — | 199 | (6,978 | ) | (7,900 | ) | ||||||||||||||||||
| Buyout of noncontrolling interest | — | — | (969 | ) | — | — | (816 | ) | (1,785 | ) | ||||||||||||||||||
| Balances, December 31, 2014 | 178,400 | $ | 1,784 | $ | 1,586,444 | $ | (893,791 | ) | $ | (10,120 | ) | $ | 79,663 | $ | 763,980 | |||||||||||||
| Comprehensive income (loss): | ||||||||||||||||||||||||||||
| Net income | — | — | — | 124,255 | — | 7,404 | 131,659 | |||||||||||||||||||||
| Unrealized change from cash flow hedging derivatives | — | — | — | — | (922 | ) | (55 | ) | (977 | ) | ||||||||||||||||||
| Common stock: | ||||||||||||||||||||||||||||
| Issuance of common stock, net of offering costs | 14,262 | 142 | 96,807 | — | — | — | 96,949 | |||||||||||||||||||||
| Issuance of common stock, stock-based compensation plans | 618 | 6 | 1,257 | — | — | — | 1,263 | |||||||||||||||||||||
| Redemptions of common stock | (29,156 | ) | (291 | ) | (213,505 | ) | — | — | — | (213,796 | ) | |||||||||||||||||
| Amortization of stock-based compensation | — | — | 32 | — | — | — | 32 | |||||||||||||||||||||
| Distributions declared on common stock | — | — | — | (63,145 | ) | — | — | (63,145 | ) | |||||||||||||||||||
| Noncontrolling interests: | ||||||||||||||||||||||||||||
| Contributions of noncontrolling interests | — | — | — | — | — | 17,337 | 17,337 | |||||||||||||||||||||
| Distributions declared to noncontrolling interests | — | — | — | — | — | (4,689 | ) | (4,689 | ) | |||||||||||||||||||
| Redemptions of noncontrolling interests | — | — | (176 | ) | — | 28 | (2,514 | ) | (2,662 | ) | ||||||||||||||||||
| Balances, December 31, 2015 | 164,124 | $ | 1,641 | $ | 1,470,859 | $ | (832,681 | ) | $ | (11,014 | ) | $ | 97,146 | $ | 725,951 | |||||||||||||
The accompanying notes are an integral part of these consolidated financial statements.
| F-6 |
DIVIDEND CAPITAL DIVERSIFIED PROPERTY FUND INC.
CONSOLIDATED STATEMENTS OF CASH FLOWS
(In thousands)
| For the Year Ended December 31, | ||||||||||||
| 2015 | 2014 | 2013 | ||||||||||
| OPERATING ACTIVITIES: | ||||||||||||
| Net income | $ | 131,659 | $ | 33,994 | $ | 56,470 | ||||||
| Adjustments to reconcile net income to net cash provided by operating activities: | ||||||||||||
| Real estate depreciation and amortization expense | 83,114 | 88,994 | 108,191 | |||||||||
| Gain on disposition of real property | (134,218 | ) | (40,592 | ) | (74,306 | ) | ||||||
| Impairment loss on real estate property | 8,124 | 9,500 | 2,600 | |||||||||
| Collection of accrued interest from debt investment | 6,421 | — | — | |||||||||
| Loss on extinguishment of debt and financing commitments | 1,168 | 63 | 2,507 | |||||||||
| Other adjustments to reconcile loss to net cash provided by operating activities | 4,660 | 8,565 | 7,328 | |||||||||
| Changes in operating assets and liabilities | 4,602 | (13,295 | ) | (16,201 | ) | |||||||
| Net cash provided by operating activities | 105,530 | 87,229 | 86,589 | |||||||||
| INVESTING ACTIVITIES: | ||||||||||||
| Acquisition of real property | (319,577 | ) | (125,509 | ) | (48,228 | ) | ||||||
| Capital expenditures in real property | (26,204 | ) | (14,944 | ) | (25,436 | ) | ||||||
| Proceeds from disposition of real properties | 359,817 | 105,322 | 133,485 | |||||||||
| Investment in debt related investments | (1,503 | ) | — | (10,848 | ) | |||||||
| Principal collections on debt related investments | 64,769 | 24,052 | 29,018 | |||||||||
| Other investing activities | (2,881 | ) | (4,023 | ) | (5,144 | ) | ||||||
| Net cash provided by (used in) investing activities | 74,421 | (15,102 | ) | 72,847 | ||||||||
| FINANCING ACTIVITIES: | ||||||||||||
| Mortgage note proceeds | 70,626 | — | — | |||||||||
| Mortgage note principal repayments | (136,658 | ) | (52,977 | ) | (29,046 | ) | ||||||
| Defeasance of mortgage note borrowings | (53,267 | ) | — | — | ||||||||
| Net proceeds from revolving line of credit borrowings | 92,000 | 45,000 | — | |||||||||
| Net proceeds from term loan borrowings | 80,000 | — | — | |||||||||
| Repayment of other secured borrowings | (25,796 | ) | (1,122 | ) | (44,256 | ) | ||||||
| Redemption of common shares | (225,720 | ) | (81,990 | ) | (66,073 | ) | ||||||
| Distributions on common stock | (42,439 | ) | (41,239 | ) | (41,050 | ) | ||||||
| Proceeds from sale of common stock | 80,609 | 74,916 | 30,917 | |||||||||
| Offering costs for issuance of common stock | (4,602 | ) | (4,568 | ) | (3,812 | ) | ||||||
| Distributions to noncontrolling interest holders | (4,591 | ) | (9,501 | ) | (5,599 | ) | ||||||
| Redemption of OP Unit holder interests | (2,750 | ) | (8,219 | ) | (6,405 | ) | ||||||
| Other financing activities | (6,055 | ) | (2,744 | ) | (6,206 | ) | ||||||
| Net cash used in financing activities | (178,643 | ) | (82,444 | ) | (171,530 | ) | ||||||
| NET INCREASE (DECREASE) IN CASH AND CASH EQUIVALENTS | 1,308 | (10,317 | ) | (12,094 | ) | |||||||
| CASH AND CASH EQUIVALENTS, beginning of period | 14,461 | 24,778 | 36,872 | |||||||||
| CASH AND CASH EQUIVALENTS, end of period | $ | 15,769 | $ | 14,461 | $ | 24,778 | ||||||
| Supplemental Disclosure of Cash Flow Information: | ||||||||||||
| Cash paid for interest | $ | 45,321 | $ | 58,330 | $ | 72,352 | ||||||
| Supplemental Disclosure of Noncash Investing and Financing Activities: | ||||||||||||
| Assumed mortgage | $ | 11,869 | $ | — | $ | 57,897 | ||||||
| Common stock issued pursuant to the distribution reinvestment plan | $ | 21,347 | $ | 20,831 | $ | 21,473 | ||||||
| Issuances of OP Units for beneficial interests | $ | 7,324 | $ | — | $ | — | ||||||
| Non-cash repayment of mortgage note and other secured borrowings* | $ | 139,236 | $ | 115,387 | $ | 285,756 | ||||||
| Non-cash disposition of real property* | $ | 128,008 | $ | 107,075 | $ | 225,409 | ||||||
| Non-cash principal collection on debt related investments* | $ | 11,228 | $ | 7,125 | $ | 46,183 | ||||||
| Non-cash investment in real property | $ | 11,869 | $ | 12,232 | $ | — | ||||||
| * | Represents the amount of sales proceeds and debt repayments from the disposition of real property or the repayment of borrowings that we did not receive or pay in cash, primarily due to the repayment or assumption of related borrowings by the purchaser or borrower at closing. |
The accompanying notes are an integral part of these consolidated financial statements.
| F-7 |
DIVIDEND CAPITAL DIVERSIFIED PROPERTY FUND INC.
NOTES TO CONSOLIDATED FINANCIAL STATEMENTS
December 31, 2015
| 1. | ORGANIZATION |
Dividend Capital Diversified Property Fund Inc. is a Maryland corporation formed on April 11, 2005 to invest in a diverse portfolio of real property and real estate related investments. As used herein, “the Company,” “we,” “our” and “us” refer to Dividend Capital Diversified Property Fund Inc. and its consolidated subsidiaries and partnerships except where the context otherwise requires.
We believe we have operated in such a manner as to qualify as a real estate investment trust (“REIT”) for federal income tax purposes, and we utilize an Umbrella Partnership Real Estate Investment Trust (“UPREIT”) organizational structure to hold all or substantially all of our assets through our operating partnership, Dividend Capital Total Realty Operating Partnership, L.P. (our “Operating Partnership”). Furthermore, our Operating Partnership wholly owns a taxable REIT subsidiary, DCTRT Leasing Corp. (the “TRS”), through which we have executed certain business transactions that might otherwise have an adverse impact on our status as a REIT if such business transactions were to occur directly or indirectly through our Operating Partnership.
We are the sole general partner of our Operating Partnership. In addition, we have contributed 100% of the proceeds received from our offerings of common stock to our Operating Partnership in exchange for partnership units (“OP Units”) representing our interest as a limited partner of the Operating Partnership.
Dividend Capital Total Advisors LLC (our “Advisor”), a related party, manages our day-to-day activities under the terms and conditions of an advisory agreement (as amended from time to time, the “Advisory Agreement”). Our Advisor and its affiliates receive various forms of compensation, reimbursements and fees for services relating to the investment and management of our real estate assets.
On July 12, 2012, the Securities and Exchange Commission (the “Commission”) declared effective our Registration Statement on Form S-11 (Registration Number 333-175989) (as amended, the “Prior Registration Statement”). The Prior Registration Statement applied to the offer and sale (the “Prior Offering”) of up to $3,000,000,000 of our shares of common stock, of which $2,250,000,000 of shares were expected to be offered to the public in a primary offering and $750,000,000 of shares were expected to be offered to our stockholders pursuant to an amended and restated distribution reinvestment plan (subject to our right to reallocate such amounts). In the Prior Offering, we offered to the public three classes of shares: Class A shares, Class W shares and Class I shares with net asset value (“NAV”) based pricing. See “Item 5. Market for Registrant’s Common Equity, Related Stockholder Matters and Issuer Purchases of Equity Securities” and Exhibit 99.1 of this Annual Report on Form 10-K for a description of our valuation procedures and valuation components, including important disclosure regarding real property valuations provided by Altus Group U.S., Inc., an independent valuation firm. Our independent registered public accounting firm does not audit our NAV. Selling commissions, dealer manager fees, and distribution fees are allocated to Class A shares, Class W shares, and Class I shares on a class-specific basis and differ for each class, even when the NAV of each class is the same. On September 15, 2015, we terminated the Prior Offering. Through September 15, 2015, the date our Prior Offering terminated, we had raised gross proceeds of approximately $183.0 million from the sale of approximately 25.8 million shares in the Prior Offering, including approximately $3.4 million through our distribution reinvestment plan.
On September 16, 2015, the Commission declared effective our Registration Statement on Form S-11 (Registration Number 333-197767) (the “Follow-On Registration Statement”). The Follow-On Registration Statement applies to the Company’s follow-on “best efforts” offering of up to $1,000,000,000 of the Company’s Class A, Class I and Class W shares of common stock, of which $750,000,000 of shares are expected to be offered to the public in a primary offering and $250,000,000 of shares are expected to be offered to stockholders of the Company pursuant to its distribution reinvestment plan (subject to the Company’s right to reallocate such amounts) (the “Follow-On Offering”). As of December 31, 2015, we had raised gross proceeds of approximately $13.7 million from the sale of approximately 1.8 million shares in the Follow-On Offering.
As of December 31, 2015, we had raised aggregate gross proceeds of approximately $196.7 million from the sale of approximately 27.6 million shares, including approximately $4.6 million raised through our distribution reinvestment plan. As of December 31, 2015, approximately $986.3 million in shares remained available for sale pursuant to the Follow-on Offering, including approximately $248.8 million in shares available for sale through our distribution reinvestment plan.
| F-8 |
We are offering to sell any combination of Class A shares, Class W shares and Class I shares with a dollar value up to the maximum offering amount pursuant to the Follow-On Offering. We also sell shares of our unclassified common stock, which we refer to as “Class E” shares, pursuant to our distribution reinvestment plan offering registered on our Registration Statement on Form S-3 (Registration Number 333-162636). In the event of a liquidation event, such assets, or the proceeds therefrom, will be distributed ratably in proportion to the respective NAV for each class until the NAV for each class has been paid. Other than differing allocable fees and liquidation rights, Class E shares, Class A shares, Class W shares, and Class I shares have identical rights and privileges.
| 2. | SUMMARY OF SIGNIFICANT ACCOUNTING POLICIES |
Principles of Consolidation
Due to our control of our Operating Partnership through our sole general partnership interest and the limited rights of the limited partners, we consolidate our Operating Partnership, and limited partner interests not held by us are reflected as noncontrolling interests in the accompanying consolidated financial statements (herein referred to as “financial statements”). All significant intercompany accounts and transactions have been eliminated in consolidation.
Our financial statements also include the accounts of our consolidated subsidiaries and joint ventures through which we are the primary beneficiary, when such subsidiaries and joint ventures are variable interest entities, or through which we have a controlling interest. In determining whether we have a controlling interest in a joint venture and the requirement to consolidate the accounts of that entity, we consider factors such as ownership interest, board representation, management representation, authority to make decisions, and contractual and substantive participating rights of the partners/members as well as whether the entity is a variable interest entity in which we have the power to direct the activities that most significantly impact the entity’s economic performance and the obligation to absorb losses that could potentially be significant to the entity or the right to receive benefits that could potentially be significant to the entity.
All joint ventures in which we have investments are variable interest entities. All of our investments in joint ventures represent our interests in real estate partnerships, formed for the purpose of acquiring, leasing, managing, holding for investment, selling and otherwise dealing with real property investments. Our involvement with our joint ventures affects our financial position, financial performance and cash flows in ways similar to direct ownership of real property investment. We own a significantly disproportionate majority of the ownership interests of our joint ventures. In each of our joint ventures, our joint venture partner performs the day-to-day management of the real properties owned by the respective joint ventures. However, in each of our joint ventures, we approve the activities that most significantly impact the joint venture’s economic performance. Due to our substantive approval rights and our exposure to the economic returns and losses of each of the joint ventures, we are the primary beneficiary of each of our joint ventures. Based on these considerations, we consolidate all of our investments in joint ventures. See our consolidated balance sheets for disclosure of the amount of real property and mortgage note borrowings that we consolidated through our investments in variable interest entities as of December 31, 2015 and 2014.
Judgments made by us with respect to our level of influence or control of an entity and whether we are the primary beneficiary of a variable interest entity involve consideration of various factors, including the form of our ownership interest, the size of our investment (including loans), our ability to direct the activities of the entity, and our obligation to absorb the losses of, or, our right to receive benefits from the entity. Our ability to correctly assess our influence or control over an entity affects the presentation of these investments in our financial statements and, consequently, our financial position and specific items in our results of operations that are used by our stockholders, lenders and others in their evaluation of us. The maximum risk of loss related to our investment in these consolidated variable interest entities is limited to our recorded investments in such entities. The creditors of the consolidated variable interest entities do not have recourse to our general credit.
Generally, we consolidate real estate partnerships and other entities that are not variable interest entities when we own, directly or indirectly, a majority voting interest in the entity.
Reclassifications
Certain amounts included in the accompanying financial statements for 2014 and 2013 have been reclassified to conform to the 2015 financial statement presentation with no effect on previously reported net income (loss) or equity. We reclassified certain third-party payments related to efforts to acquire real properties that were not ultimately completed (“terminated acquisition costs”) incurred during the years ended December 31, 2014 and 2013 from “general and administrative expenses” into “acquisition-related expenses”, none of which are material.
| F-9 |
Balance sheet amounts for properties classified as held for sale have been reclassified as of December 31, 2014. Statements of income amounts for properties classified as discontinued operations have been reclassified for the years ended December 31, 2014 and 2013. After December 31, 2013, a discontinued operation is a component (or group of components) of the entity, the disposal of which would represent a strategic shift that has (or will have) a major effect on the entity’s operations and financial results, when such component (or group of components) have been disposed of or classified as held for sale. Through December 31, 2013, discontinued operations represent properties that we have either disposed of or have classified as held for sale if both the operations and cash flows of the property have been or will be eliminated from our ongoing operations as a result of the disposal transaction and if we will not have any significant continuing involvement in the operations of the property after the disposal transaction. Amounts in our segment and quarterly financial data disclosures in Notes 13 and 16 reflect the reclassification of amounts related to properties classified as discontinued operations as of December 31, 2014.
Investments
Real Property
Costs associated with the acquisition of real property, including acquisition fees paid to our Advisor, are expensed as incurred. In addition, we estimate the fair value of contingent consideration and contingencies related to acquisitions of real property in determining the total cost of the property acquired. Subsequent changes in the fair value of such contingent consideration are recorded either as a gain or loss in our consolidated statements of income. Contingencies are subsequently adjusted through the consolidated statements of income when new information becomes available indicating that settlement of a contingent liability is probable and can be estimated at an amount greater than the acquisition date fair value, or the contingency is resolved, in which case the contingent asset or liability is derecognized.
Costs associated with the development and improvement of our real property assets are capitalized as incurred. Costs incurred in making repairs and maintaining real estate assets are expensed as incurred. During the land development and construction periods, we capitalize interest costs, insurance, real estate taxes and certain general and administrative costs if such costs are incremental and identifiable to a specific activity to get the asset ready for its intended use. The results of operations for acquired real property are included in our accompanying statements of income from their respective acquisition dates.
Upon acquisition, the total cost of a property is allocated to land, building, building and land improvements, tenant improvements and intangible lease assets and liabilities. The purchase price allocation of the total cost to land, building, building improvements, tenant improvements, intangible lease assets and intangible lease liabilities is based on our estimate of the property’s as-if vacant fair value. The as-if vacant fair value is calculated by using all available information such as the replacement cost of such asset, appraisals, property condition reports, market data and other related information. The difference between the fair value and the face value of debt assumed in an acquisition is recorded as an adjustment to the purchase price allocation. The allocation of the total cost of a property to an intangible lease asset includes the value associated with the in-place leases, which may include lost rent, leasing commissions, tenant improvements, legal and other costs.
We record acquired “above-market” and “below-market” leases at their fair value equal to the difference between the contractual amounts to be paid pursuant to each in-place lease and our estimate of fair market lease rates for each corresponding in-place lease, measured over a period equal to the remaining term of the lease for above-market leases and the remaining term of the lease plus the term of any below-market fixed-rate renewal option periods for below-market leases. In addition, we allocate a portion of the purchase price of an acquired property to the estimated value of customer relationships, if any. As of December 31, 2015, we had not recognized any estimated value to customer relationships.
The following table summarizes the amounts that we have incurred in amortization expense for intangible lease assets and adjustments to rental revenue for above-market lease assets and below-market lease liabilities for the years ended December 31, 2015, 2014 and 2013 (amounts in thousands).
| For the Year Ended December 31, | ||||||||||||
| 2015 | 2014 | 2013 | ||||||||||
| Above-market lease assets | $ | (5,216 | ) | $ | (6,708 | ) | $ | (7,293 | ) | |||
| Below-market lease liabilities | 6,029 | 7,324 | 7,537 | |||||||||
| Net increase to rental revenue | $ | 813 | $ | 616 | $ | 244 | ||||||
| Intangible lease asset amortization | $ | (44,260 | ) | $ | (48,937 | ) | $ | (62,325 | ) | |||
We expense any unamortized intangible lease asset or record an adjustment to rental revenue for any unamortized above-market lease asset or below-market lease liability when a tenant terminates a lease before the stated lease expiration date. We recorded an insignificant amount of adjustments related to write-offs of unamortized intangible lease assets and liabilities due to early lease terminations during the years ended December 31, 2015, 2014 and 2013.
| F-10 |
Real property assets, including land, building, building and land improvements, tenant improvements, lease commissions, and intangible lease assets and liabilities are stated at historical cost less accumulated depreciation and amortization. Depreciation and amortization are computed on a straight-line basis over their estimated useful lives as described in the following table.
| Description | Depreciable Life | |
| Land | Not depreciated | |
| Building | 40 years | |
| Building and land improvements | 5-40 years | |
| Tenant improvements | Lesser of useful life or lease term | |
| Lease commissions | Over lease term | |
| Intangible in-place lease assets | Over lease term | |
| Above-market lease assets | Over lease term | |
| Below-market lease liabilities | Over lease term, including below-market fixed-rate renewal options |
The following table presents expected amortization during the next five years and thereafter related to the acquired above-market lease assets, below-market lease liabilities and acquired in-place lease intangibles, for properties owned as of December 31, 2015 (amounts in thousands).
| For the Year Ended December 31, | ||||||||||||||||||||||||||||
| 2016 | 2017 | 2018 | 2019 | 2020 | Thereafter | Total | ||||||||||||||||||||||
| Acquired above-market lease assets | $ | (5,098 | ) | $ | (2,505 | ) | $ | (729 | ) | $ | (643 | ) | $ | (248 | ) | $ | (698 | ) | $ | (9,921 | ) | |||||||
| Acquired below-market lease liabilities | 5,749 | 5,079 | 4,474 | 3,748 | 3,042 | 41,782 | 63,874 | |||||||||||||||||||||
| Net rental revenue increase | $ | 651 | $ | 2,574 | $ | 3,745 | $ | 3,105 | $ | 2,794 | $ | 41,084 | $ | 53,953 | ||||||||||||||
| Acquired in-place lease intangibles | $ | 45,472 | $ | 27,756 | $ | 16,721 | $ | 11,568 | $ | 6,649 | $ | 20,527 | $ | 128,693 | ||||||||||||||
Discontinued Operations and Held for Sale
Beginning with the year ended December 31, 2014, a discontinued operation is defined as a component (or group of components) of the entity, the disposal of which would represent a strategic shift that has (or will have) a major effect on the entity’s operations and financial results, when such a component (or group of components) has been disposed of or classified as held for sale. Through December 31, 2013, we present the results of operations and the respective aggregate net gains (losses) of any property or group of properties that were disposed or classified as held for sale as of the end of each year when the operations and cash flows have been (or will be) eliminated from our ongoing operations and we will not have any significant continuing involvement. Interest expense is included in discontinued operations only if it is directly attributable to these operations or properties. The results of operations of properties that have been classified as discontinued operations are reported as discontinued operations for all periods presented. We classify real property as held for sale when our management commits to a plan to sell the property, the plan has appropriate approvals, the sale of the property is probable, and certain other criteria are met. At such time, the respective assets and liabilities are presented separately on our balance sheets and depreciation is no longer recognized. Assets held for sale are reported at the lower of their carrying amount or their estimated fair value less the costs to sell the assets. We recognize an impairment loss for assets held for sale if the current net book value of the property exceeds its fair value less selling costs. As of December 31, 2014 and 2013, one and 12 of our properties were classified as held for sale, respectively.
Debt Related Investments
Debt related investments are considered to be held for investment, as we have both the intent and ability to hold these investments until maturity. Accordingly, these assets are carried at cost, net of unamortized loan origination costs and fees, discounts, repayments and unfunded commitments unless such loans or investments are deemed to be impaired.
Revenue Recognition
Revenue Recognition — Real Property
We record rental revenue for the full term of each lease on a straight-line basis. Certain properties have leases that offer the tenant a period of time where no rent is due or where rent payments increase during the term of the lease. Accordingly, we record a receivable from tenants for rent that we expect to collect over the remaining lease term rather than currently, which is recorded as straight-line rents receivable. When we acquire a property, the term of existing leases is considered to commence as of the acquisition date for purposes of this calculation. Tenant recovery income includes payments from tenants for real estate taxes, insurance and other property operating expenses and is recognized as rental revenue.
| F-11 |
The following table summarizes straight-line rental adjustments and tenant recovery income received from tenants for real estate taxes, insurance and other property operating expenses and recognized as rental revenue for the years ended December 31, 2015, 2014, and 2013 (amounts in thousands):
| For the Year Ended December 31, | ||||||||||||
| 2015 | 2014 | 2013 | ||||||||||
| Straight-line rent adjustments | $ | (976 | ) | $ | 3,037 | $ | 8,864 | |||||
| Tenant recovery income (1) | $ | 37,526 | $ | 31,092 | $ | 33,029 | ||||||
| (1) | Tenant recovery income excludes real estate taxes that were paid directly by our tenants that are subject to triple net lease contracts. Such payments totaled approximately $7.0 million, $12.4 million and $12.6 million during the years ended December 31, 2015, 2014, and 2013, respectively. |
Impairment
Impairment — Real Property
We review our investments in real property individually on a quarterly basis, and more frequently when such an evaluation is warranted, to determine their appropriate classification, as well as whether there are indicators of impairment. The investments in real property are either classified as held and used or held for sale.
As of December 31, 2015, all of our properties were classified as held and used. The held and used assets are reviewed for indicators of impairment, which may include, among others, vacancy, each tenant’s inability to make rent payments, operating losses or negative operating trends at the property level, notification by a tenant that it will not renew its lease, a decision to dispose of a property, including a change in estimated holding periods, or adverse changes in the fair value of any of our properties. If indicators of impairment exist on a held and used asset, we compare the future estimated undiscounted cash flows from the expected use of the property to its net book value to determine if impairment exists. If the sum of the future estimated undiscounted cash flows is greater than the current net book value, we conclude no impairment exists. If the sum of the future estimated undiscounted cash flows is less than its current net book value, we recognize an impairment loss for the difference between the net book value of the property and its estimated fair value. If a property is classified as held for sale, we recognize an impairment loss if the current net book value of the property exceeds its fair value less selling costs. If our assumptions, projections or estimates regarding a property change in the future, we may have to record an impairment charge to reduce or further reduce the net book value of the property. See Note 3 for a discussion of impairment charges relating to our real properties recorded during the years ended December 31, 2015, 2014, and 2013.
Impairment — Debt Related Investments
We review our debt related investments on a quarterly basis, and more frequently when such an evaluation is warranted, to determine if impairment exists. Accordingly, we do not group our debt related investments into classes by credit quality indicator. A debt related investment is impaired when, based on current information and events (including economic, industry and geographical factors), it is probable that we will be unable to collect all amounts due, both principal and interest, according to the contractual terms of the agreement. When an investment is deemed impaired, the impairment is measured based on the expected future cash flows discounted at the investment’s effective interest rate. As a practical expedient, the Financial Accounting Standards Board (the “FASB”) issued ASC Topic 310, Receivables, which permits a creditor to measure impairment based on the fair value of the collateral of an impaired collateral-dependent debt related investment or to measure impairment based on an observable market price for the impaired debt related investment as an alternative to discounting expected future cash flows. Regardless of the measurement method, a creditor should measure impairment based on the fair value of the collateral when the creditor determines that foreclosure is probable. A debt related investment is also considered impaired if its terms are modified in a troubled debt restructuring (“TDR”). A TDR occurs when we grant a concession to a borrower in financial difficulty by modifying the original terms of the loan. Impairments on TDR loans are generally measured based on the present value of expected future cash flows discounted at the effective interest rate of the original loan. See Note 4 for a discussion of impairment charges relating to our debt related investments recorded during the years ended December 31, 2015, 2014, and 2013.
Derivative Instruments and Hedging Activities
We record all derivative instruments in the accompanying balance sheets at fair value. Accounting for changes in the fair value of a derivative instrument depends on the intended use of the derivative instrument and the designation of the derivative instrument. Derivative instruments used to hedge exposure to changes in the fair value of an asset, liability, or firm commitments attributable to a particular risk, such as interest rate risk, are considered “fair value” hedges. Derivative instruments used to hedge exposure to variability in expected future cash flows, such as future interest payments, or other types of forecasted transactions, are considered “cash flow” hedges. We do not have any fair value hedges.
| F-12 |
For derivative instruments designated as cash flow hedges, the changes in the fair value of the derivative instrument that represent changes in expected future cash flows, which are effectively hedged by the derivative instrument, are initially reported as other comprehensive income (loss) in the statement of equity until the derivative instrument is settled. Upon settlement, the effective portion of the hedge is recognized as other comprehensive income (loss) and amortized over the term of the designated cash flow or transaction the derivative instrument was intended to hedge. The change in value of any derivative instrument that is deemed to be ineffective is charged directly to earnings when the determination of hedge ineffectiveness is made. We assess the effectiveness of each hedging relationship by comparing the changes in fair value or cash flows of the derivative instrument with the changes in fair value or cash flows of the designated hedged item or transaction. For purposes of determining hedge ineffectiveness, management estimates the timing and potential amount of future fixed-rate debt issuances each quarter in order to estimate the cash flows of the designated hedged item or transaction. Management considers the likelihood of the timing and amount of entering into such forecasted transactions when determining the expected future fixed-rate debt issuances. We do not use derivative instruments for trading or speculative purposes. We classify cash paid to settle our forward starting swaps as financing activities in our statements of cash flows.
Cash and Cash Equivalents
Cash and cash equivalents consist of cash on hand and highly liquid investments with original maturities of three months or less such as money market mutual funds or certificates of deposits. As of both December 31, 2015 and 2014, we have not realized any losses in such cash accounts or investments and believe that we are not exposed to any significant credit risk.
Restricted Cash
Restricted cash consists primarily of lender and property-related escrow accounts. As of both December 31, 2015 and 2014, we had not realized any losses in such restricted cash accounts or investments related to, and believe that we are not exposed to, any significant credit risk.
Collectability of Receivables
We evaluate the collectability of our rent and other receivables on a regular basis based on factors including, among others, payment history, the financial strength of the tenant or borrower and any guarantors. Specifically with regards to our debt related investments, we evaluate the collectability of our receivables based on factors including, among others, the value of the underlying collateral, the operations and operating trends of the underlying collateral, if any, the asset type and current economic conditions. If our evaluation of these factors indicates we may not recover the full amount of the receivable, we provide a reserve against the portion of the receivable that we estimate may not be recovered. This analysis requires us to determine whether there are factors indicating a receivable may not be fully collectible and to estimate the amount of the receivable that may not be collected. As of December 31, 2015 and 2014, we had rent and other receivables of approximately $34.1 million and $48.3 million included in the caption other assets in our accompanying balance sheets, respectively, related to which we recorded allowances of approximately $628,000 and $261,000 included in the caption other assets, respectively. If our assumptions or estimates regarding the collectability of a receivable change in the future, we may have to record allowances to reduce or further reduce the carrying value of the receivable.
Accumulated Other Comprehensive Loss
Accumulated other comprehensive loss as reported in the accompanying statements of equity primarily consists of the cumulative loss related to our derivatives of $9.1 million, before attribution to noncontrolling interests of $877,000, and cumulative gain related to our real estate securities of approximately $200,000, before attribution of a cumulative loss to noncontrolling interests of $1.2 million.
Basic and Diluted Net Income (Loss) per Common Share
Basic net income (loss) per common share is determined by dividing net income (loss) attributable to common stockholders by the weighted average number of common shares outstanding during the period. Diluted net income (loss) per common share includes the effects of potentially issuable common stock, but only if dilutive, including the presumed exchange of OP Units.
| F-13 |
Stock-Based Compensation
Independent Director RSU Awards
On December 5, 2013, our board of directors approved revised compensation for our independent directors. In connection with the revised compensation plan, at each annual meeting of stockholders the independent directors will automatically, upon election, receive an award of restricted stock units (“RSUs”) with respect to Class I shares of our common stock, with the number of RSUs based on the NAV per Class I share as of the end of the day of the annual meeting. RSUs granted under this plan are measured at fair value on the grant date and amortized to compensation expense on a straight-line basis over the service period after which the awards fully vest. Such expense is included in “general and administrative expenses” in our Consolidated Statements of Income. The fair value of these awards is measured at our NAV per share. RSUs awarded to our independent directors vest no later than one year from the date of grant.
Advisor RSU Agreements
We have entered into Restricted Stock Unit Agreements (the “Advisor RSU Agreements”) with our Advisor. The purposes of the Advisor RSU Agreements are to promote an alignment of interests among our stockholders, our Advisor and the personnel of our Advisor and its affiliates, and to promote retention of the personnel of our Advisor and its affiliates. Each restricted stock unit granted pursuant to the Advisor RSU Agreements (the “Company RSU”) will, upon vesting, entitle our Advisor to one Class I share of our common stock. The Advisor is expected to redistribute a significant portion of the Company RSUs and/or shares to senior level employees of our Advisor and its affiliates that provide services to us, although the terms of such redistributions (including the timing, amount and recipients) remain solely in the discretion of our Advisor. The Company RSUs are subject to specified vesting and settlement provisions and, upon settlement in Class I shares of Company common stock, require offsets of advisory fees and expenses otherwise payable from the Company to our Advisor. Each offset amount equals the number of Company RSUs vesting on such date multiplied by the NAV per Class I share publicly disclosed by us as of the end of the grant date. Each offset amount is always calculated based on the grant date NAV per Class I share, even beyond the initial vesting date. At the end of each 12-month period following each vesting date, if the offset amount has not been fully realized by offsets from the cash payments otherwise due and payable to our Advisor under the Advisory Agreement, our Advisor shall promptly pay any shortfall to us.
If our board of directors declares and we pay a cash dividend on Class I shares for any period in which the Company RSUs are outstanding (regardless of whether such Company RSUs are then vested), our Advisor will be entitled to dividend equivalents (“Dividend Equivalents”) with respect to that cash dividend equal to the cash dividends that would have been payable on the same number of Class I shares as the number of Company RSUs subject to the Advisor RSU Agreements had such Class I shares been outstanding during the same portion of such period as the Company RSUs were outstanding. Any such Dividend Equivalents may be paid in cash or Class I shares, at our Advisor’s election. Accordingly, we classify Company RSUs as participating securities because participants receive dividends on unvested shares. We recognize all Company RSUs as outstanding common shares as of the grant date and record unvested dividends as dividends.
Restricted Stock Grants
Effective February 25, 2015 and March 4, 2014, we granted 49,263 and 44,793 restricted shares of Class I common stock, respectively, to certain employees of our Advisor and its affiliates, none of which are our named executive officers. Restricted stock grants are measured at fair value during the service period and recorded to compensation expense over the service period after which the grants fully vest. Such expense is included in “general and administrative expenses” in our Consolidated Statements of Income. The fair value of these awards is measured at our NAV per share as of the date the shares vest. During the years ended December 31, 2015 and 2014, we recorded approximately $188,000 and $125,000 within “general and administrative expenses” in our Consolidated Statements of Income, respectively. Our restricted stock generally vests ratably over a period of three to four years.
Dealer Manager and Distribution Fees
Dividend Capital Securities LLC, which we refer to as our “Dealer Manager,” distributes the shares of our common stock in our public offering on a “best efforts” basis. Our Dealer Manager coordinates our distribution effort and manages our relationships with participating broker-dealers and financial advisors and provides assistance in connection with compliance matters relating to marketing our public offering. Among other fees, we pay our Dealer Manager (i) a dealer manager fee which accrues daily in an amount equal to 1/365th of 0.6% of our NAV per share of Class A and Class W shares outstanding and an amount equal to 1/365th of 0.1% of our NAV per share of Class I shares outstanding on such day on a continuous basis, and (ii) a distribution fee which accrues daily in an amount equal to 1/365th of 0.5% of our NAV per share of Class A shares outstanding on such day on a continuous basis. We cease paying the dealer manager fee and distribution fee with respect to shares sold in the offering on the earlier to occur of the following: (i) a listing of the class of such shares on a national securities exchange, (ii) following the completion of an offering, total underwriting compensation in the offering equaling 10% of the gross proceeds from the primary portion of the respective offering, or (iii) such shares no longer being outstanding.
| F-14 |
We account for these dealer manager and distribution fees as a reduction in proceeds received from the sale of common stock. We recognize our obligation to pay such fees on a periodic basis, along with a corresponding reduction against the proceeds raised, as such fees become payable to our dealer manager pursuant to the terms of the dealer manager agreement. We record the net proceeds raised from the sale of common stock as equity as we sells such shares. However, we record the corresponding reduction to capital as dealer manager and distribution fees become contractually due to our Dealer Manager pursuant to the terms of the dealer manager agreement. The payment of dealer manager and distribution fees may extend several years after the sale of the related shares of common stock. See Note 11 for further discussion of dealer manager and distribution fees.
Use of Estimates
The preparation of the financial statements in conformity with accounting principles generally accepted in the United States (“GAAP”) requires management to make estimates and assumptions relating to the reported amounts of assets and liabilities and the disclosure of contingent assets and liabilities at the date of the financial statements, and the reported amounts of revenues and expenses during the reporting periods. Actual results could differ materially from those estimates. Estimates and assumptions are reviewed periodically and the effects of revisions are reflected in the periods they are determined to be necessary.
New Accounting Pronouncements
In January 2016, the FASB issued Accounting Standards Update 2016-01, which changes the accounting for equity investments, financial liabilities under the fair value option, and the presentation and disclosure requirements for financial instruments. The FASB also clarifies the guidance related to the valuation allowance assessment when recognizing deferred tax assets resulting from unrealized losses on available-for-sale debt securities. The guidance will be effective for annual reporting periods (including interim reporting periods within those periods) beginning after December 15, 2017. The guidance should be applied prospectively. Earlier application is permitted regarding the guidance on the presentation of the change in fair value of financial liabilities under the fair value option for financial statements that have not been issued. We do not anticipate the adoption will have a significant impact on our consolidated financial statements.
In September 2015, the FASB issued Accounting Standards Update 2015-16, which simplifies the accounting for adjustments made to provisional amounts recognized in a business combination. The guidance eliminates the requirement for an acquirer in a business combination to account for measurement-period adjustments retrospectively. Instead, the guidance requires that an acquirer recognize measurement-period adjustments during the period in which they determine the amounts, including the effect on earnings of any amounts they would have recorded in previous periods if the accounting had been completed at the acquisition date. The guidance will be effective for annual reporting periods (including interim reporting periods within those periods) beginning after December 15, 2015. The guidance should be applied prospectively to adjustments to provisional amounts that occur after the effective date with earlier application permitted for financial statements that have not been issued. We do not anticipate the adoption will have a significant impact on our consolidated financial statements.
In August 2015 and April 2015, the FASB issued Accounting Standards Update 2015-15 (“ASU 2015-15”) and Accounting Standards Update 2015-03 (“ASU 2015-03”), respectively, which simplify the presentation of debt issuance costs and clarify the guidance for presenting and measuring debt issuance costs related to line-of-credit arrangements. ASU 2015-03 requires that debt issuance costs related to a recognized debt liability be presented in the balance sheet as a direct deduction from the carrying amount of that debt liability, consistent with debt discounts. ASU 2015-15 permits an entity to defer and present debt issuance costs as an asset and subsequently amortize the deferred debt issuance costs ratably over the term of the line-of-credit arrangement, regardless of whether there are any outstanding borrowings on the line-of-credit arrangement. The recognition and measurement guidance for debt issuance costs is not affected by the guidance. Both ASU 2015-03 and ASU 2015-15 are effective for annual reporting periods (including interim reporting periods within those periods) beginning after December 15, 2015 and will require retrospective application. Early adoption is permitted for financial statements that have not been previously issued. We do not anticipate the adoption will have a significant impact on our consolidated financial statements.
In June 2015, the FASB issued Accounting Standards Update 2015-10 (“ASU 2015-10”), which (i) made technical corrections and improvements to ASC Topic 815, Derivatives and Hedging (“ASC Topic 815”), which became effective upon the issuance of ASU 2015-10, and (ii) made technical corrections and improvements to ASC Topic 820, Fair Value Measurement and Disclosures (“ASC Topic 820”), which is effective for annual reporting periods (including interim reporting periods within those periods) beginning after December 15, 2015, with early adoption permitted, including adoption in an interim period. We do not anticipate the adoption will have a significant impact on our consolidated financial statements.
| F-15 |
In February 2015, the FASB issued Accounting Standards Update 2015-02 (“ASU 2015-02”), Amendments to the Consolidation Analysis, which improves targeted areas of the consolidation guidance and reduces the number of consolidation models. The amendments in ASU 2015-02 are effective for annual and interim periods in fiscal years beginning after December 15, 2015, with early adoption permitted. We are currently evaluating the effect the guidance will have on our consolidated financial statements.
In May 2014, the FASB issued Accounting Standards Update 2014-09 (“ASU 2014-09”), which provides new guidance outlining a single comprehensive model for entities to use in accounting for revenue arising from contracts with customers that supersedes most current revenue recognition guidance. This guidance requires an entity to recognize revenue when it transfers promised goods or services to customers in an amount that reflects the consideration to which the entity expects to be entitled in exchange for those goods or services. Additionally, this guidance expands related disclosure requirements. The new guidance specifically excludes revenue associated with lease contracts. In June 2015, the FASB agreed to defer the effective date of this guidance for a year from the original effective date outlined in ASU 2014-09, and as a result, the guidance will be effective for annual reporting periods (including interim reporting periods within those periods) beginning after December 15, 2017 and will require full or modified retrospective application. Early adoption is permitted for annual reporting periods (including interim reporting periods within those periods) beginning after December 15, 2016. We do not anticipate the adoption will have a significant impact on our consolidated financial statements.
| 3. | INVESTMENTS IN REAL PROPERTY |
Currently, our consolidated investments in real property consist of investments in office, industrial and retail properties. The following tables summarize our consolidated investments in real property as of December 31, 2015 and 2014 (amounts in thousands):
| Real Property | Land | Building and Improvements | Intangible Lease Assets | Total Investment Amount | Intangible Lease Liabilities | Net Investment Amount | ||||||||||||||||||
| As of December 31, 2015: | ||||||||||||||||||||||||
| Office | $ | 203,889 | $ | 833,655 | $ | 310,629 | $ | 1,348,173 | $ | (18,923 | ) | $ | 1,329,250 | |||||||||||
| Industrial | 9,572 | 65,307 | 16,436 | 91,315 | (344 | ) | 90,971 | |||||||||||||||||
| Retail | 260,761 | 570,700 | 109,225 | 940,686 | (74,282 | ) | 866,404 | |||||||||||||||||
| Total gross book value | 474,222 | 1,469,662 | 436,290 | 2,380,174 | (93,549 | ) | 2,286,625 | |||||||||||||||||
| Accumulated depreciation/amortization | — | (208,281 | ) | (297,676 | ) | (505,957 | ) | 29,675 | (476,282 | ) | ||||||||||||||
| Total net book value | $ | 474,222 | $ | 1,261,381 | $ | 138,614 | $ | 1,874,217 | $ | (63,874 | ) | $ | 1,810,343 | |||||||||||
| As of December 31, 2014: | ||||||||||||||||||||||||
| Office (1) | $ | 238,505 | $ | 818,659 | $ | 359,057 | $ | 1,416,221 | $ | (21,535 | ) | $ | 1,394,686 | |||||||||||
| Industrial | 25,502 | 193,878 | 48,421 | 267,801 | (41,011 | ) | 226,790 | |||||||||||||||||
| Retail | 237,605 | 464,479 | 86,820 | 788,904 | (62,292 | ) | 726,612 | |||||||||||||||||
| Total gross book value | 501,612 | 1,477,016 | 494,298 | 2,472,926 | (124,838 | ) | 2,348,088 | |||||||||||||||||
| Accumulated depreciation/amortization | — | (204,165 | ) | (319,081 | ) | (523,246 | ) | 38,595 | (484,651 | ) | ||||||||||||||
| Total net book value | $ | 501,612 | $ | 1,272,851 | $ | 175,217 | $ | 1,949,680 | $ | (86,243 | ) | $ | 1,863,437 | |||||||||||
| (1) | Includes $4.1 million in land, $19.3 million in building and improvements, and $7.0 million in intangible lease assets before accumulated depreciation of $10.2 million, related to an office property classified as held for sale in the accompanying balance sheet as of December 31, 2014. |
| F-16 |
Acquisitions
The following table summarizes our acquisitions of real properties during the year ended December 31, 2015 (dollar amounts and square footage in thousands):
| Real Property | Property Type | Market | Number of Properties | Date of Acquisition | Acquired Ownership | Contract Price | Net Rentable Square Feet | Percent Leased at Acquisition | ||||||||||||||||
| Bank of America Tower | Office | South Florida | 1 | 12/11/15 | 100 | % | $ | 35,750 | 110 | 87 | % | |||||||||||||
| Yale Village | Retail | Tulsa, OK | 1 | 12/9/15 | 100 | % | 31,800 | 101 | 100 | % | ||||||||||||||
| Chester Springs | Retail | Northern New Jersey | 1 | 10/8/15 | 100 | % | 53,781 | 223 | 95 | % | ||||||||||||||
| Venture Corporate Center | Office | South Florida | 1 | 8/6/15 | 100 | % | 45,750 | 253 | 97 | % | ||||||||||||||
| Shenandoah | Retail | South Florida | 1 | 8/6/15 | 100 | % | 32,670 | 124 | 100 | % | ||||||||||||||
| City View | Office | Austin, TX | 1 | 4/24/15 | 100 | % | 68,750 | 274 | 99 | % | ||||||||||||||
| South Cape | Retail | Greater Boston (1) | 1 | 3/18/15 | 100 | % | 35,450 | 143 | 92 | % | ||||||||||||||
| Rialto | Office | Austin, TX | 1 | 1/15/15 | 100 | % | 37,300 | 155 | 94 | % | ||||||||||||||
| Total 2015 real property acquisitions | 8 | $ | 341,251 | 1,383 | 96 | % | ||||||||||||||||||
| (1) | Our Greater Boston market comprises the greater metro area around Boston, MA. As of December 31, 2015, properties in our Greater Boston market are located in the following states: Massachusetts, Connecticut, New Hampshire, and Rhode Island. |
The following table summarizes the allocations of the fair value of the real properties we acquired during the year ended December 31, 2015 to land, building and improvements, intangible lease assets, intangible lease liabilities, and mark-to-market adjustment on assumed debt (dollar amounts in thousands). We have not made any material adjustments related to these allocations.
Weighted-Average Amortization Period (Years) | ||||||||||||||||||||||||||||||||||||||||
| Real Property | Land | Building and Improvements | Intangible Lease Assets | Intangible Lease Liabilities | Mark-to-Market Adjustment on Assumed Debt | Total Fair Value | Prorations and Credits | Contract Price | Intangible Lease Assets | Intangible Lease Liabilities | ||||||||||||||||||||||||||||||
| Bank of America Tower | $ | 5,030 | $ | 25,202 | $ | 5,715 | $ | (337 | ) | $ | — | $ | 35,610 | $ | 140 | $ | 35,750 | 6.6 | 6.1 | |||||||||||||||||||||
| Yale Village | 3,492 | 23,750 | 6,905 | (2,347 | ) | — | 31,800 | — | 31,800 | 14.8 | 24.3 | |||||||||||||||||||||||||||||
| Chester Springs | 7,376 | 43,892 | 7,263 | (4,750 | ) | — | 53,781 | — | 53,781 | 4.8 | 19.0 | |||||||||||||||||||||||||||||
| Venture Corporate Center | 12,047 | 22,183 | 11,968 | (798 | ) | — | 45,400 | 350 | 45,750 | 6.3 | 6.1 | |||||||||||||||||||||||||||||
| Shenandoah | 10,501 | 22,959 | 4,438 | (4,294 | ) | (934 | ) | 32,670 | — | 32,670 | 13.0 | 18.9 | ||||||||||||||||||||||||||||
| City View | 4,606 | 55,868 | 9,382 | (1,543 | ) | — | 68,313 | 437 | 68,750 | 4.5 | 3.9 | |||||||||||||||||||||||||||||
| South Cape | 9,936 | 22,877 | 4,675 | (2,038 | ) | — | 35,450 | — | 35,450 | 7.9 | 23.8 | |||||||||||||||||||||||||||||
| Rialto | 5,094 | 26,740 | 5,751 | (447 | ) | — | 37,138 | 162 | 37,300 | 5.2 | 2.7 | |||||||||||||||||||||||||||||
| Total | $ | 58,082 | $ | 243,471 | $ | 56,097 | $ | (16,554 | ) | $ | (934 | ) | $ | 340,162 | $ | 1,089 | $ | 341,251 | ||||||||||||||||||||||
| F-17 |
Pro Forma Financial Information (Unaudited)
The table below includes the following for the years ended December 31, 2015 and 2014: (i) actual selected financial information for the 2015 acquisitions included in our consolidated statements of income; and (ii) pro forma selected financial information reflecting the 2015 acquisitions, as if the date of each acquisition had been January 1, 2014. The pro forma financial information is not intended to represent or be indicative of the Company’s consolidated financial results that would have been reported had the acquisitions been completed at the beginning of the comparable prior period presented and should not be taken as indicative of its future consolidated financial results (dollar amounts in thousands).
| For the Year Ended December 31, | ||||||||
| 2015 | 2014 | |||||||
| Actual: | ||||||||
| Total revenues | $ | 18,487 | $ | — | ||||
| Total rental expenses | 6,687 | — | ||||||
| NOI (1) | 11,800 | — | ||||||
| Net income before real estate depreciation and amortization expense | 9,263 | — | ||||||
| Real estate depreciation and amortization expense | 9,534 | — | ||||||
| Net loss | (271 | ) | — | |||||
| Pro Forma: | ||||||||
| Total revenues (2) | $ | 260,553 | $ | 265,069 | ||||
| Total rental expenses | 72,345 | 63,891 | ||||||
| NOI (1) | 188,208 | 201,178 | ||||||
| Net income before real estate depreciation and amortization expense | 238,877 | 139,480 | ||||||
| Real estate depreciation and amortization expense | 103,082 | 109,038 | ||||||
| Net income (3) | 135,795 | 30,442 | ||||||
| (1) | For a discussion as to why we view NOI to be an appropriate supplemental performance measure and a reconciliation to GAAP net income, refer to Note 13. |
| (2) | The pro forma total revenues were adjusted to include incremental revenue of approximately $35.4 million and $33.5 million in relation to the 2015 acquisitions for the years ended December 31, 2015 and 2014, respectively. |
| (3) | Acquisition-related expenses of approximately $2.4 million in relation to our 2015 acquisitions were excluded from the pro forma net income for the year ended December 31, 2015 and included in the pro forma net income for the year ended December 31, 2014, as if these expenses had been incurred as of January 1, 2014. |
Dispositions
On March 11, 2015, we completed the sale of a portfolio of 12 wholly owned office and industrial properties comprising approximately 2.7 million net rentable square feet (the “Portfolio”) to an unrelated third party, for a gross sales price of approximately $398.6 million. We incurred closing costs and fees of approximately $7.8 million upon the closing of this transaction, including approximately $4.0 million in advisory fees related to the disposition of real property paid to our Advisor. See Note 5 for information regarding financing related to the disposition of the Portfolio.
For the years ended December 31, 2015, 2014, and 2013, our consolidated statements of income include approximately $6.2 million, $33.7 million, and $34.2 million of aggregate revenue attributable to the Portfolio, respectively, and approximately $6.1 million, $33.1 million and $33.4 million of NOI attributable to the Portfolio, respectively.
| F-18 |
During 2015, 2014, and 2013 we disposed of the following properties (dollar amounts and square footage in thousands):
| Property Type | Market | Ownership | Net Rentable Square Feet | Percentage Leased | Disposition Date | Contract Sales Price | Gain (loss) on Sale | ||||||||||||||||||
| 2015 Dispositions: | |||||||||||||||||||||||||
| Retail | Greater Boston | 100 | % | 11 | 100 | % | 12/18/15 | $ | 1,625 | $ | 14 | ||||||||||||||
| Office | Silicon Valley, CA | 100 | % | 53 | 100 | % | 12/14/15 | 16,750 | 970 | ||||||||||||||||
| Land Parcel | Denver, CO | 100 | % | N/A | N/A | 8/12/15 | 7,577 | 1,701 | |||||||||||||||||
| Office | Los Angeles, CA | 100 | % | 111 | 0 | % | 7/20/15 | 12,549 | 2,866 | ||||||||||||||||
| Retail | Pittsburgh, PA | 100 | % | 103 | 93 | % | 5/5/15 | 12,500 | — | ||||||||||||||||
| Office and Industrial Portfolio (1) | Various (1) | 100 | % | 2,669 | 100 | % | 3/11/15 | 398,635 | 105,542 | ||||||||||||||||
| Office | Dallas, TX | 100 | % | 177 | 88 | % | 1/16/15 | 46,600 | 23,125 | ||||||||||||||||
| Total 2015 real property dispositions | 3,124 | 95 | % | $ | 496,236 | $ | 134,218 | ||||||||||||||||||
| 2014 Dispositions: | |||||||||||||||||||||||||
| Office | Denver, CO | 100 | % | 138 | 100 | % | 11/7/14 | $ | 9,100 | $ | 4,032 | ||||||||||||||
| Industrial (2) | Silicon Valley, CA | 100 | % | 177 | 41 | % | 10/15/14 | 13,579 | — | ||||||||||||||||
| Office | East Bay, CA | 100 | % | 60 | 0 | % | 6/13/14 | 5,700 | 2,755 | ||||||||||||||||
| Land Parcel | Denver, CO | 100 | % | N/A | N/A | 4/14/14 | 780 | 93 | |||||||||||||||||
| Office | Little Rock, AR | 100 | % | 102 | 100 | % | 2/25/14 | 19,550 | 1,350 | ||||||||||||||||
| Retail | Greater Boston | 100 | % | 110 | 0 | % | 2/18/14 | 6,750 | 2,276 | ||||||||||||||||
| Industrial Portfolio | Various (3) | 93 | % | 3,387 | 99 | % | 1/22/14 | 175,000 | 29,545 | ||||||||||||||||
| Total 2014 real property dispositions | 3,974 | 93 | % | $ | 230,459 | $ | 40,051 | ||||||||||||||||||
| 2013 Dispositions: | |||||||||||||||||||||||||
| Office | Chicago, IL | 100 | % | 100 | 100 | % | 10/15/13 | $ | 18,000 | $ | 5,580 | ||||||||||||||
| Office | Denver, CO | 100 | % | 133 | 98 | % | 9/13/13 | 58,100 | 10,233 | ||||||||||||||||
| Office | Denver, CO | 100 | % | 257 | 100 | % | 7/31/13 | 71,000 | 35,371 | ||||||||||||||||
| Office | Greater Boston | 100 | % | 132 | 100 | % | 6/6/13 | 25,500 | 6,734 | ||||||||||||||||
| Office (4) | Dallas, TX | 100 | % | 1,509 | 66 | % | 5/31/13 | 122,231 | 15,462 | ||||||||||||||||
| Industrial Portfolio | Various (5) | 96 | % | 1,918 | 98 | % | 5/10/13 | 85,935 | (311 | ) | |||||||||||||||
| Office | Dallas, TX | 100 | % | 62 | 100 | % | 1/13/13 | 8,500 | 1,217 | ||||||||||||||||
| Total 2013 real property dispositions | 4,111 | 86 | % | $ | 389,266 | $ | 74,286 | ||||||||||||||||||
| (1) | The Portfolio includes (i) six office properties comprising 1.1 million net rentable square feet located in the following markets: Los Angeles, CA (three properties, of which one disposed property was a single building from a two-building office property), Northern New Jersey, Miami, FL, and Dallas, TX, and (ii) six industrial properties comprising 1.6 million net rentable square feet located in the following markets: Los Angeles, CA, Dallas, TX, Cleveland, OH, Chicago, IL, Houston, TX, and Denver, CO. |
| (2) | On October 15, 2014, we disposed of a wholly owned industrial property comprising approximately 177,000 net rentable square feet in three buildings located in the Silicon Valley, CA market (“Lundy”). At the time of the disposition, the property had a net investment amount of approximately $13.1 million (after a $2.6 million impairment charge which we recorded during the fourth quarter of 2013). The property was transferred to the lender through a foreclosure sale which extinguished amounts due, including related principal of $13.6 million. |
| (3) | Industrial portfolio included 12 properties located in the following markets: Atlanta, GA, Central Pennsylvania, Cincinnati, OH, Columbus, OH, Dallas, TX, Indianapolis, IN, and Minneapolis/St. Paul, MN. |
| (4) | During the year ended December 31, 2012, we became the 100% owner of the titleholder of a 1.5 million square foot office property in the Dallas, TX market (“Comerica Bank Tower”), as the result of our foreclosure of a non-performing mezzanine loan for which such ownership interest had served as collateral. Comerica Bank Tower was subject to a mortgage note with a principal balance of $179.8 million as of the acquisition date bearing interest at 5.8%, which would have matured in January 2017. On September 10, 2012, we were notified that a receiver (the “Receiver”) had been appointed for the Comerica Bank Tower. As of March 31, 2013, the unpaid principal balance of this mortgage note was $177.4 million. On May 31, 2013, Comerica Bank Tower was sold by the Receiver pursuant to court order to a purchaser unaffiliated with us. Because of the outstanding principal balance of the mortgage note, we did not receive any proceeds from the sale of Comerica Bank Tower. |
| (5) | Industrial portfolio included seven properties located in the following markets: Philadelphia, PA, Sacramento, CA, Central Pennsylvania, Charlotte, NC, Atlanta, GA, and Chicago, IL. |
| F-19 |
Assets Held for Sale
We did not have any assets or related liabilities classified as held for sale as of December 31, 2015. As of December 31, 2014, we had agreed to dispose of a wholly owned office property comprising approximately 177,000 net rentable square feet in the Dallas, TX market to an unrelated third party. Accordingly, the assets and liabilities related to this property are classified as held for sale in the accompanying balance sheet as of December 31, 2014. We sold the property on January 16, 2015. The following table summarizes the carrying amounts of the major classes of assets and liabilities classified as held for sale as of December 31, 2014 (amounts in thousands):
| As of December 31, 2014 | ||||
| Land | $ | 4,075 | ||
| Building and improvements | 19,337 | |||
| Intangible lease assets | 7,005 | |||
| Accumulated depreciation | (10,163 | ) | ||
| Other assets, net | 1,673 | |||
| Assets held for sale | $ | 21,927 | ||
| Other liabilities | 1,880 | |||
| Liabilities related to assets held for sale | $ | 1,880 | ||
Discontinued Operations
We present the results of operations and the respective aggregate net gains (losses) of any property or group of properties that were disposed or classified as held for sale as of December 31, 2013, when the operations and cash flows have been (or will be) eliminated from our ongoing operations and we will not have any significant continuing involvement as discontinued operations in our accompanying statements of income. Beginning with the year ended December 31, 2014, as the result of adopting Accounting Standards Update 2014-08, Reporting Discontinued Operations and Disclosures of Disposals of Components of an Entity, issued by the FASB in April 2014, we present the results of operations and the respective aggregate net gains (losses) of any property or group of properties, the disposal of which would represent a strategic shift that has (or will have) a major effect on our operations and financial results, when such property (or group of properties) have been disposed of or classified as held for sale, as discontinued operations in our accompanying statements of income. Properties sold or classified as held for sale after December 31, 2013 are not classified as discontinued operations unless the sale or classification as held for sale meets the new accounting requirements.
We did not have any discontinued operations for the year ended December 31, 2015. Discontinued operations for the year ended December 31, 2014 include the results of operations and net gain on the disposition of 12 properties classified as held for sale as of December 31, 2013. Discontinued operations for the year ended December 31, 2013 include (i) the results of operations of the 13 properties disposed of during the year ended December 31, 2013, (ii) the results of operations of the 12 properties classified as held for sale as of December 31, 2013 and subsequently disposed of, and (iii) the aggregate net gain on dispositions recorded during the year ended December 31, 2013. The following table summarizes amounts recorded as discontinued operations for the years ended December 31, 2014 and 2013 (amounts in thousands):
| For the Year Ended December 31, | ||||||||
| 2014 | 2013 | |||||||
| Revenues | $ | 969 | $ | 39,023 | ||||
| Rental expense | (340 | ) | (14,020 | ) | ||||
| Real estate depreciation and amortization expense | — | (21,017 | ) | |||||
| Interest expense | (296 | ) | (12,662 | ) | ||||
| Other expenses | (8 | ) | (56 | ) | ||||
| Income (loss) from discontinued operations | 325 | (8,732 | ) | |||||
| Gain (Loss) on disposition | 29,679 | 74,286 | ||||||
| Discontinued operations | 30,004 | 65,554 | ||||||
| Discontinued operations attributable to noncontrolling interests | (4,462 | ) | (4,560 | ) | ||||
| Discontinued operations attributable to common stockholders | $ | 25,542 | $ | 60,994 | ||||
| F-20 |
Real Property Impairment
During the year ended December 31, 2015, we recorded a $6.5 million impairment charge related to a consolidated office property located in the Chicago, IL market, which we acquired in February 2007 and we hold through a joint venture in which we are not the managing partner. We have an 80% ownership interest in the office property. During the year ended December, 31, 2015, we began to consider possible disposition opportunities for this property. Such disposition opportunities caused us to significantly reduce our estimated holding period for this property. We recorded an impairment charge to reduce the net book value of the property to our estimate of its fair value. In addition, during the year ended December 31, 2015, we recorded approximately $1.6 million of impairment charges related to a wholly owned retail property that we acquired in May 2007 in the Pittsburgh, PA market, which was disposed of in May 2015 (“Mt. Nebo”). Mt. Nebo served as collateral for a cross-collateralized senior mortgage note that is also secured by two other retail properties. Prior to the disposition, the net book value of Mt. Nebo exceeded the contract sales price less the cost to sell by approximately $1.6 million. Accordingly, we recorded an impairment to reduce the net book value of the property to our estimate of its fair value less the cost to sell.
During the year ended December 31, 2014, we recorded a $9.5 million impairment related to Mt. Nebo. During the year ended December 31, 2014, we began to consider possible disposition opportunities for this property. Such disposition opportunities caused us to significantly reduce our estimated holding period for this property. As a result of our review and based on our estimate of future cash flow and fair value of the retail property, we recognized the impairment charge to adjust the carrying value to our estimate of fair value as of December 31, 2014.
During the year ended December 31, 2013, we recorded approximately a $2.6 million impairment charge related to a wholly-owned industrial property that we acquired in September 2006 in the Silicon Valley, CA market, which was disposed of in October 2014. During the year ended December 31, 2013, we determined that this industrial property was unlikely to generate cash flows during our estimated investment period sufficient to recover our net book basis as of December 31, 2013. The primary factor leading to this determination was our determination that the market rental rate we could obtain, and the low demand for industrial space in the particular sub market in which the building was located, did not support our recorded carrying value. As a result of our review and based on our estimate of future cash flow and fair value of the office property, we recognized the impairment charge to adjust the carrying value to our estimate of fair value as of December 31, 2013.
In the calculation of our daily NAV, our real estate assets are carried at fair value using valuation methodologies consistent with ASC Topic 820. As a result, the timing of valuation changes recorded in our NAV will not necessarily be the same as for impairment charges recorded to our consolidated financial statements prepared pursuant to GAAP. Since we determine our NAV daily, impairment charges pursuant to GAAP will likely always be delayed and potentially significantly delayed compared to the change in fair value of our properties included in the calculation of our daily NAV.
Future Minimum Rentals
Future minimum rentals to be received under non-cancelable operating and ground leases in effect as of December 31, 2015, are as follows (amounts in thousands):
| For the Year Ended December 31, | Future Minimum Rentals | |||
| 2016 | $ | 183,489 | ||
| 2017 | 141,830 | |||
| 2018 | 118,680 | |||
| 2019 | 103,909 | |||
| 2020 | 72,457 | |||
| Thereafter | 191,084 | |||
| Total | $ | 811,449 | ||
The table above does not reflect future rental revenues from the potential renewal or replacement of existing and future leases and excludes property operating expense reimbursements and assumes no early termination of leases.
| F-21 |
Concentration of Credit Risk
Concentration of credit risk with respect to our sources of revenue currently exists due to a number of tenants whose rental payments to us make up a relatively high percentage of our rental revenue. Rental revenue from our lease with Charles Schwab & Co., Inc., as master tenant of one of our office properties, represented approximately $25.9 million, or 11.5%, of our total revenue from continuing operations for the year ended December 31, 2015. The following is a summary of amounts related to the top five tenants based on annualized base rent, as of December 31, 2015 (dollar amounts and square feet in thousands):
| Tenant | Locations | Industry | Annualized Base Rent (1) | % of Total Annualized Base Rent | Square Feet | % of Total Portfolio Square Feet | ||||||||||||||||
| Charles Schwab & Co., Inc. | 2 | Securities, Commodities, Fin. Inv./Rel. Activities | $ | 23,408 | 12.8 | % | 602 | 6.6 | % | |||||||||||||
| Sybase | 1 | Publishing Information (except Internet) | 18,692 | 10.3 | % | 405 | 4.5 | % | ||||||||||||||
| Northrop Grumman (2) | 1 | Professional, Scientific and Technical Services | 15,901 | 8.7 | % | 575 | 6.3 | % | ||||||||||||||
| Stop & Shop | 16 | Food and Beverage Stores | 14,983 | 8.2 | % | 911 | 10.1 | % | ||||||||||||||
| Novo Nordisk | 1 | Chemical Manufacturing | 4,535 | 2.5 | % | 167 | 1.8 | % | ||||||||||||||
| 21 | $ | 77,519 | 42.5 | % | 2,660 | 29.3 | % | |||||||||||||||
| (1) | Annualized base rent represents the annualized monthly base rent of executed leases as of December 31, 2015. |
| (2) | Northrop Grumman exercised a purchase option to acquire the office property that they leased from us on February 18, 2016. As a result, Northrop Grumman is no longer our tenant. Prior to acquiring this property from us, Northrop Grumman’s lease would have expired in 2016. For a more detailed discussion of the purchase option and the related property disposition, see “Item 7. Management’s Discussion and Analysis of Financial Condition and Results of Operations—Subsequent Events” of this Annual Report on Form 10-K. |
Our properties in Massachusetts, New Jersey, California, and Texas accounted for approximately 18%, 18%, 13%, and 11%, respectively, of our total gross investment in real property portfolio as of December 31, 2015. A deterioration of general economic or other relevant conditions, changes in governmental laws and regulations, acts of nature, demographics or other factors in any of those states or the geographical region in which they are located could result in the loss of a tenant, a decrease in the demand for our properties and a decrease in our revenues from those markets, which in turn may have a disproportionate and material adverse effect on our results of operations and financial condition.
Third Party Purchase Options
“Harborside,” an office property located in Northern New Jersey, was subject to a purchase option held by a third party with an exercise price that we estimated to be approximately $239.4 million and an exercise date in May 2016. On August 5, 2015, we paid the option holder approximately $12.0 million to terminate the option. Such payment is included within capital expenditures in real property in the accompanying consolidated statements of cash flows. As a result, the option is no longer outstanding.
“Colshire,” an office property located in the Washington, DC area, was subject to a purchase option held by the tenant, Northrop Grumman, with an exercise price that we estimated to be approximately $158.4 million and an expiration date in March 2016. The tenant exercised the purchase option during January 2016, triggering a sale of the property to Northrop Grumman in February 2016. See “Item 1A. Risk Factors” of this Annual Report on Form 10-K for information regarding the cost basis of this office property as of December 31, 2015 and the NOI of the tenant for the year ended December 31, 2015.
| F-22 |
| 4. | DEBT RELATED INVESTMENTS |
As of December 31, 2015 and 2014, we had invested in three and 11 debt related investments, respectively. The weighted average maturity of our debt related investments structured as mortgage notes as of December 31, 2015 was 3.3 years, based on our recorded net investments. The following table describes our debt related income for the years ended December 31, 2015, 2014, and 2013 (dollar amounts in thousands):
| For the Year Ended December 31, | Weighted Average Yield as of | |||||||||||||||
| Investment Type | 2015 | 2014 | 2013 | December 31, 2015 (1) | ||||||||||||
| Mortgage notes (2) | $ | 5,136 | $ | 4,521 | $ | 8,726 | 6.1 | % | ||||||||
| B-notes | — | — | 51 | N/A | ||||||||||||
| Mezzanine debt (3) | 1,786 | 2,875 | 1,672 | N/A | ||||||||||||
| Total | $ | 6,922 | $ | 7,396 | $ | 10,449 | 6.1 | % | ||||||||
| (1) | Weighted average yield is calculated on an unlevered basis using the amount invested, current interest rates and accretion of premiums or discounts realized upon the initial investment for each investment type as of December 31, 2015. As of December 31, 2015, all of our debt related investments bear interest at fixed rates. |
| (2) | Six, three and four of our debt related investments structured as mortgage notes were repaid in full during the years ended December 31, 2015, 2014 and 2013, respectively. Amounts recorded include early repayment fees received and accelerated amortization of origination fees offset by accelerated amortization of deferred due diligence costs related to certain of these repayments. |
| (3) | Our debt related investment structured as a mezzanine loan was repaid in full during the year ended December 31, 2015. During the year ended December 31, 2015, amounts recorded were offset by accelerated amortization of deferred due diligence costs. |
The following table describes our debt related investment activity for the years ended December 31, 2015 and 2014 (amounts in thousands).
| Year Ended December 31, | ||||||||
| 2015 | 2014 | |||||||
| Investment in Debt Related Investments: | ||||||||
| Balance at January 1, | $ | 94,951 | $ | 123,935 | ||||
| Investments (1) | 3,465 | 2,924 | ||||||
| Principal repayments | (82,417 | ) | (31,177 | ) | ||||
| Amortization of deferred fees, costs, and discounts/premiums | (277 | ) | (731 | ) | ||||
| Balance at December 31, | $ | 15,722 | $ | 94,951 | ||||
| (1) | Investments include approximately $2.0 million and $2.9 million of accrued interest that was capitalized into the principal balance of our mezzanine debt investment during the years ended December 31, 2015 and 2014, respectively. |
Debt Related Investment and Repayment Activity
As of December 31, 2015, all of our debt related investments required both interest and principal payments on a monthly basis. We did not have any debt related investment that was subject to delinquent principal or interest payments. We are the senior lender in all of our debt related investments with respect to the underlying collateral. The following table summarizes our debt related investments as of December 31, 2015 (dollar amounts in thousands).
| Description | Region | Interest Rate Fixed or Variable | Interest Rate as of December 31, 2015 | Maturity Date | Face Amount of Debt (1) | Amount of Debt Related Investments | ||||||||||||||||
| Mortgage note | Northeast | Fixed | 6.2 | % | 11/1/17 | $ | 3,691 | $ | 3,721 | |||||||||||||
| Mortgage note | Southeast | Fixed | 7.0 | % | 3/1/19 | 8,729 | 8,827 | |||||||||||||||
| Mortgage note | Mountain | Fixed | 5.2 | % | 3/1/21 | 3,189 | 3,174 | |||||||||||||||
| Total/weighted average | 6.4 | % | $ | 15,609 | $ | 15,722 | ||||||||||||||||
| (1) | Reflects the principal amount of the debt investment outstanding, which is net of principal repayments. |
| F-23 |
Impairment
As of December 31, 2014, we had one impaired debt related investment with an unpaid principal balance of approximately $3.0 million, for which we have a full valuation allowance. Based on our review during the year ended December 31, 2015, we determined that the impaired debt related investment did not have any value and therefore we recorded a direct write-off of the allowance for loan loss of $3.0 million.
We did not have any debt related investments on non-accrual status as of December 31, 2015. We had one B-note debt related investment on non-accrual status as of December 31, 2014. We had recorded a complete allowance for loan loss related to the debt related investment on non-accrual status as of December 31, 2014 and have recorded a direct write-off of the full amount of the allowance for loan loss during the year ended December 31, 2015.
We did not record any interest income related to our impaired debt related investment during the years ended December 31, 2015 or 2014. During the year ended December 31, 2013, we recorded interest income of approximately $51,000 from our impaired debt related investments, which had an average recorded investment amount of approximately $6.1 million over that period.
| 5. | DEBT OBLIGATIONS |
The following table describes our borrowings as of December 31, 2015 and 2014 (dollar amounts in thousands):
| Weighted Average Stated Interest Rate as of December 31, | Outstanding Balance as of December 31, (1) | Gross Investment Amount Securing Borrowings as of December 31, (2) | ||||||||||||||||||||||
| 2015 | 2014 | 2015 | 2014 | 2015 | 2014 | |||||||||||||||||||
| Fixed-rate mortgages | 5.6 | % | 5.8 | % | $ | 579,196 | $ | 807,994 | $ | 1,016,560 | $ | 1,625,637 | ||||||||||||
| Floating-rate mortgages (3) | 3.4 | % | 3.2 | % | 7,890 | 8,250 | 16,618 | 16,118 | ||||||||||||||||
| Total mortgage notes | 5.5 | % | 5.8 | % | 587,086 | 816,244 | 1,033,178 | 1,641,755 | ||||||||||||||||
| Repurchase facilities (4) | N/A | 2.8 | % | — | 37,023 | — | 51,156 | |||||||||||||||||
| Total secured borrowings | 5.5 | % | 5.6 | % | 587,086 | 853,267 | 1,033,178 | 1,692,911 | ||||||||||||||||
| Line of credit (5) | 1.9 | % | 2.6 | % | 167,000 | 75,000 | N/A | N/A | ||||||||||||||||
| Term loans (6) | 2.6 | % | 2.7 | % | 350,000 | 270,000 | N/A | N/A | ||||||||||||||||
| Total unsecured borrowings | 2.4 | % | 2.7 | % | 517,000 | 345,000 | N/A | N/A | ||||||||||||||||
| Total borrowings | 4.1 | % | 4.8 | % | $ | 1,104,086 | $ | 1,198,267 | N/A | N/A | ||||||||||||||
| (1) | Amounts are net of (i) unamortized premiums to the face value of our outstanding fixed-rate mortgages of $1.3 million and $2.0 million as of December 31, 2015 and 2014, respectively, and (ii) GAAP principal amortization related to troubled debt restructurings of $3.1 million and $2.3 million as of December 31, 2015 and 2014, respectively. |
| (2) | “Gross Investment Amount” as used here and throughout this document represents the allocated gross basis of real property and debt related investments, after certain adjustments. Gross Investment Amount for real property (i) includes the effect of intangible lease liabilities, (ii) excludes accumulated depreciation and amortization, and (iii) includes the impact of impairments. Amounts reported for debt related investments represent our net accounting basis of the debt investments, which includes (i) unpaid principal balances, (ii) unamortized discounts, premiums, and deferred charges, and (iii) allowances for loan loss. |
| (3) | As of December 31, 2015 and 2014, our floating-rate mortgage note was subject to an interest rate spread of 3.00% over one-month LIBOR. |
| (4) | As of December 31, 2014, borrowings under our repurchase facility were subject to interest at a floating rate of 2.25% over one-month LIBOR. However, we had effectively fixed the interest rate of the borrowings using interest rate swaps at 2.84% for the term of the borrowings. |
| (5) | As of December 31, 2015 and 2014, borrowings under our line of credit were subject to interest at a floating rate of 1.40% and 1.75%, respectively, over one-month LIBOR. However, as of December 31, 2015, we had effectively fixed the interest rate of approximately $25.4 million of the total of $167.0 million in borrowings using interest rate swaps, resulting in a weighted average interest rate on the total line of credit of 1.88%. As of December 31, 2014, we had effectively fixed the interest rate of approximately $30.0 million of the total of $75.0 million in borrowings using interest rate swaps, resulting in a weighted average interest rate on the total line of credit of 2.56%. |
| (6) | As of December 31, 2015 and 2014, borrowings under our term loans were subject to interest at weighted average floating rates of 1.52% and 1.70%, respectively, over one-month LIBOR. However, we had effectively fixed the interest rates of the borrowings using interest rate swaps at 2.59% and 2.69% as of December 31, 2015 and 2014, respectively. |
As of December 31, 2015, 10 mortgage notes were interest-only and eight mortgage notes were fully amortizing with outstanding principal balances of approximately $343.8 million and $245.0 million, respectively. None of our mortgage notes are recourse to us.
Assumption and Defeasance of Mortgage Note
As discussed in Note 3, we completed the sale of the Portfolio on March 11, 2015. Upon the disposition of the Portfolio, the buyer assumed approximately $128.0 million of a mortgage note borrowing, which is scheduled to mature in July 2020 and bears interest at 5.46%. In addition, we were released of our obligations on $44.8 million of the mortgage note borrowing that was not assumed by the buyer through a defeasance process. Accordingly, we incurred defeasance costs of approximately $8.6 million, which are included within gain on sale of real property in the accompanying statements of income. Upon such defeasance, we derecognized the associated borrowing, which was assumed by an unrelated successor borrower.
| F-24 |
Recast of Credit Facility
On January 13, 2015, we amended and restated our $620 million senior unsecured term loan and revolving line of credit (the “Old Facility”) to provide for a $550 million senior unsecured term loan and revolving line of credit (the “Amended Facility”) with a syndicate of 14 lenders led by Bank of America, N.A., as Administrative Agent. The Amended Facility provides us with the ability from time to time to increase the size of the Amended Facility up to a total of $900 million less the amount of any prepayments under the term loan component of the Amended Facility, subject to receipt of lender commitments and other conditions. Because many members of the lending group participated as lenders in the Old Facility, the credit agreement for the Amended Facility is an amended and restated form of the credit agreement for the Old Facility.
The $550 million Amended Facility consists of a $400 million revolving credit facility (the “Revolving Credit Facility”) and a $150 million term loan (the “$150 Million Term Loan”). The Revolving Credit Facility contains a sublimit of $50 million for letters of credit and a sublimit of $50 million for swing line loans. The primary interest rate for the Revolving Credit Facility is based on LIBOR, plus a margin ranging from 1.40% to 2.30%, depending on our consolidated leverage ratio. The maturity date of the Revolving Credit Facility is January 31, 2019 and contains one 12-month extension option that we may exercise upon (i) payment of an extension fee equal to 0.15% of the sum of the amount outstanding under the Revolving Credit Facility and the unused portion of the Revolving Credit Facility at the time of the extension, and (ii) compliance with the other conditions set forth in the credit agreement. The primary interest rate within the $150 Million Term Loan is based on LIBOR, plus a margin ranging from 1.35% to 2.20%, depending on our consolidated leverage ratio. The maturity date of the $150 Million Term Loan is January 31, 2018 and contains two 12-month extension options that we may exercise upon (i) payment of an extension fee equal to 0.125% of the sum of the amount outstanding under the $150 Million Term Loan at the time of each extension, and (ii) compliance with the other conditions set forth in the credit agreement.
Borrowings under the Amended Facility are available for general business purposes including, but not limited to, refinancing of existing indebtedness and financing the acquisition of permitted investments, including commercial properties. Upon entering into the Amended Facility on January 13, 2015, we borrowed $280 million on the Revolving Credit Facility and $100 million on the $150 Million Term Loan. We primarily used the proceeds from the Amended Facility to repay $380 million of outstanding borrowings under the Old Facility.
Term Loan Credit Agreement
On February 27, 2015, we entered into a $200 million seven-year term loan credit agreement (the “$200 Million Term Loan”) with a syndicate of six lenders led by Wells Fargo Bank, National Association as Administrative Agent and Regions Bank as Syndication Agent. The primary interest rate within the $200 Million Term Loan is based on LIBOR, plus a margin ranging from 1.65% to 2.55%, depending on our consolidated leverage ratio. The maturity date of the $200 Million Term Loan is February 27, 2022 with no extension options.
Borrowings under the $200 Million Term Loan are available for general business purposes including, but not limited to financing the acquisition of permitted investments, including commercial properties.
As of December 31, 2015, we had outstanding borrowings of $167.0 million and $150.0 million, respectively, under the Revolving Credit Facility and $150 Million Term Loan components of the Amended Facility, respectively. As of December 31, 2015, we had outstanding borrowings of $200.0 million under the $200 Million Term Loan. As of December 31, 2015, the unused portion of our Revolving Credit Facility was approximately $230.8 million, all of which was available to us. As of December 31, 2015, we were in compliance with all the debt constraints under our credit facilities. As of December 31, 2014, we had outstanding borrowings of $270.0 million and $75.0 million under the term loan and revolving credit facility components of the Old Facility, respectively. As of December 31, 2014, the unused portion of the revolving credit facility component of the Old Facility was approximately $272.8 million, of which approximately $189.4 million was available for us to borrow due to covenant constraints under the revolving credit facility component of the Old Facility.
| F-25 |
Debt Maturities
The following table reflects our contractual debt maturities as of December 31, 2015, specifically our obligations under our mortgage notes and unsecured borrowings (dollar amounts in thousands):
| As of December 31, 2015 | |||||||||||||||||||||
| Mortgage Notes | Unsecured Borrowings | Total | |||||||||||||||||||
| Year Ending December 31, | Number of Borrowings Maturing | Outstanding Principal Balance (1) | Number of Borrowings Maturing | Outstanding Principal Balance (2) | Outstanding Principal Balance | ||||||||||||||||
| 2016 | 7 | $ | 286,679 | — | $ | — | $ | 286,679 | |||||||||||||
| 2017 | 6 | 206,660 | — | — | 206,660 | ||||||||||||||||
| 2018 | — | 1,762 | 1 | 150,000 | 151,762 | ||||||||||||||||
| 2019 | — | 1,869 | 1 | 167,000 | 168,869 | ||||||||||||||||
| 2020 | — | 1,982 | — | — | 1,982 | ||||||||||||||||
| 2021 | 1 | 10,825 | — | — | 10,825 | ||||||||||||||||
| 2022 | 1 | 1,663 | 1 | 200,000 | 201,663 | ||||||||||||||||
| 2023 | — | 978 | — | — | 978 | ||||||||||||||||
| 2024 | — | 1,034 | — | — | 1,034 | ||||||||||||||||
| 2025 | 1 | 71,094 | — | — | 71,094 | ||||||||||||||||
| Thereafter | 2 | 4,303 | — | — | 4,303 | ||||||||||||||||
| Total | 18 | $ | 588,849 | 3 | $ | 517,000 | $ | 1,105,849 | |||||||||||||
| (1) | Outstanding principal balance represents expected cash outflows for contractual amortization and scheduled balloon payment maturities and does not include principal amortization of our restructured mortgage note of approximately $3.1 million that does not reduce the contractual amount due of the related mortgage note as of December 31, 2015, partially offset by the mark-to-market adjustment on assumed debt of $1.3 million as of December 31, 2015. |
| (2) | Unsecured borrowings presented include (i) borrowings under the $150 Million Term Loan of $150.0 million, which were scheduled to mature in 2018, subject to two one-year extension options, (ii) borrowings under the Revolving Credit Facility of $167.0 million, which were scheduled to mature in 2019, subject to a one-year extension option, and (iii) borrowings under the $200 Million Term Loan of $200.0 million which are scheduled to mature in 2022 with no extension options. |
| 6. | DERIVATIVES AND HEDGING ACTIVITIES |
Risk Management Objective of Using Derivatives
We maintain risk management control systems to monitor interest rate risk attributable to both our outstanding and forecasted debt obligations. We generally seek to limit the impact of interest rate changes on earnings and cash flows by selectively utilizing derivative instruments to hedge exposures to changes in interest rates on our unsecured floating rate borrowings. While this hedging strategy is designed to minimize the impact on our net income (loss) and cash provided by operating activities from changes in interest rates, the overall returns on our investments may be reduced. Our board of directors has established policies and procedures regarding our use of derivative instruments for hedging or other purposes to achieve these risk management objectives.
Cash Flow Hedges of Interest Rate Risk
Our objectives in using interest rate derivatives are to add stability to interest expense and to manage our exposure to interest rate movements. To accomplish this objective, we primarily use interest rate swaps as part of our interest rate risk management strategy. Interest rate swaps designated as cash flow hedges involve the receipt of variable-rate amounts from counterparties in exchange for us making fixed-rate payments over the life of the agreements without exchange of the underlying notional amounts. We have entered into and plan to enter into certain interest rate derivatives with the goal of mitigating our exposure to adverse fluctuations in the interest payments on our one-month LIBOR-indexed debt. Certain of our floating rate borrowings are not hedged and therefore, to an extent, we have ongoing exposure to interest rate movements.
| F-26 |
The effective portion of changes in the fair value of derivatives designated and that qualify as cash flow hedges under ASC Topic 815 is recorded in accumulated other comprehensive income (loss) and is subsequently reclassified into earnings in the period that the hedged forecasted transaction affects earnings. During the next 12 months, we estimate that approximately $1.6 million will be reclassified as an increase to interest expense related to active effective hedges of existing floating-rate debt, and we estimate that approximately $1.9 million will be reclassified as an increase to interest expense related to effective forward started interest rate swaps where the hedging instrument has been terminated. The ineffective portion of the change in fair value of the derivatives is recognized directly in earnings. The table below presents a reconciliation of the beginning and ending balances, between December 31, 2014 and December 31, 2015, of our accumulated other comprehensive loss (“OCI”), net of amounts attributable to noncontrolling interests, related to the effective portion of our cash flow hedges as presented on our consolidated financial statements, as well as amounts related to our available-for-sale securities (amounts in thousands):
| (Losses) and Gains on Cash Flow Hedges | Unrealized (Losses) and Gains on Available-For-Sale Securities | Accumulated Other Comprehensive Loss | ||||||||||
| Beginning balance as of December 31, 2014: | $ | (9,069 | ) | $ | (1,051 | ) | $ | (10,120 | ) | |||
| Other comprehensive income: | ||||||||||||
| Amount of loss reclassified from OCI into interest expense (effective portion) (net of tax benefit of $0) | 4,820 | — | 4,820 | |||||||||
| Change in fair value recognized in OCI (effective portion) (net of tax benefit of $0) | (5,797 | ) | — | (5,797 | ) | |||||||
| Net current-period other comprehensive income | (977 | ) | — | (977 | ) | |||||||
| Attribution of and other adjustments to OCI attributable to noncontrolling interests | 79 | 4 | 83 | |||||||||
| Ending balance as of December 31, 2015 | $ | (9,967 | ) | $ | (1,047 | ) | $ | (11,014 | ) | |||
Fair Values of Derivative Instruments
The majority of the inputs used to value our derivative instruments fall within Level 2 of the fair value hierarchy. However, the credit valuation adjustments associated with our derivative instruments utilize Level 3 inputs, such as estimates of current credit spreads, to evaluate the likelihood of potential default by us and our counterparties. As of December 31, 2015, we had assessed the significance of the impact of the credit valuation adjustments and had determined that it was not significant to the overall valuation of our derivative instruments. As a result, we have determined that our derivative valuations are classified in Level 2 of the fair value hierarchy.
Designated Derivatives
As of December 31, 2015 and 2014, we had 12 and 11 outstanding interest rate swaps, respectively, that were designated as cash flow hedges of interest rate risk, with a total notional amount of $375.4 million and $339.2 million, respectively. In addition, as of December 31, 2015, we had (i) two interest rate swaps with a total notional amount of $100.0 million that will become effective in December 2016 and mature in January 2020 and (ii) two interest rate swaps with a total notional amount of $100.0 million that will become effective in December 2016 and mature in February 2022, all of which were designated as cash flow hedges of interest rate risk.
The table below presents the gross fair value of our designated derivative financial instruments as well as their classification on our accompanying consolidated balance sheets as of December 31, 2015 and 2014 (amounts in thousands):
| Fair Value of Asset Derivatives as of | Fair Value of Liability Derivatives as of | |||||||||||||||||||
| Balance Sheet | December 31, | December 31, | Balance Sheet | December 31, | December 31, | |||||||||||||||
| Location | 2015 | 2014 | Location | 2015 | 2014 | |||||||||||||||
| Interest rate contracts | Other assets, net (1) | $ | 197 | $ | 543 | Other liabilities (1) | $ | (3,303 | ) | $ | (907 | ) | ||||||||
| Total derivatives | $ | 197 | $ | 543 | $ | (3,303 | ) | $ | (907 | ) | ||||||||||
| (1) | Although our derivative contracts are subject to master netting arrangements which serve as credit mitigants to both us and our counterparties under certain situations, we do not net our derivative fair values or any existing rights or obligations to cash collateral on the consolidated balance sheets. If we did net our derivative fair values on the consolidated balance sheets, the derivative fair values would be lowered by approximately $157,000 and $24,000 as of December 31, 2015 and 2014, respectively, resulting in net fair values of our asset derivatives of approximately $41,000 and $519,000 as of December 31, 2015 and 2014, respectively, and net fair values of our liability derivatives of approximately $3.1 million and $883,000 as of December 31, 2015 and 2014, respectively. |
| F-27 |
Non-Designated Derivatives
Derivatives not designated as hedges are not speculative and are used to hedge our exposure to interest rate movements and other identified risks but do not meet hedge accounting requirements. As of December 31, 2015, 2014, and 2013, we did not have any outstanding derivatives that were not designated as hedges.
Effect of Derivative Instruments on the Statements of Comprehensive Income
The table below presents the effect of our derivative financial instruments on our accompanying financial statements for the years ended December 31, 2015, 2014, and 2013 (amounts in thousands):
| For the Year Ended December 31, | ||||||||||||
| 2015 | 2014 | 2013 | ||||||||||
| Derivatives Designated as Hedging Instruments | ||||||||||||
| Derivative type | Interest rate contracts | Interest rate contracts | Interest rate contracts | |||||||||
| Amount of (loss) gain recognized in OCI (effective portion) | $ | (5,797 | ) | $ | (2,370 | ) | $ | 352 | ||||
| Location of loss reclassified from accumulated OCI into income (effective portion) | Interest expense | Interest expense | Interest expense | |||||||||
| Amount of loss reclassified from accumulated OCI into income (effective portion) | $ | 4,820 | $ | 3,091 | $ | 2,726 | ||||||
| Location of gain (loss) recognized in income (ineffective portion and amount excluded from effectiveness testing) | Interest and other income (expense) | Interest and other income (expense) | Loss on financing commitments | |||||||||
| Amount of gain (loss) recognized in income (ineffective portion and amount excluded from effectiveness testing) | $ | 3 | $ | (1 | ) | $ | (1,897 | ) | ||||
Credit-Risk-Related Contingent Features
We have agreements with certain of our derivative counterparties that contain a provision where we could be declared in default on our derivative obligations if repayment of the underlying indebtedness is accelerated by the lender due to our default on the indebtedness. We have agreements with certain other derivative counterparties that contain a provision whereby if we default on any of our indebtedness held by our Operating Partnership, including default where repayment of the indebtedness has not been accelerated by the lender, then we could also be declared in default on our derivative obligations.
As of December 31, 2015, the fair value of derivatives was in a net liability position of approximately $3.1 million, which included accrued interest but excluded any adjustment for nonperformance risk. As of December 31, 2015, we have not posted any collateral related to these agreements. If we had breached any of these provisions at December 31, 2015, we could have been required to settle our obligations under the agreements at their termination value of $3.1 million.
| 7. | FAIR VALUE DISCLOSURES |
ASC Topic 820, defines fair value, establishes a framework for measuring fair value, and expands disclosures about fair value measurements. ASC Topic 820 applies to reported balances that are required or permitted to be measured at fair value under existing accounting pronouncements; accordingly, the standard does not require any new fair value measurements of reported balances.
ASC Topic 820 emphasizes that fair value is a market-based measurement, not an entity-specific measurement. Therefore, a fair value measurement should be determined based on the assumptions that market participants would use in pricing the asset or liability. As a basis for considering market participant assumptions in fair value measurements, ASC Topic 820 establishes a fair value hierarchy that distinguishes between market participant assumptions based on market data obtained from sources independent of the reporting entity (observable inputs that are classified within Levels 1 and 2 of the hierarchy) and the reporting entity’s own assumptions about market participant assumptions (unobservable inputs classified within Level 3 of the hierarchy).
| F-28 |
Level 1 inputs utilize quoted prices (unadjusted) in active markets for identical assets or liabilities that we have the ability to access. Level 2 inputs are inputs other than quoted prices included in Level 1 that are observable for the asset or liability, either directly or indirectly. Level 2 inputs may include quoted prices for similar assets and liabilities in active markets, as well as inputs that are observable for the asset or liability (other than quoted prices), such as interest rates, foreign exchange rates, and yield curves that are observable at commonly quoted intervals. Level 3 inputs are unobservable inputs for the asset or liabilities, which are typically based on an entity’s own assumptions, as there is little, if any, related market activity. In instances where the determination of the fair value measurement is based on inputs from different levels of the fair value hierarchy, the level in the fair value hierarchy within which the entire fair value measurement falls is based on the lowest level input that is significant to the fair value measurement in its entirety. Our assessment of the significance of a particular input to the fair value measurement in its entirety requires judgment, and considers factors specific to the asset or liability.
The table below presents certain of our assets and liabilities measured at fair value on a recurring basis as of December 31, 2015 and 2014, aggregated by the level in the fair value hierarchy within which those measurements fall as defined above (amounts in thousands). The fair value estimates presented herein are based on information available to management as of December 31, 2015 and December 31, 2014. These estimates are not necessarily indicative of the amounts we could ultimately realize. There were no changes between fair value hierarchy levels during the years ended December 31, 2015 and 2014.
| Level 1 | Level 2 | Level 3 | Total | |||||||||||||
| As of December 31, 2015: | ||||||||||||||||
| Assets | ||||||||||||||||
| Real estate securities | $ | — | $ | — | $ | 200 | $ | 200 | ||||||||
| Derivative instruments | — | 197 | — | 197 | ||||||||||||
| Total assets | $ | — | $ | 197 | $ | 200 | $ | 397 | ||||||||
| Liabilities | ||||||||||||||||
| Derivative instruments | $ | — | $ | (3,303 | ) | $ | — | $ | (3,303 | ) | ||||||
| Total liabilities | $ | — | $ | (3,303 | ) | $ | — | $ | (3,303 | ) | ||||||
| As of December 31, 2014: | ||||||||||||||||
| Assets | ||||||||||||||||
| Real estate securities | $ | — | $ | — | $ | 200 | $ | 200 | ||||||||
| Derivative instruments | — | 543 | — | 543 | ||||||||||||
| Total assets | $ | — | $ | 543 | $ | 200 | $ | 743 | ||||||||
| Liabilities | ||||||||||||||||
| Derivative instruments | $ | — | $ | (907 | ) | $ | — | $ | (907 | ) | ||||||
| Total liabilities | $ | — | $ | (907 | ) | $ | — | $ | (907 | ) | ||||||
We review our fair value hierarchy classifications on a quarterly basis. Transfers into or out of Level 3 are made if the significant inputs used in measuring the fair values of the assets and liabilities became unobservable or observable, respectively, in the current market environment. When assets and liabilities are transferred between levels, we recognize the transfer at the beginning of the period. The table below presents a reconciliation of the beginning and ending balances of certain of our assets and liabilities having fair value measurements based on significant unobservable inputs (Level 3), and our derivative instruments, between December 31, 2014 and December 31, 2015 (amounts in thousands).
| Real Estate Securities | Derivative Instruments | |||||||
| Beginning balance as of December 31, 2014 | $ | 200 | $ | (364 | ) | |||
| Total net gains (losses) included in: | ||||||||
| Net income (other income and expense) | — | 3 | ||||||
| Other comprehensive income | — | (5,798 | ) | |||||
| Total change in fair value | — | (5,795 | ) | |||||
| Settlements | — | 3,053 | ||||||
| Transfers in and/or out of Level 3 | — | — | ||||||
| Ending balance as of December 31, 2015 | $ | 200 | $ | (3,106 | ) | |||
Fair Value Estimates of Derivative Instruments
Currently, we use interest rate swaps to manage our interest rate risk. The valuation of these instruments is determined by a third party valuation specialist using widely accepted valuation techniques, including discounted cash flow analysis of the expected cash flows of each derivative. Management reviews the fair value analyses prepared by the third party valuation specialist which reflect the contractual terms of the derivatives, including the period to maturity, and use observable market-based inputs, including interest rate curves and implied volatilities.
| F-29 |
The fair values of interest rate swaps are determined using the market standard methodology of netting the discounted future fixed cash receipts (or payments) and the discounted expected variable cash payments (or receipts). The variable cash payments (or receipts) are based on an expectation of future interest rates (forward curves) derived from observable market interest rate curves.
To comply with the provisions of ASC 820, we incorporate credit valuation adjustments to appropriately reflect both our own nonperformance risk and the respective counterparty’s nonperformance risk in the fair value measurements. In adjusting the fair value of our derivative contracts for the effect of nonperformance risk, we have considered the impact of “netting” and any applicable credit enhancements, such as collateral postings, thresholds, mutual puts, and guarantees.
The majority of the inputs used to value our derivative instruments fall within Level 2 of the fair value hierarchy. However, the credit valuation adjustments associated with our derivative instruments utilize Level 3 inputs, such as estimates of current credit spreads, to evaluate the likelihood of potential default by us and our counterparties. As of December 31, 2015 and December 31, 2014, we had assessed the significance of the impact of the credit valuation adjustments and had determined that it was not significant to the overall valuation of our derivative instruments. As a result, we have determined that all of our derivative valuations are appropriately classified in Level 2 of the fair value hierarchy.
Nonrecurring Fair Value Measurements
During the year ended December 31, 2015, we recognized an impairment loss of $6.5 million related to a consolidated office property in the accompanying consolidated statements of income. We have an 80% ownership interest in the office property. The impairment was based on a reduction of our estimated holding period for this property, triggering impairment recognition with the related fair value measurement based on our estimate of future cash flows from the operation and disposition of this property. We consider the Level 3 inputs used in determining the fair value of this real property investment to be significant. As such, this investment falls under the Level 3 category of the fair value hierarchy. The fair value used in determining impairment for this property was $17.0 million as of December 31, 2015. The key assumption used in determining the fair value of this property is our expectation of the sales price of the property. Our expectation of the sales price was developed based on the valuation provided by a third-party broker quote. In addition, during the year ended December 31, 2015, we recognized an impairment loss of $1.6 million related to a wholly-owned retail property in the accompanying statements of income. The impairment was based on the disposition of this property during the year ended December 31, 2015, triggering impairment recognition with the related fair value measurement based on the contract sales price less selling costs. We consider the Level 3 inputs used in determining the fair value of this real property investment to be significant. As such, this investment falls under the Level 3 category of the fair value hierarchy. The fair value used in determining impairment for this property was $12.5 million at the disposition date. The key assumption used in determining the fair value of this property is our contract sales price of the property less selling costs.
During the year ended December 31, 2014, we recognized an impairment loss of $9.5 million related to a wholly-owned retail property in the accompanying statements of income. The impairment was based on a reduction of our estimated holding period for this property, triggering impairment recognition with the related fair value measurement based on our estimate of future cash flows from the operation and disposition of this property. We consider the Level 3 inputs used in determining the fair value of this real property investment to be significant. As such, this investment falls under the Level 3 category of the fair value hierarchy. The fair value used in determining impairment for this property was $12.5 million as of December 31, 2014. The key assumption used in determining the fair value of this property is our expectation of the sales price of the property less selling costs. Our expectation of the sales price was developed based on the valuation provided by a third-party broker quote.
During the year ended December 31, 2013, we recognized an impairment loss of $2.6 million related to a wholly-owned industrial property in the accompanying statements of income. The impairment was based on a reduction of our estimated holding period for this property, triggering impairment recognition with the related fair value measurement based on our estimate of future cash flows from the operation and disposition of this property. We consider the Level 3 inputs used in determining the fair value of this real property investment to be significant. As such, this investment falls under the Level 3 category of the fair value hierarchy. The fair value used in determining impairment for this property was $14.5 million as of December 31, 2013. The key assumption used in determining the fair value of this property is the discount rate of 8.5%, which was applied to the future cash flows we expect to receive from operating and disposing of the property. Our expectations of the future cash flows are derived from assumptions about market rents, operating expenses, and the terminal value of the property, some of which are developed by a third-party appraisal firm that we engage.
| F-30 |
| 8. | FAIR VALUE OF FINANCIAL INSTRUMENTS |
We are required to disclose an estimate of fair value of our financial instruments for which it is practicable to estimate the value. The fair value of a financial instrument is the amount at which such financial instrument could be exchanged in a current transaction between willing parties, other than in a forced sale or liquidation. For certain of our financial instruments, fair values are not readily available since there are no active trading markets as characterized by current exchanges between willing parties. Accordingly, we derive our estimated fair value using various valuation techniques, such as computing the present value of estimated future cash flows using discount rates commensurate with the risks involved. However, the determination of estimated cash flows may be subjective and imprecise and changes in assumptions or estimation methodologies can have a material effect on these estimated fair values. In that regard, the fair value estimates may not be substantiated by comparison to independent markets, and in many cases, may not be realized in immediate settlement of the instrument.
We use the framework established in ASC Topic 820 to measure the fair value of our financial instruments as disclosed in the table below. The fair values estimated below are indicative of certain interest rate and other assumptions as of December 31, 2015 and 2014, and may not take into consideration the effects of subsequent interest rate or other assumption fluctuations, or changes in the values of underlying collateral. The fair values of cash and cash equivalents, restricted cash, accounts receivable, and accounts payable and accrued expenses approximate their carrying values because of the short-term nature of these instruments.
The following table summarizes the carrying amounts and estimated fair values measured on a nonrecurring basis of our other financial instruments, including instruments classified as held for sale, as of December 31, 2015 and 2014 (amounts in thousands). See Note 7 for a discussion of our assets and liabilities measured at fair value on a recurring basis.
| As of December 31, 2015 | As of December 31, 2014 | |||||||||||
| Carrying Amount | Estimated Fair Value | Carrying Amount | Estimated Fair Value | |||||||||
| Assets: | ||||||||||||
| Fixed-rate debt related investments, net | $ | 15,722 | $ | 16,526 | $ | 69,889 | $ | 71,770 | ||||
| Floating-rate debt related investments, net | — | — | 25,062 | 25,157 | ||||||||
| Liabilities: | ||||||||||||
| Fixed-rate mortgage notes carried at amortized cost | $ | 579,196 | $ | 576,432 | $ | 807,994 | $ | 848,045 | ||||
| Floating-rate mortgage notes | 7,890 | 7,883 | 8,250 | 8,249 | ||||||||
| Floating-rate other secured borrowings | — | — | 37,023 | 37,023 | ||||||||
| Floating-rate unsecured borrowings | 517,000 | 517,000 | 345,000 | 347,235 | ||||||||
The methodologies used and key assumptions made to estimate fair values of the financial instruments, other than derivatives disclosed in Note 6, described in the above table are as follows:
Debt Related Investments—The fair value of our performing debt related investments are estimated using a discounted cash flow methodology. This method discounts estimated future cash flows using rates management determines best reflect current market interest rates that would be offered for loans with similar characteristics and credit quality. Credit spreads and market interest rates used to determine the fair value of these instruments are based on unobservable Level 3 inputs which management has determined to be its best estimate of current market values.
Mortgage Notes and Other Borrowings—The fair value of our mortgage notes and other borrowings are estimated using a discounted cash flow analysis, based on our estimate of market interest rates. Credit spreads relating to the underlying instruments are based on unobservable Level 3 inputs, which we have determined to be our best estimate of current market spreads of similar instruments.
| 9. | NONCONTROLLING INTERESTS |
Our noncontrolling interests consist of two components: (i) OP Units held by third parties and (ii) joint venture partnership interests held by our partners. The following table summarizes changes to noncontrolling interest balances between December 31, 2014 and December 31, 2015 in terms of cumulative contributions, distributions and cumulative allocations of net income (loss) and redemptions and buyouts of the interests (amounts in thousands).
| OP Units | Joint Venture Partner Interests | Noncontrolling Interests | ||||||||
| Beginning balance as of December 31, 2014: | $ | 77,080 | $ | 2,583 | $ | 79,663 | ||||
| Comprehensive Income and Loss | ||||||||||
| Net income (loss) | 8,631 | (1,227 | ) | 7,404 | ||||||
| Unrealized change from cash flow hedging derivatives | (55 | ) | — | (55 | ) | |||||
| Contributions, Distributions and Redemptions | ||||||||||
| Contributions from noncontrolling interest holders | 16,217 | 1,120 | 17,337 | |||||||
| Distributions to noncontrolling interest holders | (4,625 | ) | (64 | ) | (4,689 | ) | ||||
| Redemption and buyout of noncontrolling interests, net | (2,514 | ) | — | (2,514 | ) | |||||
| Ending balance as of December 31, 2015 | $ | 94,734 | $ | 2,412 | $ | 97,146 | ||||
| F-31 |
OP Units
Securities that are redeemable for cash or other assets at the option of the holder, not solely within the control of the issuer, are classified as redeemable noncontrolling interests outside of permanent equity in our accompanying balance sheets. We have evaluated our ability to deliver shares of common stock to satisfy redemption requests from holders of our OP Units and we have concluded that we have the right to satisfy the redemption requirements of holders of our OP Units by delivering unregistered shares of our common stock. Each outstanding OP Unit is exchangeable for one share of our common stock, and the OP Unit holder cannot require redemption in cash or other assets. As a result, we classify our OP Units held by third parties as noncontrolling interests.
We are the sole general partner of our Operating Partnership and currently own, in our capacity as the general partner, 200 OP Units for which we contributed $2,000. Subsequent to that initial investment, we have contributed 100% of the proceeds received from our offerings of common stock to our Operating Partnership in exchange for OP Units representing our interest as a limited partner of the Operating Partnership. As of December 31, 2015 and 2014, we owned approximately 92.8% and 93.6% of the outstanding limited partnership interests in our Operating Partnership, respectively, and the remaining limited partnership interests in our Operating Partnership were owned by third-party investors.
Our Operating Partnership has classes of OP Units that correspond to our four classes of common stock: Class E OP Units, Class A OP Units, Class W OP Units and Class I OP Units. After a period of one year from the date of issuance, holders of Class E OP Units (other than us) may request the Operating Partnership to redeem their Class E OP Units. We have the option of redeeming the Class E OP Units with cash for an amount based on our NAV per share as of the effective date of the redemption, shares of our common stock on a one-for-one basis, or with a combination of cash and Class E shares of common stock. We did not issue any Class E shares pursuant to this option during 2015 or 2014. During the years ended December 31, 2015 and 2014, we redeemed approximately 360,000 and 1.1 million Class E OP Units for approximately $2.7 million and $7.9 million in cash, respectively.
As of December 31, 2015 and 2014, our Operating Partnership had issued and outstanding approximately 12.8 million and 12.1 million Class E OP Units, respectively, to third-party investors in connection with its private placement offerings. Such units had a maximum approximate redemption value of $95.6 million and $87.0 million, as of December 31, 2015 and December 31, 2014, respectively, based on our December 31, 2015 and December 31, 2014 NAV per share, respectively, (unaudited). Furthermore, during the year ended December 31, 2015, we exercised our option to acquire, at fair value, previously sold fractional interests in a retail property in the Jacksonville, FL market for a combination of (i) approximately 1.0 million Class E OP Units issued at a price of $7.18 per OP Unit, representing approximately $7.3 million of the aggregate purchase price and (ii) approximately $783,000 in cash. The result of this activity was a net decrease in our financing obligations of approximately $17.9 million and a net increase in our noncontrolling interests of $16.2 million.
Joint Venture Partner Interests
We consolidate all of our joint ventures in the accompanying financial statements. Our joint venture partners’ interests in our consolidated partnerships are not redeemable. As a result, we classify our joint venture partners’ interests as noncontrolling interests. During the year ended December 31, 2014, we sold 12 industrial properties held by two of our joint ventures. As a result, we no longer have any interests in these joint ventures.
| 10. | STOCKHOLDERS’ EQUITY |
Common Stock
On May 27, 2005, we filed a Registration Statement on Form S-11 with the Commission in connection with an initial public offering of our Class E shares of common stock, which was declared effective on January 27, 2006. On June 11, 2007, we filed a Registration Statement on Form S-11 with the Commission in connection with a follow-on public offering of our Class E common stock, which was declared effective on January 22, 2008. As of the close of business on September 30, 2009, we terminated the primary portion of our public offerings of Class E shares of our common stock and ceased accepting new subscriptions to purchase shares of our common stock. On October 23, 2009, we filed a Registration Statement for the sale of up to $237,500,000 in Class E shares of our common stock pursuant to our distribution reinvestment plan. This distribution reinvestment plan offering is ongoing.
| F-32 |
On July 12, 2012, the Commission declared effective our Prior Offering, which we terminated on September 15, 2015. On September 16, 2015, the Commission declared effective our Follow-On Offering, which applies to the offer and sale of shares of Class A, Class W, and Class I common stock to the public through a primary offering and a restated distribution reinvestment plan with NAV-based pricing. See Note 1 for additional information regarding the Prior Offering and Follow-On Offering. The following table describes the changes in each class of common shares during each of the years ended December 31, 2015, 2014, and 2013 (shares and dollar amounts in thousands).
| Class E | Class A | Class W | Class I | Total | |||||||||||||||||||||||||||||||
| Shares | Amount (1) | Shares | Amount (1) | Shares | Amount (1) | Shares | Amount (1) | Shares | Amount (1) | ||||||||||||||||||||||||||
| Balances, December 31, 2012 | 178,092 | $ | 1,775,196 | 12 | $ | 83 | 12 | $ | 83 | 12 | $ | 83 | 178,128 | $ | 1,775,445 | ||||||||||||||||||||
| Issuance of common stock: | |||||||||||||||||||||||||||||||||||
| Shares sold | — | — | 205 | 1,451 | 197 | 1,354 | 4,301 | 29,333 | 4,703 | 32,138 | |||||||||||||||||||||||||
| Distribution reinvestment plan | 3,143 | 21,352 | — | — | — | — | 18 | 121 | 3,161 | 21,473 | |||||||||||||||||||||||||
| Redemptions of common stock | (9,981 | ) | (68,402 | ) | — | — | — | — | (4 | ) | (30 | ) | (9,985 | ) | (68,432 | ) | |||||||||||||||||||
| Balances, December 31, 2013 | 171,254 | $ | 1,728,146 | 217 | $ | 1,534 | 209 | $ | 1,437 | 4,327 | $ | 29,507 | 176,007 | $ | 1,760,624 | ||||||||||||||||||||
| Issuance of common stock: | |||||||||||||||||||||||||||||||||||
| Shares sold | — | — | 955 | 6,879 | 900 | 6,310 | 9,090 | 63,705 | 10,945 | 76,894 | |||||||||||||||||||||||||
| Distribution reinvestment plan | 2,830 | 19,785 | 15 | 105 | 10 | 74 | 123 | 867 | 2,978 | 20,831 | |||||||||||||||||||||||||
| Stock-based compensation | — | — | — | — | — | — | 136 | 807 | 136 | 807 | |||||||||||||||||||||||||
| Redemptions of common stock | (11,016 | ) | (77,523 | ) | — | — | (2 | ) | (13 | ) | (648 | ) | (4,566 | ) | (11,666 | ) | (82,102 | ) | |||||||||||||||||
| Balances, December 31, 2014 | 163,068 | $ | 1,670,408 | 1,187 | $ | 8,518 | 1,117 | $ | 7,808 | 13,028 | $ | 90,320 | 178,400 | $ | 1,777,054 | ||||||||||||||||||||
| Issuance of common stock: | |||||||||||||||||||||||||||||||||||
| Shares sold | — | — | 511 | 3,888 | 693 | 5,134 | 10,135 | 73,982 | 11,339 | 83,004 | |||||||||||||||||||||||||
| Distribution reinvestment plan | 2,447 | 17,866 | 28 | 203 | 22 | 158 | 426 | 3,119 | 2,923 | 21,346 | |||||||||||||||||||||||||
| Stock-based compensation | — | — | — | — | — | — | 618 | 1,295 | 618 | 1,295 | |||||||||||||||||||||||||
| Redemptions of common stock | (28,240 | ) | (206,134 | ) | (23 | ) | (171 | ) | (20 | ) | (148 | ) | (873 | ) | (6,433 | ) | (29,156 | ) | (212,886 | ) | |||||||||||||||
| Balances, December 31, 2015 | 137,275 | $ | 1,482,140 | 1,703 | $ | 12,438 | 1,812 | $ | 12,952 | 23,334 | $ | 162,283 | 164,124 | $ | 1,669,813 | ||||||||||||||||||||
| (1) | Dollar amounts presented in this table represent the gross amount of proceeds from the sale of common shares, or the amount paid to stockholders to redeem or repurchase common shares, and do not include other costs and expenses accounted for within additional paid-in capital, such as selling commissions, dealer manager and distribution fees, offering and organizational costs, and other costs associated with our distribution reinvestment plans, share redemption programs, and self-tender offers. |
Redemptions and Repurchases
On August 12, 2015, we completed a modified “Dutch Auction” tender offer, pursuant to which we accepted for purchase approximately 17.2 million shares of Class E common stock, at a purchase price of $7.25 per share for an aggregate cost of approximately $124.4 million. On December 23, 2015, we completed another self-tender offer, pursuant to which we accepted for purchase approximately 2.7 million shares of Class E common stock, at a purchase price of $7.39 per share for an aggregate cost of approximately $20.1 million.
Prior to December 12, 2015, we had adopted a Class E Share Redemption Program (the “Class E SRP”), whereby Class E stockholders may request that we redeem all or any portion of their Class E shares subject to certain conditions and limitations. On December 12, 2015, our Amended and Restated Class E Share Redemption Program (the “Amended Class E SRP”) became effective, pursuant to which redemptions are only available with respect to Class E shares of common stock in the event of the death or disability of a stockholder subject to certain conditions and limitations. The Amended Class E SRP applied to the three months ended December 31, 2015. We also have a separate Class A, W and I Share Redemption Program (“Class AWI SRP”) for holders of our Class A, Class W or Class I shares. Our board of directors may modify, suspend or terminate our share redemption programs if it deems such action to be in the best interest of our stockholders. Our board of directors will evaluate each quarter whether to make liquidity available to Class E stockholders through the Class E SRP or through a tender offer process.
| F-33 |
During the years ended December 31, 2015 and 2014, we redeemed approximately 8.4 million and 11.0 million Class E shares pursuant to our Class E SRP for approximately $61.7 million and $77.5 million, respectively. During the years ended December 31, 2015 and 2014, our board of directors authorized an additional $28.0 million and $34.6 million, respectively, in addition to the amounts calculated in accordance with our Class E SRP, related to these redemptions.
During the year ended December 31, 2015, we redeemed approximately 916,000 Class I shares, Class A shares, and Class W shares pursuant to our Class AWI SRP for a total of approximately $6.8 million. During the year ended December 31, 2014, we redeemed approximately 650,000 Class I shares and Class W shares pursuant to our Class AWI SRP for a total of approximately $4.6 million.
Distributions
We accrue distributions on a daily basis and pay distributions on a quarterly basis. Historically, each quarter, our board of directors has authorized the following quarter’s daily distribution accrual. We calculate individual payments of distributions to each stockholder or OP Unit holder based upon daily record dates during each quarter, so that investors are eligible to earn distributions immediately upon purchasing shares of our common stock or upon purchasing OP Units. The following table describes our total distributions declared on our common stock for the years ended December 31, 2015, 2014 and 2013, and the portion of each distribution that was paid in cash and reinvested in shares (dollar amounts in thousands).
| For the Year Ended December 31, | ||||||||||||||||||||||||
| Distributions: | 2015 | % of Total Distributions | 2014 | % of Total Distributions | 2013 | % of Total Distributions | ||||||||||||||||||
| Paid in cash | $ | 41,968 | 66.5 | % | $ | 41,381 | 66.5 | % | $ | 41,123 | 66.0 | % | ||||||||||||
| Reinvested in shares | 21,177 | 33.5 | % | 20,855 | 33.5 | % | 21,207 | 34.0 | % | |||||||||||||||
| Total distributions | $ | 63,145 | 100.0 | % | $ | 62,236 | 100.0 | % | $ | 62,330 | 100.0 | % | ||||||||||||
The following table sets forth the distributions that have been paid and/or authorized as of December 31, 2015, subject to class-specific adjustments.
| Amount Declared per Share/Unit (1) | |||||||||||||||||
| Quarter | Class E | Class A | Class W | Class I | Weighted Average | Payment Date | |||||||||||
| 2014 | |||||||||||||||||
| 1st Quarter 2014 | $ | 0.0875 | $ | 0.0687 | $ | 0.0772 | $ | 0.0858 | $ | 0.0874 | 4/16/14 | ||||||
| 2nd Quarter 2014 | $ | 0.0875 | $ | 0.0684 | $ | 0.0771 | $ | 0.0858 | $ | 0.0873 | 7/16/14 | ||||||
| 3rd Quarter 2014 | $ | 0.0875 | $ | 0.0680 | $ | 0.0769 | $ | 0.0857 | $ | 0.0872 | 10/16/14 | ||||||
| 4th Quarter 2014 | $ | 0.0875 | $ | 0.0677 | $ | 0.0767 | $ | 0.0857 | $ | 0.0872 | 1/16/15 | ||||||
| 2015 | |||||||||||||||||
| 1st Quarter 2015 | $ | 0.0900 | $ | 0.0705 | $ | 0.0794 | $ | 0.0882 | $ | 0.0897 | 4/16/15 | ||||||
| 2nd Quarter 2015 | $ | 0.0900 | $ | 0.0700 | $ | 0.0791 | $ | 0.0882 | $ | 0.0896 | 7/2/15 | ||||||
| 3rd Quarter 2015 | $ | 0.0900 | $ | 0.0695 | $ | 0.0788 | $ | 0.0881 | $ | 0.0895 | 10/16/15 | ||||||
| 4th Quarter 2015 | $ | 0.0900 | $ | 0.0694 | $ | 0.0788 | $ | 0.0881 | $ | 0.0894 | 1/19/16 | ||||||
| 2016 | |||||||||||||||||
| 1st Quarter 2016 (2) | $ | 0.0900 | $ | 0.0900 | $ | 0.0900 | $ | 0.0900 | $ | 0.0900 | 4/18/16 (3) | ||||||
| (1) | Assumes ownership of share or unit for the entire quarter. |
| (2) | The distribution amount herein for the first quarter of 2016 does not reflect class-specific adjustments made to our Class A, Class W, and Class I shares, which have not yet been determined. |
| (3) | Expected payment date. |
Distribution Tax Characterization
Our distributions to stockholders are characterized for federal income tax purposes as (i) ordinary income, (ii) non-taxable return of capital, or (iii) long-term capital gain. Distributions that exceed our current and accumulated tax earnings and profits constitute a return of capital for tax purposes and reduce the stockholders’ basis in the common shares. To the extent that distributions exceed both current and accumulated earnings and profits and the stockholders’ basis in the common shares, they will generally be treated as a gain or loss upon the sale or exchange of our stockholders’ common shares. We elected to classify our fourth quarter 2013 distribution as a 2014 distribution as part of our overall tax and REIT compliance strategy, resulting in a lower amount of reported distributions than were declared for the period. This election increased the percentage of total distributions that are taxable, however, it did not increase the actual dollar amount that is taxed. For 2014 and 2015, we notified stockholders of the taxability of distributions paid during the preceding year on an annual basis. The following unaudited table summarizes the information reported to investors regarding the taxability of distributions on common shares for the years ended December 31, 2015, 2014 and 2013.
| F-34 |
| For the Year Ended December 31, | ||||||||||||
| 2015 | 2014 | 2013 | ||||||||||
| Per Common Share | % of Total Distributions | % of Total Distributions | % of Total Distributions | |||||||||
| Ordinary income | 81.01 | % | 63.92 | % | 40.98 | % | ||||||
| Non-taxable return of capital | 18.99 | % | 36.08 | % | 59.02 | % | ||||||
| Total | 100.00 | % | 100.00 | % | 100.00 | % | ||||||
| 11. | RELATED PARTY TRANSACTIONS |
Our day-to-day activities are managed by our Advisor, a related party, under the terms and conditions of the Advisory Agreement. Our Advisor is considered to be a related party as certain indirect owners and employees of our Advisor serve as two of our directors and all of our executive officers. The responsibilities of our Advisor cover all facets of our business, and include the selection and underwriting of our real property and debt related investments, the negotiations for these investments, the asset management and financing of these investments and the oversight of real property dispositions.
In connection with our public offering, we entered into an Eighth Amended and Restated Advisory Agreement (the “Advisory Agreement”) with our Advisor, effective July 12, 2012, which modified the fees and expense reimbursements payable to our Advisor. The Advisory Agreement may be renewed for an unlimited number of successive one-year terms. The current term of the Advisory Agreement expires on June 30, 2016. Per the Advisory Agreement, in consideration for asset management services performed, we pay our Advisor an advisory fee comprised of two separate components: (1) a fixed amount that accrues daily in an amount equal to 1/365th of 1.15% of the “Aggregate Fund NAV” (defined as the aggregate NAV of our Class E shares, Class A shares, Class W shares and Class I shares, along with the OP Units held by third parties) for each day, and (2) a performance component that is based on the annual non-compounded investment return provided to holders of “Fund Interests” (defined as our Class E shares, Class A shares, Class W shares, Class I shares, and OP Units held by third parties) such that our Advisor will receive 25% of the overall return in excess of 6%; provided that in no event may the performance condition exceed 10% of the overall return for such year, and subject to certain other limitations. Additionally, our Advisor will provide us with a waiver of a portion of its fees generally equal to the amount of the performance component that would have been payable with respect to the Class E shares and the Class E OP Units held by third parties until the NAV of such shares or units exceeds $10.00 per share or unit, the benefit of which will be shared among all holders of Fund Interests. We will also pay our Advisor a development management fee equal to 4.0% of the cost to develop, construct, or improve real property assets. In addition, we will pay our Advisor a fee of 1% of the sales price of individual real property assets upon disposition of such assets. Further, for a substantial amount of services in connection with the sale of a property, as determined by a majority of our independent directors, we will pay our Advisor up to 50.0% of the reasonable, customary and competitive commission paid for the sale of a comparable real property, provided that such amount shall not exceed 1% of the contract price of the property sold and, when added to all other real estate commissions paid to unaffiliated parties in connection with the sale, may not exceed the lesser of a competitive real estate commission or 6% of the sales price of the property.
In addition, pursuant to the Advisory Agreement, we will pay directly, or reimburse our Advisor and our Dealer Manager (defined below) if they pay on our behalf any organizational and offering expenses (other than selling commissions, the dealer manager fee, distribution fees and non-transaction based compensation allocated to sales-related activities of employees of our Dealer Manager in connection with the offering) relating to any public offerings as and when incurred. After the termination of the primary portion of the offering and again after termination of the distribution reinvestment plan portion of the offering, our Advisor has agreed to reimburse us to the extent that total cumulative organization and offering expenses (including selling commissions, the dealer manager fee and distribution fees) that we incur exceed 15% of our gross proceeds from the applicable offering.
Subject to certain limitations, we will reimburse our Advisor for all of the costs it incurs in connection with the services it provides to us, including, without limitation, our allocable share of our Advisor’s overhead, which includes but is not limited to our Advisor’s rent, utilities and personnel costs; provided, that we will not reimburse our Advisor or its affiliates for services for which our Advisor or its affiliates are entitled to compensation in the form of a separate fee.
Dividend Capital Securities LLC, a related party, which we refer to as the “Dealer Manager,” is distributing the shares of our common stock in our public offering on a “best efforts” basis. Our Dealer Manager is a member of the Financial Industry Regulatory Authority, Inc., or FINRA. Our Dealer Manager coordinates our distribution effort and manages our relationships with participating broker-dealers and financial advisors and provides assistance in connection with compliance matters relating to marketing our public offering.
| F-35 |
We entered into a dealer manager agreement dated July 12, 2012, or the “Prior Dealer Manager Agreement,” with our Dealer Manager in connection with the Prior Offering. Pursuant to the Prior Dealer Manager Agreement, our Dealer Manager served as the dealer manager for the Prior Offering. Our Dealer Manager is an entity related to our Advisor and a member firm of FINRA.
Under the Prior Dealer Manager Agreement, our Dealer Manager provided certain sales, promotional, and marketing services to us in connection with the distribution of the shares of common stock offered pursuant to our Prior Offering prospectus. Pursuant to the Prior Dealer Manager Agreement, we paid our Dealer Manager a sales commission of up to 3.0% of the NAV per Class A share sold in the primary offering, subject to the reduction of the sales commission in certain circumstances, and a distribution fee which accrued daily in an amount equal to 1/365th of 0.5% of the amount of our NAV per share for our Class A shares for such day. We also paid our Dealer Manager a dealer manager fee which accrued daily in an amount equal to 1/365th of 0.6% of our NAV per share for each of our Class A and Class W shares and in an amount equal to 1/365th of 0.1% of our NAV per share for our Class I shares for such day.
Pursuant to an amendment to our Prior Dealer Manager Agreement entered into on May 31, 2013, from time to time we could agree to pay our Dealer Manager a primary dealer fee in the amount of up to 5.0% of the gross proceeds raised from the sale of Class I shares in the primary portion of the Prior Offering, provided that the total gross proceeds raised with respect to which the primary dealer fee could apply could not exceed $300,000,000. Pursuant to this amendment, our Dealer Manager retained 0.5% of such gross proceeds and reallowed the remainder of the primary dealer fee to the participating broker-dealers involved in selling such Class I shares based on the portion of the gross proceeds raised from their customers. The primary dealer fee is considered underwriting compensation (as defined in accordance with, and subject to the underwriting compensation limits of, applicable FINRA rules).
On September 16, 2015, the Company entered into a Second Amended and Restated Dealer Manager Agreement (the “Second Amended Dealer Manager Agreement”) with our Dealer Manager in connection with the Follow-On Offering. Pursuant to the Second Amended Dealer Manager Agreement, our Dealer Manager serves as the dealer manager for the Follow-On Offering.
The Second Amended Dealer Manager Agreement is an amendment and restatement of the Prior Dealer Manager Agreement. The purpose of the Second Amended Dealer Manager Agreement is to engage our Dealer Manager with respect to the Follow-On Offering, while still paying dealer manager fees and distribution fees with respect to the Prior Offering. Pursuant to the Second Amended Dealer Manager Agreement, we pay our Dealer Manager a sales commission of up to 3.0% of the offering price per Class A share sold in the primary offering, subject to the reduction of the sales commission in certain circumstances, and a distribution fee which accrues daily in an amount equal to 1/365th of 0.5% of the amount of our NAV per share for our Class A shares for such day. We also pay our Dealer Manager a dealer manager fee which accrued daily in an amount equal to 1/365th of 0.6% of our NAV per share for each of our Class A and Class W shares and in an amount equal to 1/365th of 0.1% of our NAV per share for our Class I shares for such day.
Pursuant to the Second Amended Dealer Manager Agreement, we may pay to the Dealer Manager a primary dealer fee in the amount of up to 5.0% of the gross proceeds raised from the sale of Class I shares in the primary portion of the Follow-On Offering, provided that (i) the total gross proceeds raised with respect to which the primary dealer fee will apply may not exceed $100,000,000, subject to further increase by our board of directors, in its discretion; (ii) the primary dealer fee will only be paid with respect to sales made by participating broker-dealers specifically approved by us as being eligible; and (iii) the primary dealer fee will only be paid with respect to sales made at times approved by us. The Dealer Manager may reallow a portion of the primary dealer fee to the participating broker-dealers involved in selling such Class I shares based on the portion of the gross proceeds raised from their customers. The Dealer Manager will consider the primary dealer fee to be underwriting compensation subject to the limits described below.
The Dealer Manager monitors the aggregate amount of underwriting compensation that we and the Advisor pay in connection with the Follow-On Offering and Prior Offering in order to ensure we comply with the underwriting compensation limits of applicable FINRA rules. Accordingly, the dealer manager fee and distribution fee that are payable to our Dealer Manager with respect to an offering (i.e., pursuant to the registration statement for an offering) will cease when, following the completion of the offering, total underwriting compensation in such offering equals 10% of the gross proceeds from the primary portion of the offering. We consider the portion of the dealer manager fee and the distribution fee accruing with respect to Class A, Class W and Class I shares issued during the term of the current offering, and not issued pursuant to a prior public offering, as underwriting compensation with respect to the current offering. In addition, we will cease paying the dealer manager fee and the distribution fee on the earlier to occur of the following: (i) a listing of the class of such shares on a national securities exchange or (ii) such shares no longer being outstanding, for example (without limitation) upon their redemption or other repurchase by us, upon our dissolution, or upon a merger or other extraordinary transaction in which we are a party and in which the shares are exchanged for cash or other securities.
| F-36 |
The sales commissions, distribution fees, and dealer manager fees may all be reallowed to participating broker dealers who are members of FINRA. Our Dealer Manager may also receive a portion of the organization and offering expense reimbursement amounts described above under “— Compensation to our Advisor”. Our Dealer Manager is presently directly or indirectly majority owned by John A. Blumberg, James R. Mulvihill, Evan H. Zucker, and/or their affiliates.
During the years ended December 31, 2015, 2014, and 2013, we paid primary dealer fees of approximately $2.5 million, $2.2 million, and $1.4 million, respectively, with respect to approximately $50.8 million, $43.9 million, and $27.1 million, respectively, of the total gross proceeds raised in our public offering. The maximum primary dealer fee we will pay our Dealer Manager pursuant to the Second Amended Dealer Manager Agreement is $5 million, although in the future we may enter into subsequent amendments to the Second Amended Dealer Manager Agreement to provide for additional primary dealer fee payments.
Independent Director RSU Awards
On December 5, 2013, our board of directors approved revised compensation for our independent directors. In connection with the revised compensation plan, at each annual meeting of stockholders the independent directors will automatically, upon election, receive an award of RSUs with respect to Class I shares of our common stock, with the number of RSUs based on the NAV per Class I share as of the end of the day of the annual meeting. Effective June 25, 2015, June 25, 2014, and January 2, 2014, we granted 4,116, 4,460, and 2,112 RSUs to our independent directors, respectively.
Restricted Stock Unit Agreements
Pursuant to the terms of the Advisor RSU Agreements, we have granted our Advisor 717,722 Company RSUs, of which approximately 441,000 Company RSUs remained unvested and unsettled as of December 31, 2015. Each Company RSU will, upon vesting, entitle our Advisor to one Class I share of our common stock. The Company RSUs are subject to specified vesting and settlement provisions and, upon settlement in Class I shares of Company common stock, require offsets of advisory fees and expenses otherwise payable from the Company to our Advisor as described further below based on the NAV per Class I share on the grant date of the applicable Company RSU (the weighted average grant-date NAV per Class I share with respect to the unsettled Company RSUs is $7.06 as of December 31, 2015). As of December 31, 2015, our Advisor had approximately 38,000 shares of Class I common stock issued upon settlement of Company RSUs that remained subject to fee offset. The Advisor is expected to redistribute a significant portion of the Company RSUs and/or shares to senior level employees of our Advisor and its affiliates that provide services to us, although the terms of such redistributions (including the timing, amount and recipients) remain solely in the discretion of our Advisor.
Vesting and Payment Offset
Following specified vesting provisions, an equal percentage of the Company RSUs vest on each of the applicable vesting dates. On each vesting date, an offset amount (each, an “Offset Amount”) is calculated and deducted on a pro rata basis over the next 12 months from the cash payments otherwise due and payable to our Advisor under our then-current Advisory Agreement for any fees or expense reimbursements. Each Offset Amount equals the number of Company RSUs vesting on such date multiplied by the NAV per Class I share publicly disclosed by us (“the “Class I NAV”) as of the end of the grant date (the “Grant Date NAV per Class I Share”). Each Offset Amount is always calculated based on the Grant Date NAV per Class I Share, even beyond the initial Vesting Date. At the end of each 12-month period following each vesting date, if the Offset Amount has not been fully realized by offsets from the cash payments otherwise due and payable to our Advisor under the Advisory Agreement, our Advisor shall promptly pay any shortfall to us.
The chart below shows the Grant Dates, vesting dates, number of unvested shares as of December 31, 2015, and Grant Date NAV per Class I Share (share amounts in thousands).
| Award | Grant Date | Vesting Dates | Number of Unvested Shares |
Grant Date NAV per Class I Share | |||||
| Company RSU | 4/7/14 | 4/15/14, 4/15/15, 4/15/16, 4/15/17 | 247 | $ | 6.96 | ||||
| Company RSU | 2/25/15 | 4/15/15, 4/15/16, 4/15/17 | 59 | 7.18 | |||||
| Company RSU | 2/25/15 | 4/15/18 | 135 | 7.18 | |||||
| Total/ weighted average | 441 | $ | 7.06 | ||||||
Termination
The Advisor RSU Agreements will automatically terminate upon termination or non-renewal of the Advisory Agreement by any party for any reason. In addition, upon a change in control of us, then either our Advisor or we may immediately terminate the Advisor RSU Agreements. Further, the Advisor may immediately terminate the Advisor RSU Agreements if we exercise certain rights under the Advisor RSU Agreements to replace the Company RSUs with another form of compensation.
| F-37 |
Upon termination of the Advisor RSU Agreements, our Advisor will promptly pay any unused Offset Amounts to us or, at our Advisor’s election, return Class I shares in equal value based on the Class I NAV as of the date of termination of the Advisor RSU Agreements. In addition, upon termination of the Advisor RSU Agreement, all unvested Company RSUs will be forfeited except that, unless the Advisor RSU Agreements were terminated at the election of our Advisor following a change in control of us or as a result of a premature termination of the Advisory Agreement at our election for cause (as defined in the Advisory Agreement) or upon the bankruptcy of our Advisor, then following such forfeiture of Company RSUs, our Advisor will have the right to acquire from us the number of Class I shares equal to the number of Company RSUs forfeited, in return for a purchase price equal to such number of Class I shares multiplied by the Grant Date NAV per Class I Share. The Advisor must notify us of its election to exercise the foregoing acquisition right within 30 days following the termination of the Advisor RSU Agreements, and the parties will close the transaction within 60 days following the termination of the Advisor RSU Agreements.
Dividend Equivalent Payments
If our board of directors declares and we pay a cash dividend on Class I shares for any period in which the Company RSUs are outstanding (regardless of whether such Company RSUs are then vested), our Advisor will be entitled to dividend equivalents (the “Dividend Equivalents”) with respect to that cash dividend equal to the cash dividends that would have been payable on the same number of Class I shares as the number of Company RSUs subject to the Advisor RSU Agreements had such Class I shares been outstanding during the same portion of such period as the Company RSUs were outstanding. Any such Dividend Equivalents may be paid in cash or Class I shares, at our Advisor’s election.
During the years ended December 31, 2015 and 2014, we recognized approximately $1.1 million and $653,000 as advisory fees expense, respectively, related to the issuance of approximately 153,000 and 123,000 shares of our Class I common stock, respectively. Amounts reported are based on the NAV per share at the end of each month during the Advisor RSU Agreements. As of December 31, 2015, the total value related to nonvested awards not yet recognized was approximately $3.3 million, which we expect to recognize during 2016, 2017, 2018, and 2019.
Summary of Fees and Other Amounts
The following table summarizes fees and other amounts earned by our Advisor and its related parties in connection with services performed for us during the years ended December 31, 2015, 2014, and 2013 (amounts in thousands):
| For the Year Ended December 31, | |||||||||
| 2015 | 2014 | 2013 | |||||||
| Advisory fees (1) | $ | 17,083 | $ | 15,919 | $ | 15,120 | |||
| Other reimbursements paid to our Advisor (2) | 9,008 | 8,287 | 6,278 | ||||||
| Other reimbursements paid to our Dealer Manager | 441 | 591 | — | ||||||
| Advisory fees related to the disposition of real properties | 4,962 | 2,064 | 2,639 | ||||||
| Development management fee | 88 | 181 | 223 | ||||||
| Primary dealer fee (3) | 2,540 | 2,197 | 1,358 | ||||||
| Selling commissions, dealer manager, and distribution fees | 422 | 336 | 57 | ||||||
| Total | $ | 34,544 | $ | 29,575 | $ | 25,675 | |||
| (1) | Amounts reported for the years ended December 31, 2015 and 2014 include approximately $1.1 million and approximately $653,000, respectively, that we were not obligated to pay in consideration of the issuance of Company RSUs to our Advisor. |
| (2) | Other reimbursements paid to our Advisor primarily comprise salary, bonus, and overhead reimbursements. |
| (3) | Amounts reported represent primary dealer fees we paid to our Dealer Manager based on the gross proceeds raised by participating broker-dealers pursuant to certain selected dealer agreements. Of the primary dealer fee earned during the years ended December 31, 2015, 2014, and 2013, our Dealer Manager reallowed approximately $2.3 million, $2.0 million, and $1.2 million, respectively, to participating third-party broker-dealers and retained approximately $254,000, $220,000, and $136,000, respectively. |
Please also see Note 2 for information regarding restricted stock grants to certain employees of our Advisor and its affiliates, none of which are our named executive officers.
| F-38 |
Product Specialists
During the year ended December 31, 2012, our Advisor entered into a product specialist agreement with BCG TRT Advisors LLC (“BCG”), in connection with advisory services related to our investments in real estate securities assets. Pursuant to this agreement, a portion of the asset management fee that our Advisor receives from us related to real estate securities investments is reallowed to BCG in exchange for services provided. Our Advisor incurred approximately $24,000, $35,000, and $58,000 related to services provided by BCG during the years ended December 31, 2015, 2014 and 2013, respectively.
Stock Purchases by Certain Officers and Directors
On March 27, 2013, Jeffrey L. Johnson, our Chief Executive Officer, and John A. Blumberg, one of our directors, each purchased 36,822 shares of our Class I common stock at a price of $6.79 per share in our ongoing public offering.
Launch of Private Placements of Delaware Statutory Trust Interests
Please see Note 17 for information regarding transactions entered into with other related parties subsequent to December 31, 2015 in connection with the launch of private placements of Delaware statutory trust interests.
| F-39 |
| 12. | NET INCOME (LOSS) PER COMMON SHARE |
Reconciliations of the numerator and denominator used to calculate basic net income (loss) per common share to the numerator and denominator used to calculate diluted net income (loss) per common share for the years ended December 31, 2015, 2014 and 2013 are described in the following table (amounts in thousands, except per share information):
| For the Year Ended December 31, | ||||||||||||
| Numerator | 2015 | 2014 | 2013 | |||||||||
| Income (loss) from continuing operations | $ | 131,659 | $ | 3,990 | $ | (9,084 | ) | |||||
| (Income) loss from continuing operations attributable to noncontrolling interests | (7,404 | ) | (340 | ) | 558 | |||||||
| Income (loss) from continuing operations attributable to common stockholders | 124,255 | 3,650 | (8,526 | ) | ||||||||
| Dilutive noncontrolling interests share of income (loss) from continuing operations | 8,632 | 233 | (652 | ) | ||||||||
| Numerator for diluted earnings per share – adjusted income (loss) from continuing operations | 132,887 | 3,883 | (9,178 | ) | ||||||||
| Income from discontinued operations | — | 30,004 | 65,554 | |||||||||
| Income from discontinued operations attributable to noncontrolling interests | — | (4,462 | ) | (4,560 | ) | |||||||
| Income from discontinued operations attributable to common stockholders | — | 25,542 | 60,994 | |||||||||
| Dilutive noncontrolling interests share of discontinued operations | — | 1,915 | 4,662 | |||||||||
| Numerator for diluted earnings per share – adjusted income from discontinued operations | $ | — | $ | 27,457 | $ | 65,656 | ||||||
| Denominator | ||||||||||||
| Weighted average shares outstanding-basic | 175,938 | 178,273 | 178,196 | |||||||||
| Incremental weighted average shares effect of conversion of OP Units | 12,851 | 12,718 | 13,736 | |||||||||
| Weighted average shares outstanding-diluted | 188,789 | 190,991 | 191,932 | |||||||||
| INCOME (LOSS) PER COMMON SHARE-BASIC AND DILUTED | ||||||||||||
| Net income (loss) from continuing operations | $ | 0.70 | $ | 0.02 | $ | (0.05 | ) | |||||
| Net income from discontinued operations | — | 0.14 | 0.34 | |||||||||
| Net income | $ | 0.70 | $ | 0.16 | $ | 0.29 | ||||||
| 13. | SEGMENT INFORMATION |
We have four reportable operating segments, which include our three real property operating sectors (office, industrial, and retail) and debt related investments, and we measure our profit and loss of our operating segments based on net operating income (“NOI”). We organize and analyze the operations and results of each of these segments independently, due to inherently different considerations for each segment. Such considerations include, but are not limited to, the nature and characteristics of the investment, and investment strategies and objectives. Specifically, the physical characteristics of our buildings, the related operating characteristics, the geographic markets, and the type of tenants are inherently different for each of our segments.
| F-40 |
The following table sets forth revenue and NOI of our segments for the years ended December 31, 2015, 2014, and 2013 (amounts in thousands).
| For the Year Ended December 31, | ||||||||||||||||||||||||
| Revenues | NOI (unaudited) | |||||||||||||||||||||||
| 2015 | 2014 | 2013 | 2015 | 2014 | 2013 | |||||||||||||||||||
| Real property (1) | ||||||||||||||||||||||||
| Office | $ | 137,204 | $ | 139,245 | $ | 123,838 | $ | 97,441 | $ | 104,533 | $ | 95,618 | ||||||||||||
| Industrial | 8,672 | 23,307 | 26,108 | 6,755 | 20,780 | 23,893 | ||||||||||||||||||
| Retail | 72,402 | 61,649 | 57,382 | 54,492 | 47,891 | 44,145 | ||||||||||||||||||
| Debt related investments | 6,922 | 7,396 | 10,449 | 6,922 | 7,396 | 10,449 | ||||||||||||||||||
| Total | $ | 225,200 | $ | 231,597 | $ | 217,777 | $ | 165,610 | $ | 180,600 | $ | 174,105 | ||||||||||||
| (1) | Excludes results of operations of real properties categorized as discontinued operations. |
We consider NOI to be an appropriate supplemental financial performance measure because NOI reflects the specific operating performance of our real properties and debt related investments, and excludes certain items that are not considered to be controllable in connection with the management of each property, such as depreciation and amortization, general and administrative expenses, advisory fees, acquisition-related expenses, interest and other income, interest expense, loss on extinguishment of debt and financing commitments, gain on the sale of real property and noncontrolling interests. However, NOI should not be viewed as an alternative measure of our financial performance as a whole, since it excludes such items that could materially impact our results of operations. Further, our NOI may not be comparable to that of other real estate companies, as they may use different methodologies for calculating NOI. Therefore, we believe net income, as defined by GAAP, to be the most appropriate measure to evaluate our overall financial performance.
The following table is a reconciliation of our NOI to our reported net income attributable to common stockholders for the years ended December 31, 2015, 2014, and 2013 (amounts in thousands).
| For the Year Ended December 31, | ||||||||||||
| 2015 | 2014 | 2013 | ||||||||||
| Net operating income | $ | 165,610 | $ | 180,600 | $ | 174,105 | ||||||
| Real estate depreciation and amortization expense | (83,114 | ) | (88,994 | ) | (87,174 | ) | ||||||
| General and administrative expenses | (10,720 | ) | (11,108 | ) | (9,774 | ) | ||||||
| Advisory fees, related party | (17,083 | ) | (15,919 | ) | (15,120 | ) | ||||||
| Acquisition-related expenses | (2,644 | ) | (1,205 | ) | (536 | ) | ||||||
| Impairment of real estate property | (8,124 | ) | (9,500 | ) | (2,600 | ) | ||||||
| Interest and other income (expense) | 2,192 | 1,168 | (153 | ) | ||||||||
| Interest expense | (47,508 | ) | (61,903 | ) | (65,325 | ) | ||||||
| Loss on extinguishment of debt and financing commitments | (1,168 | ) | (63 | ) | (2,507 | ) | ||||||
| Gain on sale of real property | 134,218 | 10,914 | — | |||||||||
| Discontinued operations | — | 30,004 | 65,554 | |||||||||
| Net income attributable to noncontrolling interests | (7,404 | ) | (4,802 | ) | (4,002 | ) | ||||||
Net income attributable to common stockholders | $ | 124,255 | $ | 29,192 | $ | 52,468 | ||||||
| F-41 |
The following table reflects our total assets by business segment as of December 31, 2015 and December 31, 2014 (amounts in thousands).
| As of December 31, | ||||||||
| 2015 | 2014 | |||||||
| Segment assets: | ||||||||
| Net investments in real property | ||||||||
| Office (1) | $ | 1,027,132 | $ | 1,069,584 | ||||
| Industrial | 61,231 | 207,655 | ||||||
| Retail | 785,854 | 652,187 | ||||||
| Debt related investments, net | 15,722 | 94,951 | ||||||
| Total segment assets, net | 1,889,939 | 2,024,377 | ||||||
| Non-segment assets: | ||||||||
| Cash and cash equivalents | 15,769 | 14,461 | ||||||
| Other non-segment assets (2) | 61,500 | 87,368 | ||||||
| Assets held for sale (3) | — | 21,927 | ||||||
| Total assets | $ | 1,967,208 | $ | 2,148,133 | ||||
| (1) | Excludes approximately $20.3 million of net investments in real property related to an office property classified as held for sale in the accompanying balance sheet as of December 31, 2014. |
| (2) | Other non-segment assets primarily consist of corporate assets including restricted cash and receivables, including straight-line rent receivable. |
| (3) | Includes other assets and restricted cash related to properties classified as held for sale in the accompanying balance sheet as of December 31, 2014. |
| 14. | INCOME TAXES |
We operate in a manner intended to qualify for treatment as a REIT for U.S. federal income tax purposes. As a REIT, we generally will not be subject to federal income taxation at the corporate level to the extent we distribute 100% of our REIT taxable income annually, as defined in the Code, to our stockholders and satisfy other requirements. To continue to qualify as a REIT for federal tax purposes, we must distribute at least 90% of our REIT taxable income annually. No material provisions have been made for federal income taxes in the accompanying financial statements. We had a gross deferred tax asset of approximately $4.4 million as of both December 31, 2015 and 2014, which is offset by a full valuation allowance. The tax years 2012 through 2014 remain open to examination by the major taxing jurisdictions to which we are subject.
| 15. | COMMITMENTS AND CONTINGENCIES |
Environmental Matters
A majority of the properties we acquire are subjected to environmental reviews either by us or the previous owners. In addition, we may incur environmental remediation costs associated with certain land parcels we may acquire in connection with the development of the land. We have acquired certain properties in urban and industrial areas that may have been leased to or previously owned by commercial and industrial companies that discharged hazardous materials. We may purchase various environmental insurance policies to mitigate our exposure to environmental liabilities. Due to the uncertainty regarding our exposure to environmental liabilities and the timing and nature of settlement of any such liabilities, we cannot estimate the effect of such potential environmental remediation on our business, financial condition, or results of operations.
| 16. | QUARTERLY FINANCIAL DATA (UNAUDITED) |
The following
tables present selected unaudited quarterly financial data for each quarter during the years ended December 31, 2015 and
2014 (amounts in thousands, except per share information). Certain reclassifications have been made to prior period results to
conform to the current presentation. Certain totals and subtotals within the following table may not sum due to de minimus rounding
adjustments. The following disclosures exclude the results from discontinued operations.
| F-42 |
| For the | ||||||||||||||||||||
| For the Quarter Ended | Year Ended | |||||||||||||||||||
| March 31, | June 30, | September 30, | December 31, | December 31, | ||||||||||||||||
| 2015 | 2015 | 2015 | 2015 | 2015 | ||||||||||||||||
| Rental revenue | $ | 59,379 | $ | 51,075 | $ | 52,854 | $ | 54,970 | $ | 218,278 | ||||||||||
| Debt related income | 3,203 | 1,584 | 807 | 1,328 | 6,922 | |||||||||||||||
| Total revenue | 62,582 | 52,659 | 53,661 | 56,298 | 225,200 | |||||||||||||||
| Total operating expenses | (44,803 | ) | (41,168 | ) | (49,406 | ) | (45,898 | ) | (181,275 | ) | ||||||||||
| Other income (expenses) | 114,422 | (11,384 | ) | (5,680 | ) | (9,624 | ) | 87,734 | ||||||||||||
| Income (loss) from continuing operations | 132,201 | 107 | (1,425 | ) | 776 | 131,659 | ||||||||||||||
| Discontinued operations | — | — | — | — | — | |||||||||||||||
| Net income (loss) | 132,201 | 107 | (1,425 | ) | 776 | 131,659 | ||||||||||||||
| Net (income) loss attributable to noncontrolling interests | (8,618 | ) | (37 | ) | 1,297 | (46 | ) | (7,404 | ) | |||||||||||
| NET INCOME (LOSS) ATTRIBUTABLE TO COMMON STOCKHOLDERS | $ | 123,583 | $ | 70 | $ | (128 | ) | $ | 730 | $ | 124,255 | |||||||||
| Net income (loss) per basic and diluted common share | ||||||||||||||||||||
| Continuing operations | $ | 0.69 | $ | 0.00 | $ | (0.00 | ) | $ | 0.01 | $ | 0.70 | |||||||||
| Discontinued operations | $ | — | $ | — | $ | — | $ | — | $ | — | ||||||||||
| NET INCOME (LOSS) PER BASIC AND DILUTED COMMON SHARE | $ | 0.69 | $ | 0.00 | $ | (0.00 | ) | $ | 0.01 | $ | 0.70 | |||||||||
| For the | ||||||||||||||||||||
| For the Quarter Ended | Year Ended | |||||||||||||||||||
| March 31, | June 30, | September 30, | December 31, | December 31, | ||||||||||||||||
| 2014 | 2014 | 2014 | 2014 | 2014 | ||||||||||||||||
| Rental revenue | $ | 55,060 | $ | 55,080 | $ | 56,793 | $ | 57,268 | $ | 224,201 | ||||||||||
| Debt related income | 2,013 | 1,760 | 1,798 | 1,825 | 7,396 | |||||||||||||||
| Total revenue | 57,073 | 56,840 | 58,591 | 59,093 | 231,597 | |||||||||||||||
| Total operating expenses | (42,259 | ) | (41,239 | ) | (51,258 | ) | (42,971 | ) | (177,723 | ) | ||||||||||
| Other expenses | (12,683 | ) | (11,927 | ) | (14,852 | ) | (10,422 | ) | (49,884 | ) | ||||||||||
| Income (loss) from continuing operations | 2,131 | 3,674 | (7,519 | ) | 5,700 | 3,990 | ||||||||||||||
| Discontinued operations | 29,857 | 142 | 5 | — | 30,004 | |||||||||||||||
| Net income (loss) | 31,988 | 3,816 | (7,514 | ) | 5,700 | 33,994 | ||||||||||||||
| Net (income) loss attributable to noncontrolling interests | (4,550 | ) | (330 | ) | 475 | (397 | ) | (4,802 | ) | |||||||||||
| NET INCOME (LOSS) ATTRIBUTABLE TO COMMON STOCKHOLDERS | $ | 27,438 | $ | 3,486 | $ | (7,039 | ) | $ | 5,303 | $ | 29,192 | |||||||||
| Net income (loss) per basic and diluted common share | ||||||||||||||||||||
| Continuing operations | $ | 0.01 | $ | 0.02 | $ | (0.04 | ) | $ | 0.03 | $ | 0.02 | |||||||||
| Discontinued operations | $ | 0.14 | $ | 0.00 | $ | 0.00 | $ | — | $ | 0.14 | ||||||||||
| NET INCOME (LOSS) PER BASIC AND DILUTED COMMON SHARE | $ | 0.15 | $ | 0.02 | $ | (0.04 | ) | $ | 0.03 | $ | 0.16 | |||||||||
17. SUBSEQUENT EVENTS
Launch of Private Placements of Delaware Statutory Trust Interests
Private Placements
On March 2, 2016, we, through the Operating Partnership, initiated a program to raise capital in private placements exempt from registration under the Securities Act of 1933, as amended (“Private Placements”) through the sale of beneficial interests (“Interests”) in specific Delaware statutory trusts holding real properties, including properties currently indirectly owned by the Operating Partnership (the “DST Program”). From 2006 through 2009, we, through our subsidiaries conducted similar private placement offerings of fractional interests in which it raised a total of $183.1 million in gross proceeds. These fractional interests were all subsequently acquired by the Operating Partnership in exchange for an aggregate of 17.7 million OP Units.
| F-43 |
Each Private Placement will offer Interests in one or more real properties placed into one or more Delaware statutory trust(s) by the Operating Partnership or its affiliates (“DST Properties”). We anticipate that these Interests may serve as replacement properties for investors seeking to complete like-kind exchange transactions under Section 1031 of the Internal Revenue Code of 1986, as amended (the “Code”). Additionally, any Interests sold to investors pursuant to such Private Placements will be leased-back by an indirect wholly owned subsidiary of the Operating Partnership on a long term basis of up to 29 years. The lease agreements are expected to be fully guaranteed by the Operating Partnership. Additionally, the Operating Partnership will retain a fair market value purchase option (“FMV Option”) giving it the right, but not the obligation, to acquire the Interests from the investors at a later time in exchange for OP Units.
Dealer Manager Agreement
In connection with the DST Program, on March 2, 2016, Dividend Capital Exchange LLC (“DCX”), a wholly owned subsidiary of our taxable REIT subsidiary that is wholly owned by the Operating Partnership, entered into a Dealer Manager Agreement with our Dealer Manager, pursuant to which the Dealer Manager agreed to conduct Private Placements for Interests reflecting an indirect ownership of up to $500 million of Interests. DCX will pay certain up-front fees and reimburse certain related expenses to the Dealer Manager with respect to capital raised through any such Private Placements. DCX is obligated to pay the Dealer Manager a dealer manager fee of up to 1.5% of gross equity proceeds raised and a commission of up to 5% of gross equity proceeds raised through the Private Placements. The Dealer Manager may re-allow such commissions and a portion of such dealer manager fee to participating broker dealers.
In addition, we, or our subsidiaries, are obligated to pay directly or reimburse the Advisor and the Dealer Manager if they pay on our behalf, any organization and offering expenses (other than selling commissions and the dealer manager fee) as and when incurred. These expenses may include reimbursements for the bona fide due diligence expenses of participating broker-dealers, supported by detailed and itemized invoices, and similar diligence expenses of investment advisers, legal fees of the Dealer Manager, reimbursements for customary travel, lodging, meals and reasonable entertainment expenses of registered persons associated with the Dealer Manager, the cost of educational conferences held by us, including costs reimbursement for registered persons associated with the Dealer Manager and registered representatives of participating broker-dealers to attend educational conferences sponsored by us, and attendance fees and costs reimbursement for registered persons associated with the Dealer Manager to attend seminars conducted by participating broker-dealers and promotional items.
We intend to recoup the costs of the selling commissions and dealer manager fees described above through a purchase price “mark-up” of the initial estimated fair value of the DST Properties to be sold to investors, thereby placing the economic burden of these up-front fees on the investors purchasing such Interests. In addition, to offset some or all of our organization and offering expenses associated with the Private Placements, we will add a purchase price mark-up of the estimated fair value of the DST Properties to be sold to investors in the amount of 1.5% of the gross equity proceeds. Collectively, these purchase price mark-ups total up to 8% of the gross equity proceeds raised in the Private Placements. Additionally, we will be paid, by investors purchasing Interests, a non-accountable reimbursement equal to 1.0% of gross equity proceeds for real estate transaction costs that we expect to incur in selling or buying these Interests. Also, investors purchasing Interests will be required to pay their own respective closing costs upon the initial sale of the interests.
Advisory Agreement
In connection with the DST Program, we, the Operating Partnership and the Advisor entered into the Ninth Amended and Restated Advisory Agreement, dated as of March 2, 2016 (the “Amended Advisory Agreement”). The Amended Advisory Agreement amends the prior advisory agreement by providing that the fixed component of the advisory fee paid to the Advisor, in consideration for the asset management services it provides on the our behalf, is now a fixed component that accrues daily in an amount equal to 1/365th of 1.15% of (a) the “Aggregate Fund NAV” (i.e., the aggregate net asset value or “NAV” of our Class E shares, Class A shares, Class W shares and Class I shares, along with the OP Units held by third parties) for such day and (b) the consideration received by us or our affiliate for selling Interests in DST Properties to third party investors, net of up-front fees and expense reimbursements payable out of gross sale proceeds from the sale of such Interests, including but not limited to sales commissions, dealer manager fees and non-accountable expense allowances. Before this amendment, the Advisor was paid based on the amount of equity outstanding, and while the Private Placement is intended to raise capital for us, cash proceeds are received the day the Interests are sold but OP Units may not be issued for several years, if at all. This amendment clarifies that the Advisor will earn compensation for managing proceeds raised in the Private Placement. We will continue to pay the Advisor a development management fee equal to 4.0% of the cost to develop, construct or improve any properties, regardless of whether they are held in fee simple or DST Properties held through leasehold interests (though we may make only minor, non-structural modifications to DST Properties). The Amended Advisory Agreement also clarifies that we must reimburse the Advisor for any private offering organization and offering expenses, such as those of the DST Program, it incurs on our behalf, including Advisor personnel costs, unless it has agreed to receive a fee in lieu of reimbursement.
| F-44 |
Limited Partnership Agreement
In connection with the launch of the DST Program, the Company, on behalf of itself as general partner and on behalf of all the limited partners thereto, entered into the Fifth Amended and Restated Limited Partnership Agreement of the Operating Partnership, dated as of March 2, 2016 (the “Amended and Restated Operating Partnership Agreement”). The Amended and Restated Operating Partnership Agreement amends the prior operating partnership agreement by establishing two series of Class E OP Units, with different redemption and registration rights. The currently existing third-party holders of Class E OP Units will now hold Series 1 Class E OP Units, and will continue to have the same redemption and registration rights they had previously, which include the right, in certain circumstances to require the Operating Partnership to redeem the OP Units for Class E shares of the Company or cash. Any purchasers of Interests in the DST Program that ultimately acquire OP Units through the FMV Option will acquire Series 2 Class E OP Units, which will have similar redemption and registration rights to those of the holders of Series 1 Class E OP Units, except that their redemption rights will in certain circumstances require the Operating Partnership to redeem the OP Units for Class I shares of the Company. In addition, the Amended and Restated Operating Partnership Agreement provides that a redemption fee of 1.5% of the shares otherwise payable to a limited partner upon redemption of Series 2 Class E Units will be paid to the Manager (defined below).
Delaware Statutory Trust Agreement
DCX Manager LLC (the “Manager”), a related party and an affiliate of the Advisor, will be engaged to act as the manager of each Delaware statutory trust holding a DST Property. While the intention is to sell 100% of the interests to third parties, DCX may hold an interest for a period of time and therefore could be subject to the following description of fees and reimbursements paid to the Manager. The trust manager will have primary responsibility for performing administrative actions in connection with the trust and any DST Property and has the sole power to determine when it is appropriate for a trust to sell a DST Property. The trust manager will be entitled to the following payments from the trust: (i) a management fee equal to a stated percentage (e.g., 1.0%) of the gross rents payable to the trust, with such amount to be set on a deal-by-deal basis, (ii) a disposition fee of 1.0% of the gross sales price of any DST Property sold to a third party, and (iii) reimbursement of certain expenses associated with the establishment, maintenance and operation of the trust and DST Properties.
Additionally, the Manager or its affiliate may earn a 1.0% loan fee for any financing arrangement sourced, negotiated and executed in connection with the DST Program. This loan fee only is payable to the Manager by new investors that purchase Interests and therefore is not paid by the Company or its affiliates.
We have evaluated subsequent events for the period from December 31, 2015, the date of these financial statements, through the date these financial statements are issued, and determined that there have been no other significant subsequent events. For information regarding dispositions and financing transactions that occurred subsequent to December 31, 2015, see “Subsequent Events” in “Item 7. Management’s Discussion and Analysis of Financial Condition and Results of Operations” of this Annual Report on Form 10-K.
| F-45 |
Report of Independent Registered Public Accounting Firm
The Board of Directors and Stockholders
Dividend Capital Diversified Property Fund Inc.:
Under date of March 3, 2016, we reported on the consolidated balance sheets of Dividend Capital Diversified Property Fund Inc. and subsidiaries (the Company) as of December 31, 2015 and 2014, and the related consolidated statements of income, comprehensive income, equity, and cash flows for each of the years in the three-year period ended December 31, 2015. In connection with our audits of the aforementioned consolidated financial statements, we also audited the related consolidated financial statement schedule, Schedule III – Real Estate and Accumulated Depreciation (Schedule III). Schedule III is the responsibility of the Company’s management. Our responsibility is to express an opinion on Schedule III based on our audits.
In our opinion, Schedule III – Real Estate and Accumulated Depreciation, when considered in relation to the basic consolidated financial statements taken as a whole, presents fairly, in all material respects, the information set forth therein.
As discussed in Note 2 to the consolidated financial statements, the Company has changed its method for reporting discontinued operations as of January 1, 2014 due to the adoption of FASB Accounting Standards Update No. 2014-08, Reporting Discontinued Operations and Disclosures of Disposals of Components of an Entity.
| /s/KPMG LLP |
Denver, Colorado
March 3, 2016
| F-46 |
Dividend Capital Diversified Property Fund Inc.
Schedule III — Real Estate and Accumulated Depreciation
As of December 31, 2015
(dollar amounts in thousands)
| Initial Cost to Company | Gross Amount Carried at December 31, 2015 | ||||||||||||||||||||||||||||||
| Property | Market | No. of Buildings | Encumbrances (1) | Land | Buildings and Improvements (2) | Total Costs | Cost Capitalized or Adjustments Subsequent to Acquisition (4) | Land | Buildings and Improvements (2) | Total Costs (3, 4) | Accumulated Depreciation (4) | Acquisition Date | Depreciable Life (years) | ||||||||||||||||||
| Office Properties: | |||||||||||||||||||||||||||||||
| Jay Street | Silicon Valley, CA | 3 | $ | 23,500 | $ | 13,859 | $ | 21,974 | $ | 35,833 | $ | 6,079 | $ | 13,859 | $ | 28,053 | $ | 41,912 | $ | 9,412 | 6/28/06 | 3-40 | |||||||||
| Bala Pointe | Philadelphia, PA | 1 | 24,000 | 10,115 | 27,516 | 37,631 | 5,851 | 10,115 | 33,367 | 43,482 | 12,584 | 8/28/06 | 2-40 | ||||||||||||||||||
| 40 Boulevard | Chicago, IL | 1 | 7,890 | 2,611 | 7,797 | 10,408 | 6,210 | 2,611 | 14,007 | 16,618 | 7,112 | 1/24/07 | 3-40 | ||||||||||||||||||
| Washington Commons | Chicago, IL | 10 | 21,300 | 9,019 | 16,622 | 25,641 | 1,485 | 6,302 | 20,824 | 27,126 | 10,150 | 2/1/07 | 1-40 | ||||||||||||||||||
| Joyce Blvd | Fayetteville, AR | 1 | — | 2,699 | 8,996 | 11,695 | — | 2,699 | 8,996 | 11,695 | 2,889 | 9/28/07 | 10-40 | ||||||||||||||||||
| Eden Prairie (ATK) | Minneapolis/St Paul, MN | 1 | — | 3,538 | 25,865 | 29,403 | 112 | 3,538 | 25,977 | 29,515 | 6,790 | 10/3/08 | 5-40 | ||||||||||||||||||
| Austin-Mueller Healthcare | Austin, TX | 1 | — | 2,663 | 42,315 | 44,978 | — | 2,663 | 42,315 | 44,978 | 11,351 | 12/23/08 | 11-40 | ||||||||||||||||||
| 1300 Connecticut | Washington, DC | 1 | 45,041 | 25,177 | 41,250 | 66,427 | 2,783 | 25,177 | 44,033 | 69,210 | 18,930 | 3/10/09 | 5-40 | ||||||||||||||||||
| Campus Road Office Center | Princeton, NJ | 1 | — | 5,302 | 45,773 | 51,075 | 158 | 5,302 | 45,931 | 51,233 | 11,390 | 11/3/09 | 10-40 | ||||||||||||||||||
| Preston Sherry Plaza | Dallas, TX | 1 | — | 7,500 | 22,303 | 29,803 | 6,072 | 7,500 | 28,375 | 35,875 | 10,213 | 12/16/09 | 3-40 | ||||||||||||||||||
| Harborside Plaza | Northern New Jersey | 1 | 107,248 | 16,800 | 193,742 | 210,542 | 14,004 | 16,800 | 207,746 | 224,546 | 66,422 | 6/25/10 | 3-40 | ||||||||||||||||||
| Colshire Drive | Washington, DC | 1 | — | 21,100 | 157,983 | 179,083 | (5 | ) | 21,100 | 157,978 | 179,078 | 60,520 | 6/25/10 | 7-40 | |||||||||||||||||
| Sunset Hills Road | Washington, DC | 1 | — | 2,700 | 31,915 | 34,615 | 36 | 2,700 | 31,951 | 34,651 | 14,087 | 6/25/10 | 5-40 | ||||||||||||||||||
| Sybase Drive | East Bay, CA | 1 | — | 8,400 | 136,797 | 145,197 | 142 | 8,400 | 136,939 | 145,339 | 54,156 | 6/25/10 | 7-40 | ||||||||||||||||||
| 655 Montgomery | San Francisco, CA | 1 | 56,134 | 40,327 | 73,961 | 114,288 | 5,950 | 32,633 | 87,605 | 120,238 | 13,046 | 11/7/13 | 2-40 | ||||||||||||||||||
| 1st Avenue Plaza | Denver, CO | 2 | — | 15,713 | 65,252 | 80,965 | 1,142 | 15,713 | 66,394 | 82,107 | 5,922 | 8/22/14 | 1-40 | ||||||||||||||||||
| Rialto | Austin, TX | 2 | — | 5,094 | 32,652 | 37,746 | 252 | 5,094 | 32,904 | 37,998 | 2,344 | 1/15/15 | 1-40 | ||||||||||||||||||
| City View | Austin, TX | 2 | — | 4,606 | 65,250 | 69,856 | 587 | 4,606 | 65,837 | 70,443 | 2,415 | 4/24/15 | 1-40 | ||||||||||||||||||
| Venture Corporate Center | South Florida | 3 | — | 12,047 | 34,151 | 46,198 | (16 | ) | 12,047 | 34,135 | 46,182 | 1,306 | 8/6/15 | 1-40 | |||||||||||||||||
| Bank of America Tower | South Florida | 1 | — | 5,030 | 30,917 | 35,947 | — | 5,030 | 30,917 | 35,947 | — | 12/11/15 | 1-40 | ||||||||||||||||||
| Total Office Properties | 36 | $ | 285,113 | $ | 214,300 | $ | 1,083,031 | $ | 1,297,331 | $ | 50,842 | $ | 203,889 | $ | 1,144,284 | $ | 1,348,173 | $ | 321,039 | ||||||||||||
| F-47 |
| Initial Cost to Company | Gross Amount Carried at December 31, 2015 | ||||||||||||||||||||||||||||||
| Property | Market | No. of Buildings | Encumbrances (1) | Land | Buildings and Improvements (2) | Total Costs | Cost Capitalized or Adjustments Subsequent to Acquisition (4) | Land | Buildings and Improvements (2) | Total Costs (3, 4) | Accumulated Depreciation (4) | Acquisition Date | Depreciable Life (years) | ||||||||||||||||||
| Industrial Properties: | |||||||||||||||||||||||||||||||
| Shiloh Road | Dallas, TX | 3 | $ | 22,700 | $ | 5,162 | $ | 30,192 | $ | 35,354 | $ | 392 | $ | 5,165 | $ | 30,581 | $ | 35,746 | $ | 11,244 | 12/21/06 | 6-40 | |||||||||
| 6900 Riverport | Louisville, KY | 1 | — | 751 | 4,131 | 4,882 | 434 | 751 | 4,565 | 5,316 | 1,348 | 9/17/08 | 3-40 | ||||||||||||||||||
| 7000 Riverport | Louisville, KY | 1 | — | 1,124 | 6,821 | 7,945 | 778 | 1,124 | 7,599 | 8,723 | 2,535 | 9/17/08 | 5-40 | ||||||||||||||||||
| 7050 Riverport | Louisville, KY | 1 | — | 672 | 3,862 | 4,534 | 252 | 672 | 4,114 | 4,786 | 1,564 | 9/17/08 | 5-40 | ||||||||||||||||||
| 7201 Riverport | Louisville, KY | 1 | — | 1,130 | 6,614 | 7,744 | 703 | 1,130 | 7,317 | 8,447 | 2,352 | 9/17/08 | 3-40 | ||||||||||||||||||
| South Columbia | Central Kentucky | 1 | — | 730 | 25,092 | 25,822 | 2,475 | 730 | 27,567 | 28,297 | 11,040 | 6/25/10 | 7-40 | ||||||||||||||||||
| Total Industrial Properties | 8 | $ | 22,700 | $ | 9,569 | $ | 76,712 | $ | 86,281 | $ | 5,034 | $ | 9,572 | $ | 81,743 | $ | 91,315 | $ | 30,083 | ||||||||||||
| F-48 |
| Initial Cost to Company | Gross Amount Carried at December 31, 2015 | ||||||||||||||||||||||||||||||
| Property | Market | No. of Buildings | Encumbrances (1) | Land | Buildings and Improvements (2) | Total Costs | Cost Capitalized or Adjustments Subsequent to Acquisition (4) | Land | Buildings and Improvements (2) | Total Costs (3, 4) | Accumulated Depreciation (4) | Acquisition Date | Depreciable Life (years) | ||||||||||||||||||
| Retail Properties: | |||||||||||||||||||||||||||||||
| Bandera Road | San Antonio, TX | 1 | $ | 21,500 | $ | 8,221 | $ | 23,472 | $ | 31,693 | $ | 376 | $ | 8,221 | $ | 23,848 | $ | 32,069 | $ | 7,342 | 2/1/07 | 5-40 | |||||||||
| Beaver Creek | Raleigh, NC | 1 | 26,200 | 13,017 | 31,375 | 44,392 | 1,161 | 13,017 | 32,536 | 45,553 | 9,338 | 5/11/07 | 5-40 | ||||||||||||||||||
| Centerton Square | Philadelphia, PA | 1 | 67,800 | 26,488 | 76,838 | 103,326 | 1,800 | 26,488 | 78,638 | 105,126 | 24,301 | 5/11/07 | 5-40 | ||||||||||||||||||
| CB Square | Jacksonville, FL | 1 | — | 3,768 | 16,660 | 20,428 | (934 | ) | 3,768 | 15,726 | 19,494 | 4,009 | 6/27/07 | 6-40 | |||||||||||||||||
| Braintree | Greater Boston | 1 | — | 9,270 | 31,266 | 40,536 | 581 | 9,270 | 31,847 | 41,117 | 9,780 | 8/1/07 | 5-40 | ||||||||||||||||||
| Holbrook | Greater Boston | 1 | — | 4,590 | 14,724 | 19,314 | 202 | 4,590 | 14,926 | 19,516 | 5,212 | 8/1/07 | 10-40 | ||||||||||||||||||
| Kingston | Greater Boston | 1 | 10,574 | 8,580 | 12,494 | 21,074 | 1,178 | 8,580 | 13,672 | 22,252 | 4,824 | 8/1/07 | 5-40 | ||||||||||||||||||
| Manomet | Greater Boston | 1 | — | 1,890 | 6,480 | 8,370 | 379 | 1,890 | 6,859 | 8,749 | 2,269 | 8/1/07 | 5-40 | ||||||||||||||||||
| Orleans | Greater Boston | 1 | — | 8,780 | 23,683 | 32,463 | 473 | 8,780 | 24,156 | 32,936 | 7,062 | 8/1/07 | 2-40 | ||||||||||||||||||
| Sandwich | Greater Boston | 1 | 15,825 | 7,380 | 25,778 | 33,158 | 79 | 7,380 | 25,857 | 33,237 | 7,133 | 8/1/07 | 5-40 | ||||||||||||||||||
| Wareham | Greater Boston | 1 | 24,400 | 13,130 | 27,030 | 40,160 | 1,719 | 13,130 | 28,749 | 41,879 | 8,727 | 8/1/07 | 5-40 | ||||||||||||||||||
| Abington | Greater Boston | 1 | — | 14,396 | 594 | 14,990 | — | 14,396 | 594 | 14,990 | 594 | 8/1/07 | 0 | ||||||||||||||||||
| Hyannis | Greater Boston | 1 | — | 10,405 | 917 | 11,322 | — | 10,405 | 917 | 11,322 | 419 | 8/1/07 | 18 | ||||||||||||||||||
| Mansfield | Greater Boston | 1 | — | 5,340 | 16,490 | 21,830 | — | 5,340 | 16,490 | 21,830 | 4,259 | 8/1/07 | 16-40 | ||||||||||||||||||
| Meriden | Greater Boston | 1 | — | 6,560 | 22,014 | 28,574 | — | 6,560 | 22,014 | 28,574 | 5,993 | 8/1/07 | 13-40 | ||||||||||||||||||
| Weymouth | Greater Boston | 1 | 16,000 | 5,170 | 19,396 | 24,566 | (257 | ) | 4,913 | 19,396 | 24,309 | 5,818 | 8/1/07 | 40 | |||||||||||||||||
| Whitman 475 Bedford Street | Greater Boston | 1 | — | 3,610 | 11,682 | 15,292 | — | 3,610 | 11,682 | 15,292 | 3,118 | 8/1/07 | 16-40 | ||||||||||||||||||
| Brockton Eastway Plaza | Greater Boston | 1 | — | 2,530 | 2,074 | 4,604 | 748 | 2,530 | 2,822 | 5,352 | 1,136 | 8/1/07 | 5-40 | ||||||||||||||||||
| Cohasset | Greater Boston | 1 | — | 3,920 | 7,765 | 11,685 | 1,028 | 3,920 | 8,793 | 12,713 | 2,614 | 8/1/07 | 6-40 | ||||||||||||||||||
| Hanover | Greater Boston | 1 | — | 1,490 | 5,084 | 6,574 | 768 | 1,490 | 5,852 | 7,342 | 1,719 | 8/1/07 | 5-40 | ||||||||||||||||||
| Rockland 360-372 Market | Greater Boston | 1 | — | 1,200 | 2,437 | 3,637 | — | 1,200 | 2,437 | 3,637 | 1,033 | 8/1/07 | 40 | ||||||||||||||||||
| Brockton Westgate Plaza | Greater Boston | 1 | — | 3,650 | 6,507 | 10,157 | 34 | 3,650 | 6,541 | 10,191 | 2,357 | 8/1/07 | 11-40 | ||||||||||||||||||
| Harwich | Greater Boston | 1 | 5,337 | 5,290 | 8,814 | 14,104 | — | 5,290 | 8,814 | 14,104 | 2,246 | 10/18/07 | 21-40 | ||||||||||||||||||
| New Bedford | Greater Boston | 1 | 7,580 | 3,790 | 11,152 | 14,942 | — | 3,790 | 11,152 | 14,942 | 2,721 | 10/18/07 | 22-40 | ||||||||||||||||||
| Norwell | Greater Boston | 1 | 4,986 | 5,850 | 14,547 | 20,397 | — | 5,850 | 14,547 | 20,397 | 3,798 | 10/18/07 | 15-40 | ||||||||||||||||||
| Greater DC Retail | Washington, DC | 1 | 70,000 | 19,779 | 42,515 | 62,294 | 239 | 19,781 | 42,752 | 62,533 | 14,688 | 4/6/09 | 5-40 | ||||||||||||||||||
| Springdale | Greater Boston | 1 | — | 11,866 | 723 | 12,589 | 8 | 11,866 | 731 | 12,597 | 319 | 2/18/11 | 6-20 | ||||||||||||||||||
| Saugus | Greater Boston | 1 | — | 3,783 | 9,713 | 13,496 | 91 | 3,783 | 9,804 | 13,587 | 4,071 | 3/17/11 | 5-40 | ||||||||||||||||||
| Durgin Square | Greater Boston | 2 | — | 7,209 | 21,055 | 28,264 | — | 7,209 | 21,055 | 28,264 | 2,256 | 5/28/14 | 4-40 | ||||||||||||||||||
| Salt Pond | Greater Boston | 2 | — | 8,759 | 40,233 | 48,992 | 15 | 8,759 | 40,248 | 49,007 | 2,658 | 11/4/14 | 2-40 | ||||||||||||||||||
| South Cape | Greater Boston | 6 | — | 9,936 | 27,552 | 37,488 | (242 | ) | 9,936 | 27,310 | 37,246 | 1,406 | 3/18/15 | 1-40 | |||||||||||||||||
| Shenandoah | South Florida | 3 | 10,834 | 10,501 | 27,397 | 37,898 | — | 10,501 | 27,397 | 37,898 | 794 | 8/6/15 | 1-40 | ||||||||||||||||||
| Chester Springs | Northern New Jersey | 4 | — | 7,376 | 51,155 | 58,531 | (47 | ) | 7,376 | 51,108 | 58,484 | 821 | 10/8/15 | 1-40 | |||||||||||||||||
| Yale Village | Tulsa, OK | 4 | — | 3,492 | 30,655 | 34,147 | — | 3,492 | 30,655 | 34,147 | — | 12/9/15 | 3-40 | ||||||||||||||||||
| Total Retail Properties | 49 | $ | 281,036 | $ | 261,016 | $ | 670,271 | $ | 931,287 | $ | 9,399 | $ | 260,761 | $ | 679,925 | $ | 940,686 | $ | 154,835 | ||||||||||||
| Grand Total | 93 | $ | 588,849 | $ | 484,885 | $ | 1,830,014 | $ | 2,314,899 | $ | 65,275 | $ | 474,222 | $ | 1,905,952 | $ | 2,380,174 | $ | 505,957 | ||||||||||||
| (1) | Encumbrances represents mortgage debt principal balances encumbering each property as of December 31, 2015. |
| (2) | Building and improvements include intangible lease assets. |
| (3) | As of December 31, 2015, the aggregate cost for federal income tax purposes of investments in real property was approximately $2.1 billion (unaudited). |
| (4) | Amount is presented net of impairments and other write-offs of tenant-related assets that were recorded at acquisition as part of our purchase price accounting. Such write-offs are the results of lease expirations and terminations. |
| F-49 |
The following table summarizes activity for real estate and accumulated depreciation for the years ended December 31, 2015, 2014, and 2013 (amounts in thousands).
| For the Year Ended December 31, | ||||||||||||
| 2015 | 2014 | 2013 | ||||||||||
| Investments in real estate: | ||||||||||||
| Balance at the beginning of the year | $ | 2,472,926 | $ | 2,570,480 | $ | 2,819,550 | ||||||
| Acquisitions of operating properties | 357,811 | 158,221 | 114,827 | |||||||||
| Improvements | 25,557 | 12,512 | 26,680 | |||||||||
| Basis of operating properties disposed of | (467,996 | ) | (258,787 | ) | (387,977 | ) | ||||||
| Impairment of real property | (8,124 | ) | (9,500 | ) | (2,600 | ) | ||||||
| Balance at the end of the year (1) | $ | 2,380,174 | $ | 2,472,926 | $ | 2,570,480 | ||||||
| Accumulated depreciation: | ||||||||||||
| Balance at the beginning of the year | $ | 523,246 | $ | 502,847 | $ | 482,782 | ||||||
| Real estate depreciation and amortization expense (2) | 83,114 | 88,994 | 108,191 | |||||||||
| Above-market lease assets amortization expenses | 5,216 | 6,708 | 7,293 | |||||||||
| Accumulated depreciation and amortization written off (3) | (105,619 | ) | (75,303 | ) | (95,419 | ) | ||||||
| Balance at the end of the year | $ | 505,957 | $ | 523,246 | $ | 502,847 | ||||||
| (1) | Amounts for the years ended December 31, 2014 and 2013 include approximately $30.1 million and $193.6 million, respectively, of investments in real estate related to properties classified as held for sale. |
| (2) | Amount for the year ended December 31, 2013 includes approximately $21.0 million of real estate depreciation and amortization expenses that is included in discontinued operations in our accompanying statements of income. |
| (3) | Amounts represent accumulated depreciation and amortization written off due to real property dispositions and early lease termination. |
| F-50 |
SIGNATURES
Pursuant to the requirements of Section 13 or 15(d) of the Securities Exchange Act of 1934, the Registrant has duly caused this report to be signed on its behalf by the undersigned, thereunto duly authorized on March 3, 2016.
| DIVIDEND CAPITAL DIVERSIFIED PROPERTY FUND INC. | ||
| By: |
/S/ JEFFREY L. JOHNSON | |
| Name: | Jeffrey L. Johnson | |
| Title: | Chief Executive Officer | |
Pursuant to the requirements of the Securities Exchange Act of 1934, this report has been signed below by the following persons on behalf of the Registrant and in the capacities indicated and on March 3, 2016.
|
Signature |
Title | |
|
/s/ jeffrey l. johnson |
Chief Executive Officer (principal executive officer) | |
| Jeffrey L. Johnson | ||
|
/s/ richard d. kincaid |
Chairman of the Board and Director | |
| Richard D. Kincaid | ||
|
/s/ Charles B. Duke |
Director | |
| Charles B. Duke | ||
|
/s/ Daniel J. Sullivan |
Director | |
| Daniel J. Sullivan | ||
|
/s/ John P. Woodberry |
Director | |
| John P. Woodberry | ||
|
/s/ John A. Blumberg |
Director | |
| John A. Blumberg | ||
|
/s/ M. Kirk Scott |
Chief Financial Officer and Treasurer (principal financial officer and principal accounting officer) | |
| M. Kirk Scott |
| F-51 |