Attached files
| file | filename |
|---|---|
| 8-K - FORM 8-K - EAGLE BANCORP INC | tm2030828-1_8k.htm |
Exhibit 99.1

Investor Presentation Ticker: EGBN EagleBankCorp.com September 2020
Forward Looking Statements 2 This presentation contains forward looking statements within the meaning of the Securities and Exchange Act of 1934 , as amended, including statements of goals, intentions, and expectations as to future trends, plans, events or results of Company operations and policies and regarding general economic conditions . In some cases, forward - looking statements can be identified by use of words such as “may,” “will,” “anticipates,” “believes,” “expects,” “plans,” “estimates,” “potential,” “continue,” “should,” and similar words or phrases . These statements are based upon current and anticipated economic conditions, nationally and in the Company’s market, interest rates and interest rate policy, competitive factors and other conditions which by their nature, are not susceptible to accurate forecast and are subject to significant uncertainty . For details on factors that could affect these expectations, see the risk factors and other cautionary language included in the Company’s Annual Report on Form 10 - K and other periodic and current reports filed with the SEC . Because of these uncertainties and the assumptions on which this discussion and the forward - looking statements are based, actual future operations and results in the future may differ materially from those indicated herein . Readers are cautioned against placing undue reliance on any such forward - looking statements . The Company’s past results are not necessarily indicative of future performance . The Company does not undertake to publicly revise or update forward - looking statements in this presentation to reflect events or circumstances that arise after the date of this presentation, except as may be required under applicable law . This presentation was delivered digitally . The Company makes no representation that subsequent to delivery of the presentation it was not altered . For the most current, accurate information, please refer to www . eaglebankcorp . com and go to the Investor Relations tab . For further information on the Company please contact : Michael T . Flynn P 240 - 497 - 2040 E mflynn@eaglebankcorp . com
Investment Rationale 3 Highly profitable, with balanced financial performance Strategically positioned in the 5th largest regional economy in the U.S. Strong capital ratios Consistent organic growth of loans and deposits Dedicated, diverse and experienced Board focused on vision and governance NOTE: Financial data at or for the quarter ended June 30, 2020

Company Overview 4 • Eagle Bancorp, Inc. is a highly profitable community bank focused on the Washington, DC metropolitan area • Commercially - oriented business model with deep relationships of loans, core deposits and related products • Recognized expertise in CRE, C&I and residential mortgage lending • Streamlined network of 20 branches and 2 lending offices located in Northern Virginia, Suburban Maryland and the District of Columbia • Successful long term organic growth based on knowledge and close ties to our community Data as - of June 30, 2020

Summary Statistics 5 Total Assets $ 9 .8 billion Total Loans $ 8 . 0 billion Total Deposits $ 7 . 9 billion Tangible Common Equity $ 1 . 1 billion Shares Outstanding (at close August 31, 2020) 32,228,636 Market Capitalization (at close August 31, 2020) $ 928 million Tangible Book Value per Common Share $ 33.62 Institutional Ownership 81 % Member of Russell 2000 yes Member of S&P SmallCap 600 yes NOTE: Financial data at or for the quarter ended June 30, 2020 unless otherwise noted (1) (1)

Key Financial Metrics 6 • Above Peer Returns: ROAA | 1.12% ; ROAE | 9.84% • Strong Capital Ratios: Tier 1 Leverage Ratio | 10.63% ; Total Risk Based Capital Ratio | 16.26% • Well - Managed Asset Quality: NPAs/Assets | 0.69% ; NCOs/Average Loans | 0.36% • Operating Leverage with streamlined branch system: Efficiency Ratio | 37.18% • Favorable Net Interest Margin | 3.26% • DDAs as a percentage of Average Deposits | 31.89% • Cash Dividend: Yield | 1.81% ; Dividend payout ratio | 20.75% NOTE: Financial data at or for the quarter ended June 30, 2020

EagleBank Growth Strategy 7 • Profitability – Pricing discipline to preserve Net Interest Margin – Prudent expense management with streamlined branch system to maintain Efficiency Ratio • Vigilant Management of Credit Quality – COVID task force established to manage impacted credits – Maintain a prudent portfolio mix: C&I, CRE and Construction – Enhanced monitoring of individual credits – Expanded stress testing • Emphasis on Organic Growth – Only 3.2% deposit market share in DC Metro Area – Significant opportunities to expand C&I business lines including loans and treasury management products – Attract new relationships and develop cross sell opportunities – Enhance infrastructure to support growth beyond $10 billion in assets • Opportunities for Noninterest Income – Residential mortgage origination, FHA commercial mortgage origination & sales, SBA guaranteed loan origination & sales, treasury management services, insurance

Key Success Factors 8 • Building and maintaining core relationships – Cross sales – Focus on key customers • Maintenance of strong credit culture – Conservative underwriting criteria and loan policies – Disciplined committee approval and review process – Portfolio is balanced among C&I, CRE and Construction loans – Periodic loan and portfolio stress testing – Proactive identification and resolution of problem credits • Built and preserved a strong capital position and balance sheet – Nine capital raising events since August 2008 – Consistent quarterly profitability bolsters the capital position – Strong Capital Ratios even after returning $128 million of capital to shareholders through the Cash Dividend and Share Repurchase Program initiated in 2019 • Disciplined ALCO process • Maintained focus on areas of strength – Concentration on core geographic markets and products • Proper infrastructure to support the increased volume of business and regulation • Comprehensive Management and Board level reporting • Human Resources – Recruiting of strong, seasoned bankers with local market knowledge and experience – Well designed, incentive based compensation plans – Stability of staff, low turnover rate

Market Information – Washington, DC MSA 9 • Population 6.2 Million – 6th largest market in the U.S. • Employment 3.1 Million – Recovery jobs began in June, 2020. After losing over 350,000 jobs in March, April and May, the Region had net job growth of 90,000 new jobs in June and July – Largest job losses were in the lower income sectors of Hospitality & Food Service and Retail Trades, Employment has been steady in higher paying Business Services sector. Federal government employment and spending has been stable – Unemployment rate of 8.0% vs. US average of 10.2% (July 2020) • Gross Regional Product (GRP) $ 510 Billion* – 5th largest regional economy in the U.S. – Highest median household income of any major US market – *Revised forecast for 2020 is $510 Billion, a (5.65%) decrease – Forecast for 2021 is a 4% increase in GRP – Federal Government Spending is expected to increase due to stimulus programs

Greater Washington Economy 10 SOURCE: Stephen S. Fuller Institute - George Mason University Total Federal Spending = 30.9% of GRP GRP Contribution by Sub - market Education & Health Care 5.8% Other 1.5% Non-Local Business 15.5% Associations 1.8% Hospitality 2.7% International 3.8% Other Federal 16.8% Federal Procurement 14.1% Local Business 38.0% Suburban Maryland 28.0% District of Columbia 24.0% Northern Virginia 48.0% Gross Regional Product $ 541 Billion

295 495 95 495 495 270 395 66 66 Bethesda Lanham Chevy Chase Twinbrook Rockville Shady Grove Rosslyn Ballston Silver Spring Park Potomac Merrifield Alexandria Fairfax Tysons Corner Reston Dulles Town Center Chantilly HQ RHQ RHQ MONTGOMERY COUNTY PRINCE GEORGE’S COUNTY FAIRFAX COUNTY ARLINGTON COUNTY LOUDOUN COUNTY DC MD MD VA Corporate Headquarters Regional Headquarters Loan Office Branch Branch System Lending Office Virginia 9 Maryland 6 2 Washington, DC 5 Total 20 2 EagleBank Locations 11

Leading Deposit Share Among DC Community Banks 12 NOTE: Washington, D.C. Metro Area as defined in FDIC Summary of Deposits Report. Data excludes: E*Trade whose deposits are substantially from outside of the defined market area. SOURCE: FDIC, as of June 30, 2018 and June 30, 2019. 76.4% (Dollar values in thousands) Washington, DC Metropolitan Area Local June 30, June 30, 2019 Community 2018 2019 Annual Market Rank Banks Company Name Branches Balance Balance Growth Share 1 Bank of America Corp. 149 36,020,840 38,188,832 6.0% 17.5% 2 Capital One Financial Corp. 104 32,472,108 36,385,715 12.1% 16.6% 3 Wells Fargo & Co. 156 29,004,206 27,965,536 -3.6% 12.8% 4 SunTrust Banks Inc. 137 18,971,412 18,829,928 -0.7% 8.6% 5 BB&T Corp. 153 14,122,059 14,314,193 1.4% 6.5% 6 PNC Financial Services Group Inc. 178 13,829,853 14,121,929 2.1% 6.5% 7 Citigroup Inc. 33 8,831,000 8,748,000 -0.9% 4.0% 8 United Bankshares Inc. 64 8,491,143 8,603,932 1.3% 3.9% 9 1 Eagle Bancorp Inc. 20 6,344,313 7,011,807 10.5% 3.2% 10 2 Sandy Spring Bancorp Inc. 47 4,864,852 5,304,062 9.0% 2.4% 11 HSBC Holdings Plc 12 3,459,642 4,586,832 32.6% 2.1% 12 Toronto-Dominion Bank 50 3,950,139 4,407,148 11.6% 2.0% 13 M&T Bank Corp 74 4,362,246 4,164,848 -4.5% 1.9% 14 3 Atlantic Union Bank 33 1,836,408 3,949,701 115.1% 1.8% 15 4 Burke & Herbert Bank & Trust Co. 25 2,329,599 2,398,132 2.9% 1.1% 16 5 Revere Bank 8 1,523,792 1,677,877 10.1% 0.8% 17 6 Old Line Bank 19 1,321,437 1,536,111 16.2% 0.7% 18 7 John Marshall Bank 8 976,132 1,266,237 29.7% 0.6% 19 8 First Virginia Community Bank 10 1,011,230 1,253,752 24.0% 0.6% 20 9 Community Bank of the Chesapeake 9 976,279 1,127,550 15.5% 0.5% 21 Amalgamated Bank 1 978,551 1,027,077 5.0% 0.5% 22 10 Capital Bank 4 921,829 1,023,173 11.0% 0.5% 23 11 Main Street Bank 6 803,223 1,013,455 26.2% 0.5% 24 12 Congressional Bank 6 844,176 922,457 9.3% 0.4% 25 13 SONABANK 16 541,282 657,042 21.4% 0.3% All Other Market Participants 225 9,825,749 8,312,355 -15.4% 3.8% Market Total 1,547 208,613,500 218,797,681 4.9% 100.0%

Total Assets $0 $500 $1,000 $1,500 $2,000 $2,500 $3,000 $3,500 $4,000 $4,500 $5,000 $5,500 $6,000 $6,500 $7,000 $7,500 $8,000 $8,500 $9,000 $9,500 $10,000 $10,500 15Q2 15Q3 15Q4 16Q1 16Q2 16Q3 16Q4 17Q1 17Q2 17Q3 17Q4 18Q1 18Q2 18Q3 18Q4 19Q1 19Q2 19Q3 19Q4 20Q1 20Q2 Consistent Balance Sheet Growth 13 NOTE: *Q4 2017 is shown on an operating basis. $9,800 * Millions of Dollars
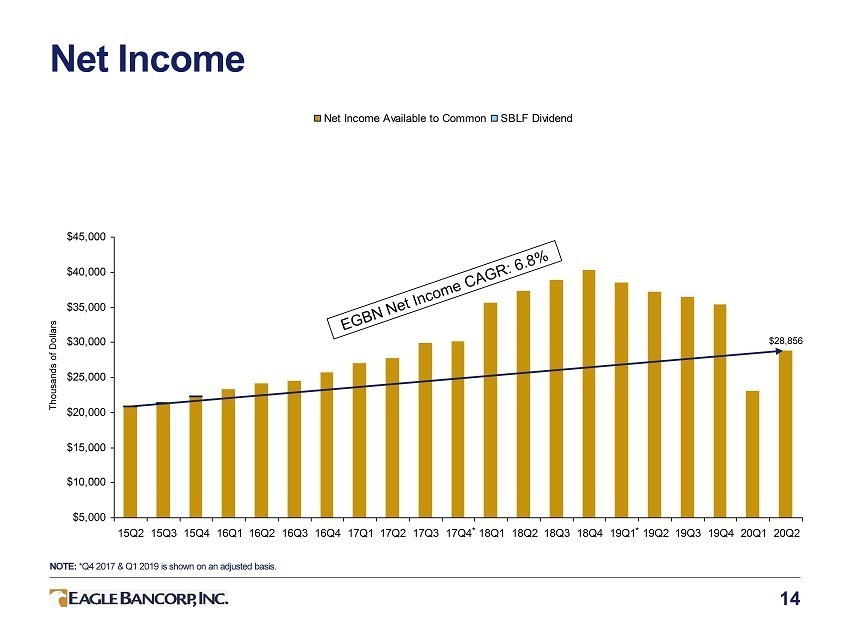
$5,000 $10,000 $15,000 $20,000 $25,000 $30,000 $35,000 $40,000 $45,000 15Q2 15Q3 15Q4 16Q1 16Q2 16Q3 16Q4 17Q1 17Q2 17Q3 17Q4 18Q1 18Q2 18Q3 18Q4 19Q1 19Q2 19Q3 19Q4 20Q1 20Q2 Net Income Available to Common SBLF Dividend Net Income 14 NOTE: *Q4 2017 & Q1 2019 is shown on an adjusted basis. $28,856 * * Thousands of Dollars
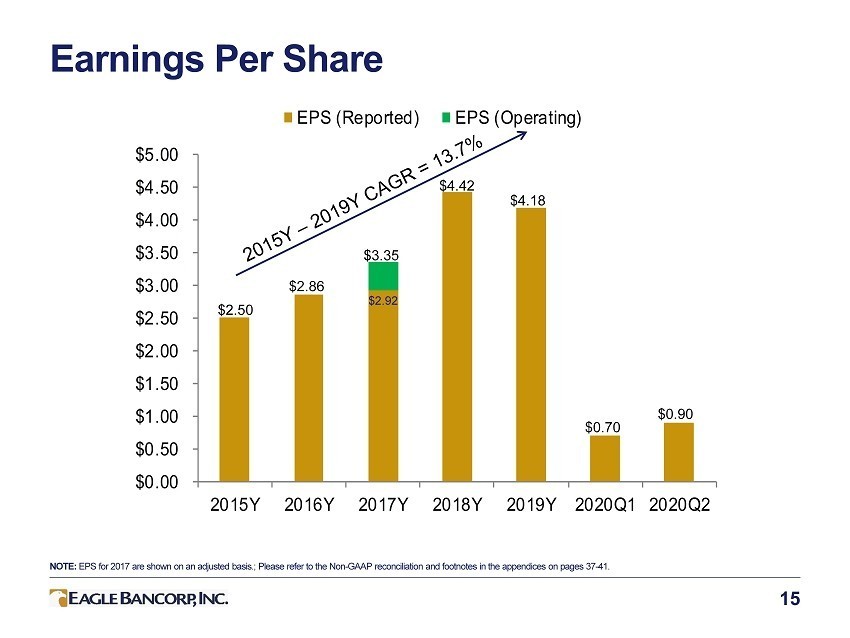
$0.00 $0.50 $1.00 $1.50 $2.00 $2.50 $3.00 $3.50 $4.00 $4.50 $5.00 2015Y 2016Y 2017Y 2018Y 2019Y 2020Q1 2020Q2 EPS (Reported) EPS (Operating) Earnings Per Share 15 NOTE: EPS for 2017 are shown on an adjusted basis.; Please refer to the Non - GAAP reconciliation and footnotes in the appendices on pages 37 - 41. $2.50 $2.86 $3.35 $2.92 $4.42 $ 4 .18 $0.70 $0.90
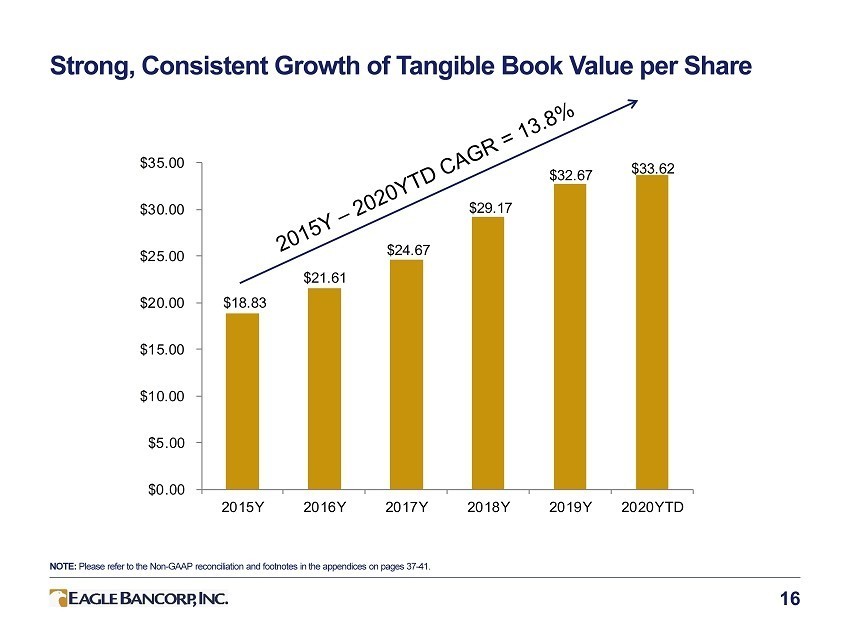
$18.83 $21.61 $24.67 $29.17 $32.67 $33.62 $0.00 $5.00 $10.00 $15.00 $20.00 $25.00 $30.00 $35.00 2015Y 2016Y 2017Y 2018Y 2019Y 2020YTD Strong, Consistent Growth of Tangible Book Value per Share 16 NOTE: Please refer to the Non - GAAP reconciliation and footnotes in the appendices on pages 37 - 41.

Competitive Net Interest Margin in Challenging Rate Environment 17 NOTE: Bank Holding Company Performance Report Peer Group represents companies with consolidated assets between $3 billion and $10 b ill ion. 4.33% 4.16% 4.15% 4.10% 3.77% 3.49% 3.26% 3.49% 3.48% 3.53% 3.58% 3.49% 3.36% 2.00% 2.50% 3.00% 3.50% 4.00% 4.50% 2015Y 2016Y 2017Y 2018Y 2019Y 2020Q1 2020Q2 EGBN Peer Group

4.69% 4.60% 4.73% 5.09% 5.00% 4.55% 3.91% 3.93% 3.93% 4.06% 4.38% 4.49% 4.29% 2.00% 2.50% 3.00% 3.50% 4.00% 4.50% 5.00% 5.50% 2015Y 2016Y 2017Y 2018Y 2019 2020Q1 2020Q2 Yield on Average Earning Assets EGBN Peer Group Yields and Cost of Funds 18 NOTE: Bank Holding Company Performance Report Peer Group represents companies with consolidated assets between $3 billion and $10 b ill ion. * Impact of July 2016 Sub - Debt Raise in 2016 was (5bps). The Sub - Debt raise impact on Cost of Funds in 2016 was 4bps. * * 5.24% 5.11% 5.17% 5.54% 5.45% 5.07% 4.63% 4.48% 4.41% 4.52% 4.85% 4.98% 4.75% 1.00% 2.00% 3.00% 4.00% 5.00% 6.00% 7.00% 2015Y 2016Y 2017Y 2018Y 2019Y 2020Q1 2020Q2 Yield on Loans EGBN Peer Group 0.36% 0.44% 0.58% 0.99% 1.23% 1.06% 0.65% 0.42% 0.44% 0.54% 0.81% 1.02% 0.87% 0.00% 0.25% 0.50% 0.75% 1.00% 1.25% 1.50% 2015Y 2016Y 2017Y 2018Y 2019Y 2020Q1 2020Q2 Cost of Funds EGBN Peer Group
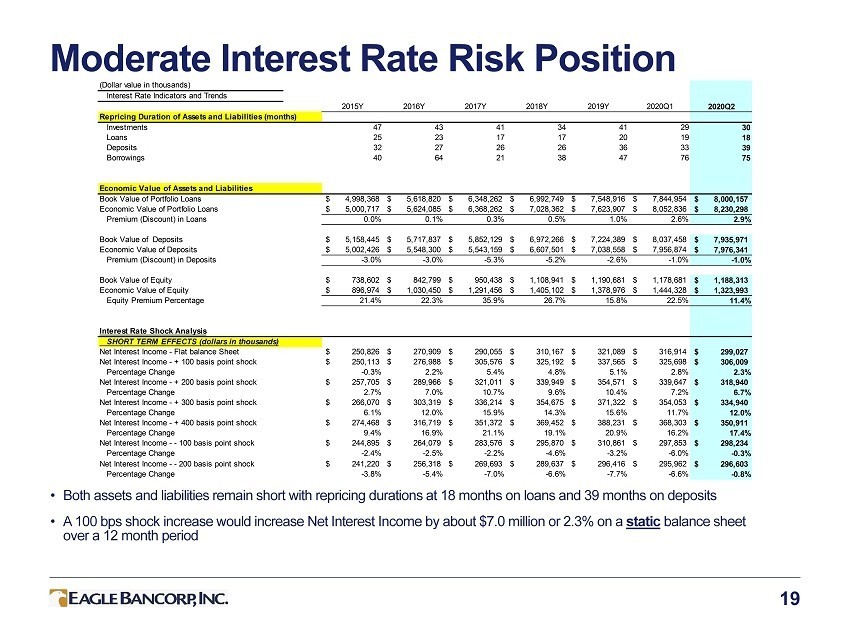
Moderate Interest Rate Risk Position 19 • Both assets and liabilities remain short with repricing durations at 18 months on loans and 39 months on deposits • A 100 bps shock increase would increase Net Interest Income by about $7.0 million or 2.3% on a static balance sheet over a 12 month period (Dollar value in thousands) Interest Rate Indicators and Trends 2015Y 2016Y 2017Y 2018Y 2019Y 2020Q1 2020Q2 Repricing Duration of Assets and Liabilities (months) Investments 47 43 41 34 41 29 30 Loans 25 23 17 17 20 19 18 Deposits 32 27 26 26 36 33 39 Borrowings 40 64 21 38 47 76 75 Economic Value of Assets and Liabilities Book Value of Portfolio Loans 4,998,368$ 5,618,820$ 6,348,262$ 6,992,749$ 7,548,916$ 7,844,954$ 8,000,157$ Economic Value of Portfolio Loans 5,000,717$ 5,624,085$ 6,368,262$ 7,028,362$ 7,623,907$ 8,052,836$ 8,230,298$ Premium (Discount) in Loans 0.0% 0.1% 0.3% 0.5% 1.0% 2.6% 2.9% Book Value of Deposits 5,158,445$ 5,717,837$ 5,852,129$ 6,972,266$ 7,224,389$ 8,037,458$ 7,935,971$ Economic Value of Deposits 5,002,426$ 5,548,300$ 5,543,159$ 6,607,501$ 7,038,558$ 7,956,874$ 7,976,341$ Premium (Discount) in Deposits -3.0% -3.0% -5.3% -5.2% -2.6% -1.0% -1.0% Book Value of Equity 738,602$ 842,799$ 950,438$ 1,108,941$ 1,190,681$ 1,178,681$ 1,188,313$ Economic Value of Equity 896,974$ 1,030,450$ 1,291,456$ 1,405,102$ 1,378,976$ 1,444,328$ 1,323,993$ Equity Premium Percentage 21.4% 22.3% 35.9% 26.7% 15.8% 22.5% 11.4% Interest Rate Shock Analysis SHORT TERM EFFECTS (dollars in thousands) Net Interest Income - Flat balance Sheet 250,826$ 270,909$ 290,055$ 310,167$ 321,089$ 316,914$ 299,027$ Net Interest Income - + 100 basis point shock 250,113$ 276,988$ 305,576$ 325,192$ 337,565$ 325,698$ 306,009$ Percentage Change -0.3% 2.2% 5.4% 4.8% 5.1% 2.8% 2.3% Net Interest Income - + 200 basis point shock 257,705$ 289,966$ 321,011$ 339,949$ 354,571$ 339,647$ 318,940$ Percentage Change 2.7% 7.0% 10.7% 9.6% 10.4% 7.2% 6.7% Net Interest Income - + 300 basis point shock 266,070$ 303,319$ 336,214$ 354,675$ 371,322$ 354,053$ 334,940$ Percentage Change 6.1% 12.0% 15.9% 14.3% 15.6% 11.7% 12.0% Net Interest Income - + 400 basis point shock 274,468$ 316,719$ 351,372$ 369,452$ 388,231$ 368,303$ 350,911$ Percentage Change 9.4% 16.9% 21.1% 19.1% 20.9% 16.2% 17.4% Net Interest Income - - 100 basis point shock 244,895$ 264,079$ 283,576$ 295,870$ 310,861$ 297,853$ 298,234$ Percentage Change -2.4% -2.5% -2.2% -4.6% -3.2% -6.0% -0.3% Net Interest Income - - 200 basis point shock 241,220$ 256,318$ 269,693$ 289,637$ 296,416$ 295,962$ 296,603$ Percentage Change -3.8% -5.4% -7.0% -6.6% -7.7% -6.6% -0.8%
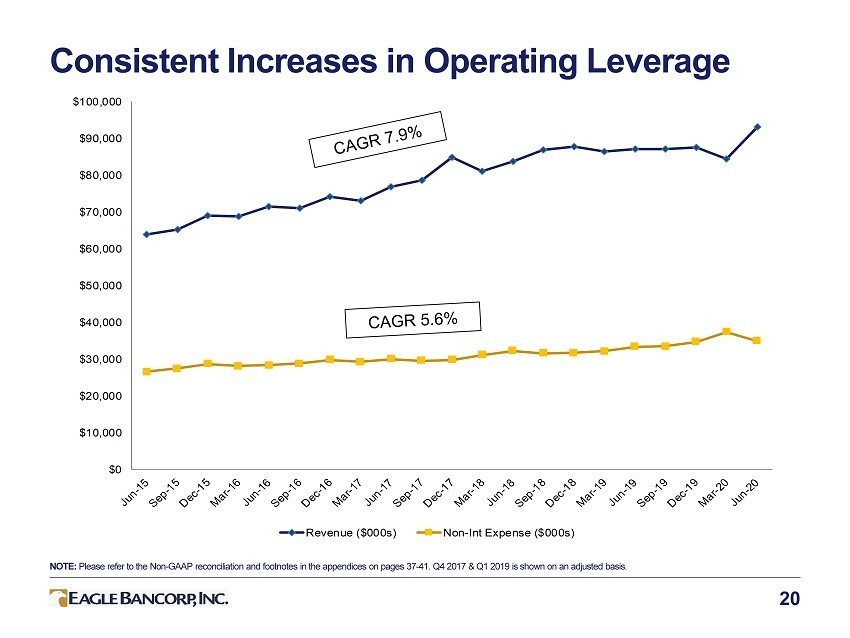
$0 $10,000 $20,000 $30,000 $40,000 $50,000 $60,000 $70,000 $80,000 $90,000 $100,000 Revenue ($000s) Non-Int Expense ($000s) Consistent Increases in Operating Leverage 20 NOTE: Please refer to the Non - GAAP reconciliation and footnotes in the appendices on pages 37 - 41. Q4 2017 & Q1 2019 is shown on an adjusted basis.

Superior Efficiency Ratio 21 NOTE: Bank Holding Company Performance Report Peer Group represents companies with consolidated assets between $3 billion and $10 b ill ion. 42% 40% 40% 37% 40% 44% 37% 65% 64% 62% 61% 62% 64% 30% 35% 40% 45% 50% 55% 60% 65% 70% 75% 2015Y 2016Y 2017Y 2018Y 2019Y 2020Q1 2020Q2 EGBN Peer Group

Deposit Composition and Growth 22 • Commercial focus drives growth of Noninterest Bearing Demand accounts • Wholesale Deposits used to enhance cost of funds, not a strategy to replace growth in core deposits (1) Core deposits include CDAR’s and ICS reciprocal deposits. (Dollar Values in Thousands) Deposit Type % of % of % of Balance Total Balance Total Balance Total Noninterest Bearing 1,873,902$ 27.0% 2,064,367$ 28.6% 2,416,058$ 30.4% Interest Bearing Transaction 862,553 12.4% 863,856 12.0% 861,703 10.9% Core Savings & Money Market (1) 2,158,191 31.0% 2,187,261 30.3% 2,722,230 34.3% Core CD's (1) 864,019 12.4% 738,291 10.2% 597,749 7.5% Wholesale Money Market 553,951 8.0% 825,868 11.4% 782,489 9.9% Wholesale CD's 637,276 9.2% 544,748 7.5% 555,743 7.0% Total Deposits 6,949,892$ 100% 7,224,391$ 100% 7,935,972$ 100% As of December 31, 2019 As of June 30, 2020As of June 30, 2019

Detail of Loan Portfolio 23 • Concentration in quality markets: Washington, DC, Montgomery County, Fairfax County • Held for Sale residential mortgages not included NOTE : Data as of June 30, 2020 32.0% 45.8% 14.3% (Dollar Value in Thousands) County C&I Owner Occupied CRE Income Producing CRE CRE Bridge Financing Owner Occupied Const. CRE Construction Land Residential Mortgage Consumer PPP TOTAL % of Total Maryland Montgomery 389,057$ 168,030$ 379,407$ 284,197$ 24,463$ 68,832$ 11,363$ 18,485$ 34,938$ 119,869$ 1,498,641$ 18.7% Prince George's 123,274 135,511 231,586 70,090 14,716 41,746 10,800 - 1,594 40,528 669,845 8.4% Baltimore 49,152 31,191 92,345 107,748 2,397 6,962 - 88 200 6,099 296,182 3.7% Anne Arundel 15,319 25,646 40,214 78,039 - 21,260 2,232 2,380 983 6,933 193,006 2.4% Frederick 3,410 622 57,899 5,842 640 - 5,505 196 341 4,059 78,514 1.0% Howard 15,161 11,605 20,862 16,846 - 553 3,002 1,539 1,045 12,857 83,470 1.0% Eastern Shore 8,272 11,519 63,813 5,500 - 152 121 1,656 201 909 92,143 1.1% Charles 379 20,205 7,342 - - - - 287 154 924 29,291 0.4% Other MD 3,843 8,651 2,820 - - 1,782 2,679 - 543 334 20,652 0.3% Washington DC 429,938 213,458 587,427 536,665 47,876 636,276 21,198 35,303 17,250 126,061 2,651,452 32.9% Virginia Fairfax 230,190 69,198 268,618 153,959 - 53,923 11,244 15,024 9,499 76,332 887,987 11.1% Loudoun 53,283 41,650 116,238 58,090 14,978 11,018 - 1,967 3,031 12,136 312,391 3.9% Arlington 63,502 397 63,976 41,771 1,520 8,267 - 2,229 1,460 7,641 190,763 2.4% Alexandria 38,402 16,867 34,382 31,143 6,842 9,490 - - 590 12,453 150,169 1.9% Prince William 10,027 30,946 54,168 25,938 203 568 4,199 - 1,292 4,719 132,060 1.6% Fauquier 2,814 2,955 4,927 6,570 - - - 1,586 263 2,265 21,380 0.3% Other VA 11,200 44,176 111,096 3,139 1,129 9,410 1,284 828 200 2,983 185,445 2.3% Other USA 159,833 131,450 63,764 52,526 35,080 42,605 9,079 12,033 2,626 19,374 528,370 6.6% Total $1,607,056 $964,077 $2,200,884 $1,478,063 $149,844 $912,844 $82,706 $93,601 $76,210 $456,476 $8,021,761 100.0% % of Total 20.0% 12.0% 27.4% 18.4% 1.9% 11.4% 1.0% 1.2% 1.0% 5.7% 100.0%
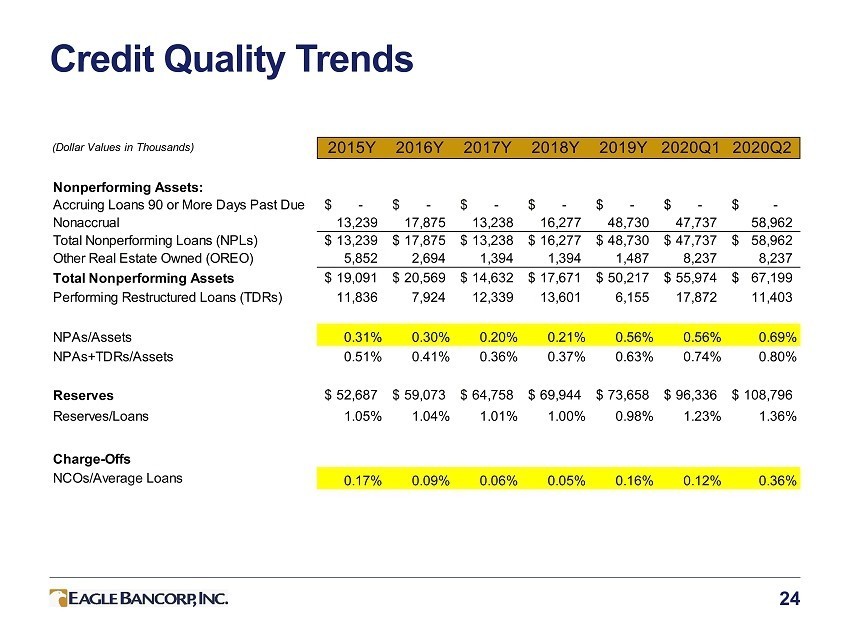
Credit Quality Trends 24 (Dollar Values in Thousands) 2015Y 2016Y 2017Y 2018Y 2019Y 2020Q1 2020Q2 Nonperforming Assets: Accruing Loans 90 or More Days Past Due -$ -$ -$ -$ -$ -$ -$ Nonaccrual 13,239 17,875 13,238 16,277 48,730 47,737 58,962 Total Nonperforming Loans (NPLs) 13,239$ 17,875$ 13,238$ 16,277$ 48,730$ 47,737$ 58,962$ Other Real Estate Owned (OREO) 5,852 2,694 1,394 1,394 1,487 8,237 8,237 Total Nonperforming Assets 19,091$ 20,569$ 14,632$ 17,671$ 50,217$ 55,974$ 67,199$ Performing Restructured Loans (TDRs) 11,836 7,924 12,339 13,601 6,155 17,872 11,403 NPAs/Assets 0.31% 0.30% 0.20% 0.21% 0.56% 0.56% 0.69% NPAs+TDRs/Assets 0.51% 0.41% 0.36% 0.37% 0.63% 0.74% 0.80% Reserves 52,687$ 59,073$ 64,758$ 69,944$ 73,658$ 96,336$ 108,796$ Reserves/Loans 1.05% 1.04% 1.01% 1.00% 0.98% 1.23% 1.36% Charge-Offs NCOs/Average Loans 0.17% 0.09% 0.06% 0.05% 0.16% 0.12% 0.36%
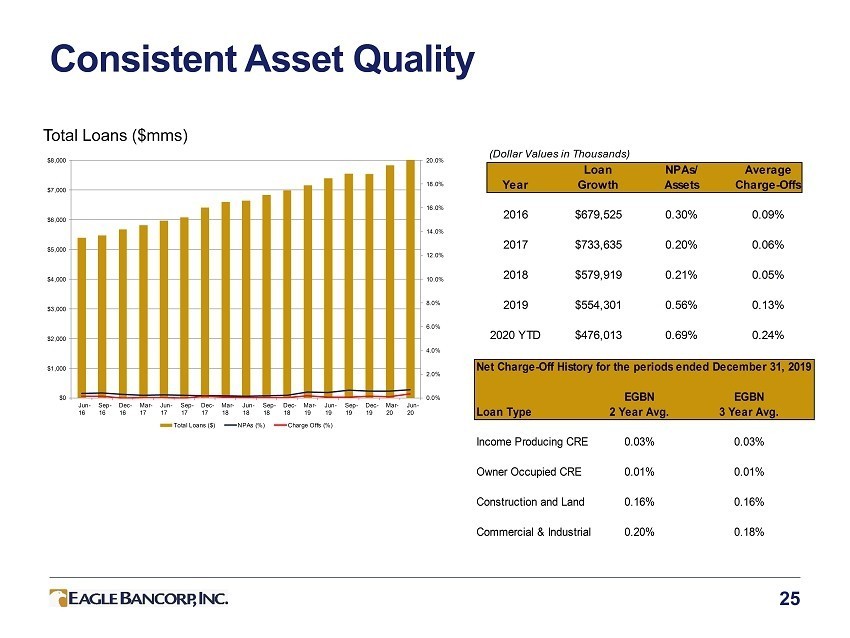
Consistent Asset Quality 25 Total Loans ($mms) Net Charge-Off History for the periods ended December 31, 2019 EGBN EGBN Loan Type 2 Year Avg. 3 Year Avg. Income Producing CRE 0.03% 0.03% Owner Occupied CRE 0.01% 0.01% Construction and Land 0.16% 0.16% Commercial & Industrial 0.20% 0.18% 0.0% 2.0% 4.0% 6.0% 8.0% 10.0% 12.0% 14.0% 16.0% 18.0% 20.0% $0 $1,000 $2,000 $3,000 $4,000 $5,000 $6,000 $7,000 $8,000 Jun- 16 Sep- 16 Dec- 16 Mar- 17 Jun- 17 Sep- 17 Dec- 17 Mar- 18 Jun- 18 Sep- 18 Dec- 18 Mar- 19 Jun- 19 Sep- 19 Dec- 19 Mar- 20 Jun- 20 Total Loans ($) NPAs (%) Charge Offs (%) (Dollar Values in Thousands) Loan NPAs/ Average Year Growth Assets Charge-Offs 2016 $679,525 0.30% 0.09% 2017 $733,635 0.20% 0.06% 2018 $579,919 0.21% 0.05% 2019 $554,301 0.56% 0.13% 2020 YTD $476,013 0.69% 0.24%

COVID - 19 Higher Risk Portfolio Segments 26 Industry areas of potential concern within the Loan Portfolio as of June 30, 2020: Industry Principal Balance (millions) % of Loan Portfolio Accommodation & Food Service $841 10.5% Retail Trade $107 1.3% Collateral driven exposures on loans secured by commercial real estate by property type as of June 30, 2020: Note: The below table excludes loans disclosed in the industry table above. Property Type Principal Balance (millions) % of Loan Portfolio Restaurant $31 0.4% Hotel $36 0.4% Retail $406 5.1%

Loan Modifications/Deferrals 27 • $1,437 million (87%) of the July 17 deferrals secured by RE, cash or marketable securities • COVID Task Force to manage modified loans created in June • Secondary deferrals generally require additional credit support (i.e. guarantor, collateral) • 65% of the $ 490 million in Hotel deferrals are flagged properties (Dollar Values in Millions) (Dollar Values in Millions) COVID-19 Deferrals as of July 17, 2020: COVID-19 Deferrals as of September 1, 2020: Count: Outstanding: Count: Outstanding: 1st Deferral 715 1,645$ 1st Deferral 282 588$ 2nd Deferral - Pending Docs 0 - 2nd Deferral - Pending Docs 59 182$ 2nd Deferral 3 2$ 2nd Deferral 38 46$ Total 718 1,647$ Total 379 816$ Returning to Regular Payments 276 739$ Making Regular Payments 46 90$ Paid Off 27 -$ Higher Risk Industries: Count: Total Outstanding: Deferred Count: Total Deferred Outstanding: % Outstanding Deferred: Secured by: Wtd Avg LTV: Hotels 32 547$ 21 490$ 90% RE 63% Restaurants 407 244 186 150 61% RE/Cash/Marketables 64% Churches 57 138 13 87 63% RE 51% Art/Entertainment/Recreation 60 131 12 46 35% RE 38% Healthcare 193 220 30 46 21% RE/Marketables 64% Education 71 140 12 4 3% RE 70% TOTAL 820 1,420$ 274 823$ 58%

Strength in C&I Lending 28 • At 23% of the Loan Portfolio, EagleBank has a much larger focus on C&I Lending than other local peer banks • C&I Loan Portfolio is predominantly variable rate loans • Owner Occupied Loans are key to small and mid - market relationships • DDA Operating Accounts of C&I relationships are a critical component of deposit composition strategy • Treasury Management services provide opportunity for relationship retention and expansion
CRE Risk Management 29 • Executive & Board Level Oversight of Approval Process • Disciplined Underwriting • Proactive Portfolio Management • Quarterly Stress Testing of CRE Portfolio • Quarterly Independent Credit Review • Dedicated Special Assets Team

CRE Concentration 30 (1) All peer group and other data is from the FR Y - 9C and Bank Holding Company Performance Report. Peer group data is based on t he Company’s asset size at the time of reporting. (2) Represents CRE (excluding owner occupied) concentration as a percentage of EGBN consolidated risk - based capital. (Dollar Values in Thousands) 2015Y 2016Y 2017Y 2018Y 2019Y 2020Q1 2020Q2 Total CRE Portfolio (excl Own Occ) 2,978,550$ 3,246,636$ 3,900,263$ 4,213,281$ 4,731,296$ 4,803,400$ 4,740,989$ CRE/Total Loans (1) 59.59% 57.18% 60.83% 60.26% 62.70% 61.26% 59.10% CRE Nonperforming Loans NPLs/Total CRE 0.22% 0.34% 0.16% 0.14% 0.35% 0.33% 0.52% Peer NPLs/Total CRE (1) 0.53% 0.40% 0.33% 0.41% 0.34% 0.43% Total Net Charge Offs NCOs/Total CRE 0.06% 0.04% 0.07% 0.01% 0.08% 0.12% 0.06% Peer NCOs/Total CRE (1) 0.01% 0.01% 0.01% 0.01% 0.02% 0.02% CRE Concentration (2) 394.40% 319.33% 345.17% 325.08% 347.31% 356.73% 343.68%

ADC Concentration 31 (1) All peer group and other data is from the FR Y - 9C and Bank Holding Company Performance Report. Peer group data is based on t he Company’s asset size at the time of reporting. (2) Represents ADC concentration as a percentage of EGBN consolidated risk - based capital. (Dollar Values in Thousands) 2015Y 2016Y 2017Y 2018Y 2019Y 2020Q1 2020Q2 Total ADC Portfolio 909,654$ 976,599$ 1,413,922$ 1,616,098$ 1,609,647$ 1,413,318$ 1,473,391$ ADC/Total Loans (1) 18.20% 17.20% 22.05% 23.12% 21.33% 18.03% 18.37% ADC Nonperforming Loans NPLs/Total ADC 0.08% 0.13% 0.05% 0.25% 0.72% 0.49% 0.86% Peer NPLs/Total ADC (1) 0.63% 0.35% 0.21% 0.18% 0.18% 0.21% Total Net Charge Offs NCOs/Total ADC -0.02% 0.16% 0.15% 0.01% 0.00% 0.50% 0.24% Peer NCOs/Total ADC (1) -0.04% -0.06% -0.04% -0.02% -0.02% -0.01% ADC Concentration (2) 120.45% 96.05% 125.13% 124.69% 118.16% 104.96% 106.81%

Capital Management 32 • 1,182,931 shares repurchased in 1st Quarter 2020; Capital impact ($44.1) million • Dividend of $0.22 per share declared in 2 nd , 3 rd & 4th Quarter of 2019 and 1 st & 2nd Quarter of 2020 • $150 million of 10 Year, 5 Year non - call, 5.00% Subordinated Notes sold in July 2016 • $100 million of Common Equity raised through an underwritten offering in March 2015 • $70 million of 10 Year non - call 5.75% Subordinated Notes sold in August 2014 (1) This constitutes a non - GAAP financial measure. Please refer to the Non - GAAP reconciliation and footnotes in the appendices o n pages 37 - 41. * Data for 2017 is shown on an adjusted basis. (Dollar Values in Thousands) 2015Y 2016Y 2017Y 2018Y 2019Y 2020Q1 2020Q2 Total Assets 6,075,577$ 6,890,096$ $ 7,493,617* 8,389,137$ 8,988,719$ 9,992,219$ 9,799,670$ Total Common Stockholders' Equity 738,601$ 842,799$ $ 965,026* 1,108,941$ 1,190,681$ 1,162,778$ 1,187,895$ Total Regulatory Capital 755,212$ 1,016,713$ 1,129,954$ 1,297,427$ 1,362,253$ 1,346,507$ 1,379,471$ Tier 1 Leverage Ratio 10.90% 10.72% 11.45% 12.10% 11.62% 11.33% 10.63% Tier 1 Risk Based Capital Ratio 10.68% 10.80% 11.23% 12.49% 12.87% 12.14% 12.80% Total Risk Based Capital Ratio 12.75% 14.89% 15.02% 16.08% 16.20% 15.44% 16.26% Common Equity Tier 1 (CETI) Ratio 10.68% 10.80% 11.23% 12.49% 12.87% 12.14% 12.80% Tangible Common Equity Ratio (1) 10.56% 10.84% 11.44% 12.11% 12.22% 10.70% 11.17%

Experienced Senior Management Team 33 Susan G. Riel CEO & President, Eagle Bancorp & EagleBank 44 years in banking 22 years with EGBN Antonio F. Marquez EVP, Eagle Bancorp; Senior EVP & President of Commercial Banking, EagleBank 35 years in banking 9 years with EGBN Charles D. Levingston EVP & Chief Financial Officer, Eagle Bancorp & EagleBank 20 years in banking 9 years with EGBN Lindsey S. Rheaume EVP, Eagle Bancorp; EVP & Chief Commercial & Industrial Lending Officer, EagleBank 35 years in banking 6 years with EGBN Janice L. Williams EVP, Eagle Bancorp; Senior EVP & Chief Credit Officer, EagleBank 26 years in banking 17 years with EGBN Paul Saltzman EVP & Chief Legal Officer, Eagle Bancorp & EagleBank 17 years in financial services .5 years with EGBN

Board Focused on Vision and Oversight 34 Norman R. Pozez Executive Chair - Board of Directors 11 years with EGBN Kathy A. Raffa Director, Chair - Audit Committee 4 years with EGBN Leslie Ludwig Director, Chair - Compensation Committee 3 years with EGBN Theresa G. LaPlaca Lead Independent Director, Chair - Risk Committee 1 years with EGBN Susan G. Riel Director - President & CEO 22 years with EGBN James A Soltesz Director 12 years with EGBN Benjamin M. Soto Director 13 years with EGBN Matthew D. Brockwell Director, Chair – Governance & Nominating Committee 1 year with EGBN
Appendices 35

Performance Statistics Summary 36 NOTE: (1) Bank Holding Company Performance Report Peer Group represents companies with consolidated assets between $3 billion and $ 10 billion. (2) Please refer to the Non - GAAP reconciliation and footnotes in the appendices on pages 37 - 41. * Data for 2017Y is shown on an adjusted basis. ** The peer group valuation numbers represent the KRX Index at June 30, 2020. Peer Group (1) Key Ratios (at or for the period ended) 2015Y 2016Y 2017Y 2018Y 2019Y 2020Q1 2020Q2 2020Q1 PROFITABILITY Net Interest Margin 4.33% 4.16% 4.15% 4.10% 3.77% 3.49% 3.26% 3.36% Efficiency Ratio 42.49% 40.29% 37.84% 37.31% 39.99% 43.83% 37.18% 63.68% Return on Average Assets 1.49% 1.52% 1.62%* 1.91% 1.61% 0.98% 1.12% 0.70% Return on Average Tangible Common Equity 14.69% 14.19% 12.54%* 16.63% 13.40% 8.56% 10.80% N/A ASSET QUALITY Allowance Loan Losses/Gross Loans 1.05% 1.04% 1.01% 1.00% 0.98% 1.23% 1.36% 1.17% NPAs + 90 Days Past Due/Total Assets 0.31% 0.30% 0.20% 0.21% 0.56% 0.56% 0.69% 0.59% Net Charge-Offs to Average Loans (annualized) 0.17% 0.09% 0.06% 0.05% 0.13% 0.12% 0.36% 0.11% Reserve/NPLs (Coverage Ratio) 397.95% 330.49% 489.20% 429.72% 151.16% 201.80% 184.52% 292.87% CAPITAL Tier 1 Leverage Ratio 10.90% 10.72% 11.45% 12.08% 11.62% 11.33% 10.63% 10.30% Tangible Common Equity/Tangible Assets (2) 10.56% 10.84% 11.44% 12.11% 12.22% 10.70% 11.17% N/A Total Risk Based Capital Ratio 12.75% 14.89% 15.02% 16.08% 16.20% 15.44% 16.26% 12.29% VALUATION Price/Earnings 20.2x 21.3x 19.8x 11.0x 11.6x 7.7x 8.8x 10.0x** Price/Tangible Book Value 268% 282% 235% 167% 149% 90% 97% 109%** EGBN
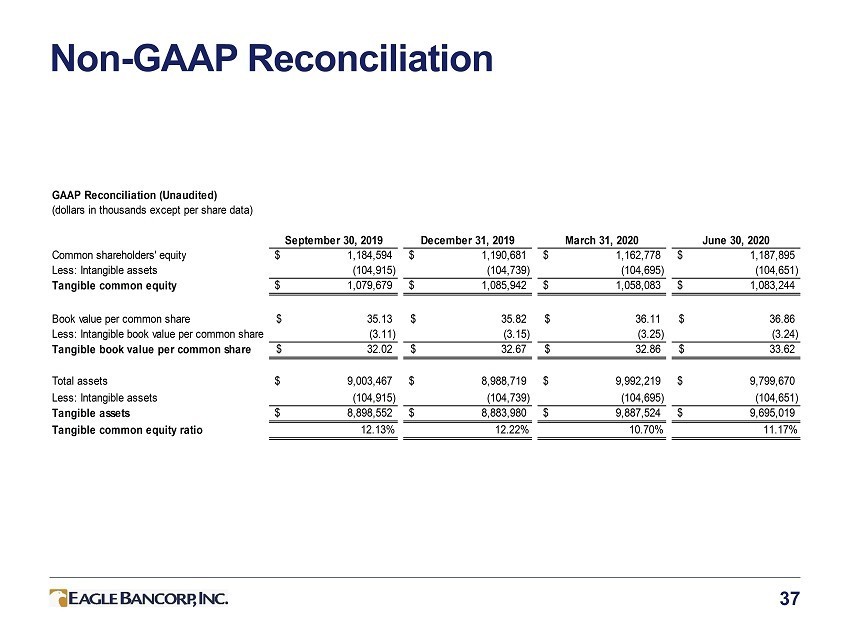
Non - GAAP Reconciliation 37 GAAP Reconciliation (Unaudited) (dollars in thousands except per share data) September 30, 2019 December 31, 2019 March 31, 2020 June 30, 2020 Common shareholders' equity 1,184,594$ 1,190,681$ 1,162,778$ 1,187,895$ Less: Intangible assets (104,915) (104,739) (104,695) (104,651) Tangible common equity 1,079,679$ 1,085,942$ 1,058,083$ 1,083,244$ Book value per common share 35.13$ 35.82$ 36.11$ 36.86$ Less: Intangible book value per common share (3.11) (3.15) (3.25) (3.24) Tangible book value per common share 32.02$ 32.67$ 32.86$ 33.62$ Total assets 9,003,467$ 8,988,719$ 9,992,219$ 9,799,670$ Less: Intangible assets (104,915) (104,739) (104,695) (104,651) Tangible assets 8,898,552$ 8,883,980$ 9,887,524$ 9,695,019$ Tangible common equity ratio 12.13% 12.22% 10.70% 11.17%

Non - GAAP Reconciliation 38 * Data for 2017 is shown on an operating basis. GAAP Reconciliation (Unaudited) (dollars in thousands except per share data) December 31, 2015 December 31, 2016 December 31, 2017* December 31, 2018 December 31, 2019 Common shareholders' equity 738,601$ 842,799$ 965,026$ 1,108,941$ 1,190,681$ Less: Intangible assets (108,542) (107,419) (107,212) (105,766) (104,739) Tangible common equity 630,059$ 735,380$ 857,814$ 1,003,175$ 1,085,942$ Book value per common share 22.07$ 24.77$ 28.23$ 32.25$ 35.82$ Less: Intangible book value per common share (3.24) (3.16) (3.14) (3.08) (3.15) Tangible book value per common share 18.83$ 21.61$ 25.09$ 29.17$ 32.67$ Total assets 6,076,649$ 6,890,097$ 7,493,617$ 8,389,137$ 8,988,719$ Less: Intangible assets (108,542) (107,419) (107,212) (105,766) (104,739) Tangible assets 5,968,107$ 6,782,678$ 7,386,405$ 8,283,371$ 8,883,980$ Tangible common equity ratio 10.56% 10.84% 11.61% 12.11% 12.22%

Non - GAAP Reconciliation 39 Eagle Bancorp, Inc. GAAP Reconciliation (Unaudited) (dollars in thousands except per share data) GAAP Change Non-GAAP GAAP Change Non-GAAP Income Statements: Income tax expense 35,395 (14,588) 20,807 85,504 (14,588) 70,916 Net income 15,569$ 14,588 30,157$ 100,232$ 14,588 114,820$ Performance Ratios (annualized): Return on average assets 0.82% 1.60% 1.41% 1.62% Return on average common equity 6.49% 12.57% 11.06% 12.67% Assets GAAP Change Non-GAAP Deferred income taxes 28,770 14,588 43,358 Total Assets 7,479,029$ 14,588$ 7,493,617$ Shareholders' Equity Retained earnings 431,544 14,588 446,132 Total Shareholders' Equity 950,438 14,588 965,026 Total Liabilities and Shareholders' Equity7,479,029$ 14,588 7,493,617$ Interest Income GAAP Change Non-GAAP GAAP Change Non-GAAP Income Tax Expense 35,395 (14,588) 20,807 85,504 (14,588) 70,916 Net Income 15,569$ 14,588$ 30,157$ 100,232$ 14,588$ 114,820$ Earnings Per Common Share Basic 0.46$ 0.43$ 0.88$ 2.94$ 0.43$ 3.36$ Diluted 0.45$ 0.42$ 0.88$ 2.92$ 0.42$ 3.35$ Three Months Ended December 31, 2017 Twelve Months Ended December 31, 2017 As of December 31, 2017 Three Months Ended December 31, 2017 Twelve Months Ended December 31, 2017
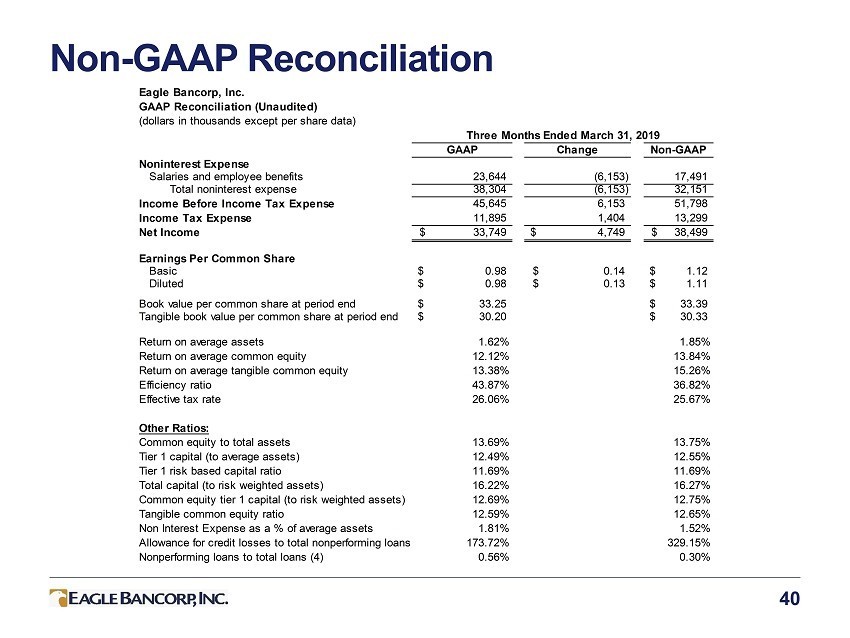
Non - GAAP Reconciliation 40 Eagle Bancorp, Inc. GAAP Reconciliation (Unaudited) (dollars in thousands except per share data) GAAP Change Non-GAAP Noninterest Expense Salaries and employee benefits 23,644 (6,153) 17,491 Total noninterest expense 38,304 (6,153) 32,151 Income Before Income Tax Expense 45,645 6,153 51,798 Income Tax Expense 11,895 1,404 13,299 Net Income 33,749$ 4,749$ 38,499$ Earnings Per Common Share Basic 0.98$ 0.14$ 1.12$ Diluted 0.98$ 0.13$ 1.11$ Book value per common share at period end 33.25$ 33.39$ Tangible book value per common share at period end 30.20$ 30.33$ Return on average assets 1.62% 1.85% Return on average common equity 12.12% 13.84% Return on average tangible common equity 13.38% 15.26% Efficiency ratio 43.87% 36.82% Effective tax rate 26.06% 25.67% Other Ratios: Common equity to total assets 13.69% 13.75% Tier 1 capital (to average assets) 12.49% 12.55% Tier 1 risk based capital ratio 11.69% 11.69% Total capital (to risk weighted assets) 16.22% 16.27% Common equity tier 1 capital (to risk weighted assets) 12.69% 12.75% Tangible common equity ratio 12.59% 12.65% Non Interest Expense as a % of average assets 1.81% 1.52% Allowance for credit losses to total nonperforming loans (4) 173.72% 329.15% Nonperforming loans to total loans (4) 0.56% 0.30% Three Months Ended March 31, 2019

Non - GAAP Reconciliation 41 (1) Tangible common equity to tangible assets (the "tangible common equity ratio") and tangible book value per common share are non-GAAP financial measures derived from GAAP-based amounts. The Company calculates the tangible common equity ratio by excluding the balance of intangible assets from common shareholders' equity and dividing by tangible assets. The Company calculates tangible book value per common share by dividing tangible common equity by common shares outstanding, as compared to book va lue per common share, which the Company calculates by dividing common shareholders' equity by common shares outstanding. The Company considers this information important to shareholders' as tangible equity is a measure that is consistent with the calculation of capital for bank regulatory purposes, which excludes intangible assets from the calculation of risk based ratios and as such is useful for investors, regulators, management and others to evaluate capital adequacy and to compare against other financial institutions.

Loan Portfolio and Growth 42 (Dollar Values in Thousands) Annual Growth Rate Loan Type Balance % of Total Balance % of Total Balance % of Total % Commercial and Industrial 1,475,201$ 20.0% 1,545,906$ 20.5% 1,607,056$ 20.0% 8.9% Commercial Real Estate: Owner Occupied 970,850 13.1% 985,409 13.1% 964,077 12.0% (0.7%) Income Producing 2,284,025 30.9% 2,328,955 30.9% 2,200,884 27.4% (3.6%) CRE Bridge Financing 1,382,790 18.7% 1,373,791 18.2% 1,478,063 18.4% 6.9% Subtotal 4,637,665$ 62.7% 4,688,155$ 62.1% 4,643,024$ 57.8% 0.1% Construction & Land: Owner Occupied 76,324 1.0% 89,490 1.2% 149,844 1.9% 96.3% CRE Construction 947,511 12.8% 963,742 12.8% 912,844 11.4% (3.7%) Land 65,278 0.9% 72,012 1.0% 82,706 1.0% 26.7% Subtotal 1,089,113$ 14.7% 1,125,244$ 14.9% 1,145,394$ 14.3% 5.2% Residential Mortgage 105,191$ 1.4% 104,221$ 1.4% 93,601$ 1.2% (11.0%) Consumer & Other 85,445$ 1.2% 82,222$ 1.1% 76,210$ 1.0% (10.8%) PPP N/A N/A N/A N/A 456,476$ 5.7% 0.0% Total Loans 7,392,615$ 100.0% 7,545,748$ 100.0% 8,021,761$ 100.0% 8.5% As of June 30, 2019 As of December 31, 2019 As of June 30, 2020

Geographic Detail – Income Producing CRE 43 • Focus in core sub - markets: Washington, DC, Montgomery County, Fairfax County NOTE: Data as of June 30, 2020 (Dollar Value in Thousands) Single Office/ Mixed Redevel./ Multi- & 1-4 County Condo Hotel Use Retail Family Industrial Single & 1-4 Family Other TOTAL % of Total Maryland Montgomery 68,794$ 44,416$ 145,028$ 12,159$ 72,198$ 17,380$ 6,018$ 13,414$ 379,407$ 17.3% Prince George's 32,006 101,667 2,670 29,950 - 35,518 2,411 27,364 231,586 10.5% Baltimore 2,212 15,311 63,769 6,589 1,302 1,100 1,711 351 92,345 4.2% Anne Arundel 1,890 9,730 - 8,584 - 20,010 - - 40,214 1.8% Frederick 6,061 - 2,617 39,369 - 2,175 3,408 4,269 57,899 2.6% Eastern Shore 1,813 58,236 - 500 - - 1,314 1,950 63,813 2.9% Howard 2,211 - - 9,903 - 6,437 786 1,525 20,862 0.9% Charles 6,321 - - 622 - - - 399 7,342 0.3% Other MD - - 155 1,363 1,302 - - - 2,820 0.1% Washington DC 72,063 137,724 174,706 34,322 81,040 3,282 73,696 10,594 587,427 26.8% Virginia Fairfax 184,926 - 1,070 41,340 1,048 511 4,795 34,928 268,618 12.2% Loudoun 38,186 - - 7,825 41,000 26,896 1,127 1,204 116,238 5.3% Arlington 12,813 46,373 - - 240 - 4,550 - 63,976 2.9% Alexandria 24,039 - 7,798 2,545 - - - - 34,382 1.6% Prince William 6,548 27,517 - 10,609 - 3,557 1,452 4,485 54,168 2.5% Fauquier - - - 4,927 - - - - 4,927 0.2% Other VA 49,372 - 5,597 37,156 15,359 217 1,520 1,875 111,096 5.0% Other USA 3,820 3,000 445 4,929 31,438 - 5,075 15,057 63,764 2.9% Total $513,075 $443,974 $403,855 $252,692 $244,927 $117,083 $107,863 $117,415 $2,200,884 100.0% % of Total 23.3% 20.3% 18.3% 11.5% 11.1% 5.3% 4.9% 5.3% 100.0%

Geographic Detail – Construction 44 • Focus in core sub - markets: Washington, DC, Montgomery County, Fairfax County • Recognized expertise in Single Family and Condo construction lending • Portfolio is diversified among collateral types NOTE: Data as of June 30, 2020 (Dollar Value in Thousands) Single Multi- Mixed & 1-4 Residential County Family Use Single & 1-4 Family Condo Office Hotel Retail Other TOTAL % of Total Maryland Montgomery 15,051$ -$ 25,923$ 168$ 21,690$ -$ -$ 6,000$ 68,832$ 7.5% Prince George's - - 3,171 - - 12,188 - 26,387 41,746 4.6% Baltimore - - 833 - - - - 6,129 6,962 0.8% Anne Arundel - 21,260 - - - - - - 21,260 2.3% Frederick - - - - - - - - - 0.0% Eastern Shore - - 152 - - - - - 152 0.0% Howard - - 553 - - - - - 553 0.1% Charles - - - - - - - - - 0.0% Other MD - 1,782 - - - - - - 1,782 0.2% - Washington DC 213,931 175,770 43,125 112,170 72,951 - 1,823 16,506 636,276 69.7% - Virginia - Fairfax 751 3,186 37,452 - - - - 12,534 53,923 5.9% Loudoun - 948 - 9,214 - - 856 - 11,018 1.2% Arlington - - 8,267 - - - - - 8,267 0.9% Alexandria - - 1,096 8,394 - - - - 9,490 1.0% Prince William - - 568 - - - - - 568 0.1% Fauquier - - - - - - - 0.0% Other VA - - 9,410 - - - - - 9,410 1.0% - Other USA - - 519 - - 30,738 - 11,348 42,605 4.7% Total $229,733 $202,946 $131,069 $129,946 $94,641 $42,926 $2,679 $78,904 $912,844 100.0% % of Total 25.2% 22.2% 14.4% 14.2% 10.4% 4.7% 0.3% 8.6% 100.0% Renovation 62,726$ 13,811$ 33,203$ 16,177$ 51,864$ -$ -$ 24,042$ 201,823$ 22.1% Ground-Up 167,007$ 189,135$ 97,866$ 113,769$ 42,777$ 42,926$ 2,679$ 54,862$ 711,021$ 77.9%

Conservative Securities Portfolio 45 • Portfolio has $21.9 million of net unrealized gains at June 30, 2020 • Average life of portfolio is 3 .1 years • Excludes Federal Reserve and Federal Home Loan Bank stock (Dollar Values in Thousands) June 30, 2020 Gross Gross Estimated Amrt. Cost Amortized Unrealized Unrealized Fair % of Total Security Type Cost Gain Losses Value Securities US Government Agency Securities $116,223 $1,580 $749 $117,054 15.5% Mortgage Backed Securites - GSEs 516,297 15,346 115 531,528 68.8% Municipal Bonds 86,374 4,333 - 90,707 11.5% Corporate Bonds 31,561 1,562 78 33,045 4.2% Other Equity Investments 198 - - 198 0.0% Total Securities $750,653 $22,821 $942 $772,532 100.0% December 31, 2019 Gross Gross Estimated Amrt. Cost Amortized Unrealized Unrealized Fair % of Total Security Type Cost Gain Losses Value Securities US Government Agency Securities $180,228 $621 $1,055 $179,794 21.5% Mortgage Backed Securites - GSEs 541,490 4,337 1,975 543,852 64.4% Municipal Bonds 71,902 2,034 5 73,931 8.6% Corporate Bonds 10,530 203 - 10,733 1.3% US Treasury 34,844 11 - 34,855 4.2% Other Equity Investments 198 - - 198 0.0% Total Securities 839,192$ 7,206$ 3,035$ 843,363$ 100.0% June 30, 2019 Gross Gross Estimated Amrt. Cost Amortized Unrealized Unrealized Fair % of Total Security Type Cost Gain Losses Value Securities US Government Agency Securities $225,389 $940 $659 $225,670 30.5% Mortgage Backed Securites - GSEs 440,243 5,186 1,884 443,545 59.4% Municipal Bonds 67,835 1,503 - 69,338 9.2% Corporate Bonds 6,502 70 - 6,572 0.9% Other Equity Investments 218 - - 218 0.0% Total Securities $740,187 $7,699 $2,543 $745,343 100.0%

Nationally Recognized Financial Performance 46 • “Sm - All Stars” Designation 2011, 2013, 2014, 2015, 2016 & 2017 Independent Community Bankers of America • Member of KBW Bank Honor Roll 2010 - 2018 • Named as one of Top 100 Performing Community Banks 2018 • Community Bankers Cup Award 2012 - 2019

Highly Regarded by Bank Rating Firms 47 FIRM BANK RATING B AUER F INANCIAL , I NC A - 300/300 Green - ***

Experienced Management Team 48 Susan G. Riel, Chief Executive Officer & President Eagle Bancorp & EagleBank Ms. Riel, President - Chief Executive Officer of the Bank and Bancorp, and formerly Chief Operating Officer. Ms. Riel has been w ith the bank for 20 years. She previously served as Executive Vice President - Chief Operating Officer of Columbia First Bank, FSB from 1989 until t hat institution’s acquisition by First Union Bancorp in 1995. She is one of the founding officers of EagleBank. Ms. Riel has over 42 years of exp erience in the commercial banking industry. Ms. Riel was recently included in the Bisnow 2017 Power Series: Women of Influence in Commercia l R eal Estate. Charles D. Levingston, EVP, Chief Financial Officer, Eagle Bancorp, Inc. and EagleBank Mr. Levingston, Executive Vice President and Chief Financial Officer of the Bank and Company as of April 2017, most recently ser ved as Executive Vice President of Finance at the Bank. Mr. Levingston, a CPA, served in various financial and senior management roles at the ba nk prior to his current role. Mr. Levingston joined the bank in January 2012, and previously worked at the Federal Reserve Banks of Atlanta and Phil ade lphia as a commissioned Bank Examiner, and at PriceWaterhouseCoopers as a Manager in the Advisory practice. He has over 18 years of experience in the banking industry. Antonio F. Marquez, EVP, Eagle Bancorp; Senior EVP & President of Commercial Banking, EagleBank Mr. Marquez, Executive Vice President, joined EagleBank in 2011 as the Chief Real Estate Lender. Prior to joining EagleBank, Mr. Marquez established the real estate lending franchise for HSBC for the Washington, DC market Earlier he was the head of Commercial Re al Estate lending at Chevy Chase Bank from 1999 to 2005 and prior to that held various lending positions at Chase Manhattan Bank in New York and T he Riggs National Bank in Washington, D.C. Mr. Marquez has over 33 years of experience in the banking industry in the Washington, DC metropolit an area.

Experienced Management Team 49 Lindsey S. Rheaume , EVP, Chief C&I Lending Officer Mr. Rheaume joined EagleBank as Chief C&I Lending Officer in December 2014 and has over 33 years of commercial lending, credit risk and managerial experience in the financial industry. Most recently, he served as relationship executive for JP Morgan Chase, res pon sible for business development in the DC, suburban Maryland and Northern Virginia market with clients ranging in revenue from $20MM to $500MM. Pre viously, he served as executive vice president and commercial lending manager at Virginia Commerce Bank — which was acquired by United Bank in 2014 — where he managed the bank’s entire commercial and industrial lending activities. Earlier in his career, he held senior comme rci al lending and credit positions with SunTrust Bank, GE Capital and Bank of America. Paul Saltzman, EVP, Chief Legal Officer Paul Saltzman is Executive Vice President & Chief Legal Officer at EagleBank . He is responsible for all legal and compliance oversight at the bank. Saltzman was recently a Partner in the Banking and Financial Institutions Advisory Practice at White & Case and Vice Chairman at Deutsche Bank, where he helped lead capital stress testing, regulatory remediation and transaction banking in the Americas region. He holds a B .A. from Clark University and a J.D. from Boston University School of Law. Janice L. Williams, EVP, Eagle Bancorp; Senior EVP & Chief Credit Officer, EagleBank Ms. Williams, Executive Vice President and Chief Credit Officer of the Bank, has served the Bank as Credit Officer, Senior Cr edi t Officer and Chief Credit Officer for the past 15 years. Prior to employment with the Bank, Ms. Williams was with Capital Bank, Sequoia Bank, and American Security Bank. Additionally, Ms. Williams, a graduate of Georgetown University Law Center and a Member of the Maryland Bar, was previous ly employed in the private practice of law in Maryland.
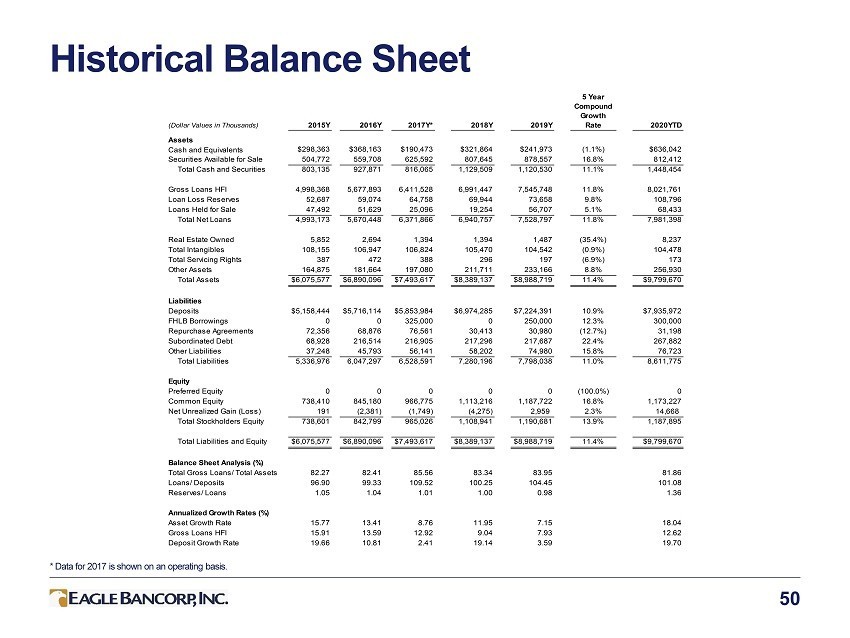
Historical Balance Sheet 50 * Data for 2017 is shown on an operating basis. (Dollar Values in Thousands) 2015Y 2016Y 2017Y* 2018Y 2019Y 5 Year Compound Growth Rate 2020YTD Assets Cash and Equivalents $298,363 $368,163 $190,473 $321,864 $241,973 (1.1%) $636,042 Securities Available for Sale 504,772 559,708 625,592 807,645 878,557 16.8% 812,412 Total Cash and Securities 803,135 927,871 816,065 1,129,509 1,120,530 11.1% 1,448,454 Gross Loans HFI 4,998,368 5,677,893 6,411,528 6,991,447 7,545,748 11.8% 8,021,761 Loan Loss Reserves 52,687 59,074 64,758 69,944 73,658 9.8% 108,796 Loans Held for Sale 47,492 51,629 25,096 19,254 56,707 5.1% 68,433 Total Net Loans 4,993,173 5,670,448 6,371,866 6,940,757 7,528,797 11.8% 7,981,398 Real Estate Owned 5,852 2,694 1,394 1,394 1,487 (35.4%) 8,237 Total Intangibles 108,155 106,947 106,824 105,470 104,542 (0.9%) 104,478 Total Servicing Rights 387 472 388 296 197 (6.9%) 173 Other Assets 164,875 181,664 197,080 211,711 233,166 8.8% 256,930 Total Assets $6,075,577 $6,890,096 $7,493,617 $8,389,137 $8,988,719 11.4% $9,799,670 Liabilities Deposits $5,158,444 $5,716,114 $5,853,984 $6,974,285 $7,224,391 10.9% $7,935,972 FHLB Borrowings 0 0 325,000 0 250,000 12.3% 300,000 Repurchase Agreements 72,356 68,876 76,561 30,413 30,980 (12.7%) 31,198 Subordinated Debt 68,928 216,514 216,905 217,296 217,687 22.4% 267,882 Other Liabilities 37,248 45,793 56,141 58,202 74,980 15.8% 76,723 Total Liabilities 5,336,976 6,047,297 6,528,591 7,280,196 7,798,038 11.0% 8,611,775 Equity Preferred Equity 0 0 0 0 0 (100.0%) 0 Common Equity 738,410 845,180 966,775 1,113,216 1,187,722 16.8% 1,173,227 Net Unrealized Gain (Loss) 191 (2,381) (1,749) (4,275) 2,959 2.3% 14,668 Total Stockholders Equity 738,601 842,799 965,026 1,108,941 1,190,681 13.9% 1,187,895 Total Liabilities and Equity $6,075,577 $6,890,096 $7,493,617 $8,389,137 $8,988,719 11.4% $9,799,670 Balance Sheet Analysis (%) Total Gross Loans/ Total Assets 82.27 82.41 85.56 83.34 83.95 81.86 Loans/ Deposits 96.90 99.33 109.52 100.25 104.45 101.08 Reserves/ Loans 1.05 1.04 1.01 1.00 0.98 1.36 Annualized Growth Rates (%) Asset Growth Rate 15.77 13.41 8.76 11.95 7.15 18.04 Gross Loans HFI 15.91 13.59 12.92 9.04 7.93 12.62 Deposit Growth Rate 19.66 10.81 2.41 19.14 3.59 19.70
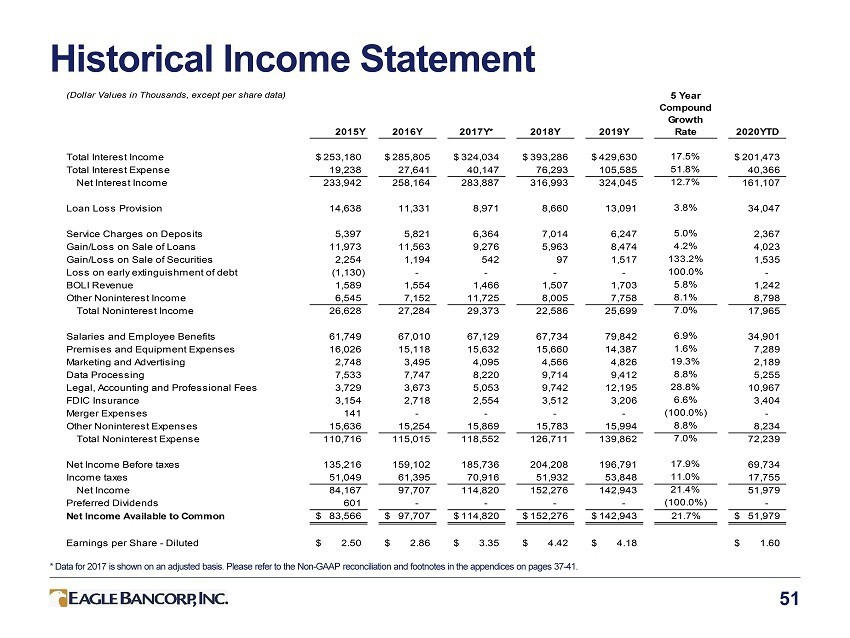
Historical Income Statement 51 * Data for 2017 is shown on an adjusted basis. Please refer to the Non - GAAP reconciliation and footnotes in the appendices on pages 37 - 41. (Dollar Values in Thousands, except per share data) 2015Y 2016Y 2017Y* 2018Y 2019Y 5 Year Compound Growth Rate 2020YTD Total Interest Income 253,180$ 285,805$ 324,034$ 393,286$ 429,630$ 17.5% 201,473$ Total Interest Expense 19,238 27,641 40,147 76,293 105,585 51.8% 40,366 Net Interest Income 233,942 258,164 283,887 316,993 324,045 12.7% 161,107 Loan Loss Provision 14,638 11,331 8,971 8,660 13,091 3.8% 34,047 Service Charges on Deposits 5,397 5,821 6,364 7,014 6,247 5.0% 2,367 Gain/Loss on Sale of Loans 11,973 11,563 9,276 5,963 8,474 4.2% 4,023 Gain/Loss on Sale of Securities 2,254 1,194 542 97 1,517 133.2% 1,535 Loss on early extinguishment of debt (1,130) - - - - 100.0% - BOLI Revenue 1,589 1,554 1,466 1,507 1,703 5.8% 1,242 Other Noninterest Income 6,545 7,152 11,725 8,005 7,758 8.1% 8,798 Total Noninterest Income 26,628 27,284 29,373 22,586 25,699 7.0% 17,965 Salaries and Employee Benefits 61,749 67,010 67,129 67,734 79,842 6.9% 34,901 Premises and Equipment Expenses 16,026 15,118 15,632 15,660 14,387 1.6% 7,289 Marketing and Advertising 2,748 3,495 4,095 4,566 4,826 19.3% 2,189 Data Processing 7,533 7,747 8,220 9,714 9,412 8.8% 5,255 Legal, Accounting and Professional Fees 3,729 3,673 5,053 9,742 12,195 28.8% 10,967 FDIC Insurance 3,154 2,718 2,554 3,512 3,206 6.6% 3,404 Merger Expenses 141 - - - - (100.0%) - Other Noninterest Expenses 15,636 15,254 15,869 15,783 15,994 8.8% 8,234 Total Noninterest Expense 110,716 115,015 118,552 126,711 139,862 7.0% 72,239 Net Income Before taxes 135,216 159,102 185,736 204,208 196,791 17.9% 69,734 Income taxes 51,049 61,395 70,916 51,932 53,848 11.0% 17,755 Net Income 84,167 97,707 114,820 152,276 142,943 21.4% 51,979 Preferred Dividends 601 - - - - (100.0%) - Net Income Available to Common 83,566$ 97,707$ 114,820$ 152,276$ 142,943$ 21.7% 51,979$ Earnings per Share - Diluted 2.50$ 2.86$ 3.35$ 4.42$ 4.18$ 1.60$