Attached files
| file | filename |
|---|---|
| EX-23 - EX-23 - EAGLE BANCORP INC | a2227493zex-23.htm |
| EX-12 - EX-12 - EAGLE BANCORP INC | a2227493zex-12.htm |
| EX-32.2 - EX-32.2 - EAGLE BANCORP INC | a2227493zex-32_2.htm |
| EX-31.1 - EX-31.1 - EAGLE BANCORP INC | a2227493zex-31_1.htm |
| EX-31.2 - EX-31.2 - EAGLE BANCORP INC | a2227493zex-31_2.htm |
| EX-32.1 - EX-32.1 - EAGLE BANCORP INC | a2227493zex-32_1.htm |
| EX-21 - EX-21 - EAGLE BANCORP INC | a2227493zex-21.htm |
Use these links to rapidly review the document
TABLE OF CONTENTS
UNITED STATES
SECURITIES AND EXCHANGE COMMISSION
Washington, D.C. 20549
FORM 10-K
ý |
Annual report pursuant to Section 13 or 15(d) of the Securities Exchange Act of 1934 |
|
For the fiscal year ended December 31, 2015 |
||
o |
Transition report pursuant to Section 13 or 15(d) of the Securities Exchange Act of 1934 |
|
For the transition period from to |
||
Commission file number: 0-25923
Eagle Bancorp, Inc.
(Exact name of registrant as specified in its charter)
| Maryland (State or other jurisdiction of incorporation or organization) |
52-2061461 (I.R.S. Employer Identification Number) |
|
7830 Old Georgetown Road, Third Floor, Bethesda, Maryland (Address of principal executive offices) |
20814 (Zip Code) |
Registrant's telephone number, including area code: (301) 986-1800
Securities registered pursuant to Section 12(b) of the Act:
| Title of class | Name of each exchange on which registered | |
|---|---|---|
| Common Stock, $0.01 par value | The NASDAQ Capital Market |
Securities registered pursuant to Section 12(g) of the Act: None
Indicate by check mark if the registrant is a well-known seasoned issuer, as defined in Section 405 of the Securities Act. Yes ý No o
Indicate by check mark if the registrant is not required to file reports pursuant to Section 13 or Section 15(d) of the Act Yes o No ý
Indicate by check mark whether the registrant; (1) has filed all reports required to be filed by Section 13 or 15(d) of the Securities Exchange Act of 1934 during the preceding 12 months (or for such shorter period that the registrant was required to file such reports; and (2) has been subject to such filing requirements for the past 90 days. Yes ý No o
Indicate by checkmark whether the registrant has submitted electronically and posted on its corporate Website, if any, every Interactive Data File required to be submitted and posted pursuant to Rule 405 of Regulation S-T (§232.405 of this chapter) during the preceding 12 months (or for such shorter period that the registrant was required to submit and post such files). Yes ý No o
Indicate by check mark if disclosure of delinquent filers pursuant to Item 405 of Regulation S-K is not contained herein, and will not be contained, to the best of registrant's knowledge, in definitive proxy or information statements incorporated by reference in Part III of this Form 10-K or any amendment to this Form 10-K. o
Indicate by check mark whether the registrant is a large accelerated filer, an accelerated filer, a non-accelerated filer or a smaller reporting company. See definitions of "large accelerated filer," "accelerated filer" and "smaller reporting company" in Rule 12b-2 of the Exchange Act.
| Large accelerated filer ý | Accelerated filer o | Non-accelerated filer o | Smaller reporting company o |
Indicate by check mark whether the registrant is a shell company (as defined in Rule 12b-2 of the Act. Yes o No ý
The aggregate market value of the outstanding Common Stock held by nonaffiliates as of June 30, 2015 was approximately $1.33 billion.
As of February 24, 2016, the number of outstanding shares of the Common Stock, $0.01 par value, of Eagle Bancorp, Inc. was 33,551,237.
DOCUMENTS INCORPORATED BY REFERENCE
Portions of the Company's definitive Proxy Statement for the Annual Meeting of Shareholders to be held on May 12, 2016 are incorporated by reference in Part III hereof.
EAGLE BANCORP, INC.
ANNUAL REPORT ON FORM 10-K
i
In this report, unless otherwise expressly stated or the context otherwise requires, the terms "we," "us," the "Company," "Eagle," and "our" refer to Eagle Bancorp, Inc. and our subsidiaries on a combined basis, except in the description of any of our securities, in which case these terms refer solely to Eagle Bancorp, Inc. and not to any of our subsidiaries. References to "EagleBank" or "Bank" refer to EagleBank, which is our principal subsidiary.
Eagle Bancorp, Inc. (the "Company"), headquartered in Bethesda, Maryland, was incorporated under the laws of the State of Maryland on October 28, 1997, to serve as the bank holding company for EagleBank (the "Bank"). The Company was formed by a group of local businessmen and professionals with significant prior experience in community banking in the Company's market area, together with an experienced community bank senior management team. The Company has one direct non-banking subsidiary, Eagle Commercial Ventures, LLC ("ECV"), which provides subordinated financing for the acquisition, development and construction of real estate projects.
The Bank, a Maryland chartered commercial bank, which is a member of the Federal Reserve System, is the Company's principal operating subsidiary. It commenced banking operations on July 20, 1998. The Bank operates twenty one banking offices: seven in Montgomery County, Maryland; five located in the District of Columbia; and nine in Northern Virginia. Refer to Properties on page 32 for a listing of banking offices. The Bank may seek additional banking offices consistent with its strategic plan, although there can be no assurance that the Bank will establish any additional offices, or that any branch office will prove to be profitable.
The Bank has two active direct subsidiaries: Bethesda Leasing, LLC and Eagle Insurance Services, LLC. Bethesda Leasing, LLC holds title to and operates real estate owned and acquired through foreclosure. Eagle Insurance Services, LLC facilitates the placement of commercial and retail insurance products through a referral arrangement with The Meltzer Group, a large well known insurance brokerage within the Company's market area.
The Bank operates as a community bank alternative to the super-regional financial institutions, which dominate its primary market area. The cornerstone of the Bank's philosophy is to provide superior, personalized service to its clients. The Bank focuses on relationship banking, providing each client with a number of services, familiarizing itself with, and addressing itself to, client needs in a proactive, personalized fashion. Management believes that the Bank's target market segments, small and medium-sized for profit and non-profit businesses and the consumer base working or living in and near the Bank's market area, demand the convenience and personal service that an independent locally based financial institution such as the Bank can offer. It is these themes of convenience and proactive personal service that form the basis for the Bank's business development strategies.
The acquisition of Virginia Heritage Bank ("Virginia Heritage") completed on October 31, 2014, added approximately $800 million in loans, $3 million in loans held for sale, $645 million in deposits, and $95 million in borrowings. Identified intangibles related to core deposits were recorded for $4.6 million, which is being amortized over its estimated useful life through 2020 and an initial intangible for goodwill was recorded for approximately $102.3 million. Additionally, in connection with the transaction, the Company recorded a fair value credit mark on the loan portfolio for approximately $12.5 million. The income and expenses of Virginia Heritage are included in the consolidated results of operations for the year ended December 31, 2014, starting with the two month period subsequent to the acquisition.
Description of Services. The Bank offers a full range of commercial banking services to its business and professional clients, as well as complete consumer banking services to individuals living or working in the service area. The Bank emphasizes providing commercial banking services to sole proprietorships, small and medium-sized businesses, partnerships, corporations, non-profit organizations and associations,
1
and investors living and working in and near the Bank's primary service area. A full range of retail banking services are offered to accommodate the individual needs of both corporate customers as well as the community the Bank serves. The Bank also offers online banking, mobile banking and a remote deposit service, which allows clients to facilitate and expedite deposit transactions through the use of electronic devices.
The Bank provides a variety of commercial and consumer lending products to small, medium and large-sized businesses and to individuals for various business and personal purposes, including (i) commercial loans for a variety of business purposes such as for working capital, equipment purchases, real estate lines of credit, and government contract financing; (ii) asset based lending and accounts receivable financing (on a limited basis); (iii) construction and commercial real estate loans; (iv) business equipment financing; (v) consumer home equity lines of credit, personal lines of credit and term loans; (vi) consumer installment loans such as auto and personal loans; (vii) personal credit cards offered through an outside vendor; and (viii) residential mortgage loans.
The Bank maintains a loan portfolio consisting primarily of traditional business and real estate secured loans, with a substantial portion having variable and adjustable rates, and where the cash flow of the borrower/borrower's business is the principal source of debt service with a secondary emphasis on collateral. Real estate loans are made generally for commercial purposes and are structured using both variable and fixed rates and renegotiable rates which adjust in three to five years, with maturities of five to ten years.
The Bank's consumer loans portfolio is comprised generally of two loan types: (i) home equity lines of credit that are structured with an interest only draw period followed either by a balloon maturity or a fully amortized repayment schedule; and (ii) first lien residential mortgage loans, although the Bank's general practice is to sell conforming first trust loans on a servicing released basis to third party investors.
The Bank has also developed significant expertise and commitment as a Small Business Administration ("SBA") lender and has been recognized as a top originator of such loans in our market area.
The Bank is an approved SBA lender. As a preferred lender under the SBA's Preferred Lender Program, the Bank can originate certain SBA loans in-house without prior SBA approval. SBA loans are made through programs designed by the federal government to assist the small business community in obtaining financing from financial institutions that are given government guarantees as an incentive to make the loans. Under certain circumstances, the Bank attempts to further mitigate commercial term loan losses by using loan guarantee programs offered by the SBA. SBA lending is subject to federal legislation that can affect the availability and funding of the program. From time to time, this dependence on legislative funding causes limitations and uncertainties with regard to the continued funding of such programs, which could potentially have an adverse financial impact on our business.
The direct lending activities in which the Bank engages carry the risk that the borrowers will be unable to perform on their obligations. As such, interest rate policies of the Board of Governors of the Federal Reserve System (the "Federal Reserve Board" or the "Federal Reserve") and general economic conditions, nationally and in the Bank's primary market area, could have a significant impact on the Bank's and the Company's results of operations. To the extent that economic conditions deteriorate, business and individual borrowers may be less able to meet their obligations to the Bank in full, in a timely manner, resulting in decreased earnings or losses to the Bank. To the extent the Bank makes fixed rate loans or variable rate loans with fixed rate floors, general increases in interest rates will tend to reduce the Bank's spread as the interest rates the Bank must pay for deposits may increase while interest income may be unchanged. Economic conditions may also adversely affect the value of property pledged as security for loans.
2
The Bank's goal is to mitigate risks in the event of unforeseen threats to the loan portfolio as a result of economic downturn or other negative influences. Plans for mitigating inherent risks in managing loan assets include: carefully enforcing loan policies and procedures, evaluating each borrower's business plan during the underwriting process and throughout the loan term, identifying and monitoring primary and alternative sources for loan repayment, and obtaining collateral to mitigate economic loss in the event of liquidation. Specific loan reserves are established based upon credit and/or collateral risks on an individual loan basis. A risk rating system is employed to proactively estimate loss exposure and provide a measuring system for setting general and specific reserve allocations.
The composition of the Bank's loan portfolio is heavily weighted toward commercial real estate, both owner occupied and income producing real estate. At December 31, 2015, owner occupied commercial real estate and owner occupied commercial real estate construction represent 12% of the loan portfolio. At December 31, 2015, non-owner occupied commercial real estate and real estate construction represented approximately 62% of the loan portfolio. The combined owner occupied and commercial real estate loans represent 74% of the loan portfolio. These loans are underwritten to mitigate lending risks typical of this type of loan such as declines in real estate values, changes in borrower cash flow and general economic conditions. The Bank typically requires a maximum loan to value of 80% and minimum cash flow debt service coverage of 1.15 to 1.0. Personal guarantees are generally required, but may be limited. In making real estate commercial mortgage loans, the Bank generally requires that interest rates adjust not less frequently than five years.
The Bank is also an active traditional commercial lender providing loans for a variety of purposes, including cash flow, equipment, and account receivable financing. This loan category represents approximately 21% of the Bank's loan portfolio at December 31, 2015 and is generally variable or adjustable rate. Commercial loans meet reasonable underwriting standards, including appropriate collateral, and cash flow necessary to support debt service. Personal guarantees are generally required, but may be limited. SBA loans represent approximately 1% of commercial loans. In originating SBA loans, the Bank assumes the risk of non-payment on the uninsured portion of the credit. The Bank generally sells the insured portion of the loan generating noninterest income from the gains on sale, as well as servicing income on the portion participated. SBA loans are subject to the same cash flow analyses as other commercial loans. SBA loans are subject to a maximum loan size established by the SBA.
Approximately 2% of the loan portfolio at December 31, 2015 consists of home equity loans and lines of credit and other consumer loans. These credits, while making up a smaller portion of the loan portfolio, demand the same emphasis on underwriting and credit evaluation as other types of loans advanced by the Bank.
Approximately 3% of the total loan portfolio consists of residential home mortgage loans. These credits represent first liens on residential property loans originated by the Bank. While the Bank's general practice is to originate and sell (servicing released) loans made by its Residential Lending department, from time to time certain loan characteristics do not meet the requirements of third party investors and these loans are instead maintained in the Bank's portfolio until they are resold to another investor at a later date.
Our lending activities are subject to a variety of lending limits imposed by state and federal law. These limits will increase or decrease in response to increases or decreases in the Bank's level of capital. At January 31, 2016, the Bank had a legal lending limit of $116 million. For the year ended December 31, 2015, the average Commercial Real Estate (CRE) and Commercial and Industrial (C&I) loan balance was $2.2 million and $687 thousand, respectively. In accordance with internal lending policies, the Bank occasionally sells participations in its loans to other area banks, which allows the Bank to manage risk involved in these loans and to meet the lending needs of its clients.
From time to time the Company may make loans for its own portfolio or through its higher risk loan affiliate, ECV, which under its operating agreement conducts lending only to real estate projects. Such
3
loans may have higher risk characteristics than loans made by the Bank, such as lower priority security interests and/or higher loan to value ratios. The Company seeks an overall financial return on these transactions commensurate with the risks and structure of each individual loan. Certain transactions bear current interest at a rate with a significant premium to normal market rates. Other loan transactions carry a standard rate of current interest, but also earn additional interest based on a fixed rate or a percentage of the profits of the underlying project. Refer to the discussion under the caption "Noninterest Income" at page 49 and "Loan Portfolio" at page 53, for further information on the Company's and ECV's higher risk lending activities. At December 31, 2015, ECV had four outstanding loan transactions totaling $9.2 million.
The risk of nonpayment (or deferred payment) of loans is inherent in commercial banking. The Bank's marketing focus on small to medium-sized businesses may result in the assumption by the Bank of certain lending risks that are different from those attendant to loans to larger companies. Management and/or committees of the Bank carefully evaluate loan applications and attempt to minimize credit risk exposure by use of extensive loan application data, due diligence, and approval and monitoring procedures; however, there can be no assurance that such procedures can significantly reduce such lending risks.
The Bank originates residential mortgage loans primarily as a correspondent lender. Activity in the residential mortgage loan market is highly sensitive to changes in interest rates and product availability. While the Bank does have delegated underwriting authority from most of its investors, it also employs the services of the investor to underwrite the loans. Because the loans are originated within investor guidelines and designated automated underwriting and product specific requirements as part of the loan application, the loans sold have a limited recourse provision. Most contracts with investors contain recourse periods. In general, the Bank may be required to repurchase a previously sold mortgage loan or indemnify the investor if there is non-compliance with defined loan origination or documentation standards, including fraud, negligence or material misstatement in the loan documents. In addition, the Bank may have an obligation to repurchase a loan if the mortgagor has defaulted early in the loan term. The potential default repurchase period varies by investor but can be up to approximately twelve months after sale of the loan to the investor. Mortgages subject to recourse are collateralized by single-family residential properties, have loan-to-value ratios of 80% or less, or have private mortgage insurance. In certain instances, the Bank may provide equity loans (second position financing) in combination with residential first mortgage lending for purchase money and refinancing purposes.
The Bank enters into commitments to originate residential mortgage loans whereby the interest rate on the loan is determined prior to funding (i.e. rate lock commitments). Such rate lock commitments on mortgage loans to be sold in the secondary market are considered to be derivatives. To protect against the price risk inherent in residential mortgage loan commitments, the Bank utilizes both "best efforts" and "mandatory delivery" forward loan sale commitments to mitigate the risk of potential decrease in the values of loans that would result from the exercise of the derivative loan commitments. Under a "best efforts" contract, the Bank commits to deliver an individual mortgage loan of a specified principal amount and quality to an investor and the investor commits to a price that it will purchase the loan from the Bank if the loan to the underlying borrower closes. The Bank protects itself from changes in interest rates through the use of best efforts forward delivery commitments, whereby the investor commits to purchase a loan at a price representing a premium on the day the borrower commits to an interest rate with the intent that the buyer/investor has assumed the interest rate risk on the loan. As a result, the Bank is not generally exposed to losses on loans sold utilizing best efforts, nor will it realize gains related to rate lock commitments due to changes in interest rates. The market values of rate lock commitments and best efforts contracts are not readily ascertainable with precision because rate lock commitments and best efforts contracts are not actively traded. Because of the high correlation between rate lock commitments and best efforts contracts, no gain or loss should occur on the rate lock commitments. Under a "mandatory delivery" contract, the Bank commits to deliver a certain principal amount of mortgage loans to an investor at a specified price on or before a specified date. If the Bank fails to deliver the amount of mortgages
4
necessary to fulfill the commitment by the specified date, it is obligated to pay the investor a "pair-off" fee, based on then-current market prices, to compensate the investor for the shortfall. The rate lock commitments on mortgage loans to be sold in the secondary market are considered to be derivatives. The Bank manages the interest rate risk on rate lock commitments by entering into forward sale contracts of mortgage backed securities, whereby the Bank obtains the right to deliver securities to investors in the future at a specified price. Such contracts are accounted for as derivatives and are recorded at fair value in derivative assets or liabilities, with changes in fair value recorded in other income. The period of time between issuance of a loan commitment to the customer and closing and sale of the loan to an investor generally ranges from 30 to 90 days under current market conditions.
The general terms and underwriting standards for each type of commercial real estate and construction loan are incorporated into the Bank's lending policies. These policies are analyzed periodically by management, and the policies are reviewed and approved by the Board. The Bank's loan policies and practices described in this report are subject to periodic change, and each guideline or standard is subject to waiver or exception in the case of any particular loan, by the appropriate officer or committee, in accordance with the Bank's loan policies. Policy standards are often stated in mandatory terms, such as "shall" or "must", but these provisions are subject to exceptions. Policy requires that loan value not exceed a percentage of "market value" or "fair value" based upon appraisals or evaluations obtained in the ordinary course of the Bank's underwriting practices.
Loans are secured primarily by duly recorded first deeds of trust. In some cases, the Bank may accept a recorded junior trust position. In general, borrowers will have a proven ability to build, lease, manage and/or sell a commercial or residential project and demonstrate satisfactory financial condition. Additionally, an equity contribution toward the project is required.
Construction loans require that the financial condition and experience of the general contractor and major subcontractors be satisfactory to the Bank. Guaranteed, fixed price construction contracts are required whenever appropriate, along with payment and performance bonds or completion bonds for certain larger scale projects.
Loans intended for residential land acquisition, lot development and construction are made on the premise that the land: (1) is or will be developed for building sites for residential structures; and (2) will ultimately be utilized for construction or improvement of residential zoned real properties, including the creation of housing. Residential development and construction loans will finance projects such as single family subdivisions, planned unit developments, townhouses, and condominiums. Residential land acquisition, development and construction loans generally are underwritten with a maximum term of 36 months, including extensions approved at origination.
Commercial land acquisition and construction loans are secured by real property where loan funds will be used to acquire land and to construct or improve appropriately zoned real property for the creation of income producing or owner user commercial properties. Borrowers are required to contribute equity into each project at levels determined by the appropriate Loan Committee. Commercial land acquisition and construction loans generally are underwritten with a maximum term of 24 months.
Loan-to-value ("LTV") ratios, with few exceptions, are maintained consistent with or below supervisory guidelines.
Construction draw requests generally must be presented in writing on American Institute of Architects documents and certified by the contractor, the borrower and the borrower's architect. Each draw request shall also include the borrower's soft cost breakdown certified by the borrower or its Chief Financial Officer. Prior to an advance, the Bank or its contractor inspects the project to determine that the work has been completed, to justify the draw requisition.
Commercial permanent loans are secured by improved real property, which is generating income in the normal course of operation. Debt service coverage, assuming stabilized occupancy, must be satisfactory
5
to support a permanent loan. The debt service coverage ratio is ordinarily at least 1.15 to 1. As part of the underwriting process, debt service coverage ratios are stress tested assuming a 200 basis point increase in interest rates from their current levels.
Commercial permanent loans are generally subject to re-pricing after 5 years and are underwritten with a term not greater than 10 years or the remaining useful life of the property, whichever is lower. The amortization term of such loans is generally a maximum of 25 years.
Personal guarantees are generally received from the principals on commercial real estate loans, and only in instances where the loan-to-value is sufficiently low and the debt service is sufficiently high is consideration given to either limiting or not requiring personal recourse.
Updated appraisals for real estate secured loans are obtained as necessary and appropriate to borrower financial condition, project status, loan terms, and market conditions.
The Company's loan portfolio includes loans made for real estate Acquisition, Development and Construction ("ADC") purposes, including both income producing and owner occupied projects. ADC loans amounted to $1.07 billion at December 31, 2015. The ADC loans containing loan funded interest reserves represent approximately 49% (by dollars) of the outstanding ADC loan portfolio at December 31, 2015. The decision to establish a loan funded interest reserve is made upon origination of the ADC loan and is based upon a number of factors considered during underwriting of the credit including: (i) the feasibility of the project; (ii) the experience of the sponsor; (iii) the creditworthiness of the borrower and guarantors; (iv) borrower equity contribution; and (v) the level of collateral protection. When appropriate, an interest reserve provides an effective means of addressing the cash flow characteristics of a properly underwritten ADC loan. The Company does not significantly utilize interest reserves in other loan products. The Company recognizes that one of the risks inherent in the use of interest reserves is the potential masking of underlying problems with the project and/or the borrower's ability to repay the loan. In order to mitigate this inherent risk, the Company employs a series of reporting and monitoring mechanisms on all ADC loans, whether or not an interest reserve is provided, including: (i) construction and development timelines which are monitored on an ongoing basis which track the progress of a given project to the timeline projected at origination; (ii) a construction loan administration department independent of the lending function; (iii) third party independent construction loan inspection reports; (iv) monthly interest reserve monitoring reports detailing the balance of the interest reserves approved at origination and the days of interest carry represented by the reserve balances as compared to the then current anticipated time to completion and/or sale of speculative projects; and (v) quarterly commercial real estate construction meetings among senior Company management which includes monitoring of current and projected real estate market conditions. If a project has not performed as expected, it is not the customary practice of the Company to increase loan funded interest reserves.
Despite the less than robust economic recovery, the Company has not experienced any significant issues with increased vacancy rates or lower rents for income producing properties financed. The construction loan portfolio has remained solid, particularly in areas of well-located residential and multifamily projects, as the housing market has continued to improve and stabilize. The Washington, D.C. metropolitan area real estate market has been relatively stable; however, certain segments, including suburban offices, have exhibited higher than normal vacancy and experienced concessions in specific submarkets. The impact of disruptions in government spending patterns, (i.e. sequestration, program cuts or terminations, leasing activity, and changes in geographic distribution of government spending) while within manageable levels to date, remains of concern. As a result, the Company has maintained somewhat higher than pre-recession environmental allocation factors for the allowance for loan and lease losses ("ALLL") for the real estate loan portfolio. As part of its overall risk assessments, management carefully reviews the Bank's loan portfolio and general economic and market conditions on a regular basis and will continue to adjust both the specific and environmental reserve factors as necessary.
6
Deposit services include business and personal checking accounts, NOW accounts, tiered savings and money market account and time deposits with varying maturity structures and customer options. A complete individual retirement account program is available. The Bank also participates in the Promontory Interfinancial Network, LLC ("Promontory") Certificate of Deposit Account Registry Service ("CDARS") and its Insured Cash Sweep ("ICS") program, both of which networks function to assure full FDIC insurance for participating Bank customers. In cooperation with Goldman Sachs Asset Management, the Bank offers a Goldman Sachs Investment Sweep Account, a check writing cash management account that sweeps funds to one of several non-FDIC insured off-balance sheet investment accounts managed by Goldman Sachs.
The Bank offers a full range of on-line banking services for both personal and business accounts and has a Mobile Banking application for both businesses and individuals. Other services include cash management services, business sweep accounts, lock box, remote deposit capture, account reconciliation services, merchant card services, safety deposit boxes and Automated Clearing House origination. After-hours depositories and ATM service are also available.
The Bank and Company maintain portfolios of short term investments and investment securities consisting primarily of U.S. agency bonds and government sponsored enterprise mortgage backed securities, municipal bonds, and corporate bonds. The Bank also owns equity investments related to membership in the Federal Reserve System and the Federal Home Loan Bank of Atlanta ("FHLB"). The Bank's securities portfolio also consists of equity investments in the form of common stock of two local banking companies. These portfolios provide the following objectives: liquidity management, additional income to the Company and Bank in the form of interest and gain on sale opportunities, collateral to facilitate borrowing arrangements and assistance with meeting interest rate risk management objectives. The current Investment Policy limits the Bank to investments of high quality, U.S. Treasury securities, U.S. agency securities and high grade municipal and corporate securities. High risk investments and non-traditional investments are prohibited. Investment maturities are generally limited to ten to fifteen years, except as specifically approved by the Asset Liability Committee ("ALCO"), and mortgage backed pass through securities with average lives generally not to exceed eight years.
The Company and Bank have formalized an asset and liability management process and have a standing ALCO consisting both of outside and inside directors and senior management. The ALCO operates under established policies and practices, which are updated and re-approved annually. A typical ALCO meeting includes discussion of current economic conditions and strategies, including interest rate trends and, the current balance sheet and earnings position, comparisons to budget, cash flow estimates, liquidity positions and funding alternatives as necessary, interest rate risk position (quarterly), capital positions of the Company and Bank, reviews (including independent reviews) of the investment portfolio of the Bank and the Company, and the approval of investment transactions. Additionally, monthly ALCO meetings may include reports and analysis of outside firms to enhance the Committee's knowledge and understanding of various financial matters.
The development of the Company's customer base has benefited from the extensive business and personal contacts of its directors and executive officers. The Bank has placed enhanced reliance on proactively designed officer calling programs, active participation in business organizations, and enhanced referral programs.
Internet Access to Company Documents. The Company provides access to its Securities and Exchange Commission ("SEC") filings through its web site at www.eaglebankcorp.com. After accessing the web site, the filings are available upon selecting "Investor Relations/SEC Filings/Documents." Reports available include the annual report on Form 10-K, quarterly reports on Form 10-Q, current reports on Form 8-K, and all amendments to those reports as soon as reasonably practicable after the reports are electronically filed with or furnished to the SEC.
7
The primary service area of the Bank is the Washington, D.C. metropolitan area. With a population of nearly 6,600,000, the region is the 5th largest market in the U.S. Total employment in the region is approximately 2,600,000. The region has one of the highest total job creation records of any market in the country with reported new job creation of more than 355,800 jobs since 2005 and 68,500 new jobs created in 2015. The Washington, D.C. metropolitan area contains a substantial federal workforce, as well as supporting a variety of support industries such as attorneys, lobbyists, government contractors, real estate developers and investors, non-profit organizations, tourism and consultants. The Gross Regional Product ("GRP") for the metropolitan area in 2014 was reported at $449 billion. Of this amount, approximately $104 billion or 30% is associated with spending by the government. Other significant sectors include professional and business services, education, health, leisure and hospitality. The region also has a very active non-profit sector including trade associations, colleges, universities and major hospitals.
Montgomery County, Maryland, with a total population estimated at 1,030,447 as of July 2014 and occupying an area of about 500 square miles, borders Washington, D.C. to the north and is roughly 30 miles southwest of Baltimore. Montgomery County represents a diverse and healthy segment of Maryland's economy. Montgomery County is a thriving business center and is Maryland's most populous jurisdiction. Population in the county is expected to grow 4.9% between 2015 and 2020. While the state of Maryland boasts a demographic profile superior to the U.S. economy at large, the economy in and around Montgomery County is among the best in Maryland. The number of jobs in Montgomery County has been relatively stable in the recent past with the public sector contributing about 20% of the employment. The unemployment rate in Montgomery County is among the lowest in the state at 3.9% as of November 2015. A highly educated population has contributed to favorable median household income of $98,704 with the number of households totaling 362,608. According to the U.S. census update, approximately 57% of the County's residents in 2014 hold college or advanced degrees, placing the population of Montgomery County among the most educated in the nation. The area boasts a diverse business climate of over 26,000 businesses with 460,000 private sector jobs in addition to a strong federal government presence. Major areas of employment include a substantial technology sector, biotechnology, software development, a housing construction and renovation sector, and legal, financial services, health care, and professional services sectors. Major private employers include Adventist Healthcare, Lockheed Martin, Giant Food, and Marriott International. The county is also an incubator for firms engaged in biotechnology and the area has traditionally attracted significant amounts of venture capital. Montgomery County is home to many major federal and private sector research and development and regulatory agencies, including the National Institute of Standards and Technology, the National Institutes of Health, National Oceanic and Atmospheric Administration, Naval Research and Development Center, Naval Surface Warfare Center, Nuclear Regulatory Commission, the Food and Drug Administration and the Walter Reed National Military Medical Center in Bethesda.
Transportation congestion and federal government spending levels remain threats to future economic development and the quality of life in the area.
The District of Columbia, in addition to being the seat of the federal government, is a vibrant city with a well-educated, diverse population. According to survey data from the latest U.S. Census, the estimated July 2014 population of the District of Columbia is approximately 658,893, up from 601,767 in 2010. Median household income, at $69,235 as of 2014, is above the national median level of $53,482. The growth of residents in the city is due partially to improvements in the city's services and to the many housing options available, ranging from grand old apartment buildings to Federal era town homes to the most modern condominiums. As of July 2014, the housing market has grown to over 306,174 units. As of December 2015, inventory levels remain tight in the District of Columbia with levels remaining 10% below the five year December average. While the federal government and its employees are a major factor in the economy, over 100 million square feet of commercial office space support a dynamic business community of more than 21,000 companies. These include law and accounting firms, trade and professional
8
associations, information technology companies, international financial institutions, health and education organizations and research and management companies. Unemployment has decreased with the rate for December 2015 at 6.6%, which is down from 7.7% in December 2014. The disparity between the high level of unemployment among District of Columbia residents and the strong employment trends reflects the high level of jobs held by residents of the surrounding suburban jurisdictions. The District of Columbia has a well-educated and highly paid work force. The federal government accounts for approximately 27% of the employment and private firms provide an additional 68% with local and state government making up the other 5%. Other large employers include the many local universities and hospitals. Another significant factor in the economy is the leisure and hospitality industry, as Washington, D.C. remains a popular tourist destination for both national and international travelers.
As a result of the October 31, 2014 merger with Virginia Heritage Bank (the "Merger"), the Bank substantially increased its market presence in Northern Virginia. Fairfax County, Virginia which is just across the Potomac River and west from Washington, D.C. is a large, affluent jurisdiction with an estimated population of 1,137,538 as of July 2014. This county covers about 395 square miles. Fairfax County is one of the leading technology centers in the United States. Eight Fortune 500 companies are headquartered in the county and 30 of the largest 100 technology federal contractors in the Washington D.C. metropolitan area are located in Fairfax County. The county has over 116.5 million square feet of office space and is one of the largest suburban office markets in the United States. The midyear 2013 office vacancy rate was 15.2%, below the national average of 16.5%, as measured in third quarter 2015. It is a thriving residential as well as business center with 410,287 households, which is expected to grow at about 8.5% between 2010 and 2020. The county is among the most affluent in the country with average annual household income of $112,102 per annum as of 2014. Total employment was over 593 thousand as of June 2015. Major companies headquartered in the county, which are also major employers, include Capital One Financial, CSC, Gannett, General Dynamics, Hilton Hotels, Leidos, Sallie Mae, and Inova Health Systems. The county is also home to several federal entities including the CIA, Fort Belvoir and a major facility of the Smithsonian Institution.
In 2011, the Bank's footprint expanded into Arlington County, Virginia, which has an estimated population of over 226,000 as of July 2014. The county is made up of 26 square miles and is situated just west of Washington, D.C., directly across the Potomac River. There are approximately 110,601 households with an estimated median household income of $105,120 as of July 2014. There were over 169,387 employees as of January 2016, working predominantly in or in support of the public sector. Significant private sector employers include Deloitte, Lockheed Martin Corporation, Virginia Hospital Center and Marriott International, Inc. The unemployment rate was just 2.4% as of December 2015. This is the lowest unemployment rate in the state of Virginia and compares very favorably to the U.S. rate of 5.0%. The population is highly educated, with about 72% of residents over 25 years of age holding at least a bachelor's degree as of 2014.
In early 2013, the Bank added a branch in Alexandria, Virginia to its network. Alexandria is a city with an estimated population of 150,575 as of July 2014. The city is made up of just over 15 square miles and sits on the west bank of the Potomac River just south of Arlington, Virginia. There are approximately 75,329 households with an estimated median household income of $87,319 as of July 2014. The employment base was approximately 95,900 employees as of December 2015, with 76% working in the private sector and 24% working in government roles. Alexandria has over 8,000 businesses and organizations, located in the more than 20 million square feet of office space and over 7 million square feet of retail space existing in the city as of March 2013. The unemployment rate was just 2.7% as of December 2015. The population is highly educated, with over 61.5% of residents over 25 years of age holding at least a bachelor's degree as of 2014.
9
Throughout the Washington, D.C. metropolitan area, competition is keen from large banking institutions headquartered outside of the area. Although some consolidation has occurred in the market in the past few years, the Bank continues to compete with other community banks, savings and loan associations, credit unions, mortgage companies, finance companies and others providing financial services. Among the advantages that many of these large institutions have over the Bank are their abilities to finance extensive advertising campaigns, maintain extensive branch networks and make technology investments, and to directly offer certain services, such as international banking and trust services, which are not offered directly by the Bank. Further, the greater capitalization of the larger institutions headquartered out-of-state allows for higher lending limits than the Bank, although the Bank's current lending limit is quite favorable and able to accommodate the credit needs of most businesses in the Washington D.C. metropolitan area, which distinguishes it from most community banks in the market area. Some of these competitors have other advantages, such as tax exemption in the case of credit unions, and to some extent lesser regulation in the case of mortgage companies and finance companies, although this regulatory oversight has undergone dramatic change. As a result of the Dodd-Frank Wall Street Reform and Consumer Protection Act (the "Dodd-Frank Act"), enacted in July 2010, regulation of all financial firms has been heightened. Under current law, unlimited interstate de novo branching is available to all state and federally chartered banks. As a result, institutions, which previously were ineligible to establish de novo branches in the Bank's market area, may elect to do so.
At December 31, 2015 the Bank employed 434 persons on a full time basis (eight of whom are executive officers of the Bank), which compares to 427 employees at December 31, 2014. None of the Bank's employees are represented by any collective bargaining group and the Bank believes that its employee relations are good. At December 31, 2015, the Bank provided a benefit program, which included health and dental insurance, a 401(k) plan, life and short and long term disability insurance. During 2015, the Bank provided company paid fitness facilities in various locations. Additionally, the Company maintains an employee stock purchase plan and a stock-based compensation plan for employees of the Bank who meet certain eligibility requirements.
Our business and operations are subject to extensive federal and state governmental regulation and supervision. The following is a brief summary of certain statutes and rules and regulations that affect or will affect us. This summary is not intended to be an exhaustive description of the statutes or regulations applicable to our business. Supervision, regulation, and examination of the Company by the regulatory agencies is intended primarily for the protection of depositors and the Deposit Insurance Fund, rather than our shareholders.
The Company. The Company is a bank holding company registered under the Bank Holding Company Act of 1956, as amended, (the "Act") and is subject to regulation and supervision by the Federal Reserve Board. The Act and other federal laws subject bank holding companies to restrictions on the types of activities in which they may engage, and to a range of supervisory requirements and activities, including regulatory enforcement actions for violations of laws and regulations and unsafe and unsound banking practices. As a bank holding company, the Company is required to file with the Federal Reserve Board an annual report and such other additional information as the Federal Reserve Board may require pursuant to the Act. The Federal Reserve Board may also examine the Company and each of its subsidiaries. The Company is subject to risk-based capital requirements adopted by the Federal Reserve Board, which are substantially identical to those applicable to the Bank, and which are described below.
The Act requires approval of the Federal Reserve Board for, among other things, a bank holding company's direct or indirect acquisition of control of more than five percent (5%) of the voting shares, or
10
substantially all the assets, of any bank or the merger or consolidation by a bank holding company with another bank holding company. The Act also generally permits the acquisition by a bank holding company of control or substantially all the assets of any bank located in a state other than the home state of the bank holding company, except where the bank has not been in existence for the minimum period of time required by state law; but if the bank is at least 5 years old, the Federal Reserve Board may approve the acquisition.
With certain limited exceptions, a bank holding company is prohibited from acquiring control of any voting shares of any company which is not a bank or bank holding company and from engaging directly or indirectly in any activity other than banking or managing or controlling banks or furnishing services to or performing service for its authorized subsidiaries. A bank holding company may, however, engage in or acquire an interest in, a company that engages in activities which the Federal Reserve Board has determined by order or regulation to be so closely related to banking or managing or controlling banks as to be properly incident thereto. In making such a determination, the Federal Reserve Board is required to consider whether the performance of such activities can reasonably be expected to produce benefits to the public, such as convenience, increased competition or gains in efficiency, which outweigh possible adverse effects, such as undue concentration of resources, decreased or unfair competition, conflicts of interest or unsound banking practices. The Federal Reserve Board is also empowered to differentiate between activities commenced de novo and activities commenced by the acquisition, in whole or in part, of a going concern. Some of the activities that the Federal Reserve Board has determined by regulation to be closely related to banking include making or servicing loans, performing certain data processing services, acting as a fiduciary or investment or financial advisor, and making investments in corporations or projects designed primarily to promote community welfare.
Subsidiary banks of a bank holding company are subject to certain restrictions imposed by the Federal Reserve Act on any extensions of credit to the bank holding company or any of its subsidiaries, or investments in the stock or other securities thereof, and on the taking of such stock or securities as collateral for loans to any borrower. Further, a bank holding company and any subsidiary bank are prohibited from engaging in certain tie-in arrangements in connection with the extension of credit. A subsidiary bank may not extend credit, lease or sell property, or furnish any services, or fix or vary the consideration for any of the foregoing on the condition that: (i) the customer obtain or provide some additional credit, property or services from or to such bank other than a loan, discount, deposit or trust service; (ii) the customer obtain or provide some additional credit, property or service from or to the Company or any other subsidiary of the Company; or (iii) the customer not obtain some other credit, property or service from competitors, except for reasonable requirements to assure the soundness of credit extended.
The Gramm Leach-Bliley Act of 1999 (the "GLB Act") allows a bank holding company or other company to certify status as a financial holding company, which allows such company to engage in activities that are financial in nature, that are incidental to such activities, or are complementary to such activities. The GLB Act enumerates certain activities that are deemed financial in nature, such as underwriting insurance or acting as an insurance principal, agent or broker, underwriting, dealing in or making markets in securities, and engaging in merchant banking under certain restrictions. It also authorizes the Federal Reserve Board to determine by regulation what other activities are financial in nature, or incidental or complementary thereto. The GLB Act allows a wider array of companies to own banks, which could result in companies with resources substantially in excess of the Company's entering into competition with the Company and the Bank. The Company has not elected financial holding company status.
The Bank. The Bank is a Maryland chartered commercial bank and a member of the Federal Reserve System (a "state member bank") whose accounts are insured by the Deposit Insurance Fund of the Federal Deposit Insurance Corporation (the "FDIC") up to the maximum legal limits of the FDIC. The Bank is subject to regulation, supervision and regular examination by the Maryland Department of Financial Institutions and the Federal Reserve Board. The regulations of these various agencies govern
11
most aspects of the Bank's business, including required reserves against deposits, loans, investments, mergers and acquisitions, borrowing, dividends and location and number of branch offices.
The laws and regulations governing the Bank generally have been promulgated to protect depositors and the Deposit Insurance Fund, and not for the purpose of protecting shareholders.
Competition among commercial banks, savings and loan associations, and credit unions has increased following enactment of legislation, which greatly expanded the ability of banks and bank holding companies to engage in interstate banking or acquisition activities. As a result of federal and state legislation, banks in the Washington, D.C. Metropolitan area can, subject to limited restrictions, acquire or merge with a bank in another jurisdiction, and can branch de novo in any jurisdiction.
Banking is a business, which depends on interest rate differentials. In general, the differences between the interest paid by a bank on its deposits and its other borrowings and the interest received by a bank on loans extended to its customers and securities held in its investment portfolio constitute the major portion of the bank's earnings. Thus, the earnings and growth of the Bank will be subject to the influence of economic conditions generally, both domestic and foreign, and also to the monetary and fiscal policies of the United States and its agencies, particularly the Federal Reserve Board, which regulates the supply of money through various means including open market dealings in United States government securities. The nature and timing of changes in such policies and their impact on the Bank cannot be predicted.
Branching and Interstate Banking. The federal banking agencies are authorized to approve interstate bank merger transactions without regard to whether such transaction is prohibited by the law of any state, unless the home state of one of the banks has opted out of the interstate bank merger provisions of the Riegle-Neal Interstate Banking and Branching Efficiency Act of 1994 (the "Riegle-Neal Act") by adopting a law after the date of enactment of the Riegle-Neal Act and prior to June 1, 1997 which applies equally to all out-of-state banks and expressly prohibits merger transactions involving out-of-state banks. Interstate acquisitions of branches are permitted only if the law of the state in which the branch is located permits such acquisitions. Such interstate bank mergers and branch acquisitions are also subject to the nationwide and statewide insured deposit concentration limitations described in the Riegle-Neal Act. Washington, D.C., Maryland and Virginia have each enacted laws, which permit interstate acquisitions of banks and bank branches. The Dodd-Frank Act authorizes national and state banks to establish de novo branches in other states to the same extent as a bank chartered by that state would be permitted to branch. Previously, banks could only establish branches in other states if the host state expressly permitted out-of-state banks to establish branches in that state. Although the District of Columbia, Maryland and Virginia had all enacted laws, which permitted banks in these jurisdictions to branch freely, the branching provisions of the Dodd-Frank Act could result in banks from a wider variety of states establishing de novo branches in the Bank's market area.
The GLB Act made substantial changes in the historic restrictions on non-bank activities of bank holding companies, and allows affiliations between types of companies that were previously prohibited. The GLB Act also allows banks to engage in a wider array of nonbanking activities through "financial subsidiaries."
USA Patriot Act. Under the Uniting and Strengthening America by Providing Appropriate Tools Required to Intercept and Obstruct Terrorism Act, commonly referred to as the "USA Patriot Act" or the "Patriot Act," financial institutions are subject to prohibitions against specified financial transactions and account relationships, as well as enhanced due diligence standards intended to detect, and prevent, the use of the United States financial system for money laundering and terrorist financing activities. The Patriot Act requires financial institutions, including banks, to establish anti-money laundering programs, including employee training and independent audit requirements, meet minimum standards specified by the act, follow minimum standards for customer identification and maintenance of customer identification records, and regularly compare customer lists against lists of suspected terrorists, terrorist organizations and money launderers. The costs or other effects of the compliance burdens imposed by the Patriot Act or future
12
anti-terrorist, homeland security or anti-money laundering legislation or regulation cannot be predicted with certainty.
Capital Adequacy. The Federal Reserve Board and the FDIC have adopted risk-based and leverage capital adequacy requirements, pursuant to which they assess the adequacy of capital in examining and supervising banks and bank holding companies and in analyzing bank regulatory applications. Risk-based capital requirements determine the adequacy of capital based on the risk inherent in various classes of assets and off-balance sheet items. Under the Dodd-Frank Act, the Federal Reserve Board is required to apply consolidated capital requirements to depository institution holding companies that are no less stringent than those currently applied to depository institutions. The Dodd-Frank Act additionally requires capital requirements to be countercyclical so that the required amount of capital increases in times of economic expansion and decreases in times of economic contraction, consistent with safety and soundness.
State member banks are expected to meet a minimum ratio of total qualifying capital (the sum of core capital (Tier 1) and supplementary capital (Tier 2) to risk weighted assets of 8%. At least half of this amount (4%) should be in the form of core capital.
The description below relates to the requirements, as they existed through December 31, 2014, subsequent to which the revised capital rules implementing Basel III became applicable to the Bank. See "Changes in Capital Requirements" below.
Tier 1 Capital generally consists of the sum of common shareholders' equity and perpetual preferred stock (subject in the case of the latter to limitations on the kind and amount of such stock which may be included as Tier 1 Capital), less goodwill, without adjustment for changes in the market value of securities classified as "available-for-sale," together with a limited amount of other qualifying interests, including trust preferred securities. Tier 2 Capital consists of the following: hybrid capital instruments; perpetual preferred stock which is not otherwise eligible to be included as Tier 1 Capital; term subordinated debt and intermediate-term preferred stock; and, subject to limitations, general allowances for loan losses and excess restricted core capital elements. Assets are adjusted under the risk-based guidelines to take into account different risk characteristics, with the categories ranging from 0% (requiring no risk-based capital) for assets such as cash, to 100% for the bulk of assets which are typically held by a bank holding company, including certain multi-family residential and commercial real estate loans, commercial business loans and consumer loans. Residential first mortgage loans on one to four family residential real estate and certain seasoned multi-family residential real estate loans, which are not 90 days or more past due or nonperforming and which have been made in accordance with prudent underwriting standards are assigned a 50% level in the risk-weighing system, as are certain privately-issued mortgage-backed securities representing indirect ownership of such loans. Off-balance sheet items also are adjusted to take into account certain risk characteristics. Under guidance adopted by the federal banking agencies, banks which have concentrations in construction, land development or commercial real estate loans (other than loans for majority owner occupied properties) would be expected to maintain higher levels of risk management and, potentially, higher levels of capital.
In addition to the risk-based capital requirements, the Federal Reserve Board has established a minimum 3.0% Leverage Capital Ratio (Tier 1 Capital to total adjusted assets) requirement for the most highly-rated banks, with an additional cushion of at least 100 to 200 basis points for all other banks, which effectively increases the minimum Leverage Capital Ratio for such other banks to 4.0% - 5.0% or more. The highest-rated banks are those that are not anticipating or experiencing significant growth and have well diversified risk, including no undue interest rate risk exposure, excellent asset quality, high liquidity, good earnings and, in general, those which are considered a strong banking organization. A bank having less than the minimum Leverage Capital Ratio requirement shall, within 60 days of the date as of which it fails to comply with such requirement, submit a reasonable plan describing the means and timing by which the bank shall achieve its minimum Leverage Capital Ratio requirement. A bank which fails to file such plan is deemed to be operating in an unsafe and unsound manner, and could subject the bank to a
13
cease-and-desist order. Any insured depository institution with a Leverage Capital Ratio that is less than 2.0% is deemed to be operating in an unsafe or unsound condition pursuant to Section 8(a) of the Federal Deposit Insurance Act (the "FDIA") and is subject to potential termination of deposit insurance. However, such an institution will not be subject to an enforcement proceeding solely on account of its capital ratios, if it has entered into and is in compliance with a written agreement to increase its Leverage Capital Ratio and to take such other action as may be necessary for the institution to be operated in a safe and sound manner. The capital regulations also provide, among other things, for the issuance of a capital directive, which is a final order issued to a bank that fails to maintain minimum capital or to restore its capital to the minimum capital requirement within a specified time period. Such directive is enforceable in the same manner as a final cease-and-desist order.
The capital ratios described above are the minimum levels that the federal banking agencies expect. Our state and federal regulators have the discretion to require us to maintain higher capital levels based upon our concentrations of loans, the risk of our lending or other activities, the performance of our loan and investment portfolios and other factors. Failure to maintain such higher capital expectations could result in a lower composite regulatory rating, which would impact our deposit insurance premiums and could affect our ability to borrow and costs of borrowing, and could result in additional or more severe enforcement actions. In respect of institutions with high concentrations of loans in areas deemed to be higher risk, or during periods of significant economic stress, regulators may require an institution to maintain a higher level of capital, and/or to maintain more stringent risk management measures, than those required by these regulations.
Changes in Capital Requirements. In December 2010, the Basel Committee on Banking Supervision released its final framework for strengthening international capital and liquidity regulation ("Basel III"). The regulations adopted by the federal banking agencies, when fully phased-in, will require bank holding companies and their bank subsidiaries to maintain more capital, with a greater emphasis on common equity.
The Basel III final capital framework, among other things, (i) introduces as a new capital measure "Common Equity Tier 1" ("CET1"), (ii) specifies that Tier 1 capital consists of CET1 and "Additional Tier 1 capital" instruments meeting specified requirements, (iii) defines CET1 narrowly by requiring that most adjustments to regulatory capital measures be made to CET1 and not to the other components of capital and (iv) expands the scope of the adjustments as compared to existing regulations.
When fully phased in by January 1, 2019, Basel III requires banks to maintain: (i) as a newly adopted international standard, a minimum ratio of CET1 to risk-weighted assets of at least 4.5%, plus a "capital conservation buffer" of 2.5%; (ii) a minimum ratio of Tier 1 capital to risk-weighted assets of at least 6.0%, plus the capital conservation buffer, or 8.5%; (iii) a minimum ratio of Total (Tier 1 plus Tier 2) capital to risk-weighted assets of at least 8.0% plus the capital conservation buffer, or 10.5%; and (iv) as a newly adopted international standard, a minimum leverage ratio of 3%, calculated as the ratio of Tier 1 capital to balance sheet exposures plus certain off-balance sheet exposures (computed as the average for each quarter of the month-end ratios for the quarter).
Basel III also provides for a "countercyclical capital buffer," generally to be imposed when federal banking agencies determine that excess aggregate credit growth becomes associated with a buildup of systemic risk that would be a CET1 add-on to the capital conservation buffer in the range of 0% to 2.5% when fully implemented. The capital conservation buffer is designed to absorb losses during periods of economic stress.
Banking institutions with a ratio of CET1 to risk-weighted assets above the minimum but below the conservation buffer (or below the combined capital conservation buffer and countercyclical capital buffer, when the latter is applied) may face constraints on its ability to pay dividends, effect equity repurchases and pay discretionary bonuses to executive officers, which constraints vary based on the amount of the shortfall.
14
The Basel III final framework provides for a number of new deductions from and adjustments to CET1. These include, for example, the requirement that mortgage servicing rights, deferred tax assets dependent upon future taxable income and significant investments in non-consolidated financial entities be deducted from CET1 to the extent that any one such category exceeds 10% of CET1 or all such categories in the aggregate exceed 15% of CET1.
The federal banking agencies adopted a final rulemaking in July 2013 (the "Basel III Rule") to implement Basel III under regulations substantially consistent with the above. The Basel III Rule also includes, as part of the definition of CET1 capital, a requirement that banking institutions include the amount of additional other comprehensive income ("AOCI," which primarily consists of unrealized gains and losses on available for sale securities, which are not required to be treated as other-than-temporary impairment, net of tax) in calculating regulatory capital, unless the institution makes a one-time opt-out election from this provision in connection with the filing of its first regulatory reports after applicability of the Basel III Rule to that institution. The Company did, in fact, opt-out of this requirement as allowed by Basel III and, as such, does not include AOCI in its regulatory capital calculation. The Basel III Rule also requires a 4% minimum leverage ratio.
The Basel III Rule also makes changes to the manner of calculating risk weighted assets. New methodologies for determining risk weighted assets in the general capital rules are included, including revisions to recognition of credit risk mitigation, including a greater recognition of financial collateral and a wider range of eligible guarantors. They also include risk weighting of equity exposures and past due loans; and higher (greater than 100%) risk weighting for certain commercial real estate exposures that have higher credit risk profiles, including higher loan to value and equity components. In particular, loans categorized as "high-volatility commercial real estate" ("HVCRE") loans are required to be assigned a 150% risk weighting, and require additional capital support. HVCRE loans are defined to include any credit facility that finances or has financed the acquisition, development or construction of real property, unless it finances: 1-4 family residential properties; certain community development investments; agricultural land used or usable for, and whose value is based on, agricultural use; or commercial real estate projects in which: (i) the LTV is less than the applicable maximum supervisory LTV ratio established by the bank regulatory agencies; (ii) the borrower has contributed cash or unencumbered readily marketable assets, or has paid development expenses out of pocket, equal to at least 15% of the appraised "as completed" value; (iii) the borrower contributes its 15% before the bank advances any funds; and (iv) the capital contributed by the borrower, and any funds internally generated by the project, is contractually required to remain in the project until the facility is converted to permanent financing, sold or paid in full.
As discussed below, the Basel III Rule also integrates the new capital requirements into the prompt corrective action provisions under Section 38 of the FDIA.
The Basel III Rule became applicable to the Company and the Bank on January 1, 2015. The capital conservation buffer requirement will be phased in beginning January 1, 2016, at 0.625% of risk-weighted assets, increasing each year until fully implemented at 2.5% on January 1, 2019. During 2015, the Company and Bank elected to exclude AOCI in calculating regulatory capital as permitted under the Basel III Rule. Basel III subjects the higher risk loans made by ECV to higher risk weightings, and as such these loans require additional capital, or substantial restructuring in order to avoid such higher risk weights. The Company's $70 million of subordinated notes due 2024 qualify for Tier 2 capital treatment under the Basel III Rule. Overall, the Company believes that implementation of the Basel III Rule will not have a material adverse effect on the Company's or the Bank's capital ratios, earnings, shareholder's equity, or its ability to pay dividends, effect stock repurchases or pay discretionary bonuses to executive officers.
Prompt Corrective Action. Under Section 38 of the FDIA, each federal banking agency is required to implement a system of prompt corrective action for institutions, which it regulates. The federal banking agencies have promulgated substantially similar regulations to implement the system of prompt corrective
15
action established by Section 38 of the FDIA. Under the regulations effective through December 31, 2014, a bank shall be deemed to be: (i) "well capitalized" if it has a Total Risk Based Capital Ratio of 10.0% or more, a Tier 1 Risk Based Capital Ratio of 6.0% or more, a Leverage Capital Ratio of 5.0% or more and is not subject to any written capital order or directive; (ii) "adequately capitalized" if it has a Total Risk Based Capital Ratio of 8.0% or more, a Tier 1 Risk Based Capital Ratio of 4.0% or more and a Tier 1 Leverage Capital Ratio of 4.0% or more (3.0% under certain circumstances) and does not meet the definition of "well capitalized;" (iii) "undercapitalized" if it has a Total Risk Based Capital Ratio that is less than 8.0%, a Tier 1 Risk based Capital Ratio that is less than 4.0% or a Leverage Capital Ratio that is less than 4.0% (3.0% under certain circumstances); (iv) "significantly undercapitalized" if it has a Total Risk Based Capital Ratio that is less than 6.0%, a Tier 1 Risk Based Capital Ratio that is less than 3.0% or a Leverage Capital Ratio that is less than 3.0%; and (v) "critically undercapitalized" if it has a ratio of tangible equity to total assets that is equal to or less than 2.0%.
An institution generally must file a written capital restoration plan which meets specified requirements with an appropriate federal banking agency within 45 days of the date the institution receives notice or is deemed to have notice that it is undercapitalized, significantly undercapitalized or critically undercapitalized. A federal banking agency must provide the institution with written notice of approval or disapproval within 60 days after receiving a capital restoration plan, subject to extensions by the applicable agency.
An institution which is required to submit a capital restoration plan must concurrently submit a performance guaranty by each company that controls the institution. Such guaranty shall be limited to the lesser of (i) an amount equal to 5.0% of the institution's total assets at the time the institution was notified or deemed to have notice that it was undercapitalized or (ii) the amount necessary at such time to restore the relevant capital measures of the institution to the levels required for the institution to be classified as adequately capitalized. Such a guaranty shall expire after the federal banking agency notifies the institution that it has remained adequately capitalized for each of four consecutive calendar quarters. An institution which fails to submit a written capital restoration plan within the requisite period, including any required performance guaranty, or fails in any material respect to implement a capital restoration plan, shall be subject to the restrictions in Section 38 of the FDIA which are applicable to significantly undercapitalized institutions.
A "critically undercapitalized institution" is to be placed in conservatorship or receivership within 90 days unless the FDIC formally determines that forbearance from such action would better protect the Deposit Insurance Fund. Unless the FDIC or other appropriate federal banking agency makes specific further findings and certifies that the institution is viable and is not expected to fail, an institution that remains critically undercapitalized on average during the fourth calendar quarter after the date it becomes critically undercapitalized must be placed in receivership. The general rule is that the FDIC will be appointed as receiver within 90 days after a bank becomes critically undercapitalized unless extremely good cause is shown and an extension is agreed to by the federal regulators. In general, good cause is defined as capital, which has been raised and is imminently available for infusion into the Bank except for certain technical requirements, which may delay the infusion for a period of time beyond the 90 day time period.
Immediately upon becoming undercapitalized, an institution shall become subject to the provisions of Section 38 of the FDIA, which (i) restrict payment of capital distributions and management fees; (ii) require that the appropriate federal banking agency monitor the condition of the institution and its efforts to restore its capital; (iii) require submission of a capital restoration plan; (iv) restrict the growth of the institution's assets; and (v) require prior approval of certain expansion proposals. The appropriate federal banking agency for an undercapitalized institution also may take any number of discretionary supervisory actions if the agency determines that any of these actions is necessary to resolve the problems of the institution at the least possible long-term cost to the deposit insurance fund, subject in certain cases to specified procedures. These discretionary supervisory actions include: requiring the institution to raise additional capital; restricting transactions with affiliates; requiring divestiture of the institution or the sale
16
of the institution to a willing purchaser; and any other supervisory action that the agency deems appropriate. These and additional mandatory and permissive supervisory actions may be taken with respect to significantly undercapitalized and critically undercapitalized institutions.
Additionally, under Section 11(c)(5) of the FDIA, a conservator or receiver may be appointed for an institution where: (i) an institution's obligations exceed its assets; (ii) there is substantial dissipation of the institution's assets or earnings as a result of any violation of law or any unsafe or unsound practice; (iii) the institution is in an unsafe or unsound condition; (iv) there is a willful violation of a cease-and-desist order; (v) the institution is unable to pay its obligations in the ordinary course of business; (vi) losses or threatened losses deplete all or substantially all of an institution's capital, and there is no reasonable prospect of becoming "adequately capitalized" without assistance; (vii) there is any violation of law or unsafe or unsound practice or condition that is likely to cause insolvency or substantial dissipation of assets or earnings, weaken the institution's condition, or otherwise seriously prejudice the interests of depositors or the insurance fund; (viii) an institution ceases to be insured; (ix) the institution is undercapitalized and has no reasonable prospect that it will become adequately capitalized, fails to become adequately capitalized when required to do so, or fails to submit or materially implement a capital restoration plan; or (x) the institution is critically undercapitalized or otherwise has substantially insufficient capital.
As noted above, the Basel III Rule integrates the new capital requirements into the prompt corrective action category definitions. As of January 1, 2015, the following capital requirements applied to the Company for purposes of Section 38.
Capital Category
|
Total Risk-Based Capital Ratio |
Tier 1 Risk-Based Capital Ratio |
Common Equity Tier 1 Capital Ratio |
Leverage Ratio | Tangible Equity to Assets |
Supplemental Leverage Ratio |
||||||
|---|---|---|---|---|---|---|---|---|---|---|---|---|
Well Capitalized |
10% or greater | 8% or greater | 6.5% or greater | 5% or greater | n/a | n/a | ||||||
Adequately Capitalized |
8% or greater | 6% or greater | 4.5% or greater | 4% or greater | n/a | 3% or greater | ||||||
Undercapitalized |
Less than 8% | Less than 6% | Less than 4.5% | Less than 4% | n/a | Less than 3% | ||||||
Significantly Undercapitalized |
Less than 6% | Less than 4% | Less than3% | Less than 3% | n/a | n/a | ||||||
Critically Undercapitalized |
n/a | n/a | n/a | n/a | Less than 2% | n/a |
Regulatory Enforcement Authority. Federal banking law grants substantial enforcement powers to federal banking agencies. This enforcement authority includes, among other things, the ability to assess civil money penalties, to issue cease-and-desist or removal orders and to initiate injunctive actions against banking organizations and institution-affiliated parties. In general, these enforcement actions may be initiated for violations of laws and regulations and unsafe or unsound practices. Other actions or inactions may provide the basis for enforcement action, including misleading or untimely reports filed with regulatory authorities.
As a result of the volatility and instability in the financial system in recent years, Congress, the bank regulatory authorities and other government agencies have called for or proposed additional regulation and restrictions on the activities, practices and operations of banks and their holding companies. While many of these proposals relate to institutions that have accepted investments from, or sold troubled assets to, the Department of the Treasury or other government agencies, or otherwise participate in government programs intended to promote financial stabilization, the Congress and the federal banking agencies have broad authority to require all banks and holding companies to adhere to more rigorous or costly operating procedures, corporate governance procedures, or to engage in activities or practices which they would not otherwise elect. Any such requirement could adversely affect the Company's business and results of operations.
The Dodd-Frank Act. The Dodd-Frank Act made significant changes to the current bank regulatory structure, which affects the lending, deposit, investment, trading and operating activities of financial institutions and their holding companies. The Dodd-Frank Act requires a number of federal agencies to adopt a broad range of new rules and regulations, and to prepare various studies and reports for Congress. The federal agencies are given significant discretion in drafting these rules and regulations, and
17
consequently, many of the details and much of the impact of the Dodd-Frank Act may not be known for some time. Although it is not possible to determine the ultimate impact of this statute until the extensive rulemaking is complete and becomes effective, the following provisions are considered to be of greatest significance to the Company:
- •
- Expands the authority of the Federal Reserve Board to examine bank holding companies and their subsidiaries, including insured
depository institutions.
- •
- Requires a bank holding company to be well capitalized and well managed to receive approval of an interstate bank acquisition.
- •
- Provides mortgage reform provisions regarding a customer's ability to pay and making more loans subject to provisions for higher-cost
loans and new disclosures.
- •
- Creates the Consumer Financial Protection Bureau ("CFPB"), which has rulemaking authority for a wide range of consumer protection laws
that apply to all banks, and has broad powers to supervise and enforce consumer protection laws.
- •
- Creates the Financial Stability Oversight Council ("FSOC") with authority to identify institutions and practices that might pose a
systemic risk.
- •
- Introduces additional corporate governance and executive compensation requirements on companies subject to the 1934 Act, as amended.
- •
- Permits FDIC-insured banks to pay interest on business demand deposits.
- •
- Codifies the requirement that holding companies and other companies that directly or indirectly control an insured depository
institution to serve as a source of financial strength.
- •
- Makes permanent the $250 thousand limit for federal deposit insurance.
- •
- Permits national and state banks to establish interstate branches to the same extent as the branch host state allows establishment of in-state branches.
Consumer Financial Protection Bureau. The Dodd-Frank Act created the CFPB, a new, independent federal agency within the Federal Reserve System having broad rulemaking, supervisory and enforcement powers under various federal consumer financial protection laws, including the Equal Credit Opportunity Act, Truth in Lending Act, Real Estate Settlement Procedures Act, Fair Credit Reporting Act, Fair Debt Collection Practices Act, the consumer financial privacy provisions of the Gramm-Leach-Bliley Act and certain other statutes. The CFPB, which began operations on July 21, 2011, has examination and primary enforcement authority with respect to depository institutions with $10 billion or more in assets. Smaller institutions, including the Bank, are subject to rules promulgated by the CFPB but continue to be examined and supervised by federal banking agencies for compliance with federal consumer protection laws and regulations. The CFPB also has authority to prevent unfair, deceptive or abusive practices in connection with the offering of consumer financial products. The Dodd-Frank Act permits states to adopt consumer protection laws and standards that are more stringent than those adopted at the federal level and, in certain circumstances, permits state attorneys general to enforce compliance with both the state and federal laws and regulations.
The CFPB has proposed or issued a number of important rules affecting a wide range of consumer financial products. Many of these rules took effect in January 2014 and October 2015. The changes resulting from the Dodd-Frank Act and CFPB rulemakings may impact the profitability of our business activities, limit our ability to make, or the desirability of making, certain types of loans, including non-qualified mortgage loans, require us to change our business practices, impose upon us more stringent capital, liquidity and leverage ratio requirements or otherwise adversely affect our business or profitability. The changes may also require us to dedicate significant management attention and resources to evaluate and make necessary changes to comply with the new statutory and regulatory requirements.
18
The CFPB has concentrated much of its rulemaking efforts on reforms related to residential mortgage transactions. In 2013, the CFPB issued final rules related to a borrower's ability to repay and qualified mortgage standards, mortgage servicing standards, loan originator compensation standards, requirements for high-cost mortgages, appraisal and escrow standards and requirements for higher-priced mortgages. In November 2013, the CFPB issued final rules establishing integrated disclosure requirements for lenders and settlement agents in connection with most closed end, real estate secured consumer loans. The Bank fully complies with these rules, which became effective October 2015. In October 2015, the CFPB issued final rules which, among other things, expand the scope of information lenders must report in connection with mortgage and other housing-related loan applications under the Home Mortgage Disclosure Act. These rules include significant regulatory and compliance changes and are expected to have a broad impact on the financial services industry. The Bank intends to fully comply with these rules, which become effective on a rolling basis between January 1, 2017 and January 1, 2019.
The final rule implementing the Dodd-Frank Act requirement that lenders determine whether a consumer has the ability to repay a mortgage loan, which went into effect on January 10, 2014, establishes certain minimum requirements for creditors when making ability to pay determinations, and establishes certain protections from liability for mortgages meeting the definition of "qualified mortgages." Generally, the rule applies to all consumer-purpose, closed-end loans secured by a dwelling including home-purchase loans, refinances and home equity loans—whether first or subordinate lien. The rule does not cover, among other things, home equity lines of credit or other open-end credit; temporary or "bridge" loans with a term of 12 months or less, such as a loan to finance the initial construction of a dwelling; a construction phase of 12 months or less of a construction-to-permanent loan; and business-purpose loans, even if secured by a dwelling. The rule affords greater legal protections for lenders making qualified mortgages that are not "higher priced." Qualified mortgages must generally satisfy detailed requirements related to product features, underwriting standards, and a points and fees requirement whereby the total points and fees on a mortgage loan cannot exceed specified amounts or percentages of the total loan amount. Mandatory features of a qualified mortgage include: (1) a loan term not exceeding 30 years; and (2) regular periodic payments that do not result in negative amortization, deferral of principal repayment, or a balloon payment. Further, the rule clarifies that qualified mortgages do not include "no-doc" loans and loans with negative amortization, interest-only payments, or balloon payments. The rule creates special categories of qualified mortgages originated by certain smaller creditors. In January 2015, the CFPB issued a proposed rule that would provide regulatory relief to a broader set of smaller lenders. Among other things, the proposed rule would (1) increase the loan origination limit to qualify for "smaller creditor" status from 500 loans to 2,000 loans annually, (2) extend the transition period for smaller lenders seeking to make qualified mortgages with a balloon payment feature to April 1, 2016. Our business strategy, product offerings, and profitability may change as the rule is interpreted by the regulators and courts.
The final rule adopting new mortgage servicing standards, which took effect January 2014, imposes new requirements regarding force-placed insurance, mandates certain notices prior to rate adjustments on adjustable rate mortgages, and establishes requirements for periodic disclosures to borrowers. These requirements will affect notices to be given to consumers as to delinquency, foreclosure alternatives, modification applications, interest rate adjustments and options for avoiding "force-placed" insurance. Servicers will be prohibited from processing foreclosures when a loan modification is pending, and must wait until a loan is more than 120 days delinquent before initiating a foreclosure action. Servicers must provide direct and ongoing access to its personnel, and provide prompt review of any loss mitigation application. Servicers must maintain accurate and accessible mortgage records for the life of a loan and until one year after the loan is paid off or transferred. These new standards are expected to increase the cost and compliance risks of servicing mortgage loans. While the Bank has a general practice of selling the residential mortgage loans it originates in the secondary market, it continues to engage in servicing activities for the loans it maintains in its portfolio. We cannot predict the ultimate outcome of these inquiries, actions, or regulatory changes or the impact that they could have on our financial condition, results of operations, or business.
19
Additionally, the CFPB has focused on the area of automotive finance, particularly with respect to indirect financing arrangements and fair lending compliance. In March 2013, the CFPB provided guidance about compliance with fair lending requirements of the Equal Credit Opportunity Act and its implementing regulations for indirect automotive finance companies that permit dealers to charge annual percentage rates to consumers in excess of buy rates used by the finance company to calculate the price paid to acquire an assignment of the retail installment sale contract.
FDIC Insurance Premiums. The FDIC maintains a risk-based assessment system for determining deposit insurance premiums. Four risk categories (I-IV), each subject to different premium rates, ranging from a low of 2.5 basis points up to 45 basis points, are established based upon an institution's status as well capitalized, adequately capitalized or undercapitalized, and the institution's supervisory rating. An insured institution is required to pay deposit insurance premiums on its assessment base in accordance with its risk category. In general, a bank's assessment base is determined by subtracting the bank's tangible equity and certain allowable deductions from its consolidated average assets. There are three adjustments that can be made to an institution's initial base assessment rate: (1) a potential decrease for long-term unsecured debt, including senior and subordinated debt and, for small institutions, a portion of Tier 1 capital; (2) a potential increase for secured liabilities above a threshold amount; and (3) for non-Risk Category I institutions, a potential increase for brokered deposits above a threshold amount. The FDIC may also impose special assessments from time to time.
The Dodd-Frank Act permanently increased the maximum deposit insurance amount for banks, savings institutions and credit unions to $250 thousand per depositor. The Dodd-Frank Act also broadened the base for FDIC insurance assessments. Assessments are now based on a financial institution's average consolidated total assets less tangible equity capital. The Dodd-Frank Act requires the FDIC to increase the reserve ratio of the Deposit Insurance Fund from 1.15% to 1.35% of insured deposits by 2020 and eliminates the requirement that the FDIC pay dividends to insured depository institutions when the reserve ratio exceeds certain thresholds. The Dodd-Frank Act eliminated the statutory prohibition against the payment of interest on business checking accounts.
Increased Focus on Lending to Members of the Military. The federal banking agencies and the Department of Justice have recently increased its focus on financial institution compliance with the Servicemembers Civil Relief Act (SCRA). The SCRA requires a bank to cap the interest rate at 6% for any loan to a member of the military who goes on active duty after taking out the loan. It also limits the actions the bank can take when a servicemember is in foreclosure. The Bank fully complies with this rule.
An investment in our common stock involves a high degree of risk. Before making an investment decision, you should carefully read and consider the risk factors described below as well as the other information included in this report and other documents we file with the SEC, as the same may be updated from time to time. Any of these risks, if they actually occur, could materially adversely affect our business, financial condition, and results of operations. Additional risks and uncertainties not currently known to us or that we currently deem to be immaterial may also materially and adversely affect us. In any such case, you could lose all or a portion of your original investment.
The price of our common stock may fluctuate significantly, which may make it difficult for investors to resell shares of common stock at a time or price they find attractive.
Our stock price may fluctuate significantly as a result of a variety of factors, many of which are beyond our control. In addition to those described in "Caution About Forward Looking Statements," these factors include:
- •
- Actual or anticipated quarterly fluctuations in our operating results and financial condition;
20
- •
- Changes in financial estimates or publication of research reports and recommendations by financial analysts or actions taken by rating
agencies with respect to us or other financial institutions;
- •
- Reports in the press or investment community generally or relating to our reputation or the financial services industry;
- •
- Strategic actions by us or our competitors, such as acquisitions, restructurings, dispositions or financings;
- •
- Fluctuations in the stock price and operating results of our competitors;
- •
- Future sales of our equity or equity-related securities;
- •
- Proposed or adopted regulatory changes or developments;
- •
- Anticipated or pending investigations, proceedings, or litigation that may involve or affect us;
- •
- Domestic and international economic and political factors unrelated to our performance; and
- •
- General market conditions and, in particular, developments related to market conditions for the financial services industry.
In addition, in recent years, the stock market in general has experienced extreme price and volume fluctuations. This volatility has had a significant effect on the market price of securities issued by many companies, including for reasons unrelated to their operating performance. These broad market fluctuations may adversely affect our stock price, notwithstanding our operating results. We expect that the market price of our common stock will continue to fluctuate and there can be no assurances about the levels of the market prices for our common stock.
Trading in our common stock has been moderate. As a result, shareholders may not be able to quickly and easily sell their common stock, particularly in large quantities.
Although our common stock is listed for trading on NASDAQ and a number of brokers offer to make a market in our common stock on a regular basis, trading volume to date has been limited, averaging approximately 128,583 shares per day for 2015 and 164,377 shares per day through February 19, 2016. There can be no assurance that a more active and liquid market for our common stock will develop or can be maintained. As a result, shareholders may find it difficult to sell a significant number of shares of our common stock at the prevailing market price.
Our ability to pay dividends on our common stock, or repurchase shares of common stock may be limited.
The payment of a cash dividend on common stock will depend largely upon the ability of the Bank, the Company's principal operating business, to declare and pay dividends to the Company. Payment of dividends on the common stock will also depend upon the Bank's earnings, financial condition, and need for funds, as well as laws, regulations and governmental policies applicable to the Company and the Bank, which limit the amount of dividends that may be declared. Additionally, under the Basel III Rule, banking institutions that do not meet certain CET1 to risk-weighted asset thresholds may face constraints on its ability to pay dividends and/or effect equity repurchases based on the amount of the shortfall, if any. Refer to "Regulation" under Item 1 and to "Market for Common Stock" under Item 5 for additional information.
21
We may issue additional equity securities, or engage in other transactions, which could dilute our book value or affect the priority of our common stock, which may adversely affect the market price of our common stock.
Our Board of Directors may determine from time to time that we need to raise additional capital by issuing additional shares of our common stock or other securities. We are not restricted from issuing additional shares of common stock, including securities that are convertible into or exchangeable for, or that represent the right to receive, common stock. Because our decision to issue securities in any future offering will depend on market conditions and other factors beyond our control, we cannot predict or estimate the amount, timing or nature of any future offerings, or the prices at which such offerings may be effected. Such offerings could be dilutive to common shareholders. New investors also may have rights, preferences and privileges that are senior to, and that adversely affect, our then current common shareholders. Additionally, if we raise additional capital by making additional offerings of debt or preferred equity securities, upon liquidation of the Company, holders of our debt securities and shares of preferred stock, and lenders with respect to other borrowings, will receive distributions of our available assets prior to the holders of our common stock. Additional equity offerings may dilute the holdings of our existing shareholders or reduce the market price of our common stock, or both. Holders of our common stock are not entitled to preemptive rights or other protections against dilution.
Changes in the value of goodwill and intangible assets could reduce our earnings.
The Company accounts for goodwill and other intangible assets in accordance with generally accepted accounting principles ("GAAP"), which, in general, requires that goodwill not be amortized, but rather that it be tested for impairment at least annually at the reporting unit level using the two step approach. Testing for impairment of goodwill and intangible assets is performed annually and involves the identification of reporting units and the estimation of fair values. The estimation of fair values involves a high degree of judgment and subjectivity in the assumptions used. Changes in the local and national economy, the federal and state legislative and regulatory environments for financial institutions, the stock market, interest rates and other external factors (such as natural disasters or significant world events) may occur from time to time, often with great unpredictability, and may materially impact the fair value of publicly traded financial institutions and could result in an impairment charge at a future date.
We may not be able to manage future growth and competition.
We have grown rapidly in the past several years, through acquisition and through organic growth. We intend to seek further growth in the level of our assets and deposits and selectively in the number of our branches, both within our existing footprint and possibly to expand our footprint in the Northern Virginia suburbs, although no additional branches are currently anticipated in 2016. We cannot provide any assurance that we will continue to be able to maintain our rate of growth at acceptable risk levels and upon acceptable terms, while managing the costs and implementation risks associated with its growth strategy. We may be unable to continue to increase our volume of loans and deposits or to introduce new products and services at acceptable risk levels for a variety of reasons, including an inability to maintain capital and liquidity sufficient to support continued growth. If we are successful in continuing our growth, we cannot assure you that further growth would offer the same levels of potential profitability, or that it would be successful in controlling costs and maintaining asset quality. Accordingly, an inability to maintain growth, or an inability to effectively manage growth, could adversely affect our results of operations, financial condition and stock price.
22
Our directors and officers currently own approximately 9.51% of our outstanding shares of common stock. As a result of their combined ownership, they could make it more difficult to obtain approval for some matters submitted to shareholder vote, including acquisitions of the Company. The results of the vote may be contrary to the desires or interests of the public shareholders.
Our directors and officers and their affiliates currently own approximately 9.51% of our outstanding shares of common stock, excluding shares, which may be acquired upon the exercise of options. By voting against a proposal submitted to shareholders, the directors and officers, as a group, may be able to make approval more difficult for proposals requiring the vote of shareholders, such as some mergers, share exchanges, asset sales, and amendments to the Articles of Incorporation.
Substantial regulatory limitations on changes of control and anti-takeover provisions of Maryland law may make it more difficult for shareholders to receive a change in control premium.
With certain limited exceptions, federal regulations prohibit a person or company or a group of persons deemed to be "acting in concert" from, directly or indirectly, acquiring more than 10% (5% if the acquiror is a bank holding company) of any class of the Company's voting stock or obtaining the ability to control in any manner the election of a majority of its directors or otherwise direct the management or policies of the Company without prior notice or application to and the approval of the Federal Reserve. There are comparable prior approval requirements for changes in control under Maryland law. Also, the Maryland General Corporation Law, as amended, contains several provisions that may make it more difficult for a third party to acquire control of the Company without the approval of its Board of Directors, and may make it more difficult or expensive for a third party to acquire a majority of its outstanding common stock.
The economic environment continues to pose significant challenges for us and could adversely affect our financial condition and results of operations.
The Company and the Bank are operating in a challenging and uncertain economic environment. Financial institutions continue to be affected by some softness in the real estate market and constrained financial markets, highlighted by historically low market interest rates. Some concerns about the housing market remain, and higher levels of foreclosures and weak employment statistics continue in some parts of the country. While conditions have improved since the depths of the financial crisis, both generally and in the Bank's market area, should declines in real estate values, home sales volumes, and financial stress on borrowers as a result of the uncertain economic environment re-emerge, such events could have an adverse effect on our borrowers or their customers, which could adversely affect our financial condition and results of operations. A worsening of these conditions would likely exacerbate the adverse effects on the Company and others in the financial institutions industry. For example, deterioration in local economic conditions in our market could drive losses beyond that which is provided for in our allowance for loan losses. The Company may also face the following risks in connection with these events:
- •
- Economic conditions that negatively affect commercial real estate values and the job market may result in a deterioration in credit
quality of our loan portfolio, and such deterioration in credit quality could have a negative impact on our business;
- •
- Market developments may affect consumer confidence levels and may cause adverse changes in payment patterns, causing increases in
delinquencies and default rates on loans and other credit facilities;
- •
- A reduction in the size, spending or employment levels of the federal, state and/or local governments in the Washington, D.C. metropolitan area could have a negative effect on the economy in the region, on our customers and on real estate prices;
23
- •
- The methodologies we use to establish our allowance for loan losses may no longer be reliable because they rely on complex judgments,
including forecasts of economic conditions, which may no longer be capable of accurate estimation; and
- •
- Compliance with increased regulation of the banking industry may increase our costs, limit our ability to pursue business opportunities, and divert management efforts.
If these conditions or similar ones continue to exist or worsen, the Company could experience continuing or increased adverse effects on its financial condition and results of operations.
Our financial condition and results of operations would be adversely affected if our allowance for credit losses is not sufficient to absorb actual losses or if we are required to increase our allowance for loan losses.
Historically, we have enjoyed a relatively low level of nonperforming assets and net charge-offs, both in absolute dollars, as a percentage of loans and as compared to many of our peer institutions. As a result of this historical experience, we have incurred a relatively lower loan loss provision expense, which has positively impacted our earnings. However, should a higher portion of our loans become delinquent, or if some of our loans are only partially repaid, we may experience losses for reasons beyond our control. Despite our underwriting criteria and historical experience, we may be particularly susceptible to losses due to: (1) the geographic concentration of our loans; (2) the concentration of higher risk loans, such as commercial real estate, construction and commercial and industrial loans; and (3) the relative lack of seasoning of certain of our loans. As a result, we may not be able to maintain our relatively low levels of nonperforming assets and charge-offs. Although we believe that our allowance for loan losses is maintained at a level adequate to absorb any inherent losses in our loan portfolio, these estimates of loan losses are necessarily subjective and their accuracy depends on the outcome of future events. If we need to make significant and unanticipated increases in our loss allowance in the future, our results of operations and financial condition would be materially adversely affected at that time.
While we strive to carefully monitor credit quality and to identify loans that may become nonperforming, at any time there are loans included in the portfolio that will result in losses, but that have not been identified as nonperforming or potential problem loans. We cannot be sure that we will be able to identify deteriorating loans before they become nonperforming assets, or that we will be able to limit losses on those loans that are identified. As a result, future additions to the allowance may be necessary.
Economic conditions and uncertainty in the financial markets could adversely affect our ability to accurately assess our allowance for credit losses. Our ability to assess the creditworthiness of our customers or to estimate the values of our assets and collateral for loans will be reduced if the models and approaches we use become less predictive of future behaviors, valuations, assumptions or estimates. We estimate losses inherent in our credit exposure, the adequacy of our allowance for loan losses and the values of certain assets by using estimates based on difficult, subjective, and complex judgments, including estimates as to the effects of economic conditions and how these economic conditions might affect the ability of our borrowers to repay their loans or the value of assets.
Changes in accounting standards could impact reported earnings.
From time to time there are changes in the financial accounting and reporting standards that govern the preparation of our financial statements. These changes can materially impact how we record and report our financial condition and results of operations. In some instances, we could be required to apply a new or revised standard retroactively, resulting in the restatement of prior period financial statements. Changes currently proposed or expected to be proposed or adopted include requirements that the Company: (i) calculate the allowance for loan losses on the basis of the current expected credit losses over the lifetime of its loans, which is expected to be applicable beginning in 2019, and may result in increases in the Company's allowance for loan losses and future provisions for loan losses; and (ii) record the value of and liabilities relating to operating leases on the Bank's balance sheet. These changes could adversely
24
affect the Company's and Bank's capital, regulatory capital ratios, ability to make larger loans, earnings and performance metrics.
Our continued growth depends on our ability to meet minimum regulatory capital levels. Growth and shareholder returns may be adversely affected if sources of capital are not available to help us meet them.
As we grow, we will have to maintain our regulatory capital levels at or above the required minimum levels, including the new capital requirements under the Basel III Rule that became applicable to the Company on January 1, 2015. If earnings do not meet our current estimates, if we incur unanticipated losses or expenses, or if we grow faster than expected, we may need to obtain additional capital sooner than expected or we may be required to reduce our level of assets or reduce our rate of growth in order to maintain regulatory compliance. Under those circumstances net income and the rate of growth of net income may be adversely affected. Additional issuances of equity securities could have a dilutive effect on existing shareholders. The significant level of real estate acquisition, development and construction loans in our portfolio, and new loans sought by customers, which may be required to be categorized as HVCRE loans under the Basel III Rule, could require us to maintain additional capital for these loans as a result of the higher risk weighting attributed to such loans.
Our results of operations, financial condition and the value of our shares may be adversely affected if we are not able to maintain our historical growth rate.
Since opening for business in 1998, our asset level and net income available to common shareholders have increased rapidly. We may not be able to achieve comparable results in future years. As our asset size and earnings increase, it may become more difficult to achieve high rates of increase in assets and earnings. Additionally, it may become more difficult to achieve continued improvements in our expense levels and efficiency ratio. We may not be able to maintain the relatively low levels of nonperforming assets that we have experienced to date. Declines in the rate of growth of income or assets or deposits, and increases in operating expenses or nonperforming assets may have an adverse impact on the value of the common stock.
We are subject to liquidity risk in our operations.
Liquidity risk is the possibility of being unable to meet obligations as they come due, pay deposits when withdrawn, and fund loan and investment opportunities as they arise because of an inability to liquidate assets or obtain adequate funding on a timely basis, at a reasonable cost and within acceptable risk tolerances. If a financial institution is unable to meet its payment obligations on a daily basis, it is subject to being placed into receivership, regardless of its capital levels. Our largest source of liquidity is customer deposit accounts, including noninterest bearing demand deposit accounts, which constituted 27% of our total deposits at December 31, 2015. If we are unable to increase customer deposits in an amount sufficient to fund loan growth, we may be required to rely on other, potentially more expensive, sources of liquidity, such as FHLB borrowings, brokered deposits and repurchase agreements, to fund loan growth, which could adversely affect our earnings, or reduce our rate of growth, which could adversely effect our earnings and stock price.
We also have a significant amount of deposits, which are in excess of the maximum FDIC insurance coverage limits. At any time, customers who have uninsured deposits may decide to move their deposits to institutions which are perceived as safer, sounder, or "too big to fail" or could elect to use other non-deposit funding products, such as repurchase agreements, that would require the Bank to pay higher interest and to provide securities as collateral for the Bank's repurchase obligation. At December 31, 2015, the Bank had approximately $2.07 billion of deposits that would be uninsured deposits, or 40% of our total deposits.
25
While we believe that our strong earnings, capital position, relationship banking model and reputation as a safe and sound institution mitigate the risk of losing deposits, there can be no assurance that we will not have to replace a significant amount of deposits with alternative funding sources, such as repurchase agreements, federal funds lines, certificates of deposit, brokered deposits, other categories of interest bearing deposits and FHLB borrowings, all of which are more expensive than noninterest bearing deposits, and can be more expensive than other categories of deposits. While we believe that we would be able to maintain adequate liquidity at reasonable cost, the loss of a significant amount of deposits, particularly noninterest bearing deposits, could have a material adverse effect on our earnings, net interest margin, rate of growth and stock price.
We may face risks with respect to future expansion or acquisition activity.
We selectively seek to expand our banking operations through limited de novo branching or opportunistic acquisition activities. We cannot be certain that any expansion activity, through de novo branching, acquisition of branches of another financial institution or a whole institution, or the establishment or acquisition of nonbanking financial service companies, will prove profitable or will increase shareholder value. The success of any acquisition will depend, in part, on our ability to realize the estimated cost savings and revenue enhancements from combining the businesses of the Company and the target company. Our ability to realize increases in revenue will depend, in part, on our ability to retain customers and employees, and to capitalize on existing relationships for the provision of additional products and services. If our estimates turn out to be incorrect or we are not able to successfully combine companies, the anticipated cost savings and increased revenues may not be realized fully or at all, or may take longer to realize than expected. It is possible that the integration process could result in the loss of key employees, the disruption of each company's ongoing business or inconsistencies in standards, controls, procedures and policies that adversely affect our ability to maintain relationships with clients and employees or to achieve the anticipated benefits of the merger. As with any combination of banking institutions, there also may be disruptions that cause us to lose customers or cause customers to withdraw their deposits from our bank. Customers may not readily accept changes to their banking arrangements that we make as part of or following an acquisition. Additionally, the value of an acquisition to the Company is dependent on our ability to successfully identify and estimate the magnitude of any asset quality issues of acquired companies.
Our concentrations of loans may create a greater risk of loan defaults and losses.
A substantial portion of our loans are secured by real estate in the Washington, D.C. metropolitan area and substantially all of our loans are to borrowers in that area. We also have a significant amount of real estate construction loans and land related loans for residential and commercial developments. At December 31, 2015, 79% of our loans were secured by real estate, primarily commercial real estate. Management believes that the commercial real estate concentration risk is mitigated by diversification among the types and characteristics of real estate collateral properties, sound underwriting practices, and ongoing portfolio monitoring and market analysis. Of these loans, $900.9 million, or 18% of portfolio loans, were construction and land development loans. An additional $1.05 billion, or 21% of portfolio loans, were commercial and industrial loans, which are generally not secured by real estate. The repayment of these loans often depends on the successful operation of a business or the sale or development of the underlying property and, as a result, is more likely to be adversely affected by adverse conditions in the real estate market or the economy in general. While we believe that our loan portfolio is well diversified in terms of borrowers and industries, these concentrations expose us to the risk that adverse developments in the real estate market, or in the general economic conditions in the Washington, D.C. metropolitan area, could increase the levels of nonperforming loans and charge-offs, and reduce loan demand. In that event, we would likely experience lower earnings or losses. Additionally, if, for any reason, economic conditions in our market area deteriorate, or there is significant volatility or weakness in the economy or any significant sector of the area's economy, our ability to develop our business relationships may be diminished, the
26
quality and collectability of our loans may be adversely affected, the value of collateral may decline and loan demand may be reduced.
Commercial, commercial real estate and construction loans tend to have larger balances than single family mortgages loans and other consumer loans. Because the loan portfolio contains a significant number of commercial and commercial real estate and construction loans with relatively large balances, the deterioration of one or a few of these loans may cause a significant increase in nonperforming assets. An increase in nonperforming loans could result in: a loss of earnings from these loans, an increase in the provision for loan losses, or an increase in loan charge-offs, which could have an adverse impact on our results of operations and financial condition.
Additionally, through ECV, we provide subordinated financing for the acquisition, development and construction of real estate projects, the primary financing for which may be provided by the Bank. These subordinated financings and the business of ECV will generally entail a higher risk profile (including lower lien priority and higher loan to value ratios) than loans made by the Bank. A portion of the amount, which the Company expects to receive for such loans, may be payments based on the success, sale or completion of the underlying project, and as such the income of the Company may be more volatile from period to period, based on the status of such projects.
Our concentrations of loans may require us to maintain higher levels of capital.
Under guidance adopted by the federal banking agencies, banks which have concentrations in construction, land development or commercial real estate loans (other than loans for majority owner occupied properties) would be expected to maintain higher levels of risk management and, potentially, higher levels of capital. Although not currently anticipated, we may be required to maintain higher levels of capital than we would otherwise be expected to maintain as a result of our levels of construction, development and commercial real estate loans, which may require us to obtain additional capital sooner than we would otherwise seek it, which may reduce shareholder returns.
Our Residential Lending department may not continue to provide us with significant noninterest income.
In 2015, the Bank originated $911 million and sold $907 million of residential mortgage loans to investors, as compared to $572 million originated and $570 million sold to investors in 2014. The residential mortgage business is highly competitive, and highly susceptible to changes in market interest rates, consumer confidence levels, employment statistics, the capacity and willingness of secondary market purchasers to acquire and hold or securitize loans, and other factors beyond our control. Additionally, in many respects, the mortgage origination business is relationship based, and dependent on the services of individual mortgage loan officers. The loss of services of one or more loan officers could have the effect of reducing the level of our mortgage production, or the rate of growth of production. As a result of these factors we cannot be certain that we will be able to continue to maintain or increase the volume or percentage of revenue or net income produced by the residential mortgage business.
Our financial condition, earnings and asset quality could be adversely affected if we are required to repurchase loans originated for sale by our Residential Lending department.
The Bank originates residential mortgage loans for sale to secondary market investors, subject to contractually specified and limited recourse provisions. Because the loans are intended to be originated within investor guidelines, using designated automated underwriting and product specific requirements as part of the loan application, the loans sold have a limited recourse provision. In general, the Bank may be required to repurchase a previously sold mortgage loan or indemnify the investor if there is non-compliance with defined loan origination or documentation standards including fraud, negligence, material misstatement in the loan documents or non-compliance with applicable law. In addition, the Bank
27
may have an obligation to repurchase a loan if the mortgagor has defaulted early in the loan term. The potential mortgagor early default repurchase period is up to approximately twelve months after sale of the loan to the investor. The recourse period for fraud, material misstatement, breach of representations and warranties, non-compliance with law, or similar matters could be as long as the term of the loan. Mortgages subject to recourse are collateralized by single family residential properties, have loan-to-value ratios of 80% or less, or have private mortgage insurance. Our experience to date has been minimal in the case of loan repurchases due to default, fraud, breach of representations, material misstatement, or legal non-compliance. Should repurchases become a material issue, our earnings and asset quality could be adversely impacted, which could adversely impact our share price.
Our financial condition, earnings and asset quality could be adversely affected if our consumer facing operations do not operate in compliance with applicable regulations.
While all aspects of our operations are subject to detailed and complex compliance regimes, those portions of our lending operations which most directly deal with consumers pose particular challenges given the emphasis on consumer compliance by bank regulators at all levels. While we are not aware of any material issues of non-compliance, residential mortgage lending raises significant compliance risks resulting from the detailed and complex nature of mortgage lending regulations imposed by federal regulatory agencies, and the relatively independent operating environment in which mortgage lending officers operate. As a result, despite the education, compliance training, supervision and oversight we exercise in these areas, individual loan officers intentionally trying to conceal improper activities could result in the Bank being strictly liable for restitution or damages to individual borrowers, and to regulatory enforcement activity.
Changes in interest rates and other factors beyond our control could have an adverse impact on our financial performance and results.
Our operating income and net income depend to a great extent on our net interest margin, i.e., the difference between the interest yields we receive on loans, securities and other interest bearing assets and the interest rates we pay on interest bearing deposits and other liabilities. Net interest margin is affected by changes in market interest rates, because different types of assets and liabilities may react differently, and at different times, to market interest rate changes. When interest bearing liabilities mature or re-price more quickly than interest earning assets in a period, an increase in market rates of interest could reduce net interest income. Similarly, when interest earning assets mature or re-price more quickly than interest bearing liabilities, falling interest rates could reduce net interest income. These rates are highly sensitive to many factors beyond our control, including competition, general economic conditions and monetary and fiscal policies of various governmental and regulatory authorities, including the Federal Reserve Board.
We attempt to manage our risk from changes in market interest rates by adjusting the rates, maturity, re-pricing, and balances of the different types of interest earning assets and interest bearing liabilities, but interest rate risk management techniques are not exact. As a result, a rapid increase or decrease in interest rates could have an adverse effect on our net interest margin and results of operations. At December 31, 2015, our cumulative net asset sensitive twelve month gap position was +14% of total assets, which includes variable and adjustable rate loans currently at their floor rates. As such, we expect modest decreases of approximately minus 0.3% and minus 1.9%, respectively, in projected net interest income and net income over a twelve month period resulting from a 100 basis point increase in rates, as loans currently at floor rates which are above the calculated contractual rate do not adjust upon a rate increase, and our residential mortgage origination and sale volume could decline as interest rates increase. The results of our interest rate sensitivity simulation model depend upon a number of assumptions, which may not prove to be accurate. There can be no assurance that we will be able to successfully manage our interest rate risk.
Adverse changes in the real estate market in our market area could also have an adverse effect on our cost of funds and net interest margin, as we have a large amount of noninterest bearing deposits related to
28
real estate sales and development. While we expect that we would be able to replace the liquidity provided by these deposits, the replacement funds would likely be more costly, negatively impacting earnings.
We may not be able to successfully compete with others for business.
The Washington, D.C. metropolitan area in which we operate is considered highly attractive from an economic and demographic viewpoint, and is a highly competitive banking market. We compete for loans, deposits, and investment dollars with numerous regional and national banks, online divisions of out-of-market banks, and other community banking institutions, as well as other kinds of financial institutions and enterprises, such as securities firms, insurance companies, savings associations, credit unions, mortgage brokers, and private lenders. Many competitors have substantially greater resources than us, and some operate under less stringent regulatory environments. The differences in resources and regulations may make it harder for us to compete profitably, reduce the rates that we can earn on loans and investments, increase the rates we must offer on deposits and other funds, and adversely affect our overall financial condition and earnings.
The Bank has been very successful in developing new customer relationships. These new relationships have resulted in significant increases in both loans and deposits, and have contributed to increased earnings. Going forward, should competitive pressures increase, we are subject to the risk that we may not be able to retain the loans and deposits produced by these new relationships. While we believe that our relationship banking model will enable us to keep a significant percentage of these new relationships, there can be no assurance that we will be able to do so, that we would be able to maintain favorable pricing, margins and asset quality, or that we will be able to grow at the same rate we did when alternative financing was not widely available.
Government regulation will significantly affect the Bank's business, and may result in higher costs and lower shareholder returns.
The banking industry is heavily regulated. Banking regulations are primarily intended to protect the federal deposit insurance fund and depositors, not shareholders. The Company and Bank are regulated and supervised by the Maryland Department of Financial Regulation, the Federal Reserve Board and the FDIC. The Bank is also subject to regulations promulgated by the CFPB. The burden imposed by federal and state regulations puts banks at a competitive disadvantage compared to less regulated competitors. Changes in the laws, regulations and regulatory practices affecting the banking industry may increase our costs of doing business or otherwise adversely affect us and create competitive advantages for others. Regulations affecting banks and financial services companies undergo continuous change, and we cannot predict the ultimate effect of these changes, which could have a material adverse effect on our profitability or financial condition. Federal economic and monetary policy may also affect our ability to attract deposits and other funding sources, make loans and investments, and achieve satisfactory interest spreads.
New or changed legislation or regulation and regulatory initiatives could subject us to increased regulation, increase our costs of doing business and adversely affect us.
Changes in federal and state legislation and regulation may affect our operations. New and modified regulation, such as the Dodd-Frank Act and Basel III, may have unforeseen or unintended consequences on our industry. The Dodd-Frank Act implemented, and is expected to further implement, significant changes to the U.S. financial system, including new regulatory agencies (such as the FSOC to oversee systemic risk and the CFPB to develop and enforce rules for consumer financial products), changes in retail banking regulations, and changes to deposit insurance assessments. Additionally, the Basel III Rule has revised risk-based and leverage capital requirements and also limits capital distributions and certain discretionary bonuses if a banking organization does not hold a "capital conservation buffer." This additional regulation increases our compliance costs and may otherwise adversely affects our operations. The potential also exists for additional federal or state laws or regulations, or changes in policy or
29
interpretations, affecting many of our operations, including capital levels, lending and funding practices, insurance assessments, and liquidity standards. The effect of any such changes and their interpretation and application by regulatory authorities cannot be predicted, may increase the Company's cost of doing business and otherwise affect our operations, may significantly affect the markets in which the Company does business, and could have a material adverse effect on the Company.
In addition, government responses to the condition of the global financial markets and the banking industry has, among other things, increased our costs and may further increase our costs for items such as federal deposit insurance. The FDIC insures deposits at FDIC-insured institutions, such as the Bank, up to applicable limits. The FDIC charges the insured financial institutions premiums to maintain the Deposit Insurance Fund at a certain level. Increases in deposit insurance premiums to increase the coverage ratio to required levels, to meet revised rules to measure risk or to pay depositors of additional failed institutions could adversely affect the Company's net income.
While the full impact of the Dodd-Frank Act and the CFPB rulemakings cannot be assessed until all implementing regulations are released, become effective and are interpreted by regulators and the courts, the Dodd-Frank Act's extensive requirements have had to date a significant effect on the financial markets, and may affect the availability or terms of financing from our lender counterparties and the availability or terms of mortgage-backed securities, both of which may have an adverse effect on our financial condition and results of operations. The CFPB's continued rule making is likely to result in increased compliance costs and fees, along with possible restrictions on our operations, any of which may have a material adverse effect on our operating results and financial condition.
Our customers and businesses in the Washington, D.C. metropolitan area in general, may be adversely impacted as a result of changes in government spending.
The Washington, D.C. metropolitan area is characterized by a significant number of businesses that are federal government contractors or subcontractors, or which depend on such businesses for a significant portion of their revenues. While the Company does not have a significant level of loans to federal government contractors or their subcontractors, the impact of a decline in federal government spending, a reallocation of government spending to different industries or different areas of the country, or a delay in payments to such contractors, could have a ripple effect. Temporary layoffs, salary reductions or furloughs of government employees or government contractors could have adverse impacts on other businesses in the Company's market and the general economy of the greater Washington, D.C. metropolitan area, and may indirectly lead to a loss of revenues by the Company's customers, including vendors and lessors to the federal government and government contractors or to their employees, as well as a wide variety of commercial and retail businesses. Accordingly, such potential federal government activities could lead to increases in past due loans, nonperforming loans, loan loss reserves, and charge-offs, and a decline in liquidity.
We rely upon independent appraisals to determine the value of the real estate, which secures a significant portion of our loans, and the values indicated by such appraisals may not be realizable if we are forced to foreclose upon such loans.
A significant portion of our loan portfolio consists of loans secured by real estate. We rely upon independent appraisers to estimate the value of such real estate. Appraisals are only estimates of value and the independent appraisers may make mistakes of fact or judgment, which adversely affect the reliability of their appraisals. In addition, events occurring after the initial appraisal may cause the value of the real estate to increase or decrease. As a result of any of these factors, the real estate securing some of our loans may be more or less valuable than anticipated at the time the loans were made. If a default occurs on a loan secured by real estate that is less valuable than originally estimated, we may not be able to recover the outstanding balance of the loan and will suffer a loss.
30
We are exposed to risk of environmental liabilities with respect to properties to which we take title.
In the course of our business we lend against, and may foreclose and take title to, real estate, potentially becoming subject to environmental liabilities associated with the properties. We may be held liable to a governmental entity or to third parties for property damage, personal injury, investigation and cleanup costs or we may be required to investigate or clean up hazardous or toxic substances or chemical releases at a property. Costs associated with investigation or remediation activities can be substantial. If the Bank is the lender to, or owner or former owner of, a contaminated site, it may be subject to common law claims by third parties based on damages and costs resulting from environmental contamination emanating from the property. These costs and claims could adversely affect our business.
Our operations rely on certain external vendors.
Our business is dependent on the use of outside service providers that support our day-to-day operations including data processing and electronic communications. Our operations are exposed to risk that a service provider may not perform in accordance with established performance standards required in our agreements for any number of reasons including equipment or network failure, a change in their senior management, their financial condition, their product line or mix and how they support existing customers, or a simple change in their strategic focus. While we have comprehensive policies and procedures in place to mitigate risk at all phases of service provider management from selection, to performance monitoring and renewals, the failure of a service provider to perform in accordance with contractual agreements could be disruptive to our business, which could have a material adverse effect on our financial conditions and results of our operations.
A breach of information security or cyber-related threats could negatively affect our earnings.
Increasingly, we depend upon data processing, communication and information exchange on a variety of computing platforms and networks, and over the Internet from internal sources and external, third party vendors. While to date we have not suffered significant financial losses due to cyber-attacks or other cyber incidents, we cannot guarantee all our systems are free from vulnerability to attack, despite safeguards we and our vendors have instituted. In addition, disruptions to our vendors' systems may arise from events that are wholly or partially beyond our and our vendors' control (including, for example, computer viruses or electrical or telecommunications outages). If information security is breached, despite the controls we and our third-party vendors have instituted, information can be lost or misappropriated, resulting in financial losses or costs to us or damages to others. These costs or losses could materially exceed the amount of insurance coverage, if any, which would adversely affect our earnings. In addition, our reputation could be damaged which could result in loss of customers, greater difficulty in attracting new customers, or an adverse effect on the value of our common stock.
ITEM 1B. UNRESOLVED STAFF COMMENTS
None
31
All properties out of which the Company operates are leased properties. As of December 31, 2015, the Company and its subsidiaries operated out of 35 leased facilities; 21 of which are leased for branch offices in the Washington, D.C. metropolitan area: seven in Montgomery County, Maryland; nine located in Northern Virginia; and five in the District of Columbia.
| Maryland Branch Locations: | ||
Bethesda 7815 Woodmont Avenue Bethesda, Maryland 20814 Chevy Chase 15 Wisconsin Circle Chevy Chase, Maryland 20815 Park Potomac 12505 Park Potomac Avenue Potomac, Maryland 20854 Rockville 110 North Washington Street Rockville, Maryland 20850 Rollins Avenue 130 Rollins Avenue Rockville, Maryland 20852 Shady Grove 9600 Blackwell Road Rockville, Maryland 20850 Silver Spring 8665-B Georgia Avenue Silver Spring, Maryland 20910 Virginia Branch Locations: Ballston 4420 N. Fairfax Drive Arlington, Virginia 22203 Chantilly 13986 Metrotech Drive Chantilly, Virginia 20151 Dulles Town Center 45745 Nokes Boulevard Sterling, Virginia 20166 Fairfax 11166 Fairfax Boulevard Fairfax, Virginia 22030 |
Merrifield 2905 District Avenue Fairfax, Virginia 22201 Old Town Alexandria 277 S. Washington Street Alexandria, Virginia 22314 Reston 12011 Sunset Hills Road Reston, Virginia 20190 Rosslyn 1919 N. Lynn Street Arlington, Virginia 22209 Tysons Corner 8245 Boone Boulevard Tysons Corner, Virginia 22182 Washington, D.C. Branch Locations: Dupont Circle 1228 Connecticut Avenue, NW Washington, D.C. 20036 Gallery Place 700 7th Street, NW Washington, D.C. 20001 Georgetown 1044 Wisconsin Avenue, NW Washington, D.C. 20007 (Expected Summer 2016 relocation to 3143 N Street, NW Washington, D.C. 20007) K Street 2001 K Street, NW, Suite 150 Washington, D.C. 20006 McPherson Square 1425 K Street, NW Washington, D.C. 20005 |
32
| Corporate Offices and Commercial Lending Centers: Executive Offices and Commercial Lending Center 7830 Old Georgetown Road Bethesda, Maryland 20814 Tysons Corner Corporate Offices Commercial Lending Center 8245 Boone Boulevard, Suite 820 Tysons Corner, Virginia 22182 K Street Corporate / Commercial Lending Center Commercial Deposit Operations Center 2001 K Street, NW, Suite 150 Washington, D.C. 20006 Residential Real Estate Lending: Park Potomac Office Residential Lending Center 12505 Park Potomac Avenue, 5th Floor Potomac, Maryland 20854 (Expected June 2016 relocation to 6010 Executive Boulevard, Suite 300 Rockville, MD 20852) Reston Office Residential Lending Center 12011 Sunset Hills Drive Reston, Virginia 20190 Tysons Corner Office Residential Lending Center 8245 Boone Boulevard, Suite 820 Tysons Corner, Virginia 22182 Other Properties: Operations Center 11961 and 11931 Tech Road Silver Spring, Maryland 20904 |
From time to time the Company and its subsidiaries are participants in various legal proceedings incidental to their business. In the opinion of management, the liabilities (if any) resulting from such legal proceedings will not have a material effect on the financial position of the Company.
ITEM 4. MINE SAFETY DISCLOSURES
Not applicable.
33
ITEM 5. MARKET FOR REGISTRANT'S COMMON EQUITY, RELATED STOCKHOLDER MATTERS AND ISSUER PURCHASES OF COMMON EQUITY
Market for Common Stock. The Company's common stock is listed for trading on the NASDAQ Capital Market under the symbol "EGBN." Over the twelve month period ended December 31, 2015, the average daily trading volume amounted to approximately 128,583 shares, an increase from approximately 82,382 shares over the twelve month period ended December 31, 2014. No assurance can be given that a more active trading market will develop or can be maintained. The following table sets forth the high and low sale prices for the common stock during each calendar quarter during the last two fiscal years. No cash dividends for common shareholders were declared during such periods. As of February 24, 2016, there were 33,551,237 shares of common stock outstanding, held by approximately 944 shareholders of record. Based on the most recent mailings, the Company believes beneficial shareholders number approximately 13,743.
| |
2015 | 2014 | |||||||||||
|---|---|---|---|---|---|---|---|---|---|---|---|---|---|
Quarter
|
High | Low | High | Low | |||||||||
First |
$ | 38.98 | $ | 31.78 | $ | 37.00 | $ | 29.24 | |||||
Second |
$ | 45.46 | $ | 35.51 | $ | 36.99 | $ | 30.22 | |||||
Third |
$ | 47.03 | $ | 39.28 | $ | 35.48 | $ | 31.61 | |||||
Fourth |
$ | 55.56 | $ | 43.97 | $ | 36.70 | $ | 30.94 | |||||
Dividends. The Company does not currently pay a cash dividend on its common stock.
The payment of a cash dividend on common stock will depend largely upon the ability of the Bank, the Company's principal operating business, to declare and pay dividends to the Company. Payment of dividends on the common stock will also depend upon the Bank's earnings, financial condition, and need for funds, as well as governmental policies and regulations applicable to the Company and the Bank.
Regulations of the Federal Reserve Board and Maryland law place limits on the amount of dividends the Bank may pay to the Company without prior approval. Prior regulatory approval is required to pay dividends which exceed the Bank's net profits for the current year plus its retained net profits for the preceding two calendar years, less required transfers to surplus. Under Maryland law, dividends may only be paid out of retained earnings. State and federal bank regulatory agencies also have authority to prohibit a bank from paying dividends if such payment is deemed to be an unsafe or unsound practice, and the Federal Reserve Board has the same authority over bank holding companies. At December 31, 2015 the Bank could pay dividends to the Company to the extent of its earnings so long as it maintained required capital ratios.
The Federal Reserve Board has established requirements with respect to the maintenance of appropriate levels of capital by registered bank holding companies. Compliance with such standards, as presently in effect, or as they may be amended from time to time, could possibly limit the amount of dividends that the Company may pay in the future. In 1985, the Federal Reserve Board issued a policy statement on the payment of cash dividends by bank holding companies. In the statement, the Federal Reserve Board expressed its view that a holding company experiencing earnings weaknesses should not pay cash dividends exceeding its net income, or which could only be funded in ways that weaken the holding company's financial health, such as by borrowing. As a depository institution, the deposits of which are insured by the FDIC, the Bank may not pay dividends or distribute any of its capital assets while it remains in default on any assessment due the FDIC. The Bank currently is not in default under any of its obligations to the FDIC.
Issuer Repurchase of Common Stock. No shares of the Company's common stock were repurchased by or on behalf of the Company during 2015 or 2014.
34
See Item 12—Security Ownership of Certain Beneficial Owners and Management and Related Stockholder Matters for "Securities Authorized for Issuance Under Equity Compensation Plans."
Stock Price Performance. The following table compares the cumulative total return on a hypothetical investment of $100 in the Company's common stock on December 31, 2010 through December 31, 2015, with the hypothetical cumulative total return on the NASDAQ Stock Market Index (U.S. Companies) and the NASDAQ Bank Index for the comparable period, including reinvestment of dividends.
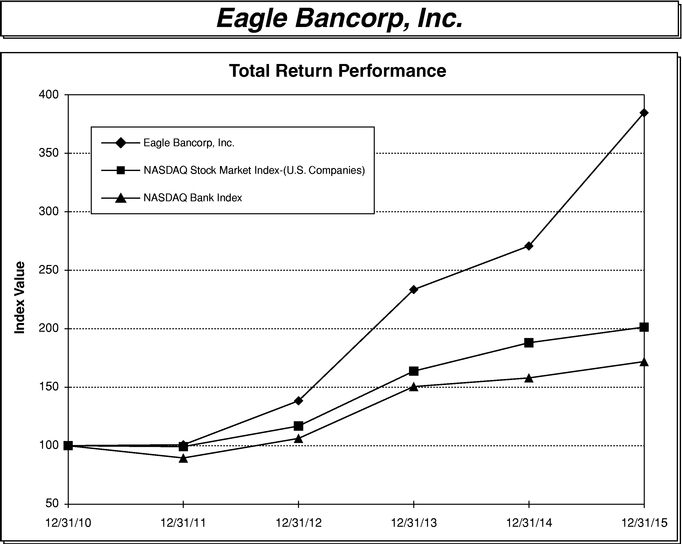
| |
Period Ending | ||||||||||||||||||
|---|---|---|---|---|---|---|---|---|---|---|---|---|---|---|---|---|---|---|---|
Index
|
12/31/10 | 12/31/11 | 12/31/12 | 12/31/13 | 12/31/14 | 12/31/15 | |||||||||||||
Eagle Bancorp, Inc. |
100.00 | 100.76 | 138.39 | 233.49 | 270.77 | 384.73 | |||||||||||||
NASDAQ Stock Market Index-(U.S. Companies) |
100.00 | 99.21 | 116.82 | 163.75 | 188.03 | 201.40 | |||||||||||||
NASDAQ Bank Index |
100.00 | 89.50 | 106.23 | 150.55 | 157.95 | 171.92 | |||||||||||||
35
ITEM 6. SELECTED FINANCIAL DATA
The following table shows selected historical consolidated financial data for the Company. It should be read in conjunction with Management's Discussion and Analysis of Financial Condition and Results of Operations at page 39 and the Consolidated Financial Statements and Notes thereto included elsewhere in this report.
Use of Non-GAAP Financial Measures
The information set forth below contains certain financial information determined by methods other than in accordance with GAAP. These non-GAAP financial measures are "tangible common equity," "tangible book value per common share," "efficiency ratio (adjusted for merger expenses)," and "return on average common equity." Management uses these non-GAAP measures in its analysis of our performance because it believes these measures are material and will be used as a measure of our performance by investors.
These disclosures should not be considered in isolation or as a substitute for results determined in accordance with GAAP, and are not necessarily comparable to non-GAAP performance measures which may be presented by other bank holding companies. Management compensates for these limitations by providing detailed reconciliations between GAAP information and the non-GAAP financial measures. A reconciliation table is set forth below following the selected historical consolidated financial data.
| |
Years Ended December 31, | |||||||||||||||
|---|---|---|---|---|---|---|---|---|---|---|---|---|---|---|---|---|
| (dollars in thousands except per share data) |
2015 | 2014 | 2013 | 2012 | 2011 | |||||||||||
Balance Sheets—Period End |
||||||||||||||||
Securities |
$ | 504,772 | $ | 404,903 | $ | 389,405 | $ | 310,514 | $ | 324,053 | ||||||
Loans held for sale |
47,492 | 44,317 | 42,030 | 226,923 | 176,826 | |||||||||||
Loans |
4,998,368 | 4,312,399 | 2,945,158 | 2,493,095 | 2,056,256 | |||||||||||
Allowance for credit losses |
52,687 | 46,075 | 40,921 | 37,492 | 29,653 | |||||||||||
Intangible assets, net |
108,542 | 109,908 | 3,510 | 3,785 | 4,145 | |||||||||||
Total assets |
6,076,649 | 5,247,880 | 3,771,503 | 3,409,441 | 2,831,255 | |||||||||||
Deposits |
5,158,444 | 4,310,768 | 3,225,414 | 2,897,222 | 2,392,095 | |||||||||||
Borrowings |
142,356 | 280,420 | 119,771 | 140,638 | 152,662 | |||||||||||
Total liabilities |
5,338,048 | 4,627,121 | 3,377,640 | 3,059,465 | 2,564,544 | |||||||||||
Preferred shareholders' equity |
— | 71,900 | 56,600 | 56,600 | 56,600 | |||||||||||
Common shareholders' equity |
738,601 | 548,859 | 337,263 | 293,376 | 210,111 | |||||||||||
Total shareholders' equity |
738,601 | 620,759 | 393,863 | 349,976 | 266,711 | |||||||||||
Tangible common equity(1) |
630,059 | 438,951 | 333,753 | 289,591 | 205,966 | |||||||||||
Statements of Operations |
||||||||||||||||
Interest income |
$ | 253,180 | $ | 191,573 | $ | 157,294 | $ | 141,943 | $ | 119,124 | ||||||
Interest expense |
19,238 | 13,095 | 12,504 | 14,414 | 20,077 | |||||||||||
Provision for credit losses |
14,638 | 10,879 | 9,602 | 16,190 | 10,983 | |||||||||||
Noninterest income |
26,628 | 18,345 | 24,716 | 21,364 | 13,501 | |||||||||||
Noninterest expense(2) |
110,716 | 99,728 | 84,579 | 76,531 | 63,276 | |||||||||||
Income before taxes |
135,216 | 86,216 | 75,325 | 56,172 | 38,289 | |||||||||||
Income tax expense |
51,049 | 31,958 | 28,318 | 20,883 | 13,731 | |||||||||||
Net income(2) |
84,167 | 54,258 | 47,007 | 35,289 | 24,558 | |||||||||||
Preferred dividends |
601 | 614 | 566 | 566 | 1,511 | |||||||||||
Net income available to common shareholders(2) |
83,566 | 53,644 | 46,441 | 34,723 | 23,047 | |||||||||||
36
| |
Years Ended December 31, | |||||||||||||||
|---|---|---|---|---|---|---|---|---|---|---|---|---|---|---|---|---|
| (dollars in thousands except per share data) |
2015 | 2014 | 2013 | 2012 | 2011 | |||||||||||
Per Common Share Data(3) |
||||||||||||||||
Net income, basic(2) |
$ | 2.54 | $ | 2.01 | $ | 1.81 | $ | 1.50 | $ | 1.05 | ||||||
Net income, diluted(2) |
2.50 | 1.95 | 1.76 | 1.46 | 1.04 | |||||||||||
Book value |
22.07 | 18.21 | 13.03 | 11.62 | 9.57 | |||||||||||
Tangible book value(4) |
18.83 | 14.56 | 12.89 | 11.47 | 9.38 | |||||||||||
Common shares outstanding |
33,467,893 | 30,139,396 | 25,885,863 | 25,250,378 | 21,948,128 | |||||||||||
Weighted average common shares outstanding, basic |
32,836,449 | 26,683,759 | 25,726,062 | 23,135,886 | 21,819,087 | |||||||||||
Weighted average common shares outstanding, diluted |
33,479,592 | 27,550,978 | 26,358,611 | 23,743,815 | 22,316,593 | |||||||||||
Ratios |
||||||||||||||||
Net interest margin |
4.33 | % | 4.44 | % | 4.30 | % | 4.32 | % | 3.99 | % | ||||||
Efficiency ratio(2)(5) |
42.49 | % | 50.67 | % | 49.90 | % | 51.40 | % | 56.22 | % | ||||||
Return on average assets(2) |
1.49 | % | 1.31 | % | 1.37 | % | 1.18 | % | 0.97 | % | ||||||
Return on average common equity(2) |
12.32 | % | 13.50 | % | 14.60 | % | 14.14 | % | 11.71 | % | ||||||
CET1 capital (to risk weighted assets)(6) |
10.68 | % | — | — | — | — | ||||||||||
Total capital (to risk weighted assets) |
12.75 | % | 12.97 | % | 13.01 | % | 12.20 | % | 11.84 | % | ||||||
Tier 1 capital (to risk weighted assets) |
10.68 | % | 10.39 | % | 11.53 | % | 10.80 | % | 10.33 | % | ||||||
Tier 1 capital (to average assets) |
10.90 | % | 10.69 | % | 10.93 | % | 10.44 | % | 8.21 | % | ||||||
Tangible common equity ratio(1) |
10.56 | % | 8.54 | % | 8.86 | % | 8.50 | % | 7.29 | % | ||||||
Asset Quality |
||||||||||||||||
Nonperforming assets and loans 90+ past due |
$ | 19,091 | $ | 35,667 | $ | 33,927 | $ | 35,983 | $ | 36,019 | ||||||
Nonperforming assets and loans 90+ past due to total loans |
0.38 | % | 0.83 | % | 1.15 | % | 1.44 | % | 1.75 | % | ||||||
Nonperforming loans to total loans |
0.26 | % | 0.52 | % | 0.84 | % | 1.23 | % | 1.59 | % | ||||||
Allowance for credit losses to loans |
1.05 | % | 1.07 | % | 1.39 | % | 1.50 | % | 1.44 | % | ||||||
Allowance for credit losses to nonperforming loans |
397.95 | % | 205.30 | % | 165.66 | % | 122.19 | % | 90.42 | % | ||||||
Net charge-offs |
$ | 8,026 | $ | 5,724 | $ | 6,173 | $ | 8,351 | $ | 6,084 | ||||||
Net charge-offs to average loans |
0.17 | % | 0.17 | % | 0.23 | % | 0.37 | % | 0.32 | % | ||||||
- (1)
- Tangible
common equity, a non-GAAP financial measure, is defined as total common shareholders' equity reduced by goodwill and other intangible assets.
- (2)
- The
reported figure includes the effect of $4.7 million of merger related expenses ($3.5 million net of tax) for the year ended
December 31, 2014. As the magnitude of the merger expenses distorts the operational results of the Company, we present in the GAAP reconciliation below and in the Management's Discussion and
Analysis of Financial Condition and Results of Operations certain performance ratios excluding the effect of the merger expenses during the year ended December 31, 2014. We believe this
information is important to enable shareholders and other interested parties to assess the core operational performance of the Company.
- (3)
- Presented
giving retroactive effect to the 10% stock dividend paid on the common stock on June 14, 2013.
- (4)
- Tangible
book value per common share, a non-GAAP financial measure, is defined as tangible common shareholders' equity divided by total common shares
outstanding.
- (5)
- Computed
by dividing noninterest expense by the sum of net interest income and noninterest income.
- (6)
- Not applicable to fiscal years prior to 2015.
| |
Years Ended December 31, | |||||||||||||||
|---|---|---|---|---|---|---|---|---|---|---|---|---|---|---|---|---|
| Non-GAAP Reconciliation (Unaudited) (dollars in thousands except per share data) |
2015 | 2014 | 2013 | 2012 | 2011 | |||||||||||
Common shareholders' equity |
$ | 738,601 | $ | 548,859 | $ | 337,263 | $ | 293,376 | $ | 210,111 | ||||||
Less: Intangible assets |
(108,542 | ) | (109,908 | ) | (3,510 | ) | (3,785 | ) | (4,145 | ) | ||||||
| | | | | | | | | | | | | | | | | |
Tangible common equity |
$ | 630,059 | $ | 438,951 | $ | 333,753 | $ | 289,591 | $ | 205,966 | ||||||
| | | | | | | | | | | | | | | | | |
| | | | | | | | | | | | | | | | | |
| | | | | | | | | | | | | | | | | |
Book value per common share |
$ | 22.07 | $ | 18.21 | $ | 13.03 | $ | 11.62 | $ | 9.57 | ||||||
Less: Intangible book value per common share |
(3.24 | ) | (3.65 | ) | (0.14 | ) | (0.15 | ) | (0.19 | ) | ||||||
| | | | | | | | | | | | | | | | | |
Tangible book value per common share |
$ | 18.83 | $ | 14.56 | $ | 12.89 | $ | 11.47 | $ | 9.38 | ||||||
| | | | | | | | | | | | | | | | | |
| | | | | | | | | | | | | | | | | |
| | | | | | | | | | | | | | | | | |
37
| |
Year Ended December 31, | ||||||
|---|---|---|---|---|---|---|---|
| Non-GAAP Reconciliation (Unaudited) (dollars in thousands except per share data) |
2015 | 2014 | |||||
Common shareholders' equity |
$ | 738,601 | $ | 548,859 | |||
Less: Intangible assets |
(108,542 | ) | (109,908 | ) | |||
| | | | | | | | |
Tangible common equity |
$ | 630,059 | $ | 438,951 | |||
| | | | | | | | |
| | | | | | | | |
| | | | | | | | |
Book value per common share |
$ | 22.07 | $ | 18.21 | |||
Less: Intangible book value per common share |
(3.24 | ) | (3.65 | ) | |||
| | | | | | | | |
Tangible book value per common share |
$ | 18.83 | $ | 14.56 | |||
| | | | | | | | |
| | | | | | | | |
| | | | | | | | |
Total assets |
$ | 6,076,649 | $ | 5,247,880 | |||
Less: Intangible assets |
(108,542 | ) | (109,908 | ) | |||
| | | | | | | | |
Tangible assets |
$ | 5,968,107 | $ | 5,137,972 | |||
| | | | | | | | |
| | | | | | | | |
| | | | | | | | |
Tangible common equity ratio |
10.56 | % | 8.54 | % | |||
| | | | | | | | |
| | | | | | | | |
| | | | | | | | |
| Non-GAAP Reconciliation (Unaudited) (dollars in thousands except per share data) |
Year Ended December 31, 2014 |
|||
|---|---|---|---|---|
Net income |
$ | 54,258 | ||
Adjustments to net income |
||||
Merger-related expenses, net of tax |
3,472 | |||
| | | | | |
Operating net income |
$ | 57,730 | ||
| | | | | |
| | | | | |
| | | | | |
Net income available to common shareholders |
$ | 53,644 | ||
Adjustments to net income available to common shareholders |
||||
Merger-related expenses, net of tax |
3,472 | |||
| | | | | |
Operating earnings |
$ | 57,116 | ||
| | | | | |
| | | | | |
| | | | | |
Earnings per weighted average common share, basic |
$ | 2.01 | ||
Adjustments to earnings per weighted average common share, basic |
||||
Merger-related expenses, net of tax |
0.13 | |||
| | | | | |
Operating earnings per weighted average common share, basic |
$ | 2.14 | ||
| | | | | |
| | | | | |
| | | | | |
Earnings per weighted average common share, diluted |
$ | 1.95 | ||
Adjustments to earnings per weighted average common share, diluted |
||||
Merger-related expenses, net of tax |
0.13 | |||
| | | | | |
Operating earnings per weighted average common share, diluted |
$ | 2.08 | ||
| | | | | |
| | | | | |
| | | | | |
Summary Operating Results: |
||||
Noninterest expense |
$ | 99,728 | ||
Merger-related expenses |
4,699 | |||
| | | | | |
Adjusted noninterest expense |
$ | 95,029 | ||
| | | | | |
| | | | | |
| | | | | |
Adjusted efficiency ratio |
48.28 | % | ||
Adjusted noninterest expense as a % of average assets |
2.30 |
% |
||
Return on average assets |
||||
Net income |
$ | 54,258 | ||
Adjustments to net income |
||||
Merger-related expenses, net of tax |
3,472 | |||
| | | | | |
Operating net income |
$ | 57,730 | ||
| | | | | |
| | | | | |
| | | | | |
Adjusted return on average assets |
1.40 | % | ||
Return on average common equity |
||||
Net income available to common shareholders |
$ | 53,644 | ||
Adjustments to net income available to common shareholders |
||||
Merger-related expenses, net of tax |
3,472 | |||
| | | | | |
Operating earnings |
$ | 57,116 | ||
| | | | | |
| | | | | |
| | | | | |
Adjusted return on average common equity |
14.38 | % | ||
38
ITEM 7. MANAGEMENT'S DISCUSSION AND ANALYSIS OF FINANCIAL CONDITION AND RESULTS OF OPERATIONS
The following discussion provides information about the results of operations, financial condition, liquidity, and capital resources of the Company. The Company's primary subsidiary is the Bank, and the Company's other direct and indirect operating subsidiaries are Bethesda Leasing, LLC, Eagle Insurance Services, LLC, and ECV. This discussion and analysis should be read in conjunction with the audited Consolidated Financial Statements and Notes thereto, appearing elsewhere in this report.
Caution About Forward Looking Statements. This report contains forward looking statements within the meaning of Section 27A of the Securities Act of 1933, as amended (the "Securities Act"), and Section 21E of the Securities Exchange Act of 1934, as amended (the "Exchange Act"). These forward looking statements represent plans, estimates, objectives, goals, guidelines, expectations, intentions, projections and statements of our beliefs concerning future events, business plans, objectives, expected operating results and the assumptions upon which those statements are based. Forward looking statements include without limitation, any statement that may predict, forecast, indicate or imply future results, performance or achievements, and are typically identified with words such as "may," "could," "should," "will," "would," "believe," "anticipate," "estimate," "expect," "intend," "plan," or words or phases of similar meaning. These forward looking statements are based largely on our expectations and are subject to a number of known and unknown risks and uncertainties that are subject to change based on factors which are, in many instances, beyond our control. Actual results, performance or achievements could differ materially from those contemplated, expressed, or implied by the forward looking statements.
The following factors, among others, could cause our financial performance to differ materially from that expressed in such forward looking statements:
- •
- The strength of the United States economy, in general, and the strength of the local economies in which we conduct operations;
- •
- Geopolitical conditions, including acts or threats of terrorism, actions taken by the United States or other governments in response
to acts or threats of terrorism and/or military conflicts, which could impact business and economic conditions in the United States and abroad;
- •
- The effects of, and changes in, trade, monetary and fiscal policies and laws, including interest rate policies of the Federal Reserve
Board, inflation, interest rate, market and monetary fluctuations;
- •
- The timely development of competitive new products and services and the acceptance of these products and services by new and existing
customers;
- •
- Results of examinations of us by our regulators, including the possibility that our regulators may, among other things, require us to
increase our allowance for credit losses, to write-down assets or to hold more capital;
- •
- Changing bank regulatory conditions, policies or programs, whether arising as new legislation or regulatory initiatives, that could
lead to restrictions on activities of banks generally, or our subsidiary bank in particular, more restrictive regulatory capital requirements, increased costs, including deposit insurance premiums,
regulation or prohibition of certain income producing activities or changes in the secondary market for loans and other products;
- •
- The willingness of customers to substitute competitors' products and services for our products and services;
- •
- The impact of changes in financial services policies, laws and regulations, including laws, regulations and policies concerning taxes, banking, securities and insurance, and the application thereof by regulatory bodies;
39
- •
- The effect of changes in accounting policies and practices, as may be adopted from time-to-time by bank regulatory agencies, the
Securities and Exchange Commission, the Public Company Accounting Oversight Board or the Financial Accounting Standards Board;
- •
- Technological and social media changes;
- •
- Cybersecurity breaches and threats that cause the Bank to sustain financial losses;
- •
- The effect of acquisitions we may make, including, without limitation, the failure to achieve the expected revenue growth and/or
expense savings from such acquisitions;
- •
- The growth and profitability of noninterest or fee income being less than expected;
- •
- Changes in the level of our nonperforming assets and charge-offs;
- •
- Changes in consumer spending and savings habits;
- •
- Unanticipated regulatory or judicial proceedings; and
- •
- The factors discussed under the caption "Risk Factors" in this report.
If one or more of the factors affecting our forward looking information and statements proves incorrect, then our actual results, performance or achievements could differ materially from those expressed in, or implied by, forward looking information and statements contained in this report. You should not place undue reliance on our forward looking information and statements. We will not update the forward looking statements to reflect actual results or changes in the factors affecting the forward looking statements.
The Company is a growth-oriented, one-bank holding company headquartered in Bethesda, Maryland, which is currently celebrating seventeen years of successful operations. The Company provides general commercial and consumer banking services through the Bank, its wholly owned banking subsidiary, a Maryland chartered bank which is a member of the Federal Reserve System. The Company was organized in October 1997, to be the holding company for the Bank. The Bank was organized in 1998 as an independent, community oriented, full service banking alternative to the super regional financial institutions, which dominate the Company's primary market area. The Company's philosophy is to provide superior, personalized service to its customers. The Company focuses on relationship banking, providing each customer with a number of services and becoming familiar with and addressing customer needs in a proactive, personalized fashion. The Bank currently has a total of twenty one branch offices, including nine in Northern Virginia, seven in Montgomery County, Maryland, and five in Washington, D.C.
The Bank offers a broad range of commercial banking services to its business and professional clients as well as full service consumer banking services to individuals living and/or working primarily in the Bank's market area. The Bank emphasizes providing commercial banking services to sole proprietors, small and medium-sized businesses, non-profit organizations and associations, and investors living and working in and near the primary service area. These services include the usual deposit functions of commercial banks, including business and personal checking accounts, NOW accounts and money market and savings accounts, business, construction, and commercial loans, residential mortgages and consumer loans, and cash management services. The Bank is also active in the origination and sale of residential mortgage loans and the origination of SBA loans. The residential mortgage loans are originated for sale to third-party investors, generally large mortgage and banking companies, under best efforts and mandatory delivery commitments with the investors to purchase the loans subject to compliance with pre-established criteria. The Bank generally sells the guaranteed portion of the SBA loans in a transaction apart from the loan origination generating noninterest income from the gains on sale, as well as servicing income on the portion participated. Bethesda Leasing, LLC, a subsidiary of the Bank, holds title to and manages other
40
real estate owned ("OREO") assets. Eagle Insurance Services, LLC, a subsidiary of the Bank, offers access to insurance products and services through a referral program with a third party insurance broker. Additionally, the Bank offers investment advisory services through referral programs with two third parties. ECV, a subsidiary of the Company, provides subordinated financing for the acquisition, development and/or construction of real estate projects. ECV lending involves higher levels of risk, together with commensurate expected returns.
Throughout 2015, economic conditions in the U.S. economy remained mixed as monthly reports fluctuated from generally good to weak with sub-par economic and wage growth being a persistent theme. As 2015 began, expectations were high that the Federal Reserve Board would begin moving short-term interest rates higher but that move did not occur until the final meeting in December. Actual GDP growth for 2015 in the U.S. was below expectations, with the final quarter of 2015 registering just 0.7% growth. Worldwide GDP growth was also generally weak with the European Central Bank ("ECB") committing to further monetary stimulus, and discussions of negative interest rates. Additionally, growth in China declined, which put pressure on developing countries growth, resulting in lower commodity prices, including oil, which prices were very dependent on the strength of the Chinese economy. The U.S. official unemployment rate declined by year-end 2015 to 4.9%. However, job growth, which occurred monthly, was impacted significantly by lower paying jobs, more part-time employment and a lower job participation level. The lack of solid full time job growth and wages weighed heavily on Federal Reserve Board monetary policy, which continued short-term interest rates at near zero levels until its December 2015 meeting, when the federal funds target interest rate was increased by 25 basis points, the first such rate hike by the Federal Reserve's Open Market Committee ("FOMC") in nine years.
Longer-term U.S. interest rates averaged lower in 2015, with the ten year U.S. Treasury rate averaging 2.14% in 2015 versus 2.54% in 2014. The yield curve flattened (two year versus ten year U.S. Treasury rates) during 2015 as inflationary pressures subsided and the prospect of the FOMC raising short term rates increased, which did not happen until late in 2015. Lower long-term interest rates were a function of both a flight to quality in U.S. Treasury securities, as persistent weaknesses continued in ECB economies generally, along with geopolitical risks, combined with very low inflation levels, most notably energy prices. Arguably, the most significant economic factor in 2015, was substantially lower energy (oil and natural gas) prices brought about by enhanced production in the U.S. and worldwide, creating a huge oversupply situation. The good news was lower U.S. consumer gasoline prices. The bad news was significant stress on the U.S. energy sector's jobs and financial position and results.
As the ten year U.S. Treasury rate remained in a range of 2.00%-2.25% for most of 2015, the volume of residential mortgage lending was generally favorable throughout the year. Overall, real estate values were stable to increasing in 2015 as interest rates remained low and job growth and personal income levels rose modestly. Political gridlock continued in Washington, D.C. over concerns of public debt and deficits, tax policy and spending levels, although a bill to fund the federal government through September 2016 was reached in late 2015. Uncertainty concerning public policy kept private investment weak throughout 2015 and average liquidity in the overall economy remained high.
Even considering the impact of lower federal government spending in 2015, the Company's primary market, the Washington, D.C. metropolitan area, has been relatively less impacted by recessionary forces than other parts of the country, due to good growth in the private sector. Private sector growth was attributable in part to a diverse economy including a large healthcare component, substantial business services, and a highly educated work force.
During 2015, the Company enhanced its marketplace positioning by remaining proactive in growing client relationships and expanding its presence in the Northern Virginia sub-market with the acquisition of Virginia Heritage completed October 31, 2014. The Company has had the financial resources to meet, and has remained committed to meeting, the credit needs of its community, resulting in substantial growth in the Bank's loan portfolio during 2015. Furthermore, the Company's capital position was enhanced in 2015
41
by very strong and consistent earnings and a successful common stock offering in March 2015. The Company believes its strategies of remaining growth-oriented, retaining a talented staff and maintaining focus on seeking quality lending and deposit relationships has proven successful and is evidenced in its financial and performance ratios. Additionally, the Company believes such focus and strategy of relationship building has fostered future growth opportunities, as the Company's reputation in the marketplace has continued to grow. At December 31, 2015, the Company had total assets of approximately $6.08 billion, total loans of $5.00 billion, total deposits of $5.16 billion and twenty one branches in the Washington, D.C. metropolitan area.
Operating in the economic environment of 2015, the Bank was able to produce above average growth as compared to local peer banks in both deposits and loans. Additionally, the Bank was able to grow its net interest spread earnings substantially, maintain an above average net interest margin, retain a solid position regarding asset quality, and generate enhanced operating leverage due in part from the Merger, as well as to its seasoned and professional staff. The Company increased its net income in each quarter of 2015, continuing a trend of consecutive quarterly increases dating to the first quarter of 2009.
The Company's Consolidated Financial Statements are prepared in accordance with GAAP and follow general practices within the banking industry. Application of these principles requires management to make estimates, assumptions, and judgments that affect the amounts reported in the financial statements and accompanying notes. These estimates, assumptions and judgments are based on information available as of the date of the Consolidated Financial Statements; accordingly, as this information changes, the Consolidated Financial Statements could reflect different estimates, assumptions, and judgments. Certain policies inherently have a greater reliance on the use of estimates, assumptions and judgments and, as such, have a greater possibility of producing results that could be materially different than originally reported. Estimates, assumptions, and judgments are necessary when assets and liabilities are required to be recorded at fair value, when a decline in the value of an asset not carried on the financial statements at fair value warrants an impairment write-down or a valuation reserve to be established, or when an asset or liability needs to be recorded contingent upon a future event. Carrying assets and liabilities at fair value inherently results in more financial statement volatility.
The fair values and the information used to record valuation adjustments for investment securities available-for-sale are based either on quoted market prices or are provided by other third-party sources, when available. The Company's investment portfolio is categorized as available-for-sale with unrealized gains and losses net of income tax being a component of shareholders' equity and accumulated other comprehensive income.
Business combinations are accounted for by applying the acquisition method in accordance with Accounting Standards Codification ("ASC") Topic 805, "Business Combinations." Under the acquisition method, identifiable assets acquired and liabilities assumed, and any non-controlling interest in the acquiree at the acquisition date are measured at their fair values as of that date, and are recognized separately from goodwill. Results of operations of the acquired entities are included in the consolidated statement of income from the date of acquisition. Adjustments to fair value for credit and current interest rate considerations at the date of acquisition are subsequently amortized to interest income and interest expense based on the remaining life of the asset or liability. Ongoing assessments of fair value are made at each balance sheet date.
The allowance for credit losses is an estimate of the losses that may be sustained in our loan portfolio. The allowance is based on two principles of accounting: (a) ASC Topic 450, "Contingencies," which requires that losses be accrued when they are probable of occurring and are estimable and (b) ASC Topic 310, "Receivables," which requires that losses be accrued when it is probable that the Company will not collect all principal and interest payments according to the contractual terms of the loan. The loss, if
42
any, can be determined by the difference between the loan balance and the value of collateral, the present value of expected future cash flows, or values observable in the secondary markets.
Three components comprise our allowance for credit losses: a specific allowance, a formula allowance and a nonspecific or environmental factors allowance. Each component is determined based on estimates that can and do change when actual events occur.
The specific allowance allocates a reserve to identified impaired loans. Impaired loans are assigned specific reserves based on an impairment analysis. Under ASC Topic 310, "Receivables," a loan for which reserves are individually allocated may show deficiencies in the borrower's overall financial condition, payment record, support available from financial guarantors and for the fair market value of collateral. When a loan is identified as impaired, a specific reserve is established based on the Company's assessment of the loss that may be associated with the individual loan.
The formula allowance is used to estimate the loss on internally risk rated loans, exclusive of those identified as requiring specific reserves. The portfolio of unimpaired loans is stratified by loan type and risk assessment. Allowance factors relate to the type of loan and level of the internal risk rating, with loans exhibiting higher risk and loss experience receiving a higher allowance factor.
The environmental allowance is also used to estimate the loss associated with pools of non-classified loans. These non-classified loans are also stratified by loan type, and environmental allowance factors are assigned by management based upon a number of conditions, including delinquencies, loss history, changes in lending policy and procedures, changes in business and economic conditions, changes in the nature and volume of the portfolio, management expertise, concentrations within the portfolio, quality of internal and external loan review systems, competition, and legal and regulatory requirements.
The allowance captures losses inherent in the loan portfolio, which have not yet been recognized. Allowance factors and the overall size of the allowance may change from period to period based upon management's assessment of the above described factors, the relative weights given to each factor, and portfolio composition.
Management has significant discretion in making the judgments inherent in the determination of the provision and allowance for credit losses, including in connection with the valuation of collateral, a borrower's prospects of repayment, and in establishing allowance factors on the formula and environmental components of the allowance. The establishment of allowance factors involves a continuing evaluation, based on management's ongoing assessment of the global factors discussed above and their impact on the portfolio. The allowance factors may change from period to period, resulting in an increase or decrease in the amount of the provision or allowance, based upon the same volume and classification of loans. Changes in allowance factors can have a direct impact on the amount of the provision, and a related after tax effect on net income. Errors in management's perception and assessment of the global factors and their impact on the portfolio could result in the allowance not being adequate to cover losses in the portfolio, and may result in additional provisions or charge-offs. Alternatively, errors in management's perception and assessment of the global factors and their impact on the portfolio could result in the allowance being in excess of amounts necessary to cover losses in the portfolio, and may result in lower provisions in the future. For additional information regarding the provision for credit losses, refer to the discussion under the caption "Provision for Credit Losses" below.
Goodwill represents the excess of the cost of an acquisition over the fair value of the net assets acquired. Other intangible assets represent purchased assets that lack physical substance but can be distinguished from goodwill because of contractual or other legal rights. Intangible assets that have finite lives, such as core deposit intangibles, are amortized over their estimated useful lives and subject to periodic impairment testing. Intangible assets (other than goodwill) are amortized to expense using accelerated or straight-line methods over their respective estimated useful lives.
43
Goodwill and other intangibles are subject to impairment testing at the reporting unit level, which must be conducted at least annually. The Company performs impairment testing during the fourth quarter of each year or when events or changes in circumstances indicate the assets might be impaired.
The Company performs a qualitative assessment to determine whether it is more likely than not that the fair value of a reporting unit is less than its carrying amount. If, after assessing updated qualitative factors, the Company determines it is not more likely than not that the fair value of a reporting unit is less than its carrying amount, it does not have to perform the two-step goodwill impairment test. Determining the fair value of a reporting unit under the first step of the goodwill impairment test and determining the fair value of individual assets and liabilities of a reporting unit under the second step of the goodwill impairment test are judgmental and often involve the use of significant estimates and assumptions. Similarly, estimates and assumptions are used in determining the fair value of other intangible assets. Estimates of fair value are primarily determined using discounted cash flows, market comparisons and recent transactions. These approaches use significant estimates and assumptions including projected future cash flows, discount rates reflecting the market rate of return, projected growth rates and determination and evaluation of appropriate market comparables. Based on the results of quantitative assessments of all reporting units, the Company concluded that no impairment existed at December 31, 2015. However, future events could cause the Company to conclude that goodwill or other intangibles have become impaired, which would result in recording an impairment loss. Any resulting impairment loss could have a material adverse impact on the Company's financial condition and results of operations.
The Company follows the provisions of ASC Topic 718, "Compensation," which requires the expense recognition for the fair value of share based compensation awards, such as stock options, restricted stock awards, and performance based shares. This standard allows management to establish modeling assumptions as to expected stock price volatility, option terms, forfeiture rates and dividend rates which directly impact estimated fair value. The accounting standard also allows for the use of alternative option pricing models which may impact fair value as determined. The Company's practice is to utilize reasonable and supportable assumptions.
Interest rate swap derivatives designated as qualified cash flow hedges are tested for hedge effectiveness on a quarterly basis. Assessments are made at the inception of the hedge and on a recurring basis to determine whether the derivative used in the hedging transaction has been and is expected to continue to be highly effective in offsetting changes in fair values or cash flows of the hedged item. A statistical regression analysis is performed to measure the effectiveness.
If, based on the assessment, a derivative is not expected to be a highly effective hedge or it has ceased to be a highly effective hedge, hedge accounting is discontinued as of the quarter the hedge is not highly effective. As the statistical regression analysis requires the use of estimates regarding the amount and timing of future cash flows which are sensitive to significant changes in future periods based on changes in market rates; we consider this a critical accounting estimate.
Overview
Due to the Merger completed in 2014, the Company incurred various merger-related expenses in 2014, which make it difficult for readers to analyze the Company's core operating earnings. For comparison purposes, the Company provides parenthetically in the discussion below the operating amounts and ratios which it feels are more useful to the reader. For a reconciliation of these non-GAAP financial measures to the GAAP equivalents, please refer to the Selected Financial Data appearing at Item 6 of this report.
For the year ended December 31, 2015, the Company's net income was $84.2 million, a 55% increase (46% on an operating basis) over the $54.3 million ($57.7 million on an operating basis) for the year ended
44
December 31, 2014. Net income available to common shareholders for the year ended December 31, 2015 was $83.6 million, as compared to $53.6 million ($57.1 million on an operating basis) for the same period in 2014, a 56% increase (46% on an operating basis).
Net income available to common shareholders in 2015 was $2.54 per basic common share and $2.50 per diluted common share, as compared to $2.01 per basic common share and $1.95 per diluted common share ($2.14 per basic common share and $2.08 per diluted common share on an operating basis) for 2014, a 26% increase per basic and a 28% increase per diluted common share (19% increase per basic and 21% per diluted common share on an operating basis).
For the year ended December 31, 2015, the Company reported a return on average assets ("ROAA") of 1.49% as compared to 1.31% (1.40% on an operating basis) for the year ended December 31, 2014, while the return on average common equity ("ROACE") was 12.32%, as compared to 13.50% (14.38% on an operating basis) for the year ended December 31, 2014.
The lower ROACE for the full year 2015 as compared to the 2014 ratio was due to higher capital levels in 2015.
The Company's earnings are largely dependent on net interest income, the difference between interest income and interest expense, which represented 90% and 91% of total revenue (defined as net interest income plus noninterest income) for the full year in 2015 and 2014, respectively.
The net interest margin, which measures the difference between interest income and interest expense (i.e., net interest income) as a percentage of earning assets, decreased 11 basis points from 4.44% for the year ended December 31, 2014 to 4.33% for the year ended December 31, 2015. Average earning asset yields decreased by 8 basis points (4.69% versus 4.77%) for the year ended December 31, 2015 compared to the same period in 2014, while the cost of interest bearing liabilities increased by 5 basis points (to 0.54% from 0.49%). For 2015, in spite of competitive factors and a low interest rate environment, the Company has been able to maintain its loan portfolio yields relatively close to 2014 levels (5.24% versus 5.37%) due to disciplined loan pricing practices. The net interest margin was positively impacted by 6 basis points for the year ended December 31, 2015 as a result of $3.5 million in amortization of the credit mark adjustment from the Merger.
For the year ended December 31, 2015, the net interest spread decreased by 13 basis points (to 4.15% from 4.28%) as compared to 2014, due to lower yields on average earning assets and an increase in the average cost on interest bearing liabilities. The cost of interest bearing liabilities increased in 2015 largely as a result of the full year impact of the issuance of $70 million of subordinated notes completed in August 2014, and to a higher mix of time deposits resulting from the Merger. Overall, the Company believes its deposit mix and cost of funds remains favorable. The benefit of noninterest sources funding earning assets increased by 2 basis points to 18 basis points from 16 basis points for the year ended December 31, 2015 and 2014, respectively, as a result of a favorable mix of noninterest bearing deposits and stockholders' equity.
The combination of a 13 basis point decrease in the net interest spread and a 2 basis point increase in the value of noninterest sources resulted in the 11 basis point decrease in the net interest margin for the year ended December 31, 2015 as compared to the same period in 2014.
The Company believes it effectively managed its net interest margin and net interest income during 2015 as market interest rates (on average) have remained relatively low. This factor has been significant to overall earnings performance during 2015 as net interest income (at 90%) represents the most significant component of the Company's revenues.
The provision for credit losses was $14.6 million for the year ended December 31, 2015 as compared to $10.9 million for the year ended December 31, 2014. The higher provisioning in the year ended December 31, 2015, as compared to the December 31, 2014, is due to both higher loan growth and higher
45
net charge-offs. Net charge-offs of $8.0 million for the year ended December 31, 2015 represented 0.17% of average loans, excluding loans held for sale, as compared to $5.7 million or 0.17% of average loans, excluding loans held for sale, for the year ended December 31, 2014.
At December 31, 2015, the allowance for credit losses represented 1.05% of loans outstanding, as compared to 1.07% at December 31, 2014. The decrease in the allowance for credit losses as a percentage of total loans was due to both higher loan growth and lower impaired loan balances. The allowance for credit losses was 398% of nonperforming loans at December 31, 2015, as compared to 205% at December 31, 2014.
Total noninterest income for the year ended December 31, 2015 increased to $26.6 million from $18.3 million for the year ended December 31, 2014, a 45% increase.
The efficiency ratio, which measures the ratio of noninterest expense to total revenue, remained favorable at 42.49% for the year ended December 31, 2015 as compared to 50.67% (48.28% on an operating basis) for the same period in 2014. Total noninterest expenses totaled $110.7 million for the year ended December 31, 2015, as compared to $99.7 million ($95.0 million on an operating basis) for the year ended December 31, 2014, an 11% increase (17% on an operating basis). As a percentage of average assets, total noninterest expense was 1.97% for the year of 2015 as compared to 2.41% (2.30% on an operating basis) for the same period in 2014.
The ratio of common equity to total assets increased from 10.46% at December 31, 2014 to 12.15% at December 31, 2015 due to growth from earnings and the public offering of common stock completed during the first quarter of 2015. As discussed in the "Capital Resources and Adequacy" section, the regulatory capital ratios of the Bank and Company remain above well capitalized levels.
Net Interest Income and Net Interest Margin
Net interest income is the difference between interest income on earning assets and the cost of funds supporting those assets. Earning assets are composed primarily of loans, loans held for sale, investment securities, and interest bearing deposits with banks. The cost of funds comprises interest expense on deposits, customer repurchase agreements and other borrowings, which consist of federal funds purchased, advances from the FHLB and subordinated notes. Noninterest bearing deposits and capital are other components representing funding sources. Changes in the volume and mix of assets and funding sources, along with the changes in yields earned and rates paid, determine changes in net interest income.
Net interest income in 2015 was $233.9 million compared to $178.5 million in 2014 and $144.8 million in 2013.
For the year ended December 31, 2015, net interest income increased 31% over the same period for 2014. Average loans increased $1.23 billion (37%) and average deposits increased by $1.18 billion (34%). The net interest margin was 4.33% for the year ended December 31, 2015, as compared to 4.44% for the same period in 2014. The Company has been able to maintain its loan yields in 2015 relatively close to 2014 levels due to disciplined loan pricing practices, and has managed its funding costs while maintaining a favorable deposit mix; much of which has occurred from sales efforts to increase and deepen client relationships. The Company believes its net interest margin remains favorable.
The table below presents the average balances and rates of the various categories of the Company's assets and liabilities for the years ended December 31, 2015, 2014 and 2013. Included in the tables is a measurement of interest rate spread and margin. Interest rate spread is the difference (expressed as a percentage) between the interest rate earned on earning assets less the interest expense on interest bearing liabilities. While the interest rate spread provides a quick comparison of earnings rates versus cost of funds, management believes that margin provides a better measurement of performance. Margin includes the effect of noninterest bearing sources in its calculation and is net interest income expressed as a percentage of average earning assets.
46
Consolidated Average Balances, Interest Yields And Rates (Unaudited)
| |
Years Ended December 31, | |||||||||||||||||||||||||||
|---|---|---|---|---|---|---|---|---|---|---|---|---|---|---|---|---|---|---|---|---|---|---|---|---|---|---|---|---|
| |
2015 | 2014 | 2013 | |||||||||||||||||||||||||
| (dollars in thousands) |
Average Balance |
Interest | Average Yield / Rate |
Average Balance |
Interest | Average Yield / Rate |
Average Balance |
Interest | Average Yield / Rate |
|||||||||||||||||||
Assets |
||||||||||||||||||||||||||||
Interest earning assets: |
||||||||||||||||||||||||||||
Interest bearing deposits with other |
||||||||||||||||||||||||||||
banks and other short-term investments |
$ | 308,345 | $ | 732 | 0.24 | % | $ | 207,530 | $ | 496 | 0.24 | % | $ | 280,399 | $ | 689 | 0.25 | % | ||||||||||
Loans held for sale(1) |
44,533 | 1,671 | 3.75 | % | 33,541 | 1,337 | 3.99 | % | 90,161 | 3,140 | 3.48 | % | ||||||||||||||||
Loans(1)(2) |
4,594,395 | 240,669 | 5.24 | % | 3,361,696 | 180,438 | 5.37 | % | 2,644,892 | 145,661 | 5.51 | % | ||||||||||||||||
Investment securities available for sale(2) |
445,986 | 10,092 | 2.26 | % | 401,153 | 9,286 | 2.31 | % | 348,143 | 7,792 | 2.24 | % | ||||||||||||||||
Federal funds sold |
6,812 | 16 | 0.23 | % | 9,205 | 16 | 0.17 | % | 6,871 | 12 | 0.17 | % | ||||||||||||||||
| | | | | | | | | | | | | | | | | | | | | | | | | | | | | |
Total interest earning assets |
5,400,071 | 253,180 | 4.69 | % | 4,013,125 | 191,573 | 4.77 | % | 3,370,466 | 157,294 | 4.67 | % | ||||||||||||||||
| | | | | | | | | | | | | | | | | | | | | | | | | | | | | |
Noninterest earning assets |
280,443 | 160,543 | 107,844 | |||||||||||||||||||||||||
Less: allowance for credit losses |
48,811 | 43,173 | 39,207 | |||||||||||||||||||||||||
| | | | | | | | | | | | | | | | | | | | | | | | | | | | | |
Total noninterest earning assets |
231,632 | 117,370 | 68,637 | |||||||||||||||||||||||||
| | | | | | | | | | | | | | | | | | | | | | | | | | | | | |
Total Assets |
$ | 5,631,703 | $ | 4,130,495 | $ | 3,439,103 | ||||||||||||||||||||||
| | | | | | | | | | | | | | | | | | | | | | | | | | | | | |
| | | | | | | | | | | | | | | | | | | | | | | | | | | | | |
| | | | | | | | | | | | | | | | | | | | | | | | | | | | | |
Liabilities and |
||||||||||||||||||||||||||||
Shareholders' Equity |
||||||||||||||||||||||||||||
Interest bearing liabilities: |
||||||||||||||||||||||||||||
Interest bearing transaction |
$ | 182,518 | $ | 291 | 0.16 | % | $ | 119,835 | $ | 178 | 0.15 | % | $ | 103,763 | $ | 298 | 0.29 | % | ||||||||||
Savings and money market |
2,425,286 | 8,185 | 0.34 | % | 1,950,138 | 6,265 | 0.32 | % | 1,516,699 | 5,765 | 0.38 | % | ||||||||||||||||
Time deposits |
774,943 | 5,867 | 0.76 | % | 449,108 | 3,195 | 0.71 | % | 481,576 | 4,551 | 0.95 | % | ||||||||||||||||
| | | | | | | | | | | | | | | | | | | | | | | | | | | | | |
Total interest bearing deposits |
3,382,747 | 14,343 | 0.42 | % | 2,519,081 | 9,638 | 0.38 | % | 2,102,038 | 10,614 | 0.50 | % | ||||||||||||||||
Customer repurchase agreements and federal funds purchased |
59,141 | 132 | 0.22 | % | 63,490 | 143 | 0.23 | % | 94,566 | 254 | 0.27 | % | ||||||||||||||||
Other short-term borrowings |
27,659 | 86 | 0.31 | % | 7,288 | 31 | 0.42 | % | 30 | — | — | |||||||||||||||||
Long-term borrowings |
82,446 | 4,677 | 5.60 | % | 77,081 | 3,283 | 4.20 | % | 39,300 | 1,636 | 4.11 | % | ||||||||||||||||
| | | | | | | | | | | | | | | | | | | | | | | | | | | | | |
Total interest bearing liabilities |
3,551,993 | 19,238 | 0.54 | % | 2,666,940 | 13,095 | 0.49 | % | 2,235,934 | 12,504 | 0.56 | % | ||||||||||||||||
| | | | | | | | | | | | | | | | | | | | | | | | | | | | | |
Noninterest bearing liabilities: |
||||||||||||||||||||||||||||
Noninterest bearing demand |
1,314,516 | 994,007 | 811,757 | |||||||||||||||||||||||||
Other liabilities |
26,726 | 12,925 | 16,709 | |||||||||||||||||||||||||
| | | | | | | | | | | | | | | | | | | | | | | | | | | | | |
Total noninterest bearing liabilities |
1,341,242 | 1,006,932 | 828,466 | |||||||||||||||||||||||||
| | | | | | | | | | | | | | | | | | | | | | | | | | | | | |
Shareholders' equity |
738,468 | 456,623 | 374,703 | |||||||||||||||||||||||||
| | | | | | | | | | | | | | | | | | | | | | | | | | | | | |
Total Liabilities and Shareholders' Equity |
$ | 5,631,703 | $ | 4,130,495 | $ | 3,439,103 | ||||||||||||||||||||||
| | | | | | | | | | | | | | | | | | | | | | | | | | | | | |
| | | | | | | | | | | | | | | | | | | | | | | | | | | | | |
| | | | | | | | | | | | | | | | | | | | | | | | | | | | | |
Net interest income |
$ | 233,942 | $ | 178,478 | $ | 144,790 | ||||||||||||||||||||||
| | | | | | | | | | | | | | | | | | | | | | | | | | | | | |
| | | | | | | | | | | | | | | | | | | | | | | | | | | | | |
| | | | | | | | | | | | | | | | | | | | | | | | | | | | | |
Net interest spread |
4.15 | % | 4.28 | % | 4.11 | % | ||||||||||||||||||||||
Net interest margin |
4.33 | % | 4.44 | % | 4.30 | % | ||||||||||||||||||||||
Cost of funds |
0.36 | % | 0.33 | % | 0.37 | % | ||||||||||||||||||||||
- (1)
- Loans
placed on nonaccrual status are included in average balances. Net loan fees and late charges included in interest income on loans totaled
$12.6 million, $11.5 million and $7.9 million for the year ended December 31, 2015, 2014, and 2013 respectively.
- (2)
- Interest and fees on loans and investments exclude tax equivalent adjustments.
Rate/Volume Analysis of Net Interest Income
The rate/volume table below presents the composition of the change in net interest income for the periods indicated, as allocated between the change in net interest income due to changes in the volume of average earning assets and interest bearing liabilities, and the changes in net interest income due to changes in interest rates. As the table shows, the increase in net interest income in 2015 as compared to
47
2014 was primarily a function of an increase in the volume of earning assets. For 2014 over 2013, the change was primarily a function of an increase in the volume of earning assets.
| |
2015 compared with 2014 | 2014 compared with 2013 | |||||||||||||||||
|---|---|---|---|---|---|---|---|---|---|---|---|---|---|---|---|---|---|---|---|
| (dollars in thousands) |
Change Due to Volume |
Change Due to Rate |
Total Increase (Decrease) |
Change Due to Volume |
Change Due to Rate |
Total Increase (Decrease) |
|||||||||||||
Interest earned on |
|||||||||||||||||||
Loans |
$ | 66,165 | $ | (5,934 | ) | $ | 60,231 | $ | 39,476 | $ | (4,699 | ) | $ | 34,777 | |||||
Loans held for sale |
438 | (104 | ) | 334 | (1,972 | ) | 169 | (1,803 | ) | ||||||||||
Investment securities |
1,038 | (232 | ) | 806 | 1,186 | 308 | 1,494 | ||||||||||||
Interest bearing bank deposits |
241 | (5 | ) | 236 | (179 | ) | (14 | ) | (193 | ) | |||||||||
Federal funds sold |
(4 | ) | 4 | — | 4 | 0 | 4 | ||||||||||||
| | | | | | | | | | | | | | | | | | | | |
Total interest income |
67,878 | (6,271 | ) | 61,607 | 38,515 | (4,236 | ) | 34,279 | |||||||||||
| | | | | | | | | | | | | | | | | | | | |
Interest paid on |
|||||||||||||||||||
Interest bearing transaction |
93 | 20 | 113 | 46 | (166 | ) | (120 | ) | |||||||||||
Savings and money market |
1,526 | 394 | 1,920 | 1,648 | (1,148 | ) | 500 | ||||||||||||
Time deposits |
2,318 | 354 | 2,672 | (307 | ) | (1,049 | ) | (1,356 | ) | ||||||||||
Customer repurchase agreements |
(10 | ) | (1 | ) | (11 | ) | (83 | ) | (28 | ) | (111 | ) | |||||||
Other borrowings |
315 | 1,134 | 1,449 | 1,573 | 105 | 1,678 | |||||||||||||
| | | | | | | | | | | | | | | | | | | | |
Total interest expense |
4,242 | 1,901 | 6,143 | 2,877 | (2,286 | ) | 591 | ||||||||||||
| | | | | | | | | | | | | | | | | | | | |
Net interest income |
$ | 63,636 | $ | (8,172 | ) | $ | 55,464 | $ | 35,638 | $ | (1,950 | ) | $ | 33,688 | |||||
| | | | | | | | | | | | | | | | | | | | |
| | | | | | | | | | | | | | | | | | | | |
| | | | | | | | | | | | | | | | | | | | |
Provision for Credit Losses
The provision for credit losses represents the amount of expense charged to current earnings to fund the allowance for credit losses. The amount of the allowance for credit losses is based on many factors which reflect management's assessment of the risk in the loan portfolio. Those factors include economic conditions and trends, the value and adequacy of collateral, volume and mix of the portfolio, performance of the portfolio, and internal loan processes of the Company and Bank.
Management has developed a comprehensive analytical process to monitor the adequacy of the allowance for credit losses. This process and guidelines were developed utilizing, among other factors, the guidance from federal banking regulatory agencies. The results of this process, in combination with conclusions of the Bank's outside loan review consulting firm, support management's assessment as to the adequacy of the allowance at the balance sheet date. Please refer to the discussion under the caption "Critical Accounting Policies" for an overview of the methodology management employs on a quarterly basis to assess the adequacy of the allowance and the provisions charged to expense. Also, refer to the table under "Allowance for Credit Losses" at page 56, which reflects the comparative charge-offs and recoveries.
The allowance for credit losses increased $6.6 million as of December 31, 2015 as compared to December 31, 2014, reflecting $14.6 million in provision for credit losses and $8.0 million in net charge-offs during 2015. The provision for credit losses was $14.6 million for 2015 as compared to $10.9 million in 2014. The higher provisioning for the year ended December 31, 2015 as compared to the same period in 2014 was due to both higher loan growth and higher net charge-offs. Net charge-offs totaled $8.0 million (0.17% of average loans, excluding loans held for sale) for the year ended December 31, 2015 compared to $5.7 million (0.17% of average loans, excluding loans held for sale) for the year ended December 31, 2014, a dollar increase of $2.3 million. Net charge-offs for the year ended December 31, 2015 were attributable
48
primarily to land development and construction loans ($1.7 million), commercial and industrial loans ($4.5 million), home equity and other consumer ($1.2 million), and income producing-commercial real estate loans ($625 thousand).
At December 31, 2015 the allowance for credit losses represented 1.05% of loans outstanding, as compared to 1.07% at December 31, 2014. The decline in the ratio of the allowance for credit losses to total loans was due to growth in the loan portfolio and lower impaired loan balances. The allowance for credit losses represented 398% of nonperforming loans at December 31, 2015, as compared to 205% at December 31, 2014.
As part of its comprehensive loan review process, the Bank's Board of Directors and Loan Committee or Credit Review Committee carefully evaluate loans which are past-due 30 days or more. The Committees make a thorough assessment of the conditions and circumstances surrounding each delinquent loan. The Bank's loan policy requires that loans be placed on nonaccrual if they are 90 days past-due, unless they are well secured and in the process of collection. Additionally, Credit Administration specifically analyzes the status of development and construction projects, sales activities and utilization of interest reserves in order to carefully and prudently assess potential increased levels of risk requiring additional reserves.
The maintenance of a high quality loan portfolio, with an adequate allowance for possible credit losses, will continue to be a primary management objective for the Company.
Noninterest Income
Total noninterest income includes service charges on deposits, gain on sale of loans, gain on sale of investments, income from bank owned life insurance ("BOLI") and other income.
Total noninterest income for the year ended December 31, 2015 increased to $26.6 million from $18.3 million for the year ended December 31, 2014, a 45% increase. This increase was primarily due to $4.9 million higher gains on the sale of residential mortgage loans and to gains realized on the sale of investment securities of $2.3 million offset by a $1.1 million loss on the early extinguishment of debt due to the early payoff of FHLB advances. There were $2.3 million of investment securities gains recorded for the year of 2015, as compared to $22 thousand of investment securities gains for the year of 2014.
For the year ended December 31, 2015, service charges on deposit accounts increased $491 thousand to $5.4 million from $4.9 million, an increase of 10% over 2014. This increase in service charges for the year ended December 31, 2015 was primarily related to growth in the number of accounts.
Gain on sale of loans consists of SBA and residential mortgage loans. For the year ended December 31, 2015, gain on sale of loans increased from $6.9 million to $12.0 million compared to the same period in 2014.
The Company originates residential mortgage loans and utilizes both "mandatory delivery" and "best efforts" forward loan sale commitments to sell those loans, servicing released. Sales of these residential mortgage loans yielded gains of $10.4 million for the year ended December 31, 2015 compared to $5.6 million in the same period in 2014, as refinancing activity increased beginning in the first quarter of 2015. Loans sold are subject to repurchase in circumstances where documentation is deficient or the underlying loan becomes delinquent or pays off within a specified period following loan funding and sale. The Bank considers these potential recourse provisions to be a minimal risk, but has established a reserve for possible repurchases. The reserve amounted to $117 thousand at December 31, 2015 and is included in other liabilities on the Consolidated Balance Sheets. There were no repurchases due to fraud by the borrower during the year ended December 31, 2015. The Bank does not originate "sub-prime" loans and has no exposure to that market segment.
The Company is an originator of SBA loans and its current practice is to sell the guaranteed portion of those loans at a premium. Income from this source was $1.5 million for the year ended December 31,
49
2015 compared to $1.3 million for the same period in 2014. Activity in SBA loan sales to secondary markets can vary widely from quarter to quarter.
Other income totaled $6.5 million for the year ended December 31, 2015 as compared to $5.2 million for the same period in 2014, an increase of 25%. ATM fees increased from $1.2 million for the year ended December 31, 2014, to $1.4 million for the year ended December 31, 2015, a 19% increase. SBA servicing fees increased from $260 thousand for the year ended December 31, 2014 to $290 thousand for the year ended December 31, 2015, a 12% increase. Noninterest loan fees increased from $2.8 million for the year ended December 31, 2014 to $3.6 million for the same period in 2015, a 30% increase. Noninterest loan fees relate primarily to the collection of prepayment and commitment fees. Other noninterest fee income was $1.2 million for 2015 compared to $1.0 million for 2014, a 19% increase.
At December 31, 2015, BOLI amounted to $58.7 million as compared to $56.6 million at December 31, 2014, which reflected an increase in cash surrender values.
Net investment gains amounted to $2.3 million for the year ended December 31, 2015 compared to $22 thousand for the year ended December 31, 2014. Net investment gains were realized in 2015 to take advantage of market conditions, as longer term U.S. Treasury rates declined precipitously in February 2015.
Noninterest Expense
Total noninterest expense consists of salaries and employee benefits, premises and equipment expenses, marketing and advertising, data processing, legal, accounting and professional fees, FDIC insurance premiums and other expenses.
Total noninterest expenses totaled $110.7 million for the year ended December 31, 2015, as compared to $99.7 million ($95.0 million on an operating basis) for the year ended December 31, 2014, an 11% increase (17% on an operating basis).
Salaries and employee benefits were $61.7 million for the year ended December 31, 2015, as compared to $57.3 million for the same period in 2014, an 8% increase. Cost increases for salaries and benefits for the year ended December 31, 2015 were due primarily to increased staff, merit increases, employee benefit expense increases and higher incentive compensation. At December 31, 2015, the Company's full time equivalent staff numbered 434, as compared to 427 at December 31, 2014.
Premises and equipment expenses amounted to $16.0 million for the year ended December 31, 2015 as compared to $13.3 million for the same period in 2014, a 20% increase. For the year ended December 31, 2015, premises and equipment expenses were higher due to costs of additional branches and office space acquired in the Merger, to increases in leasing costs, and to accelerated amortization. For the year ended December 31, 2015, the Company recognized $435 thousand of sublease revenue as compared to $114 thousand for the same period in 2014. The sublease revenue is a direct offset of premises and equipment expenses.
Marketing and advertising expenses increased from $2.0 million for the year ended December 31, 2014 to $2.7 million for 2015, an increase of 38%, primarily due to costs associated with digital and print advertising and sponsorships.
Data processing expenses increased from $6.2 million for the year ended December 31, 2014 to $7.5 million for 2015, an increase of 22%. The increase in expense for the year ended December 31, 2015 as compared to the same period in 2014 was due to increased accounts and transaction volume primarily arising out of the Merger and to higher network expenses.
Legal, accounting and professional fees were $3.7 million for the year ended December 31, 2015, as compared to $3.4 million for 2014, an increase of 8%.
50
FDIC insurance premiums increased $821 thousand to $3.2 million for the year ended December 31, 2015, an increase of 35% compared to 2014 due to higher average asset growth.
Other expenses increased to $15.6 million for the year ended December 31, 2015 from $10.5 million for the same period in 2014, an increase of 49%. The major components of cost in this category include insurance expenses, deposit fees, director fees, OREO expenses and franchise taxes. The increase for the year ended December 31, 2015 compared to the same period in 2014 was primarily due to an increase in costs and valuation adjustments associated with other real estate owned of $2.1 million, an increase in franchise tax of $506 thousand, and an increase in core deposit intangible amortization of $754 thousand. Cost control remains a significant operating objective of the Company.
Income Tax Expense
The Company recorded income tax expense of $51.0 million in 2015 compared to $32.0 million in 2014, resulting in an effective tax rate of 37.8% and 37.1%, respectively. The higher effective tax rate for 2015 reflects the relatively lower levels of tax exempt income.
Overview
At December 31, 2015, total assets were $6.08 billion, compared to $5.25 billion at December 31, 2014, a 16% increase. Total loans (excluding loans held for sale) were $5.00 billion at December 31, 2015 compared to $4.31 billion at December 31, 2014, a 16% increase. Total deposits were $5.16 billion at December 31, 2015, compared to deposits of $4.31 billion at December 31, 2014, a 20% increase. Loans held for sale amounted to $47.5 million at December 31, 2015 as compared to $44.3 million at December 31, 2014, a 7% increase.
The investment portfolio totaled $487.9 million at December 31, 2015, a 28% increase from the $382.3 million balance at December 31, 2014. Total borrowed funds (excluding customer repurchase agreements) were $70.0 million at December 31, 2015 as compared to $219.3 million at December 31, 2014, a 68% decrease. The decline in borrowed funds for the year ended December 31, 2015 as compared to December 31, 2014 was the result of the payoff of all FHLB advances and the $9.3 million in subordinated notes due 2021.
Total shareholders' equity at December 31, 2015 decreased 6%, to $738.6 million, compared to $786.1 million at September 30, 2015, and increased 19%, from $620.8 million, at December 31, 2014. The decline of shareholders' equity from September 30, 2015 reflects the redemption during the fourth quarter of 2015 of all $71.9 million of the preferred stock issued under the Small Business Lending Fund ("SBLF"), partially offset by earnings during the fourth quarter. The increase in shareholders' equity in 2015 was due to increased retained earnings, the public offering of common stock completed during the first quarter of 2015 (which netted approximately $94.5 million) and the redemption of the SBLF preferred stock noted above. The ratio of common equity to total assets was 12.15% at December 31, 2015 as compared to 10.46% at December 31, 2014. The Company's capital position remains substantially in excess of regulatory requirements for well capitalized status, with a total risk based capital ratio of 12.75% at December 31, 2015, as compared to 12.97% at December 31, 2014. In addition, the tangible common equity ratio was 10.56% at December 31, 2015, compared to 8.54% at December 31, 2014.
Investment Securities Available-for-Sale and Short-Term Investments
The tables below and Note 4 to the Consolidated Financial Statements provide additional information regarding the Company's investment securities categorized as "available-for-sale" ("AFS"). The Company classifies all its investment securities as AFS. This classification requires that investment securities be recorded at their fair value with any difference between the fair value and amortized cost (the purchase
51
price adjusted by any discount accretion or premium amortization) reported as a component of shareholders' equity (accumulated other comprehensive income), net of deferred income taxes. At December 31, 2015, the Company had a net unrealized gain in AFS securities of $1.7 million with a deferred income tax liability of $694 thousand, as compared to a net unrealized gain in AFS securities of $4.4 million at December 31, 2014, with a deferred tax liability of $1.8 million, respectively.
The AFS portfolio is comprised of U.S. agency securities (12% of AFS securities) with an average duration of 2.4 years, seasoned mortgage backed securities that are 100% agency issued (61% of AFS securities) which have an average expected life of 3.7 years with contractual maturities of the underlying mortgages of up to thirty years, municipal bonds (24% of AFS securities) which have an average duration of 5.2 years, corporate bonds (3% of AFS securities) which have an average duration of 3.8 years, and equity investments which comprise less than 1% of AFS securities. The equity investment consists of common stock of a few community banking companies with an estimated fair value of $334 thousand. Ninety nine percent of the investment securities which are debt instruments are rated AAA or AA or have the implicit guarantee of the U.S. Treasury.
At December 31, 2015, the investment portfolio amounted to $487.9 million as compared to $382.3 million at December 31, 2014, an increase of 28%. The investment portfolio is managed to achieve goals related to liquidity, income, interest rate risk management and to provide collateral for customer repurchase agreements and other borrowing relationships.
The following table provides information regarding the composition of the Company's investment securities portfolio at the dates indicated. Amounts are reported at estimated fair value. The change in composition of the portfolio at December 31, 2015 as compared to 2014 was due principally to ALCO decisions to sell various longer-term municipal investments, to acquire floating rate corporate bonds in June 2015, and to increase holdings of U.S. agency securities to well position the Company in the current interest rate environment. During the year ended December 31, 2015, the investment portfolio balances increased as compared to balances at December 31, 2014, in part from the reinvestment of a portion of the cash flows from the sale of the indirect consumer loan portfolio which closed in late July 2015, amounting to approximately $80.3 million at the time of sale. In addition to the purchase of investments, cash flows from the sale of the indirect consumer loan portfolio provided additional liquidity for loan originations.
| |
Years Ended December 31, | ||||||||||||||||||
|---|---|---|---|---|---|---|---|---|---|---|---|---|---|---|---|---|---|---|---|
| |
2015 | 2014 | 2013 | ||||||||||||||||
| (dollars in thousands) |
Balance | Percent of Total |
Balance | Percent of Total |
Balance | Percent of Total |
|||||||||||||
U. S. agency securities |
$ | 56,975 | 11.7 | % | $ | 29,894 | 7.8 | % | $ | 47,335 | 12.5 | % | |||||||
Residential mortgage backed securities |
297,241 | 60.9 | % | 240,320 | 62.9 | % | 228,674 | 60.5 | % | ||||||||||
Municipal bonds |
118,381 | 24.3 | % | 111,712 | 29.2 | % | 101,740 | 26.9 | % | ||||||||||
Corporate bonds |
14,938 | 3.1 | % | — | — | — | — | ||||||||||||
Other equity investments |
334 | 0.1 | % | 417 | 0.1 | % | 384 | 0.1 | % | ||||||||||
| | | | | | | | | | | | | | | | | | | | |
|
$ | 487,869 | 100 | % | $ | 382,343 | 100 | % | $ | 378,133 | 100 | % | |||||||
| | | | | | | | | | | | | | | | | | | | |
| | | | | | | | | | | | | | | | | | | | |
| | | | | | | | | | | | | | | | | | | | |
At December 31, 2015, there were no issuers, other than the U.S. Government and its agencies, whose securities owned by the Company had a book or fair value exceeding 10% of the Company's shareholders' equity.
The following table provides information, on an amortized cost basis, regarding the contractual maturity and weighted-average yield of the investment portfolio at December 31, 2015. Expected maturities will differ from contractual maturities because borrowers may have the right to call or prepay
52
obligations with or without call or prepayment penalties. Yields on tax exempt securities have not been calculated on a tax equivalent basis.
| |
One Year or Less | After One Year Through Five Years |
After Five Years Through Ten Years |
After Ten Years | Total | ||||||||||||||||||||||||||
|---|---|---|---|---|---|---|---|---|---|---|---|---|---|---|---|---|---|---|---|---|---|---|---|---|---|---|---|---|---|---|---|
(dollars in thousands)
|
Amortized Cost |
Weighted Average Yield |
Amortized Cost |
Weighted Average Yield |
Amortized Cost |
Weighted Average Yield |
Amortized Cost |
Weighted Average Yield |
Amortized Cost |
Weighted Average Yield |
|||||||||||||||||||||
U. S. agency securities |
$ | 31,436 | 1.84 | % | $ | 18,826 | 2.03 | % | $ | 6,513 | 2.32 | % | $ | — | — | $ | 56,775 | 1.96 | % | ||||||||||||
Residential mortgage backed securities |
5,306 | 2.66 | % | 250,453 | 1.84 | % | 43,950 | 2.40 | % | — | — | 299,709 | 1.94 | % | |||||||||||||||||
Muncipal bonds |
4,450 | 2.84 | % | 41,214 | 3.47 | % | 66,001 | 2.23 | % | 2,588 | 4.01 | % | 114,253 | 2.74 | % | ||||||||||||||||
Corporate bonds |
— | — | 15,090 | 1.03 | % | — | — | — | — | 15,090 | 1.03 | % | |||||||||||||||||||
Other equity investments |
— | — | — | — | — | — | — | — | 307 | — | |||||||||||||||||||||
| | | | | | | | | | | | | | | | | | | | | | | | | | | | | | | | |
|
$ | 41,192 | 2.05 | % | $ | 325,583 | 1.97 | % | $ | 116,464 | 2.30 | % | $ | 2,588 | 4.01 | % | $ | 486,134 | 2.07 | % | |||||||||||
| | | | | | | | | | | | | | | | | | | | | | | | | | | | | | | | |
| | | | | | | | | | | | | | | | | | | | | | | | | | | | | | | | |
| | | | | | | | | | | | | | | | | | | | | | | | | | | | | | | | |
The Company also has a portfolio of short-term investments utilized for asset liability management needs. For the year ended December 31, 2015, this portfolio totaled $1.6 million and was comprised of time deposits. For the year ended December 31, 2014, this portfolio totaled $10.3 million and was comprised of discount notes, commercial paper, money market investments, and other bank certificates of deposit.
Federal funds sold amounted to $3.8 million at December 31, 2015 as compared to $3.5 million at December 31, 2014. These funds represent excess daily liquidity which is invested on an unsecured basis with well capitalized banks, in amounts generally limited both in the aggregate and to any one bank.
Interest bearing deposits with banks and other short-term investments amounted to $283.6 million at December 31, 2015 as compared to $243.4 million at December 31, 2014. These overnight funds represent daily liquidity held at the Federal Reserve to meet future loan demand, to fund future increases in investment securities and to meet other general liquidity needs of the Company.
Loan Portfolio
In its lending activities, the Company seeks to develop substantial relationships with clients whose businesses and individual banking needs will grow with the Bank. There has been a significant effort to grow the loan portfolio and to be responsive to the lending needs in the markets served by the Bank, while maintaining sound asset quality.
Loan growth over the past year has been favorable, with loans outstanding reaching $5.00 billion at December 31, 2015, an increase of $686 million or 16% as compared to $4.31 billion at December 31, 2014, and increased $2.05 billion or 70% as compared to $2.95 billion at December 31, 2013. Loan growth over the last twelve months was due in part to the Bank's enhanced Northern Virginia footprint achieved through the Merger and the George Mason sponsorship, which presented additional opportunities to obtain and expand relationships through attaining a much higher profile in this growing market within our trading area.
The Company sold the indirect consumer loan portfolio acquired in the Merger, amounting to approximately $80.3 million as of the time of sale. The sale of this non-strategic loan class allows the Company to deploy the funds into commercial and commercial real estate loans, its core competency, improve its yield on earning assets and reduce operating expenses. The estimated loss of approximately $900 thousand has been included as an adjustment to the intangibles established in the Merger. The transaction closed on July 24, 2015.
Loan growth in 2015 was predominantly in the income producing—commercial real estate and construction—commercial and residential categories, along with significant percentage increases in the commercial, owner occupied—commercial real estate, and owner occupied commercial real estate
53
construction. Despite an increased level of in-market competition for business, the Bank continued to experience strong organic loan growth across the portfolio, with the largest dollar increase in the income producing property category. Multi-family commercial real estate leasing in the Bank's market area has held up well, particularly for well-located close-in projects, while suburban office leasing softened somewhat. Overall, commercial real estate values have generally held up well with upward price escalation in prime pockets. The housing market has remained stable to increasing, with well-located, Metro accessible properties garnering a premium.
Owner occupied commercial real estate and owner occupied commercial real estate construction loans represent 12% of the loan portfolio. The Bank has a large portion of its loan portfolio related to real estate, with 74% consisting of commercial real estate and real estate construction loans. When owner occupied commercial real estate and owner occupied commercial real estate construction are excluded, the percentage of total loans represented by commercial real estate decreases to 62%. Real estate also serves as collateral for loans made for other purposes, resulting in 79% of loans being secured by real estate.
The following table shows the trends in the composition of the loan portfolio over the past five years.
| |
Years Ended December 31, | ||||||||||||||||||||||||||||||
|---|---|---|---|---|---|---|---|---|---|---|---|---|---|---|---|---|---|---|---|---|---|---|---|---|---|---|---|---|---|---|---|
| |
2015 | 2014 | 2013 | 2012 | 2011 | ||||||||||||||||||||||||||
| (dollars in thousands) |
Amount | % | Amount | % | Amount | % | Amount | % | Amount | % | |||||||||||||||||||||
Commercial |
$ | 1,052,257 | 21 | % | $ | 916,226 | 21 | % | $ | 694,350 | 24 | % | $ | 545,070 | 22 | % | $ | 478,886 | 23 | % | |||||||||||
Income producing—commercial real estate |
2,115,478 | 42 | % | 1,703,172 | 40 | % | 1,119,800 | 38 | % | 914,638 | 37 | % | 756,645 | 37 | % | ||||||||||||||||
Owner occupied—commercial real estate |
498,103 | 10 | % | 461,581 | 11 | % | 317,491 | 11 | % | 297,857 | 12 | % | 250,174 | 12 | % | ||||||||||||||||
Real estate mortgage—residential |
147,365 | 3 | % | 148,018 | 3 | % | 90,418 | 3 | % | 61,871 | 3 | % | 39,552 | 2 | % | ||||||||||||||||
Construction—commercial and residential |
985,607 | 20 | % | 793,432 | 18 | % | 574,167 | 19 | % | 533,722 | 21 | % | 395,267 | 19 | % | ||||||||||||||||
Construction—C&I (owner occupied) |
79,769 | 2 | % | 58,032 | 1 | % | 34,659 | 1 | % | 28,808 | 1 | % | 34,402 | 2 | % | ||||||||||||||||
Home equity |
112,885 | 2 | % | 122,536 | 3 | % | 110,242 | 4 | % | 106,844 | 4 | % | 97,103 | 5 | % | ||||||||||||||||
Other consumer |
6,904 | — | 109,402 | 3 | % | 4,031 | — | 4,285 | — | 4,227 | — | ||||||||||||||||||||
| | | | | | | | | | | | | | | | | | | | | | | | | | | | | | | | |
Total loans |
4,998,368 | 100 | % | 4,312,399 | 100 | % | 2,945,158 | 100 | % | 2,493,095 | 100 | % | 2,056,256 | 100 | % | ||||||||||||||||
| | | | | | | | | | | | | | | | | | | | | | | | | | | | | | | | |
| | | | | | | | | | | | | | | | | | | | | | | | | | | | | | | | |
| | | | | | | | | | | | | | | | | | | | | | | | | | | | | | | | |
Less: Allowance for credit losses |
(52,687 | ) | (46,075 | ) | (40,921 | ) | (37,492 | ) | (29,653 | ) | |||||||||||||||||||||
| | | | | | | | | | | | | | | | | | | | | | | | | | | | | | | | |
Net loans |
$ | 4,945,681 | $ | 4,266,324 | $ | 2,904,237 | $ | 2,455,603 | $ | 2,026,603 | |||||||||||||||||||||
| | | | | | | | | | | | | | | | | | | | | | | | | | | | | | | | |
| | | | | | | | | | | | | | | | | | | | | | | | | | | | | | | | |
| | | | | | | | | | | | | | | | | | | | | | | | | | | | | | | | |
As noted above, a significant portion of the loan portfolio consists of commercial, construction and commercial real estate loans, primarily made in the Washington, D.C. metropolitan area and secured by real estate or other collateral in that market. Although these loans are made to a diversified pool of unrelated borrowers across numerous businesses, adverse developments in the Washington, D.C. metropolitan real estate market could have an adverse impact on this portfolio of loans and the Company's income and financial position. While our basic market area is the Washington, D.C. metropolitan area, the Bank has made loans outside that market area where the nature and quality of such loans was consistent with the Bank's lending policies. At present, the Company believes that commercial real estate values are stable to improving in those sub-markets of the Washington, D.C. metropolitan area in which the Company has significant real estate exposure.
54
The federal banking agencies have issued guidance for those institutions which are deemed to have concentrations in commercial real estate lending. Pursuant to the supervisory criteria contained in the guidance for identifying institutions with a potential commercial real estate concentration risk, institutions which have (1) total reported loans for construction, land development, and other land which represent in total 100% or more of an institution's total risk-based capital; or (2) total commercial real estate loans representing 300% or more of the institutions total risk-based capital and the institution's commercial real estate loan portfolio has increased 50% or more during the prior 36 months are identified as having potential commercial real estate concentration risk. Institutions which are deemed to have concentrations in commercial real estate lending are expected to employ heightened levels of risk management with respect to their commercial real estate portfolios, and may be required to hold higher levels of capital. The Company, like many community banks, has a concentration in commercial real estate loans, and the Company has experienced significant growth in its commercial real estate portfolio in recent years. Commercial real estate loans and construction, land and land development loans represent 441% and 134%, respectively, of total risk based capital. Management has extensive experience in commercial real estate lending, and has implemented and continues to maintain heightened portfolio monitoring and reporting, and strong underwriting criteria with respect to its commercial real estate portfolio. The Company is well capitalized. Nevertheless, the Company could be required to maintain higher levels of capital as a result of our commercial real estate concentration, which could require us to obtain additional capital, and may adversely affect shareholder returns.
At December 31, 2015, the Company had no other concentrations of loans in any one industry exceeding 10% of its total loan portfolio. An industry for this purpose is defined as a group of businesses that are engaged in similar activities and have similar economic characteristics that would cause their ability to meet contractual obligations to be similarly affected by changes in economic or other conditions.
Loan Maturity
The following table sets forth the time to contractual maturity of the loan portfolio as of December 31, 2015.
| |
Due In | |||||||||||||||
|---|---|---|---|---|---|---|---|---|---|---|---|---|---|---|---|---|
| (dollars in thousands) |
Total | One Year or Less |
Over One to Five Years |
Over Five to Ten Years |
Over Ten Years |
|||||||||||
Commercial |
$ | 1,052,257 | $ | 443,953 | $ | 400,922 | $ | 189,743 | $ | 17,639 | ||||||
Income producing—commercial real estate |
2,115,478 | 705,243 | 1,085,685 | 294,513 | 30,037 | |||||||||||
Owner occupied—commercial real estate |
498,103 | 43,398 | 172,045 | 226,290 | 56,370 | |||||||||||
Real estate mortgage—residential |
147,365 | 7,075 | 116,111 | 1,474 | 22,705 | |||||||||||
Construction—commercial and residential |
985,607 | 416,477 | 523,526 | 40,228 | 5,376 | |||||||||||
Construction—C&I (owner occupied) |
79,769 | 4,229 | 9,879 | 56,342 | 9,319 | |||||||||||
Home equity |
112,885 | 1,595 | 15,719 | 52,187 | 43,384 | |||||||||||
Other consumer |
6,904 | 1,691 | 3,977 | 228 | 1,008 | |||||||||||
| | | | | | | | | | | | | | | | | |
Total loans |
$ | 4,998,368 | $ | 1,623,661 | $ | 2,327,864 | $ | 861,005 | $ | 185,838 | ||||||
| | | | | | | | | | | | | | | | | |
| | | | | | | | | | | | | | | | | |
| | | | | | | | | | | | | | | | | |
Loans with: |
||||||||||||||||
Predetermined fixed interest rate |
$ | 1,751,475 | $ | 320,523 | $ | 1,099,292 | $ | 263,296 | $ | 68,364 | ||||||
Floating interest rate |
3,246,893 | 1,303,138 | 1,228,572 | 597,709 | 117,474 | |||||||||||
| | | | | | | | | | | | | | | | | |
Total loans |
$ | 4,998,368 | $ | 1,623,661 | $ | 2,327,864 | $ | 861,005 | $ | 185,838 | ||||||
| | | | | | | | | | | | | | | | | |
| | | | | | | | | | | | | | | | | |
| | | | | | | | | | | | | | | | | |
Loans are shown in the period based on final contractual maturity. Demand loans, having no contractual maturity and overdrafts, are reported as due in one year or less.
55
Allowance for Credit Losses
The provision for credit losses represents the amount of expense charged to current earnings to fund the allowance for credit losses. The amount of the allowance for credit losses is based on many factors which reflect management's assessment of the risk in the loan portfolio. Those factors include economic conditions and trends, the value and adequacy of collateral, volume and mix of the portfolio, performance of the portfolio, and internal loan processes of the Company and Bank.
Management has developed a comprehensive analytical process to monitor the adequacy of the allowance for credit losses. This process and guidelines were developed utilizing, among other factors, the guidance from federal banking regulatory agencies. The results of this process, in combination with conclusions of the Bank's outside loan review consulting firm, support management's assessment as to the adequacy of the allowance at December 31, 2015. During 2015, a provision for credit losses was made in the amount of $14.6 million and net charge-offs amounted to $8.0 million. A full discussion of the accounting for allowance for credit losses is contained in Note 1 to the Consolidated Financial Statements and activity in the allowance for credit losses is contained in Note 5 to the Consolidated Financial Statements. Also, please refer to the discussion under the caption "Critical Accounting Policies" within Management's Discussion and Analysis of Financial Condition and Results of Operation for further discussion of the methodology which management employs to maintain an adequate allowance for credit losses, as well as the discussion under the caption "Provision for Credit Losses."
The allowance for credit losses represented 1.05% of total loans at December 31, 2015 as compared to 1.07% at December 31, 2014. At December 31, 2015, the allowance represented 398% of nonperforming loans as compared to 205% at December 31, 2014. The decline in the ratio of the allowance for loan losses to total loans was due to improved credit quality in the loan portfolio at December 31, 2015 versus December 31, 2014. The increase in the allowance coverage ratio was due in large part to the level of nonperforming loans declining by $9.2 million, or approximately 41%, at December 31, 2015 as compared to December 31, 2014.
As part of its comprehensive loan review process, the Bank's Board of Directors, Directors' Loan Committee or Credit Review Committee carefully evaluate loans which are past due 30 days or more. The Committees make a thorough assessment of the conditions and circumstances surrounding each delinquent loan. The Bank's loan policy requires that loans be placed on nonaccrual if they are 90 days past due, unless they are well secured and in the process of collection. Additionally, Credit Administration specifically analyzes the status of development and construction projects, sales activities and utilization of interest reserves in order to carefully and prudently assess potential increased levels of risk which may require additional reserves.
At December 31, 2015, the Company had $13.2 million of loans classified as nonperforming, and $18.6 million of potential problem loans, as compared to $22.4 million of nonperforming loans and $23.9 million of potential problem loans at December 31, 2014. Please refer to Note 1 to the Consolidated Financial Statements under the caption "Loans" for a discussion of the Company's policy regarding impairment of loans. Please refer to "Nonperforming Assets" at page 58 for a discussion of problem and potential problem assets.
As the loan portfolio and allowance for credit losses review processes continue to evolve, there may be changes to elements of the allowance and this may have an effect on the overall level of the allowance maintained. Historically, the Bank has enjoyed a high quality loan portfolio with relatively low levels of net charge-offs and low delinquency rates. In 2015, the Company witnessed an increased level of net charge-offs in dollars, but as a percentage of average loans the net charge-off ratio remained at 0.17%. The maintenance of a high quality portfolio will continue to be a high priority for both management and the Board of Directors.
56
Management, being aware of the significant loan growth experienced by the Company, is intent on maintaining a strong credit review function and risk rating process. The Company has an experienced Credit Administration function, which provides independent analysis of credit requests and the management of problem credits. The Credit Department has developed and implemented analytical procedures for evaluating credit requests, has refined the Company's risk rating system, and has adopted enhanced monitoring of the loan portfolio (in particular the construction loan portfolio) and the adequacy of the allowance for credit losses, including stress test analyses. Additionally, fair value assessments of loans acquired is made as part of analytical procedures. The loan portfolio analysis process is ongoing and proactive in order to maintain a portfolio of quality credits and to quickly identify any weaknesses before they become more severe.
The following table sets forth activity in the allowance for credit losses for the past five years.
| |
Years Ended December 31, | |||||||||||||||
|---|---|---|---|---|---|---|---|---|---|---|---|---|---|---|---|---|
| (dollars in thousands) |
2015 | 2014 | 2013 | 2012 | 2011 | |||||||||||
Balance at beginning of year |
$ | 46,075 | $ | 40,921 | $ | 37,492 | $ | 29,653 | $ | 24,754 | ||||||
Charge-offs: |
||||||||||||||||
Commercial |
4,693 | 2,634 | 4,275 | 3,481 | 4,310 | |||||||||||
Investment—commercial real estate |
651 | 121 | 602 | 1,189 | 277 | |||||||||||
Owner occupied—commercial real estate |
— | 752 | — | 350 | — | |||||||||||
Real estate mortgage—residential |
— | 138 | — | 300 | 95 | |||||||||||
Construction—commercial and residential |
1,884 | 2,721 | 2,010 | 3,033 | 1,366 | |||||||||||
Construction—C&I (owner occupied) |
— | — | — | — | — | |||||||||||
Home equity |
1,142 | 379 | 89 | 698 | 295 | |||||||||||
Other consumer |
228 | 189 | 63 | 47 | 87 | |||||||||||
| | | | | | | | | | | | | | | | | |
Total charge-offs |
8,598 | 6,934 | 7,039 | 9,098 | 6,430 | |||||||||||
| | | | | | | | | | | | | | | | | |
Recoveries: |
||||||||||||||||
Commercial |
195 | 977 | 161 | 144 | 28 | |||||||||||
Investment—commercial real estate |
26 | 42 | — | 18 | 126 | |||||||||||
Owner occupied—commercial real estate |
3 | 7 | — | — | — | |||||||||||
Real estate mortgage—residential |
7 | — | — | — | 3 | |||||||||||
Construction—commercial and residential |
206 | 83 | 688 | 510 | 183 | |||||||||||
Construction—C&I (owner occupied) |
— | — | — | — | — | |||||||||||
Home equity |
25 | 10 | 11 | 73 | 3 | |||||||||||
Other consumer |
110 | 90 | 6 | 2 | 3 | |||||||||||
| | | | | | | | | | | | | | | | | |
Total recoveries |
572 | 1,209 | 866 | 747 | 346 | |||||||||||
| | | | | | | | | | | | | | | | | |
Net charge-offs |
8,026 | 5,725 | 6,173 | 8,351 | 6,084 | |||||||||||
Provision for Credit Losses |
14,638 | 10,879 | 9,602 | 16,190 | 10,983 | |||||||||||
| | | | | | | | | | | | | | | | | |
Balance at end of year |
$ | 52,687 | $ | 46,075 | $ | 40,921 | $ | 37,492 | $ | 29,653 | ||||||
| | | | | | | | | | | | | | | | | |
| | | | | | | | | | | | | | | | | |
| | | | | | | | | | | | | | | | | |
Ratio of allowance for credit losses to total loans outstanding at year end |
1.05 | % | 1.07 | % | 1.39 | % | 1.50 | % | 1.44 | % | ||||||
Ratio of net charge-offs during the year to average loans outstanding during the year |
0.17 | % | 0.17 | % | 0.23 | % | 0.37 | % | 0.32 | % | ||||||
The following table presents the allocation of the allowance for credit losses by loan category and the percent of loans each category bears to total loans. The allocation of the allowance at December 31, 2015 includes specific reserves of $4.2 million against impaired loans of $25.1 million as compared to specific reserves of $8.1 million against impaired loans of $35.9 million at December 31, 2014. The allocation of the
57
allowance to each category is not necessarily indicative of future losses or charge-offs and does not restrict the usage of the allowance for any specific loan or category.
| |
Years Ended December 31, | ||||||||||||||||||||||||||||||
|---|---|---|---|---|---|---|---|---|---|---|---|---|---|---|---|---|---|---|---|---|---|---|---|---|---|---|---|---|---|---|---|
| |
2015 | 2014 | 2013 | 2012 | 2011 | ||||||||||||||||||||||||||
| (dollars in thousands) |
Amount | %(1) | Amount | %(1) | Amount | %(1) | Amount | %(1) | Amount | %(1) | |||||||||||||||||||||
Commercial |
$ | 11,563 | 21 | % | $ | 13,222 | 21 | % | $ | 9,780 | 24 | % | $ | 9,412 | 22 | % | $ | 9,609 | 23 | % | |||||||||||
Income producing—commercial real estate |
14,122 | 42 | % | 11,442 | 40 | % | 10,359 | 38 | % | 9,148 | 37 | % | 7,304 | 37 | % | ||||||||||||||||
Owner occupied—commercial real estate |
3,279 | 10 | % | 2,954 | 11 | % | 3,899 | 11 | % | 2,781 | 12 | % | 1,898 | 12 | % | ||||||||||||||||
Real estate mortgage—residential |
1,268 | 3 | % | 1,259 | 3 | % | 944 | 3 | % | 659 | 3 | % | 399 | 2 | % | ||||||||||||||||
Construction—commercial and residential |
20,133 | 20 | % | 14,982 | 18 | % | 13,422 | 19 | % | 12,671 | 21 | % | 7,862 | 19 | % | ||||||||||||||||
Construction—C&I (owner occupied) |
955 | 2 | % | 643 | 1 | % | 512 | 1 | % | 720 | 1 | % | 684 | 2 | % | ||||||||||||||||
Home equity |
1,292 | 2 | % | 1,469 | 3 | % | 1,871 | 4 | % | 1,730 | 4 | % | 1,528 | 5 | % | ||||||||||||||||
Other consumer |
75 | — | 104 | 3 | % | 134 | — | 371 | — | 369 | — | ||||||||||||||||||||
| | | | | | | | | | | | | | | | | | | | | | | | | | | | | | | | |
Total allowance for credit losses |
$ | 52,687 | 100 | % | $ | 46,075 | 100 | % | $ | 40,921 | 100 | % | $ | 37,492 | 100 | % | $ | 29,653 | 100 | % | |||||||||||
| | | | | | | | | | | | | | | | | | | | | | | | | | | | | | | | |
| | | | | | | | | | | | | | | | | | | | | | | | | | | | | | | | |
| | | | | | | | | | | | | | | | | | | | | | | | | | | | | | | | |
- (1)
- Represents the percent of loans in each category to total loans.
Nonperforming Assets
As shown in the table below, the Company's nonperforming assets, which are comprised of loans delinquent 90 days or more, nonaccrual loans, restructured loans and OREO, totaled $19.1 million at December 31, 2015, representing 0.31% of total assets, as compared to $35.7 million at December 31, 2014, representing 0.68% of total assets. The Company has been highly proactive in addressing existing and potential problem loans resulting from a weaker economy. Management remains attentive to early signs of deterioration in borrowers' financial conditions and to taking the appropriate action to mitigate risk. Furthermore, the Company is diligent in placing loans on nonaccrual status and believes, based on its loan portfolio risk analysis, that its allowance for loan losses at 1.05% of total loans at December 31, 2015, is adequate to absorb potential credit losses in the loan portfolio at that date.
Included in nonperforming assets at December 31, 2015 is OREO of $5.9 million, consisting of eight foreclosed properties. The Company had ten OREO properties with a net carrying value of $13.2 million at December 31, 2014. OREO properties are carried at fair value less estimated costs to sell. It is the Company's policy to obtain third party appraisals prior to foreclosure, and to obtain updated third party appraisals on OREO properties not less frequently than annually. Generally, the Company would obtain updated appraisals or evaluations where it has reason to believe, based upon market indications (such as comparable sales, legitimate offers below carrying value, broker indications and similar factors), that the current appraisal does not accurately reflect current value. During the year of 2015, the Company sold five foreclosed properties with a net carrying value of $5.8 million, recording a net loss on sale of $328 thousand.
Included in nonperforming assets are loans that we consider impaired. Impaired loans are defined as those which we believe it is probable that we will not collect all amounts due according to the contractual terms of the loan agreement, as well as that portion of loans whose terms have been modified in a troubled debt restructuring ("TDR") which have not shown a period of performance as required under applicable accounting standards. Valuation allowances for those loans determined to be impaired are evaluated in accordance with ASC Topic 310—"Receivables," and updated quarterly. For collateral dependent impaired loans, the carrying amount of the loan is determined by current appraised value less estimated costs to sell the underlying collateral, which may be adjusted downward under certain circumstances for actual events and/or changes in market conditions. For example, current average actual selling prices less average actual
58
closing costs on an impaired multi-unit real estate project may indicate the need for an adjustment in the appraised valuation of the project, which in turn could increase the associated ASC Topic 310 specific reserve for the loan. Generally, all appraisals associated with impaired loans are updated on a not less than annual basis.
Loans are considered to have been modified in a TDR when, due to a borrower's financial difficulties, the Company makes unilateral concessions to the borrower that it would not otherwise consider. Concessions could include interest rate reductions, principal or interest forgiveness, forbearance, and other actions intended to minimize economic loss and to avoid foreclosure or repossession of collateral. Alternatively, management, from time-to-time and in the ordinary course of business, implements renewals, modifications, extensions, and/or changes in terms of loans to borrowers who have the ability to repay on reasonable market-based terms, as circumstances may warrant. Such modifications are not considered to be TDRs as the accommodation of a borrower's request does not rise to the level of a concession and/or the borrower is not experiencing financial difficulty; for example, (1) adverse weather conditions may create a short term cash flow issue for an otherwise profitable retail business which suggests a temporary interest only period on an amortizing loan; (2) there may be delays in absorption on a real estate project which reasonably suggests extension of the loan maturity at market terms; or (3) there may be maturing loans to borrowers with demonstrated repayment ability who are not in a position at the time of maturity to obtain alternate long-term financing. The most common change in terms provided by the Company is an extension of an interest only term. The determination of whether a restructured loan is a TDR requires consideration of all of the facts and circumstances surrounding the change in terms, and the exercise of prudent business judgment. The Company had eight TDRs at December 31, 2015 totaling approximately $12.1 million, as compared to six TDRs totaling approximately $13.7 million at December 31, 2014. At December 31, 2015, seven of these TDR loans, totaling approximately $11.8 million, are performing under the modified terms. During 2015, there were four loans modified in a TDR totaling approximately $1.9 million, and two performing TDR loans aggregating approximately $3.3 million were paid off and removed from TDR status. There were four loans totaling approximately $8.0 million modified in a TDR during the year ended December 31, 2014. During the year ended December 31, 2015, there were no defaults on restructured loans, as compared to the year ended December 31, 2014, which had eight performing TDR loans totaling approximately $11.6 million that experienced defaults on their modified terms. During 2014, these eight previously performing TDRs were reclassified as follows: (a) four nonperforming TDRs totaling $9.1 million were sold during the year; (b) one nonperforming TDR totaling approximately $2.0 million was reclassified to OREO after the Company took possession of the underlying collateral; (c) the Company was paid off on another TDR totaling $217 thousand; (d) one TDR totaling $227 thousand was reclassified to nonperforming loans; (e) and one TDR totaling $95 thousand was charged-off. A default is considered to have occurred once the TDR is past due 90 days or more, or it has been placed on nonaccrual. There were no nonperforming TDRs reclassified to nonperforming loans during the year ended December 31, 2015. Commercial and consumer loans modified in a TDR are closely monitored for delinquency as an early indicator of possible future default. If loans modified in a TDR subsequently default, the Company evaluates the loan for possible further impairment. The allowance may be increased, adjustments may be made in the allocation of the allowance, or partial charge-offs may be taken to further write-down the carrying value of the loan. Refer to Note 5 "Loans and Allowance for Credit Losses" under the caption "modifications" for additional detail.
Total nonperforming loans amounted to $13.2 million at December 31, 2015, representing 0.26% of total loans, compared to $22.4 million at December 31, 2014, representing 0.52% of total loans. Nonperforming loans decreased by $9.2 million at December 31, 2015 as compared to 2014, and the ratio of nonperforming loans to total loans decreased due to both a decline in nonperforming loans and an increase in the loan portfolio in 2015.
59
The following table shows the amounts and relevant ratios of nonperforming assets at December 31, for the past five years:
(dollars in thousands)
|
2015 | 2014 | 2013 | 2012 | 2011 | |||||||||||
|---|---|---|---|---|---|---|---|---|---|---|---|---|---|---|---|---|
Nonaccrual Loans: |
||||||||||||||||
Commercial |
$ | 4,940 | $ | 12,975 | $ | 6,779 | $ | 4,799 | $ | 5,718 | ||||||
Income producing—commercial real estate |
5,961 | 2,645 | 2,525 | 3,458 | 7,662 | |||||||||||
Owner occupied—commercial real estate |
1,268 | 1,324 | 5,452 | 2,578 | 282 | |||||||||||
Real estate mortgage—residential |
329 | 346 | 887 | 699 | 1,041 | |||||||||||
Construction—commercial and residential |
557 | 3,697 | 8,366 | 18,594 | 17,459 | |||||||||||
Construction—C&I (owner occupied) |
— | — | — | — | — | |||||||||||
Home equity |
161 | 1,398 | 623 | 513 | 624 | |||||||||||
Other consumer |
23 | 58 | 70 | 43 | 8 | |||||||||||
Accrual loans-past due 90 days |
— | — | — | — | — | |||||||||||
| | | | | | | | | | | | | | | | | |
Total nonperforming loans(1) |
13,239 | 22,443 | 24,702 | 30,684 | 32,794 | |||||||||||
| | | | | | | | | | | | | | | | | |
Other real estate owned |
5,852 | 13,224 | 9,225 | 5,299 | 3,225 | |||||||||||
| | | | | | | | | | | | | | | | | |
Total nonperforming assets |
$ | 19,091 | $ | 35,667 | $ | 33,927 | $ | 35,983 | $ | 36,019 | ||||||
| | | | | | | | | | | | | | | | | |
| | | | | | | | | | | | | | | | | |
| | | | | | | | | | | | | | | | | |
Coverage ratio, allowance for credit losses to total nonperforming loans |
397.95 | % | 205.30 | % | 165.66 | % | 122.19 | % | 90.42 | % | ||||||
Ratio of nonperforming loans to total loans |
0.26 | % | 0.52 | % | 0.84 | % | 1.23 | % | 1.59 | % | ||||||
Ratio of nonperforming assets to total assets |
0.31 | % | 0.68 | % | 0.90 | % | 1.06 | % | 1.27 | % | ||||||
- (1)
- As
of December 31, 2015, nonaccrual loans reported in the table above included one loan totaling approximately $211 thousand that migrated
from performing "troubled debt restructurings" during 2014.
- (2)
- Gross interest income of $1.0 million would have been recorded in 2015 if nonaccrual loans shown above had been current and in accordance with their original terms, while interest actually recorded on such loans was $629 thousand. See Note 1 to the Consolidated Financial Statements for a description of the Company's policy for placing loans on nonaccrual status.
Significant variation in the amount of nonperforming loans may occur from period to period because the amount of nonperforming loans depends largely on the condition of a relatively small number of individual credits and borrowers relative to the total loan portfolio.
At December 31, 2015, there were $18.6 million of performing loans considered potential problem loans, defined as loans which are not included in the 90 days past due, nonaccrual or restructured categories, but for which known information about possible credit problems causes management to be uncertain as to the ability of the borrowers to comply with the present loan repayment terms which may in the future result in disclosure in the past due, nonaccrual or restructured loan categories. The $18.6 million in potential problem loans at December 31, 2015, compared to $23.9 million at December 31, 2014. The balance of potential problem loans at December 31, 2015 included $14.8 million of loans that were considered potential problem loans at December 31, 2014. The Company has taken a conservative posture with respect to risk rating its loan portfolio. Based upon their status as potential problem loans, these loans receive heightened scrutiny and ongoing intensive risk management. Additionally, the Company's loan loss allowance methodology incorporates increased reserve factors for certain loans considered potential problem loans as compared to the general portfolio. See "Allowance for Credit Losses" on page 56 for a description of the allowance methodology.
60
Other Earning Assets
Residential mortgage loans held for sale amounted to $47.5 million at December 31, 2015 compared to $44.3 million at December 31, 2014. The Company's general practice is to originate and sell such loans only on a "servicing released" basis in order to enhance noninterest income. See "Business" at page 1 for a description of the Bank's mortgage lending and brokerage activities.
BOLI is utilized by the Company in accordance with income tax regulations as part of the Company's financing of its benefit programs. At December 31, 2015, this asset amounted to $58.7 million as compared to $56.6 million at December 31, 2014, which reflected an increase in cash surrender values. Refer to Note 19 of Notes to Consolidated Financial Statements.
Intangible Assets
The Company recognizes a servicing asset for the computed value of servicing fees on the sale of the guaranteed portion of SBA loans, which is in excess of a normal servicing fee. Assumptions related to loan term and amortization are made to arrive at the initial recorded value, which is included in intangible assets, net, on the Consolidated Balance Sheet.
For 2015, excess servicing fees of $379 thousand were recorded, and $274 thousand was amortized as a reduction of actual service fees collected, which is a component of other income. At December 31, 2015, the balance of excess servicing fees was $387 thousand. For 2014, excess servicing fees of $330 thousand were recorded, of which $282 thousand was amortized as a reduction of actual service fees collected, which is a component of other income. At December 31, 2014, the balance of excess servicing fees was $282 thousand.
In connection with the acquisitions of Fidelity & Trust Financial Corporation ("Fidelity") in 2008 and Virginia Heritage in 2014, the Company allocated a portion of the purchase price to core deposit intangibles, based upon an independent evaluation, and which is included in intangible assets, on the Consolidated Balance Sheets. The initial amount recorded for the Fidelity acquisition was $2.3 million. The amount of the core deposit intangible relating to the Fidelity acquisition at December 31, 2015 was $502 thousand, which is being amortized over its remaining economic life through 2018 as a component of other noninterest expense. The amount of the core deposit intangible relating to the Virginia Heritage acquisition at December 31, 2015 was $3.5 million, which is being amortized over its remaining economic life through 2020 as a component of other noninterest expense. The amounts amortized for core deposit intangibles in 2015 and 2014 were $1.2 million and $461 thousand, respectively. The unamortized assets at December 31, 2015 and 2014 were $4.0 million and $5.2 million, respectively.
The Company recorded an unidentified intangible asset (goodwill) incident to the acquisition of Fidelity of $2.2 million. The Company recorded an initial amount of unidentified intangible (goodwill) incident to the acquisition of Virginia Heritage of approximately $102 million. The Company's testing of potential goodwill impairment (which is required annually), has resulted in no impairment being recorded. Based on allowable adjustments through October 31, 2015, the unidentified intangible (goodwill) was reduced by $257 thousand.
Deposits and Other Borrowings
The principal sources of funds for the Bank are core deposits, consisting of demand deposits, NOW accounts, money market accounts and savings accounts. Additionally, the Bank obtains certificates of deposits from the local market areas surrounding the Bank's offices. The deposit base includes transaction accounts, time and savings accounts and accounts which customers use for cash management and which provide the Bank with a source of fee income and cross-marketing opportunities, as well as an attractive source of lower cost funds. To meet funding needs during periods of high loan demand and seasonal variations in core deposits, the Bank utilizes alternative funding sources such as secured borrowings from
61
the FHLB, federal funds purchased lines of credit from correspondent banks and brokered deposits from regional and national brokerage firms and Promontory.
For the twelve months ended December 31, 2015, total deposits increased by $847 million or 20%. Noninterest bearing deposits increased $229 million or 20% to $1.4 billion, as compared to $1.2 billion at December 31, 2014, while interest bearing deposits increased by $618 million or 20%. Within interest bearing deposits, money market and savings accounts collectively amounted to $2.8 billion at December 31, 2015 or 55% of total deposits, as compared to $2.3 billion, or 53% of total deposits, at December 31, 2014, an increase of $533 million, or 23%.
Average total deposits for the year ended December 31, 2015 were $4.70 billion, as compared to $3.51 billion for the same period in 2014, a 34% increase. The higher average deposit growth as compared to period end growth was attributed to the Merger completed October 31, 2014.
Approximately 14% of the Bank's deposits at December 31, 2015 ($739 million) were time deposits, which are generally the most expensive form of deposit because of their fixed rate and term, as compared to 16% at December 31, 2014 ($689 million). Growth in time deposits was derived primarily from a CD special offer in the second quarter of 2015 which raised $50 million.
The following table sets forth the maturities of time deposits with balances of $100 thousand or more, which represent 8% and 9% of total deposits as of December 31, 2015 and 2014, respectively. See Note 11 to the Consolidated Financial Statements for additional information regarding the maturities of time deposits and the Average Balances Table at page 47 for the average rates paid on interest-bearing deposits. Time deposits of $100 thousand or more can be more volatile and more expensive than time deposits of less than $100 thousand. However, because the Bank focuses on relationship banking, and its marketplace demographics are favorable, its historical experience has been that large time deposits have not been more volatile or significantly more expensive than smaller denomination certificates.
| |
Years Ended December 31, | |||||||||
|---|---|---|---|---|---|---|---|---|---|---|
| (dollars in thousands) |
2015 | 2014 | 2013 | |||||||
Three months or less |
$ | 64,703 | $ | 75,256 | $ | 68,710 | ||||
More than three months through six months |
78,795 | 60,923 | 66,240 | |||||||
More than six months through twelve months |
145,184 | 116,218 | 41,384 | |||||||
Over twelve months |
117,888 | 140,735 | 27,372 | |||||||
| | | | | | | | | | | |
Total |
$ | 406,570 | $ | 393,132 | $ | 203,706 | ||||
| | | | | | | | | | | |
| | | | | | | | | | | |
| | | | | | | | | | | |
As of December 31, 2015 and December 31, 2014, time deposit accounts in excess of $250 thousand totaled $180.1 million and $138.6, respectively.
When appropriate in order to fund strong loan demand, the Bank accepts brokered time deposits, generally in denominations of less than $100 thousand, from a regional brokerage firm, and other national brokerage networks, including Promontory. The Bank participates in the CDARS and the ICS programs offered by Promontory, which provides for reciprocal ("two-way") transactions among banks facilitated by Promontory for the purpose of maximizing FDIC insurance. These reciprocal CDARS and ICS funds are broadly classified as brokered deposits, although the federal banking agencies have recognized that these reciprocal deposits have many characteristics of core deposits, and therefore provide for separate identification of such deposits in quarterly Call Report data. The total of reciprocal deposits at December 31, 2015 was $611.8 million (12% of total deposits) versus $391.3 million at December 31, 2014 (9% of total deposits). The Bank also is able to obtain one way CDARS deposits and participates in Promontory's Insured Network Deposit ("IND"). The Bank had $236.4 million and $246.9 million of IND brokered deposits as of December 31, 2015 and 2014, respectively.
At December 31, 2015, total deposits included $597.5 million of brokered deposits (excluding the CDARS and ICS two-way noted above), which represented 12% of total deposits. At December 31, 2014, total time deposits (excluding the CDARS and ICS two-way) included $506.5 million of brokered deposits,
62
which represented 12% of total deposits. These sources are believed by the Company to represent a reliable and cost efficient alternative funding source for the Bank.
At December 31, 2015, the Company had $1.41 billion in noninterest bearing demand deposits, representing 27% of total deposits. This compared to $1.18 billion of these deposits at December 31, 2014 or 27% of total deposits. These deposits are primarily business checking accounts. Since July 2011, banks are no longer prohibited from paying interest on demand deposits account, including those from businesses. To date, the Bank has elected not to pay interest on business checking accounts, nor is the payment of such interest a prevalent practice in the Bank's market area at present. It is not clear over the long-term what effect the elimination of this prohibition will have on the Bank's interest expense, allocation of deposits, deposit pricing, loan pricing, net interest margin, ability to compete, ability to establish and maintain customer relationships, or profitability. The Bank is prepared to evaluate options in this area should competition intensify for these deposits, which is not occurring at this time. Payment of interest on these deposits could have a significant negative impact on the Company's net interest income and net interest margin, net income, and the return on assets and equity, although no such effect is currently anticipated.
As an enhancement to the basic noninterest bearing demand deposit account, the Company offers a sweep account, or "customer repurchase agreement," allowing qualifying businesses to earn interest on short-term excess funds, which are not suited for either a certificate of deposit or a money market account. The balances in these accounts were $72.4 million at December 31, 2015 compared to $61.1 million at December 31, 2014. Customer repurchase agreements are not deposits and are not insured by the FDIC, but are collateralized by U.S. agency securities or U.S. agency mortgage backed securities. These accounts are particularly suitable to businesses with significant fluctuation in the levels of cash flows. Attorney and title company escrow accounts are an example of accounts which can benefit from this product, as are customers who may require collateral for deposits in excess of FDIC insurance limits but do not qualify for other pledging arrangements. This program requires the Company to maintain sufficient investment securities for pledging purposes to accommodate the fluctuations in balances which may occur in these customer repurchase agreement accounts.
The Company had no outstanding balances under its federal funds lines of credit provided by correspondent banks at December 31, 2015 and 2014, respectively. At December 31, 2015, the Bank had no borrowings outstanding under its credit facility from the FHLB as compared to $140 million at December 31, 2014. Outstanding FHLB advances are secured by collateral consisting of a blanket lien on qualifying loans in the Bank's commercial mortgage, residential mortgage and home equity loan portfolios.
The Company has a credit facility with a regional bank, secured by a portion of the stock of the Bank, pursuant to which the Company may borrow, on a revolving basis, up to $50 million for working capital purposes, to finance capital contributions to the Bank and ECV. There were no amounts outstanding under this credit at December 31, 2015 or 2014.
Please refer to "Liquidity Management" at page 70, and Note 12 to the Consolidated Financial Statements for additional information regarding the Company's short and long-term borrowings.
COMPARISON OF THE YEARS ENDED DECEMBER 31, 2014 AND 2013
For the year ended December 31, 2014, the Company's net income was $54.3 million ($57.7 million on an operating basis), a 15% increase (23% on an operating basis) over the $47.0 million for the year ended December 31, 2013. Net income available to common shareholders was $53.6 million ($57.1 million on an operating basis) as compared to $46.4 million for 2013, a 16% increase (23% on an operating basis).
Net income per basic and diluted common share for the year ended December 31, 2014 was $2.01 and $1.95, respectively ($2.14 per basic common share and $2.08 per diluted common share on an operating basis), as compared to $1.81 per basic common share and $1.76 per diluted common share for 2013, an 11% increase per basic and diluted share (18% on an operating basis per basic and diluted share).
63
For the year ended December 31, 2014, the Company reported a ROAA of 1.31% (1.40% on an operating basis) as compared to 1.37% for the year ended December 31, 2013, while the ROACE was 13.50% (14.38% on an operating basis), as compared to 14.60% for the year ended December 31, 2013.
The Company's earnings are largely dependent on net interest income, the difference between interest income and interest expense, which represented 91% and 85% of total revenue (defined as net interest income plus noninterest income) for the full year in 2014 and 2013, respectively.
The net interest margin, which measures the difference between interest income and interest expense (i.e. net interest income) as a percentage of earning assets, increased 14 basis points from 4.30% for the year ended December 31, 2013 to 4.44% for the year ended December 31, 2014. For 2014, the Company maintained its loan portfolio yields relatively close to 2013 levels (5.37% versus 5.51%) due to disciplined loan pricing practices, and reduced its cost of funds (0.33% versus 0.37%), while maintaining a favorable deposit mix, largely resulting from ongoing efforts to increase and expand client relationships. Average earning assets yields were higher by 10 basis points (4.77% versus 4.67%). This increase in average earning asset yields compares to a decline of 7 basis points (from 0.56% to 0.49%) in the cost of interest bearing liabilities. A higher mix of average loans as a percentage of total earning assets (from 79% to 84%) and lower average liquidity during the year ended December 31, 2014, as compared to the same period in 2013, were the primary contributors to the increase in average earning asset yields in 2014 versus 2013. The net interest spread increased by 17 basis points for the year ended December 31, 2014 (4.28% versus 4.11%) as compared to 2013, as the Company has managed its cost of funds aggressively and been extremely disciplined in setting new loan rates. The benefit of noninterest sources funding earning assets declined by 3 basis points to 16 basis points from 19 basis points for the years ended December 31, 2014 and 2013, respectively. The combination of a 17 basis point increase in the net interest spread and a 3 basis point decline in the value of noninterest sources resulted in the 14 basis point increase in the net interest margin for the year ended December 31, 2014 as compared to the same period in 2013.
The Company believes it effectively managed its net interest margin and net interest income during 2014 as market interest rates (on average) have remained relatively low. This factor has been significant to overall earnings performance during 2014 as net interest income (at 91%) represents the most significant component of the Company's revenues.
In order to fund growth in average loans of 24% for the year ended December 31, 2014 as compared to the same period in 2013, as well as sustain significant liquidity, the Company has relied primarily upon core deposit growth, while decreasing the levels of brokered and wholesale deposits as compared to total deposits. The major component of the growth in core deposits has been growth in money market accounts and noninterest bearing deposits primarily as a result of effectively building new and enhanced client relationships. Average growth of total deposits was 21% for the year of 2014 as compared to the same period in 2013.
In terms of the average balance sheet composition or mix, loans, which generally have higher yields than securities and other earning assets, increased from 79% of average earning assets for the year ended December 31, 2013, to 84% of average earning assets for the year ended December 31, 2014. The lower growth of average funding sources as compared to loans has reduced average liquidity to the balance sheet for 2014 as compared to 2013 ($208 million as compared to $280 million). For the year ended December 31, 2014, as compared to the same period in 2013, average loans, excluding loans held for sale, increased $717 million, a 27% increase. The increase in average loans for 2014 as compared to 2013 was primarily attributable to growth in commercial real estate loans and commercial loans. Increases in average deposits for the year of 2014, as compared to the year of 2013, is attributable to growth in money market accounts and noninterest bearing deposits. Average investment securities for the year ended December 31, 2014 and 2013 amounted to 10% of average earning assets. The combination of federal funds sold, interest bearing deposits with other banks and loans held for sale averaged 6% of average earning assets for 2014 as compared to 11% for 2013.
64
At December 31, 2014, the allowance for credit losses represented 1.07% of loans outstanding, as compared to 1.39% at December 31, 2013. The decrease in the allowance for credit losses as a percentage of total loans at December 31, 2014, as compared to December 31, 2013 was due to accounting for the loans acquired from Virginia Heritage at fair value. The acquired loans with a credit mark will not have any allowance component attributed against them, except to the extent of future deterioration, if any. The initial credit mark recorded in connection with the Merger was 1.59% of loans acquired, or approximately $12.8 million, which represents expected lifetime losses on the acquired loan portfolio. The allowance for credit losses was 205% of nonperforming loans at December 31, 2014, as compared to 166% at December 31, 2013.
Total noninterest income for the year ended December 31, 2014 decreased to $18.3 million from $24.7 million for the year ended December 31, 2013, a 26% decrease. This decrease was primarily due to a decline of $6.9 million in gains on the sale of residential mortgage loans due to lower origination and sales volume, and a decrease of $791 thousand in income from sales of SBA loans. This decrease was partially offset by an increase of $299 thousand in service charges on deposits and an increase in income of $563 thousand from BOLI. There were $22 thousand of investment securities gains recorded for the year of 2014, as compared to $19 thousand of investment securities gains for the year of 2013.
Total noninterest expenses for the year ended December 31, 2014 were $99.7 million ($95.0 million on an operating basis) compared to $84.6 million for the same period in 2013, an 18% increase (12% on an operating basis). Salaries and employee benefits were $57.3 million for the year ended December 31, 2014, as compared to $47.5 million for the same period in 2013, a 21% increase. Cost increases for salaries and benefits for the year were due primarily to increased staff from the Merger, merit increases, employee benefit expense increases and incentive compensation. At December 31, 2014, the Company's staff numbered 427, as compared to 386 at December 31, 2013. Premises and equipment expenses amounted to $13.3 million for the year ended December 31, 2014 as compared to $11.9 million for the same period in 2013, a 12% increase. For the year, premises and equipment expenses were higher due to costs of additional branches and office space acquired in the Merger and to increases in leasing costs. Marketing and advertising expenses increased from $1.7 million for the year ended December 31, 2013 to $2.0 million for 2014, an increase of 19%. The primary reason for the increase was more expansive third party marketing support from a new full-service marketing agency. The scope of the services has also expanded to include the redesign of the Bank's website and various social media platforms. Data processing expenses increased from $5.9 million for the year ended December 31, 2013 to $6.2 million for 2014, an increase of 4%. The increase in expense for the year ended December 31, 2014 as compared to the same periods in 2013 was due to increases associated with the Merger and higher network expenses. Legal, accounting and professional fees were $3.4 million for the year ended December 31, 2014, as compared to $3.0 million for 2013, an increase of 16%. The increase for the year ended December 31, 2014 as compared to the same periods in 2013 was primarily due to increases in professional and consulting fees and collection costs related to problem loans. FDIC insurance premiums increased $70 thousand to $2.3 million for the year ended December 31, 2014, an increase of 3% compared to 2013 due to average asset growth. Other expenses decreased to $10.5 million for the year ended December 31, 2014 from $12.4 million for the same period in 2013, a decrease of 15%. The major components of cost in this category include insurance expenses, deposit fees, director fees, OREO expenses and Virginia franchise taxes.
The Company recorded income tax expense of $32.0 million in 2014 compared to $28.3 million in 2013, resulting in an effective tax rate of 37.1% and 37.6%, respectively. The lower effective tax rate for 2014 reflects a higher level of tax exempt income.
At December 31, 2014, total assets were $5.25 billion, compared to $3.77 billion at December 31, 2013, a 39% increase. Total loans (excluding loans held for sale) were $4.31 billion at December 31, 2014 compared to $2.95 billion at December 31, 2013, a 46% increase. Total deposits were $4.31 billion at December 31, 2014, compared to deposits of $3.23 billion at December 31, 2013, a 34% increase. Such increases were primarily due to the Merger, complemented by organic growth. Loans held for sale
65
amounted to $44.3 million at December 31, 2014 as compared to $42.0 million at December 31, 2013, a 5% increase.
The investment portfolio totaled $382.3 million at December 31, 2014, a 1% increase from the $378.1 million balance at December 31, 2013. Total borrowed funds (excluding customer repurchase agreements) were $219.3 million at December 31, 2014 as compared to $39.3 million at December 31, 2013, a 458% increase. Included in the increase in borrowed funds at December 31, 2014 is the issuance of $70 million of ten-year non-callable 5.75% subordinated notes in August 2014. The subordinated notes qualify as Tier 2 capital for regulatory purposes at the Company.
Total shareholders' equity increased to $620.8 million at December 31, 2014, compared to $393.9 million at December 31, 2013, respectively, primarily due to growth from earnings and the issuance of 4,010,261 shares of common stock in the Merger. The ratio of common equity to total assets was 10.46% at December 31, 2014 as compared to 8.94% at December 31, 2013. The Company's capital position remains substantially in excess of regulatory requirements for well capitalized status, with a total risk based capital ratio of 12.97% at December 31, 2014, as compared to a total risk based capital ratio of 13.01% at December 31, 2013. In addition, the tangible common equity ratio (tangible common equity to tangible assets) was 8.54% at December 31, 2014, compared to 8.86% at December 31, 2013.
At December 31, 2014, the investment portfolio amounted to $382.3 million as compared to $378.1 million at December 31, 2013, an increase of 1%. The investment portfolio is managed to achieve goals related to liquidity, income, interest rate risk management and to provide collateral for customer repurchase agreements and other borrowing relationships.
Federal funds sold amounted to $3.5 million at December 31, 2014 as compared to $5.7 million at December 31, 2013. These funds represent excess daily liquidity which is invested on an unsecured basis with well capitalized banks, in amounts generally limited both in the aggregate and to any one bank.
Interest bearing deposits with banks and other short-term investments amounted to $243.4 million at December 31, 2014 as compared to $291.7 million at December 31, 2013. These overnight funds represent daily liquidity held at the Federal Reserve to meet future loan demand, to fund future increases in investment securities and to meet other general liquidity needs of the Company.
Loan growth during 2014 has been favorable, with loans outstanding reaching $4.31 billion at December 31, 2014, an increase of $1.37 billion or 46% as compared to $2.95 billion at December 31, 2013. The acquisition of Virginia Heritage contributed approximately $800 million in loans in 2014, while the remaining increase of approximately $569 million (19%) was due to organic growth. The loan growth in 2014 was predominantly in the commercial and investment commercial real estate categories, along with significant percentage increases in the owner occupied commercial real estate construction and other consumer. Despite an increased level of in-market competition for business, the Bank continued to experience strong organic loan growth across the portfolio, with the largest dollar increase in the income producing property segment. Additionally, the portfolio increased approximately $800 million in the fourth quarter as a result of completion of the Merger.
At December 31, 2014, the Company had $22.4 million of loans classified as nonperforming, and $23.9 million of potential problem loans, as compared to $24.7 million of nonperforming loans and $10.7 million of potential problem loans at December 31, 2013.
Included in nonperforming assets at December 31, 2014 is OREO of $13.2 million, consisting of ten foreclosed properties. The Company had seven OREO properties with a net carrying value of $9.2 million at December 31, 2013. OREO properties are carried at fair value less estimated costs to sell. It is the Company's policy to obtain third party appraisals prior to foreclosure, and to obtain updated third party appraisals on OREO properties not less frequently than annually. Generally, the Company would obtain updated appraisals or evaluations where it has reason to believe, based upon market indications (such as comparable sales, legitimate offers below carrying value, broker indications and similar factors), that the current appraisal does not accurately reflect current value. During the year of 2014, the Company sold five
66
foreclosed properties with a net carrying value of $616 thousand, recording a net loss on sale of $154 thousand.
Residential mortgage loans held for sale amounted to $44.3 million at December 31, 2014 compared to $42.0 million at December 31, 2013. The increase in loans held for sale in 2014 was effectively due to a decline in market interest rates during the last half of the year, which increased the level of home purchases and refinancing activity.
BOLI is utilized by the Company in accordance with income tax regulations as part of the Company's financing of its benefit programs. At December 31, 2014, this asset amounted to $56.6 million as compared to $39.7 million at December 31, 2013, which reflected an increase in cash surrender values and acquisition of $15.8 million of BOLI in the Merger.
For the twelve months ended December 31, 2014, noninterest bearing deposits increased $326 million or 38% to $1.2 billion, as compared to $849 million at December 31, 2013, while interest bearing deposits increased by $759 million or 32% during the same period. Within interest bearing deposits, money market and savings accounts collectively amounted to $2.3 billion at December 31, 2014 or 53% of total deposits, as compared to $1.8 billion, or 56% of total deposits, at December 31, 2013, a 27% increase. The acquisition of Virginia Heritage contributed approximately $645 million in deposits in 2014, while the remaining increase of approximately $440 million (14%) was due to organic growth.
At December 31, 2014, the Company had $1.18 billion in noninterest bearing demand deposits, representing 27% of total deposits. This compared to $849.4 million of these deposits at December 31, 2013 or 26% of total deposits. These deposits are primarily business checking accounts.
The Company had no outstanding balances under its federal funds lines of credit provided by correspondent banks at December 31, 2014 and 2013, respectively. At December 31, 2014, the Bank had $140 million of borrowings outstanding under its credit facility from the FHLB as compared to $30 million at December 31, 2013. The increased borrowings were taken on to support the Bank's liquidity position and provide additional support for loan fundings. Outstanding FHLB advances are secured by collateral consisting of a blanket lien on qualifying loans in the Bank's commercial mortgage, residential mortgage and home equity loan portfolios.
The Company has a credit facility with a regional bank, secured by a portion of the stock of the Bank, pursuant to which the Company may borrow, on a revolving basis, up to $50 million for working capital purposes, to finance capital contributions to the Bank and ECV. There were no amounts outstanding under this credit at December 31, 2014 or 2013.
CONTRACTUAL OBLIGATIONS
The Company has various financial obligations, including contractual obligations and commitments that may require future cash payments. Except for its loan commitments, as shown in Note 20 to the Consolidated Financial Statements, the following table shows details on these fixed and determinable obligations as of December 31, 2015 in the time period indicated.
(dollars in thousands)
|
Within One Year |
One to Three Years |
Three to Five Years |
Over Five Years |
Total | |||||||||||
|---|---|---|---|---|---|---|---|---|---|---|---|---|---|---|---|---|
Deposits without a stated maturity(1) |
$ | 4,419,189 | $ | — | $ | — | $ | — | $ | 4,419,189 | ||||||
Time deposits(1) |
446,956 | 272,551 | 19,748 | — | 739,255 | |||||||||||
Borrowed funds(2) |
72,356 | — | — | 70,000 | 142,356 | |||||||||||
Operating lease obligations |
8,061 | 13,942 | 12,402 | 11,398 | 45,803 | |||||||||||
Outside data processing(3) |
2,369 | 4,526 | 2,158 | — | 9,053 | |||||||||||
George Mason sponsorship(4) |
650 | 1,300 | 1,300 | 10,500 | 13,750 | |||||||||||
| | | | | | | | | | | | | | | | | |
Total |
$ | 4,949,581 | $ | 292,319 | $ | 35,608 | $ | 91,898 | $ | 5,369,406 | ||||||
| | | | | | | | | | | | | | | | | |
| | | | | | | | | | | | | | | | | |
| | | | | | | | | | | | | | | | | |
- (1)
- Excludes accrued interest payable at December 31, 2015.
67
- (2)
- Borrowed
funds include customer repurchase agreements, and other short-term and long-term borrowings.
- (3)
- The
Bank has outstanding obligations under its current core data processing contract that expires in December 2019 and one other vendor arrangement that
relates to data communications and data software that expires in December 2017.
- (4)
- The Bank has the option of terminating the George Mason agreement at the end of contract years 10 and 15 (that is, effective June 30, 2025 or June 30, 2030). Should the Bank elect to exercise its right to terminate the George Mason contract, contractual obligations would decrease $3.5 million and $3.6 million for the first option period (years 11-15) and the second option period (16-20), respectively.
Effective July 1, 2015, the Bank entered into a multi-faceted support agreement with George Mason University ("George Mason"), the Commonwealth of Virginia's largest public research university. The agreement provides for significant educational support, and a strategic alliance including the Bank obtaining the naming rights to a multi-purpose sports and entertainment venue formerly known as the Patriot Center in Fairfax, VA for up to a 20 year term and now known as "EagleBank Arena". Under the agreement, the Bank pays George Mason an annual fee to be used for scholarships, internships, overall educational and athletic support and beautification efforts. The Bank has the option to terminate the agreement at the end of contract years 10 and 15 (that is, effective June 30, 2025 or June 30, 2030).
OFF-BALANCE SHEET ARRANGEMENTS
The Company is party to financial instruments with off-balance-sheet risk in the normal course of business to meet the financing needs of its customers and to reduce its own exposure to fluctuations in interest rates. These financial instruments include commitments to extend credit and standby letters of credit. They involve, to varying degrees, elements of credit risk in excess of the amount recognized in the balance sheets. The contract or notional amounts of those instruments reflect the extent of involvement the Company has in particular classes of financial instruments.
Various commitments to extend credit are made in the normal course of banking business. Letters of credit are also issued for the benefit of customers. These commitments are subject to loan underwriting standards and geographic boundaries consistent with the Company's loans outstanding.
Commitments to extend credit are agreements to lend to a customer as long as there is no violation of any condition established in the contract. Commitments generally have fixed expiration dates or other termination clauses and may require payment of a fee. Since some of the commitments are expected to expire without being drawn upon, the total commitment amounts do not necessarily represent future cash requirements.
Loan commitments outstanding and lines and letters of credit at December 31, 2015 and 2014 are as follows:
(dollars in thousands)
|
2015 | 2014 | |||||
|---|---|---|---|---|---|---|---|
Unfunded loan commitments |
$ | 1,838,336 | $ | 1,625,957 | |||
Unfunded lines of credit |
112,159 | 105,895 | |||||
Letters of credit |
83,511 | 75,615 | |||||
| | | | | | | | |
Total |
$ | 2,034,006 | $ | 1,807,467 | |||
| | | | | | | | |
| | | | | | | | |
| | | | | | | | |
The Company's exposure to credit loss in the event of nonperformance by the other party to the financial instrument for commitments to extend credit and standby letters of credit is represented by the contractual amount of those instruments. The Company uses the same credit policies in making commitments and conditional obligations as it does for on-balance-sheet instruments. See Note 20 to the Consolidated Financial Statements for a summary list of loan commitments at December 31, 2015 and 2014.
68
Loan commitments represent agreements to lend to a customer as long as there is no violation of any condition established in the contract and which have been accepted in writing by the borrower. Commitments generally have fixed expiration dates or other termination clauses and may require payment of a fee. Since some of the commitments may expire without being drawn upon, the total commitment amounts do not necessarily represent future cash requirements. The Company evaluates each customer's creditworthiness on a case-by-case basis. The amount of collateral obtained is based on management's credit evaluation of the borrower. Collateral obtained varies, and may include certificates of deposit, accounts receivable, inventory, property and equipment, residential and commercial real estate.
Standby letters of credit are conditional commitments issued by the Company which guarantee the performance of a customer to a third party. The credit risk involved in issuing letters of credit is essentially the same as that involved in extending loan facilities to customers. Collateral held varies as specified above and is required in instances which the Company deems necessary. At December 31, 2015, approximately 92% of the dollar amount of standby letters of credit was collateralized.
The Company enters into interest rate lock commitments, which are commitments to originate loans whereby the interest rate on the loan is determined prior to funding and the customers have locked into that interest rate. The residential mortgage division either locks in the loan and rate with an investor and commits to deliver the loan if settlement occurs under best efforts or commits to deliver the locked loan in a binding mandatory delivery program with an investor. Certain loans under rate lock commitments are covered under forward sales contracts of mortgage backed securities. Forward sales contracts of mortgage backed securities are recorded at fair value with changes in fair value recorded in noninterest income. Interest rate lock commitments and commitments to deliver loans to investors are considered derivatives. The market value of interest rate lock commitments and best efforts contracts are not readily ascertainable with precision because they are not actively traded in stand-alone markets. The Company determines the fair value of rate lock commitments and delivery contracts by measuring the fair value of the underlying asset, which is impacted by current interest rates and taking into consideration the probability that the rate lock commitments will close or will be funded.
The Company enters into interest rate swap derivative financial instruments to manage differences in the amount, timing, and duration of the Company's known or expected cash receipts and its known or expected cash payments principally related to certain variable rate deposits. Such instruments are designed as cash flow hedges. The Company has no fair value hedges or stand-alone derivatives. For a cash flow hedge, the gain or loss on the derivative is reported in other comprehensive income (a Consolidated Balance Sheet component of shareholders' equity) and is reclassified into earnings in the same period(s) during which the hedged transaction affects earnings (i.e. the period when cash flows are exchanged between counterparties). Changes in the fair value of derivatives that are not highly effective in hedging the changes in the expected cash flows of the hedged item are recognized immediately in current earnings. Please refer to Note 10 to the Consolidated Financial Statements for further detail.
In connection with deposit guarantees, the Bank collateralizes certain public funds using qualified investment securities and has purchased surety bonds for the benefit of certain bankruptcy trustee fiduciaries. The cost of insurance is included on noninterest expenses on the Consolidated Statement of Operations.
With the exception of these off-balance sheet arrangements, the Company has no off-balance sheet arrangements that have or are reasonably likely to have a current or future effect on the Company's financial condition, changes in financial condition, revenues or expenses, results of operations, capital expenditures or capital resources, that is material to investors.
69
Liquidity is a measure of the Company and Bank's ability to meet loan demand and to satisfy depositor withdrawal requirements in an orderly manner. The Bank's primary sources of liquidity consist of cash and cash balances due from correspondent banks, excess reserves at the Federal Reserve, loan repayments, federal funds sold and other short-term investments, maturities and sales of investment securities, income from operations and new core deposits into the Bank. The Bank's investment portfolio of debt securities is held in an available-for-sale status which allows for flexibility, subject to holdings held as collateral for customer repurchase agreements and public funds, to generate cash from sales as needed to meet ongoing loan demand. These sources of liquidity are considered primary and are supplemented by the ability of the Company and Bank to borrow funds or issue brokered deposits, which are termed secondary sources of liquidity and which are substantial. The Company's secondary sources of liquidity include a $50 million line of credit with a regional bank, secured by a portion of the stock of the Bank, against which there were no amounts outstanding at December 31, 2015. Additionally, the Bank can purchase up to $137.5 million in federal funds on an unsecured basis from its correspondents, against which there were no amounts outstanding at December 31, 2015 and can borrow unsecured funds under one-way CDARS brokered deposits in the amount of $909.5 million, against which there was $5.8 million outstanding at December 31, 2015. The Bank also has a commitment at December 31, 2015 from Promontory to place up to $300.0 million of brokered deposits from its IND program with the Bank, with an actual balance of $236.4 million outstanding at December 31, 2015. At December 31, 2015, the Bank was also eligible to make advances from the FHLB up to $731.1 million based on collateral at the FHLB, against which there were no amounts outstanding at December 31, 2015. Also, the Bank may enter into repurchase agreements as well as obtaining additional borrowing capabilities from the FHLB provided adequate collateral exists to secure these lending relationships. The Bank also has a back-up borrowing facility through the Discount Window at the Federal Reserve Bank of Richmond ("Federal Reserve Bank"). This facility, which amounts to approximately $408.0 million, is collateralized with specific loan assets identified to the Federal Reserve Bank. It is anticipated that, except for periodic testing, this facility would be utilized for contingency funding only.
The loss of deposits, through disintermediation, is one of the greater risks to liquidity. Disintermediation occurs most commonly when rates rise and depositors withdraw deposits seeking higher rates in alternative savings and investment sources than the Bank may offer. The Bank was founded under a philosophy of relationship banking and, therefore, believes that it has less of an exposure to disintermediation and resultant liquidity concerns than do many banks. The Bank makes competitive deposit interest rate comparisons weekly and feels its interest rate offerings are competitive. There is, however, a risk that some deposits would be lost if rates were to increase and the Bank elected not to remain competitive with its deposit rates. Under those conditions, the Bank believes that it is well positioned to use other sources of funds such as FHLB borrowings, brokered deposits, repurchase agreements and correspondent banks' lines of credit to offset a decline in deposits in the short run. Over the long-term, an adjustment in assets and change in business emphasis could compensate for a potential loss of deposits. The Bank also maintains a marketable investment portfolio to provide flexibility in the event of significant liquidity needs. The ALCO has adopted policy guidelines, which emphasize the importance of core deposits, adequate asset liquidity and a contingency funding plan.
At December 31, 2015, under the Bank's liquidity formula, it had $2.48 billion of primary and secondary liquidity sources. The amount is deemed adequate to meet current and projected funding needs.
CAPITAL RESOURCES AND ADEQUACY
The assessment of capital adequacy depends on a number of factors such as asset quality and mix, liquidity, earnings performance, changing competitive conditions and economic forces, regulatory measures and policy, as well as the overall level of growth and complexity of the balance sheet. The
70
adequacy of the Company's current and future capital needs is monitored by management on an ongoing basis. Management seeks to maintain a capital structure that will assure an adequate level of capital to support anticipated asset growth and to absorb potential losses.
The federal banking agencies have issued guidance for those institutions, which are deemed to have concentrations in commercial real estate lending. Pursuant to the supervisory criteria contained in the guidance for identifying institutions with a potential commercial real estate concentration risk, institutions which have (1) total reported loans for construction, land development, and other land acquisitions which represent 100% or more of an institution's total risk-based capital; or (2) total commercial real estate loans representing 300% or more of the institution's total risk-based capital and the institution's commercial real estate loan portfolio has increased 50% or more during the prior 36 months are identified as having potential commercial real estate concentration risk. Institutions which are deemed to have concentrations in commercial real estate lending are expected to employ heightened levels of risk management with respect to their commercial real estate portfolios, and may be required to hold higher levels of capital. The Company, like many community banks, has a concentration in commercial real estate loans, and the Company has experienced significant growth in its commercial real estate portfolio in recent years. At December 31, 2015, non-owner-occupied commercial real estate loans (including construction, land and land development loans) represent 441% of total risk based capital. Construction, land and land development loans represent 134% of total risk based capital. Management has extensive experience in commercial real estate lending, and has implemented and continues to maintain heightened risk management procedures, and strong underwriting criteria with respect to its commercial real estate portfolio.
Monitoring practices include periodic stress testing analysis to evaluate changes to cash flows, owing to interest rate increases and declines in net operating income. Nevertheless, we may be required to maintain higher levels of capital as a result of our commercial real estate concentrations, which could require us to obtain additional capital, and may adversely affect shareholder returns. The Company has an extensive Capital Plan and Policy, which includes pro-forma projections including stress testing within which the Board of Directors has established internal policy limits for regulatory capital ratios that are in excess of well capitalized ratios (as defined in the section "Regulations" above).
The Company and the Bank are subject to regulatory capital requirements administered by federal banking agencies. Capital adequacy guidelines and prompt corrective action regulations involve quantitative measures of assets, liabilities, and certain off-balance-sheet items calculated under regulatory accounting practices. Capital amounts and classifications are also subject to qualitative judgments by regulators about components, risk weightings, and other factors and the regulators can lower classifications in certain cases. Failure to meet various capital requirements can initiate regulatory action that could have a direct material effect on the financial statements.
At December 31, 2015, the capital position of the Company and its wholly owned subsidiary, the Bank, continues to exceed regulatory requirements and guidelines. The primary indicators relied on by bank regulators in measuring the capital position are four ratios as follows: Tier 1 risk-based capital ratio, Total risk-based capital ratio, the Leverage ratio and the Common Equity Tier 1 ratio. Tier 1 capital consists of common and qualifying preferred shareholders' equity (including without limit the preferred stock issued to the U.S. Treasury) less goodwill and other intangibles. Total risk-based capital consists of Tier 1 capital, plus qualifying subordinated debt, and the qualifying portion of the allowance for credit losses, and for the Company to a limited extent, excess amounts of restricted core capital elements. Risk-based capital ratios are calculated with reference to risk-weighted assets, which are prescribed by regulation. The measure of Tier 1 capital to average assets for the prior quarter is often referred to as the leverage ratio. The Common Equity Tier 1 ratio is the Tier 1 capital ratio but excluding preferred stock.
In July 2013, the Federal Reserve Board and the FDIC approved the final rules implementing the Basel Committee on Banking Supervision's capital guidelines for U.S. banks (commonly known as
71
Basel III). Under the final rules, which became applicable to the Company and the Bank on January 1, 2015 and are subject to a phase-in period through January 1, 2019, minimum requirements will increase for both the quantity and quality of capital held by the Company and the Bank. The rules include a new common equity Tier 1 capital to risk-weighted assets ratio (CET1 ratio) of 4.5% and a capital conservation buffer of 2.5% of risk-weighted assets, which when fully phased-in, effectively results in a minimum CET1 ratio of 7.0%. Basel III raises the minimum ratio of Tier 1 capital to risk-weighted assets from 4.0% to 6.0% (which, with the capital conservation buffer, effectively results in a minimum Tier 1 capital ratio of 8.5% when fully phased-in), effectively results in a minimum total capital to risk-weighted assets ratio of 10.5% (with the capital conservation buffer fully phased-in), and requires a minimum leverage ratio of 4.0%. Basel III also makes changes to risk weights for certain assets and off-balance-sheet exposures.
The prompt corrective action regulations provide five categories, including well capitalized, adequately capitalized, undercapitalized, significantly undercapitalized, and critically undercapitalized, although these terms are not used to represent overall financial condition. If a bank is only adequately capitalized, regulatory approval is required to, among other things, accept, renew or roll-over brokered deposits. If a bank is undercapitalized, capital distributions and growth and expansion are limited, and plans for capital restoration are required.
The Company's capital ratios were all well in excess of guidelines established by the Federal Reserve Board and the Bank's capital ratios were in excess of those required to be classified as a "well capitalized" institution under the prompt corrective action provisions of the Federal Deposit Insurance Act. The Company's and Bank's capital ratios at December 31, 2015 and 2014 are shown in Note 22 to the Consolidated Financial Statements.
The Company has a credit facility with a regional bank, pursuant to which the Company may borrow, on a revolving basis, up to $50 million for working capital purposes, to finance capital contributions to the Bank in whole and to ECV in part. The credit facility is secured by a first lien on a portion of the stock of the Bank, pursuant to which the Company may borrow, and bears interest at a floating rate equal to the Wall Street Journal Prime Rate minus 0.25% with a floor interest rate of 3.50%. Interest is payable on a monthly basis. The term of the credit facility expires on September 30, 2016. There were no amounts outstanding under this credit facility at December 31, 2015 or December 31, 2014.
On November 2, 2015, the Company redeemed all of the 56,600 shares of the Company's Senior Non-Cumulative Perpetual Preferred Stock, Series B, liquidation amount $1,000 per share (the "Series B Preferred Stock"), and all of the 15,300 shares of the Company's Senior Non-Cumulative Perpetual Preferred Stock, Series C, liquidation amount $1,000 per share ("Series C Preferred Stock"). The aggregate redemption price of the Series B Preferred Stock and Series C Preferred Stock was approximately $71.96 million, including dividends accrued but unpaid through, but not including, the redemption date.
During 2015, the Company redeemed the remaining balance of $9.3 million of subordinated notes, due 2021.
In March 2015, the Company completed the public offering of $100 million of its common stock at $35.50 per share and received gross proceeds of sale of $100 million and net proceeds of sale of approximately $94.6 million.
On August 5, 2014, the Company completed the sale of $70.0 million of its noncallable 5.75% subordinated notes, due September 1, 2024. (the "Notes"). The Notes were sold to the public at par. The Notes qualify as Tier 2 capital for regulatory purposes under the Basel III Rule capital requirements.
The ability of the Company to continue to grow is dependent on its earnings and those of the Bank, the ability to obtain additional funds for contribution to the Bank's capital, through additional borrowings, through the sale of additional common stock or preferred stock, or through the issuance of additional qualifying capital instruments, such as subordinated debt. The capital levels required to be maintained by
72
the Company and Bank may be impacted as a result of the Bank's concentrations in commercial real estate loans. See "Regulation" at page 10 and "Risk Factors" at page 20.
IMPACT OF INFLATION AND CHANGING PRICES
The Consolidated Financial Statements and Notes thereto have been prepared in accordance with GAAP in the United States of America, which require the measurement of financial position and operating results in terms of historical dollars without considering the changes in the relative purchasing power of money over time due to inflation. The impact of inflation is reflected in the increased cost of operations. Unlike most industrial companies, nearly all of our assets and liabilities are monetary in nature. As a result, interest rates have a greater impact on our performance than do the effects of general levels of inflation. Interest rates do not necessarily move in the same direction or to the same extent as the price of goods or services.
NEW AUTHORITATIVE ACCOUNTING GUIDANCE
Refer to Note 1 to the Consolidated Financial Statements for New Authoritative Accounting Guidance and their expected impact on the Company's Financial Statements.
ITEM 7A. QUANTITATIVE AND QUALITATIVE DISCLOSURES ABOUT MARKET RISK
Asset/Liability Management of Interest Rate Risk
A fundamental risk in banking is exposure to market risk, or interest rate risk, since a bank's net income is largely dependent on net interest income. The Bank's ALCO formulates and monitors the management of interest rate risk through policies and guidelines established by it and the full Board of Directors and through review of detailed reports discussed quarterly. In its consideration of risk limits, the ALCO considers the impact on earnings and capital, the level and direction of interest rates, liquidity, local economic conditions, outside threats and other factors. Banking is generally a business of managing the maturity and re-pricing mismatch inherent in its asset and liability cash flows and to provide net interest income growth consistent with the Company's profit objectives.
During the year ended December 31, 2015, the Company was able to increase its net interest income (by 31%) despite a decrease in net interest spread (from 4.28% to 4.15%) while managing its overall interest rate risk position.
The Company, through its ALCO and ongoing financial management practices, monitors the interest rate environment in which it operates and adjusts the rates and maturities of its assets and liabilities to remain competitive and to achieve its overall financial objectives subject to established risk limits. In the current and expected future interest rate environment, the Company has been maintaining its investment portfolio to manage the balance between yield and prepayment risk in its portfolio of mortgage backed securities should interest rates remain at current levels and has been managing the investment portfolio to mitigate extension risk and related declines in market values in that same portfolio should interest rates increase. Additionally, the Company has very limited call risk in its U.S. agency investment portfolio. During the year ended December 31, 2015, average investment portfolio balances increased as compared to balances at December 31, 2014, due in part to cash flow from the sale of the indirect lending portfolio being deployed into a combination of higher yielding loans, and higher average investments. Cash flows from mortgage backed securities and sales of U.S. agency securities were reinvested primarily into a combination of mortgage backed securities and additional investments have been made in high quality corporate and SBA bonds. The percentage mix of municipal securities decreased to 24% of total investments at December 31, 2015 from 29% at December 31, 2014, as the focus shifted to shorter duration instruments with more cash flow. The portion of the portfolio invested in mortgage backed securities decreased from 63% to 61% at December 31, 2015, as compared to December 31, 2014 and the
73
portion of the portfolio represented in U.S. agency investments increased from 8% to 12%. Shorter duration floating rate corporate bonds and SBA bonds, which are included in mortgage backed securities, were 3% of total investments at December 31, 2015. The duration of the investment portfolio declined to 3.9 years at December 31, 2015 from 4.0 years at December 31, 2014, due primarily to a higher mix and dollar amount of mortgage backed securities and continued shortening of existing investment holdings due to the passing of time.
In the loan portfolio, the re-pricing duration shortened to 25 months at December 31, 2015 from 27 months at December 31, 2014, with fixed rate loans amounting to 35% and 41% of total loans at December 31, 2015 and 2014, respectively. Variable and adjustable rate loans comprised 65% and 59% of total loans at December 31, 2015 and 2014, respectively. Variable rate loans are indexed primarily to the Wall Street Journal prime interest rate or the London Interbank Offered Rate ("LIBOR"), while adjustable rate loans are indexed primarily to the five year U.S. Treasury interest rate. In the deposit portfolio, the duration of the portfolio shortened to 32 months at December 31, 2015 from 33 months at December 31, 2014. The sale of the indirect auto portfolio and total deposit growth above loan growth in 2015 resulted in higher average liquidity in 2015 as compared to 2014. The Company experienced $848 million in total deposit growth for the year ended December 31, 2015 as compared to total loan growth of $686 million.
The Company has continued its emphasis on funding loans in its marketplace, and has been able to achieve favorable loan pricing, including interest rate floors on many loan originations, although competition for new loans persisted throughout 2015. A disciplined approach to loan pricing, together with loans floors existing in 60% of total loans (at December 31, 2015), has resulted in slightly lower loan portfolio yields over the past twelve months, as average loan yields have declined by just 13 basis points (from 5.37% to 5.24%) for 2015 as compared to 2014. Subject to interest rate floors, variable and adjustable rate loans provide additional income opportunities should interest rates rise from current levels.
The net unrealized gain before income tax on the investment portfolio was $1.7 million at December 31, 2015 as compared to a net unrealized gain before tax of $4.4 million at December 31, 2014, with $2.3 million of realized net gains recorded during the year ended December 31, 2015. The net unrealized gain on the investment portfolio was due primarily to low interest rates that persisted throughout 2015. At December 31, 2015, the unrealized gain position represented 0.4% of the portfolio's book value.
In April 2015, the Company entered into forward starting interest rate swaps as part of its interest rate risk management strategy intended to mitigate the potential risk of rising interest rates on the Bank's cost of funds. The interest rate swaps are designated as cash flow hedges and involve the receipt of variable rate amounts from two counterparties in exchange for the Company making fixed payments beginning in April 2016. As of December 31, 2015, the Company had three forward starting interest rate swap transactions outstanding that had a notional amount of $250 million associated with the Company's variable rate deposits. The net unrealized loss before income tax on the swaps was $1.4 million at December 31, 2015. The unrealized loss is due to the increase in spread between short and longer term interest rates between when the forward starting swap was entered into and year end 2015.
There can be no assurance that the Company will be able to successfully achieve its optimal asset liability mix, as a result of competitive pressures, customer preferences and the inability to perfectly forecast future interest rates and movements.
One of the tools used by the Company to manage its interest rate risk is a static GAP analysis presented below. The Company also employs an earnings simulation model on a quarterly basis to monitor its interest rate sensitivity and risk and to model its balance sheet cash flows and the related income statement effects in different interest rate scenarios. The model utilizes a static current balance sheet and attributes and adjusts for assumptions as to investment maturities (including prepayments), loan prepayments, interest rates, and the level of noninterest income and noninterest expense. The data is then
74
subjected to a "shock test" which assumes a simultaneous change in interest rates up 100, 200, 300, and 400 basis points or down 100 and 200 basis points, along the entire yield curve, but not below zero. The results are analyzed as to the impact on net interest income, net income and the market equity over the next twelve and twenty-four month periods from December 31, 2015. In addition to analysis of simultaneous changes in interest rates along the yield curve, changes based on interest rate "ramps" is also performed. This analysis represents the impact of a more gradual change in interest rates, as well as yield curve shape changes.
For the analysis presented below, at December 31, 2015, the simulation assumes a 50 basis point change in interest rates on money market and interest bearing transaction deposits for each 100 basis point change in market interest rates in a decreasing interest rate shock scenario with a floor of 10 basis points, and assumes a 70 basis point change in interest rates on money market and interest bearing transaction deposits for each 100 basis point change in market interest rates in an increasing interest rate shock scenario.
As quantified in the table below, the Company's analysis at December 31, 2015 shows a moderate effect on net interest income over the next 12 months, as well as a moderate effect on the economic value of equity when interest rates are shocked both down 100 and 200 basis points and up 100, 200, 300, and 400 basis points. This moderate impact is due substantially to the significant level of variable rate and re-priceable assets and liabilities and related shorter relative durations. The re-pricing duration of the investment portfolio at December 31, 2015 is 3.9 years, the loan portfolio 2.1 years, the interest bearing deposit portfolio 2.7 years and the borrowed funds portfolio 3.3 years.
The following table reflects the result of simulation analysis on the December 31, 2015 asset and liabilities balances:
Change in interest rates (basis points) |
Percentage change in net interest income |
Percentage change in net income |
Percentage change in market value of portfolio equity |
||||||||
|---|---|---|---|---|---|---|---|---|---|---|---|
| +400 | +9.4 | % | +15.1 | % | +0.8 | % | |||||
| +300 | +6.1 | % | +9.2 | % | +0.2 | % | |||||
| +200 | +2.7 | % | +3.4 | % | –0.4 | % | |||||
| +100 | –0.3 | % | –1.9 | % | –1.1 | % | |||||
0 |
— | — | — | ||||||||
| –100 | –2.4 | % | –4.4 | % | –6.1 | % | |||||
| –200 | –3.8 | % | –7.1 | % | –15.0 | % | |||||
The results of simulation are well within the policy limits adopted by the Company. For net interest income, the Company has adopted a policy limit of 10% for a 100 basis point change, 12% for a 200 basis point change, 18% for a 300 basis point change and 24% for a 400 basis point change. For the market value of equity, the Company has adopted a policy limit of 12% for a 100 basis point change, 15% for a 200 basis point change, 25% for a 300 basis point change and 30% for a 400 basis point change. The changes in net interest income, net income and the economic value of equity in a higher interest rate shock scenario at December 31, 2015 are considered to be at a moderate level of risk. A 100 basis point reduction in the interest rate shock scenario is also modest for the same period while a down 200 basis point reduction is at the policy limit of 15%. The negative impact of –0.3% in net interest income and –1.9% in net income given a 100 basis point increase in market interest rates reflects in large measure the impact of floor interest rates in a substantial portion of the loan portfolio and a lower level of expected residential mortgage sales activity.
Generally speaking, the loss of economic value of portfolio equity in a lower interest rate environment is due to lower values of core deposits more than offsetting the gains in loan and investment values; while the gain of economic value of portfolio equity in a higher interest rate environment is due to higher value of core deposits more than offsetting lower values of fixed rate loans and investments. The Company believes its balance sheet is well positioned in the current interest rate environment.
75
During 2015, the Company continued to manage its interest rate sensitivity position to moderate levels of risk, as indicated in the simulation results above. The interest rate risk position at December 31, 2015 was slightly more asset sensitive than the interest rate risk position at December 31, 2014. The increase in the target federal funds rate from 25 to 50 basis points results in loans piercing through their floors more quickly in an up 100 basis point environment relative to the interest rate risk position at December 31, 2014. As compared to December 31, 2014, the sum of federal funds sold, interest bearing deposits with banks and other short-term investments and loans held for sale increased by $43.6 million at December 31, 2015.
Certain shortcomings are inherent in the method of analysis presented in the foregoing table. For example, although certain assets and liabilities may have similar maturities or repricing periods, they may react in different degrees to changes in market interest rates. Also, the interest rates on certain types of assets and liabilities may fluctuate in advance of changes in market interest rates, while interest rates on other types may lag behind changes in market rates. Additionally, certain assets, such as adjustable-rate mortgage loans, have features that limit changes in interest rates on a short-term basis and over the life of the loan. Further, in the event of a change in interest rates, prepayment and early withdrawal levels could deviate significantly from those assumed in calculating the tables. Finally, the ability of many borrowers to service their debt may decrease in the event of a significant interest rate increase.
During 2015, average short-term market interest rates increased and mid-term rates decreased as compared to 2014 and the yield curve flattened. As compared to the year 2014, the average two year U.S. Treasury rate in 2015 increased by 23 basis points from 0.46% to 0.69%, the average five year U.S. Treasury rate decreased by 11 basis points from 1.64% to 1.53% and the average ten year U.S. Treasury rate decreased by 40 basis points from 2.54% to 2.14%. In that environment, the Company was able to achieve a net interest spread for 2015 of 4.15% compared to 4.28% for the year of 2014, the lower spread reflecting the more competitive pricing for new loan business. The Company believes that the change in the net interest spread for the full year 2015 has been consistent with its risk analysis at December 31, 2014. On an annual basis, the Company back-tests the actual change in its net interest spread against expected change and actual market interest rate movements and other factors impacting actual versus projected results.
GAP Analysis
Banks and other financial institutions earnings are significantly dependent upon net interest income, which is the difference between interest earned on earning assets and interest expense on interest bearing liabilities. Net interest income represented 90% of the Company's revenue for the year ended December 31, 2015, as compared to 91% of the Company's revenue for the year ended December 31, 2014. The Company's net interest margin was 4.33% at December 31, 2015, as compared to 4.44% for the year ended December 31, 2014. The stable net interest margin for the year ended December 31, 2015 as compared to the year ended December 31, 2014, was due to declining funding costs more than offsetting declines in yields on earning assets and to a higher average loan to deposit ratio in 2015 versus 2014 (97.8% versus 95.7%).
Generally speaking, in falling interest rate environments, net interest income is maximized with longer term, higher yielding assets being funded by lower yielding short-term funds, or what is referred to as a negative mismatch or negative GAP. Conversely, in a rising interest rate environment, net interest income is maximized with shorter term, higher yielding assets being funded by longer-term liabilities or what is referred to as a positive mismatch or positive GAP.
The GAP position, which is a measure of the difference in maturity and re-pricing volume between assets and liabilities, is a means of monitoring the sensitivity of a financial institution to changes in interest rates. The chart below provides an indication of the sensitivity of the Company to changes in interest rates. A negative GAP indicates the degree to which the volume of re-priceable liabilities exceeds re-priceable assets in given time periods.
76
At December 31, 2015, the Company had a positive GAP position of approximately $554 million or 9% of total assets out to three months and a positive cumulative GAP position of $827 million or 14% of total assets out to 12 months; as compared to a positive GAP position of approximately $363 million or 7% of total assets out to three months and a positive cumulative GAP position of approximately $347 million or 7% out to 12 months at December 31, 2014. The change in the positive GAP position at December 31, 2015, as compared to December 2014, was due substantially to higher levels of variable rate loans. The GAP analysis reports variable and adjustable rate loans as re-priceable without regard to interest rate floors, which impact is captured in simulation analysis only. The change in the GAP position at December 31, 2015 as compared to December 31, 2014 is not deemed material to the Company's overall interest rate risk position, which relies more heavily on simulation analysis, which captures the full optionality within the balance sheet. The current position is within guideline limits established by the ALCO. While management believes that this overall position creates a reasonable balance in managing its interest rate risk and maximizing its net interest margin within plan objectives, there can be no assurance as to actual results.
If interest rates increase, the Company's net interest income and net interest margin are expected to decrease modestly initially and then increase as the floors on loans are pierced. This is due to an excess of rate sensitive assets over liabilities, adjusted for the impact of loan floors and the assumption of an increase in money market interest rates by 70% of the change in market interest rates, and the estimated impact on residential mortgage loan originations.
If interest rates decline, the Company's net interest income and margin are expected to decline modestly as the repricing of loans at lower rates slightly outpaces both the decrease in funding from rate reductions in variable rate deposits.
Because competitive market behavior does not necessarily track the trend of interest rates but at times moves ahead of financial market influences, the change in the cost of liabilities may be different than anticipated by the GAP model. If this were to occur, the effects of a declining interest rate environment may not be in accordance with management's expectations.
77
GAP Analysis
December 31, 2015
(dollars in thousands)
Repriceable in:
|
0-3 months | 4-12 months | 13-36 months | 37-60 months | Over 60 months | Total Rate Sensitive |
Non- sensitive |
Total Assets |
|||||||||||||||||
|---|---|---|---|---|---|---|---|---|---|---|---|---|---|---|---|---|---|---|---|---|---|---|---|---|---|
RATE SENSITIVE ASSETS: |
|||||||||||||||||||||||||
Investment securities |
$ | 51,299 | $ | 55,693 | $ | 120,638 | $ | 107,641 | $ | 169,501 | $ | 504,772 | |||||||||||||
Loans(1)(2) |
2,580,900 | 497,415 | 1,098,136 | 729,006 | 140,403 | 5,045,860 | |||||||||||||||||||
Fed funds and other short-term investments |
287,354 | — | — | — | — | 287,354 | |||||||||||||||||||
Other earning assets |
58,682 | — | — | — | — | 58,682 | |||||||||||||||||||
| | | | | | | | | | | | | | | | | | | | | | | | | | |
Total |
$ | 2,978,235 | $ | 553,108 | $ | 1,218,774 | $ | 836,647 | $ | 309,904 | $ | 5,896,668 | $ | 179,981 | $ | 6,076,649 | |||||||||
| | | | | | | | | | | | | | | | | | | | | | | | | | |
RATE SENSITIVE LIABILITIES: |
|||||||||||||||||||||||||
Noninterest bearing demand |
$ | 57,327 | $ | 171,980 | $ | 458,052 | $ | 458,052 | $ | 259,656 | $ | 1,405,067 | |||||||||||||
Interest bearing transaction |
125,157 | — | 26,820 | 26,820 | — | 178,797 | |||||||||||||||||||
Savings and money market |
2,080,758 | — | 377,284 | 377,283 | — | 2,835,325 | |||||||||||||||||||
Time deposits |
88,482 | 358,472 | 272,166 | 20,135 | — | 739,255 | |||||||||||||||||||
Customer repurchase agreements and fed funds purchased |
72,356 | — | — | — | — | 72,356 | |||||||||||||||||||
Other borrowings |
— | — | — | — | 70,000 | 70,000 | |||||||||||||||||||
| | | | | | | | | | | | | | | | | | | | | | | | | | |
Total |
$ | 2,424,080 | $ | 530,452 | $ | 1,134,322 | $ | 882,290 | $ | 329,656 | $ | 5,300,800 | $ | 37,248 | $ | 5,338,048 | |||||||||
| | | | | | | | | | | | | | | | | | | | | | | | | | |
GAP |
$ | 554,155 | $ | 22,656 | $ | 84,452 | $ | (45,643 | ) | $ | (19,752 | ) | $ | 595,868 | |||||||||||
Cumulative GAP |
$ | 554,155 | $ | 576,811 | $ | 661,263 | $ | 615,620 | $ | 595,868 | |||||||||||||||
Cumulative gap as percent of total assets |
9.12 | % | 9.49 | % | 10.88 | % | 10.13 | % | 9.81 | % | |||||||||||||||
OFF BALANCE-SHEET: |
|||||||||||||||||||||||||
Interest Rate Swaps—LIBOR based |
$ | — | $ | 150,000 | $ | — | $ | (75,000 | ) | $ | (75,000 | ) | $ | — | |||||||||||
Interest Rate Swaps—Fed Funds based |
— | 100,000 | — | — | (100,000 | ) | — | ||||||||||||||||||
| | | | | | | | | | | | | | | | | | | | | | | | | | |
Total |
$ | — | $ | 250,000 | $ | — | $ | (75,000 | ) | $ | (175,000 | ) | $ | — | $ | — | $ | — | |||||||
| | | | | | | | | | | | | | | | | | | | | | | | | | |
GAP |
$ | 554,155 | $ | 272,656 | $ | 84,452 | $ | (120,643 | ) | $ | (194,752 | ) | $ | 595,868 | |||||||||||
Cumulative GAP |
$ | 554,155 | $ | 826,811 | $ | 911,263 | $ | 790,620 | $ | 595,868 | |||||||||||||||
Cumulative gap as percent of total assets |
9.12 | % | 13.61 | % | 15.00 | % | 13.01 | % | 9.81 | % | |||||||||||||||
- (1)
- Includes
loans held for sale.
- (2)
- Nonaccrual loans are included in the over 60 months category.
Over the twelve months ending December 31, 2016, as reflected in the GAP table above, the Company has an excess of rate sensitive assets over rate sensitive liabilities of 14%.
The sum of federal funds sold, interest bearing deposits with banks and other short-term investments increased by $40.4 million at December 31, 2015 as compared to December 31, 2014. The increase in interest sensitive assets at year-end 2015 versus 2014, including off-balance sheet forward starting interest rate swap contracts entered into during April 2015, was a significant factor in the cumulative GAP position within 12 months increasing to 14% of total assets at December 31, 2015 from 7% of total assets at December 31, 2014.
Although NOW and money market accounts are subject to immediate re-pricing, the Bank's GAP model has incorporated a re-pricing schedule to account for a lag in rate changes based on our experience, as measured by the amount of those deposit rate changes relative to the amount of rate change in assets.
78
ITEM 8. FINANCIAL STATEMENTS AND SUPPLEMENTARY DATA
Report of Stegman & Company
Independent Registered Public Accounting Firm
To the Board of Directors and
Shareholders of Eagle Bancorp, Inc.
We have audited the accompanying consolidated balance sheets of Eagle Bancorp, Inc. (the "Company") as of December 31, 2015 and 2014, and the consolidated statements of operations, comprehensive income, changes in shareholders' equity and cash flows for each of the years in the three-year period ended December 31, 2015. We also have audited the Company's internal control over financial reporting as of December 31, 2015, based on criteria established in the Internal Control—Integrated Framework (2013) issued by the Committee of Sponsoring Organizations of the Treadway Commission ("COSO"). The Company's management is responsible for these financial statements, for maintaining effective internal control over financial reporting, and for its assessment of the effectiveness of internal control over financial reporting, included in the accompanying Management's Report on Internal Control over Financial Reporting. Our responsibility is to express an opinion on these Consolidated Financial Statements and an opinion on the Company's internal control over financial reporting based on our audits.
We conducted our audits in accordance with the standards of the Public Company Accounting Oversight Board (United States). Those standards require that we plan and perform the audits to obtain reasonable assurance about whether the financial statements are free of material misstatement and whether effective internal control over financial reporting was maintained in all material respects. Our audits of the Consolidated Financial Statements included examining, on a test basis, evidence supporting the amounts and disclosures in the financial statements, assessing the accounting principles used and significant estimates made by management, and evaluating the overall financial statement presentation. Our audit of internal control over financial reporting included obtaining an understanding of internal control over financial reporting, assessing the risk that a material weakness exists, and testing and evaluating the design and operating effectiveness of internal control based on the assessed risk. Our audits also included performing such other procedures as we considered necessary in the circumstances. We believe that our audits provide a reasonable basis for our opinions.
A company's internal control over financial reporting is a process designed to provide reasonable assurance regarding the reliability of financial reporting and the preparation of financial statements for external purposes in accordance with generally accepted accounting principles. A company's internal control over financial reporting includes those policies and procedures that (1) pertain to the maintenance of records that, in reasonable detail, accurately and fairly reflect the transactions and dispositions of the assets of the company; (2) provide reasonable assurance that transactions are recorded as necessary to permit preparation of financial statements in accordance with generally accepted accounting principles, and that receipts and expenditures of the company are being made only in accordance with authorizations of management and directors of the company; and (3) provide reasonable assurance regarding prevention or timely detection of unauthorized acquisition, use, or disposition of the company's assets that could have a material effect on the financial statements.
Because of its inherent limitations, internal control over financial reporting may not prevent or detect misstatements. Also, projections of any evaluation of effectiveness to future periods are subject to the risk that controls may become inadequate because of changes in conditions, or that the degree of compliance with the policies or procedures may deteriorate.
79
In our opinion, the Consolidated Financial Statements referred to above present fairly, in all material respects, the financial position of Eagle Bancorp, Inc. as of December 31, 2015 and 2014, and the results of its operations and its cash flows for each of the years in the three-year period ended December 31, 2015 in conformity with accounting principles generally accepted in the United States of America. Also in our opinion, Eagle Bancorp, Inc. maintained, in all material respects, effective internal control over financial reporting as of December 31, 2015, based on criteria established in the Internal Control—Integrated Framework (2013) issued by the Committee of Sponsoring Organizations of the Treadway Commission (COSO).
/s/ STEGMAN AND COMPANY
Baltimore,
Maryland
February 29, 2016
80
EAGLE BANCORP, INC.
Consolidated Balance Sheets
(dollars in thousands, except share and per share data)
| |
December 31, 2015 | December 31, 2014 | |||||
|---|---|---|---|---|---|---|---|
Assets |
|||||||
Cash and due from banks |
$ | 11,009 | $ | 9,097 | |||
Federal funds sold |
3,791 | 3,516 | |||||
Interest bearing deposits with banks and other short-term investments |
283,563 | 243,412 | |||||
Investment securities available-for-sale, at fair value |
487,869 | 382,343 | |||||
Federal Reserve and Federal Home Loan Bank stock |
16,903 | 22,560 | |||||
Loans held for sale, at fair value |
47,492 | 44,317 | |||||
Loans |
4,998,368 | 4,312,399 | |||||
Less allowance for credit losses |
(52,687 | ) | (46,075 | ) | |||
| | | | | | | | |
Loans, net |
4,945,681 | 4,266,324 | |||||
Premises and equipment, net |
18,254 | 19,099 | |||||
Deferred income taxes |
40,311 | 32,511 | |||||
Bank owned life insurance |
58,682 | 56,594 | |||||
Intangible assets, net |
108,542 | 109,908 | |||||
Other real estate owned |
5,852 | 13,224 | |||||
Other assets |
48,700 | 44,975 | |||||
| | | | | | | | |
Total Assets |
$ | 6,076,649 | $ | 5,247,880 | |||
| | | | | | | | |
| | | | | | | | |
| | | | | | | | |
Liabilities and Shareholders' Equity |
|||||||
Liabilities |
|||||||
Deposits: |
|||||||
Noninterest bearing demand |
$ | 1,405,067 | $ | 1,175,799 | |||
Interest bearing transaction |
178,797 | 143,628 | |||||
Savings and money market |
2,835,325 | 2,302,600 | |||||
Time, $100,000 or more |
406,570 | 393,132 | |||||
Other time |
332,685 | 295,609 | |||||
| | | | | | | | |
Total deposits |
5,158,444 | 4,310,768 | |||||
Customer repurchase agreements |
72,356 | 61,120 | |||||
Other short-term borrowings |
— | 100,000 | |||||
Long-term borrowings |
70,000 | 119,300 | |||||
Other liabilities |
37,248 | 35,933 | |||||
| | | | | | | | |
Total Liabilities |
5,338,048 | 4,627,121 | |||||
| | | | | | | | |
Shareholders' Equity |
|||||||
Preferred stock, par value $.01 per share, shares authorized 1,000,000, Series B, $1,000 per share liquidation preference, shares issued and outstanding -0- at December 31, 2015 and 56,600 at December 31, 2014; Series C, $1,000 per share liquidation preference, shares issued and outstanding -0- at December 31, 2015, and 15,300 at December 31, 2014 |
$ | — | $ | 71,900 | |||
Common stock, par value $.01 per share; shares authorized 100,000,000, shares issued and outstanding 33,467,893 and 30,139,396, respectively |
331 | 296 | |||||
Warrant |
946 | 946 | |||||
Additional paid in capital |
503,529 | 394,933 | |||||
Retained earnings |
233,604 | 150,037 | |||||
Accumulated other comprehensive income |
191 | 2,647 | |||||
| | | | | | | | |
Total Shareholders' Equity |
738,601 | 620,759 | |||||
| | | | | | | | |
Total Liabilities and Shareholders' Equity |
$ | 6,076,649 | $ | 5,247,880 | |||
| | | | | | | | |
| | | | | | | | |
| | | | | | | | |
See notes to consolidated financial statements.
81
EAGLE BANCORP, INC.
Consolidated Statements of Operations
Years Ended December 31,
(dollars in thousands, except per share
data)
| |
2015 | 2014 | 2013 | |||||||
|---|---|---|---|---|---|---|---|---|---|---|
Interest Income |
||||||||||
Interest and fees on loans |
$ | 242,340 | $ | 181,775 | $ | 148,801 | ||||
Interest and dividends on investment securities |
10,092 | 9,286 | 7,792 | |||||||
Interest on balances with other banks and short-term investments |
732 | 496 | 689 | |||||||
Interest on federal funds sold |
16 | 16 | 12 | |||||||
| | | | | | | | | | | |
Total interest income |
253,180 | 191,573 | 157,294 | |||||||
| | | | | | | | | | | |
Interest Expense |
||||||||||
Interest on deposits |
14,343 | 9,638 | 10,614 | |||||||
Interest on customer repurchase agreements |
132 | 143 | 254 | |||||||
Interest on short-term borrowings |
86 | 31 | — | |||||||
Interest on long-term borrowings |
4,677 | 3,283 | 1,636 | |||||||
| | | | | | | | | | | |
Total interest expense |
19,238 | 13,095 | 12,504 | |||||||
| | | | | | | | | | | |
Net Interest Income |
233,942 | 178,478 | 144,790 | |||||||
Provision for Credit Losses |
14,638 | 10,879 | 9,602 | |||||||
| | | | | | | | | | | |
Net Interest Income After Provision For Credit Losses |
219,304 | 167,599 | 135,188 | |||||||
| | | | | | | | | | | |
Noninterest Income |
||||||||||
Service charges on deposits |
5,397 | 4,906 | 4,607 | |||||||
Gain on sale of loans |
11,973 | 6,886 | 14,578 | |||||||
Gain on sale of investment securities |
2,254 | 22 | 19 | |||||||
Loss on early extinguishment of debt |
(1,130 | ) | — | — | ||||||
Increase in the cash surrender value of bank owned life insurance |
1,589 | 1,283 | 720 | |||||||
Other income |
6,545 | 5,248 | 4,792 | |||||||
| | | | | | | | | | | |
Total noninterest income |
26,628 | 18,345 | 24,716 | |||||||
| | | | | | | | | | | |
Noninterest Expense |
||||||||||
Salaries and employee benefits |
61,749 | 57,268 | 47,481 | |||||||
Premises and equipment expenses |
16,026 | 13,317 | 11,923 | |||||||
Marketing and advertising |
2,748 | 1,999 | 1,686 | |||||||
Data processing |
7,533 | 6,163 | 5,903 | |||||||
Legal, accounting and professional fees |
3,729 | 3,439 | 2,969 | |||||||
FDIC insurance |
3,154 | 2,333 | 2,263 | |||||||
Merger expenses |
141 | 4,699 | — | |||||||
Other expenses |
15,636 | 10,510 | 12,354 | |||||||
| | | | | | | | | | | |
Total noninterest expense |
110,716 | 99,728 | 84,579 | |||||||
| | | | | | | | | | | |
Income Before Income Tax Expense |
135,216 | 86,216 | 75,325 | |||||||
Income Tax Expense |
51,049 | 31,958 | 28,318 | |||||||
| | | | | | | | | | | |
Net Income |
84,167 | 54,258 | 47,007 | |||||||
Preferred Stock Dividends |
601 | 614 | 566 | |||||||
| | | | | | | | | | | |
Net Income Available to Common Shareholders |
$ | 83,566 | $ | 53,644 | $ | 46,441 | ||||
| | | | | | | | | | | |
| | | | | | | | | | | |
| | | | | | | | | | | |
Earnings Per Common Share |
||||||||||
Basic |
$ | 2.54 | $ | 2.01 | $ | 1.81 | ||||
Diluted |
$ | 2.50 | $ | 1.95 | $ | 1.76 | ||||
See notes to consolidated financial statements.
82
EAGLE BANCORP, INC.
Consolidated Statements of Comprehensive Income
Years Ended December 31,
(dollars in thousands)
| |
2015 | 2014 | 2013 | |||||||
|---|---|---|---|---|---|---|---|---|---|---|
Net Income |
$ | 84,167 | $ | 54,258 | $ | 47,007 | ||||
Other comprehensive income (loss), net of tax: |
||||||||||
Unrealized (loss) gain on securities available for sale |
(254 | ) | 5,979 | (8,773 | ) | |||||
Unrealized loss on derivatives |
(850 | ) | — | — | ||||||
Reclassification adjustment for net gains included in net income |
(1,352 | ) | (13 | ) | (11 | ) | ||||
| | | | | | | | | | | |
Net change other comprehensive income (loss) |
(2,456 | ) | 5,966 | (8,784 | ) | |||||
| | | | | | | | | | | |
Comprehensive Income |
$ | 81,711 | $ | 60,224 | $ | 38,223 | ||||
| | | | | | | | | | | |
| | | | | | | | | | | |
| | | | | | | | | | | |
See notes to consolidated financial statements.
83
EAGLE BANCORP, INC.
Consolidated Statements of Changes in Shareholders' Equity
(dollars in thousands except share data)
| |
Preferred | Common | |
|
|
Accumulated Other Comprehensive Income (Loss) |
|
|||||||||||||||||||||
|---|---|---|---|---|---|---|---|---|---|---|---|---|---|---|---|---|---|---|---|---|---|---|---|---|---|---|---|---|
| |
|
Additional Paid in Capital |
Retained Earnings |
Total Shareholders' Equity |
||||||||||||||||||||||||
| |
Shares | Amount | Shares | Amount | Warrant | |||||||||||||||||||||||
Balance January 1, 2013 |
56,600 | $ | 56,600 | 22,954,889 | $ | 226 | $ | 946 | $ | 180,593 | $ | 106,146 | $ | 5,465 | $ | 349,976 | ||||||||||||
Net Income |
— | — | — | — | — | — | 47,007 | — | 47,007 | |||||||||||||||||||
Net change in other comprehensive income |
— | — | — | — | — | — | — | (8,784 | ) | (8,784 | ) | |||||||||||||||||
10% common stock dividend |
— | — | 2,340,518 | 24 | — | 56,159 | (56,183 | ) | — | — | ||||||||||||||||||
Cash paid in lieu of fractional shares |
— | — | — | — | — | — | (11 | ) | — | (11 | ) | |||||||||||||||||
Stock-based compensation |
— | — | — | — | — | 3,304 | — | — | 3,304 | |||||||||||||||||||
Issuance of common stock related to options exercised, net of shares withheld for payroll taxes |
— | — | 191,612 | 2 | — | 1,982 | — | — | 1,984 | |||||||||||||||||||
Tax benefits realized from stock compensation |
— | — | — | — | — | 410 | — | — | 410 | |||||||||||||||||||
Vesting of restricted stock awards issued at date of grant, net of shares withheld for payroll taxes |
— | — | (14,161 | ) | 1 | — | (1 | ) | — | — | — | |||||||||||||||||
Restricted stock awards granted |
— | — | 385,892 | — | — | — | — | — | — | |||||||||||||||||||
Issuance of common stock related to employee stock purchase plan |
— | — | 27,113 | — | — | 543 | — | — | 543 | |||||||||||||||||||
Preferred stock dividends |
— | — | — | — | — | — | (566 | ) | — | (566 | ) | |||||||||||||||||
| | | | | | | | | | | | | | | | | | | | | | | | | | | | | |
Balance December 31, 2013 |
56,600 | $ | 56,600 | 25,885,863 | $ | 253 | $ | 946 | $ | 242,990 | $ | 96,393 | $ | (3,319 | ) | $ | 393,863 | |||||||||||
| | | | | | | | | | | | | | | | | | | | | | | | | | | | | |
| | | | | | | | | | | | | | | | | | | | | | | | | | | | | |
| | | | | | | | | | | | | | | | | | | | | | | | | | | | | |
Net Income |
— | — | — | — | — | — | 54,258 | — | 54,258 | |||||||||||||||||||
Net change in other comprehensive income |
— | — | — | — | — | — | — | 5,966 | 5,966 | |||||||||||||||||||
Common stock issued to effect merger with |
||||||||||||||||||||||||||||
Virginia Heritage |
— | — | 4,010,261 | 40 | — | 144,053 | — | — | 144,093 | |||||||||||||||||||
Stock-based compensation |
— | — | — | — | — | 3,981 | — | — | 3,981 | |||||||||||||||||||
Issuance of common stock related to options exercised, net of shares withheld for payroll taxes |
— | — | 157,313 | 1 | — | 2,312 | — | — | 2,313 | |||||||||||||||||||
Tax benefits realized from stock compensation |
— | — | — | — | — | 978 | — | — | 978 | |||||||||||||||||||
Vesting of restricted stock awards issued at date of grant, net of shares withheld for payroll taxes |
— | — | (21,858 | ) | 2 | — | (2 | ) | — | — | — | |||||||||||||||||
Restricted stock awards granted |
— | — | 87,927 | — | — | — | — | — | — | |||||||||||||||||||
Issuance of common stock related to employee stock purchase plan |
— | — | 19,890 | — | — | 621 | — | — | 621 | |||||||||||||||||||
Issuance of Series C Preferred Stock |
15,300 | 15,300 | — | — | — | — | — | — | 15,300 | |||||||||||||||||||
Preferred stock dividends |
— | — | — | — | — | — | (614 | ) | — | (614 | ) | |||||||||||||||||
| | | | | | | | | | | | | | | | | | | | | | | | | | | | | |
Balance December 31, 2014 |
71,900 | $ | 71,900 | 30,139,396 | $ | 296 | $ | 946 | $ | 394,933 | $ | 150,037 | $ | 2,647 | $ | 620,759 | ||||||||||||
| | | | | | | | | | | | | | | | | | | | | | | | | | | | | |
| | | | | | | | | | | | | | | | | | | | | | | | | | | | | |
| | | | | | | | | | | | | | | | | | | | | | | | | | | | | |
Net Income |
— | — | — | — | — | — | 84,167 | — | 84,167 | |||||||||||||||||||
Net change in other comprehensive income, net of tax |
— | — | — | — | — | — | — | (2,456 | ) | (2,456 | ) | |||||||||||||||||
Stock-based compensation |
— | — | — | — | — | 5,073 | — | — | 5,073 | |||||||||||||||||||
Issuance of common stock related to options exercised, net of shares withheld for payroll taxes |
— | — | 439,582 | 5 | — | 5,171 | — | — | 5,176 | |||||||||||||||||||
Tax benefits realized from stock compensation |
— | — | — | — | — | 2,984 | — | — | 2,984 | |||||||||||||||||||
Vesting of restricted stock awards issued at date of grant, net of shares withheld for payroll taxes |
— | — | (26,701 | ) | 2 | — | (2 | ) | — | — | — | |||||||||||||||||
Restricted stock awards granted |
— | — | 78,070 | — | — | — | — | — | — | |||||||||||||||||||
Shares issued in public offering, net of issuance costs of $5,302 |
— | — | 2,816,900 | 28 | — | 94,605 | — | — | 94,633 | |||||||||||||||||||
Issuance of common stock related to employee stock purchase plan |
— | — | 20,646 | — | — | 769 | — | — | 769 | |||||||||||||||||||
Cash paid in lieu of fractional shares upon merger with Virginia Heritage |
— | — | — | — | — | (4 | ) | — | — | (4 | ) | |||||||||||||||||
Preferred stock dividends |
— | — | — | — | — | — | (600 | ) | — | (600 | ) | |||||||||||||||||
Redemption of Series B & C Preferred Stock |
(71,900 | ) | (71,900 | ) | — | — | — | — | — | — | (71,900 | ) | ||||||||||||||||
| | | | | | | | | | | | | | | | | | | | | | | | | | | | | |
Balance December 31, 2015 |
— | $ | — | 33,467,893 | $ | 331 | $ | 946 | $ | 503,529 | $ | 233,604 | $ | 191 | $ | 738,601 | ||||||||||||
| | | | | | | | | | | | | | | | | | | | | | | | | | | | | |
| | | | | | | | | | | | | | | | | | | | | | | | | | | | | |
| | | | | | | | | | | | | | | | | | | | | | | | | | | | | |
See notes to consolidated financial statements.
84
EAGLE BANCORP, INC.
Consolidated Statements of Cash Flows
Years Ended December 31
(dollars in thousands)
| |
2015 | 2014 | 2013 | |||||||
|---|---|---|---|---|---|---|---|---|---|---|
Cash Flows From Operating Activities: |
||||||||||
Net Income |
$ | 84,167 | $ | 54,258 | $ | 47,007 | ||||
Adjustments to reconcile net income to net cash |
||||||||||
provided by operating activities: |
||||||||||
Provision for credit losses |
14,638 | 10,879 | 9,602 | |||||||
Depreciation and amortization |
7,780 | 9,027 | 4,227 | |||||||
Gains on sale of loans |
(11,973 | ) | (6,886 | ) | (14,578 | ) | ||||
Securities premium amortization (discount accretion), net |
3,514 | 3,456 | 3,162 | |||||||
Origination of loans held for sale |
(910,595 | ) | (572,342 | ) | (983,332 | ) | ||||
Proceeds from sale of loans held for sale |
919,393 | 576,941 | 1,182,803 | |||||||
Net increase in cash surrender value of BOLI |
(1,589 | ) | (1,283 | ) | (720 | ) | ||||
Increase in deferred income taxes |
(6,729 | ) | (7,540 | ) | (3,965 | ) | ||||
Decrease in value of other real estate owned |
1,100 | 638 | — | |||||||
Net loss on sale of other real estate owned |
328 | 154 | 772 | |||||||
Net gain on sale of investment securities |
(2,254 | ) | (22 | ) | (19 | ) | ||||
Loss on early extinguishment of debt |
1,130 | — | — | |||||||
Stock-based compensation expense |
5,073 | 3,981 | 3,304 | |||||||
Tax benefits realized from stock compensation |
(2,984 | ) | (978 | ) | (410 | ) | ||||
Increase in other assets |
(3,725 | ) | (12,631 | ) | (26 | ) | ||||
Increase in other liabilities |
1,315 | 1,856 | 10,850 | |||||||
| | | | | | | | | | | |
Net cash provided by operating activities |
98,589 | 59,508 | 258,677 | |||||||
| | | | | | | | | | | |
Cash Flows From Investing Activities: |
||||||||||
Decrease (increase) in interest bearing deposits with other banks and short-term investments |
3,058 | (634 | ) | (88 | ) | |||||
Purchases of available for sale investment securities |
(274,904 | ) | (50,404 | ) | (148,373 | ) | ||||
Proceeds from maturities of available for sale securities |
53,966 | 37,571 | 35,985 | |||||||
Proceeds from sale/call of available for sale securities |
111,696 | 49,902 | 22,148 | |||||||
Purchases of Federal Reserve and Federal Home Loan Bank stock |
(2,443 | ) | (5,650 | ) | (731 | ) | ||||
Proceeds from redemption of Federal Reserve and Federal Home Loan Bank stock |
8,100 | 1,374 | 153 | |||||||
Net increase in loans |
(695,720 | ) | (595,543 | ) | (474,542 | ) | ||||
Proceeds from sale of other real estate owned |
5,477 | 520 | 6,783 | |||||||
Proceeds from redemption of BOLI |
— | — | 95 | |||||||
Purchases of BOLI |
(499 | ) | (1,058 | ) | (25,603 | ) | ||||
Purchases of annuities |
(992 | ) | — | (11,227 | ) | |||||
Acquisition of Virginia Heritage, net of cash |
— | (156,581 | ) | — | ||||||
Bank premises and equipment acquired |
(4,660 | ) | (5,223 | ) | (5,336 | ) | ||||
| | | | | | | | | | | |
Net cash used in investing activities |
(796,921 | ) | (725,726 | ) | (600,736 | ) | ||||
| | | | | | | | | | | |
Cash Flows From Financing Activities: |
||||||||||
Increase in deposits |
847,676 | 384,443 | 328,192 | |||||||
Increase (decrease) in customer repurchase agreements |
11,236 | (19,351 | ) | (20,867 | ) | |||||
Issuance of Series C Preferred Stock |
— | 15,300 | — | |||||||
Issuance of common stock |
94,633 | 144,093 | — | |||||||
Redemption of Series B Preferred Stock |
(56,600 | ) | — | — | ||||||
Redemption of Series C Preferred Stock |
(15,300 | ) | — | — | ||||||
(Decrease) increase in short-term borrowings |
(100,000 | ) | 7,500 | — | ||||||
(Decrease) increase in long-term borrowings |
(49,300 | ) | 80,000 | — | ||||||
Payment of dividends on preferred stock |
(600 | ) | (614 | ) | (566 | ) | ||||
Proceeds from exercise of equity compensation plans |
5,176 | 2,313 | 1,984 | |||||||
Tax benefits realized from stock compensation |
2,984 | 978 | 410 | |||||||
Payment in lieu of fractional shares |
(4 | ) | — | (11 | ) | |||||
Proceeds from employee stock purchase plan |
769 | 621 | 543 | |||||||
| | | | | | | | | | | |
Net cash provided by financing activities |
740,670 | 615,283 | 309,685 | |||||||
| | | | | | | | | | | |
Net Increase (Decrease) In Cash and Cash Equivalents |
42,338 | (50,935 | ) | (32,374 | ) | |||||
Cash and Cash Equivalents at Beginning of Year |
256,025 | 306,960 | 339,334 | |||||||
| | | | | | | | | | | |
Cash and Cash Equivalents at End of Year |
$ | 298,363 | $ | 256,025 | $ | 306,960 | ||||
| | | | | | | | | | | |
| | | | | | | | | | | |
| | | | | | | | | | | |
Supplemental Cash Flows Information: |
||||||||||
Interest paid |
$ | 19,586 | $ | 11,742 | $ | 12,910 | ||||
| | | | | | | | | | | |
| | | | | | | | | | | |
| | | | | | | | | | | |
Income taxes paid |
$ | 52,650 | $ | 33,050 | $ | 23,945 | ||||
| | | | | | | | | | | |
| | | | | | | | | | | |
| | | | | | | | | | | |
Non-Cash Investing Activities |
||||||||||
Transfers from loans to other real estate owned |
$ | 1,725 | $ | 5,311 | $ | 14,842 | ||||
| | | | | | | | | | | |
| | | | | | | | | | | |
| | | | | | | | | | | |
Transfers from other real estate owned to loans |
$ | 2,192 | $ | — | $ | 3,361 | ||||
| | | | | | | | | | | |
| | | | | | | | | | | |
| | | | | | | | | | | |
See notes to consolidated financial statements.
85
Eagle Bancorp, Inc.
Notes to Consolidated Financial Statements
for the Years Ended December 31, 2015, 2014 and 2013:
Note 1—Summary of Significant Accounting Policies
The Consolidated Financial Statements include the accounts of Eagle Bancorp, Inc. and its subsidiaries (the "Company"), EagleBank (the "Bank"), Eagle Commercial Ventures, LLC ("ECV"), Eagle Insurance Services, LLC, and Bethesda Leasing, LLC, with all significant intercompany transactions eliminated. The investment in subsidiaries is recorded on the Company's books (Parent Only) on the basis of its equity in the net assets of the subsidiary. The accounting and reporting policies of the Company conform to generally accepted accounting principles ("GAAP") in the United States of America and to general practices in the banking industry. Certain reclassifications have been made to amounts previously reported to conform to the classification made in 2015. The following is a summary of the more significant accounting policies.
Nature of Operations
The Company, through the Bank, conducts a full service community banking business, primarily in Northern Virginia, Montgomery County, Maryland, and Washington, D.C. The primary financial services offered by the Bank include real estate, commercial and consumer lending, as well as traditional deposit and repurchase agreement products. The Bank is also active in the origination and sale of residential mortgage loans and the origination of small business loans. The guaranteed portion of small business loans, guaranteed by the Small Business Administration ("SBA"), is typically sold to third party investors in a transaction apart from the loan's origination. As of December 31, 2015, the Bank offers its products and services through twenty one banking offices, five lending centers and various electronic capabilities, including remote deposit services and mobile banking services. Eagle Insurance Services, LLC, a subsidiary of the Bank, offers access to insurance products and services through a referral program with a third party insurance broker. Eagle Commercial Ventures, LLC, a direct subsidiary of the Company, provides subordinated financing for the acquisition, development and construction of real estate projects; these transactions involve higher levels of risk, together with commensurate higher returns. Refer to Higher Risk Lending—Revenue Recognition below.
Use of Estimates
The preparation of financial statements in conformity with GAAP requires management to make estimates and assumptions that affect the reported amounts in the financial statements and accompanying notes. Actual results may differ from those estimates and such differences could be material to the financial statements.
Business Combinations
Business combinations are accounted for by applying the acquisition method in accordance with Accounting Standards Codification ("ASC") 805, "Business Combinations". Under the acquisition method, identifiable assets acquired and liabilities assumed, and any non-controlling interest in the acquiree at the acquisition date are measured at their fair values as of that date, and are recognized separately from goodwill. Results of operations of the acquired entities are included in the consolidated statement of income from the date of acquisition.
Refer to Note 2 for information relating to the Company's acquisition of Virginia heritage Bank ("Virginia Heritage").
86
Eagle Bancorp, Inc.
Notes to Consolidated Financial Statements
for the Years Ended December 31, 2015, 2014 and 2013: (Continued)
Note 1—Summary of Significant Accounting Policies (Continued)
Cash Flows
For purposes of reporting cash flows, cash and cash equivalents include cash and due from banks, federal funds sold, and interest bearing deposits with other banks which have an original maturity of three months or less.
Loans Held for Sale
The Company regularly engages in sales of residential mortgage loans and the guaranteed portion of SBA loans originated by the Bank. Loans held for sale are carried at fair value. Fair value is derived from secondary market quotations for similar instruments. Gains and losses on sales of these loans are recorded as a component of noninterest income in the Consolidated Statements of Operations.
The Company's current practice is to sell residential mortgage loans on a servicing released basis, and, therefore, it has no intangible asset recorded for the value of such servicing as of December 31, 2015 and December 31, 2014. The sale of the guaranteed portion of SBA loans on a servicing retained basis gives rise to an excess servicing asset, which is computed on a loan by loan basis with the unamortized amount being included in intangible assets in the Consolidated Balance Sheets. This excess servicing asset is being amortized on a straight-line basis (with adjustment for prepayments) as an offset to servicing fees collected and is included in other income in the Consolidated Statement of Operations.
The Company enters into commitments to originate residential mortgage loans whereby the interest rate on the loan is determined prior to funding (i.e. interest rate lock commitments). Such interest rate lock commitments on mortgage loans to be sold in the secondary market are considered to be derivatives. To protect against the price risk inherent in residential mortgage loan commitments, the Company utilizes both "best efforts" and "mandatory delivery" forward loan sale commitments to mitigate the risk of potential decreases in the values of loans that would result from the exercise of the derivative loan commitments. Under a "best efforts" contract, the Company commits to deliver an individual mortgage loan of a specified principal amount and quality to an investor and the investor commits to a price that it will purchase the loan from the Company if the loan to the underlying borrower closes. The Company protects itself from changes in interest rates through the use of best efforts forward delivery commitments, whereby the investor commits to purchase a loan at a price representing a premium on the day the borrower commits to an interest rate with the intent that the buyer/investor has assumed the interest rate risk on the loan. As a result, the Bank is not generally exposed to losses on loans sold utilizing best efforts, nor will it realize gains related to rate lock commitments due to changes in interest rates. The market values of interest rate lock commitments and best efforts contracts are not readily ascertainable with precision because rate lock commitments and best efforts contracts are not actively traded. Because of the high correlation between rate lock commitments and best efforts contracts, no gain or loss should occur on the interest rate lock commitments. Under a "mandatory delivery" contract, the Company commits to deliver a certain principal amount of mortgage loans to an investor at a specified price on or before a specified date. If the Company fails to deliver the amount of mortgages necessary to fulfill the commitment by the specified date, it is obligated to pay the investor a "pair-off" fee, based on then-current market prices, to compensate the investor for the shortfall. The Company manages the interest rate risk on interest rate lock commitments by entering into forward sale contracts of mortgage backed securities, whereby the Company obtains the right to deliver securities to investors in the future at a specified price. Such contracts are accounted for as derivatives and are recorded at fair value in derivative assets or
87
Eagle Bancorp, Inc.
Notes to Consolidated Financial Statements
for the Years Ended December 31, 2015, 2014 and 2013: (Continued)
Note 1—Summary of Significant Accounting Policies (Continued)
liabilities, carried on the Consolidated Balance Sheet within other assets or other liabilities with changes in fair value recorded in other income within the Consolidated Statement of Income. The period of time between issuance of a loan commitment to the customer and closing and sale of the loan to an investor generally ranges from 30 to 90 days under current market conditions. The gross gains on loan sales are recognized based on new loan commitments with adjustment for price and pair-off activity. Commission expenses on loans held for sale are recognized based on loans closed.
In circumstances where the Company does not deliver the whole loan to an investor, but rather elects to retain the loan in its portfolio, the loan is transferred from held for sale to loans at fair value at date of transfer.
Investment Securities
The Company has no securities classified as trading, or as held to maturity. Marketable equity securities and debt securities not classified as held to maturity or trading are classified as available-for-sale. Securities available-for-sale are acquired as part of the Company's asset/liability management strategy and may be sold in response to changes in interest rates, current market conditions, loan demand, changes in prepayment risk and other factors. Securities available-for-sale are carried at fair value, with unrealized gains or losses being reported as accumulated other comprehensive income/(loss), a separate component of shareholders' equity, net of deferred income tax. Realized gains and losses, using the specific identification method, are included as a separate component of noninterest income in the Consolidated Statements of Operations.
Premiums and discounts on investment securities are amortized/accreted to the earlier of call or maturity based on expected lives, which lives are adjusted based on prepayment assumptions and call optionality, if any. Declines in the fair value of individual available-for-sale securities below their cost that are other-than-temporary in nature result in write-downs of the individual securities to their fair value. Factors affecting the determination of whether other-than-temporary impairment has occurred include a downgrading of the security by a rating agency, a significant deterioration in the financial condition of the issuer, or a change in management's intent and ability to hold a security for a period of time sufficient to allow for any anticipated recovery in fair value. Management systematically evaluates investment securities for other-than-temporary declines in fair value on a quarterly basis. This analysis requires management to consider various factors, which include: (1) duration and magnitude of the decline in value; (2) the financial condition of the issuer or issuers: and (3) structure of the security.
The entire amount of an impairment loss is recognized in earnings only when: (1) the Company intends to sell the security; or (2) it is more likely than not that the Company will have to sell the security before recovery of its amortized cost basis; or (3) the Company does not expect to recover the entire amortized cost basis of the security. In all other situations, only the portion of the impairment loss representing the credit loss must be recognized in earnings, with the remaining portion being recognized in shareholders' equity as comprehensive income, net of deferred taxes.
Loans
Loans are stated at the principal amount outstanding, net of unamortized deferred costs and fees. Interest income on loans is accrued at the contractual rate on the principal amount outstanding. It is the
88
Eagle Bancorp, Inc.
Notes to Consolidated Financial Statements
for the Years Ended December 31, 2015, 2014 and 2013: (Continued)
Note 1—Summary of Significant Accounting Policies (Continued)
Company's policy to discontinue the accrual of interest when circumstances indicate that collection is doubtful. Deferred fees and costs are being amortized on the interest method over the term of the loan.
Management considers loans impaired when, based on current information, it is probable that the Company will not collect all principal and interest payments according to contractual terms. Loans are evaluated for impairment in accordance with the Company's portfolio monitoring and ongoing risk assessment procedures. Management considers the financial condition of the borrower, cash flow of the borrower, payment status of the loan, and the value of the collateral, if any, securing the loan. Generally, impaired loans do not include large groups of smaller balance homogeneous loans such as residential real estate and consumer type loans which are evaluated collectively for impairment and are generally placed on nonaccrual when the loan becomes 90 days past due as to principal or interest. Loans specifically reviewed for impairment are not considered impaired during periods of "minimal delay" in payment (90 days or less) provided eventual collection of all amounts due is expected. The impairment of a loan is measured based on the present value of expected future cash flows discounted at the loan's effective interest rate, or the fair value of the collateral if repayment is expected to be provided solely by the collateral. In appropriate circumstances, interest income on impaired loans may be recognized on a cash basis.
Higher Risk Lending—Revenue Recognition
The Company has occasionally made higher risk acquisition, development, and construction ("ADC") loans that entail higher risks than ADC loans made following normal underwriting practices ("higher risk loan transactions"). These higher risk loan transactions are currently made through the Company's subsidiary, ECV. This activity is limited as to individual transaction amount and total exposure amounts, based on capital levels, and is carefully monitored. The loans are carried on the balance sheet at amounts outstanding and meet the loan classification requirements of the Accounting Standard Executive Committee ("AcSEC") guidance reprinted from the CPA Letter, Special Supplement, dated February 10, 1986 (also referred to as Exhibit 1 to AcSEC Practice Bulletin No. 1). Additional interest earned on these higher risk loan transactions (as defined in the individual loan agreements) is recognized as realized under the provisions contained in AcSEC's guidance reprinted from the CPA Letter, Special Supplement, dated February 10, 1986 (also referred to as Exhibit 1 to AcSEC Practice Bulletin No.1) and Staff Accounting Bulletin No. 101 (Revenue Recognition in Financial Statements). Certain additional interest is included as a component of noninterest income. ECV recorded no additional interest on higher risk loan transactions during 2015, 2014 or 2013 (although normal interest income was recorded) and had four higher risk loan transactions outstanding as of December 31, 2015, as compared to four higher risk loan transactions outstanding as of December 31, 2014, amounting to $9.2 million and $6.2 million, respectively.
Allowance for Credit Losses
The allowance for credit losses represents an amount, which in management's judgment, is adequate to absorb probable losses on loans and other extensions of credit that may become uncollectible. The adequacy of the allowance for credit losses is determined through careful and continuous review and evaluation of the loan portfolio and involves the balancing of a number of factors to establish a prudent level of allowance. Among the factors considered in evaluating the adequacy of the allowance for credit losses are lending risks associated with growth and entry into new markets, loss allocations for specific credits, the level of the allowance to nonperforming loans, historical loss experience, economic conditions,
89
Eagle Bancorp, Inc.
Notes to Consolidated Financial Statements
for the Years Ended December 31, 2015, 2014 and 2013: (Continued)
Note 1—Summary of Significant Accounting Policies (Continued)
portfolio trends and credit concentrations, changes in the size and character of the loan portfolio, and management's judgment with respect to current and expected economic conditions and their impact on the existing loan portfolio. Allowances for impaired loans are generally determined based on collateral values. Loans or any portion thereof deemed uncollectible are charged against the allowance, while recoveries are credited to the allowance. Management adjusts the level of the allowance through the provision for credit losses, which is recorded as a current period operating expense. The allowance for credit losses consists of allocated and unallocated components.
The components of the allowance for credit losses represent an estimation done pursuant to ASC Topic 450, "Contingencies," or ASC Topic 310, "Receivables." Specific allowances are established in cases where management has identified significant conditions or circumstances related to a specific credit that management believes indicate the probability that a loss may be incurred. For potential problem credits for which specific allowance amounts have not been determined, the Company establishes allowances according to the application of credit risk factors. These factors are set by management and approved by the appropriate Board committee to reflect its assessment of the relative level of risk inherent in each risk grade. A third component of the allowance computation, termed a nonspecific or environmental factors allowance, is based upon management's evaluation of various environmental conditions that are not directly measured in the determination of either the specific allowance or formula allowance. Such conditions include general economic and business conditions affecting key lending areas, credit quality trends (including trends in delinquencies and nonperforming loans expected to result from existing conditions), loan volumes and concentrations, specific industry conditions within portfolio categories, recent loss experience in particular loan categories, duration of the current business cycle, bank regulatory examination results, findings of outside review consultants, and management's judgment with respect to various other conditions including credit administration and management and the quality of risk identification systems. Executive management reviews these environmental conditions quarterly, and documents the rationale for all changes.
Management believes that the allowance for credit losses is adequate; however, determination of the allowance is inherently subjective and requires significant estimates. While management uses available information to recognize losses on loans, future additions to the allowance may be necessary based on changes in economic conditions. Evaluation of the potential effects of these factors on estimated losses involves a high degree of uncertainty, including the strength and timing of economic cycles and concerns over the effects of a prolonged economic downturn in the current cycle. In addition, various banking agencies, as an integral part of their examination process, and independent consultants engaged by the Bank, periodically review the Bank's loan portfolio and allowance for credit losses. Such review may result in recognition of additions to the allowance based on their judgments of information available to them at the time of their examination. The review of the adequacy of the Allowance for Credit Losses includes an assessment of the fair value adjustment for acquired loans in accordance with generally accepted accounting principles.
Premises and Equipment
Premises and equipment are stated at cost less accumulated depreciation and amortization computed using the straight-line method for financial reporting purposes. Premises and equipment are depreciated over the useful lives of the assets, which generally range from five to seven years for furniture, fixtures and equipment, three to five years for computer software and hardware, and ten to forty years for buildings and
90
Eagle Bancorp, Inc.
Notes to Consolidated Financial Statements
for the Years Ended December 31, 2015, 2014 and 2013: (Continued)
Note 1—Summary of Significant Accounting Policies (Continued)
building improvements. Leasehold improvements are amortized over the terms of the respective leases, which may include renewal options where management has the positive intent to exercise such options, or the estimated useful lives of the improvements, whichever is shorter. The costs of major renewals and betterments are capitalized, while the costs of ordinary maintenance and repairs are expensed as incurred. These costs are included as a component of premises and equipment expenses on the Consolidated Statements of Operations.
Other Real Estate Owned ("OREO")
Assets acquired through loan foreclosure are held for sale and are recorded at fair value less estimated selling costs when acquired, establishing a new cost basis. The new basis is supported by appraisals that are generally no more than twelve months old. Costs after acquisition are generally expensed. If the fair value of the asset declines, a write-down is recorded through noninterest expense. The valuation of foreclosed assets is subjective in nature and may be adjusted in the future because of changes in market conditions or appraised values.
Goodwill and Other Intangible Assets
Goodwill represents the excess of the cost of an acquisition over the fair value of the net assets acquired. Other intangible assets represent purchased assets that lack physical substance but can be distinguished from goodwill because of contractual or other legal rights. Intangible assets that have finite lives, such as core deposit intangibles, are amortized over their estimated useful lives and subject to periodic impairment testing. Intangible assets (other than goodwill) are amortized to expense using accelerated or straight-line methods over their respective estimated useful lives.
Goodwill and other intangibles are subject to impairment testing at the reporting unit level, which must be conducted at least annually. The Company performs impairment testing during the fourth quarter of each year or when events or changes in circumstances indicate the assets might be impaired.
The Company performs a qualitative assessment to determine whether it is more likely than not that the fair value of a reporting unit is less than its carrying amount. If, after assessing updated qualitative factors, the Company determines it is not more likely than not that the fair value of a reporting unit is less than its carrying amount, it does not have to perform the two-step goodwill impairment test. Determining the fair value of a reporting unit under the first step of the goodwill impairment test and determining the fair value of individual assets and liabilities of a reporting unit under the second step of the goodwill impairment test are judgmental and often involve the use of significant estimates and assumptions. Similarly, estimates and assumptions are used in determining the fair value of other intangible assets. Estimates of fair value are primarily determined using discounted cash flows, market comparisons and recent transactions. These approaches use significant estimates and assumptions including projected future cash flows, discount rates reflecting the market rate of return, projected growth rates and determination and evaluation of appropriate market comparables. Based on the results of quantitative assessments of all reporting units, the Company concluded that no impairment existed at December 31, 2015. However, future events could cause the Company to conclude that goodwill or other intangibles have become impaired, which would result in recording an impairment loss. Any resulting impairment loss could have a material adverse impact on the Company's financial condition and results of operations.
91
Eagle Bancorp, Inc.
Notes to Consolidated Financial Statements
for the Years Ended December 31, 2015, 2014 and 2013: (Continued)
Note 1—Summary of Significant Accounting Policies (Continued)
Interest Rate Swap Derivatives
The Company is exposed to certain risks arising from both its business operations and economic conditions. The Company principally manages its exposures to a wide variety of business and operational risks through management of its core business activities. The Company manages economic risks, including interest rate, liquidity, and credit risk, primarily by managing the amount, sources, and duration of its assets and liabilities and through the use of derivative financial instruments. Specifically, the Company enters into derivative financial instruments to manage exposures that arise from business activities that result in the receipt or payment of future known and uncertain cash amounts, the value of which are determined by interest rates. With the exception of forward commitment contracts discussed above under "Loans Held for Sale", the Company's derivative financial instruments are used to manage differences in the amount, timing, and duration of the Company's known or expected cash receipts and its known or expected cash payments principally related to certain variable rate deposits.
At the inception of a derivative contract, the Company designates the derivative as one of three types based on the Company's intentions and belief as to the likely effectiveness as a hedge. These three types are (1) a hedge of the fair value of a recognized asset or liability or of an unrecognized firm commitment ("fair value hedge"), (2) a hedge of a forecasted transaction or the variability of cash flows to be received or paid related to a recognized asset or liability ("cash flow hedge"), or (3) an instrument with no hedging designation ("stand-alone derivative"). The Company has no fair value hedges or stand-alone derivatives, only cash flow hedges. For a cash flow hedge, the gain or loss on the derivative is reported in other comprehensive income (a Consolidated Balance Sheet component of shareholders' equity) and is reclassified into earnings in the same period(s) during which the hedged transaction affects earnings (i.e. the period when cash flows are exchanged between counterparties). For both fair value and cash flow hedges, changes in the fair value of derivatives that are not highly effective in hedging the changes in fair value or expected cash flows of the hedged item are recognized immediately in current earnings. Changes in the fair value of derivatives that do not qualify for hedge accounting are reported currently in earnings, as noninterest income.
Net cash settlements on derivatives that qualify for hedge accounting are recorded in interest income or interest expense, based on the item being hedged. Net cash settlements on derivatives that do not qualify for hedge accounting are reported in noninterest income. Cash flows on hedges are classified in the cash flow statement the same as the cash flows of the items being hedged.
The Company formally documents the relationship between derivatives and hedged items, as well as the risk-management objective and the strategy for undertaking hedge transactions at the inception of the hedging relationship. This documentation includes linking fair value or cash flow hedges to specific assets and liabilities on the balance sheet or to specific firm commitments or forecasted transactions. The Company also formally assesses, both at the hedge's inception and on an ongoing basis, whether the derivative instruments that are used are highly effective in offsetting changes in fair values or cash flows of the hedged items. The Company discontinues hedge accounting when it determines that the derivative is no longer effective in offsetting changes in the fair value or cash flows of the hedged item, the derivative is settled or terminates, a hedged forecasted transaction is no longer probable, a hedged firm commitment is no longer firm, or treatment of the derivative as a hedge is no longer appropriate or intended.
When hedge accounting is discontinued, subsequent changes in fair value of the derivative are recorded as noninterest income or expense. When a fair value hedge is discontinued, the hedged asset or
92
Eagle Bancorp, Inc.
Notes to Consolidated Financial Statements
for the Years Ended December 31, 2015, 2014 and 2013: (Continued)
Note 1—Summary of Significant Accounting Policies (Continued)
liability is no longer adjusted for changes in fair value and the existing basis adjustment is amortized or accreted over the remaining life of the asset or liability. When a cash flow hedge is discontinued but the hedged cash flows or forecasted transactions are still expected to occur, gains or losses that were accumulated in other comprehensive income are amortized into earnings over the same periods in which the hedged transactions will affect earnings. Please refer to Note 10 to the Consolidated Financial Statements for further detail.
Customer Repurchase Agreements
The Company enters into agreements under which it sells securities subject to an obligation to repurchase the same securities. Under these arrangements, the Company may transfer legal control over the assets but still retain effective control through an agreement that both entitles and obligates the Company to repurchase the assets. As a result, securities sold under agreements to repurchase are accounted for as collateralized financing arrangements and not as a sale and subsequent repurchase of securities. The agreements are entered into primarily as accommodations for large commercial deposit customers. The obligation to repurchase the securities is reflected as a liability in the Company's Consolidated Balance Sheets, while the securities underlying the securities sold under agreements to repurchase remain in the respective assets accounts and are delivered to and held as collateral by third party trustees.
Marketing and Advertising
Marketing and advertising costs are generally expensed as incurred.
Income Taxes
The Company employs the liability method of accounting for income taxes as required by ASC Topic 740, "Income Taxes." Under the liability method, deferred-tax assets and liabilities are determined based on differences between the financial statement carrying amounts and the tax basis of existing assets and liabilities (i.e. temporary timing differences) and are measured at the enacted rates that will be in effect when these differences reverse. The Company utilizes statutory requirements for its income tax accounting, and avoids risks associated with potentially problematic tax positions that may incur challenge upon audit, where an adverse outcome is more likely than not. Therefore, no provisions are made for either uncertain tax positions nor accompanying potential tax penalties and interest for underpayments of income taxes in the Company's tax reserves. In accordance with ASC Topic 740, the Company may establish a reserve against deferred tax assets in those cases where realization is less than certain, although no such reserves exist at either December 31, 2015 or December 31, 2014.
Transfer of Financial Assets
Transfers of financial assets are accounted for as sales, when control over the assets has been surrendered. Control over transferred assets is deemed to be surrendered when: (1) the assets have been isolated from the Company; (2) the transferee obtains the right (free of conditions that constrain it from taking advantage of that right) to pledge or exchange the transferred assets; and (3) the Company does not maintain effective control over the transferred assets through an agreement to repurchase them before
93
Eagle Bancorp, Inc.
Notes to Consolidated Financial Statements
for the Years Ended December 31, 2015, 2014 and 2013: (Continued)
Note 1—Summary of Significant Accounting Policies (Continued)
their maturity. In certain cases, the recourse to the Bank to repurchase assets may exist but is deemed immaterial based on the specific facts and circumstances.
Earnings per Common Share
Basic net income per common share is derived by dividing net income available to common shareholders by the weighted-average number of common shares outstanding during the period measured. Diluted earnings per common share is computed by dividing net income available to common shareholders by the weighted-average number of common shares outstanding during the period measured including the potential dilutive effects of common stock equivalents.
Stock-Based Compensation
In accordance with ASC Topic 718, "Compensation," the Company records as compensation expense an amount equal to the amortization (over the remaining service period) of the fair value (computed at the date of option grant) of any outstanding fixed stock option grant and restricted stock award. Compensation expense on variable stock option grants and awards (i.e. performance based grants and awards) if any, is recorded based on the probability of achievement of the goals underlying the performance grant. Refer to Note 17 for a description of stock-based compensation awards, activity and expense for the years ended December 31, 2015, 2014 and 2013.
New Authoritative Accounting Guidance
In April 2015, the Financial Accounting Standards Board ("FASB") issued ASU No. 2015-03, "Interest—Imputation of Interest (Subtopic 835-30): Simplifying the Presentation of Debt Issuance Costs." The update simplifies the presentation of debt issuance costs by requiring that debt issuance costs be presented in the balance sheet as a direct deduction from the carrying amount of debt liability, consistent with debt discounts or premiums. The recognition and measurement guidance for debt issuance costs are not affected by the amendments in this update. This update will be effective for interim and annual periods beginning after December 15, 2015, and is to be applied retrospectively. The Company does not expect the guidance to have a material impact on its financial statements.
In September 2015, the FASB issued ASU 2015-16, "Business Combinations (Topic 805)—Simplifying the Accounting for Measurement-Period Adjustments." ASU 2015-16 requires that adjustments to provisional amounts that are identified during the measurement period of a business combination be recognized in the reporting period in which the adjustment amounts are determined. Furthermore, the income statement effects of such adjustments, if any, must be calculated as if the accounting had been completed at the acquisition date. The amendments also require the Company to report on its income statement or include a footnote disclosure the portion of the amount recorded in current-period earnings by line item that would have been recorded in previous reporting periods if the adjustment to the provisional amounts had been recognized as of the acquisition date. Under previous guidance, adjustments to provisional amounts identified during the measurement period are to be recognized retrospectively. ASU 2015-16 will be effective for the Company on January 1, 2016 and is not expected to have a significant impact on its financial statements.
In January 2016, the FASB issued ASU 2016-1, "No. 2016-01, Financial Instruments—Overall (Subtopic 825-10): Recognition and Measurement of Financial Assets and Financial Liabilities. ASU 2016-1,
94
Eagle Bancorp, Inc.
Notes to Consolidated Financial Statements
for the Years Ended December 31, 2015, 2014 and 2013: (Continued)
Note 1—Summary of Significant Accounting Policies (Continued)
among other things, (i) requires equity investments, with certain exceptions, to be measured at fair value with changes in fair value recognized in net income, (ii) simplifies the impairment assessment of equity investments without readily determinable fair values by requiring a qualitative assessment to identify impairment, (iii) eliminates the requirement for public business entities to disclose the methods and significant assumptions used to estimate the fair value that is required to be disclosed for financial instruments measured at amortized cost on the balance sheet, (iv) requires public business entities to use the exit price notion when measuring the fair value of financial instruments for disclosure purposes, (v) requires an entity to present separately in other comprehensive income the portion of the total change in the fair value of a liability resulting from a change in the instrument-specific credit risk when the entity has elected to measure the liability at fair value in accordance with the fair value option for financial instruments, (vi) requires separate presentation of financial assets and financial liabilities by measurement category and form of financial asset on the balance sheet or the accompanying notes to the financial statements and (viii) clarifies that an entity should evaluate the need for a valuation allowance on a deferred tax asset related to available-for-sale. ASU 2016-1 will be effective for us on January 1, 2018 and is not expected to have a significant impact on our financial statements.
Note 2—Mergers and Acquisitions
On October 31, 2014, the Company completed its acquisition of Virginia Heritage, a banking institution based in Fairfax County, Virginia. The acquisition of Virginia Heritage was effected through the merger (the "Merger") of Virginia Heritage with and into EagleBank, in accordance with the Agreement and Plan of Reorganization (the "Merger Agreement") among the Company, EagleBank and Virginia Heritage, dated June 9, 2014. Pursuant to the Merger Agreement, each share of Virginia Heritage common stock was converted into the right to receive 0.6632 shares of Company common stock and $7.50 in cash, plus cash in lieu of fractional shares. Outstanding options to acquire Virginia Heritage common stock were converted into fully vested options to purchase an aggregate of 401,497 shares of Company common stock. In connection with the Merger, the Company paid an aggregate of $45.4 million in cash to former shareholders of Virginia Heritage and issued 4,010,261 shares of Company common stock. On the acquisition date, the estimated fair values of Virginia Heritage included $914 million in assets, $800 million in loans and $645 million in deposits. The acquisition was valued at $189 million Additionally, pursuant to the Merger Agreement, each of the 15,300 shares of Virginia Heritage's Senior Non-Cumulative Perpetual Preferred Stock, Series A, $1,000 liquidation amount per share ("Virginia Heritage Series A Preferred Stock"), which was issued to the U.S. Treasury pursuant to the Small Business Lending Fund Program ("SBLF"), was exchanged for one share of a new series of the Company's Senior Non-Cumulative Perpetual Preferred Stock, Series C, liquidation amount $1,000 per share (the "Series C Preferred Stock"), which ranks equally with and has substantially identical terms and conditions as the Company's Senior Non-Cumulative Perpetual Preferred Stock, Series B, liquidation amount $1,000 per share ("Series B Preferred Stock"). The Series C Preferred Stock has a dividend rate of 1.00%. On November 2, 2015, the Company redeemed all Series B and Series C Preferred Stock as detailed in Note 13. The assets acquired and liabilities assumed were accounted for under the acquisition method of accounting. The assets and liabilities, both tangible and intangible, were recorded at their fair value as of October 31, 2014, based on management's best estimates using the information available as of the merger date. The Company incurred $4.7 million of acquisition related expenses during the year ended December 31, 2014 related to the acquisition of Virginia Heritage, included within "Merger expenses" in the Consolidated Statements of Operations.
95
Eagle Bancorp, Inc.
Notes to Consolidated Financial Statements
for the Years Ended December 31, 2015, 2014 and 2013: (Continued)
Note 2—Mergers and Acquisitions (Continued)
Virginia Heritage's results of operations have been included in the Company's consolidated statements of income and comprehensive income for the two months ended December 31, 2014. Based on a purchase price allocation, the Company recorded $102.3 million in goodwill and $4.6 million in core deposit intangibles as a result of the acquisition. Based on allowable adjustments through October 31, 2015, the unidentified intangible (goodwill) was reduced by approximately $257 thousand. Goodwill is not amortized for book purposes; however, it is reviewed at least annually for impairment, and is not deductible for tax purposes.
Except for collateral dependent loans, the fair values for loans acquired from Virginia Heritage were estimated using cash flow projections based on the remaining maturity and repricing terms. Cash flows were adjusted by estimating future credit losses and the rate of prepayments. Projected monthly cash flows were then discounted to present value using a risk-adjusted market rate for similar loans. For collateral dependent loans with deteriorated credit quality, fair value was estimated by analyzing the value of the underlying collateral, assuming the fair values of the loans were derived from the eventual sale of the collateral. These values were discounted using market derived rates of return, with consideration given to the period of time and costs associated with the foreclosure and disposition of the collateral.
The core deposit intangible asset recognized is being amortized on an accelerated basis over the remaining estimated life, currently expected to be 5 years.
Goodwill is not amortized for book purposes; however, it is reviewed at least annually for impairment and is not deductible for tax purposes.
The fair value of premises and equipment and other real estate owned was estimated using appraisals of like kind properties and assets. Premises, equipment and leasehold improvements will be amortized or depreciated over their estimated useful lives ranging from one to five years for equipment or over the life of the lease for leasehold improvements. Other real estate owned is not amortized and is carried at estimated fair value determined by the appraised value less costs to sell.
The fair value of retail demand and interest bearing deposit accounts was assumed to approximate the carrying value as these accounts have no stated maturity and are payable on demand. The fair value of time deposits was estimated by discounting the contractual future cash flows using market rates offered for time deposits of similar remaining maturities. The fair value of borrowed funds was estimated by discounting the future cash flows using market rates for similar borrowings.
Note 3—Cash and Due from Banks
Regulation D of the Federal Reserve Act requires that banks maintain reserve balances with the Federal Reserve Bank of Richmond ("Federal Reserve Bank") based principally on the type and amount of their deposits. During 2015, the Bank maintained balances at the Federal Reserve sufficient to meet the reserve requirements as well as significant excess reserves. Late in 2008, the Federal Reserve in connection with the Emergency Economic Stabilization Act of 2008 began paying a nominal amount of interest on balances held, which interest on excess reserves was increased under provisions of the Dodd Frank Wall Street Reform and Consumer Protection Act passed in July 2010.
Additionally, the Bank maintains interest-bearing balances with the Federal Home Loan Bank of Atlanta and noninterest bearing balances with nine domestic correspondent banks as compensation for services they provide to the Bank.
96
Eagle Bancorp, Inc.
Notes to Consolidated Financial Statements
for the Years Ended December 31, 2015, 2014 and 2013: (Continued)
Note 4—Investment Securities Available-for-Sale
The amortized cost and estimated fair values of investments available-for-sale at December 31, 2015 and 2014 are as follows:
December 31, 2015
|
Amortized Cost |
Gross Unrealized Gains |
Gross Unrealized Losses |
Estimated Fair Value |
|||||||||
|---|---|---|---|---|---|---|---|---|---|---|---|---|---|
| (dollars in thousands) |
|
|
|
|
|||||||||
U. S. agency securities |
$ | 56,775 | $ | 477 | $ | 277 | $ | 56,975 | |||||
Residential mortgage backed securities |
299,709 | 692 | 3,160 | 297,241 | |||||||||
Municipal bonds |
114,253 | 4,131 | 3 | 118,381 | |||||||||
Corporate bonds |
15,090 | — | 152 | 14,938 | |||||||||
Other equity investments |
307 | 27 | — | 334 | |||||||||
| | | | | | | | | | | | | | |
|
$ | 486,134 | $ | 5,327 | $ | 3,592 | $ | 487,869 | |||||
| | | | | | | | | | | | | | |
| | | | | | | | | | | | | | |
| | | | | | | | | | | | | | |
December 31, 2014
|
Amortized Cost |
Gross Unrealized Gains |
Gross Unrealized Losses |
Estimated Fair Value |
|||||||||
|---|---|---|---|---|---|---|---|---|---|---|---|---|---|
| (dollars in thousands) |
|
|
|
|
|||||||||
U. S. agency securities |
$ | 29,434 | $ | 500 | $ | 40 | $ | 29,894 | |||||
Residential mortgage backed securities |
241,120 | 1,716 | 2,516 | 240,320 | |||||||||
Municipal bonds |
106,983 | 4,850 | 121 | 111,712 | |||||||||
Other equity investments |
396 | 21 | — | 417 | |||||||||
| | | | | | | | | | | | | | |
|
$ | 377,933 | $ | 7,087 | $ | 2,677 | $ | 382,343 | |||||
| | | | | | | | | | | | | | |
| | | | | | | | | | | | | | |
| | | | | | | | | | | | | | |
In addition, at December 31, 2015 and December 31, 2014, the Company held $16.9 million and $22.6 million in equity securities in a combination of Federal Reserve Bank and Federal Home Loan Bank ("FHLB") stocks, which are required to be held for regulatory purposes and which are not marketable, and therefore are carried at cost.
The unrealized losses that exist are generally the result of changes in market interest rates and interest spread relationships since original purchases. The weighted average duration of debt securities, which comprise 99.9% of total investment securities, is relatively short at 3.9 years. If quoted prices are not available, fair value is measured using independent pricing models or other model-based valuation techniques such as the present value of future cash flows, adjusted for the security's credit rating, prepayment assumptions and other factors such as credit loss assumptions. The Company does not believe that the investment securities that were in an unrealized loss position as of December 31, 2015 represent an other-than-temporary impairment. The Company does not intend to sell the investments and it is more likely than not that the Company will not have to sell the securities before recovery of its amortized cost basis, which may be at maturity.
97
Eagle Bancorp, Inc.
Notes to Consolidated Financial Statements
for the Years Ended December 31, 2015, 2014 and 2013: (Continued)
Note 4—Investment Securities Available-for-Sale (Continued)
Gross unrealized losses and fair value by length of time that the individual available-for-sale securities have been in a continuous unrealized loss position as of December 31, 2015 and 2014 are as follows:
| |
Less than 12 Months | 12 Months or Greater | Total | ||||||||||||||||
|---|---|---|---|---|---|---|---|---|---|---|---|---|---|---|---|---|---|---|---|
December 31, 2015
|
Estimated Fair Value |
Unrealized Losses |
Estimated Fair Value |
Unrealized Losses |
Estimated Fair Value |
Unrealized Losses |
|||||||||||||
| (dollars in thousands) |
|
|
|
|
|
|
|||||||||||||
U. S. agency securities |
$ | 32,927 | $ | 277 | $ | — | $ | — | $ | 32,927 | $ | 277 | |||||||
Residential mortgage backed securities |
157,871 | 1,438 | 58,954 | 1,722 | 216,825 | 3,160 | |||||||||||||
Municipal bonds |
1,559 | 3 | — | — | 1,559 | 3 | |||||||||||||
Corporate bonds |
14,938 | 152 | — | — | 14,938 | 152 | |||||||||||||
| | | | | | | | | | | | | | | | | | | | |
|
$ | 207,295 | $ | 1,870 | $ | 58,954 | $ | 1,722 | $ | 266,249 | $ | 3,592 | |||||||
| | | | | | | | | | | | | | | | | | | | |
| | | | | | | | | | | | | | | | | | | | |
| | | | | | | | | | | | | | | | | | | | |
| |
Less than 12 Months | 12 Months or Greater | Total | ||||||||||||||||
|---|---|---|---|---|---|---|---|---|---|---|---|---|---|---|---|---|---|---|---|
December 31, 2014
|
Estimated Fair Value |
Unrealized Losses |
Estimated Fair Value |
Unrealized Losses |
Estimated Fair Value |
Unrealized Losses |
|||||||||||||
| (dollars in thousands) |
|
|
|
|
|
|
|||||||||||||
U. S. agency securities |
$ | 2,001 | $ | 7 | $ | 1,750 | $ | 33 | $ | 3,751 | $ | 40 | |||||||
Residential mortgage backed securities |
49,644 | 221 | 86,028 | 2,295 | 135,672 | 2,516 | |||||||||||||
Municipal bonds |
4,974 | 14 | 10,915 | 107 | 15,889 | 121 | |||||||||||||
| | | | | | | | | | | | | | | | | | | | |
|
$ | 56,619 | $ | 242 | $ | 98,693 | $ | 2,435 | $ | 155,312 | $ | 2,677 | |||||||
| | | | | | | | | | | | | | | | | | | | |
| | | | | | | | | | | | | | | | | | | | |
| | | | | | | | | | | | | | | | | | | | |
The amortized cost and estimated fair values of investments available-for-sale at December 31, 2015 and 2014 by contractual maturity are shown in the table below. Expected maturities will differ from
98
Eagle Bancorp, Inc.
Notes to Consolidated Financial Statements
for the Years Ended December 31, 2015, 2014 and 2013: (Continued)
Note 4—Investment Securities Available-for-Sale (Continued)
contractual maturities because borrowers may have the right to call or prepay obligations with or without call or prepayment penalties.
| |
December 31, 2015 | December 31, 2014 | |||||||||||
|---|---|---|---|---|---|---|---|---|---|---|---|---|---|
(dollars in thousands)
|
Amortized Cost |
Estimated Fair Value |
Amortized Cost |
Estimated Fair Value |
|||||||||
U. S. agency securities maturing: |
|||||||||||||
One year or less |
$ | 31,436 | $ | 31,361 | $ | 2,998 | $ | 3,051 | |||||
After one year through five years |
18,826 | 19,047 | 19,947 | 20,276 | |||||||||
Five years through ten years |
6,513 | 6,567 | 6,489 | 6,567 | |||||||||
Residential mortgage backed securities |
299,709 | 297,241 | 241,120 | 240,320 | |||||||||
Municipal bonds maturing: |
|||||||||||||
One year or less |
4,450 | 4,478 | 2,410 | 2,438 | |||||||||
After one year through five years |
41,213 | 43,720 | 47,038 | 49,607 | |||||||||
Five years through ten years |
66,001 | 67,398 | 54,983 | 56,927 | |||||||||
After ten years |
2,589 | 2,785 | 2,552 | 2,740 | |||||||||
Corporate bonds |
|||||||||||||
After one year through five years |
15,090 | 14,938 | — | — | |||||||||
Other equity investments |
307 | 334 | 396 | 417 | |||||||||
| | | | | | | | | | | | | | |
|
$ | 486,134 | $ | 487,869 | $ | 377,933 | $ | 382,343 | |||||
| | | | | | | | | | | | | | |
| | | | | | | | | | | | | | |
| | | | | | | | | | | | | | |
In 2015, gross realized gains on sales of investment securities were $2.7 million and gross realized losses on sales of investment securities were $475 thousand. In 2014, gross realized gains on sales of investment securities were $298 thousand and gross realized losses on sales of investment securities were $276 thousand. In 2013, gross realized gains on sales of investment securities were $237 thousand and gross realized losses on sales of investment securities were $218 thousand.
Proceeds from sales and calls of investment securities for 2015, 2014 and 2013 were $111.7 million, $49.9 million, and $22.1 million, respectively.
The carrying value of securities pledged as collateral for certain government deposits, securities sold under agreements to repurchase, and certain lines of credit with correspondent banks at December 31, 2015 was $416.5 million, which is well in excess of required amounts in order to operationally provide significant reserve amounts for new business. As of December 31, 2015 and December 31, 2014, there were no holdings of securities of any one issuer, other than the U.S. Government and U.S. agency securities, which exceeded ten percent of shareholders' equity.
Note 5—Loans and Allowance for Credit Losses
The Bank makes loans to customers primarily in the Washington, D.C. metropolitan area and surrounding communities. A substantial portion of the Bank's loan portfolio consists of loans to businesses secured by real estate and other business assets.
99
Eagle Bancorp, Inc.
Notes to Consolidated Financial Statements
for the Years Ended December 31, 2015, 2014 and 2013: (Continued)
Note 5—Loans and Allowance for Credit Losses (Continued)
Loans, net of unamortized net deferred fees, at December 31, 2015 and 2014 are summarized by type as follows:
| |
December 31, 2015 | December 31, 2014 | |||||||||||
|---|---|---|---|---|---|---|---|---|---|---|---|---|---|
(dollars in thousands)
|
Amount | % | Amount | % | |||||||||
Commercial |
$ | 1,052,257 | 21 | % | $ | 916,226 | 21 | % | |||||
Income producing—commercial real estate |
2,115,478 | 42 | % | 1,703,172 | 40 | % | |||||||
Owner occupied—commercial real estate |
498,103 | 10 | % | 461,581 | 11 | % | |||||||
Real estate mortgage—residential |
147,365 | 3 | % | 148,018 | 3 | % | |||||||
Construction—commercial and residential |
985,607 | 20 | % | 793,432 | 18 | % | |||||||
Construction—C&I (owner occupied) |
79,769 | 2 | % | 58,032 | 1 | % | |||||||
Home equity |
112,885 | 2 | % | 122,536 | 3 | % | |||||||
Other consumer |
6,904 | — | 109,402 | 3 | % | ||||||||
| | | | | | | | | | | | | | |
Total loans |
4,998,368 | 100 | % | 4,312,399 | 100 | % | |||||||
Less: Allowance for Credit Losses |
(52,687 | ) | (46,075 | ) | |||||||||
| | | | | | | | | | | | | | |
Net loans |
$ | 4,945,681 | $ | 4,266,324 | |||||||||
| | | | | | | | | | | | | | |
| | | | | | | | | | | | | | |
| | | | | | | | | | | | | | |
Unamortized net deferred fees amounted to $18.4 million and $15.6 million at December 31, 2015 and 2014, of which $144 thousand and $182 thousand at December 31, 2015 and 2014, respectively, represented net deferred costs on home equity loans.
Loans acquired from Virginia Heritage totaled $804 million at fair value, comprised of $801 million of loans that were not considered impaired at the acquisition date and $3.0 million of loans that were determined to be impaired at the time of acquisition. The impaired loans were accounted for in accordance with ASC Topic 310-30 "Accounting for Certain Loans or Debt Securities Acquired in a Transfer" ("ASC 310-30"). At December 31, 2015, the net recorded amount of loans accounted for under ASC 310-30 was $1.3 million. Loans acquired in the Merger that were determined to be purchased credit impaired loans were all considered collateral dependent loans. Therefore, estimated fair value calculations and projected cash flows included only return of principal and no interest income. There was no accretable yield associated with these loans during the year ended 2015.
The Company sold the indirect consumer loan portfolio acquired in the Merger, amounting to approximately $80.3 million as of the time of sale. The sale of this non-strategic loan class allows the Company to deploy the funds into commercial and commercial real estate loans, its core competency, improve its yield on earning assets and reduce operating expenses. The estimated loss of approximately $900 thousand has been included as an adjustment to the intangibles established in the Merger. The transaction closed on July 24, 2015.
As of December 31, 2015 and 2014, the Bank serviced $78.8 million and $67.9 million, respectively, of loan participations which are not reflected as loan balances on the Consolidated Balance Sheets.
Loan Origination/Risk Management
The Company's goal is to mitigate risks in the event of unforeseen threats to the loan portfolio as a result of economic downturn or other negative influences. Plans for mitigating inherent risks in managing
100
Eagle Bancorp, Inc.
Notes to Consolidated Financial Statements
for the Years Ended December 31, 2015, 2014 and 2013: (Continued)
Note 5—Loans and Allowance for Credit Losses (Continued)
loan assets include carefully enforcing loan policies and procedures, evaluating each borrower's business plan during the underwriting process and throughout the loan term, identifying and monitoring primary and alternative sources for loan repayment, and obtaining collateral to mitigate economic loss in the event of liquidation. Specific loan reserves are established based upon credit and/or collateral risks on an individual loan basis. A risk rating system is employed to proactively estimate loss exposure and provide a measuring system for setting general and specific reserve allocations.
The composition of the Bank's loan portfolio is heavily weighted toward commercial real estate, both owner occupied and income producing real estate. At December 31, 2015, owner occupied commercial real estate and owner occupied commercial real estate construction represent 12% of the loan portfolio. At December 31, 2015, non-owner occupied commercial real estate and real estate construction represented approximately 62% of the loan portfolio. The combined owner occupied and commercial real estate loans represent 74% of the loan portfolio. These loans are underwritten to mitigate lending risks typical of this type of loan such as declines in real estate values, changes in borrower cash flow and general economic conditions. The Bank typically requires a maximum loan to value of 80% and minimum cash flow debt service coverage of 1.15 to 1.00. Personal guarantees are generally required, but may be limited. In making real estate commercial mortgage loans, the Bank generally requires that interest rates adjust not less frequently than five years.
The Company is also an active traditional commercial lender providing loans for a variety of purposes, including cash flow, equipment and account receivable financing. This loan category represents approximately 21% of the loan portfolio at December 31, 2015 and was generally variable or adjustable rate. Commercial loans meet reasonable underwriting standards, including appropriate collateral and cash flow necessary to support debt service. Personal guarantees are generally required, but may be limited. SBA loans represent approximately 1% of the commercial loan category of loans. In originating SBA loans, the Company assumes the risk of non-payment on the unguaranteed portion of the credit. The Company generally sells the guaranteed portion of the loan generating noninterest income from the gains on sale, as well as servicing income on the portion participated. SBA loans are subject to the same cash flow analyses as other commercial loans. SBA loans are subject to a maximum loan size established by the SBA.
Approximately 2% of the loan portfolio at December 31, 2015 consists of home equity loans and lines of credit and other consumer loans. These credits, while making up a smaller portion of the loan portfolio, demand the same emphasis on underwriting and credit evaluation as other types of loans advanced by the Bank.
Approximately 3% of the loan portfolio consists of residential mortgage loans. These are typically loans underwritten for shorter terms, generally less than 10 years.
Loans are secured primarily by duly recorded first deeds of trust. In some cases, the Bank may accept a recorded junior trust position. In general, borrowers will have a proven ability to build, lease, manage and/or sell a commercial or residential project and demonstrate satisfactory financial condition. Additionally, an equity contribution toward the project is customarily required.
Construction loans require that the financial condition and experience of the general contractor and major subcontractors be satisfactory to the Bank. Guaranteed, fixed price contracts are required whenever appropriate, along with payment and performance bonds or completion bonds for larger scale projects.
101
Eagle Bancorp, Inc.
Notes to Consolidated Financial Statements
for the Years Ended December 31, 2015, 2014 and 2013: (Continued)
Note 5—Loans and Allowance for Credit Losses (Continued)
Loans intended for residential land acquisition, lot development and construction are made on the premise that the land: (1) is or will be developed for building sites for residential structures, and; (2) will ultimately be utilized for construction or improvement of residential zoned real properties, including the creation of housing. Residential development and construction loans will finance projects such as single family subdivisions, planned unit developments, townhouses, and condominiums. Residential land acquisition, development and construction loans generally are underwritten with a maximum term of 36 months, including extensions approved at origination.
Commercial land acquisition and construction loans are secured by real property where loan funds will be used to acquire land and to construct or improve appropriately zoned real property for the creation of income producing or owner user commercial properties. Borrowers are generally required to put equity into each project at levels determined by the appropriate Loan Committee. Commercial land acquisition and construction loans generally are underwritten with a maximum term of 24 months.
Substantially all construction draw requests must be presented in writing on American Institute of Architects documents and certified either by the contractor, the borrower and/or the borrower's architect. Each draw request shall also include the borrower's soft cost breakdown certified by the borrower or its Chief Financial Officer. Prior to an advance, the Bank or its contractor inspects the project to determine that the work has been completed, to justify the draw requisition.
Commercial permanent loans are secured by improved real property which is generating income in the normal course of operation. Debt service coverage, assuming stabilized occupancy, must be satisfactory to support a permanent loan. The debt service coverage ratio is ordinarily at least 1.15 to 1.00. As part of the underwriting process, debt service coverage ratios are stress tested assuming a 200 basis point increase in interest rates from their current levels.
Commercial permanent loans generally are underwritten with a term not greater than 10 years or the remaining useful life of the property, whichever is lower. The preferred term is between 5 to 7 years, with amortization to a maximum of 25 years.
The Company's loan portfolio includes ADC real estate loans including both investment and owner occupied projects. ADC loans amounted to $1.07 million at December 31, 2015. A portion of the ADC portfolio, both speculative and non-speculative, includes loan funded interest reserves at origination. ADC loans containing loan funded interest reserves represent approximately 49% of the outstanding ADC loan portfolio at December 31, 2015. The decision to establish a loan-funded interest reserve is made upon origination of the ADC loan and is based upon a number of factors considered during underwriting of the credit including: (i) the feasibility of the project; (ii) the experience of the sponsor; (iii) the creditworthiness of the borrower and guarantors; (iv) borrower equity contribution; and (v) the level of collateral protection. When appropriate, an interest reserve provides an effective means of addressing the cash flow characteristics of a properly underwritten ADC loan. The Company does not significantly utilize interest reserves in other loan products. The Company recognizes that one of the risks inherent in the use of interest reserves is the potential masking of underlying problems with the project and/or the borrower's ability to repay the loan. In order to mitigate this inherent risk, the Company employs a series of reporting and monitoring mechanisms on all ADC loans, whether or not an interest reserve is provided, including: (i) construction and development timelines which are monitored on an ongoing basis which track the progress of a given project to the timeline projected at origination; (ii) a construction loan administration department independent of the lending function; (iii) third party independent construction loan inspection
102
Eagle Bancorp, Inc.
Notes to Consolidated Financial Statements
for the Years Ended December 31, 2015, 2014 and 2013: (Continued)
Note 5—Loans and Allowance for Credit Losses (Continued)
reports; (iv) monthly interest reserve monitoring reports detailing the balance of the interest reserves approved at origination and the days of interest carry represented by the reserve balances as compared to the then current anticipated time to completion and/or sale of speculative projects; and (v) quarterly commercial real estate construction meetings among senior Company management, which includes monitoring of current and projected real estate market conditions. If a project has not performed as expected, it is not the customary practice of the Company to increase loan funded interest reserves.
From time to time the Company may make loans for its own portfolio or through its higher risk loan affiliate, ECV. Such loans, which are made to finance projects (which may also be financed at the Bank level), may have higher risk characteristics than loans made by the Bank, such as lower priority interests and/or higher loan to value ratios. The Company seeks an overall financial return on these transactions commensurate with the risks and structure of each individual loan. Certain transactions may bear current interest at a rate with a significant premium to normal market rates. Other loan transactions may carry a standard rate of current interest, but also earn additional interest based on a percentage of the profits of the underlying project or a fixed accrued rate of interest.
The following tables detail activity in the allowance for credit losses by portfolio segment for the years ended December 31, 2015 and 2014. Allocation of a portion of the allowance to one category of loans does not preclude its availability to absorb losses in other categories.
(dollars in thousands)
|
Commercial | Income Producing Commercial Real Estate |
Owner Occupied Commercial Real Estate |
Real Estate Mortgage Residential |
Construction Commercial and Residential |
Home Equity |
Other Consumer |
Total | |||||||||||||||||
|---|---|---|---|---|---|---|---|---|---|---|---|---|---|---|---|---|---|---|---|---|---|---|---|---|---|
For the Year Ended December 31, 2015 |
|||||||||||||||||||||||||
Allowance for credit losses: |
|||||||||||||||||||||||||
Balance at beginning of period |
$ | 13,222 | $ | 11,442 | $ | 2,954 | $ | 1,259 | $ | 15,625 | $ | 1,469 | $ | 104 | $ | 46,075 | |||||||||
Loans charged-off |
(4,693 | ) | (651 | ) | — | — | (1,884 | ) | (1,142 | ) | (228 | ) | (8,598 | ) | |||||||||||
Recoveries of loans previously charged-off |
195 | 26 | 3 | 7 | 206 | 25 | 110 | 572 | |||||||||||||||||
| | | | | | | | | | | | | | | | | | | | | | | | | | |
Net loans (charged-off) recoveries |
(4,498 | ) | (625 | ) | 3 | 7 | (1,678 | ) | (1,117 | ) | (118 | ) | (8,026 | ) | |||||||||||
Provision for credit losses |
2,839 | 3,305 | 322 | 2 | 7,141 | 940 | 89 | 14,638 | |||||||||||||||||
| | | | | | | | | | | | | | | | | | | | | | | | | | |
Ending balance |
$ | 11,563 | $ | 14,122 | $ | 3,279 | $ | 1,268 | $ | 21,088 | $ | 1,292 | $ | 75 | $ | 52,687 | |||||||||
| | | | | | | | | | | | | | | | | | | | | | | | | | |
| | | | | | | | | | | | | | | | | | | | | | | | | | |
| | | | | | | | | | | | | | | | | | | | | | | | | | |
For the Year Ended December 31, 2015 |
|||||||||||||||||||||||||
Allowance for credit losses: |
|||||||||||||||||||||||||
Individually evaluated for impairment |
$ | 3,478 | $ | 1,033 | $ | 400 | $ | — | $ | 950 | $ | 38 | $ | 3 | $ | 5,902 | |||||||||
Collectively evaluated for impairment |
8,085 | 13,089 | 2,879 | 1,268 | 20,138 | 1,254 | 72 | 46,785 | |||||||||||||||||
| | | | | | | | | | | | | | | | | | | | | | | | | | |
Ending balance |
$ | 11,563 | $ | 14,122 | $ | 3,279 | $ | 1,268 | $ | 21,088 | $ | 1,292 | $ | 75 | $ | 52,687 | |||||||||
| | | | | | | | | | | | | | | | | | | | | | | | | | |
| | | | | | | | | | | | | | | | | | | | | | | | | | |
| | | | | | | | | | | | | | | | | | | | | | | | | | |
103
Eagle Bancorp, Inc.
Notes to Consolidated Financial Statements
for the Years Ended December 31, 2015, 2014 and 2013: (Continued)
Note 5—Loans and Allowance for Credit Losses (Continued)
(dollars in thousands)
|
Commercial | Income Producing Commercial Real Estate |
Owner Occupied Commercial Real Estate |
Real Estate Mortgage Residential |
Construction Commercial and Residential |
Home Equity |
Other Consumer |
Total | |||||||||||||||||
|---|---|---|---|---|---|---|---|---|---|---|---|---|---|---|---|---|---|---|---|---|---|---|---|---|---|
For the Year Ended December 31, 2014 |
|||||||||||||||||||||||||
Allowance for credit losses: |
|||||||||||||||||||||||||
Balance at beginning of period |
$ | 9,780 | $ | 10,359 | $ | 3,899 | $ | 944 | $ | 13,934 | $ | 1,871 | $ | 134 | $ | 40,921 | |||||||||
Loans charged-off |
(2,634 | ) | (121 | ) | (752 | ) | (138 | ) | (2,721 | ) | (379 | ) | (189 | ) | (6,934 | ) | |||||||||
Recoveries of loans previously charged-off |
977 | 42 | 7 | — | 83 | 10 | 90 | 1,209 | |||||||||||||||||
| | | | | | | | | | | | | | | | | | | | | | | | | | |
Net loans charged-off |
(1,657 | ) | (79 | ) | (745 | ) | (138 | ) | (2,638 | ) | (369 | ) | (99 | ) | (5,725 | ) | |||||||||
Provision for credit losses |
5,099 | 1,162 | (200 | ) | 453 | 4,329 | (33 | ) | 69 | 10,879 | |||||||||||||||
| | | | | | | | | | | | | | | | | | | | | | | | | | |
Ending balance |
$ | 13,222 | $ | 11,442 | $ | 2,954 | $ | 1,259 | $ | 15,625 | $ | 1,469 | $ | 104 | $ | 46,075 | |||||||||
| | | | | | | | | | | | | | | | | | | | | | | | | | |
| | | | | | | | | | | | | | | | | | | | | | | | | | |
| | | | | | | | | | | | | | | | | | | | | | | | | | |
For the Year Ended December 31, 2014 |
|||||||||||||||||||||||||
Allowance for credit losses: |
|||||||||||||||||||||||||
Individually evaluated for impairment |
$ | 5,334 | $ | 751 | $ | 577 | $ | — | $ | 927 | $ | 430 | $ | 45 | $ | 8,064 | |||||||||
Collectively evaluated for impairment |
7,888 | 10,691 | 2,377 | 1,259 | 14,698 | 1,039 | 59 | 38,011 | |||||||||||||||||
| | | | | | | | | | | | | | | | | | | | | | | | | | |
Ending balance |
$ | 13,222 | $ | 11,442 | $ | 2,954 | $ | 1,259 | $ | 15,625 | $ | 1,469 | $ | 104 | $ | 46,075 | |||||||||
| | | | | | | | | | | | | | | | | | | | | | | | | | |
| | | | | | | | | | | | | | | | | | | | | | | | | | |
| | | | | | | | | | | | | | | | | | | | | | | | | | |
At December 31, 2015, the allowance for loan losses included $3 thousand associated with purchased credit impaired loans, as there was minimal further deterioration in the credit quality of these loans since the Merger date.
The Company's recorded investments in loans as of December 31, 2015 and December 31, 2014 related to each balance in the allowance for loan losses by portfolio segment and disaggregated on the basis of the Company's impairment methodology was as follows:
(dollars in thousands)
|
Commercial | Income Producing Commercial Real Estate |
Owner occupied Commercial Real Estate |
Real Estate Mortgage Residential |
Construction Commercial and Residential |
Home Equity |
Other Consumer |
Total | |||||||||||||||||
|---|---|---|---|---|---|---|---|---|---|---|---|---|---|---|---|---|---|---|---|---|---|---|---|---|---|
December 31, 2015 |
|||||||||||||||||||||||||
Recorded investment in loans: |
|||||||||||||||||||||||||
Individually evaluated for impairment |
$ | 13,008 | $ | 6,118 | $ | 1,753 | $ | — | $ | 10,454 | $ | 161 | $ | 22 | $ | 31,516 | |||||||||
Collectively evaluated for impairment |
1,039,249 | 2,109,360 | 496,350 | 147,365 | 1,054,922 | 112,724 | 6,882 | 4,966,852 | |||||||||||||||||
| | | | | | | | | | | | | | | | | | | | | | | | | | |
Ending balance |
$ | 1,052,257 | $ | 2,115,478 | $ | 498,103 | $ | 147,365 | $ | 1,065,376 | $ | 112,885 | $ | 6,904 | $ | 4,998,368 | |||||||||
| | | | | | | | | | | | | | | | | | | | | | | | | | |
| | | | | | | | | | | | | | | | | | | | | | | | | | |
| | | | | | | | | | | | | | | | | | | | | | | | | | |
December 31, 2014 |
|||||||||||||||||||||||||
Recorded investment in loans: |
|||||||||||||||||||||||||
Individually evaluated for impairment |
$ | 17,612 | $ | 5,109 | $ | 6,891 | $ | — | $ | 14,241 | $ | 1,398 | $ | 59 | $ | 45,310 | |||||||||
Collectively evaluated for impairment |
898,614 | 1,698,063 | 454,690 | 148,018 | 837,223 | 121,138 | 109,343 | 4,267,089 | |||||||||||||||||
| | | | | | | | | | | | | | | | | | | | | | | | | | |
Ending balance |
$ | 916,226 | $ | 1,703,172 | $ | 461,581 | $ | 148,018 | $ | 851,464 | $ | 122,536 | $ | 109,402 | $ | 4,312,399 | |||||||||
| | | | | | | | | | | | | | | | | | | | | | | | | | |
| | | | | | | | | | | | | | | | | | | | | | | | | | |
| | | | | | | | | | | | | | | | | | | | | | | | | | |
At December 31, 2015, the nonperforming loans acquired from Fidelity and Virginia Heritage have a carrying value of $509 thousand and $1.3 million, and an unpaid principal balance of $566 thousand and $2.3 million, and were evaluated separately in accordance with ASC Topic 310-30, "Loans and Debt
104
Eagle Bancorp, Inc.
Notes to Consolidated Financial Statements
for the Years Ended December 31, 2015, 2014 and 2013: (Continued)
Note 5—Loans and Allowance for Credit Losses (Continued)
Securities Acquired with Deteriorated Credit Quality." The various impaired loans were recorded at estimated fair value with any excess being charged-off or treated as a non-accretable discount. Subsequent downward adjustments to the valuation of impaired loans acquired will result in additional loan loss provisions and related allowance for credit losses. Subsequent upward adjustments to the valuation of impaired loans acquired will result in accretable discounts. No adjustments have been made to the fair value amounts of impaired loans subsequent to the allowable period of adjustment from the date of acquisition.
Credit Quality Indicators
The Company uses several credit quality indicators to manage credit risk in an ongoing manner. The Company's primary credit quality indicators are to use an internal credit risk rating system that categorizes loans into pass, watch, special mention, or classified categories. Credit risk ratings are applied individually to those classes of loans that have significant or unique credit characteristics that benefit from a case-by-case evaluation. These are typically loans to businesses or individuals in the classes which comprise the commercial portfolio segment. Groups of loans that are underwritten and structured using standardized criteria and characteristics, such as statistical models (e.g., credit scoring or payment performance), are typically risk rated and monitored collectively. These are typically loans to individuals in the classes which comprise the consumer portfolio segment.
105
Eagle Bancorp, Inc.
Notes to Consolidated Financial Statements
for the Years Ended December 31, 2015, 2014 and 2013: (Continued)
Note 5—Loans and Allowance for Credit Losses (Continued)
The following are the definitions of the Company's credit quality indicators:
| Pass: | Loans in all classes that comprise the commercial and consumer portfolio segments that are not adversely rated, are contractually current as to principal and interest, and are otherwise in compliance with the contractual terms of the loan agreement. Management believes that there is a low likelihood of loss related to those loans that are considered pass. | |
Watch: |
Loan paying as agreed with generally acceptable asset quality; however the obligor's performance has not met expectations. Balance sheet and/or income statement has shown deterioration to the point that the obligor could not sustain any further setbacks. Credit is expected to be strengthened through improved obligor performance and/or additional collateral within a reasonable period of time. |
|
Special Mention: |
Loans in the classes that comprise the commercial portfolio segment that have potential weaknesses that deserve management's close attention. If not addressed, these potential weaknesses may result in deterioration of the repayment prospects for the loan. The special mention credit quality indicator is not used for classes of loans that comprise the consumer portfolio segment. Management believes that there is a moderate likelihood of some loss related to those loans that are considered special mention. |
|
Classified: |
Classified (a) Substandard—Loans inadequately protected by the current sound worth and paying capacity of the obligor or of the collateral pledged, if any. Loans so classified have a well-defined weakness or weaknesses that jeopardize the liquidation of the debt. They are characterized by the distinct possibility that the company will sustain some loss if the deficiencies are not corrected. Loss potential, while existing in the aggregate amount of substandard loans, does not have to exist in individual loans classified substandard. |
|
Classified (b) Doubtful—Loans that have all the weaknesses inherent in a loan classified substandard, with the added characteristic that the weaknesses make collection or liquidation in full, on the basis of currently existing facts, conditions, and values, highly questionable and improbable. The possibility of loss is extremely high, but because of certain important and reasonably specific pending factors, which may work to the advantage and strengthening of the assets, its classification as an estimated loss is deferred until its more exact status may be determined. |
The Company's credit quality indicators are generally updated on a quarterly basis, but no less frequently than annually. The following table presents by class and by credit quality indicator, the recorded investment in the Company's loans and leases as of December 31, 2015 and 2014.
106
Eagle Bancorp, Inc.
Notes to Consolidated Financial Statements
for the Years Ended December 31, 2015, 2014 and 2013: (Continued)
Note 5—Loans and Allowance for Credit Losses (Continued)
(dollars in thousands)
|
Pass | Watch and Special Mention |
Substandard | Doubtful | Total Loans |
|||||||||||
|---|---|---|---|---|---|---|---|---|---|---|---|---|---|---|---|---|
December 31, 2015 |
||||||||||||||||
Commercial |
$ | 1,021,427 | $ | 17,822 | $ | 13,008 | $ | — | $ | 1,052,257 | ||||||
Income producing—commercial real estate |
2,096,032 | 13,328 | 6,118 | — | 2,115,478 | |||||||||||
Owner occupied—commercial real estate |
488,496 | 7,854 | 1,753 | — | 498,103 | |||||||||||
Real estate mortgage—residential |
146,651 | 714 | — | — | 147,365 | |||||||||||
Construction—commercial and residential |
1,049,926 | 4,996 | 10,454 | — | 1,065,376 | |||||||||||
Home equity |
110,870 | 1,854 | 161 | — | 112,885 | |||||||||||
Other consumer |
6,877 | 5 | 22 | — | 6,904 | |||||||||||
| | | | | | | | | | | | | | | | | |
Total |
$ | 4,920,279 | $ | 46,573 | $ | 31,516 | $ | — | $ | 4,998,368 | ||||||
| | | | | | | | | | | | | | | | | |
| | | | | | | | | | | | | | | | | |
| | | | | | | | | | | | | | | | | |
December 31, 2014 |
||||||||||||||||
Commercial |
$ | 875,102 | $ | 23,512 | $ | 17,612 | $ | — | $ | 916,226 | ||||||
Income producing—commercial real estate |
1,679,101 | 18,962 | 5,109 | — | 1,703,172 | |||||||||||
Owner occupied—commercial real estate |
445,013 | 9,677 | 6,891 | — | 461,581 | |||||||||||
Real estate mortgage—residential |
147,262 | 756 | — | — | 148,018 | |||||||||||
Construction—commercial and residential |
827,503 | 9,720 | 14,241 | — | 851,464 | |||||||||||
Home equity |
119,420 | 1,718 | 1,398 | — | 122,536 | |||||||||||
Other consumer |
109,343 | — | 59 | — | 109,402 | |||||||||||
| | | | | | | | | | | | | | | | | |
Total |
$ | 4,202,744 | $ | 64,345 | $ | 45,310 | $ | — | $ | 4,312,399 | ||||||
| | | | | | | | | | | | | | | | | |
| | | | | | | | | | | | | | | | | |
| | | | | | | | | | | | | | | | | |
Nonaccrual and Past Due Loans
Loans are considered past due if the required principal and interest payments have not been received as of the date such payments were due. Loans are placed on nonaccrual status when, in management's opinion, the borrower may be unable to meet payment obligations as they become due, as well as when required by regulatory provisions. Loans may be placed on nonaccrual status regardless of whether or not such loans are considered past due. When interest accrual is discontinued, all unpaid accrued interest is reversed. Interest income is subsequently recognized only to the extent cash payments are received in excess of principal due. Loans are returned to accrual status when all the principal and interest amounts contractually due are brought current and future payments are reasonably assured.
107
Eagle Bancorp, Inc.
Notes to Consolidated Financial Statements
for the Years Ended December 31, 2015, 2014 and 2013: (Continued)
Note 5—Loans and Allowance for Credit Losses (Continued)
The following presents by class of loan, information related to nonaccrual loans as of December 31, 2015 and 2014.
(dollars in thousands)
|
December 31, 2015 |
December 31, 2014 |
|||||
|---|---|---|---|---|---|---|---|
Commercial |
$ | 4,940 | $ | 12,975 | |||
Income producing—commercial real estate |
5,961 | 2,645 | |||||
Owner occupied—commercial real estate |
1,268 | 1,324 | |||||
Real estate mortgage—residential |
329 | 346 | |||||
Construction—commercial and residential |
557 | 3,697 | |||||
Home equity |
161 | 1,398 | |||||
Other consumer |
23 | 58 | |||||
| | | | | | | | |
Total nonaccrual loans(1)(2) |
$ | 13,239 | $ | 22,443 | |||
| | | | | | | | |
| | | | | | | | |
| | | | | | | | |
- (1)
- Excludes
troubled debt restructurings ("TDRs") that were performing under their restructured terms totaling $11.8 million at December 31,
2015, and $13.5 million at December 31, 2014.
- (2)
- Gross interest income of $1.0 million would have been recorded in 2015 if nonaccrual loans shown above had been current and in accordance with their original terms, while interest actually recorded on such loans was $629 thousand. See Note 1 to the Consolidated Financial Statements for a description of the Company's policy for placing loans on nonaccrual status.
108
Eagle Bancorp, Inc.
Notes to Consolidated Financial Statements
for the Years Ended December 31, 2015, 2014 and 2013: (Continued)
Note 5—Loans and Allowance for Credit Losses (Continued)
The following table presents by class, an aging analysis and the recorded investments in loans past due as of December 31, 2015 and 2014.
(dollars in thousands)
|
Loans 30-59 Days Past Due |
Loans 60-89 Days Past Due |
Loans 90 Days or More Past Due |
Total Past Due Loans |
Current Loans |
Total Recorded Investment in Loans |
|||||||||||||
|---|---|---|---|---|---|---|---|---|---|---|---|---|---|---|---|---|---|---|---|
December 31, 2015 |
|||||||||||||||||||
Commercial |
$ | 4,130 | $ | 1,364 | $ | 4,940 | $ | 10,434 | $ | 1,041,823 | $ | 1,052,257 | |||||||
Income producing—commercial real estate |
2,841 | — | 5,961 | 8,802 | 2,106,676 | 2,115,478 | |||||||||||||
Owner occupied—commercial real estate |
3,189 | 902 | 1,268 | 5,359 | 492,744 | 498,103 | |||||||||||||
Real estate mortgage—residential |
— | — | 329 | 329 | 147,036 | 147,365 | |||||||||||||
Construction—commercial and residential |
— | 5,020 | 557 | 5,577 | 1,059,799 | 1,065,376 | |||||||||||||
Home equity |
— | 77 | 161 | 238 | 112,647 | 112,885 | |||||||||||||
Other consumer |
56 | 60 | 23 | 139 | 6,765 | 6,904 | |||||||||||||
| | | | | | | | | | | | | | | | | | | | |
Total |
$ | 10,216 | $ | 7,423 | $ | 13,239 | $ | 30,878 | $ | 4,967,490 | $ | 4,998,368 | |||||||
| | | | | | | | | | | | | | | | | | | | |
| | | | | | | | | | | | | | | | | | | | |
| | | | | | | | | | | | | | | | | | | | |
December 31, 2014 |
|||||||||||||||||||
Commercial |
$ | 1,505 | $ | 4,032 | $ | 12,975 | $ | 18,512 | $ | 897,714 | $ | 916,226 | |||||||
Income producing—commercial real estate |
1,825 | 5,376 | 2,645 | 9,846 | 1,693,326 | 1,703,172 | |||||||||||||
Owner occupied—commercial real estate |
1,089 | 214 | 1,324 | 2,627 | 458,954 | 461,581 | |||||||||||||
Real estate mortgage—residential |
— | — | 346 | 346 | 147,672 | 148,018 | |||||||||||||
Construction—commercial and residential |
— | — | 3,697 | 3,697 | 847,767 | 851,464 | |||||||||||||
Home equity |
— | 1,365 | 1,398 | 2,763 | 119,773 | 122,536 | |||||||||||||
Other consumer |
284 | 81 | 58 | 423 | 108,979 | 109,402 | |||||||||||||
| | | | | | | | | | | | | | | | | | | | |
Total |
$ | 4,703 | $ | 11,068 | $ | 22,443 | $ | 38,214 | $ | 4,274,185 | $ | 4,312,399 | |||||||
| | | | | | | | | | | | | | | | | | | | |
| | | | | | | | | | | | | | | | | | | | |
| | | | | | | | | | | | | | | | | | | | |
Impaired Loans
Loans are considered impaired when, based on current information and events, it is probable the Company will be unable to collect all amounts due in accordance with the original contractual terms of the loan agreement, including scheduled principal and interest payments. Impairment is evaluated in total for smaller-balance loans of a similar nature and on an individual loan basis for other loans. If a loan is impaired, a specific valuation allowance is allocated, if necessary, so that the loan is reported net, at the present value of estimated future cash flows using the loan's existing rate or at the fair value of collateral if repayment is expected solely from the collateral. Interest payments on impaired loans are typically applied to principal unless collectability of the principal amount is reasonably assured, in which case interest is recognized on a cash basis. Impaired loans, or portions thereof, are charged off when deemed uncollectible.
109
Eagle Bancorp, Inc.
Notes to Consolidated Financial Statements
for the Years Ended December 31, 2015, 2014 and 2013: (Continued)
Note 5—Loans and Allowance for Credit Losses (Continued)
The following table presents by class, information related to impaired loans for the years ended December 31, 2015 and 2014.
| |
|
|
|
|
|
Average Recorded Investment |
Interest Income Recognized |
|||||||||||||||||||||
|---|---|---|---|---|---|---|---|---|---|---|---|---|---|---|---|---|---|---|---|---|---|---|---|---|---|---|---|---|
| |
Unpaid Contractual Principal Balance |
Recorded Investment With No Allowance |
Recorded Investment With Allowance |
|
|
|||||||||||||||||||||||
(dollars in thousands)
|
Total Recorded Investment |
Related Allowance |
Quarter To Date |
Year To Date |
Quarter To Date |
Year To Date |
||||||||||||||||||||||
December 31, 2015 |
||||||||||||||||||||||||||||
Commercial |
$ | 16,123 | $ | 2,396 | $ | 10,283 | $ | 12,679 | $ | 3,478 | $ | 9,340 | $ | 9,973 | $ | 21 | $ | 69 | ||||||||||
Income producing—commercial real estate |
6,811 | 1,190 | 4,928 | 6,118 | 1,033 | 10,675 | 10,294 | 95 | 354 | |||||||||||||||||||
Owner occupied—commercial real estate |
1,753 | 946 | 807 | 1,753 | 400 | 1,772 | 1,810 | — | — | |||||||||||||||||||
Real estate mortgage—residential |
329 | 329 | — | 329 | — | 331 | 336 | — | — | |||||||||||||||||||
Construction—commercial and residential |
10,454 | 4,877 | 5,577 | 10,454 | 950 | 8,031 | 7,594 | (93 | ) | 205 | ||||||||||||||||||
Home equity |
161 | 116 | 45 | 161 | 38 | 411 | 650 | — | — | |||||||||||||||||||
Other consumer |
22 | 19 | 3 | 22 | 3 | 47 | 31 | (1 | ) | 1 | ||||||||||||||||||
| | | | | | | | | | | | | | | | | | | | | | | | | | | | | |
Total |
$ | 35,653 | $ | 9,873 | $ | 21,643 | $ | 31,516 | $ | 5,902 | $ | 30,607 | $ | 30,688 | $ | 22 | $ | 629 | ||||||||||
| | | | | | | | | | | | | | | | | | | | | | | | | | | | | |
| | | | | | | | | | | | | | | | | | | | | | | | | | | | | |
| | | | | | | | | | | | | | | | | | | | | | | | | | | | | |
December 31, 2014 |
||||||||||||||||||||||||||||
Commercial |
$ | 14,075 | $ | 1,603 | $ | 11,372 | $ | 12,975 | $ | 5,334 | $ | 14,203 | $ | 13,681 | $ | 20 | $ | 251 | ||||||||||
Income producing—commercial real estate |
10,869 | 8,952 | 1,542 | 10,494 | 751 | 8,202 | 7,021 | 196 | 203 | |||||||||||||||||||
Owner occupied—commercial real estate |
1,889 | 1,038 | 851 | 1,889 | 577 | 2,696 | 3,986 | — | 6 | |||||||||||||||||||
Real estate mortgage—residential |
346 | 346 | — | 346 | — | 348 | 529 | — | — | |||||||||||||||||||
Construction—commercial and residential |
8,785 | 8,176 | 609 | 8,785 | 927 | 10,113 | 10,967 | 436 | 1,147 | |||||||||||||||||||
Home equity |
1,398 | 339 | 1,059 | 1,398 | 430 | 993 | 747 | 32 | 36 | |||||||||||||||||||
Other consumer |
58 | — | 58 | 58 | 45 | 29 | 30 | 7 | 7 | |||||||||||||||||||
| | | | | | | | | | | | | | | | | | | | | | | | | | | | | |
Total |
$ | 37,420 | $ | 20,454 | $ | 15,491 | $ | 35,945 | $ | 8,064 | $ | 36,584 | $ | 36,961 | $ | 691 | $ | 1,650 | ||||||||||
| | | | | | | | | | | | | | | | | | | | | | | | | | | | | |
| | | | | | | | | | | | | | | | | | | | | | | | | | | | | |
| | | | | | | | | | | | | | | | | | | | | | | | | | | | | |
Modifications
A modification of a loan constitutes a troubled debt restructuring ("TDR") when a borrower is experiencing financial difficulty and the modification constitutes a concession. The Company offers various types of concessions when modifying a loan. Commercial and industrial loans modified in a TDR often involve temporary interest-only payments, term extensions, and converting revolving credit lines to term loans. Additional collateral, a co-borrower, or a guarantor is often requested. Commercial mortgage and construction loans modified in a TDR often involve reducing the interest rate for the remaining term of the loan, extending the maturity date at an interest rate lower than the current market rate for new debt with similar risk, or substituting or adding a new borrower or guarantor. Construction loans modified in a TDR may also involve extending the interest-only payment period.
Loans modified in a TDR for the Company may have the financial effect of increasing the specific allowance associated with the loan. An allowance for impaired consumer and commercial loans that have been modified in a TDR is measured based on the present value of expected future cash flows discounted at the loan's effective interest rate, the loan's observable market price, or the estimated fair value of the collateral, less any selling costs, if the loan is collateral dependent. Management exercises significant judgment in developing these estimates.
110
Eagle Bancorp, Inc.
Notes to Consolidated Financial Statements
for the Years Ended December 31, 2015, 2014 and 2013: (Continued)
Note 5—Loans and Allowance for Credit Losses (Continued)
The following table presents by class, the recorded investment of TDR loans for the years ended December 31, 2015 and 2014.
(dollars in thousands)
|
Number of Contracts |
TDRs Performing to Modified Terms |
TDRs Not Performing to Modified Terms |
Total TDRs |
|||||||||
|---|---|---|---|---|---|---|---|---|---|---|---|---|---|
December 31, 2015 |
|||||||||||||
Commercial |
4 | $ | 1,171 | $ | 211 | $ | 1,382 | ||||||
Income producing—commercial real estate |
2 | 5,160 | — | 5,160 | |||||||||
Owner occupied—commercial real estate |
1 | 485 | — | 485 | |||||||||
Construction—commercial and residential |
1 | 5,020 | — | 5,020 | |||||||||
| | | | | | | | | | | | | | |
Total |
8 | $ | 11,836 | $ | 211 | $ | 12,047 | ||||||
| | | | | | | | | | | | | | |
| | | | | | | | | | | | | | |
| | | | | | | | | | | | | | |
December 31, 2014 |
|||||||||||||
Commercial |
1 | $ | — | $ | 227 | $ | 227 | ||||||
Income producing—commercial real estate |
3 | 7,849 | — | 7,849 | |||||||||
Owner occupied—commercial real estate |
1 | 565 | — | 565 | |||||||||
Construction—commercial and residential |
1 | 5,088 | — | 5,088 | |||||||||
| | | | | | | | | | | | | | |
Total |
6 | $ | 13,502 | $ | 227 | $ | 13,729 | ||||||
| | | | | | | | | | | | | | |
| | | | | | | | | | | | | | |
| | | | | | | | | | | | | | |
During the year ended December 31, 2015, there were no defaults on restructured loans, as compared to the year ended December 31, 2014, which had eight performing TDR loans totaling approximately $11.6 million that experienced defaults on their modified terms. During 2014, these eight previously performing TDRs were reclassified as follows: (a) four nonperforming TDRs totaling $9.1 million were sold during the year; (b) one nonperforming TDR totaling approximately $2.0 million was reclassified to OREO after the Company took possession of the underlying collateral; (c) the Company was paid off on another TDR totaling $217 thousand; (d) one TDR totaling $227 thousand was reclassified to nonperforming loans; (e) and one TDR totaling $95 thousand was charged-off. A default is considered to have occurred once the TDR is past due 90 days or more, or it has been placed on nonaccrual. There were no nonperforming TDRs reclassified to nonperforming loans during the year ended December 31, 2015. Commercial and consumer loans modified in a TDR are closely monitored for delinquency as an early indicator of possible future default. If loans modified in a TDR subsequently default, the Company evaluates the loan for possible further impairment. The allowance may be increased, adjustments may be made in the allocation of the allowance, or partial charge-offs may be taken to further write-down the carrying value of the loan. During 2015, there were four loans modified in a TDR totaling approximately $1.9 million, and two performing TDR loans aggregating approximately $3.3 million were paid off and removed from TDR status. There were four loans totaling approximately $8.0 million modified in a TDR during the year ended December 31, 2014.
The criteria used to determine if a loan should be considered for charge off relates to its ultimate collectability includes the following:
- •
- All or a portion of the loan is deemed uncollectible;
- •
- Repayment is dependent upon secondary sources, such as liquidation of collateral, other assets, or judgment liens that may require an indefinite time period to collect.
111
Eagle Bancorp, Inc.
Notes to Consolidated Financial Statements
for the Years Ended December 31, 2015, 2014 and 2013: (Continued)
Note 5—Loans and Allowance for Credit Losses (Continued)
Loans may be identified for charge off in whole or in part based upon an impairment analysis consistent with ASC 310. If all or a portion of a loan is deemed uncollectible, such amount shall be charged off in the month in which the loan or portion thereof is determined to be uncollectible.
Loans approved for non-accrual status, or charge off, should be managed by the Chief Credit Officer or as dictated by the Directors Loan Committee and/or Credit Review Committee. The Chief Credit Officer is expected to position the loan in the best possible posture for recovery, including, among other actions, liquidating collateral, obtaining additional collateral, filing suit to obtain judgment or restructuring of repayment terms. A review of charged off loans should be made on a monthly basis to assess the possibility of recovery from renewed collection efforts. All charged off loans that are deemed to have the possibility of recovery, whether partial or full, shall be actively pursued. Charged off loans that are deemed uncollectible will be placed in an inactive file with documentation supporting the suspension of further collection efforts.
In the process of collecting problem loans the Bank may resort to the acquisition of collateral through foreclosure and repossession actions, or may accept the transfer of assets in partial or full satisfaction of the debt. These actions may in turn result in the necessity of carrying real property or chattels as an asset of the Company pending sale.
For purchased loans acquired that are not deemed impaired at acquisition, credit marks representing the principal losses expected over the life of the loans are a component of the initial fair value. Subsequent to the purchase date, the methods utilized to estimate the required allowance for credit losses for these loans is similar to originated loans; however, the Company records a provision for loan losses only when the required allowance exceeds any remaining credit mark. The remaining differences between the purchase price and the unpaid principal balance at the date of acquisition are recorded in interest income over the life of the loans.
The following table presents changes in the credit mark accretable yield, which includes income recognized from contractual interest cash flows, for the dates indicated.
(dollars in thousands)
|
Total | |||
|---|---|---|---|---|
Balance at December 31, 2014 |
$ | (10,298 | ) | |
Net reclassifications from nonaccretable yield |
— | |||
Accretion |
4,290 | |||
| | | | | |
Balance at December 31, 2015 |
$ | (6,008 | ) | |
| | | | | |
| | | | | |
| | | | | |
Related Party Loans
Certain directors and executive officers have had loan transactions with the Company. Such loans were made in the ordinary course of business on substantially the same terms, including interest rates and collateral, as those prevailing at the time for comparable transactions with outsiders. The following table
112
Eagle Bancorp, Inc.
Notes to Consolidated Financial Statements
for the Years Ended December 31, 2015, 2014 and 2013: (Continued)
Note 5—Loans and Allowance for Credit Losses (Continued)
summarizes changes in amounts of loans outstanding, both direct and indirect, to those persons during 2015 and 2014.
| (dollars in thousands) |
2015 | 2014 | |||||
|---|---|---|---|---|---|---|---|
Balance at January 1, |
$ | 17,082 | $ | 30,123 | |||
Additions |
23,578 | 10,000 | |||||
Repayments |
(10,711 | ) | (23,041 | ) | |||
| | | | | | | | |
Balance at December 31, |
$ | 29,949 | $ | 17,082 | |||
| | | | | | | | |
| | | | | | | | |
| | | | | | | | |
Note 6—Premises and Equipment
Premises and equipment include the following at December 31:
| (dollars in thousands) |
2015 | 2014 | |||||
|---|---|---|---|---|---|---|---|
Leasehold improvements |
$ | 26,987 | $ | 23,050 | |||
Furniture and equipment |
22,217 | 20,931 | |||||
Less accumulated depreciation and amortization |
(30,950 | ) | (24,882 | ) | |||
| | | | | | | | |
Total premises and equipment, net |
$ | 18,254 | $ | 19,099 | |||
| | | | | | | | |
| | | | | | | | |
| | | | | | | | |
Total depreciation and amortization expense for the years ended December 31, 2015, 2014 and 2013, was $6.1 million, $4.6 million and $3.9 million, respectively.
The Company leases banking and office space in 35 locations under non-cancelable lease arrangements accounted for as operating leases. The initial lease periods range from five to ten years and provide for one or more five year renewal options. The leases in some cases provide for scheduled annual rent escalations and require that the Bank (lessee) pay certain operating expenses applicable to the leased space. Rent expense applicable to operating leases amounted to $8.5 million for 2015, $7.5 million in 2014, and $6.9 million in 2013. The Company subleased six leased premises during 2015 and two leased premises during 2014 and 2013. The Company recorded $435 thousand, $114 thousand, and $57 thousand as a reduction of rent expense during 2015, 2014, and 2013, respectively.
At December 31, 2015, future minimum lease payments under non-cancelable operating leases having an initial term in excess of one year are as follows:
Years Ending December 31:
|
|
|||
|---|---|---|---|---|
| (dollars in thousands) |
|
|||
2016 |
$ | 8,061 | ||
2017 |
7,186 | |||
2018 |
6,756 | |||
2019 |
6,448 | |||
2020 |
5,954 | |||
Thereafter |
11,398 | |||
| | | | | |
Total minimum lease payments |
$ | 45,803 | ||
| | | | | |
| | | | | |
| | | | | |
113
Eagle Bancorp, Inc.
Notes to Consolidated Financial Statements
for the Years Ended December 31, 2015, 2014 and 2013: (Continued)
Note 7—Intangible Assets
Intangible assets are included in the Consolidated Balance Sheets as a separate line item, net of accumulated amortization and consist of the following items:
| (dollars in thousands) |
Gross Intangible Assets |
Additions/ (Adjustments) |
Accumulated Amortization |
Net Intangible Assets |
|||||||||
|---|---|---|---|---|---|---|---|---|---|---|---|---|---|
December 31, 2015 |
|||||||||||||
Goodwill(1) |
$ | 104,425 | $ | (257 | ) | $ | — | $ | 104,168 | ||||
Core deposit(2) |
7,070 | — | (3,084 | ) | 3,986 | ||||||||
Excess servicing(3) |
282 | 379 | (274 | ) | 387 | ||||||||
| | | | | | | | | | | | | | |
|
$ | 111,777 | $ | 122 | $ | (3,358 | ) | $ | 108,541 | ||||
| | | | | | | | | | | | | | |
| | | | | | | | | | | | | | |
| | | | | | | | | | | | | | |
December 31, 2014 |
|||||||||||||
Goodwill(1) |
$ | 2,163 | $ | 102,262 | $ | — | $ | 104,425 | |||||
Core deposit(2) |
2,520 | 4,550 | (1,869 | ) | 5,201 | ||||||||
Excess servicing(3) |
865 | 330 | (913 | ) | 282 | ||||||||
| | | | | | | | | | | | | | |
|
$ | 5,548 | $ | 107,142 | $ | (2,782 | ) | $ | 109,908 | ||||
| | | | | | | | | | | | | | |
| | | | | | | | | | | | | | |
| | | | | | | | | | | | | | |
The aggregate amortization expense was $1.5 million, $743 thousand, and $614 thousand for the years ended December 31, 2015, 2014 and 2013, respectively.
- (1)
- The
Company recorded an initial amount of unidentified intangible (goodwill) incident to the acquisition of Fidelity of approximately $360 thousand.
Based on allowable adjustments through August 31, 2009, the unidentified intangible (goodwill) amounted to approximately $2.2 million. The Company recorded an initial amount of
unidentified intangible (goodwill) incident to the acquisition of Virginia Heritage of approximately $102.3 million. Based on allowable adjustments through October 31, 2015, the
unidentified intangible (goodwill) was reduced by $257 thousand.
- (2)
- In
connection with the Fidelity and Virginia Heritage acquisitions, the Company made an allocation of the purchase price of $2.3 million and
$4.6 million, respectively, to the core deposit intangibles. These allocations were based on independent evaluations, and are included in intangible assets, net of the Consolidated Balances
Sheets. The amount of the core deposit intangible relating to the Fidelity acquisition at December 31, 2015 was $502 thousand, which is being amortized over its remaining economic life
through 2018 as a component of other noninterest expense. The amount of the core deposit intangible relating to the Virginia Heritage acquisition at December 31, 2015 was $3.5 million,
which is being amortized over its remaining economic life through 2020 as a component of other noninterest expense.
- (3)
- The Company recognizes a servicing asset for the computed value of servicing fees on the sale of the guaranteed portion of SBA loans, which is in excess of a normal servicing fee. Assumptions related to the loan term and amortization period are made to arrive at the initial recorded value.
114
Eagle Bancorp, Inc.
Notes to Consolidated Financial Statements
for the Years Ended December 31, 2015, 2014 and 2013: (Continued)
Note 7—Intangible Assets (Continued)
The future estimated annual amortization expense is presented below:
Years Ending December 31:
|
|
|||
|---|---|---|---|---|
| (dollars in thousands) |
|
|||
2016 |
$ | 1,207 | ||
2017 |
1,064 | |||
2018 |
957 | |||
2019 |
715 | |||
2020 |
43 | |||
Thereafter |
— | |||
| | | | | |
Total |
$ | 3,986 | ||
| | | | | |
| | | | | |
| | | | | |
Note 8—Other Real Estate Owned
The activity within OREO for the twelve months ended December 31, 2015 and 2014 is presented in the table below. There were no residential real estate loans in the process of foreclosure as of December 31, 2015. For the year ended December 31, 2015 and 2014, proceeds on sales of OREO were $5.5 million and $520 thousand, respectively. For the year ended December 31, 2015 and 2014, the net losses on sales were $328 thousand and $154 thousand, respectively.
| |
Year Ended December 31, |
||||||
|---|---|---|---|---|---|---|---|
(dollars in thousands)
|
2015 | 2014 | |||||
Balance beginning of period |
$ | 13,224 | $ | 9,225 | |||
Real estate acquired from borrowers |
1,725 | 5,310 | |||||
Valuation allowance |
(1,100 | ) | (554 | ) | |||
Properties sold |
(7,997 | ) | (757 | ) | |||
| | | | | | | | |
Balance end of period |
$ | 5,852 | $ | 13,224 | |||
| | | | | | | | |
| | | | | | | | |
| | | | | | | | |
Note 9—Mortgage Banking Derivatives
As part of its mortgage banking activities, the Bank enters into interest rate lock commitments, which are commitments to originate loans where the interest rate on the loan is determined prior to funding and the customers have locked into that interest rate. The Bank then locks in the loan and interest rate with an investor and commits to deliver the loan if settlement occurs ("best efforts") or commits to deliver the locked loan in a binding ("mandatory") delivery program with an investor. Certain loans under interest rate lock commitments are covered under forward sales contracts of mortgage backed securities ("MBS"). Forward sales contracts of MBS are recorded at fair value with changes in fair value recorded in noninterest income. Interest rate lock commitments and commitments to deliver loans to investors are considered derivatives. The market value of interest rate lock commitments and best efforts contracts are not readily ascertainable with precision because they are not actively traded in stand-alone markets. The Bank determines the fair value of interest rate lock commitments and delivery contracts by measuring the fair value of the underlying asset, which is impacted by current interest rates, taking into consideration the probability that the interest rate lock commitments will close or will be funded.
115
Eagle Bancorp, Inc.
Notes to Consolidated Financial Statements
for the Years Ended December 31, 2015, 2014 and 2013: (Continued)
Note 9—Mortgage Banking Derivatives (Continued)
Certain additional risks arise from these forward delivery contracts in that the counterparties to the contracts may not be able to meet the terms of the contracts. The Bank does not expect any counterparty to any MBS to fail to meet its obligation. Additional risks inherent in mandatory delivery programs include the risk that, if the Bank does not close the loans subject to interest rate risk lock commitments, it will still be obligated to deliver MBS to the counterparty under the forward sales agreement. Should this be required, the Bank could incur significant costs in acquiring replacement loans or MBS and such costs could have an adverse effect on mortgage banking operations.
The fair value of the mortgage banking derivatives is recorded as a freestanding asset or liability with the change in value being recognized in current earnings during the period of change.
At December 31, 2015 the Bank had mortgage banking derivative financial instruments with a notional value of $39.6 million related to its forward contracts. The fair value of these mortgage banking derivative instruments at December 31, 2015 were $24 thousand included in other assets and $30 thousand included in other liabilities. At December 31, 2014 the Bank had mortgage banking derivative financial instruments with a notional value of $45.1 million related to its forward contracts. The fair value of these mortgage banking derivative instruments at December 31, 2014 were $146 thousand included in other assets and $250 thousand included in other liabilities.
Included in other noninterest income for the year ended December 31, 2015 and 2014 was a net loss of $155 thousand and a net gain of $140 thousand, respectively, relating to mortgage banking derivative instruments. The amount included in other noninterest income for year ended December 31, 2015 and 2014 pertaining to its mortgage banking hedging activities was a net realized gain of $202 thousand and a net realized loss of $108 thousand, respectively.
Note 10—Interest Rate Swap Derivatives
The Company uses interest rate swap agreements to assist in its interest rate risk management. The notional amounts of the interest rate swaps do not represent amounts exchanged by the counterparties, but rather, the notional amount is used to determine, along with other terms of the derivative, the amounts to be exchanged between the counterparties.
The Company's objectives in using interest rate derivatives are to add stability to interest income and expense and to manage its exposure to interest rate movements. To accomplish this objective, the Company entered into forward starting interest rate swaps in April 2015 as part of its interest rate risk management strategy intended to mitigate the potential risk of rising interest rates on the Bank's cost of funds. The interest rate swaps are designated as cash flow hedges and involve the receipt of variable rate amounts from two counterparties in exchange for the Company making fixed payments beginning in April 2016. As of December 31, 2015, the Company had three forward starting interest rate swap transactions outstanding that had a notional amount of $250 million associated with the Company's variable rate deposits. The net unrealized loss before income tax on the swaps was $1.4 million at December 31, 2015. The unrealized loss is due to the increase in spread between short and longer term interest rates between the date the forward starting swap was entered into and year end 2015. There were no interest rate swap derivative instruments as of December 31, 2014.
For derivatives designated as cash flow hedges, the effective portion of changes in the fair value of the derivative is initially reported in other comprehensive income (outside of earnings), net of tax, and
116
Eagle Bancorp, Inc.
Notes to Consolidated Financial Statements
for the Years Ended December 31, 2015, 2014 and 2013: (Continued)
Note 10—Interest Rate Swap Derivatives (Continued)
subsequently reclassified to earnings when the hedged transaction affects earnings, and the ineffective portion of changes in the fair value of the derivative is recognized directly in earnings. The Company assesses the effectiveness of each hedging relationship by comparing the changes in cash flows of the interest rate swap derivative hedging instrument with the changes in cash flows of the designated hedged transactions. The Company did not recognize any hedge ineffectiveness in earnings during the year ended December 31, 2015.
The Company is hedging its exposure to the variability in future cash flows for forecasted transactions over a maximum period of ten months (excluding forecasted transactions related to the payment of variable interest on existing financial instruments) and as such existing hedges are deemed forward starting swaps and no net settlements of cash flows is occurring.
Amounts reported in accumulated other comprehensive income related to interest rate swap derivatives will be reclassified to interest income/expense as interest payments are made/received on the Company's variable-rate assets/liabilities. During the year ended December 31, 2015, the Company did not have any reclassifications to interest expense. During the next twelve months, the Company estimates (based on existing interest rates) that $1.8 million will be reclassified as an increase in interest expense.
The Company is exposed to credit risk in the event of nonperformance by the interest rate swap counterparty. The Company minimizes this risk by entering into interest rate swap derivative contracts with only large, stable financial institutions, and the Company has not experienced, and does not expect, any losses from counterparty nonperformance on the interest rate swaps. The Company monitors counterparty risk in accordance with the provisions of ASC Topic 815, "Derivatives and Hedging."
The interest rate swap agreements detail: the requirement that collateral be posted when the market value exceeds certain threshold limits associated with the secured party's exposure; that if the Company defaults on any of its indebtedness (including default where repayment of the indebtedness has not been accelerated by the lender), then the Company could also be declared in default on its derivative obligations; and that if the Company fails to maintain its status as a well/adequate capitalized institution then the counterparty could terminate the derivative positions and the Company would be required to settle its obligations under the agreements.
As of December 31, 2015, the aggregate fair value of all derivative contracts with credit risk contingent features (i.e., those containing collateral posting or termination provisions based on our capital status) that were in a net liability position totaled $1.4 million. As of December 31, 2015, the Company has minimum collateral posting thresholds with certain of its derivative counterparties and has posted collateral of $2.9 million against its obligations under these agreements. If the Company had breached any of these provisions at December 31, 2015, it could have been required to settle its obligations under the agreements at the termination value.
117
Eagle Bancorp, Inc.
Notes to Consolidated Financial Statements
for the Years Ended December 31, 2015, 2014 and 2013: (Continued)
Note 10—Interest Rate Swap Derivatives (Continued)
The table below identifies the balance sheet category and fair values of the Company's interest rate swap derivative instruments designated as cash flow hedges as of December 31, 2015. There were no interest rate swap derivative instruments as of December 31, 2014.
December 31, 2015
|
Swap Number |
Notional Amount |
Fair Value |
Balance Sheet Category |
Receive Rate |
Pay Rate | Maturity | |||||||||||
|---|---|---|---|---|---|---|---|---|---|---|---|---|---|---|---|---|---|---|
| (dollars in thousands) |
|
|
|
|
|
|
|
|||||||||||
Interest rate swap |
(1 | ) | $ | 75,000 | $ | (368 | ) | Other Liabilities | 1 month USD-LIBOR-BBA w/–1 day lookback +10 basis points | 1.71 | % | March 31, 2020 | ||||||
Interest rate swap |
(2 | ) | 100,000 | (665 | ) | Other Liabilities | Federal Funds Effective Rate +10 basis points | 1.74 | % | April 15, 2021 | ||||||||
Interest rate swap |
(3 | ) | 75,000 | (384 | ) | Other Liabilities | 1 month USD-LIBOR-BBA w/–1 day lookback +10 basis points | 1.92 | % | March 31, 2022 | ||||||||
The table below presents the pre-tax net gains (losses) of the Company's cash flow hedges for the year ended December 31, 2015. Since all transactions are forward starting swaps all amounts are balance sheet related ("AOCI"), and no amounts were recorded in the income statement.
| |
|
Year Ended December 31, 2015 | |||||||||||||||||
|---|---|---|---|---|---|---|---|---|---|---|---|---|---|---|---|---|---|---|---|
| |
|
Effective Portion | Ineffective Portion | ||||||||||||||||
| |
|
|
Reclassified from AOCI into income |
Recognized in Income on Derivatives |
|||||||||||||||
| (dollars in thousands) |
Swap Number |
Amount of Pre-tax gain (loss) Recognized in OCI |
Category | Amount of Gain (Loss) |
Category | Amount of Gain (Loss) |
|||||||||||||
Interest rate swap |
(1 | ) | $ | (368 | ) | $ | — | $ | — | ||||||||||
Interest rate swap |
(2 | ) | (665 | ) | — | — | |||||||||||||
Interest rate swap |
(3 | ) | (384 | ) | — | — | |||||||||||||
Note 11—Deposits
The following table provides information regarding the Bank's deposit composition and shows the average rate being paid on the interest bearing deposits at December 31, 2015, 2014 and 2013.
| |
2015 | 2014 | 2013 | ||||||||||||||||
|---|---|---|---|---|---|---|---|---|---|---|---|---|---|---|---|---|---|---|---|
| (dollars in thousands) |
Balance | Average Rate |
Balance | Average Rate |
Balance | Average Rate |
|||||||||||||
Noninterest bearing demand |
$ | 1,405,067 | — | $ | 1,175,799 | — | $ | 849,409 | — | ||||||||||
Interest bearing transaction |
178,797 | 0.16 | % | 143,628 | 0.13 | % | 118,580 | 0.26 | % | ||||||||||
Savings and money market |
2,835,325 | 0.34 | % | 2,302,600 | 0.32 | % | 1,811,088 | 0.35 | % | ||||||||||
Time, $100,000 or more |
406,570 | 0.77 | % | 393,132 | 0.68 | % | 203,706 | 0.88 | % | ||||||||||
Other time |
332,685 | 0.74 | % | 295,609 | 0.70 | % | 242,631 | 0.54 | % | ||||||||||
| | | | | | | | | | | | | | | | | | | | |
Total |
$ | 5,158,444 | $ | 4,310,768 | $ | 3,225,414 | |||||||||||||
| | | | | | | | | | | | | | | | | | | | |
| | | | | | | | | | | | | | | | | | | | |
| | | | | | | | | | | | | | | | | | | | |
118
Eagle Bancorp, Inc.
Notes to Consolidated Financial Statements
for the Years Ended December 31, 2015, 2014 and 2013: (Continued)
Note 11—Deposits (Continued)
The remaining maturity of time deposits at December 31, 2015, 2014 and 2013 are as follows:
| (dollars in thousands) |
2015 | 2014 | 2013 | |||||||
|---|---|---|---|---|---|---|---|---|---|---|
Three months or less |
$ | 88,483 | $ | 104,482 | $ | 82,790 | ||||
More than three months through six months |
123,789 | 106,861 | 109,101 | |||||||
More than six months through twelve months |
234,684 | 182,187 | 118,646 | |||||||
Over twelve months |
292,299 | 295,211 | 135,800 | |||||||
| | | | | | | | | | | |
Total |
$ | 739,255 | $ | 688,741 | $ | 446,337 | ||||
| | | | | | | | | | | |
| | | | | | | | | | | |
| | | | | | | | | | | |
Interest expense on deposits for the years ended December 31, 2015, 2014 and 2013 is as follows:
| (dollars in thousands) |
2015 | 2014 | 2013 | |||||||
|---|---|---|---|---|---|---|---|---|---|---|
Interest bearing transaction |
$ | 291 | $ | 178 | $ | 298 | ||||
Savings and money market |
8,185 | 6,265 | 5,765 | |||||||
Time, $100,000 or more |
5,019 | 2,830 | 2,080 | |||||||
Other time |
848 | 365 | 2,471 | |||||||
| | | | | | | | | | | |
Total |
$ | 14,343 | $ | 9,638 | $ | 10,614 | ||||
| | | | | | | | | | | |
| | | | | | | | | | | |
| | | | | | | | | | | |
Related Party Deposits totaled $57 million, $71 million, and $71 million at December 31, 2015, 2014, and 2013, respectively.
As of December 31, 2015 and December 31, 2014, time deposit accounts in excess of $250 thousand totaled $180.1 million and $138.6, respectively.
119
Eagle Bancorp, Inc.
Notes to Consolidated Financial Statements
for the Years Ended December 31, 2015, 2014 and 2013: (Continued)
Note 12—Borrowings
Information relating to short-term and long-term borrowings is as follows for the years ended December 31:
| |
2015 | 2014 | 2013 | ||||||||||||||||
|---|---|---|---|---|---|---|---|---|---|---|---|---|---|---|---|---|---|---|---|
| (dollars in thousands) |
Amount | Rate | Amount | Rate | Amount | Rate | |||||||||||||
Short-term: |
|||||||||||||||||||
At Year-End: |
|||||||||||||||||||
Customer repurchase agreements and federal funds purchased |
$ | 72,356 | 0.23 | % | $ | 61,120 | 0.25 | % | $ | 80,471 | 0.28 | % | |||||||
Federal Home Loan Bank—current portion |
— | — | 100,000 | 0.38 | % | — | — | ||||||||||||
| | | | | | | | | | | | | | | | | | | | |
Total |
$ | 72,356 | $ | 161,120 | $ | 80,471 | |||||||||||||
| | | | | | | | | | | | | | | | | | | | |
| | | | | | | | | | | | | | | | | | | | |
| | | | | | | | | | | | | | | | | | | | |
Average Daily Balance: |
|||||||||||||||||||
Customer repurchase agreements and federal funds purchased |
$ | 59,141 | 0.22 | % | $ | 63,490 | 0.23 | % | $ | 94,566 | 0.27 | % | |||||||
Federal Home Loan Bank—current portion |
27,659 | 0.31 | % | 7,288 | 0.42 | % | — | — | |||||||||||
| | | | | | | | | | | | | | | | | | | | |
Total |
$ | 86,800 | $ | 70,778 | $ | 94,566 | |||||||||||||
| | | | | | | | | | | | | | | | | | | | |
| | | | | | | | | | | | | | | | | | | | |
| | | | | | | | | | | | | | | | | | | | |
Maximum Month-end Balance: |
|||||||||||||||||||
Customer repurchase agreements and federal funds purchased |
$ | 73,696 | 0.21 | % | $ | 80,471 | 0.28 | % | $ | 106,975 | 0.23 | % | |||||||
Federal Home Loan Bank—current portion |
140,000 | 0.20 | % | 100,000 | 0.38 | % | — | — | |||||||||||
| | | | | | | | | | | | | | | | | | | | |
Total |
$ | 213,696 | $ | 180,471 | $ | 106,975 | |||||||||||||
| | | | | | | | | | | | | | | | | | | | |
| | | | | | | | | | | | | | | | | | | | |
| | | | | | | | | | | | | | | | | | | | |
Long-term: |
|||||||||||||||||||
At Year-End: |
|||||||||||||||||||
Federal Home Loan Bank |
$ | 0 | — | $ | 40,000 | 2.62 | % | $ | 30,000 | 2.46 | % | ||||||||
Subordinated Notes |
70,000 | 5.75 | % | 79,300 | 6.40 | % | 9,300 | 8.50 | % | ||||||||||
United Bank Line of Credit |
— | — | — | — | — | — | |||||||||||||
| | | | | | | | | | | | | | | | | | | | |
Total |
$ | 70,000 | $ | 119,300 | $ | 39,300 | |||||||||||||
| | | | | | | | | | | | | | | | | | | | |
| | | | | | | | | | | | | | | | | | | | |
| | | | | | | | | | | | | | | | | | | | |
Average Daily Balance: |
|||||||||||||||||||
Federal Home Loan Bank |
$ | 8,329 | 2.25 | % | $ | 39,205 | 2.00 | % | $ | 30,000 | 2.46 | % | |||||||
Subordinated Notes |
74,117 | 6.06 | % | 37,875 | 6.59 | % | 9,300 | 9.64 | % | ||||||||||
United Bank Line of Credit |
— | — | — | — | — | — | |||||||||||||
| | | | | | | | | | | | | | | | | | | | |
Total |
$ | 82,446 | $ | 77,080 | $ | 39,300 | |||||||||||||
| | | | | | | | | | | | | | | | | | | | |
| | | | | | | | | | | | | | | | | | | | |
| | | | | | | | | | | | | | | | | | | | |
Maximum Month-end Balance: |
|||||||||||||||||||
Federal Home Loan Bank |
$ | 40,000 | 0.37 | % | $ | 122,500 | 0.68 | % | $ | 30,000 | 2.46 | % | |||||||
Subordinated Notes |
79,300 | 6.52 | % | 79,300 | 6.52 | % | 9,300 | 10.00 | % | ||||||||||
United Bank Line of Credit |
— | — | — | — | — | — | |||||||||||||
| | | | | | | | | | | | | | | | | | | | |
Total |
$ | 119,300 | $ | 201,800 | $ | 39,300 | |||||||||||||
| | | | | | | | | | | | | | | | | | | | |
| | | | | | | | | | | | | | | | | | | | |
| | | | | | | | | | | | | | | | | | | | |
120
Eagle Bancorp, Inc.
Notes to Consolidated Financial Statements
for the Years Ended December 31, 2015, 2014 and 2013: (Continued)
Note 12—Borrowings (Continued)
The Company offers its business customers a repurchase agreement sweep account in which it collateralizes these funds with U.S. agency and mortgage backed securities segregated in its investment portfolio for this purpose. By entering into the agreement, the customer agrees to have the Bank repurchase the designated securities on the business day following the initial transaction in consideration of the payment of interest at the rate prevailing on the day of the transaction.
The Bank can purchase up to $137.5 million in federal funds on an unsecured basis from its correspondents, against which there were no amounts outstanding at December 31, 2015 and can borrow unsecured funds under one-way CDARS brokered deposits in the amount of $909.5 million, against which there was $5.8 million outstanding at December 31, 2015. The Bank also has a commitment at December 31, 2015 from Promontory Interfinancial Network, LLC ("Promontory") to place up to $300.0 million of brokered deposits from its Insured Network Deposit ("IND") program with the Bank, with an actual balance of $236.4 million outstanding at December 31, 2015. At December 31, 2015, the Bank was also eligible to make advances from the FHLB up to $731.1 million based on collateral at the FHLB, against which there were no amounts outstanding at December 31, 2015. Also, the Bank may enter into repurchase agreements as well as obtaining additional borrowing capabilities from the FHLB provided adequate collateral exists to secure these lending relationships. The Bank also has a back-up borrowing facility through the Discount Window at the Federal Reserve Bank. This facility, which amounts to approximately $408.0 million, is collateralized with specific loan assets identified to the Federal Reserve Bank. It is anticipated that, except for periodic testing, this facility would be utilized for contingency funding only.
During 2015, the Company renewed its Loan Agreement and related Stock Security Agreement and Promissory Note (the "credit facility") with a regional bank, pursuant to which the Company may borrow, on a revolving basis, up to $50 million for working capital purposes, or to finance capital contributions to the Bank in whole and to ECV in part. This facility was originally entered into in August 2008 and has been renegotiated over the past seven years to its current terms. The credit facility is secured by a first lien on a portion of the stock of the Bank, and bears interest at a floating rate equal to the Wall Street Journal Prime Rate minus 0.25% with a floor interest rate of 3.50%. Interest is payable on a monthly basis. The term of the credit facility expires on September 30, 2016. There were no amounts outstanding under this credit at December 31, 2015 or December 31, 2014.
On August 5, 2014, the Company completed the sale of $70.0 million of its 5.75% subordinated notes, due September 1, 2024 (the "Notes"). The Notes were offered to the public at par and qualify as Tier 2 capital for regulatory purposes to the fullest extent permitted under capital regulations applicable under the Basel III Rule capital requirements. The net proceeds were approximately $68.8 million, net of $1.2 million in deferred financing costs which is being amortized over the life of the Notes.
During 2015, the Company redeemed the remaining balance of $9.3 million of subordinated notes, due 2021. As a result, the only long-term borrowing outstanding at December 31, 2015 was the Company's August 5, 2014, issuance of $70.0 million of subordinated notes, due September 1, 2024 noted above.
During March 2015, the Company paid off its outstanding FHLB advances. A $1.1 million loss on the early extinguishment of debt was recorded in March of 2015 due to the early payoff of FHLB advances. This decision was made in light of deposit growth in the quarter and expected benefits to the cost of funds going forward.
121
Eagle Bancorp, Inc.
Notes to Consolidated Financial Statements
for the Years Ended December 31, 2015, 2014 and 2013: (Continued)
Note 13—Preferred Stock and Warrants
On July 14, 2011, the Company entered into and consummated a Securities Purchase Agreement (the "Purchase Agreement") with the Secretary of the Treasury of the United States (the "Secretary") under the Small Business Lending Fund program. Pursuant to the Purchase Agreement, the Company issued 56,600 shares of the Series B Preferred Stock for a total purchase price of $56,600,000.
The Series B Preferred Stock was entitled to receive non-cumulative dividends beginning October 1, 2011 of one percent (1%).
Pursuant to the Merger Agreement, each of the 15,300 shares of Virginia Heritage Series A Preferred Stock was exchanged for one share of the Company's Senior Series C Preferred Stock, which ranks equally with and has substantially identical terms and conditions as the Company's Series B Preferred Stock.
On November 2, 2015, the Company redeemed all of the 56,600 shares of the Series B Preferred Stock, and all of the 15,300 shares of the Company's Series C Preferred Stock. The aggregate redemption price of the Series B Preferred Stock and Series C Preferred Stock was approximately $71.96 million, including dividends accrued but unpaid through, but not including the redemption date.
On November 18, 2011 under provisions of the TARP Capital Purchase Program the Company issued to the U.S. Department of the Treasury warrants for 423,977 shares (as adjusted reflect the 10% stock dividend paid on June 14, 2013) of Company common stock at $6.76 per share (as adjusted for the 10% stock dividend paid on June 14, 2013). The warrants have an expiration date of December 8, 2018. Upon exercise, which is at the option of the holder, the Company will issue a number of shares of Company common stock in exchange for the warrants equal to the number of shares subject to the warrant less the number of shares determined by multiplying the number of shares subject to the warrant by the strike price and dividing the result by the current share price.
Note 14—Income Taxes
Federal and state income tax expense consists of the following for the years ended December 31:
| (dollars in thousands) |
2015 | 2014 | 2013 | |||||||
|---|---|---|---|---|---|---|---|---|---|---|
Current federal income tax |
$ | 46,758 | $ | 32,384 | $ | 26,136 | ||||
Current state income tax |
11,020 | 7,114 | 6,147 | |||||||
| | | | | | | | | | | |
Total current |
57,778 | 39,498 | 32,283 | |||||||
| | | | | | | | | | | |
Deferred federal income tax benefit |
(6,642 | ) | (7,494 | ) | (3,909 | ) | ||||
Deferred state income tax benefit |
(87 | ) | (46 | ) | (56 | ) | ||||
| | | | | | | | | | | |
Total deferred |
(6,729 | ) | (7,540 | ) | (3,965 | ) | ||||
| | | | | | | | | | | |
Total income tax expense |
$ | 51,049 | $ | 31,958 | $ | 28,318 | ||||
| | | | | | | | | | | |
| | | | | | | | | | | |
| | | | | | | | | | | |
Temporary timing differences between the amounts reported in the financial statements and the tax bases of assets and liabilities result in deferred taxes. Gross deferred tax assets and liabilities, shown as the
122
Eagle Bancorp, Inc.
Notes to Consolidated Financial Statements
for the Years Ended December 31, 2015, 2014 and 2013: (Continued)
Note 14—Income Taxes (Continued)
sum of the appropriate tax effect for each significant type of temporary difference, is presented below for the years ended December 31:
| (dollars in thousands) |
2015 | 2014 | 2013 | |||||||
|---|---|---|---|---|---|---|---|---|---|---|
Deferred tax assets |
||||||||||
Allowance for credit losses |
$ | 21,191 | $ | 18,544 | $ | 16,440 | ||||
Deferred loan fees and costs |
9,724 | 10,337 | 5,039 | |||||||
Deferred rent |
1,364 | — | — | |||||||
Stock-based compensation |
2,068 | 1,714 | 1,370 | |||||||
Net operating loss |
2,946 | 3,198 | 3,449 | |||||||
Unrealized loss on securities available for sale |
— | — | 2,213 | |||||||
SERP |
1,776 | 1,421 | — | |||||||
Premises and equipment |
3,381 | 1,590 | 1,283 | |||||||
Other |
383 | 71 | 4 | |||||||
| | | | | | | | | | | |
Total deferred tax assets |
42,833 | 36,875 | 29,798 | |||||||
| | | | | | | | | | | |
Deferred tax liabilities |
||||||||||
Unrealized gain on securities available for sale |
(694 | ) | (1,765 | ) | — | |||||
Excess servicing |
(157 | ) | (114 | ) | (95 | ) | ||||
Deferred rent |
— | (162 | ) | (264 | ) | |||||
Intangible assets |
(1,671 | ) | (2,323 | ) | (490 | ) | ||||
| | | | | | | | | | | |
Total deferred tax liabilities |
(2,522 | ) | (4,364 | ) | (849 | ) | ||||
| | | | | | | | | | | |
Net deferred income tax amount |
$ | 40,311 | $ | 32,511 | $ | 28,949 | ||||
| | | | | | | | | | | |
| | | | | | | | | | | |
| | | | | | | | | | | |
A reconciliation of the statutory federal income tax rate to the Company's effective income tax rate for the years ended December 31 follows:
| |
2015 | 2014 | 2013 | |||||||
|---|---|---|---|---|---|---|---|---|---|---|
Statutory federal income tax rate |
35.00 | % | 35.00 | % | 35.00 | % | ||||
Increase (decrease) due to |
||||||||||
State income taxes, net of federal income tax benefit |
5.26 | 5.33 | 5.26 | |||||||
Tax exempt interest and dividend income |
(1.25 | ) | (2.28 | ) | (2.17 | ) | ||||
Stock-based compensation expense |
0.02 | 0.04 | 0.06 | |||||||
Other |
(1.28 | ) | (1.02 | ) | (0.56 | ) | ||||
| | | | | | | | | | | |
Effective tax rates |
37.75 | % | 37.07 | % | 37.59 | % | ||||
| | | | | | | | | | | |
| | | | | | | | | | | |
| | | | | | | | | | | |
The net operating loss carry forward acquired in conjunction with the Fidelity acquisition is subject to annual limits under Section 382 of the Internal Revenue Code of $718 thousand and expires in 2027. The Company remains subject to examination for the years ending after December 31, 2011.
123
Eagle Bancorp, Inc.
Notes to Consolidated Financial Statements
for the Years Ended December 31, 2015, 2014 and 2013: (Continued)
Note 15—Net Income per Common Share
The calculation of net income per common share for the years ended December 31 was as follows:
(dollars and shares in thousands, except per share data)
|
2015 | 2014 | 2013 | |||||||
|---|---|---|---|---|---|---|---|---|---|---|
Basic: |
||||||||||
Net income available to common shareholders |
$ | 83,566 | $ | 53,644 | $ | 46,441 | ||||
Average common shares outstanding |
32,836 | 26,684 | 25,726 | |||||||
| | | | | | | | | | | |
Basic net income per common share |
$ | 2.54 | $ | 2.01 | $ | 1.81 | ||||
| | | | | | | | | | | |
Diluted: |
||||||||||
Net income available to common shareholders |
$ | 83,566 | $ | 53,644 | $ | 46,441 | ||||
Average common shares outstanding |
32,836 | 26,684 | 25,726 | |||||||
Adjustment for common share equivalents |
643 | 867 | 633 | |||||||
| | | | | | | | | | | |
Average common shares outstanding-diluted |
33,479 | 27,551 | 26,359 | |||||||
| | | | | | | | | | | |
Diluted net income per common share |
$ | 2.50 | $ | 1.95 | $ | 1.76 | ||||
| | | | | | | | | | | |
Anti-dilutive shares |
5 | 13 | 35 | |||||||
Note 16—Related Party Transactions
During 2015, approximately $427 thousand in interest was paid to the current or former directors of the Company or accounts for the benefit of such persons in respect of the Company's subordinated notes, due 2021. See Note 12 for additional information regarding these subordinated notes.
The Bank leases office space from limited liability companies in which a trust for the benefit of an executive officer's children has an 85% interest in one instance and a 51% interest in another. During the fourth quarter of 2015, the Company entered into an agreement to lease office space for a second location with limited liability companies in which an executive officer indirectly owns a majority interest. The Company paid $1.6 million, $1.3 million, and $822 thousand excluding certain pass-through expenses for the years ended December 31, 2015, 2014 and 2013, respectively.
A director is a partner in the law firm which has provided, and continues to provide, legal services to the Company and its subsidiaries. During 2015, the Company and its subsidiaries paid aggregate fees of $1.1 million to that firm. Under Mr. Roger's arrangement with his firm, he does not participate significantly in the profits or revenues resulting from the provision of legal services to the Company and its subsidiaries.
Note 17—Stock-Based Compensation
The Company maintains the 1998 Stock Option Plan ("1998 Plan"), the 2006 Stock Plan ("2006 Plan") and the 2011 Employee Stock Purchase Plan ("2011 ESPP").
In connection with the acquisition of Fidelity, the Company assumed the Fidelity 2004 Long Term Incentive Plan and the 2005 Long Term Incentive Plan (the "Fidelity Plans").
In connection with the acquisition of Virginia Heritage, the Company assumed the Virginia Heritage 2006 Stock Option Plan and the 2010 Long Term Incentive Plan (the "Virginia Heritage Plans").
124
Eagle Bancorp, Inc.
Notes to Consolidated Financial Statements
for the Years Ended December 31, 2015, 2014 and 2013: (Continued)
Note 17—Stock-Based Compensation (Continued)
No additional options may be granted under the 1998 Plan, the Fidelity Plans or the Virginia Heritage Plans.
The 2006 Plan provides for the issuance of awards of incentive stock options, non-qualifying stock options, restricted stock and stock appreciation rights to selected key employees and members of the Board of Directors. As amended, 1,996,500 shares of common stock are subject to issuance pursuant to awards under the 2006 Plan. Stock options awarded have an exercise price equal to the average of the high and low price of the Company's shares at the date of grant.
For awards that are service based, compensation expense is being recognized over the service (vesting) period based on fair value, which for stock option grants is computed using the Black-Scholes model, and for restricted stock awards is based on the average of the high and low stock price of the Company's shares on the date of grant. For awards that are performance-based, compensation expense is recorded based on the probability of achievement of the goals underlying the grant. No performance-based awards are outstanding at December 31, 2015.
In February 2015, the Company awarded 77,370 shares of restricted stock to senior officers, directors and employees. The shares vest in three substantially equal installments beginning on the first anniversary of the date of grant.
In March 2015, the Company awarded 700 shares of restricted stock to an employee. The shares vest in five substantially equal installments beginning on the first anniversary of the date of grant.
In October 2015, the Company awarded an employee stock options to purchase 5,000 shares which have a ten-year term and vest in four installments beginning on the first anniversary of the date of grant.
Below is a summary of stock option activity for the twelve months ended December 31, 2015, 2014 and 2013. The information excludes restricted stock awards.
| |
2015 | 2014 | 2013 | ||||||||||||||||
|---|---|---|---|---|---|---|---|---|---|---|---|---|---|---|---|---|---|---|---|
| |
Shares | Weighted- Average Exercise Price |
Shares | Weighted- Average Exercise Price |
Shares | Weighted- Average Exercise Price |
|||||||||||||
Beginning balance |
759,683 | $ | 11.36 | 503,834 | $ | 10.41 | 722,155 | $ | 10.18 | ||||||||||
Issued |
5,000 | 46.50 | 21,000 | 32.77 | 5,800 | 22.11 | |||||||||||||
Assumed from |
|||||||||||||||||||
Virginia Heritage |
— | — | 401,497 | 13.16 | — | — | |||||||||||||
Exercised |
(443,912 | ) | 12.03 | (157,313 | ) | 14.71 | (198,588 | ) | 9.99 | ||||||||||
Forfeited |
(12,380 | ) | 29.58 | (8,110 | ) | 33.06 | (2,420 | ) | 7.40 | ||||||||||
Expired |
(9,651 | ) | 18.19 | (1,225 | ) | 9.00 | (23,113 | ) | 10.05 | ||||||||||
| | | | | | | | | | | | | | | | | | | | |
Ending balance |
298,740 | $ | 9.97 | 759,683 | $ | 11.36 | 503,834 | $ | 10.41 | ||||||||||
| | | | | | | | | | | | | | | | | | | | |
| | | | | | | | | | | | | | | | | | | | |
| | | | | | | | | | | | | | | | | | | | |
125
Eagle Bancorp, Inc.
Notes to Consolidated Financial Statements
for the Years Ended December 31, 2015, 2014 and 2013: (Continued)
Note 17—Stock-Based Compensation (Continued)
The following summarizes information about stock options outstanding at December 31, 2015. The information excludes restricted stock units and awards.
| |
Stock Options Outstanding |
Weighted-Average Exercise Price |
Weighted-Average Remaining Contractual Life |
|||||||
|---|---|---|---|---|---|---|---|---|---|---|
Outstanding:
|
||||||||||
| Range of Exercise Prices |
||||||||||
$5.76 $9.21 |
162,269 | $ | 5.76 | 2.95 | ||||||
$9.22 $15.47 |
108,529 | 12.41 | 1.59 | |||||||
$15.48 $22.66 |
18,794 | 19.28 | 6.81 | |||||||
$22.67 $49.50 |
9,148 | 36.61 | 7.65 | |||||||
| | | | | | | | | | | |
|
298,740 | $ | 9.97 | 2.84 | ||||||
| | | | | | | | | | | |
| | | | | | | | | | | |
| | | | | | | | | | | |
| |
Stock Options Exercisable |
Weighted-Average Exercise Price |
|||||
|---|---|---|---|---|---|---|---|
Exercisable:
|
|||||||
| Range of Exercise Prices |
|||||||
$5.76 $9.21 |
105,359 | $ | 5.76 | ||||
$9.22 $15.47 |
101,859 | 12.51 | |||||
$15.48 $22.66 |
15,714 | 19.45 | |||||
$22.67 $49.50 |
2,648 | 24.59 | |||||
| | | | | | | | |
|
225,580 | $ | 9.99 | ||||
| | | | | | | | |
| | | | | | | | |
| | | | | | | | |
The fair value of each stock option grant is estimated on the date of grant using the Black-Scholes option pricing model with the assumptions as shown in the table below used for grants during the years ended December 31, 2015, 2014 and 2013.
| |
Years Ended December 31, | |||||||||
|---|---|---|---|---|---|---|---|---|---|---|
| |
2015 | 2014 | 2013 | |||||||
Expected volatility |
31.21 | % | 34.25 | % | 34.12 | % | ||||
Weighted-Average volatility |
31.21 | % | 34.25 | % | 34.12 | % | ||||
Expected dividends |
— | — | — | |||||||
Expected term (in years) |
7.0 | 9.4 | 7.5 | |||||||
Risk-free rate |
1.64 | % | 2.26 | % | 1.31 | % | ||||
Weighted-average fair value (grant date) |
$ | 16.73 | $ | 13.49 | $ | 7.83 | ||||
Weighted-average fair value (grant date) for Virginia Heritage Bank ("VHB") options assumed |
n/a | $ | 24.89 | n/a | ||||||
The expected lives are based on the "simplified" method allowed by ASC Topic 718 "Compensation," whereby the expected term is equal to the midpoint between the vesting date and the end of the contractual term of the award.
The total intrinsic value of outstanding stock options was $12.2 million and $18.5 million, respectively, at December 31, 2015 and 2014. The total fair value of stock options vested was $90 thousand and $10.1 million (including $10.0 million of assumed stock options issued under the Virginia Heritage Plans), and $133 thousand for 2015, 2014 and 2013, respectively. Unrecognized stock-based compensation expense related to stock options totaled $138 thousand at December 31, 2015. At such date, the weighted-average period over which this unrecognized expense was expected to be recognized was 3.26 years.
126
Eagle Bancorp, Inc.
Notes to Consolidated Financial Statements
for the Years Ended December 31, 2015, 2014 and 2013: (Continued)
Note 17—Stock-Based Compensation (Continued)
Cash proceeds, tax benefits and intrinsic value related to total stock options exercised is as follows:
| |
Years Ended December 31, | |||||||||
|---|---|---|---|---|---|---|---|---|---|---|
| (dollars in thousands) |
2015 | 2014 | 2013 | |||||||
Proceeds from stock options exercised |
$ | 5,176 | $ | 2,313 | $ | 1,984 | ||||
Tax benefits realized from stock compensation |
2,984 | 978 | 410 | |||||||
Intrinsic value of stock options exercised |
11,042 | 3,184 | 3,060 | |||||||
The Company has unvested restricted stock awards of 369,093 shares under the 2006 Plan at December 31, 2015. Unrecognized stock based compensation expense related to restricted stock awards totaled $5.1 million at December 31, 2015. At such date, the weighted-average period over which this unrecognized expense was expected to be recognized was 1.46 years. The following table summarizes the unvested restricted stock awards at December 31, 2015 and 2014:
| |
Years Ended December 31, | ||||||||||||
|---|---|---|---|---|---|---|---|---|---|---|---|---|---|
| |
2015 | 2014 | |||||||||||
| |
Shares | Weighted- Average Grant Date Fair Value |
Shares | Weighted- Average Grant Date Fair Value |
|||||||||
Unvested at beginning |
509,336 | $ | 21.58 | 614,580 | $ | 18.71 | |||||||
Issued |
78,070 | 36.06 | 87,927 | 33.50 | |||||||||
Forfeited |
(8,490 | ) | 33.57 | (8,250 | ) | 25.28 | |||||||
Vested |
(209,823 | ) | 21.47 | (184,921 | ) | 17.54 | |||||||
| | | | | | | | | | | | | | |
Unvested at end |
369,093 | $ | 24.43 | 509,336 | $ | 21.58 | |||||||
| | | | | | | | | | | | | | |
| | | | | | | | | | | | | | |
| | | | | | | | | | | | | | |
Approved by shareholders in May 2011, the 2011 ESPP reserved 550,000 shares of common stock (as adjusted for stock dividends) for issuance to employees. Whole shares are sold to participants in the plan at 85% of the lower of the stock price at the beginning or end of each quarterly offering period. The 2011 ESPP is available to all eligible employees who have completed at least one year of continuous employment, work at least 20 hours per week and at least five months a year. Participants may contribute a minimum of $10 per pay period to a maximum of $6,250 per offering period or $25,000 annually (not to exceed more than 10% of compensation per pay period). At December 31, 2015, the 2011 ESPP had 434,277 shares remaining for issuance.
Included in salaries and employee benefits the Company recognized $5.1 million, $4.0 million and $3.3 million in stock-based compensation expense for 2015, 2014 and 2013, respectively. Stock-based compensation expense is recognized ratably over the requisite service period for all awards.
Note 18—Employee Benefit Plans
The Company has a qualified 401(k) Plan which covers all employees who have reached the age of 21 and have completed at least one month of service as defined by the Plan. The Company makes contributions to the Plan based on a matching formula, which is annually reviewed. For the years 2015, 2014 and 2013, the Company recognized $755 thousand, $833 thousand, and $878 thousand in expense, respectively. These amounts are included in salaries and employee benefits in the accompanying Consolidated Statements of Operations.
127
Eagle Bancorp, Inc.
Notes to Consolidated Financial Statements
for the Years Ended December 31, 2015, 2014 and 2013: (Continued)
Note 19—Supplemental Executive Retirement Plan
The Bank has entered into Supplemental Executive Retirement and Death Benefit Agreements (the "SERP Agreements") with certain of the Bank's executive officers other than Mr. Paul, which upon the executive's retirement, will provide for a stated monthly payment for such executive's lifetime subject to certain death benefits described below. The retirement benefit is computed as a percentage of each executive's projected average base salary over the five years preceding retirement, assuming retirement at age 67. The SERP Agreements provide that (a) the benefits vest ratably over six years of service to the Bank, with the executive receiving credit for years of service prior to entering into the SERP Agreement (b) death, disability and change-in-control shall result in immediate vesting, and (c) the monthly amount will be reduced if retirement occurs earlier than age 67 for any reason other than death, disability or change-in-control. The SERP Agreements further provide for a death benefit in the event the retired executive dies prior to receiving 180 monthly installments, paid either in a lump sum payment or continued monthly installment payments, such that the executive's beneficiary has received payment(s) sufficient to equate to a cumulative 180 monthly installments.
The SERP Agreements are unfunded arrangements maintained primarily to provide supplemental retirement benefits and comply with Section 409A of the Internal Revenue Code. The Bank financed the retirement benefits by purchasing fixed annuity contracts with four insurance carriers totaling $11.4 million that have been designed to provide a future source of funds for the lifetime retirement benefits of the SERP Agreements. The primary impetus for utilizing fixed annuities is a substantial savings in compensation expenses for the Bank as opposed to a traditional SERP Agreement. The annuity contracts accrued $84 thousand and $50 thousand respectively of income for the years ended December 31, 2015 and 2014, which is included in other noninterest income on the Consolidated Statement of Operations. The cash surrender value of the annuity contracts is $12.1 million at December 31, 2015 and is included in other assets on the Consolidated Balance Sheet. For the years ended December 31, 2015 and 2014, the Company recorded benefit expense accruals of $953 thousand and $1.9 million respectively for this post retirement benefit.
Upon death of a named executive, the annuity contract related to such executive terminates. The Bank has purchased additional bank owned life insurance contracts, which would effectively finance payments (up to a 15 year certain amount) to the executives' named beneficiaries.
Note 20—Financial Instruments with Off-Balance Sheet Risk
Various commitments to extend credit are made in the normal course of banking business. Letters of credit are also issued for the benefit of customers. These commitments are subject to loan underwriting standards and geographic boundaries consistent with the Company's loans outstanding.
Commitments to extend credit are agreements to lend to a customer as long as there is no violation of any condition established in the contract. Commitments generally have fixed expiration dates or other termination clauses and may require payment of a fee. Since some of the commitments are expected to expire without being drawn upon, the total commitment amounts do not necessarily represent future cash requirements.
128
Eagle Bancorp, Inc.
Notes to Consolidated Financial Statements
for the Years Ended December 31, 2015, 2014 and 2013: (Continued)
Note 20—Financial Instruments with Off-Balance Sheet Risk (Continued)
Loan commitments outstanding and lines and letters of credit at December 31, 2015 and 2014 are as follows:
(dollars in thousands)
|
2015 | 2014 | |||||
|---|---|---|---|---|---|---|---|
Unfunded loan commitments |
$ | 1,838,336 | $ | 1,625,957 | |||
Unfunded lines of credit |
112,159 | 105,895 | |||||
Letters of credit |
83,511 | 75,615 | |||||
| | | | | | | | |
Total |
$ | 2,034,006 | $ | 1,807,467 | |||
| | | | | | | | |
| | | | | | | | |
| | | | | | | | |
Because most of the Company's business activity is with customers located in the Washington, D.C., metropolitan area, a geographic concentration of credit risk exists within the loan portfolio, the performance of which will be influenced by the economy of the region.
The Bank maintains a reserve for the potential repurchase of residential mortgage loans, which amounted to $117 thousand at December 31, 2015 and $101 thousand at December 31, 2014. These amounts are included in other liabilities in the accompanying Consolidated Balance Sheets. Changes in the balance of the reserve are a component of other expenses in the accompanying Consolidated Statements of Operations. The reserve is available to absorb losses on the repurchase of loans sold related to document and other fraud, early payment default and early payoff. Through December 31, 2015, no reserve charges have occurred related to fraud.
The Company enters into interest rate lock commitments, which are commitments to originate loans whereby the interest rate on the loan is determined prior to funding and the customers have locked into that interest rate. The residential mortgage division either locks in the loan and rate with an investor and commits to deliver the loan if settlement occurs under best efforts or commits to deliver the locked loan in a binding mandatory delivery program with an investor. Certain loans under rate lock commitments are covered under forward sales contracts of mortgage backed securities as a hedge of any interest rate risk. Forward sales contracts of mortgage backed securities are recorded at fair value with changes in fair value recorded in noninterest income. Interest rate lock commitments and commitments to deliver loans to investors are considered derivatives. The market value of interest rate lock commitments and best efforts contracts are not readily ascertainable with precision because they are not actively traded in stand-alone markets. The Company determines the fair value of rate lock commitments and delivery contracts by measuring the fair value of the underlying asset, which is impacted by current interest rates while taking into consideration the probability that the rate lock commitments will close or will be funded. These transactions are further detailed in Note 9 to the Consolidated Financial Statements.
129
Eagle Bancorp, Inc.
Notes to Consolidated Financial Statements
for the Years Ended December 31, 2015, 2014 and 2013: (Continued)
Note 21—Commitments and Contingent Liabilities
The Company has various financial obligations, including contractual obligations and commitments that may require future cash payments. Except for its loan commitments, as shown in Note 20 to the Consolidated Financial Statements, the following table shows details on these fixed and determinable obligations as of December 31, 2015 in the time period indicated.
(dollars in thousands)
|
Within One Year |
One to Three Years |
Three to Five Years |
Over Five Years |
Total | |||||||||||
|---|---|---|---|---|---|---|---|---|---|---|---|---|---|---|---|---|
Deposits without a stated maturity(1) |
$ | 4,419,189 | $ | — | $ | — | $ | — | $ | 4,419,189 | ||||||
Time deposits(1) |
446,956 | 272,551 | 19,748 | — | 739,255 | |||||||||||
Borrowed funds(2) |
72,356 | — | — | 70,000 | 142,356 | |||||||||||
Operating lease obligations |
8,061 | 13,942 | 12,402 | 11,398 | 45,803 | |||||||||||
Outside data processing(3) |
2,369 | 4,526 | 2,158 | — | 9,053 | |||||||||||
George Mason sponsorship(4) |
650 | 1,300 | 1,300 | 10,500 | 13,750 | |||||||||||
| | | | | | | | | | | | | | | | | |
Total |
$ | 4,949,581 | $ | 292,319 | $ | 35,608 | $ | 91,898 | $ | 5,369,406 | ||||||
| | | | | | | | | | | | | | | | | |
| | | | | | | | | | | | | | | | | |
| | | | | | | | | | | | | | | | | |
- (1)
- Excludes
accrued interest payable at December 31, 2015.
- (2)
- Borrowed
funds include customer repurchase agreements, and other short-term and long-term borrowings.
- (3)
- The
Bank has outstanding obligations under its current core data processing contract that expires in December 2019 and one other vendor arrangement that
relates to data communications and data software that expires in December 2017.
- (4)
- The Bank has the option of terminating the George Mason agreement at the end of contract years 10 and 15 (that is, effective June 30, 2025 or June 30, 2030). Should the Bank elect to exercise its right to terminate the George Mason contract, contractual obligations would decrease $3.5 million and $3.6 million for the first option period (years 11-15) and the second option period (16-20), respectively.
Effective July 1, 2015, the Bank entered into a multi-faceted support agreement with George Mason University ("George Mason"), the Commonwealth of Virginia's largest public research university. The agreement provides for significant educational support, and a strategic alliance including the Bank obtaining the naming rights to a multi-purpose sports and entertainment venue formerly known as the Patriot Center in Fairfax, VA for up to a 20 year term and now known as "EagleBank Arena". Under the agreement, the Bank pays George Mason an annual fee to be used for scholarships, internships, overall educational and athletic support and beautification efforts. The Bank has the option to terminate the agreement at the end of contract years 10 and 15 (that is, effective June 30, 2025 or June 30, 2030). The payment schedule under the agreement is as follows:
Contract Year
|
Annual Fee | |||
|---|---|---|---|---|
1-5 |
$ | 650,000 | ||
6-10 |
$ | 675,000 | ||
11-15 |
$ | 700,000 | ||
16-20 |
$ | 725,000 | ||
130
Eagle Bancorp, Inc.
Notes to Consolidated Financial Statements
for the Years Ended December 31, 2015, 2014 and 2013: (Continued)
Note 21—Commitments and Contingent Liabilities (Continued)
In the normal course of its business, the Company is involved in litigation arising from banking, financial, and other activities it conducts. Management, after consultation with legal counsel, does not anticipate that the ultimate liability, if any, arising out of these matters will have a material effect on the Company's financial condition, operating results or liquidity.
Note 22—Regulatory Matters
The Company and Bank are subject to various regulatory capital requirements administered by the Federal banking agencies. Failure to meet minimum capital requirements can initiate certain mandatory and possibly additional discretionary actions by regulators that, if undertaken, could have a direct material effect on the Company's financial statements. Under capital adequacy guidelines and the regulatory framework for prompt corrective action, the Company and Bank must meet specific capital guidelines that involve quantitative measures of assets, liabilities, and certain off-balance sheet items as calculated under regulatory accounting practices. The capital amounts and classification are also subject to qualitative judgments by the regulators about components, risk weighting, and other factors.
Quantitative measures established by regulation to ensure capital adequacy require the Company and Bank to maintain amounts and ratios (set forth in the table below) of Total capital, Tier 1 capital and CET1 (as defined in the regulations) to risk-weighted assets (as defined), and of Tier 1 capital (as defined) to average assets (as defined). Management believes, as of December 31, 2015 and 2014, that the Company and Bank met all capital adequacy requirements to which they are subject.
The actual capital amounts and ratios for the Company and Bank as of December 31, 2015 and 2014 are presented in the table below:
| |
Company | Bank | |
|
|||||||||||||||
|---|---|---|---|---|---|---|---|---|---|---|---|---|---|---|---|---|---|---|---|
| |
Minimun Required For Capital Adequacy Purposes |
To Be Well Capitalized Under Prompt Corrective Action Regulations* |
|||||||||||||||||
| |
Actual | Actual | |||||||||||||||||
(dollars in thousands)
|
Amount | Ratio | Amount | Ratio | |||||||||||||||
As of December 31, 2015 |
|||||||||||||||||||
CET1 capital (to risk weighted assets) |
$ | 632,408 | 10.68 | % | $ | 620,879 | 10.52 | % | 4.50 | % | 6.5 | % | |||||||
Total capital (to risk weighted assets) |
755,212 | 12.75 | % | 673,442 | 11.41 | % | 8.00 | % | 10.0 | % | |||||||||
Tier 1 capital (to risk weighted assets) |
632,408 | 10.68 | % | 620,879 | 10.52 | % | 6.00 | % | 8.0 | % | |||||||||
Tier 1 capital (to average assets) |
632,408 | 10.90 | % | 620,879 | 10.74 | % | 4.00 | % | 5.0 | % | |||||||||
As of December 31, 2014 |
|||||||||||||||||||
Total capital (to risk weighted assets) |
$ | 631,340 | 12.97 | % | $ | 568,637 | 11.73 | % | 8.00 | % | 10.0 | % | |||||||
Tier 1 capital (to risk weighted assets) |
505,864 | 10.39 | % | 522,637 | 10.78 | % | 4.00 | % | 6.0 | % | |||||||||
Tier 1 capital (to average assets) |
505,864 | 10.69 | % | 522,637 | 11.09 | % | 3.00 | % | 5.0 | % | |||||||||
- *
- Applies to Bank only
Bank and holding company regulations, as well as Maryland law, impose certain restrictions on dividend payments by the Bank, as well as restricting extensions of credit and transfers of assets between the Bank and the Company. At December 31, 2015, the Bank could pay dividends to the parent to the extent of its earnings so long as it maintained required capital ratios.
131
Eagle Bancorp, Inc.
Notes to Consolidated Financial Statements
for the Years Ended December 31, 2015, 2014 and 2013: (Continued)
Note 23—Other Comprehensive Income
The following table presents the components of other comprehensive income (loss) for the years ended December 31, 2015, 2014 and 2013.
(dollars in thousands)
|
Before Tax | Tax Effect | Net of Tax | |||||||
|---|---|---|---|---|---|---|---|---|---|---|
Year Ended December 31, 2015 |
||||||||||
Net unrealized loss on securities available-for-sale |
$ | (423 | ) | $ | (169 | ) | $ | (254 | ) | |
Net unrealized loss on derivatives |
(1,417 | ) | (567 | ) | (850 | ) | ||||
Less: Reclassification adjustment for net gains included in net income |
(2,254 | ) | (902 | ) | (1,352 | ) | ||||
| | | | | | | | | | | |
Other comprehensive loss |
$ | (4,094 | ) | $ | (1,638 | ) | $ | (2,456 | ) | |
| | | | | | | | | | | |
| | | | | | | | | | | |
| | | | | | | | | | | |
Year Ended December 31, 2014 |
||||||||||
Net unrealized gain on securities available-for-sale |
$ | 9,965 | $ | 3,986 | $ | 5,979 | ||||
Less: Reclassification adjustment for net gains included in net income |
(22 | ) | (9 | ) | (13 | ) | ||||
| | | | | | | | | | | |
Other comprehensive income |
$ | 9,943 | $ | 3,977 | $ | 5,966 | ||||
| | | | | | | | | | | |
| | | | | | | | | | | |
| | | | | | | | | | | |
Year Ended December 31, 2013 |
||||||||||
Net unrealized loss on securities available-for-sale |
$ | (14,622 | ) | $ | (5,849 | ) | $ | (8,773 | ) | |
Less: Reclassification adjustment for net gains included in net income |
(19 | ) | (8 | ) | (11 | ) | ||||
| | | | | | | | | | | |
Other comprehensive loss |
$ | (14,641 | ) | $ | (5,857 | ) | $ | (8,784 | ) | |
| | | | | | | | | | | |
| | | | | | | | | | | |
| | | | | | | | | | | |
132
Eagle Bancorp, Inc.
Notes to Consolidated Financial Statements
for the Years Ended December 31, 2015, 2014 and 2013: (Continued)
Note 23—Other Comprehensive Income (Continued)
The following table presents the changes in each component of accumulated other comprehensive income (loss), net of tax, for the years ended December 31, 2015, 2014 and 2013.
(dollars in thousands)
|
Securities Available For Sale |
Derivatives | Accumulated Other Comprehensive (Loss) Income |
|||||||
|---|---|---|---|---|---|---|---|---|---|---|
Year Ended December 31, 2015 |
||||||||||
Balance at beginning of period |
$ | 2,647 | $ | — | $ | 2,647 | ||||
Other comprehensive income (loss) before reclassifications |
(254 | ) | (850 | ) | (1,104 | ) | ||||
Amounts reclassified from accumulated other comprehensive income |
(1,352 | ) | — | (1,352 | ) | |||||
| | | | | | | | | | | |
Net other comprehensive loss during the period |
(1,606 | ) | (850 | ) | (2,456 | ) | ||||
| | | | | | | | | | | |
Balance at end of period |
$ | 1,041 | $ | (850 | ) | $ | 191 | |||
| | | | | | | | | | | |
| | | | | | | | | | | |
| | | | | | | | | | | |
Year Ended December 31, 2014 |
||||||||||
Balance at beginning of period |
$ | (3,319 | ) | $ | — | $ | (3,319 | ) | ||
Other comprehensive income before reclassifications |
5,979 | — | 5,979 | |||||||
Amounts reclassified from accumulated other comprehensive income |
(13 | ) | — | (13 | ) | |||||
| | | | | | | | | | | |
Net other comprehensive income during the period |
5,966 | — | 5,966 | |||||||
| | | | | | | | | | | |
Balance at end of period |
$ | 2,647 | $ | — | $ | 2,647 | ||||
| | | | | | | | | | | |
| | | | | | | | | | | |
| | | | | | | | | | | |
Year Ended December 31, 2013 |
||||||||||
Balance at beginning of period |
$ | 5,465 | $ | — | $ | 5,465 | ||||
Other comprehensive income before reclassifications |
(8,773 | ) | — | (8,773 | ) | |||||
Amounts reclassified from accumulated other comprehensive income |
(11 | ) | — | (11 | ) | |||||
| | | | | | | | | | | |
Net other comprehensive loss during the period |
(8,784 | ) | — | (8,784 | ) | |||||
| | | | | | | | | | | |
Balance at end of period |
$ | (3,319 | ) | $ | — | $ | (3,319 | ) | ||
| | | | | | | | | | | |
| | | | | | | | | | | |
| | | | | | | | | | | |
The following table presents the amounts reclassified out of each component of accumulated other comprehensive income (loss) for the years ended December 31, 2015, 2014 and 2013.
| |
Amount Reclassified from Accumulated Other Comprehensive Income (Loss) |
|
|||||||||
|---|---|---|---|---|---|---|---|---|---|---|---|
| |
Year Ended December 31, |
|
|||||||||
| Details about Accumulated Other Comprehensive Income Components (dollars in thousands) |
Affected Line Item in the Statement Where Net Income is Presented |
||||||||||
| 2015 | 2014 | 2013 | |||||||||
Realized gain on sale of investment securities |
$ | 2,254 | $ | 22 | $ | 19 | Gain on sale of investment securities | ||||
|
(902 | ) | (9 | ) | (8 | ) | Tax Expense | ||||
| | | | | | | | | | | | |
Total reclassifications for the period |
$ | 1,352 | $ | 13 | $ | 11 | Net of Tax | ||||
| | | | | | | | | | | | |
| | | | | | | | | | | | |
| | | | | | | | | | | | |
133
Eagle Bancorp, Inc.
Notes to Consolidated Financial Statements
for the Years Ended December 31, 2015, 2014 and 2013: (Continued)
Note 24—Fair Value Measurements
The fair value of an asset or liability is the price that would be received to sell that asset or paid to transfer that liability in an orderly transaction occurring in the principal market (or most advantageous market in the absence of a principal market) for such asset or liability. In estimating fair value, the Company utilizes valuation techniques that are consistent with the market approach, the income approach and/or the cost approach. Such valuation techniques are consistently applied. Inputs to valuation techniques include the assumptions that market participants would use in pricing an asset or liability. ASC Topic 820, "Fair Value Measurements and Disclosures," establishes a fair value hierarchy for valuation inputs that gives the highest priority to quoted prices in active markets for identical assets or liabilities and the lowest priority to unobservable inputs. The fair value hierarchy is as follows:
Level 1 |
Quoted prices in active exchange markets for identical assets or liabilities; also includes certain U.S. Treasury and other U.S. Government and agency securities actively traded in over-the-counter markets. | ||
Level 2 |
Observable inputs other than Level 1 including quoted prices for similar assets or liabilities, quoted prices in less active markets, or other observable inputs that can be corroborated by observable market data; also includes derivative contracts whose value is determined using a pricing model with observable market inputs or can be derived principally from or corroborated by observable market data. This category generally includes certain U.S. Government and agency securities, corporate debt securities, derivative instruments, and residential mortgage loans held for sale. |
||
Level 3 |
Unobservable inputs supported by little or no market activity for financial instruments whose value is determined using pricing models, discounted cash flow methodologies, or similar techniques, as well as instruments for which the determination of fair value requires significant management judgment or estimation; also includes observable inputs for single dealer nonbinding quotes not corroborated by observable market data. This category generally includes certain private equity investments, retained interests from securitizations, and certain collateralized debt obligations. |
134
Eagle Bancorp, Inc.
Notes to Consolidated Financial Statements
for the Years Ended December 31, 2015, 2014 and 2013: (Continued)
Note 24—Fair Value Measurements (Continued)
Assets and Liabilities Recorded at Fair Value on a Recurring Basis
The table below presents the recorded amount of assets and liabilities measured at fair value on a recurring basis as of December 31, 2015 and 2014:
(dollars in thousands)
|
Quoted Prices (Level 1) |
Significant Other Observable Inputs (Level 2) |
Significant Other Unobservable Inputs (Level 3) |
Total (Fair Value) |
|||||||||
|---|---|---|---|---|---|---|---|---|---|---|---|---|---|
December 31, 2015 |
|||||||||||||
Assets: |
|||||||||||||
Investment securities available for sale: |
|||||||||||||
U. S. agency securities |
$ | — | $ | 56,975 | $ | — | $ | 56,975 | |||||
Residential mortgage backed securities |
— | 297,241 | — | 297,241 | |||||||||
Municipal bonds |
— | 118,381 | — | 118,381 | |||||||||
Corporate bonds |
— | 14,938 | — | 14,938 | |||||||||
Other equity investments |
115 | — | 219 | 334 | |||||||||
Loans held for sale |
— | 47,492 | — | 47,492 | |||||||||
Mortgage banking derivatives |
— | — | 24 | 24 | |||||||||
| | | | | | | | | | | | | | |
Total assets measured at fair value on a recurring basis as of December 31, 2015 |
$ | 115 | $ | 535,027 | $ | 243 | $ | 535,385 | |||||
| | | | | | | | | | | | | | |
| | | | | | | | | | | | | | |
| | | | | | | | | | | | | | |
Liabilities: |
|||||||||||||
Interest rate swap derivatives |
— | 1,417 | — | 1,417 | |||||||||
| | | | | | | | | | | | | | |
Total liabilities measured at fair value on a recurring basis as of December 31, 2015 |
$ | — | $ | 1,417 | $ | — | $ | 1,417 | |||||
| | | | | | | | | | | | | | |
| | | | | | | | | | | | | | |
| | | | | | | | | | | | | | |
(dollars in thousands)
|
Quoted Prices (Level 1) |
Significant Other Observable Inputs (Level 2) |
Significant Other Unobservable Inputs (Level 3) |
Total (Fair Value) |
|||||||||
|---|---|---|---|---|---|---|---|---|---|---|---|---|---|
December 31, 2014 |
|||||||||||||
Assets: |
|||||||||||||
Investment securities available for sale: |
|||||||||||||
U. S. agency securities |
$ | — | $ | 29,894 | $ | — | $ | 29,894 | |||||
Residential mortgage backed securities |
— | 240,320 | — | 240,320 | |||||||||
Municipal bonds |
— | 111,712 | — | 111,712 | |||||||||
Other equity investments |
198 | — | 219 | 417 | |||||||||
Loans held for sale |
— | 44,317 | — | 44,317 | |||||||||
Mortgage banking derivatives |
— | — | 146 | 146 | |||||||||
| | | | | | | | | | | | | | |
Total assets measured at fair value on a recurring basis as of December 31, 2014 |
$ | 198 | $ | 426,243 | $ | 365 | $ | 426,806 | |||||
| | | | | | | | | | | | | | |
| | | | | | | | | | | | | | |
| | | | | | | | | | | | | | |
Liabilities: |
|||||||||||||
Interest rate swap derivatives |
— | — | — | — | |||||||||
| | | | | | | | | | | | | | |
Total liabilities measured at fair value on a recurring basis as of December 31, 2014 |
$ | — | $ | — | $ | — | $ | — | |||||
| | | | | | | | | | | | | | |
| | | | | | | | | | | | | | |
| | | | | | | | | | | | | | |
135
Eagle Bancorp, Inc.
Notes to Consolidated Financial Statements
for the Years Ended December 31, 2015, 2014 and 2013: (Continued)
Note 24—Fair Value Measurements (Continued)
Investment Securities Available-for-Sale
Investment securities available-for-sale are recorded at fair value on a recurring basis. Fair value measurement is based upon quoted prices, if available. If quoted prices are not available, fair value is measured using independent pricing models or other model-based valuation techniques such as the present value of future cash flows, adjusted for the security's credit rating, prepayment assumptions and other factors such as credit loss assumptions. Level 1 securities include those traded on an active exchange such as the New York Stock Exchange, U.S. Treasury securities that are traded by dealers or brokers in active over-the-counter markets and money market funds. Level 2 securities include U.S. agency debt securities, mortgage backed securities issued by government sponsored entities and municipal bonds. Securities classified as Level 3 include securities in less liquid markets, the carrying amount approximate the fair value.
Loans held for sale: Loans held for sale are carried at the fair value. Fair value is derived from secondary market quotations for similar instruments. Gains and losses on sales of these loans are recorded as a component of noninterest income in the consolidated statements of operations. As such, the Company classifies loans subjected to fair value adjustments as Level 2 valuation.
Interest rate swap derivatives: These derivative instruments consist of forward starting interest rate swap agreements, which are accounted for as cash flow hedges. The Company's derivative position is classified within Level 2 of the fair value hierarchy and is valued using models generally accepted in the financial services industry and that use actively quoted or observable market input values from external market data providers and/or non-binding broker-dealer quotations. The fair value of the derivatives is determined using discounted cash flow models. These models' key assumptions include the contractual terms of the respective contract along with significant observable inputs, including interest rates, yield curves, nonperformance risk and volatility. Derivative contracts are executed with a Credit Support Annex, which is a bilateral ratings-sensitive agreement that requires collateral postings when the market value exceeds certain threshold limits. These agreements protect the interests of the Company and its counterparties should either party suffer a credit rating deterioration.
136
Eagle Bancorp, Inc.
Notes to Consolidated Financial Statements
for the Years Ended December 31, 2015, 2014 and 2013: (Continued)
Note 24—Fair Value Measurements (Continued)
The following is a reconciliation of activity for assets and liabilities measured at fair value based on Significant Other Unobservable Inputs (Level 3):
(dollars in thousands)
|
Other Equity Investments |
Derivative Assets/(Liabilities) |
Total | |||||||
|---|---|---|---|---|---|---|---|---|---|---|
Assets: |
||||||||||
Beginning balance at January 1, 2015 |
$ | 219 | $ | 146 | $ | 365 | ||||
Realized gain (loss) included in earnings—net mortgage banking derivatives |
— | (122 | ) | (122 | ) | |||||
Principal redemption |
— | — | — | |||||||
| | | | | | | | | | | |
Ending balance at December 31, 2015 |
$ | 219 | $ | 24 | $ | 243 | ||||
| | | | | | | | | | | |
| | | | | | | | | | | |
| | | | | | | | | | | |
Liabilities: |
||||||||||
Beginning balance at January 1, 2015 |
$ | — | $ | 250 | $ | 250 | ||||
Realized (gain) loss included in earnings—net mortgage banking derivatives |
— | (220 | ) | (220 | ) | |||||
Principal redemption |
— | — | — | |||||||
| | | | | | | | | | | |
Ending balance at December 31, 2015 |
$ | — | $ | 30 | $ | 30 | ||||
| | | | | | | | | | | |
| | | | | | | | | | | |
| | | | | | | | | | | |
(dollars in thousands)
|
Other Equity Investments |
Derivative Assets/(Liabilities) |
Total | |||||||
|---|---|---|---|---|---|---|---|---|---|---|
Assets: |
||||||||||
Beginning balance at January 1, 2014 |
$ | 219 | $ | — | $ | 219 | ||||
Realized gain (loss) included in earnings—net mortgage banking derivatives |
— | 146 | 146 | |||||||
| | | | | | | | | | | |
Ending balance at December 31, 2014 |
$ | 219 | $ | 146 | $ | 365 | ||||
| | | | | | | | | | | |
| | | | | | | | | | | |
| | | | | | | | | | | |
Liabilities: |
||||||||||
Beginning balance at January 1, 2014 |
$ | — | $ | — | $ | — | ||||
Realized (gain) loss included in earnings—net mortgage banking derivatives |
— | 250 | 250 | |||||||
| | | | | | | | | | | |
Ending balance at December 31, 2014 |
$ | — | $ | 250 | $ | 250 | ||||
| | | | | | | | | | | |
| | | | | | | | | | | |
| | | | | | | | | | | |
Securities classified as Level 3 include securities in less liquid markets, the carrying amount approximate the fair value. The securities consist of equity investments in the form of common stock of two local banking companies which are not publicly traded.
The Company relies on a third-party pricing service to value its mortgage banking derivative financial assets and liabilities, which the Company classifies as a Level 3 valuation. The external valuation model to estimate the fair value of its interest rate lock commitments to originate residential mortgage loans held for sale includes grouping the interest rate lock commitments by interest rate and terms, applying an estimated pull-through rate based on historical experience, and then multiplying by quoted investor prices determined to be reasonably applicable to the loan commitment groups based on interest rate, terms, and rate lock expiration dates of the loan commitment groups. The Company also relies on an external
137
Eagle Bancorp, Inc.
Notes to Consolidated Financial Statements
for the Years Ended December 31, 2015, 2014 and 2013: (Continued)
Note 24—Fair Value Measurements (Continued)
valuation model to estimate the fair value of its forward commitments to sell residential mortgage loans (i.e., an estimate of what the Company would receive or pay to terminate the forward delivery contract based on market prices for similar financial instruments), which includes matching specific terms and maturities of the forward commitments against applicable investor pricing.
Assets and Liabilities Recorded at Fair Value on a Nonrecurring Basis
The Company measures certain assets at fair value on a nonrecurring basis and the following is a general description of the methods used to value such assets.
Impaired loans: The Company considers a loan impaired when it is probable that the Company will be unable to collect all amounts due according to the original contractual terms of the note agreement, including both principal and interest. Management has determined that nonaccrual loans and loans that have had their terms restructured in a troubled debt restructuring meet this impaired loan definition. For individually evaluated impaired loans, the amount of impairment is based upon the present value of expected future cash flows discounted at the loan's effective interest rate or the estimated fair value of the underlying collateral for collateral-dependent loans, which the Company classifies as a Level 3 valuation.
Other real estate owned: Other real estate owned is initially recorded at the lower of carrying value or fair value. Fair value is based upon independent market prices, appraised values of the collateral or management's estimation of the value of the collateral, which the Company classifies as a Level 3 valuation. Assets measured at fair value on a nonrecurring basis are included in the table below:
(dollars in thousands)
|
Quoted Prices (Level 1) |
Significant Other Observable Inputs (Level 2) |
Significant Other Unobservable Inputs (Level 3) |
Total (Fair Value) |
|||||||||
|---|---|---|---|---|---|---|---|---|---|---|---|---|---|
December 31, 2015 |
|||||||||||||
Impaired loans: |
|||||||||||||
Commercial |
$ | — | $ | 271 | $ | 8,930 | $ | 9,201 | |||||
Income producing—commercial real estate |
— | — | 5,085 | 5,085 | |||||||||
Owner occupied—commercial real estate |
— | 282 | 1,071 | 1,353 | |||||||||
Real estate mortgage—residential |
— | — | 329 | 329 | |||||||||
Construction—commercial and residential |
— | — | 9,504 | 9,504 | |||||||||
Home equity |
— | — | 123 | 123 | |||||||||
Other consumer |
— | — | 19 | 19 | |||||||||
Other real estate owned |
— | 5,394 | 458 | 5,852 | |||||||||
| | | | | | | | | | | | | | |
Total assets measured at fair value on a nonrecurring basis as of December 31, 2015 |
$ | — | $ | 5,947 | $ | 25,519 | $ | 31,466 | |||||
| | | | | | | | | | | | | | |
| | | | | | | | | | | | | | |
| | | | | | | | | | | | | | |
138
Eagle Bancorp, Inc.
Notes to Consolidated Financial Statements
for the Years Ended December 31, 2015, 2014 and 2013: (Continued)
Note 24—Fair Value Measurements (Continued)
(dollars in thousands)
|
Quoted Prices (Level 1) |
Significant Other Observable Inputs (Level 2) |
Significant Other Unobservable Inputs (Level 3) |
Total (Fair Value) |
|||||||||
|---|---|---|---|---|---|---|---|---|---|---|---|---|---|
December 31, 2014 |
|||||||||||||
Impaired loans: |
|||||||||||||
Commercial |
$ | — | $ | 781 | $ | 6,860 | $ | 7,641 | |||||
Income producing—commercial real estate |
— | 703 | 9,040 | 9,743 | |||||||||
Owner occupied—commercial real estate |
— | — | 1,312 | 1,312 | |||||||||
Real estate mortgage—residential |
— | — | 346 | 346 | |||||||||
Construction—commercial and residential |
— | — | 7,858 | 7,858 | |||||||||
Home equity |
— | 5 | 963 | 968 | |||||||||
Other consumer |
— | — | 13 | 13 | |||||||||
Other real estate owned |
— | 9,184 | 4,040 | 13,224 | |||||||||
| | | | | | | | | | | | | | |
Total assets measured at fair value on a nonrecurring basis as of December 31, 2014 |
$ | — | $ | 10,673 | $ | 30,432 | $ | 41,105 | |||||
| | | | | | | | | | | | | | |
| | | | | | | | | | | | | | |
| | | | | | | | | | | | | | |
Loans
The Company does not record loans at fair value on a recurring basis; however, from time to time, a loan is considered impaired and an allowance for loan loss is established. Loans for which it is probable that payment of interest and principal will not be made in accordance with the contractual terms of the loan are considered impaired. Once a loan is identified as individually impaired, management measures the impairment in accordance with ASC Topic 310, "Receivables." The fair value of impaired loans is estimated using one of several methods, including the collateral value, market value of similar debt, enterprise value, and liquidation value and discounted cash flows. Those impaired loans not requiring a specific allowance represent loans for which the fair value of expected repayments or collateral exceed the recorded investment in such loans. At December 31, 2015, substantially all of the totally impaired loans were evaluated based upon the fair value of the collateral. In accordance with ASC Topic 820, impaired loans where an allowance is established based on the fair value of collateral require classification in the fair value hierarchy. When the fair value of the collateral is based on an observable market price or a current appraised value, the Company records the loan as nonrecurring Level 2. When an appraised value is not available or management determines the fair value of the collateral is further impaired below the appraised value and there is no observable market price, the Company records the loan as nonrecurring Level 3.
The Company discloses fair value information about financial instruments for which it is practicable to estimate the value, whether or not such financial instruments are recognized on the balance sheet. Fair value is the amount at which a financial instrument could be exchanged in a current transaction between willing parties, other than in a forced sale or liquidation, and is best evidenced by quoted market price, if one exists.
Quoted market prices, if available, are shown as estimates of fair value. Because no quoted market prices exist for a portion of the Company's financial instruments, the fair value of such instruments has been derived based on management's assumptions with respect to future economic conditions, the amount
139
Eagle Bancorp, Inc.
Notes to Consolidated Financial Statements
for the Years Ended December 31, 2015, 2014 and 2013: (Continued)
Note 24—Fair Value Measurements (Continued)
and timing of future cash flows and estimated discount rates. Different assumptions could significantly affect these estimates. Accordingly, the net realizable value could be materially different from the estimates presented below. In addition, the estimates are only indicative of individual financial instrument values and should not be considered an indication of the fair value of the Company taken as a whole.
The following methods and assumptions were used to estimate the fair value of each category of financial instrument for which it is practicable to estimate value:
Cash due from banks and federal funds sold: For cash and due from banks and federal funds sold the carrying amount approximates fair value.
Interest bearing deposits with other banks: Values are estimated by discounting the future cash flows using the current rates at which similar deposits would be earning.
Investment securities: For these instruments, fair values are based upon quoted prices, if available. If quoted prices are not available, fair value is measured using independent pricing models or other model-based valuation techniques such as the present value of future cash flows, adjusted for the security's credit rating, prepayment assumptions and other factors such as credit loss assumptions.
Federal Reserve and Federal Home Loan Bank stock: The carrying amount approximate the fair values at the reporting date.
Loans held for sale: The fair value of loans held for sale is based on commitments outstanding from investors as well as what secondary markets are currently offering for portfolios with similar characteristics for residential mortgage loans held for sale since such loans are typically committed to be sold (servicing released) at a profit.
Loans: For variable rate loans that re-price on a scheduled basis, fair values are based on carrying values. The fair value of the remaining loans are estimated by discounting the estimated future cash flows using the current interest rate at which similar loans would be made to borrowers with similar credit ratings and for the same remaining term.
Bank owned life insurance: The fair value of bank owned life insurance is the current cash surrender value, which is the carrying value.
Annuity investment: The fair value of the annuity investments is the carrying amount at the reporting date.
Mortgage banking derivatives: The Company enters into interest rate lock commitments (IRLCs) with prospective residential mortgage borrowers. These commitments are carried at fair value based on the fair value of the underlying mortgage loans which are based on market data. These commitments are classified as Level 3 in the fair value disclosures, as the valuations are based on market unobservable inputs. The Company hedges the risk of the overall change in the fair value of loan commitments to borrowers by selling forward contracts on securities of GSEs. These forward settling contracts are classified as Level 3, as valuations are based on market unobservable inputs. See Note 9 to the Consolidated Financial Statements for additional detail.
140
Eagle Bancorp, Inc.
Notes to Consolidated Financial Statements
for the Years Ended December 31, 2015, 2014 and 2013: (Continued)
Note 24—Fair Value Measurements (Continued)
Interest rate swap derivatives: These derivative instruments consist of forward starting interest rate swap agreements, which are accounted for as cash flow hedges. The Company's derivative position is classified within Level 2 of the fair value hierarchy and is valued using models generally accepted in the financial services industry and that use actively quoted or observable market input values from external market data providers and/or non-binding broker-dealer quotations. The fair value of the derivatives is determined using discounted cash flow models. These models' key assumptions include the contractual terms of the respective contract along with significant observable inputs, including interest rates, yield curves, nonperformance risk and volatility. Derivative contracts are executed with a Credit Support Annex, which is a bilateral ratings-sensitive agreement that requires collateral postings when the market value exceeds certain threshold limits. These agreements protect the interests of the Company and its counterparties should either party suffer a credit rating deterioration.
Noninterest bearing deposits: The fair value of these deposits is the amount payable on demand at the reporting date, since generally accepted accounting standards do not permit an assumption of core deposit value.
Interest bearing deposits: The fair value of interest bearing transaction, savings, and money market deposits with no defined maturity is the amount payable on demand at the reporting date, since generally accepted accounting standards do not permit an assumption of core deposit value.
Certificates of deposit: The fair value of certificates of deposit is estimated by discounting the future cash flows using the current rates at which similar deposits with remaining maturities would be accepted.
Customer repurchase agreements: The carrying amount approximate the fair values at the reporting date.
Borrowings: The carrying amount for variable rate borrowings approximate the fair values at the reporting date. The fair value of fixed rate FHLB advances and the subordinated notes are estimated by computing the discounted value of contractual cash flows payable at current interest rates for obligations with similar remaining terms. The fair value of variable rate FHLB advances is estimated to be carrying value since these liabilities are based on a spread to a current pricing index.
Off-balance sheet items: Management has reviewed the unfunded portion of commitments to extend credit, as well as standby and other letters of credit, and has determined that the fair value of such instruments is equal to the fee, if any, collected and unamortized for the commitment made.
141
Eagle Bancorp, Inc.
Notes to Consolidated Financial Statements
for the Years Ended December 31, 2015, 2014 and 2013: (Continued)
Note 24—Fair Value Measurements (Continued)
The estimated fair values of the Company's financial instruments at December 31, 2015 and 2014 are as follows:
| |
|
|
Fair Value Measurements | |||||||||||||
|---|---|---|---|---|---|---|---|---|---|---|---|---|---|---|---|---|
(dollars in thousands)
|
Carrying Value |
Fair Value | Quoted Prices in Active Markets for Identical Assets or Liabilities (Level 1) |
Significant Other Observable Inputs (Level 2) |
Significant Unobservable Inputs (Level 3) |
|||||||||||
December 31, 2015 |
||||||||||||||||
Assets |
||||||||||||||||
Cash and due from banks |
$ | 11,009 | $ | 11,009 | $ | — | $ | 11,009 | $ | — | ||||||
Federal funds sold |
3,791 | 3,791 | — | 3,791 | — | |||||||||||
Interest bearing deposits with other banks |
283,563 | 283,563 | — | 283,563 | — | |||||||||||
Investment securities |
487,869 | 487,869 | 115 | 487,535 | 219 | |||||||||||
Federal Reserve and Federal Home Loan Bank stock |
16,903 |
16,903 |
— |
16,903 |
— |
|||||||||||
Loans held for sale |
47,492 | 47,492 | — | 47,492 | — | |||||||||||
Loans |
4,998,368 | 5,000,717 | — | 553 | 5,000,164 | |||||||||||
Bank owned life insurance |
58,682 | 58,682 | — | 58,682 | — | |||||||||||
Annuity investment |
12,136 | 12,136 | — | 12,136 | — | |||||||||||
Mortgage banking derivatives |
24 | 24 | — | — | 24 | |||||||||||
Interest rate swap derivatives |
— | — | — | — | — | |||||||||||
Liabilities |
||||||||||||||||
Noninterest bearing deposits |
1,405,067 | 1,405,067 | — | 1,405,067 | — | |||||||||||
Interest bearing deposits |
3,014,122 | 3,014,122 | — | 3,014,122 | — | |||||||||||
Certificates of deposit |
739,255 | 736,973 | — | 736,973 | — | |||||||||||
Customer repurchase agreements |
72,356 | 72,356 | — | 72,356 | — | |||||||||||
Borrowings |
70,000 | 69,992 | — | 69,992 | — | |||||||||||
Mortgage banking derivatives |
30 | 30 | — | — | 30 | |||||||||||
Interest rate swap derivatives |
1,417 | 1,417 | — | 1,417 | — | |||||||||||
December 31, 2014 |
||||||||||||||||
Assets |
||||||||||||||||
Cash and due from banks |
$ | 9,097 | $ | 9,097 | $ | — | $ | 9,097 | $ | — | ||||||
Federal funds sold |
3,516 | 3,516 | — | 3,516 | — | |||||||||||
Interest bearing deposits with other banks |
243,412 | 243,412 | — | 243,412 | — | |||||||||||
Investment securities |
382,343 | 382,343 | 198 | 381,926 | 219 | |||||||||||
Federal Reserve and Federal Home Loan Bank stock |
22,560 |
22,560 |
— |
22,560 |
— |
|||||||||||
Loans held for sale |
44,317 | 44,669 | — | 44,669 | — | |||||||||||
Loans |
4,312,399 | 4,314,618 | — | 1,489 | 4,313,129 | |||||||||||
Bank owned life insurance |
56,594 | 56,594 | — | 56,594 | — | |||||||||||
Annuity investment |
11,277 | 11,277 | — | 11,277 | — | |||||||||||
Mortgage banking derivatives |
146 | 146 | — | — | 146 | |||||||||||
Liabilities |
||||||||||||||||
Noninterest bearing deposits |
1,175,799 | 1,175,799 | — | 1,175,799 | — | |||||||||||
Interest bearing deposits |
2,446,228 | 2,446,228 | — | 2,446,228 | — | |||||||||||
Certificates of deposit |
688,741 | 688,067 | — | 688,067 | — | |||||||||||
Customer repurchase agreements |
61,120 | 61,120 | — | 61,120 | — | |||||||||||
Borrowings |
219,300 | 220,838 | — | 220,838 | — | |||||||||||
Mortgage banking derivatives |
250 | 250 | — | — | 250 | |||||||||||
142
Eagle Bancorp, Inc.
Notes to Consolidated Financial Statements
for the Years Ended December 31, 2015, 2014 and 2013: (Continued)
Note 25—Quarterly Results of Operations (unaudited)
The following table reports quarterly results of operations (unaudited) for 2015, 2014 and 2013:
| |
2015 | ||||||||||||
|---|---|---|---|---|---|---|---|---|---|---|---|---|---|
(dollars in thousands except per share data)
|
Fourth Quarter |
Third Quarter |
Second Quarter |
First Quarter |
|||||||||
Total interest income |
$ | 67,311 | $ | 63,981 | $ | 62,423 | $ | 59,465 | |||||
Total interest expense |
4,735 | 4,896 | 4,873 | 4,734 | |||||||||
| | | | | | | | | | | | | | |
Net interest income |
62,576 | 59,085 | 57,550 | 54,731 | |||||||||
Provision for credit losses |
4,595 | 3,262 | 3,471 | 3,310 | |||||||||
| | | | | | | | | | | | | | |
Net interest income after provision for credit losses |
57,981 | 55,823 | 54,079 | 51,421 | |||||||||
Noninterest income |
6,492 | 6,099 | 6,233 | 7,804 | |||||||||
Noninterest expense |
28,640 | 27,405 | 26,598 | 28,073 | |||||||||
| | | | | | | | | | | | | | |
Income before income tax expense |
35,833 | 34,517 | 33,714 | 31,152 | |||||||||
Income tax expense |
13,485 | 13,054 | 12,776 | 11,734 | |||||||||
| | | | | | | | | | | | | | |
Net income |
22,348 | 21,463 | 20,938 | 19,418 | |||||||||
Preferred stock dividends and discount accretion |
62 | 180 | 179 | 180 | |||||||||
| | | | | | | | | | | | | | |
Net income available to common shareholders |
$ | 22,286 | $ | 21,283 | $ | 20,759 | $ | 19,238 | |||||
| | | | | | | | | | | | | | |
| | | | | | | | | | | | | | |
| | | | | | | | | | | | | | |
Earnings per common share |
|||||||||||||
Basic(1) |
$ | 0.67 | $ | 0.64 | $ | 0.62 | $ | 0.62 | |||||
Diluted(1) |
$ | 0.65 | $ | 0.63 | $ | 0.61 | $ | 0.61 | |||||
| |
2014 | ||||||||||||
|---|---|---|---|---|---|---|---|---|---|---|---|---|---|
(dollars in thousands except per share data)
|
Fourth Quarter |
Third Quarter |
Second Quarter |
First Quarter |
|||||||||
Total interest income |
$ | 56,091 | $ | 47,886 | $ | 44,759 | $ | 42,837 | |||||
Total interest expense |
4,275 | 3,251 | 2,739 | 2,830 | |||||||||
| | | | | | | | | | | | | | |
Net interest income |
51,816 | 44,635 | 42,020 | 40,007 | |||||||||
Provision for credit losses |
3,700 | 2,111 | 3,134 | 1,934 | |||||||||
| | | | | | | | | | | | | | |
Net interest income after provision for credit losses |
48,116 | 42,524 | 38,886 | 38,073 | |||||||||
Noninterest income |
5,310 | 4,761 | 3,811 | 4,463 | |||||||||
Noninterest expense |
29,352 | 25,143 | 22,135 | 23,098 | |||||||||
| | | | | | | | | | | | | | |
Income before income tax expense |
24,074 | 22,142 | 20,562 | 19,438 | |||||||||
Income tax expense |
9,347 | 8,054 | 7,618 | 6,939 | |||||||||
| | | | | | | | | | | | | | |
Net income |
14,727 | 14,088 | 12,944 | 12,499 | |||||||||
Preferred stock dividends and discount accretion |
180 | 151 | 142 | 141 | |||||||||
| | | | | | | | | | | | | | |
Net income available to common shareholders |
$ | 14,547 | $ | 13,937 | $ | 12,802 | $ | 12,358 | |||||
| | | | | | | | | | | | | | |
| | | | | | | | | | | | | | |
| | | | | | | | | | | | | | |
Earnings per common share |
|||||||||||||
Basic(1) |
$ | 0.51 | $ | 0.54 | $ | 0.49 | $ | 0.48 | |||||
Diluted(1) |
$ | 0.49 | $ | 0.52 | $ | 0.48 | $ | 0.47 | |||||
143
Eagle Bancorp, Inc.
Notes to Consolidated Financial Statements
for the Years Ended December 31, 2015, 2014 and 2013: (Continued)
Note 25—Quarterly Results of Operations (unaudited) (Continued)
| |
2013 | ||||||||||||
|---|---|---|---|---|---|---|---|---|---|---|---|---|---|
(dollars in thousands except per share data)
|
Fourth Quarter |
Third Quarter |
Second Quarter |
First Quarter |
|||||||||
Total interest income |
$ | 41,652 | $ | 39,724 | $ | 37,985 | $ | 37,933 | |||||
Total interest expense |
2,938 | 3,021 | 3,121 | 3,424 | |||||||||
| | | | | | | | | | | | | | |
Net interest income |
38,714 | 36,703 | 34,864 | 34,509 | |||||||||
Provision for credit losses |
2,508 | 1,372 | 2,357 | 3,365 | |||||||||
| | | | | | | | | | | | | | |
Net interest income after provision for credit losses |
36,206 | 35,331 | 32,507 | 31,144 | |||||||||
Noninterest income |
4,304 | 5,236 | 7,065 | 8,111 | |||||||||
Noninterest expense |
21,524 | 21,673 | 20,685 | 20,697 | |||||||||
| | | | | | | | | | | | | | |
Income before income tax expense |
18,986 | 18,894 | 18,887 | 18,558 | |||||||||
Income tax expense |
6,983 | 7,137 | 7,212 | 6,986 | |||||||||
| | | | | | | | | | | | | | |
Net income |
12,003 | 11,757 | 11,675 | 11,572 | |||||||||
Preferred stock dividends and discount accretion |
141 | 142 | 142 | 141 | |||||||||
| | | | | | | | | | | | | | |
Net income available to common shareholders |
$ | 11,862 | $ | 11,615 | $ | 11,533 | $ | 11,431 | |||||
| | | | | | | | | | | | | | |
| | | | | | | | | | | | | | |
| | | | | | | | | | | | | | |
Earnings per common share |
|||||||||||||
Basic(1)(2) |
$ | 0.46 | $ | 0.45 | $ | 0.45 | $ | 0.45 | |||||
Diluted(1)(2) |
$ | 0.45 | $ | 0.44 | $ | 0.44 | $ | 0.44 | |||||
- (1)
- Earnings
per common share are calculated on a quarterly basis and may not be additive to the year to date amount.
- (2)
- Per share amounts have been adjusted to give effect to the 10% common stock dividend paid on June 14, 2013.
144
Eagle Bancorp, Inc.
Notes to Consolidated Financial Statements
for the Years Ended December 31, 2015, 2014 and 2013: (Continued)
Note 26—Parent Company Financial Information
Condensed financial information for Eagle Bancorp, Inc. (Parent Company only) is as follows:
| (dollars in thousands) |
December 31, 2015 |
December 31, 2014 |
|||||
|---|---|---|---|---|---|---|---|
Assets |
|||||||
Cash |
$ | 65,692 | $ | 42,810 | |||
Cash equivalents |
— | 8,739 | |||||
Investment securities available-for-sale, at fair value |
216 | 300 | |||||
Investment in subsidiaries |
740,804 | 647,633 | |||||
Other assets |
3,516 | 2,731 | |||||
| | | | | | | | |
Total Assets |
$ | 810,228 | $ | 702,213 | |||
| | | | | | | | |
| | | | | | | | |
| | | | | | | | |
Liabilities |
|||||||
Other liabilities |
$ | 1,627 | $ | 2,154 | |||
Long-term borrowings |
70,000 | 79,300 | |||||
| | | | | | | | |
Total liabilities |
$ | 71,627 | $ | 81,454 | |||
| | | | | | | | |
| | | | | | | | |
| | | | | | | | |
Shareholders' Equity |
|||||||
Preferred stock, Series B |
$ | — | $ | 56,600 | |||
Preferred stock, Series C |
— | 15,300 | |||||
Common stock |
331 | 296 | |||||
Warrant |
946 | 946 | |||||
Additional paid in capital |
503,529 | 394,933 | |||||
Retained earnings |
233,604 | 150,037 | |||||
Accumulated other comprehensive income |
191 | 2,647 | |||||
| | | | | | | | |
Total Shareholders' Equity |
738,601 | 620,759 | |||||
| | | | | | | | |
Total Liabilities and Shareholders' Equity |
$ | 810,228 | $ | 702,213 | |||
| | | | | | | | |
| | | | | | | | |
| | | | | | | | |
145
Eagle Bancorp, Inc.
Notes to Consolidated Financial Statements
for the Years Ended December 31, 2015, 2014 and 2013: (Continued)
Note 26—Parent Company Financial Information (Continued)
Condensed Statements of Operations
| |
Years Ended December 31, | |||||||||
|---|---|---|---|---|---|---|---|---|---|---|
| (dollars in thousands) |
2015 | 2014 | 2013 | |||||||
Income |
||||||||||
Other interest and dividends |
$ | 369 | $ | 171 | $ | 117 | ||||
| | | | | | | | | | | |
Total Income |
369 | 171 | 117 | |||||||
| | | | | | | | | | | |
Expenses |
||||||||||
Interest expense |
4,490 | 2,497 | 897 | |||||||
Legal and professional |
101 | 108 | 142 | |||||||
Directors' compensation |
224 | 257 | 187 | |||||||
Other |
1,152 | 1,086 | 946 | |||||||
| | | | | | | | | | | |
Total Expenses |
5,967 | 3,948 | 2,172 | |||||||
| | | | | | | | | | | |
Loss Before Income Tax (Benefit) and Equity in Undistributed Income of Subsidiaries |
(5,598 | ) | (3,777 | ) | (2,055 | ) | ||||
Income Tax Benefit |
(2,208 | ) | (1,490 | ) | (810 | ) | ||||
| | | | | | | | | | | |
Loss Before Equity in Undistributed Income of Subsidiaries |
(3,390 | ) | (2,287 | ) | (1,245 | ) | ||||
Equity in Undistributed Income of Subsidiaries |
87,557 | 56,545 | 48,252 | |||||||
| | | | | | | | | | | |
Net Income |
84,167 | 54,258 | 47,007 | |||||||
Preferred Stock Dividends |
601 | 614 | 566 | |||||||
| | | | | | | | | | | |
Net Income Available to Common Shareholders |
$ | 83,566 | $ | 53,644 | $ | 46,441 | ||||
| | | | | | | | | | | |
| | | | | | | | | | | |
| | | | | | | | | | | |
146
Eagle Bancorp, Inc.
Notes to Consolidated Financial Statements
for the Years Ended December 31, 2015, 2014 and 2013: (Continued)
Note 26—Parent Company Financial Information (Continued)
Condensed Statements of Cash Flows
| |
Years Ended December 31, | |||||||||
|---|---|---|---|---|---|---|---|---|---|---|
| (dollars in thousands) |
2015 | 2014 | 2013 | |||||||
Cash Flows From Operating Activities |
||||||||||
Net Income |
$ | 84,167 | $ | 54,258 | $ | 47,007 | ||||
Adjustments to reconcile net income to net cash (used in) provided by operating activities: |
||||||||||
Equity in undistributed income of subsidiary |
(87,557 | ) | (56,545 | ) | (48,252 | ) | ||||
Excess tax benefit on stock-based compensation |
(2,984 | ) | (978 | ) | (410 | ) | ||||
Proceeds from sale of available for sale securities |
84 | — | — | |||||||
(Increase) decrease in other assets |
(785 | ) | (1,731 | ) | 353 | |||||
(Decrease) increase in other liabilities |
(121 | ) | 1,803 | 67 | ||||||
| | | | | | | | | | | |
Net cash (used in) operating activities |
(7,196 | ) | (3,193 | ) | (1,235 | ) | ||||
| | | | | | | | | | | |
Cash Flows From Investing Activities |
||||||||||
Investment in subsidiary (net) |
(419 | ) | (203,782 | ) | (810 | ) | ||||
| | | | | | | | | | | |
Net cash used in investing activities |
(419 | ) | (203,782 | ) | (810 | ) | ||||
| | | | | | | | | | | |
Cash Flows From Financing Activities |
||||||||||
Issuance of common stock |
94,633 | 144,093 | — | |||||||
Issuance of Series C Preferred Stock |
— | 15,300 | — | |||||||
Increase in long-term borrowings |
— | 70,000 | — | |||||||
Redemption of Series B Preferred Stock |
(56,600 | ) | — | — | ||||||
Redemption of Series C Preferred Stock |
(15,300 | ) | — | — | ||||||
Decrease in long-term borrowings |
(9,300 | ) | — | — | ||||||
Proceeds from exercise of stock options |
5,176 | 2,313 | 1,984 | |||||||
Preferred stock dividends |
(600 | ) | (614 | ) | (566 | ) | ||||
Excess tax benefit on stock-based compensation |
2,984 | 978 | 410 | |||||||
Payment in lieu of fractional shares |
(4 | ) | — | (11 | ) | |||||
Proceeds from employee stock purchase plan |
769 | 621 | 543 | |||||||
| | | | | | | | | | | |
Net cash provided by financing activities |
21,758 | 232,691 | 2,360 | |||||||
| | | | | | | | | | | |
Net Increase in Cash |
14,143 | 25,716 | 315 | |||||||
Cash and Cash Equivalents at Beginning of Year |
51,549 | 25,833 | 25,518 | |||||||
| | | | | | | | | | | |
Cash and Cash Equivalents at End of Year |
$ | 65,692 | $ | 51,549 | $ | 25,833 | ||||
| | | | | | | | | | | |
| | | | | | | | | | | |
| | | | | | | | | | | |
147
ITEM 9. CHANGES IN AND DISAGREEMENTS WITH ACCOUNTANTS ON ACCOUNTING AND FINANCIAL DISCLOSURES
None
ITEM 9A. CONTROLS AND PROCEDURES
The Company's management, under the supervision and with the participation of the Chief Executive Officer and Chief Financial Officer, evaluated, as of the last day of the period covered by this report, the effectiveness of the design and operation of the Company's disclosure controls and procedures, as defined in Rule 13a-15(e) under the Securities Exchange Act of 1934. Based on that evaluation, the Chief Executive Officer and Chief Financial Officer concluded that the Company's disclosure controls and procedures were effective.
MANAGEMENT REPORT ON INTERNAL CONTROL OVER FINANCIAL REPORTING
The management of Eagle Bancorp, Inc. (the "Company") is responsible for the preparation, integrity and fair presentation of the financial statements included in this Annual Report. The financial statements have been prepared in conformity with accounting principles generally accepted in the United States of America and reflect management's judgments and estimates concerning the effects of events and transactions that are accounted for or disclosed.
Management is also responsible for establishing and maintaining effective internal control over financial reporting. The Company's internal control over financial reporting includes those policies and procedures that pertain to the Company's ability to record, process, summarize and report reliable financial data. The internal control system contains monitoring mechanisms, and appropriate actions taken to correct identified deficiencies. Management believes that internal controls over financial reporting, which are subject to scrutiny by management and the Company's internal auditors, support the integrity and reliability of the financial statements. Management recognizes that there are inherent limitations in the effectiveness of any internal control system, including the possibility of human error and the circumvention or overriding of internal controls. Accordingly, even effective internal control over financial reporting can provide only reasonable assurance with respect to financial statement preparation. In addition, because of changes in conditions and circumstances, the effectiveness of internal control over financial reporting may vary over time. The Audit Committee of the Board of Directors (the "Committee"), is comprised entirely of outside directors who are independent of management. The Committee is responsible for the appointment and compensation of the independent auditors and makes decisions regarding the appointment or removal of members of the internal audit function. The Committee meets periodically with management, the independent auditors, and the internal auditors to ensure that they are carrying out their responsibilities. The Committee is also responsible for performing an oversight role by reviewing and monitoring the financial, accounting, and auditing procedures of the Company in addition to reviewing the Company's financial reports. The independent auditors and the internal auditors have full and unlimited access to the Audit Committee, with or without the presence of management, to discuss the adequacy of internal control over financial reporting, and any other matters which they believe should be brought to the attention of the Audit Committee.
Management assessed the Company's system of internal control over financial reporting as of December 31, 2015. This assessment was conducted based on the Committee of Sponsoring Organizations ("COSO") of the Treadway Commission "Internal Control—Integrated Framework (2013)." Based on this assessment, management believes that the Company maintained effective internal control over financial reporting as of December 31, 2015. Management's assessment concluded that there were no material weaknesses within the Company's internal control structure.
There were no changes in the Company's internal control over financial reporting (as defined in Rule 13a-15 under the Securities Act of 1934) during the quarter ended December 31, 2015 that have
148
materially affected, or are reasonably likely to materially affect, the Company's internal control over financial reporting.
The 2015 financial statements have been audited by the independent registered public accounting firm of Stegman & Company ("Stegman"). Personnel from Stegman were given unrestricted access to all financial records and related data, including minutes of all meetings of the Board of Directors and committees thereof. Management believes that all representations made to the independent auditors were valid and appropriate. The resulting report from Stegman accompanies the financial statements. Stegman has also issued a report on the effectiveness of internal control over financial reporting. That report has also been made a part of this Annual Report.
/s/ Ronald D. Paul |
/s/ James H. Langmead |
149
None
ITEM 10. DIRECTORS, EXECUTIVE OFFICERS AND CORPORATE GOVERNANCE
The information required by this Item is incorporated by reference to the material appearing under the captions "Election of Directors" and "Compliance with Section 16(a) of the Securities Exchange Act of 1934" in the Company's definitive proxy statement for the Annual Meeting of Shareholders to be held on May 12, 2016 (the "Proxy Statement"). The Company has adopted a code of ethics that applies to its Chief Executive Officer and Chief Financial Officer. A copy of the code of ethics will be provided to any person, without charge, upon written request directed to Jane Cornett, Corporate Secretary, Eagle Bancorp, Inc., 7830 Old Georgetown Road, Third Floor, Bethesda, Maryland 20814. There have been no material changes in the procedures previously disclosed by which shareholders may recommend nominees to the Company's Board of Directors.
ITEM 11. EXECUTIVE COMPENSATION
The information required by this Item is incorporated by reference to the material appearing under the captions "Election of Directors—Director's Compensation" and "Executive Compensation" in the Proxy Statement.
ITEM 12. SECURITY OWNERSHIP OF CERTAIN BENEFICIAL OWNERS AND MANAGEMENT AND RELATED STOCKHOLDER MATTERS
Securities Authorized for Issuance Under Equity Compensation Plans. The following table sets forth information regarding outstanding options and other rights to purchase or acquire common stock granted under the Company's compensation plans as of December 31, 2015:
Equity Compensation Plan Information
Plan category
|
Number of securities to be issued upon exercise of outstanding options, warrants and rights |
Weighted average exercise price of outstanding options, warrants and rights |
Number of securities remaining available for future issuance under equity compensation plans excluding securities reflected in column (a) |
|||||||
|---|---|---|---|---|---|---|---|---|---|---|
| |
(a) |
(b) |
(c) |
|||||||
Equity compensation plans approved by security holders(1) |
298,740 | $ | 9.97 | 775,151 | (2) | |||||
Equity compensation plans not approved by security holders |
0 | 0 | 0 | |||||||
| | | | | | | | | | | |
Total |
298,740 | $ | 9.97 | 775,151 | ||||||
- (1)
- Consists
of the Company's 2011 Employee Stock Purchase Plan, 2006 Stock Plan, 1998 Stock Option Plan, Fidelity Long-Term Incentive Plans, VHB 2010 Long-Term
Incentive Plan and the VHB 2006 Stock Option Plan. For additional information, see Note 15 to the Consolidated Financial Statements.
- (2)
- Shares available for issuance under the 2011 Employee Stock Purchase Plan and the 2006 Stock Plan.
The remainder of the information required by this Item is incorporated by reference to the material appearing under the caption "Voting Securities and Principal Shareholders" in the Proxy Statement.
150
ITEM 13. CERTAIN RELATIONSHIPS AND RELATED TRANSACTIONS AND DIRECTOR INDEPENDENCE
The information required by this Item is incorporated by reference to the material appearing under the captions "Election of Directors" and "Certain Relationships and Related Transactions" in the Proxy Statement.
ITEM 14. PRINCIPAL ACCOUNTANT FEES AND SERVICES
The information required by this Item is incorporated by reference to the material appearing under the caption "Ratification of Appointment of Independent Registered Public Accounting Firm—Fees Paid to Independent Accounting Firm" in the Proxy Statement.
151
ITEM 15. EXHIBITS AND FINANCIAL STATEMENT SCHEDULES
The following financial statements are included in this report
Report
of Independent Registered Public Accounting Firm
Consolidated Balance Sheets at December 31, 2015 and 2014
Consolidated Statements of Operations for the years ended December 31, 2015, 2014 and 2013
Consolidated Statements of Comprehensive Income for the years ended December 31, 2015, 2014 and 2013
Consolidated Statements of Changes in Shareholders' Equity for the years ended December 31, 2015, 2014 and 2013
Consolidated Statements of Cash Flows for the years ended December 31, 2015, 2014 and 2013
Notes to the Consolidated Financial Statements
All financial statement schedules have been omitted as the required information is either inapplicable or included in the Consolidated Financial Statements or related notes. Renumber exhibits and notes as necessary
| Exhibit No. | Description of Exhibit
|
||
|---|---|---|---|
| 3.1 | Certificate of Incorporation of the Company, as amended(1) | ||
3.2 |
Bylaws of the Company(3) |
||
4.1 |
Warrant to Purchase Common Stock(5) |
||
4.2 |
Subordinated Indenture, dated as of August 5, 2014, between the Company and Wilmington Trust, National Association, as Trustee(8) |
||
4.3 |
First Supplemental Indenture, dated as of August 5, 2014, between the Company and Wilmington Trust, National Association, as Trustee(9) |
||
4.4 |
Form of Global Note representing the 5.75% Subordinated Notes due September 1, 2024 (included in Exhibit 4.3) |
||
10.1 |
1998 Stock Option Plan(10) |
||
10.2 |
2006 Stock Plan(11) |
||
10.3 |
Amended and Restated Employment Agreement dated as of August 1, 2014, between EagleBank and James H. Langmead(12) |
||
10.4 |
Amended and Restated Employment Agreement dated as of August 1, 2014, between EagleBank and Antonio F. Marquez(13) |
||
10.5 |
Amended and Restated Employment Agreement dated as of January 1, 2014, between Eagle Bancorp, Inc., EagleBank and Ronald D. Paul(14) |
||
10.6 |
Amended and Restated Employment Agreement dated as of August 1, 2014, between EagleBank and Susan G. Riel(15) |
||
10.7 |
Amended and Restated Employment Agreement dated as of August 1, 2014, between EagleBank and Janice L. Williams(16) |
||
10.8 |
Non-Compete Agreement dated as of August 1, 2014, between EagleBank and James H. Langmead(17) |
||
152
| Exhibit No. | Description of Exhibit
|
||
|---|---|---|---|
| 10.9 | Non-Compete Agreement dated as of August 1, 2014, between EagleBank and Antonio F. Marquez(18) | ||
10.10 |
Non-Compete Agreement dated as of August 1, 2014, between EagleBank and Ronald D. Paul(19) |
||
10.11 |
Non-Compete Agreement dated as of August 1, 2014, between EagleBank and Susan G. Riel(20) |
||
10.12 |
Non-Compete Agreement dated as of August 1, 2014, between EagleBank and Janice L. Williams(21) |
||
10.13 |
Amended and Restated Employment Agreement dated as of August 1, 2014 between EagleBank and Laurence E. Bensignor(22) |
||
10.14 |
Vice Chairman Agreement dated as of June 1, 2014 between Eagle Bancorp, Inc., EagleBank and Robert Pincus(25) |
||
10.15 |
Non-Compete Agreement dated as of August 1, 2014, between EagleBank and Laurence E. Bensignor(26) |
||
10.16 |
Non-Compete Agreement dated as of August 1, 2014, between EagleBank and Robert Pincus(29) |
||
10.17 |
Form of Supplemental Executive Retirement Plan Agreement(30) |
||
10.18 |
Director Fee Agreement between Eagle Bancorp, Inc., Eagle Bank and David P. Summers(31) |
||
10.19 |
2015 Senior Executive Incentive Plan(32) |
||
10.20 |
Employment Agreement dated as of November 1, 2014 between EagleBank and Charles C. Brockett(33) |
||
10.21 |
Non-Compete Agreement dated as of November 1, 2014, between EagleBank and Charles C. Brockett(34) |
||
10.22 |
Amended and Restated Employment Agreement dated as of December 15, 2014 between EagleBank and Lindsey S. Rheaume(35) |
||
10.23 |
Non-Compete Agreement dated as of December 15, 2014, between EagleBank and Lindsey S. Rheaume(36) |
||
10.24 |
Virginia Heritage Bank 2006 Stock Option Plan(37) |
||
10.25 |
Virginia Heritage Bank 2010 Long-Term Incentive Plan(38) |
||
11 |
Statement Regarding Computation of Per Share Income |
||
See Note 15 of the Notes to Consolidated Financial Statements |
|||
21 |
Subsidiaries of the Registrant |
||
31.1 |
Certification of Ronald D. Paul |
||
31.2 |
Certification of James H. Langmead |
||
32.1 |
Certification of Ronald D. Paul |
||
32.2 |
Certification of James H. Langmead |
||
153
| Exhibit No. | Description of Exhibit
|
||
|---|---|---|---|
| 101 | Interactive data files pursuant to Rule 405 of Regulation S-T: | ||
| (i) Consolidated Balance Sheets at December 31, 2015 and 2014 | |||
| (ii) Consolidated Statement of Operations for the years ended December 31, 2015, 2014 and 2013 | |||
| (iii) Consolidated Statement of Comprehensive Income for the years ended December 31, 2015, 2014 and 2013 | |||
| (iv) Consolidated Statement of Changes in Shareholders' Equity for the years ended December 31, 2015, 2014 and 2013 | |||
| (v) Consolidated Statement of Cash Flows for the years ended December 31, 2015, 2014 and 2013 | |||
| (vi) Notes to the Consolidated Financial Statements | |||
- (1)
- Incorporated
by reference to the Exhibit of the same number to the Company's Current Report on Form 8-K filed on July 16, 2008.
- (3)
- Incorporated
by reference to Exhibit 3.2 to the Company's Current Report on Form 8-K filed on June 27, 2012.
- (5)
- Incorporated
by reference to Exhibit 4.1 to the Company's Current Report on Form 8-K filed on December 8, 2008.
- (8)
- Incorporated
by reference to Exhibit 4.1 to the Company's Current Report on Form 8-K filed on August 5, 2014.
- (9)
- Incorporated
by reference to Exhibit 4.2 to the Company's Current Report on Form 8-K filed on August 5, 2014.
- (10)
- Incorporated
by reference to Exhibit 10.1 to the Company's Annual Report on Form 10-KSB for the year ended December 31, 1998.
- (11)
- Incorporated
by reference to Exhibit 4 to the Company's Registration Statement on Form S-8 (No. 333-187713)
- (12)
- Incorporated
by reference to Exhibit 10.1 to the Company's Current Report on Form 8-K filed on December 15, 2014.
- (13)
- Incorporated
by reference to Exhibit 10.1 to the Company's Current Report on Form 8-K filed on December 15, 2014.
- (14)
- Incorporated
by reference to Exhibit 10.2 to the Company's Current Report on Form 8-K filed on December 15, 2014.
- (15)
- Incorporated
by reference to Exhibit 10.3 to the Company's Current Report on Form 8-K filed on December 15, 2014.
- (16)
- Incorporated
by reference to Exhibit 10.4 to the Company's Current Report on Form 8-K filed on December 15, 2014.
- (17)
- Incorporated
by reference to Exhibit 10.5 to the Company's Current Report on Form 8-K filed on December 15, 2014.
- (18)
- Incorporated
by reference to Exhibit 10.6 to the Company's Current Report on Form 8-K filed on December 15, 2014.
- (19)
- Incorporated by reference to Exhibit 10.7 to the Company's Current Report on Form 8-K filed on December 15, 2014.
154
- (20)
- Incorporated
by reference to Exhibit 10.8 to the Company's Current Report on Form 8-K filed on December 15, 2014.
- (21)
- Incorporated
by reference to Exhibit 10.9 to the Company's Current Report on Form 8-K filed on December 15, 2014.
- (22)
- Incorporated
by reference to Exhibit 10.10 to the Company's Current Report on Form 8-K filed on December 15, 2014.
- (25)
- Incorporated
by reference to Exhibit 10.13 to the Company's Current Report on Form 8-K filed on December 15, 2014.
- (26)
- Incorporated
by reference to Exhibit 10.14 to the Company's Current Report on Form 8-K filed on December 15, 2014.
- (29)
- Incorporated
by reference to Exhibit 10.17 to the Company's Current Report on Form 8-K filed on December 15, 2014.
- (30)
- Incorporated
by reference to Exhibit 10.22 to the Company's Annual Report on Form 10-K for the Year ended December 31, 2013.
- (32)
- Incorporated
by reference to Exhibit 10.1 to the Company's Current Report on Form 8-K filed on April 28, 2015.
- (33)
- Incorporated
by reference to Exhibit 4 to the Company's Form 10-Q for the Quarter ended March 31, 2015.
- (34)
- Incorporated
by reference to Exhibit 4 to the Company's Form 10-Q for the Quarter ended March 31, 2015.
- (35)
- Incorporated
by reference to Exhibit 4 to the Company's Form 10-Q for the Quarter ended March 31, 2015.
- (36)
- Incorporated
by reference to Exhibit 4 to the Company's Form 10-Q for the Quarter ended March 31, 2015.
- (37)
- Incorporated
by reference to Exhibit 4.1 to the Company's Registration Statement on Form S-8 (No. 333-199875)
- (38)
- Incorporated by reference to Exhibit 4.2 to the Company's Registration Statement on Form S-8 (No. 333-199875)
155
Pursuant to the requirements of Section 13 or 15(d) of the Securities Exchange Act of 1934, the registrant has duly caused this report to be signed on its behalf by the undersigned, thereunto duly authorized.
| EAGLE BANCORP, INC. | ||||
February 29, 2016 |
by: |
/s/ RONALD D. PAUL Ronald D. Paul, Chairman, President and CEO |
||
Pursuant to the requirements of the Securities Exchange Act of 1934, this report has been signed below by the following persons on behalf of the registrant and in the capacities and on the dates indicated.
Name
|
Position
|
Date
|
||
|---|---|---|---|---|
| /s/ LESLIE M. ALPERSTEIN, PH.D. Leslie M. Alperstein, Ph.D. |
Director | February 29, 2016 | ||
/s/ DUDLEY C. DWORKEN Dudley C. Dworken |
Director |
February 29, 2016 |
||
/s/ HARVEY M. GOODMAN Harvey M. Goodman |
Director |
February 29, 2016 |
||
/s/ RONALD D. PAUL Ronald D. Paul |
Chairman, President and Principal Executive Officer of the Company |
February 29, 2016 |
||
/s/ ROBERT P. PINCUS Robert P. Pincus |
Vice Chairman |
February 29, 2016 |
||
/s/ NORMAN R. POZEZ Norman R. Pozez |
Director |
February 29, 2016 |
||
/s/ DONALD R. ROGERS Donald R. Rogers |
Director |
February 29, 2016 |
||
/s/ LELAND M. WEINSTEIN Leland M. Weinstein |
Director |
February 29, 2016 |
||
/s/ JAMES H. LANGMEAD James H. Langmead |
Executive Vice President and Chief Financial Officer of the Company Principal Financial and Accounting Officer |
February 29, 2016 |
156