Attached files
| file | filename |
|---|---|
| EX-23 - EX-23 - EAGLE BANCORP INC | a2202687zex-23.htm |
| EX-21 - EX-21 - EAGLE BANCORP INC | a2202687zex-21.htm |
| EX-10.12 - EX-10.12 - EAGLE BANCORP INC | a2202687zex-10_12.htm |
| EX-99.1 - EX-99.1 - EAGLE BANCORP INC | a2202687zex-99_1.htm |
| EX-32.1 - EX-32.1 - EAGLE BANCORP INC | a2202687zex-32_1.htm |
| EX-32.2 - EX-32.2 - EAGLE BANCORP INC | a2202687zex-32_2.htm |
| EX-99.2 - EX-99.2 - EAGLE BANCORP INC | a2202687zex-99_2.htm |
| EX-31.1 - EX-31.1 - EAGLE BANCORP INC | a2202687zex-31_1.htm |
| EX-31.2 - EX-31.2 - EAGLE BANCORP INC | a2202687zex-31_2.htm |
UNITED STATES
SECURITIES AND EXCHANGE COMMISSION
Washington, D.C. 20549
FORM 10-K
ý |
Annual report pursuant to Section 13 or 15(d) of the Securities Exchange Act of 1934 |
|
For the fiscal year ended December 31, 2010 |
||
o |
Transition report pursuant to Section 13 or 15(d) of the Securities Exchange Act of 1934 |
|
For the transition period from to |
||
Commission file number: 0-25923
Eagle Bancorp, Inc.
(Exact name of registrant as specified in its charter)
| Maryland (State or other jurisdiction of incorporation or organization) |
52-2061461 (I.R.S. Employer Identification Number) |
|
7815 Woodmont Avenue, Bethesda, Maryland (Address of principal executive offices) |
20814 (Zip Code) |
Registrant's telephone number, including area code: (301) 986-1800
Securities registered pursuant to Section 12(b) of the Act:
| Title of class | Name of each exchange on which registered | |
|---|---|---|
| Common Stock, $0.01 par value | The NASDAQ Capital Market |
Securities registered pursuant to Section 12(g) of the Act: None
Indicate by check mark if the registrant is a well-known seasoned issuer, as defined in Section 405 of the Securities Act. Yes o No ý
Indicate by check mark if the registrant is not required to file reports pursuant to Section 13 or Section 15(d) of the Act Yes o No ý
Indicate by check mark whether the registrant; (1) has filed all reports required to be filed by Section 13 or 15(d) of the Securities Exchange Act of 1934 during the preceding 12 months (or for such shorter period that the registrant was required to file such reports; and (2) has been subject to such filing requirements for the past 90 days. Yes ý No o
Indicate by checkmark whether the registrant has submitted electronically and posted on its corporate Website, if any, every Interactive Data File required to be submitted and posted pursuant to Rule 405 of Regulation S-T (§232.405 of this chapter) during the preceding 12 months (or for such shorter period that the registrant was required to submit and post such files). Yes o No o
Indicate by check mark if disclosure of delinquent filers pursuant to Item 405 of Regulation S-K is not contained herein, and will not be contained, to the best of registrant's knowledge, in definitive proxy or information statements incorporated by reference in Part III of this Form 10-K or any amendment to this Form 10-K. ý
Indicate by check mark whether the registrant is a large accelerated filer, an accelerated filer, a non-accelerated filer or a smaller reporting company. See definitions of "large accelerated filer," "accelerated filer" and "smaller reporting company" in Rule 12b-2 of the Exchange Act.
| Large accelerated filer o | Accelerated filer ý | Non-accelerated filer o | Smaller reporting company o |
Indicate by check mark whether the registrant is a shell company (as defined in Rule 12b-2 of the Act. Yes o No ý
The aggregate market value of the outstanding Common Stock held by nonaffiliates as of June 30, 2010 was approximately $188.7 million.
As of March 4, 2011, the number of outstanding shares of the Common Stock, $0.01 par value, of Eagle Bancorp, Inc. was 19,728,433.
DOCUMENTS INCORPORATED BY REFERENCE
Portions of the Company's definitive Proxy Statement for the Annual Meeting of Shareholders to be held on May 19, 2011 are incorporated by reference in part III hereof.
EAGLE BANCORP, INC.
ANNUAL REPORT ON FORM 10-K
TABLE OF CONTENTS
i
Eagle Bancorp, Inc. (the "Company") was incorporated under the laws of the State of Maryland on October 28, 1997, to serve as the bank holding company for Eaglebank (the "Bank"). The Company was formed by a group of local businessmen and professionals with significant prior experience in community banking in the Company's market area, together with an experienced community bank senior management team. The Bank, a Maryland chartered commercial bank which is a member of the Federal Reserve System, is the Company's principal operating subsidiary. It commenced banking operations on July 20, 1998. As of December 31, 2010, the Bank operated twelve offices: seven in Montgomery County, Maryland located in Rockville (3), Bethesda, Silver Spring, Potomac and Chevy Chase; four located in the District of Columbia; and one Northern Virginia office located in Tysons Corner. The Bank began operating its thirteenth office in Washington, D.C. in the Gallery Place area, near the Verizon Center, in January 2011, and has announced two additional offices projected to open in Northern Virginia in the second quarter of 2011. The Bank seeks additional banking offices consistent with its strategic plan, although there can be no assurance that the Bank will establish any additional offices, or that any branch office will prove to be profitable. The Bank consolidated two offices in 2010. Eagle Commercial Ventures, LLC ("ECV") a direct subsidiary, provides subordinated financing for the acquisition, development and construction of real estate projects. Bethesda Leasing, LLC, holds title to and operates real estate owned acquired through foreclosure. Eagle Insurance Services, LLC, organized in 2010, provides commercial and retail insurance products through a services arrangement with The Meltzer Group, a large well known insurance brokerage within the Company's market area.
The Bank operates as a community bank alternative to the super-regional financial institutions which dominate EagleBank's primary market area. The cornerstone of the Bank's philosophy is to provide superior, personalized service to its clients. The Bank focuses on relationship banking, providing each client with a number of services, familiarizing itself with, and addressing itself to, client needs in a proactive, personalized fashion. Management believes that the market segments which the Bank targets, small to medium-sized for profit and not for profit businesses and the consumer base of the Bank's market area demand the convenience and personal service that a smaller, independent financial institution such as the Bank can offer. It is these themes of convenience and proactive personal service that form the basis for the Bank's business development strategies.
Acquisition. Effective August 31, 2008, the Company consummated the acquisition of Fidelity & Trust Financial Corporation ("Fidelity"), pursuant to which its subsidiary, Fidelity & Trust Bank ("F&T Bank") was merged into the Bank, with the Bank being the surviving entity.
As a result of the acquisition, the Company succeeded to six branch offices of Fidelity, effectively closing four of its branches through December 31, 2010, as a part of the integration plan, three in Montgomery County, Maryland and one in Washington, D.C.
Description of Services. The Bank offers full commercial banking services to its business and professional clients as well as complete consumer banking services to individuals living and/or working in the service area. The Bank emphasizes providing commercial banking services to sole proprietorships, small and medium-sized businesses, partnerships, corporations, non-profit organizations and associations, and investors living and working in and near the Bank's primary service area. A full range of retail banking services are offered to accommodate the individual needs of both corporate customers as well as the community the Bank serves. The Bank also offers a remote deposit service which allows clients to facilitate and expedite deposit transactions through the use of electronic scanning devices.
The Bank has developed a loan portfolio consisting primarily of traditional business and real estate secured loans with a substantial portion having variable rates, and where the cash flow of the borrower/borrower's business is the principal source of debt service with a secondary emphasis on collateral. Real
1
estate loans are made generally for commercial purposes and are structured using both variable and fixed rates and renegotiable rates which adjust in three to five years, with maturities of five to ten years. Consumer loans are comprised primarily of home equity lending and are made on the traditional installment basis for a variety of purposes. The Bank has developed significant expertise and commitment as a Small Business Administration ("SBA") lender.
All new business customers are screened to determine, in advance, their credit qualifications and history. This practice permits the Bank to respond quickly to credit requests as they arise.
In general, the Bank offers the following credit services:
- •
- Commercial loans for business purposes including working capital, equipment purchases, real estate, lines of credit, and
government contract financing. Asset based lending and accounts receivable financing are available on a selective basis.
- •
- Real estate loans, including construction loan financing, for business and investment purposes.
- •
- Business equipment financing.
- •
- Traditional general purpose consumer installment loans including automobile and personal loans. In addition, the Bank
offers personal lines of credit.
- •
- Credit card services are offered through an outside vendor.
- •
- Residential mortgage loans.
The direct lending activities in which the Bank engages carry the risk that the borrowers will be unable to perform on their obligations. As such, interest rate policies of the Federal Reserve Board and general economic conditions, nationally and in the Bank's primary market area, have a significant impact on the Bank's and the Company's results of operations. To the extent that economic conditions deteriorate, business and individual borrowers may be less able to meet their obligations to the Bank in full, in a timely manner, resulting in decreased earnings or losses to the Bank. To the extent the Bank makes fixed rate loans, general increases in interest rates will tend to reduce the Bank's spread as the interest rates the Bank must pay for deposits may increase while interest income may be unchanged. Economic conditions and interest rates may also adversely affect the value of property pledged as security for loans.
The Bank's goal is to mitigate risks in the event of unforeseen threats to the loan portfolio as a result of economic downturn or other negative influences. Plans for mitigating inherent risks in managing loan assets include; carefully enforcing loan policies and procedures, evaluating each borrower's business plan during the underwriting process and throughout the loan term, identifying and monitoring primary and alternative sources for loan repayment, and obtaining collateral to mitigate economic loss in the event of liquidation. Specific loan reserves are established based upon credit and/or collateral risks on an individual loan basis. A risk rating system is employed to proactively estimate loss exposure and provide a measuring system for setting general and specific reserve allocations.
Under certain circumstances, the Bank attempts to further mitigate commercial term loan losses by using loan guarantee programs offered by the SBA. The Bank has been approved for the SBA's preferred lender program ("PLP"). SBA loans made using PLP by the Bank are not subject to SBA pre-approval.
Refer to Critical Accounting Policies at page 33; and Allowance for Credit Losses at page 50 for further discussion of credit risk management policies and practices.
The composition of the Bank's loan portfolio is heavily weighted toward commercial real estate, both owner occupied and investment real estate. At December 31, 2010, real estate commercial, real estate residential and real estate construction combined represented approximately 69% of the loan portfolio. These loans are underwritten to mitigate lending risks typical of this type of loan such as declines in real estate values, changes in borrower cash flow and general economic conditions. The Bank typically requires
2
a maximum loan to value of 80% or less and minimum cash flow debt service coverage of 1.15 to 1.0. Personal guarantees are generally required, but may be limited. In making real estate commercial mortgage loans, the Bank generally requires that interest rates adjust not less frequently than five years.
The Bank is also an active traditional commercial lender providing loans for a variety of purposes, including cash flow, equipment and account receivable financing. This loan category represents approximately 26% of the loan portfolio at December 31, 2010 and is generally variable or adjustable rate. Commercial loans meet reasonable underwriting standards, including appropriate collateral, and cash flow necessary to support debt service. Personal guarantees are generally required, but may be limited. SBA loans represent 2% of the commercial loan category of loans. In originating SBA loans, the Company assumes the risk of non-payment on the uninsured portion of the credit. The Company generally sells the insured portion of the loan generating noninterest income from the gains on sale, as well as servicing income on the portion participated. SBA loans are subject to the same cash flow analyses as other commercial loans. SBA loans and the Section 7A lending program in particular, are subject to a maximum loan size established by the SBA.
Approximately 6% of the loan portfolio at December 31, 2010 consists of home equity loans and lines of credit and other consumer loans. These credits, while making up a smaller portion of the loan portfolio, demand the same emphasis on underwriting and credit evaluation as other types of loans advanced by the Bank.
At January 31, 2011, the Bank had a legal lending limit of $31.2 million. Due to legal lending limitations, the Bank occasionally participates portions of credits to other area banks. The Bank has also participated loans to the Company until such time as the Bank could accommodate the participation within its legal limit or the loan could be participated to another lender. No loan participations to the Company are outstanding at December 31, 2010. The ability of the Company to assist the Bank with these credits has expanded the flexibility and service the Bank can offer its customers.
From time to time the Company may make loans for its own portfolio or through its higher risk loan affiliate, ECV, which under its operating agreement conducts lending only to real estate projects, where the Company's directors or lending officers have significant expertise. Such loans, which are made to finance real estate projects, may have higher risk characteristics than loans made by the Bank, such as lower priority interests and/or higher loan to value ratios. The Company seeks an overall financial return on these transactions commensurate with the risks and structure of each individual loan. Certain transactions bear current interest at a rate with a significant premium to normal market rates. Other loan transactions carry a standard rate of current interest, but also earn additional interest based on a percentage of the profits of the underlying project. This additional interest is recognized upon full repayment of the underlying loan and substantial completion of the project. Refer to the discussion under "Management's Discussion and Analysis—Noninterest Income" at page 42 and "Loan Portfolio" at page 47, for further information on the Company's and ECV's higher risk lending activities. In 2010, no additional higher risk loan transactions were entered into.
The risk of nonpayment (or deferred payment) of loans is inherent in commercial banking. The Bank's marketing focus on small to medium-sized businesses may result in the assumption by the Bank of certain lending risks that are different from those attendant to loans to larger companies. The management and director committees of the Bank carefully evaluate all loan applications and attempt to minimize credit risk exposure by use of extensive loan application data, due diligence, and approval and monitoring procedures; however, there can be no assurance that such procedures can significantly reduce such lending risks.
The Bank originates residential mortgage loans primarily as a correspondent lender. With only rare exceptions, the loans are registered with one of the designated investors at the time of application with intentions of immediate sale to that investor on a servicing released basis. This activity is managed by utilizing the available pricing, programs and lock periods which produce market gains on the sale of the
3
loan. Activity in the residential mortgage loan market is highly sensitive to changes in interest rates and product availability. While the Bank does have delegated underwriting authority from most of its investors, it also employs the services of a contract underwriter which has been approved by the designated investors. Because the loans are originated with investor guidelines, designated automated underwriting and product specific requirements as part of the loan application, the loans sold have a limited recourse provision. Most contracts with investors contain recourse periods that may vary from 90 days up to one year. In general, the Company may be required to repurchase a previously sold mortgage loan or indemnify the investor if there is major non-compliance with defined loan origination or documentation standards, including fraud, negligence or material misstatement in the loan documents. In addition, the Company may have an obligation to repurchase a loan if the mortgagor has defaulted early in the loan term. The potential default repurchase period is approximately twelve months after sale of the loan to the investor. Mortgages subject to recourse are collateralized by single-family residential properties, have loan-to-value ratios of 80% or less, or have private mortgage insurance. In certain instances, the Bank may provide equity loans (second position financing) in combination with residential first mortgage lending for purchase money and refinancing purposes. The Bank also brokers loan transactions with two investors, where the Bank refers, but does not underwrite and does not close the loan transaction. In this situation the Bank has no recourse liability for the loan.
The general terms and underwriting standards for each type of commercial real estate and construction loan are incorporated into the Bank's lending policies. These policies are analyzed periodically by management, and the policies are reviewed and approved by the Board on an annual basis. The Bank's loan policies and practices described in this report are subject to periodic change, and each guideline or standard is subject to waiver or exception in the case of any particular loan, by the appropriate officer or committee, in accordance with the Bank's loan policies. Policy standards are often stated in mandatory terms, such as "shall" or "must", but these provisions are subject to exceptions. Policy requirements that value not exceed a percentage of "market value" or "fair value" are based upon appraisals or evaluations obtained in the ordinary course of the Bank's underwriting practices.
Loans are secured primarily by duly recorded first deeds of trust. In some cases, the Bank may accept a recorded second trust position. In general, borrowers will have a proven ability to build, lease, manage and/or sell a commercial or residential project and demonstrate satisfactory financial condition. Additionally, an equity contribution toward the project is customarily required.
Construction loans require that the financial condition and experience of the general contractor and major subcontractors be satisfactory to the Bank. Guaranteed, fixed price contracts are required whenever appropriate, along with payment and performance bonds or completion bonds for larger scale projects.
Loans intended for residential land acquisition, lot development and construction are made on the premise that the land: 1) is or will be developed for building sites for residential structures, and; 2) will ultimately be utilized for construction or improvement of residential zoned real properties, including the creation of housing. Residential development and construction loans will finance projects such as single family subdivisions, planned unit developments, townhouses, and condominiums. Residential land acquisition, development and construction loans generally are underwritten with a maximum term of 36 months, including extensions approved at origination.
Commercial land acquisition and construction loans are secured by real property where loan funds will be used to acquire land and to construct or improve appropriately zoned real property for the creation of income producing or owner user commercial properties. Borrowers are generally required to put equity into each project at levels determined by the appropriate Loan Committee. Commercial land acquisition and construction loans generally are underwritten with a maximum term of 24 months.
Loan-to-value ("LTV") ratios, with few exceptions, are maintained consistent with or below supervisory guidelines.
4
All construction draw requests must be presented in writing on American Institute of Architects documents and certified by the contractor, the borrower and the borrower's architect. Each draw request shall also include the borrower's soft cost breakdown certified by the borrower or its Chief Financial Officer. Prior to an advance, the Bank or its contractor inspects the project to determine that the work has been completed, to justify the draw requisition.
Commercial permanent loans are secured by improved real property which is generating income in the normal course of operation. Debt service coverage, assuming stabilized occupancy, must be satisfactory to support a permanent loan. The debt service coverage ratio is ordinarily at least 1.15:1. As part of the underwriting process, debt service coverage ratios are stress tested assuming a 200 basis point increase in interest rates from their current levels.
Commercial permanent loans generally are underwritten with a term not greater than 10 years or the remaining useful life of the property, whichever is lower. The preferred term is between 5 to 7 years, with amortization to a maximum of 25 years.
Personal guarantees are generally received from the principals, and only in instances where the loan-to-value is sufficiently low and the debt service is sufficiently high is consideration given to either limiting or not requiring personal recourse.
Updated appraisals for real estate secured loans are obtained as necessary and appropriate to borrower financial condition, project status, loan terms, and market conditions.
The Company's loan portfolio includes loans made for real estate Acquisition, Development and Construction ("ADC") purposes, including both investment and owner occupied projects. ADC loans amounted to $308.1 million at December 31, 2010. The ADC loans containing loan funded interest reserves represent approximately 29% of the outstanding ADC loan portfolio at December 31, 2010. The decision to establish a loan-funded interest reserve is made upon origination of the ADC loan and is based upon a number of factors considered during underwriting of the credit including: (i) the feasibility of the project; (ii) the experience of the sponsor; (iii) the creditworthiness of the borrower and guarantors; (iv) borrower equity contribution; and (v) the level of collateral protection. When appropriate, an interest reserve provides an effective means of addressing the cash flow characteristics of a properly underwritten ADC loan. The Company does not significantly utilize interest reserves in other loan products. The Company recognizes that one of the risks inherent in the use of interest reserves is the potential masking of underlying problems with the project and/or the borrower's ability to repay the loan. In order to mitigate this inherent risk, the Company employs a series of reporting and monitoring mechanisms on all ADC loans, whether or not an interest reserve is provided, including: (i) construction and development timelines which are monitored on an ongoing basis which track the progress of a given project to the timeline projected at origination; (ii) a construction loan administration department independent of lending function; (iii) third party independent construction loan inspection reports; (iv) monthly interest reserve monitoring reports detailing the balance of the interest reserves approved at origination and the days of interest carry represented by the reserve balances as compared to the then current anticipated time to completion and/or sale of speculative projects; and (v) quarterly commercial real estate construction meetings among senior Company management which includes monitoring of current and projected real estate market conditions. If a project has not performed as expected, it is not the customary practice of the Company to increase loan funded interest reserves.
Despite the softening economy and real estate markets in general, to date, the Company has not experienced any significant issues with increased vacancy rates or lower rents for income producing properties financed. However, the construction loan portfolio has felt to some extent the impacts of a softer market and slower absorption, although the Washington D.C. metropolitan area real estate market has been very strong, as compared to other markets in the U.S. Some general slowness in turn of projects has impacted the liquidity of borrowers and guarantors. As a result the Company has maintained higher allocation factors (established in 2008) for the ALLL for the real estate loan portfolio. This increase has
5
had an impact on the provision expense which results in marginal decrease in net income. Management carefully reviews the Bank's portfolio and general economic and market conditions on a regular basis and will continue to adjust both the specific and environmental reserve factors as necessary.
Deposit services include business and personal checking accounts, NOW accounts, tiered savings and money market account and time deposits with varying maturity structures and customer options. A complete individual retirement account program is available. In cooperation with Goldman Sachs Asset Management, the bank has introduced Eagle Asset Management Account, a check writing cash management account that sweeps funds to one of several off-balance sheet investment accounts managed by Goldman Sachs.
Other services include cash management services such as electronic banking, business sweep accounts, lock box, and account reconciliation services, credit card depository, safety deposit boxes and Automated Clearing House origination. After-hours depositories and ATM service are also available.
The Bank and Company maintain portfolios of short term investments and investment securities consisting primarily of U.S. Government Agency bonds and government sponsored enterprise mortgage backed securities, and municipal bonds. The Company also owns equity investments related to membership in the Federal Reserve System and the FHLB. The Company's securities portfolio also consists of equity investments in the form of common stocks. The Company holds limited equity investments in local banking companies. These portfolios provide the following objectives: liquidity management, additional income to the Company and Bank in the form of interest and gain on sale opportunities, collateral to facilitate borrowing arrangements and assistance with meeting interest rate risk management objectives.
The Company and Bank have formalized an asset and liability management process and have a standing ALCO consisting both of outside and inside directors. The ALCO operates under established policies and practices, which are updated and re-approved annually. A typical Committee meeting includes discussion of current economic conditions and strategies, including interest rate trends and volumes positions, the current balance sheet and earnings position, cash flow estimates, liquidity positions and funding alternatives as necessary, interest rate risk position (quarterly), capital position, review of the investment portfolio of the Bank and the Company, and the approval of investment transactions. The current Investment Policy limits the Bank to investments of high quality, U.S. Treasury securities, U.S. Government agency securities and high grade municipal securities. High risk investments, derivatives and non traditional investments are prohibited, although the Bank does have investments in structured notes, which are permitted under the investment policy and which are performing well. Investment maturities are generally limited to ten to fifteen years, except as specifically approved by the ALCO, and mortgage backed pass through securities with average lives generally not to exceed eight years.
The Bank's customer base has benefited from the extensive business and personal contacts of its Directors and Executive Officers. To introduce new customers to the Bank, enhanced reliance is expected on proactively designed officer calling programs, active participation in business organizations, newly created advisory board structures and enhanced referral programs.
The Bank's main office and the headquarters of the Company and the Bank are located at 7815 Woodmont Avenue, Bethesda, Maryland 20814. The Bank has six additional Maryland offices, located at 110 North Washington Street, Rockville; 8665 Georgia Avenue, Silver Spring; 130 Rollins Avenue, Rockville; 9600 Blackwell Road, Rockville; 15 Wisconsin Circle, Chevy Chase; and 12505 Park Potomac Avenue, Potomac. There are four offices in Washington D.C., located at 2001 K Streets, NW; 1044 Wisconsin Ave, NW; 1228 Connecticut Ave, NW. The Bank has one office in Virginia, located at 8601 Westwood Center Drive, Vienna.
6
The primary service area of the Bank is the Washington, D.C. metropolitan statistical area. With a population of approximately 6,200,000 (January, 2009), the region is the 5th largest market in the U.S. Total employment in the region is approximately 2,900,000. The region has the highest total of job creation of any market in the country over the last decade and new job creation was reported at 57,500 for the year 2010. The Washington, D.C. metropolitan statistical area contains a substantial federal workforce, as well as supporting a variety of support industries such as attorneys, lobbyists, government contractors, real estate developers and investors, non-profit organizations, tourism and consultants. The Gross Regional Product for 2009 was reported at $443 billion. Of this about 35% is spending by the federal government for both employment and procurement. The economic engine is well balanced with 37% contributed by local businesses. The remainder of the regional economy is further supplied by national and international businesses at 18%. The region also has a very active non-profit sector including trade associations, colleges and universities and major hospitals.
Montgomery County, Maryland with a total population of approximately 972,000 (January 2009) and occupying an area of about 500 square miles is located roughly 30 miles southwest of Baltimore and is a diverse and healthy segment of Maryland's economy. Montgomery County is a thriving business center and is Maryland's most populous jurisdiction. Population growth in the county is expected to average 1% per year. While the State of Maryland boasts a demographic profile superior to the U.S. economy at large, the economy in and around Montgomery County is among the very best in Maryland. According to data from the Maryland National Capital Parks and Planning Commission, the number of jobs in the County has been relatively stable in the recent past with the public sector contributing about 19% of the employment. This is due to federal as well as state and local government employment. The unemployment rate in Montgomery County is among the lowest in the state at 5.3% (December 2009), but was elevated as compared to December 2008 (3.9%). A very educated population has contributed to favorable median household income of $94,420 (2009) with the number of households in excess of 356,000 (January 2009). According to the 2005 census update, approximately 64% of the County's residents hold college or advanced degrees with 89% of households having computers, placing Montgomery County among the most educated counties in the nation. The area boasts a diverse business climate of 33,000 businesses employing over 360,000 workers in addition to a strong federal government presence. Major areas of employment include a substantial technology sector, biotechnology, software development, a housing construction and renovation sector, and a legal, financial services and professional services sector. Major private employers include Lockheed Martin, Adventist Healthcare, Giant Food, and Marriott International. The county is also an incubator for firms engaged in bio-technology and the area has traditionally attracted significant amounts of venture capital. Transportation congestion remains the biggest threat to future economic development and the quality of life in the area.
Montgomery County is home to many major federal and private sector research and development and regulatory agencies, including the National Institute of Standards and Technology, the National Institutes of Health, National Oceanic and Atmospheric Administration, Naval Research and Development Center, Naval Surface Warfare Center, Nuclear Regulatory Commission, the Food and Drug Administration and the National Naval Medical Center in Bethesda.
Washington, D.C. in addition to being the seat of the Federal government is a vibrant city with a well educated, diverse population. According to survey estimates from the U.S. Census, the 2009 population of the District of Columbia is approximately 599,600, up from about 572,000 in 2000. Median household income, at $59,290 (2009), is above the national median level. The growth of residents in the city is due partially to improvements in the city's services and also to the many housing options available, ranging from grand old apartment buildings to Federal era town homes to the most modern condominiums. Over the last few years the housing market has grown to over 284,000 units. During 2010 the absorption of condominium units in the District has continued at a satisfactory pace. The inventory of new condominium units dropped from a peak of over 5,100 units at the end of 2006 to 700 units at year end 2010. While the Federal government and its employees are a major factor in the economy, over 100 million square feet of
7
commercial office space support a dynamic business community of more than 20,000 companies. These include law and accounting firms, trade and professional associations, information technology companies, international financial institutions, health and education organizations and research and management companies. The vacancy rate for office space in the city at December 2010 was 9.7%, below the national average of 16.4%. Employment in the city is approximately 691,000. Statistics indicate that the District of Columbia lost 600 jobs, net, in 2009, particularly in the construction and retail industries. However it also gained jobs in the professional sectors. In 2010 the city gained approximately 10,500 jobs, mostly in white collar positions. The unemployment rate for December 2009 was 10.2%, down from 11.9% for 2008. The disparity between the high level of unemployment among District residents and the strong employment trends reflects the high level of jobs held by residents of the surrounding suburban jurisdictions. The District has a well educated and highly paid work force. Over 51% of the jobs in the city are in managerial or professional positions. The Federal Government provides approximately 29% of the employment and professional service firms provide an additional 21%. Other large employers include the many local universities and hospitals. Another significant factor in the economy is the leisure and hospitality industry.
Fairfax County, Virginia is a large, affluent jurisdiction with a population of approximately 1,038,000 at the end of 2009. This county of about 395 square miles is located west of Washington, D.C. Fairfax County is one of the leading technology centers in the United States. Twelve of the top 50 federal contractors are headquartered in the county and 23 of the largest 50 technology companies in the Washington metropolitan area are located in Fairfax. The county has over 111 million square feet of office space and is one of the largest suburban office markets in the United States. The current office vacancy rate is 13.2%, below the national average of 16.4% It is a thriving residential as well as business center with 381,000 households which are expected to grow at about 1% per annum over the next 5 to 10 years. The county is among the most affluent in the country with household income of $102,499 per annum. Total employment was over 551,000 at the end of 2009. The county did experience loss of jobs during 2009, although job growth of 9,500 positions was reported for 2010. Major companies headquartered in the county, which are also major employers, include Capital One Financial, CSC, Gannett, General Dynamics, Hilton Hotels, SAIC and Sallie Mae. The county is also home to several federal agencies including the CIA, Fort Belvoir and a major facility of the Smithsonian Institution.
Deregulation of financial institutions and holding company acquisitions of banks across state lines has resulted in widespread, fundamental changes in the financial services industry. This transformation, although occurring nationwide, is particularly intense in the greater Washington, D.C. metropolitan area because of the changes in the area's economic base in recent years and changing state laws authorizing interstate mergers and acquisitions of banks, and the interstate establishment or acquisition of branches.
Throughout the Washington, D.C. metropolitan area, competition is exceptionally keen from large banking institutions headquartered outside of Maryland. In addition, the Bank competes with other community banks, savings and loan associations, credit unions, mortgage companies, finance companies and others providing financial services. Among the advantages that many of these large institutions have over the Bank are their abilities to finance extensive advertising campaigns, maintain extensive branch networks and technology investments, and to directly offer certain services, such as international banking and trust services, which are not offered directly by the Bank. Further, the greater capitalization of the larger institutions allows for substantially higher lending limits than the Bank. Certain of these competitors have other advantages, such as tax exemption in the case of credit unions, and lesser regulation in the case of mortgage companies and finance companies, although this regulatory oversight is undergoing change. As a result of the Dodd-Frank Wall Street Reform and Consumer Protection Act (the "Dodd-Frank Act"), enacted in July 2010, almost unlimited interstate de novo branching is available to all state and federally chartered banks. As a result, institutions which previously were ineligible to establish de novo branches in the Company's market area may elect to do so.
8
At December 31, 2010 the Bank employed 292 persons on a full time basis, eight of whom are executive officers of the Bank, which compares to 235 employees at December 31, 2009. None of the Bank's employees are represented by any collective bargaining group, and the Bank believes that its employee relations are good. The Bank provides a benefit program which includes health and dental insurance, a 401k plan, life and long term disability insurance. Additionally, the Company maintains a stock-based compensation plan for employees of the Bank who meet certain eligibility requirements.
The Company. The Company is a bank holding company registered under the Bank Holding Company Act of 1956, as amended, (the "Act") and is subject to supervision by the Board of Governors of the Federal Reserve System (the "Federal Reserve Board"). As a bank holding company, the Company is required to file with the Federal Reserve Board an annual report and such other additional information as the Federal Reserve Board may require pursuant to the Act. The Federal Reserve Board may also make examinations of the Company and each of its subsidiaries.
The Act requires approval of the Federal Reserve Board for, among other things, the acquisition by a proposed bank holding company of control of more than five percent (5%) of the voting shares, or substantially all the assets, of any bank or the merger or consolidation by a bank holding company with another bank holding company. The Act also generally permits the acquisition by a bank holding company of control or substantially all the assets of any bank located in a state other than the home state of the bank holding company, except where the bank has not been in existence for the minimum period of time required by state law; but if the bank is at least 5 years old, the Federal Reserve Board may approve the acquisition.
With certain limited exceptions, a bank holding company is prohibited from acquiring control of any voting shares of any company which is not a bank or bank holding company and from engaging directly or indirectly in any activity other than banking or managing or controlling banks or furnishing services to or performing service for its authorized subsidiaries. A bank holding company may, however, engage in or acquire an interest in, a company that engages in activities which the Federal Reserve Board has determined by order or regulation to be so closely related to banking or managing or controlling banks as to be properly incident thereto. In making such a determination, the Federal Reserve Board is required to consider whether the performance of such activities can reasonably be expected to produce benefits to the public, such as convenience, increased competition or gains in efficiency, which outweigh possible adverse effects, such as undue concentration of resources, decreased or unfair competition, conflicts of interest or unsound banking practices. The Federal Reserve Board is also empowered to differentiate between activities commenced de novo and activities commenced by the acquisition, in whole or in part, of a going concern. Some of the activities that the Federal Reserve Board has determined by regulation to be closely related to banking include making or servicing loans, performing certain data processing services, acting as a fiduciary or investment or financial advisor, and making investments in corporations or projects designed primarily to promote community welfare.
Subsidiary banks of a bank holding company are subject to certain restrictions imposed by the Federal Reserve Act on any extensions of credit to the bank holding company or any of its subsidiaries, or investments in the stock or other securities thereof, and on the taking of such stock or securities as collateral for loans to any borrower. Further, a holding company and any subsidiary bank are prohibited from engaging in certain tie-in arrangements in connection with the extension of credit. A subsidiary bank may not extend credit, lease or sell property, or furnish any services, or fix or vary the consideration for any of the foregoing on the condition that: (i) the customer obtain or provide some additional credit, property or services from or to such bank other than a loan, discount, deposit or trust service; (ii) the customer obtain or provide some additional credit, property or service from or to the Company or any other
9
subsidiary of the Company; or (iii) the customer not obtain some other credit, property or service from competitors, except for reasonable requirements to assure the soundness of credit extended.
Effective on March 11, 2000, the Gramm Leach-Bliley Act of 1999 (the "GLB Act") allows a bank holding company or other company to certify status as a financial holding company, which allows such company to engage in activities that are financial in nature, that are incidental to such activities, or are complementary to such activities. The GLB Act enumerates certain activities that are deemed financial in nature, such as underwriting insurance or acting as an insurance principal, agent or broker, underwriting, dealing in or making markets in securities, and engaging in merchant banking under certain restrictions. It also authorizes the Federal Reserve Board to determine by regulation what other activities are financial in nature, or incidental or complementary thereto. The GLB Act allows a wider array of companies to own banks, which could result in companies with resources substantially in excess of the Company's entering into competition with the Company and the Bank.
The Dodd-Frank Act contains various provisions designed to enhance the regulation of depository institutions and prevent the recurrence of a financial crisis such as occurred in 2008-2009. Also included is the creation of a new federal agency to administer and enforce consumer and fair lending laws, a function that is now performed by the depository institution regulators. The full impact of the Dodd-Frank Act on the Company's business and operations will not be known for years until regulations implementing the statute are written and adopted. The Dodd-Frank Act may have a material impact on the Company's operations, particularly through increased compliance costs resulting from possible future consumer and fair lending regulations.
The Bank. The Bank, as a Maryland chartered commercial bank which is a member of the Federal Reserve System (a "state member bank") and whose accounts are insured by the Deposit Insurance Fund of the Federal Deposit Insurance Corporation (the "FDIC") up to the maximum legal limits of the FDIC, is subject to regulation, supervision and regular examination by the Maryland Department of Financial Institutions and the Federal Reserve Board. The regulations of these various agencies govern most aspects of the Bank's business, including required reserves against deposits, loans, investments, mergers and acquisitions, borrowing, dividends and location and number of branch offices.
The laws and regulations governing the Bank generally have been promulgated to protect depositors and the deposit insurance funds, and not for the purpose of protecting stockholders.
Competition among commercial banks, savings and loan associations, and credit unions has increased following enactment of legislation which greatly expanded the ability of banks and bank holding companies to engage in interstate banking or acquisition activities. As a result of federal and state legislation, banks in the Washington, D.C./Maryland/Virginia area can, subject to limited restrictions, acquire or merge with a bank in another of the jurisdictions, and can branch de novo in any of the jurisdictions.
Banking is a business which depends on interest rate differentials. In general, the differences between the interest paid by a bank on its deposits and its other borrowings and the interest received by a bank on loans extended to its customers and securities held in its investment portfolio constitute the major portion of the bank's earnings. Thus, the earnings and growth of the Bank will be subject to the influence of economic conditions generally, both domestic and foreign, and also to the monetary and fiscal policies of the United States and its agencies, particularly the Federal Reserve Board, which regulates the supply of money through various means including open market dealings in United States government securities. The nature and timing of changes in such policies and their impact on the Bank cannot be predicted.
Branching and Interstate Banking. The federal banking agencies are authorized to approve interstate bank merger transactions without regard to whether such transaction is prohibited by the law of any state, unless the home state of one of the banks has opted out of the interstate bank merger provisions of the Riegle-Neal Interstate Banking and Branching Efficiency Act of 1994 (the "Riegle-Neal Act") by adopting a law after the date of enactment of the Riegle-Neal Act and prior to June 1, 1997 which applies equally to all out-of-state banks and expressly prohibits merger transactions involving out-of-state banks. Interstate
10
acquisitions of branches are permitted only if the law of the state in which the branch is located permits such acquisitions. Such interstate bank mergers and branch acquisitions are also subject to the nationwide and statewide insured deposit concentration limitations described in the Riegle-Neal Act. The District of Columbia, Maryland and Virginia have each enacted laws which permit interstate acquisitions of banks and bank branches. The Dodd-Frank Act authorizes national and state banks to establish de novo branches in other states to the same extent as a bank chartered by that state would be permitted to branch. Previously, banks could only establish branches in other states if the host state expressly permitted out-of-state banks to establish branches in that state. Although the District of Columbia, Maryland and Virginia had all enacted laws which permitted banks in these jurisdictions to branch freely, the branching provisions of the Dodd-Frank Act could result in banks from a wider variety of states establishing de novo branches in the Bank's market area.
The GLB Act made substantial changes in the historic restrictions on non-bank activities of bank holding companies, and allows affiliations between types of companies that were previously prohibited. The GLB Act also allows banks to engage in a wider array of non banking activities through "financial subsidiaries."
USA Patriot Act. Under the Uniting and Strengthening America by Providing Appropriate Tools Required to Intercept and Obstruct Terrorism Act, commonly referred to as the "USA Patriot Act" or the "Patriot Act," financial institutions are subject to prohibitions against specified financial transactions and account relationships, as well as enhanced due diligence standards intended to detect, and prevent, the use of the United States financial system for money laundering and terrorist financing activities. The Patriot Act requires financial institutions, including banks, to establish anti-money laundering programs, including employee training and independent audit requirements, meet minimum standards specified by the act, follow minimum standards for customer identification and maintenance of customer identification records, and regularly compare customer lists against lists of suspected terrorists, terrorist organizations and money launderers. The costs or other effects of the compliance burdens imposed by the Patriot Act or future anti-terrorist, homeland security or anti-money laundering legislation or regulation cannot be predicted with certainty.
Capital Adequacy Guidelines. The Federal Reserve Board and the FDIC have adopted risk based capital adequacy guidelines pursuant to which they assess the adequacy of capital in examining and supervising banks and bank holding companies and in analyzing bank regulatory applications. Risk-based capital requirements determine the adequacy of capital based on the risk inherent in various classes of assets and off-balance sheet items. Under the Dodd-Frank Act, the Federal Reserve Board is required to apply consolidated capital requirements to depository institution holding companies that are no less stringent than those currently applied to depository institutions. The Dodd-Frank Act additionally requires capital requirements to be countercyclical so that the required amount of capital increases in times of economic expansion and decreases in times of economic contraction, consistent with safety and soundness.
State member banks are expected to meet a minimum ratio of total qualifying capital (the sum of core capital (Tier 1) and supplementary capital (Tier 2) to risk weighted assets of 8%. At least half of this amount (4%) should be in the form of core capital.
Tier 1 Capital generally consists of the sum of common stockholders' equity and perpetual preferred stock (subject in the case of the latter to limitations on the kind and amount of such stock which may be included as Tier 1 Capital), less goodwill, without adjustment for changes in the market value of securities classified as "available-for-sale," together with a limited amount of other qualifying interests, including trust preferred securities. The cumulative perpetual stock issued to the United States Department of the Treasury (the "Treasury") pursuant to the Troubled Asset Relief Program Capital Purchase Program (the "Capital Purchase Program") is eligible for treatment as Tier 1 capital without limitation. Tier 2 Capital consists of the following: hybrid capital instruments; perpetual preferred stock which is not otherwise eligible to be included as Tier 1 Capital; term subordinated debt and intermediate-term preferred stock; and, subject to limitations, general allowances for loan losses and excess restricted core capital elements.
11
Assets are adjusted under the risk-based guidelines to take into account different risk characteristics, with the categories ranging from 0% (requiring no risk-based capital) for assets such as cash, to 100% for the bulk of assets which are typically held by a bank holding company, including certain multi-family residential and commercial real estate loans, commercial business loans and consumer loans. Residential first mortgage loans on one to four family residential real estate and certain seasoned multi-family residential real estate loans, which are not 90 days or more past-due or nonperforming and which have been made in accordance with prudent underwriting standards are assigned a 50% level in the risk-weighing system, as are certain privately-issued mortgage-backed securities representing indirect ownership of such loans. Off-balance sheet items also are adjusted to take into account certain risk characteristics. Under guidance adopted by the federal banking regulators, banks which have concentrations in construction, land development or commercial real estate loans (other than loans for majority owner occupied properties) would be expected to maintain higher levels of risk management and, potentially, higher levels of capital.
In addition to the risk-based capital requirements, the Federal Reserve Board has established a minimum 3.0% Leverage Capital Ratio (Tier 1 Capital to total adjusted assets) requirement for the most highly-rated banks, with an additional cushion of at least 100 to 200 basis points for all other banks, which effectively increases the minimum Leverage Capital Ratio for such other banks to 4.0%—5.0% or more. The highest-rated banks are those that are not anticipating or experiencing significant growth and have well diversified risk, including no undue interest rate risk exposure, excellent asset quality, high liquidity, good earnings and, in general, those which are considered a strong banking organization. A bank having less than the minimum Leverage Capital Ratio requirement shall, within 60 days of the date as of which it fails to comply with such requirement, submit a reasonable plan describing the means and timing by which the bank shall achieve its minimum Leverage Capital Ratio requirement. A bank which fails to file such plan is deemed to be operating in an unsafe and unsound manner, and could subject the bank to a cease-and-desist order. Any insured depository institution with a Leverage Capital Ratio that is less than 2.0% is deemed to be operating in an unsafe or unsound condition pursuant to Section 8(a) of the Federal Deposit Insurance Act (the "FDIA") and is subject to potential termination of deposit insurance. However, such an institution will not be subject to an enforcement proceeding solely on account of its capital ratios, if it has entered into and is in compliance with a written agreement to increase its Leverage Capital Ratio and to take such other action as may be necessary for the institution to be operated in a safe and sound manner. The capital regulations also provide, among other things, for the issuance of a capital directive, which is a final order issued to a bank that fails to maintain minimum capital or to restore its capital to the minimum capital requirement within a specified time period. Such directive is enforceable in the same manner as a final cease-and-desist order.
Prompt Corrective Action. Under Section 38 of the FDIA, each federal banking agency is required to implement a system of prompt corrective action for institutions which it regulates. The federal banking agencies have promulgated substantially similar regulations to implement the system of prompt corrective action established by Section 38 of the FDIA. Under the regulations, a bank shall be deemed to be: (i) "well capitalized" if it has a Total Risk Based Capital Ratio of 10.0% or more, a Tier 1 Risk Based Capital Ratio of 6.0% or more, a Leverage Capital Ratio of 5.0% or more and is not subject to any written capital order or directive; (ii) "adequately capitalized" if it has a Total Risk Based Capital Ratio of 8.0% or more, a Tier 1 Risk Based Capital Ratio of 4.0% or more and a Tier 1 Leverage Capital Ratio of 4.0% or more (3.0% under certain circumstances) and does not meet the definition of "well capitalized;" (iii) "undercapitalized" if it has a Total Risk Based Capital Ratio that is less than 8.0%, a Tier 1 Risk based Capital Ratio that is less than 4.0% or a Leverage Capital Ratio that is less than 4.0% (3.0% under certain circumstances); (iv) "significantly undercapitalized" if it has a Total Risk Based Capital Ratio that is less than 6.0%, a Tier 1 Risk Based Capital Ratio that is less than 3.0% or a Leverage Capital Ratio that is less than 3.0%; and (v) "critically undercapitalized" if it has a ratio of tangible equity to total assets that is equal to or less than 2.0%.
12
An institution generally must file a written capital restoration plan which meets specified requirements with an appropriate federal banking agency within 45 days of the date the institution receives notice or is deemed to have notice that it is undercapitalized, significantly undercapitalized or critically undercapitalized. A federal banking agency must provide the institution with written notice of approval or disapproval within 60 days after receiving a capital restoration plan, subject to extensions by the applicable agency.
An institution which is required to submit a capital restoration plan must concurrently submit a performance guaranty by each company that controls the institution. Such guaranty shall be limited to the lesser of (i) an amount equal to 5.0% of the institution's total assets at the time the institution was notified or deemed to have notice that it was undercapitalized or (ii) the amount necessary at such time to restore the relevant capital measures of the institution to the levels required for the institution to be classified as adequately capitalized. Such a guaranty shall expire after the federal banking agency notifies the institution that it has remained adequately capitalized for each of four consecutive calendar quarters. An institution which fails to submit a written capital restoration plan within the requisite period, including any required performance guaranty, or fails in any material respect to implement a capital restoration plan, shall be subject to the restrictions in Section 38 of the FDIA which are applicable to significantly undercapitalized institutions.
A "critically undercapitalized institution" is to be placed in conservatorship or receivership within 90 days unless the FDIC formally determines that forbearance from such action would better protect the deposit insurance fund. Unless the FDIC or other appropriate federal banking regulatory agency makes specific further findings and certifies that the institution is viable and is not expected to fail, an institution that remains critically undercapitalized on average during the fourth calendar quarter after the date it becomes critically undercapitalized must be placed in receivership. The general rule is that the FDIC will be appointed as receiver within 90 days after a bank becomes critically undercapitalized unless extremely good cause is shown and an extension is agreed to by the federal regulators. In general, good cause is defined as capital which has been raised and is imminently available for infusion into the Bank except for certain technical requirements which may delay the infusion for a period of time beyond the 90 day time period.
Immediately upon becoming undercapitalized, an institution shall become subject to the provisions of Section 38 of the FDIA, which (i) restrict payment of capital distributions and management fees; (ii) require that the appropriate federal banking agency monitor the condition of the institution and its efforts to restore its capital; (iii) require submission of a capital restoration plan; (iv) restrict the growth of the institution's assets; and (v) require prior approval of certain expansion proposals. The appropriate federal banking agency for an undercapitalized institution also may take any number of discretionary supervisory actions if the agency determines that any of these actions is necessary to resolve the problems of the institution at the least possible long-term cost to the deposit insurance fund, subject in certain cases to specified procedures. These discretionary supervisory actions include: requiring the institution to raise additional capital; restricting transactions with affiliates; requiring divestiture of the institution or the sale of the institution to a willing purchaser; and any other supervisory action that the agency deems appropriate. These and additional mandatory and permissive supervisory actions may be taken with respect to significantly undercapitalized and critically undercapitalized institutions.
Additionally, under Section 11(c)(5) of the FDIA, a conservator or receiver may be appointed for an institution where: (i) an institution's obligations exceed its assets; (ii) there is substantial dissipation of the institution's assets or earnings as a result of any violation of law or any unsafe or unsound practice; (iii) the institution is in an unsafe or unsound condition; (iv) there is a willful violation of a cease-and-desist order; (v) the institution is unable to pay its obligations in the ordinary course of business; (vi) losses or threatened losses deplete all or substantially all of an institution's capital, and there is no reasonable prospect of becoming "adequately capitalized" without assistance; (vii) there is any violation of law or unsafe or unsound practice or condition that is likely to cause insolvency or substantial dissipation of assets or earnings, weaken the institution's condition, or otherwise seriously prejudice the interests of depositors
13
or the insurance fund; (viii) an institution ceases to be insured; (ix) the institution is undercapitalized and has no reasonable prospect that it will become adequately capitalized, fails to become adequately capitalized when required to do so, or fails to submit or materially implement a capital restoration plan; or (x) the institution is critically undercapitalized or otherwise has substantially insufficient capital.
Regulatory Enforcement Authority. Federal banking law grants substantial enforcement powers to federal banking regulators. This enforcement authority includes, among other things, the ability to assess civil money penalties, to issue cease-and-desist or removal orders and to initiate injunctive actions against banking organizations and institution-affiliated parties. In general, these enforcement actions may be initiated for violations of laws and regulations and unsafe or unsound practices. Other actions or inactions may provide the basis for enforcement action, including misleading or untimely reports filed with regulatory authorities.
As a result of the volatility and instability in the financial system during 2008 and 2009, the Congress, the bank regulatory authorities and other government agencies have called for or proposed additional regulation and restrictions on the activities, practices and operations of banks and their holding companies. While many of these proposals relate to institutions that have accepted investments from, or sold troubled assets to, the Department of the Treasury or other government agencies, or otherwise participate in government programs intended to promote financial stabilization, the Congress and the federal banking agencies have broad authority to require all banks and holding companies to adhere to more rigorous or costly operating procedures, corporate governance procedures, or to engage in activities or practices which they would not otherwise elect. Any such requirement could adversely affect the Company's business and results of operations.
FDIC Insurance Premiums. The FDIC maintains a risk-based assessment system for determining deposit insurance premiums. Four risk categories (I-IV), each subject to different premium rates, are established, based upon an institution's status as well capitalized, adequately capitalized or undercapitalized, and the institution's supervisory rating. The levels of rates are subject to periodic adjustment by the FDIC. Depository institutions will also pay premiums for the increased coverage provided by the FDIC.
Commencing in 2009, the premium rates increased by 7 basis points in each category for the first quarter of 2009. For the second quarter of 2009 and beyond, the FDIC established further changes in rates, and introduced three adjustments that can be made to an institution's initial base assessment rate: (1) a potential decrease for long-term unsecured debt, including senior and subordinated debt and, for small institutions, a portion of Tier 1 capital; (2) a potential increase for secured liabilities above a threshold amount; and (3) for non-Risk Category I institutions, a potential increase for brokered deposits above a threshold amount. The schedule for base assessment rates and potential adjustment is set forth in the following table. Note that these scheduled assessment rates have been modified under new rules (see below) approved in February 2011 and effective April 1, 2011.
| |
Risk Category I |
Risk Category II |
Risk Category III |
Risk Category IV |
||||
|---|---|---|---|---|---|---|---|---|
Initial Base Assessment Rate |
12 - 16 | 22 | 32 | 45 | ||||
Unsecured Debt Adjustment (added) |
(5) to 0 | (5) to 0 | (5) to 0 | (5) to 0 | ||||
Secured Liability Adjustment (added) |
0 to 8 | 0 to 11 | 0 to 16 | 0 to 22.5 | ||||
Brokered Deposit Adjustment (added) |
N/A | 0 to 10 | 0 to 10 | 0 to 10 | ||||
Total Base Assessment Rate |
7 to 24.0 | 17 to 43.0 | 27 to 58.0 | 43 to 77.5 |
In 2009, the FDIC imposed a 5 basis points special assessment on each insured depository institution's assets minus Tier 1 capital as of June 30, 2009, but no more than 10 basis points times the institution's assessment base for the second quarter of 2009, which was collected on September 30, 2009. This special assessment for the Bank amounted to $723 thousand. Additional special assessments may be imposed by the FDIC in the future.
14
Additionally, the Bank elected to participate in the FDIC program whereby noninterest bearing transaction account deposits were insured without limitation through June 2011. Until December 31, 2009, the Bank was required to pay an additional premium to the FDIC of 10 basis points on the amount of balances in noninterest bearing transaction accounts that exceed the existing deposit insurance limit of $250,000. During 2010, the fee was increased to 15 to 25 basis points, depending on the institution's risk category. The Bank's fee was 15 basis points.
In order to increase its liquidity, the FDIC required banks to prepay three years of estimated insurance premiums in December 2009. The Company paid the FDIC approximately $7.2 million in December 2009 for its estimated premiums for the subsequent three years. The prepaid premium payment is being applied to required calculated quarterly insurance assessments.
The Dodd-Frank Act permanently increases the maximum deposit insurance amount for banks, savings institutions and credit unions to $250,000 per depositor, and extends unlimited deposit insurance to non-interest bearing transaction accounts through December 31, 2012. The Dodd-Frank Act requires the FDIC to increase the reserve ratio of the Deposit Insurance Fund from 1.15% to 1.35% of insured deposits by 2020 and eliminates the requirement that the FDIC pay dividends to insured depository institutions when the reserve ratio exceeds certain thresholds. Effective one year from the date of enactment, the Dodd-Frank Act eliminates the federal statutory prohibition against the payment of interest on business checking accounts.
The Dodd-Frank Act also broadens the base for FDIC insurance assessments. Assessments will now be based on the average consolidated total assets less tangible equity capital of a financial institution. Effective April 1, 2011, the new schedule for base assessment rates and potential adjustments is as set forth in the following table.
| |
Risk Category I |
Risk Category II |
Risk Category III |
Risk Category IV |
Large and Highly Complex Institutions |
|||||
|---|---|---|---|---|---|---|---|---|---|---|
Initial Base Assessment Rate |
5 to 9 | 14 | 23 | 35 | 5 to 35 | |||||
Unsecured Debt Adjustment (added) |
(4.5) to 0 | (5) to 0 | (5) to 0 | (5) to 0 | (5) to 0 | |||||
Brokered Deposit Adjustment (added) |
N/A | 0 to 10 | 0 to 10 | 0 to 10 | 0 to 10 | |||||
Total Base Assessment Rate |
2.5 to 9 | 9 to 24 | 18 to 33 | 30 to 45 | 2.5 to 45 |
Consumer Financial Protection Bureau. The Dodd-Frank Act creates a new, independent federal agency called the Consumer Financial Protection Bureau ("CFPB") which is granted broad rulemaking, supervisory and enforcement powers under various federal consumer financial protection laws, including the Equal Credit Opportunity Act, Truth in Lending Act, Real Estate Settlement Procedures Act, Fair Credit Reporting Act, Fair Debt Collection Act, the Consumer Financial Privacy provisions of the Gramm-Leach-Bliley Act and certain other statutes. The CFPB will have examination and primary enforcement authority with respect to depository institutions with $10 billion or more in assets. Smaller institutions will be subject to rules promulgated by the CFPB but will continue to be examined and supervised by federal banking regulators for consumer compliance purposes. The CFPB will have authority to prevent unfair, deceptive or abusive practices in connection with the offering of consumer financial products. The Dodd-Frank Act authorizes the CFPB to establish certain minimum standards for the origination of residential mortgages including a determination of the borrower's ability to repay. In addition, Dodd-Frank will allow borrowers to raise certain defenses to foreclosure if they receive any loan other than a "qualified mortgage" as defined by the CFPB. The Dodd-Frank Act permits states to adopt consumer protection laws and standards that are more stringent than those adopted at the federal level and, in certain circumstances, permits state attorneys general to enforce compliance with both the state and federal laws and regulations.
It is difficult to predict at this time what specific impact the Dodd-Frank Act and the yet to be written implementing rules and regulations will have on community banks. However, it is expected that at a minimum they will increase our operating and compliance costs and could increase our interest expense.
15
An investment in our common stock involves a high degree of risk. Before making an investment decision, you should carefully read and consider the risk factors described below as well as the other information included in this report and other documents we file with the SEC, as the same may be updated from time to time. Any of these risks, if they actually occur, could materially adversely affect our business, financial condition, and results of operations. Additional risks and uncertainties not currently known to us or that we currently deem to be immaterial may also materially and adversely affect us. In any such case, you could lose all or a portion of your original investment.
The price of our common stock may fluctuate significantly, which may make it difficult for investors to resell shares of common stock at time or prices they find attractive.
Our stock price may fluctuate significantly as a result of a variety of factors, many of which are beyond our control. These factors include, in addition to those described above:
- •
- Actual or anticipated quarterly fluctuations in our operating results and financial condition;
- •
- Changes in financial estimates or publication of research reports and recommendations by financial analysts or actions
taken by rating agencies with respect to us or other financial institutions;
- •
- Speculation in the press or investment community generally or relating to our reputation or the financial services
industry;
- •
- Strategic actions by us or our competitors, such as acquisitions, restructurings, dispositions or financings;
- •
- Fluctuations in the stock price and operating results of our competitors;
- •
- Future sales of our equity or equity-related securities;
- •
- Proposed or adopted regulatory changes or developments;
- •
- Anticipated or pending investigations, proceedings, or litigation that involve or affect us;
- •
- Domestic and international economic factors unrelated to our performance; and
- •
- General market conditions and, in particular, developments related to market conditions for the financial services industry.
In addition, in recent years, the stock market in general has experienced extreme price and volume fluctuations. This volatility has had a significant effect on the market price of securities issued by many companies, including for reasons unrelated to their operating performance. These broad market fluctuations may adversely affect our stock price, notwithstanding our operating results. We expect that the market price of our common stock will continue to fluctuate and there can be no assurances about the levels of the market prices for our common stock.
Trading in the common stock has been light. As a result, shareholders may not be able to quickly and easily sell their common stock, particularly in large quantities.
Although our common stock is listed for trading on The NASDAQ Capital Market and a number of brokers offer to make a market in the common stock on a regular basis, trading volume to date has been limited, averaging approximately 46,500 shares per day during 2010, and there can be no assurance that a continuously active and liquid market for the common stock can be maintained. As a result, shareholders may find it difficult to sell a significant number of shares at the prevailing market price.
16
We are not currently able to pay dividends on the common stock, or repurchase shares of common stock.
Until the earlier of December 5, 2011 and the date on which the Treasury no longer holds any shares of our Series A Preferred Stock, our ability to declare or pay dividends or distributions on, or purchase, redeem or otherwise acquire for consideration, shares of common stock is subject to restrictions, including a restriction against paying any dividends on the common stock without Treasury consent. In addition, our ability to declare or pay dividends or distributions on, or repurchase, redeem or otherwise acquire for consideration, shares of common stock is subject to restrictions in the event that we fail to declare and pay full dividends (or declare and set aside a sum sufficient for payment thereof) on the Series A Preferred Stock. Even if we were permitted to pay dividends under the terms of the Series A Preferred Stock, our ability to pay dividends would be dependent on the performance of the Bank, our principal operating subsidiary, and by the capital requirements of our subsidiaries. See "Market for Common Stock and Dividends" at page 26 for additional information on limitations of our ability to pay dividends.
We may issue additional equity securities, or engage in other transactions which dilute our book value or affect the priority of the common stock, which may adversely affect the market price of our common stock.
Our board of directors may determine from time to time that we need to raise additional capital by issuing additional shares of our common stock or other securities. We are not restricted from issuing additional shares of common stock, including securities that are convertible into or exchangeable for, or that represent the right to receive, common stock. Because our decision to issue securities in any future offering will depend on market conditions and other factors beyond our control, we cannot predict or estimate the amount, timing or nature of any future offerings, or the prices at which such offerings may be affected. Such offerings, including an offering to fund the redemption of our Series A Preferred Stock and related Warrants, could be dilutive to common stockholders. New investors also may have rights, preferences and privileges that are senior to, and that adversely affect, our then current common shareholders. Additionally, if we raise additional capital by making additional offerings of debt or preferred equity securities, upon liquidation, holders of our debt securities and shares of preferred stock, and lenders with respect to other borrowings, will receive distributions of our available assets prior to the holders of our common stock. Additional equity offerings may dilute the holdings of our existing stockholders or reduce the market price of our common stock, or both. Holders of our common stock are not entitled to preemptive rights or other protections against dilution.
Directors and officers of the Company own approximately 15.5% of the outstanding common stock. As a result of their combined ownership, they could make it more difficult to obtain approval for some matters submitted to shareholder vote, including acquisitions of the Company. The results of the vote may be contrary to the desires or interests of the public shareholders.
Directors and executive officers of the Company and their affiliates own approximately 15.5% of the outstanding shares of common stock, and combined with directors of the Bank, are believed to own approximately 16.6% of the currently outstanding common stock, excluding in each case shares which may be acquired upon the exercise of options. By voting against a proposal submitted to shareholders, the directors and officers, as a group, may be able to make approval more difficult for proposals requiring the vote of shareholders, such as some mergers, share exchanges, asset sales, and amendments to the articles of incorporation.
Substantial regulatory limitations on changes of control and anti-takeover provisions of Maryland law may make it more difficult for you to receive a change in control premium.
With certain limited exceptions, federal regulations prohibit a person or company or a group of persons deemed to be "acting in concert" from, directly or indirectly, acquiring more than 10% (5% if the
17
acquirer is a bank holding company) of any class of our voting stock or obtaining the ability to control in any manner the election of a majority of our directors or otherwise direct the management or policies of our company without prior notice or application to and the approval of the Federal Reserve Board. There are comparable prior approval requirements for changes in control under Maryland law. Also, Maryland corporate law contains several provisions that may make it more difficult for a third party to acquire control of the Company without the approval of the Company's board of directors, and may make it more difficult or expensive for a third party to acquire a majority of our outstanding common stock.
The current economic environment poses significant challenges for us and could adversely affect our financial condition and results of operations.
The Company is operating in a challenging and uncertain economic environment. Financial institutions continue to be affected by sharp declines in the real estate market and constrained financial markets. Dramatic declines in the housing market over the past years, with falling home prices and high levels of foreclosures and unemployment, have resulted in significant write-downs of asset values by financial institutions. Continued declines in real estate values, home sales volumes, and financial stress on borrowers as a result of the uncertain economic environment could have an adverse effect on our borrowers or their customers, which could adversely affect our financial condition and results of operations. A worsening of these conditions would likely exacerbate the adverse effects on us and others in the financial institutions industry. For example, further deterioration in local economic conditions in our market could drive losses beyond that which is provided for in our allowance for loan losses. The Company may also face the following risks in connection with these events:
- •
- Economic conditions that negatively affect housing prices and the job market have resulted, and may continue to result, in
a deterioration in credit quality of our loan portfolios, and such deterioration in credit quality has had, and could continue to have, a negative impact on our business;
- •
- Market developments may affect consumer confidence levels and may cause adverse changes in payment patterns, causing
increases in delinquencies and default rates on loans and other credit facilities;
- •
- The methodologies we use to establish our allowance for loan losses may no longer be reliable because they rely on complex
judgments, including forecasts of economic conditions, which may no longer be capable of accurate estimation;
- •
- Continued turmoil in the market, and loss of confidence in the banking system, could require the Bank to pay higher
interest rates to obtain deposits to meet the needs of its depositors and borrowers, resulting in reduced margin and net interest income. If conditions worsen significantly, it is possible that banks
such as the Bank may be unable to meet the needs of their depositors and borrowers, which could, in the worst case, result in the Bank being placed into receivership; and
- •
- Compliance with increased regulation of the banking industry may increase our costs, limit our ability to pursue business opportunities, and divert management efforts.
If these conditions or similar ones continue to exist or worsen, the Company could experience continuing or increased adverse effects on its financial condition.
Our financial condition and results of operations would be adversely affected if our allowance for loan losses is not sufficient to absorb actual losses or if we are required to increase our allowance for loan losses.
Historically, we have enjoyed a relatively low level of nonperforming assets and net charge-offs, both in absolute dollars, as a percentage of loans and as compared to many of our peer institutions. As a result of this historical experience, we have incurred a relatively lower loan loss provision expense, which has positively impacted our earnings. However, experience in the banking industry indicates that a portion of
18
our loans will become delinquent, that some of our loans may only be partially repaid or may never be repaid and we may experience other losses for reasons beyond our control. Despite our underwriting criteria and historical experience, we may be particularly susceptible to losses due to: (1) the geographic concentration of our loans, (2) the concentration of higher risk loans, such as commercial real estate, construction and commercial and industrial loans, (3) the relative lack of seasoning of certain of our loans. As a result, we may not be able to maintain our relatively low levels of nonperforming assets and charge-offs. Although we believe that our allowance for loan losses is maintained at a level adequate to absorb any inherent losses in our loan portfolio, these estimates of loan losses are necessarily subjective and their accuracy depends on the outcome of future events. If we need to make significant and unanticipated increases in our loss allowance in the future, our results of operations and financial condition would be materially adversely affected at that time.
While we strive to carefully monitor credit quality and to identify loans that may become nonperforming, at any time there are loans included in the portfolio that will result in losses, but that have not been identified as nonperforming or potential problem loans. We cannot be sure that we will be able to identify deteriorating loans before they become nonperforming assets, or that we will be able to limit losses on those loans that are identified. As a result, future additions to the allowance may be necessary.
Economic conditions and increased uncertainty in the financial markets could adversely affect ability to accurately assess our allowance for credit losses. Our ability to assess the creditworthiness of our customers or to estimate the values of our assets and collateral for loans will be reduced if the models and approaches we use become less predictive of future behaviors, valuations, assumptions or estimates. We estimate losses inherent in our credit exposure, the adequacy of our allowance for loan losses and the values of certain assets by using estimates based on difficult, subjective, and complex judgments, including estimates as to the effects of economic conditions and how these economic conditions might affect the ability of our borrowers to repay their loans or the value of assets.
Our continued growth depends on our ability to meet minimum regulatory capital levels. Growth and shareholder returns may be adversely affected if sources of capital are not available to help us meet them.
As we grow, we will have to maintain our regulatory capital levels at or above the required minimum levels. If earnings do not meet our current estimates, if we incur unanticipated losses or expenses, or if we grow faster than expected, we may need to obtain additional capital sooner than not have continued access to sufficient capital, we may be required to reduce our level of assets or reduce our rate of growth in order to maintain regulatory compliance. Under those circumstances net income and the rate of growth of net income may be adversely affected. Additional issuances of equity securities could have a dilutive effect on existing shareholders.
The Company is subject to additional uncertainties, and potential additional regulatory or compliance burdens, as a result of its participation it the Capital Purchase Program.
The Company accepted an investment of $38.235 million from the Treasury under the Capital Purchase Program. The Stock Purchase Agreement executed by the Company (and all other participating institutions) and Treasury, provides that Treasury may unilaterally amend the agreement to the extent required to comply with any changes after the execution in applicable federal statutes. As a result of this provision, the Treasury and Congress may impose additional requirements or restrictions on the Company and the Bank in respect of reporting, compliance, corporate governance, executive or employee compensation, dividend payments, stock repurchases, lending or other business practices, capital requirements or other matters. The Company and Bank may be required to expend additional resources in order to comply with these requirements. Such additional requirements could impair the Company's ability to compete with institutions that are not subject to the restrictions because they did not accept an investment from the Treasury. To the extent that additional restrictions or limitations on employee compensation are imposed, such as those contained in American Reinvestment and Recovery Act of 2009
19
("ARRA") and the regulations issued in June 2009, the Company and the Bank may be less competitive in attracting and retaining successful incentive compensation based lenders and customer relations personnel, or senior executive officers.
Additionally, the ability of the Congress to utilize the amendment provisions to effect political or public relations goals could result in the Company and the Bank being subjected to additional burdens as a result of public perceptions of issues relating to the largest banks, and which are not applicable to community oriented institutions such as the Company. The Company may be disadvantaged as a result of these uncertainties.
As a result of the issuance of the Series A Preferred Stock to the Treasury, the Company is required to comply with certain restrictions on executive and employee compensation included in Emergency Economic Stimulus Act of 2008 ("EESA"), as amended. Certain of these provisions could limit the amount and the tax deductibility of compensation the Company pays to its executive officers, and could have an adverse affect on the ability of the Company to compete for and retain employees and senior executive officers.
Our results of operations, financial condition and the value of our shares may be adversely affected if we are not able to maintain our historical growth rate.
Since opening for business in 1998, our asset level has increased rapidly, including a 16% increase in 2010. Over the past five fiscal years (2006 - 2010), our net income has increased at a compounded annual rate of 17%, with an increase in net income of 60% in 2010. We may not be able to achieve comparable results in future years. As our asset size and earnings increase, it may become more difficult to achieve high rates of increase in assets and earnings. Additionally, it may become more difficult to achieve continued improvements in our expense levels and efficiency ratio. We may not be able to maintain the relatively low levels of nonperforming assets that we have experienced. Declines in the rate of growth of income or assets or deposits, and increases in operating expenses or nonperforming assets may have an adverse impact on the value of the common stock.
Higher FDIC deposit insurance premiums and assessments could adversely affect our financial condition.
FDIC insurance premiums increased substantially in 2009, due primarily to special assessments. While the revised rules effective April 1, 2011 are expected to reduce the assessment levels for the Bank in 2011, FDIC premiums remain an area where expenses could increase in the future, and may be subject to volatility. A large number of bank failures has significantly depleted the deposit insurance fund and reduced the ratio of reserves to insured deposits. During 2009, the FDIC adopted a revised risk-based deposit insurance assessment schedule which raised deposit insurance premiums, and it implemented a five basis point special assessment, collected on September 30, 2009. Additional special assessments may be imposed by the FDIC in the future. The Dodd-Frank Act requires the FDIC to increase the reserve ratio of the Deposit Insurance Fund from 1.15% to 1.35% of insured deposits by 2020 and eliminates the requirement that the FDIC pay dividends to insured depository institutions when the reserve ratio exceeds certain thresholds. These actions could significantly increase our noninterest expense for the foreseeable future. There is no assurance that the Company will be able to reflect all or any portion of these premium costs in the rates it pays depositors.
We may not be able to successfully manage continued growth.
We intend to seek further growth in the level of our assets and deposits and the number of our branches, both within our existing footprint and possibly to expand our footprint in the Maryland and Virginia suburbs, and in Washington, D.C. We may not be able to manage increased levels of assets and liabilities, and an expanded branch system, without increased expenses and higher levels of nonperforming
20
assets. We may be required to make additional investments in equipment and personnel to manage higher asset levels and loan balances and a larger branch network, which may adversely impact earnings, shareholder returns and our efficiency ratio. Increases in operating expenses or nonperforming assets may have an adverse impact on the value of our common stock.
We may face risks with respect to future expansion or acquisition activity.
We regularly seek to expand our banking operations through de novo branching or acquisition activities, and expect to continue to explore such opportunities. We cannot be certain that any expansion activity, through de novo branching, acquisition of branches of another financial institution or a whole institution, or acquisition of nonbanking financial service companies, will prove profitable or will increase shareholder value. The success of any acquisition will depend, in part, on our ability to realize the estimated cost savings and revenue enhancements from combining the businesses of the Company and the target company. Our ability to realize increases in revenue will depend, in part, on our ability to retain customers and employees, and to capitalize on existing relationships for the provision of additional products and services. If our estimates turn out to be incorrect or we are not able to successfully combine companies, the anticipated cost savings and increased revenues may not be realized fully or at all, or may take longer to realize than expected. It is possible that the integration process could result in the loss of key employees, the disruption of each company's ongoing business or inconsistencies in standards, controls, procedures and policies that adversely affect our ability to maintain relationships with clients and employees or to achieve the anticipated benefits of the merger. As with any combination of banking institutions, there also may be disruptions that cause us to lose customers or cause customers to withdraw their deposits from our banks. Customers may not readily accept changes to their banking arrangements that we make as part of or following an acquisition. Additionally, the value of an acquisition to the Company is dependent on our ability to successfully identify and estimate the magnitude of any asset quality issues of acquired companies.
Our concentrations of loans may create a greater risk of loan defaults and losses.
A substantial portion of our loans are secured by real estate in the Washington, D.C. metropolitan area, and substantially all of our loans are to borrowers in that area. We also have a significant amount of real estate construction loans and land related loans for residential and commercial developments. At December 31, 2010, 73% of our loans were secured by real estate, primarily commercial real estate. Management believes that the commercial real estate concentration risk is mitigated by diversification among the types and characteristics of real estate collateral properties, sound underwriting practices, and ongoing portfolio monitoring and market analysis. Of these loans, $308.1 million, or 25% were construction and land development loans. An additional $410.7 million, or 25% of portfolio loans, were commercial and industrial loans which are not secured by real estate. These categories of loans generally have a higher risk of default than other types of loans, such as single family residential mortgage loans. The repayments of these loans often depends on the successful operation of a business or the sale or development of the underlying property and as a result, are more likely to be adversely affected by adverse conditions in the real estate market or the economy in general. While we believe that our loan portfolio is well diversified in terms of borrowers and industries, these concentrations expose us to the risk that adverse developments in the real estate market, or in the general economic conditions in the Washington, D.C. metropolitan area, could increase the levels of nonperforming loans and charge-offs, and reduce loan demand. In that event, we would likely experience lower earnings or losses. Additionally, if, for any reason, economic conditions in our market area deteriorate, or there is significant volatility or weakness in the economy or any significant sector of the area's economy, our ability to develop our business relationships may be diminished, the quality and collectability of our loans may be adversely affected, the value of collateral may decline and loan demand may be reduced.
21
Commercial, commercial real estate and construction loans tend to have larger balances than single family mortgages loans and other consumer loans. Because the loan portfolio contains a significant number of commercial and commercial real estate and construction loans with relatively large balances, the deterioration of one or a few of these loans may cause a significant increase in nonperforming assets. An increase in nonperforming loans could result in: a loss of earnings from these loans, an increase in the provision for loan losses, or an increase in loan charge-offs, which could have an adverse impact on our results of operations and financial condition.
Further, under guidance adopted by the federal banking regulators, banks which have concentrations in construction, land development or commercial real estate loans (other than loans for majority owner occupied properties) would be expected to maintain higher levels of risk management and, potentially, higher levels of capital. It is possible that we may be required to maintain higher levels of capital than we would otherwise be expected to maintain as a result of our levels of construction, development and commercial real estate loans, which may require us to obtain additional capital sooner than we would otherwise seek it, which may reduce shareholder returns.
Additionally, through ECV, we provide subordinated financing for the acquisition, development and construction of real estate or other projects. These subordinated financings and the business of ECV will generally entail a higher risk profile (including lower priority and higher loan to value ratios) than loans made by the Bank. A portion of the amount which the Company expects to receive for such loans will be payments based on the success, sale or completion of the underlying project, and as such the income of the Company may be more volatile from period to period, based on the status of such projects. The Company may not be able to successfully operate or manage the business of providing higher loan to value financing.
Changes in interest rates and other factors beyond our control could have an adverse impact on our financial performance and results.
Our operating income and net income depend to a great extent on our net interest margin, i.e., the difference between the interest yields we receive on loans, securities and other interest bearing assets and the interest rates we pay on interest bearing deposits and other liabilities. Net interest margin is affected by changes in market interest rates, because different types of assets and liabilities may react differently, and at different times, to market interest rate changes. When interest bearing liabilities mature or reprice more quickly than interest earning assets in a period, an increase in market rates of interest could reduce net interest income. Similarly, when interest earning assets mature or reprice more quickly than interest bearing liabilities, falling interest rates could reduce net interest income. These rates are highly sensitive to many factors beyond our control, including competition, general economic conditions and monetary and fiscal policies of various governmental and regulatory authorities, including the Federal Reserve Board.
We attempt to manage our risk from changes in market interest rates by adjusting the rates, maturity, repricing, and balances of the different types of interest earning assets and interest bearing liabilities, but interest rate risk management techniques are not exact. As a result, a rapid increase or decrease in interest rates could have an adverse effect on our net interest margin and results of operations. At December 31, 2010, our cumulative net asset sensitive twelve month gap position was 12.7% of total assets, which does not include adjustment for loans currently at their floor rates. As such, we expect modest decreases of approximately minus 0.6% and minus 1.3%, respectively, in projected net interest income and net income over a twelve month period resulting from a 100 basis point increase in rates, as loans currently at floor rates which are above the calculated contractual rate do not adjust upon a rate increase. The results of our interest rate sensitivity simulation model depend upon a number of assumptions which may not prove to be accurate. There can be no assurance that we will be able to successfully manage our interest rate risk. Increases in market rates and adverse changes in the local residential real estate market, the general economy or consumer confidence would likely have a significant adverse impact on our noninterest income, as a result of reduced demand for residential mortgage loans, which we make on a pre-sold basis.
22
Adverse changes in the real estate market in our market area could also have an adverse affect on our cost of funds and net interest margin, as we have a large amount of noninterest bearing deposits related to real estate sales and development. While we expect that we would be able to replace the liquidity provided by these deposits, the replacement funds would likely be more costly, negatively impacting earnings.
Changes in laws, including those that permit banks to pay interest on checking and demand deposit accounts established by businesses commencing in July 2011, could have a significant negative effect on net interest income, net income, net interest margin, return on assets and return on equity. At December 31, 2010, 23.2% of our deposits were noninterest bearing demand deposits.
We may not be able to successfully compete with others for business.
The Washington, D.C. metropolitan statistical area in which we operate is considered highly attractive from an economic and demographic viewpoint, and is a highly competitive banking market. We compete for loans, deposits, and investment dollars with numerous regional and national banks, online divisions of out-of-market banks, and other community banking institutions, as well as other kinds of financial institutions and enterprises, such as securities firms, insurance companies, savings associations, credit unions, mortgage brokers, and private lenders. Many competitors have substantially greater resources than us, and operate under less stringent regulatory environments. The differences in resources and regulations may make it harder for us to compete profitably, reduce the rates that we can earn on loans and investments, increase the rates we must offer on deposits and other funds, and adversely affect our overall financial condition and earnings.
The Company has been very successful in developing new customer relationships by capitalizing on the reluctance of many large regional and nationwide banks to lend over the past several years, and the demise of the commercial mortgage backed securities market and other nonbank sources of financing. These new relationships have resulted in significant increases in both loans and deposits, and have contributed to increased earnings. As the economy improves and these competitors, many of which have access to cheaper sources of funding than the Company, recommence lending, we may not be able to retain the loans and deposits produced by these new relationships. While we believe that our relationship banking model will enable us to keep a significant percentage of these new relationships, there can be no assurance that we will be able to do so, that we would be able to maintain favorable pricing, margins and asset quality, or that we will be able to grow at the same rate we did when such alternative financing was not widely available.
Government regulation will significantly affect the Bank's business, and may result in higher costs and lower shareholder returns.
The banking industry is heavily regulated. Banking regulations are primarily intended to protect the federal deposit insurance funds and depositors, not shareholders. The Company and Bank are regulated and supervised by the Maryland Department of Financial Regulation, the Federal Reserve Board and the FDIC. The burden imposed by federal and state regulations puts banks at a competitive disadvantage compared to less regulated competitors such as finance companies, mortgage banking companies and leasing companies. Changes in the laws, regulations and regulatory practices affecting the banking industry may increase our costs of doing business or otherwise adversely affect us and create competitive advantages for others. Regulations affecting banks and financial services companies undergo continuous change, and we cannot predict the ultimate effect of these changes, which could have a material adverse effect on our profitability or financial condition. Federal economic and monetary policy may also affect our ability to attract deposits and other funding sources, make loans and investments, and achieve satisfactory interest spreads.
23
ITEM 1B. UNRESOLVED STAFF COMMENTS
None
The main banking office and the executive offices for the Bank and the Company are located at 7815 Woodmont Avenue, Bethesda, Maryland, in a 12,000 square foot, two story masonry structure (plus lower level), with parking. The Company leases the building under a five year lease option which expires in March 2013. The Silver Spring office of the Bank is located at 8665-B Georgia Avenue, Silver Spring, Maryland and consists of 3,635 square feet. The property is currently occupied under a lease, which expires in June 2016. The Rockville office is located at 110 North Washington Street, Rockville, Maryland, and consists of 2,000 square feet. The property is currently occupied under a five year lease option which expires in June 2013. The Shady Grove office is located at 9600 Blackwell Road, Suite 200, Rockville, Maryland, and consists of 2,326 square feet. The property is currently occupied under a ten year lease, which expires in January 2012. The K Street office is located at 2001 K Street N.W., Washington, D.C. and consists of 4,154 square feet on the first floor and 2,978 square feet of additional office space on the second floor. The property is currently occupied under a ten year lease, which expires in February 2021. The DuPont Circle office is located at 1228 Connecticut Avenue, N.W., Washington, D.C. and consists of 2,784 square feet. The property is currently occupied under a ten year lease, which expires in May 2014. The McPherson Square office is located at 1425 K Street, N.W., Washington, D.C. and consists of 5,199 square feet. The property is currently occupied under a ten year lease, which expires in January 2015. The Chevy Chase office is located at 15 Wisconsin Circle, Chevy Chase, Maryland and consists of 4,276 square feet. The property is currently occupied under a ten year lease, which expires in May 2016. The Rollins Avenue office is located at 130 Rollins Avenue, Rockville, Maryland and consists of 2,851 square feet. The property is currently occupied under a ten year lease, which expires in June 2017. The Tysons Corner office is located at 8601 Westwood Center Drive, Vienna, Virginia and consists of 4,688 square feet. The property is currently occupied under a ten year lease, which expires in October 2016. The Georgetown office is located at 1044 Wisconsin Avenue N.W, Washington, D.C. and consists of 2,700 square feet. The property is currently occupied under a ten year lease, which expires in January 2016. The Potomac office is located at 12505 Park Potomac Avenue, Potomac, Maryland, and consists of 4,347 square feet. The property is currently occupied under a ten year lease, which expires in September 30, 2019. The Gallery Place office is located at 700 7th Street NW. Washington, D.C. and consists of 1,845 square feet. The property is currently occupied under a ten year lease, which expires on January 21, 2021.
In January 2002, the Company occupied an office facility in Bethesda at 7768 Woodmont Avenue under a ten year lease which expires in December 2011. Additional contiguous space at this location has been leased and was incorporated into the existing lease. The current space consists of 7,906 square feet. This facility is currently under three sub-lease arrangements which run concurrent to the lease expiration in December 2011.
In June 2003, the Company occupied an additional office facility in Bethesda at 7819 Norfolk Avenue, consisting of 2,820 square feet under a ten year lease with options which expire in May 2013. This facility is currently under a sub-lease arrangement which runs concurrent to the lease expiration in May 2013.
In April 2004, the Company occupied an operations center at 11961 Tech Road, Silver Spring, Maryland, consisting of 9,172 square feet. The property is currently occupied under a seven year lease with options which expires in December 2015. In February 2008, the Company leased additional space amounting to approximately 2,000 square feet at this facility with terms that are co-terminus with the existing lease.
In November 2006, the Company entered into a lease for additional office space at 7830 Old Georgetown Road, Bethesda, Maryland, consisting of 14,778 square feet under a ten year lease which expires in December 2016. The Company completed a fit-up of the space for lending and administrative
24
personnel and commenced occupancy in February 2007. In October 2008, the Company leased approximately 1,115 additional square feet at this facility for a term which is co-terminus with the existing lease.
In May 2009, the Company expanded its executive offices for the Bank and the Company by leasing approximately 7,400 square feet in a mixed use building adjacent to its headquarters building in Bethesda, Maryland at 7809 Woodmont Avenue. The minimum lease commitment is approximately $3.0 million. The property is currently occupied under a lease, which expires in September 30, 2015.
In November 2009, the Bank entered into a lease for a new branch office in Potomac, Maryland. The initial lease term is 10 years and the minimum lease obligation is approximately $3.7 million.
From time to time the Company is a participant in various legal proceedings incidental to its business. In the opinion of management, the liabilities (if any) resulting from such legal proceedings will not have a material effect on the financial position of the Company.
25
PART II
ITEM 5. MARKET FOR COMMON STOCK AND DIVIDENDS
Market for Common Stock. The Company's common stock is listed for trading on the NASDAQ Capital Market under the symbol "EGBN." Over the twelve month period ended December 31, 2010, the average daily trading volume amounted to approximately 46,500 shares, an increase from approximately 38,400 shares over the twelve month period ended December 31, 2009. No assurance can be given that a highly active trading market will develop or can be maintained. The following table sets forth the high and low sale prices for the common stock during each calendar quarter during the last two fiscal years. No dividends were declared during such periods. As of February 28, 2011, there were 19,728,433 shares of common stock outstanding, held by approximately 2,450 beneficial shareholders, including approximately 962 shareholders of record.
| |
2010 | 2009 | |||||||||||
|---|---|---|---|---|---|---|---|---|---|---|---|---|---|
Quarter
|
High | Low | High | Low | |||||||||
First |
$ | 12.98 | $ | 9.90 | $ | 7.10 | $ | 5.36 | |||||
Second |
$ | 14.49 | $ | 11.06 | $ | 11.20 | $ | 6.15 | |||||
Third |
$ | 12.25 | $ | 10.25 | $ | 10.19 | $ | 7.70 | |||||
Fourth |
$ | 14.89 | $ | 10.95 | $ | 11.00 | $ | 8.89 | |||||
Dividends. The Company has not paid a cash dividend on the common stock since the second quarter of 2008, after which the dividend was discontinued in order to conserve capital. The Company declared a 10% stock dividend on the common stock on October 1, 2008.
The resumption of payment of a cash dividend on common stock is prohibited for the first three years that the Series A Preferred Stock is outstanding, unless all of the Series A Preferred Stock is redeemed. Any resumption of cash dividends on the common stock will also depend largely upon the ability of the Bank, the Company's principal operating business, to declare and pay dividends to the Company. Resumption of dividends on the common stock will also depend upon the Bank's earnings, financial condition, and need for funds, as well as governmental policies and regulations applicable to the Company and the Bank.
Regulations of the Federal Reserve Board and Maryland law place limits on the amount of dividends the Bank may pay to the Company without prior approval. Prior regulatory approval is required to pay dividends which exceed the Bank's net profits for the current year plus its retained net profits for the preceding two calendar years, less required transfers to surplus. Under Maryland law, dividends may only be paid out of retained earnings. State and federal bank regulatory agencies also have authority to prohibit a bank from paying dividends if such payment is deemed to be an unsafe or unsound practice, and the Federal Reserve Board has the same authority over bank holding companies. At December 31, 2010 the Bank could pay dividends to the Company to the extent of its earnings so long as it maintained required capital ratios.
The Federal Reserve Board has established guidelines with respect to the maintenance of appropriate levels of capital by registered bank holding companies. Compliance with such standards, as presently in effect, or as they may be amended from time to time, could possibly limit the amount of dividends that the Company may pay in the future. In 1985, the Federal Reserve Board issued a policy statement on the payment of cash dividends by bank holding companies. In the statement, the Federal Reserve Board expressed its view that a holding company experiencing earnings weaknesses should not pay cash dividends exceeding its net income, or which could only be funded in ways that weaken the holding company's financial health, such as by borrowing. As a depository institution, the deposits of which are insured by the FDIC, the Bank may not pay dividends or distribute any of its capital assets while it remains in default on any assessment due the FDIC. The Bank currently is not in default under any of its obligations to the
26
FDIC. Refer to above discussion on conditions precedent to resuming the payment of the cash common stock dividend.
Issuer Repurchase of Common Stock. No shares of the Company's Common Stock were repurchased by or on behalf of the Company during 2010 or 2009.
Internet Access to Company Documents. The Company provides access to its SEC filings through its web site at www.eaglebankcorp.com by linking to the SEC's web site. After accessing the web site, the filings are available upon selecting "Investor Relations SEC Filings." Reports available include the annual report on Form 10-K, quarterly reports on Form 10-Q, current reports on Form 8-K, and all amendments to those reports as soon as reasonably practicable after the reports are electronically filed with or furnished to the SEC.
Securities Authorized for Issuance Under Equity Compensation Plans. The following table sets forth information regarding outstanding options and other rights to purchase or acquire common stock granted under the Company's compensation plans as of December 31, 2010:
Plan category
|
Number of securities to be issued upon exercise of outstanding options, warrants and rights |
Weighted average exercise price of outstanding options, warrants and rights |
Number of securities remaining available for future issuance under equity compensation plans excluding securities reflected in column (a) |
||||||||
|---|---|---|---|---|---|---|---|---|---|---|---|
| |
(a) |
(b) |
(c) |
||||||||
Equity compensation plans approved by security holders(1) |
1,148,871 | $ | 10.84 | 507,786 | (2) | ||||||
Equity compensation plans not approved by security holders |
0 | 0 | 0 | ||||||||
Total |
1,148,871 | $ | 10.84 | 507,786 | |||||||
- (1)
- Consists
of the Company's 2006 Stock Plan, 1998 Stock Option Plan and the Fidelity Long Term Incentive Plans. For additional information, see Note 13
to the Consolidated Financial Statements.
- (2)
- Shares available for issuance under the 2006 Stock Plan.
27
Stock Price Performance. The following table compares the cumulative total return on a hypothetical investment of $100 in the Company's common stock on December 31, 2005 through December 31, 2010, with the hypothetical cumulative total return on the NASDAQ Stock Market Index (U.S. Companies) and the NASDAQ Bank Index for the comparable period, including reinvestment of dividends.
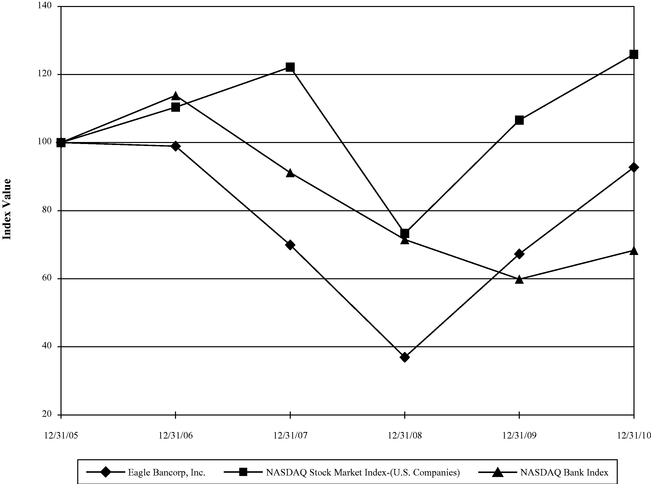
| |
Period Ending | ||||||||||||||||||
|---|---|---|---|---|---|---|---|---|---|---|---|---|---|---|---|---|---|---|---|
Index
|
12/31/05 | 12/31/06 | 12/31/07 | 12/31/08 | 12/31/09 | 12/31/10 | |||||||||||||
Eagle Bancorp, Inc. |
100.00 | 98.94 | 69.93 | 36.95 | 67.29 | 92.74 | |||||||||||||
NASDAQ Stock Market Index—(U.S. Companies) |
100.00 | 110.39 | 122.15 | 73.32 | 106.57 | 125.91 | |||||||||||||
NASDAQ Bank Index |
100.00 | 113.82 | 91.16 | 71.52 | 59.87 | 68.34 | |||||||||||||
28
ITEM 6. SELECTED FINANCIAL DATA
The following table shows selected historical consolidated financial data for the Company. It should be read in conjunction with the Company's audited Consolidated Financial Statements and Notes thereto appearing elsewhere in this report.
Use of Non-GAAP Financial Measures
The information set forth below contains certain financial information determined by methods other than in accordance with generally accepted accounting principles in the United States ("GAAP"). These non-GAAP financial measures are "tangible common equity," and "tangible book value per common share." Our management uses these non-GAAP measures in its analysis of our performance because it believes these measures are material and will be used as a measure of our performance by investors.
These disclosures should not be considered in isolation or as a substitute for results determined in accordance with GAAP, and are not necessarily comparable to non-GAAP performance measures which may be presented by other bank holding companies. Management compensates for these limitations by providing detailed reconciliations between GAAP information and the non-GAAP financial measures. A reconciliation table is set forth below following the selected historical consolidated financial data.
| |
Year ended December 31, | |||||||||||||||||||
|---|---|---|---|---|---|---|---|---|---|---|---|---|---|---|---|---|---|---|---|---|
| (dollars in thousands except per share data) |
2010 | 2009 | 2008 | 2007 | 2006 | 2005 | ||||||||||||||
Balance Sheet—Period End |
||||||||||||||||||||
Securities |
$ | 237,576 | $ | 245,644 | $ | 169,079 | $ | 87,117 | $ | 91,140 | $ | 68,050 | ||||||||
Loans held for sale |
80,571 | 1,550 | 2,718 | 2,177 | 2,157 | 2,924 | ||||||||||||||
Loans |
1,675,500 | 1,399,311 | 1,265,640 | 716,677 | 625,773 | 549,212 | ||||||||||||||
Allowance for credit losses |
24,754 | 20,619 | 18,403 | 8,037 | 7,373 | 5,985 | ||||||||||||||
Intangible assets, net |
4,188 | 4,379 | 2,533 | 236 | 255 | 168 | ||||||||||||||
Total assets |
2,089,370 | 1,805,504 | 1,496,827 | 846,400 | 773,451 | 672,252 | ||||||||||||||
Deposits |
1,726,798 | 1,460,274 | 1,129,380 | 630,936 | 628,515 | 568,893 | ||||||||||||||
Borrowings |
146,884 | 150,090 | 215,952 | 128,408 | 68,064 | 32,139 | ||||||||||||||
Total liabilities |
1,884,654 | 1,617,183 | 1,354,456 | 765,234 | 700,535 | 607,288 | ||||||||||||||
Preferred stockholders' equity |
22,582 | 22,612 | 36,312 | — | — | — | ||||||||||||||
Common stockholders' equity |
182,134 | 165,709 | 106,059 | 81,166 | 72,916 | 64,964 | ||||||||||||||
Total stockholders' equity |
204,716 | 188,321 | 142,371 | 81,166 | 72,916 | 64,964 | ||||||||||||||
Tangible common equity(1) |
177,946 | 161,330 | 103,526 | 80,930 | 72,661 | 64,796 | ||||||||||||||
Statement of Operations |
||||||||||||||||||||
Interest income |
$ | 96,658 | $ | 84,338 | $ | 65,657 | $ | 57,077 | $ | 50,318 | $ | 36,726 | ||||||||
Interest expense |
19,832 | 24,809 | 23,676 | 23,729 | 17,880 | 8,008 | ||||||||||||||
Provision for credit losses |
9,308 | 7,669 | 3,979 | 1,643 | 1,745 | 1,843 | ||||||||||||||
Noninterest income |
9,242 | 7,297 | 4,366 | 5,186 | 3,846 | 3,998 | ||||||||||||||
Noninterest expense |
51,005 | 42,773 | 30,817 | 24,921 | 21,824 | 18,960 | ||||||||||||||
Income before taxes |
25,755 | 16,384 | 11,551 | 11,970 | 12,715 | 11,913 | ||||||||||||||
Income tax expense |
9,098 | 5,965 | 4,123 | 4,269 | 4,690 | 4,369 | ||||||||||||||
Net income |
16,657 | 10,419 | 7,428 | 7,701 | 8,025 | 7,544 | ||||||||||||||
Preferred dividends |
1,299 | 2,307 | 177 | — | — | — | ||||||||||||||
Net income available to common shareholders |
15,358 | 8,112 | 7,251 | 7,701 | 8,025 | 7,544 | ||||||||||||||
29
| |
Year ended December 31, | |||||||||||||||||||
|---|---|---|---|---|---|---|---|---|---|---|---|---|---|---|---|---|---|---|---|---|
| (dollars in thousands except per share data) |
2010 | 2009 | 2008 | 2007 | 2006 | 2005 | ||||||||||||||
Per Common Share Data(2) |
||||||||||||||||||||
Net income, basic |
$ | 0.78 | $ | 0.55 | $ | 0.63 | $ | 0.73 | $ | 0.77 | $ | 0.74 | ||||||||
Net income, diluted |
0.77 | 0.55 | 0.62 | 0.71 | 0.74 | 0.70 | ||||||||||||||
Dividends declared |
— | — | 0.11 | 0.22 | 0.21 | 0.20 | ||||||||||||||
Book value |
9.25 | 8.48 | 8.34 | 7.59 | 6.99 | 6.32 | ||||||||||||||
Tangible book value(3) |
9.03 | 8.26 | 8.14 | 7.57 | 6.97 | 6.31 | ||||||||||||||
Common shares outstanding |
19,700,387 | 19,534,226 | 12,714,355 | 10,693,447 | 10,425,870 | 10,274,394 | ||||||||||||||
Weighted average common shares |
19,648,591 | 14,643,294 | 11,556,569 | 10,531,236 | 10,373,080 | 10,177,948 | ||||||||||||||
Ratios |
||||||||||||||||||||
Net interest margin |
4.09 | % | 3.85 | % | 4.05 | % | 4.37 | % | 4.81 | % | 4.99 | % | ||||||||
Efficiency ratio(4) |
59.26 | % | 64.01 | % | 66.49 | % | 66.54 | % | 60.15 | % | 57.95 | % | ||||||||
Return on average assets |
0.86 | % | 0.65 | % | 0.69 | % | 0.96 | % | 1.13 | % | 1.24 | % | ||||||||
Return on average common equity |
8.74 | % | 6.52 | % | 8.04 | % | 10.03 | % | 11.63 | % | 12.25 | % | ||||||||
Total capital (to risk weighted assets) |
11.64 | % | 13.57 | % | 11.93 | % | 11.21 | % | 11.91 | % | 12.05 | % | ||||||||
Tier 1 capital (to risk weighted assets) |
9.91 | % | 11.82 | % | 9.78 | % | 10.20 | % | 10.82 | % | 11.04 | % | ||||||||
Tier 1 capital (to average assets) |
9.32 | % | 10.29 | % | 9.22 | % | 9.46 | % | 9.67 | % | 9.94 | % | ||||||||
Asset Quality |
||||||||||||||||||||
Nonperforming assets and loans 90+ past due |
$ | 31,988 | $ | 27,131 | $ | 26,366 | $ | 5,324 | $ | 2,013 | $ | 491 | ||||||||
Nonperforming assets and loans 90+ past due to total assets |
1.53 | % | 1.50 | % | 1.76 | % | 0.63 | % | 0.26 | % | 0.07 | % | ||||||||
Allowance for credit losses to loans |
1.48 | % | 1.47 | % | 1.45 | % | 1.12 | % | 1.18 | % | 1.09 | % | ||||||||
Allowance for credit losses to nonperforming assets |
77.39 | % | 76.00 | % | 69.80 | % | 150.96 | % | 366.27 | % | 1218.94 | % | ||||||||
Net charge-offs |
$ | 5,172 | $ | 5,454 | $ | 1,123 | $ | 979 | $ | 357 | $ | 98 | ||||||||
Net charge-offs to average loans |
0.35 | % | 0.42 | % | 0.12 | % | 0.15 | % | 0.06 | % | 0.02 | % | ||||||||
- (1)
- Tangible
common shareholders' equity, a non-GAAP financial measure, is defined as total common shareholders' equity reduced by goodwill and
other intangible assets.
- (2)
- Presented
giving retroactive effect to the 10% stock dividend paid on the common stock on October 1, 2008 and the stock splits in the form of 30%
dividend on the common stock paid on July 5, 2006 and February 28, 2005. In July 2008, the Company discontinued the payment of its quarterly cash dividend.
- (3)
- Tangible
book value per common share, a non-GAAP financial measure, is defined as tangible common shareholders' equity divided by total common
shares outstanding.
- (4)
- Computed by dividing noninterest expense by the sum of net interest income and noninterest income.
| GAAP Reconciliation |
Year ended December 31, | ||||||||||||||||||
|---|---|---|---|---|---|---|---|---|---|---|---|---|---|---|---|---|---|---|---|
| (dollars in thousands except per share data) |
2010 | 2009 | 2008 | 2007 | 2006 | 2005 | |||||||||||||
Common stockholders' equity |
$ | 182,134 | $ | 165,709 | $ | 106,059 | $ | 81,166 | $ | 72,916 | $ | 64,964 | |||||||
Less: Intangible assets |
(4,188 | ) | (4,379 | ) | (2,533 | ) | (236 | ) | (255 | ) | (168 | ) | |||||||
Tangible common equity |
$ | 177,946 | $ | 161,330 | $ | 103,526 | $ | 80,930 | $ | 72,661 | $ | 64,796 | |||||||
Book value per common share |
$ |
9.25 |
$ |
8.48 |
$ |
8.34 |
$ |
7.59 |
$ |
6.99 |
$ |
6.32 |
|||||||
Less: Intangible book value per common share |
(0.22 | ) | (0.22 | ) | (0.20 | ) | (0.02 | ) | (0.02 | ) | (0.01 | ) | |||||||
Tangible book value per common share |
$ | 9.03 | $ | 8.26 | $ | 8.14 | $ | 7.57 | $ | 6.97 | $ | 6.31 | |||||||
30
ITEM 7. MANAGEMENT'S DISCUSSION AND ANALYSIS OF FINANCIAL CONDITION AND RESULTS OF OPERATIONS
The following discussion provides information about the results of operations, financial condition, liquidity, and capital resources of the Company. The Company's primary subsidiaries are the Bank, Bethesda Leasing, LLC, Eagle Insurance Services, LLC, and Eagle Commercial Ventures ("ECV"). This discussion and analysis should be read in conjunction with the audited Consolidated Financial Statements and Notes thereto, appearing elsewhere in this report.
Caution About Forward Looking Statements. This report contains forward looking statements within the meaning of Section 27A of the Securities Act of 1933, as amended, or the Securities Act, and Section 21E of the Securities Exchange Act of 1934, as amended, or the Exchange Act. These forward looking statements represent plans, estimates, objectives, goals, guidelines, expectations, intentions, projections and statements of our beliefs concerning future events, business plans, objectives, expected operating results and the assumptions upon which those statements are based. Forward looking statements include without limitation, any statement that may predict, forecast, indicate or imply future results, performance or achievements, and are typically identified with words such as "may," "could," "should," "will," "would," "believe," "anticipate," "estimate," "expect," "intend," "plan," or words or phases of similar meaning. These forward looking statements are based largely on our expectations and are subject to a number of known and unknown risks and uncertainties that are subject to change based on factors which are, in many instances, beyond our control. Actual results, performance or achievements could differ materially from those contemplated, expressed, or implied by the forward looking statements.
The following factors, among others, could cause our financial performance to differ materially from that expressed in such forward looking statements:
- •
- The strength of the United States economy in general and the strength of the local economies in which we conduct
operations;
- •
- Geopolitical conditions, including acts or threats of terrorism, actions taken by the United States or other governments
in response to acts or threats of terrorism and/or military conflicts, which could impact business and economic conditions in the United States and abroad;
- •
- The effects of, and changes in, trade, monetary and fiscal policies and laws, including interest rate policies of the
Federal Reserve Board, inflation, interest rate, market and monetary fluctuations;
- •
- The timely development of competitive new products and services and the acceptance of these products and services by new
and existing customers;
- •
- The willingness of users to substitute competitors' products and services for our products and services;
- •
- The impact of changes in financial services policies, laws and regulations, including laws, regulations and policies
concerning taxes, banking, securities and insurance, and the application thereof by regulatory bodies;
- •
- The effect of changes in accounting policies and practices, as may be adopted from time-to-time by
bank regulatory agencies, the Securities and Exchange Commission (the "SEC"), the Public Company Accounting Oversight Board or the Financial Accounting Standards Board;
- •
- Technological changes;
- •
- The effect of acquisitions we may make, including, without limitation, the failure to achieve the expected revenue growth
and/or expense savings from such acquisitions;
- •
- The growth and profitability of non-interest or fee income being less than expected;
- •
- Changes in the level of our nonperforming assets and charge-offs;
31
- •
- Changes in consumer spending and savings habits; and
- •
- Unanticipated regulatory or judicial proceedings.
If one or more of the factors affecting our forward looking information and statements proves incorrect, then our actual results, performance or achievements could differ materially from those expressed in, or implied by, forward looking information and statements contained in this report. You should not place undue reliance on our forward looking information and statements. We will not update the forward looking statements to reflect actual results or changes in the factors affecting the forward looking statements.
The Company is a growth oriented, one-bank holding company headquartered in Bethesda, Maryland. The Company provides general commercial and consumer banking services through the Bank, its wholly owned banking subsidiary, a Maryland chartered bank which is a member of the Federal Reserve System. The Company was organized in October 1997, to be the holding company for the Bank. The Bank was organized as an independent, community oriented, full service banking alternative to the super regional financial institutions, which dominate the primary market area. The Company's philosophy is to provide superior, personalized service to its customers. The Company focuses on relationship banking, providing each customer with a number of services, becoming familiar with and addressing customer needs in a proactive, personalized fashion. The Bank currently has a total of thirteen offices including seven offices serving Montgomery County, Maryland, five offices in the District of Columbia and one office in Fairfax County, Virginia. Our newest office in the District of Columbia, located in the Gallery Place area adjacent to the Verizon Center in downtown Washington, D.C., opened January 24, 2011. The Company has announced two new offices in Northern Virginia projected to open in the second quarter of 2011.
The Company offers a broad range of commercial banking services to its business and professional clients as well as full service consumer banking services to individuals living and/or working primarily in the service area. The Company emphasizes providing commercial banking services to sole proprietors, small and medium-sized businesses, partnerships, corporations, non-profit organizations and associations, and investors living and working in and near the primary service area. A full range of retail banking services are offered to accommodate the individual needs of both corporate customers as well as the community the Company serves. These services include the usual deposit functions of commercial banks, including business and personal checking accounts, "NOW" accounts and money market and savings accounts, business, construction, and commercial loans, residential mortgages and consumer loans, and cash management services. The Bank is also active in the origination and sale of residential mortgage loans and the origination of small business loans. The residential mortgage loans are originated for sale to third-party investors, generally large mortgage and banking companies, under firm commitments by the investors to purchase the loans subject to compliance with pre-established investor criteria. The guaranteed portion of small business loans is typically sold through the Small Business Administration, in a transaction apart from the loan's origination. Bethesda Leasing, LLC, a subsidiary of the Company holds title to and manages Other Real Estate Owned ("OREO") assets. Eagle Insurance Services, LLC, a subsidiary of the Bank markets insurance products and services through an arrangement with a third party insurance broker. ECV, a subsidiary of the Company provides, subordinated financing for the acquisition, development and construction of real estate projects. This lending involves higher levels of risk, together with commensurate expected returns.
In spite of the official measures of economic activity signaling an end to the recession in June 2010, generally weak economic conditions persisted in the U.S. economy throughout 2010, with unemployment levels remaining high, real estate values remaining a concern, home foreclosure problems, and personal income levels being only modestly higher. Average interest rates during 2010 declined as compared to 2009, although interest rates began increasing late in 2010, in response to market concerns about inflation.
32
The Company's primary market, the Washington, D.C. metropolitan area, has been relatively less impacted by the severe recessionary climate than other parts of the country, due in part to the significant economic impact of the federal government, a highly educated work force and a diverse economy.
The slowdown in the economy was less severe in the Company's marketplace than many other areas of the country, and has to a lesser extent impacted the Company's customers and business. However, the Company has had the resources and has remained committed to meeting the credit needs of its community, resulting in ongoing growth in its loan portfolio. The Company believes its strategies during the difficult economic times of the past few years is providing substantial new relationships, in addition to fostering future growth opportunities.
In this less than ideal operating environment, the Company was able to produce positive earnings in each quarter of 2010, continuing a trend of eight quarters of increasing net income through the fourth quarter of 2010. The Company did not make subprime residential mortgage loans to retail customers, did not invest in private label mortgage backed securities, securities backed by subprime or Alt A mortgages, and was not a major lender to home builders, factors which have negatively impacted many banking companies throughout the U.S and the region.
The Company's Consolidated Financial Statements are prepared in accordance with accounting principles generally accepted in the United States of America ("GAAP") and follow general practices within the banking industry. Application of these principles requires management in certain circumstances to make estimates, assumptions, and judgments that affect the amounts reported in the financial statements and accompanying notes. These estimates, assumptions and judgments are based on information available as of the date of the Consolidated Financial Statements. As this information changes, the Consolidated Financial Statements could reflect different estimates, assumptions, and judgments. Certain policies inherently have a greater reliance on the use of estimates, assumptions and judgments and as such have a greater possibility of producing results that could be materially different than originally reported.
Estimates, assumptions, and judgments are necessary when assets and liabilities are required to be recorded at fair value, when a decline in the value of an asset warrants an impairment write-down or a valuation reserve to be established, or when an asset or liability needs to be recorded contingent upon a future event. Carrying assets and liabilities at fair value inherently results in more financial statement volatility.
The fair values and the information used to record valuation adjustments for investment securities available-for-sale are based either on quoted market prices or are provided by other third-party sources, when available. The Company's investment portfolio is categorized as available-for-sale with unrealized gains and losses net of tax being a component of stockholders' equity and comprehensive income. Refer to the fair value disclosures at page 46—and Note 18 to the Consolidated Financial Statements at page 107 for further discussion of the carrying value of the investment portfolio and certain loans.
The allowance for credit losses is an estimate of the losses that may be sustained in our loan portfolio. The allowance is based on two principles of accounting: (a) ASC Topic 450, "Contingencies," which requires that losses be accrued when they are probable of occurring and are estimable and (b) ASC Topic 310, "Receivables," which requires that losses be accrued when it is probable that the Company will not collect all principal and interest payments according to the contractual terms of the loan. The loss, if any, can be determined by the difference between the loan balance and the value of collateral, the present value of expected future cash flows, or values observable in the secondary markets.
33
Three components comprise our allowance for credit losses: a specific allowance, a formula allowance and a nonspecific or environmental factors allowance. Each component is determined based on estimates that can and do change when actual events occur.
The specific allowance allocates a reserve to identified impaired loans. Loans identified in the risk rating evaluation as substandard, doubtful and loss (classified loans), are segregated from non-classified loans. Classified loans are assigned specific reserves based on an impairment analysis. Under ASC Topic 310, "Receivables," a loan for which reserves are individually allocated may show deficiencies in the borrower's overall financial condition, payment record, support available from financial guarantors and the fair market value of collateral. When a loan is identified as impaired, a specific reserve (if any) is established based on the Company's assessment of the loss that may be associated with the individual loan.
The formula allowance is used to estimate the loss on internally risk rated loans, exclusive of those identified as impaired. The portfolio of unimpaired loans is stratified by loan type and risk assessment. Allowance factors relate to the type of loan and level of the internal risk rating, with loans exhibiting higher risk and loss experience receiving a higher allowance factor. The formula allowance takes into account historical loss experience as one factor in the analyses of reserve adequacy.
The environmental allowance is used to estimate the loss associated with pools of non-classified loans. These non-classified loans are also stratified by loan type, and environmental allowance factors are assigned by management based upon a number of conditions, including delinquencies, loss history, changes in lending policy and procedures, changes in business and economic conditions, changes in the nature, volume and loan sizes within the portfolio, management expertise, concentrations within the portfolio, quality of internal and external loan review systems, competition, and legal and regulatory requirements.
The allowance captures losses inherent in the portfolio which have not yet been recognized. Allowance factors and the overall size of the allowance may change from period to period based upon management's assessment of the above described factors, the relative weights given to each factor, and portfolio composition.
Management has significant discretion in making the judgments inherent in the determination of the provision and allowance for credit losses, including, in connection with the valuation of collateral, a borrower's prospects of repayment, and in establishing allowance factors on the formula allowance and environmental allowance components of the allowance. The establishment of allowance factors involves a continuing evaluation, based on management's ongoing assessment of the global factors discussed above and their impact on the portfolio. The allowance factors may change from period to period, resulting in an increase or decrease in the amount of the provision or allowance, based upon the same volume and classification of loans. Changes in allowance factors can have a direct impact on the amount of the provision, and a related after tax effect on net income. Errors in management's perception and assessment of the global factors and their impact on the portfolio could result in the allowance not being adequate to cover losses in the portfolio, and may result in additional provisions or charge-offs. Alternatively, errors in management's perception and assessment of the global factors and their impact on the portfolio could result in the allowance being in excess of amounts necessary to cover losses in the portfolio, and may result in lower provisions in the future. For additional information regarding the allowance for credit losses, refer to the discussion under the caption "Allowance for Credit Losses" at page 50.
The Company follows the provisions of ASC Topic 718 "Compensation," which requires the expense recognition over a service period for the fair value of share based compensation awards, such as stock options, restricted stock, and performance based shares. This standard allows management to establish modeling assumptions as to expected stock price volatility, option terms, forfeiture rates and dividend rates which directly impact estimated fair value. The accounting standard also allows for the use of alternative option pricing models which may impact fair value as determined. The Company's practice is to utilize reasonable and supportable assumptions which are reviewed with the appropriate Board Committee.
34
In accounting for the acquisition of Fidelity and its subsidiary F&T Bank, the Company followed the provisions of ASC Topic 805 "Business Combinations," which mandates the use of the purchase method of accounting and ASC Topic 310-30, "Loans and Debt Securities Acquired with Deteriorated Credit Quality." Accordingly, the tangible assets and liabilities and identifiable intangibles acquired were recorded at their respective fair values on the date of acquisition, with any impaired loans acquired being recorded at fair value outside the allowance for loan losses. The valuation of the loan and time deposit portfolios acquired were made by independent analysis for the difference between the instruments' stated interest rates and the instruments' current origination interest rate, with premiums and discounts being amortized to interest income and interest expense to achieve an effective market interest rate. An identified intangible asset related to core deposits was recorded based on independent valuation. Deferred tax assets were recorded for the future value of a net operating loss and for the tax effect of temporary timing differences between the accounting and tax basis of assets and liabilities. The Company recorded an unidentified intangible (goodwill) for the excess of the purchase price of the acquisition (including direct acquisition costs) over the fair value of net tangible and identifiable intangible assets acquired. See "Allowance for Credit Losses" at page 50, "Nonperforming Assets" at page 53, "Intangible Assets" at page 56, and Note 4 "Loans and Allowance for Credit Losses" to the Consolidated Financial Statements, for further information on the acquisition of Fidelity.
Overview
The Company reported net income of $16.7 million for the year ended December 31, 2010, a 60% increase from net income of $10.4 million for the year ended December 31, 2009, as compared to $7.4 million for the year ended December 31, 2008. Net income available to common stockholders, which is after accrual of preferred stock dividends, was $15.4 million for year ended December 31, 2010, an 89% increase from net income available to common stockholders of $8.1 million for the year ended December 31, 2009. The increase in net income for the twelve months ended December 31, 2010 can be attributed primarily to an increase in net interest income of 29% as compared to the same period in 2009. Net interest income growth was due substantially to growth in average earning assets of 22% in 2010 and to expansion of the net interest margin by 24 basis points to 4.09%.
Earnings per basic common share were $0.78 for the year ended December 31, 2010, as compared to $0.55 for 2009 and $0.63 for 2008. Earnings per diluted common share were $0.77 for the year ended December 31, 2010, as compared to $0.55 for 2009 and $0.62 for 2008. Per common share amounts and the number of shares have been adjusted to give effect to the 10% stock dividend paid on October 1, 2008. The decline in net income per common share for 2009 in part reflects the significant increase in the number of shares outstanding as a result of the Company's successful offering of common stock completed in September 2009.
For the three months ended December 31, 2010, the Company reported net income of $5.1 million as compared to $3.0 million for the same period in 2009. Earnings per basic share were $0.24 for the three months ended December 31, 2010, as compared to $0.12 for 2009. Earnings per diluted common shares were $0.23 for the three months ended December 31, 2010 and $0.12 for the same period in 2009.
The Company had a return on average assets of 0.86% and a return on average common equity of 8.74% for the year of 2010, as compared to returns on average assets and average equity of 0.65% and 6.60%, respectively, for the year of 2009 and 0.69% and 8.05%, respectively, for the year of 2008.
The Company's earnings are largely dependent on net interest income, which represented 89% of total revenue (defined as net interest income plus non interest income) in 2010 and 2009. For the twelve months ended December 31, 2010, the net interest margin, which measures the difference between interest income and interest expense (i.e. net interest income) as a percentage of earning assets increased from 3.85% for the twelve months ended December 31, 2009 to 4.09% for the twelve months ended
35
December 31, 2010. The higher margin for 2010 as compared to 2009 was due to lower funding costs for both deposits and borrowings more than offsetting declines in earning asset yields. Higher average federal funds sold during the year ended December 31, 2010, as compared to the same period in 2009, contributed to the lower earning asset yields, as did lower yields on investment securities, due to lower market interest rates and the impact of investment sales. The benefit of noninterest sources funding earning assets declined by 12 basis points to 36 basis points for the twelve months ended December 31, 2010 as compared to 48 basis points for the same period in 2009, which effect was due to lower market interest rates in the current period as compared to 2009. Additionally, while the average rate on earning assets for the twelve months ended December 31, 2010, as compared to the same period in 2009 decreased by 31 basis points from 5.46% to 5.15%, the cost of interest bearing liabilities decreased by 67 basis points from 2.09% to 1.42%, resulting in a net interest spread of 3.73% for the twelve months ended December 31, 2010, as compared to 3.37% for the same period in 2009, an increase of 36 basis points. The combination of a 36 basis point increase in the net interest spread and a 12 basis point decline in the value of noninterest sources resulted in the 24 basis point increase in the net interest margin in 2010 versus 2009.
For the three months ended December 31, 2010 and 2009, average interest bearing liabilities were 73% and 75%, respectively, of average earning assets. Additionally, while the average rate on earning assets for the three months ended December 31, 2010 declined by 19 basis points from 5.30% to 5.11%, as compared to 2009, the cost of interest bearing liabilities decreased by 53 basis points from 1.81% to 1.28%, resulting in a increase in the net interest spread of 34 basis points from 3.49% for the quarter ended December 31, 2009 to 3.83% for the three months ended December 31, 2010. The net interest margin increased 22 basis points from 3.96% for the three months ended December 31, 2009 to 4.18% for the three months ended December 31, 2010. The 12 basis point difference between the net interest spread improvement of 34 basis points and the net interest margin improvement of 22 basis points was due to lower market interest rates in the current period reducing the benefit of noninterest funding sources from 47 basis points to 35 basis points.
The Company believes it has effectively managed its net interest margin and net interest income over the past twelve months as market interest rates (on average) have declined. This factor has been significant to overall earnings performance over the past twelve months as net interest income (at 89%) represents the most significant component of the Company's revenues.
Due to favorable core deposit growth over the past twelve months, the need to meet loan funding objectives has not required the use of further alternative funding sources, such as Federal Home Loan Bank ("FHLB") advances, correspondent bank lines of credit and brokered time deposits, the balances of which have declined since December 31, 2009. The major components of the growth in core deposits has been growth in a special money market account originally promoted through advertisements, but which is currently being promoted primarily through direct sales efforts by the business development staff, and growth in noninterest deposits primarily as a result of effectively building new and enhanced client relationships.
In terms of the average balance sheet composition or mix, loans, which generally have higher yields than securities and other earning assets, decreased from 85% of average earning assets in 2009 to 82% of average earning assets for 2010. The decrease in average loans as a percentage of other earning assets is due to the growth in the securities portfolio and other earning assets resulting from higher levels of growth in deposits as compared to loans over the past twelve months. In 2010, average loans, including loans held for sale, increased $219 million, a 17% increase, and average deposits increased by $324 million, a 26% increase as compared to 2009. The increase in average loans in 2010 as compared to 2009 is primarily attributable to growth in loans on income-producing commercial real estate and commercial loans. The increase in average deposits in 2010 as compared to 2009 is primarily attributable to noninterest bearing demand deposits and money market deposits. Investment securities for the year of 2010 amounted to 14% of average earning assets, an increase of 2% from an average of 12% for the year of 2009. Federal funds sold averaged 4% of average earning assets in 2010 as compared to 3% in 2009.
36
For the three months ended December 31, 2010, average loans were 83% of average earning assets as compared to 81% for the same period in 2009, as the Company experienced very strong loan growth in the fourth quarter of 2010. Average loans, which include loans held for sale, increased $320 million (24%) and average deposits increased $329 million (24%) during the three months ended December 31, 2010 as compared to the same period in 2010. The increase in average loans in the fourth quarter of 2010 as compared to the fourth quarter of 2009 is primarily attributable to growth in loans on income-producing commercial real estate, commercial loans, and loans held for sale, as the Company significantly expanded its residential mortgage origination division late in the second quarter of 2010. Increases in average deposits in the fourth quarter of 2010, as compared to the fourth quarter of 2009, is attributable to growth in both noninterest bearing demand deposits and money market accounts. Average investment securities for the three months ended December 31, 2010 and 2009 amounted to 13% of average earning assets. Average federal funds sold averaged 4% of average earning assets for the three months ended December 31, 2010 as compared to 6% for the same period in 2009.
The provision for credit losses was $9.3 million for the year of 2010 as compared to $7.7 million in 2009. The higher provisioning in 2010 as compared to 2009 is attributable to substantially higher amounts of loan growth in 2010 compared to 2009. For the twelve months ended December 31, 2010, net charge-offs totaled $5.2 million (0.35% of average loans) compared to $5.5 million (0.42% of average loans) for the twelve months ended December 31, 2009. Net charge-offs in the twelve months ended December 31, 2010 were primarily attributable to charge-offs of commercial real estate loans—owner occupied ($246 thousand), commercial real estate loans—investments ($716 thousand), commercial loans ($1.7 million), construction loans ($1.7 million), and the unguaranteed portion of SBA loans ($750 thousand).
At December 31, 2010, the allowance for credit losses represented 1.48% of loans outstanding, as compared to 1.47% at December 31, 2009 and 1.45% at September 30, 2010. The allowance for credit losses was 98% of nonperforming loans at December 31, 2010, as compared to 94% at December 31, 2009, and 90% at September 30, 2010.
Total noninterest income for the year of 2010 was $9.2 million compared to $7.3 million in 2009, an increase of 27%. This increase was due primarily to a $1.8 million increase in gains realized on the sale of residential loans and $234 thousand of other income. These increases were partially offset by a $208 thousand decline in gains on the sale of investment securities and $70 thousand decrease from the sale of SBA loans. Investment gains realized in both 2010 and 2009 were the result of asset/liability management decisions to either reduce call risk in the portfolio of U.S. Agency securities, to mitigate potential extension risk in longer-term mortgage-backed securities or to mitigate prepayment risk in mortgage-backed securities. Excluding investment securities gains, total noninterest income was $7.9 million for the year of 2010 as compared to $5.8 million for 2009, a 37% increase.
Total noninterest income for the three months ended December 31, 2010 increased to $3.7 million from $1.3 million for the three months ended December 31, 2009, a 188% increase. This increase was due primarily to increases of $1.8 million in gains realized on the sale of residential loans and $496 thousand in increased gains realized on the sale of investment securities. Gains on the sale of SBA loans decreased $70 thousand. Investment gains realized in the fourth quarter of 2010 were the result of asset/liability management decisions to sell a portion of mortgage-backed securities that exhibited substantial prepayment risk. Also contributing to the increase in noninterest income in 2010 compared to 2009 was an increase of $52 thousand in service fees and a $121 thousand increase in other income. Excluding investment securities gains, total noninterest income was $3.2 million for the fourth quarter of 2010 as compared to $1.3 million for the fourth quarter of 2009, a 149% increase.
The efficiency ratio, which measures the ratio of noninterest expense to total revenue, was 59.26% for the full year of 2010 as compared to 64.01% for the same period in 2009, as the Company has enhanced its productivity. Cost control remains a key operating objective of the Company. Total noninterest expenses
37
were $51.0 million for the year of 2010, as compared to $42.8 million for 2009, a 19% increase. The increase is primarily due to salaries, incentive compensation and benefits increases of $4.6 million including staffing increases primarily as a result of expansion of the residential mortgage division, to premises and equipment expense increases of $1.1 million and to other expense increases of $2.1 million. Other expense increases include $851 thousand due to the operating and disposition costs of OREO properties; legal, accounting and professional fees of $256 thousand and data processing cost increases of $273 thousand. Premises and equipment expenses include approximately $827 thousand due to the acceleration of rent and leasehold improvement amortization for the consolidation of two branch offices in 2010. These higher costs were partially offset by a reduction in marketing and advertising costs of $41 thousand and lower FDIC insurance costs of $51 thousand, largely as a result of the absence of a special assessment of approximately $723 thousand recorded in the second quarter of 2009.
Total noninterest expenses were $13.5 million for the three months ended December 31, 2010, as compared to $10.6 million for the three months ended December 31, 2009, a 27% increase. Cost increases were incurred for salaries and benefits of $1.9 million due substantially to additional residential mortgage staff, and to increases in incentive compensation. Premises and equipment expenses were $108 thousand lower due primarily to the consolidation of two branches during 2010. Other expenses increased by $624 thousand, with $200 thousand due to the operating and disposition costs of OREO properties. Marketing and advertising costs decreased by $175 thousand due to the Company's reduced sponsorship role in the Military Bowl in 2010. FDIC insurance premiums were $387 thousand higher due to substantially higher deposit balances, increased costs of the transaction account guarantee program and lower costs in the fourth quarter of 2009 resulting from accrual adjustments. The efficiency ratio was 53.98% for the fourth quarter of 2010, as compared to 59.02% for the fourth quarter of 2009, as the Company enhanced its productivity. As compared to the third quarter of 2010, the fourth quarter efficiency ratio was lower (from 58.68% to 53.98%) due to increases in revenue (net interest income and noninterest income) substantially offsetting increases in noninterest expenses.
The ratio of common equity to total assets decreased from 9.18% at December 31, 2009 to 8.72% at December 31, 2010 due to an increase in balance sheet leverage. As discussed below, the regulatory capital ratios of the Bank and Company remain above well capitalized levels.
Net Interest Income and Net Interest Margin
Net interest income is the difference between interest income on earning assets and the cost of funds supporting those assets. Earning assets are composed primarily of loans and investment securities. The cost of funds comprises interest expense on deposits, customer repurchase agreements and other borrowings, which are federal funds purchased and other borrowings. Noninterest bearing deposits and capital are other components representing funding sources. Changes in the volume and mix of assets and funding sources, along with the changes in yields earned and rates paid, determine changes in net interest income. Net interest income in 2010 was $76.8 million compared to $59.5 million in 2009 and $42.0 million in 2008. For the three months ended December 31, 2010, net interest income was $21.3 million as compared to $16.7 million and $13.2 million for the same periods in 2009 and 2008, respectively.
The tables below labeled "Average Balances, Interest Yields and Rates and Net Interest Margin" present the average balances and rates of the various categories of the Company's assets and liabilities for the years and three months ended December 31, 2010, 2009 and 2008. Included in the tables are measurements of interest rate spread and margin. Interest spread is the difference (expressed as a percentage) between the interest rate earned on earning assets less the interest expense on interest bearing liabilities. While net interest spread provides a quick comparison of earnings rates versus cost of funds, management believes that net interest margin provides a better measurement of performance. Margin includes the effect of noninterest bearing sources in its calculation and is net interest income expressed as a percentage of average earning assets.
38
Average Balances, Interest Yields and Rates, and Net Interest Margin
| |
Year Ended December 31, | ||||||||||||||||||||||||||||
|---|---|---|---|---|---|---|---|---|---|---|---|---|---|---|---|---|---|---|---|---|---|---|---|---|---|---|---|---|---|
| |
2010 | 2009 | 2008 | ||||||||||||||||||||||||||
| (dollars in thousands) |
Average Balance |
Interest | Average Yield/Rate |
Average Balance |
Interest | Average Yield/Rate |
Average Balance |
Interest | Average Yield/Rate |
||||||||||||||||||||
ASSETS |
|||||||||||||||||||||||||||||
Interest earning assets: |
|||||||||||||||||||||||||||||
Interest bearing deposits with other banks and other short-term investments |
$ | 8,151 | $ | 108 | 1.32 | % | $ | 3,928 | $ | 94 | 2.39 | % | $ | 3,750 | $ | 98 | 2.61 | % | |||||||||||
Loans(1)(2)(3) |
1,531,304 | 89,384 | 5.84 | % | 1,312,537 | 77,004 | 5.87 | % | 911,329 | 59,901 | 6.57 | % | |||||||||||||||||
Investment securities available for sale(3) |
259,576 | 6,992 | 2.69 | % | 182,073 | 7,138 | 3.92 | % | 111,398 | 5,459 | 4.90 | % | |||||||||||||||||
Federal funds sold |
78,120 | 174 | 0.22 | % | 46,412 | 102 | 0.22 | % | 11,255 | 199 | 1.77 | % | |||||||||||||||||
Total interest earning assets |
1,877,151 | 96,658 | 5.15 | % | 1,544,950 | 84,338 | 5.46 | % | 1,037,732 | 65,657 | 6.33 | % | |||||||||||||||||
Noninterest earning assets |
80,787 | 70,012 | 50,050 | ||||||||||||||||||||||||||
Less: allowance for credit losses |
21,747 | 19,344 | 11,581 | ||||||||||||||||||||||||||
Total noninterest earning assets |
59,040 | 50,668 | 38,469 | ||||||||||||||||||||||||||
TOTAL ASSETS |
$ | 1,936,191 | $ | 1,595,618 | $ | 1,076,201 | |||||||||||||||||||||||
LIABILITIES AND STOCKHOLDERS' EQUITY |
|||||||||||||||||||||||||||||
Interest bearing liabilities: |
|||||||||||||||||||||||||||||
Interest bearing transaction |
$ | 54,889 | $ | 209 | 0.38 | % | $ | 52,083 | $ | 161 | 0.31 | % | $ | 48,094 | $ | 306 | 0.64 | % | |||||||||||
Savings and money market |
684,858 | 7,847 | 1.15 | % | 401,912 | 6,144 | 1.53 | % | 225,126 | 4,212 | 1.87 | % | |||||||||||||||||
Time deposits |
506,570 | 8,830 | 1.74 | % | 566,686 | 14,651 | 2.59 | % | 402,232 | 15,025 | 3.74 | % | |||||||||||||||||
Total interest bearing deposits |
1,246,317 | 16,886 | 1.35 | % | 1,020,681 | 20,956 | 2.05 | % | 675,452 | 19,543 | 2.89 | % | |||||||||||||||||
Customer repurchase agreements and federal funds purchased |
96,862 | 731 | 0.75 | % | 93,363 | 957 | 1.03 | % | 68,696 | 1,406 | 2.05 | % | |||||||||||||||||
Other short-term borrowings |
3,737 | 27 | 0.72 | % | 30,562 | 611 | 1.97 | % | 15,577 | 546 | 3.51 | % | |||||||||||||||||
Long-term borrowings |
49,300 | 2,188 | 4.44 | % | 45,322 | 2,285 | 5.04 | % | 53,750 | 2,181 | 4.06 | % | |||||||||||||||||
Total interest bearing liabilities |
1,396,216 | 19,832 | 1.42 | % | 1,189,928 | 24,809 | 2.09 | % | 813,475 | 23,676 | 2.91 | % | |||||||||||||||||
Noninterest bearing liabilities: |
|||||||||||||||||||||||||||||
Noninterest bearing demand |
335,029 | 236,340 | 164,116 | ||||||||||||||||||||||||||
Other liabilities |
6,648 | 8,702 | 5,718 | ||||||||||||||||||||||||||
Total noninterest bearing liabilities |
341,677 | 245,042 | 169,834 | ||||||||||||||||||||||||||
Stockholders' equity |
198,298 | 160,648 | 92,892 | ||||||||||||||||||||||||||
TOTAL LIABILITIES AND STOCKHOLDERS' EQUITY |
$ | 1,936,191 | $ | 1,595,618 | $ | 1,076,201 | |||||||||||||||||||||||
Net interest income |
$ | 76,826 | $ | 59,529 | $ | 41,981 | |||||||||||||||||||||||
Net interest spread |
3.73 | % | 3.37 | % | 3.42 | % | |||||||||||||||||||||||
Net interest margin |
4.09 | % | 3.85 | % | 4.05 | % | |||||||||||||||||||||||
- (1)
- Includes
loans held for sale.
- (2)
- Loans
placed on nonaccrual status are included in average balances. Net loan fees and late charges included in interest income on loans totaled
$2.6 million, $2.1 million and $1.6 million for 2010, 2009 and 2008, respectively.
- (3)
- Interest and fees on loans and investment securities available for sale exclude tax equivalent adjustments.
39
Average Balances, Interest Yields and Rates, and Net Interest Margin
| |
Three Months Ended December 31, | ||||||||||||||||||||||||||||
|---|---|---|---|---|---|---|---|---|---|---|---|---|---|---|---|---|---|---|---|---|---|---|---|---|---|---|---|---|---|
| |
2010 | 2009 | 2008 | ||||||||||||||||||||||||||
| (dollars in thousands) |
Average Balance |
Interest | Average Yield/Rate |
Average Balance |
Interest | Average Yield/Rate |
Average Balance |
Interest | Average Yield/Rate |
||||||||||||||||||||
ASSETS |
|||||||||||||||||||||||||||||
Interest earning assets: |
|||||||||||||||||||||||||||||
Interest bearing deposits with other banks and other short-term investments |
$ | 9,419 | $ | 25 | 1.05 | % | $ | 7,470 | $ | 39 | 2.07 | % | $ | 6,648 | $ | 24 | 1.44 | % | |||||||||||
Loans(1)(2)(3) |
1,672,572 | 24,389 | 5.79 | % | 1,352,076 | 20,576 | 6.04 | % | 1,218,067 | 18,804 | 6.14 | % | |||||||||||||||||
Investment securities available for sale(3) |
256,520 | 1,580 | 2.44 | % | 224,225 | 1,747 | 3.09 | % | 166,803 | 2,040 | 4.87 | % | |||||||||||||||||
Federal funds sold |
82,981 | 46 | 0.22 | % | 93,802 | 51 | 0.22 | % | 14,903 | 36 | 0.96 | % | |||||||||||||||||
Total interest earning assets |
2,021,492 | 26,040 | 5.11 | % | 1,677,573 | 22,413 | 5.30 | % | 1,406,421 | 20,904 | 5.91 | % | |||||||||||||||||
Noninterest earning assets |
80,973 | 74,569 | 62,433 | ||||||||||||||||||||||||||
Less: allowance for credit losses |
23,073 | 19,974 | 17,559 | ||||||||||||||||||||||||||
Total noninterest earning assets |
57,900 | 54,595 | 44,874 | ||||||||||||||||||||||||||
TOTAL ASSETS |
$ | 2,079,392 | $ | 1,732,168 | $ | 1,451,295 | |||||||||||||||||||||||
LIABILITIES AND STOCKHOLDERS' EQUITY |
|||||||||||||||||||||||||||||
Interest bearing liabilities: |
|||||||||||||||||||||||||||||
Interest bearing transaction |
$ | 59,616 | $ | 69 | 0.46 | % | $ | 55,434 | $ | 44 | 0.31 | % | $ | 51,536 | $ | 53 | 0.41 | % | |||||||||||
Savings and money market |
732,839 | 1,889 | 1.02 | % | 527,300 | 1,845 | 1.39 | % | 282,534 | 1,232 | 1.73 | % | |||||||||||||||||
Time deposits |
521,680 | 2,068 | 1.57 | % | 524,860 | 2,975 | 2.25 | % | 605,022 | 5,128 | 3.37 | % | |||||||||||||||||
Total interest bearing deposits |
1,314,135 | 4,026 | 1.22 | % | 1,107,594 | 4,864 | 1.74 | % | 939,092 | 6,413 | 2.72 | % | |||||||||||||||||
Customer repurchase agreements and federal funds purchased |
105,650 | 186 | 0.70 | % | 82,106 | 184 | 0.89 | % | 99,071 | 388 | 1.56 | % | |||||||||||||||||
Other short-term borrowings |
— | — | — | 23,696 | 184 | 3.08 | % | 16,717 | 124 | 2.95 | % | ||||||||||||||||||
Long-term borrowings |
49,300 | 541 | 4.35 | % | 35,604 | 453 | 5.05 | % | 62,166 | 755 | 4.84 | % | |||||||||||||||||
Total interest bearing liabilities |
1,469,085 | 4,753 | 1.28 | % | 1,249,000 | 5,685 | 1.81 | % | 1,117,046 | 7,680 | 2.73 | % | |||||||||||||||||
Noninterest bearing liabilities: |
|||||||||||||||||||||||||||||
Noninterest bearing demand |
395,953 | 273,711 | 213,284 | ||||||||||||||||||||||||||
Other liabilities |
8,163 | 7,453 | 7,719 | ||||||||||||||||||||||||||
Total noninterest bearing liabilities |
404,116 | 281,164 | 221,003 | ||||||||||||||||||||||||||
Stockholders' equity |
206,191 | 202,004 | 113,245 | ||||||||||||||||||||||||||
TOTAL LIABILITIES AND STOCKHOLDERS' EQUITY |
$ | 2,079,392 | $ | 1,732,168 | $ | 1,451,294 | |||||||||||||||||||||||
Net interest income |
$ | 21,287 | $ | 16,728 | $ | 13,224 | |||||||||||||||||||||||
Net interest spread |
3.83 | % | 3.49 | % | 3.18 | % | |||||||||||||||||||||||
Net interest margin |
4.18 | % | 3.96 | % | 3.74 | % | |||||||||||||||||||||||
- (1)
- Includes
loans held for sale.
- (2)
- Loans
placed on nonaccrual status are included in average balances. Net loan fees and late charges included in interest income on loans totaled
$712 thousand, $752 thousand and $514 thousand for the three months ended December 31, 2010, 2009 and 2008, respectively.
- (3)
- Interest and fees on loans and investment securities available for sale exclude tax equivalent adjustments.
40
The rate/volume table below presents the composition of the change in net interest income for the periods indicated, as allocated between the change in net interest income due to changes in the volume of average earning assets and interest bearing liabilities, and the changes in net interest income due to changes in interest rates. As the table shows, the increase in net interest income in 2010 as compared to 2009 was a function of an increase in the volume of earning assets, and an improving net interest margin resulting from lower funding costs more than offsetting the decrease in interest income on earning assets, as compared to 2009. For 2009 over 2008, the change is due to a significant increase in the volume of earning assets, partially offset by a decrease in the net interest margin on earning assets, due to the lower value of noninterest funding sources in 2009 as compared to 2008.
Rate/Volume Analysis of Net Interest Income
| |
2010 compared with 2009 | 2009 compared with 2008 | |||||||||||||||||||
|---|---|---|---|---|---|---|---|---|---|---|---|---|---|---|---|---|---|---|---|---|---|
| (dollars in thousands) |
Change Due to Volume |
Change Due to Rate |
Total Increase (Decrease) |
Change Due to Volume |
Change Due to Rate |
Total Increase (Decrease) |
|||||||||||||||
Interest earned on |
|||||||||||||||||||||
Loans |
$ | 12,835 | $ | (455 | ) | $ | 12,380 | $ | 26,371 | $ | (9,268 | ) | $ | 17,103 | |||||||
Investment securities |
3,038 | (3,184 | ) | (146 | ) | 3,463 | (1,784 | ) | 1,679 | ||||||||||||
Interest bearing bank deposits |
101 | (87 | ) | 14 | 5 | (9 | ) | (4 | ) | ||||||||||||
Federal funds sold |
70 | 2 | 72 | 622 | (719 | ) | (97 | ) | |||||||||||||
Total interest income |
16,044 | (3,724 | ) | 12,320 | 30,461 | (11,780 | ) | 18,681 | |||||||||||||
Interest paid on |
|||||||||||||||||||||
Interest bearing transaction |
9 | 39 | 48 | 25 | (170 | ) | (145 | ) | |||||||||||||
Savings and money market |
4,325 | (2,622 | ) | 1,703 | 3,308 | (1,376 | ) | 1,932 | |||||||||||||
Time deposits |
(1,554 | ) | (4,267 | ) | (5,821 | ) | 6,143 | (6,517 | ) | (374 | ) | ||||||||||
Customer repurchase agreements |
36 | (262 | ) | (226 | ) | 505 | (954 | ) | (449 | ) | |||||||||||
Other borrowings |
(336 | ) | (345 | ) | (681 | ) | 183 | (14 | ) | 169 | |||||||||||
Total interest expense |
2,480 | (7,457 | ) | (4,977 | ) | 10,164 | (9,031 | ) | 1,133 | ||||||||||||
Net interest income |
$ | 13,564 | $ | 3,733 | $ | 17,297 | $ | 20,297 | $ | (2,749 | ) | $ | 17,548 | ||||||||
Provision for Credit Losses
The provision for credit losses represents the amount of expense charged to current earnings to fund the allowance for credit losses. The amount of the allowance for credit losses is based on many factors which reflect management's assessment of the risk in the loan portfolio. Those factors include economic conditions and trends, the value and adequacy of collateral, volume and mix of the portfolio, performance of the portfolio, and internal loan processes of the Company and Bank.
Management has developed a comprehensive analytical process to monitor the adequacy of the allowance for credit losses. This process and guidelines were developed utilizing among other factors, the guidance from federal banking regulatory agencies. The results of this process, in combination with conclusions of the Bank's outside loan review consultant, support management's assessment as to the adequacy of the allowance at the balance sheet date. Please refer to the discussion under the caption "Critical Accounting Policies" for an overview of the methodology management employs on a quarterly basis to assess the adequacy of the allowance and the provisions charged to expense. Also, refer to the table under "Allowance for Credit Losses" at page 50, which reflects the comparative charge-offs and recoveries.
41
During the year of 2010, the allowance for credit losses increased $4.1 million reflecting $9.3 million in provision for credit losses and $5.2 million in net charge-offs during the period. The provision for credit losses was $9.3 million for 2010 compared to a provision for credit losses of $7.7 million for the same period in 2009. For 2010, net charge-offs amounted to $5.2 million as compared to $5.5 million for 2009. The higher provisioning in 2010 as compared to 2009 is attributable to increased amounts of loan growth in 2010 versus 2009, and to increased reserves for problem loans.
During the three months ended December 31, 2010, the allowance for credit losses increased $2.5 million reflecting $3.5 million in provision for credit losses and $1.0 million in net charge-offs during the period. The provision for credit losses was $3.5 million for the three months ended December 31, 2010 as compared to $2.5 million for the three months ended December 31, 2009. For the fourth quarter of 2010, net charge-offs amounted to $1.0 million as compared to $1.8 million of net charge-offs for the same period in 2009. The higher provision for the fourth quarter of 2010 is primarily attributable to $145 million in loan growth in the fourth quarter of 2010, and also reflects minor increases in specific reserves for problem loans.
As part of its comprehensive loan review process, the Bank's Board of Directors and Loan Committee or Company's Credit Review Committee carefully evaluate loans which are past-due 30 days or more. The Committees make a thorough assessment of the conditions and circumstances surrounding each delinquent loan. The Bank's loan policy requires that loans be placed on nonaccrual if they are ninety days past-due, unless they are well secured and in the process of collection. Additionally, Credit Administration specifically analyzes the status of development and construction projects, sales activities and utilization of interest reserves in order to carefully and prudently assess potential increased levels of risk requiring additional reserves.
The maintenance of a high quality loan portfolio, with an adequate allowance for possible credit losses, will continue to be a primary management objective for the Company.
Noninterest Income
Total noninterest income includes service charges on deposits, gain on sale of loans, gain on sale of investments, income from bank owned life insurance ("BOLI") and other income.
Total noninterest income for the year of 2010 was $9.2 million compared to $7.3 million in 2009, an increase of 27%. This increase was due primarily to a $1.8 million increase in gains realized on the sale of residential loans and $234 thousand of other income. Gains on the sale of SBA loans decreased $59 thousand. These increases were partially offset by a $208 thousand decline in gains on the sale of investment securities. Investment gains realized in both 2010 and 2009 were the result of asset/liability management decisions to either reduce call risk in the portfolio of U.S. Agency securities, to mitigate potential extension risk in longer-term mortgage-backed securities or to mitigate prepayment risk in mortgage-backed securities. Excluding investment securities gains, total noninterest income was $7.9 million for the year of 2010 as compared to $5.8 million for 2009, a 37% increase.
Total noninterest income for the three months ended December 31, 2010 increased to $3.7 million from $1.3 million for the three months ended December 31, 2009, a 188% increase. This increase was due primarily to increases of $1.8 million in gains realized on the sale of residential loans and $496 thousand in gains realized on the sale of investment securities. Gains on the sale of SBA loans decreased $70 thousand. Investment gains realized in the fourth quarter of 2010 were the result of asset/liability management decisions to sell a portion of mortgage-backed securities that exhibited substantial prepayment risk. Also contributing to the increase in noninterest income in 2010 compared to 2009 was an increase of $52 thousand in service fees and a $121 thousand increase in other income. Excluding investment securities gains, total noninterest income was $3.2 million for the fourth quarter of 2010 as compared to $1.3 million for the fourth quarter of 2009, a 149% increase.
42
For the year ended December 31, 2010, service charges on deposit accounts increased to $3.1 million from $2.9 million, an increase of 6% over 2009. The increase in service charges was primarily related to fee increases due in part to the impact of lower interest rates on customer earnings credits and to new relationships. For the three months ended December 31, 2010, service charges on deposit accounts increased $52 thousand to $768 thousand compared to the same period in 2009, an increase of 7%. This increase was due to new relationships.
Gain on sale of loans consists of SBA and residential mortgage loans. For the year ended December 31, 2010, gain on sale of loans increased from $1.1 million to $2.8 million compared to the same period in 2009 or 169%. For the three months ended December 31, 2010, gain on sale of loans increased from $104 thousand to $1.8 million compared to the same period in 2009. The higher amount of gains is due substantially to gains realized on the sale of residential mortgage loans.
The Company originates residential mortgage loans on a pre-sold basis, servicing released. Sales of these mortgage loans yielded gains of $2.5 million for the year of 2010 compared to $682 thousand in the same period in 2009. For the three months ended December 31, 2010, gains on the sale of residential mortgage loans were $1.8 million as compared to $29 thousand for the same three months of 2009. Loans sold are subject to repurchase in circumstances where documentation is deficient or the underlying loan becomes delinquent within a specified period following sale and loan funding. The Bank considers these potential recourse provisions to be a minimal risk, but has established a reserve under generally accepted accounting principles for possible repurchases. There has been no repurchases to date due to fraud or payment defaults. The reserve amounted to $149 thousand at December 31, 2010 and is included in Other liabilities on the Statements of Financial Condition. The Bank does not originate "sub-prime" loans and has no exposure to this market segment. The expansion of the residential mortgage origination division and higher refinancing activity resulting from a decline in residential mortgage rates in 2010 as compared to 2009 were the primary reason for the increase in income.
The Company is an originator of SBA loans and its current practice is to sell the insured portion of those loans at a premium. Income from this source was $313 thousand for the year ended December 31, 2010 compared to $372 thousand for the year ended December 31, 2009. For the three months ended December 31, 2010, gains on the sale of SBA loans amounted to $4 thousand as compared to $75 thousand for the same period in 2009. Activity in SBA loan sales to secondary markets can vary widely from quarter to quarter. Beginning in 2010, the Company's earnings from the sale of the guaranteed portion of SBA loans originated were impacted by the new accounting standard, ASC Topic 860, "Transfers and Servicing," which requires that the recognition of profit on the sale of loans be deferred until all re-purchase recourse provisions are met, which is typically a period of 90-120 days.
Other income totaled $1.6 million for the year ended 2010 as compared to $1.3 million for the same period in 2009, an increase of 17%. The major components of income in this category consist of ATM fees, SBA service fees, noninterest loan fees and other noninterest fee income. ATM fees increased from $430 thousand for the year ended 2009 to $559 thousand for the year ended 2010, a 30% increase. SBA service fees increased from $184 thousand for the year ended 2009 to $217 thousand for the year ended 2010, an 18% increase. Noninterest loan fees increased from $461 thousand for the year ended 2009 to $634 thousand for the same period in 2010, a 37% increase, primarily due to letter of credit fees and higher non amortizable loan fees resulting from the higher loan growth during 2010. Other noninterest fee income was $167 thousand for the year 2010 compared to $267 thousand for the same period in 2009. Other income totaled $461 thousand for the three months ended December 31, 2010 as compared to $340 thousand for the same period in 2009, an increase of 36%.
Net investment gains amounted to $1.3 million and $497 thousand for the year and quarter ended December 31, 2010, respectively, as compared to net investment gains of $1.5 million and $1 thousand for the year and quarter ended December 31, 2009, respectively. Investment gains realized in both 2010 and 2009 were the result of asset/liability management decisions to either reduce call risk in the portfolio of
43
U.S. Agency securities, to mitigate potential extension risk in longer-term mortgage-backed securities or to mitigate prepayment risk in mortgage-backed securities.
Noninterest Expense
Total noninterest expense consists of salaries and employee benefits, premises and equipment expenses, marketing and advertising, data processing, legal, accounting and professional fees, FDIC insurance premiums and other expenses.
Total noninterest expenses were $51.0 million for 2010, as compared to $42.8 million for 2009, a 19% increase, which primarily reflects strategic growth initiatives of the organization and more specifically, to substantial expansion of the residential mortgage origination and sales division during 2010. For the three months ended December 31, 2010, total noninterest expenses were $13.5 million, as compared to $10.6 million for 2009, a 27% increase.
Salaries and employee benefits were $25.6 million for the year ended 2010, as compared to $20.9 million for 2009, a 22% increase. For the three months ended December 31, 2010, salaries and employee benefits amounted to $7.3 million versus $5.4 million for the same period in 2009, a 35% increase. These increases were due to staff additions (including substantial expansion of the residential mortgage origination and sales division), merit increases, increased incentive based compensation and increased benefit costs. At December 31, 2010, the Company's staff numbered 292, as compared to 235 at December 31, 2009 and 2008.
Premises and equipment expenses amounted to $8.5 million for the year ended December 31, 2010 as compared to $7.3 million for the same period in 2009, a 15% increase. Premises and equipment expenses amounted to $1.7 million for the three months ended December 31, 2010 as compared to $1.8 million for the same period in 2009, a 6% decrease. The increase in expenses for the year ended December 31, 2010 is due primarily to $595 thousand for the acceleration of the remaining minimum lease obligation due to consolidation of a Silver Spring, Maryland location and $232 thousand due to the acceleration of the amortization of the leasehold improvements for the consolidation of a branch in Washington, D.C. A portion of the increased cost was also due to the expanded executive offices for the Bank and Company which opened in May 2009 and a new bank branch opened in November 2009. Additionally, ongoing operating expense increases associated with the Company's facilities, all of which are leased, and increased equipment costs contributed to the overall increase in expense. The decrease in expense for the three months ended December 31, 2010 is due primarily to benefits of consolidation of the two offices noted above earlier in 2010. For the year and three months ended December 31, 2010, the Company recognized $410 thousand and $93 thousand respectively of sublease revenue as compared to $366 thousand and $97 thousand for the same period in 2009. The sublease revenue is a direct offset of premises and equipment expenses.
Marketing and advertising expenses were stable at $1.1 million for the years ended December 31, 2010 and 2009. Marketing and advertising expenses decreased from $314 thousand for the three months ended December 31, 2009 to $139 thousand for the same period in 2010, a 56% decrease. The primary reason for the decrease was due to the Company's reduced sponsorship role in the Military Bowl in 2010.
Data processing expenses increased from $2.4 million for the year ended December 31, 2009 to $2.6 million for 2010, an increase of 12%. Data processing expenses increased from $576 thousand for the three months ended December 31, 2009 to $674 thousand in the same period in 2010, a 17% increase. The year and quarterly increases in expense were due to an increase in the volume of data processing activity from organic growth.
Legal, accounting and professional fees were $3.0 million for the year ended December 31, 2010, as compared to $2.7 million for 2009, an increase of 9%. Although the Company's collection costs related to problem assets decreased significantly for the year ended December 31, 2010, by $501 thousand as compared to the same period in 2009, this decrease was more than offset by an increase in expense for the
44
use of outside consultants of $756 thousand for the year ended December 31, 2010, including consulting to enhance the Company's sales management processes and to assess strategic growth options. Legal, accounting and professional fees were $806 thousand for the three months ended December 31, 2010, as compared to $690 thousand in 2009, a 17% increase. The primary reason for the increase was legal fees incurred related to strategic growth initiatives.
FDIC insurance premiums were $2.7 million for the years ended December 31, 2010 and 2009, as increased costs of higher deposit balances for 2010, as compared to 2009, were effectively offset by a special assessment of $723 thousand in 2009, which was mandated by the FDIC for all insured depository institutions to address the funds declining balance. For the three months ended December 31, 2010, FDIC insurance premiums amounted to $664 thousand as compared to $278 thousand for the same period in 2009, a 139% increase. This increase was due to substantially higher deposit balances, increased costs of the transaction account guarantee program and lower costs in the fourth quarter of 2009 resulting from accrual adjustments.
Other expenses increased to $7.7 million for the year ended December 31, 2010 from $5.6 million for the same period in 2009, an increase of 37%. For the three months ended December 31, 2010, other expenses amounted to $2.1 million as compared to $1.5 million for the same period in 2009, an increase of 41%. The major components of cost in this category include insurance expenses, broker fees, telephone, director fees, Maryland regulatory assessments, OREO expenses and other losses. For the year and three months ended December 31, 2010, the significant increases in this category as compared to the same periods in 2009 were primarily operating expenses of OREO properties, related valuation adjustments and losses on the sale of OREO properties, Maryland regulatory assessments and other losses.
Income Tax Expense
The Company recorded income tax expense of $9.1 million in 2010 compared to $6.0 million in 2009 and $4.1 million in 2008, resulting in an effective tax rate of 35.3%, 36.4% and 35.7%, respectively. The lower effective tax rate for 2010 relates to higher average tax exempt investments and loans, including associated tax credits.
Overview
At December 31, 2010, the Company's total assets were $2.1 billion, loans were $1.7 billion, deposits were $1.7 billion, borrowings, including customer repurchase agreements, were $146.9 million and stockholders' equity was $204.7 million. As compared to December 31, 2009, assets increased in 2010 by $283.9 million or 16%, loans by $276.2 million or 20%, deposits by $266.5 million or 18%, borrowings, including customer repurchase agreements decreased by $3.2 million or 2% and stockholders' equity increased by $16.4 million or 9%.
A substantial portion of the growth in 2010 in deposits is due to focused sales effort to attract more core deposit customers, and an emphasis on requiring loan customers to maintain deposits with the Bank. The dollar volume of time deposits has remained relatively unchanged at December 31, 2010 as compared to December 31, 2009, however, time deposits as a percentage of total deposits declined in 2010 as new deposits were increasingly attracted to higher rate money market accounts. Approximately 31% of the Bank's deposits at December 31, 2010 ($527.7 million), and 35% at December 31, 2009 ($509.7 million) were time deposits, which are generally the most expensive form of deposit because of their fixed rate and term.
On September 21, 2009, the Company completed an underwritten public offering of 6,731,640 shares of its common stock, at $8.20 per share, including 878,040 shares subject to the underwriter's over-allotment option. As a result of the capital raise, the number of shares of common stock subject to the warrants issued to the Treasury in December 2008 was reduced by 50% to 385,434.
45
Investment Securities Available-for-Sale ("AFS") and Short-Term Investments
The tables below and Note 3 to the Consolidated Financial Statements provide additional information regarding the Company's investment securities categorized as "available-for-sale" ("AFS"). The Company classifies all its investment securities as AFS. This classification requires that investment securities be recorded at their fair value with any difference between the fair value and amortized cost (the purchase price adjusted by any discount accretion or premium amortization) reported as a component of stockholders' equity (accumulated other comprehensive income), net of deferred income taxes. At December 31, 2010, the Company had a net unrealized gain in AFS securities of $3.5 million as compared to a net unrealized gain in AFS securities of $3.9 million at December 31, 2009. The deferred income tax liability at December 31, 2010 and 2009 related to these unrealized gains was $1.4 million and $1.6 million, respectively.
The AFS portfolio is comprised of U.S. Government agency securities (28% of AFS securities) with an average duration of 3.1 years, seasoned mortgage backed securities that are 100% agency issued (50% of AFS securities) which have an average expected life of 3.1 years with contractual maturities of the underlying mortgages of up to thirty years, municipal bonds (22% of AFS securities) which have an average duration of 8.9 years, and equity investments which comprise less than 1% of AFS securities. The equity investment includes common stock of three community banking companies which have an estimated fair value of $325 thousand, two tax lien certificates which have an estimated fair value of $40 thousand, and an equity interest in Community Bank Mortgage, LLC which has an estimated fair value of $8 thousand. Ninety nine percent (99%) of the investment securities which are debt instruments are rated AAA or AA. The remaining one percent (1%) of the investment securities which are debt instruments are municipal bonds which have a rating of A. All ratings represent investment grade issues.
At December 31, 2010, the investment portfolio amounted to $228.0 million as compared to a balance of $235.2 million at December 31, 2009, a decrease of 3%. The decrease in the portfolio coincided with an increase in loans held for sale beginning in the second quarter of 2010, which required higher levels of funding. The investment portfolio is managed to achieve goals related to income, liquidity, interest rate risk management and to provide collateral for customer repurchase agreements and other borrowing relationships.
The following table provides information regarding the composition of the Company's investment securities portfolio at the dates indicated. As earlier noted, amounts are reported at estimated fair value. The change in composition of the portfolio at December 31, 2010 as compared to 2009 was due principally to Asset Liability Committee decisions to increase the mix of municipal bonds, which was believed to represent good value and safety, and to increase holdings of structured mortgage backed securities issued by U.S. Government agencies or government sponsored enterprises which are believed to well position the Company in an increasing interest rate environment, which is anticipated over the next few years.
| |
December 31, | ||||||||||||||||||
|---|---|---|---|---|---|---|---|---|---|---|---|---|---|---|---|---|---|---|---|
| |
2010 | 2009 | 2008 | ||||||||||||||||
| (dollars in thousands) |
Balance | Percent of Total |
Balance | Percent of Total |
Balance | Percent of Total |
|||||||||||||
U. S. Government agency securities |
$ | 68,398 | 30.0 | % | $ | 76,107 | 32.4 | % | $ | 74,029 | 46.4 | % | |||||||
Residential mortgage backed securities |
109,909 | 48.2 | % | 125,396 | 53.3 | % | 79,770 | 50.0 | % | ||||||||||
Municipal bonds |
49,368 | 21.6 | % | 33,325 | 14.2 | % | 4,708 | 3.0 | % | ||||||||||
Other equity investments |
373 | 0.2 | % | 399 | 0.1 | % | 973 | 0.6 | % | ||||||||||
|
$ | 228,048 | 100 | % | $ | 235,227 | 100 | % | $ | 159,480 | 100 | % | |||||||
The growth in the investment portfolio in 2009 over 2008 was due in large part to investing a significant portion of the deposit growth in excess of loan growth that occurred in 2009.
46
The following table provides information, on an amortized cost basis, regarding the contractual maturity and weighted average yield of the investment portfolio at December 31, 2010. Expected maturities will differ from contractual maturities because borrowers may have the right to call or prepay obligations with or without call or prepayment penalties. Yields on tax exempt securities have not been calculated on a tax equivalent basis.
At December 31, 2010, there were no issuers, other than the U.S. Government and its agencies, whose securities owned by the Company had a book or fair value exceeding 10% of the Company's stockholders' equity.
| |
One Year or Less | After One Year Through Five Years | After Five Years Through Ten Years | After Ten Years | Total | ||||||||||||||||||||||||||
|---|---|---|---|---|---|---|---|---|---|---|---|---|---|---|---|---|---|---|---|---|---|---|---|---|---|---|---|---|---|---|---|
| (dollars in thousands) |
Amortized Cost |
Weighted Average Yield |
Amortized Cost |
Weighted Average Yield |
Amortized Cost |
Weighted Average Yield |
Amortized Cost |
Weighted Average Yield |
Amortized Cost |
Weighted Average Yield |
|||||||||||||||||||||
U. S. Government agency securities |
$ | — | — | $ | 60,175 | 2.04 | % | $ | 7,113 | 2.28 | % | $ | — | — | $ | 67,288 | 2.06 | % | |||||||||||||
Residential mortgage backed securities |
— | — | 2,240 | 4.30 | % | 38,286 | 3.22 | % | 66,899 | 3.78 | % | 107,425 | 3.59 | % | |||||||||||||||||
Muncipal bonds |
— | — | — | — | 7,250 | 4.52 | % | 42,209 | 5.46 | % | 49,459 | 5.32 | % | ||||||||||||||||||
Other equity investments |
— | — | — | — | — | — | — | — | 445 | 0.00 | % | ||||||||||||||||||||
|
$ | — | — | $ | 62,415 | 2.12 | % | $ | 52,649 | 3.27 | % | $ | 109,108 | 4.43 | % | $ | 224,617 | 3.51 | % | ||||||||||||
The Company also has a portfolio of short-term investments utilized for asset liability management needs which consist from time-to-time of discount notes, money market investments, and other bank certificates of deposit. This portfolio amounted to $11.7 million at December 31, 2010 as compared to $7.5 million at December 31, 2009.
Federal funds sold amounted to $34.0 million at December 31, 2010 as compared to $88.2 million at December 31, 2009. These funds represent excess daily liquidity which is invested on an unsecured basis with well capitalized banks, in amounts generally limited both in the aggregate and to any one bank.
Loan Portfolio
In its lending activities, the Company seeks to develop substantial relationships with clients whose businesses and individual banking needs will grow with the Bank. There has been a significant effort to grow the loan portfolio and to be responsive to the lending needs in the markets served, while maintaining sound asset quality.
Loan growth over the past year has been favorable, with loans outstanding reaching $1.7 billion at December 31, 2010, an increase of $276.2 million or 20% as compared to $1.4 billion at December 31, 2009, and increased $409.9 million or 32% as compared to $1.3 billion at December 31, 2008.
The Company had loan growth of $276.2 million during 2010, with $145.6 million, or 53% of loan growth for the year, being recorded in the fourth quarter of 2010. The loan growth was predominantly in the commercial, commercial real estate owner occupied, and investment commercial real estate segments. Traditional sources of credit for commercial real estate transactions remain constrained and the Bank has been able to capitalize on this environment and acquire significant new customers because of the Bank's ability and willingness to lend. Commercial real estate leasing in the Bank's market area has held up far better than in other markets and values have generally seen only minor declines. Meanwhile, multi-family properties in a number of sub-markets within the Bank's market area are experiencing normalized vacancy rates, indicating a balance of supply and demand. Construction loans increased modestly year over year as demand for new construction loans begins to return, and the Bank is selectively evaluating projects. Commercial loan growth was flat through the first quarter of the year, but picked up strongly during the second through fourth quarter of 2010 as several new and sizeable relationships were captured from other banks in the market. Consumer loan balances, a relatively minor focus of the Company's lending efforts, were essentially unchanged. The current mortgage rate environment is enticing many borrowers to
47
refinance their home equity line or loan balances into a new low rate first mortgage, although mortgage loan rates have been increasing over the past several months. This refinancing environment for first mortgage loans has impacted the Bank's ability to achieve growth in the home equity loan segment.
The Bank has a large portion of its loan portfolio related to real estate, with 69% consisting of commercial real estate, residential mortgage real estate and commercial and residential construction loans. Real estate also serves as collateral for loans made for other purposes, resulting in 73% of loans being secured by real estate.
The following table shows the trends in the composition of the loan portfolio over the past five years.
| |
Year Ended December 31, | |||||||||||||||||||||||||||||||
|---|---|---|---|---|---|---|---|---|---|---|---|---|---|---|---|---|---|---|---|---|---|---|---|---|---|---|---|---|---|---|---|---|
| |
2010 | 2009 | 2008 | 2007 | 2006 | |||||||||||||||||||||||||||
| (dollars in thousands) |
Amount | % | Amount | % | Amount | % | Amount | % | Amount | % | ||||||||||||||||||||||
Commercial |
$ | 411,744 | 26 | % | $ | 346,692 | 25 | % | $ | 334,999 | 27 | % | $ | 149,332 | 21 | % | $ | 132,981 | 21 | % | ||||||||||||
Investment—commercial real estate |
619,714 | 37 | % | 499,501 | 36 | % | 365,010 | 28 | % | 265,678 | 37 | % | 253,262 | 41 | % | |||||||||||||||||
Owner occupied—commercial real estate |
223,986 | 13 | % | 196,433 | 14 | % | 184,059 | 15 | % | 127,079 | 18 | % | 95,782 | 15 | % | |||||||||||||||||
Real estate mortgage—residential |
15,977 | 1 | % | 9,236 | 1 | % | 9,757 | 1 | % | 2,160 | — | 1,523 | — | |||||||||||||||||||
Construction—commercial and residential(1) |
308,081 | 18 | % | 252,695 | 18 | % | 283,020 | 22 | % | 110,115 | 15 | % | 86,524 | 14 | % | |||||||||||||||||
Home equity |
89,885 | 5 | % | 87,283 | 6 | % | 80,295 | 6 | % | 57,515 | 8 | % | 50,572 | 8 | % | |||||||||||||||||
Other consumer |
6,113 | — | 7,471 | — | 8,500 | 1 | % | 4,798 | 1 | % | 5,129 | 1 | % | |||||||||||||||||||
Total loans |
1,675,500 | 100 | % | 1,399,311 | 100 | % | 1,265,640 | 100 | % | 716,677 | 100 | % | 625,773 | 100 | % | |||||||||||||||||
Less: Allowance for credit losses |
(24,754 | ) | (20,619 | ) | (18,403 | ) | (8,037 | ) | (7,373 | ) | ||||||||||||||||||||||
Net loans |
$ | 1,650,746 | $ | 1,378,692 | $ | 1,247,237 | $ | 708,640 | $ | 618,400 | ||||||||||||||||||||||
- (1)
- Includes loans for land acquisition and development.
The Company has directly made higher risk loans that entail additional risks as compared to loans made following normal underwriting practices. These higher risk loan transactions, representing financing subordinated to loans made by the Bank or other parties, and occasionally referred to in this report as "subordinated financings" are currently made through the Company's subsidiary, ECV. This activity is limited as to individual transaction amount and total exposure amounts based on capital levels and is carefully monitored. Transactions are structured to provide ECV with returns commensurate to the risk through the requirement of additional interest following payoff of all loans, which additional interest is recorded as a component of non-interest income:
- •
- For the year ended December 31, 2010, the Company recorded $7 thousand of noninterest income and for 2009
and 2008 recorded $0 of noninterest income, from one subordinated financing transaction.
- •
- At December 31, 2010, ECV has $1.3 million of loans outstanding for higher risk loan transaction relating to one real estate project which is currently in a construction/sales phase. The loan is expected to be outstanding throughout 2011, with marketing and sales continuing until that time. Due to delays in scheduled sales activity, the borrower has posted additional interest reserves to keep the loan current through 2011.
48
Although the Company carefully underwrites each higher risk loan transaction and expects these transactions to provide additional revenues, there can be no assurance that any higher risk loan transaction, or the related loans made by the Bank, will prove profitable for the Company and Bank, that the Company will be able to receive any additional interest payments with respect to these loans, that any additional interest payments will be significant, or that the Company and Bank will not incur losses with respect to these transactions.
As noted above, a significant portion of the loan portfolio consists of commercial, construction and commercial real estate loans, primarily made in the Washington, D.C. metropolitan area and secured by real estate or other collateral in that market. Although these loans are made to a diversified pool of unrelated borrowers across numerous businesses, adverse developments in the Washington, D.C. metropolitan real estate market could have an adverse impact on this portfolio of loans and the Company's income and financial position. While our basic market area is the Washington, D.C. metropolitan area, in which 97% of our commercial real estate exposure exists, the Bank has made loans outside that market area where the nature and quality of such loans was consistent with the Bank's lending policies. At present, the Company believes that commercial real estate values are stable to improving in the specific sub-markets of the Washington, D.C. metropolitan market in which the Company has its most significant real estate exposure.
The federal banking regulators have issued guidance for those institutions which are deemed to have concentrations in commercial real estate lending. Pursuant to the supervisory criteria contained in the guidance for identifying institutions with a potential commercial real estate concentration risk, institutions which have (1) total reported loans for construction, land development, and other land which represent in total 100% or more of an institutions total risk-based capital; or (2) total commercial real estate loans representing 300% or more of the institutions total risk-based capital and the institution's commercial real estate loan portfolio has increased 50% or more during the prior 36 months are identified as having potential commercial real estate concentration risk. Institutions which are deemed to have concentrations in commercial real estate lending are expected to employ heightened levels of risk management with respect to their commercial real estate portfolios, and may be required to hold higher levels of capital. The Company, like many community banks, has a concentration in commercial real estate loans, and the Company has experienced significant growth in its commercial real estate portfolio in recent years. Commercial real estate loans and construction, land and land development loans represent 508% and 136%, respectively, of total risk based capital. Management has extensive experience in commercial real estate lending, and has implemented and continues to maintain heightened portfolio monitoring and reporting, and strong underwriting criteria with respect to its commercial real estate portfolio. The Company is well capitalized. Nevertheless, the Company could be required to maintain higher levels of capital as a result of our commercial real estate concentration, which could require us to obtain additional capital, and may adversely affect shareholder returns.
At December 31, 2010, the Company had no other concentrations of loans in any one industry exceeding 10% of its total loan portfolio. An industry for this purpose is defined as a group of businesses that are engaged in similar activities and have similar economic characteristics that would cause their ability to meet contractual obligations to be similarly affected by changes in economic or other conditions.
49
Loan Maturity
The following table sets forth the time to contractual maturity of the loan portfolio as of December 31, 2010.
| |
Due In | |||||||||||||||
|---|---|---|---|---|---|---|---|---|---|---|---|---|---|---|---|---|
| (dollars in thousands) |
Total | One Year or Less |
Over One to Five Years |
Over Five to Ten Years |
Over Ten Years |
|||||||||||
Commercial |
$ | 411,744 | $ | 184,470 | $ | 164,340 | $ | 26,581 | $ | 36,353 | ||||||
Owner occupied—commercial real estate |
223,986 | 18,722 | 57,386 | 109,816 | 38,062 | |||||||||||
Investment—commercial real estate |
619,714 | 106,856 | 327,323 | 172,520 | 13,015 | |||||||||||
Real estate mortgage—residential |
15,977 | 203 | 760 | 3,844 | 11,170 | |||||||||||
Construction—commercial and residential |
308,081 | 160,712 | 119,249 | 22,573 | 5,547 | |||||||||||
Home equity |
89,885 | 1,145 | 4,277 | 21,624 | 62,839 | |||||||||||
Other consumer |
6,113 | 3,051 | 1,335 | 423 | 1,304 | |||||||||||
Total loans |
$ | 1,675,500 | $ | 475,159 | $ | 674,670 | $ | 357,381 | $ | 168,290 | ||||||
Loans with: |
||||||||||||||||
Predetermined fixed interest rate |
$ | 567,193 | $ | 95,916 | $ | 386,201 | $ | 60,703 | $ | 24,373 | ||||||
Floating interest rate |
1,108,307 | 379,243 | 288,469 | 296,678 | 143,917 | |||||||||||
Total loans |
$ | 1,675,500 | $ | 475,159 | $ | 674,670 | $ | 357,381 | $ | 168,290 | ||||||
Loans are shown in the period based on final contractual maturity. Demand loans, having no contractual maturity and overdrafts, are reported as due in one year or less.
Allowance for Credit Losses
The provision for credit losses represents the amount of expense charged to current earnings to fund the allowance for credit losses. The amount of the allowance for credit losses is based on many factors which reflect management's assessment of the risk in the loan portfolio. Those factors include economic conditions and trends, the value and adequacy of collateral, volume and mix of the portfolio, performance of the portfolio, and internal loan processes of the Company and Bank.
Management has developed a comprehensive analytical process to monitor the adequacy of the allowance for credit losses. This process and guidelines were developed utilizing, among other factors, the guidance from federal banking regulatory agencies. The results of this process, in combination with conclusions of the Bank's outside loan review consultant, support management's assessment as to the adequacy of the allowance at December 31, 2010. During 2010, a provision for credit losses was made in the amount of $9.3 million and net charge-offs amounted to $5.2 million. A full discussion of the accounting for allowance for credit losses is contained in Note 1 to the Consolidated Financial Statements and activity in the allowance for credit losses is contained in Note 4 to the Consolidated Financial Statements. Also, please refer to the discussion under the caption, "Critical Accounting Policies" within Management's Discussion and Analysis of Financial Condition and Results of Operation for further discussion of the methodology which management employs to maintain an adequate allowance for credit losses, as well as the discussion under the caption "Provision for Credit Losses."
The allowance for credit losses represented 1.48% of total loans at December 31, 2010 as compared to 1.47% at December 31, 2009. At December 31, 2010, the allowance represented 98% of nonperforming loans as compared to 94% at December 31, 2009. The increase in the coverage ratio was due substantially to loan growth during 2010, as new credits exhibit lower levels of potential credit risk.
As part of its comprehensive loan review process, the Bank's Board of Directors, Director's Loan Committee and Credit Review Committee carefully evaluate loans which are past-due 30 days or more. The Committees make a thorough assessment of the conditions and circumstances surrounding each
50
delinquent loan. The Bank's loan policy requires that loans be placed on nonaccrual if they are ninety days past-due, unless they are well secured and in the process of collection. Additionally, Credit Administration specifically analyzes the status of development and construction projects, sales activities and utilization of interest reserves in order to carefully and prudently assess potential increased levels of risk which may require additional reserves.
At December 31, 2010, the Company had $25.3 million of loans classified as nonperforming, and $36.5 million of potential problem loans, as compared to $22.0 million of nonperforming loans and $20.9 million of potential problem loans at December 31, 2009. Please refer to Note 1 to the Consolidated Financial Statements under the caption "Loans" for a discussion of the Company's policy regarding impairment of loans. Please refer to "Nonperforming Assets" at page 53 for a discussion of problem and potential problem assets.
As the loan portfolio and allowance for credit losses review process continues to evolve, there may be changes to elements of the allowance and this may have an effect on the overall level of the allowance maintained. Historically, the Bank has enjoyed a high quality loan portfolio with relatively low levels of net charge-offs and low delinquency rates. In 2010, the Company witnessed a decreased level of net charge-offs and believes its level of net charge-offs and problem assets were below those of its peer banking companies. The maintenance of a high quality portfolio will continue to be a high priority for both management and the Board of Directors.
Management, being aware of the significant loan growth experienced by the Company, is intent on maintaining a strong credit review function and risk rating process. The Company has an experienced Credit Administration function, which provides independent analysis of credit requests and the management of problem credits. The Credit Department has developed and implemented analytical procedures for evaluating credit requests, has refined the Company's risk rating system, and has adopted enhanced monitoring of the loan portfolio (in particular the construction loan portfolio) and the adequacy of the allowance for credit losses, including stress test analyses. The loan portfolio analysis process is ongoing and proactive in order to maintain a portfolio of quality credits and to quickly identify any weaknesses before they become more severe.
51
The following table sets forth activity in the allowance for credit losses for the past five years.
| |
Year Ended December 31, | ||||||||||||||||
|---|---|---|---|---|---|---|---|---|---|---|---|---|---|---|---|---|---|
| (dollars in thousands) |
2010 | 2009 | 2008 | 2007 | 2006 | ||||||||||||
Balance at beginning of year |
$ | 20,619 | $ | 18,403 | $ | 8,037 | $ | 7,373 | $ | 5,985 | |||||||
Charge-offs: |
|||||||||||||||||
Commercial(1) |
2,495 | 3,705 | 481 | 1,005 | 369 | ||||||||||||
Investment—commercial real estate(2) |
719 | 488 | 29 | — | — | ||||||||||||
Owner occupied—commercial real estate |
246 | 239 | — | — | — | ||||||||||||
Real estate mortgage—residential |
— | 553 | — | — | — | ||||||||||||
Construction—commercial and residential(2) |
1,698 | 177 | 497 | — | — | ||||||||||||
Home equity |
43 | 427 | 124 | — | 15 | ||||||||||||
Other consumer |
21 | 191 | 86 | 26 | 5 | ||||||||||||
Total charge-offs |
5,222 | 5,780 | 1,217 | 1,031 | 389 | ||||||||||||
Recoveries: |
|||||||||||||||||
Commercial(1) |
37 | 274 | 44 | 37 | 27 | ||||||||||||
Investment—commercial real estate(2) |
3 | — | — | — | — | ||||||||||||
Owner occupied—commercial real estate |
— | — | — | — | — | ||||||||||||
Real estate mortgage—residential |
— | 2 | — | — | — | ||||||||||||
Construction—commercial and residential(2) |
7 | 2 | 50 | — | — | ||||||||||||
Home equity |
2 | — | — | — | — | ||||||||||||
Other consumer |
— | 49 | — | 15 | 5 | ||||||||||||
Total recoveries |
49 | 327 | 94 | 52 | 32 | ||||||||||||
Net charge-offs |
5,173 | 5,453 | 1,123 | 979 | 357 | ||||||||||||
Additions charged to operations |
9,308 | 7,669 | 3,979 | 1,643 | 1,745 | ||||||||||||
Acquired allowance—Fidelity |
— | — | 7,510 | — | — | ||||||||||||
Balance at end of year |
$ | 24,754 | $ | 20,619 | $ | 18,403 | $ | 8,037 | $ | 7,373 | |||||||
Ratio of allowance for credit losses to total loans outstanding at year end |
1.48 | % | 1.47 | % | 1.45 | % | 1.12 | % | 1.18 | % | |||||||
Ratio of net charge-offs during the year to average loans outstanding during the year |
0.34 | % | 0.42 | % | 0.12 | % | 0.15 | % | 0.06 | % | |||||||
- (1)
- Includes
SBA loans.
- (2)
- Includes loans for land acquisition and development.
The following table presents the allocation of the allowance for credit losses by loan category and the percent of loans each category bears to total loans. The allocation of the allowance at December 31, 2010 includes specific reserves of $3.9 million against impaired loans of $25.3 million as compared to specific reserves of $2.7 million against impaired loans of $22.0 million at December 31, 2009. The allocation of the allowance to each category is not necessarily indicative of future losses or charge-offs and does not restrict the usage of the allowance for any specific loan or category. The larger allowance at December 31, 2008, as
52
compared to December 31, 2007, reflects in large part the $7.5 million allowance acquired in the Fidelity acquisition.
| |
Year Ended December 31, | |||||||||||||||||||||||||||||||
|---|---|---|---|---|---|---|---|---|---|---|---|---|---|---|---|---|---|---|---|---|---|---|---|---|---|---|---|---|---|---|---|---|
| |
2010 | 2009 | 2008 | 2007 | 2006 | |||||||||||||||||||||||||||
| (dollars in thousands) |
Amount | %(1) | Amount | %(1) | Amount | %(1) | Amount | %(1) | Amount | %(1) | ||||||||||||||||||||||
Commercial |
$ | 8,630 | 26 | % | $ | 9,871 | 25 | % | $ | 8,923 | 27 | % | $ | 3,300 | 21 | % | $ | 3,379 | 21 | % | ||||||||||||
Investment—commercial real estate(2) |
6,668 | 37 | % | 3,328 | 36 | % | 2,103 | 28 | % | 1,447 | 37 | % | 1,515 | 41 | % | |||||||||||||||||
Owner occupied—commercial real estate |
2,064 | 13 | % | 3,167 | 14 | % | 2,746 | 15 | % | 1,606 | 18 | % | 1,285 | 15 | % | |||||||||||||||||
Real estate mortgage—residential |
115 | 1 | % | 28 | 1 | % | 58 | 1 | % | 21 | — | 40 | — | |||||||||||||||||||
Construction—commercial and residential(2) |
5,745 | 18 | % | 3,680 | 18 | % | 3,972 | 22 | % | 1,314 | 15 | % | 854 | 14 | % | |||||||||||||||||
Home equity |
1,441 | 5 | % | 382 | 6 | % | 394 | 6 | % | 233 | 8 | % | 176 | 8 | % | |||||||||||||||||
Other consumer |
91 | — | 163 | — | 207 | 1 | % | 116 | 1 | % | 124 | 1 | % | |||||||||||||||||||
Unallocated |
— | — | — | — | — | — | — | — | — | — | ||||||||||||||||||||||
Total allowance for credit losses |
$ | 24,754 | 100 | % | $ | 20,619 | 100 | % | $ | 18,403 | 100 | % | $ | 8,037 | 100 | % | $ | 7,373 | 100 | % | ||||||||||||
- (1)
- Represents
the percent of loans in each category to total loans.
- (2)
- Includes loans for land acquisition and development.
Nonperforming Assets
As shown in the table below, the Company's level of nonperforming assets, which are comprised of loans delinquent 90 days or more, nonaccrual loans, restructured loans and other real estate owned, totaled $32.0 million at December 31, 2010, representing 1.53% of total assets, as compared to $27.1 million at December 31, 2009, representing 1.50%. While the total amount of nonperforming assets at December 31, 2010 was higher than at December 31, 2009, the ratio of nonperforming loans to total loans was lower at December 31, 2010 as compared to December 31, 2009. The Company has been highly proactive in addressing existing and potential problem loans resulting from a weaker economy. Management remains attentive to early signs of deterioration in borrowers' financial conditions and to taking the appropriate action to mitigate risk. Furthermore, the Company is diligent in placing loans on nonaccrual status and believes, based on its loan portfolio risk analysis, that its allowance for loan losses at 1.48% of total loans at December 31, 2010 is adequate to absorb potential credit losses in the loan portfolio at that date.
Included in nonperforming assets at December 31, 2010 is Other Real Estate Owned ("OREO") of $6.7 million, consisting of eleven foreclosed properties. The Company had twelve OREO properties with a net carrying value of $5.1 million at December 31, 2009. OREO properties are carried at the lower of cost or appraised value less estimated costs to sell. It is the Company's policy to obtain third party appraisals prior to foreclosure, and to obtain updated third party appraisals on OREO properties not less frequently than annually. Generally, the Company would obtain updated appraisals or evaluations where it has reason to believe, based upon market indications (such as comparable sales, legitimate offers below carrying value, broker indications and similar factors), that the current appraisal does not accurately reflect current value. During the year of 2010, the Company sold eight foreclosed properties with a net carrying value of $2.7 million, recording a net loss on sale of $366 thousand.
53
Included in nonperforming assets are loans that we consider impaired. Impaired loans are defined as those which we believe it is probable that we will not collect all amounts due according to the contractual terms of the loan agreement, as well as that portion of loans whose terms have been modified in a troubled debt restructuring ("TDR") which have not shown a period of performance as required under applicable accounting standards. Valuation allowances for those loans determined to be impaired are evaluated in accordance with ASC Topic 310—"Receivables," and updated quarterly. For collateral dependent impaired loans, the carrying amount of the loan is determined by current appraised value less estimated costs to sell the underlying collateral, which may be adjusted downward under certain circumstances for actual events and/or changes in market conditions. For example, current average actual selling prices less average actual closing costs on an impaired multi unit real estate project may indicate the need for an adjustment in the appraised valuation of the project, which in turn could increase the associated ASC Topic 310 specific reserve for the loan. Generally, all appraisals associated with impaired loans are updated on a not less than annual basis.
Loans are considered to have been modified in a TDR when due to a borrower's financial difficulties the Company makes unilateral concessions to the borrower that it would not otherwise consider. Concessions could include interest rate reductions, principal or interest forgiveness, forbearance, and other actions intended to minimize economic loss and to avoid foreclosure or repossession of collateral. Alternatively, management, from time-to-time and in the ordinary course of business, implements renewals, modifications, extensions, and/or changes in terms of loans to borrowers who have the ability to repay on reasonable market-based terms, as circumstances may warrant. Such modifications are not considered to be TDR's as the accommodation of a borrower's request does not rise to the level of a concession and/or the borrower is not experiencing financial difficulty. For example, (1) adverse weather conditions may create a short term cash flow issue for an otherwise profitable retail business which suggests a temporary interest only period on an amortizing loan; (2) there may be delays in absorption on a real estate project which reasonably suggests extension of the loan maturity at market terms; or (3) there may be maturing loans to borrowers with demonstrated repayment ability who are not in a position at the time of maturity to obtain alternate long-term financing. The most common change in terms provided by the Company is an extension of an interest only term. The determination of whether a restructured loan is a TDR requires consideration of all of the facts and circumstances surrounding the change in terms, and the exercise of prudent business judgment. The Company had two TDR's at December 31, 2010, totaling approximately $4.4 million, $3.1 million of which was performing under modified terms at December 31, 2010. These loans have demonstrated a period of at least six months of performance under the modified terms.
Total nonperforming loans amounted to $25.3 million at December 31, 2010 (1.51% of total loans), compared to $22.0 million at December 31, 2009 (1.57% of total loans). Nonperforming loans increased by $3.3 million at December 31, 2010 as compared to 2009, as the ratio of nonperforming loans to total loans declined due to the larger loan portfolio at December 31, 2010, as compared to December 31, 2009.
54
The following table shows the amounts and relevant ratios of nonperforming assets at December 31 for the past five years:
| (dollars in thousands) |
2010 | 2009 | 2008 | 2007 | 2006 | ||||||||||||
|---|---|---|---|---|---|---|---|---|---|---|---|---|---|---|---|---|---|
Nonaccrual Loans: |
|||||||||||||||||
Commercial |
$ | 5,137 | $ | 4,364 | $ | 3,506 | $ | 1,174 | $ | 1,976 | |||||||
Investment—commercial real estate |
3,831 | 1,641 | 3,960 | 641 | — | ||||||||||||
Owner occupied—commercial real estate |
— | 526 | 207 | — | — | ||||||||||||
Real estate mortgage—residential |
760 | 259 | — | — | — | ||||||||||||
Construction—commercial and residential |
13,438 | 15,192 | 17,588 | 3,386 | — | ||||||||||||
Home equity |
297 | 42 | 196 | 123 | — | ||||||||||||
Other consumer |
535 | — | — | — | — | ||||||||||||
Accrual loans-past due 90 days: |
— | ||||||||||||||||
Commercial |
— | — | — | — | 37 | ||||||||||||
Real estate—commercial |
— | — | — | — | — | ||||||||||||
Other consumer |
— | — | — | — | — | ||||||||||||
Restructured loans(1) |
1,289 | — | — | — | — | ||||||||||||
Total nonperforming loans(2) |
25,287 | 22,024 | 25,457 | 5,324 | 2,013 | ||||||||||||
Other real estate owned |
6,701 | 5,106 | 909 | — | — | ||||||||||||
Total nonperforming assets |
$ | 31,988 | $ | 27,130 | $ | 26,366 | $ | 5,324 | $ | 2,013 | |||||||
Coverage ratio, allowance for credit losses to total nonperforming loans |
97.89 | % | 93.62 | % | 72.29 | % | 150.96 | % | 366.27 | % | |||||||
Ratio of nonperforming loans to total loans |
1.51 | % | 1.57 | % | 2.01 | % | 0.74 | % | 0.32 | % | |||||||
Ratio of nonperforming assets to total assets |
1.53 | % | 1.50 | % | 1.76 | % | 0.63 | % | 0.26 | % | |||||||
- (1)
- Excludes
TDRs returned to performing status totaling $3.1 million at December 31, 2010. These loans have demonstrated a period of a least six
months of performance under the modified terms.
- (2)
- Gross interest income that would have been recorded in 2010 if nonaccrual loans shown above had been current and in accordance with their original terms was $1.4 million, while interest actually recorded on such loans was $390 thousand. See Note 1 to the Consolidated Financial Statements for a description of the Company's policy for placing loans on nonaccrual status.
Significant variation in the amount of nonperforming loans may occur from period to period because the amount of nonperforming loans depends largely on the condition of a relatively small number of individual credits and borrowers relative to the total loan portfolio.
At December 31, 2010, there were $36.5 million of performing loans considered potential problem loans, defined as loans which are not included in the 90 day past due, nonaccrual or restructured categories, but for which known information about possible credit problems causes management to be uncertain as to the ability of the borrowers to comply with the present loan repayment terms which may in the future result in disclosure in the past due, nonaccrual or restructured loan categories. The $36.5 million in potential problem loans at December 31, 2010, compared to $31.1 million at September 30, 2010, and $20.9 million at December 31, 2009. There were $2.0 million of potential problem loans that comprised the $20.9 million in loans considered as potential problem loans at December 31, 2009, that migrated to nonperforming loan status over the course of 2010. The nonperforming loan balance at December 31, 2010, included $569 thousand of the loans that were considered potential problem loans at December 31, 2009. The Company maintains a conservative posture with respect to its risk ratings, which allows for early intervention in potential problem loan situations. Based upon their status as potential problem loans, these loans receive heightened scrutiny and ongoing intensive risk management. Additionally, the Company's loan loss allowance methodology incorporates increased reserve factors for certain loans considered
55
potential problem loans as compared to the general portfolio. See Allowance for Credit Losses on page 50 for a description of the allowance methodology.
Other Earning Assets
Residential mortgage loans held for sale amounted to $80.6 million at December 31, 2010 compared to $1.6 million at December 31, 2009. The significant increase in loans held for sale in 2010 was due to the Company's expansion of the residential mortgage origination and sales division in the second quarter of 2010. Origination and sale of these loans on a "servicing released" basis is emphasized by the Company in order to enhance noninterest income, which emphasis is expected to continue in 2011. Loans sold are subject to repurchase in circumstances where documentation is deficient or the underlying loan becomes delinquent within a specified period following sale and loan funding. There were no loan repurchases as a result of these defined events in 2010. While the Bank considers these potential recourse provisions to be a minimal risk, it has established a reserve based on the portfolio of loans subject to re-purchase. The Bank did not engage in the origination of subprime or "exotic" mortgage loans. See "Business" at page 1 for a description of the Bank's mortgage lending and brokerage activities.
Bank owned life insurance is utilized by the Company in accordance with income tax regulations as part of the Company's financing of its benefit programs. At December 31, 2010 this asset amounted to $13.3 million as compared to $12.9 million at December 31, 2009, which reflected an increase in cash surrender values, and not new investments.
Intangible Assets
The Company recognizes a servicing asset for the computed value of servicing fees on the sale of the guaranteed portion of SBA loans, which is in excess of a normal servicing fee. Assumptions related to loan term and amortization is made to arrive at the initial recorded value, which is included in intangible assets, net, on the Consolidated Balance Sheets.
For 2010, excess servicing fees of $82 thousand were recorded, and $88 thousand was amortized as a reduction of actual service fees collected, which is a component of other income. At December 31, 2010, the balance of excess servicing fees was $153 thousand. For 2009, excess servicing fees of $62 thousand were recorded, of which $88 thousand was amortized as a reduction of actual service fees collected, which is a component of other income. At December 31, 2009, the balance of excess servicing fees was $159 thousand.
In connection with the Fidelity acquisition, the Company made an allocation of the purchase price to a core deposit intangible which was determined by independent evaluation and is included in intangible assets, net, on the Consolidated Balance Sheets. The initial amount recorded was $2.3 million, which is being amortized over its remaining economic life of 5.2 years as a component of other noninterest expense. The amounts amortized in 2010 and 2009 were $185 thousand $186 thousand, respectively. The unamortized assets at December 31, 2010 and 2009 were $1.9 million and $2.1 million, respectively.
The Company recorded an initial amount of unidentified intangible (goodwill) incident to the acquisition of Fidelity of approximately $360 thousand. Based on allowable adjustments through August 31, 2009, the unidentified intangible (goodwill) amounted to approximately $2.2 million. The increase in goodwill year over year was the result of purchase accounting adjustments during the first year after the acquisition for write downs of assets that were overvalued at the date of the acquisition. The Company's testing of potential goodwill impairment (which is required annually) at December 31, 2010, resulted in no impairment being recorded.
56
Deposits and Other Borrowings
The principal sources of funds for the Bank are core deposits, consisting of demand deposits, NOW accounts, money market accounts, savings accounts and certificates of deposits from the local market areas surrounding the Bank's offices. The deposit base includes transaction accounts, time and savings accounts and accounts which customers use for cash management and which provide the Bank with a source of fee income and cross-marketing opportunities, as well as an attractive source of lower cost funds. To meet funding needs during periods of high loan demand and seasonal variations in core deposits, the Bank utilizes alternative funding sources such as secured borrowings from the FHLB federal funds purchased lines of credit from correspondent banks and brokered deposits from a regional brokerage firm, a national brokered funds network and from the Promontory Interfinancial Network, LLC network.
For the year ended December 31, 2010, total deposits increased $266.5 million, from $1.46 billion to $1.73 billion, or 18%, due largely to focused sales efforts in 2010 to attract more core deposit customers, and also due to the emphasis on requiring loan customers to place deposits with the Bank.
Approximately 31% of the Bank's deposits at December 31, 2010 ($527.7 million) were time deposits, which are generally the most expensive form of deposit because of their fixed rate and term, as compared to 35% at December 31, 2009 ($509.7 million). This decrease in the percentage of total deposits provided by the time deposit category at December 31, 2010 as compared to December 31, 2009, was due to new deposits being increasingly attracted to higher rate money market account promotions.
For the twelve months ended December 31, 2010, noninterest bearing deposits increased $92.3 million as compared to December 31, 2009 to $400.3 million or a growth rate of 30%, while interest bearing deposits increased by $174.2 million during the same period, a growth rate of 15%. Within interest bearing deposits, money market and savings accounts collectively amounted to $737.1 million at December 31, 2010 or 43% of total deposits, as compared to $582.9 million, or 40% of total deposits, at December 31, 2009, a 27% increase.
The following table sets forth the maturities of time deposits with balances of $100,000 or more, which represent 20% of total deposits as of December 31, 2010 and 2009, respectively. See Note 7 to the Consolidated Financial Statements for additional information regarding the maturities of time deposits and the Average Balances Table at page 39 for the average rates paid on interest-bearing deposits. Time deposits of $100 thousand or more can be more volatile and more expensive than time deposits of less than $100 thousand. However, because the Bank focuses on relationship banking, and its marketplace demographics are favorable, its historical experience has been that large time deposits have not been more volatile or significantly more expensive than smaller denomination certificates.
| |
December 31, | |||||||||
|---|---|---|---|---|---|---|---|---|---|---|
| (dollars in thousands) |
2010 | 2009 | 2008 | |||||||
Three months or less |
$ | 112,706 | $ | 89,318 | $ | 109,283 | ||||
More than three months through six months |
78,567 | 74,189 | 23,448 | |||||||
More than six months through twelve months |
108,181 | 74,152 | 91,832 | |||||||
Over twelve months |
45,293 | 58,540 | 24,953 | |||||||
Total |
$ | 344,747 | $ | 296,199 | $ | 249,516 | ||||
From time to time, when appropriate in order to fund strong loan demand, the Bank accepts brokered time deposits, generally in denominations of less than $100 thousand, from a regional brokerage firm, and other national brokerage networks, including the Promontory Interfinancial Network, LLC, for one-way purchased transactions. Additionally, the Bank participates in the Certificates of Deposit Account Registry Service ("CDARS"), which provides for reciprocal ("two-way") transactions among banks facilitated by the Promontory Interfinancial Network, LLC for the purpose of maximizing FDIC insurance. These reciprocal CDARS funds are classified as brokered deposits, although bank regulators have recognized
57
that these deposits have many tendencies as core deposits. At December 31, 2010, total time deposits included $151.6 million of brokered deposits, which represented 9% of total deposits. The CDARS component represented $91.5 million or 5% of total deposits. These sources are believed to represent a reliable and cost efficient alternative funding source for the Company. At December 31, 2009, total time deposits included $106.7 million of brokered deposits, which represented 7% of total deposits. The CDARS component represented $38.8 million, or 3% of total deposits. The higher level of wholesale funding during 2010 is attributable solely to higher levels of CDARS deposits, as other brokered deposits were reduced during 2010.
At December 31, 2010, the Company had approximately $400.3 million in noninterest bearing demand deposits, representing 23% of total deposits. This compared to approximately $308 million of these deposits at December 31, 2009 or 21% of total deposits. These deposits are primarily business checking accounts on which the payment of interest is prohibited by regulations of the Federal Reserve Board. As a result of the enactment of the Dodd-Frank Wall Street Reform and Consumer Protection Act ("Dodd Frank") banks are no longer prohibited from paying interest on demand deposits account, including those from businesses, effective in July 2011. It is not clear what effect the elimination of this prohibition will have on the Bank's interest expense, allocation of deposits, deposit pricing, loan pricing, net interest margin, ability to compete, ability to establish and maintain customer relationships, or profitability. The Bank is currently evaluating this and other portions of Dodd-Frank. Payment of interest on these deposits could have a significant negative impact on the Company's net interest income and net interest margin, net income, and the return on assets and equity, although no such effect is currently anticipated, as the payment of interest on accounts will not permit those business checking accounts above $250,000 to receive deposit insurance, a factor deemed important.
As an enhancement to the basic noninterest bearing demand deposit account, the Company offers a sweep account, or "customer repurchase agreement," allowing qualifying businesses to earn interest on short-term excess funds which are not suited for either a certificate of deposit or a money market account. The balances in these accounts were $97.6 million at December 31, 2010 compared to $90.8 million at December 31, 2009, the increase being attributed primarily to growth in escrow accounts from refinancing activities at December 31, 2010 as compared to the end of 2009. Customer repurchase agreements are not deposits and are not insured by the FDIC, but are collateralized by U.S. government agency securities or U.S. government agency mortgage backed securities. These accounts are particularly suitable to businesses with significant fluctuation in the levels of cash flows. Attorney and title company escrow accounts are an example of accounts which can benefit from this product, as are customers who may require collateral for deposits in excess of FDIC insurance limits but do not qualify for other pledging arrangements. This program requires the Company to maintain sufficient investment securities for pledging purposes to accommodate the fluctuations in balances which may occur in these customer repurchase agreement accounts.
The Company had no outstanding balances under its federal funds lines of credit provided by correspondent banks at December 31, 2010 and 2009, respectively. At December 31, 2010, the Bank had $40 million of borrowings outstanding under its credit facility from the FHLB, as compared to $50 million at December 31, 2009. Outstanding FHLB advances are secured by collateral consisting of a blanket lien on qualifying loans in the Bank's commercial mortgage and home equity loan portfolios.
In June 2010, the Company renewed its Loan Agreement and related Stock Security Agreement and Promissory Note (the "credit facility") with United Bank, pursuant to which the Company may borrow, on a revolving basis, up to $30 million for working capital purposes, to finance capital contributions to the Bank and ECV.
On August 30, 2010, the Company entered into and consummated a Note Exchange Agreement, pursuant to which the Company issued, on a private placement basis, to eight parties, all of which are current or former directors of the Company or accounts for the benefit of such persons, an aggregate of
58
$9.3 million of a new series of subordinated notes, in exchange for an equal principal amount of the Company's 10% Subordinated Notes dues September 30, 2014, which were issued in August 2008.
Please refer to "Capital Resources and Adequacy" at page 65, and Note 8 to the Consolidated Financial Statements for additional information regarding the Company's short and long-term borrowings.
COMPARISON OF 2009 VERSUS 2008
The Company reported net income of $10.4 million for the year ended December 31, 2009, a 40% increase from net income of $7.4 million for the year ended December 31, 2008. Net income available to common stockholders, which is after accrual of preferred stock dividends, was $8.1 million for year ended December 31, 2009, a 12% increase from net income available to common stockholders of $7.3 million for the year ended December 31, 2008.
The increase in net income for the twelve months ended December 31, 2009 can be attributed primarily to an increase in net interest income of 42% as compared to the same period in 2008. Net interest income growth was due substantially to growth in average earning assets of 49% in 2009.
Earnings per basic common share were $0.55 for the year ended December 31, 2009, as compared to $0.63 for 2008. Earnings per diluted common share were $0.55 for the year ended December 31, 2009, as compared to $0.62 for 2008. Per common share amounts and the number of shares have been adjusted to give effect to the 10% stock dividend paid on October 1, 2008. The decline in net income per common share for 2009 in part reflects the significant increase in the number of shares outstanding as a result of the Company's successful offering of common stock completed in September 2009.
The Company had a return on average assets of 0.65% and a return on average common equity of 6.60% for the year of 2009, as compared to returns on average assets and average equity of 0.69% and 8.05%, respectively, for the year of 2008.
The Company's earnings are largely dependent on net interest income, which represented 89% of total revenue in 2009 and 91% in 2008. For the twelve months ended December 31, 2009, the net interest margin, which measures the difference between interest income and interest expense (i.e. net interest income) as a percentage of earning assets declined from 4.05% for the twelve months ended December 31, 2008 to 3.85% for the twelve months ended December 31, 2009. This decline was due primarily to a reduced benefit of noninterest funding sources from 63 basis points in 2008 to 48 basis points for 2009, as average interest rates were lower in 2009 than in 2008. Average interest bearing liabilities funding average earning assets decreased to 77% as compared to 78% for the year of 2008. Additionally, while the average rate on earning assets for the twelve month period ended December 31, 2009, as compared to 2008 decreased by 87 basis points from 6.33% to 5.46%, the cost of interest bearing liabilities decreased by 82 basis points from 2.91% to 2.09%, resulting in a net interest spread of 3.37% for the twelve months ended December 31, 2009, as compared to 3.42% for the same period in 2008, a slight decline of 5 basis points. For the twelve months ended December 31, 2009, average noninterest sources funding earning assets were $355 million as compared to $225 million for the same period in 2008.
Due to favorable core deposit growth during 2009, the need to meet loan funding objectives did not require the expanded use of alternative funding sources, such as FHLB advances, correspondent bank lines of credit and brokered time deposits, the balances of which declined during 2009. The major component of the growth in core deposits was growth in a special money market account.
In terms of the average balance sheet composition or mix, loans, which generally have higher yields than securities and other earning assets, decreased from 88% of average earning assets in 2008 to 85% of average earning assets for 2009, as balance sheet liquidity evidenced by an increased level of average federal funds sold and other short term investments increased in 2009. Investment securities accounted for 12% and 11% of average earning assets for 2009 and 2008, respectively. Federal funds sold averaged 3% and 1% of average earning assets for 2009 and 2008, respectively. The higher average level of investments
59
and federal funds sold in 2009 (i.e. higher average liquidity) contributed to the decline in the net interest margin in 2009 as compared to 2008.
The provision for credit losses was $7.7 million for the year ended December 31, 2009 as compared to $4.0 million in 2008. The higher provisioning in 2009 as compared to 2008 is attributable to higher net charge-offs in 2009, $134 million in loan growth, risk migration within the portfolio due to a weaker economy and to increased reserves for problem loans. For the full year 2009, the Company recorded net charge-offs of $5.5 million, as compared to $1.1 million for the same period in 2008. The ratio of net charge-offs to average loans was 0.42% for 2009 and 0.12% for 2008. The amount of net charge-offs in 2009 was attributable to charge-offs in the unguaranteed portion of SBA loans ($496 thousand), commercial and industrial loans ($3.2 million), consumer loans ($568 thousand), mortgage loans ($552 thousand), commercial real estate investment property loans ($488 thousand) and owner occupied commercial real estate loans ($175 thousand).
At December 31, 2009, the allowance for credit losses was $20.6 million or 1.47% of total loans, as compared to $18.4 million or 1.45% of total loans at December 31, 2008. The higher allowance percentage in 2009, as compared to 2008, is primarily attributable to higher levels of classified loans and related reserve allocations.
Total noninterest income was $7.3 million for the year 2009 as compared to $4.4 million for 2008, an increase of 67%. This increase was due primarily to higher service charges on deposit accounts of $839 thousand resulting primarily from increased number of deposit accounts, gains realized on the sale of residential and SBA loans of $628 thousand, and gains realized on the investment securities portfolio of $1.5 million. Investment gains realized in the second quarter of 2009 were the result of asset/liability management decisions to reduce call risk in the portfolio of U.S. Agency securities, to reduce potential extension risk in longer term U.S. Agency mortgage backed securities and to better position the investment portfolio for potentially higher interest rates over future years. Increased gains from mortgage banking activities in 2009 reflect higher levels of mortgage refinancing given lower market interest rates.
Total noninterest expenses increased from $30.8 million for 2008 to $42.8 million for 2009, an increase of 39%. The primary reason for this increase was the Fidelity acquisition (completed August 31, 2008) and staff additions which increased the size of the organization, and other related personnel and benefit costs of $4.2 million, increased occupancy costs of $1.9 million, related in part to one new office and increased data processing costs of $734 thousand. In addition, higher costs were incurred for legal, accounting and professional fees of $1.7 million and FDIC deposit insurance premiums of $2.1 million, which includes the special FDIC assessment of approximately $723 thousand recorded in the second quarter of 2009 and reflects higher base premium rates and increased levels of insured deposits. Other expenses increased $1.3 million primarily due to $304 thousand in OREO expenses, other losses of $299 thousand resulting from the write-off of ATM/Overdrafts fees, director fees of $169 thousand and $123 thousand of intangible amortization. The efficiency ratio, which measures the level of non-interest expense to total revenue (defined as the sum of net interest income and noninterest income) was 64.01% for the year of 2009 as compared to 66.49% for 2008. While the Company continues to make strategic investments in infrastructure, attention to post-merger integration was emphasized in 2009, resulting in more efficient operations.
During the year of 2009, the allowance for credit losses increased $2.2 million reflecting $7.7 million in provision for credit losses and $5.5 million in net charge-offs during the period. The provision for credit losses of $7.7 million for 2009 compared to a provision for credit losses of $4.0 million for the same period in 2008. For 2009, net charge-offs amounted to $5.5 million as compared to $1.1 million for 2008. The higher provisioning in 2009 as compared to 2008 is attributable to higher net charge-offs in 2009, $134 million in loan growth, risk migration within the portfolio due to a weaker economy and to increased reserves for problem loans.
60
The Company recorded income tax expense of $6.0 million in 2009 compared to $4.1 million in 2008, resulting in an effective tax rate of 36.4% and 35.7%, respectively. The higher effective tax rate for 2009 relates to a higher marginal tax rate on increases in income.
At December 31, 2009, the Company's total assets were $1.8 billion, loans were $1.4 billion, deposits were $1.5 billion, other borrowings, including customer repurchase agreements, were $150.1 million and stockholders' equity was $188.3 million. As compared to December 31, 2008, assets grew in 2009 by $308.7 million (21%), loans by $133.7 million (11%), deposits by $330.9 million (29%), borrowings decreased by $65.9 million (30%) and stockholders' equity increased by $46.0 million (32%).
A substantial portion of the growth in deposits during 2009 is due to a successful money market campaign, commenced in the second quarter of 2009 which resulted in stronger deposit growth than loan growth in the second half of the year, and a resulting higher liquidity position in federal funds sold.
On September 21, 2009, the Company completed an underwritten public offering of 6,731,640 shares of its common stock, at $8.20 per share, including 878,040 shares subject to the underwriter's over-allotment option. As a result of the capital raise, the number of shares of common stock subject to the warrants issued to the Treasury in December 2008 was reduced by 50% to 385,434.
At December 31, 2009, the investment portfolio amounted to $235.2 million as compared to a balance of $159.5 million at December 31, 2008, an increase of 47%. The growth in the portfolio was due in large part to investing a significant portion of the deposit growth in excess of loan growth that occurred in the twelve months ended December 31, 2009. The investment portfolio is managed to achieve goals related to income, liquidity, interest rate risk management and to provide collateral for customer repurchase agreements and other borrowing relationships. The Company also has a portfolio of short-term investments utilized for asset liability management needs which consist from time-to-time of discount notes, money market investments, and other bank certificates of deposit. This portfolio amounted to $7.5 million at December 31, 2009 as compared to $2.5 million at December 31, 2008.
Federal funds sold amounted to $88.2 million at December 31, 2009 as compared to $191 thousand at December 31, 2008. These funds represent excess daily liquidity which is invested on an unsecured basis with well capitalized banks, in amounts generally limited both in the aggregate and to any one bank.
Loan growth over 2009 was favorable, with loans outstanding reaching $1.4 billion at December 31, 2009, an increase of $134 million or 11% as compared to $1.3 billion at December 31, 2008. The loan growth was predominantly in the commercial real estate segment. As conduits and Commercial Mortgage-Backed Securities credit sources dried up in late 2008 and through 2009, capital for real estate transactions became scarce. Many banks retracted their lending appetites as well, further contracting the supply of credit. The Company was able to capitalize on the demand/supply imbalance for credit with new loan fundings. Construction loans declined as projects came to completion and were paid off by permanent financing or sale. Demand for new construction loans declined sharply decreasing loan growth in that category during the year. Commercial and industrial loan growth was flat through the first half of the year, but picked up strongly during the second half of 2009. Consumer loan balances, a relatively minor focus of the Company's lending efforts, were essentially unchanged as consumers retrenched in the recessionary environment.
The allowance for credit losses represented 1.47% of total loans at December 31, 2009 as compared to 1.45% at December 31, 2008. This increase in the ratio of the allowance for credit losses was due substantially to increased reserves for problem loans. At December 31, 2009, the allowance represented 94% of nonperforming loans as compared to 72% at December 31, 2008. The increase in the coverage ratio was due substantially to loan growth during 2009 as new credits exhibit lower levels of potential credit risk.
61
At December 31, 2009, the Company had $22.0 million of loans classified as nonperforming, and $20.9 million of potential problem loans, as compared to $25.5 million of nonperforming loans and $3.6 million of potential problem loans at December 31, 2008. The Company's level of nonperforming assets, which are comprised of loans delinquent 90 days or more, nonaccrual loans, restructured loans and other real estate owned, totaled $27.1 million, at December 31, 2009, representing 1.50% of total assets. While the total amount of nonperforming assets at December 31, 2009 was slightly higher than at December 31, 2008, the ratio of nonperforming assets to total assets and nonperforming loans to total loans were both lower at December 31, 2009 as compared to December 31, 2008. Included in nonperforming assets at December 31, 2009 is OREO of $5.1 million, consisting of twelve foreclosed properties. The Company had four OREO properties with a net carrying value of $909 thousand at December 31, 2008. During the year of 2009, the Company sold six foreclosed properties with a net carrying value of $1.6 million, realizing a net gain of $164 thousand.
Residential mortgage loans held for sale amounted to $1.6 million at December 31, 2009 compared to $2.7 million at December 31, 2008. Origination and sale of these loans on a servicing released basis is emphasized by the Company in order to enhance noninterest income, which emphasis continued in 2010. The Bank did not engage in the origination of subprime or "exotic" mortgage loans.
Bank owned life insurance is utilized by the Company in accordance with income tax regulations as part of the Company's financing of its benefit programs. At December 31, 2009 this asset amounted to $12.9 million as compared to $12.4 million at December 31, 2008, which reflected an increase in cash surrender values, and not new investments.
For the twelve months ended December 31, 2009, noninterest bearing deposits increased $84.4 million as compared to December 31, 2008 to $308.0 million or 21% of total deposits, while interest bearing deposits increased by $246.5 million during the same period, primarily attributable to a marketing campaign begun in the second quarter of 2009 for money market accounts. Money market accounts and savings accounts collectively amounted to $582.9 million at December 31, 2009 or 40% of total deposits, as compared to $271.8 million, or 24% of total deposits, at December 31, 2008, a 114% increase.
For the year ended December 31, 2009, total deposits increased $331 million, from $1.13 billion to $1.46 billion, or 29%, due largely to focus sales efforts in 2009 to attract more core deposit customers, and also to the emphasis on requiring loan customers to place deposits with the Bank. Approximately 35% of the Bank's deposits at December 31, 2009 ($509.7 million) were time deposits, as compared to 51% at December 31, 2008 ($579.2 million). This decrease in the time deposit category at December 31, 2009 as compared to December 31, 2008 was due in part to migration of funds in response to higher rate money market account promotions.
At December 31, 2009, the Company had approximately $308 million in noninterest bearing demand deposits, representing 21% of total deposits. This compared to approximately $223.6 million of these deposits at December 31, 2008 or 20% of total deposits. The balance of customer repurchase agreements were $90.8 million at December 31, 2009 compared to $93.9 million at December 31, 2008, the decrease being attributed primarily to clients' reduced safety concerns over condition of the financial markets at December 31, 2009 as compared to the end of 2008, when financial markets were experiencing a period of heightened stress.
At December 31, 2009 the Company had no outstanding balances under its federal funds lines of credit provided by correspondent banks, as compared to $5.0 million outstanding at December 31, 2008. This decrease was due to the Company having an ample supply of core deposits to meet loan funding needs throughout 2009. At December 31, 2009, the Bank had $50 million of borrowings outstanding under its credit facility from the FHLB, as compared to $105 million at December 31, 2008. This decrease in borrowed funding was due to larger amounts of core deposits, primarily money market accounts, attributable in part to special rate promotions over the March-September 2009 period. Outstanding FHLB
62
advances are secured by collateral consisting of a blanket lien on qualifying loans in the Bank's commercial mortgage and home equity loan portfolios.
The Company has various financial obligations, including contractual obligations and commitments that may require future cash payments. Except for its loan commitments, as shown in Note 15 to the Consolidated Financial Statements—Financial Instruments with Off-Balance Sheet Risk, the following table shows details on these fixed and determinable obligations as of December 31, 2010 in the time period indicated.
(dollars in thousands)
|
Within One Year |
One to Three Years |
Three to Five Years |
Over Five Years |
Total | ||||||||||||
|---|---|---|---|---|---|---|---|---|---|---|---|---|---|---|---|---|---|
Deposits without a stated maturity(1) |
$ | 1,199,133 | $ | — | $ | — | $ | — | $ | 1,199,133 | |||||||
Time deposits(1) |
403,994 | 97,831 | 25,840 | — | 527,665 | ||||||||||||
Borrowed funds(2) |
97,584 | — | 30,000 | 19,300 | 146,884 | ||||||||||||
Operating lease obligations |
4,788 | 9,624 | 8,994 | 11,713 | 35,119 | ||||||||||||
Outside data processing(3) |
2,166 | 4,083 | 3,990 | — | 10,239 | ||||||||||||
Total |
$ | 1,707,665 | $ | 111,538 | $ | 68,824 | $ | 31,013 | $ | 1,919,040 | |||||||
- (1)
- Excludes
accrued interest payable at December 31, 2010.
- (2)
- Borrowed
funds include customer repurchase agreements, and other short-term and long-term borrowings.
- (3)
- The Bank has outstanding obligations under its current core data processing contract that expires in April 2015 and one other vendor arrangement that relates to data communications and data software that expires in December 2012.
OFF—BALANCE SHEET ARRANGEMENTS
The Company is party to financial instruments with off-balance-sheet risk in the normal course of business to meet the financing needs of its customers and to reduce its own exposure to fluctuations in interest rates. These financial instruments include commitments to extend credit and standby letters of credit. They involve, to varying degrees, elements of credit risk in excess of the amount recognized in the balance sheets. The contract or notional amounts of those instruments reflect the extent of involvement the Company has in particular classes of financial instruments.
The Company's exposure to credit loss in the event of nonperformance by the other party to the financial instrument for commitments to extend credit and standby letters of credit is represented by the contractual amount of those instruments. The Company uses the same credit policies in making commitments and conditional obligations as it does for on-balance-sheet instruments. See Note 15 to the Consolidated Financial Statements for a summary list of loan commitments at December 31, 2010 and 2009.
Loan commitments represent agreements to lend to a customer as long as there is no violation of any condition established in the contract and which have been accepted in writing by the borrower. Commitments generally have fixed expiration dates or other termination clauses and may require payment of a fee. Since some of the commitments may expire without being drawn upon, the total commitment amounts do not necessarily represent future cash requirements. The Company evaluates each customer's creditworthiness on a case-by-case basis. The amount of collateral obtained is based on management's credit evaluation of the borrower. Collateral obtained varies, and may include certificates of deposit, accounts receivable, inventory, property and equipment, residential and commercial real estate.
63
Standby letters of credit are conditional commitments issued by the Company which guarantee the performance of a customer to a third party. The credit risk involved in issuing letters of credit is essentially the same as that involved in extending loan facilities to customers. Collateral held varies as specified above and is required in instances which the Company deems necessary. At December 31, 2010, approximately 91% of the dollar amount of standby letters of credit was collateralized.
With the exception of these off-balance sheet arrangements, the Company has no off-balance sheet arrangements that have or are reasonably likely to have a current or future effect on the Company's financial condition, changes in financial condition, revenues or expenses, results of operations, capital expenditures or capital resources, that is material to investors.
Liquidity is a measure of the Company's and Bank's ability to meet loan demand and to satisfy depositor withdrawal requirements in an orderly manner. The Bank's primary sources of liquidity consist of cash and cash balances due from correspondent banks, loan repayments, federal funds sold and other short-term investments, maturities and sales of investment securities and income from operations. The Bank's investment portfolio of debt securities is held 100% in an available-for-sale status and has a substantial unrealized gain position, which allows for flexibility, subject to holdings held as collateral for customer repurchase agreements; to generate cash from sales as needed to meet ongoing loan demand. These sources of liquidity are considered primary and are supplemented by the ability of the Company and Bank to borrow funds, which are termed secondary sources and which are substantial. The Company's secondary sources of liquidity include a $30 million line of credit with United Bank, secured by the stock of the Bank, against which there were no amounts outstanding at December 31, 2010. Additionally, the Bank can purchase up to $82.5 million in federal funds on an unsecured basis from its correspondents, against which there were no amounts outstanding at December 31, 2010 and can borrow unsecured funds under one-way CDARS brokered deposits in the amount of $207.1 million, against which there was $448 thousand outstanding at December 31, 2010. At December 31, 2010, the Bank was also eligible to make advances from the FHLB up to $154.8 million based on collateral at the FHLB, of which it had $40 million of advances outstanding at December 31, 2010. Also, the Bank may enter into repurchase agreements as well as obtain additional borrowing capabilities from the FHLB provided adequate collateral exists to secure these lending relationships. The Bank also has a back-up borrowing facility through the Discount Window at the Federal Reserve Bank of Richmond ("Federal Reserve"). This facility, which amounts to approximately $144.0 million, is collateralized with specific loan assets identified to the Federal Reserve. It is anticipated, except for periodic testing, that this facility would be utilized for contingency funding only.
The loss of deposits, through disintermediation, is one of the greater risks to liquidity. Disintermediation occurs most commonly when rates rise and depositors withdraw deposits seeking higher rates in alternative savings and investment sources than the Bank may offer. The Bank was founded under a philosophy of relationship banking and, therefore, believes that it has less of an exposure to disintermediation and resultant liquidity concerns than do many banks. There is, however, a risk that some deposits would be lost if rates were to increase and the Bank elected not to remain competitive with its deposit rates. Under those conditions, the Bank believes that it is well positioned to use other sources of funds such as FHLB borrowings, brokered deposits, correspondent bank lines of credit and the Discount Window to offset a decline in core deposits in the short run. Over the long-term, an adjustment in assets and change in business emphasis could compensate for a potential loss of deposits. The Bank also maintains a marketable investment portfolio to provide flexibility in the event of significant liquidity needs. The Bank's Asset Liability Committee has adopted policy guidelines which emphasize the importance of core deposits and their continued growth. In the year ended December 31, 2010, the Bank was able to substantially increase its core deposits through both new relationships and increases to accounts of existing relationships.
64
At December 31, 2010, under the Bank's liquidity formula, it had $718.8 million of primary and secondary liquidity sources, which was deemed adequate to meet current and projected funding needs.
CAPITAL RESOURCES AND ADEQUACY
The assessment of capital adequacy depends on a number of factors such as asset quality and mix, liquidity, earnings performance, changing competitive conditions and economic forces, regulatory measures and policy, as well as the overall level of growth and complexity of the balance sheet. The adequacy of the Company's current and future capital needs is monitored by management on an ongoing basis. Management seeks to maintain a capital structure that will assure an adequate level of capital to support anticipated asset growth and to absorb potential losses.
The federal banking regulators have issued guidance for those institutions which are deemed to have concentrations in commercial real estate lending. Pursuant to the supervisory criteria contained in the guidance for identifying institutions with a potential commercial real estate concentration risk, institutions which have (1) total reported loans for construction, land development, and other land acquisitions which represent in total 100% or more of an institution's total risk-based capital; or (2) total commercial real estate loans representing 300% or more of the institution's total risk-based capital and the institution's commercial real estate loan portfolio has increased 50% or more during the prior 36 months are identified as having potential commercial real estate concentration risk. Institutions which are deemed to have concentrations in commercial real estate lending are expected to employ heightened levels of risk management with respect to their commercial real estate portfolios, and may be required to hold higher levels of capital. The Company, like many community banks, has a concentration in commercial real estate loans, and the Company has experienced significant growth in its commercial real estate portfolio in recent years. Commercial real estate loans and construction, land and land development loans represent 508% and 136%, respectively of total risk based capital. Management has extensive experience in commercial real estate lending, and has implemented and continues to maintain heightened risk management procedures, and strong underwriting criteria with respect to its commercial real estate portfolio. Nevertheless, we may be required to maintain higher levels of capital as a result of our commercial real estate concentration, which could require us to obtain additional capital, and may adversely affect shareholder returns.
The Company renewed its Loan Agreement and related Stock Security Agreement and Promissory Note (the "credit facility") with United Bank, pursuant to which the Company may borrow, on a revolving basis, up to $30 million for working capital purposes, to finance capital contributions to the Bank and ECV. The credit facility is secured by a first lien on all of the stock of the Bank, and bears interest at a floating rate equal to the Wall Street Journal Prime Rate minus 0.25% with a floor interest rate of 4.75%. Interest is payable on a monthly basis. The term of the credit facility expires on June 20, 2011. At any time, provided no event of default exists, the Company may term out repayment of up to $20 million of the credit facility up to a five year term. There were no amounts outstanding under this credit facility at December 31, 2010 or 2009.
On August 30, 2010, the Company entered into and consummated a Note Exchange Agreement, pursuant to which the Company issued, on a private placement basis, to eight parties, all of which are current or former directors of the Company or accounts for the benefit of such persons, an aggregate of $9.3 million of a new series of subordinated notes (the "New Notes"), in exchange for an equal principal amount of the Company's 10% Subordinated Notes dues September 30, 2014 (the "Old Notes"), which were issued in August 2008. The New Notes bear interest, payable on the first day of each month, at a fixed rate of 10.0% per year. The New Notes have a maturity of September 30, 2016. The New Notes are redeemable at the option of the Company, in whole or in part, on any interest payment date at the principal amount thereof, plus interest to the date of redemption. The New Notes are intended to qualify as Tier 2 capital for regulatory purposes to the fullest extent permitted. The payment of principal on the Notes may only be accelerated upon the occurrence of certain bankruptcy or receivership related events
65
relating to the Company or, to the extent permitted under capital rules to be adopted by the Federal Reserve Board pursuant to Dodd-Frank, a major bank subsidiary of the Company.
The issuance of the New Notes in exchange for the Old Notes (the "Exchange") is intended to enable the Company to maximize the capital treatment of its indebtedness. Under existing capital rules, the capital treatment of the Old Notes must be phased out, at a rate of 20% of the original principal amount per year. As a result, effective October 1, 2010, only 60% of the principal amount of the Old Notes would have been eligible for inclusion as Tier 2 capital. As a result of the Exchange, 100% of the principal amount of the New Notes is eligible for inclusion in capital. The capital treatment of the New Notes will be phased out in the last five years they are outstanding commencing in October 2011, at a rate of 20% per year.
On September 21, 2009, the Company completed an underwritten public offering of 6,731,640 shares of its common stock at an offering price of $8.20 per share, including 878,040 shares subject to the underwriter's over-allotment option. The offering, which constituted a "qualified equity offering" for purposes of the Series A Preferred Stock, generated gross cash proceeds of $55,199,448. As a result of the offering, the Company, in November 2009, received Treasury approval of the reduction of the number of shares of common stock subject to the Warrant. Accordingly, the discount on the preferred stock and the Warrant were reduced by $946 thousand in November 2009.
On December 23, 2009, the Company redeemed 15,000 shares of its Series A Preferred Stock. The aggregate redemption price was $15,079,166, including accrued but unpaid dividends. Following the redemption, 23,235 shares of Series A Preferred Stock ($23,235,000) remain outstanding, held by the Treasury.
At December 31, 2010, the capital position of the Company and its wholly-owned subsidiary, the Bank, continues to exceed regulatory requirements and guidelines. The primary indicators relied on by bank regulators in measuring the capital position are the Tier 1 risk-based capital ratio, Total risk-based capital ratio, and the Leverage ratio. Tier 1 capital consists of common and qualifying preferred stockholders' equity (including without limit the preferred stock issued to the Treasury) less goodwill and other intangibles. Total risk-based capital consists of Tier 1 capital, plus qualifying subordinated debt, and the qualifying portion of the allowance for credit losses, and for the Company to a limited extent, excess amounts of restricted core capital elements. Risk-based capital ratios are calculated with reference to risk-weighted assets, which are prescribed by regulation. The measure of Tier 1 capital to average assets for the prior quarter is often referred to as the Leverage ratio.
The Company's capital ratios were all well in excess of guidelines established by the Federal Reserve Board and the Bank's capital ratios were in excess of those required to be classified as a "well capitalized" institution under the prompt corrective action provisions of the Federal Deposit Insurance Act. The Company's and Bank's capital ratios at December 31, 2010 and 2009 are shown in Note 17 to the Consolidated Financial Statements.
The ability of the Company to continue to grow is dependent on its earnings and those of the Bank, the ability to obtain additional funds for contribution to the Bank's capital, through additional borrowings, through the sale of additional common stock or preferred stock, or through the issuance of additional qualifying equity equivalents, such as subordinated debt or trust preferred securities. The capital levels required to be maintained by the Company and Bank may be impacted as a result of the Bank's concentrations in commercial real estate loans. See "Regulation" at page 9 and "Risk Factors" at page 16.
IMPACT OF INFLATION AND CHANGING PRICES
The Consolidated Financial Statements and Notes thereto have been prepared in accordance with accounting principles generally accepted in the United States of America, which require the measurement of financial position and operating results in terms of historical dollars without considering the changes in the relative purchasing power of money over time due to inflation. The impact of inflation is reflected in
66
the increased cost of operations. Unlike most industrial companies, nearly all of our assets and liabilities are monetary in nature. As a result, interest rates have a greater impact on our performance than do the effects of general levels of inflation. Interest rates do not necessarily move in the same direction or to the same extent as the price of goods or services.
NEW AUTHORITATIVE ACCOUNTING GUIDANCE
Refer to Note 1 to the Consolidated Financial Statements for New Authoritative Accounting Guidance and their expected impact on the Company's Financial Statements.
ITEM 7A. QUANTITATIVE AND QUALITATIVE DISCLOSURES ABOUT MARKET RISK
Asset/Liability Management of Interest Rate Risk
A fundamental risk in banking is exposure to market risk, or interest rate risk, since a bank's net income is largely dependent on net interest income. The Asset Liability Committee ("ALCO") of the Bank's Board of Directors formulates and monitors the management of interest rate risk through policies and guidelines established by it and the full Board of Directors and through review of detailed analysis reports discussed quarterly. In its consideration of risk limits, the ALCO considers the impact on earnings and capital, the level and direction of interest rates, liquidity, local economic conditions, outside threats and other factors. Banking is generally a business of managing the maturity and repricing mismatch inherent in its asset and liability cash flows and to provide net interest income growth consistent with the Company's profit objectives. During the year ended December 31, 2010, the Company was able to both substantially increase its net interest income and manage its overall interest rate risk position.
The Company, through its ALCO, monitors the interest rate environment in which it operates and adjusts the rates and maturities of its assets and liabilities to remain competitive and to achieve its overall financial objectives subject to established risk limits. In the current and expected future interest rate environment, the Company has been restructuring its investment portfolio to mitigate prepayment risk in its portfolio of mortgage backed securities should rates remain at current levels and to mitigate extension risk in that same portfolio should rates increase. Additionally, the Company in 2010 restructured its FHLB advances to longer durations as much as possible given the very low interest rate environment, in an effort to secure attractive funding rates over the next three to four years. The growth of core deposits, which enhance franchise value and provide a stable funding source, has been a major objective which has been met by the Company during 2010, adding liquidity and enhanced asset sensitivity to the year end 2010 balance sheet, which includes the level of loans held for sale. The repricing duration of the deposit portfolio increased to 32 months at December 31, 2010 from 30 months at December 31, 2009, as the mix of deposits shifted from time deposits with relatively short duration to money market and demand accounts with longer effective durations.
The Company has continued its emphasis on funding loans in its marketplace, and has been able to achieve favorable loan pricing, including interest rate floors on many loan originations. These factors have resulted in less pressure on loan yields over the past twelve months, as average interest rates have declined, thereby contributing to enhancing the Company's net interest margin in 2010 as compared to 2009. Also, approximately 63% of total loans at December 31, 2010 (66% at December 31, 2009) have either variable interest rates, indexed primarily to the Wall Street Journal prime interest rate or are adjustable rate indexed primarily to the five year U.S. Treasury interest rate, with 37% of the loan portfolio at December 31, 2010 (34% at December 31, 2009) being fixed rate. Subject to interest rate floor rates, these variable and adjustable rate loans provide additional income opportunities should interest rates rise from current levels. The repricing duration of the loan portfolio remained low at eleven months at December 31, 2010 versus twelve months at December 31, 2009.
Within the investment portfolio, during 2010, the Company increased the mix of municipal securities which valuations and credit risk appeared attractive. The mix of both U.S. Agency bonds and mortgage
67
backed securities have been reduced in order to mitigate extension risk, as well as to accommodate substantial growth in the loans held for sale portfolio, primarily in the latter half of 2010. Taken together, extension risk and prepayment risk have been reduced in the investment portfolio during 2010, as pass-through mortgage backed securities have been reduced in favor of more structured products. The result of these actions has been to extend the duration of the investment portfolio to 46 months at December 31, 2010 as compared to 40 months at December 31, 2009. The net unrealized gain before tax on the investment portfolio decreased to approximately $3.5 million at December 31, 2010 from approximately $3.9 million at December 31, 2009, with realized gains of $1.3 million recorded for the year ended December 31, 2010.
There can be no assurance that the Company will be able to successfully achieve its optimal asset liability mix, as a result of competitive pressures, customer preferences and the inability to perfectly forecast future interest rates and movements.
One of the tools used by the Company to manage its interest rate risk is a static GAP analysis presented below. The Company also employs an earnings simulation model on a quarterly basis to monitor its interest rate sensitivity and risk and to model its balance sheet cash flows and its income statement effects in different interest rate scenarios. The model utilizes current balance sheet data and attributes and is adjusted for assumptions as to investment maturities (calls), loan prepayments, interest rates, the level of noninterest income and noninterest expense. The data is then subjected to a "shock test" which assumes a simultaneous change in interest rates up 100, 200 and 300 basis points or down 100, 200 and 300 basis points, along the entire yield curve, but not below zero. The results are analyzed as to the impact on net interest income, net income and the market equity over the next twelve and twenty-four month periods.
For the analysis presented below, at December 31, 2010, the simulation assumes a 50 basis point change in interest rates on money market and interest bearing transaction deposits for each 100 basis point change in market interest rates in a decreasing interest rate shock scenario with a floor of 10 basis points, and assumes a 70 basis point change in interest rates on money market and interest bearing transaction deposits for each 100 basis point change in market interest rates in an increasing interest rate shock scenario.
As quantified in the table below, the Company's analysis at December 31, 2010 shows a moderate effect on net interest income (over the next 12 months) as well as to the economic value of equity when interest rates are shocked both down 100, 200 and 300 basis points and up 100, 200 and 300 basis points due substantially to the significant level of variable rate and repriceable assets and liabilities. The repricing duration of the investment portfolio at December 31, 2010 is 3.9 years, the loan portfolio 0.9 years, the interest bearing deposit portfolio 2.3 years and the borrowed funds portfolio 1.4 years.
The following table reflects the result of simulation analysis on the December 31, 2010 asset and liabilities balances:
Change in interest rates (basis points)
|
Percentage change in net interest income |
Percentage change in net income |
Percentage change in market value of portfolio equity |
||||||||
|---|---|---|---|---|---|---|---|---|---|---|---|
| +300 | +2.9 | % | +6.7 | % | -1.1 | % | |||||
| +200 | +0.3 | % | +0.7 | % | +0.4 | % | |||||
| +100 | -0.5 | % | -1.3 | % | +0.6 | % | |||||
| 0 | — | — | — | ||||||||
| -100 | +0.3 | % | +0.7 | % | -4.1 | % | |||||
| -200 | -0.1 | % | -0.3 | % | -8.7 | % | |||||
| -300 | -2.8 | % | -6.4 | % | -15.0 | % | |||||
The results of simulation are within the policy limits adopted by the Company. For net interest income, the Company has adopted a policy limit of 10% for a 100 basis point change, 12% for a 200 basis point change, and 18% for a 300 basis point change. For the market value of equity, the Company has adopted a policy limit of 12% for a 100 basis point change, 15% for a 200 basis point change, and 20% for
68
a 300 basis point change. The changes in net interest income, net income and the economic value of equity in both a higher and lower interest rate shock scenario at December 31, 2010 are not considered to be material. The negative impact of -0.5% in net interest income and -1.3% in net income given a 100 basis point increase in market interest rates reflects in large measure interest rate floors that operate within many loan agreements. Until interest rates rise above the loan's floor interest rate, no additional interest income is achieved, causing some compression of net interest income as liability costs increase at a faster pace than asset yields.
During 2010, the Company continued to manage its interest rate sensitivity position to moderate levels of risk, as indicated in the simulation results above. While asset sensitivity was increased at December 31, 2010 as compared to 2009, the Company also experienced in 2010 significant increases in money market accounts which liabilities are highly rate sensitive. This change is manifested in a moderate negative impact on both net interest income and net income at December 31, 2010 as compared to the position at December 31, 2009. The change in the market value of equity is not materially different as compared to the position at December 31, 2009.
Generally speaking, the loss of economic value of portfolio equity in a lower interest rate environment is due to lower values of core deposits more than offsetting the gains in loan and investment values; while the gain of economic value of portfolio equity in a higher interest rate environment is due to higher value of core deposits more than offsetting lower values of fixed rate loans and investments. The Company believes its balance sheet is well positioned in the current interest rate environment.
Certain shortcomings are inherent in the method of analysis presented in the foregoing table. For example, although certain assets and liabilities may have similar maturities or repricing periods, they may react in different degrees to changes in market interest rates. Also, the interest rates on certain types of assets and liabilities may fluctuate in advance of changes in market interest rates, while interest rates on other types may lag behind changes in market rates. Additionally, certain assets, such as adjustable-rate mortgage loans, have features that limit changes in interest rates on a short-term basis and over the life of the loan. Further, in the event of a change in interest rates, prepayment and early withdrawal levels could deviate significantly from those assumed in calculating the tables. Finally, the ability of many borrowers to service their debt may decrease in the event of a significant interest rate increase.
During 2010, average market interest rates declined as compared to 2009 and the yield curve steepened as average short-term rates declined more than average long-term rates. The average two year U.S. Treasury rate declined by about 25 basis points and the average ten year U.S. Treasury rate declined by about 5 basis points. In that environment, the Company was able to increase its net interest spread and margin in 2010 as compared to 2009. The Company believes that the change in the net interest spread in 2010 as compared to 2009 has been consistent with its risk analysis at December 31, 2009.
GAP Analysis
Banks and other financial institutions earnings are significantly dependent upon net interest income, which is the difference between interest earned on earning assets and interest expense on interest bearing liabilities. This revenue represented 89% of the Company's revenue for the year ended December 31, 2010 and 2009, as compared to 91% of the Company's revenue for the year ended December 31, 2008.
In falling interest rate environments, net interest income is maximized with longer term, higher yielding assets being funded by lower yielding short-term funds, or what is referred to as a negative mismatch or GAP. Conversely, in a rising interest rate environment, net interest income is maximized with shorter term, higher yielding assets being funded by longer-term liabilities or what is referred to as a positive mismatch or GAP.
Based on the current economic environment, and anticipating higher interest rates over the next few years management, in the second quarter of 2010, restructured the composition of its investment portfolio by selling U.S. Agency securities to mitigate call risk, by selling 30 year mortgage backed securities to
69
mitigate extension risk and by purchasing seasoned 15 and 20 year mortgage backed securities and structured mortgage backed products to provide enhanced cash flows by increasing the portion of the investment portfolio that was amortizing. Additionally, the Company has increased the proportion of its tax exempt securities in the 10-15 year maturity range to provide attractive fully tax equivalent yields in a barbell approach to investing. These actions have had the effect of increasing the duration of the investment portfolio. On the liability side of the balance sheet, management has restructured certain FHLB advances to extend duration and has attracted large amounts of core money market accounts (which have longer durations) in an effort to build more client relationships. The Company's net interest spread and margin for the twelve months ended December 31, 2010 of 3.73% and 4.09% respectively were both improved from the net interest spread and margin for the twelve months ended December 31, 2009 of 3.37% and 3.85% respectively, evidence that the Company was well positioned at December 31, 2009 for lower interest rates, which did occur in 2010.
The Company's net interest margin increased during 2010 as compared to 2009 by 24 basis points (from 3.85% to 4.09%). The higher margin was due to lower funding costs for both deposits and borrowings more than offsetting declines in earning asset yields, owing in part to loan pricing strategies and floors in selected loan products.
The GAP position, which is a measure of the difference in maturity and repricing volume between assets and liabilities, is a means of monitoring the sensitivity of a financial institution to changes in interest rates. The chart below provides an indication of the sensitivity of the Company to changes in interest rates. A negative GAP indicates the degree to which the volume of repriceable liabilities exceeds repriceable assets in given time periods.
At December 31, 2010, the Company had a positive GAP position of approximately 19.1% of total assets out to three months and a positive cumulative GAP position of 12.7% out to 12 months; as compared to a positive GAP position of approximately 15.8% of total assets out to three months and a positive cumulative GAP position of 11.5% out to 12 months at December 31, 2009. The change in the GAP position at December 31, 2010 as compared to December 31, 2009 relates primarily to higher amounts of liquidity and short-term investments, to the acquisition of large amounts of money market and demand deposits which have longer duration and to the extension of terms for FHLB advances. The current position is within guideline limits established by the ALCO.
While management believes that this overall position creates a reasonable balance in managing its interest rate risk and maximizing its net interest margin within plan objectives, there can be no assurance as to actual results.
Management has carefully considered its strategy to maximize interest income by reviewing interest rate levels, economic indicators and call features within its investment portfolio (which aspects of risk have been reduced significantly) , as well as interest rate floors within its loan portfolio. These factors have been discussed with the ALCO and management believes that current strategies are appropriate to current economic and interest rate trends.
If interest rates increase, the Company's net interest income and net interest margin are expected to decline modestly due to an excess of rate sensitive assets over liabilities, adjusted for the impact of loan floors and the assumption of an increase in money market interest rates by 70% of the change in market interest rates.
If interest rates decline, the Company's net interest income and margin are expected to increase as the floors on the loan portfolio provide added value and variable rate deposits are reduced.
Because competitive market behavior does not necessarily track the trend of interest rates but at times moves ahead of financial market influences, the change in the cost of liabilities may be different than anticipated by the GAP model. If this were to occur, the effects of a declining interest rate environment may not be in accordance with management's expectations.
70
GAP Analysis
December 31, 2010
(dollars in thousands)
Repriceable in:
|
0-3 months | 4-12 months | 13-36 months | 37-60 months | Over 60 months | Total Rate Sensitive |
Non- sensitive |
Total Assets | |||||||||||||||||||
|---|---|---|---|---|---|---|---|---|---|---|---|---|---|---|---|---|---|---|---|---|---|---|---|---|---|---|---|
RATE SENSITIVE ASSETS: |
|||||||||||||||||||||||||||
Investment securities |
$ | 23,244 | $ | 16,004 | $ | 72,996 | $ | 41,913 | $ | 73,891 | $ | 228,048 | |||||||||||||||
Loans(1)(2) |
1,152,025 | 139,456 | 259,334 | 189,416 | 15,840 | 1,756,071 | |||||||||||||||||||||
Fed funds and other short-term investments |
45,700 | — | — | — | — | 45,700 | |||||||||||||||||||||
Other earning assets |
— | 13,342 | — | — | — | 13,342 | |||||||||||||||||||||
Total |
$ | 1,220,969 | $ | 168,802 | $ | 332,330 | $ | 231,329 | $ | 89,731 | $ | 2,043,161 | $ | 46,209 | $ | 2,089,370 | |||||||||||
RATE SENSITIVE LIABILITIES: |
|||||||||||||||||||||||||||
Noninterest bearing demand |
$ | 11,280 | $ | 33,838 | $ | 90,234 | $ | 90,234 | $ | 174,705 | $ | 400,291 | |||||||||||||||
Interest bearing transaction |
61,771 | — | — | — | — | 61,771 | |||||||||||||||||||||
Savings and money market |
515,950 | — | 110,561 | 110,560 | — | 737,071 | |||||||||||||||||||||
Time deposits |
135,478 | 269,026 | 97,775 | 25,386 | — | 527,665 | |||||||||||||||||||||
Customer repurchase agreements and fed funds purchased |
97,584 | — | — | — | — | 97,584 | |||||||||||||||||||||
Other borrowings |
— | — | 10,000 | 20,000 | 19,300 | 49,300 | |||||||||||||||||||||
Total |
$ | 822,063 | $ | 302,864 | $ | 308,570 | $ | 246,180 | $ | 194,005 | $ | 1,873,682 | $ | 10,972 | $ | 1,884,654 | |||||||||||
GAP |
$ | 398,906 | $ | (134,062 | ) | $ | 23,760 | $ | (14,851 | ) | $ | (104,274 | ) | $ | 169,479 | ||||||||||||
Cumulative GAP |
$ | 398,906 | $ | 264,844 | $ | 288,604 | $ | 273,753 | $ | 169,479 | |||||||||||||||||
Cumulative gap as percent of total assets |
19.09 | % | 12.68 | % | 13.81 | % | 13.10 | % | 8.11 | % | |||||||||||||||||
- (1)
- Includes
loans held for sale.
- (2)
- Non-accrual loans are included in the over 60 months category.
Over the next twelve months, as reflected in the GAP table above, the Company has an excess of rate sensitive assets over rate sensitive liabilities of 12.7% out to 12 months. During 2010, the Company has recognized the probability of higher interest rates and has repositioned both its investment portfolio and its borrowed funds to better position the Company for that probability, while not exposing the Company to negative effects should interest rates either stay fairly stable or decline.
Although NOW and MMA accounts are subject to immediate repricing, the Bank's GAP model has incorporated a repricing schedule to account for a lag in rate changes based on our experience, as measured by the amount of those deposit rate changes relative to the amount of rate change in assets.
71
ITEM 8. FINANCIAL STATEMENTS AND SUPPLEMENTARY DATA
Report of Stegman & Company
Independent Registered Public Accounting Firm
To
the Board of Directors and
Stockholders of Eagle Bancorp, Inc.
We have audited the accompanying consolidated balance sheets of Eagle Bancorp, Inc. (the "Company") as of December 31, 2010 and 2009, and the consolidated statements of operations, changes in stockholders' equity and cash flows for each of the years in the three-year period ended December 31, 2010. We also have audited the Company's internal control over financial reporting as of December 31, 2010, based on criteria established in Internal Control—Integrated Framework issued by the Committee of Sponsoring Organizations of the Treadway Commission (COSO). The Company's management is responsible for these financial statements, for maintaining effective internal control over financial reporting, and for its assessment of the effectiveness of internal control over financial reporting, included in the accompanying Management's Report on Internal Control over Financial Reporting. Our responsibility is to express an opinion on these consolidated financial statements and an opinion on the Company's internal control over financial reporting based on our audits.
We conducted our audits in accordance with the standards of the Public Company Accounting Oversight Board (United States). Those standards require that we plan and perform the audits to obtain reasonable assurance about whether the financial statements are free of material misstatement and whether effective internal control over financial reporting was maintained in all material respects. Our audits of the consolidated financial statements included examining, on a test basis, evidence supporting the amounts and disclosures in the financial statements, assessing the accounting principles used and significant estimates made by management, and evaluating the overall financial statement presentation. Our audit of internal control over financial reporting included obtaining an understanding of internal control over financial reporting, assessing the risk that a material weakness exists, and testing and evaluating the design and operating effectiveness of internal control based on the assessed risk. Our audits also included performing such other procedures as we considered necessary in the circumstances. We believe that our audits provide a reasonable basis for our opinions.
A company's internal control over financial reporting is a process designed to provide reasonable assurance regarding the reliability of financial reporting and the preparation of financial statements for external purposes in accordance with generally accepted accounting principles. A company's internal control over financial reporting includes those policies and procedures that (1) pertain to the maintenance of records that, in reasonable detail, accurately and fairly reflect the transactions and dispositions of the assets of the company; (2) provide reasonable assurance that transactions are recorded as necessary to permit preparation of financial statements in accordance with generally accepted accounting principles, and that receipts and expenditures of the company are being made only in accordance with authorizations of management and directors of the company; and (3) provide reasonable assurance regarding prevention or timely detection of unauthorized acquisition, use, or disposition of the company's assets that could have a material effect on the financial statements.
Because of its inherent limitations, internal control over financial reporting may not prevent or detect misstatements. Also, projections of any evaluation of effectiveness to future periods are subject to the risk that controls may become inadequate because of changes in conditions, or that the degree of compliance with the policies or procedures may deteriorate.
72
In our opinion, the consolidated financial statements referred to above present fairly, in all material respects, the financial position of Eagle Bancorp, Inc. as of December 31, 2010 and 2009, and the results of its operations and its cash flows for each of the years in the three-year period ended December 31, 2010 in conformity with accounting principles generally accepted in the United States of America. Also in our opinion, Eagle Bancorp, Inc. maintained, in all material respects, effective internal control over financial reporting as of December 31, 2010, based on criteria established in Internal Control—Integrated Framework issued by the Committee of Sponsoring Organizations of the Treadway Commission (COSO).
/s/ STEGMAN AND COMPANY
Baltimore,
Maryland
March 15, 2011
73
EAGLE BANCORP, INC.
Consolidated Balance Sheets
(dollars in thousands, except per share data)
| |
December 31, 2010 | December 31, 2009 | |||||||
|---|---|---|---|---|---|---|---|---|---|
Assets |
|||||||||
Cash and due from banks |
$ | 12,414 | $ | 21,955 | |||||
Federal funds sold |
34,048 | 88,248 | |||||||
Interest bearing deposits with banks and other short-term investments |
11,652 | 7,484 | |||||||
Investment securities available for sale, at fair value |
228,048 | 235,227 | |||||||
Federal Reserve and Federal Home Loan Bank stock |
9,528 | 10,417 | |||||||
Loans held for sale |
80,571 | 1,550 | |||||||
Loans |
1,675,500 | 1,399,311 | |||||||
Less allowance for credit losses |
(24,754 | ) | (20,619 | ) | |||||
Loans, net |
1,650,746 | 1,378,692 | |||||||
Premises and equipment, net |
9,367 | 9,253 | |||||||
Deferred income taxes |
14,471 | 12,455 | |||||||
Bank owned life insurance |
13,342 | 12,912 | |||||||
Intangible assets, net |
4,188 | 4,379 | |||||||
Other real estate owned |
6,701 | 5,106 | |||||||
Other assets |
14,294 | 17,826 | |||||||
Total Assets |
$ | 2,089,370 | $ | 1,805,504 | |||||
Liabilities and Stockholders' Equity Liabilities |
|||||||||
Deposits: |
|||||||||
Noninterest bearing demand |
$ | 400,291 | $ | 307,959 | |||||
Interest bearing transaction |
61,771 | 59,720 | |||||||
Savings and money market |
737,071 | 582,854 | |||||||
Time, $100,000 or more |
344,747 | 296,199 | |||||||
Other time |
182,918 | 213,542 | |||||||
Total deposits |
1,726,798 | 1,460,274 | |||||||
Customer repurchase agreements |
97,584 | 90,790 | |||||||
Other short-term borrowings |
— | 10,000 | |||||||
Long-term borrowings |
49,300 | 49,300 | |||||||
Other liabilities |
10,972 | 6,819 | |||||||
Total liabilities |
1,884,654 | 1,617,183 | |||||||
Stockholders' Equity |
|||||||||
Preferred stock, par value $.01 per share, shares authorized 1,000,000, Series A, $1,000 per share liquidation preference, shares issued and and outstanding 23,235, discount of $601 and $570, respectively, net |
22,582 | 22,612 | |||||||
Common stock, par value $.01per share; shares authorized 50,000,000, shares issued and outstanding 19,700,387 and 19,534,226, respectively |
197 | 195 | |||||||
Warrants |
946 | 946 | |||||||
Additional paid in capital |
130,382 | 129,211 | |||||||
Retained earnings |
48,551 | 33,024 | |||||||
Accumulated other comprehensive income |
2,058 | 2,333 | |||||||
Total stockholders' equity |
204,716 | 188,321 | |||||||
Total Liabilities and Stockholders' Equity |
$ | 2,089,370 | $ | 1,805,504 | |||||
See notes to consolidated financial statements.
74
EAGLE BANCORP, INC.
Consolidated Statements of Operations
Years Ended December 31,
(dollars in thousands, except per share
data)
| |
2010 | 2009 | 2008 | ||||||||||
|---|---|---|---|---|---|---|---|---|---|---|---|---|---|
Interest Income |
|||||||||||||
Interest and fees on loans |
$ | 89,384 | $ | 77,004 | $ | 59,901 | |||||||
Interest and dividends on investment securities |
6,992 | 7,138 | 5,459 | ||||||||||
Interest on balances with other banks and short-term investments |
108 | 94 | 98 | ||||||||||
Interest on federal funds sold |
174 | 102 | 199 | ||||||||||
Total interest income |
96,658 | 84,338 | 65,657 | ||||||||||
Interest Expense |
|||||||||||||
Interest on deposits |
16,886 | 20,956 | 19,543 | ||||||||||
Interest on customer repurchase agreements |
|||||||||||||
and federal funds purchased |
731 | 957 | 1,406 | ||||||||||
Interest on short-term borrowings |
27 | 611 | 546 | ||||||||||
Interest on long-term borrowings |
2,188 | 2,285 | 2,181 | ||||||||||
Total interest expense |
19,832 | 24,809 | 23,676 | ||||||||||
Net Interest Income |
76,826 | 59,529 | 41,981 | ||||||||||
Provision for Credit Losses |
9,308 | 7,669 | 3,979 | ||||||||||
Net Interest Income After Provision For Credit Losses |
67,518 | 51,860 | 38,002 | ||||||||||
Noninterest Income |
|||||||||||||
Service charges on deposits |
3,068 | 2,898 | 2,059 | ||||||||||
Gain on sale of loans |
2,836 | 1,054 | 426 | ||||||||||
Gain on sale of investment securities |
1,330 | 1,538 | 2 | ||||||||||
Increase in the cash surrender value of bank owned life insurance |
430 | 463 | 466 | ||||||||||
Other income |
1,578 | 1,344 | 1,413 | ||||||||||
Total noninterest income |
9,242 | 7,297 | 4,366 | ||||||||||
Noninterest Expense |
|||||||||||||
Salaries and employee benefits |
25,511 | 20,889 | 16,728 | ||||||||||
Premises and equipment expenses |
8,460 | 7,343 | 5,424 | ||||||||||
Marketing and advertising |
1,058 | 1,099 | 1,054 | ||||||||||
Data processing |
2,629 | 2,356 | 1,622 | ||||||||||
Legal, accounting and professional fees |
2,987 | 2,731 | 1,054 | ||||||||||
FDIC insurance |
2,692 | 2,743 | 642 | ||||||||||
Other expenses |
7,668 | 5,612 | 4,293 | ||||||||||
Total noninterest expense |
51,005 | 42,773 | 30,817 | ||||||||||
Income Before Income Tax Expense |
25,755 | 16,384 | 11,551 | ||||||||||
Income Tax Expense |
9,098 | 5,965 | 4,123 | ||||||||||
Net Income |
16,657 | 10,419 | 7,428 | ||||||||||
Preferred Stock Dividends and Discount Accretion |
1,299 | 2,307 | 177 | ||||||||||
Net Income Available to Common Shareholders |
$ | 15,358 | $ | 8,112 | $ | 7,251 | |||||||
Earnings Per Common Share |
|||||||||||||
Basic |
$ | 0.78 | $ | 0.55 | $ | 0.63 | |||||||
Diluted |
$ | 0.77 | $ | 0.55 | $ | 0.62 | |||||||
Dividends Declared Per Common Share |
$ | — | $ | — | $ | 0.11 | |||||||
See notes to consolidated financial statements.
75
EAGLE BANCORP, INC.
Consolidated Statements of Changes in Stockholders' Equity
For The Years Ended December 31, 2010, 2009 and 2008
(dollars in thousands, except share and per share data)
| |
Preferred Stock |
Warrants | Common Stock |
Additional Paid in Capital |
Retained Earnings |
Accumulated Other Comprehensive Income (Loss) |
Total Stockholders' Equity |
|||||||||||||||||
|---|---|---|---|---|---|---|---|---|---|---|---|---|---|---|---|---|---|---|---|---|---|---|---|---|
Balance January 1, 2008 |
$ | — | $ | — | $ | 97 | $ | 52,290 | $ | 28,195 | $ | 584 | $ | 81,166 | ||||||||||
Comprehensive Income |
||||||||||||||||||||||||
Net Income |
7,428 | 7,428 | ||||||||||||||||||||||
Other comprehensive income: |
||||||||||||||||||||||||
Unrealized gain on securities available for sale (net of taxes) |
1,769 | 1,769 | ||||||||||||||||||||||
Less: reclassification adjustment for gains net of taxes of $1 included in net income |
||||||||||||||||||||||||
|
(1 | ) | (1 | ) | ||||||||||||||||||||
Total Comprehensive Income |
1,768 | 9,196 | ||||||||||||||||||||||
Cash Dividends ($0.11 per share) |
(1,178 | ) | (1,178 | ) | ||||||||||||||||||||
Stock-based compensation |
311 | 311 | ||||||||||||||||||||||
Shares issued under dividend reinvestment plan—76,246 shares |
1 | 806 | 807 | |||||||||||||||||||||
Exercise of options for 126,827 shares of common stock |
1 | 441 | 442 | |||||||||||||||||||||
Tax benefit on non-qualified options exercised |
195 | 195 | ||||||||||||||||||||||
Shares issued to effect merger with Fidelity 1,638,031 shares, net of issuance costs of $96 |
16 | 13,037 | 13,053 | |||||||||||||||||||||
Net tangible asset value of Fidelity assets acquired |
181 | 181 | ||||||||||||||||||||||
Preferred shares and warrants issued, net of issuance costs |
36,312 | 1,892 | 38,204 | |||||||||||||||||||||
10% common stock dividend |
12 | 9,567 | (9,579 | ) | — | |||||||||||||||||||
Cash paid in lieu of fractional shares |
(6 | ) | (6 | ) | ||||||||||||||||||||
Balance December 31, 2008 |
36,312 | 1,892 | 127 | 76,822 | 24,866 | 2,352 | 142,371 | |||||||||||||||||
Comprehensive Income |
||||||||||||||||||||||||
Net Income |
10,419 | 10,419 | ||||||||||||||||||||||
Other comprehensive income: |
||||||||||||||||||||||||
Unrealized gain on securities available for sale (net of taxes) |
966 | 966 | ||||||||||||||||||||||
Less: reclassification adjustment for gains net of taxes of $553 included in net income |
||||||||||||||||||||||||
|
(985 | ) | (985 | ) | ||||||||||||||||||||
Total Comprehensive Income |
(19 | ) | 10,400 | |||||||||||||||||||||
Stock-based compensation |
578 | 578 | ||||||||||||||||||||||
Exercise of options for 38,645 shares of common stock |
1 | 122 | 123 | |||||||||||||||||||||
Tax benefit on non-qualified options exercised |
98 | 98 | ||||||||||||||||||||||
Shares issued in public offering—6,731,640 shares, net of issuance costs of $3,541 |
67 | 51,591 | 51,658 | |||||||||||||||||||||
Preferred stock dividends |
(1,885 | ) | (1,885 | ) | ||||||||||||||||||||
Preferred stock: |
||||||||||||||||||||||||
Redemption of Series A Preferred Stock—15,000 shares |
(15,000 | ) | (15,000 | ) | ||||||||||||||||||||
Warrants reduced by 385,434 warrants |
946 | (946 | ) | — | ||||||||||||||||||||
Issuance costs |
(22 | ) | (22 | ) | ||||||||||||||||||||
Discount accretion |
376 | (376 | ) | — | ||||||||||||||||||||
Balance December 31, 2009 |
22,612 | 946 | 195 | 129,211 | 33,024 | 2,333 | 188,321 | |||||||||||||||||
Comprehensive Income |
||||||||||||||||||||||||
Net Income |
16,657 | 16,657 | ||||||||||||||||||||||
Other comprehensive income: |
||||||||||||||||||||||||
Unrealized gain on securities available for sale (net of taxes) |
523 | 523 | ||||||||||||||||||||||
Less: reclassification adjustment for gains net of taxes of $532 included in net income |
||||||||||||||||||||||||
|
(798 | ) | (798 | ) | ||||||||||||||||||||
Total Comprehensive Income |
(275 | ) | 16,382 | |||||||||||||||||||||
Stock-based compensation |
585 | 585 | ||||||||||||||||||||||
Exercise of options for 80,734 shares of common stock |
2 | 451 | 453 | |||||||||||||||||||||
Tax benefit on non-qualified options exercised |
187 | 187 | ||||||||||||||||||||||
Capital raise issuance costs |
(52 | ) | (52 | ) | ||||||||||||||||||||
Preferred stock dividends |
(1,160 | ) | (1,160 | ) | ||||||||||||||||||||
Preferred stock: |
||||||||||||||||||||||||
Discount accretion |
(30 | ) | 30 | — | ||||||||||||||||||||
Balance December 31, 2010 |
$ | 22,582 | $ | 946 | $ | 197 | $ | 130,382 | $ | 48,551 | $ | 2,058 | $ | 204,716 | ||||||||||
See notes to consolidated financial statements.
76
EAGLE BANCORP, INC.
Consolidated Statements of Cash Flows
Years Ended December 31,
(dollars in thousands)
| |
2010 | 2009 | 2008 | |||||||||||
|---|---|---|---|---|---|---|---|---|---|---|---|---|---|---|
Cash Flows From Operating Activities: |
||||||||||||||
Net income |
$ | 16,657 | $ | 10,419 | $ | 7,428 | ||||||||
Adjustments to reconcile net income to net cash (used in) provided by operating activities: |
||||||||||||||
Decrease in deferred income taxes |
(1,833 | ) | (1,310 | ) | (1,643 | ) | ||||||||
Provision for credit losses |
9,308 | 7,669 | 3,979 | |||||||||||
Depreciation and amortization |
2,465 | 2,084 | 1,613 | |||||||||||
Gains on sale of loans |
(2,836 | ) | (1,054 | ) | (426 | ) | ||||||||
Origination of loans held for sale |
(453,784 | ) | (88,547 | ) | (29,071 | ) | ||||||||
Proceeds from sale of loans held for sale |
377,599 | 90,769 | 28,956 | |||||||||||
Net loss (gain) on sale of other real estate owned |
366 | (164 | ) | — | ||||||||||
Gain on sale of investment securities |
(1,330 | ) | (1,538 | ) | (2 | ) | ||||||||
Net increase in surrender value of Bank-owned life insurance |
(430 | ) | (463 | ) | (466 | ) | ||||||||
Stock-based compensation expense |
585 | 578 | 311 | |||||||||||
Excess tax benefit from stock-based compensation |
(187 | ) | (98 | ) | (195 | ) | ||||||||
Decrease (increase) in other assets |
3,448 | (8,197 | ) | (19,579 | ) | |||||||||
Increase (decrease) in other liabilities |
4,153 | (2,207 | ) | 2,163 | ||||||||||
Net cash (used in) provided by operating activities |
(45,819 | ) | 7,941 | (6,932 | ) | |||||||||
Cash Flows From Investing Activities: |
||||||||||||||
(Increase) decrease in interest bearing deposits—other banks |
(4,168 | ) | (4,995 | ) | 2,001 | |||||||||
Purchases of available for sale investment securities |
(129,282 | ) | (179,555 | ) | (63,056 | ) | ||||||||
Proceeds from maturities of available for sale securities |
64,470 | 52,210 | 20,399 | |||||||||||
Proceeds from sale / call of available for sale securities |
73,321 | 53,136 | 64,830 | |||||||||||
Purchases of Federal Reserve and Federal Home Loan Bank stock |
(9 | ) | (2,618 | ) | (6,481 | ) | ||||||||
Proceeds from repurchase of Federal Reserve and Federal Home Loan Bank stock |
898 | 1,800 | 1,752 | |||||||||||
Net increase in loans |
(285,675 | ) | (144,966 | ) | (191,577 | ) | ||||||||
Net cash received in acquisition |
— | — | 10,885 | |||||||||||
Proceeds from the sale of other real estate owned |
2,304 | 1,547 | — | |||||||||||
Bank premises and equipment acquired |
(2,579 | ) | (1,671 | ) | (1,422 | ) | ||||||||
Net cash used in investing activities |
(280,720 | ) | (225,112 | ) | (162,669 | ) | ||||||||
Cash Flows From Financing Activities: |
||||||||||||||
Increase in deposits |
266,524 | 330,894 | 111,708 | |||||||||||
Increase (decrease) in customer repurchase agreements and fed funds purchased |
6,794 | (8,012 | ) | (29,878 | ) | |||||||||
(Decrease) increase in other short-term borrowings |
(10,000 | ) | (45,000 | ) | 28,847 | |||||||||
(Decrease) increase in long-term borrowings |
— | (12,850 | ) | 32,150 | ||||||||||
Issuance of preferred stock and warrants |
— | — | 38,204 | |||||||||||
Issuance of common stock |
453 | 51,781 | 1,249 | |||||||||||
Excess tax benefit from stock-based compensation |
187 | 98 | 195 | |||||||||||
Redemption of Series A Preferred Stock |
— | (15,000 | ) | — | ||||||||||
Preferred stock dividends |
(1,160 | ) | (1,885 | ) | — | |||||||||
Common stock dividends and payment in lieu of fractional shares |
— | — | (1,178 | ) | ||||||||||
Net cash provided by financing activities |
262,798 | 300,026 | 181,297 | |||||||||||
Net (Decrease) Increase in Cash |
(63,741 | ) | 82,855 | 11,696 | ||||||||||
Cash and Cash Equivalents at Beginning of Year |
110,203 | 27,348 | 15,652 | |||||||||||
Cash and Cash Equivalents at End of Year |
$ | 46,462 | $ | 110,203 | $ | 27,348 | ||||||||
Supplemental Cash Flows Information: |
||||||||||||||
Interest paid |
$ | 20,092 | $ | 25,898 | $ | 22,380 | ||||||||
Income taxes paid |
$ | 8,847 | $ | 7,575 | $ | 6,088 | ||||||||
Stock issued for acquisition of Fidelity |
$ | — | $ | — | $ | 13,330 | ||||||||
Non-Cash Investing Activities |
||||||||||||||
Transfers from loans to other real estate owned |
$ | 2,070 | $ | 7,178 | $ | 909 | ||||||||
See notes to consolidated financial statements.
77
Eagle Bancorp, Inc.
Notes to Consolidated Financial Statements
for the Years Ended December 31, 2010, 2009 and 2008:
Note 1—Summary of Significant Accounting Policies
The Consolidated Financial Statements include the accounts of Eagle Bancorp, Inc. (the "Company") and its subsidiaries, EagleBank (the "Bank"), Eagle Commercial Ventures LLC ("ECV") and Bethesda Leasing, LLC (which holds title to and manages Other Real Estate Owned ("OREO") assets), and Eagle Insurance Services, LLC (recently organized) with all significant intercompany transactions eliminated. The investment in subsidiaries is recorded on the Company's books (Parent Only) on the basis of its equity in the net assets of the subsidiary. The accounting and reporting policies of the Company conform to accounting principles generally accepted in the United States of America and to general practices in the banking industry. Certain reclassifications have been made to amounts previously reported to conform to the classification made in 2010. The following is a summary of the more significant accounting policies.
Nature of Operations
The Company, through the Bank, conducts a full service community banking business, primarily in Montgomery County, Maryland; Washington, D.C.; and Fairfax County, Northern Virginia. The primary financial services offered by the Bank include real estate, commercial and consumer lending, as well as traditional deposit and repurchase agreement products. The Bank is also active in the origination and sale of residential mortgage loans and the origination of small business loans. The guaranteed portion of small business loans is typically sold through the Small Business Administration, in a transaction apart from the loan's origination. The Bank offers its products and services through thirteen banking offices and various electronic capabilities, including remote deposit services. ECV, a direct subsidiary of the Company, provides subordinated financing for the acquisition, development and construction of real estate projects. These transactions involve higher levels of risk, together with commensurate higher returns. Refer to—Higher Risk Lending—Revenue Recognition below.
Use of Estimates
The preparation of financial statements in conformity with accounting principles generally accepted in the United States requires management to make estimates and assumptions that affect the reported amounts of assets and liabilities and disclosure of contingent assets and liabilities at the date of the financial statements and the reported amounts of revenues and expenses during the reported period. Actual results could differ from those estimates.
Cash Flows
For purposes of reporting cash flows, cash and cash equivalents include cash and due from banks, and federal funds sold.
Loans Held for Sale
The Company engages in sales of residential mortgage loans and the guaranteed portion of Small Business Administration ("SBA") loans originated by the Bank. Loans held for sale are carried at the lower of aggregate cost or fair value. Fair value is derived from secondary market quotations for similar instruments. Gains and losses on sales of these loans are recorded as a component of noninterest income in the Consolidated Statements of Operations.
The Company's current practice is to sell residential mortgage loans on a servicing released basis, and, therefore, it has no intangible asset recorded for the value of such servicing as of December 31, 2010 or
78
Eagle Bancorp, Inc.
Notes to Consolidated Financial Statements
for the Years Ended December 31, 2010, 2009 and 2008: (Continued)
Note 1—Summary of Significant Accounting Policies (Continued)
2009. The sale of the guaranteed portion of SBA loans on a servicing retained basis gives rise to an Excess Servicing Asset, which is computed on a loan by loan basis and which unamortized amount is included in other assets. This Excess Servicing Asset is being amortized on a straight line basis (with adjustment for prepayments) as an offset of servicing fees collected and is included in other noninterest income.
The Company enters into commitments to originate residential mortgage loans whereby the interest rate on the loan is determined prior to funding (i.e. rate lock commitments). Such rate lock commitments on mortgage loans to be sold in the secondary market are considered to be derivatives. The period of time between issuance of a loan commitment and closing and sale of the loan generally ranges from 15 to 60 days. The Company protects itself from changes in interest rates through the use of best efforts forward delivery commitments, whereby the Company commits to sell a loan at a premium at the time the borrower commits to an interest rate with the intent that the buyer has assumed interest rate risk on the loan. As a result, the Company is not exposed to losses nor will it realize gains related to its rate lock commitments due to changes in interest rates.
The market values of rate lock commitments and best efforts contracts are not readily ascertainable with precision because rate lock commitments and best efforts contracts are not actively traded. Because of the high correlation between rate lock commitments and best efforts contracts, no gain or loss occurs on the rate lock commitments.
Investment Securities
The Company has no securities classified as trading, nor are any investment securities classified as held to maturity. Marketable equity securities and debt securities not classified as held to maturity or trading are classified as available-for-sale. Securities available-for-sale are acquired as part of the Company's asset/liability management strategy and may be sold in response to changes in interest rates, loan demand, changes in prepayment risk and other factors. Securities available-for-sale are carried at fair value, with unrealized gains or losses being reported as accumulated other comprehensive income, a separate component of stockholders' equity, net of deferred tax. Realized gains and losses, using the specific identification method, are included as a separate component of noninterest income. Premiums and discounts on investment securities are amortized / accreted to the earlier of call or maturity based on expected lives, which lives are adjusted for securities based on prepayments and call optionality. Declines in the fair value of individual available-for-sale securities below their cost that are other-than-temporary in nature result in write-downs of the individual securities to their fair value. Factors affecting the determination of whether other-than-temporary impairment has occurred include a downgrading of the security by a rating agency, a significant deterioration in the financial condition of the issuer, or a change in management's intent and ability to hold a security for a period of time sufficient to allow for any anticipated recovery in fair value. Management systematically evaluates investment securities for other-than-temporary declines in fair value on a quarterly basis. This analysis requires management to consider various factors, which include (1) duration and magnitude of the decline in value, (2) the financial condition of the issuer or issuers and (3) structure of the security.
The entire amount of an impairment loss is recognized in earnings only when (1) the Company intends to sell the debt security, (2) it is more likely than not that the Company will have to sell the security before recovery of its amortized cost basis or (3) the Company does not expect to recover the entire amortized cost basis of the security. In all other situations, only the portion of the impairment loss
79
Eagle Bancorp, Inc.
Notes to Consolidated Financial Statements
for the Years Ended December 31, 2010, 2009 and 2008: (Continued)
Note 1—Summary of Significant Accounting Policies (Continued)
representing the credit loss must be recognized in earnings, with the remaining portion being recognized in stockholders' equity as comprehensive income, net of deferred taxes.
Loans
Loans are stated at the principal amount outstanding, net of unamortized deferred costs and fees. Interest income on loans is accrued at the contractual rate on the principal amount outstanding. It is the Company's policy to discontinue the accrual of interest when circumstances indicate that collection is doubtful. Deferred fees and costs on loans originated through October 2005 are being amortized on the straight line method over the term of the loan. Deferred fees and costs on loans originated subsequent to October 2005 are being amortized on the interest method over the term of the loan. The difference between the straight line method and the interest method was considered immaterial.
Management considers loans impaired when, based on current information, it is probable that the Company will not collect all principal and interest payments according to contractual terms. Loans are evaluated for impairment in accordance with the Company's portfolio monitoring and ongoing risk assessment procedures. Management considers the financial condition of the borrower, cash flow of the borrower, payment status of the loan, and the value of the collateral, if any, securing the loan. Generally, impaired loans do not include large groups of smaller balance homogeneous loans such as residential real estate and consumer type loans which loans are evaluated collectively for impairment and are generally placed on non-accrual when the loan becomes 90 days past due as to principal or interest. Loans specifically reviewed for impairment are not considered impaired during periods of "minimal delay" in payment (ninety days or less) provided eventual collection of all amounts due is expected. The impairment of a loan is measured based on the present value of expected future cash flows discounted at the loan's effective interest rate, or the fair value of the collateral if repayment is expected to be provided solely by the collateral. In appropriate circumstances, interest income on impaired loans may be recognized on the cash basis.
Higher Risk Lending—Revenue Recognition
The Company has occasionally made higher risk acquisition, development, and construction (ADC) loans that entail higher risks than ADC loans made following normal underwriting practices ("higher risk loan transactions"). These higher risk loan transactions are currently made through the Company's subsidiary, ECV. This activity is limited as to individual transaction amount and total exposure amounts based on capital levels and is carefully monitored. The loans are carried on the balance sheet at amounts outstanding and meet the loan classification requirements of the Accounting Standard Executive Committee ("AcSEC") guidance reprinted from the CPA Letter, Special Supplement, dated February 10, 1986 (also referred to as Exhibit 1 to AcSEC Practice Bulletin No. 1). Additional interest earned on these higher risk loan transactions (as defined in the individual loan agreements) is recognized as realized under the provisions contained in AcSEC's guidance reprinted from the CPA Letter, Special Supplement, dated February 10, 1986 (also referred to as Exhibit 1 to AcSEC Practice Bulletin No.1) and Staff Accounting Bulletin No. 101 (Revenue Recognition in Financial Statements). The additional interest is included as a component of noninterest income. ECV recorded no additional interest on higher risk transactions during 2010 and 2009 (although normal interest income was recorded) and had one higher risk lending transaction outstanding as of December 31, 2010 and December 31, 2009, amounting to $1.3 million and $1.6 million, respectively.
80
Eagle Bancorp, Inc.
Notes to Consolidated Financial Statements
for the Years Ended December 31, 2010, 2009 and 2008: (Continued)
Note 1—Summary of Significant Accounting Policies (Continued)
Allowance for Credit Losses
The allowance for credit losses represents an amount which, in management's judgment, is adequate to absorb probable losses on existing loans and other extensions of credit that may become uncollectible. The adequacy of the allowance for credit losses is determined through careful and continuous review and evaluation of the loan portfolio and involves the balancing of a number of factors to establish a prudent level of allowance. Among the factors considered in evaluating the adequacy of the allowance for credit losses are lending risks associated with growth and entry into new markets, loss allocations for specific credits, the level of the allowance to nonperforming loans, historical loss experience, economic conditions, portfolio trends and credit concentrations, changes in the size and character of the loan portfolio, and management's judgment with respect to current and expected economic conditions and their impact on the existing loan portfolio. Allowances for impaired loans are generally determined based on collateral values. Loans or any portion thereof deemed uncollectible are charged against the allowance, while recoveries are credited to the allowance. Management adjusts the level of the allowance through the provision for credit losses, which is recorded as a current period operating expense. The allowance for credit losses consists of allocated and unallocated components.
The components of the allowance for credit losses represent an estimation done pursuant to Accounting Standards Codification ("ASC") Topic 450, "Contingencies," or ASC Topic 310, "Receivables." Specific allowances are established in cases where management has identified significant conditions or circumstances related to a specific credit that management believes indicate the probability that a loss may be incurred. For potential problem credits for which specific allowance amounts have not been determined, the Company establishes allowances according to the application of credit risk factors. These factors are set by management and approved by the appropriate Board Committee to reflect its assessment of the relative level of risk inherent in each risk grade. A third component of the allowance computation, termed a nonspecific or environmental factors allowance, is based upon management's evaluation of various environmental conditions that are not directly measured in the determination of either the specific allowance or formula allowance. Such conditions include general economic and business conditions affecting key lending areas, credit quality trends (including trends in delinquencies and nonperforming loans expected to result from existing conditions), loan volumes and concentrations, specific industry conditions within portfolio categories, recent loss experience in particular loan categories, duration of the current business cycle, bank regulatory examination results, findings of outside review consultants, and management's judgment with respect to various other conditions including credit administration and management and the quality of risk identification systems. Executive management reviews these environmental conditions quarterly, and documents the rationale for all changes.
Management believes that the allowance for credit losses is adequate; however, determination of the allowance is inherently subjective and requires significant estimates. While management uses available information to recognize losses on loans, future additions to the allowance may be necessary based on changes in economic conditions. Evaluation of the potential effects of these factors on estimated losses involves a high degree of uncertainty, including the strength and timing of economic cycles and concerns over the effects of a prolonged economic downturn in the current cycle. In addition, various regulatory agencies, as an integral part of their examination process, and independent consultants engaged by the Bank periodically review the Bank's loan portfolio and allowance for credit losses. Such review may result in recognition of additions to the allowance based on their judgments of information available to them at the time of their examination.
81
Eagle Bancorp, Inc.
Notes to Consolidated Financial Statements
for the Years Ended December 31, 2010, 2009 and 2008: (Continued)
Note 1—Summary of Significant Accounting Policies (Continued)
Premises and Equipment
Premises and equipment are stated at cost less accumulated depreciation and amortization computed using the straight-line method for financial reporting purposes. Premises and equipment are depreciated over the useful lives of the assets, which generally range from seven years for furniture, fixtures and equipment, three to five years for computer software and hardware, and ten to forty years for buildings and building improvements. Leasehold improvements are amortized over the terms of the respective leases, which may include renewal options where management has the positive intent to exercise such options, or the estimated useful lives of the improvements, whichever is shorter. The costs of major renewals and betterments are capitalized, while the costs of ordinary maintenance and repairs are expensed as incurred. These costs are included as a component of premises and equipment expenses on the Consolidated Statements of Operations.
Other Real Estate Owned (OREO)
Assets acquired through loan foreclosure are held for sale and are initially recorded at the lower of cost or fair value less estimated selling costs when acquired, establishing a new cost basis. The new basis is supported by recent appraisals. Costs after acquisition are generally expensed. If the fair value of the asset declines, a write-down is recorded through expense. The valuation of foreclosed assets is subjective in nature and may be adjusted in the future because of changes in economic conditions or review by regulatory examiners.
Goodwill and Other Intangible Assets
Goodwill and other intangible assets are subject to impairment testing at least annually, or when events or changes in circumstances indicate the assets might be impaired. Intangible assets (other than goodwill) are amortized to expense using accelerated or straight-line methods over their respective estimated useful lives. The Company's testing of potential goodwill impairment (which is required annually) at December 31, 2010, resulted in no impairment being recorded.
Customer Repurchase Agreements
The Company enters into agreements under which it sells securities subject to an obligation to repurchase the same securities. Under these arrangements, the Company may transfer legal control over the assets but still retain effective control through an agreement that both entitles and obligates the Company to repurchase the assets. As a result, securities sold under agreements to repurchase are accounted for as collateralized financing arrangements and not as a sale and subsequent repurchase of securities. The agreements are entered into primarily as accommodations for large commercial deposit customers. The obligation to repurchase the securities is reflected as a liability in the Company's Consolidated Statement of Condition, while the securities underlying the securities sold under agreements to repurchase remain in the respective assets accounts and are delivered to and held as collateral by third party trustees.
Marketing and Advertising
Marketing and advertising costs are generally expensed as incurred.
82
Eagle Bancorp, Inc.
Notes to Consolidated Financial Statements
for the Years Ended December 31, 2010, 2009 and 2008: (Continued)
Note 1—Summary of Significant Accounting Policies (Continued)
Income Taxes
The Company employs the liability method of accounting for income taxes as required by ASC Topic 740, "Income Taxes." Under the liability method, deferred-tax assets and liabilities are determined based on differences between the financial statement carrying amounts and the tax bases of existing assets and liabilities (i.e., temporary timing differences) and are measured at the enacted rates that will be in effect when these differences reverse. The Company utilizes statutory requirements for its income tax accounting, and avoids risks associated with potentially problematic tax positions that may incur challenge upon audit, where an adverse outcome is more likely than not. Therefore, no provisions are made for either uncertain tax positions nor accompanying potential tax penalties and interest for underpayments of income taxes in the Company's tax reserves. In accordance with ASC Topic 740, the Company may establish a reserve against deferred tax assets in those cases where realization is less than certain.
Transfer of Financial Assets
Transfers of financial assets are accounted for as sales, when control over the assets has been surrendered. Control over transferred assets is deemed to be surrendered when (1) the assets have been isolated from the Company, (2) the transferee obtain the right (free of conditions that constrain it from taking advantage of that right) to pledge or exchange the transferred assets, and (3) the Company does not maintain effective control over the transferred assets through an agreement to repurchase them before their maturity. In certain cases, the recourse to the Bank to repurchase assets may exist but be deemed immaterial based on the specific facts and circumstances.
Earnings per Common Share
Basic net income per common share is derived by dividing net income available to common stockholders by the weighted-average number of common shares outstanding during the period measured. Diluted earnings per common share is computed by dividing net income available to common stockholders by the weighted-average number of common shares outstanding during the period measured including the potential dilutive effects of common stock equivalents. Earnings per common share have been adjusted to give retroactive effect to all stock splits and stock dividends.
Stock-Based Compensation
Effective January 2006, in accordance with ASC Topic 718, "Compensation," the Company records as compensation expense an amount equal to the amortization (over the remaining service period) of the fair value (computed at the date of option grant) of any outstanding fixed stock option grants and restricted stock awards which vest subsequent to December 31, 2005. Compensation expense on variable stock option grants (i.e. performance based grants) is recorded based on the probability of achievement of the goals underlying the performance grant. Refer to Note 13 for a description of stock-based compensation awards, activity and expense for the years ended December 31, 2010, 2009 and 2008.
New Authoritative Accounting Guidance
In January 2010, the FASB issued ASU No. 2010-06, "Improving Disclosures About Fair Value Measurements," which added disclosure requirements about transfers into and out of Levels 1, 2, and 3, clarified existing fair value disclosure requirements about the appropriate level of disaggregation, and clarified that a description of the valuation technique (e.g., market approach, income approach, or cost approach) and inputs used to measure fair value was required for recurring, nonrecurring, and Level 2 and 3 fair value measurements. These provisions of the ASU were effective for the Company's reporting period
83
Eagle Bancorp, Inc.
Notes to Consolidated Financial Statements
for the Years Ended December 31, 2010, 2009 and 2008: (Continued)
Note 1—Summary of Significant Accounting Policies (Continued)
ending March 31, 2010. The ASU also requires that Level 3 activity about purchases, sales, issuances, and settlements be presented on a gross basis rather than as a net number as currently permitted. This provision of the ASU is effective for the Company's reporting period ending March 31, 2011. As this provision amends only the disclosure requirements related to Level 3 activity, the adoption will have no impact on the Company's statements of income and condition.
In December 2010, the FASB issued ASU No. 2010-28, "When to Perform Step 2 of the Goodwill Impairment Test for Reporting Units with Zero or Negative Carrying Amounts." Under GAAP, the evaluation of goodwill impairment is a two-step test. In Step 1, an entity must assess whether the carrying amount of a reporting unit exceeds its fair value. If it does, an entity must perform Step 2 of the goodwill impairment test to determine whether goodwill has been impaired and to calculate the amount of that impairment. The provisions of this ASU modify Step 1 of the goodwill impairment test for reporting units with zero or negative carrying amounts. For those reporting units, an entity is required to perform Step 2 of the goodwill impairment test if it is more likely than not that a goodwill impairment exists. The provisions of this ASU are effective for the Company's reporting period ending March 31, 2011. As of December 31, 2010, the Company had no reporting units with zero or negative carrying amounts or reporting units where there was a reasonable possibility of failing Step 1 of the goodwill impairment test. As a result, the adoption of this ASU is not expected to have a material impact on the Company's statements of income and condition.
In January 2011, the FASB issued ASU No. 2011-01, "Deferral of the Effective Date of Disclosures about Troubled Debt Restructurings in Update No. 2010-20." The provisions of ASU No. 2010-20 required the disclosure of more granular information on the nature and extent of troubled debt restructurings and their effect on the allowance for credit losses for the period ending March 31, 2011. The amendments in this ASU defer the effective date related to these disclosures, enabling creditors to provide those disclosures after the FASB completes its project clarifying the guidance for determining what constitutes a troubled debt restructuring. Currently, that guidance is expected to be effective for interim and annual periods ending after June 15, 2011. As the provisions of this ASU only defer the effective date of disclosure requirements related to troubled debt restructurings, the adoption of this ASU will have no impact on the Company's statements of income and condition.
Note 2—Cash and Due from Banks
Regulation D of the Federal Reserve Act requires that banks maintain noninterest reserve balances with the Federal Reserve Bank based principally on the type and amount of their deposits. During 2010, the Bank maintained balances at the Federal Reserve (in addition to vault cash) to meet the reserve requirements as well as balances to partially compensate for services. Late in 2008, the Federal Reserve in connection with the Emergency Economic Stabilization Act of 2008 began paying a nominal amount of interest on balances held. Additionally, the Bank maintains interest bearing balances with the Federal Home Loan Bank of Atlanta and noninterest bearing balances with six domestic correspondents as compensation for services they provide to the Bank.
84
Eagle Bancorp, Inc.
Notes to Consolidated Financial Statements
for the Years Ended December 31, 2010, 2009 and 2008: (Continued)
Note 3—Investment Securities Available-for-Sale
The amortized cost and estimated fair values of investments available-for-sale at December 31, 2010 and 2009 are as follows:
December 31, 2010
|
Amortized Cost |
Gross Unrealized Gains |
Gross Unrealized Losses |
Estimated Fair Value |
|||||||||
|---|---|---|---|---|---|---|---|---|---|---|---|---|---|
| (dollars in thousands) |
|
|
|
|
|||||||||
U. S. Government agency securities |
$ | 67,288 | $ | 1,253 | $ | 143 | $ | 68,398 | |||||
Residential mortgage backed securities |
107,425 | 2,903 | 419 | 109,909 | |||||||||
Municipal bonds |
49,459 | 658 | 749 | 49,368 | |||||||||
Other equity investments |
445 | — | 72 | 373 | |||||||||
|
$ | 224,617 | $ | 4,814 | $ | 1,383 | $ | 228,048 | |||||
December 31, 2009
|
Amortized Cost |
Gross Unrealized Gains |
Gross Unrealized Losses |
Estimated Fair Value |
|||||||||
|---|---|---|---|---|---|---|---|---|---|---|---|---|---|
| (dollars in thousands) |
|
|
|
|
|||||||||
U. S. Government agency securities |
$ | 75,980 | $ | 412 | $ | 285 | $ | 76,107 | |||||
Residential mortgage backed securities |
122,076 | 3,501 | 181 | 125,396 | |||||||||
Municipal bonds |
32,845 | 717 | 237 | 33,325 | |||||||||
Other equity investments |
436 | — | 37 | 399 | |||||||||
|
$ | 231,337 | $ | 4,630 | $ | 740 | $ | 235,227 | |||||
Ninety nine percent (99%) of the debt instruments reflected in the above table are rated AAA or AA. The remaining one percent (1%) of the debt instruments consists of municipal bonds which have a rating of A; all ratings of which represent investment grade issues. The debt instruments have a net unrealized gain representing 1.6% of amortized cost. The debt instruments have a weighted average duration of 3.9 years, and low credit risk. The gross unrealized loss on other equity investments represents common stock of one local banking company owned by the Company, and traded on a broker "bulletin board" exchange. The estimated fair value is determined by broker quoted prices. The unrealized loss is deemed a result of generally weak valuations for many smaller community bank stocks. The individual banking company is profitable and has a satisfactory capital position. If quoted prices are not available, fair value is measured using independent pricing models or other model-based valuation techniques such as the present value of future cash flows, adjusted for the security's credit rating, prepayment assumptions and other factors such as credit loss assumptions. The unrealized gross losses that exist on the debt and equity securities are the result of market changes in interest rates since the original purchase and widening interest rate spreads on debt and common stock issues during 2010. The Company does not intend to sell the investments and it is more likely than not that the Company will not have to sell the securities before recovery of its amortized cost basis, which may be maturity. In addition, at December 31, 2010, the Company held $9.5 million in equity securities in a combination of Federal Reserve Bank ("FRB") and Federal Home Loan Bank ("FHLB") stocks, which are held for regulatory purposes and are not marketable.
85
Eagle Bancorp, Inc.
Notes to Consolidated Financial Statements
for the Years Ended December 31, 2010, 2009 and 2008: (Continued)
Note 3—Investment Securities Available-for-Sale (Continued)
Gross unrealized losses and fair value by length of time that the individual available-for-sale securities have been in a continuous unrealized loss position as of December 31, 2010 and 2009 are as follows:
| |
Less than 12 Months | 12 Months or Greater | Total | ||||||||||||||||
|---|---|---|---|---|---|---|---|---|---|---|---|---|---|---|---|---|---|---|---|
December 31, 2010
|
Estimated Fair Value |
Unrealized Losses |
Estimated Fair Value |
Unrealized Losses |
Estimated Fair Value |
Unrealized Losses |
|||||||||||||
| (dollars in thousands) |
|
|
|
|
|
|
|||||||||||||
U. S. Government agency securities |
$ | 7,122 | $ | 143 | $ | — | $ | — | $ | 7,122 | $ | 143 | |||||||
Residential mortgage backed securities |
31,605 | 419 | — | — | 31,605 | 419 | |||||||||||||
Municipal bonds |
21,874 | 749 | — | — | 21,874 | 749 | |||||||||||||
Other equity investments |
— | — | 105 | 72 | 105 | 72 | |||||||||||||
|
$ | 60,601 | $ | 1,311 | $ | 105 | $ | 72 | $ | 60,706 | $ | 1,383 | |||||||
| |
Less than 12 Months | 12 Months or Greater | Total | ||||||||||||||||
|---|---|---|---|---|---|---|---|---|---|---|---|---|---|---|---|---|---|---|---|
December 31, 2009
|
Estimated Fair Value |
Unrealized Losses |
Estimated Fair Value |
Unrealized Losses |
Estimated Fair Value |
Unrealized Losses |
|||||||||||||
| (dollars in thousands) |
|
|
|
|
|
|
|||||||||||||
U. S. Government agency securities |
$ | 37,357 | $ | 285 | $ | — | $ | — | $ | 37,357 | $ | 285 | |||||||
Residential mortgage backed securities |
11,681 | 181 | — | — | 11,681 | 181 | |||||||||||||
Municipal bonds |
13,850 | 237 | — | — | 13,850 | 237 | |||||||||||||
Other equity investments |
140 | 37 | — | — | 140 | 37 | |||||||||||||
|
$ | 63,028 | $ | 740 | $ | — | $ | — | $ | 63,028 | $ | 740 | |||||||
The amortized cost and estimated fair values of investments available-for-sale at December 31, 2010 and 2009 by contractual maturity are shown below. Expected maturities will differ from contractual maturities because borrowers may have the right to call or prepay obligations with or without call or prepayment penalties.
| |
2010 | 2009 | ||||||||||||
|---|---|---|---|---|---|---|---|---|---|---|---|---|---|---|
| (dollars in thousands) |
Amortized Cost |
Estimated Fair Value |
Amortized Cost |
Estimated Fair Value |
||||||||||
U. S. Government agency securities maturing: |
||||||||||||||
One year or less |
$ | — | $ | — | $ | 8,095 | $ | 8,186 | ||||||
After one year through five years |
60,175 | 61,398 | 67,885 | 67,921 | ||||||||||
After five years through ten years |
7,113 | 7,000 | — | — | ||||||||||
Residential mortgage backed securities |
107,425 | 109,909 | 122,076 | 125,396 | ||||||||||
Municipal bonds maturing: |
||||||||||||||
Five years through ten years |
7,250 | 7,356 | 3,023 | 3,072 | ||||||||||
After ten years |
42,209 | 42,012 | 29,822 | 30,253 | ||||||||||
Other equity investments |
445 | 373 | 436 | 399 | ||||||||||
|
$ | 224,617 | $ | 228,048 | $ | 231,337 | $ | 235,227 | ||||||
In 2010, realized gains on sales of investment securities were $1.4 million and realized losses on sales of investment securities were $42 thousand. In 2009, realized gains on sales of investment securities were $1.6 million and realized losses on sales of investment securities were $14 thousand. In 2008, realized gains on sales of investment securities were $54 thousand and realized losses on sales of investment securities were $52 thousand.
86
Eagle Bancorp, Inc.
Notes to Consolidated Financial Statements
for the Years Ended December 31, 2010, 2009 and 2008: (Continued)
Note 3—Investment Securities Available-for-Sale (Continued)
Proceeds from sales and calls of investment securities in 2010 were $73.3 million, in 2009 were $53.1 million, and in 2008 were $64.8 million.
At December 31, 2010, $178.3 million (fair value) of securities were pledged as collateral for certain government deposits, and securities sold under agreement to repurchase. The outstanding balance of no single issuer, except for U.S. Government and U.S. Government agency securities, exceeded ten percent of stockholders' equity at December 31, 2010 or 2009.
Note 4—Loans and Allowance for Credit Losses
The Bank makes loans to customers primarily in the Washington, D.C. metropolitan statistical area and surrounding communities. A substantial portion of the Bank's loan portfolio consists of loans to businesses secured by real estate and other business assets.
Loans, net of unamortized net deferred fees, at December 31, 2010 and 2009 are summarized by type as follows:
| (dollars in thousands) |
2010 | 2009 | ||||||
|---|---|---|---|---|---|---|---|---|
Commercial |
$ | 411,744 | $ | 346,692 | ||||
Owner occupied—commercial real estate |
223,986 | 196,433 | ||||||
Investment—commercial real estate |
619,714 | 499,501 | ||||||
Real estate mortgage—residential |
15,977 | 9,236 | ||||||
Construction—commercial & residential(1) |
308,081 | 252,695 | ||||||
Home equity |
89,885 | 87,283 | ||||||
Other consumer |
6,113 | 7,471 | ||||||
Total loans |
1,675,500 | 1,399,311 | ||||||
Less: Allowance for Credit Losses |
(24,754 | ) | (20,619 | ) | ||||
Loans net |
$ | 1,650,746 | $ | 1,378,692 | ||||
- (1)
- Includes loans for land acquisition and land development.
Unamortized net deferred fees amounted to $4.1 million and $2.6 million at December 31, 2010 and 2009, of which $484 thousand and $520 thousand, at December 31, 2010 and 2009, respectively, represented net deferred costs on home equity loans.
As of December 31, 2010 and 2009, the Bank serviced $28.1 million and $25.8 million, respectively, of SBA loans participations which are not reflected as loan balances on the Consolidated Balance Sheets.
Loan Origination / Risk Management
The Company's goal is to mitigate risks in the event of unforeseen threats to the loan portfolio as a result of economic downturn or other negative influences. Plans for mitigating inherent risks in managing loan assets include; carefully enforcing loan policies and procedures, evaluating each borrower's business plan during the underwriting process and throughout the loan term, identifying and monitoring primary and alternative sources for loan repayment, and obtaining collateral to mitigate economic loss in the event of liquidation. Specific loan reserves are established based upon credit and/or collateral risks on an individual loan basis. A risk rating system is employed to proactively estimate loss exposure and provide a measuring system for setting general and specific reserve allocations.
The composition of the Company's loan portfolio is heavily weighted toward commercial real estate, both owner occupied and investment real estate. At December 31, 2010, real estate commercial, real estate residential and real estate construction combined represented approximately 69% of the loan portfolio.
87
Eagle Bancorp, Inc.
Notes to Consolidated Financial Statements
for the Years Ended December 31, 2010, 2009 and 2008: (Continued)
Note 4—Loans and Allowance for Credit Losses (Continued)
These loans are underwritten to mitigate lending risks typical of this type of loan such as declines in real estate values, changes in borrower cash flow and general economic conditions. The Bank typically requires a maximum loan to value of 80% or less and minimum cash flow debt service coverage of 1.15 to 1.0. Personal guarantees are generally required, but may be limited. In making real estate commercial mortgage loans, the Bank generally requires that interest rates adjust not less frequently than five years.
The Company is also an active traditional commercial lender providing loans for a variety of purposes, including cash flow, equipment and account receivable financing. This loan category represents approximately 26% of the loan portfolio at December 31, 2010 and is generally variable or adjustable rate. Commercial loans meet reasonable underwriting standards, including appropriate collateral, and cash flow necessary to support debt service. Personal guarantees are generally required, but may be limited. SBA loans represent 2% of the commercial loan category of loans. In originating SBA loans, the Company assumes the risk of non-payment on the uninsured portion of the credit. The Company generally sells the insured portion of the loan generating noninterest income from the gains on sale, as well as servicing income on the portion participated. SBA loans are subject to the same cash flow analyses as other commercial loans. SBA loans and the Section 7A lending program in particular, are subject to a maximum loan size established by the SBA.
Approximately 6% of the loan portfolio at December 31, 2010 consists of home equity loans and lines of credit and other consumer loans. These credits, while making up a smaller portion of the loan portfolio, demand the same emphasis on underwriting and credit evaluation as other types of loans advanced by the Bank.
From time to time the Company may make loans for its own portfolio or through its higher risk loan affiliate, ECV, which under its operating agreement conducts lending only to real estate projects, where the Company's directors or lending officers have significant expertise. Such loans, which are made to finance projects (which may also be financed at the Bank level), may have higher risk characteristics than loans made by the Bank, such as lower priority interests and/or higher loan to value ratios. The Company seeks an overall financial return on these transactions commensurate with the risks and structure of each individual loan. Certain transactions bear current interest at a rate with a significant premium to normal market rates. Other loan transactions carry a standard rate of current interest, but also earn additional interest based on a percentage of the profits of the underlying project.
Loans are secured primarily by duly recorded first deeds of trust. In some cases, the Bank may accept a recorded second trust position. In general, borrowers will have a proven ability to build, lease, manage and/or sell a commercial or residential project and demonstrate satisfactory financial condition. Additionally, an equity contribution toward the project is customarily required.
Construction loans require that the financial condition and experience of the general contractor and major subcontractors be satisfactory to the Bank. Guaranteed, fixed price contracts are required whenever appropriate, along with payment and performance bonds or completion bonds for larger scale projects.
Loans intended for residential land acquisition, lot development and construction are made on the premise that the land: 1) is or will be developed for building sites for residential structures, and; 2) will ultimately be utilized for construction or improvement of residential zoned real properties, including the creation of housing. Residential development and construction loans will finance projects such as single family subdivisions, planned unit developments, townhouses, and condominiums. Residential land acquisition, development and construction loans generally are underwritten with a maximum term of 36 months, including extensions approved at origination.
88
Eagle Bancorp, Inc.
Notes to Consolidated Financial Statements
for the Years Ended December 31, 2010, 2009 and 2008: (Continued)
Note 4—Loans and Allowance for Credit Losses (Continued)
Commercial land acquisition and construction loans are secured by real property where loan funds will be used to acquire land and to construct or improve appropriately zoned real property for the creation of income producing or owner user commercial properties. Borrowers are generally required to put equity into each project at levels determined by the appropriate Loan Committee. Commercial land acquisition and construction loans generally are underwritten with a maximum term of 24 months.
All construction draw requests must be presented in writing on American Institute of Architects documents and certified by the contractor, the borrower and the borrower's architect. Each draw request shall also include the borrower's soft cost breakdown certified by the borrower or its Chief Financial Officer. Prior to an advance, the Bank or its contractor inspects the project to determine that the work has been completed, to justify the draw requisition.
Commercial permanent loans are secured by improved real property which is generating income in the normal course of operation. Debt service coverage, assuming stabilized occupancy, must be satisfactory to support a permanent loan. The debt service coverage ratio is ordinarily at least 1.15:1. As part of the underwriting process, debt service coverage ratios are stress tested assuming a 200 basis point increase in interest rates from their current levels.
Commercial permanent loans generally are underwritten with a term not greater than 10 years or the remaining useful life of the property, whichever is lower. The preferred term is between 5 to 7 years, with amortization to a maximum of 25 years.
Personal guarantees are generally received from the principals, and only in instances where the loan-to-value is sufficiently low and the debt service is sufficiently high is consideration given to either limiting or not requiring personal recourse.
The Company's loan portfolio includes loans made for real estate Acquisition, Development and Construction ("ADC") purposes, including both investment and owner occupied projects. ADC loans amounted to $308.1 million at December 31, 2010. The majority of the ADC portfolio, both speculative and non speculative, includes loan funded interest reserves. ADC loans containing loan funded interest reserves represent approximately 29% of the outstanding ADC loan portfolio at December 31, 2010. The decision to establish a loan-funded interest reserve is made upon origination of the ADC loan and is based upon a number of factors considered during underwriting of the credit including: (i) the feasibility of the project; (ii) the experience of the sponsor; (iii) the creditworthiness of the borrower and guarantors; (iv) borrower equity contribution; and (v) the level of collateral protection. When appropriate, an interest reserve provides an effective means of addressing the cash flow characteristics of a properly underwritten ADC loan. The Company does not significantly utilize interest reserves in other loan products. The Company recognizes that one of the risks inherent in the use of interest reserves is the potential masking of underlying problems with the project and/or the borrower's ability to repay the loan. In order to mitigate this inherent risk, the Company employs a series of reporting and monitoring mechanisms on all ADC loans, whether or not an interest reserve is provided, including: (i) construction and development timelines which are monitored on an ongoing basis which track the progress of a given project to the timeline projected at origination; (ii) a construction loan administration department independent of lending function; (iii) third party independent construction loan inspection reports; (iv) monthly interest reserve monitoring reports detailing the balance of the interest reserves approved at origination and the days of interest carry represented by the reserve balances as compared to the then current anticipated time to completion and/or sale of speculative projects; and (v) quarterly commercial real estate construction meetings among senior Company management which includes monitoring of current and projected real
89
Eagle Bancorp, Inc.
Notes to Consolidated Financial Statements
for the Years Ended December 31, 2010, 2009 and 2008: (Continued)
Note 4—Loans and Allowance for Credit Losses (Continued)
estate market conditions. If a project has not performed as expected, it is not the customary practice of the Company to increase loan funded interest reserves.
The following table details activity in the allowance for credit losses by portfolio segment for the year ended December 31, 2010. Allocation of a portion of the allowance to one category of loans does not preclude its availability to absorb losses in other categories.
| (dollars in thousands) |
Commercial | Investment Commercial Real Estate |
Owner occupied Commercial Real Estate |
Real Estate Mortgage Residential |
Construction Commercial and Residential |
Home Equity |
Other Consumer |
Total | ||||||||||||||||||||
|---|---|---|---|---|---|---|---|---|---|---|---|---|---|---|---|---|---|---|---|---|---|---|---|---|---|---|---|---|
For the Year Ended December 31, 2010 |
||||||||||||||||||||||||||||
Allowance for credit losses: |
||||||||||||||||||||||||||||
Balance at beginning of period |
$ | 9,871 | $ | 3,328 | $ | 3,167 | $ | 28 | $ | 3,680 | $ | 382 | $ | 163 | $ | 20,619 | ||||||||||||
Loans charged-off |
(2,495 | ) | (719 | ) | (246 | ) | — | (1,698 | ) | (43 | ) | (21 | ) | (5,222 | ) | |||||||||||||
Recoveries of loans previously charged-off |
37 | 3 | — | — | 7 | 2 | — | 49 | ||||||||||||||||||||
Net loan charged-off |
(2,458 | ) | (716 | ) | (246 | ) | — | (1,691 | ) | (41 | ) | (21 | ) | (5,173 | ) | |||||||||||||
Provision for credit losses |
1,217 | 4,056 | (857 | ) | 87 | 3,756 | 1100 | (51 | ) | 9,308 | ||||||||||||||||||
Balance at end of period |
$ | 8,630 | $ | 6,668 | $ | 2,064 | $ | 115 | $ | 5,745 | $ | 1,441 | $ | 91 | $ | 24,754 | ||||||||||||
For the Year Ended December 31, 2010 |
||||||||||||||||||||||||||||
Allowance for credit losses: |
||||||||||||||||||||||||||||
Individually evaluated for impairment |
$ | 2,080 | $ | 545 | $ | 150 | $ | — | $ | 1,075 | $ | 85 | $ | — | $ | 3,935 | ||||||||||||
Collectively evaluated for impairment |
6,550 | 6,123 | 1,914 | 115 | 4,670 | 1,356 | 91 | 20,819 | ||||||||||||||||||||
Total |
$ | 8,630 | $ | 6,668 | $ | 2,064 | $ | 115 | $ | 5,745 | $ | 1,441 | $ | 91 | $ | 24,754 | ||||||||||||
Recorded investment in loans: |
||||||||||||||||||||||||||||
Individually evaluated for impairment |
$ | 18,720 | $ | 9,805 | $ | 3,859 | $ | — | $ | 27,778 | $ | 284 | $ | — | $ | 60,446 | ||||||||||||
Collectively evaluated for impairment |
393,024 | 609,909 | 220,127 | 15,977 | 280,303 | 89,601 | 6,113 | 1,615,054 | ||||||||||||||||||||
Total |
$ | 411,744 | $ | 619,714 | $ | 223,986 | $ | 15,977 | $ | 308,081 | $ | 89,885 | $ | 6,113 | $ | 1,675,500 | ||||||||||||
At December 31, 2010, the nonperforming loans acquired from Fidelity & Trust Financial Corporation ("Fidelity") have a carrying value of $5.6 million and an unpaid principal balance of $15.4 million and were evaluated separately in accordance with ASC Topic 310-30, "Loans and Debt Securities Acquired with Deteriorated Credit Quality." The various impaired loans were recorded at estimated fair value with any excess being charged-off or treated as a non-accretable discount. Subsequent downward adjustments to the valuation of impaired loans acquired will result in additional loan loss provisions and related allowance for credit losses. Subsequent upward adjustments to the valuation of impaired loans acquired will result in accretable discount. No adjustments have been made to the fair value amounts of impaired loans subsequent to the allowable period of adjustment from the date of acquisition.
Credit Quality Indicators
The Company uses several credit quality indicators to manage credit risk in an ongoing manner. The Company's primary credit quality indicators are to use an internal credit risk rating system that categorizes loans into pass, watch, special mention, or classified categories. Credit risk ratings are applied individually
90
Eagle Bancorp, Inc.
Notes to Consolidated Financial Statements
for the Years Ended December 31, 2010, 2009 and 2008: (Continued)
Note 4—Loans and Allowance for Credit Losses (Continued)
to those classes of loans that have significant or unique credit characteristics that benefit from a case-by-case evaluation. These are typically loans to businesses or individuals in the classes which comprise the commercial portfolio segment. Groups of loans that are underwritten and structured using standardized criteria and characteristics, such as statistical models (e.g., credit scoring or payment performance), are typically risk rated and monitored collectively. These are typically loans to individuals in the classes which comprise the consumer portfolio segment.
The following are the definitions of the Company's credit quality indicators:
| Pass: | Loans in all classes that comprise the commercial and consumer portfolio segments that are not adversely rated, are contractually current as to principal and interest, and are otherwise in compliance with the contractual terms of the loan agreement. Management believes that there is a low likelihood of loss related to those loans that are considered pass. | |
Watch: |
Loan paying as agreed with generally acceptable asset quality; however the obligor's performance has not met expectations. Balance sheet and/or income statement has shown deterioration to the point that the obligor could not sustain any further setbacks. Credit is expected to be strengthened through improved obligor performance and/or additional collateral within a reasonable period of time. |
|
Special Mention: |
Loans in the classes that comprise the commercial portfolio segment that have potential weaknesses that deserve management's close attention. If not addressed, these potential weaknesses may result in deterioration of the repayment prospects for the loan. The special mention credit quality indicator is not used for classes of loans that comprise the consumer portfolio segment. Management believes that there is a moderate likelihood of some loss related to those loans that are considered special mention. |
|
Classified: |
Classified (a) Substandard—Loans inadequately protected by the current sound worth and paying capacity of the obligor or of the collateral pledged, if any. Loans so classified have a well-defined weakness or weaknesses that jeopardize the liquidation of the debt. They are characterized by the distinct possibility that the Company will sustain some loss if the deficiencies are not corrected. Loss potential, while existing in the aggregate amount of substandard loans, does not have to exist in individual loans classified substandard. |
|
Classified (b) Doubtful—Loans that have all the weaknesses inherent in a loan classified substandard, with the added characteristic that the weaknesses make collection or liquidation in full, on the basis of currently existing facts, conditions, and values, highly questionable and improbable. The possibility of loss is extremely high, but because of certain important and reasonably specific pending factors, which may work to the advantage and strengthening of the assets, its classification as an estimated loss is deferred until its more exact status may be determined. |
91
Eagle Bancorp, Inc.
Notes to Consolidated Financial Statements
for the Years Ended December 31, 2010, 2009 and 2008: (Continued)
Note 4—Loans and Allowance for Credit Losses (Continued)
The Company's credit quality indicators are periodically updated on a case-by-case basis. The following table presents by class and by credit quality indicator, the recorded investment in the Company's loans and leases as of December 31, 2010.
| (dollars in thousands) |
Pass Rates | Watch | Substandard | Doubtful | Total Loans |
||||||||||||
|---|---|---|---|---|---|---|---|---|---|---|---|---|---|---|---|---|---|
Commercial |
$ | 375,493 | $ | 17,531 | $ | 17,710 | $ | 1,010 | $ | 411,744 | |||||||
Investment—commercial real estate |
605,340 | 4,569 | 9,805 | — | 619,714 | ||||||||||||
Owner occupied—commercial real estate |
216,204 | 3,923 | 3,859 | — | 223,986 | ||||||||||||
Real estate mortgage—residential |
15,977 | — | — | — | 15,977 | ||||||||||||
Construction—commercial and residential |
274,837 | 5,466 | 27,098 | 680 | 308,081 | ||||||||||||
Home equity |
89,601 | — | 284 | — | 89,885 | ||||||||||||
Other consumer |
6,113 | — | — | — | 6,113 | ||||||||||||
Total |
$ | 1,583,565 | $ | 31,489 | $ | 58,756 | $ | 1,690 | $ | 1,675,500 | |||||||
Non-Accrual and Past Due Loans
Loans are considered past due if the required principal and interest payments have not been received as of the date such payments were due. Loans are placed on non-accrual status when, in management's opinion, the borrower may be unable to meet payment obligations as they become due, as well as when required by regulatory provisions. Loans may be placed on non-accrual status regardless of whether or not such loans are considered past due. When interest accrual is discontinued, all unpaid accrued interest is reversed. Interest income is subsequently recognized only to the extent cash payments are received in excess of principal due. Loans are returned to accrual status when all the principal and interest amounts contractually due are brought current and future payments are reasonably assured.
The following presents by class of loan, information related to non-accrual loans as of the year ended December 31:
| (dollars in thousands) |
2010 | 2009 | ||||||
|---|---|---|---|---|---|---|---|---|
Commercial |
$ | 5,137 | $ | 4,364 | ||||
Investment—commercial real estate |
3,913 | 1,641 | ||||||
Owner occupied—commercial real estate |
— | 526 | ||||||
Real estate mortgage—residential |
760 | 259 | ||||||
Construction—commercial and residential |
14,645 | 15,192 | ||||||
Home equity |
297 | 42 | ||||||
Other consumer |
535 | — | ||||||
Total nonperforming loans(1)(2) |
25,287 | 22,024 | ||||||
- (1)
- Excludes TDRs returned to performing status totaling $3.1 million at December 31, 2010. These loans have demonstrated a period of a least six months of performance under the modified terms.
92
Eagle Bancorp, Inc.
Notes to Consolidated Financial Statements
for the Years Ended December 31, 2010, 2009 and 2008: (Continued)
Note 4—Loans and Allowance for Credit Losses (Continued)
- (2)
- Gross interest income that would have been recorded in 2010 if nonaccrual loans shown above had been current and in accordance with their original terms was $1.4 million, while interest actually recorded on such loans was $390 thousand. See Note 1 to the Consolidated Financial Statements for a description of the Company's policy for placing loans on nonaccrual status.
The following table presents by class, an aging analysis and the recorded investments in loans past due as of December 31, 2010:
| (dollars in thousands) |
Loans 30-59 Days Past Due |
Loans 60-89 Days Past Due |
Loans 90 Days or More Past Due |
Total Past Due Loans |
Current Loans |
Total Recorded Investment in Loans |
||||||||||||||
|---|---|---|---|---|---|---|---|---|---|---|---|---|---|---|---|---|---|---|---|---|
Commercial |
$ | 1,175 | $ | 1,497 | $ | 5,136 | $ | 7,808 | $ | 403,936 | $ | 411,744 | ||||||||
Investment—commercial real estate |
3,758 | 2,096 | 5,039 | 10,893 | 608,821 | 619,714 | ||||||||||||||
Owner occupied—commercial real estate |
368 | 3,177 | — | 3,545 | 220,441 | 223,986 | ||||||||||||||
Real estate mortgage—residential |
107 | — | 760 | 867 | 15,110 | 15,977 | ||||||||||||||
Construction—commercial and residential |
12,028 | 8,122 | 14,056 | 34,206 | 273,875 | 308,081 | ||||||||||||||
Home equity |
1,199 | — | 297 | 1,496 | 88,389 | 89,885 | ||||||||||||||
Other consumer |
64 | — | — | 64 | 6,049 | 6,113 | ||||||||||||||
Total |
$ | 18,699 | $ | 14,892 | $ | 25,288 | $ | 58,879 | $ | 1,616,621 | $ | 1,675,500 | ||||||||
Impaired Loans
Loans are considered impaired when, based on current information and events, it is probable the Company will be unable to collect all amounts due in accordance with the original contractual terms of the loan agreement, including scheduled principal and interest payments. Impairment is evaluated in total for smaller-balance loans of a similar nature and on an individual loan basis for other loans. If a loan is impaired, a specific valuation allowance is allocated, if necessary, so that the loan is reported net, at the present value of estimated future cash flows using the loan's existing rate or at the fair value of collateral if repayment is expected solely from the collateral. Interest payments on impaired loans are typically applied to principal unless collectability of the principal amount is reasonably assured, in which case interest is recognized on a cash basis. Impaired loans, or portions thereof, are charged off when deemed uncollectible.
93
Eagle Bancorp, Inc.
Notes to Consolidated Financial Statements
for the Years Ended December 31, 2010, 2009 and 2008: (Continued)
Note 4—Loans and Allowance for Credit Losses (Continued)
The following table presents by class, information related to impaired loans for the years ended December 31, 2010 and 2009.
| (dollars in thousands) |
Unpaid Contractual Principal Balance |
Recorded Investment With No Allowance |
Recorded Investment With Allowance |
Total Recorded Investment |
Related Allowance |
Average Recorded Investment |
Interest Income Recognized |
||||||||||||||||
|---|---|---|---|---|---|---|---|---|---|---|---|---|---|---|---|---|---|---|---|---|---|---|---|
Commercial |
$ | 5,136 | $ | 1,527 | $ | 1,995 | $ | 3,522 | $ | 1,615 | $ | 4,480 | $ | 131 | |||||||||
Investment—commercial real estate |
7,182 | 2,156 | 2,188 | 4,344 | 695 | 3,736 | 87 | ||||||||||||||||
Owner occupied—commercial |
— | — | — | — | — | 263 | — | ||||||||||||||||
Real estate mortgage—residential |
760 | 760 | — | 760 | — | 510 | 23 | ||||||||||||||||
Construction—commercial and residential |
15,055 | 7,775 | 5,206 | 12,981 | 1,075 | 19,147 | 136 | ||||||||||||||||
Home equity |
297 | 112 | 100 | 212 | 85 | 170 | 13 | ||||||||||||||||
Other consumer |
— | — | — | — | — | 4,253 | — | ||||||||||||||||
Total impaired loans at December 31, 2010 |
$ | 28,430 | $ | 12,330 | $ | 9,489 | $ | 21,819 | $ | 3,470 | $ | 32,559 | $ | 390 | |||||||||
| (dollars in thousands) |
Unpaid Contractual Principal Balance |
Recorded Investment With No Allowance |
Recorded Investment With Allowance |
Total Recorded Investment |
Related Allowance |
Average Recorded Investment |
Interest Income Recognized |
||||||||||||||||
|---|---|---|---|---|---|---|---|---|---|---|---|---|---|---|---|---|---|---|---|---|---|---|---|
Commercial |
$ | 4,364 | $ | 1,196 | $ | 1,850 | $ | 3,046 | $ | 1,318 | $ | 4,997 | $ | 154 | |||||||||
Investment—commercial real estate |
5,027 | 3,732 | 1,123 | 4,855 | 172 | 5,773 | 12 | ||||||||||||||||
Owner occupied—commercial |
526 | 526 | — | 526 | — | 263 | 25 | ||||||||||||||||
Real estate mortgage—residential |
259 | 259 | — | 259 | — | 130 | 22 | ||||||||||||||||
Construction—commercial and residential |
11,806 | 10,124 | 982 | 11,106 | 700 | 18,185 | 326 | ||||||||||||||||
Home equity |
42 | 42 | — | 42 | — | 200 | 7 | ||||||||||||||||
Other consumer |
— | — | — | — | — | 1 | — | ||||||||||||||||
Total impaired loans at December 31, 2009 |
$ | 22,024 | $ | 15,879 | $ | 3,955 | $ | 19,834 | $ | 2,190 | $ | 29,549 | $ | 546 | |||||||||
Related Party Loans
Certain directors and executive officers have had loan transactions with the Company. Such loans were made in the ordinary course of business on substantially the same terms, including interest rates and collateral, as those prevailing at the time for comparable transactions with outsiders. The following table summarizes changes in amounts of loans outstanding, both direct and indirect, to those persons during 2010 and 2009.
| (dollars in thousands) |
2010 | 2009 | |||||
|---|---|---|---|---|---|---|---|
Balance at January 1 |
$ | 25,332 | $ | 24,647 | |||
Additions |
5,750 | 6,190 | |||||
Repayments |
(7,227 | ) | (5,505 | ) | |||
Balance at December 31 |
$ | 23,855 | $ | 25,332 | |||
94
Eagle Bancorp, Inc.
Notes to Consolidated Financial Statements
for the Years Ended December 31, 2010, 2009 and 2008: (Continued)
Note 5—Premises and Equipment
Premises and equipment include the following at December 31:
| (dollars in thousands) |
2010 | 2009 | ||||||
|---|---|---|---|---|---|---|---|---|
Leasehold improvements |
$ | 9,878 | $ | 9,498 | ||||
Furniture and equipment |
11,257 | 9,361 | ||||||
Less accumulated depreciation and amortization |
(11,768 | ) | (9,606 | ) | ||||
Total premises and equipment, net |
$ | 9,367 | $ | 9,253 | ||||
The Company leases banking and office space in seventeen locations under non-cancelable lease arrangements accounted for as operating leases. The initial lease periods range from 5 to 10 years and provide for one or more five year renewal options. The leases in some cases provide for scheduled annual rent escalations and require that the Bank (lessee) pay certain operating expenses applicable to the leased space. Rent expense applicable to operating leases amounted to $5.5 million for 2010, $4.7 million in 2009, and $3.4 million in 2008. The Company subleased to subtenants four leased premises during 2010 and three leased premises during 2009. The Company has recorded $410 thousand and $366 thousand respectively, as a reduction of rent expense during 2010 and 2009. At December 31, 2010, future minimum lease payments under non-cancelable operating leases having an initial term in excess of one year are as follows:
Years ending December 31:
|
|
||||
|---|---|---|---|---|---|
(dollars in thousands) |
|||||
2011 |
$ | 4,788 | |||
2012 |
4,938 | ||||
2013 |
4,686 | ||||
2014 |
4,552 | ||||
2015 |
4,442 | ||||
Thereafter |
11,713 | ||||
Total minimum lease payments |
$ | 35,119 | |||
95
Eagle Bancorp, Inc.
Notes to Consolidated Financial Statements
for the Years Ended December 31, 2010, 2009 and 2008: (Continued)
Note 6—Intangible Assets
Intangible assets are included in the Consolidated Balance Sheets as a separate line item, net of accumulated amortization.
| (dollars in thousands) |
Gross Intangible Assets |
Adjustments | Additions | Accumulated Amortization |
Net Intangible Assets |
||||||||||||
|---|---|---|---|---|---|---|---|---|---|---|---|---|---|---|---|---|---|
2010 |
|||||||||||||||||
Goodwill(1) |
$ | 2,163 | $ | — | $ | — | $ | — | $ | 2,163 | |||||||
Core deposit(2) |
2,057 | — | — | (185 | ) | 1,872 | |||||||||||
Excess servicing(3) |
159 | — | 82 | (88 | ) | 153 | |||||||||||
|
$ | 4,379 | $ | — | $ | 82 | $ | (273 | ) | $ | 4,188 | ||||||
2009 |
|||||||||||||||||
Goodwill(1) |
$ | 105 | $ | 2,058 | $ | — | $ | — | $ | 2,163 | |||||||
Core deposit(2) |
2,243 | — | — | (186 | ) | 2,057 | |||||||||||
Excess servicing(3) |
185 | — | 62 | (88 | ) | 159 | |||||||||||
|
$ | 2,533 | $ | 2,058 | $ | 62 | $ | (274 | ) | $ | 4,379 | ||||||
Years ending December 31:
|
|
|||
|---|---|---|---|---|
(dollars in thousands) |
||||
Future estimated annual amortization expense is presented below: |
||||
2011 |
$ | 185 | ||
2012 |
217 | |||
2013 |
358 | |||
2014 |
309 | |||
2015 |
301 | |||
Thereafter |
501 | |||
- (1)
- The
Company recorded an initial amount of unidentified intangible (goodwill) incident to the acquisition of Fidelity of approximately $360 thousand.
Based on allowable adjustments through August 31, 2009, the unidentified intangible (goodwill) amounted to approximately $2.2 million.
- (2)
- In
connection with the Fidelity acquisition, the Company made an allocation of the purchase price to a core deposit intangible which was determined by
independent evaluation and is included in intangible assets, net on the Consolidated Balance Sheets. The initial amount was $2.3 million, which is being amortized over its remaining life of
5.2 years as a component of other noninterest expenses.
- (3)
- The Company recognizes a servicing asset for the computed value of servicing fees on the sale of the guaranteed portion of SBA loans, which is in excess of a normal servicing fee. Assumptions related to loan term and amortization are made to arrive at the initial recorded value, which is included in other assets.
96
Eagle Bancorp, Inc.
Notes to Consolidated Financial Statements
for the Years Ended December 31, 2010, 2009 and 2008: (Continued)
Note 7—Deposits
The following table provides information regarding the Bank's deposit composition at December 31 for the years indicated and shows the average rate being paid on the interest bearing deposits in December of each year.
| |
2010 | 2009 | 2008 | |||||||||||||||||
|---|---|---|---|---|---|---|---|---|---|---|---|---|---|---|---|---|---|---|---|---|
| (dollars in thousands) |
Balance | Average Rate | Balance | Average Rate | Balance | Average Rate | ||||||||||||||
Noninterest bearing demand |
$ | 400,291 | — | $ | 307,959 | — | $ | 223,580 | — | |||||||||||
Interest bearing transaction |
61,771 | 0.46 | % | 59,720 | 0.31 | % | 54,801 | 0.25 | % | |||||||||||
Savings and money market |
737,071 | 1.02 | % | 582,854 | 1.39 | % | 271,791 | 1.79 | % | |||||||||||
Time, $100,000 or more |
344,747 | 1.54 | % | 296,199 | 2.12 | % | 249,516 | 3.21 | % | |||||||||||
Other time |
182,918 | 1.48 | % | 213,542 | 2.33 | % | 329,692 | 3.27 | % | |||||||||||
Total |
$ | 1,726,798 | $ | 1,460,274 | $ | 1,129,380 | ||||||||||||||
The remaining maturity of time deposits at December 31, 2010, 2009 and 2008 are as follows:
| (dollars in thousands) |
2010 | 2009 | 2008 | |||||||
|---|---|---|---|---|---|---|---|---|---|---|
Three months or less |
$ | 135,309 | $ | 132,861 | $ | 172,826 | ||||
More than three months through six months |
111,476 | 120,460 | 127,618 | |||||||
More than six months through twelve months |
157,209 | 105,641 | 229,926 | |||||||
Over twelve months |
123,671 | 150,779 | 48,838 | |||||||
Total |
$ | 527,665 | $ | 509,741 | $ | 579,208 | ||||
Interest expense on deposits for the years ended December 31, 2010, 2009 and 2008 is as follows:
| (dollars in thousands) |
2010 | 2009 | 2008 | ||||||||
|---|---|---|---|---|---|---|---|---|---|---|---|
Interest bearing transaction |
$ | 209 | $ | 161 | $ | 306 | |||||
Savings and money market |
7,847 | 6,144 | 4,212 | ||||||||
Time, $100,000 or more |
5,958 | 6,502 | 7,672 | ||||||||
Other time |
2,872 | 8,149 | 7,353 | ||||||||
Total |
$ | 16,886 | $ | 20,956 | $ | 19,543 | |||||
97
Eagle Bancorp, Inc.
Notes to Consolidated Financial Statements
for the Years Ended December 31, 2010, 2009 and 2008: (Continued)
Note 8—Borrowings
Information relating to short-term and long-term borrowings is as follows for the years ended December 31:
| |
2010 | 2009 | 2008 | ||||||||||||||||||
|---|---|---|---|---|---|---|---|---|---|---|---|---|---|---|---|---|---|---|---|---|---|
| (dollars in thousands) |
Amount | Rate | Amount | Rate | Amount | Rate | |||||||||||||||
Short-term: |
|||||||||||||||||||||
At Year-End: |
|||||||||||||||||||||
Customer repurchase agreements and federal funds purchased repurchase |
$ | 97,584 | 0.75 | % | $ | 90,790 | 0.85 | % | $ | 98,802 | 1.73 | % | |||||||||
Federal Home Loan Bank—current portion |
— | 0.00 | % | 10,000 | 0.14 | % | 55,000 | 0.70 | % | ||||||||||||
Total |
$ | 97,584 | $ | 100,790 | $ | 153,802 | |||||||||||||||
Average Daily Balance: |
|||||||||||||||||||||
Customer repurchase agreements and federal funds purchased repurchase |
$ | 96,862 | 0.75 | % | $ | 93,363 | 1.03 | % | $ | 68,696 | 2.05 | % | |||||||||
Federal Home Loan Bank—current portion |
3,737 | 0.72 | % | 30,562 | 1.97 | % | 15,577 | 3.51 | % | ||||||||||||
Maximum Month-end Balance: |
|||||||||||||||||||||
Customer repurchase agreements and federal funds purchased repurchase |
$ | 109,699 | 0.63 | % | $ | 120,918 | 1.16 | % | $ | 104,243 | 1.92 | % | |||||||||
Federal Home Loan Bank—current portion |
11,000 | 2.99 | % | 50,000 | 0.38 | % | 55,000 | 0.70 | % | ||||||||||||
Long-term: |
|||||||||||||||||||||
At Year-End: |
|||||||||||||||||||||
Federal Home Loan Bank |
$ | 40,000 | 2.36 | % | $ | 40,000 | 3.03 | % | $ | 50,000 | 3.56 | % | |||||||||
Subordinated Notes |
9,300 | 10.00 | % | 9,300 | 10.00 | % | 12,150 | 10.00 | % | ||||||||||||
United Bank Line of Credit |
— | 0 | % | — | 0 | % | — | 0 | % | ||||||||||||
Average Daily Balance for the Year: |
|||||||||||||||||||||
Federal Home Loan Bank |
$ | 40,000 | 2.36 | % | $ | 34,000 | 3.35 | % | $ | 46,202 | 3.84 | % | |||||||||
Subordinated Notes |
9,300 | 10.00 | % | 11,322 | 10.00 | % | 4,187 | 10.00 | % | ||||||||||||
United Bank Line of Credit |
— | 0 | % | — | 0 | % | 3,361 | 4.39 | % | ||||||||||||
Maximum Month-end Balance: |
|||||||||||||||||||||
Federal Home Loan Bank |
$ | 40,000 | 2.36 | % | $ | 50,000 | 3.56 | % | $ | 50,000 | 3.56 | % | |||||||||
Subordinated Notes |
9,300 | 10.00 | % | 12,150 | 10.00 | % | 12,150 | 10.00 | % | ||||||||||||
United Bank Line of Credit |
— | 0 | % | — | 0 | % | 18,000 | 3.75 | % | ||||||||||||
The Company offers its business customers a repurchase agreement sweep account in which it collateralizes these funds with U.S. Government agency and mortgage backed securities segregated in its investment portfolio safekeeping for this purpose. By entering into the agreement, the customer agrees to have the Bank repurchase the designated securities on the business day following the initial transaction in consideration of the payment of interest at the rate prevailing on the day of the transaction.
The Bank has commitments from correspondent banks under which it can purchase up to $82.5 million in federal funds on an unsecured basis, against which there were no amounts outstanding at December 31, 2010 and can borrow unsecured funds under one-way CDARS brokered deposits in the amount of $207.1 million, against which there was $448 thousand outstanding at December 31, 2010. At December 31, 2010, the Bank was also eligible to make advances from the FHLB up to $154.8 million based on collateral at the FHLB, of which it had $40 million of advances outstanding at December 31, 2010. Also, the Bank may enter into repurchase agreements as well as obtaining additional borrowing capabilities from the FHLB provided adequate collateral exists to secure these lending relationships.
98
Eagle Bancorp, Inc.
Notes to Consolidated Financial Statements
for the Years Ended December 31, 2010, 2009 and 2008: (Continued)
Note 8—Borrowings (Continued)
In June 2010, the Company renewed its Loan Agreement and related Stock Security Agreement and Promissory Note (the "credit facility") with United Bank, pursuant to which the Company may borrow, on a revolving basis, up to $30 million for working capital purposes, or to finance capital contributions to the Bank and ECV. This facility was originally entered into in August 2008 and has been renegotiated over the past two years to its current terms. The credit facility is secured by a first lien on all of the stock of the Bank, and bears interest at a floating rate equal to the Wall Street Journal Prime Rate minus 0.25% with a floor interest rate of 4.75%. Interest is payable on a monthly basis. The term of the credit facility expires on June 20, 2011. At any time, provided no event of default exists, the Company may term out repayment of up to $20 million of the credit facility up to a five year term. There were no amounts outstanding under this credit at December 31, 2010 or 2009.
On August 30, 2010, the Company entered into and consummated a Note Exchange Agreement, pursuant to which the Company issued, on a private placement basis, to eight parties, all of which are current or former directors of the Company or accounts for the benefit of such persons, an aggregate of $9.3 million of a new series of subordinated notes (the "New Notes"), in exchange for an equal principal amount of the Company's 10% Subordinated Notes dues September 30, 2014 (the "Old Notes"), which were issued in August 2008. The New Notes bear interest, payable on the first day of each month, at a fixed rate of 10.0% per year. The New Notes have a maturity of September 30, 2016. The New Notes are redeemable at the option of the Company, in whole or in part, on any interest payment date at the principal amount thereof, plus interest to the date of redemption. The New Notes are intended to qualify as Tier 2 capital for regulatory purposes to the fullest extent permitted. The payment of principal on the Notes may only be accelerated upon the occurrence of certain bankruptcy or receivership related events relating to the Company or, to the extent permitted under capital rules to be adopted by the Federal Reserve pursuant to Dodd-Frank, a major bank subsidiary of the Company.
The issuance of the New Notes in exchange for the Old Notes (the "Exchange") is intended to enable the Company to maximize the capital treatment of its indebtedness. Under existing capital rules, the capital treatment of the Old Notes must be phased out, at a rate of 20% of the original principal amount per year. As a result, effective October 1, 2010, only 60% of the principal amount of the Old Notes would have been eligible for inclusion as Tier 2 capital. As a result of the Exchange, 100% of the principal amount of the New Notes is eligible for inclusion in capital at December 31, 2010. The capital treatment of the New Notes will be phased out in the last five years they are outstanding commencing in October 2011, at a rate of 20% per year.
Note 9—Preferred Stock and Warrant
On December 5, 2008, the Company entered into and consummated a Letter Agreement (the "Purchase Agreement") with the United States Department of the Treasury (the "Treasury"), pursuant to which the Company issued 38,235 shares of the Company's Fixed Rate Cumulative Perpetual Preferred Stock, Series A (the "Series A Preferred Stock"), having a liquidation amount per share equal to $1,000, for a total purchase price of $38,235,000. The Series A Preferred Stock pays cumulative dividends at a rate of 5% per year for the first five years and thereafter at a rate of 9% per year. Subject to consultation with the Company's and Bank's federal regulators, the Company may, at its option, redeem the Series A Preferred Stock at the liquidation amount plus accrued and unpaid dividends. The Series A Preferred Stock is non-voting, except in limited circumstances. Prior to the third anniversary of issuance, unless the Company has redeemed all of the Series A Preferred Stock or the Treasury has transferred all of the
99
Eagle Bancorp, Inc.
Notes to Consolidated Financial Statements
for the Years Ended December 31, 2010, 2009 and 2008: (Continued)
Note 9—Preferred Stock and Warrant (Continued)
Series A Preferred Stock to a third party, the consent of the Treasury will be required for the Company to increase its common stock dividend or repurchase its common stock or other equity or capital securities, other than in connection with benefit plans consistent with past practice and certain other circumstances specified in the Purchase Agreement.
The Company redeemed 15,000 shares of Series A Preferred Stock on December 23, 2009. The aggregate redemption price for the shares was $15,079,166, including accrued but unpaid dividends on the shares. Following the repurchase, 23,235 shares of Series A Preferred Stock ($23,235,000 aggregate liquidation amount) remain outstanding, held by the Treasury.
In connection with the purchase of the Series A Preferred Stock, the Treasury was issued a warrant (the "Warrant") to purchase 770,867 shares of the Company's common stock at an initial exercise price of $7.44 per share. The Warrant provides for the adjustment of the exercise price and the number of shares of the common stock issuable upon exercise pursuant to customary anti-dilution provisions, such as upon stock splits or distributions of securities or other assets to holders of the common stock, and upon certain issuances of the common stock (or securities exercisable or exchangeable for, or convertible into, common stock) at or below 90% of the market price of the common stock on the trading day prior to the date of the agreement on pricing such securities. The Warrant expires ten years from the date of issuance. As a result of the completion of a "qualified equity offering" by the Company, the number of shares of common stock issuable pursuant to the Warrant has been reduced by one-half to 385,434. Accordingly, the discount on the preferred stock and the Warrant was reduced by $946 thousand in November 2009. The Treasury has agreed not to exercise voting power with respect to any shares of common stock issued upon exercise of the Warrant.
Note 10—Income Taxes
Federal and state income tax expense consists of the following for the years ended December 31:
| (dollars in thousands) |
2010 | 2009 | 2008 | ||||||||
|---|---|---|---|---|---|---|---|---|---|---|---|
Current federal income tax |
$ | 8,940 | $ | 6,027 | $ | 5,052 | |||||
Current state income tax |
1,991 | 1,248 | 714 | ||||||||
Total current |
10,931 | 7,275 | 5,766 | ||||||||
Deferred federal income tax benefit |
(1,592 | ) | (1,087 | ) | (1,418 | ) | |||||
Deferred state income tax benefit |
(241 | ) | (223 | ) | (225 | ) | |||||
Total deferred |
(1,833 | ) | (1,310 | ) | (1,643 | ) | |||||
Total income tax expense |
$ | 9,098 | $ | 5,965 | $ | 4,123 | |||||
Temporary timing differences between the amounts reported in the financial statements and the tax bases of assets and liabilities result in deferred taxes. Gross deferred tax assets and liabilities, shown as the
100
Eagle Bancorp, Inc.
Notes to Consolidated Financial Statements
for the Years Ended December 31, 2010, 2009 and 2008: (Continued)
Note 10—Income Taxes (Continued)
sum of the appropriate tax effect for each significant type of temporary difference, is presented below for the years ended December 31:
| |
2010 | 2009 | 2008 | |||||||
|---|---|---|---|---|---|---|---|---|---|---|
Deferred tax assets |
||||||||||
Allowance for credit losses |
$ | 10,007 | $ | 8,336 | $ | 7,440 | ||||
Deferred loan fees and costs |
1,626 | 1,040 | 746 | |||||||
Stock based compensation |
160 | 90 | 49 | |||||||
Net operating loss |
4,203 | 4,526 | 4,778 | |||||||
Deferred rent |
159 | 357 | 278 | |||||||
Premises and equipment |
506 | 446 | — | |||||||
Other |
234 | 200 | 310 | |||||||
Total deferred tax assets |
16,895 | 14,995 | 13,601 | |||||||
Deferred tax liabilities |
||||||||||
Unrealized gain on securities available for sale |
(1,372 | ) | (1,555 | ) | (1,594 | ) | ||||
Excess servicing |
(61 | ) | (64 | ) | (74 | ) | ||||
Intangible assets |
(991 | ) | (921 | ) | (755 | ) | ||||
Premises and equipment |
— | — | (72 | ) | ||||||
Total deferred tax liabilities |
(2,424 | ) | (2,540 | ) | (2,495 | ) | ||||
Net deferred income tax account |
$ | 14,471 | $ | 12,455 | $ | 11,106 | ||||
A reconciliation of the statutory federal income tax rate to the Company's effective income tax rate for the years ended December 31 follows:
| |
2010 | 2009 | 2008 | ||||||||
|---|---|---|---|---|---|---|---|---|---|---|---|
Statutory federal income tax rate |
35.00 | % | 35.00 | % | 35.00 | % | |||||
Increase (decrease) due to |
|||||||||||
State income taxes, net of federal income tax benefit |
4.42 | 2.75 | 2.75 | ||||||||
Tax exempt interest and dividend income |
(3.50 | ) | (3.48 | ) | (3.48 | ) | |||||
Share-based compensation expense |
0.27 | 0.95 | 0.95 | ||||||||
Other |
(0.86 | ) | 0.47 | 0.47 | |||||||
Effective tax rates |
35.33 | % | 35.69 | % | 35.69 | % | |||||
The net operating loss carry forward acquired in conjunction with the Fidelity acquisition is subject to annual limits under Section 382 of the Internal Revenue Code of $718 thousand and expires in 2027.
As a result of the issuance of the Series A Preferred Stock to the Treasury, the Company is required to comply with certain restrictions on executive compensation included in the Emergency Economic Stabilization Act of 2008, as amended (the "EESA"). Certain of these provisions could limit the tax deductibility of compensation the Company pays to its executive officers, although no such effect has impacted the Company.
101
Eagle Bancorp, Inc.
Notes to Consolidated Financial Statements
for the Years Ended December 31, 2010, 2009 and 2008: (Continued)
Note 11—Net Income per Common Share
The calculation of net income per common share for the years ended December 31 was as follows:
| (dollars and shares in thousands, except per share data) |
2010 | 2009 | 2008 | |||||||
|---|---|---|---|---|---|---|---|---|---|---|
Basic: |
||||||||||
Net income allocable to common stockholders |
$ | 15,358 | $ | 8,112 | $ | 7,251 | ||||
Average common shares outstanding |
19,649 | 14,643 | 11,557 | |||||||
Basic net income per common share |
$ | 0.78 | $ | 0.55 | $ | 0.63 | ||||
Diluted: |
||||||||||
Net income allocable to common stockholders |
$ | 15,358 | $ | 8,112 | $ | 7,251 | ||||
Average common shares outstanding |
19,649 | 14,643 | 11,557 | |||||||
Adjustment for common share equivalents |
394 | 141 | 135 | |||||||
Average common shares outstanding-diluted |
20,043 | 14,784 | 11,692 | |||||||
Diluted net income per common share |
$ | 0.77 | $ | 0.55 | $ | 0.62 | ||||
Per share amounts and the number of outstanding shares have been adjusted to give effect to the 10% common dividend paid on October 1, 2008.
There were 227,246, 951,399 and 1,628,274 common shares equivalents at December 31, 2010, 2009 and 2008, respectively that were excluded from the diluted net income per common share computation because their effects were anti-dilutive.
Note 12—Related Party Transactions
On August 30, 2010, the Company entered into and consummated a Note Exchange Agreement, pursuant to which the Company issued $9.3 million of the New Notes to eight parties, all of which are current or former directors of the Company or accounts for the benefit of such persons, in exchange for an equal principal amount of the Old Notes. During 2010, approximately $943 thousand in interest expense was paid to the current or former directors of the Company or accounts for the benefit of such persons. See Note 8 for additional information regarding the Exchange and the New Notes.
The Bank leases certain office space, at a current monthly base rental of $50,071, excluding certain pass through expenses, from limited liability companies in which a trust for the benefit of an executive officer's children has an 85% interest in one instance and a 51% interest in another.
The Bank has obtained certain deposits through title company clients in which a director of the Bank has a direct interest and for which a broker fee of 0.50% of average deposits is paid monthly in arrears. During 2010, approximately $34 thousand in broker fees was paid.
Note 13—Stock-Based Compensation
The Company maintains the 1998 Stock Option Plan ("1998 Plan") and the 2006 Stock Plan ("2006 Plan"), and, in connection with the acquisition of Fidelity and its subsidiary Fidelity & Trust Bank, assumed the Fidelity 2004 Long Term Incentive Plan and 2005 Long Term Incentive Plan (the "Fidelity Plans"). No additional options may be granted under the 1998 Plan or the Fidelity Plans.
The 2006 Plan provides for the issuance of awards of incentive options, nonqualifying options, restricted stock and stock appreciation rights to selected key employees and members of the Board. As amended, 1,215,000 shares of common stock are subject to issuance pursuant to awards under the 2006
102
Eagle Bancorp, Inc.
Notes to Consolidated Financial Statements
for the Years Ended December 31, 2010, 2009 and 2008: (Continued)
Note 13—Stock-Based Compensation (Continued)
Plan. Option awards are made with an exercise price equal to the average of the high and low price of the Company's shares at the date of grant.
For awards that are service based, compensation expense is being recognized over the service (vesting) period based on fair value, which for stock option grants is computed using the Black-Scholes model, and for restricted stock awards is based on the average of the high and low stock price of the Company's shares at the date of grant. For awards that are performance based, compensation expense is recorded based on the probability of achievement of the goals underlying the grant. No performance based awards are outstanding at December 31, 2010.
In January 2010, the Company awarded 81,600 shares of restricted stock to employees, senior officers and to a Director. Of the total restricted stock awarded, 17,464 shares vest in five substantially equal installments beginning on the date of grant. The Company awarded 31,247 shares that vest 100% upon the later of the date of repayment in full of all financial assistance received by the Company under the Troubled Asset Relief Program Capital Purchase Program (the "Capital Purchase Program") or on January 21, 2012. The remaining 32,889 shares vest 60% upon the second anniversary of the date of grant and 20% on the third and fourth anniversaries of the date of grant or upon the later date of repayment in full of all financial assistance received by the Company under the Capital Purchase Program.
In April 2010, the Company awarded two employees options to purchase a total of 5,000 shares under the 2006 Plan which have ten-year terms and vest in five substantially equal installments on the first through fifth anniversaries of the date of grant.
Below is a summary of stock option activity (split adjusted) for the twelve months ended December 31, 2010, 2009 and 2008. The information excludes restricted stock units and awards.
| |
2010 | 2009 | 2008 | |||||||||||||||||||||||||
|---|---|---|---|---|---|---|---|---|---|---|---|---|---|---|---|---|---|---|---|---|---|---|---|---|---|---|---|---|
| |
Shares | Weighted- Average Grant Date Fair Value |
Weighted- Average Exercise Price |
Shares | Weighted- Average Grant Date Fair Value |
Weighted- Average Exercise Price |
Shares | Weighted- Average Grant Date Fair Value |
Weighted- Average Exercise Price |
|||||||||||||||||||
Outstanding at Beginning of Year |
1,234,181 | $ | 2.56 | $ | 11.44 | 1,036,994 | $ | 2.58 | $ | 12.98 | 836,503 | $ | 2.99 | $ | 9.18 | |||||||||||||
Issued |
5,000 | 6.23 | 12.33 | 326,437 | 2.06 | 6.43 | 429,715 | 1.30 | 18.17 | |||||||||||||||||||
Exercised |
(80,734 | ) | 2.23 | 5.63 | (38,645 | ) | 1.38 | 3.18 | (139,494 | ) | 1.40 | 3.17 | ||||||||||||||||
Forfeited |
(55,150 | ) | 0.12 | 24.41 | (39,673 | ) | 2.13 | 7.20 | (15,047 | ) | 2.53 | 13.11 | ||||||||||||||||
Expired |
(88,611 | ) | 2.87 | 15.63 | (50,932 | ) | 1.09 | 20.22 | (74,683 | ) | 1.93 | 18.59 | ||||||||||||||||
Outstanding at End of Year |
1,014,686 | 2.71 | 10.84 | 1,234,181 | 2.56 | 11.44 | 1,036,994 | 2.58 | 12.98 | |||||||||||||||||||
The following summarizes information about stock options outstanding at December 31, 2010. The information excludes restricted stock units and awards.
Outstanding:
|
Stock Options Outstanding |
Weighted-Average Exercise Price |
Weighted-Average Remaining Contractual Life |
|||||||
|---|---|---|---|---|---|---|---|---|---|---|
| Range of Exercise Prices |
||||||||||
$ 2.98 – $ 8.10 |
418,658 | $ | 6.34 | 5.80 | ||||||
$ 8.11 – $11.07 |
247,022 | 10.16 | 3.42 | |||||||
$11.08 – $15.43 |
215,371 | 12.75 | 3.15 | |||||||
$15.44 – $26.86 |
133,635 | 23.12 | 4.90 | |||||||
|
1,014,686 | 10.84 | 4.54 | |||||||
103
Eagle Bancorp, Inc.
Notes to Consolidated Financial Statements
for the Years Ended December 31, 2010, 2009 and 2008: (Continued)
Note 13—Stock-Based Compensation (Continued)
Exercisable:
|
Stock Options Exercisable | Weighted-Average Exercise Price | |||||
|---|---|---|---|---|---|---|---|
| Range of Exercise Prices |
|||||||
$ 2.98 – $ 8.10 |
180,891 | $ | 6.33 | ||||
$ 8.11 – $11.07 |
241,146 | 10.17 | |||||
$11.08 – $15.43 |
182,871 | 12.89 | |||||
$15.44 – $26.86 |
119,200 | 23.86 | |||||
|
724,108 | 12.15 | |||||
The fair value of each stock option grant is estimated on the date of grant using the Black-Scholes option pricing model with the assumptions as shown in the table below used for grants during the years ended December 31, 2010, 2009 and 2008.
| |
Year Ended December 31, | |||||||||
|---|---|---|---|---|---|---|---|---|---|---|
| |
2010 | 2009 | 2008 | |||||||
Expected Volatility |
44.4% – 44.4% | 25.9% – 58.0% | 23.7% – 78.5% | |||||||
Weighted-Average Volatility |
44.44% | 26.74% | 35.47% | |||||||
Expected Dividends |
0.0% | 0.0% | 0.8% | |||||||
Expected Term (In years) |
8.5 | 3.5 – 8.5 | 0.1 – 9.0 | |||||||
Risk-Free Rate |
1.01% | 0.84% | 2.54% | |||||||
Weighted-Average Fair Value (Grant date) |
$ | 6.23 | $ | 2.06 | $ | 1.30 | ||||
The expected lives are based on the "simplified" method allowed by ASC Topic 718"Compensation," whereby the expected term is equal to the midpoint between the vesting date and the end of the contractual term of the award.
The total intrinsic value of outstanding stock options and outstanding exercisable stock options was $4.9 million, at December 31, 2010. The total intrinsic value of stock options exercised during the years ended December 31, 2010, 2009 and 2008 was $449 thousand, $243 thousand and $880 thousand, respectively. The total fair value of stock options vested was $379 thousand, $233 thousand and $291 thousand for 2010, 2009 and 2008, respectively.
Cash proceeds, tax benefits and intrinsic value related to total stock options exercised is as follows:
| |
Year Ended December 31, | |||||||||
|---|---|---|---|---|---|---|---|---|---|---|
| (dollars in thousands) |
2010 | 2009 | 2008 | |||||||
Proceeds from stock options exercised |
$ | 453 | $ | 123 | $ | 442 | ||||
Tax benefits related to stock options exercised |
187 | 98 | 195 | |||||||
Intrinsic value of stock options exercised |
449 | 243 | 880 | |||||||
Included in salaries and employee benefits the Company recognized $585 thousand, $578 thousand and $311 thousand in stock-based compensation expense for 2010, 2009 and 2008, respectively. Stock-based compensation expense is recognized ratably over the requisite service period for all awards. Unrecognized stock based compensation expense related to all stock-based awards totaled $1.3 million thousand at December 31, 2010. At such date, the weighted-average period over which this unrecognized expense was expected to be recognized was 2.55 years.
104
Eagle Bancorp, Inc.
Notes to Consolidated Financial Statements
for the Years Ended December 31, 2010, 2009 and 2008: (Continued)
Note 13—Stock-Based Compensation (Continued)
The Company has unvested restricted stock award grants of 114,463 shares from the 2006 Plan at December 31, 2010. Unrecognized stock based compensation expense related to restricted stock awards totaled $738 thousand at December 31, 2010. At such date, the weighted-average period over which this unrecognized expense was expected to be recognized was 1.38 years. The following table summarizes the unvested restricted stock units and awards at December 31, 2010:
| |
Restricted Stock Units | Restricted Stock Awards | |||||||||||
|---|---|---|---|---|---|---|---|---|---|---|---|---|---|
| |
Shares | Weighted-Average Grant Date Fair Value |
Shares | Weighted-Average Grant Date Fair Value |
|||||||||
Unvested at January 1, 2010 |
7,642 | $ | 15.21 | 49,585 | $ | 6.88 | |||||||
Issued |
— | — | 81,600 | 10.35 | |||||||||
Forfeited |
(3,817 | ) | 15.21 | (825 | ) | 10.35 | |||||||
Vested |
(3,825 | ) | 15.21 | (15,897 | ) | 7.77 | |||||||
Unvested at December 31, 2010 |
— | — | 114,463 | $ | 9.20 | ||||||||
Note 14—Employee Benefit Plans
The Company has a qualified 401(k) Plan which covers all employees who have reached the age of 21 and have completed at least one month of service as defined by the Plan. The Company makes contributions to the Plan based on a matching formula, which is annually reviewed. For years 2010, 2009 and 2008, the Company recognized $504 thousand, $203 thousand, and $341 thousand in expense, respectively. These amounts are included in salaries and employee benefits in the accompanying Consolidated Statements of Operations.
Note 15—Financial Instruments with Off-Balance Sheet Risk
Various commitments to extend credit are made in the normal course of banking business. Letters of credit are also issued for the benefit of customers. These commitments are subject to loan underwriting standards and geographic boundaries consistent with the Company's loans outstanding.
Commitments to extend credit are agreements to lend to a customer as long as there is no violation of any condition established in the contract. Commitments generally have fixed expiration dates or other termination clauses and may require payment of a fee. Since some of the commitments are expected to expire without being drawn upon, the total commitment amounts do not necessarily represent future cash requirements.
Loan commitments outstanding and lines and letters of credit at December 31, 2010 and 2009 are as follows:
| (dollars in thousands) |
2010 | 2009 | |||||
|---|---|---|---|---|---|---|---|
Loan commitments |
$ | 48,215 | $ | 47,800 | |||
Unused lines of credit |
341,978 | 241,652 | |||||
Letters of credit |
30,141 | 18,238 | |||||
Because most of the Company's business activity is with customers located in the Washington, D.C., metropolitan area, a geographic concentration of credit risk exists within the loan portfolio, and, as such, its performance will be influenced by the economy of the region.
105
Eagle Bancorp, Inc.
Notes to Consolidated Financial Statements
for the Years Ended December 31, 2010, 2009 and 2008: (Continued)
Note 15—Financial Instruments with Off-Balance Sheet Risk (Continued)
The Bank maintains a reserve for the potential repurchase of residential mortgage loans which amounted to $149 thousand at December 31, 2010 and $13 thousand at December 31, 2009. These amounts are included in Other liabilities in the accompanying Consolidated Balance Sheets. Changes in the balance of the reserve are a component of Other expenses in the accompanying Consolidated Statements of Operations. The reserve is available to absorb losses on the repurchase of loans sold related to document and other fraud, early payment default and early payoff. Through December 31, 2010, no reserve charges have occurred related to fraud or early payment default.
Note 16—Litigation
In the normal course of its business, the Company is involved in litigation arising from banking, financial, and other activities it conducts. Management, after consultation with legal counsel, does not anticipate that the ultimate liability, if any, arising out of these matters will have a material effect on the Company's financial condition, operating results or liquidity.
Note 17—Regulatory Matters
The Company and Bank are subject to various regulatory capital requirements administered by the Federal banking agencies. Failure to meet minimum capital requirements can initiate certain mandatory and possibly additional discretionary actions by regulators that, if undertaken, could have a direct material effect on the Company's financial statements. Under capital adequacy guidelines and the regulatory framework for prompt corrective action, the Company and Bank must meet specific capital guidelines that involve quantitative measures of assets, liabilities, and certain off-balance sheet items as calculated under regulatory accounting practices. The capital amounts and classification are also subject to qualitative judgments by the regulators about components, risk weighting, and other factors.
Quantitative measures established by regulation to ensure capital adequacy require the Bank and Company to maintain amounts and ratios (set forth in the table below) of total Tier 1 capital (as defined in the regulations) to risk-weighted assets (as defined), and of Tier 1 capital (as defined) to average assets (as defined). Management believes, as of December 31, 2010 and 2009, that the Company and Bank met all capital adequacy requirements to which they are subject.
106
Eagle Bancorp, Inc.
Notes to Consolidated Financial Statements
for the Years Ended December 31, 2010, 2009 and 2008: (Continued)
Note 17—Regulatory Matters (Continued)
The actual capital amounts and ratios for the Company and Bank as of December 31, 2010 and 2009 are presented in the table below:
| |
|
|
|
|
|
To Be Well Capitalized Under Prompt Corrective Action Provision Ratio* |
||||||||||||||
|---|---|---|---|---|---|---|---|---|---|---|---|---|---|---|---|---|---|---|---|---|
| |
Company | Bank | |
|||||||||||||||||
| (dollars in thousands) |
Actual Amount |
Ratio | Actual Amount |
Ratio | For Capital Adequacy Purposes Ratio | |||||||||||||||
As of December 31, 2010 |
||||||||||||||||||||
Total capital (to risk weighted assets) |
$ | 226,131 | 11.64% | $ | 204,250 | 10.60% | 8.0 | % | 10.0 | % | ||||||||||
Tier 1 capital (to risk weighted assets) |
192,988 | 9.91% | 180,146 | 9.35% | 4.0 | % | 6.0 | % | ||||||||||||
Tier 1 capital (to average assets) |
192,988 | 9.32% | 180,146 | 8.82% | 3.0 | % | 5.0 | % | ||||||||||||
As of December 31, 2009 |
||||||||||||||||||||
Total capital (to risk weighted assets) |
$ | 203,551 | 13.57% | $ | 165,809 | 11.20% | 8.0 | % | 10.0 | % | ||||||||||
Tier 1 capital (to risk weighted assets) |
177,334 | 11.82% | 147,276 | 9.95% | 4.0 | % | 6.0 | % | ||||||||||||
Tier 1 capital (to average assets) |
177,334 | 10.29% | 147,276 | 8.76% | 3.0 | % | 5.0 | % | ||||||||||||
- *
- Applies to Bank only
Bank and holding company regulations, as well as Maryland law, impose certain restrictions on dividend payments by the Bank, as well as restricting extensions of credit and transfers of assets between the Bank and the Company. At December 31, 2010, the Bank could pay dividends to the parent to the extent of its earnings so long as it maintained required capital ratios. However, until December 5, 2011 or the earlier redemption of the Series A Preferred Stock, the Company is prohibited from increasing the dividend on the common stock without Treasury consent. Additionally, the ability of the Company to pay dividends or purchase shares of its common stock will be restricted at any time when dividends on the Series A Preferred Stock are in arrears.
Note 18—Fair Value Measurements
The fair value of an asset or liability is the price that would be received to sell that asset or paid to transfer that liability in an orderly transaction occurring in the principal market (or most advantageous market in the absence of a principal market) for such asset or liability. In estimating fair value, the Company utilizes valuation techniques that are consistent with the market approach, the income approach and/or the cost approach. Such valuation techniques are consistently applied. Inputs to valuation techniques include the assumptions that market participants would use in pricing an asset or liability. ASC Topic 820, "Fair Value Measurements and Disclosures," establishes a fair value hierarchy for valuation inputs
107
Eagle Bancorp, Inc.
Notes to Consolidated Financial Statements
for the Years Ended December 31, 2010, 2009 and 2008: (Continued)
Note 18—Fair Value Measurements (Continued)
that gives the highest priority to quoted prices in active markets for identical assets or liabilities and the lowest priority to unobservable inputs. The fair value hierarchy is as follows:
Level 1 |
Quoted prices in active exchange markets for identical assets or liabilities; also includes certain U.S. Treasury and other U.S. government and agency securities actively traded in over-the-counter markets. | ||
Level 2 |
Observable inputs other than Level 1 including quoted prices for similar assets or liabilities, quoted prices in less active markets, or other observable inputs that can be corroborated by observable market data; also includes derivative contracts whose value is determined using a pricing model with observable market inputs or can be derived principally from or corroborated by observable market data. This category generally includes certain U.S. government and agency securities, corporate debt securities, derivative instruments, and residential mortgage loans held for sale. |
||
Level 3 |
Unobservable inputs supported by little or no market activity for financial instruments whose value is determined using pricing models, discounted cash flow methodologies, or similar techniques, as well as instruments for which the determination of fair value requires significant management judgment or estimation; also includes observable inputs for single dealer nonbinding quotes not corroborated by observable market data. This category generally includes certain private equity investments, retained interests from securitizations, and certain collateralized debt obligations. |
Assets and Liabilities Recorded as Fair Value on a Recurring Basis
The table below presents the recorded amount of assets and liabilities measured at fair value on a recurring basis as of December 31, 2010 and 2009:
| (dollars in thousands) |
Quoted Prices (Level 1) |
Significant Other Observable Inputs (Level 2) |
Significant Other Unobservable Inputs (Level 3) |
Total (Fair Value) |
||||||||||
|---|---|---|---|---|---|---|---|---|---|---|---|---|---|---|
December 31, 2010 |
||||||||||||||
Investment securities available for sale: |
||||||||||||||
U. S. Government agency securities |
$ | — | $ | 68,398 | $ | — | $ | 68,398 | ||||||
Residential mortgage backed securities |
— | 109,909 | — | 109,909 | ||||||||||
Municipal bonds |
— | 49,368 | — | 49,368 | ||||||||||
Other equity investments |
106 | — | 267 | 373 | ||||||||||
Residential mortgage loans held for sale |
— | 80,571 | — | 80,571 | ||||||||||
Total assets measured at fair value on a recurring basis as of December 31, 2010 |
$ | 106 | $ | 308,246 | $ | 267 | $ | 308,619 | ||||||
108
Eagle Bancorp, Inc.
Notes to Consolidated Financial Statements
for the Years Ended December 31, 2010, 2009 and 2008: (Continued)
Note 18—Fair Value Measurements (Continued)
| (dollars in thousands) |
Quoted Prices (Level 1) |
Significant Other Observable Inputs (Level 2) |
Significant Other Unobservable Inputs (Level 3) |
Total (Fair Value) |
||||||||||
|---|---|---|---|---|---|---|---|---|---|---|---|---|---|---|
December 31, 2009 |
||||||||||||||
Investment securities available for sale: |
||||||||||||||
U. S. Government agency securities |
$ | — | $ | 76,107 | $ | — | $ | 76,107 | ||||||
Residential mortgage backed securities |
— | 125,396 | — | 125,396 | ||||||||||
Municipal bonds |
— | 33,325 | — | 33,325 | ||||||||||
Other equity investments |
141 | — | 258 | 399 | ||||||||||
Residential mortgage loans held for sale |
— | 1,550 | — | 1,550 | ||||||||||
Total assets measured at fair value on a recurring basis as of December 31, 2009 |
$ | 141 | $ | 236,378 | $ | 258 | $ | 236,777 | ||||||
Investment Securities Available-for-sale
Investment securities available-for-sale are recorded at fair value on a recurring basis. Fair value measurement is based upon quoted prices, if available. If quoted prices are not available, fair value is measured using independent pricing models or other model-based valuation techniques such as the present value of future cash flows, adjusted for the security's credit rating, prepayment assumptions and other factors such as credit loss assumptions. Level 1 securities include those traded on an active exchange such as the New York Stock Exchange, Treasury securities that are traded by dealers or brokers in active over-the-counter markets and money market funds. Level 2 securities include U.S. government agency debt securities, mortgage backed securities issued by government sponsored entities and municipal bonds. Securities classified as Level 3 include securities in less liquid markets.
The Company's residential loans held for sale are reported on an aggregate basis at the lower of cost or fair value.
The following is a reconciliation of activity for assets measured at fair value based on significant unobservable (non-market) information:
| (dollars in thousands) |
2010 | 2009 | |||||||
|---|---|---|---|---|---|---|---|---|---|
Balance, beginning of period |
$ | 258 | $ | 218 | |||||
Total realized and unrealized gains and losses: |
|||||||||
Included in net income |
— | — | |||||||
Included in other comprehensive income |
1 | — | |||||||
Purchases, issuances and settlements |
8 | 40 | |||||||
Transfers in and/or out of Level 3 |
— | — | |||||||
Balance, end of period |
$ | 267 | $ | 258 | |||||
Assets and Liabilities Recorded at Fair Value on a Nonrecurring Basis
The Company may be required from time to time, to measure certain assets at fair value on a nonrecurring basis in accordance with GAAP. These include assets that are measured at the lower of cost or market that were recognized at fair value below cost at the end of the period. There are no liabilities
109
Eagle Bancorp, Inc.
Notes to Consolidated Financial Statements
for the Years Ended December 31, 2010, 2009 and 2008: (Continued)
Note 18—Fair Value Measurements (Continued)
which the Company measures at fair value on a nonrecurring basis. Assets measured at fair value on a nonrecurring basis are included in the table below:
| (dollars in thousands) |
Quoted Prices (Level 1) |
Significant Other Observable Inputs (Level 2) |
Significant Other Unobservable Inputs (Level 3) |
Total (Fair Value) |
|||||||||||
|---|---|---|---|---|---|---|---|---|---|---|---|---|---|---|---|
December 31, 2010 |
|||||||||||||||
Impaired loans: |
|||||||||||||||
Commercial |
$ | — | $ | 1,715 | $ | 3,422 | $ | 5,137 | |||||||
Investment—commercial real estate |
— | 1,631 | 2,200 | 3,831 | |||||||||||
Owner occupied—commercial real estate |
— | — | — | ||||||||||||
Real estate mortgage—residential |
260 | 500 | 760 | ||||||||||||
Construction—commercial and residential |
— | 7,454 | 5,984 | 13,438 | |||||||||||
Home equity |
— | 185 | 112 | 297 | |||||||||||
Other consumer |
535 | — | 535 | ||||||||||||
Restructured loans |
1,289 | — | 1,289 | ||||||||||||
Other real estate owned |
— | 6,051 | 650 | 6,701 | |||||||||||
Total assets measured at fair value on |
|||||||||||||||
a nonrecurring basis as of December 31, 2010 |
$ | — | $ | 19,120 | $ | 12,868 | $ | 31,988 | |||||||
| (dollars in thousands) |
Quoted Prices (Level 1) |
Significant Other Observable Inputs (Level 2) |
Significant Other Unobservable Inputs (Level 3) |
Total (Fair Value) |
||||||||||
|---|---|---|---|---|---|---|---|---|---|---|---|---|---|---|
December 31, 2009 |
||||||||||||||
Impaired loans: |
||||||||||||||
Commercial |
$ | — | $ | 4,364 | $ | — | $ | 4,364 | ||||||
Investment—commercial real estate |
— | — | — | — | ||||||||||
Owner occupied—commercial real estate |
2,426 | — | 2,426 | |||||||||||
Real estate mortgage—residential |
— | — | — | |||||||||||
Construction—commercial and residential |
— | 14,072 | 1,120 | 15,192 | ||||||||||
Home equity |
— | 42 | — | 42 | ||||||||||
Other consumer |
— | — | — | |||||||||||
Restructured loans |
— | — | — | |||||||||||
Other real estate owned |
— | — | 5,106 | 5,106 | ||||||||||
Total assets measured at fair value on a nonrecurring basis as of December 31, 2009 |
$ | — | $ | 20,904 | $ | 6,226 | $ | 27,130 | ||||||
Loans
The Company does not record loans at fair value on a recurring basis, however, from time to time, a loan is considered impaired and an allowance for loan loss is established. Loans for which it is probable that payment of interest and principal will not be made in accordance with the contractual terms of the loan are considered impaired. Once a loan is identified as individually impaired, management measures
110
Eagle Bancorp, Inc.
Notes to Consolidated Financial Statements
for the Years Ended December 31, 2010, 2009 and 2008: (Continued)
Note 18—Fair Value Measurements (Continued)
impairment in accordance with ASC Topic 310, "Receivables," the fair value of impaired loans is estimated using one of several methods, including the collateral value, market value of similar debt, enterprise value, and liquidation value and discounted cash flows. Those impaired loans not requiring a specific allowance represents loans for which the fair value of expected repayments or collateral exceed the recorded investment in such loans. At December 31, 2010, substantially all of the totally impaired loans were evaluated based upon the fair value of the collateral. In accordance with ASC Topic 820, impaired loans where an allowance is established based on the fair value of collateral require classification in the fair value hierarchy. When the fair value of the collateral is based on an observable market price or a current appraised value, the Company records the loan as nonrecurring Level 2. When an appraised value is not available or management determines the fair value of the collateral is further impaired below the appraised value and there is no observable market price, the Company records the loan as nonrecurring Level 3.
The Company discloses fair value information about financial instruments for which it is practicable to estimate the value, whether or not such financial instruments are recognized on the balance sheet. Fair value is the amount at which a financial instrument could be exchanged in a current transaction between willing parties, other than in a forced sale or liquidation, and is best evidenced by quoted market price, if one exists.
Quoted market prices, if available, are shown as estimates of fair value. Because no quoted market prices exist for a portion of the Company's financial instruments, the fair value of such instruments has been derived based on management's assumptions with respect to future economic conditions, the amount and timing of future cash flows and estimated discount rates. Different assumptions could significantly affect these estimates. Accordingly, the net realizable value could be materially different from the estimates presented below. In addition, the estimates are only indicative of individual financial instrument values and should not be considered an indication of the fair value of the Company taken as a whole.
The following methods and assumptions were used to estimate the fair value of each category of financial instrument for which it is practicable to estimate value:
Cash due from banks and federal funds sold: For cash and due from banks, and federal funds sold the carrying amount approximates fair value.
Interest bearing deposits with other banks: Values are estimated by discounting the future cash flows using the current rates at which similar deposits would be earning.
Investment securities: For these instruments, fair values are based upon quoted prices, if available. If quoted prices are not available, fair value is measured using independent pricing models or other model-based valuation techniques such as the present value of future cash flows, adjusted for the security's credit rating, prepayment assumptions and other factors such as credit loss assumptions.
Federal Reserve and Federal Home Loan Bank stock: The carrying amount approximate the fair values at the reporting date.
Loans held for sale: Fair values are at the carrying value (lower of cost or market) since such loans are typically committed to be sold (servicing released) at a profit.
Loans: For variable rate loans that re-price on a scheduled basis, fair values are based on carrying values. The fair value of the remaining loans are estimated by discounting the estimated future cash flows
111
Eagle Bancorp, Inc.
Notes to Consolidated Financial Statements
for the Years Ended December 31, 2010, 2009 and 2008: (Continued)
Note 18—Fair Value Measurements (Continued)
using the current interest rate at which similar loans would be made to borrowers with similar credit ratings and for the same remaining term.
Other earning assets: The fair value of bank owned life insurance is the current cash surrender value which is the carrying value.
Noninterest bearing deposits: The fair value of these deposits is the amount payable on demand at the reporting date, since generally accepted accounting standards do not permit an assumption of core deposit value.
Interest bearing deposits: The fair value of interest bearing transaction, savings, and money market deposits with no defined maturity is the amount payable on demand at the reporting date, since generally accepted accounting standards do not permit an assumption of core deposit value.
Certificates of deposit: The fair value of certificates of deposit is estimated by discounting the future cash flows using the current rates at which similar deposits would be accepted.
Customer repurchase agreements and federal funds purchased: The carrying amount approximate the fair values at the reporting date.
Borrowings: The carrying amount for variable rate borrowings approximate the fair values at the reporting date. The fair value of fixed rate FHLB advances and the subordinated notes are estimated by computing the discounted value of contractual cash flows payable at current interest rates for obligations with similar remaining terms. The fair value of variable rate FHLB advances is estimated to be carrying value since these liabilities are based on a spread to a current pricing index.
Off-balance sheet items: Management has reviewed the unfunded portion of commitments to extend credit, as well as standby and other letters of credit, and has determined that the fair value of such instruments is equal to the fee, if any, collected and unamortized for the commitment made.
The estimated fair values of the Company's financial instruments at December 31, 2010 and 2009 are as follows:
| |
2010 | 2009 | |||||||||||
|---|---|---|---|---|---|---|---|---|---|---|---|---|---|
| (dollars in thousands) |
Carrying Value |
Fair Value |
Carrying Value |
Fair Value |
|||||||||
Assets |
|||||||||||||
Cash and due from banks |
$ | 12,414 | $ | 12,414 | $ | 21,955 | $ | 21,955 | |||||
Federal funds sold |
34,048 | 34,048 | 88,248 | 88,248 | |||||||||
Interest bearing deposits with other banks |
11,652 | 11,652 | 7,484 | 7,484 | |||||||||
Investment securities |
228,048 | 228,048 | 235,227 | 235,227 | |||||||||
Federal Reserve and Federal Home Loan Bank stock |
9,528 | 9,528 | 10,417 | 10,417 | |||||||||
Loans held for sale |
80,571 | 80,571 | 1,550 | 1,550 | |||||||||
Loans |
1,675,500 | 1,680,569 | 1,399,311 | 1,398,043 | |||||||||
Other earning assets |
13,342 | 13,342 | 12,912 | 12,912 | |||||||||
Liabilities |
|||||||||||||
Noninterest bearing deposits |
400,291 | 400,291 | 307,959 | 307,959 | |||||||||
Interest bearing deposits |
1,326,507 | 1,331,070 | 1,152,315 | 1,155,583 | |||||||||
Borrowings |
146,884 | 149,331 | 150,090 | 154,480 | |||||||||
112
Eagle Bancorp, Inc.
Notes to Consolidated Financial Statements
for the Years Ended December 31, 2010, 2009 and 2008: (Continued)
Note 19—Quarterly Results of Operations (unaudited)
The following table reports quarterly results of operations (unaudited) for 2010, 2009 and 2008:
| |
2010 | |||||||||||||
|---|---|---|---|---|---|---|---|---|---|---|---|---|---|---|
| (dollars in thousands except per share data) |
Fourth Quarter |
Third Quarter |
Second Quarter |
First Quarter |
||||||||||
Total interest income |
$ | 26,040 | $ | 24,421 | $ | 23,689 | $ | 22,508 | ||||||
Total interest expense |
4,753 | 4,722 | 5,072 | 5,285 | ||||||||||
Net interest income |
21,287 | 19,699 | 18,617 | 17,223 | ||||||||||
Provision for credit losses |
3,556 | 1,962 | 2,101 | 1,689 | ||||||||||
Net interest income after provision for credit losses |
17,731 | 17,737 | 16,516 | 15,534 | ||||||||||
Noninterest income |
3,677 | 2,333 | 2,010 | 1,222 | ||||||||||
Noninterest expense |
13,476 | 12,929 | 13,137 | 11,463 | ||||||||||
Net income before income tax expenses |
7,932 | 7,141 | 5,389 | 5,293 | ||||||||||
Income tax expense |
2,879 | 2,375 | 1,942 | 1,902 | ||||||||||
Net income |
5,053 | 4,766 | 3,447 | 3,391 | ||||||||||
Preferred stock dividends and discount accretion |
328 | 327 | 324 | 320 | ||||||||||
Net income available to common shareholders |
$ | 4,725 | $ | 4,439 | $ | 3,123 | $ | 3,071 | ||||||
Income per common share |
||||||||||||||
Basic, per common share |
$ | 0.24 | $ | 0.22 | $ | 0.16 | $ | 0.16 | ||||||
Diluted, per common share |
0.23 | 0.22 | 0.16 | 0.16 | ||||||||||
Dividend declared per common share |
— | — | — | — | ||||||||||
| |
2009 | |||||||||||||
|---|---|---|---|---|---|---|---|---|---|---|---|---|---|---|
| (dollars in thousands except per share data) |
Fourth Quarter |
Third Quarter |
Second Quarter |
First Quarter |
||||||||||
Total interest income |
$ | 22,413 | $ | 21,426 | $ | 20,432 | $ | 20,067 | ||||||
Total interest expense |
5,685 | 6,408 | 6,112 | 6,604 | ||||||||||
Net interest income |
16,728 | 15,018 | 14,320 | 13,463 | ||||||||||
Provision for credit losses |
2,528 | 1,857 | 1,718 | 1,566 | ||||||||||
Net interest income after provision for credit losses |
14,200 | 13,161 | 12,602 | 11,897 | ||||||||||
Noninterest income |
1,276 | 1,486 | 3,103 | 1,432 | ||||||||||
Noninterest expense |
10,627 | 10,280 | 11,573 | 10,293 | ||||||||||
Net income before income tax expenses |
4,849 | 4,367 | 4,132 | 3,036 | ||||||||||
Income tax expense |
1,898 | 1,625 | 1,481 | 961 | ||||||||||
Net income |
2,951 | 2,742 | 2,651 | 2,075 | ||||||||||
Preferred stock dividends and discount accretion |
540 | 595 | 589 | 583 | ||||||||||
Net income available to common shareholders |
$ | 2,411 | $ | 2,147 | $ | 2,062 | $ | 1,492 | ||||||
Income per common share |
||||||||||||||
Basic, per common share(1) |
$ | 0.12 | $ | 0.16 | $ | 0.16 | $ | 0.12 | ||||||
Diluted, per common share(1) |
0.12 | 0.15 | 0.16 | 0.12 | ||||||||||
Dividend declared per common share |
— | — | — | — | ||||||||||
113
Eagle Bancorp, Inc.
Notes to Consolidated Financial Statements
for the Years Ended December 31, 2010, 2009 and 2008: (Continued)
Note 19—Quarterly Results of Operations (unaudited) (Continued)