Attached files
| file | filename |
|---|---|
| 8-K - FORM 8-K - HANMI FINANCIAL CORP | f8k_090820.htm |
Exhibit 99.1

2020 U.S. Bank Conference September 9 - 10, 2020
Hanmi Financial Corporation (the “Company”) cautions investors that any statements contained herein that are not historical facts are forward - looking statements within the meaning of the “safe harbor” provisions of the Private Securities Litigation Reform Act of 1995 , including, but not limited to, those statements regarding operating and financial performance, financial position and liquidity, business strategies, regulatory and competitive outlook, investment and expenditure plans, capital and financing needs and availability, litigation plans and objectives, merger or sale activity, the effects of COVID - 19 on our business, financial condition and results of operations, and all other forecasts and statements of expectation or assumption underlying any of the foregoing . These statements involve known and unknown risks and uncertainties that are difficult to predict . Investors should not rely on any forward - looking statement and should consider risks, such as changes in governmental policy, legislation and regulations, economic climate uncertainty, fluctuations in interest rate and credit risk, competitive pressures, the ability to succeed in new markets, balance sheet management, ability to identify and remediate any material weakness in internal controls over financial reporting, and other operational factors . Further, given its ongoing and dynamic nature, it is difficult to predict the full impact of the COVID - 19 outbreak on our business, financial condition and results of operations . The extent of such impact will depend on future developments, which are highly uncertain, including when the coronavirus can be controlled and abated and when and how the economy may be fully reopened . As the result of the COVID - 19 pandemic and the related adverse local and national economic consequences, we could be subject to various risks, any of which could have a material, adverse effect on our business, financial condition, liquidity, and results of operations . Forward - looking statements are based upon the good faith beliefs and expectations of management as of this date only and are further subject to additional risks and uncertainties, including, but not limited to, the risk factors set forth in our earnings release dated July 28 , 2020 , including the section titled “Forward Looking Statements and the Company’s most recent Form 10 - K, 10 - Q and other filings with the Securities and Exchange Commission (“SEC”) . Investors are urged to review our earnings release dated July 28 , 2020 , including the section titled “Forward Looking Statements and the Company’s SEC filings . The Company disclaims any obligation to update or revise the forward - looking statements herein . 2 Forward - Looking Statements

“Hanmi remains committed to providing value and support to our customers, while making sure we are staying safe for our families and our communities. Amidst the easing of shelter in place restrictions, we are seeing a resurgence of new COVID - 19 cases. Some states are pausing reopening plans in response to what some are calling “quarantine fatigue” and desensitization to the continued threat of the pandemic. In such times, we must continue to be vigilant and do our part to keep ourselves, our loved ones and our customers safe. We can only get through this if we continue to work together.” 3 Bonnie Lee, President and Chief Executive Officer
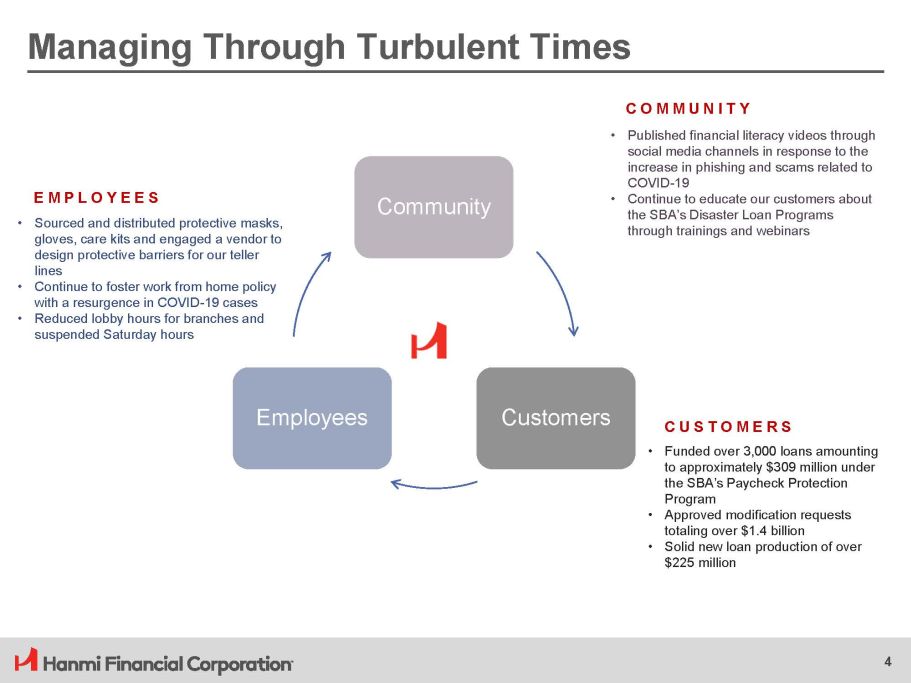
Managing Through Turbulent Times C o mmu n ity Customers Employees C O M M U N I T Y • Published financial literacy videos through social media channels in response to the increase in phishing and scams related to COVID - 19 • Continue to educate our customers about the SBA’s Disaster Loan Programs through trainings and webinars 4 E M P L O Y E E S • Sourced and distributed protective masks, gloves, care kits and engaged a vendor to design protective barriers for our teller lines • Continue to foster work from home policy with a resurgence in COVID - 19 cases • Reduced lobby hours for branches and suspended Saturday hours C U S T O M E R S • Funded over 3,000 loans amounting to approximately $309 million under the SBA’s Paycheck Protection Program • Approved modification requests totaling over $1.4 billion • Solid new loan production of over $225 million

Hanmi’s Strengths in the Midst of COVID - 19 Crisis C a p it a l L i q u i d ity B a l a nce Sheet B A L A N C E S H E E T • The bank’s asset quality remains stable, with NPAs at 0.94% of total assets and ACL at 1.79% of loans (1.91% excluding PPP loans) 5 C A P I T A L • The bank remains well capitalized, significantly above the regulatory requirements L I Q U I D I T Y • The bank, with $5.2 billion of deposits, has $2.9 billion of cash, securities and borrowing availability

Supporting our Customers PAYCHECK PROTECTION PROGRAM (1) 3,064 # of Loans Funded $309M $ of Loans Funded $11M Total Fees FUNDING DISTRIBUTION LOANS UP TO $350K (5% FEE) 2,913 $155M $53K $7.8M # of Loans Funded $ Total Fund i ng $ Total Fees $ Average Balance LOANS BETWEEN $350K AND $2M (3% FEE) 134 $97M $727K $2.9M 17 $56M $0.6M $3M LOANS AT LEAST $2M AND ABOVE (1% FEE) APPROVED MODIFICATIONS (1) 698 Approved Loan Modifications $1,308M Loans Sectors (By Dollar Volume) $ M od i f i cat i o n # of Loans $ Average Loan Size Hospitality Retail Leases Residential Mixed Use $590 $339 $59 $106 $47 $4.44 $2.09 $0.50 $0.06 $1.38 133 162 118 1745 34 TOP FIVE SECTORS ($million) (1) As of 6/30/2020 6 1,745 Approved Lease Modifications $106M Leases Note: Numbers may not foot due to rounding

$339 $290 $437 CRE - Hospitality CRE - Retail CRE - Other ($ million) C&I / Consumer $531 $238 $227 $82 $222 Encouraging Modification Trend • 49% decline in modifications (1) since June 30 th – from $1.3B to $671M • Nearly half of these second - round modifications (1) will provide interest payments - 26% - 71% - 67% - 57% $590 $59 $215 $101 $99 $56 $43 $63 $97 $43 $54 $89 $7 $38 $7 $31 1 st Request - Deferment 1 st Request – Interest Only 2 nd Request - Deferment 2 nd Request – Interest Only ($ million) Note: Numbers may not foot due to rounding (1) As of 8/31/2020; excludes leases; if included, aggregate decline in modifications would be 46%, with 41% of the second - round modifications being interest - only $1,078 $350 $230 $321 June 30 th Deferment August 31 st Interest Only $1 , 3 08 $671 - 49% 7

The Hanmi Story 1982 First Korean American Bank in the U.S. 1988 Began offering SBA loans Acquired First Global Bank 2001 Listed HAFC common stock 2004 Acquired Pacific Union Bank 2007 Completed $70 million secondary common stock offering 8 2016 Acquired & commenced Commercial Equipment Leasing Division (CELD) 2017 Assets surpassed $5 billion Opened a Manhattan branch in NY 2018 Opened Houston Chinatown branch in Texas 2014 Acquired Central Bancorp, Inc.

Management Team 9 Name Position Banking Experience (Years) Hanmi Experience (Years) Previous Experience Bonnie Lee President & CEO 34 7 BBCN Bancorp, Shinhan Bank America, Nara Bank Romolo Santarosa SEVP, Chief Financial Officer 29 5 Opus Bank, First California Financial Group, Sanwa Bank, Shawmut National Corporation Anthony Kim EVP, Chief Banking Officer 26 7 Nara Bank / Saehan Bank BBCN Bancorp Matthew Fuhr EVP, Chief Credit Administration Officer 24 5 Pacific Western Bank, Wells Fargo Bank, Foothill Independent Bank, FDIC Mike Park EVP, Chief Credit Risk Officer 32 6 East West Bank, Nara Bank, Sanwa/Bank of the West, Center Bank Anna Chung EVP, Chief SBA Lending Officer 37 6 East West Bank, Nara Bank, Sanwa/Bank of the West, Center Bank Navneeth Naidu EVP, Chief Technology Officer 18 2 Columbia Bank, American Marine Bank, First Capital Bank of Texas Michael Du SVP, Chief Risk Officer 21 1 Fremont Investment and Loan, Capital Source, Banc of California, Unify Financial Federal Credit Union, Pacific Western Bank

Hanmi at a Glance Focus on growth and value preservation for our shareholders • Second largest Korean American Bank with 38 years of history and $6.2 billion in assets • 35 branches coast - to - coast in major banking markets & 9 LPOs • Commitment to conservative, disciplined underwriting, and strong asset quality • Well capitalized, significantly above the regulatory requirements Equity Snapshot H e a d q u a r t ers: Ticker: Share Price: 52 Week Range: Market Cap: Avg. 3M Daily Volume: $4 . 2 3 $4 . 7 0 $5 . 2 1 $5 . 5 0 $5 . 5 4 2 0 15 2 0 16 2 0 17 2 0 18 2 0 19 $3 . 1 8 $3 . 8 4 $4 . 3 1 $4 . 6 1 $4 . 6 1 2 0 15 2 0 16 2 0 17 2 0 18 2 0 19 $3 . 5 1 $3 . 8 1 $4 . 3 5 $4 . 7 5 $4 . 7 0 2 0 15 2 0 16 2 0 17 2 0 18 2 0 19 $53 . 8 2 $56 . 4 9 $54 . 6 6 $57 . 8 7 $32.80 2 0 15 2 0 16 2 0 17 2 0 18 2 0 19 A ssets $ billions Loans $ billions Deposits $ billions Net Income $ millions Branch Loan Production Office (LPO) Bank Network (as of September 3, 2020) 1 1 3 1 2 1 1 1 1 7 1 WASHINGTON CALIFORNIA C OLO R A D O ILLINOIS GEO R GIA T EX A S VI R GI N IA NY / NJ 2 22 10 Los Angeles, CA NASDAQ: HAFC $ 9 .57 $7.15 - $20.79 $291.5 Million 2 4 8,966

2Q20 Highlights Diluted EPS $ 0 .30 ROAA 0. 63 % NIM 3. 15 % Efficiency TBVPS * 41.51% $17.47 Net Income $ 9 .2M • Net income of $9.2 million, or $0.30 per diluted share; second quarter results included credit loss expense of $24.6 million • Loans receivable increased 6.2% from prior quarter to $4.8 billion driven by solid new loan production of $225.3 million in addition to PPP loans » Funded over 3,000 Paycheck Protection Program loans totaling $308.8 million • Deposits of $5.21 billion, up 13.7% from the end of the first quarter » Cost of interest - bearing deposits declined 45 basis points from the prior quarter • Noninterest income of $20.9 million, included gains on sales of securities of $15.7 million • Noninterest expense decreased 12.7% from the prior quarter to $27.1 million » Efficiency ratio for the second quarter was 41.51% (60.82% excluding securities gains and deferred PPP loan origination costs), compared with 61.89% for the prior quarter • Well - capitalized with a Total Risk - Based capital ratio of 14.04% and a Common Equity Tier 1 capital ratio of 10.47% and TCE/TA ratio of 8.63% (9.07% excluding PPP loans) *Non - GAAP financial measure; refer to the non - GAAP reconciliation slide 11

($ million, except EPS) Change (1,2) 2Q20 1Q20 2Q19 Q/Q Y/Y Income Statement Summary Net interest income $ 44.4 $ 44.0 $ 43.0 1.1% 3.4% Noninterest income 20.9 6.2 7.7 236.4% 170.8% Operating revenue 65.4 50.2 50.7 30.2% 28.9% Noninterest expense 27.1 31.1 30.1 - 12.7% - 10.0% Credit Loss Expense 24.6 15.7 16.7 56.3% 47.3% Pretax income 13.6 3.4 3.9 302.3% 251.9% Income tax expense 4.5 1.0 1.2 329.0% 266.0% Net income $ 9.2 $ 2.4 $ 2.7 290.4% 245.4% EPS - Diluted (in $) $ 0.30 $ 0.08 $ 0.09 Select Balance Sheet Items Loans receivable $ 4 , 826 $ 4,544 $ 4,556 6.2% 5.9% Deposits 5 , 210 4,582 4,762 13.7% 9.4% Total assets 6 , 218 5,618 5,512 10.7% 12.8% Stockholders' equity 547 553 564 - 1.0% - 3.0% Profitability Metrics Return on average assets 0.63% 0.17% 0.19% 46 44 Return on average equity 6.73% 1.69% 1.87% 504 486 TCE/TA 8.63% 9.65% 10.04% - 102 - 141 Net interest margin 3.15% 3.36% 3.30% - 21 - 15 Efficiency ratio 41.51% 61.89% 59.43% - 2,038 - 1,792 • Net income of $ 9 . 2 million, or $ 0 . 30 per diluted share ; compared with $ 2 . 4 million, or $ 0 . 08 per diluted share in the first quarter o 2020 second quarter results included credit loss expense of $24.6 million and gain on sale of securities of $15.7 million • Loans receivable of $4.83 billion, up 6.2% from the end of the prior quarter reflecting $308.8 million of loans funded through the Paycheck Protection Program (“PPP”) and $225.3 million of new loan and lease production; Loans receivable up 5.9% year - over - year. • Deposits of $5.21 billion, up $627.7 million or 13.7% from the end of the first quarter, led principally from increases in noninterest - bearing deposits; Deposits up 9.4% from a year ago. • Net interest income increased to $44.4 million for the second quarter; net interest margin of 3.15% • Noninterest expense down 12.7% from the previous quarter to $27.1 million • Efficiency ratio for the second quarter was 41.51% (60.82% excluding securities gains and deferred PPP loan origination costs) compared with 61.89% from the prior quarter 12 Note: Numbers may not foot due to rounding (1) Percentage change calculated from dollars in thousands (2) Change in basis points for returns and ratios 2Q20 Financial Summary
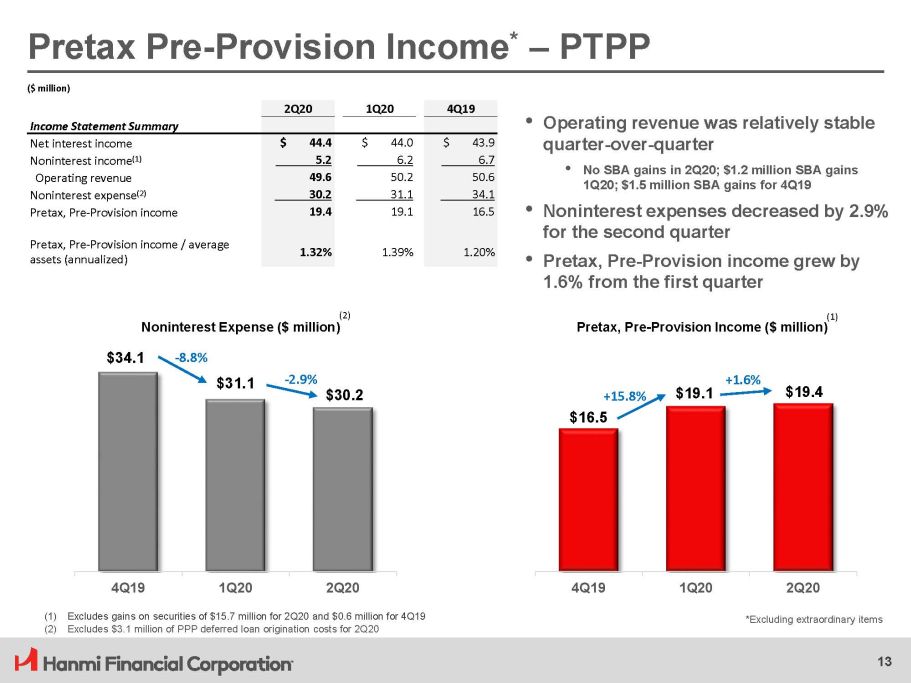
$34 .1 $31 .1 4Q19 1Q20 2Q20 (1) Excludes gains on securities of $15.7 million for 2Q20 and $0.6 million for 4Q19 $19 .1 $19 .4 4 Q 19 1 Q 20 2 Q 20 ($ million) 2Q20 1Q20 4Q19 • Operating revenue was relatively stable Income Statement Summary Net interest income $ 44.4 $ 44.0 $ 43.9 quarter - over - quarter Noninterest income (1) 5.2 6.2 6.7 • No SBA gains in 2Q20; $1.2 million SBA gains Operating revenue 49.6 50.2 50.6 1Q20; $1.5 million SBA gains for 4Q19 Noninterest expense (2) 30.2 31.1 34.1 • Noninterest expenses decreased by 2.9% Pretax, Pre - Provision income 19.4 19.1 16.5 Pretax, Pre - Provision income / average assets (annualized) 1.32% 1.39% for the second quarter 1.20% • Pretax, Pre - Provision income grew by 1.6% from the first quarter ( 2) Noninterest Expense ($ million) Pretax Pre - Provision Income * – PTPP - 8 . 8% ( 1) Pretax, Pre - Provision Income ($ million) - 2.9% $30.2 + 1 5.8% $16.5 + 1 .6% *Excluding extraordinary items (2) Excludes $3.1 million of PPP deferred loan origination costs for 2Q20 13

Successful Portfolio Diversification Strategy Total Portfolio: $2.9 billion Total Portfolio: $4.8 billion Significant progress in reducing CRE concentration from 84% of total portfolio to 68% today 11% CAGR CRE 68% Loan Composition 2Q 2015 Loan Composition 2Q 2020 C&I (1) 9% (3) RRE includes Consumer 14 (1) CRE 84% Le ases 9% C&I (2) 15% (1) Includes $214 million of the retained unguaranteed portion of the SBA loans. (2) Includes $176 million of the retained unguaranteed portion of the SBA loans and $302 million of guaranteed loans funded through the Paycheck Protection Program net of deferred fees and cost (2) RRE (3) 8% R R E (3) 7%

CRE $ 3 ,266 (68%) 15 Leases $463 (9%) RRE $366 (8%) Loan Portfolio Composition $4.83 Billion Loan Portfolio (as of 2Q20) Loan Portfolio Composition ($ million) RRE & Consumer Portfolio (1) $ in million Outstanding $366 Average Size $0.4 QTD Average Yield 3.53% Commercial & Industrial Portfolio (2) $ in millions Outstanding $730 Average Size $0 .2 QTD Average Yield 3.92% Leasing Portfolio $ in millions Outstanding $463 Average Size $0.04 QTD Average Yield 5.55% Commercial Real Estate Portfolio $ in millions Outstanding $3 , 26 6 Average Size $1.2 QTD Average Yield 4.54% C&I (2) $730 (15%) (1) RRE includes Consumer (2) C&I portfolio includes $302 million of loans funded through the Paycheck Protection Program net of deferred fees and costs (1)

Reta il 26% Gas Station 6% Of f i c e 8% In f orma t ion 6% S er v i c es 5% Mixed Use Other 15% Wholesale T rade 15% 5% Industrial 5% H o spitality 29% Manufacturing 10% A partment 6% Other s (1) 55% Retail Trade 9% Loan Portfolio Diversification 16 Loan portfolio is well diversified across property and business types. CRE Portfolio $3.27B C&I Portfolio $730M Note: Numbers may not foot due to rounding (1) 75% of this category represents PPP loans

$294 $131 $55 $94 $209 $13 $50 $22 $16 $50 California Texas Il l inois Washington New York Other Modifi e d Non - Modified 17 Hospitality Segment Total Hospitality Segment: $935M *Geography based on the collateral address ** Debt coverage and loan to value ratio calculated at the time of origination Hospitality Portfolio Detail • Average balance within the segment is $3.3 million • Flagged properties comprise 78% of the segment with an average balance of $3.3 million • Non - flagged properties comprise 22% of the segment with an average balance of $3.2 million • 64% of the segment, representing $601 million, has 1.5x or better debt coverage ** ratio o Weighted average debt coverage ** ratio of the segment is 2x • 81% of the segment, representing $762 million, has 59% or better loan to value ** ratio o Weighted average loan to value ** ratio of the segment is 50.1% Hospitality segment is $935 million, representing 19% of the loan portfolio. 78% of the hospitality segment is attributed to flagged properties. Composition by Top 5 States* (modified vs. non - modified)

Retail Segment Retail segment is $843 million, representing 18% of the loan portfolio. Retail Portfolio Detail Total Retail Segment: $843M • Average balance within the segment is $1.2 million • 53% of the segment representing $443 million has 1.5x or better debt coverage ** ratio o Weighted average debt coverage ** ratio of the segment is 1.8x • 76% of the segment representing $643 million has 59% or better loan to value ** ratio o Weighted average loan to value ** ratio of the segment is 49.6% $229 $87 $377 $51 $18 $4 $12 $8 $5 $38 $13 California Te x as G e o r g i a Other Il l inois Modifi e d Arizona Non - Modified Composition by Top 5 States* (modified vs. non - modified) 18 *Geography based on the collateral address ** Debt coverage and loan to value ratio calculated at the time of origination
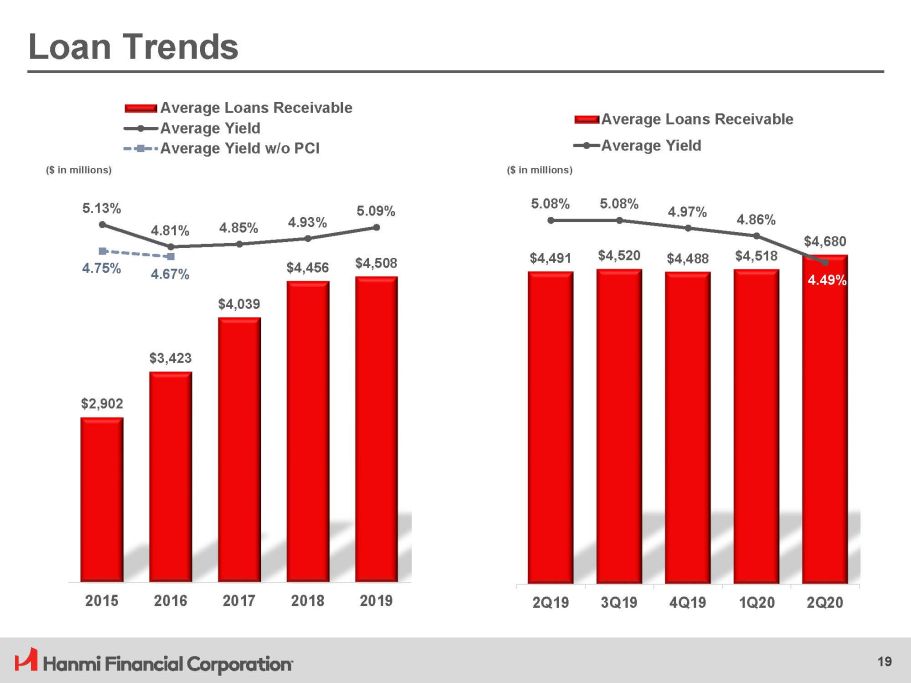
$ 4 ,4 9 1 $ 4 ,5 2 0 $ 4 ,4 8 8 $ 4 ,5 1 8 $ 4 ,6 8 0 5.08% 5.08% 4.97% 4.86% 4.49% 2 Q 19 3 Q 19 4 Q 19 1 Q 20 2 Q 20 Average Loans Receivable Average Yield $ 4 ,0 3 9 $3,423 $2,902 $ 4 ,4 5 6 $ 4 ,5 0 8 5.13% 4.81% 4.85% 4.93% 5.09% 4.75% 4.67% 2 0 15 2 0 16 2 0 17 2 0 18 2 0 19 Average Loans Receivable Average Yield Average Yield w/o PCI Loan Trends 19 ($ in millions) ($ in millions)
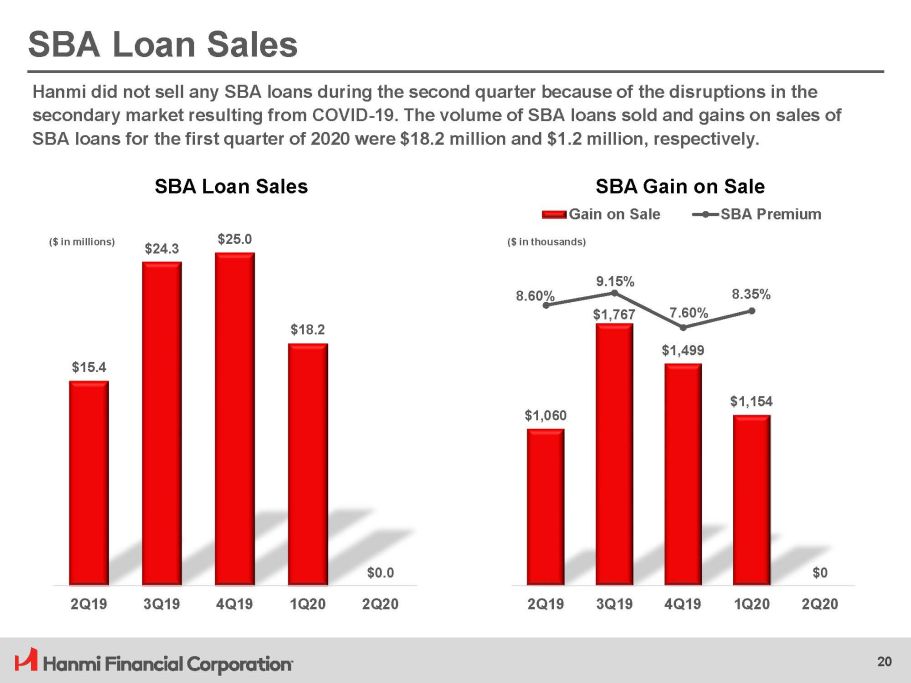
$ 1 ,0 6 0 $1,767 $ 1 ,4 9 9 $ 1 ,1 5 4 8.60% 9.15% 7.60% 8.35% Gain on Sale SBA Premium ($ in thousands) SBA Loan Sales $ 1 5.4 20 $ 2 4.3 $ 2 5.0 $ 1 8.2 $0.0 $0 2Q19 3Q19 4Q19 1Q20 2Q20 2Q19 3Q19 4Q19 1Q20 2Q20 ($ in millions) Hanmi did not sell any SBA loans during the second quarter because of the disruptions in the secondary market resulting from COVID - 19. The volume of SBA loans sold and gains on sales of SBA loans for the first quarter of 2020 were $18.2 million and $1.2 million, respectively. SBA Loan Sales SBA Gain on Sale

Asset Quality in New CRE Originations 5 4 .5% 5 4 .2% 5 3 .7% 5 1 .9% 5 5 .5% 2 Q 19 3 Q 19 4 Q 19 1 Q 20 2 Q 20 Weighted Average Loan to Value 1.78x 1.71x 1.68x 1.78x 1.70x 2 Q 19 3 Q 19 4 Q 19 1 Q 20 2 Q 20 Weighted Average Debt Coverage Ratio 21

1.3 8 % 1.42% 1.38% 1.15% 1.21% 2 Q 19 3 Q 19 4 Q 19 1 Q 20 2 Q 20 Nonperforming Loans to Total Loans (1) Asset Quality 1.15% 1.18% 1.15% 0.93% 0.94% 2 Q 19 3 Q 19 4 Q 19 1 Q 20 2 Q 20 Nonperforming Assets to Assets (1) 1.08% 1.11% 1.33% 1.46% 1.79% 2Q19 (2) 3Q19 (2) 4Q19 (2) 1 Q 20 2 Q 20 Allowance for Credit Losses to Total Loans 0.02% 22 0.02% 0.00% Net Loan Charge - offs (Recoveries) to Average Loans 0.19% 0.11% 2 Q 19 3 Q 19 4 Q 19 (3) 1Q20 2 Q 20 (1) 2Q19 includes a $40.7 million loan relationship comprised of a land loan ($27.9 million) and a business loan ($12.8 million) which has declined to $13.3 million at 2Q20; charge - offs were $25.4 million (2) 2Q19 and 3Q19 include a $15.7 million specific allowance, and 4Q19 includes a $22.6 million specific allowance for the loan relationship discussed in note 1 (3) 1Q20 annualized net charge - off, inclusive of the charge - off in note 2, was 2.41% Overall asset quality remains strong

$0 $ 1 ,0 0 0 $ 2 ,0 0 0 $ 3 ,0 0 0 $ 4 , 0 0 0 $ 5 ,0 0 0 2015 2016 2017 2018 2019 Time Deposits Money Market & Savings Demand Interest - bearing Demand Noninterest - bearing Diversified Deposit Base $ 1 ,0 0 0 $0 $ 3 ,0 0 0 $ 2 ,0 0 0 $ 4 ,0 0 0 $ 5 ,0 0 0 $ 6 ,0 0 0 2 Q 19 3 Q 19 4 Q 19 1 Q 20 2 Q 20 Deposits ($ in millions) Deposits ($ in millions) Deposits by Type – June 30, 2020 ($ in millions) Note: Numbers may not sum due to rounding Time Deposits Money Market & Savings Demand Interest - bearing Demand Noninterest - bearing $1,435 27% 23 $1,813 35% $97 2% $1,865 36%

$ 1 3 1 .6 $ 1 5 3 .2 $ 1 7 6 .8 $ 1 8 1 .0 $ 1 7 5 .9 3.90% 3.95% 3.82% 3.57% 3.3 7 % 3.4 7 % 3.79% Net Interest Income w/o PCI Net Interest Margin Net Interest Margin w/o PCI 2020: Net Interest Margin ($ in millions) $ 4 3.0 3.30% 2015 2016 2017 2018 2019 2Q19 3Q19 4Q19 1Q20 2Q20 $44.1 $43.9 $44.0 $ 4 4.4 3.36% 3.32% 3.36% (1) 3.15% Net Interest Income Net Interest Margin 24 ($ in millions) (1) Net interest margin adjusted for PPP loans is 3.21%

Noninterest Expenses 5 9 .4 4 % 6 4 .0 4 % 6 7 .3 1 % 6 1 .8 9 % 4 1 .5 1 % 1 Q 20 2 Q 20 Efficiency Ratio 2.83% 2.47% 2.30% 2.19% 2.30% 2015 2016 2017 2018 (1) 2019 NIE/Avg. Assets 5 8 .9 3 % 5 6 .0 0 % 5 4 .2 8 % 5 7 .2 0 % 6 1 .8 9 % 2015 2016 2017 2018 2019 (1) 2Q19 3Q19 (1) 4Q19 (1) (1) Reflects, among other things, elevated charges arising from the troubled loan relationship (2) Efficiency ratio adjusted for PPP loans and securities gains is 60.82% Efficiency Ratio 2.19% 25 2.39% 2.48% 2.26% 1.84% 2 Q 19 1 Q 20 2 Q 20 (1) 4Q19 (1) 3Q19 NIE/Avg. Assets (2)
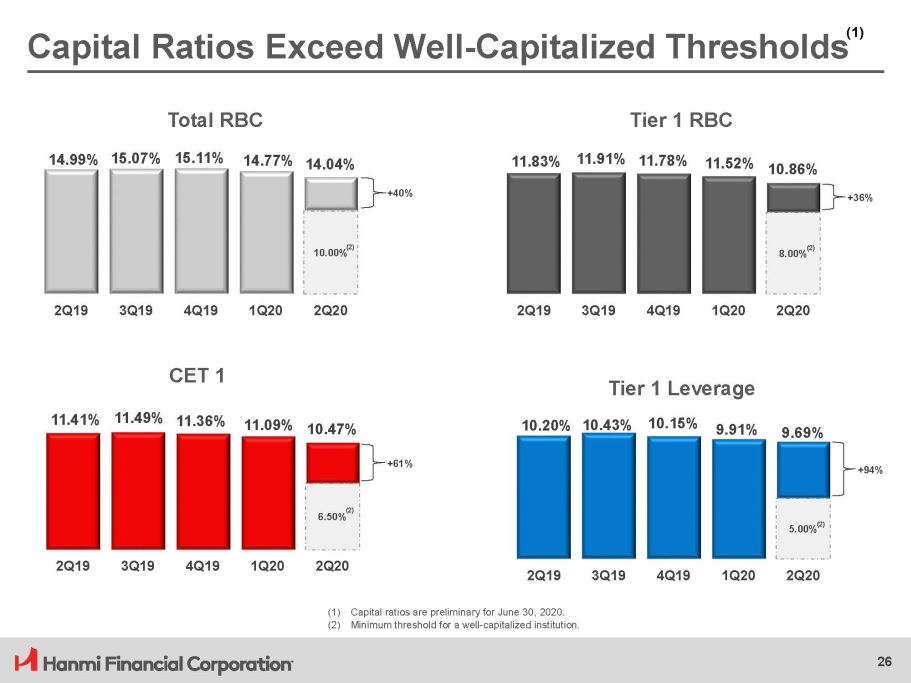
10 . 00 % 14 . 9 9% 15 . 0 7% 15 . 1 1% 14 . 7 7% 14 . 0 4% 2 Q 19 3 Q 19 4 Q 19 1 Q 20 2 Q 20 Total RBC (2) + 40 % (1) Capital ratios are preliminary for June 30, 2020. (2) Minimum threshold for a well - capitalized institution. 6 . 50 % 1 1 . 4 1% 1 1 . 4 9% 1 1 . 3 6% 1 1 . 0 9% 10 . 4 7% 2 Q 19 3 Q 19 4 Q 19 1 Q 20 2 Q 20 CET 1 (2) + 61 % 8 . 00 % 1 1 . 8 3% 1 1 . 9 1% 1 1 . 7 8% 1 1 . 5 2% 10 . 8 6% 2 Q 19 3 Q 19 4 Q 19 1 Q 20 2 Q 20 Tier 1 RBC (2) + 36 % 10.20% 10.43% 1 0 .15% 9 . 9 1% 9 . 6 9% 5.00% (2) 2 Q 19 3 Q 19 4 Q 19 1 Q 20 2 Q 20 Tier 1 Leverage + 94 % Capital Ratios Exceed Well - Capitalized Thresholds 26 (1)

ACL Analysis Allowance for credit losses was $86.3 million as of June 30, 2020 generating an allowance for credit losses to loans of 1.79% (1.91% excluding PPP loans) compared with 1.46% at the end of the prior quarter. The increase in the allowance from the first quarter reflects the change in macroeconomic assumptions including a higher projected average unemployment rate for the subsequent four quarters and a lower projected annual GDP growth rate. 1.46% C O VE R A GE RATIO ($ million) $ 6 6.5 27 $ 8 6.3 $(1.3) $ 2 1.1 1 Q 2 0 NCO P r ov i s ion 2 Q 2 0 1.79%

ACL by Loan Components ($ million) 28 June 30, 2020 Allowance Loans March 31, 2020 Allowance Loans January 1, 2020 (1) Allowance Loans Loan Components CRE $ 5 3 .6 $ 3, 2 6 6 .2 $ 3 7 .0 $ 3, 1 8 7 .2 $ 3 4 .7 $ 3, 2 1 3 .0 C&I 1 3 .4 7 3 0.4 1 1 .6 4 7 2.7 2.0 4 7 2.4 Leases 1 6 .5 4 6 2.8 1 5 .8 4 9 2.5 1 4 .7 4 8 3.9 RRE & Consumer 2.8 3 6 6.2 2.1 3 9 1.2 2.2 4 1 5.7 Total $ 86.3 $ 4 , 8 2 5 . 6 $ 66.5 $ 4 , 5 4 3 . 6 $ 5 3 .6 $ 4 , 5 8 5 . 0 Allowance for credit losses grew from $53.6 million to $66.5 million by the end of the first quarter to $86.3 million by the end of the second quarter, since inception of CECL. (1) Allowance and loans exclude the 1Q20 $25.2 million charge - off associated with the previously identified troubled - loan relationships
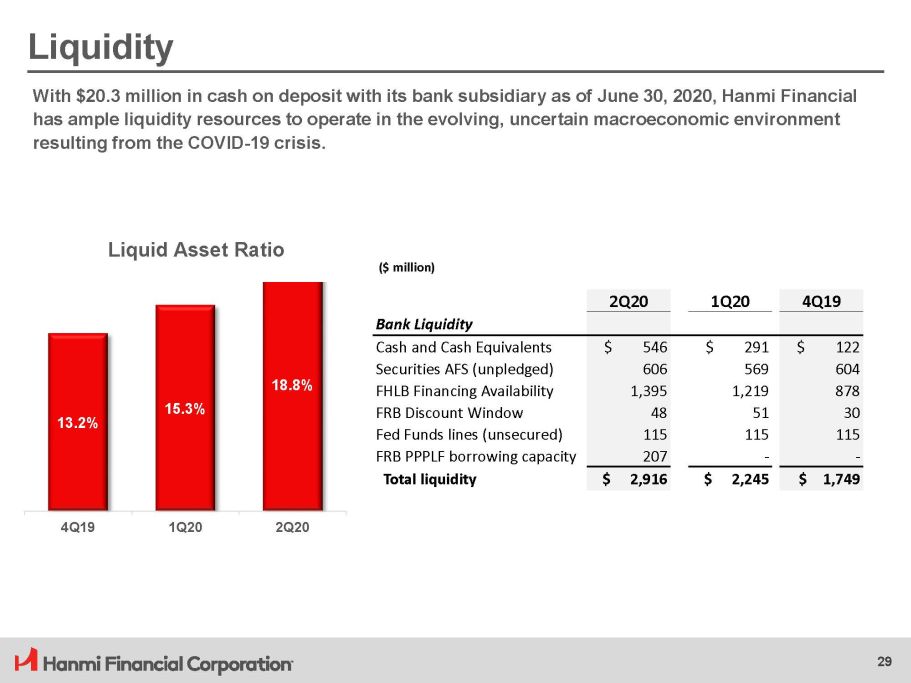
Li q ui d ity With $20.3 million in cash on deposit with its bank subsidiary as of June 30, 2020, Hanmi Financial has ample liquidity resources to operate in the evolving, uncertain macroeconomic environment resulting from the COVID - 19 crisis. ($ million) 2Q20 1Q20 4Q19 Bank Liquidity Cash and Cash Equivalents $ 546 $ 291 $ 122 Securities AFS (unpledged) 6 0 6 569 604 FHLB Financing Availability 1, 3 95 1, 2 19 878 FRB Discount Window 48 51 30 Fed Funds lines (unsecured) 115 115 115 FRB PPPLF borrowing capacity 207 - - Total liquidity $ 2,9 1 6 $ 2,2 4 5 $ 1,749 18 . 8 % 15.3% 13.2% 29 4 Q 19 1 Q 20 2 Q 20 Liquid Asset Ratio

Securities Portfolio 30 The composition of the securities portfolio remains relatively unchanged quarter - over - quarter, with allocation to U.S. treasuries, and U.S. government agencies and sponsored agencies – mortgage - backed securities, collateralized mortgage obligations, and notes. ($ thousand) June 30, 2020 Fair Value TE Yield Proj. Securities Portfolio U.S. treasuries $ 45,262 0.99% U.S. government agencies and sponsored agencies: Mortgage - backed securities 413,264 1.56% Collateralized mortgage obligations 120,294 1.03% Notes 77,152 0.58% Securities total $ 655,971 1.31% Unrealized appreciation, net $ 471
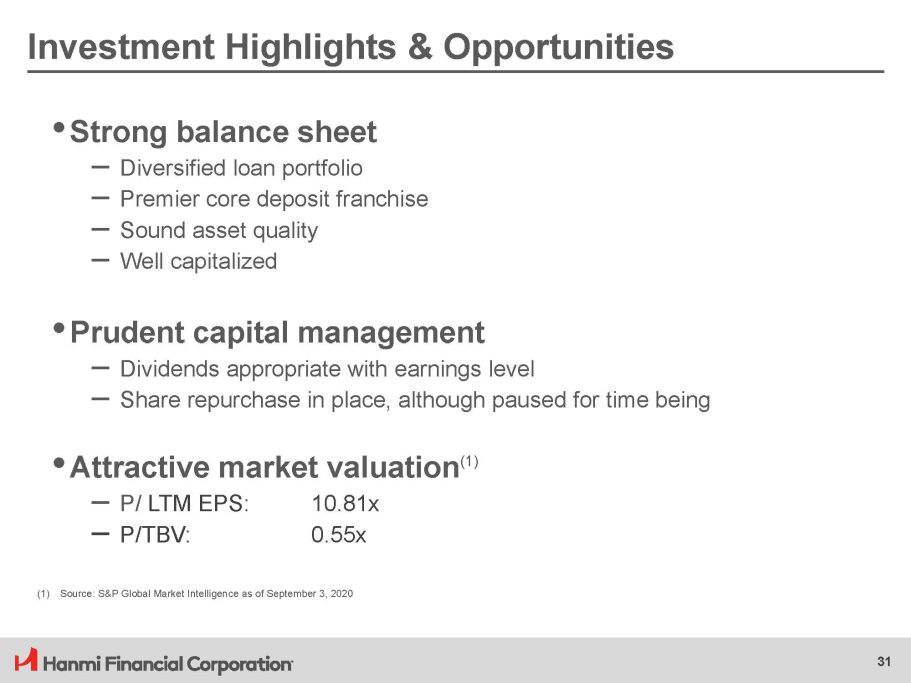
Investment Highlights & Opportunities 31 • Strong balance sheet – Diversified loan portfolio – Premier core deposit franchise – Sound asset quality – Well capitalized • Prudent capital management – Dividends appropriate with earnings level – Share repurchase in place, although paused for time being • Attractive market valuation (1) – P/ LTM EPS: – P/TBV: 1 0 .8 1 x 0.55x (1) Source: S&P Global Market Intelligence as of September 3, 2020

Non - GAAP Reconciliation 32 ($ thousand, except share, per share data and ratios) 2Q20 1Q20 4Q19 3Q19 2Q19 Tangible Common Equity to Tangible Assets Ratio Assets $ 6, 2 1 8 ,1 6 3 $ 5, 6 1 7 ,6 9 0 $ 5, 5 3 8 ,1 8 4 $ 5, 5 2 7 ,9 8 2 $ 5, 5 1 1 ,7 5 2 Less goodwill and other intangible assets (11, 7 4 2 ) (11, 8 0 8 ) ( 1 1 ,8 7 3) ( 1 1 ,9 5 0) ( 1 2 ,0 2 8) Tangible assets $ 6, 2 0 6 ,4 2 1 $ 5, 6 0 5 ,8 8 2 $ 5, 5 2 6 ,3 1 1 $ 5, 5 1 6 ,0 3 2 $ 5, 4 9 9 ,7 2 4 Stockholders' equity 1 $ 5 4 7, 4 36 $ 5 5 2, 9 58 $ 5 6 3, 2 67 $ 5 7 4, 5 27 $ 5 6 4, 4 58 Less goodwill and other intangible assets (11, 7 4 2 ) ( 1 1 ,8 0 8) ( 1 1 ,8 7 3) ( 1 1 ,9 5 0) ( 1 2 ,0 2 8) Tangible stockholders' equity 1 $ 5 3 5, 6 94 $ 5 4 1, 1 50 $ 5 5 1, 3 94 $ 5 6 2, 5 77 $ 5 5 2, 4 30 Stockholders' equity to assets 8.81% 9.84% 1 0 .1 7% 1 0 .3 9% 1 0 .2 4% Tangible common equity to tangible assets 1 8.63% 9.65% 9.98% 10 .20% 10 .04% Common shares outstanding 3 0 ,6 5 7, 6 29 3 0 ,6 2 2, 7 41 3 0 ,7 9 9, 6 24 3 1 ,1 7 3, 8 81 3 0 ,9 7 5, 1 63 Tangible common equity per common share $ 1 7 .47 $ 1 7 .67 $ 1 7 .90 $ 1 8 .05 $ 1 7 .83 (1) There were no preferred shares outstanding at the periods indicated.

Non - GAAP Reconciliation – Paycheck Protection Program 33 ($ in thousands, except share and per share data) As of June 30, 2020 Tangible Common Equity to Tangible Assets Tangible assets $ 6,206,4 2 1 Less PPP loans (301,836) Tangible assets adjusted for PPP loans $ 5,904,585 Tangible stockholders' equity (1) $ 535,694 TCE / TA Ratio 8.63% TCE / TA Ratio adjusted for PPP loans 9.07% Allowance for Credit Losses to Loans Receivable Allowance for credit losses $ 86,330 Loans receivable $ 4,825,642 Less PPP loans (301,83 6 ) Loans receivable adjusted for PPP loans $ 4,523,806 ACL / Loans Receivable 1.79% ACL / Loans Receivable adjusted for PPP loans 1.91% Three Months Ended June 30, 2020 Net Interest Margin Net interest income $ 44,442 Less PPP loan interest income (1,129) Net interest income adjusted for PPP loans $ 43,313 Average interest - earning assets $ 5,673,3 2 1 Less average PPP loans (251,758) Average interest - earning assets adjusted for PPP loans $ 5,421,5 6 3 NIM (2) 3.15% NIM adjusted for PPP loans (2) 3.21% Efficiency Ratio Noninterest expense $ 27,138 Less PPP deferred origination costs 3,064 Noninterest expense adjusted for PPP loans $ 30,202 Net interest income plus noninterest income $ 65,373 Less net gain on sales of securities (15,712) Net interest income plus noninterest income adjusted for net securities gains $ 49,661 Efficiency ratio (3) Efficiency ratio adjusted for PPP loans and securities gains (3) 41.51% 60.82% (1) There were no preferred shares outstanding at June 30, 2020 (2) Net interest income (as applicable) divided by average interest - earning assets (as applicable), annualized (3) Noninterest expense (as applicable) divided by the sum of net interest income and noninterest income (as applicable) In response to the Covid - 19 pandemic, the Coronavirus Aid, Relief and Economic Security Act (the “CARES Act”) was adopted, which included authorization for the U.S. Small Business Administration (the “SBA”) to introduce a new program, entitled the “Paycheck Protection Program,” which provides loans for eligible businesses through the SBA’s 7(a) loan guaranty program. These loans are fully guaranteed and available for loan forgiveness of up to the full principal amount so long as certain employee and compensation levels of the business are maintained and the proceeds of the loan are used as required under the program. The Paycheck Protection Program (“PPP”) and loan forgiveness are intended to provide economic relief to small businesses nationwide adversely impacted under the COVID - 19 pandemic. Hanmi participated in this program and the financial information for the 2020 second quarter reflects this participation. This table shows financial information excluding the effect of the origination of the PPP loans, including the corresponding interest income earned on such loans, which constitutes a non - GAAP measure. Management believes the presentation of certain financial measures excluding the effect of PPP loans provides useful supplemental information that is essential to a proper understanding of the financial condition and results of operations of Hanmi. This disclosure should not be viewed as a substitution for results determined in accordance with GAAP, nor is it necessarily comparable to non - GAAP financial measures that may be used by other companies.