Attached files
| file | filename |
|---|---|
| 8-K - FORM 8-K - AAR CORP | tm2027409d1_8k.htm |
Exhibit 99.1

AAR CORP. All rights reserved worldwide. Confidential and proprietary document. 0 AAR CORP. Canaccord Genuity Global Growth Conference August 13, 2020
AAR CORP. All rights reserved worldwide. Confidential and proprietary document. 1 Forward - Looking Statements This presentation contains certain statements relating to future results, which are forward - looking statements as that term is defined in the Private Securities Litigation Reform Act of 1995. Forward - looking statements may also be identified because they contain words such as ‘‘anticipate,’’ ‘‘believe,’’ ‘‘continue,’’ ‘‘could,’’ ‘‘estimate,’’ ‘‘expect,’’ ‘‘intend,’’ ‘‘likely,’’ ‘‘may,’’ ‘‘might,’’ ‘‘plan,’’ ‘‘potential,’’ ‘‘predict,’’ ‘‘project,’’ ‘‘seek,’’ ‘‘should ,’’ ‘‘target,’’ ‘‘will,’’ ‘‘would,’’ or similar expressions and the negatives of those terms. These forward - looking statements are based on beliefs of Company management, as well as assumptions and estimates based on information currently available to the Company, and are subject to certain risks and uncertainties that could cause actual results to differ materially from historical results or those anticipated, including those factors discussed under Item 1A, entitled “Risk Factors”, included in the Company’s Form 10 - K for the fiscal year ended May 31, 2020. Should one or more of these risks or uncertainties materialize adversely, or should underlying assumptions or estimates prove incorrect, actual results may vary materially from those described. These events and uncertainties are difficult or impossible to predict accurately and many are beyond the Company’s control. The Company assumes no obligation to update any forward - looking statements to reflect events or circumstances after the date of such statements or to reflect the occurrence of anticipated or unanticipated events. For additional information, see the comments included in AAR’s filings with the Securities and Exchange Commission .
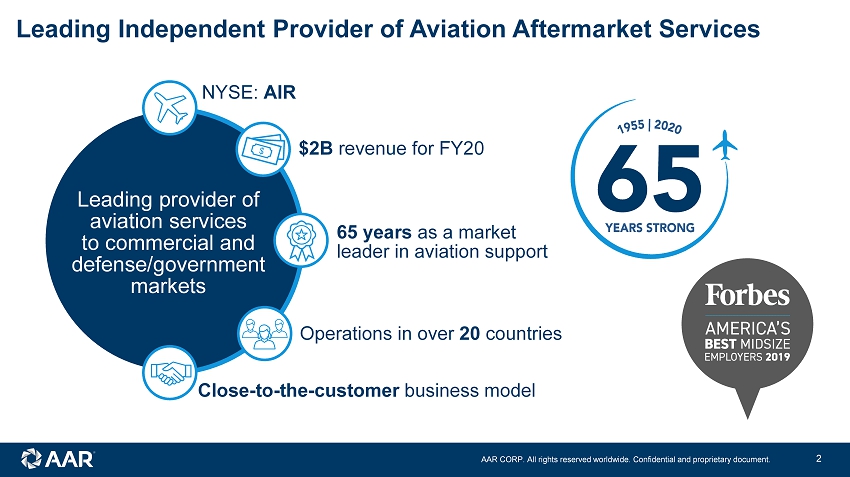
AAR CORP. All rights reserved worldwide. Confidential and proprietary document. 2 Leading Independent Provider of Aviation Aftermarket Services Leading provider of aviation services to commercial and defense/government markets NYSE: AIR $ 2B revenue for FY20 65 years as a market leader in aviation support Operations in over 20 countries Close - to - the - customer business model
AAR CORP. All rights reserved worldwide. Confidential and proprietary document. 3 Our Values
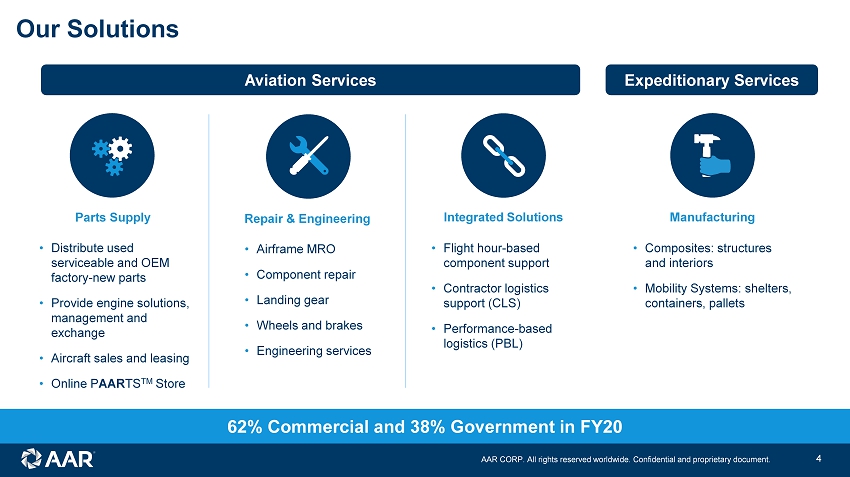
AAR CORP. All rights reserved worldwide. Confidential and proprietary document. 4 Our Solutions 62% Commercial and 38% Government in FY20 Integrated Solutions • Flight hour - based component support • Contractor logistics support (CLS) • Performance - based logistics (PBL) • Distribute used serviceable and OEM factory - new parts • Provide engine solutions, management and exchange • Aircraft sales and leasing • Online P AAR TS TM Store Parts Supply • Airframe MRO • Component repair • Landing g ear • Wheels and brakes • Engineering services Repair & Engineering • Composites: structures and interiors • Mobility Systems: shelters, containers, pallets Manufacturing Aviation Services Expeditionary Services
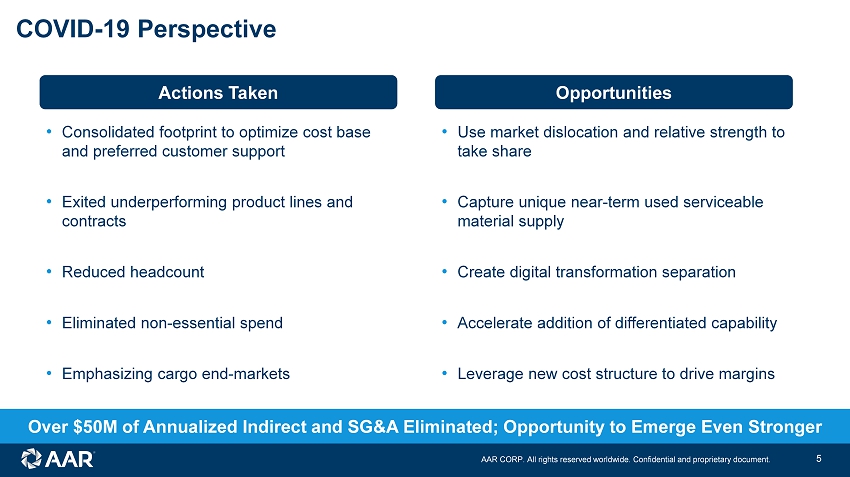
AAR CORP. All rights reserved worldwide. Confidential and proprietary document. 5 • Consolidated footprint to optimize cost base and preferred customer support • Exited underperforming product lines and contracts • Reduced headcount • Eliminated non - essential spend • Emphasizing cargo end - markets • Use market dislocation and relative strength to take share • Capture unique near - term used serviceable material supply • Create digital transformation separation • Accelerate addition of differentiated capability • Leverage new cost structure to drive margins Actions Taken Opportunities COVID - 19 Perspective Over $50M of Annualized Indirect and SG&A Eliminated; Opportunity to Emerge Even Stronger
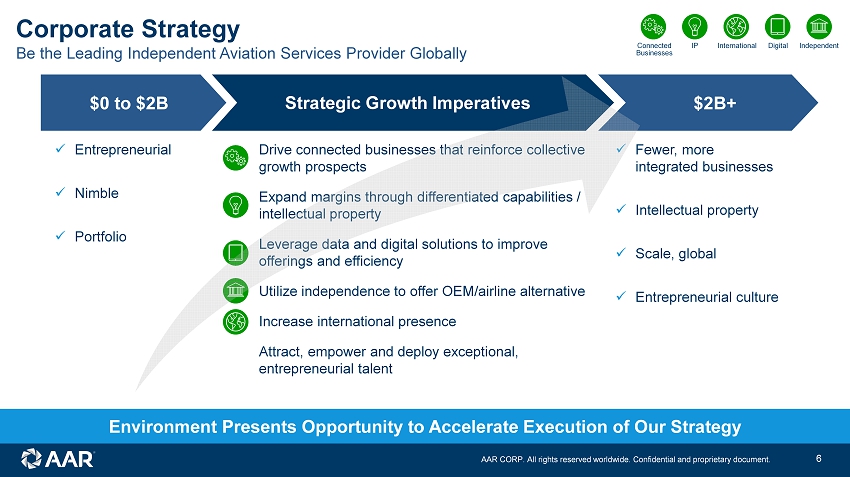
AAR CORP. All rights reserved worldwide. Confidential and proprietary document. 6 Corporate Strategy x Entrepreneurial x Nimble x Portfolio Drive connected businesses that reinforce collective growth prospects Expand margins through differentiated capabilities / i ntellectual property Leverage data and digital solutions to improve offerings and efficiency Utilize independence to offer OEM/airline alternative Increase international presence Attract , empower and deploy exceptional, entrepreneurial talent x Fewer, more integrated businesses x Intellectual property x Scale, global x Entrepreneurial culture $0 to $2B Strategic Growth Imperatives Connected Businesses Digital Independent IP International $2B+ Environment Presents Opportunity to Accelerate Execution of Our Strategy Be the Leading Independent Aviation Services Provider Globally
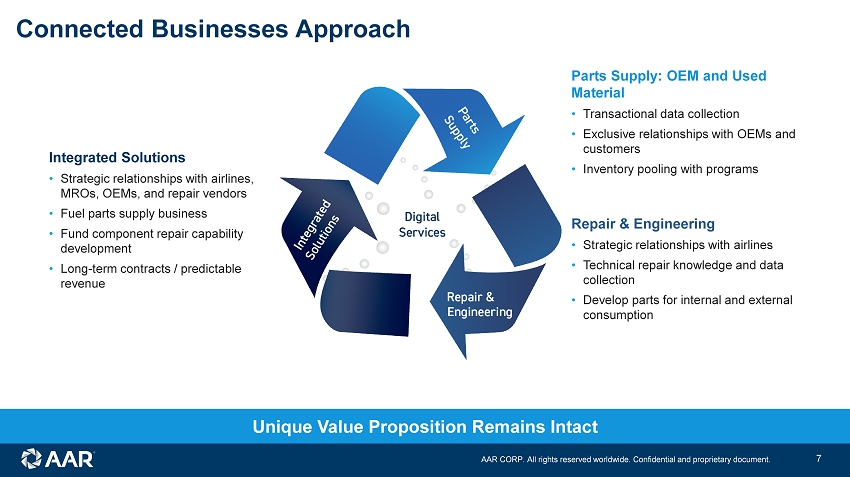
AAR CORP. All rights reserved worldwide. Confidential and proprietary document. 7 Connected Businesses Approach Parts Supply: OEM and Used Material • Transactional data collection • Exclusive relationships with OEMs and customers • Inventory pooling with programs Repair & Engineering • Strategic relationships with airlines • Technical repair knowledge and data collection • Develop parts for internal and external consumption Integrated Solutions • Strategic relationships with airlines, MROs, OEMs, and repair vendors • Fuel parts supply business • Fund component repair capability development • Long - term contracts / predictable revenue Unique Value Proposition Remains Intact
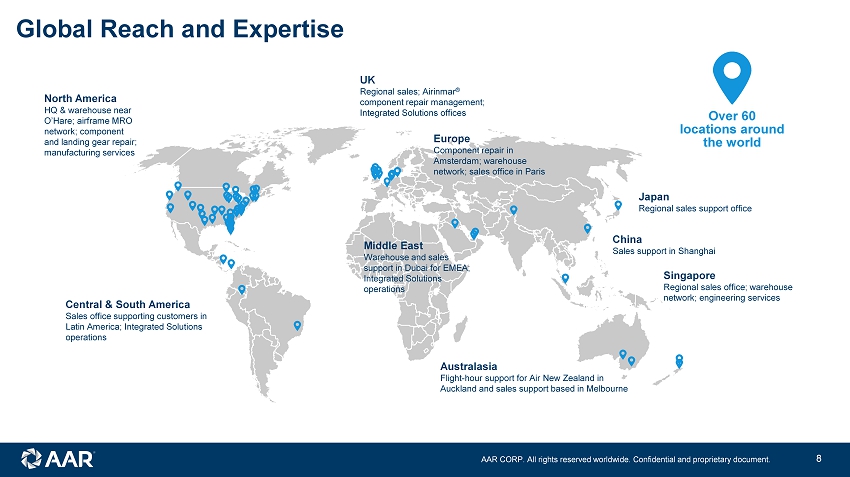
AAR CORP. All rights reserved worldwide. Confidential and proprietary document. 8 Global Reach and Expertise Over 60 locations around the world North America HQ & warehouse near O’Hare; airframe MRO network; component and landing gear repair; manufacturing services UK Regional sales; Airinmar ® component r epair management; Integrated Solutions offices Europe Component repair in Amsterdam; warehouse network; sales office in Paris China Sales support in Shanghai Middle East Warehouse and sales support in Dubai for EMEA; Integrated Solutions operations Australasia Flight - hour support for Air New Zealand in Auckland and sales support based in Melbourne Singapore Regional sales office; warehouse network; engineering services Central & South America Sales office supporting customers in Latin America; Integrated Solutions operations Japan Regional sales support office
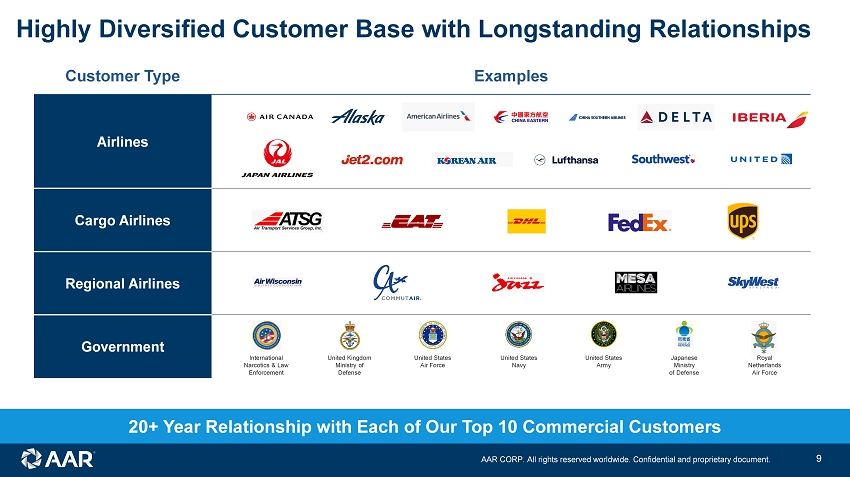
AAR CORP. All rights reserved worldwide. Confidential and proprietary document. 9 Customer Type Examples Airlines Cargo Airlines Regional Airlines Government International Narcotics & Law Enforcement United Kingdom Ministry of Defense United States Air Force Royal Netherlands Air Force Japanese Ministry of Defense United States Navy United States Army Highly Diversified Customer Base with Longstanding Relationships 20+ Y ear Relationship with Each of Our Top 10 Commercial Customers
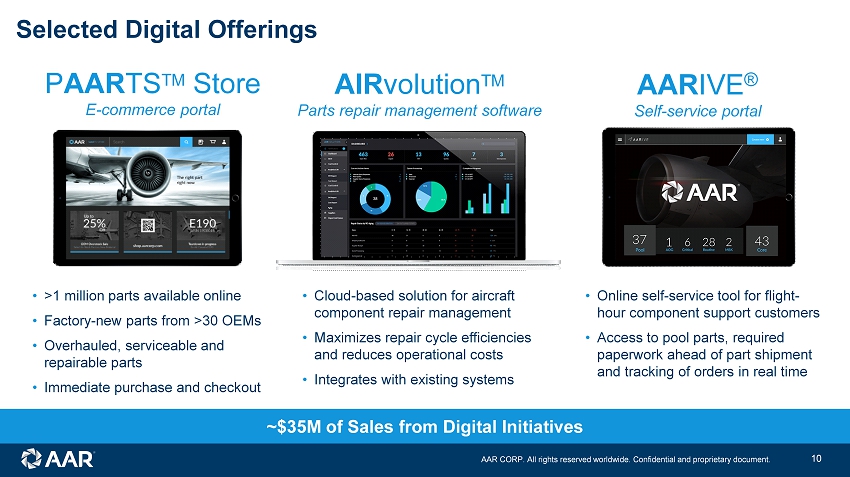
AAR CORP. All rights reserved worldwide. Confidential and proprietary document. 10 ~$35M of Sales from Digital Initiatives P AAR TS TM Store E - commerce portal AIR volution TM Parts repair management software • > 1 million parts available online • Factory - new parts from > 30 OEMs • Overhauled, serviceable and repairable parts • Immediate purchase and checkout • Cloud - based solution for aircraft component repair management • Maximizes repair cycle efficiencies and reduces operational costs • Integrates with existing systems AAR IVE ® Self - service portal • Online self - service tool for flight - hour component support customers • Access to pool parts, required paperwork ahead of part shipment and tracking of orders in real time Selected Digital Offerings
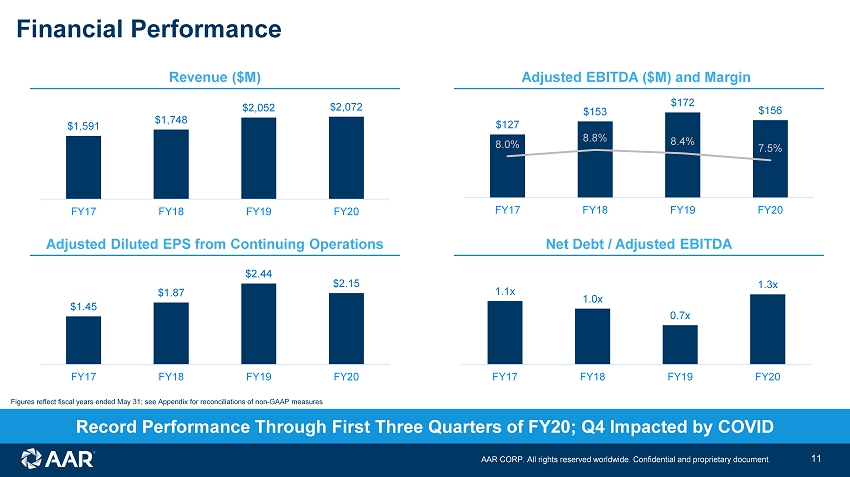
AAR CORP. All rights reserved worldwide. Confidential and proprietary document. 11 Record Performance Through First Three Quarters of FY20; Q4 Impacted by COVID Financial Performance Adjusted Diluted EPS from Continuing Operations Revenue ($M) Net Debt / Adjusted EBITDA Adjusted EBITDA ($M) and Margin $1,591 $1,748 $2,052 $2,072 FY17 FY18 FY19 FY20 Figures reflect fiscal years ended May 31; see Appendix for reconciliations of non - GAAP measures $127 $153 $172 $156 8.0% 8.8% 8.4% 7.5% FY17 FY18 FY19 FY20 $1.45 $1.87 $2.44 $2.15 FY17 FY18 FY19 FY20 1.1x 1.0x 0.7x 1.3x FY17 FY18 FY19 FY20

AAR CORP. All rights reserved worldwide. Confidential and proprietary document. 12 Appendix
AAR CORP. All rights reserved worldwide. Confidential and proprietary document. 13 Non - GAAP Financial Measures Adjusted diluted earnings per share from continuing operations, adjusted EBITDA and net debt are “non - GAAP financial measures” as defined in Regulation G of the Securities Exchange Act of 1934, as amended (the “Exchange Act”). We believe these non - GAAP financial measures are relevant and useful for investors as they illustrate our actual operating performance unaffected by the impact of certain items. When reviewed in conjunction with our GAAP results and the accompanying reconciliations, we believe these non - GAAP financial measures provide additional information that is useful to gain an understanding of the factors and trends affecting our business and provide a means by which to compare our operating performance against that of other companies in the industries we compete. These non - GAAP measures should be considered as a supplement to, and not as a substitute for, or superior to, the corresponding measures calculated in accordance with GAAP. Adjusted EBITDA is income from continuing operations before interest income (expense), other income (expense), income taxes, depreciation and amortization, stock - based compensation and other items of an unusual nature including but not limited to workforce actions and costs, impairment charges, facility consolidation and repositioning costs, investigation and remediation compliance costs, significant income tax adjustments, gains on asset sales and significant customer events such as early terminations, contract restructurings, and bankruptcies. Pursuant to the requirements of Regulation G of the Exchange Act, we are providing the following tables that reconcile the above mentioned non - GAAP financial measures to the most directly comparable GAAP financial measures.
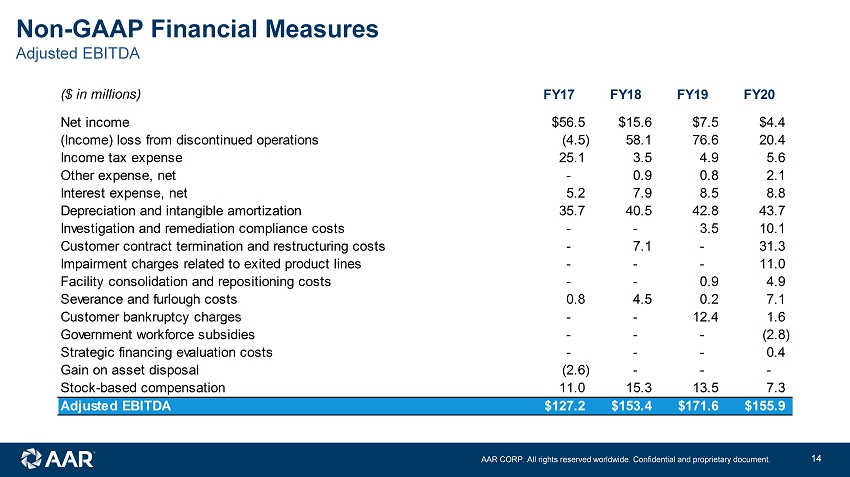
AAR CORP. All rights reserved worldwide. Confidential and proprietary document. 14 Non - GAAP Financial Measures Adjusted EBITDA ($ in millions) FY17 FY18 FY19 FY20 Net income $56.5 $15.6 $7.5 $4.4 (Income) loss from discontinued operations (4.5) 58.1 76.6 20.4 Income tax expense 25.1 3.5 4.9 5.6 Other expense, net - 0.9 0.8 2.1 Interest expense, net 5.2 7.9 8.5 8.8 Depreciation and intangible amortization 35.7 40.5 42.8 43.7 Investigation and remediation compliance costs - - 3.5 10.1 Customer contract termination and restructuring costs - 7.1 - 31.3 Impairment charges related to exited product lines - - - 11.0 Facility consolidation and repositioning costs - - 0.9 4.9 Severance and furlough costs 0.8 4.5 0.2 7.1 Customer bankruptcy charges - - 12.4 1.6 Government workforce subsidies - - - (2.8) Strategic financing evaluation costs - - - 0.4 Gain on asset disposal (2.6) - - - Stock-based compensation 11.0 15.3 13.5 7.3 Adjusted EBITDA $127.2 $153.4 $171.6 $155.9
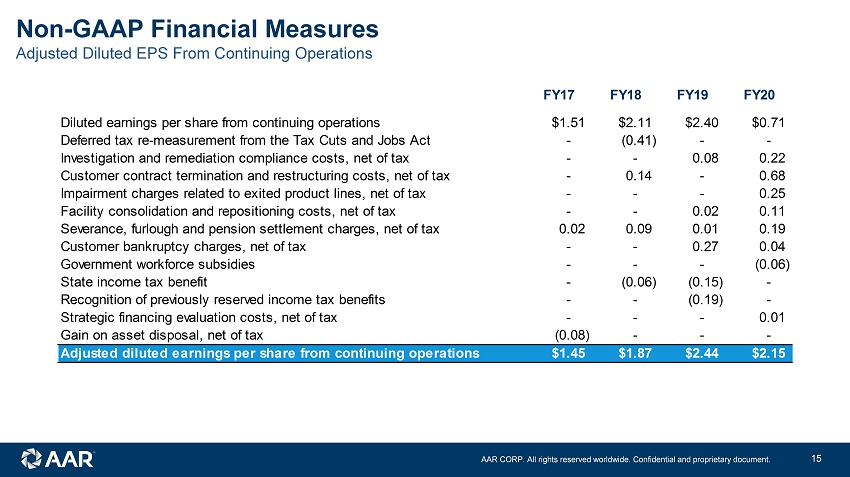
AAR CORP. All rights reserved worldwide. Confidential and proprietary document. 15 Non - GAAP Financial Measures Adjusted Diluted EPS From Continuing Operations FY17 FY18 FY19 FY20 Diluted earnings per share from continuing operations $1.51 $2.11 $2.40 $0.71 Deferred tax re-measurement from the Tax Cuts and Jobs Act - (0.41) - - Investigation and remediation compliance costs, net of tax - - 0.08 0.22 Customer contract termination and restructuring costs, net of tax - 0.14 - 0.68 Impairment charges related to exited product lines, net of tax - - - 0.25 Facility consolidation and repositioning costs, net of tax - - 0.02 0.11 Severance, furlough and pension settlement charges, net of tax 0.02 0.09 0.01 0.19 Customer bankruptcy charges, net of tax - - 0.27 0.04 Government workforce subsidies - - - (0.06) State income tax benefit - (0.06) (0.15) - Recognition of previously reserved income tax benefits - - (0.19) - Strategic financing evaluation costs, net of tax - - - 0.01 Gain on asset disposal, net of tax (0.08) - - - Adjusted diluted earnings per share from continuing operations $1.45 $1.87 $2.44 $2.15
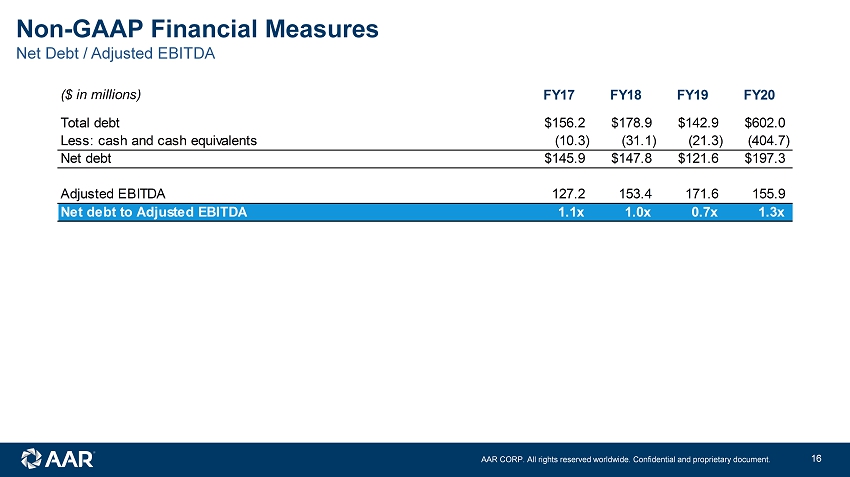
AAR CORP. All rights reserved worldwide. Confidential and proprietary document. 16 Non - GAAP Financial Measures Net Debt / Adjusted EBITDA ($ in millions) FY17 FY18 FY19 FY20 Total debt $156.2 $178.9 $142.9 $602.0 Less: cash and cash equivalents (10.3) (31.1) (21.3) (404.7) Net debt $145.9 $147.8 $121.6 $197.3 Adjusted EBITDA 127.2 153.4 171.6 155.9 Net debt to Adjusted EBITDA 1.1x 1.0x 0.7x 1.3x