Attached files
| file | filename |
|---|---|
| EX-99.1 - EX-99.1 - Williams Industrial Services Group Inc. | tmb-20200812xex99d1.htm |
| 8-K - 8-K - Williams Industrial Services Group Inc. | tmb-20200812x8k.htm |
Exhibit 99.2
| Q2 2020 Financial Results August 13, 2020 Tracy Pagliara President & CEO OTCQX: WLMS Randy Lay SVP & Chief Financial Officer |

| 2 2 Forward-looking Statement Disclaimer This presentation contains “forward-looking statements” within the meaning of the term set forth in the Private Securities Litigation Reform Act of 1995. The forward-looking statements include statements or expectations regarding the Company’s ability to realize opportunities and successfully achieve its growth and strategic initiatives, the impact of the COVID-19 pandemic on the Company’s business, operations, and financial condition, the Company’s ability to control costs, future demand for the Company’s services, future steady demand for the Company’s services, the Company’s ability to obtain new business, diversify backlog, reduce costs, streamline operations and improve performance, expectations regarding future contract awards and positive cash flow, the Company’s ability to refinance its outstanding debt, and other related matters. These statements reflect the Company’s current views of future events and financial performance and are subject to a number of risks and uncertainties, some of which have been, and may further be, exacerbated by the COVID-19 pandemic, including its ability to comply with the terms of its debt instruments and access letters of credit, ability to implement strategic initiatives, business plans, and liquidity plans, and ability to maintain effective internal control over financial reporting and disclosure controls and procedures. Actual results, performance or achievements may differ materially from those expressed or implied in the forward-looking statements. Additional risks and uncertainties that could cause or contribute to such material differences include, but are not limited to, the Company’s level of indebtedness; the Company’s ability to make interest and principal payments on its debt and satisfy the financial and other covenants contained in its credit facilities; the Company’s ability to engage in certain transactions and activities due to limitations and covenants contained in its credit facilities; the Company’s ability to enter into new lending facilities, if needed, and to obtain adequate surety bonding and letters of credit; the Company’s ability to generate sufficient cash resources to continue funding operations, including investments in working capital required to support growth-related commitments that it makes to its customers, and the possibility that the Company continues to incur further losses from operations in the future; exposure to market risks from changes in interest rates, including changes to or replacement of LIBOR; the possibility the Company may be required to write-down additional amounts of goodwill and other indefinite-lived assets; failure to maintain effective internal control over financial reporting and disclosure controls and procedures in the future; changes in the Company’s senior management and financial reporting and accounting teams, the ability of such persons to successfully perform their roles, and the Company’s ability to attract and retain qualified personnel, skilled workers and key officers; a failure to successfully implement or realize the Company’s business strategies, plans and objectives of management, and liquidity, operating and growth initiatives and opportunities; the loss of one or more of the Company’s significant customers; the Company’s competitive position; market outlook and trends in the Company’s industry, including the possibility of reduced investment in, or increased regulation of, nuclear power plants and declines in public infrastructure construction and reductions in government funding, including funding by state and local agencies; costs exceeding estimates the Company uses to set fixed-price contracts; harm to the Company’s reputation or profitability due to, among other things, internal operational issues, poor subcontractor performances or subcontractor insolvency; potential insolvency or financial distress of third parties, including the Company’s customers and suppliers; the Company’s contract backlog and related amounts to be recognized as revenue; the Company’s ability to maintain its safety record, the inherently dangerous nature of the services it provides, the risks of potential liability and adequacy of insurance; changes in the Company’s credit profile and market conditions affecting its relationships with suppliers, vendors and subcontractors; compliance with environmental, health, safety and other related laws and regulations; expiration of the Price-Anderson Act’s indemnification authority; the Company’s expected financial condition, future cash flows, results of operations and future capital and other expenditures; the impact of general economic conditions, including the current economic disruption and recession in the U.S. generated by the COVID-19 pandemic; the impact of the COVID-19 pandemic on revenues, expenses, uncollectible accounts, capital investment programs, cash flows, liquidity, maintenance of existing assets, and other operating expenses; the potential for additional COVID-19 cases to occur at the Company’s active or future job sites, as has occurred at the Plant Vogtle site in Georgia, during the COVID-19 pandemic, which potentially could impact cost and labor availability; information technology vulnerabilities and cyberattacks on the Company’s networks; the Company’s failure to comply with applicable laws and regulations, including, but not limited to, those relating to privacy and anti-bribery; the Company’s participation in multiemployer pension plans; the impact of any disruptions resulting from the expiration of collective bargaining agreements; availability of raw materials and inventories; the impact of natural disasters and other severe catastrophic events; future income tax payments and utilization of net operating loss and foreign tax credit carryforwards, including any impact relating to the Tax Cuts and Jobs Act of 2017 or other tax changes; future compliance with orders of and agreements with regulatory agencies; volatility of the market price for the Company’s common stock and stockholders’ ability to resell their shares of the Company’s common stock; the Company’s ability to pay cash dividends in the future; the impact of future offerings or sales of the Company’s common stock on the market price of such stock; expected outcomes of legal or regulatory proceedings and their expected effects on the Company’s results of operations, including future liabilities, fees and expenses resulting from the Koontz-Wagner bankruptcy filing; and any other statements regarding future growth, future cash needs, future operations, business plans and future financial results. Other important factors that may cause actual results to differ materially from those expressed in the forward-looking statements are discussed in the Company’s filings with the U.S. Securities and Exchange Commission, including the section of the Annual Report on Form 10-K for its 2019 fiscal year titled “Risk Factors” and in subsequent filings. Any forward-looking statement speaks only as of the date of this presentation. Except as may be required by applicable law, the Company undertakes no obligation to publicly update or revise any forward-looking statements, whether as a result of new information, future events or otherwise, and you are cautioned not to rely upon them unduly. Non-GAAP Financial Measures This presentation will discuss some non-GAAP financial measures, which the Company believes are useful in evaluating its performance. You should not consider the presentation of this additional information in isolation or as a substitute for results prepared in accordance with GAAP. The Company has provided reconciliations of comparable GAAP to non-GAAP measures in tables found on the slides following the “Supplemental Information” slide of this presentation. Cautionary Notes Note: Unless otherwise noted, all discussion is based upon continuing operations. |

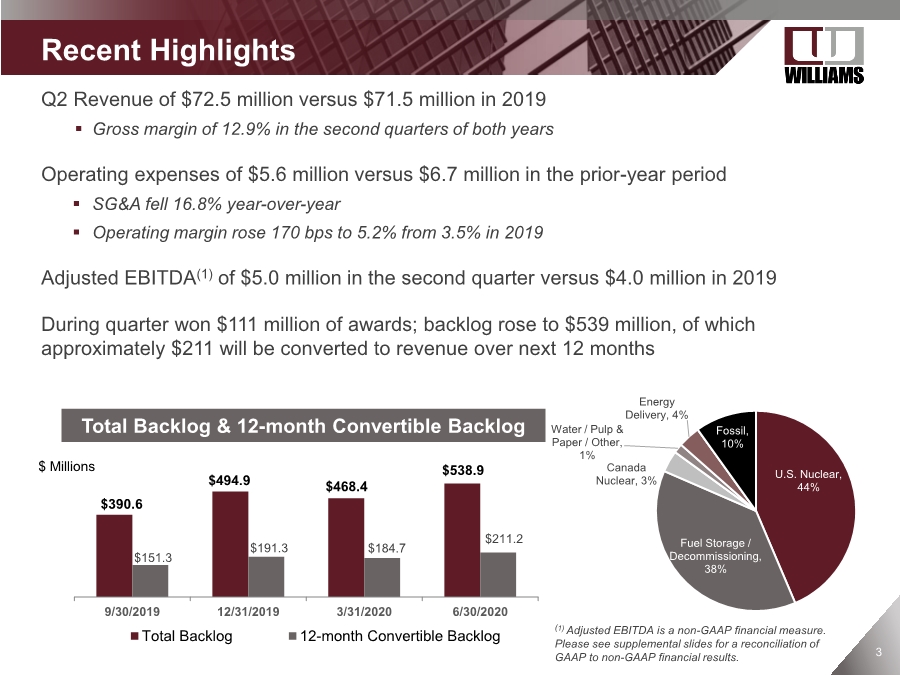
| 3 Q2 Revenue of $72.5 million versus $71.5 million in 2019 ▪ Gross margin of 12.9% in the second quarters of both years Operating expenses of $5.6 million versus $6.7 million in the prior-year period ▪ SG&A fell 16.8% year-over-year ▪ Operating margin rose 170 bps to 5.2% from 3.5% in 2019 Adjusted EBITDA(1) of $5.0 million in the second quarter versus $4.0 million in 2019 During quarter won $111 million of awards; backlog rose to $539 million, of which approximately $211 will be converted to revenue over next 12 months Recent Highlights (1) Adjusted EBITDA is a non-GAAP financial measure. Please see supplemental slides for a reconciliation of GAAP to non-GAAP financial results. $390.6 $494.9 $468.4 $538.9 $151.3 $191.3 $184.7 $211.2 9/30/2019 12/31/2019 3/31/2020 6/30/2020 Total Backlog 12-month Convertible Backlog Total Backlog & 12-month Convertible Backlog U.S. Nuclear, 44% Fuel Storage / Decommissioning, 38% Canada Nuclear, 3% Water / Pulp & Paper / Other, 1% Energy Delivery, 4% Fossil, 10% $ Millions |
| 4 4 Q2 Pandemic Impact Update ▪ Continue to take appropriate measures to safeguard employees & customers ▪ Moderate impact to operations • Vogtle continues, with no new material changes to work • Some impact to new business development • No material project delays ▪ Continue to manage expenses and working capital ▪ Reaffirming 2020 guidance, with Adjusted EBITDA expected near high end of range |
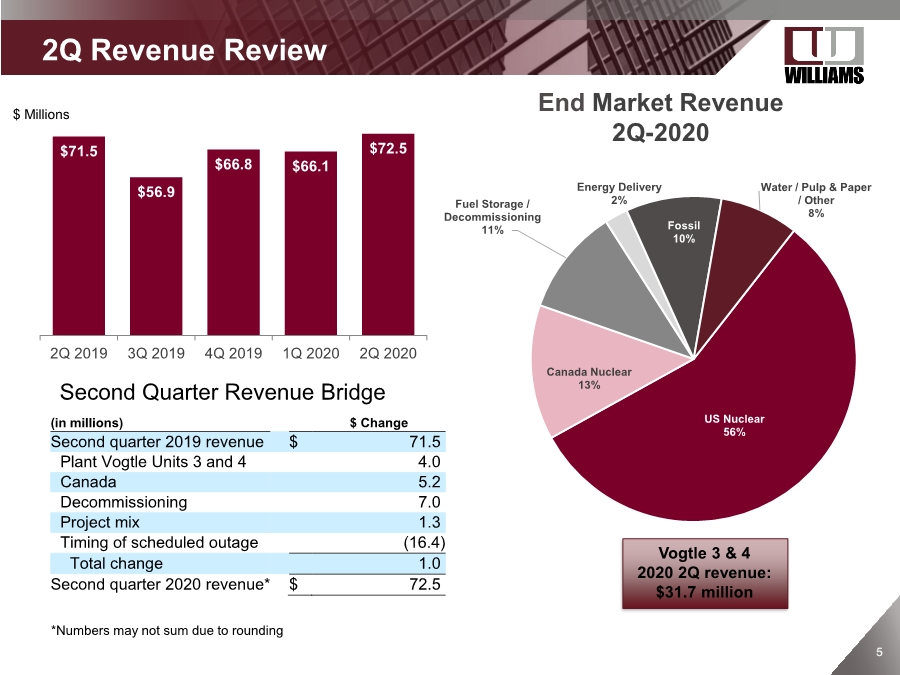
| 5 5 (in millions) $ Change Second quarter 2019 revenue $ 71.5 Plant Vogtle Units 3 and 4 4.0 Canada 5.2 Decommissioning 7.0 Project mix 1.3 Timing of scheduled outage (16.4) Total change 1.0 Second quarter 2020 revenue* $ 72.5 US Nuclear 56% Canada Nuclear 13% Fuel Storage / Decommissioning 11% Energy Delivery 2% Fossil 10% Water / Pulp & Paper / Other 8% 2Q Revenue Review End Market Revenue 2Q-2020 Vogtle 3 & 4 2020 2Q revenue: $31.7 million $71.5 $56.9 $66.8 $66.1 $72.5 2Q 2019 3Q 2019 4Q 2019 1Q 2020 2Q 2020 Second Quarter Revenue Bridge $ Millions *Numbers may not sum due to rounding |
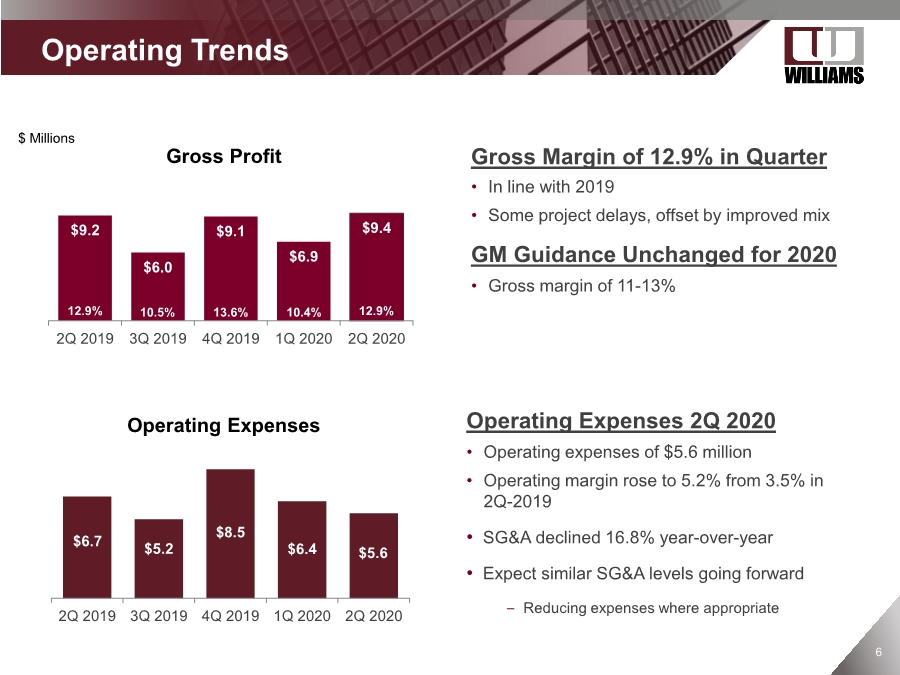
| 6 Operating Trends Gross Margin of 12.9% in Quarter • In line with 2019 • Some project delays, offset by improved mix GM Guidance Unchanged for 2020 • Gross margin of 11-13% $9.2 $6.0 $9.1 $6.9 $9.4 2Q 2019 3Q 2019 4Q 2019 1Q 2020 2Q 2020 12.9% 13.6% $ Millions 12.9% 10.5% $6.7 $5.2 $8.5 $6.4 $5.6 2Q 2019 3Q 2019 4Q 2019 1Q 2020 2Q 2020 $1.4 Gross Profit Operating Expenses 2Q 2020 • Operating expenses of $5.6 million • Operating margin rose to 5.2% from 3.5% in 2Q-2019 • SG&A declined 16.8% year-over-year • Expect similar SG&A levels going forward – Reducing expenses where appropriate 10.4% Operating Expenses |
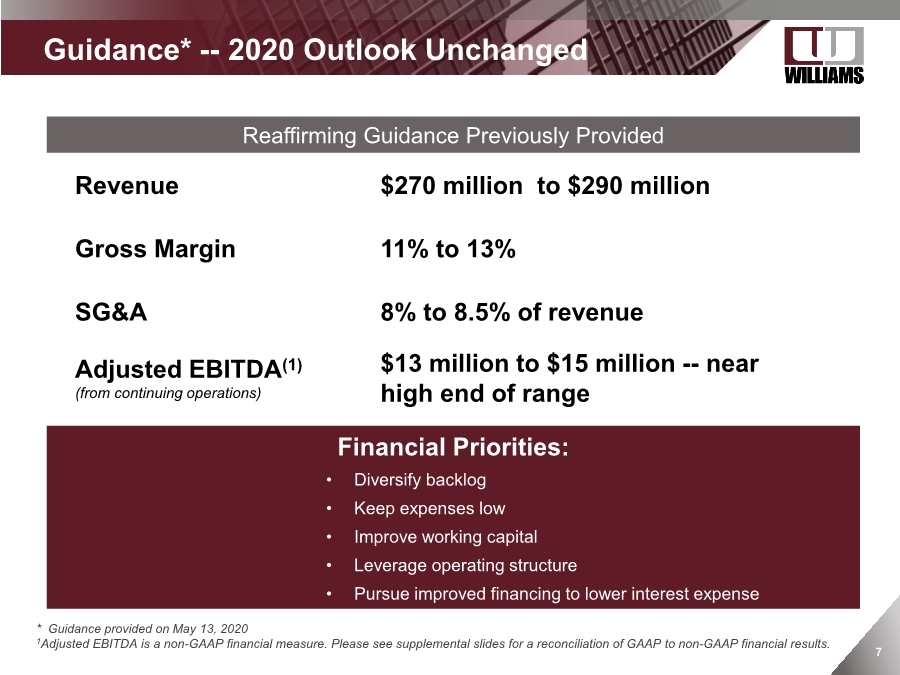
| 7 ▪ Guidance* -- 2020 Outlook Unchanged * Guidance provided on May 13, 2020 1Adjusted EBITDA is a non-GAAP financial measure. Please see supplemental slides for a reconciliation of GAAP to non-GAAP financial results. Reaffirming Guidance Previously Provided Revenue $270 million to $290 million Gross Margin 11% to 13% SG&A 8% to 8.5% of revenue Adjusted EBITDA(1) (from continuing operations) $13 million to $15 million -- near high end of range Financial Priorities: • Diversify backlog • Keep expenses low • Improve working capital • Leverage operating structure • Pursue improved financing to lower interest expense |
| Supplemental Information OTCQX: WLMS |

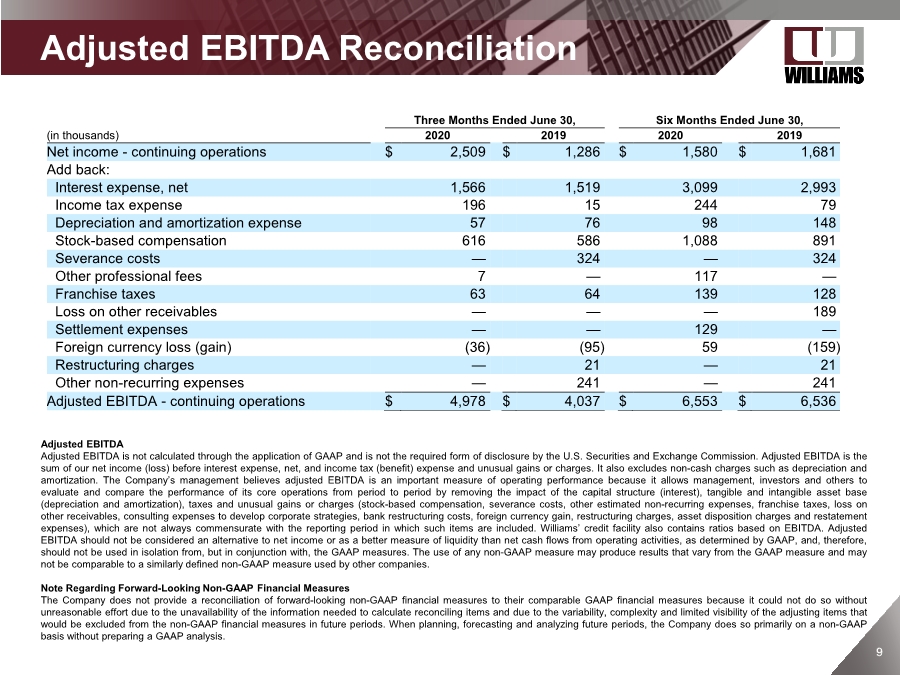
| 9 9 Adjusted EBITDA Reconciliation Adjusted EBITDA Adjusted EBITDA is not calculated through the application of GAAP and is not the required form of disclosure by the U.S. Securities and Exchange Commission. Adjusted EBITDA is the sum of our net income (loss) before interest expense, net, and income tax (benefit) expense and unusual gains or charges. It also excludes non-cash charges such as depreciation and amortization. The Company’s management believes adjusted EBITDA is an important measure of operating performance because it allows management, investors and others to evaluate and compare the performance of its core operations from period to period by removing the impact of the capital structure (interest), tangible and intangible asset base (depreciation and amortization), taxes and unusual gains or charges (stock-based compensation, severance costs, other estimated non-recurring expenses, franchise taxes, loss on other receivables, consulting expenses to develop corporate strategies, bank restructuring costs, foreign currency gain, restructuring charges, asset disposition charges and restatement expenses), which are not always commensurate with the reporting period in which such items are included. Williams’ credit facility also contains ratios based on EBITDA. Adjusted EBITDA should not be considered an alternative to net income or as a better measure of liquidity than net cash flows from operating activities, as determined by GAAP, and, therefore, should not be used in isolation from, but in conjunction with, the GAAP measures. The use of any non-GAAP measure may produce results that vary from the GAAP measure and may not be comparable to a similarly defined non-GAAP measure used by other companies. Note Regarding Forward-Looking Non-GAAP Financial Measures The Company does not provide a reconciliation of forward-looking non-GAAP financial measures to their comparable GAAP financial measures because it could not do so without unreasonable effort due to the unavailability of the information needed to calculate reconciling items and due to the variability, complexity and limited visibility of the adjusting items that would be excluded from the non-GAAP financial measures in future periods. When planning, forecasting and analyzing future periods, the Company does so primarily on a non-GAAP basis without preparing a GAAP analysis. Three Months Ended June 30, Six Months Ended June 30, (in thousands) 2020 2019 2020 2019 Net income - continuing operations $ 2,509 $ 1,286 $ 1,580 $ 1,681 Add back: Interest expense, net 1,566 1,519 3,099 2,993 Income tax expense 196 15 244 79 Depreciation and amortization expense 57 76 98 148 Stock-based compensation 616 586 1,088 891 Severance costs — 324 — 324 Other professional fees 7 — 117 — Franchise taxes 63 64 139 128 Loss on other receivables — — — 189 Settlement expenses — — 129 — Foreign currency loss (gain) (36) (95) 59 (159) Restructuring charges — 21 — 21 Other non-recurring expenses — 241 — 241 Adjusted EBITDA - continuing operations $ 4,978 $ 4,037 $ 6,553 $ 6,536 |