Attached files
| file | filename |
|---|---|
| EX-99.1 - EX-99.1 - Oaktree Strategic Income Corp | d48379dex991.htm |
| 8-K - 8-K - Oaktree Strategic Income Corp | d48379d8k.htm |
Third Quarter Fiscal Year 2020 Earnings Presentation August 10, 2020 Nasdaq: OCSI Exhibit 99.2
Forward Looking Statements Some of the statements in this presentation constitute forward-looking statements because they relate to future events or our future performance or financial condition. The forward-looking statements contained in this presentation may include statements as to: our future operating results and distribution projections; the ability of Oaktree Fund Advisors, LLC (“Oaktree”) to reposition our portfolio and to implement Oaktree’s future plans with respect to our business; the ability of Oaktree and its affiliates to attract and retain highly talented professionals; our business prospects and the prospects of our portfolio companies; the impact of the investments that we expect to make; the ability of our portfolio companies to achieve their objectives; our expected financings and investments and additional leverage we may seek to incur in the future; the adequacy of our cash resources and working capital; the timing of cash flows, if any, from the operations of our portfolio companies; and the cost or potential outcome of any litigation to which we may be a party. In addition, words such as “anticipate,” “believe,” “expect,” “seek,” “plan,” “should,” “estimate,” “project” and “intend” indicate forward-looking statements, although not all forward-looking statements include these words. The forward-looking statements contained in this presentation involve risks and uncertainties. Our actual results could differ materially from those implied or expressed in the forward-looking statements for any reason, including the factors set forth in “Risk Factors” and elsewhere in our annual report on Form 10-K for the fiscal year ended September 30, 2019 and our quarterly report on Form 10-Q for the quarter ended June 30, 2020. Other factors that could cause actual results to differ materially include: changes or potential disruptions in our operations, the economy, financial markets or political environment; risks associated with possible disruption in our operations or the economy generally due to terrorism, natural disasters or the COVID-19 pandemic; future changes in laws or regulations (including the interpretation of these laws and regulations by regulatory authorities) and conditions in our operating areas, particularly with respect to business development companies or regulated investment companies; general considerations associated with the COVID-19 pandemic; and other considerations that may be disclosed from time to time in our publicly disseminated documents and filings. We have based the forward-looking statements included in this presentation on information available to us on the date of this presentation, and we assume no obligation to update any such forward-looking statements. Although we undertake no obligation to revise or update any forward-looking statements, whether as a result of new information, future events or otherwise, you are advised to consult any additional disclosures that we may make directly to you or through reports that we in the future may file with the SEC, including annual reports on Form 10-K, quarterly reports on Form 10-Q and current reports on Form 8-K. Unless otherwise indicated, data provided herein are dated as of June 30, 2020.
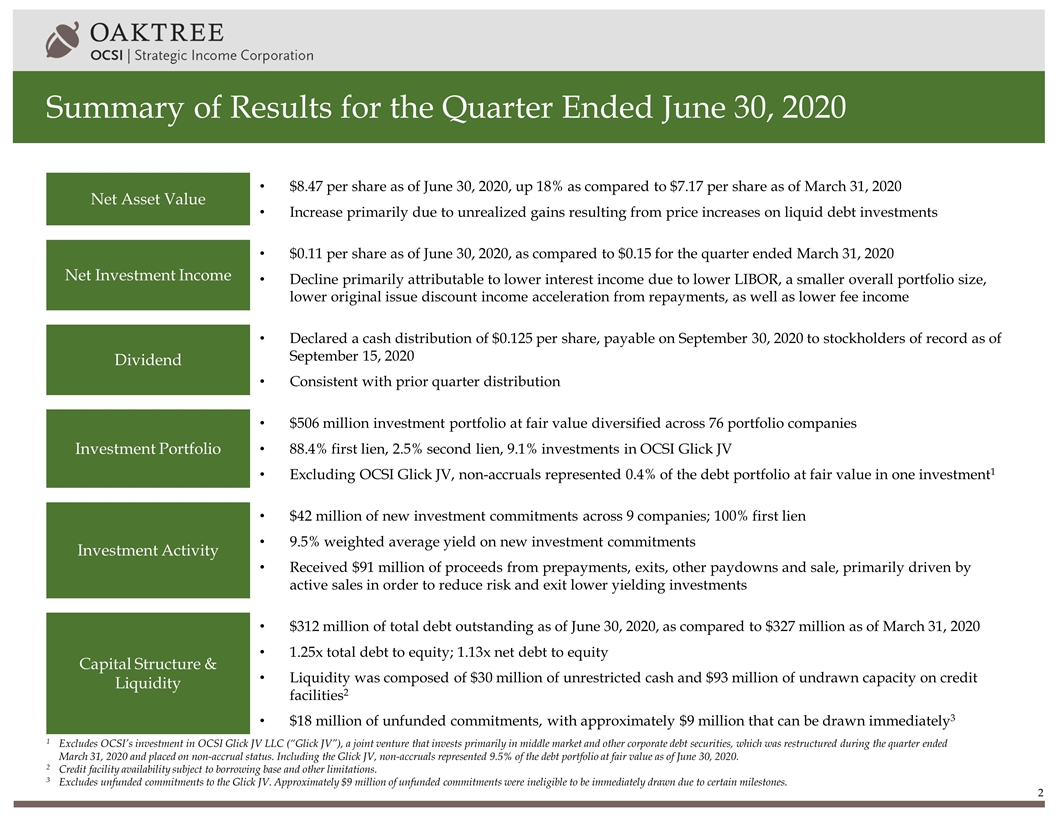
Summary of Results for the Quarter Ended June 30, 2020 Net Asset Value $8.47 per share as of June 30, 2020, up 18% as compared to $7.17 per share as of March 31, 2020 Increase primarily due to unrealized gains resulting from price increases on liquid debt investments Net Investment Income $0.11 per share as of June 30, 2020, as compared to $0.15 for the quarter ended March 31, 2020 Decline primarily attributable to lower interest income due to lower LIBOR, a smaller overall portfolio size, lower original issue discount income acceleration from repayments, as well as lower fee income Dividend Declared a cash distribution of $0.125 per share, payable on September 30, 2020 to stockholders of record as of September 15, 2020 Consistent with prior quarter distribution Investment Portfolio $506 million investment portfolio at fair value diversified across 76 portfolio companies 88.4% first lien, 2.5% second lien, 9.1% investments in OCSI Glick JV Excluding OCSI Glick JV, non-accruals represented 0.4% of the debt portfolio at fair value in one investment1 Investment Activity $42 million of new investment commitments across 9 companies; 100% first lien 9.5% weighted average yield on new investment commitments Received $91 million of proceeds from prepayments, exits, other paydowns and sale, primarily driven by active sales in order to reduce risk and exit lower yielding investments Capital Structure & Liquidity $312 million of total debt outstanding as of June 30, 2020, as compared to $327 million as of March 31, 2020 1.25x total debt to equity; 1.13x net debt to equity Liquidity was composed of $30 million of unrestricted cash and $93 million of undrawn capacity on credit facilities2 $18 million of unfunded commitments, with approximately $9 million that can be drawn immediately3 1Excludes OCSI’s investment in OCSI Glick JV LLC (“Glick JV”), a joint venture that invests primarily in middle market and other corporate debt securities, which was restructured during the quarter ended March 31, 2020 and placed on non-accrual status. Including the Glick JV, non-accruals represented 9.5% of the debt portfolio at fair value as of June 30, 2020. 2Credit facility availability subject to borrowing base and other limitations. 3Excludes unfunded commitments to the Glick JV. Approximately $9 million of unfunded commitments were ineligible to be immediately drawn due to certain milestones.
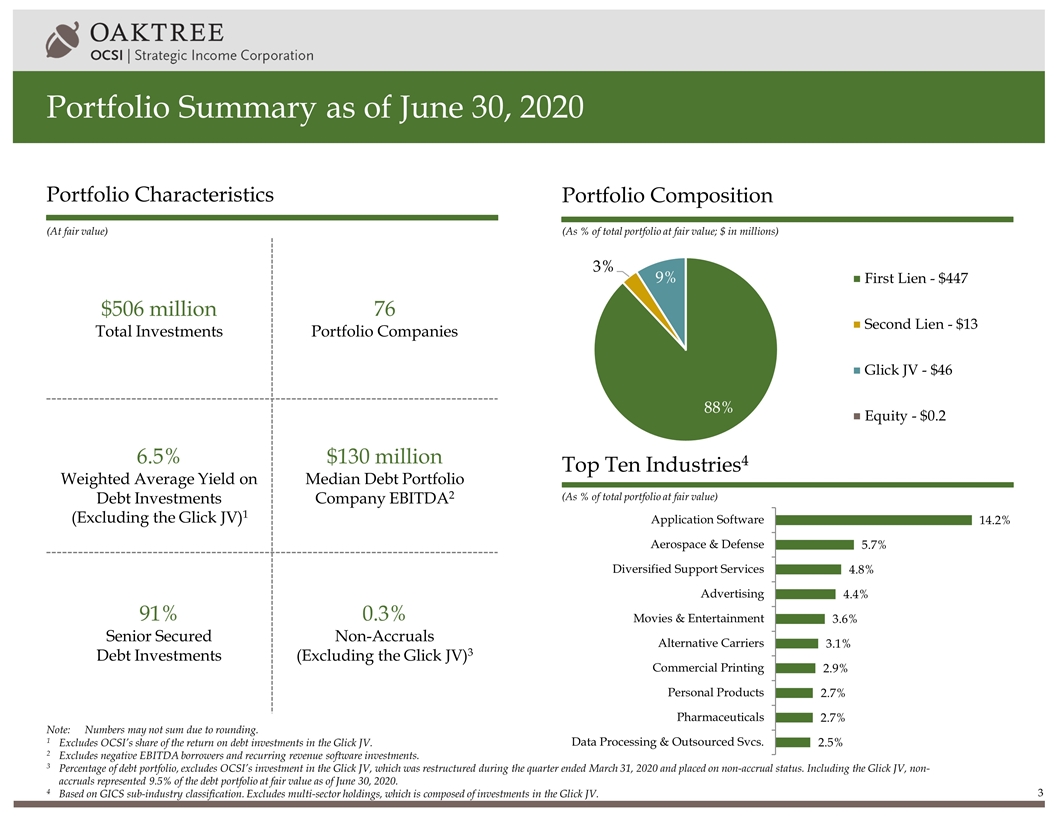
Portfolio Summary as of June 30, 2020 (As % of total portfolio at fair value; $ in millions) (As % of total portfolio at fair value) Portfolio Composition Top Ten Industries4 Portfolio Characteristics Note:Numbers may not sum due to rounding. 1Excludes OCSI’s share of the return on debt investments in the Glick JV. 2 Excludes negative EBITDA borrowers and recurring revenue software investments. 3Percentage of debt portfolio, excludes OCSI’s investment in the Glick JV, which was restructured during the quarter ended March 31, 2020 and placed on non-accrual status. Including the Glick JV, non-accruals represented 9.5% of the debt portfolio at fair value as of June 30, 2020. 4 Based on GICS sub-industry classification. Excludes multi-sector holdings, which is composed of investments in the Glick JV. $506 million Total Investments 76 Portfolio Companies 6.5% Weighted Average Yield on Debt Investments $130 million Median Debt Portfolio Company EBITDA2 91% Senior Secured Debt Investments 0.3% Non-Accruals (Excluding the Glick JV)3 (At fair value) (Excluding the Glick JV)1
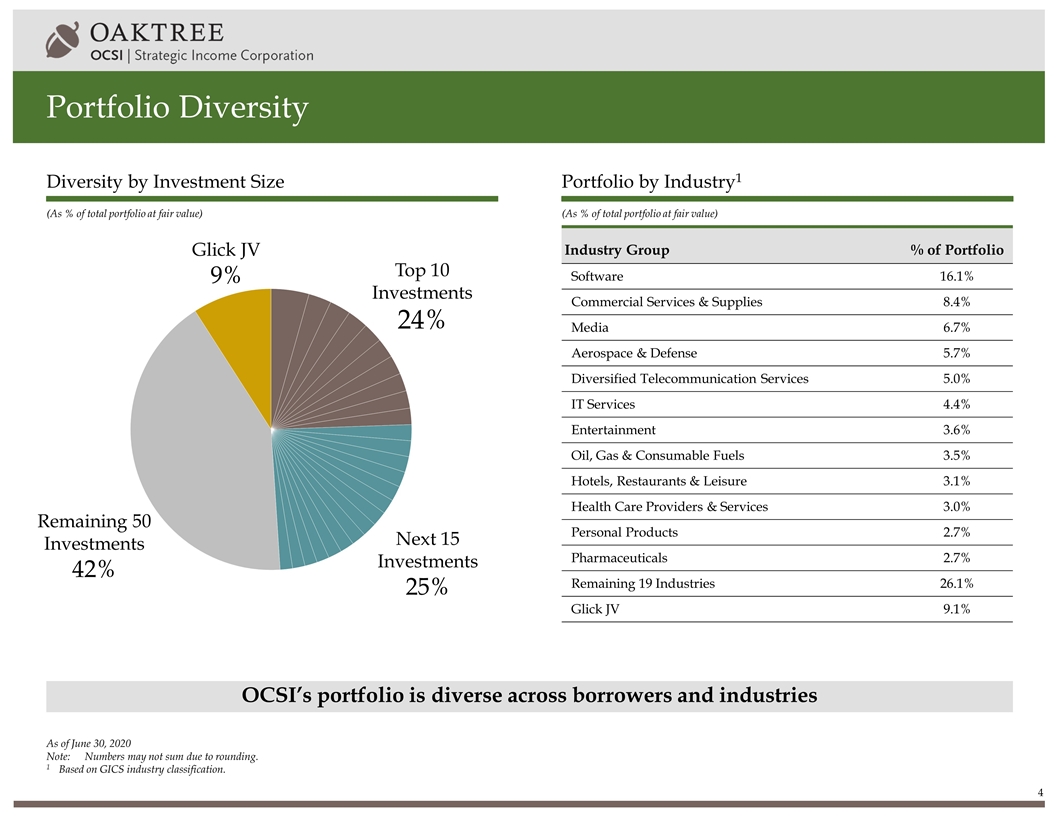
Portfolio Diversity OCSI’s portfolio is diverse across borrowers and industries (As % of total portfolio at fair value) (As % of total portfolio at fair value) Portfolio by Industry1 Diversity by Investment Size Top 10 Investments 24% Next 15 Investments 25% Remaining 50 Investments 42% Glick JV 9% Industry Group % of Portfolio Software 16.1% Commercial Services & Supplies 8.4% Media 6.7% Aerospace & Defense 5.7% Diversified Telecommunication Services 5.0% IT Services 4.4% Entertainment 3.6% Oil, Gas & Consumable Fuels 3.5% Hotels, Restaurants & Leisure 3.1% Health Care Providers & Services 3.0% Personal Products 2.7% Pharmaceuticals 2.7% Remaining 19 Industries 26.1% Glick JV 9.1% As of June 30, 2020 Note:Numbers may not sum due to rounding. 1Based on GICS industry classification.
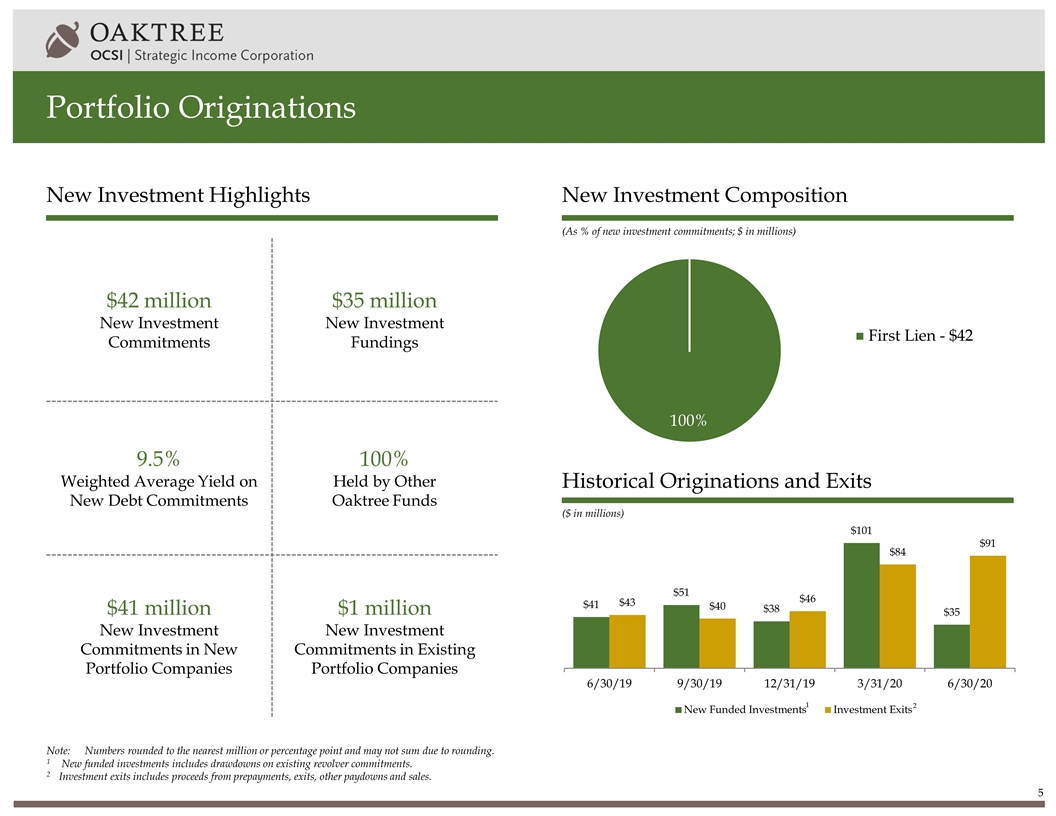
Portfolio Originations New Investment Highlights ($ in millions) Historical Originations and Exits (As % of new investment commitments; $ in millions) New Investment Composition Note:Numbers rounded to the nearest million or percentage point and may not sum due to rounding. 1 New funded investments includes drawdowns on existing revolver commitments. 2Investment exits includes proceeds from prepayments, exits, other paydowns and sales. 2 1 $42 million New Investment Commitments $35 million New Investment Fundings 9.5% Weighted Average Yield on New Debt Commitments 100% Held by Other Oaktree Funds $41 million New Investment Commitments in New Portfolio Companies $1 million New Investment Commitments in Existing Portfolio Companies
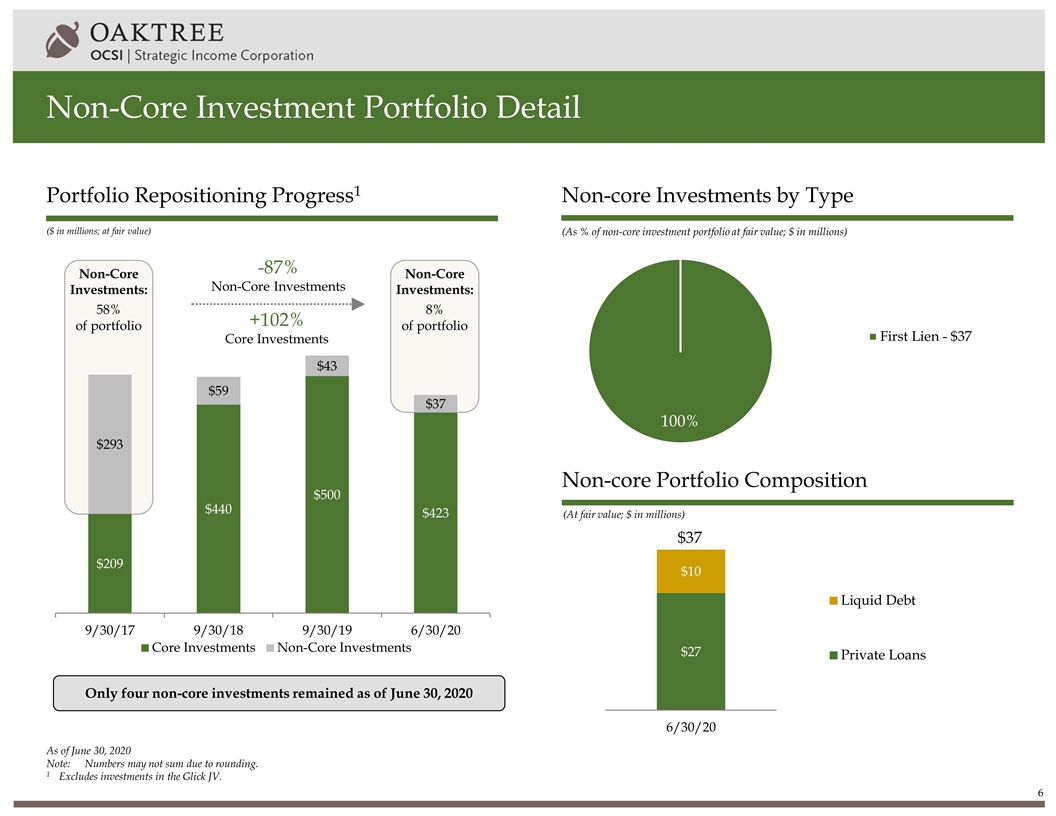
As of June 30, 2020 Note:Numbers may not sum due to rounding. 1Excludes investments in the Glick JV. Non-Core Investment Portfolio Detail Portfolio Repositioning Progress1 (As % of non-core investment portfolio at fair value; $ in millions) Non-core Investments by Type (At fair value; $ in millions) Non-core Portfolio Composition $37 Non-Core Investments: 8% of portfolio Non-Core Investments: 58% of portfolio -87% Non-Core Investments +102% Core Investments ($ in millions; at fair value) Only four non-core investments remained as of June 30, 2020
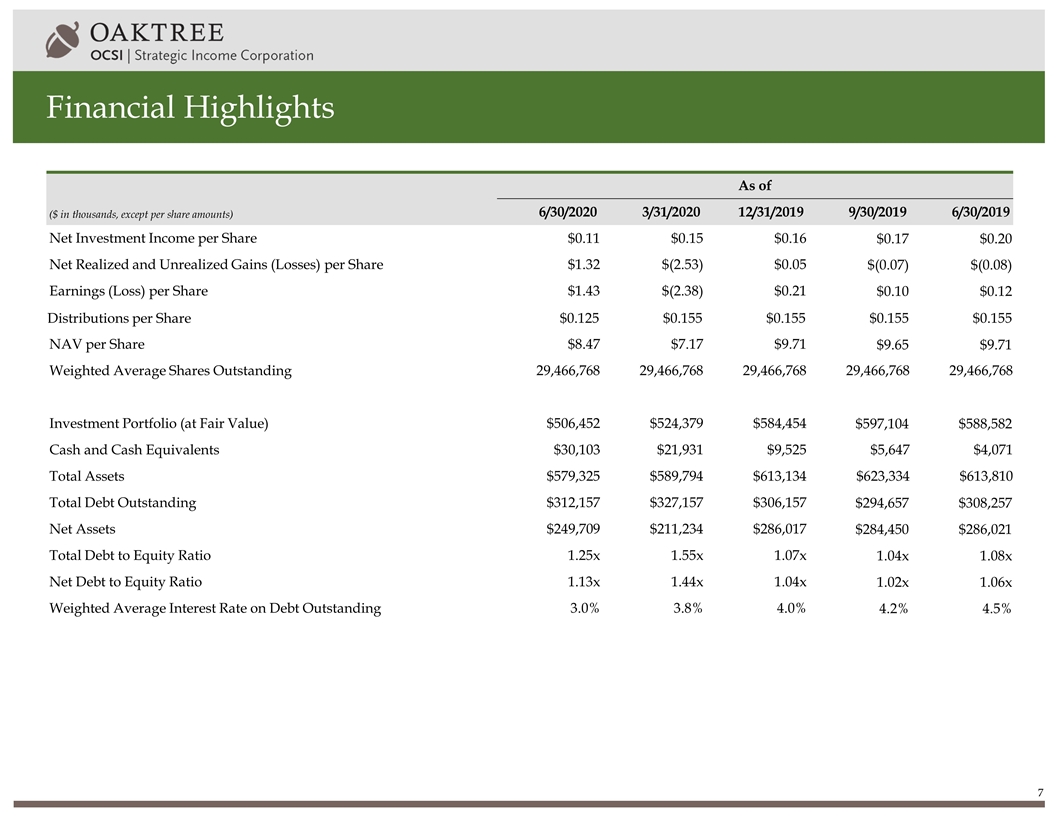
Financial Highlights ($ in thousands, except per share amounts) As of 6/30/2020 3/31/2020 12/31/2019 9/30/2019 6/30/2019 Net Investment Income per Share $0.11 $0.15 $0.16 $0.17 $0.20 Net Realized and Unrealized Gains (Losses) per Share $1.32 $(2.53) $0.05 $(0.07) $(0.08) Earnings (Loss) per Share $1.43 $(2.38) $0.21 $0.10 $0.12 Distributions per Share $0.125 $0.155 $0.155 $0.155 $0.155 NAV per Share $8.47 $7.17 $9.71 $9.65 $9.71 Weighted Average Shares Outstanding 29,466,768 29,466,768 29,466,768 29,466,768 29,466,768 Investment Portfolio (at Fair Value) $506,452 $524,379 $584,454 $597,104 $588,582 Cash and Cash Equivalents $30,103 $21,931 $9,525 $5,647 $4,071 Total Assets $579,325 $589,794 $613,134 $623,334 $613,810 Total Debt Outstanding $312,157 $327,157 $306,157 $294,657 $308,257 Net Assets $249,709 $211,234 $286,017 $284,450 $286,021 Total Debt to Equity Ratio 1.25x 1.55x 1.07x 1.04x 1.08x Net Debt to Equity Ratio 1.13x 1.44x 1.04x 1.02x 1.06x Weighted Average Interest Rate on Debt Outstanding 3.0% 3.8% 4.0% 4.2% 4.5%
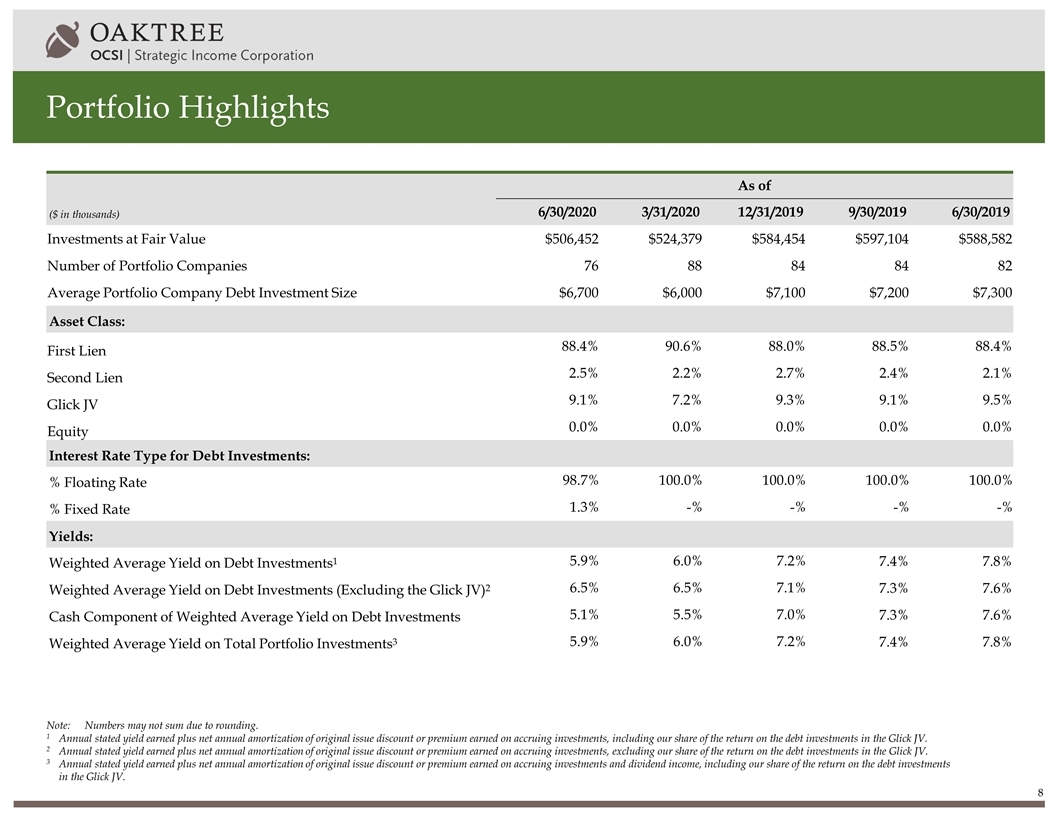
Portfolio Highlights ($ in thousands) As of 6/30/2020 3/31/2020 12/31/2019 9/30/2019 6/30/2019 Investments at Fair Value $506,452 $524,379 $584,454 $597,104 $588,582 Number of Portfolio Companies 76 88 84 84 82 Average Portfolio Company Debt Investment Size $6,700 $6,000 $7,100 $7,200 $7,300 Asset Class: First Lien 88.4% 90.6% 88.0% 88.5% 88.4% Second Lien 2.5% 2.2% 2.7% 2.4% 2.1% Glick JV 9.1% 7.2% 9.3% 9.1% 9.5% Equity 0.0% 0.0% 0.0% 0.0% 0.0% Interest Rate Type for Debt Investments: % Floating Rate 98.7% 100.0% 100.0% 100.0% 100.0% % Fixed Rate 1.3% -% -% -% -% Yields: Weighted Average Yield on Debt Investments1 5.9% 6.0% 7.2% 7.4% 7.8% Weighted Average Yield on Debt Investments (Excluding the Glick JV)2 6.5% 6.5% 7.1% 7.3% 7.6% Cash Component of Weighted Average Yield on Debt Investments 5.1% 5.5% 7.0% 7.3% 7.6% Weighted Average Yield on Total Portfolio Investments3 5.9% 6.0% 7.2% 7.4% 7.8% Note:Numbers may not sum due to rounding. 1Annual stated yield earned plus net annual amortization of original issue discount or premium earned on accruing investments, including our share of the return on the debt investments in the Glick JV. 2Annual stated yield earned plus net annual amortization of original issue discount or premium earned on accruing investments, excluding our share of the return on the debt investments in the Glick JV. 3Annual stated yield earned plus net annual amortization of original issue discount or premium earned on accruing investments and dividend income, including our share of the return on the debt investments in the Glick JV.
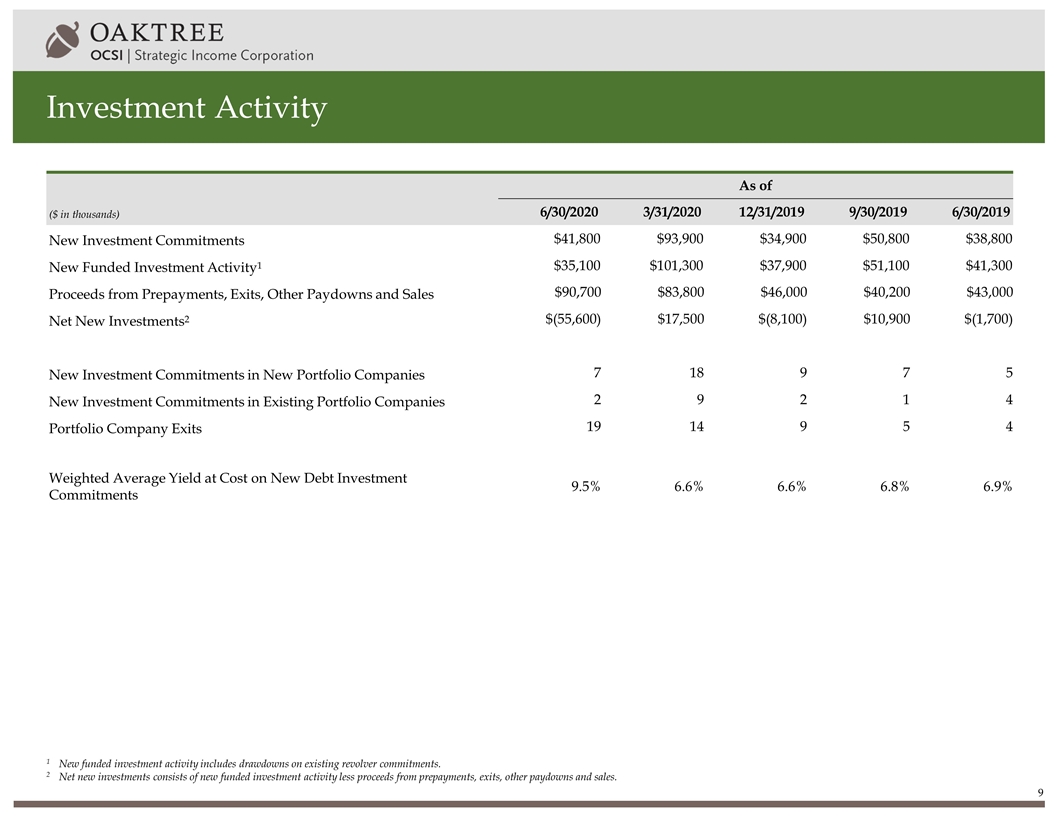
Investment Activity ($ in thousands) As of 6/30/2020 3/31/2020 12/31/2019 9/30/2019 6/30/2019 New Investment Commitments $41,800 $93,900 $34,900 $50,800 $38,800 New Funded Investment Activity1 $35,100 $101,300 $37,900 $51,100 $41,300 Proceeds from Prepayments, Exits, Other Paydowns and Sales $90,700 $83,800 $46,000 $40,200 $43,000 Net New Investments2 $(55,600) $17,500 $(8,100) $10,900 $(1,700) New Investment Commitments in New Portfolio Companies 7 18 9 7 5 New Investment Commitments in Existing Portfolio Companies 2 9 2 1 4 Portfolio Company Exits 19 14 9 5 4 Weighted Average Yield at Cost on New Debt Investment Commitments 9.5% 6.6% 6.6% 6.8% 6.9% 1New funded investment activity includes drawdowns on existing revolver commitments. 2Net new investments consists of new funded investment activity less proceeds from prepayments, exits, other paydowns and sales.
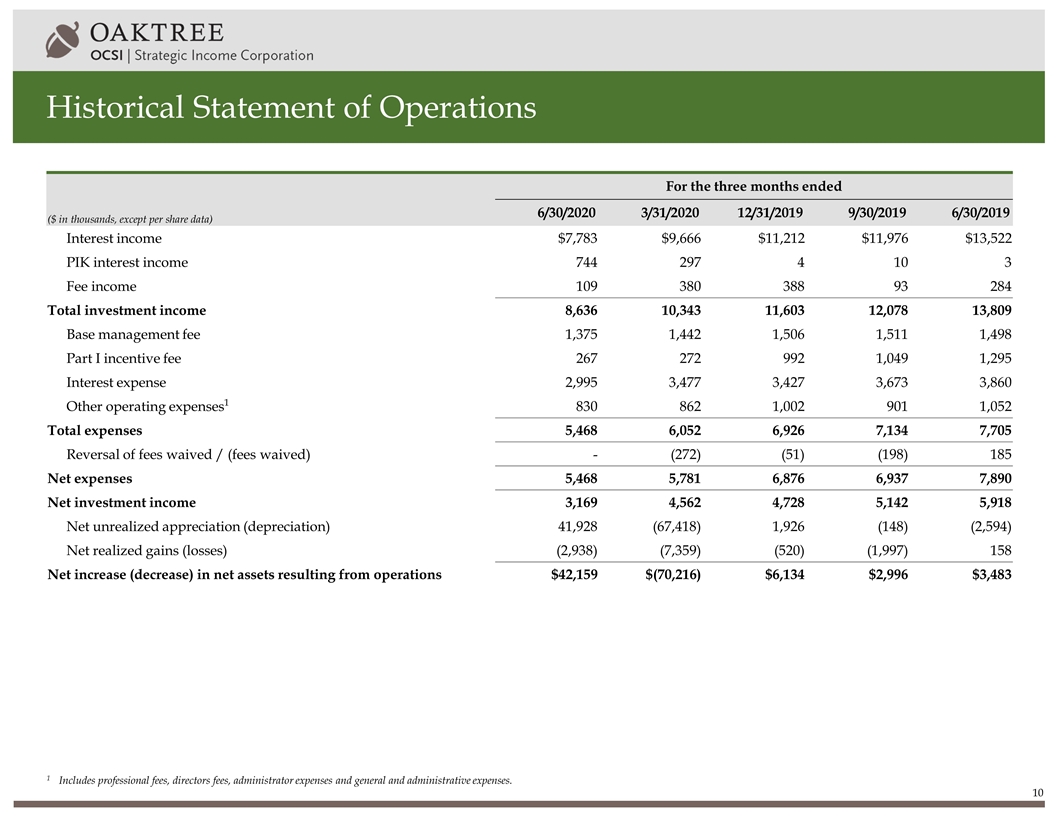
Historical Statement of Operations ($ in thousands, except per share data) For the three months ended 6/30/2020 3/31/2020 12/31/2019 9/30/2019 6/30/2019 Interest income $7,783 $9,666 $11,212 $11,976 $13,522 PIK interest income 744 297 4 10 3 Fee income 109 380 388 93 284 Total investment income 8,636 10,343 11,603 12,078 13,809 Base management fee 1,375 1,442 1,506 1,511 1,498 Part I incentive fee 267 272 992 1,049 1,295 Interest expense 2,995 3,477 3,427 3,673 3,860 Other operating expenses1 830 862 1,002 901 1,052 Total expenses 5,468 6,052 6,926 7,134 7,705 Reversal of fees waived / (fees waived) - (272) (51) (198) 185 Net expenses 5,468 5,781 6,876 6,937 7,890 Net investment income 3,169 4,562 4,728 5,142 5,918 Net unrealized appreciation (depreciation) 41,928 (67,418) 1,926 (148) (2,594) Net realized gains (losses) (2,938) (7,359) (520) (1,997) 158 Net increase (decrease) in net assets resulting from operations $42,159 $(70,216) $6,134 $2,996 $3,483 1Includes professional fees, directors fees, administrator expenses and general and administrative expenses.
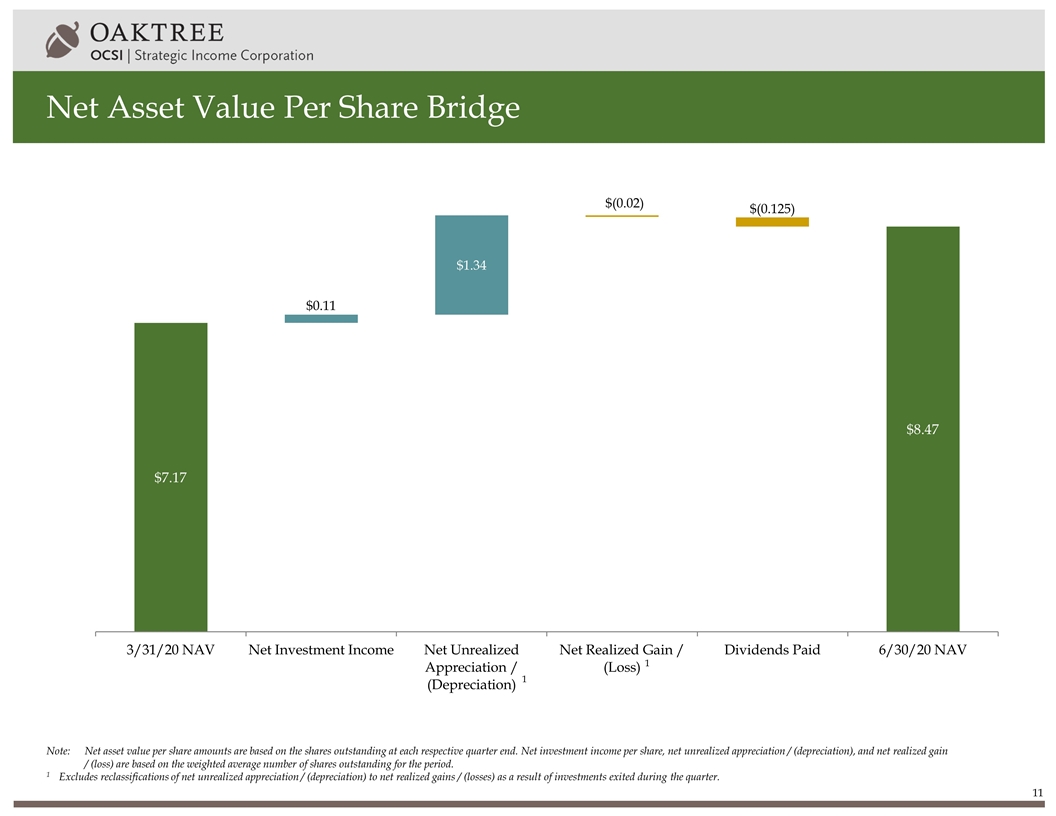
Net Asset Value Per Share Bridge Note:Net asset value per share amounts are based on the shares outstanding at each respective quarter end. Net investment income per share, net unrealized appreciation / (depreciation), and net realized gain / (loss) are based on the weighted average number of shares outstanding for the period. 1Excludes reclassifications of net unrealized appreciation / (depreciation) to net realized gains / (losses) as a result of investments exited during the quarter. 1 1
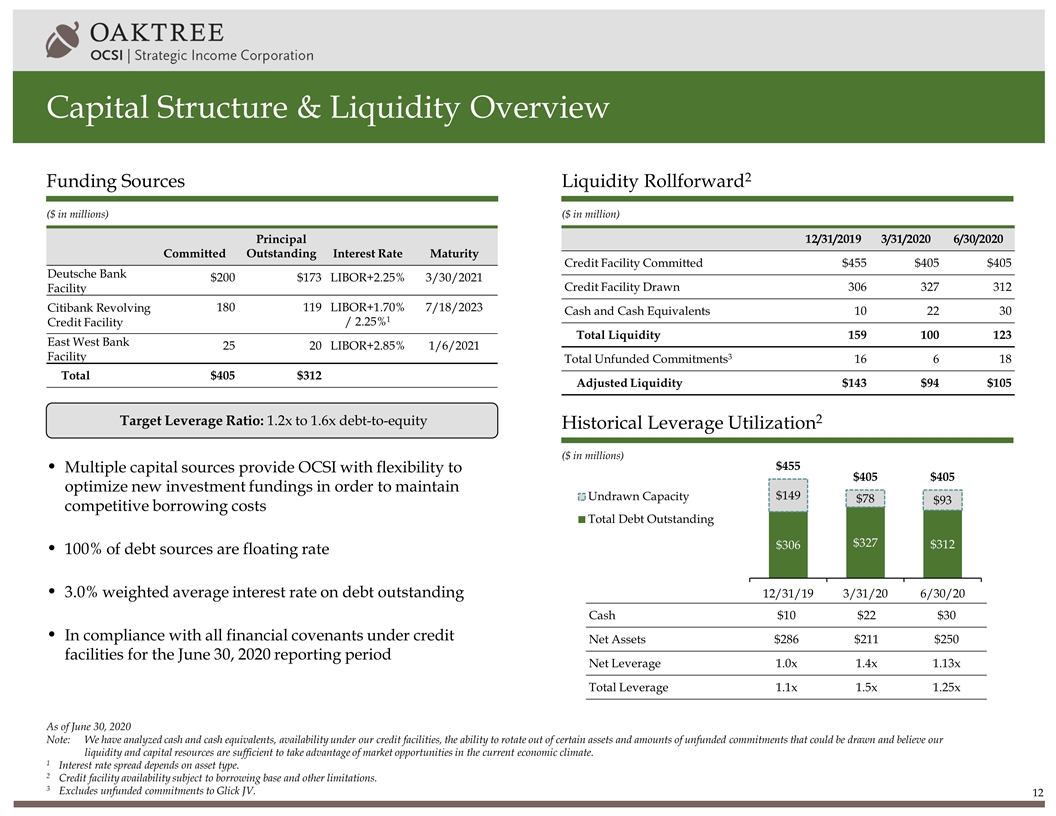
Capital Structure & Liquidity Overview ($ in millions) ($ in million) ($ in millions) Funding Sources Liquidity Rollforward2 Historical Leverage Utilization2 Committed Principal Outstanding Interest Rate Maturity Deutsche Bank Facility $200 $173 LIBOR+2.25% 3/30/2021 Citibank Revolving Credit Facility 180 119 LIBOR+1.70% / 2.25%1 7/18/2023 East West Bank Facility 25 20 LIBOR+2.85% 1/6/2021 Total $405 $312 As of June 30, 2020 Note:We have analyzed cash and cash equivalents, availability under our credit facilities, the ability to rotate out of certain assets and amounts of unfunded commitments that could be drawn and believe our liquidity and capital resources are sufficient to take advantage of market opportunities in the current economic climate. 1Interest rate spread depends on asset type. 2Credit facility availability subject to borrowing base and other limitations. 3 Excludes unfunded commitments to Glick JV. Target Leverage Ratio: 1.2x to 1.6x debt-to-equity Multiple capital sources provide OCSI with flexibility to optimize new investment fundings in order to maintain competitive borrowing costs 100% of debt sources are floating rate 3.0% weighted average interest rate on debt outstanding In compliance with all financial covenants under credit facilities for the June 30, 2020 reporting period 12/31/2019 3/31/2020 6/30/2020 Credit Facility Committed $455 $405 $405 Credit Facility Drawn 306 327 312 Cash and Cash Equivalents 10 22 30 Total Liquidity 159 100 123 Total Unfunded Commitments3 16 6 18 Adjusted Liquidity $143 $94 $105 Cash $10 $22 $30 Net Assets $286 $211 $250 Net Leverage 1.0x 1.4x 1.13x Total Leverage 1.1x 1.5x 1.25x
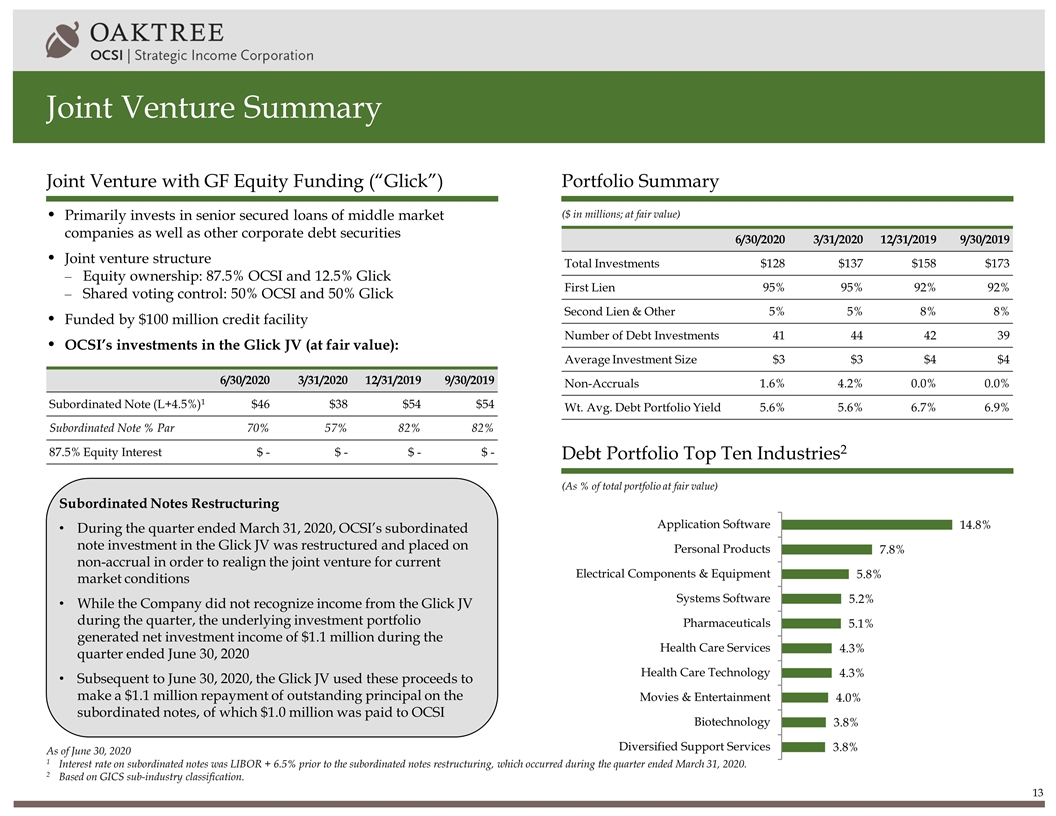
Joint Venture Summary ($ in millions; at fair value) (As % of total portfolio at fair value) Joint Venture with GF Equity Funding (“Glick”) Portfolio Summary Debt Portfolio Top Ten Industries2 As of June 30, 2020 1Interest rate on subordinated notes was LIBOR + 6.5% prior to the subordinated notes restructuring, which occurred during the quarter ended March 31, 2020. 2Based on GICS sub-industry classification. Primarily invests in senior secured loans of middle market companies as well as other corporate debt securities Joint venture structure Equity ownership: 87.5% OCSI and 12.5% Glick Shared voting control: 50% OCSI and 50% Glick Funded by $100 million credit facility OCSI’s investments in the Glick JV (at fair value): 6/30/2020 3/31/2020 12/31/2019 9/30/2019 Total Investments $128 $137 $158 $173 First Lien 95% 95% 92% 92% Second Lien & Other 5% 5% 8% 8% Number of Debt Investments 41 44 42 39 Average Investment Size $3 $3 $4 $4 Non-Accruals 1.6% 4.2% 0.0% 0.0% Wt. Avg. Debt Portfolio Yield 5.6% 5.6% 6.7% 6.9% Subordinated Notes Restructuring During the quarter ended March 31, 2020, OCSI’s subordinated note investment in the Glick JV was restructured and placed on non-accrual in order to realign the joint venture for current market conditions While the Company did not recognize income from the Glick JV during the quarter, the underlying investment portfolio generated net investment income of $1.1 million during the quarter ended June 30, 2020 Subsequent to June 30, 2020, the Glick JV used these proceeds to make a $1.1 million repayment of outstanding principal on the subordinated notes, of which $1.0 million was paid to OCSI 6/30/2020 3/31/2020 12/31/2019 9/30/2019 Subordinated Note (L+4.5%)1 $46 $38 $54 $54 Subordinated Note % Par 70% 57% 82% 82% 87.5% Equity Interest $ - $ - $ - $ -

Contact: Michael Mosticchio, Investor Relations ocsi-ir@oaktreecapital.com
