Attached files
| file | filename |
|---|---|
| EX-99.1 - EX-99.1 - INSIGHT ENTERPRISES INC | nsit-ex991_6.htm |
| 8-K - 8-K SECOND QUARTER OF FY 2020 - INSIGHT ENTERPRISES INC | nsit-8k_20200806.htm |

Insight Enterprises, Inc. Second Quarter 2020 Earnings Conference Call and Webcast Exhibit 99.2
Agenda Opening Comments CEO Commentary Q2 2020 Priorities Second Quarter 2020 Financial Results PCM Integration Update Impact of COVID-19 on Client Engagement Current Demand Environment CFO Commentary Recent Cost Reductions Liquidity and Debt Covenants Financial Results by Region Taxes and Cash Flow Closing Comments
Disclosures Safe harbor statement This presentation includes “forward-looking statements” within the meaning of the Private Securities Litigation Reform Act of 1995 related to Insight’s plans and expectations. Statements that are not historical facts, including those related to Coronavirus strain (“COVID-19”), our future responses to and the impact of COVID-19 on our Company, our expectations about future benefits relating to the PCM integration, including future expected trends in the IT market and our opportunities for growth, are forward-looking statements. These forward-looking statements are subject to assumptions, risks and uncertainties which could cause actual results or future events to differ materially from such statements. The Company undertakes no obligation to update publicly or revise any of the forward-looking statements, except as otherwise required by law. More detailed information about risk factors is included in today’s press release and discussed in the Company’s most recently filed periodic reports and subsequent filings with the Securities and Exchange Commission. Non-GAAP measures This presentation will reference certain non-GAAP financial information as ‘Adjusted’. A reconciliation of non-GAAP financial measures presented in this document to our actual GAAP results is attached to the back of this presentation and included in the press release issued today, which you may find on the Investor Relations section of our website at investor.insight.com. Constant currency In some instances the Company refers to changes in net sales, gross profit and earnings from operations on a consolidated basis and in North America, EMEA and APAC excluding the effects of fluctuating foreign currency exchange rates. In computing these changes and percentages, the Company compares the current year amount as translated into U.S. dollars under the applicable accounting standards to the prior year amount in local currency translated into U.S. dollars utilizing the weighted average translation rate for the current period.
Q2 2020 Priorities Ensure safe work environment, ability to serve client Reduce discretionary operating costs Focus on cash flow generation Optimize financial results
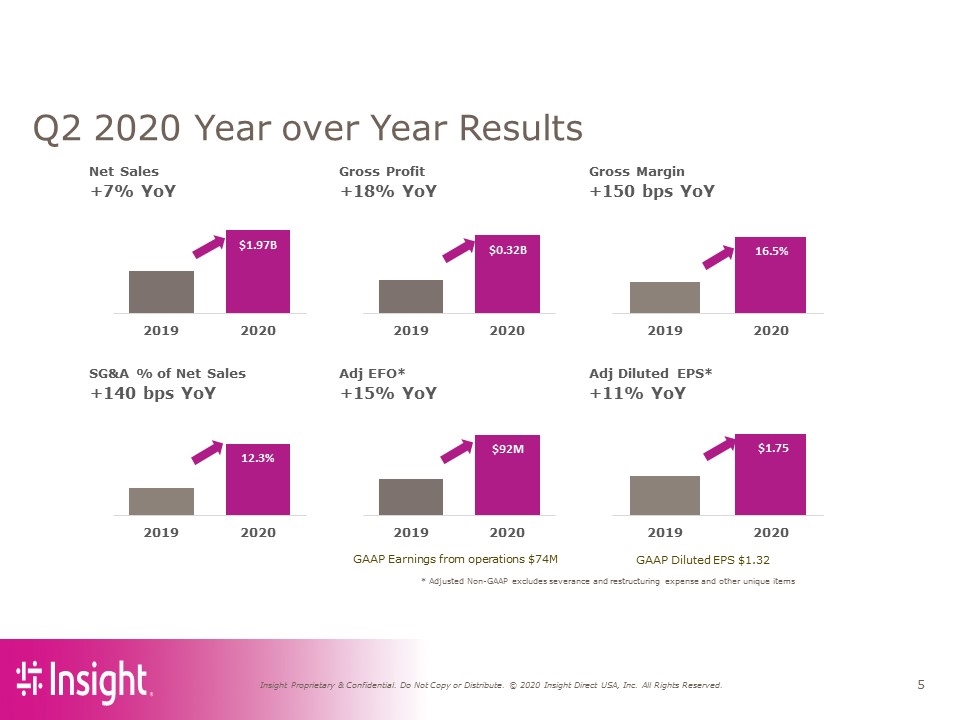
Q2 2020 Year over Year Results GAAP Earnings from operations $74M GAAP Diluted EPS $1.32 * Adjusted Non-GAAP excludes severance and restructuring expense and other unique items Net Sales Gross Profit Gross Margin +7% YoY +18% YoY +150 bps YoY SG&A % of Net Sales Adj EFO* Adj Diluted EPS* +140 bps YoY +15% YoY +11% YoY $1.97B 2019 2020 $0.32B 2019 2020 $92M 2019 2020 12.3% 2019 2020 16.5% 2019 2020 $1.75 2019 2020
PCM Integration Update Nearing completion of onboarding all PCM clients to SAP platform Well positioned to compete as single brand in marketplace Complete data migration by end of 2020 Expect ~$50-$55 million in annualized run-rate cost saving by year end
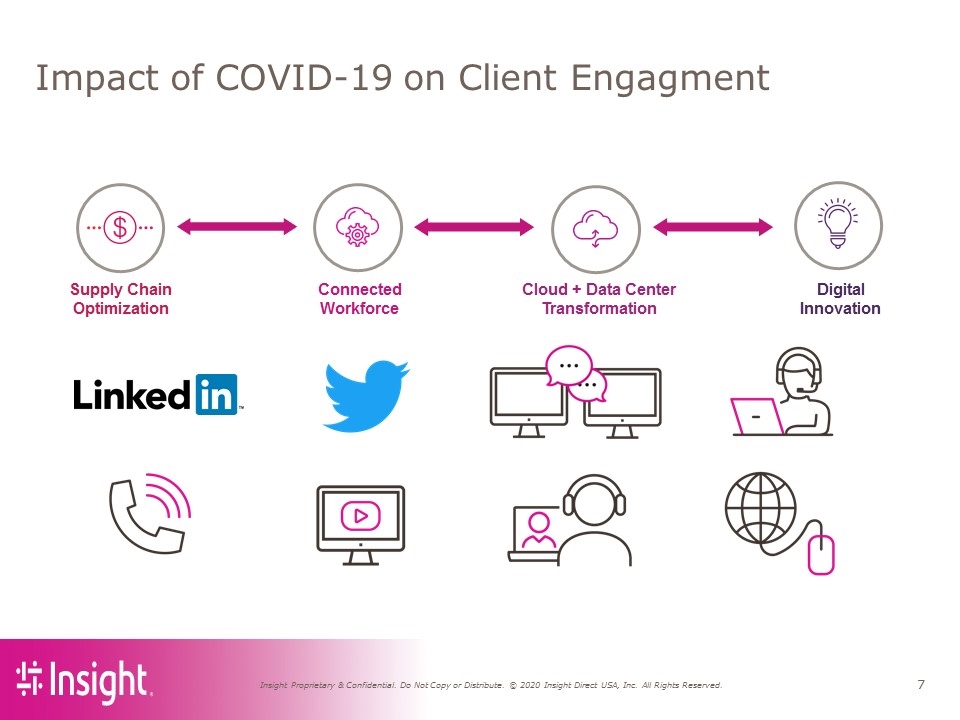
Impact of COVID-19 on Client Engagment Cloud + Data Center Transformation Digital Innovation Supply Chain Optimization Connected Workforce
Current Demand Environment Most markets remain in work from home mode Hardware bookings in North America down> 10% year over year in July Currently expect consolidated net sales to be up in the third quarter year over year due to the addition of PCM for additional two months this year On a consolidated basis, currently expect gross margins in the business to be between 14.7% and 14.9%, up year over year due to the addition of PCM and a higher mix of cloud and services sales Currently expect SG&A as a percent of sales will approximate levels reported in the second quarter
CFO Commentary Recent Cost Reductions Liquidity and Debt Covenants Financial Results by Region Taxes and Cash Flow
Recent Cost Reductions Reduced discretionary operating costs driven by: Integration and demand Travel and other discretionary Variable compensation
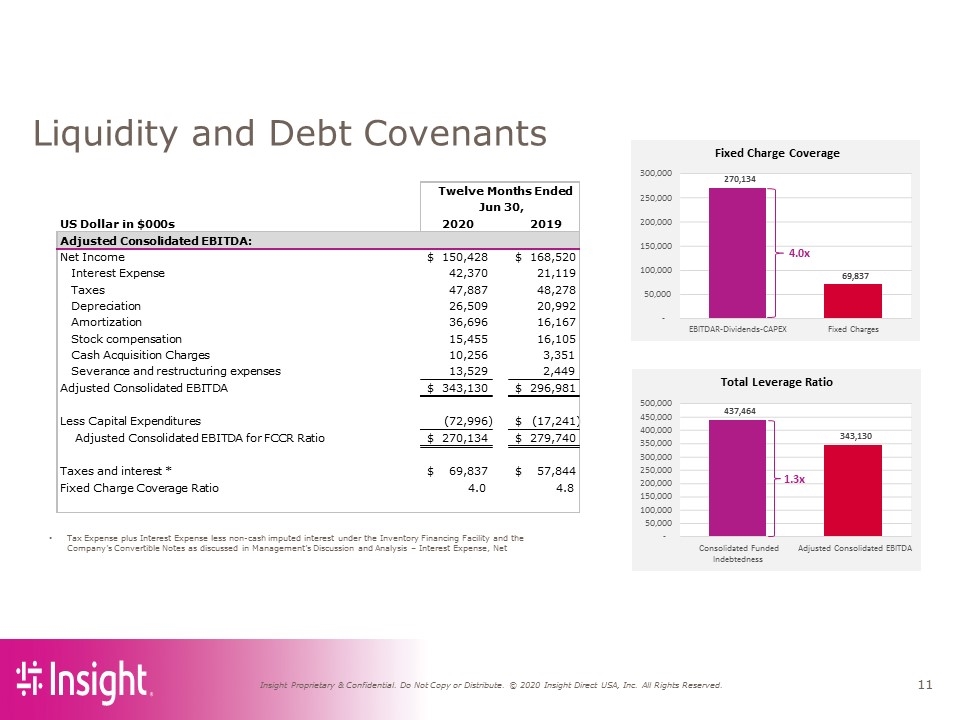
Liquidity and Debt Covenants Tax Expense plus Interest Expense less non-cash imputed interest under the Inventory Financing Facility and the Company’s Convertible Notes as discussed in Management’s Discussion and Analysis – Interest Expense, Net US Dollar in $000s 2020 2019 Adjusted Consolidated EBITDA: Net Income 150,428 $ 168,520 $ Interest Expense 42,370 21,119 Taxes 47,887 48,278 Depreciation 26,509 20,992 Amortization 36,696 16,167 Stock compensation 15,455 16,105 Cash Acquisition Charges 10,256 3,351 Severance and restructuring expenses 13,529 2,449 Adjusted Consolidated EBITDA 343,130 $ 296,981 $ Less Capital Expenditures (72,996) (17,241) $ Adjusted Consolidated EBITDA for FCCR Ratio 270,134 $ 279,740 $ Taxes and interest * 69,837 $ 57,844 $ Fixed Charge Coverage Ratio 4.0 4.8 Twelve Months Ended Jun 30, Fixed Charge Coverage 270,134 69,837 - 50,000 100,000 150,000 200,000 250,000 300,000 EBITDAR-Dividends-CAPEX Fixed Charges 4.0x Total Leverage Ratio 437,464 343,130 - 50,000 100,000 150,000 200,000 250,000 300,000 350,000 400,000 450,000 500,000 Consolidated Funded Indebtedness Adjusted Consolidated EBITDA 1.3x
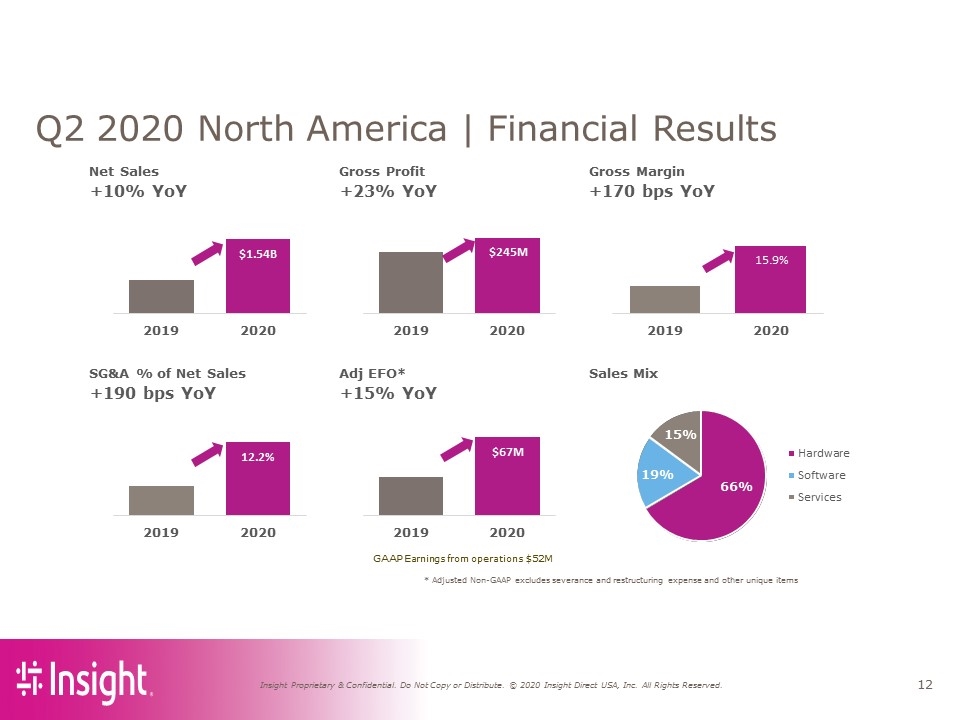
* Adjusted Non-GAAP excludes severance and restructuring expense and other unique items Q2 2020 North America | Financial Results GAAP Earnings from operations $52M Net Sales Gross Profit Gross Margin +10% YoY +23% YoY +170 bps YoY SG&A % of Net Sales Adj EFO* Sales Mix +190 bps YoY +15% YoY 66% 19% 15% Hardware Software Services $1.54B 2019 2020 $245M 2019 2020 15.9% 2019 2020 $67M 2019 2020 12.2% 2019 2020
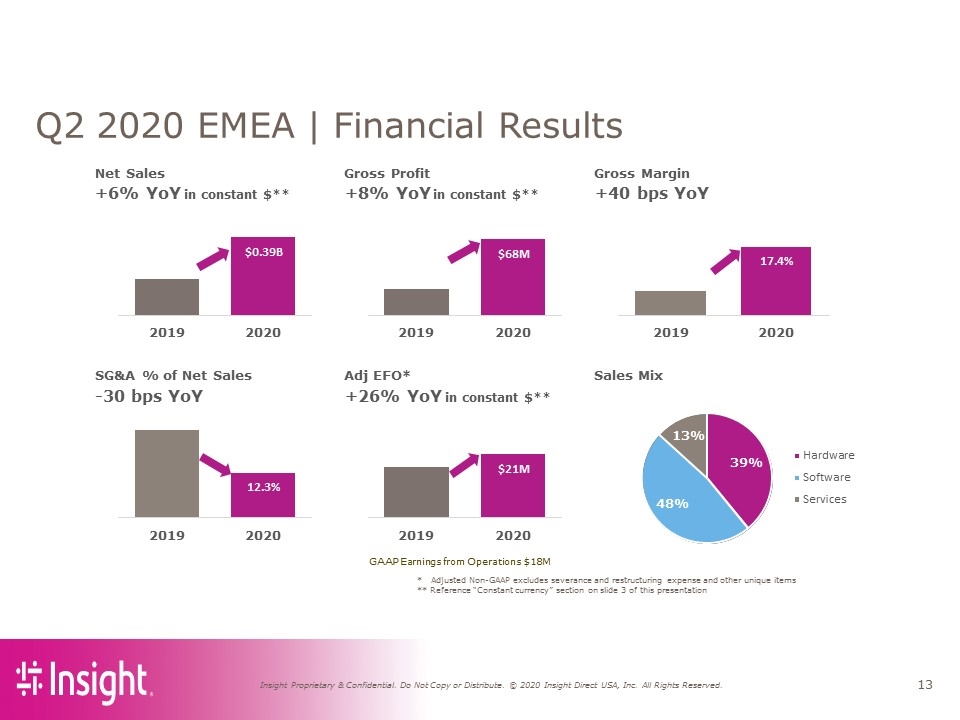
* Adjusted Non-GAAP excludes severance and restructuring expense and other unique items ** Reference “Constant currency” section on slide 3 of this presentation Q2 2020 EMEA | Financial Results in constant $** in constant $** GAAP Earnings from Operations $18M in constant $** Net Sales Gross Profit Gross Margin +6% YoY +8% YoY +40 bps YoY SG&A % of Net Sales Adj EFO* Sales Mix -30 bps YoY +26% YoY 39% 48% 13% Hardware Software Services $0.39B 2019 2020 $68M 2019 2020 17.4% 2019 2020 $21M 2019 2020 12.3% 2019 2020
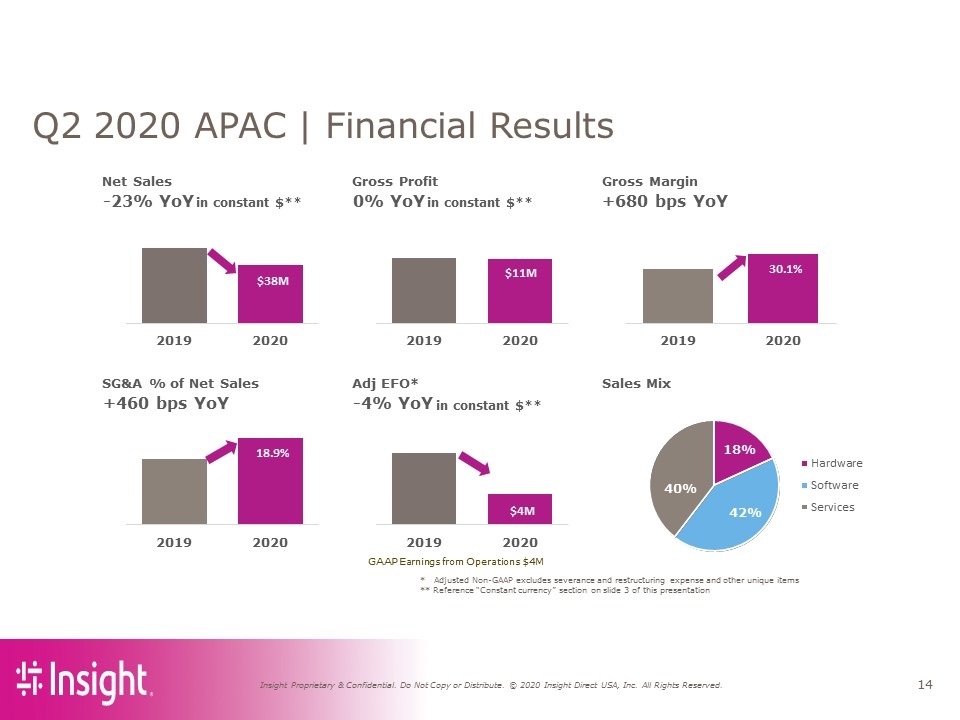
Net Sales Gross Profit Gross Margin -23% YoY 0% YoY +680 bps YoY SG&A % of Net Sales Adj EFO* Sales Mix +460 bps YoY -4% YoY $38M 2019 2020 $11M 2019 2020 30.1% 2019 2020 $4M 2019 2020 18.9% 2019 2020 18% 42% 40% Hardware Software Services * Adjusted Non-GAAP excludes severance and restructuring expense and other unique items ** Reference “Constant currency” section on slide 3 of this presentation Q2 2020 APAC | Financial Results in constant $** in constant $** GAAP Earnings from Operations $4M in constant $**
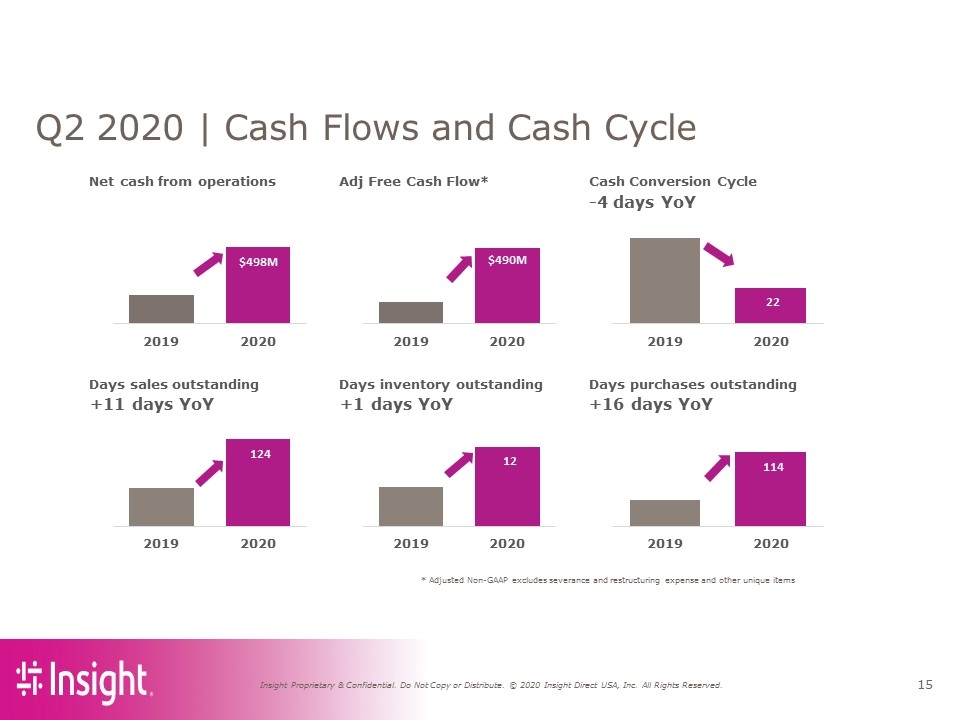
* Adjusted Non-GAAP excludes severance and restructuring expense and other unique items Q2 2020 | Cash Flows and Cash Cycle Net cash from operations Adj Free Cash Flow* Cash Conversion Cycle -4 days YoY Days sales outstanding Days inventory outstanding Days purchases outstanding +11 days YoY +1 days YoY +16 days YoY $498M 2019 2020 $490M 2019 2020 22 2019 2020 124 2019 2020 12 2019 2020 114 2019 2020
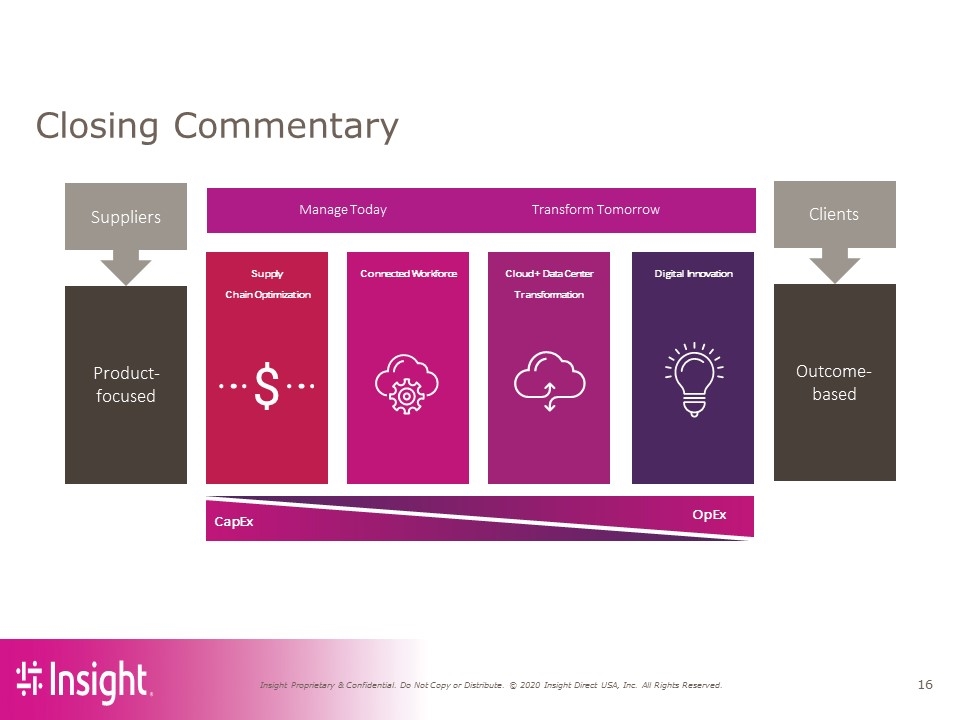
Closing Commentary Product-focused Suppliers Outcome-based Clients Supply Chain Optimization Connected Workforce Cloud + Data Center Transformation Digital Innovation CapEx OpEx Manage Today Transform Tomorrow
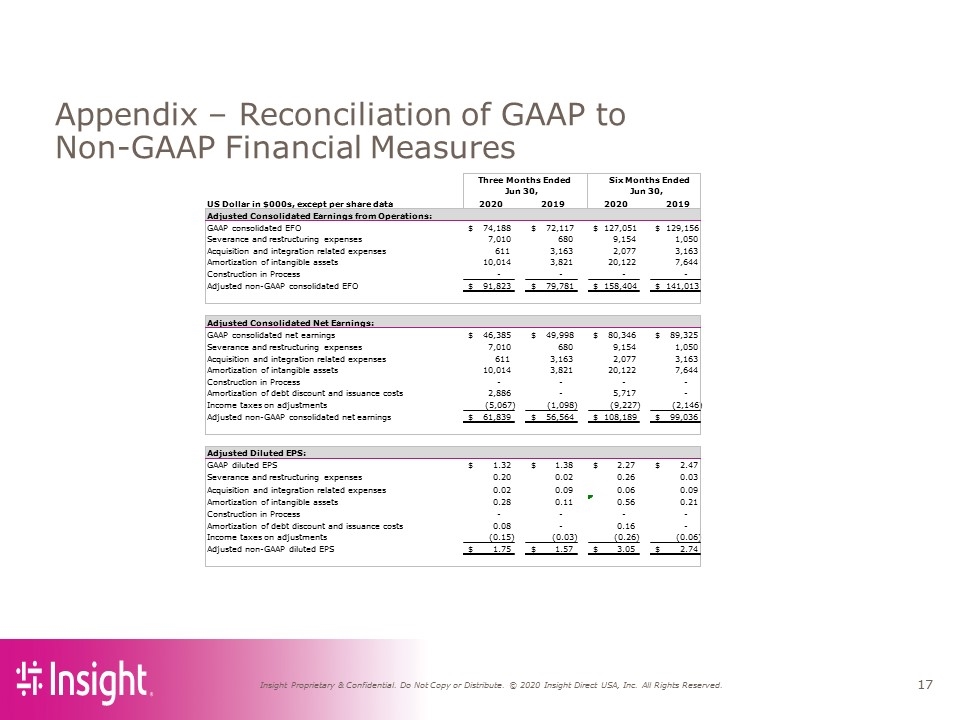
Appendix – Reconciliation of GAAP to Non-GAAP Financial Measures US Dollar in $000s, except per share data 2020 2019 2020 2019 Adjusted Consolidated Earnings from Operations: GAAP consolidated EFO 74,188 $ 72,117 $ 127,051 $ 129,156 $ Severance and restructuring expenses 7,010 680 9,154 1,050 Acquisition and integration related expenses 611 3,163 2,077 3,163 Amortization of intangible assets 10,014 3,821 20,122 7,644 Construction in Process - - - - Adjusted non-GAAP consolidated EFO 91,823 $ 79,781 $ 158,404 $ 141,013 $ Adjusted Consolidated Net Earnings: GAAP consolidated net earnings 46,385 $ 49,998 $ 80,346 $ 89,325 $ Severance and restructuring expenses 7,010 680 9,154 1,050 Acquisition and integration related expenses 611 3,163 2,077 3,163 Amortization of intangible assets 10,014 3,821 20,122 7,644 Construction in Process - - - - Amortization of debt discount and issuance costs 2,886 - 5,717 - Income taxes on adjustments (5,067) (1,098) (9,227) (2,146) Adjusted non-GAAP consolidated net earnings 61,839 $ 56,564 $ 108,189 $ 99,036 $ Adjusted Diluted EPS: GAAP diluted EPS 1.32 $ 1.38 $ 2.27 $ 2.47 $ Severance and restructuring expenses 0.20 0.02 0.26 0.03 Acquisition and integration related expenses 0.02 0.09 0.06 0.09 Amortization of intangible assets 0.28 0.11 0.56 0.21 Construction in Process - - - - Amortization of debt discount and issuance costs 0.08 - 0.16 - Income taxes on adjustments (0.15) (0.03) (0.26) (0.06) Adjusted non-GAAP diluted EPS 1.75 $ 1.57 $ 3.05 $ 2.74 $ Three Months Ended Six Months Ended Jun 30, Jun 30,
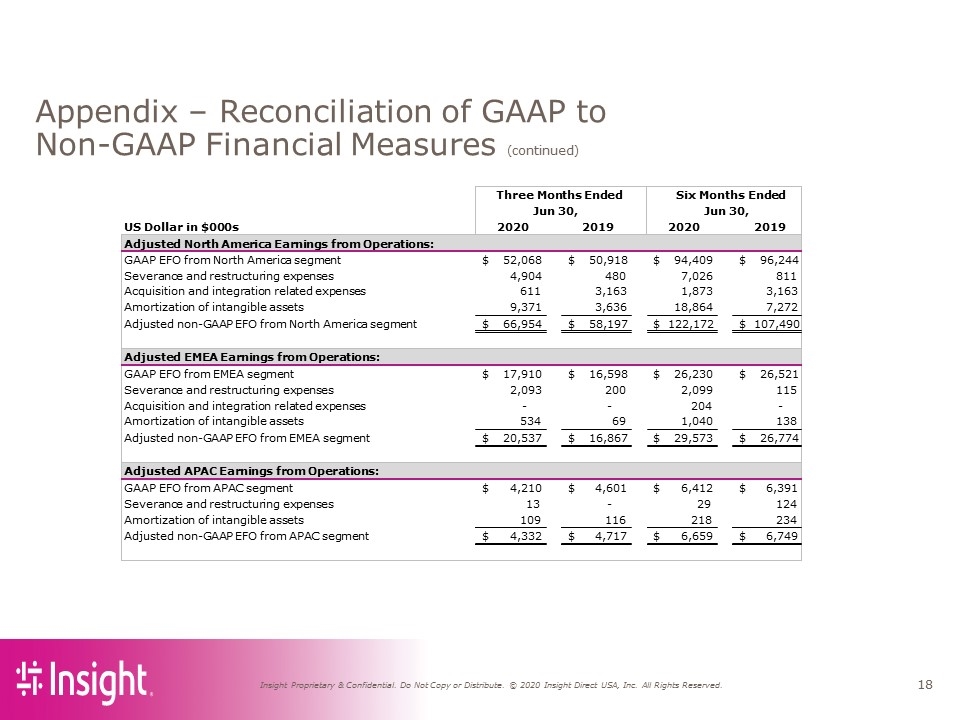
Appendix – Reconciliation of GAAP to Non-GAAP Financial Measures (continued) US Dollar in $000s 2020 2019 2020 2019 Adjusted North America Earnings from Operations: GAAP EFO from North America segment 52,068 $ 50,918 $ 94,409 $ 96,244 $ Severance and restructuring expenses 4,904 480 7,026 811 Acquisition and integration related expenses 611 3,163 1,873 3,163 Amortization of intangible assets 9,371 3,636 18,864 7,272 Adjusted non-GAAP EFO from North America segment 66,954 $ 58,197 $ 122,172 $ 107,490 $ Adjusted EMEA Earnings from Operations: GAAP EFO from EMEA segment 17,910 $ 16,598 $ 26,230 $ 26,521 $ Severance and restructuring expenses 2,093 200 2,099 115 Acquisition and integration related expenses - - 204 - Amortization of intangible assets 534 69 1,040 138 Adjusted non-GAAP EFO from EMEA segment 20,537 $ 16,867 $ 29,573 $ 26,774 $ Adjusted APAC Earnings from Operations: GAAP EFO from APAC segment 4,210 $ 4,601 $ 6,412 $ 6,391 $ Severance and restructuring expenses 13 - 29 124 Amortization of intangible assets 109 116 218 234 Adjusted non-GAAP EFO from APAC segment 4,332 $ 4,717 $ 6,659 $ 6,749 $ Jun 30, Jun 30, Three Months Ended Six Months Ended
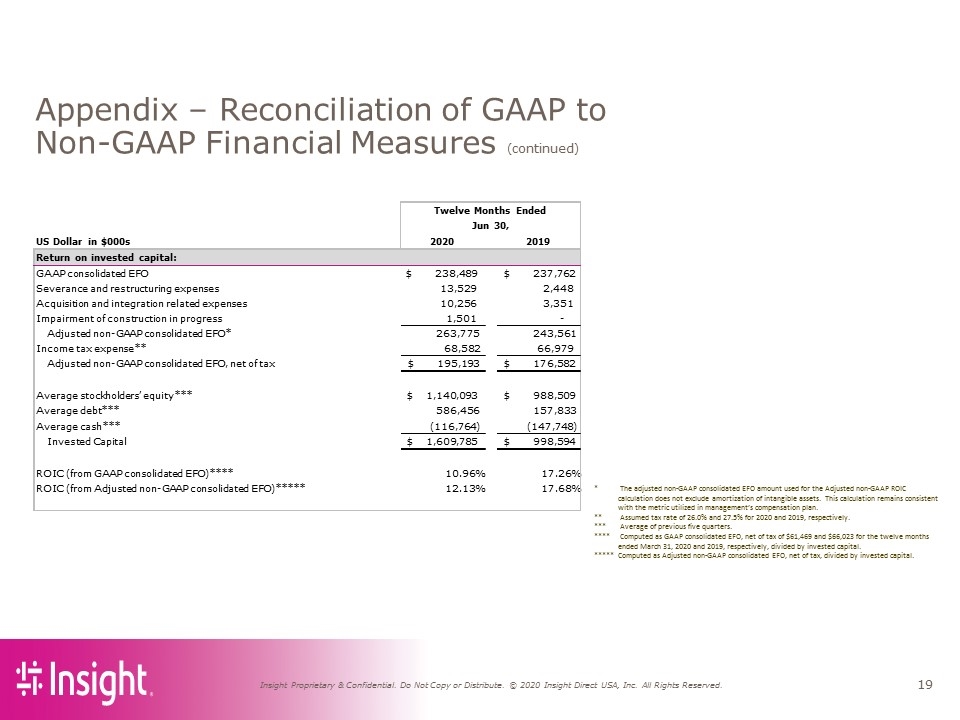
Appendix – Reconciliation of GAAP to Non-GAAP Financial Measures (continued) * The adjusted non-GAAP consolidated EFO amount used for the Adjusted non-GAAP ROIC calculation does not exclude amortization of intangible assets. This calculation remains consistent with the metric utilized in management’s compensation plan. ** Assumed tax rate of 26.0% and 27.5% for 2020 and 2019, respectively. *** Average of previous five quarters. **** Computed as GAAP consolidated EFO, net of tax of $61,469 and $66,023 for the twelve months ended March 31, 2020 and 2019, respectively, divided by invested capital. ***** Computed as Adjusted non-GAAP consolidated EFO, net of tax, divided by invested capital. US Dollar in $000s 2020 2019 GAAP consolidated EFO $ 238,489 $ 237,762 Severance and restructuring expenses 13,529 2,448 Acquisition and integration related expenses 10,256 3,351 Impairment of construction in progress 1,501 - Adjusted non-GAAP consolidated EFO* 263,775 243,561 Income tax expense** 68,582 66,979 Adjusted non-GAAP consolidated EFO, net of tax $ 195,193 $ 176,582 Average stockholders’ equity*** $ 1,140,093 $ 988,509 Average debt*** 586,456 157,833 Average cash*** (116,764) (147,748) Invested Capital $ 1,609,785 $ 998,594 ROIC (from GAAP consolidated EFO)**** 10.96% 17.26% ROIC (from Adjusted non-GAAP consolidated EFO)***** 12.13% 17.68% Twelve Months Ended Jun 30, Return on invested capital:
