Attached files
| file | filename |
|---|---|
| EX-24.7 - EX-24.7 - INSIGHT ENTERPRISES INC | d508368dex247.htm |
| EX-32.1 - EX-32.1 - INSIGHT ENTERPRISES INC | d508368dex321.htm |
| EX-31.2 - EX-31.2 - INSIGHT ENTERPRISES INC | d508368dex312.htm |
| EX-31.1 - EX-31.1 - INSIGHT ENTERPRISES INC | d508368dex311.htm |
| EX-24.10 - EX-24.10 - INSIGHT ENTERPRISES INC | d508368dex2410.htm |
| EX-24.9 - EX-24.9 - INSIGHT ENTERPRISES INC | d508368dex249.htm |
| EX-24.8 - EX-24.8 - INSIGHT ENTERPRISES INC | d508368dex248.htm |
| EX-24.6 - EX-24.6 - INSIGHT ENTERPRISES INC | d508368dex246.htm |
| EX-24.5 - EX-24.5 - INSIGHT ENTERPRISES INC | d508368dex245.htm |
| EX-24.4 - EX-24.4 - INSIGHT ENTERPRISES INC | d508368dex244.htm |
| EX-24.3 - EX-24.3 - INSIGHT ENTERPRISES INC | d508368dex243.htm |
| EX-24.2 - EX-24.2 - INSIGHT ENTERPRISES INC | d508368dex242.htm |
| EX-24.1 - EX-24.1 - INSIGHT ENTERPRISES INC | d508368dex241.htm |
| EX-23.1 - EX-23.1 - INSIGHT ENTERPRISES INC | d508368dex231.htm |
| EX-21 - EX-21 - INSIGHT ENTERPRISES INC | d508368dex21.htm |
Table of Contents
UNITED STATES
SECURITIES AND EXCHANGE COMMISSION
Washington, D.C. 20549
FORM 10-K
(Mark One)
| ☒ | Annual Report pursuant to Section 13 or 15(d) of the Securities Exchange Act of 1934 |
For the fiscal year ended December 31, 2017
or
| ☐ | Transition report pursuant to Section 13 or 15(d) of the Securities Exchange Act of 1934 For the transition period from to . |
Commission File Number: 0-25092

INSIGHT ENTERPRISES, INC.
(Exact name of registrant as specified in its charter)
| Delaware | 86-0766246 | |
| (State or other jurisdiction of incorporation or organization) |
(IRS Employer Identification No.) | |
6820 South Harl Avenue, Tempe, Arizona 85283
(Address of principal executive offices, Zip Code)
Registrant’s telephone number, including area code: (480) 333-3000
Securities registered pursuant to Section 12(b) of the Act:
| Title of each class |
Name of each exchange on which registered | |
| Common stock, par value $0.01 | The NASDAQ Global Select Market |
Securities registered pursuant to Section 12(g) of the Act:
n/a
(Title of Class)
Indicate by check mark if the registrant is a well-known seasoned issuer, as defined in Rule 405 of the Securities Act. Yes ☒ No ☐
Indicate by check mark if the registrant is not required to file reports pursuant to Section 13 or Section 15(d) of the Act. Yes ☐ No ☒
Indicate by check mark whether the registrant (1) has filed all reports required to be filed by Section 13 or 15(d) of the Securities Exchange Act of 1934 during the preceding 12 months (or for such shorter period that the registrant was required to file such reports), and (2) has been subject to such filing requirements for the past 90 days. Yes ☒ No ☐
Indicate by check mark whether the registrant has submitted electronically and posted on its corporate Web site, if any, every Interactive Data File required to be submitted and posted pursuant to Rule 405 of Regulation S-T (§ 232.405 of this chapter) during the preceding 12 months (or for such shorter period that the registrant was required to post such files). Yes ☒ No ☐
Indicate by check mark if disclosure of delinquent filers pursuant to Item 405 of Regulation S-K (§ 229.405) is not contained herein, and will not be contained, to the best of registrant’s knowledge, in definitive proxy or information statements incorporated by reference in Part III of this Form 10-K or any amendment to this Form 10-K. ☐
Indicate by check mark whether the registrant is a large accelerated filer, an accelerated filer, a non-accelerated filer, a smaller reporting company, or an emerging growth company. See the definitions of “large accelerated filer,” “accelerated filer,” “smaller reporting company,” and “emerging growth company” in Rule 12b-2 of the Exchange Act.
| Large accelerated filer | ☒ | Accelerated filer | ☐ | |||
| Non-accelerated filer | ☐ (Do not check if a smaller reporting company) | Smaller reporting company | ☐ | |||
| Emerging growth company | ☐ | |||||
If an emerging growth company, indicate by check mark if the registrant has elected not to use the extended transition period for complying with any new or revised financial accounting standards provided pursuant to Section 13(a) of the Exchange Act. ☐
Indicate by check mark whether the registrant is a shell company (as defined in Rule 12b-2 of the Act). Yes ☐ No ☒
The aggregate market value of the voting and non-voting common equity held by non-affiliates of the registrant, based upon the closing price of the registrant’s common stock as reported on The Nasdaq Global Select Market on June 30, 2017, the last business day of the registrant’s most recently completed second fiscal quarter, was $1,410,322,331.
The number of shares outstanding of the registrant’s common stock on February 15, 2018 was 35,836,320.
DOCUMENTS INCORPORATED BY REFERENCE
Portions of the registrant’s Proxy Statement relating to its 2018 Annual Meeting of Stockholders have been incorporated by reference into Part III, Items 10, 11, 12, 13 and 14 of this Annual Report on Form 10-K.
Table of Contents
INSIGHT ENTERPRISES, INC.
ANNUAL REPORT ON FORM 10-K
Year Ended December 31, 2017
| Page | ||||||
| PART I | ||||||
| ITEM 1. |
2 | |||||
| ITEM 1A. |
10 | |||||
| ITEM 1B. |
17 | |||||
| ITEM 2. |
17 | |||||
| ITEM 3. |
18 | |||||
| ITEM 4. |
18 | |||||
| PART II | ||||||
| ITEM 5. |
19 | |||||
| ITEM 6. |
21 | |||||
| ITEM 7. |
Management’s Discussion and Analysis of Financial Condition and Results of Operations |
23 | ||||
| ITEM 7A. |
43 | |||||
| ITEM 8. |
44 | |||||
| ITEM 9. |
Changes in and Disagreements With Accountants on Accounting and Financial Disclosure |
84 | ||||
| ITEM 9A. |
84 | |||||
| ITEM 9B. |
84 | |||||
| PART III | ||||||
| ITEM 10. |
85 | |||||
| ITEM 11. |
85 | |||||
| ITEM 12. |
Security Ownership of Certain Beneficial Owners and Management and Related Stockholder Matters |
85 | ||||
| ITEM 13. |
Certain Relationships and Related Transactions, and Director Independence |
85 | ||||
| ITEM 14. |
85 | |||||
| PART IV | ||||||
| ITEM 15. |
85 | |||||
| ITEM 16. |
85 | |||||
| 86 | ||||||
| 92 | ||||||
Table of Contents
INSIGHT ENTERPRISES, INC.
FORWARD-LOOKING STATEMENTS
Certain statements in this Annual Report on Form 10-K, including statements in “Management’s Discussion and Analysis of Financial Condition and Results of Operations” in Part II, Item 7 of this report, are forward-looking statements within the meaning of the Private Securities Litigation Reform Act of 1995. These forward-looking statements may include: projections of matters that affect net sales, gross profit, gross margin, operating expenses, earnings from operations, non-operating income and expenses, net earnings or cash flows, cash needs and the payment of accrued expenses and liabilities; the expected effects of seasonality on our business; expectations of further consolidation in the Information Technology (“IT”) industry; our business strategy and our strategic initiatives, including our efforts to grow our core business, develop and grow our global cloud business and build scalable solutions; expectations regarding partner incentives; our expectations about future benefits of our acquisitions and our plans related thereto, including potential expansion into wider regions; the increasing demand for big data solutions; the availability of competitive sources of products for our purchase and resale; our intentions concerning the payment of dividends; our acquisition strategy; our ability to offset the effects of inflation and manage any increase in interest rates; projections of capital expenditures; our plan to migrate EMEA’s IT system; the sufficiency of our capital resources, the availability of financing and our needs or plans relating thereto; the effects of new accounting principles and expected dates of adoption; the effect of indemnification obligations; projections about the outcome of ongoing tax audits; adequate provisions for and our positions and strategies with respect to ongoing and threatened litigation; our exposure to derivative counterparty concentration and non-performance risks; our ability to expand our client relationships; our expectations that pricing pressures in the IT industry will continue; our plans to use cash flow from operations for working capital, to pay down debt, repurchase shares of our common stock, make capital expenditures, and fund acquisitions; our belief that our office facilities are adequate and that we will be able to extend our current leases or locate substitute facilities on satisfactory terms; our expectations that working capital trends will return to normalized levels; our belief that we have adequate provisions for losses; our expectation that we will not incur interest payments under our inventory financing facility; our compliance with leverage ratio requirements; our exposure to off-balance sheet arrangements; statements of belief; and statements of assumptions underlying any of the foregoing. Forward-looking statements are identified by such words as “believe,” “anticipate,” “expect,” “estimate,” “intend,” “plan,” “project,” “will,” “may” and variations of such words and similar expressions and are inherently subject to risks and uncertainties, some of which cannot be predicted or quantified. Future events and actual results could differ materially from those set forth in, contemplated by, or underlying the forward-looking statements. There can be no assurances that results described in forward-looking statements will be achieved, and actual results could differ materially from those suggested by the forward-looking statements. Some of the important factors that could cause our actual results to differ materially from those projected in any forward-looking statements include, but are not limited to, the following:
| • | actions of our competitors, including manufacturers and publishers of products we sell; |
| • | our reliance on our partners for product availability, competitive products to sell and marketing funds and purchasing incentives, which can change significantly in the amounts made available and the requirements year over year; |
| • | changes in the IT industry and/or rapid changes in technology; |
| • | risks associated with the integration and operation of acquired businesses; |
| • | possible significant fluctuations in our future operating results; |
| • | the risks associated with our international operations; |
| • | general economic conditions; |
| • | increased debt and interest expense and decreased availability of funds under our financing facilities; |
| • | the security of our electronic and other confidential information; |
| • | disruptions in our IT systems and voice and data networks; |
| • | failure to comply with the terms and conditions of our commercial and public sector contracts; |
| • | legal proceedings and client audits and failure to comply with laws and regulations; |
| • | accounts receivable risks, including increased credit loss experience or extended payment terms with our clients; |
| • | our reliance on independent shipping companies; |
| • | our dependence on certain key personnel; |
| • | natural disasters or other adverse occurrences; |
| • | exposure to changes in, interpretations of, or enforcement trends related to tax rules and regulations; and |
| • | intellectual property infringement claims and challenges to our registered trademarks and trade names. |
Any forward-looking statements in this report, including those identified under “Risk Factors” in Part I, Item 1A of this report, should be considered in light of various important factors, including the risks and uncertainties listed above, as well as others. Additionally, there are risks described from time to time in the reports that we file with the Securities and Exchange Commission. We assume no obligation to update, and, except as may be required by law, do not intend to update, any forward-looking statements. We do not endorse any projections regarding future performance that may be made by third parties.
1
Table of Contents
INSIGHT ENTERPRISES, INC.
| Item 1. | Business |
Our Company
Insight Enterprises, Inc. (“Insight” or the “Company”) is a Fortune 500 global IT provider helping businesses of all sizes – from small and medium sized firms to worldwide enterprises, governments, schools and health care organizations – define, architect, implement and manage Intelligent Technology SolutionsTM in North America; Europe, the Middle East and Africa (“EMEA”); and Asia-Pacific (“APAC”). We empower our clients to manage their IT environments so they can drive meaningful business outcomes today and transform their operations for tomorrow.
The Company is organized in the following three operating segments, which are primarily defined by their related geographies:
| Operating Segment* |
Geography |
% of 2017 Consolidated Net Sales | ||
| North America |
United States and Canada | 77% | ||
| EMEA |
Europe, Middle East and Africa | 20% | ||
| APAC |
Asia-Pacific | 3% |
| * | Additional detailed segment and geographic information can be found in “Management’s Discussion and Analysis of Financial Condition and Results of Operations” in Part II, Item 7 and in Note 20 to the Consolidated Financial Statements in Part II, Item 8 of this report. |
This year, 2018, marks 30 years of doing business for Insight. Across three decades, we have evolved with the industry. Each strategic pivot has been made in pursuit of helping our clients run their businesses smarter. Insight began operations in Arizona in 1988, incorporated in Delaware in 1991 and completed its initial public offering in 1995. Our corporate headquarters are located in Tempe, Arizona. From our original location in the United States, we expanded nationwide and then entered Canada in 1997 and the United Kingdom in 1998. Through a combination of acquisitions and organic growth, we continued to increase our geographic coverage and expand our technical capabilities. Our major acquisitions were as follows:
| • | 2006 – Acquired Software Spectrum, Inc., and expanded our footprint in EMEA and APAC and strengthened our software and related services capabilities; |
| • | 2008 – Acquired Calence, LLC in North America and MINX Limited in the United Kingdom, and enhanced our global technical expertise around higher-end networking and communications technologies, as well as managed services and security; |
| • | 2011 – Acquired Ensynch, Inc. (“Ensynch”) and enhanced our professional services capabilities across the complete Microsoft solution set, including cloud migration and management; |
| • | 2012 – Acquired Inmac GmbH and Micro Warehouse BV (“Inmac”) and expanded our hardware capabilities into key markets in our existing European footprint, specifically in Germany and the Netherlands; |
| • | 2015 – Acquired BlueMetal Architects, Inc. (“BlueMetal”), an interactive design and technology architecture firm, and strengthened our services capabilities in the area of application design, mobility and big data; |
| • | 2016 –Acquired Ignia, Pty Ltd (“Ignia”) and expanded our global footprint in the areas of application design, digital solutions, cloud, mobility and business analytics, while also building on our ability to bring solutions powered by Intelligent Technology Solutions to our clients in APAC; and |
| • | 2017 – On January 6, 2017, we acquired Datalink Corporation (“Datalink”), a leading provider of IT services and enterprise data center solutions based in Eden Prairie, Minnesota, and strengthened our position as a leading IT solutions provider with deep technical expertise delivering data center solutions to clients on premise or in the cloud. On September 26, 2017, we acquired Caase Group B.V. (referred to herein as, “Caase.com”), a Dutch cloud service provider, and strengthened our ability to deliver Intelligent Technology Solutions to our clients in the Netherlands, with a view to expanding into the wider European region in the near future. |
2
Table of Contents
INSIGHT ENTERPRISES, INC.
Our Purpose and Values
Our purpose is: “We build meaningful connections to help businesses run smarter.” We live by our core values of Hunger, Heart and Harmony, which set the tone for our business and define who we are. Our core values are:
| • | Hunger – Our insatiable desire to create new opportunities for our clients and our business is apparent in everything we do. |
| • | Heart – We seek to impact the lives of the people we serve positively by always putting our clients, partners and teammates first. |
| • | Harmony – We invite perspective, and we consistently celebrate each other’s unique contributions as we work together to bring the best solutions to our clients. |
We believe that these values strengthen the overall Insight experience for our clients, partners and teammates (we refer to our customers as “clients,” our suppliers as “partners” and our employees as “teammates”).
Our Market
The worldwide total addressable market for information technology is forecasted to be $3.7 trillion annually according to Gartner, a leading IT research and advisory company. Based on our analysis of Gartner market data, we believe the top 10 most comparable global solution providers represent less than 10% of the worldwide total addressable market. We believe our addressable worldwide market in the indirect sales IT channel represents approximately $612 billion in annual sales and for the year ended December 31, 2017, our net sales of $6.7 billion represented approximately 1% of that highly diverse market. We believe that we are well positioned in this highly fragmented global market with locations in 20 countries and have the capabilities to provide clients with hardware, software provisioning and related services and solutions across the globe.
Our Value Proposition
As the IT industry evolves, our value proposition to our clients continues to evolve. The increased complexity across the technology ecosystem, combined with the continual emergence of new trends and offerings, has made it difficult for most clients to effectively manage their IT environments. We consult with our clients regarding their IT hardware and software product and services needs and help our clients define, architect, implement and manage their IT solutions.
We are well positioned to participate in the market as IT continues to transform. Our value drivers include:
| • | Deep knowledge in client-relevant solution areas |
| • | History of adapting our business model to respond to new technology trends, including the cloud |
| • | Differentiated consulting, technology and managed services offerings |
| • | Ability to scale to serve clients of all sizes and across many verticals |
| • | Strong partner relationships with top market positions |
| • | Global footprint with local presence in key markets |
| • | Flexible capital structure to support future growth, including additional acquisitions |
We believe that Insight has a unique position in the market to gain profitable market share by offering Intelligent Technology Solutions that empower our clients to manage their IT environments so they can drive meaningful business outcomes today and transform their operations for tomorrow.
We believe that Insight’s unique advantages include:
| • | Our global scale and coverage – we have the capabilities to serve clients across the globe with hardware, software provisioning and related services and with integrated technology solutions in multiple countries directly or through our partner network. |
| • | Our operational excellence and systems – we offer a broad selection of hardware and software products with access to billions of dollars in virtual inventory and efficient supply chain execution, as well as product fulfillment and logistics capabilities, management tools and technical expertise. |
3
Table of Contents
INSIGHT ENTERPRISES, INC.
| • | Our software DNA – we understand complex licensing requirements and have the know-how to optimize our clients’ usage and compliance management through a portfolio of license consulting and optimization services. |
| • | Our partner alignment – we have a multi-partner approach and have deep relationships with leading product manufacturers, software publishers and distribution partners, as well as emerging cloud and other technology partners, to service our global portfolio of commercial and public sector clients with the integrated IT solutions that make the most sense for their IT environments. |
| • | Our data center transformation skills – in support of our long-term strategy, in January 2017, we completed the acquisition of Datalink, a leading provider of IT services and enterprise data center solutions, adding deep technical expertise and complementary services offerings to our internally developed solutions and increasing our addressable market opportunity in hybrid cloud and other high-growth data center categories. |
| • | Our next-generation tech skills – we quickly adapt to new technology trends and innovation and, with our acquisition of BlueMetal in 2015, continued our evolution as thought leaders in emerging technologies that help transform our clients’ businesses. |
| • | Our App development and Internet-of-Things (“IoT”) expertise – we were recognized as Microsoft’s Worldwide Partner of the Year for IoT as well as Mobile App Development in each of the past two years and, combined with our hardware and software expertise, we are well-positioned to deliver holistic connected product and IoT solutions. |
| • | Our digital platform – we have customizable client portals, primarily in North America, which allow clients to streamline procurement and processes through a self-service online tool, drive standardization and optimize reconciliation. We also have a best-in-class digital marketing engine to bring scalable solutions to the mid-market. |
| • | Our services solutions – we can scale to help organizations of all sizes and have well-developed services capabilities focused on four solutions areas: supply chain optimization, connected workforce, cloud and datacenter transformation and digital innovation, that represent the ways we help our clients with the demands they face, as discussed in more detail below. |
Our Business Strategy
Our long-term strategy remains consistent and includes three components:
| • | Grow our core business; |
| • | Grow services sales in our key solutions areas; and |
| • | Accelerate with cloud. |
Grow our core business. We believe that our core business is strong and continues to present opportunities for growth. We believe that Insight is uniquely positioned to help our clients manage their business effectively today and also transform to meet their changing needs tomorrow. Our balanced portfolio of manufacturer and publisher brands, extensive e-commerce and logistics capabilities and differentiated services capabilities allow us to tailor our offerings based on the size and complexity of the needs of our clients. As a global provider of integrated solutions to business and government clients, we believe we are well-positioned relative to our competitors in several markets. Our go-to-market model leverages both centralized and local market sales and technical and support resources to efficiently serve and advise our clients.
In each of our geographic operating segments we are focused on driving our growth objectives by acquiring new clients and expanding our relationships with existing clients by increasing the types of products and services they buy from us. In North America, we have a local market presence in key cities where we have invested in sales, technical and service delivery resources to drive growth with existing and new clients, particularly in the large account client space. In addition, we drive expansion in specific service/solution areas with key partners. We are also concentrating our efforts on growing our business with mid-sized and large clients in certain vertical markets, including federal government, state and local governments, K-12 education, healthcare and service providers, and have invested in both local market and centralized sales resources to drive these efforts. In EMEA, we are focused on increasing our share in the mid-market and public sector by increasing sales of software and certain hardware categories across the business. We continue to expand our services capabilities in the region and to leverage strategic partner relationships and service-delivery vendors to bring software, cloud and collaboration solutions to our clients. Our APAC operating segment, which is largely comprised of software sales, is engaged in growing sales in the mid-market and enterprise space and in the development of specialized software services, particularly in the areas of software license optimization and cloud.
4
Table of Contents
INSIGHT ENTERPRISES, INC.
Grow services sales in our key solutions areas. The IT market has become more complex and clients are looking for solutions providers to help them navigate the rapidly changing environment. We believe that our core business plus our recent strategic acquisitions provide an integrated foundation that we can leverage to better serve our clients. We have identified four key solutions areas that capitalize on this foundation and include robust offerings to help our clients with the demands they face. Our services capabilities provide significant value-add to our clients, driving stronger client relationships and higher margins. Our key solutions areas are:
| • | Supply Chain Optimization – We help our clients invest smarter so they can manage today and transform for the future. By optimizing their supply chain, we can help our clients maximize resources and do more today so they can invest in the future. |
| • | Connected Workforce – We help our clients’ employees work smarter so they can manage and transform their businesses. By connecting their workforces, we help our clients create meaningful employee experiences that fuel productivity as well as attract and retain essential talent. |
| • | Cloud and Data Center Transformation – We help our clients run workloads smarter so they can transform business. By defining and navigating cloud and data center platforms, we help our clients optimize and modernize their business. |
| • | Digital Innovation – We help our clients innovate smarter so they can create meaningful connections with their customers. By innovating their digital business, we help our clients monetize existing offerings, create new revenue streams and drive differentiation across their customer experience. |
Accelerate with cloud. Private, public and hybrid cloud solutions provide flexible, reliable, secure and affordable solutions for delivering critical IT functions, such as email, data security, Infrastructure as a Service (“IaaS”) and more. Cloud solutions have become more mainstream, and adoption continues to increase across markets and verticals. Key market imperatives in the adoption of cloud solutions are speed to market, flexibility, scalability and availability. We have invested in, and will continue to invest in, technical tools and resources to provide clients with the assessment, migration, integration and managed services required to simplify the cloud adoption decision, whether that decision results in a private, public or hybrid cloud environment.
We also continue to invest in our global cloud management platform, which serves as a marketplace for our clients to buy and manage their cloud subscriptions with options that enhance their Software as a Service (“SaaS”) and IaaS management capabilities.
Components of our cloud management platform include:
| • | A focus on small to medium-sized clients, providing them with the ability to learn, solve, buy, and manage cloud products and services via our online experience. |
| • | A similar online experience and capabilities for our larger enterprise clients with added IT as a Service Broker (ITaaSB) capabilities allowing larger IT organizations to centrally provide cloud offerings while maintaining the manageability and visibility they require. |
Additionally, we have a strong global position in the service provider and independent software vendor (ISV) market. Building on our existing capabilities in this market, we have developed a cloud portfolio for our service provider clients to resell to their customers, offering them revenue diversification with minimal investment. We also plan to expand our cloud management platform capabilities and deliver cloud portal platforms that provide e-commerce and subscription management capabilities to our service provider clients.
5
Table of Contents
INSIGHT ENTERPRISES, INC.
Our Offerings
Our offerings in North America and certain countries in EMEA and APAC include a suite of IT hardware, software and services solutions. Our offerings in the remainder of our EMEA and APAC segments are largely software and certain software-related services. On a consolidated basis, hardware, software and services represented approximately 58%, 32% and 10%, respectively, of our net sales in 2017. This compares to 54%, 37% and 9%, respectively, of our consolidated net sales in 2016, and 54%, 38% and 8%, respectively, of our consolidated net sales in 2015. Additional detailed sales mix information by operating segment, including a discussion of changes in our classification of certain revenue streams during 2017, can be found in “Management’s Discussion and Analysis of Financial Condition and Results of Operations” in Part II, Item 7 and in Note 20 to the Consolidated Financial Statements in Part II, Item 8 of this report. Prior year results were reclassified to conform to the current year presentation, resulting in 3% of our consolidated net sales being reclassified from software to services in both 2016 and 2015. These reclassifications had no effect on consolidated total net sales.
Services Solutions Offerings
We have developed solutions that integrate hardware, software and services to help businesses run smarter within our key solutions areas. Our core solutions include:
Supply Chain Optimization – Growing pressure on IT budgets and increasing trends in outsourcing of non-core functions are changing what clients choose to build versus buy. We provide outsourcing services our clients desire, including management of client infrastructure and end-user operations to drive IT return on investment.
| • | Product Life Cycle: Source, procure, stage, configure, integrate, test, deploy and maintain IT products spanning endpoints to infrastructure. |
| • | Infrastructure Management: 24x7 remote management of clients’ server/storage/network infrastructure through our ISO-certified Remote Network Operating Center (RNOC). |
Connected Workforce – The consumerization of IT, increase in the millennial population and proliferation of alternate work models is transforming the workplace. We provide our clients’ workforce with tools to enable and enhance employee productivity and retention.
| • | Insight Managed Office: Desktop and notebook devices coupled with cloud-based productivity solutions, deployed through a modern, “over the air” deployment model, managed by Insight’s 24x7 Service Desk. In addition, we see growing demand for “Device-as-a-Service.” |
| • | Insight Managed Mobility: Tablet and cellular-based devices, paired with cloud-based applications and Insight’s 24x7 Service Desk to deliver an end-to-end managed experience where clients can outsource their highly complex mobility environments to Insight in an as-a-service style model. |
| • | Insight Managed Collaboration: Offerings that allow clients to outsource their highly complex voice, conferencing and collaboration/team applications, delivering cloud-based redeployment of modern technologies managed for our clients with both Insight’s onsite and remote Service Desk support professionals. |
| • | Insight Managed Deployment: Service level agreement-based outsourcing of distributed devices and technology, or edge, deployment and support. This comprises multi-site deployments, coupled with dedicated, onsite desktop support technicians coupled with 24x7 Service Desk. |
Cloud and Data Center Transformation – Consumption-based models and technology convergence are reinventing decades-old infrastructure business models. We optimize our clients’ public and private infrastructure to enable customer and workforce objectives best suited to their workload and business requirements.
| • | Hybrid Cloud: On-premise converged infrastructure (private cloud) augmented by off-premise public cloud integrated, managed and secured. |
| • | Intelligent Network: Core WAN, LAN, wireless and security solutions to seamlessly connect Hybrid Cloud, Branch Infrastructure and end users. |
Digital Innovation – When interacting with their customers, our clients face growing digital engagement and a rapid shift toward social media. We help our clients leverage technology to better engage their customers to build loyalty and increase profitability.
| • | Intelligent Endpoints: Digital signage, kiosk, tablet and smartphone endpoints integrated with off-the-shelf software applications. |
| • | Intelligent Applications: Custom-developed applications to enable client-to-customer engagement. These applications are increasingly cloud-based and mobile-centric. |
6
Table of Contents
INSIGHT ENTERPRISES, INC.
| • | Modern Applications: Custom-developed mobile, cloud and IoT applications. Typically, these applications are specific to the client vertical market, e.g., healthcare, financial services or retail. |
We have invested in cloud, mobility, big data and security capabilities and expertise to enable our key solutions areas and continuously seek to identify client-relevant technology solutions.
Cloud. Cloud computing represents an evolution in the IT world. Cloud-based SaaS, whereby clients subscribe to software that is hosted either by the software publisher or a dedicated third-party hosting company, is prevalent in the Connected Workforce and Cloud and Data Center Transformation solutions highlighted above. In addition, public IaaS and converged infrastructure private cloud represent growing portions of Hybrid Cloud solutions. We help clients assess readiness, architect appropriate solutions and migrate to both public and private cloud infrastructures.
Mobility. Our clients must engage differently with their customers and fully engage their workforce whether they are at work, at home or on-the-go. We help clients do so through solutions starting with Insight Managed Mobility, an as-a-service like Enterprise Mobility Management (EMS) solution for employees, and modern customer-facing solutions, such as mobile Point of Sale (mPOS) and mobile commerce applications in the retail industry as well as mobile trading applications for brokerage customers in the financial services industry.
Big Data. Our clients are inundated with data that they struggle to interpret. We help turn this data into actionable insights with solutions such as weather-based predictive analytics to drive weekly marketing campaigns for consumer products and patient-based intake and health outcomes analysis to optimize nurse staffing. We expect the proliferation of sensors for IoT will fuel this data overload and drive further demand for these solutions.
Security. All of these solutions must be delivered without compromising customer, company or employee private information. We offer services for identity and access management, single-sign-on (SSO) and mobile-device-management (MDM) to protect end users. In addition, we provide network security and Security Incident Event Management (SIEM) solutions to secure our clients’ infrastructure.
Hardware Offerings
We offer products from hundreds of manufacturers, including such industry leaders as Cisco, HP Inc., Lenovo, Dell, Hewlett Packard Enterprise Company (“HPE”), EMC, Microsoft, NetApp, Apple and IBM. Our scale and purchasing power, combined with our efficient, high-volume and cost effective direct sales and marketing model, allow us to offer competitive prices. We believe that offering choices from multiple partners enables us to better serve our clients by providing a variety of product solutions to address their specific business needs.
In addition to our distribution facilities, we have “direct-ship” programs with many of our partners, including manufacturers and distributors, allowing us to expand our product offerings without increasing inventory, handling costs or inventory risk exposure. As a result, we are able to offer billions of dollars of products in virtual inventory in fulfilling our performance obligations to our clients. Convenience and product options among multiple brands are key competitive advantages compared to manufacturers’ direct selling programs, which are generally limited to their own brands and may not offer clients a complete or best-in-class solution across all product categories.
Software Offerings
Our clients acquire software applications from us in the form of licensing agreements with software publishers or boxed products. We offer products from hundreds of publishers, including such industry leaders as Microsoft, Adobe, VMware, Symantec, McAfee, Citrix, IBM Software and Red Hat, as well as newer entrants, such as Box and 8x8.
As software publishers choose different models for implementing licensing agreements, businesses must evaluate the alternatives to ensure that they select the appropriate agreements and comply with the publishers’ licensing terms when purchasing and managing their software licenses. In addition to software provisioning, we offer holistic software solutions, including software licensing optimization and implementation consulting, to help our clients better understand their software needs, evaluate their existing software and provide options to optimize their assets.
7
Table of Contents
INSIGHT ENTERPRISES, INC.
Our Information Technology Systems
We have committed significant resources to the IT systems that we own and use to manage our business and believe that our success is dependent upon our ability to provide prompt and efficient service to our clients based on the accuracy, quality and utilization of the information generated by our IT systems. Because these systems affect our ability to manage our sales, client service, partner relationships and programs, distribution, inventories and accounting systems and our voice and data networks, we have built redundancy into certain systems, maintain system outage policies and procedures and have comprehensive data backup. We are focused on driving improvements in sales productivity through upgraded IT systems to support higher levels of client satisfaction and new client acquisition, as well as garnering efficiencies in our business.
We operate under a single, standardized IT system across North America and APAC and a separate, single IT system platform in all countries in our EMEA operations. We plan to migrate our EMEA operations to the same IT system used in North America and APAC.
For a discussion of risks associated with our IT systems, see “Risk Factors – Disruptions in our IT systems and voice and data networks could affect our ability to service our clients and cause us to incur additional expenses,” in Part I, Item 1A of this report.
Our Competition
The IT hardware, software and services industry is very fragmented and highly competitive. Our competition includes:
| • | Direct marketers and resellers, such as CDW (North America and United Kingdom), Systemax (Europe), Softchoice, Comparex, Connection, PCM, World Wide Technology, SHI, SoftwareONE, Computacenter, SCC, Bechtle, Cancom and Crayon; |
| • | National and regional resellers, including value-added resellers, specialty retailers, aggregators, distributors, and to a lesser extent, national computer retailers, computer superstores, Internet-only computer providers, consumer electronics and office supply superstores and mass merchandisers; |
| • | Product manufacturers, such as Dell, HP Inc., IBM, Lenovo and HPE; |
| • | Software publishers, such as IBM, Microsoft and Symantec; |
| • | Systems integrators, such as Compucom Systems, Inc.; |
| • | National and global service providers, such as IBM Global Services and HP Enterprise Services; and |
| • | E-tailers, such as Amazon Web Services (AWS), Newegg, Buy.com and e-Buyer (United Kingdom). |
The competitive landscape in the industry is continually changing as various competitors expand their product and services offerings. In addition, emerging models such as cloud computing are creating new competitors and opportunities in messaging, infrastructure, security, collaboration and other services offerings, and, as with other areas, we compete both with resellers and directly with manufacturers, publishers or other service providers for many of these offerings. Further, many of our manufacturer and publisher partners are also our competitors, as many sell directly to business customers, particularly larger corporate customers.
For a discussion of risks associated with the actions of our competitors, see “Risk Factors – The IT hardware, software and services industry is intensely competitive, and actions of our competitors, including manufacturers and publishers of products we sell, can negatively affect our business,” in Part I, Item 1A of this report.
Our Partners
We partner with market leaders offering the top technology brands as well as emerging entrants in the marketplace. During 2017, we purchased products and software from approximately 5,400 partners. Approximately 66% (based on dollar volume) of these purchases were directly from manufacturers or software publishers, with the balance purchased through distributors. Purchases from Microsoft accounted for approximately 26% of our aggregate purchases in 2017. No other partner accounted for more than 10% of purchases in 2017. Our top five partners as a group for 2017 were Microsoft, Cisco Systems, Tech Data (a distributor), Dell and HP Inc., and approximately 60% of our total purchases during 2017 came from this group of partners. Although brand names and individual products are important to our business, we believe that competitive sources of supply are available in substantially all of our product categories such that, with the exception of Microsoft, we are not dependent on any single partner for sourcing products.
8
Table of Contents
INSIGHT ENTERPRISES, INC.
During 2017, sales of Microsoft, Dell and Cisco Systems products accounted for approximately 20%, 12% and 11%, respectively, of our consolidated net sales. No other manufacturer’s products accounted for more than 10% of our consolidated net sales in 2017. Sales of product from our top five manufacturers/publishers as a group (Microsoft, Dell, Cisco Systems, HP Inc. and Lenovo) accounted for approximately 59% of Insight’s consolidated net sales during 2017.
We obtain incentives from certain product manufacturers, software publishers and distribution partners based typically upon the volume of sales or purchases of their products and services. In other cases, such incentives may be in the form of participation in our partner programs, which may require specific services or activities with our clients, discounts, marketing funds, price protection or rebates. Manufacturers and publishers may also provide mailing lists, contacts or leads to us. We believe that these incentives (or partner funding) and other marketing assistance allow us to increase our marketing reach and strengthen our relationships with leading manufacturers and publishers.
We are focused on understanding our partners’ objectives and developing plans and programs to grow our mutual businesses. We have invested in our digital marketing capabilities over the past two years. These digital marketing investments increase the effectiveness of our marketing campaigns and client interactions. Our partners are taking notice, and we are emerging as a leader in our industry as we consistently outpace our competition in digital marketing. We implemented business intelligence tools that enable us to track performance in this area and demonstrate the return on our partners’ investments with us. We measure partner satisfaction regularly and hold quarterly business reviews with our largest partners to review business results from the prior quarter, discuss plans for the future and obtain feedback. Additionally, we host annual partner forums in North America, EMEA and APAC to articulate our plans for the upcoming year.
As we move into new service areas, we may become even more reliant on certain partner relationships. For a discussion of risks associated with our reliance on partners, see “Risk Factors – We rely on our partners for product availability, competitive products to sell and marketing funds and purchasing incentives, which can change significantly in the amounts made available and the requirements year over year,” in Part I, Item 1A of this report.
Our Teammates
As of December 31, 2017, we employed 6,697 teammates, of whom 2,512 were engaged in sales related activities, 2,024 were engaged in management, support services and administration activities, 2,007 were skilled, certified consulting and service delivery professionals and 154 were engaged in distribution activities. Our teammates in the United States are not represented by a labor union. Our workforces in certain foreign countries, such as Germany, have worker representative committees or work councils with which we maintain strong relationships. We believe our relations with our teammates are good, and we have never experienced a labor related work stoppage.
For a discussion of risks associated with our dependence on certain personnel, including sales personnel, see “Risk Factors – We depend on certain key personnel,” in Part I, Item 1A of this report.
Our Seasonality
We experience some seasonal trends in our sales of IT hardware, software and services. For example:
| • | software sales are typically higher in our second and fourth quarters, particularly the second quarter; |
| • | business clients, particularly larger enterprise businesses in the United States, tend to spend more in our fourth quarter and less in the first quarter; |
9
Table of Contents
INSIGHT ENTERPRISES, INC.
| • | sales to the federal government in the United States are often stronger in our third quarter, while sales in the state and local government and education markets are stronger in our second quarter; and |
| • | sales to public sector clients in the United Kingdom are often stronger in our first quarter. |
These trends create overall seasonality in our consolidated results such that sales and profitability are expected to be higher in the second and fourth quarters of the year.
Our Backlog
The majority of our backlog historically has been and continues to be open cancelable purchase orders. We do not believe that backlog as of any particular date is predictive of future results.
Our Intellectual Property
We do not maintain a traditional research and development group, but we do develop and seek to protect a range of intellectual property, including trademarks, service marks, copyrights, domain name rights, trade dress, trade secrets and similar intellectual property, relying for such protection on applicable statutes and common law rights, trade-secret protection and confidentiality and license agreements, as applicable, with teammates, clients, partners and others to protect our intellectual property rights. Our principal trademark is a registered mark, and we also license certain of our proprietary intellectual property rights to third parties. We have registered a number of domain names, applied for registration of other marks in the United States and in certain international jurisdictions, and, from time to time, filed patent applications. We believe our trademarks and service marks, in particular, have significant value, and we continue to invest in the promotion of our trademarks and service marks and in our protection of them.
For a discussion of risks associated with our intellectual property, see “Risk Factors – We may not be able to protect our intellectual property adequately, and we may be subject to intellectual property infringement claims,” in Part I, Item 1A of this report.
Available Information
Our annual report on Form 10-K, quarterly reports on Form 10-Q, current reports on Form 8-K and amendments to such reports filed pursuant to Sections 13(a) and 15(d) of the Securities Exchange Act of 1934, as amended (the “Exchange Act”), and the reports filed pursuant to Section 16(a) of the Exchange Act are available free of charge on our web site at www.insight.com, as soon as reasonably practicable after we electronically file them with, or furnish them to, the Securities and Exchange Commission. The information contained on our web site is not included as a part of, or incorporated by reference into, this Annual Report on Form 10-K.
| Item 1A. | Risk Factors |
The IT hardware, software and services industry is intensely competitive, and actions of our competitors, including manufacturers and publishers of products we sell, can negatively affect our business. Competition in the industry is based on price, product availability, speed of delivery, credit availability, quality and breadth of product lines, and, increasingly, on the ability to provide services and tailor specific solutions to client needs. Many of our manufacturer and publisher partners are also our competitors, as many sell directly to business customers, particularly larger corporate customers. In addition to the manufacturers and publishers of products we sell, we compete with a large number and wide variety of providers and resellers of IT hardware, software and services. We believe our industry will see further consolidation as product resellers and direct marketers combine operations or acquire or merge with other resellers, service providers and direct marketers to increase efficiency, service capabilities and market share. Moreover, current and potential competitors have established or may establish cooperative relationships among themselves or with third parties to enhance their product and service offerings. Accordingly, it is possible that new competitors or alliances among competitors may emerge and acquire significant market share.
10
Table of Contents
INSIGHT ENTERPRISES, INC.
The competitive landscape in which we operate continues to change as new technologies are developed. While innovation helps our business as it creates new offerings for us to sell, it can also disrupt our business model and create new and stronger competitors. For instance, while cloud-based solutions present an opportunity for us, cloud-based solutions and technologies that deliver technology solutions as-a-service could increase the amount of sales directly to customers rather than through solutions providers like us, or could reduce the amount of hardware or software we sell, leading to a reduction in our sales and/or profitability. Accordingly, we are dependent on continued innovations by our current vendor partners and our ability to partner with new and emerging technology providers.
Generally, pricing is very aggressive in the industry, and we expect pricing pressures to continue. There can be no assurance that we will be able to negotiate prices as favorable as those negotiated by our competitors or that we will be able to offset the effects of price reductions with an increase in the number of clients, higher net sales, cost reductions, greater sales of services, which are typically at higher gross margins, or otherwise. Price reductions by our competitors that we either cannot or choose not to match could result in an erosion of our market share and/or reduced sales or, to the extent we match such reductions, could result in reduced operating margins or inventory impairment charges, any of which could have a material adverse effect on our business, financial condition and results of operations.
Some of our competitors in each of our operating segments may have greater technical, marketing and other resources than we do. In addition, some of these competitors may be able to respond more quickly to new or changing opportunities, technologies and client requirements. Many current and potential competitors also may have greater name recognition and engage in more extensive promotional activities, offer more attractive terms to their customers and adopt more aggressive pricing policies than we do. Additionally, some of our competitors have higher margins and/or lower operating cost structures, allowing them to price more aggressively. There can be no assurance that we will be able to compete effectively with current or future competitors or that the competitive pressures we face will not have a material adverse effect on our business, financial condition and results of operations.
We rely on our partners for product availability, competitive products to sell and marketing funds and purchasing incentives, which can change significantly in the amounts made available and the requirements year over year. We acquire products for resale both directly from manufacturers and publishers and indirectly through distributors, and the loss of a significant partner relationship could cause a disruption in the availability of products to us. There can be no assurance that manufacturers and publishers will continue to sell or will not limit or curtail the availability of their product to resellers like us. The loss of, or change in business relationship with, any of our key vendor partners could negatively impact our business.
In addition, certain manufacturers, publishers and distributors provide us with substantial incentives in the form of rebates, marketing funds, purchasing incentives, early payment discounts, referral fees and price protections (collectively, “partner funding”). Partner funding is used to offset, among other things, inventory costs, costs of goods sold, marketing costs and other operating expenses. Certain of these funds are based on our volume of sales or purchases, growth rate of net sales or purchases and marketing programs. If we do not meet the goals of these programs or if we are not in compliance with the terms of these programs, there could be a material negative effect on the amount of incentives offered or paid to us by manufacturers and publishers. We continue to experience adverse partner funding program changes that reduce the incentives many partners make available to us and that change the requirements for earning such incentives. If we are unable to react timely to remediate and respond to these changes in partner funding programs of publishers and manufacturers, including the elimination of, or significant reductions in, funding for some of the activities for which we have been compensated in the past, the changes could have a material adverse effect on our business, financial condition and results of operations. This is especially true in connection with the incentive programs of our largest partners: Microsoft, Dell, Cisco Systems, HP Inc. and Lenovo. There can be no assurance that we will continue to receive such incentives in the future.
Changes in the IT industry and/or rapid changes in technology may reduce demand for the IT hardware, software and services we sell or change who makes purchasing decisions for IT hardware, software and services. Our results of operations are influenced by a variety of factors, including the condition of the IT industry, shifts in demand for, or availability of, IT hardware, software, peripherals and services, and industry innovation and the introduction of new products. The IT industry is characterized by rapid technological change and the frequent introduction of new products and changing delivery channels and models, which can decrease demand for current products and services and can disrupt purchasing patterns. If we fail to react in a timely manner to such changes, we may experience lower sales and, with respect to hardware, we may have to record write-downs of obsolete inventory. In addition, in order to satisfy client demand, protect ourselves against product shortages, obtain greater purchasing discounts and react to changes in original equipment manufacturers’ terms and conditions, we may decide to carry inventory of products that may have limited or no return privileges. There can be no assurance that we will be able to avoid losses related to inventory obsolescence on these products. Additionally, if purchasing power within our clients shifts from centralized procurement functions to business units or individual end users and we are unable to react timely to any such changes, these shifts in purchasing power could have a material adverse effect on our business, financial conditions and results of operations.
11
Table of Contents
INSIGHT ENTERPRISES, INC.
The cloud and “as-a-service” models are transforming the IT market and introducing new products, services and competitors to the market. In many cases, these new distribution models allow enterprises to obtain the benefits of commercially licensed, internally operated software with less complexity and lower initial set-up, operational and licensing costs, which increases competition for us. There can be no assurance that we will be able to adapt to, or compete effectively with, current or future distribution channels or competitors or that the competitive pressures we face will not have a material adverse effect on our business, financial condition and results of operations.
The integration and operation of acquired businesses may disrupt our business and create additional expenses, and we may not achieve the anticipated benefits of the acquisitions. Integration of an acquired business involves numerous risks, including assimilation of operations of the acquired business and difficulties in the convergence of IT systems, the diversion of management’s attention from other business concerns, risks of entering markets in which we have had no or only limited direct experience, assumption of unknown or unquantifiable liabilities, the potential loss of key teammates and/or clients, difficulties in completing strategic initiatives already underway in the acquired company, and unfamiliarity with partners of the acquired company, each of which could have a material adverse effect on our business, results of operations and financial condition. The continued integration activities of the acquired businesses into our business is difficult and time consuming, and we may be unable to achieve expected synergies and operating efficiencies over the long term. We cannot assure that these risks or other unforeseen factors will not offset the intended benefits of the acquisitions, in whole or in part.
Our future operating results may fluctuate significantly. Our operating results are highly dependent upon our level of gross profit as a percentage of net sales, which fluctuates due to numerous factors, including changes in prices from partners, changes in the amount and timing of partner funding, volumes of purchases, changes in client mix, management of our cash conversion cycle, the relative mix of products and services sold during the period, general competitive conditions, and strategic product and services pricing and purchasing actions. As a result of significant price competition and our higher concentration of large enterprise clients, our gross margins are low, and we expect them to continue to be low in the future. Increased competition arising from industry consolidation and low demand for certain IT products and services may hinder our ability to maintain or improve our gross margins. These low gross margins magnify the impact of variations in revenue and operating costs on our operating results. In addition, our expense levels are based, in part, on anticipated net sales and the anticipated amount and timing of partner funding, and a portion of our operating expenses is relatively fixed. Therefore, we may not be able to reduce spending quickly enough to compensate for any unexpected net sales shortfall, and we may not be able to reduce our operating expenses as a percentage of revenue to mitigate any further reductions in gross margins in the future. If we cannot proportionately decrease our cost structure, our business, financial condition and results of operations could suffer. In addition, a reduction in the amount of credit granted to us by our partners could increase our need for and cost of working capital and have a material adverse effect on our business, financial condition and results of operations.
There are risks associated with our international operations that are different than the risks associated with our operations in the United States, and our exposure to the risks of a global market could hinder our ability to maintain and expand international operations. Outside of the United States, we have operation centers in Australia, Canada, France, Germany and the United Kingdom, as well as sales offices throughout EMEA and APAC. In the regions in which we do not currently have a physical presence, we serve our clients through strategic relationships. In implementing our international strategy, we may face barriers to entry and competition from local companies and other companies that already have established global businesses, as well as the risks generally associated with conducting business internationally. The success and profitability of international operations are subject to numerous risks and uncertainties, many of which are outside of our control, such as:
| • | political or economic instability; |
12
Table of Contents
INSIGHT ENTERPRISES, INC.
| • | changes in governmental regulation or taxation (foreign and domestic); |
| • | currency exchange fluctuations; |
| • | changes in import/export laws, regulations and customs and duties (foreign and domestic); |
| • | trade restrictions (foreign and domestic); |
| • | difficulties of conducting business, managing operations, and costs of staffing in certain foreign countries; |
| • | work stoppages or other changes in labor conditions; |
| • | taxes and other restrictions on repatriating foreign profits back to the United States; |
| • | extended payment terms; |
| • | seasonal reductions in business activity in some parts of the world; and |
| • | natural disasters, terrorism, civil unrest and other geopolitical uncertainties. |
In addition, changes in policies and/or laws of the United States or foreign governments, including data privacy restrictions, resulting in, among other changes, higher taxation, tariffs or similar protectionist laws, currency conversion limitations, limitations on business operations, or the nationalization of private enterprises could reduce the anticipated benefits of international operations and could have a material adverse effect on our business, financial condition and results of operations.
We have currency exposure arising from both sales and purchases denominated in foreign currencies, including intercompany transactions outside the United States, and we currently conduct limited hedging activities. In addition, some currencies may be subject to limitations on conversion into other currencies, which can limit the ability to otherwise react to rapid foreign currency devaluations. We cannot predict with precision the effect of future exchange-rate fluctuations, and significant rate fluctuations could have a material adverse effect on our business, financial condition and results of operations.
International operations also expose us to currency fluctuations as we translate the financial statements of our foreign operations to U.S. dollars.
General economic conditions, including unfavorable economic conditions in a particular region, business or industry sector, may lead our clients to delay or forgo investments in IT hardware, software and services. Weak economic conditions generally or any broad-based reduction in IT spending adversely affects our business, operating results and financial condition. A prolonged slowdown in the global economy or similar crisis, or in a particular region or business or industry sector, or tightening of credit markets, could cause our clients to have difficulty accessing capital and credit sources, delay contractual payments, or delay or forgo decisions to upgrade or add to their existing IT environments, license new software or purchase products or services (particularly with respect to discretionary spending for hardware, software and services). Such events could have a material adverse effect on our business, financial condition and results of operations. Economic or industry downturns could result in longer payment cycles, increased collection costs and defaults in excess of our expectations. A significant deterioration in our ability to collect on accounts receivable could also impact the cost or availability of financing under our accounts receivable securitization program.
Our sales to our public sector customers are also impacted by government spending policies, budget priorities and revenue levels. An adverse change in government spending policies (including budget cuts at the federal, state and local level), budget priorities or revenue levels could cause our public sector customers to reduce their purchases or to terminate or not renew their contracts with us. These possible actions or the adoption of new or modified procurement regulations or practices could have a material adverse effect our business, financial position and results of operations.
In addition, there continues to be substantial uncertainty regarding the impact of the Referendum on the United Kingdom’s Membership in the European Union (“EU”) (referred to as “Brexit”), advising for the exit of the United Kingdom from the EU. Potential adverse consequences of Brexit such as global market uncertainty, volatility in currency exchange rates, greater restrictions on imports and exports between the United Kingdom and EU countries and increased regulatory complexities could have a negative impact on our business, financial condition and results of operations.
13
Table of Contents
INSIGHT ENTERPRISES, INC.
The acquisition of Datalink has increased our outstanding debt and interest expense and decreased the availability under our financing facilities, all of which could have a material adverse effect on our results of operations and financial condition. To fund our acquisition of Datalink in January 2017, we increased our borrowings under our senior revolving credit facility in the form of an incremental Term Loan A. These additional borrowings will have the effect of increasing our 2018 interest expense and require escalating amortization payments with a balloon payment in 2021. Additionally, our financing facilities have interest rates that vary based on market conditions and on our leverage ratio, which increases our exposure to interest rate fluctuations and may result in greater interest expense than we have forecasted.
Our financing facilities contain various covenants that we must comply with in order to avoid an occurrence of an event of default. The covenants include limitations on the payment of dividends and the requirement that we comply with maximum leverage and minimum fixed charge ratio requirements, comply with a minimum receivables requirement and meet monthly, quarterly and annual reporting requirements. Our ability to maintain compliance with our financial covenants and to make scheduled payments on our financing facilities depends on our financial and operating performance. If we were unable to maintain compliance or to repay the borrowed amounts, the lenders under our financing facilities could declare an event of default and demand payment within a specified period of time.
Breaches in the security of our electronic and other confidential information could materially adversely affect our financial condition and results of operations. We are dependent upon automated information technology processes. Privacy, security, and compliance concerns have continued to increase as technology has evolved to facilitate commerce and as cross-border commerce increases. As part of our normal business activities, we collect and store certain confidential information, including information about teammates and information about partners and clients which may be entitled to protection under a number of regulatory regimes. In the course of normal and customary business practice, we may share some of this information with vendors who assist us with certain aspects of our business. Moreover, the success of our operations depends upon the secure transmission of confidential and personal data over public networks, including the use of cashless payments. Any failure on the part of us or our vendors to maintain the security of data we are required to protect, including via the penetration of our network security and the misappropriation of confidential and personal information, could result in business disruption, damage to our reputation, financial obligations to third parties, fines, penalties, regulatory proceedings and private litigation with potentially large costs, and also result in deterioration in our teammates’, partners’ and clients’ confidence in us and other competitive disadvantages, and thus could have a material adverse effect on our business, financial condition and results of operations. In the past, we have been subject to information security attacks. Although we do not believe the attacks resulted in the misappropriation of sensitive data, we have been, and expect to continue to be, subject to electronic data attacks and threats. Additionally, some of the hardware and software products we resell could have defects or otherwise be the subject of security breaches and other attacks. We would consider the consequences of such attacks to be the responsibility of the respective manufacturers and publishers of such products, however, if such circumstances were to arise, we could be subject to litigation.
Disruptions in our IT systems and voice and data networks could affect our ability to service our clients and cause us to incur additional expenses. We believe that our success to date has been, and future results of operations will be, dependent in large part upon our ability to provide prompt and efficient service to our clients. Our ability to provide that level of service is largely dependent on the ease of use, accuracy, quality and utilization of our IT systems, which affects our ability to manage our sales, client service, distribution, inventories and accounting systems, and the reliability of our voice and data networks and managed services offerings. If our current technology is determined to have a shorter useful life or the value of our current system is impaired, we could incur additional depreciation expense and/or impairment charges. The continuing development of our IT systems is crucial for our success. Accordingly, some of our IT systems are subject to ongoing IT projects designed to streamline or optimize the information systems. There is no guarantee that we will be successful in these efforts at all times or that there will not be implementation or integration difficulties. In addition, a substantial interruption in our IT systems or in our voice and data networks, however caused, could occur and could have a material adverse effect on our business, financial condition and results of operations.
14
Table of Contents
INSIGHT ENTERPRISES, INC.
The failure to comply with the terms and conditions of our commercial and public sector contracts could result in, among other things, damages, fines or other liabilities. Sales to commercial clients are based on stated contractual terms, the terms and conditions on our website or terms contained in purchase orders on a transaction by transaction basis. Sales to public sector clients are derived from sales to federal, state and local governmental departments and agencies, as well as to educational institutions, through open market sales and various contracts and programs. Noncompliance with contract terms, particularly to highly regulated public sector clients, or with government procurement regulations and other requirements could result in fines or penalties against us or termination of contracts, and, in the public sector, could also result in civil, criminal, and administrative liability. With respect to our public sector clients, the government’s remedies may include suspension or debarment. In addition, almost all of our contracts have default provisions, and substantially all of our contracts in the public sector are terminable at any time for convenience of the contracting agency.
We are exposed to risks from legal proceedings and client audits and failure to comply with the laws and regulations applicable to our operations could adversely impact our business, results of operations or cash flows. We are party to various legal proceedings that arise in the ordinary course of our business, which include commercial, employment, tort and other litigation. Because of our significant sales to governmental entities, we also are subject to audits by federal, state, international, national, provincial and local authorities in the ordinary course of our business. We also are subject to audits by various vendor partners and large customers, including government agencies, relating to purchases and sales under various contracts. In addition, we are subject to indemnification claims under various contracts. Current and future litigation, infringement claims, governmental proceedings and investigations, audits or indemnification claims that we face may result in substantial costs and expenses and significantly divert the attention of our management regardless of the outcome. Additionally, our operations are subject to numerous U.S. and foreign laws and regulations in a number of areas including areas of labor and employment, advertising, e-commerce, tax, import and export requirements, anti-corruption, data privacy requirements, anti-competition, and environmental, health, and safety. Compliance with these laws, regulations and similar requirements may be onerous and expensive, and they may be inconsistent from jurisdiction to jurisdiction, further increasing the cost of compliance and doing business, and the risk of noncompliance. We have implemented policies and procedures designed to help ensure compliance with applicable laws and regulations, but there can be no guarantee against teammates, contractors, or agents violating such laws and regulations or our policies and procedures.
We are exposed to accounts receivable risks. We extend credit to our customers for a significant portion of our net sales, typically on 30-day payment terms. We are subject to the risk that our customers may not pay for the products they have purchased, or may pay at a slower rate than we have historically experienced, the risk of which is heightened during periods of economic downturn or uncertainty or, in the case of public sector customers, during periods of budget constraints.
We rely on independent shipping companies for delivery of products and are subject to price increases or service interruptions from these carriers. We generally ship hardware products to our customers by FedEx, United Parcel Service and other commercial delivery services and invoice customers for delivery charges. If we are unable to pass on to our clients future increases in the cost of commercial delivery services, our profitability could be adversely affected. Additionally, strikes, inclement weather, natural disasters or other service interruptions by such shippers could adversely affect our ability to deliver products on a timely basis. Such events could have a material adverse effect on our business, financial condition and results of operations.
We depend on certain key personnel. We rely on key management teammates to execute our strategy to grow profitable market share. The loss of one or more of these leaders, or a failure to attract and retain new executives, could have a material adverse effect on our business, financial condition and results of operations. We also believe that our future success will be largely dependent on our ability to attract and retain highly qualified management, sales, service and technical teammates, and we make significant investments in the training of our sales account executives, architects and services engineers. If we are not able to retain such personnel or to train them quickly enough to meet changing market conditions, we could experience a drop in the overall quality and efficiency of our sales and services teammates, and that could have a material adverse effect on our business, financial condition and results of operations.
15
Table of Contents
INSIGHT ENTERPRISES, INC.
A natural disaster or other adverse occurrence at one of our primary facilities or customer data centers could damage our business. We have warehouse and distribution facilities in the United States and Canada and in the United Kingdom and Germany. If the warehouse and distribution equipment at one of our distribution centers were to be seriously damaged by a natural disaster or other adverse occurrence, we could utilize another distribution center or third-party distributors to ship products to our customers. However, this may not be sufficient to avoid interruptions in our service and may not enable us to meet all of the needs of our customers and would cause us to incur incremental operating costs. In addition, we operate customer data centers and numerous sales offices which may contain both business-critical data and confidential information of our customers. A natural disaster or other adverse occurrence at any of the customer data centers or at any of our major sales offices could negatively impact our business, results of operations or cash flows.
Changes in, interpretations of, or enforcement trends related to tax rules and regulations may adversely affect our effective income tax rates or operating margins and we may be required to pay additional tax assessments. We conduct business globally and file tax returns in various U.S. and foreign tax jurisdictions. Our effective income tax rate could be adversely affected by various factors, many of which are outside of our control, including:
| • | changes in pre-tax income in various jurisdictions in which we operate that have differing statutory tax rates; |
| • | increases in corporate tax rates and the availability of deductions or credits in the United States and elsewhere; |
| • | changes in tax laws, regulations, and/or interpretations of such tax laws in multiple jurisdictions; |
| • | tax effects related to purchase accounting for acquisitions; and |
| • | resolutions of issues arising from tax examinations and any related interest or penalties. |
On December 22, 2017, the U.S. government enacted comprehensive federal tax legislation commonly referred to as the Tax Cuts and Jobs Act of 2017 (the “Tax Act”). The Tax Act makes changes to the U.S. corporate tax rate, business-related deductions and taxation of foreign earnings, among others, that will generally be effective for taxable years beginning after December 31, 2017. By reducing the tax rate, these changes have reduced the value of our net U.S. deferred tax assets, resulting in a significant one-time charge in the current tax year. We are continuing to evaluate the Tax Act and its requirements, as well as its application to our business and its impact on our effective tax rate. At this point, it is unclear how many U.S. states will incorporate these federal law changes, or portions thereof, into their local laws. Our implementation of new practices and processes designed to comply with, and benefit from, the Tax Act and its rules and regulations could require us to make substantial changes to our business practices.
The determination of our worldwide provision for income taxes and other tax liabilities requires estimation, judgment and complex calculations in situations where the ultimate tax determination may not be certain. Our determination of tax liabilities is always subject to review or examination by tax authorities in various jurisdictions. Any adverse outcome of such review or examination could have a material adverse effect on our financial condition and results of operations.
We may not be able to protect our intellectual property adequately, and we may be subject to intellectual property infringement claims. To protect our intellectual property, we rely on copyright, trademark and trade secret laws, unpatented proprietary know-how, and patents, as well as confidentiality, invention assignment, non-solicitation and non-competition agreements. There can be no assurance that these measures will afford us sufficient protection of our intellectual property, and it is possible that third parties may copy or otherwise obtain and use our proprietary information without authorization or otherwise infringe on our intellectual property rights. The disclosure of our trade secrets could impair our competitive position and could have a material adverse effect on our business, financial condition and results of operations. In addition, our registered trademarks and trade names are subject to challenge by third parties. This may affect our ability to continue using those marks and names. Likewise, many businesses are actively investing in, developing and seeking protection for intellectual property in the areas of search, indexing, e-commerce and other Web-related technologies, as well as a variety of on-line business models and methods, all of which are in addition to traditional research and development efforts for IT products and application software, and non-practicing entities continue to invest in acquiring patent portfolios for the purpose of turning the portfolios into income-generating assets, whether through licensing campaigns or litigation. If there is a determination that we have infringed the proprietary rights of others, we could incur substantial monetary liability, be forced to stop selling infringing products or providing infringing services, be required to enter into costly royalty or licensing agreements, if available, or be prevented from using the rights, which could force us to change our business practices or hardware, software or services offerings in the future. These types of claims and challenges could have a material adverse effect on our business, financial condition and results of operations.
16
Table of Contents
INSIGHT ENTERPRISES, INC.
| Item 1B. | Unresolved Staff Comments |
Not applicable.
| Item 2. | Properties |
Our principal executive offices are located in Tempe, Arizona. We believe that our facilities are suitable and adequate for our present purposes, and we anticipate that we will be able to extend our existing leases on terms satisfactory to us or, if necessary, to locate substitute facilities on acceptable terms. At December 31, 2017, we owned or leased approximately 1.4 million square feet of office and warehouse space, and, while approximately 69% of the square footage is in the United States, we own or lease office and warehouse facilities in Canada and in 10 countries in EMEA and we lease office facilities in five countries in APAC.
Information about significant sales, distribution, services and administration facilities in use as of December 31, 2017 is summarized in the following table:
| Operating Segment |
Location |
Primary Activities |
Own or Lease | |||
| North America |
Tempe, Arizona, USA | Executive Offices, Sales and Administration and Network Operations Center | Own | |||
| Tempe, Arizona, USA | Client Support Center | Own | ||||
| Addison, Illinois, USA | Sales and Administration | Lease | ||||
| Eden Prairie, Minnesota, USA | Sales, Services and Administration | Lease | ||||
| Hanover Park, Illinois, USA | Services, Distribution and Administration | Lease | ||||
| Plano, Texas, USA | Sales and Administration | Lease | ||||
| Austin, Texas, USA | Sales and Administration | Lease | ||||
| Liberty Lake, Washington, USA | Sales and Administration | Lease | ||||
| Tampa, Florida, USA | Sales and Administration | Lease | ||||
| Conway, Arkansas, USA | Sales and Administration | Lease | ||||
| Winnipeg, Manitoba, Canada | Sales and Administration | Lease | ||||
| Montreal, Quebec, Canada | Sales and Administration | Own | ||||
| Montreal, Quebec, Canada | Distribution | Lease | ||||
| EMEA |
Sheffield, United Kingdom | Sales and Administration | Own | |||
| Sheffield, United Kingdom | Distribution | Lease | ||||
| Uxbridge, United Kingdom | Sales and Administration | Lease | ||||
| Garching, Germany | Sales and Administration | Lease | ||||
| Frankfurt, Germany | Sales and Administration | Lease | ||||
| Frankfurt, Germany | Distribution | Lease | ||||
| Vélizy, France | Sales and Administration | Lease | ||||
| APAC |
Sydney, New South Wales, Australia | Sales and Administration | Lease | |||
| Perth, Australia | Sales and Administration | Lease | ||||
In addition to those listed above, we have leased sales offices in various cities across North America, EMEA and APAC. These properties are not included in the table above. Substantially all of our owned properties secure our senior revolving credit facility (“revolving facility”). A portion of the client support center that we own in Tempe, Arizona included in the table above is currently leased to Revana, formerly known as Direct Alliance Corporation, a discontinued operation that was sold to a third party in 2006. For additional information on operating leases, see Note 7 to the Consolidated Financial Statements in Part II, Item 8 of this report.
17
Table of Contents
INSIGHT ENTERPRISES, INC.
| Item 3. | Legal Proceedings |
For a discussion of legal proceedings, see “Legal Proceedings” in Note 17 to the Consolidated Financial Statements in Part II, Item 8 of this report, which is incorporated by reference herein.
| Item 4. | Mine Safety Disclosures |
Not applicable.
18
Table of Contents
INSIGHT ENTERPRISES, INC.
| Item 5. | Market for Registrant’s Common Equity, Related Stockholder Matters and Issuer Purchases of Equity Securities |
Market Information
Our common stock trades under the symbol “NSIT” on The Nasdaq Global Select Market. The following table shows, for the calendar quarters indicated, the high and low sales prices per share for our common stock as reported on The Nasdaq Global Select Market.
| Common Stock | ||||||||
| Year 2017 | High Price | Low Price | ||||||
| Fourth Quarter |
$ | 46.68 | $ | 35.26 | ||||
| Third Quarter |
47.95 | 37.91 | ||||||
| Second Quarter |
53.19 | 39.67 | ||||||
| First Quarter |
46.00 | 35.44 | ||||||
| Year 2016 |
||||||||
| Fourth Quarter |
$ | 41.81 | $ | 28.15 | ||||
| Third Quarter |
32.77 | 24.23 | ||||||
| Second Quarter |
29.39 | 23.31 | ||||||
| First Quarter |
28.96 | 18.26 | ||||||
As of February 15, 2018, we had 35,836,320 shares of common stock outstanding held by 56 stockholders of record. This figure does not include an estimate of the number of beneficial holders whose shares are held of record by brokerage firms and clearing agencies.
We have never paid a cash dividend on our common stock, and we currently do not intend to pay any cash dividends in the foreseeable future. Our revolving facility and our accounts receivable securitization financing facility contain restrictions on the payment of cash dividends.
Issuer Purchases of Equity Securities
We did not repurchase shares of our common stock during the quarter ended December 31, 2017.
See further information on our share repurchase programs in Note 16 to the Consolidated Financial Statements in Part II, Item 8 of this report.
19
Table of Contents
INSIGHT ENTERPRISES, INC.
Stock Price Performance Graph
Set forth below is a graph comparing the percentage change in the cumulative total stockholder return on our common stock with the cumulative total return of the Nasdaq US Benchmark TR Index (Market Index) and the Nasdaq US Benchmark Computer Hardware TR Index (Industry Index). The graph assumes that $100 was invested on December 31, 2012 in our common stock and in each of the two Nasdaq indices, and that, as to such indices, dividends were reinvested. We have not, since our inception, paid any cash dividends on our common stock. Historical stock price performance shown on the graph is not necessarily indicative of future price performance.
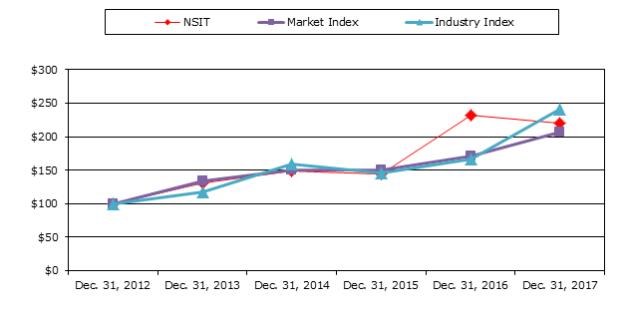
| Dec. 31, 2012 |
Dec. 31, 2013 |
Dec. 31, 2014 |
Dec. 31, 2015 |
Dec. 31, 2016 |
Dec. 31, 2017 |
|||||||||||||||||||
| Insight Enterprises, Inc. Common Stock (NSIT) |
$ | 100.00 | $ | 130.74 | $ | 149.05 | $ | 144.62 | $ | 232.82 | $ | 220.44 | ||||||||||||
| Nasdaq US Benchmark TR Index (Market Index) |
100.00 | 133.48 | 150.12 | 150.84 | 170.46 | 206.91 | ||||||||||||||||||
| Nasdaq US Benchmark Computer Hardware TR Index (Industry Index) |
100.00 | 117.65 | 159.48 | 145.20 | 167.36 | 240.72 | ||||||||||||||||||
20
Table of Contents
INSIGHT ENTERPRISES, INC.
| Item 6. | Selected Financial Data |
The following selected consolidated financial data should be read in conjunction with our Consolidated Financial Statements and the Notes thereto in Part II, Item 8 and “Management’s Discussion and Analysis of Financial Condition and Results of Operations” in Part II, Item 7 of this report. The selected consolidated financial data presented below under the captions “Consolidated Statements of Operations Data” and “Consolidated Balance Sheet Data” as of and for each of the years in the five-year period ended December 31, 2017 is derived from our audited consolidated financial statements. The consolidated financial statements as of December 31, 2017 and 2016, and for each of the years in the three-year period ended December 31, 2017, which have been audited by KPMG LLP, our independent registered public accounting firm, are included in Part II, Item 8 of this report.
| Years Ended December 31, | ||||||||||||||||||||
| 2017 | 2016 | 2015 | 2014 | 2013 | ||||||||||||||||
| (in thousands, except per share data) | ||||||||||||||||||||
| Consolidated Statements of Operations Data (1) |
||||||||||||||||||||
| Net sales |
$ | 6,703,623 | $ | 5,485,515 | $ | 5,373,090 | $ | 5,316,229 | $ | 5,144,347 | ||||||||||
| Costs of goods sold |
5,785,053 | 4,742,413 | 4,656,758 | 4,603,826 | 4,445,460 | |||||||||||||||
|
|
|
|
|
|
|
|
|
|
|
|||||||||||
| Gross profit |
918,570 | 743,102 | 716,332 | 712,403 | 698,887 | |||||||||||||||
| Operating expenses: |
||||||||||||||||||||
| Selling and administrative expenses |
723,328 | 585,243 | 584,906 | 576,967 | 564,910 | |||||||||||||||
| Severance and restructuring expenses |
9,002 | 4,580 | 4,907 | 4,433 | 12,740 | |||||||||||||||
| Loss on sale of foreign entity |
3,646 | — | — | — | — | |||||||||||||||
| Acquisition-related expenses |
3,329 | 4,447 | — | — | — | |||||||||||||||
|
|
|
|
|
|
|
|
|
|
|
|||||||||||
| Earnings from operations |
179,265 | 148,832 | 126,519 | 131,003 | 121,237 | |||||||||||||||
| Non-operating (income) expense: |
||||||||||||||||||||
| Interest income |
(1,209 | ) | (1,066 | ) | (783 | ) | (1,062 | ) | (1,230 | ) | ||||||||||
| Interest expense |
19,174 | 8,628 | 7,224 | 6,019 | 6,337 | |||||||||||||||
| Net foreign currency exchange loss (gain) |
855 | 522 | (393 | ) | 327 | 194 | ||||||||||||||
| Other expense, net |
1,347 | 1,290 | 1,295 | 1,347 | 1,412 | |||||||||||||||
|
|
|
|
|
|
|
|
|
|
|
|||||||||||
| Earnings before income taxes |
159,098 | 139,458 | 119,176 | 124,372 | 114,524 | |||||||||||||||
| Income tax expense |
68,415 | 54,768 | 43,325 | 48,688 | 43,503 | |||||||||||||||
|
|
|
|
|
|
|
|
|
|
|
|||||||||||
| Net earnings |
$ | 90,683 | $ | 84,690 | $ | 75,851 | $ | 75,684 | $ | 71,021 | ||||||||||
|
|
|
|
|
|
|
|
|
|
|
|||||||||||
| Net earnings per share: |
||||||||||||||||||||
| Basic |
$ | 2.54 | $ | 2.35 | $ | 2.00 | $ | 1.84 | $ | 1.65 | ||||||||||
|
|
|
|
|
|
|
|
|
|
|
|||||||||||
| Diluted |
$ | 2.50 | $ | 2.32 | $ | 1.98 | $ | 1.83 | $ | 1.64 | ||||||||||
|
|
|
|
|
|
|
|
|
|
|
|||||||||||
| Shares used in per share calculations: |
||||||||||||||||||||
| Basic |
35,741 | 36,102 | 37,984 | 41,062 | 43,012 | |||||||||||||||
|
|
|
|
|
|
|
|
|
|
|
|||||||||||
| Diluted |
36,207 | 36,438 | 38,275 | 41,358 | 43,289 | |||||||||||||||
|
|
|
|
|
|
|
|
|
|
|
|||||||||||
21
Table of Contents
INSIGHT ENTERPRISES, INC.
| December 31, | ||||||||||||||||||||
| 2017 | 2016 | 2015 | 2014 | 2013 | ||||||||||||||||
| (in thousands) | ||||||||||||||||||||
| Consolidated Balance Sheet Data |
||||||||||||||||||||
| Working capital |
$ | 804,369 | $ | 544,943 | $ | 543,534 | $ | 565,559 | $ | 526,423 | ||||||||||
| Total assets |
2,685,651 | 2,219,300 | 2,014,017 | 1,947,838 | 1,868,611 | |||||||||||||||
| Short-term debt, including capital leases and other financing obligations(2) |
16,592 | 480 | 1,535 | 766 | 217 | |||||||||||||||
| Long-term debt, including capital leases and other financing obligations(2) |
296,576 | 40,251 | 89,000 | 62,535 | 66,949 | |||||||||||||||
| Stockholders’ equity |
843,469 | 713,443 | 685,742 | 721,231 | 716,918 | |||||||||||||||
| Cash dividends declared per common share |
— | — | — | — | — | |||||||||||||||
| (1) | Our consolidated statements of operations data includes results of the following acquisitions from their respective dates of acquisition: Caase.com from September 26, 2017, Datalink from January 6, 2017, Ignia from September 1, 2016 and BlueMetal from October 1, 2015. |
| (2) | Excludes obligations under our inventory financing facility of $319.5 million, $154.9 million, $106.3 million, $122.8 million and $115.3 million as of December 31, 2017, 2016, 2015, 2014 and 2013, respectively. We do not include these obligations in total debt because we have not in the past incurred, and in the future do not expect to incur, any interest payments due under this facility. These amounts are classified separately as accounts payable-inventory financing facility on our consolidated balance sheets. See Note 5 to the Consolidated Financial Statements in Part II, Item 8 of this report. |
22
Table of Contents
INSIGHT ENTERPRISES, INC.
MANAGEMENT’S DISCUSSION AND ANALYSIS OF FINANCIAL CONDITION
AND RESULTS OF OPERATIONS
| Item 7. | Management’s Discussion and Analysis of Financial Condition and Results of Operations |
The following discussion and analysis of our financial condition and results of our operations should be read in conjunction with the Consolidated Financial Statements and notes thereto included in Part II, Item 8 of this report. Our actual results could differ materially from those contained in forward-looking statements due to a number of factors, including those discussed in “Risk Factors” in Part I, Item 1A and elsewhere in this report. Additionally, any references to our “core” business exclude Datalink’s results subsequent to the Datalink acquisition.
Overview
We are a Fortune 500 global IT provider helping businesses of all sizes – from small and medium sized firms to worldwide enterprises, governments, schools and health care organizations – define, architect, implement and manage Intelligent Technology SolutionsTM in North America; Europe, the Middle East and Africa (“EMEA”); and Asia-Pacific (“APAC”). We empower our clients to manage their IT environments so they can drive meaningful business outcomes today and transform their operations for tomorrow. Our offerings in North America and certain countries in EMEA and APAC include hardware, software and services. Our offerings in the remainder of our EMEA and APAC segments are largely software and certain software-related services.
Full year 2017 financial and operational highlights included the following:
| • | In North America: |
| • | We completed the acquisition of Datalink on January 6, 2017 and completed the IT systems and back office integration activities by mid-year. We achieved expense synergies ahead of our expectations and are pleased with the overall financial results of the business in its first year as part of Insight; |
| • | We gained hardware market share from competitors according to third-party data, reflecting strong growth in data center solutions as well as devices; and |
| • | We continued our focus on tight expense control across the business. |
| • | In EMEA: |
| • | We continued to transform into a cloud and solutions business, invested in technical and pre-sales and service delivery teammates focused on cloud technologies and grew our services sales by 15%; |
| • | We sold our non-strategic business in Russia; |
| • | We were named #1 in Microsoft Azure consumption in the region for 2017; and |
| • | We acquired Caase.com in the third quarter, which further enhances our technical capabilities around Office 365 and Azure in the region. |
| • | In APAC: |
| • | We generated double digit gross profit growth; and |
| • | We invested significantly to support cloud and services sales in Australia, which we expect will improve our growth trends in 2018. |
On a consolidated basis, for the year ended December 31, 2017, our net sales of $6.7 billion increased 22% compared to 2016. This increase reflects growth of 20% in our core business and the addition of Datalink to our results of operations beginning January 6, 2017. As a result, for the first time in the Company’s history, net sales from the provision of services approximated 10%. Our gross profit increased faster than sales, increasing by 24%, or $175.5 million, compared to 2016, also up 24% year over year excluding the effects of fluctuating foreign currency exchange rates. Consolidated gross margin improved approximately 20 basis points to 13.7% of net sales in 2017. This increase reflects solid growth in net sales and gross profit in our core business combined with the addition of Datalink. Selling and administrative expenses increased $138.1 million, or 24%, in 2017 compared to 2016. The year over year change reflects the addition of Datalink and an increase of 5% in selling and administrative expenses in our core business. We reported earnings from operations of $179.3 million in 2017, an increase of 20% compared to the prior year, which represented 2.7% of net sales, consistent with the prior year. Our effective tax rate in 2017 was 43.0%, driven by the effects of U.S. federal tax reform enacted in December 2017. This higher tax rate in 2017 compares to our effective tax rate of 39.3% in 2016 and 36.4% in 2015. Net earnings and diluted net earnings per share were $90.7 million and $2.50, respectively, in 2017. In 2016, we reported net earnings of $84.7 million and diluted net earnings per share of $2.32. In 2015, we reported net earnings of $75.9 million and diluted net earnings per share of $1.98.
23
Table of Contents
INSIGHT ENTERPRISES, INC.
MANAGEMENT’S DISCUSSION AND ANALYSIS OF FINANCIAL CONDITION
AND RESULTS OF OPERATIONS (continued)
The results of operations for 2017 include the following items:
| • | the results of the acquisitions of Caase.com and Datalink, from their respective acquisition dates; |
| • | the loss on the sale of our Russia business totaling $3.6 million; |
| • | transaction costs totaling $3.3 million, $2.5 million net of tax, associated with the acquisitions of Caase.com and Datalink; |
| • | severance and restructuring expenses of $9.0 million, $7.3 million net of tax; and |
| • | incremental income tax expense related to U.S. federal tax reform of $13.4 million. |
The results of operations for 2016 include the following items:
| • | the results of the acquisition of Ignia effective September 1, 2016; |
| • | transaction costs totaling $4.4 million, $4.2 million net of tax, associated with the acquisitions of Ignia and Datalink; |
| • | severance and restructuring expenses of $4.6 million, $3.3 million net of tax; |
| • | a gain of $338,000 on the sale of our Bloomingdale, Illinois real estate; and |
| • | the repurchase of approximately 1.9 million shares of the Company’s common stock for $50 million. |
The results of operations for 2015 include the following items:
| • | the results of the acquisition of BlueMetal effective October 1, 2015; |
| • | severance and restructuring expenses of $4.9 million, $4.3 million net of tax; |
| • | an impairment loss of $800,000 to further reduce the carrying amount of our previously owned real estate in Bloomingdale, Illinois to its estimated fair value less costs to sell; and |
| • | the repurchase of approximately 3.3 million shares of the Company’s common stock for $91.8 million. |
Throughout the “Overview” and “Results of Operations” sections of “Management’s Discussion and Analysis of Financial Condition and Results of Operations,” we refer to changes in net sales, gross profit, selling and administrative expenses and earnings from operations on a consolidated basis and in North America, EMEA and APAC excluding the effects of fluctuating foreign currency exchange rates. In computing these amounts and percentages, we compare the current period amount as translated into U.S. dollars under the applicable accounting standards to the prior period amount in local currency translated into U.S. dollars utilizing the weighted average translation rate for the current period.
Net of tax amounts referenced above were computed using the statutory tax rate for the taxing jurisdictions in the operating segment in which the related expenses were recorded, adjusted for the effects of valuation allowances on net operating losses in certain jurisdictions.
During 2017, we used $305.4 million in operating activities, including approximately $186.9 million, net of cash and cash equivalents acquired, utilized to fund the acquisitions of Datalink and Caase.com. We ended the year with $105.8 million of cash and cash equivalents and $307.9 million of debt outstanding under our long-term debt facilities.
Details about segment results of operations can be found in Note 20 to the Consolidated Financial Statements in Part II, Item 8 of this report.
Our discussion and analysis of financial condition and results of operations is intended to assist in the understanding of our consolidated financial statements, including the changes in certain key items in those consolidated financial statements from year to year and the primary factors that contributed to those changes, as well as how certain critical accounting estimates affect our consolidated financial statements.
24
Table of Contents
INSIGHT ENTERPRISES, INC.
MANAGEMENT’S DISCUSSION AND ANALYSIS OF FINANCIAL CONDITION
AND RESULTS OF OPERATIONS (continued)
Critical Accounting Estimates
General
Our consolidated financial statements have been prepared in accordance with U.S. generally accepted accounting principles (“GAAP”). For a summary of significant accounting policies, see Note 1 to the Consolidated Financial Statements in Part II, Item 8 of this report. The preparation of these consolidated financial statements requires us to make estimates and assumptions that affect the reported amounts of assets, liabilities, net sales and expenses. We base our estimates on historical experience and on various other assumptions that we believe to be reasonable under the circumstances, the results of which form the basis for making judgments about the carrying values of assets and liabilities that are not readily apparent from other sources. Actual results, however, may differ from our estimates. Members of our senior management have discussed the critical accounting estimates and related disclosures with the Audit Committee of our Board of Directors.
We consider the following to be our critical accounting estimates used in the preparation of our consolidated financial statements:
Sales Recognition
Sales are recognized when title and risk of loss are passed to the client, there is persuasive evidence of an arrangement for sale, delivery has occurred and/or services have been rendered, the sales price is fixed or determinable and collectibility is reasonably assured. Our standard sales terms are F.O.B. shipping point or equivalent, at which time title and risk of loss have passed to the client. However, because we either (i) have a general practice of covering client losses while products are in transit despite title and risk of loss contractually transferring at the point of shipment or (ii) have specifically stated F.O.B. destination contractual terms with the client, delivery is not deemed to have occurred until the point in time when the product is received by the client. We make provisions for estimated product returns that we expect to occur under our return policy based upon historical return rates.
We leverage drop-shipment arrangements with many of our partners and suppliers to deliver products to our clients without having to physically hold the inventory at our warehouses, thereby increasing efficiency and reducing costs. We recognize revenue for drop-shipment arrangements on a gross basis when the product is received by the client. We recognize revenue on a gross basis as the principal in the transaction because we control the transaction as the primary obligor for product fulfillment in the arrangement, we assume inventory risk if the product is returned by the client, we set the price of the product charged to the client, we assume credit risk for the amounts invoiced, and we work closely with our clients to determine their hardware and software specifications.
Revenue is recognized from software sales when clients acquire the right to use or copy software under license, but in no case prior to the commencement of the term of the initial software license agreement, provided that all other revenue recognition criteria have been met (i.e., evidence of the arrangement exists, the fee is fixed or determinable and collectibility of the fee is probable).
We sell certain third-party service contracts and software maintenance and cloud or software-as-a-service subscription products for which we are not the primary obligor. These sales do not meet the criteria for gross sales recognition and, thus, are recorded on a net sales recognition basis. As we enter into contracts with third-party service providers or vendors and our clients, we evaluate whether the subsequent sales of such services should be recorded as gross sales or net sales. We determine whether we act as a principal in the transaction and assume the risks and rewards of ownership or if we are simply acting as an agent or broker. Under gross sales recognition, the selling price is recorded in sales and our cost to the third-party service provider or vendor is recorded in costs of goods sold. Under net sales recognition, the cost to the third-party service provider or vendor is recorded as a reduction to sales, resulting in net sales equal to the gross profit on the transaction, and there are no costs of goods sold.
We recognize revenue for sales of services ratably over the time period over which the service will be provided if there is no discernible pattern of recognition of the cost to perform the service. Billings for such services that are made in advance of the related revenue recognized are recorded as deferred revenue and recognized as revenue ratably over the billing coverage period. Revenue from certain arrangements that allow for the use of a product or service over a period of time without taking possession of software are also accounted for ratably over the time period over which the service will be provided.
25
Table of Contents
INSIGHT ENTERPRISES, INC.
MANAGEMENT’S DISCUSSION AND ANALYSIS OF FINANCIAL CONDITION
AND RESULTS OF OPERATIONS (continued)
We recognize revenue for professional services engagements that are on a time and materials basis based upon hours incurred as the services are performed and amounts are earned. Net sales for these service engagements are not a significant portion of our consolidated net sales.
Additionally, we sell certain professional services contracts on a fixed fee basis. Revenues for fixed fee professional services contracts are recognized based on the ratio of costs incurred to total estimated costs. Net sales for these service contracts are not a significant portion of our consolidated net sales.
In certain arrangements, we may provide a combination of hardware and software products as well as services. Services that are performed by us in conjunction with hardware and software sales that are completed in our facilities prior to shipment of the product are recognized upon delivery, when title passes to the client, for the hardware sale. Net sales of services that are performed at client locations are primarily service-only contracts and are recorded as sales when the services are performed. The total consideration for an arrangement with multiple deliverables is allocated to all deliverables that represent a separate unit of accounting using the relative selling price method.
Partner Funding
We receive payments and credits from partners, including consideration pursuant to volume sales incentive programs, volume purchase incentive programs and shared marketing expense programs. Partner funding received pursuant to volume sales incentive programs is recognized as it is earned as a reduction to costs of goods sold. Partner funding received pursuant to volume purchase incentive programs is allocated as a reduction to inventories based on the applicable incentives earned from each partner and is recorded in costs of goods sold as the related inventory is sold. Partner funding received pursuant to shared marketing expense programs is recorded as it is earned as a reduction of the related selling and administrative expenses in the period the program takes place if the consideration represents a reimbursement of specific, incremental, identifiable costs. Consideration that exceeds the specific, incremental, identifiable costs is classified as a reduction of costs of goods sold. Changes in estimates of anticipated achievement levels under individual partner programs could have a material effect on our results of operations and our cash flows.
See Note 1 to the Consolidated Financial Statements in Part II, Item 8 of this report for further discussion of our accounting policies related to partner funding.
Valuation of Long-Lived Assets Including Purchased Intangible Assets and Goodwill
We review property, plant and equipment and purchased intangible assets for impairment whenever events or changes in circumstances indicate the carrying value of an asset may not be recoverable. If such events or changes in circumstances indicate a possible impairment, our asset impairment review assesses the recoverability of the assets based on the estimated undiscounted future cash flows expected to result from the use of the asset or the asset group plus net proceeds expected from disposition of the asset or the asset group (if any) and compares that value to the carrying value. Such impairment test is based on the lowest level for which identifiable cash flows are largely independent of the cash flows of other groups of assets and liabilities. If the carrying value exceeds the undiscounted future cash flows, an impairment loss is recognized for the difference between fair value and the carrying amount. This approach uses our estimates of future market growth, forecasted net sales and costs, expected periods the assets will be utilized and appropriate discount rates.
We perform an annual review of our goodwill in the fourth quarter of every year and between annual tests if an event occurs or circumstances change that would more likely than not reduce the fair value of the reporting unit below its carrying value. We continually assess whether any indicators of impairment exist, and that assessment requires a significant amount of judgment. Events or circumstances that could trigger an impairment review include a significant adverse change in legal factors or in the business climate, unanticipated competition, significant changes in the manner of our use of the acquired assets or the strategy for our overall business, significant negative industry or economic trends, significant declines in our stock price for a sustained period or significant underperformance relative to expected historical or projected future cash flows or results of operations. Any adverse change in these factors, among others, could have a significant effect on the recoverability of goodwill and could have a material effect on our consolidated financial statements.
26
Table of Contents
INSIGHT ENTERPRISES, INC.
MANAGEMENT’S DISCUSSION AND ANALYSIS OF FINANCIAL CONDITION
AND RESULTS OF OPERATIONS (continued)
The goodwill impairment test is performed at the reporting unit level. A reporting unit is an operating segment or one level below an operating segment (referred to as a “component”). A component of an operating segment is a reporting unit if the component constitutes a business for which discrete financial information is available and management of the segment regularly reviews the operating results of that component. When two or more components of an operating segment have similar economic characteristics, the components may be aggregated and deemed a single reporting unit. An operating segment shall be deemed to be a reporting unit if all of its components are similar, if none of its components is a reporting unit, or if the segment comprises only a single component. Insight has three reporting units, which are equivalent to our operating segments.
We may first perform a qualitative assessment to determine whether it is more likely than not that the fair value of a reporting unit is less than its carrying value. If it is concluded that this is the case, it is necessary to perform a quantitative goodwill impairment test. Otherwise, the goodwill impairment test is not required. In completing a quantitative test for a potential impairment of goodwill, we compare the estimated fair value of each reporting unit in which the goodwill resides to its book value, including goodwill. Management must apply judgment in determining the estimated fair value of our reporting units. Multiple valuation techniques can be used to assess the fair value of the reporting unit, including the market and income approaches. All of these techniques include the use of estimates and assumptions that are inherently uncertain. Changes in these estimates and assumptions could materially affect the determination of fair value or goodwill impairment, or both. These estimates and assumptions primarily include, but are not limited to, an appropriate control premium in excess of the market capitalization of the Company, future market growth, forecasted sales and costs and appropriate discount rates. Due to the inherent uncertainty involved in making these estimates, actual results could differ from those estimates. Management evaluates the merits of each significant assumption, both individually and in the aggregate, used to determine the fair value of the reporting units. If the estimated fair value exceeds book value, goodwill is considered not to be impaired. If the carrying amount of the reporting unit exceeds its fair value, then an impairment charge is recognized for the amount by which the carrying value exceeds the fair value. To ensure the reasonableness of the estimated fair values of our reporting units, we perform a reconciliation of our total market capitalization to the estimated fair value of all of our reporting units.
See further information on the carrying value of goodwill in Note 3 to the Consolidated Financial Statements in Part II, Item 8 of this report.
Income Taxes
In December 2017, U.S. federal tax reform was enacted as part of the Tax Act. The change in tax law required a remeasurement of our deferred tax balances. In addition, the change in tax law included provisions requiring mandatory deemed repatriation of undistributed foreign earnings. Due to the enactment date and complexities of the new law, we have not completed our accounting related to these items. In accordance with Staff Accounting Bulletin 118, issued on December 22, 2017, we have concluded that the U.S. income taxes attributable to the remeasurement of U.S. deferred income taxes, the mandatory deemed repatriation provision and the state tax effects of these items are provisional amounts.
We record a valuation allowance to reduce our deferred tax assets to the amount that is more likely than not to be realized. We consider past operating results, future market growth, forecasted earnings, historical and projected taxable income, the mix of earnings in the jurisdictions in which we operate, prudent and feasible tax planning strategies and statutory tax law changes in determining the need for a valuation allowance. If we were to determine that it is more likely than not that we would not be able to realize all or part of our net deferred tax assets in the future, an adjustment to the deferred tax assets would be charged to earnings in the period such determination is made. Likewise, if we later determine that it is more likely than not that all or part of the net deferred tax assets would be realized, then all or part of the previously provided valuation allowance would be reversed.
27
Table of Contents
INSIGHT ENTERPRISES, INC.
MANAGEMENT’S DISCUSSION AND ANALYSIS OF FINANCIAL CONDITION
AND RESULTS OF OPERATIONS (continued)
We establish liabilities for potentially unfavorable outcomes associated with uncertain tax positions taken on specific tax matters. These liabilities are based on management’s assessment of whether a tax benefit is more likely than not to be sustained upon examination by tax authorities. There may be differences between the anticipated and actual outcomes of these matters that may result in subsequent recognition or derecognition of a tax position based on all the available information at the time. If material adjustments are warranted, it could affect our effective tax rate.
Additional information about recent U.S. federal tax reform, the valuation allowance and uncertain tax positions can be found in Note 11 to the Consolidated Financial Statements in Part II, Item 8 of this report.
Contingencies
From time to time, we are subject to potential claims and assessments from third parties. We are also subject to various government agency, client and partner audits. We continually assess whether or not such claims have merit and warrant accrual. An accrual is made if it is both probable that a liability has been incurred and the amount of the loss can be reasonably estimated. Such estimates are subject to change and may affect our results of operations and our cash flows. Additional information about contingencies can be found in Note 17 to the Consolidated Financial Statements in Part II, Item 8 of this report.
RESULTS OF OPERATIONS
The following table sets forth certain financial data as a percentage of net sales for the years ended December 31, 2017, 2016 and 2015:
| 2017 | 2016 | 2015 | ||||||||||
| Net sales |
100.0 | % | 100.0 | % | 100.0 | % | ||||||
| Costs of goods sold |
86.3 | 86.5 | 86.7 | |||||||||
|
|
|
|
|
|
|
|||||||
| Gross profit |
13.7 | 13.5 | 13.3 | |||||||||
| Operating expenses: |
||||||||||||
| Selling and administrative expenses |
10.8 | 10.7 | 10.9 | |||||||||
| Severance and restructuring expenses, loss on sale of foreign entity and acquisition-related expenses |
0.2 | 0.1 | 0.0 | |||||||||
|
|
|
|
|
|
|
|||||||
| Earnings from operations |
2.7 | 2.7 | 2.4 | |||||||||
| Non-operating expense, net |
0.3 | 0.2 | 0.2 | |||||||||
|
|
|
|
|
|
|
|||||||
| Earnings before income taxes |
2.4 | 2.5 | 2.2 | |||||||||
| Income tax expense |
1.0 | 1.0 | 0.8 | |||||||||
|
|
|
|
|
|
|
|||||||
| Net earnings |
1.4 | % | 1.5 | % | 1.4 | % | ||||||
|
|
|
|
|
|
|
|||||||
During the year ended December 31, 2017, our consolidated net sales from the provision of services was approximately 10% of net sales. Accordingly, for the year ended December 31, 2017, we began reporting, on the face of our consolidated statement of operations, net sales from the provision of services and the related costs of goods sold separately from net sales of products and the related costs of goods. For comparability purposes, the presentation of net sales and costs of goods sold for the years ended December 31, 2016 and 2015 has been revised to conform to the current year presentation. These changes in presentation had no effect on previously reported total net sales, total costs of goods sold or gross profit amounts.
In conjunction with this change in presentation, because fees earned from activities reported net are considered services revenues, we reclassified certain revenue streams for which we act as the agent in the transaction to net sales from services. Previously, we included these net revenue streams within our software and, to a lesser extent, hardware sales mix categories based on the type of product being sold (e.g., fees earned for the sale of software maintenance and certain software licenses were included in software sales and fees earned for the sale of certain third-party provided training were included in hardware sales when we historically disclosed and analyzed our sales mix). For comparability purposes, the sales mix among our hardware, software and services categories for the years ended December 31, 2016 and 2015 have been reclassified to conform to the current year presentation. Such reclassifications had no effect on previously reported net sales amounts.
28
Table of Contents
INSIGHT ENTERPRISES, INC.
MANAGEMENT’S DISCUSSION AND ANALYSIS OF FINANCIAL CONDITION
AND RESULTS OF OPERATIONS (continued)
Our gross profit across the business and related to product versus services sales are, and will continue to be, impacted by partner incentives, which can change significantly in the amounts made available and the related product or services sales being incentivized by the partner. These changes could impact our results of operations to the extent we are unable to remediate and respond to them.
2017 Compared to 2016
Net Sales. Net sales increased 22%, or $1.2 billion, in 2017 compared to 2016. Net sales of products (hardware and software) increased 21% and net sales of services increased 36% in 2017 compared to 2016 (as reclassified). Our net sales by operating segment for 2017 and 2016 were as follows (dollars in thousands):
| 2017 | 2016 | % Change | ||||||||||
| North America |
$ | 5,181,734 | $ | 3,971,828 | 30 | % | ||||||
| EMEA |
1,355,416 | 1,338,560 | 1 | % | ||||||||
| APAC |
166,473 | 175,127 | (5 | %) | ||||||||
|
|
|
|
|
|
|
|||||||
| Consolidated |
$ | 6,703,623 | $ | 5,485,515 | 22 | % | ||||||
|
|
|
|
|
|
|
|||||||
Net sales in North America increased 30%, or $1.2 billion, in 2017 compared to 2016, including 17% year over year growth in our core business driven by higher volume of sales from new and existing clients, and the addition of Datalink, which reported $524.3 million in net sales in 2017. Net sales of hardware, software and services increased 37%, 14% and 40%, respectively, year over year. The improvement in net sales in the hardware category reflects higher volume of sales to large enterprise clients and was due primarily to strong growth in data center solutions as well as client devices. Strong growth in our core business was complemented by the addition of Datalink, which accounted for approximately 29% of the year over year growth in the hardware category. The increase in the software category was also affected by the acquisition of Datalink, which accounted for approximately 70% of the year over year increase. The increase in services net sales reflects the addition of Datalink to our business, offset partially by declines in technical services projects in our core business in 2017 compared to 2016. Services net sales during 2017 also reflected the continued trend toward higher sales of cloud-based offerings and a higher mix of software maintenance sales that are recorded on a net sales recognition basis, with net sales equal to the gross profit on the transaction. Our net sales by offering category for North America for 2017 and 2016 (as reclassified), were as follows (dollars in thousands):
| North America | ||||||||||||
| Sales Mix |
2017 | 2016 | % Change | |||||||||
| (As Reclassified) | ||||||||||||
| Hardware |
$ | 3,352,355 | $ | 2,454,889 | 37 | % | ||||||
| Software |
1,310,118 | 1,146,808 | 14 | % | ||||||||
| Services |
519,261 | 370,131 | 40 | % | ||||||||
|
|
|
|
|
|
|
|||||||
| $ | 5,181,734 | $ | 3,971,828 | 30 | % | |||||||
|
|
|
|
|
|
|
|||||||
In North America, fees earned from activities reported on a net basis of $270,000 and $87,984,000 that were previously reported as part of our hardware and software product categories, respectively, in 2016, were reclassified to services to conform to the current year presentation.
29
Table of Contents
INSIGHT ENTERPRISES, INC.
MANAGEMENT’S DISCUSSION AND ANALYSIS OF FINANCIAL CONDITION
AND RESULTS OF OPERATIONS (continued)
Net sales in EMEA increased 1%, or $16.9 million, in 2017 compared to 2016. Excluding the effects of fluctuating foreign currency exchange rates, net sales increased 2% in 2017 compared to 2016. Net sales of hardware and services were up 11% and 15%, respectively, year over year, while net sales of software declined 7% year to year. The increase in hardware net sales was due primarily to higher volume sales of client devices, storage and networking solutions to public sector clients. The increase in services net sales was due primarily to increased sales of license consulting services and partner delivered services to new and existing clients across the region. In addition, a higher volume of sales of software maintenance and cloud subscription products that are recorded on a net sales recognition basis, with net sales equal to the gross profit on the transaction, are included in the services category. The decrease in software net sales was driven by a single significant transaction during the prior year period affecting the year over year comparison. Our net sales by offering category for EMEA for 2017 and 2016 (as reclassified), were as follows (dollars in thousands):
| EMEA | ||||||||||||
| Sales Mix |
2017 | 2016 | % Change | |||||||||
| (As Reclassified) | ||||||||||||
| Hardware |
$ | 536,500 | $ | 481,505 | 11 | % | ||||||
| Software |
710,452 | 762,427 | (7 | %) | ||||||||
| Services |
108,464 | 94,628 | 15 | % | ||||||||
|
|
|
|
|
|
|
|||||||
| $ | 1,355,416 | $ | 1,338,560 | 1 | % | |||||||
|
|
|
|
|
|
|
|||||||
In EMEA, fees earned from activities reported on a net basis of $48,586,000 that were previously reported as part of our software product category in 2016 were reclassified to services to conform to the current year presentation.
Net sales in APAC decreased 5%, or $8.7 million, in 2017 compared to 2016. Excluding the effects of fluctuating foreign currency exchange rates, net sales decreased 7% in 2017 compared to 2016. Increases in hardware and services net sales year over year were offset by a decrease in software net sales during 2017 compared to 2016, resulting from the timing of a single client agreement in the public sector that historically transacted in the fourth quarter but instead transacted in the first quarter of 2018 this year. The growth in hardware net sales was primarily due to our continued expansion of hardware offerings in this market. The growth in services net sales resulted from the contributions of Ignia, as well as a higher volume of sales of software maintenance and cloud subscriptions products that are recorded on a net sales recognition basis in 2017 compared to 2016. Our net sales by offering category for APAC for 2017 and 2016 (as reclassified), were as follows (dollars in thousands):
| APAC | ||||||||||||
| Sales Mix |
2017 | 2016 | % Change | |||||||||
| (As Reclassified) | ||||||||||||
| Hardware |
$ | 27,907 | $ | 18,916 | 48 | % | ||||||
| Software |
101,412 | 132,718 | (24 | %) | ||||||||
| Services |
37,154 | 23,493 | 58 | % | ||||||||
|
|
|
|
|
|
|
|||||||
| $ | 166,473 | $ | 175,127 | (5 | %) | |||||||
|
|
|
|
|
|
|
|||||||
In APAC, fees earned from activities reported on a net basis of $9,000 and $10,991,000 that were previously reported as part of our hardware and software product categories, respectively, in 2016, were reclassified to services to conform to the current year presentation.
Net sales by category for North America, EMEA and APAC were as follows for 2017 and 2016 (as reclassified):
| North America | EMEA | APAC | ||||||||||||||||||||||
| Sales Mix |
2017 | 2016 | 2017 | 2016 | 2017 | 2016 | ||||||||||||||||||
| Hardware |
65 | % | 62 | % | 40 | % | 36 | % | 17 | % | 11 | % | ||||||||||||
| Software |
25 | % | 29 | % | 52 | % | 57 | % | 61 | % | 76 | % | ||||||||||||
| Services |
10 | % | 9 | % | 8 | % | 7 | % | 22 | % | 13 | % | ||||||||||||
|
|
|
|
|
|
|
|
|
|
|
|
|
|||||||||||||
| 100 | % | 100 | % | 100 | % | 100 | % | 100 | % | 100 | % | |||||||||||||
|
|
|
|
|
|
|
|
|
|
|
|
|
|||||||||||||
Gross Profit. Gross profit increased 24%, or $175.5 million, in 2017 compared to 2016, with gross margin increasing approximately 20 basis points to 13.7% of net sales. Our gross profit and gross profit as a percent of net sales by operating segment for 2017 and 2016 were as follows (dollars in thousands):
| 2017 | % of Net Sales |
2016 | % of Net Sales |
|||||||||||||
| North America |
$ | 691,677 | 13.3 | % | $ | 525,481 | 13.2 | % | ||||||||
| EMEA |
190,310 | 14.0 | % | 185,687 | 13.9 | % | ||||||||||
| APAC |
36,583 | 22.0 | % | 31,934 | 18.2 | % | ||||||||||
|
|
|
|
|
|||||||||||||
| Consolidated |
$ | 918,570 | 13.7 | % | $ | 743,102 | 13.5 | % | ||||||||
|
|
|
|
|
|||||||||||||
30
Table of Contents
INSIGHT ENTERPRISES, INC.
MANAGEMENT’S DISCUSSION AND ANALYSIS OF FINANCIAL CONDITION
AND RESULTS OF OPERATIONS (continued)
North America’s gross profit in 2017 increased 32% compared to 2016, and as a percentage of net sales, gross margin increased by approximately 10 basis points year over year. The year over year increase in gross margin was primarily attributable to a net increase in product margin, which includes partner funding and freight, of 30 basis points year over year. The net increase in product margin was due primarily to improvements in hardware and software product margin during 2017 compared to 2016 due to the acquisition of Datalink, which includes sales of data center products at higher gross margins then in our core business. The positive effect of the Datalink acquisition was partially offset by lower product margin in our core business due to a higher mix of business with large enterprise clients, where margins tend to be lower than other client groups. Services margin improvement year over year of 11 basis points was driven by an increase in margin generated by sales of warranty services during 2017 compared to 2016, which was driven by the acquisition of Datalink. These increases in margin were offset partially by a decrease in margin from lower fees from enterprise software agreements of 23 basis points during 2017 compared to 2016. The year over year comparison was also affected by a $2.2 million insurance settlement recognized during 2016 as a reduction of cost of sales due to the nature of the related insured loss previously recorded.
EMEA’s gross profit in 2017 increased 2% compared to 2016. Excluding the effects of fluctuating foreign currency exchange rates, gross profit was up 4% in 2017 compared to 2016. As a percentage of net sales, gross margin increased by approximately 10 basis points year over year. The year over year improvement in gross margin was primarily attributable to a 60 basis point increase in services margin due to a higher volume of higher margin services net sales during 2017 compared to 2016 as well as the positive effect on services margin that resulted from the higher volume of sales that were recorded on a net sales recognition basis in 2017 compared to 2016. The improvement in gross margin resulting from higher margin services net sales was partially offset by a net decrease in product margin, which includes partner funding and freight, of 50 basis points during 2017 compared to 2016. The decline in product margin primarily resulted from lower margins on large enterprise and public sector deals transacted during 2017.
APAC’s gross profit increased 15% in 2017 compared to 2016, with gross margin increasing to 22.0% in 2017 from 18.2% in 2016. Excluding the effects of fluctuating foreign currency exchange rates, gross profit increased 13% in 2017 compared to 2016. The improvement in gross margin in 2017 compared to 2016 was due primarily to the positive effect on services margin that results from the higher volume of sales that are recorded on a net sales recognition basis, an increase in the mix of higher margin services net sales and the margin contribution from increases in hardware net sales during 2017 compared to 2016.
Operating Expenses.
Selling and Administrative Expenses. Selling and administrative expenses increased $138.1 million in 2017 compared to 2016. Selling and administrative expenses increased approximately 10 basis points as a percentage of net sales in 2017 compared to 2016.
Selling and administrative expenses as a percent of net sales by operating segment for 2017 and 2016 were as follows (dollars in thousands):
| 2017 | % of Net Sales |
2016 | % of Net Sales |
|||||||||||||
| North America |
$ | 530,792 | 10.2 | % | $ | 401,316 | 10.1 | % | ||||||||
| EMEA |
164,305 | 12.1 | % | 160,269 | 12.0 | % | ||||||||||
| APAC |
28,231 | 17.0 | % | 23,658 | 13.5 | % | ||||||||||
|
|
|
|
|
|||||||||||||
| Consolidated |
$ | 723,328 | 10.8 | % | $ | 585,243 | 10.7 | % | ||||||||
|
|
|
|
|
|||||||||||||
North America’s selling and administrative expenses increased 32%, or $129.5 million, in 2017 compared to 2016, and increased approximately 10 basis points year over year as a percentage of net sales to 10.2% of net sales in 2017. The increase in expenses reflects the addition of Datalink to our North America business effective January 2017 and an increase in selling and administrative expenses in our core business of approximately 5% compared to 2016. The addition of Datalink was the primary driver for the $62.4 million increase in salaries and wages, contract labor and teammate benefit expenses for 2017 compared to 2016, as well as year over year increases in travel and entertainment, facilities and marketing expenses. Depreciation and amortization expense also increased approximately $6.0 million year over year, as amortization expense of $11.5 million, associated with the intangible assets acquired from Datalink, was offset partially by the year over year effect of intangible assets acquired in previous acquisitions being fully amortized in the third quarter of 2016. Additionally, increased sales and gross profit in 2017 compared to 2016, resulted in a $37.0 million increase in variable compensation year over year.
31
Table of Contents
INSIGHT ENTERPRISES, INC.
MANAGEMENT’S DISCUSSION AND ANALYSIS OF FINANCIAL CONDITION
AND RESULTS OF OPERATIONS (continued)
EMEA’s selling and administrative expenses increased 3%, or $4.0 million, in 2017 compared to 2016, and increased approximately 10 basis points to 12.1% of net sales in 2017. Excluding the effects of fluctuating foreign currency exchange rates, selling and administrative expenses increased 4% compared to 2016. The increase in expenses was primarily driven by a $3.1 million increase in salaries and wages and teammate benefits expenses due to increased headcount. This year over year increase in selling and administrative expenses was offset partially by a decrease in amortization expense during 2017 compared to 2016, as intangible assets acquired in previous acquisitions were fully amortized in the third quarter of 2016.
APAC’s selling and administrative expenses increased 19%, or $4.6 million, in 2017 compared to 2016, and increased approximately 350 basis points to 17.0% of net sales in 2017. Excluding the effects of fluctuating foreign currency exchange rates, selling and administrative expenses increased 16% compared to 2016. The year over year increase was primarily driven by increased selling and administrative expenses as a result of the acquisition of Ignia, effective September 1, 2016, which accounted for over half of the year over year increase in selling and administrative expenses. Additionally, salaries and wages expenses increased as we invested to support growth in cloud and services sales.
Severance and Restructuring Expenses. During 2017, North America, EMEA and APAC recorded severance expense, net of adjustments, totaling $4.0 million, $4.9 million and $104,000, respectively. The North America charges related to severance actions taken to realign roles and responsibilities subsequent to the acquisition of Datalink in January 2017, as well as a headcount reduction as part of cost reduction initiatives in the fourth quarter of 2017. The EMEA charges primarily related to headcount reductions in France, Germany and the Netherlands as part our cost reduction and restructuring initiatives in EMEA. The APAC charges primarily related to severance actions taken subsequent to the acquisition of Ignia. Current period charges were offset by adjustments for changes in estimates of previous accruals as cash payments were made during 2017. During 2016, North America, EMEA and APAC recorded severance expense, net of adjustments, totaling $3.0 million, $1.5 million and $118,000, respectively. See Note 8 to the Consolidated Financial Statements in Part II, Item 8 of this report for further discussion of severance and restructuring activities.
Acquisition-related Expenses. During 2017, we incurred $3.2 million in direct third-party transaction costs related to the acquisition of Datalink in North America and $106,000 in such costs related to the acquisition of Caase.com in EMEA. Comparatively, during 2016, we incurred $4.3 million in such costs related to the acquisition of Datalink in North America and $169,000 in such costs related to the acquisition of Ignia in APAC. See Note 21 to the Consolidated Financial Statements in Part II, Item 8 of this report for further discussion of acquisitions.
Non-Operating (Income) Expense.
Interest Income. Interest income for 2017 and 2016 was generated from interest earned on cash and cash equivalent bank balances. The slight increase in interest income year over year is primarily due to higher interest rates earned on such balances and to higher average interest-bearing cash and cash equivalent balances during 2017.
Interest Expense. Interest expense primarily relates to borrowings under our financing facilities and imputed interest under our inventory financing facility. Interest expense increased 122%, or $10.5 million, in 2017 compared to 2016 due primarily to borrowings under our Term Loan A (“TLA”) as well as higher borrowing rates and higher average daily balances under our other financing facilities, in 2017 compared to 2016, while imputed interest under our inventory financing facility increased $3.3 million from 2016 to 2017 to $6.7 million. For a description of our various financing facilities, see Notes 5 and 6 to the Consolidated Financial Statements in Part II, Item 8 of this report.
32
Table of Contents
INSIGHT ENTERPRISES, INC.
MANAGEMENT’S DISCUSSION AND ANALYSIS OF FINANCIAL CONDITION
AND RESULTS OF OPERATIONS (continued)
Net Foreign Currency Exchange Gains/Losses. These gains/losses result from foreign currency transactions, including foreign currency derivative contracts and intercompany balances that are not considered long-term in nature. The change in net foreign currency exchange gains/losses is due primarily to the underlying changes in the applicable exchange rates, partially mitigated by our use of foreign exchange forward contracts to offset the effects of fluctuations in foreign currencies on certain of our non-functional currency assets and liabilities.
Other Expense, Net. Other expense, net, consists primarily of bank fees associated with our cash management activities and was relatively flat in 2017 compared to 2016.
Income Tax Expense. Our effective tax rate for 2017 was 43.0% compared to 39.3% in 2016. The increase in the tax rate from 2016 to 2017 was primarily due to the effect of U.S. federal tax reform that was enacted in December 2017, which accounted for 8.4% of our effective tax rate. The effective tax rate in 2017 was higher than the federal statutory rate of 35.0% primarily due to the effect of U.S. federal tax reform enacted during the fourth quarter of 2017, as previously noted, as well as state income taxes, net of federal income tax benefits, and increases in the valuation allowances in certain foreign jurisdictions. These increases in our effective tax rate in 2017 were offset partially by lower taxes on earnings in foreign jurisdictions. See Note 11 to the Consolidated Financial Statements in Part II, Item 8 of this report for further discussion of income tax expense.
2016 Compared to 2015
As previously noted, the sales mix among our hardware, software and services categories for the years ended December 31, 2016 and 2015 have been reclassified to conform to changes made to the current year presentation, as reflected in the following results of operations discussion for these periods. These changes in classification had no effect on previously reported total net sales, total costs of goods sold or gross profit amounts.
Net Sales. Net sales increased 2%, or $112.4 million, in 2016 compared to 2015. Net sales of products (hardware and software) increased 1% and net sales of services increased 14% in 2016 (as reclassified) compared to 2015 (as reclassified). Our net sales by operating segment for 2016 and 2015 were as follows (dollars in thousands):
| 2016 | 2015 | % Change | ||||||||||
| North America |
$ | 3,971,828 | $ | 3,823,528 | 4 | % | ||||||
| EMEA |
1,338,560 | 1,371,137 | (2 | %) | ||||||||
| APAC |
175,127 | 178,425 | (2 | %) | ||||||||
|
|
|
|
|
|
|
|||||||
| Consolidated |
$ | 5,485,515 | $ | 5,373,090 | 2 | % | ||||||
|
|
|
|
|
|
|
|||||||
Net sales in North America increased 4%, or $148.3 million, in 2016 compared to 2015. Net sales of hardware and services (as reclassified) increased 5% and 12%, respectively, year over year, while net sales of software (as reclassified) decreased 1% year to year. The improvement in net sales in the hardware category was due primarily to higher sales of client devices, servers and storage products. The increase in services net sales reflects the BlueMetal acquisition in October 2015 as well as organic growth in technical services projects. Services net sales during 2016 also reflected the continued trend toward higher sales of cloud-based offerings and a higher mix of software maintenance sales that are recorded on a net sales recognition basis, with net sales equal to the gross profit on the transaction. Our net sales by offering category for North America for 2016 (as reclassified) and 2015 (as reclassified), were as follows (dollars in thousands):
| North America | ||||||||||||
| Sales Mix |
2016 | 2015 | % Change | |||||||||
| (As Reclassified) | (As Reclassified) | |||||||||||
| Hardware |
$ | 2,454,889 | $ | 2,336,764 | 5 | % | ||||||
| Software |
1,146,808 | 1,157,168 | (1 | %) | ||||||||
| Services |
370,131 | 329,596 | 12 | % | ||||||||
|
|
|
|
|
|
|
|||||||
| $ | 3,971,828 | $ | 3,823,528 | 4 | % | |||||||
|
|
|
|
|
|
|
|||||||
33
Table of Contents
INSIGHT ENTERPRISES, INC.
MANAGEMENT’S DISCUSSION AND ANALYSIS OF FINANCIAL CONDITION
AND RESULTS OF OPERATIONS (continued)
In North America, fees earned from activities reported on a net basis of $270,000 and $87,984,000 that were previously reported as part of our hardware and software product categories, respectively, in 2016, and fees earned from activities reported on a net basis of $24,000 and $74,101,000 that were previously reported as part of our hardware and software product categories, respectively, in 2015, were reclassified to services to conform to the current year presentation.
Net sales in EMEA decreased 2%, or $32.6 million, in 2016 compared to 2015. Excluding the effects of fluctuating foreign currency exchange rates, net sales increased 4% in 2016 compared to 2015. Net sales of software (as reclassified) were up 1% year over year, while net sales of hardware and services (as reclassified) were down 9% and 1%, respectively, year to year. The increase in software net sales in 2016 compared to 2015 was driven by increased volume with large enterprise clients. The decrease in services net sales was due primarily to the relative impact year over year of the volume of sales of software maintenance and cloud subscription products that are recorded on a net sales recognition basis, offset partially by increased sales of license consulting services and partner delivered third-party services to new and existing clients across the region. Our net sales by offering category for EMEA for 2016 (as reclassified) and 2015 (as reclassified), were as follows (dollars in thousands):
| EMEA | ||||||||||||
| Years Ended December 31, | ||||||||||||
| Sales Mix |
2016 | 2015 | % Change | |||||||||
| (As Reclassified) | (As Reclassified) | |||||||||||
| Hardware |
$ | 481,505 | $ | 531,308 | (9 | %) | ||||||
| Software |
762,427 | 756,373 | 1 | % | ||||||||
| Services |
94,628 | 83,456 | 13 | % | ||||||||
|
|
|
|
|
|
|
|||||||
| $ | 1,338,560 | $ | 1,371,137 | (2 | %) | |||||||
|
|
|
|
|
|
|
|||||||
In EMEA, fees earned from activities reported on a net basis of $48,586,000 and $43,388,000 that were previously reported as part of our software product category in 2016 and 2015, respectively, were reclassified to services to conform to the current year presentation.
Net sales in APAC decreased 2%, or $3.3 million, in 2016 compared to 2015. Excluding the effects of fluctuating foreign currency exchange rates, net sales in 2016 remained flat compared to 2015. An increase in services and hardware net sales year over year was offset by a decrease in software net sales during 2016 compared to 2015. Our net sales by offering category for APAC for 2016 (as reclassified) and 2015 (as reclassified), were as follows (dollars in thousands):
| APAC | ||||||||||||
| Sales Mix |
2016 | 2015 | % Change | |||||||||
| (As Reclassified) | (As Reclassified) | |||||||||||
| Hardware |
$ | 18,916 | $ | 14,327 | 32 | % | ||||||
| Software |
132,718 | 149,607 | (11 | %) | ||||||||
| Services |
23,493 | 14,491 | 62 | % | ||||||||
|
|
|
|
|
|
|
|||||||
| $ | 175,127 | $ | 178,425 | (2 | %) | |||||||
|
|
|
|
|
|
|
|||||||
In APAC, fees earned from activities reported on a net basis of $9,000 and $10,991,000 that were previously reported as part of our hardware and software product categories, respectively, in 2016, and fees earned from activities reported on a net basis of $6,000 and $8,439,000 that were previously reported as part of our hardware and software product categories, respectively, in 2015, were reclassified to services to conform to the current year presentation.
34
Table of Contents
INSIGHT ENTERPRISES, INC.
MANAGEMENT’S DISCUSSION AND ANALYSIS OF FINANCIAL CONDITION
AND RESULTS OF OPERATIONS (continued)
Net sales by category for North America, EMEA and APAC were as follows for 2016 (as reclassified) and 2015 (as reclassified):
| North America | EMEA | APAC | ||||||||||||||||||||||
| Sales Mix |
2016 | 2015 | 2016 | 2015 | 2016 | 2015 | ||||||||||||||||||
| Hardware |
62 | % | 61 | % | 36 | % | 39 | % | 11 | % | 8 | % | ||||||||||||
| Software |
29 | % | 30 | % | 57 | % | 55 | % | 76 | % | 84 | % | ||||||||||||
| Services |
9 | % | 9 | % | 7 | % | 6 | % | 13 | % | 8 | % | ||||||||||||
|
|
|
|
|
|
|
|
|
|
|
|
|
|||||||||||||
| 100 | % | 100 | % | 100 | % | 100 | % | 100 | % | 100 | % | |||||||||||||
|
|
|
|
|
|
|
|
|
|
|
|
|
|||||||||||||
Gross Profit. Gross profit increased 4%, or $26.8 million, in 2016 compared to 2015, with gross margin increasing approximately 20 basis points to 13.5% of net sales. Our gross profit and gross profit as a percent of net sales by operating segment for 2016 and 2015 were as follows (dollars in thousands):
| 2016 | % of Net Sales |
2015 | % of Net Sales |
|||||||||||||
| North America |
$ | 525,481 | 13.2 | % | $ | 501,563 | 13.1 | % | ||||||||
| EMEA |
185,687 | 13.9 | % | 186,287 | 13.6 | % | ||||||||||
| APAC |
31,934 | 18.2 | % | 28,482 | 16.0 | % | ||||||||||
|
|
|
|
|
|||||||||||||
| Consolidated |
$ | 743,102 | 13.5 | % | $ | 716,332 | 13.3 | % | ||||||||
|
|
|
|
|
|||||||||||||
North America’s gross profit in 2016 increased 5% compared to 2015, and as a percentage of net sales, gross margin increased by approximately 10 basis points year over year. The year over year increase in gross margin was primarily attributable to increases in supplier discounts year over year as we took advantage of early pay discounts offered by certain of our partners, which generated a 6 basis point improvement in margin year over year. During 2016, we also recognized a $2.2 million insurance settlement as a reduction of cost of sales due to the nature of the related insured loss previously recorded. The insurance settlement accounted for 6 basis points of the year over year margin expansion during 2016 compared to 2015. Although an increase in higher margin consulting services sales generated a 15 basis point improvement in gross margin year over year, the increase was partially offset by a decline in margin generated by sales of warranty services of 12 basis points year to year.
EMEA’s gross profit remained flat in 2016 compared to 2015. Excluding the effects of fluctuating foreign currency exchange rates, gross profit was up 7% in 2016 compared to 2015. As a percentage of net sales, gross margin increased by approximately 30 basis points year over year. The year over year increase in gross margin was primarily attributable to the positive effect on gross margin that results from the higher volume of sales that are recorded on a net sales recognition basis within the net sales line item. Changes in the mix and size of transactions and an increase in partner funding earlier in 2016 also contributed to the margin improvement during 2016 compared to 2015. In addition, we recognized an increase in margin resulting from higher fees from enterprise software agreements during 2016 compared to 2015.
APAC’s gross profit increased 12% in 2016 compared to 2015, with gross margin increasing to 18.2% in 2016 from 16.0% in 2015. Excluding the effects of fluctuating foreign currency exchange rates, gross profit increased 14% in 2016 compared to 2015. The improvement in gross margin in 2016 compared to 2015 was due primarily to the positive effect on margin that results from the higher volume of sales that are recorded on a net sales recognition basis, an increase in the mix of higher margin services net sales, higher partner funding and an increase in hardware sales during 2016 compared to 2015.
Operating Expenses.
Selling and Administrative Expenses. Selling and administrative expenses increased $337,000 in 2016 compared to 2015. Selling and administrative expenses decreased approximately 20 basis points as a percentage of net sales in 2016 compared to 2015.
35
Table of Contents
INSIGHT ENTERPRISES, INC.
MANAGEMENT’S DISCUSSION AND ANALYSIS OF FINANCIAL CONDITION
AND RESULTS OF OPERATIONS (continued)
Selling and administrative expenses as a percent of net sales by operating segment for 2016 and 2015 were as follows (dollars in thousands):
| 2016 | % of Net Sales |
2015 | % of Net Sales |
|||||||||||||
| North America |
$ | 401,316 | 10.1 | % | $ | 396,603 | 10.4 | % | ||||||||
| EMEA |
160,269 | 12.0 | % | 165,879 | 12.1 | % | ||||||||||
| APAC |
23,658 | 13.5 | % | 22,424 | 12.6 | % | ||||||||||
|
|
|
|
|
|||||||||||||
| Consolidated |
$ | 585,243 | 10.7 | % | $ | 584,906 | 10.9 | % | ||||||||
|
|
|
|
|
|||||||||||||
North America’s selling and administrative expenses increased 1%, or $4.7 million, in 2016 compared to 2015, but decreased approximately 30 basis points year to year as a percentage of net sales to 10.1% of net sales in 2016. Teammate benefits expense, including healthcare expenses, increased $6.0 million year over year due to an increase in healthcare claims, and variable compensation increased $4.6 million as a result of the increase in net sales and gross profit year over year. These increases in expenses during 2016 compared to 2015 were partially offset by a decline in the provision for losses on accounts receivable of $3.4 million in 2016 compared to 2015 due to favorable collection results and a decrease in salaries and wages and contract labor of $2.7 million resulting from cost reduction initiatives implemented earlier in 2016 across our North America business. Our results for 2015 included a non-cash charge of $800,000 to reduce the carrying amount of our real estate held for sale to its estimated fair value less costs to sell.
EMEA’s selling and administrative expenses decreased 3%, or $5.6 million, in 2016 compared to 2015, and decreased approximately 10 basis points to 12.0% of net sales in 2016. Excluding the effects of fluctuating foreign currency exchange rates, selling and administrative expenses increased 3% compared to the prior year. The increase in expenses (excluding the effects of fluctuating foreign currency exchange rates) was primarily driven by increased salaries and wages and teammate benefits expenses attributed to higher average cost per head in conjunction with our investments in sales and services related headcount to support services and cloud growth across the region.
APAC’s selling and administrative expenses increased 6%, or $1.2 million, in 2016 compared to 2015, and increased approximately 90 basis points to 13.5% of net sales in 2016. Excluding the effects of fluctuating foreign currency exchange rates, selling and administrative expenses increased 7% compared to the prior year. The year over year increase is primarily driven by higher variable compensation as a result of the increase in gross profit year over year and increased selling and administrative expenses as a result of the acquisition of Ignia, a business technology consulting and managed services provider, effective September 1, 2016.
Severance and Restructuring Expenses. During 2016, North America, EMEA and APAC recorded severance expense, net of adjustments, totaling $3.0 million, $1.5 million and $118,000, respectively. The North America charges related to a headcount reduction as part of cost reduction initiatives early in 2016 noted previously, while the EMEA charges related to significant restructuring activities, primarily in the United Kingdom, Germany and France, as we worked to reduce our selling and administrative expenses in EMEA. Current period charges were offset by adjustments for changes in estimates of previous accruals as cash payments were made during 2016. During 2015, North America and EMEA recorded severance expense, net of adjustments, totaling $1.1 million and $3.8 million, respectively. APAC did not record any severance expense in 2015. See Note 8 to the Consolidated Financial Statements in Part II, Item 8 of this report for further discussion of severance and restructuring activities.
Acquisition-related Expenses. During 2016, we incurred $169,000 in direct third-party transaction costs related to the acquisition of Ignia and $4.3 million in such costs related to the acquisition of Datalink that was completed on January 6, 2017. See Note 21 to the Consolidated Financial Statements in Part II, Item 8 of this report for further discussion of acquisitions.
36
Table of Contents
INSIGHT ENTERPRISES, INC.
MANAGEMENT’S DISCUSSION AND ANALYSIS OF FINANCIAL CONDITION
AND RESULTS OF OPERATIONS (continued)
Non-Operating (Income) Expense.
Interest Income. Interest income for 2016 and 2015 was generated from interest earned on cash and cash equivalent bank balances. The increase in interest income year over year is primarily due to higher interest rates earned on such balances and to higher average interest-bearing cash and cash equivalent balances during 2016.
Interest Expense. Interest expense primarily relates to borrowings under our financing facilities and imputed interest under our inventory financing facility. Interest expense increased 19% in 2016 compared to 2015 due primarily to higher borrowing rates and higher average daily balances under our debt facilities in 2016 compared to 2015, while imputed interest under our inventory financing facility remained flat from 2015 to 2016 at $3.4 million. For a description of our various financing facilities, see Notes 5 and 6 to the Consolidated Financial Statements in Part II, Item 8 of this report.
Net Foreign Currency Exchange Gains/Losses. These gains/losses result from foreign currency transactions, including foreign currency derivative contracts and intercompany balances that are not considered long-term in nature. The change in net foreign currency exchange gains/losses is due primarily to the underlying changes in the applicable exchange rates, partially mitigated by our use of foreign exchange forward contracts to offset the effects of fluctuations in foreign currencies on certain of our non-functional currency assets and liabilities.
Other Expense, Net. Other expense, net, consists primarily of bank fees associated with our cash management activities.
Income Tax Expense. Our effective tax rate for 2016 was 39.3% compared to 36.4% in 2015. The increase in the tax rate from 2015 to 2016 was primarily due to the effect of a change in tax law that was enacted in December 2016 related to the taxation of foreign currency translation gains or losses arising from qualified business units and the effect of non-deductible acquisition-related expenses incurred in 2016. The effective tax rate in 2016 was higher than the federal statutory rate of 35.0% primarily due to the increases in the valuation allowances in certain foreign jurisdictions and state taxes in the United States as well as the tax law change during the fourth quarter of 2016 and the effect of non-deductible acquisition-related expenses incurred in 2016, as noted previously. These increases in our effective tax rate in 2016 were offset partially by lower taxes on earnings in foreign jurisdictions. See Note 11 to the Consolidated Financial Statements in Part II, Item 8 of this report for further discussion of income tax expense.
Liquidity and Capital Resources
The following table sets forth certain consolidated cash flow information for 2017, 2016 and 2015 (in thousands):
| 2017 | 2016 | 2015 | ||||||||||
| Net cash (used in) provided by operating activities |
$ | (305,426 | ) | $ | 96,128 | $ | 181,102 | |||||
| Net cash used in investing activities |
(204,645 | ) | (21,185 | ) | (57,637 | ) | ||||||
| Net cash provided by (used in) financing activities |
397,121 | (58,230 | ) | (83,328 | ) | |||||||
| Foreign currency exchange effect on cash and cash equivalent balances |
15,899 | (1,809 | ) | (16,683 | ) | |||||||
|
|
|
|
|
|
|
|||||||
| (Decrease) increase in cash and cash equivalents |
(97,051 | ) | 14,904 | 23,454 | ||||||||
| Cash and cash equivalents at beginning of year |
202,882 | 187,978 | 164,524 | |||||||||
|
|
|
|
|
|
|
|||||||
| Cash and cash equivalents at end of year |
$ | 105,831 | $ | 202,882 | $ | 187,978 | ||||||
|
|
|
|
|
|
|
|||||||
Cash and Cash Flow
Our primary uses of cash during 2017 were to fund working capital requirements, pay down our debt balances, fund capital expenditures and acquire Caase.com and Datalink. Operating activities used $305.4 million in cash in 2017. Both the 2017 and 2016 results are affected by individually significant transactions at each year end, whereby a single significant receivable was collected from a client in the fourth quarter of the year for which the related payment to the supplier was due and paid in January of the following year, as discussed in more detail below. During 2017, we had net combined borrowings on our long-term debt facilities of $269.3 million and acquired Caase.com and Datalink for $6.0 million and $180.9 million, respectively, net of cash and cash equivalents acquired. Capital expenditures were $19.2 million in 2017, a 57% increase from 2016, reflecting higher IT investments in our core ERP systems and e-commerce and digital marketing platforms year over year. Cash and cash equivalent balances in 2017 were positively affected by $15.9 million as a result of foreign currency exchange rates.
37
Table of Contents
INSIGHT ENTERPRISES, INC.
MANAGEMENT’S DISCUSSION AND ANALYSIS OF FINANCIAL CONDITION
AND RESULTS OF OPERATIONS (continued)
We anticipate that cash flows from operations, together with the funds available under our financing facilities, will be adequate to support our cash and working capital requirements for operations as well as other strategic investments over the next 12 months. We expect existing cash and cash flows from operations to continue to be sufficient to fund our operating cash activities and cash commitments for investing and financing activities, such as capital expenditures, repurchases of our common stock and debt repayments, for at least the next 12 months.
Net cash (used in) provided by operating activities. Cash flows from operating activities reflect our net earnings, adjusted for non-cash items such as depreciation, amortization, stock-based compensation expense and write-offs and write-downs of assets, as well as changes in asset and liability balances. Net earnings for 2017 was also adjusted for the loss on sale of our Russia business, which included a non-cash charge for the release of our cumulative translation adjustment balance upon sale of the foreign entity. As noted previously, our net sales grew 22% in 2017 and in particular, our North America net sales grew 30%. This level of growth required significant working capital investments as we experienced higher demand for inventory positions with key clients and, at the same time, our accounts receivable balances began to age as collection efforts did not keep up with the growth. The 2017 results also reflect the collection of a single significant receivable from a client in the fourth quarter of 2016 for which the related payment to the supplier of approximately $160 million was due and paid in January 2017, as noted previously. Further impacting our operating cash flows was the fact that we report cash flows associated with trade payables financed under our inventory financing facility in the financing section of our statement of cash flows. In 2017, and most notably in the fourth quarter, we expanded the use of that facility with certain vendors. Had we not leveraged the facility during 2017, the net borrowings under our inventory financing facility of $141.0 million that are reflected as cash flows provided by financing activities would have been included within trade payables, which are reflected in the operating activities section of our statement of cash flows. The increase in inventories was primarily attributable to an increase in inventory levels at December 31, 2017 to support specific client engagements. The decrease in deferred revenue was a result of revenue recognition in 2017 on a number of larger client transactions in North America for which monies had been collected from clients prior to December 31, 2016, in advance of meeting the criteria for revenue recognition.
In 2016, the increases in accounts receivable and accounts payable reflected increased sales and associated costs of goods sold, respectively, in 2016 compared to 2015. However, the 2016 results were also affected by a single significant receivable collected from a client in the fourth quarter of 2016 for which the related payment to the supplier of approximately $160 million was due and paid in January 2017, as noted previously. In the fourth quarter of 2015, we had a similar experience with a significant receivable collected in the quarter for which the payment to the supplier of approximately $60 million was not made until the first quarter of 2016. Excluding the effects of these two individually significant timing differences, cash flow from operations would have been nominal for 2016. Additionally, the increase in accounts payable reflected as cash provided by operating activities in 2016 was affected by the increased use of our inventory financing facility in 2016 to facilitate the purchase of inventory from various suppliers. Increases in accounts payable under this facility were reflected as cash provided by financing activities, as discussed below. Had these purchases been made without using the inventory financing facility during 2016, the net borrowings under our inventory financing facility of $48.6 million that were reflected as cash flows from financing activities would have been reflected as an increase in accounts payable, which would have been an increase in cash provided by operating activities. We used more working capital in the fourth quarter of 2016 compared to the fourth quarter of 2015, as our sales growth was weighted to the last two months of the current year. The $50.1 million increase in other assets was primarily a result of our deferral of costs for certain payments made or payable to partners at December 31, 2016, in advance of our being able to recognize the related revenue. The $28.9 million increase in inventories was primarily attributable to an increase in inventory levels at December 31, 2016, to support specific client engagements and hardware sale transactions in transit to clients as of December 31, 2016 such that delivery was not deemed to have occurred until the product was received by the client in early January 2017.
38
Table of Contents
INSIGHT ENTERPRISES, INC.
MANAGEMENT’S DISCUSSION AND ANALYSIS OF FINANCIAL CONDITION
AND RESULTS OF OPERATIONS (continued)
In 2015, the increases in accounts receivable and accounts payable reflected increased sales and associated costs of goods sold, respectively, in 2015 compared to 2014. However, the 2015 results were also affected by the single significant receivable collected from a client in the fourth quarter of 2015 for which the related payment to the supplier of approximately $60 million was due and paid in January 2016, as noted previously. The increase in other assets was primarily a result of our deferral of costs for certain payments made or payable to partners at December 31, 2015, in advance of our being able to recognize the related revenue. As a result, cash flows from operating activities in 2015 exceeded our historical average annual cash flow generation of $80 million to $120 million.
Our consolidated cash flow operating metrics for the quarters ended December 31, 2017, 2016 and 2015 were as follows:
| 2017 | 2016 | 2015 | ||||||||||
| Days sales outstanding in ending accounts receivable (“DSOs”) (a) |
94 | 90 | 87 | |||||||||
| Days inventory outstanding (“DIOs”) (b) |
13 | 12 | 10 | |||||||||
| Days purchases outstanding in ending accounts payable (“DPOs”) (c) |
(72 | ) | (88 | ) | (77 | ) | ||||||
|
|
|
|
|
|
|
|||||||
| Cash conversion cycle (days) (d) |
35 | 14 | 20 | |||||||||
|
|
|
|
|
|
|
|||||||
| (a) | Calculated as the balance of accounts receivable, net at the end of the period divided by daily net sales. Daily net sales is calculated as net sales for the quarter divided by 92 days. |
| (b) | Calculated as average inventories (excluding inventories not available for sale) divided by daily costs of goods sold. Average inventories is calculated as the sum of the balances of inventories at the beginning of the period plus inventories at the end of the period divided by two. Daily costs of goods sold is calculated as costs of goods sold for the quarter divided by 92 days. |
| (c) | Calculated as the sum of the balances of accounts payable – trade and accounts payable – inventory financing facility at the end of the period divided by daily costs of goods sold. Daily costs of goods sold is calculated as costs of goods sold for the quarter divided by 92 days. |
| (d) | Calculated as DSOs plus DIOs, less DPOs. |
Our cash conversion cycle was 35 days in the fourth quarter ended December 31, 2017, compared to 14 days in the fourth quarter of 2016. Our 2016 cash conversion cycle was below our target range of 20 to 25 days as a result of unusually high DPOs associated with the $160 million payment timing difference in North America at the end of the prior year period, as discussed below. Our 2017 cash conversion cycle was above our target range due to the increases in our inventory and accounts receivable balances noted above. We expect working capital trends to return to normalized levels and have action plans in place to improve our cash flow efficiency in 2018.
Our cash conversion cycle was 14 days in the fourth quarter ended December 31, 2016, a decrease of six days from the fourth quarter of 2015, due primarily to an 11 day increase in DPOs driven by a single significant payment to a supplier in North America that was due and paid in January 2017. Although the payment to the supplier was not due until after year-end, we collected on the accounts receivable from the client in the fourth quarter of 2016 under normal credit terms. Both the 2016 and 2015 results are affected by individually significant transactions at each year end; however, the magnitude of the 2016 transaction had a greater effect on DPOs. The computation of DPOs for the quarter ended December 31, 2016 includes a payable to a supplier of $160 million, and the computation of DPOs for the quarter ended December 30, 2015 includes a payable to a supplier of $60 million, both of which do not have corresponding accounts receivable outstanding as of the end of the respective periods.
Our cash conversion cycle was 20 days in the fourth quarter ended December 31, 2015, a decrease of four days from the fourth quarter of 2014, due primarily to an increase in DPOs in North America driven by a single significant payment to a supplier that was due and paid in January 2016, after the resolution of certain invoicing issues with the supplier. Although we did not pay the supplier until after year-end, we collected on the accounts receivable from the client in the fourth quarter of 2015 under normal credit terms.
We expect that cash flow from operations will be used, at least partially, to fund working capital as we typically pay our partners on average terms that are shorter than the average terms we grant to our clients in order to take advantage of supplier discounts. We intend to use cash generated in 2018 in excess of working capital needs to support our capital expenditures for the year, to repurchase shares of our common stock and to pay down our debt balances. We also may use cash to fund potential acquisitions.
39
Table of Contents
INSIGHT ENTERPRISES, INC.
MANAGEMENT’S DISCUSSION AND ANALYSIS OF FINANCIAL CONDITION
AND RESULTS OF OPERATIONS (continued)
Net cash used in investing activities. Capital expenditures of $19.2 million, $12.3 million and $13.4 million in 2017, 2016 and 2015, respectively, were primarily related to technology and facility enhancements. We expect total capital expenditures in 2018 to be between $15.0 million and $20.0 million, primarily for technology-related upgrade projects and the integration of prior acquisitions.
During 2017 we acquired Caase.com and Datalink for $6.0 million and $180.9 million, respectively, net of cash and cash equivalents acquired. During 2016, we acquired Ignia for $10.8 million, net of cash acquired, and during 2015, we acquired BlueMetal for $44.2 million, net of cash acquired.
Net cash provided by (used in) financing activities. During 2017, we had net combined borrowings on our long-term debt under our revolving facility, TLA and accounts receivable securitization facility (“ABS facility”) of $269.3 million and had net borrowings under our inventory financing facility of $141.0 million. During 2016, we made net combined repayments on our long-term debt under our revolving facility and our ABS facility of $49.5 million and had net borrowings under our inventory financing facility of $48.6 million. In 2016, we also funded $50.0 million of repurchases of our common stock. During 2015, we had net combined borrowings on our long-term debt under our revolving facility and our ABS facility of $28.0 million and made net repayments under our inventory financing facility of $16.5 million. In 2015, we also funded $91.8 million of repurchases of our common stock.
Financing Facilities
As of December 31, 2017, our long-term debt balance includes $25.0 million outstanding under our $250.0 million ABS facility and $117.5 million outstanding under our $350.0 million revolving facility. In connection with the acquisition of Datalink on January 6, 2017, we amended our revolving facility to expand the facility by $175.0 million in the form of a TLA that requires amortization payments in years one through five. As of December 31, 2017, we had $166.3 million outstanding under our TLA. See Note 6 to the Consolidated Financial Statements in Part II, Item 8 of this report for a description of our amendment to our revolving facility in connection with our acquisition of Datalink.
As of December 31, 2017, the current portion of our long-term debt relates to our capital leases and other financing obligations as well as the amortization payments due in 2018 under our TLA. Our objective is to pay our debt balances down while retaining adequate cash balances to meet overall business objectives.
While the ABS facility has a stated maximum amount, the actual availability under the ABS facility is limited by the quantity and quality of the underlying accounts receivable. As of December 31, 2017, qualified receivables were sufficient to permit access to the full $250.0 million under the ABS facility.
Our consolidated debt balance that can be outstanding at the end of any fiscal quarter under our revolving facility, our TLA and our ABS facility is limited by certain financial covenants, particularly a maximum leverage ratio. The maximum leverage ratio is calculated as aggregate debt outstanding divided by the sum of the Company’s trailing twelve month net earnings (loss) plus (i) interest expense, excluding non-cash imputed interest on our inventory financing facility, (ii) income tax expense (benefit), (iii) depreciation and amortization, (iv) non-cash stock-based compensation, (v) extraordinary or non-recurring non-cash losses or expenses and (vi) certain cash restructuring and acquisition-related charges and synergies, not to exceed a specified cap (“adjusted earnings”). The maximum leverage ratio permitted under the facilities was increased to 3.50 times trailing twelve-month adjusted earnings in connection with the acquisition of Datalink in January 2017. We anticipate that we will be in compliance with our maximum leverage ratio requirements, which will decrease to 3.25 in 2018, over the next four quarters. However, a significant drop in the Company’s adjusted earnings would limit the amount of indebtedness that could be outstanding at the end of any fiscal quarter to a level that would be below the Company’s consolidated maximum facility amounts. Based on the maximum permitted leverage ratio as of December 31, 2017, the Company’s debt balance that could have been outstanding under our revolving facility, TLA and ABS facility was the full amount of the maximum borrowing capacity of $766.3 million.
40
Table of Contents
INSIGHT ENTERPRISES, INC.
MANAGEMENT’S DISCUSSION AND ANALYSIS OF FINANCIAL CONDITION
AND RESULTS OF OPERATIONS (continued)
Our revolving facility, our TLA and our ABS facility contain various covenants customary for transactions of this type, including limitations on the payment of dividends and the requirement that we comply with maximum leverage and minimum fixed charge ratio requirements, comply with a minimum receivable requirement and meet monthly, quarterly and annual reporting requirements. If we fail to comply with these covenants, the lenders would be able to demand payment within a specified time period. At December 31, 2017, we were in compliance with all such covenants. Further, the terms of the ABS facility identify various circumstances that would result in an “amortization event” under the facility. As of December 31, 2017, no such “amortization event” had occurred.
We also have an agreement with a financial intermediary to facilitate the purchase of inventory from various suppliers under certain terms and conditions. These amounts are classified separately as accounts payable - inventory financing facility in our consolidated balance sheets.
The aggregate availability for vendor purchases under our inventory financing facility is $325,000,000. From time to time and at our option, we may request to increase the aggregate amount available under the inventory financing facility by up to an aggregate of $25,000,000, subject to customary conditions. The facility matures on June 23, 2021. Additionally, the facility may be renewed under certain circumstances described in the agreement for successive 12-month periods. Interest does not accrue on accounts payable under this facility provided the accounts payable are paid within stated vendor terms (typically 60 days).
Notes 5 and 6 to the Consolidated Financial Statements in Part II, Item 8 of this report also include: a description of our financing facilities; amounts outstanding; amounts available and weighted average borrowings and interest rates during the year.
Undistributed Foreign Earnings
Cash and cash equivalents held by foreign subsidiaries are generally subject to U.S. income taxation upon repatriation to the United States. As a result of the U.S. federal tax reform enacted in December 2017, all undistributed foreign earnings are deemed distributed. We provided for U.S. income and withholding taxes on the earnings deemed distributed from all of our foreign subsidiaries during 2017. As of December 31, 2017, we had approximately $87.1 million in cash and cash equivalents in certain of our foreign subsidiaries. As of December 31, 2017, the majority of our foreign cash resides in the Netherlands, Canada and Australia. Certain of these cash balances will be remitted to the United States by paying down intercompany payables generated in the ordinary course of business or though actual dividend distributions.
Off-Balance Sheet Arrangements
We have entered into off-balance sheet arrangements, which include guaranties and indemnifications. These arrangements are discussed in Note 17 to the Consolidated Financial Statements in Part II, Item 8 of this report. We believe that none of our off-balance sheet arrangements have, or are reasonably likely to have, a material current or future effect on our financial condition, sales or expenses, results of operations, liquidity, capital expenditures or capital resources.
41
Table of Contents
INSIGHT ENTERPRISES, INC.
MANAGEMENT’S DISCUSSION AND ANALYSIS OF FINANCIAL CONDITION
AND RESULTS OF OPERATIONS (continued)
Contractual Obligations
At December 31, 2017, our contractual obligations for continuing operations were as follows (in thousands):
| Payments due by period | ||||||||||||||||||||
| Total | Less than 1 Year |
1-3 Years |
3-5 Years |
More than 5 Years |
||||||||||||||||
| Long-term debt (a) |
$ | 308,750 | $ | 13,125 | $ | 64,375 | $ | 231,250 | $ | — | ||||||||||
| Capital lease obligations, including interest payments |
5,436 | 3,620 | 1,816 | — | — | |||||||||||||||
| Inventory financing facility (b) |
319,468 | 319,468 | — | — | — | |||||||||||||||
| Operating lease obligations (c) |
75,499 | 18,601 | 28,739 | 16,136 | 12,023 | |||||||||||||||
| Severance and restructuring obligations (d) |
4,640 | 4,640 | — | — | — | |||||||||||||||
| Other contractual obligations (e) |
40,418 | 12,631 | 20,519 | 5,074 | 2,194 | |||||||||||||||
|
|
|
|
|
|
|
|
|
|
|
|||||||||||
| Total |
$ | 754,211 | $ | 372,085 | $ | 115,449 | $ | 252,460 | $ | 14,217 | ||||||||||
|
|
|
|
|
|
|
|
|
|
|
|||||||||||
| (a) | Reflects the $25.0 million outstanding at December 31, 2017 under our ABS facility as due in June 2019, the date at which the facility matures, $117.5 million outstanding at December 31, 2017 under our revolving facility as due in June 2021, the date at which the facility matures, and $166.3 million outstanding at December 31, 2017 under our TLA. The TLA requires amortization payments of 5%, 7.5%, 10%, 12.5% and 15% of the original principal balance in years one through five, respectively, to be paid quarterly through March 31, 2021, with the remaining balance of $107.2 million due at maturity on June 23, 2021. See further discussion in Note 6 to the Consolidated Financial Statements in Part II, Item 8 of this report. |
| (b) | As of December 31, 2017, this amount has been included in our contractual obligations table above as being due in less than 1 year due to the 30- to 120-day stated vendor terms. See further discussion in Note 5 to the Consolidated Financial Statements in Part II, Item 8 of this report. |
| (c) | Amounts in the table above exclude non-cancellable rental income of approximately $1.6 million due in less than one year and a total of approximately $1.6 million due in years one through three. |
| (d) | As a result of approved severance and restructuring plans, we expect future cash expenditures related to employee termination benefits. See further discussion in Note 8 to the Consolidated Financial Statements in Part II, Item 8 of this report. |
| (e) | The table above includes: |
| I. | Estimated interest payments of $603,000 in 2018 and $301,000 in the first six months of 2019, based on the current debt balance at December 31, 2017 of $25.0 million under our ABS facility, multiplied by the floating interest rate applicable at December 31, 2017 of 2.41% per annum. |
| II. | Estimated interest payments of $4.1 million in 2018, 2019 and 2020 and $2.1 million in the first six months of 2021, based on the current debt balance at December 31, 2017 of $117.5 million under our revolving facility, multiplied by the floating interest rate applicable at December 31, 2017 of 3.49% per annum. |
| III. | Estimated interest payments of $5.7 million in 2018, $5.2 million in 2019, $4.5 million in 2020 and $2.0 million in the first six months of 2021, based on the current debt balance at December 31, 2017 of $166.3 million under our TLA, multiplied by the floating interest rate applicable at December 31, 2017 of 3.57% per annum. |
| IV. | Amounts totaling $197,000 through 2018 for other contractual obligations. |
| V. | We estimate that we will owe $7.5 million in future years in connection with the obligations to perform asset-retirement activities that are conditional on a future event. |
The table above excludes $4.3 million of unrecognized tax benefits, including $287,000 related to accrued interest, as we are unable to reasonably estimate the ultimate amount or timing of settlement. See further discussion in Note 11 to the Consolidated Financial Statements in Part II, Item 8 of this report.
Although we set purchase targets with our partners tied to the amount of supplier reimbursements we receive, we have no material contractual purchase obligations with our partners.
Acquisitions
Our strategy includes the possible acquisition of or investments in other businesses to expand or complement our operations or to add certain services capabilities. The magnitude, timing and nature of any future acquisitions or investments will depend on a number of factors, including the availability of suitable candidates, the negotiation of acceptable terms, our financial capabilities and general economic and business conditions. Financing for future transactions would result in the utilization of cash, incurrence of additional debt, issuance of stock or some combination of the three. See Note 21 to the Consolidated Financial Statements in Part II, Item 8 of this report for a discussion of our acquisitions of Caase.com on September 26, 2017 and Datalink on January 6, 2017 and the amendment to our revolving facility to fund, in part, the acquisition of Datalink.
42
Table of Contents
INSIGHT ENTERPRISES, INC.
MANAGEMENT’S DISCUSSION AND ANALYSIS OF FINANCIAL CONDITION
AND RESULTS OF OPERATIONS (continued)
Inflation
We have historically not been adversely affected by inflation, as technological advances and competition within the IT industry have generally caused the prices of the products we sell to decline and product life cycles tend to be short. This requires our growth in unit sales to exceed the decline in prices in order to increase our net sales. We believe that most price increases could be passed on to our clients, as prices charged by us are not set by long-term contracts; however, as a result of competitive pressure, there can be no assurance that the full effect of any such price increases could be passed on to our clients.
Recently Issued Accounting Standards
The information contained in Note 1 to the Consolidated Financial Statements in Part II, Item 8 of this report concerning a description of recent accounting pronouncements, including our expected dates of adoption and the estimated effects on our results of operations and financial condition, is incorporated by reference herein.
| Item 7A. | Quantitative and Qualitative Disclosures About Market Risk |
The information contained in Note 12 to the Consolidated Financial Statements in Part II, Item 8 of this report concerning a description of market risk management, including interest rate risk and foreign currency exchange risk, is incorporated by reference herein.
43
Table of Contents
INDEX TO CONSOLIDATED FINANCIAL STATEMENTS
| Item 8. | Financial Statements and Supplementary Data |
| Page | ||||
| 45 | ||||
| 48 | ||||
| 49 | ||||
| 50 | ||||
| 51 | ||||
| 52 | ||||
| 53 | ||||
44
Table of Contents
REPORT OF INDEPENDENT REGISTERED
PUBLIC ACCOUNTING FIRM
To the Stockholders and Board of Directors
Insight Enterprises, Inc.:
Opinion on the Consolidated Financial Statements
We have audited the accompanying consolidated balance sheets of Insight Enterprises, Inc. and subsidiaries (the “Company”) as of December 31, 2017 and 2016, the related consolidated statements of operations, comprehensive income, stockholders’ equity, and cash flows for each of the years in the three-year period ended December 31, 2017, and the related notes (collectively, the “consolidated financial statements”). In our opinion, the consolidated financial statements present fairly, in all material respects, the financial position of the Company as of December 31, 2017 and 2016, and the results of its operations and its cash flows for each of the years in the three-year period ended December 31, 2017, in conformity with U.S. generally accepted accounting principles.
We also have audited, in accordance with the standards of the Public Company Accounting Oversight Board (United States) (“PCAOB”), the Company’s internal control over financial reporting as of December 31, 2017, based on criteria established in Internal Control – Integrated Framework (2013) issued by the Committee of Sponsoring Organizations of the Treadway Commission, and our report dated February 23, 2018, expressed an unqualified opinion on the effectiveness of the Company’s internal control over financial reporting.
Basis for Opinion
These consolidated financial statements are the responsibility of the Company’s management. Our responsibility is to express an opinion on these consolidated financial statements based on our audits. We are a public accounting firm registered with the PCAOB and are required to be independent with respect to the Company in accordance with the U.S. federal securities laws and the applicable rules and regulations of the Securities and Exchange Commission and the PCAOB.
We conducted our audits in accordance with the standards of the PCAOB. Those standards require that we plan and perform the audit to obtain reasonable assurance about whether the consolidated financial statements are free of material misstatement, whether due to error or fraud. Our audits included performing procedures to assess the risks of material misstatement of the consolidated financial statements, whether due to error or fraud, and performing procedures that respond to those risks. Such procedures included examining, on a test basis, evidence regarding the amounts and disclosures in the consolidated financial statements. Our audits also included evaluating the accounting principles used and significant estimates made by management, as well as evaluating the overall presentation of the consolidated financial statements. We believe that our audits provide a reasonable basis for our opinion.
| /s/ KPMG LLP |
We have served as the Company’s auditor since 1990.
Phoenix, Arizona
February 23, 2018
45
Table of Contents
REPORT OF INDEPENDENT REGISTERED
PUBLIC ACCOUNTING FIRM
To the Stockholders and Board of Directors
Insight Enterprises, Inc.:
Opinion on Internal Control Over Financial Reporting
We have audited Insight Enterprises, Inc.’s and subsidiaries (the “Company”) internal control over financial reporting as of December 31, 2017, based on criteria established in Internal Control – Integrated Framework (2013) issued by the Committee of Sponsoring Organizations of the Treadway Commission. In our opinion, the Company maintained, in all material respects, effective internal control over financial reporting as of December 31, 2017, based on criteria established in Internal Control – Integrated Framework (2013) issued by the Committee of Sponsoring Organizations of the Treadway Commission.
We also have audited, in accordance with the standards of the Public Company Accounting Oversight Board (United States) (“PCAOB”), the consolidated balance sheets of the Company as of December 31, 2017 and 2016, the related consolidated statements of operations, comprehensive income, stockholders’ equity, and cash flows for each of the years in the three-year period ended December 31, 2017, and the related notes (collectively, the “consolidated financial statements”), and our report dated February 23, 2018 expressed an unqualified opinion on those consolidated financial statements.
Basis for Opinion
The Company’s management is responsible for maintaining effective internal control over financial reporting and for its assessment of the effectiveness of internal control over financial reporting, included in the accompanying item 9A(a), Management’s Report on Internal Control over Financial Reporting. Our responsibility is to express an opinion on the Company’s internal control over financial reporting based on our audit. We are a public accounting firm registered with the PCAOB and are required to be independent with respect to the Company in accordance with the U.S. federal securities laws and the applicable rules and regulations of the Securities and Exchange Commission and the PCAOB.
We conducted our audit in accordance with the standards of the PCAOB. Those standards require that we plan and perform the audit to obtain reasonable assurance about whether effective internal control over financial reporting was maintained in all material respects. Our audit of internal control over financial reporting included obtaining an understanding of internal control over financial reporting, assessing the risk that a material weakness exists, and testing and evaluating the design and operating effectiveness of internal control based on the assessed risk. Our audit also included performing such other procedures as we considered necessary in the circumstances. We believe that our audit provides a reasonable basis for our opinion.
Definition and Limitations of Internal Control Over Financial Reporting
A company’s internal control over financial reporting is a process designed to provide reasonable assurance regarding the reliability of financial reporting and the preparation of financial statements for external purposes in accordance with generally accepted accounting principles. A company’s internal control over financial reporting includes those policies and procedures that (1) pertain to the maintenance of records that, in reasonable detail, accurately and fairly reflect the transactions and dispositions of the assets of the company; (2) provide reasonable assurance that transactions are recorded as necessary to permit preparation of financial statements in accordance with generally accepted accounting principles, and that receipts and expenditures of the company are being made only in accordance with authorizations of management and directors of the company; and (3) provide reasonable assurance regarding prevention or timely detection of unauthorized acquisition, use, or disposition of the company’s assets that could have a material effect on the financial statements.
46
Table of Contents
REPORT OF INDEPENDENT REGISTERED
PUBLIC ACCOUNTING FIRM
Because of its inherent limitations, internal control over financial reporting may not prevent or detect misstatements. Also, projections of any evaluation of effectiveness to future periods are subject to the risk that controls may become inadequate because of changes in conditions, or that the degree of compliance with the policies or procedures may deteriorate.
| /s/ KPMG LLP |
Phoenix, Arizona
February 23, 2018
47
Table of Contents
CONSOLIDATED BALANCE SHEETS
(in thousands, except per share data)
| ASSETS | December 31, | |||||||
| 2017 | 2016 | |||||||
| Current assets: |
||||||||
| Cash and cash equivalents |
$ | 105,831 | $ | 202,882 | ||||
| Accounts receivable, net |
1,814,560 | 1,436,742 | ||||||
| Inventories |
194,529 | 148,203 | ||||||
| Inventories not available for sale |
36,956 | 68,619 | ||||||
| Other current assets |
152,467 | 127,159 | ||||||
|
|
|
|
|
|||||
| Total current assets |
2,304,343 | 1,983,605 | ||||||
| Property and equipment, net |
75,252 | 70,910 | ||||||
| Goodwill |
131,431 | 62,645 | ||||||
| Intangible assets, net |
100,778 | 20,707 | ||||||
| Deferred income taxes |
17,064 | 52,347 | ||||||
| Other assets |
56,783 | 29,086 | ||||||
|
|
|
|
|
|||||
| $ | 2,685,651 | $ | 2,219,300 | |||||
|
|
|
|
|
|||||
| LIABILITIES AND STOCKHOLDERS’ EQUITY | ||||||||
| Current liabilities: |
||||||||
| Accounts payable—trade |
$ | 899,075 | $ | 1,070,259 | ||||
| Accounts payable—inventory financing facility |
319,468 | 154,930 | ||||||
| Accrued expenses and other current liabilities |
175,860 | 151,895 | ||||||
| Current portion of long-term debt |
16,592 | 480 | ||||||
| Deferred revenue |
88,979 | 61,098 | ||||||
|
|
|
|
|
|||||
| Total current liabilities |
1,499,974 | 1,438,662 | ||||||
| Long-term debt |
296,576 | 40,251 | ||||||
| Deferred income taxes |
717 | 900 | ||||||
| Other liabilities |
44,915 | 26,044 | ||||||
|
|
|
|
|
|||||
| 1,842,182 | 1,505,857 | |||||||
|
|
|
|
|
|||||
| Commitments and contingencies |
||||||||
| Stockholders’ equity: |
||||||||
| Preferred stock, $0.01 par value, 3,000 shares authorized; no shares issued |
— | — | ||||||
| Common stock, $0.01 par value, 100,000 shares authorized; 35,829 and 35,484 shares issued and outstanding in 2017 and 2016, respectively |
358 | 355 | ||||||
| Additional paid-in capital |
317,155 | 309,650 | ||||||
| Retained earnings |
550,220 | 459,537 | ||||||
| Accumulated other comprehensive loss – foreign currency translation adjustments |
(24,264 | ) | (56,099 | ) | ||||
|
|
|
|
|
|||||
| Total stockholders’ equity |
843,469 | 713,443 | ||||||
|
|
|
|
|
|||||
| $ | 2,685,651 | $ | 2,219,300 | |||||
|
|
|
|
|
|||||
See accompanying notes to consolidated financial statements.
48
Table of Contents
CONSOLIDATED STATEMENTS OF OPERATIONS
(in thousands, except per share data)
| Years Ended December 31, | ||||||||||||
| 2017 | 2016 | 2015 | ||||||||||
| Net sales: |
||||||||||||
| Products |
$ | 6,038,744 | $ | 4,997,263 | $ | 4,945,547 | ||||||
| Services |
664,879 | 488,252 | 427,543 | |||||||||
|
|
|
|
|
|
|
|||||||
| Total net sales |
6,703,623 | 5,485,515 | 5,373,090 | |||||||||
|
|
|
|
|
|
|
|||||||
| Costs of goods sold: |
||||||||||||
| Products |
5,512,402 | 4,571,462 | 4,513,353 | |||||||||
| Services |
272,651 | 170,951 | 143,405 | |||||||||
|
|
|
|
|
|
|
|||||||
| Total costs of goods sold |
5,785,053 | 4,742,413 | 4,656,758 | |||||||||
|
|
|
|
|
|
|
|||||||
| Gross profit |
918,570 | 743,102 | 716,332 | |||||||||
| Operating expenses: |
||||||||||||
| Selling and administrative expenses |
723,328 | 585,243 | 584,906 | |||||||||
| Severance and restructuring expenses |
9,002 | 4,580 | 4,907 | |||||||||
| Loss on sale of foreign entity |
3,646 | — | — | |||||||||
| Acquisition-related expenses |
3,329 | 4,447 | — | |||||||||
|
|
|
|
|
|
|
|||||||
| Earnings from operations |
179,265 | 148,832 | 126,519 | |||||||||
| Non-operating (income) expense: |
||||||||||||
| Interest income |
(1,209 | ) | (1,066 | ) | (783 | ) | ||||||
| Interest expense |
19,174 | 8,628 | 7,224 | |||||||||
| Net foreign currency exchange loss (gain) |
855 | 522 | (393 | ) | ||||||||
| Other expense, net |
1,347 | 1,290 | 1,295 | |||||||||
|
|
|
|
|
|
|
|||||||
| Earnings before income taxes |
159,098 | 139,458 | 119,176 | |||||||||
| Income tax expense |
68,415 | 54,768 | 43,325 | |||||||||
|
|
|
|
|
|
|
|||||||
| Net earnings |
$ | 90,683 | $ | 84,690 | $ | 75,851 | ||||||
|
|
|
|
|
|
|
|||||||
| Net earnings per share: |
||||||||||||
| Basic |
$ | 2.54 | $ | 2.35 | $ | 2.00 | ||||||
|
|
|
|
|
|
|
|||||||
| Diluted |
$ | 2.50 | $ | 2.32 | $ | 1.98 | ||||||
|
|
|
|
|
|
|
|||||||
| Shares used in per share calculations: |
||||||||||||
| Basic |
35,741 | 36,102 | 37,984 | |||||||||
|
|
|
|
|
|
|
|||||||
| Diluted |
36,207 | 36,438 | 38,275 | |||||||||
|
|
|
|
|
|
|
|||||||
See accompanying notes to consolidated financial statements.
49
Table of Contents
CONSOLIDATED STATEMENTS OF COMPREHENSIVE INCOME
(in thousands)
| Years Ended December 31, | ||||||||||||
| 2017 | 2016 | 2015 | ||||||||||
| Net earnings |
$ | 90,683 | $ | 84,690 | $ | 75,851 | ||||||
| Other comprehensive income (loss), net of tax: |
||||||||||||
| Foreign currency translation adjustments |
31,835 | (16,063 | ) | (26,707 | ) | |||||||
|
|
|
|
|
|
|
|||||||
| Total comprehensive income |
$ | 122,518 | $ | 68,627 | $ | 49,144 | ||||||
|
|
|
|
|
|
|
|||||||
See accompanying notes to consolidated financial statements.
50
Table of Contents
CONSOLIDATED STATEMENTS OF STOCKHOLDERS’ EQUITY
(in thousands)
| Common Stock | Treasury Stock | Additional Paid-in |
Accumulated Comprehensive |
Retained | Total Stockholders’ |
|||||||||||||||||||||||||||
| Shares | Par Value | Shares | Amount | Capital | Loss | Earnings | Equity | |||||||||||||||||||||||||
| Balances at December 31, 2014 |
40,147 | $ | 401 | — | $ | — | $ | 337,167 | $ | (13,329 | ) | $ | 396,992 | $ | 721,231 | |||||||||||||||||
| Issuance of common stock under employee stock plans, net of shares withheld for payroll taxes |
259 | 3 | — | — | (2,268 | ) | — | — | (2,265 | ) | ||||||||||||||||||||||
| Stock-based compensation expense |
— | — | — | — | 8,922 | — | — | 8,922 | ||||||||||||||||||||||||
| Tax benefit from stock-based compensation |
— | — | — | — | 553 | — | — | 553 | ||||||||||||||||||||||||
| Repurchase of treasury stock |
— | — | (3,300 | ) | (91,843 | ) | — | — | — | (91,843 | ) | |||||||||||||||||||||
| Retirement of treasury stock |
(3,300 | ) | (33 | ) | 3,300 | 91,843 | (27,688 | ) | — | (64,122 | ) | — | ||||||||||||||||||||
| Foreign currency translation adjustments, net of tax |
— | — | — | — | — | (26,707 | ) | — | (26,707 | ) | ||||||||||||||||||||||
| Net earnings |
— | — | — | — | — | — | 75,851 | 75,851 | ||||||||||||||||||||||||
|
|
|
|
|
|
|
|
|
|
|
|
|
|
|
|
|
|||||||||||||||||
| Balances at December 31, 2015 |
37,106 | 371 | — | — | 316,686 | (40,036 | ) | 408,721 | 685,742 | |||||||||||||||||||||||
| Issuance of common stock under employee stock plans, net of shares withheld for payroll taxes |
269 | 3 | — | — | (2,222 | ) | — | — | (2,219 | ) | ||||||||||||||||||||||
| Stock-based compensation expense |
— | — | — | — | 11,058 | — | — | 11,058 | ||||||||||||||||||||||||
| Tax benefit from stock-based compensation |
— | — | — | — | 235 | — | — | 235 | ||||||||||||||||||||||||
| Repurchase of treasury stock |
— | — | (1,891 | ) | (50,000 | ) | — | — | — | (50,000 | ) | |||||||||||||||||||||
| Retirement of treasury stock |
(1,891 | ) | (19 | ) | 1,891 | 50,000 | (16,107 | ) | — | (33,874 | ) | — | ||||||||||||||||||||
| Foreign currency translation adjustments, net of tax |
— | — | — | — | — | (16,063 | ) | — | (16,063 | ) | ||||||||||||||||||||||
| Net earnings |
— | — | — | — | — | — | 84,690 | 84,690 | ||||||||||||||||||||||||
|
|
|
|
|
|
|
|
|
|
|
|
|
|
|
|
|
|||||||||||||||||
| Balances at December 31, 2016 |
35,484 | 355 | — | — | 309,650 | (56,099 | ) | 459,537 | 713,443 | |||||||||||||||||||||||
| Issuance of common stock under employee stock plans, net of shares withheld for payroll taxes |
345 | 3 | — | — | (5,321 | ) | — | — | (5,318 | ) | ||||||||||||||||||||||
| Stock-based compensation expense |
— | — | — | — | 12,826 | — | — | 12,826 | ||||||||||||||||||||||||
| Foreign currency translation adjustments, net of tax |
— | — | — | — | — | 31,835 | — | 31,835 | ||||||||||||||||||||||||
| Net earnings |
— | — | — | — | — | — | 90,683 | 90,683 | ||||||||||||||||||||||||
|
|
|
|
|
|
|
|
|
|
|
|
|
|
|
|
|
|||||||||||||||||
| Balances at December 31, 2017 |
35,829 | $ | 358 | — | $ | — | $ | 317,155 | $ | (24,264 | ) | $ | 550,220 | $ | 843,469 | |||||||||||||||||
|
|
|
|
|
|
|
|
|
|
|
|
|
|
|
|
|
|||||||||||||||||
See accompanying notes to consolidated financial statements.
51
Table of Contents
CONSOLIDATED STATEMENTS OF CASH FLOWS
(in thousands)
| Years Ended December 31, | ||||||||||||
| 2017 | 2016 | 2015 | ||||||||||
| Cash flows from operating activities: |
||||||||||||
| Net earnings |
$ | 90,683 | $ | 84,690 | $ | 75,851 | ||||||
| Adjustments to reconcile net earnings to net cash (used in) provided by operating activities: |
||||||||||||
| Depreciation and amortization of property and equipment |
25,787 | 27,493 | 26,649 | |||||||||
| Amortization of intangible assets |
16,812 | 10,637 | 11,308 | |||||||||
| Non-cash real estate impairment |
— | — | 800 | |||||||||
| Provision for losses on accounts receivable |
5,245 | 2,452 | 6,761 | |||||||||
| Write-downs of inventories |
2,776 | 2,934 | 3,997 | |||||||||
| Write-off of property and equipment |
418 | — | 535 | |||||||||
| Non-cash stock-based compensation |
12,826 | 11,058 | 8,922 | |||||||||
| Deferred income taxes |
19,139 | 10,517 | 5,174 | |||||||||
| Loss on sale of foreign entity |
3,646 | — | — | |||||||||
| Gain on sale of real estate |
— | (338 | ) | — | ||||||||
| Changes in assets and liabilities: |
||||||||||||
| Increase in accounts receivable |
(208,065 | ) | (168,966 | ) | (47,206 | ) | ||||||
| Increase in inventories |
(14,046 | ) | (50,712 | ) | (9,214 | ) | ||||||
| Decrease (increase) in other assets |
4,982 | (50,130 | ) | (26,714 | ) | |||||||
| (Decrease) increase in accounts payable |
(237,457 | ) | 193,582 | 113,594 | ||||||||
| (Decrease) increase in deferred revenue |
(27,184 | ) | 10,633 | 2,927 | ||||||||
| (Decrease) increase in accrued expenses and other liabilities |
(988 | ) | 12,278 | 7,718 | ||||||||
|
|
|
|
|
|
|
|||||||
| Net cash (used in) provided by operating activities |
(305,426 | ) | 96,128 | 181,102 | ||||||||
|
|
|
|
|
|
|
|||||||
| Cash flows from investing activities: |
||||||||||||
| Acquisitions, net of cash and cash equivalents acquired |
(186,932 | ) | (10,297 | ) | (44,221 | ) | ||||||
| Purchases of property and equipment |
(19,230 | ) | (12,266 | ) | (13,416 | ) | ||||||
| Proceeds from sale of foreign entity |
1,517 | — | — | |||||||||
| Proceeds from sale of real estate, net |
— | 1,378 | — | |||||||||
|
|
|
|
|
|
|
|||||||
| Net cash used in investing activities |
(204,645 | ) | (21,185 | ) | (57,637 | ) | ||||||
|
|
|
|
|
|
|
|||||||
| Cash flows from financing activities: |
||||||||||||
| Borrowings on senior revolving credit facility |
1,151,216 | 772,218 | 686,410 | |||||||||
| Repayments on senior revolving credit facility |
(1,033,716 | ) | (772,218 | ) | (686,410 | ) | ||||||
| Borrowings on accounts receivable securitization financing facility |
3,961,389 | 2,802,000 | 1,897,100 | |||||||||
| Repayments on accounts receivable securitization financing facility |
(3,975,889 | ) | (2,851,500 | ) | (1,869,100 | ) | ||||||
| Borrowings under Term Loan A |
175,000 | — | — | |||||||||
| Repayments under Term Loan A |
(8,750 | ) | — | — | ||||||||
| Repayments under other financing agreements |
(5,636 | ) | (1,309 | ) | (543 | ) | ||||||
| Payments on capital lease obligations |
(1,089 | ) | (445 | ) | (223 | ) | ||||||
| Net borrowings (repayments) under inventory financing facility |
141,037 | 48,603 | (16,454 | ) | ||||||||
| Payment of debt issuance costs |
(1,123 | ) | (3,360 | ) | — | |||||||
| Payment of payroll taxes on stock-based compensation through shares withheld |
(5,318 | ) | (2,219 | ) | (2,265 | ) | ||||||
| Repurchases of common stock |
— | (50,000 | ) | (91,843 | ) | |||||||
|
|
|
|
|
|
|
|||||||
| Net cash provided by (used in) financing activities |
397,121 | (58,230 | ) | (83,328 | ) | |||||||
|
|
|
|
|
|
|
|||||||
| Foreign currency exchange effect on cash and cash equivalent balances |
15,899 | (1,809 | ) | (16,683 | ) | |||||||
|
|
|
|
|
|
|
|||||||
| (Decrease) increase in cash and cash equivalents |
(97,051 | ) | 14,904 | 23,454 | ||||||||
| Cash and cash equivalents at beginning of year |
202,882 | 187,978 | 164,524 | |||||||||
|
|
|
|
|
|
|
|||||||
| Cash and cash equivalents at end of year |
$ | 105,831 | $ | 202,882 | $ | 187,978 | ||||||
|
|
|
|
|
|
|
|||||||
See accompanying notes to consolidated financial statements.
52
Table of Contents
NOTES TO CONSOLIDATED FINANCIAL STATEMENTS
(1) Operations and Summary of Significant Accounting Policies
Description of Business
We are a Fortune 500 global information technology (“IT”) provider helping businesses of all sizes – from small and medium sized firms to worldwide enterprises, governments, schools and health care organizations – define, architect, implement and manage Intelligent Technology SolutionsTM. We empower our clients to manage their IT environments so they can drive meaningful business outcomes today and transform their operations for tomorrow. Our company is organized in the following three operating segments, which are primarily defined by their related geographies:
| Operating Segment |
Geography | |
| North America |
United States and Canada | |
| EMEA |
Europe, Middle East and Africa | |
| APAC |
Asia-Pacific |
Our offerings in North America and certain countries in EMEA and APAC include hardware, software and services. Our offerings in the remainder of our EMEA and APAC segments are largely software and certain software-related services. A discussion of changes in our classification of certain revenue streams during 2017, can be found in Note 20. Prior year results were reclassified to conform to the current year presentation. These reclassifications had no effect on consolidated total net sales.
Acquisitions
Effective September 26, 2017, we acquired Caase Group B.V. (referred to herein as, “Caase.com”), a Dutch cloud service provider, for a purchase price, net of cash acquired, of approximately $6,038,000, subject to a final working capital adjustment. The acquisition was funded using cash on hand.
Effective January 6, 2017, we acquired Datalink Corporation (“Datalink”), a leading provider of IT services and enterprise data center solutions based in Eden Prairie, Minnesota, for a cash purchase price of $257,456,000, which included cash and cash equivalents acquired of $76,597,000. The acquisition was funded using cash on hand and borrowings under our revolving facility in the form of an incremental Term Loan A (“TLA”).
Effective September 1, 2016, we acquired Ignia Pty Ltd (“Ignia”), a business technology consulting and managed services provider headquartered in Perth, Australia, with an additional office in Melbourne, for a cash purchase price, net of cash acquired, of approximately $10,804,000. The acquisition was funded using cash on hand.
Effective October 1, 2015, we acquired BlueMetal Architects, Inc. (“BlueMetal”), an interactive design and technology architecture firm based in the Boston area with offices in Chicago and New York, for a cash purchase price, net of cash acquired, of approximately $44,221,000. The acquisition was funded using borrowings under our accounts receivable securitization financing facility.
Our results of operations include the results of Caase.com, Datalink, Ignia and BlueMetal from their respective acquisition dates. (See Note 21 for a discussion of our acquisitions.)
Principles of Consolidation and Presentation
The consolidated financial statements include the accounts of Insight Enterprises, Inc. and its wholly owned subsidiaries. All significant intercompany balances and transactions have been eliminated in consolidation. References to “the Company,” “Insight,” “we,” “us,” “our” and other similar words refer to Insight Enterprises, Inc. and its consolidated subsidiaries, unless the context suggests otherwise.
53
Table of Contents
INSIGHT ENTERPRISES, INC.
NOTES TO CONSOLIDATED FINANCIAL STATEMENTS (continued)
Use of Estimates
The preparation of consolidated financial statements in conformity with U.S. generally accepted accounting principles (“GAAP”) requires management to make estimates and assumptions that affect the reported amounts of assets and liabilities and disclosure of contingent assets and liabilities at the date of the consolidated financial statements. Additionally, these estimates and assumptions affect the reported amounts of net sales and expenses during the reporting period. Actual results could differ from those estimates. On an ongoing basis, we evaluate our estimates, including those related to sales recognition, anticipated achievement levels under partner funding programs, assumptions related to stock-based compensation valuation, allowances for doubtful accounts, valuation of inventories, litigation-related obligations, valuation allowances for deferred tax assets and impairment of long-lived assets, including purchased intangibles and goodwill, if indicators of potential impairment exist.
Cash and Cash Equivalents
We consider all highly liquid investments with maturities at the date of purchase of three months or less to be cash equivalents.
Book overdrafts represent the amount by which outstanding checks issued, but not yet presented to our banks for disbursement, exceed balances on deposit in applicable bank accounts and a legal right of offset with our positive cash balances in other financial institution accounts does not exist. Our book overdrafts, which are not directly linked to a credit facility or other bank overdraft arrangement, do not result in an actual bank financing, but rather constitute normal unpaid trade payables at the end of a reporting period. These amounts are included within our accounts payable balance in our consolidated balance sheets. The changes in these book overdrafts are included within the changes in accounts payable line item as a component of cash flows from operating activities in our consolidated statements of cash flows.
Allowance for Doubtful Accounts
We establish an allowance for doubtful accounts to reflect our best estimate of probable losses inherent in our accounts receivable balance. The allowance is based on our evaluation of the aging of the receivables, historical write-offs and the current economic environment. We write off individual accounts against the reserve when we no longer believe that it is probable that we will collect the receivable because we become aware of a client’s or partner’s inability to meet its financial obligations. Such awareness may be as a result of bankruptcy filings, or deterioration in the client’s or partner’s operating results or financial position.
Inventories
We state inventories, principally purchased IT hardware, at the lower of weighted average cost (which approximates cost under the first-in, first-out method) or net realizable value. We evaluate inventories for excess, obsolescence or other factors that may render inventories unmarketable at normal margins. Write-downs are recorded so that inventories reflect the approximate net realizable value and take into account contractual provisions with our partners governing price protection, stock rotation and return privileges relating to obsolescence. Because of the large number of transactions and the complexity of managing the price protection and stock rotation process, estimates are made regarding write-downs of the carrying amount of inventories. Additionally, assumptions about future demand, market conditions and decisions by manufacturers/publishers to discontinue certain products or product lines can affect our decision to write down inventories.
Inventories not available for sale relate to product sales transactions in which we are warehousing the product and will be deploying the product to our clients’ designated locations subsequent to period-end. Additionally, we may perform services on a portion of the product prior to shipment to our clients and will be paid a fee for doing so. Although these product contracts are non-cancelable with customary credit terms beginning the date the inventories are segregated in our warehouse and invoiced to the client and the warranty periods begin on the date of invoice, these transactions do not meet the sales recognition criteria under GAAP. Therefore, we do not record sales and the inventories are classified as inventories not available for sale on our consolidated balance sheet until the product is delivered. If clients remit payment before we deliver the product to them, we record the payments received as deferred revenue on our consolidated balance sheet until such time as the product is delivered.
54
Table of Contents
INSIGHT ENTERPRISES, INC.
NOTES TO CONSOLIDATED FINANCIAL STATEMENTS (continued)
Property and Equipment
We record property and equipment at cost. We capitalize major improvements and betterments, while maintenance, repairs and minor replacements are expensed as incurred. Depreciation or amortization is provided using the straight-line method over the following estimated economic lives of the assets:
| Estimated Economic Life | ||
| Leasehold improvements |
Shorter of underlying lease term or asset life | |
| Furniture and fixtures |
2 – 7 years | |
| Equipment |
3 – 5 years | |
| Software |
3 – 10 years | |
| Buildings |
29 years |
Costs incurred to develop internal-use software during the application development stage, including capitalized interest, are recorded in property and equipment at cost. External direct costs of materials and services consumed in developing or obtaining internal-use computer software and payroll and payroll-related costs for teammates who are directly associated with and who devote time to internal-use computer software development projects, to the extent of the time spent directly on the project and specific to application development, are capitalized.
Reviews are regularly performed to determine whether facts and circumstances exist which indicate that the useful life is shorter than originally estimated or the carrying amount of assets may not be recoverable. When an indication exists that the carrying amount of long-lived assets may not be recoverable, we assess the recoverability of our assets by comparing the projected undiscounted net cash flows associated with the related asset or group of assets over their remaining lives against their respective carrying amounts. Such impairment test is based on the lowest level for which identifiable cash flows are largely independent of the cash flows of other groups of assets and liabilities. Impairment, if any, is based on the excess of the carrying amount over the estimated fair value of those assets.
Goodwill
Goodwill is recorded when the purchase price paid for an acquisition exceeds the estimated fair value of net identified tangible and intangible assets acquired. Goodwill is tested for impairment at the reporting unit level on an annual basis in the fourth quarter and between annual tests if an event occurs or circumstances change that would more likely than not reduce the fair value of the reporting unit below its carrying value. We may first perform a qualitative assessment to determine whether it is more likely than not that the fair value of a reporting unit is less than its carrying value. If it is concluded that this is the case, it is necessary to perform a quantitative goodwill impairment test. Otherwise, the goodwill impairment test is not required. The quantitative goodwill impairment review process compares the fair value of the reporting unit in which goodwill resides to its carrying value. The Company has three reporting units, which are the same as our operating segments. Multiple valuation techniques can be used to assess the fair value of the reporting unit. All of these techniques include the use of estimates and assumptions that are inherently uncertain. Changes in these estimates and assumptions could materially affect the determination of fair value or goodwill impairment, or both.
Intangible Assets
We amortize intangible assets acquired in business combinations using the straight-line method over the following estimated economic lives of the intangible assets from the date of acquisition:
| Estimated Economic Life | ||
| Customer relationships |
2 –11 years | |
| Tradenames and Restrictive Covenant Agreements |
9 months –3 years |
We regularly perform reviews to determine if facts and circumstances exist which indicate that the useful lives of our intangible assets are shorter than originally estimated or the carrying amount of these assets may not be recoverable. When an indication exists that the carrying amount of intangible assets may not be recoverable, we assess the recoverability of our assets by comparing the projected undiscounted net cash flows associated with the related asset or group of assets over their remaining lives against their respective carrying amounts. Such impairment test is based on the lowest level for which identifiable cash flows are largely independent of the cash flows of other groups of assets and liabilities. Impairment, if any, is based on the excess of the carrying amount over the estimated fair value of those assets.
55
Table of Contents
INSIGHT ENTERPRISES, INC.
NOTES TO CONSOLIDATED FINANCIAL STATEMENTS (continued)
Trade Credits
Trade credit liabilities arise from aged unclaimed credit memos, duplicate payments, payments for returned product or overpayments made to us by our clients, and, to a lesser extent, from goods received by us from a partner for which we were never invoiced. Trade credit liabilities are included in accrued expenses and other current liabilities in our consolidated balance sheets. We derecognize the liability only if it has been extinguished, upon either (1) our payment of the liability to relieve our obligation or (2) our legal release from the related obligation, which is recorded as a reduction of costs of goods sold.
Self-Insurance
We are self-insured in the United States for medical insurance up to certain annual stop-loss limits and workers’ compensation claims up to certain deductible limits. We establish reserves for claims, both reported and incurred but not reported, using currently available information as well as our historical claims experience.
Treasury Stock
We record repurchases of our common stock as treasury stock at cost. We also record the subsequent retirement of these treasury shares at cost. The excess of the cost of the shares retired over their par value is allocated between additional paid-in capital and retained earnings. The amount recorded as a reduction of paid-in capital is based on the excess of the average original issue price of the shares over par value. The remaining amount is recorded as a reduction of retained earnings.
Sales Recognition
Sales are recognized when title and risk of loss are passed to the client, there is persuasive evidence of an arrangement for sale, delivery has occurred and/or services have been rendered, the sales price is fixed or determinable and collectibility is reasonably assured. Our standard sales terms are F.O.B. shipping point or equivalent, at which time title and risk of loss have passed to the client. However, because we either (i) have a general practice of covering client losses while products are in transit despite title and risk of loss contractually transferring at the point of shipment or (ii) have specifically stated F.O.B. destination contractual terms with the client, delivery is not deemed to have occurred until the point in time when the product is received by the client. We make provisions for estimated product returns that we expect to occur under our return policy based upon historical return rates.
We leverage drop-shipment arrangements with many of our partners and suppliers to deliver products to our clients without having to physically hold the inventory at our warehouses, thereby increasing efficiency and reducing costs. We recognize revenue for drop-shipment arrangements on a gross basis when the product is received by the client. We recognize revenue on a gross basis as the principal in the transaction because we control the transaction as the primary obligor for product fulfillment in the arrangement, we assume inventory risk if the product is returned by the client, we set the price of the product charged to the client, we assume credit risk for the amounts invoiced, and we work closely with our clients to determine their hardware and software specifications.
We record the freight we bill to our clients as net sales and the related freight costs we pay as costs of goods sold. We report sales net of any sales-based taxes assessed by governmental authorities that are imposed on and concurrent with sales transactions.
Revenue is recognized from software sales when clients acquire the right to use or copy software under license, but in no case prior to the commencement of the term of the initial software license agreement, provided that all other revenue recognition criteria have been met (i.e., evidence of the arrangement exists, the fee is fixed or determinable and collectibility of the fee is probable).
We sell certain third-party service contracts, software maintenance and cloud or software-as-a-service subscription products for which we are not the primary obligor. These sales do not meet the criteria for gross sales recognition, and thus are recorded on a net sales recognition basis. As we enter into contracts with third-party service providers or vendors and our clients, we evaluate whether the subsequent sales of such services should be recorded as gross sales or net sales. We determine whether we act as a principal in the transaction and assume the risks and rewards of ownership or if we are simply acting as an agent or broker. Under gross sales recognition, the selling price is recorded in sales and our cost to the third-party service provider or vendor is recorded in costs of goods sold. Under net sales recognition, the cost to the third-party service provider or vendor is recorded as a reduction to sales, resulting in net sales equal to the gross profit on the transaction, and there are no costs of goods sold.
56
Table of Contents
INSIGHT ENTERPRISES, INC.
NOTES TO CONSOLIDATED FINANCIAL STATEMENTS (continued)
We recognize revenue for sales of services ratably over the time period over which the service will be provided if there is no discernible pattern of recognition of the cost to perform the service. Billings for such services that are made in advance of the related revenue recognized are recorded as deferred revenue and recognized as revenue ratably over the billing coverage period. Revenue from certain arrangements that allow for the use of a product or service over a period of time without taking possession of software are also accounted for ratably over the time period over which the service will be provided.
We recognize revenue for professional services engagements that are on a time and materials basis based upon hours incurred as the services are performed and amounts are earned. Net sales for these services engagements are not a significant portion of our consolidated net sales.
Additionally, we sell certain professional services contracts on a fixed fee basis. Revenues for fixed fee professional services contracts are recognized based on the ratio of costs incurred to total estimated costs. Net sales for these service contracts are not a significant portion of our consolidated net sales.
In certain arrangements, we may provide a combination of hardware and software products and the provision of services. Services that are performed by us in conjunction with hardware and software sales that are completed in our facilities prior to shipment of the product are recognized upon delivery, when title passes to the client, for the hardware sale. Net sales of services that are performed at client locations are primarily service-only contracts and are recorded as sales when the services are performed. The total consideration for an arrangement with multiple deliverables is allocated to all deliverables that represent a separate unit of accounting using the relative selling price method.
Costs of Goods Sold
Costs of goods sold include product costs, direct costs incurred associated with delivering services, outbound and inbound freight costs and provisions for inventory reserves. These costs are reduced by provisions for supplier discounts and certain payments and credits received from partners, as described under “Partner Funding” below.
Selling and Administrative Expenses
Selling and administrative expenses include salaries and wages, bonuses and incentives, stock-based compensation expense, employee-related expenses, facility-related expenses, marketing and advertising expense, reduced by certain payments and credits received from partners related to shared marketing expense programs, as described under “Partner Funding” below, depreciation of property and equipment, professional fees, amortization of intangible assets, provisions for losses on accounts receivable and other operating expenses.
Partner Funding
We receive payments and credits from partners, including consideration pursuant to volume sales incentive programs, volume purchase incentive programs and shared marketing expense programs. Partner funding received pursuant to volume sales incentive programs is recognized as it is earned as a reduction to costs of goods sold. Partner funding received pursuant to volume purchase incentive programs is allocated as a reduction to inventories based on the applicable incentives earned from each partner and is recorded in cost of goods sold as the related inventory is sold. Partner funding received pursuant to shared marketing expense programs is recorded as it is earned as a reduction of the related selling and administrative expenses in the period the program takes place if the consideration represents a reimbursement of specific, incremental, identifiable costs. Consideration that exceeds the specific, incremental, identifiable costs is classified as a reduction of costs of goods sold. The amount of partner funding recorded as a reduction of selling and administrative expenses in our statements of operations totaled $53,227,000, $48,114,000 and $45,146,000 in 2017, 2016 and 2015, respectively.
57
Table of Contents
INSIGHT ENTERPRISES, INC.
NOTES TO CONSOLIDATED FINANCIAL STATEMENTS (continued)
Concentrations of Risk
Credit Risk
Although we are affected by the international economic climate, management does not believe material credit risk concentration existed at December 31, 2017. We monitor our clients’ financial condition and do not require collateral. Sales to the U.S. federal government, which are diversified across multiple agencies and departments, collectively accounts for approximately 9% of our 2017 net sales. Excluding these sales to the federal government, we are not reliant on any one client. No single client accounted for more than 4% of our consolidated net sales in 2017.
Supplier Risk
Purchases from Microsoft accounted for approximately 26% of our aggregate purchases in 2017. No other partner accounted for more than 10% of purchases in 2017. Our top five partners as a group for 2017 were Microsoft, Cisco Systems, Tech Data (a distributor), Dell and HP Inc., and approximately 60% of our total purchases during 2017 came from this group of partners. Although brand names and individual products are important to our business, we believe that competitive sources of supply are available in substantially all of our product categories such that, with the exception of Microsoft, we are not dependent on any single partner for sourcing products.
Advertising Costs
Advertising costs are expensed as they are incurred. Advertising expense of $47,053,000, $37,565,000 and $33,568,000 was recorded in 2017, 2016 and 2015, respectively. These amounts were predominantly offset by partner funding earned pursuant to shared marketing expense programs recorded as a reduction of selling and administrative expenses, as discussed in “Partner Funding” above.
Stock-Based Compensation
Stock-based compensation is measured based on the fair value of the award on the date of grant and the corresponding expense is recognized over the period during which an employee is required to provide service in exchange for the reward. Stock-based compensation expense is classified in the same line item of our consolidated statements of operations as other payroll-related expenses specific to the employee. Compensation expense related to service-based restricted stock units (“RSUs”) is recognized on a straight-line basis over the requisite service period for the entire award. Compensation expense related to performance-based RSUs is recognized on a straight-line basis over the requisite service period for each separately vesting portion of the award as if the award was, in-substance, multiple awards (i.e., a graded vesting basis).
Foreign Currencies
We use the U.S. dollar as our reporting currency. The functional currencies of our foreign subsidiaries are the local currencies. Accordingly, assets and liabilities of the subsidiaries are translated into U.S. dollars at the exchange rate in effect at the balance sheet dates. Income and expense items are translated at the average exchange rate for each month within the year. The resulting translation adjustments are recorded directly in accumulated other comprehensive income, net of tax – foreign currency translation adjustments as a separate component of stockholders’ equity. Net foreign currency transaction gains/losses, including transaction gains/losses on intercompany balances that are not of a long-term investment nature and non-functional currency cash balances, are reported as a separate component of non-operating (income) expense in our consolidated statements of operations.
Derivative Financial Instruments
We enter into forward foreign exchange contracts to mitigate the risk of non-functional currency monetary assets and liabilities on our consolidated financial statements. These forward contracts are not designated as hedge instruments. The fair value of all derivative assets and liabilities are recorded gross in the other current assets and accrued expenses and other current liabilities sections of our consolidated balance sheets. Gains/losses are recorded net in non-operating (income) expense in our consolidated statements of operations.
58
Table of Contents
INSIGHT ENTERPRISES, INC.
NOTES TO CONSOLIDATED FINANCIAL STATEMENTS (continued)
Income Taxes
Income taxes are accounted for under the asset and liability method. Deferred tax assets and liabilities are recognized for the future tax consequences attributable to differences between the financial statement carrying amounts of existing assets and liabilities and their respective tax bases and operating loss and tax credit carry forwards. Deferred tax assets and liabilities are measured using enacted tax rates expected to apply to taxable earnings in the years in which those temporary differences are expected to be recovered or settled. The effect on deferred tax assets and liabilities of a change in tax rates is recognized in earnings in the period that includes the enactment date.
We recognize net deferred tax assets to the extent that we believe these assets are more likely than not to be realized. In making such a determination, we consider all available positive and negative evidence, including future reversals of existing taxable temporary differences, projected future taxable income, tax-planning strategies and results of recent operations. If we determine that we would be able to realize our deferred tax assets in the future in excess of their net recorded amount, we would make an adjustment to the deferred tax asset valuation allowance, which would reduce the provision for income taxes.
We record uncertain tax positions on the basis of a two-step process whereby (1) we determine whether it is more likely than not that the tax positions will be sustained on the basis of the technical merits of the position and (2) for those tax positions that meet the more-likely-than-not recognition threshold, we recognize the largest amount of tax benefit that is more than 50 percent likely to be realized upon ultimate settlement with the related tax authority. Interest and penalties related to unrecognized tax benefits are recognized within the income tax expense line in our consolidated statements of operations. Accrued interest and penalties are included within the related tax liability line in our consolidated balance sheets.
Net Earnings Per Share (“EPS”)
Basic EPS is computed by dividing net earnings available to common stockholders by the weighted average number of common shares outstanding during each year. Diluted EPS is computed on the basis of the weighted average number of shares of common stock plus the effect of dilutive potential common shares outstanding during the period using the treasury stock method. Dilutive potential common shares include outstanding RSUs. A reconciliation of the denominators of the basic and diluted EPS calculations follows (in thousands, except per share data):
| Years Ended December 31, | ||||||||||||
| 2017 | 2016 | 2015 | ||||||||||
| Numerator: |
||||||||||||
| Net earnings |
$ | 90,683 | $ | 84,690 | $ | 75,851 | ||||||
|
|
|
|
|
|
|
|||||||
| Denominator: |
||||||||||||
| Weighted-average shares used to compute basic EPS |
35,741 | 36,102 | 37,984 | |||||||||
| Dilutive potential common shares due to dilutive RSUs, net of tax effect |
466 | 336 | 291 | |||||||||
|
|
|
|
|
|
|
|||||||
| Weighted-average shares used to compute diluted EPS |
36,207 | 36,438 | 38,275 | |||||||||
|
|
|
|
|
|
|
|||||||
| Net earnings per share: |
||||||||||||
| Basic |
$ | 2.54 | $ | 2.35 | $ | 2.00 | ||||||
|
|
|
|
|
|
|
|||||||
| Diluted |
$ | 2.50 | $ | 2.32 | $ | 1.98 | ||||||
|
|
|
|
|
|
|
|||||||
In 2017, 2016 and 2015, approximately 40,000, 36,000 and 1,000, respectively, of our RSUs were not included in the diluted EPS calculations because their inclusion would have been anti-dilutive. These share-based awards could be dilutive in the future.
Recently Issued Accounting Standards
In January 2017, the Financial Accounting Standards Board (“FASB”) issued Accounting Standard Update (“ASU”) No. 2017-04, “Simplifying the Test for Goodwill Impairment.” The new standard requires an entity to no longer perform a hypothetical purchase price allocation to measure goodwill impairment. Instead, impairment will be measured using the difference between the carrying amount and the fair value of the reporting unit. The new standard is effective for annual and interim periods beginning after December 15, 2019, and early adoption is permitted. We adopted this new standard when we performed our annual goodwill impairment analysis for 2017 in the fourth quarter of 2017 and applied it prospectively. The adoption of this standard did not have a material effect on our consolidated financial statements. See “Goodwill” above for further details about our test for goodwill impairment.
59
Table of Contents
INSIGHT ENTERPRISES, INC.
NOTES TO CONSOLIDATED FINANCIAL STATEMENTS (continued)
In November 2016, the FASB issued ASU No. 2016-18, “Restricted Cash.” The new standard requires companies to include cash and cash equivalents that have restrictions on withdrawal or use within total cash and cash equivalents when reconciling the beginning-of-period and end-of-period total amounts shown on the statement of cash flows. The new standard is effective for interim and annual periods beginning after December 15, 2017, and early adoption is permitted. The new standard is required to be adopted retrospectively. We plan to adopt this new standard in the first quarter of 2018 and do not expect the adoption to have a material effect on our consolidated financial statements.
In August 2016, the FASB issued ASU No. 2016-15, “Classification of Certain Cash Receipts and Cash Payments.” The new standard is intended to reduce diversity in practice in how certain transactions are classified in the statement of cash flows. It addresses eight specific cash flow issues to clarify the presentation and classification of cash receipts and cash payments in the statement of cash flows. The new standard is effective for interim and annual periods beginning after December 15, 2017, and early adoption is permitted. The new standard is required to be adopted retrospectively. We plan to adopt this new standard in the first quarter of 2018 and do not expect the adoption to have a material effect on our consolidated financial statements.
In March 2016, the FASB issued ASU No. 2016-09, “Improvements to Employee Share-Based Payment Accounting.” This new standard simplifies the accounting for share-based payment transactions, including the income tax consequences, the calculation of diluted earnings per share, the treatment of forfeitures, the classification of awards as either equity or liabilities and the classification on the statement of cash flows. This new standard increases volatility in the statement of operations by requiring all excess tax benefits and deficiencies to be recognized as income tax benefit or expense in the statement of operations and treated as discrete items in the period in which they occur. We adopted the new standard as of January 1, 2017, and prospectively applied the provisions in this guidance requiring recognition of excess tax benefits and deficits in the statement of operations, which resulted in an income tax benefit of $2,483,000 for the year ended December 31, 2017. The corresponding increase in net earnings equated to $0.07 per diluted share during the year ended December 31, 2017. Also, as a result of the adoption of the new standard, we made an accounting policy election to recognize forfeitures as they occur and no longer estimate expected forfeitures. The provisions in this guidance requiring the use of a modified retrospective transition method would have required us to record a cumulative effect adjustment in retained earnings as of January 1, 2017. We elected not to adjust retained earnings and to record such cumulative effect adjustment as stock-based compensation in the first quarter of 2017 on the basis of immateriality. Lastly, we applied the provisions of this guidance relating to classification on the statement of cash flows retrospectively. As a result, excess tax benefits from employee gains on stock-based compensation of $323,000 and $592,000 were reclassified from cash flows from financing activities to cash flows from operating activities for the years ended December 31, 2016 and 2015, respectively, to conform to the current period presentation.
In February 2016, the FASB issued ASU No. 2016-02, “Leases,” which supersedes the existing lease recognition requirements in the existing accounting standard for leases. The core principal of the new standard is that an entity should recognize assets and liabilities arising from a lease for both financing and operating leases, along with additional qualitative and quantitative disclosures. The new standard will be effective for fiscal years beginning after December 15, 2018, including interim periods within such fiscal years. Early adoption is permitted. The new standard is to be applied using a modified retrospective transition method with the option to elect a number of practical expedients. We expect to adopt the new standard in the first quarter of 2019 and are in the process of determining the effect that the adoption of ASU 2016-02 will have on our consolidated financial statements and disclosures. We have not yet selected our planned transition approach.
In January 2016, the FASB issues ASU No. 2016-01, “Financial Instruments Overview: Recognition and Measurement of Financial Assets and Financial Liabilities.” The new standard amends the guidance on the classification and measurement of financial instruments and changes the accounting for investments in equity securities. The new standard is effective for annual and interim periods in fiscal years beginning after December 15, 2017, and early adoption is permitted. We plan to adopt this new standard in the first quarter of 2018 and do not expect the adoption to have a material effect on our consolidated financial statements.
60
Table of Contents
INSIGHT ENTERPRISES, INC.
NOTES TO CONSOLIDATED FINANCIAL STATEMENTS (continued)
In July 2015, the FASB issued ASU No. 2015-11, “Simplifying the Measurement of Inventory.” This standard changes the measurement from lower of cost or market to lower of cost and net realizable value. We adopted the standard in the first quarter of 2017 and applied the provisions prospectively. The standard did not have a material effect on our consolidated financial statements.
On May 28, 2014, the FASB issued ASU No. 2014-09, “Revenue from Contracts with Customers,” which amends the existing accounting standards for revenue recognition. The core principle of the guidance is that an entity should recognize revenue to depict the transfer of promised goods or services to customers in an amount that reflects the consideration to which the entity expects to be entitled in exchange for those goods or services. The standard, as amended, will be effective for the Company beginning in the first quarter of 2018. The standard permits two methods of adoption: retrospectively to each prior reporting period presented (the full retrospective transition method) or retrospectively with the cumulative effect adjustment of initially applying the new standard recognized at the date of initial application (the modified retrospective transition method).
We will adopt the standard as of January 1, 2018, and will utilize the modified retrospective transition method. While we are still finalizing our accounting policies under the new standard and are in the process of quantifying the cumulative effect adjustment from prior periods that will be recognized in our consolidated balance sheet as of the date of adoption as an adjustment to retained earnings, to date we have concluded:
| • | In sales transactions for certain security software products that are sold with integral third-party delivered software maintenance, we will change to record both the software license and the accompanying software maintenance on a net basis, as the agent in the arrangement. Under current guidance, we bifurcate the sale of the software license from the sale of the maintenance contract, record the sale of the software product on a gross basis, as the principal in the arrangement, and record the sale of the software maintenance on a net basis, as an agent in the arrangement. This change will lead us to report lower net sales in future periods related to security software products. This change will have no effect on gross profit dollars, but all other things being equal, gross margin for these specific sales would increase compared to prior years. |
| • | The accounting for inventories not available for sale, otherwise known as bill and hold arrangements, will change such that a portion of revenue under the contracts will be recognized earlier than we are recognizing under current accounting standards. Bill and hold arrangements are inventory balances owned and paid for by our clients, but for which we are warehousing the product and will be deploying it to the clients’ locations in a future period. |
| • | The accounting for renewals of certain software term licenses will change to delay revenue recognition until the beginning of the renewal period. Under current guidance, we recognize revenue as the renewal order is completed. We do not believe this change will have a material effect on our sales or profitability trends, as it is only a change in timing of recognition between periods. |
| • | Sales commissions on contracts with performance periods that exceed one year will be recorded as an asset and amortized to expense over the related contract performance period as opposed to being expensed in the period the transaction is generated. |
Our analysis and evaluation of the new standard will continue through to when we publish our first quarter of 2018 results. A substantial amount of work has been completed, and findings and progress to date have been reported to management and the Audit Committee. Although we currently believe that the changes overall resulting from the adoption of the new standard will not lead to operating trends that are materially different than we reported in prior years, our evaluation of the effects is still being finalized. Currently, we estimate the total cumulative effect adjustment from prior periods that will be recognized in our consolidated balance sheet as of the date of adoption as an adjustment to retained earnings to be less than $10,000,000, on a pretax basis.
61
Table of Contents
INSIGHT ENTERPRISES, INC.
NOTES TO CONSOLIDATED FINANCIAL STATEMENTS (continued)
(2) Property and Equipment
Property and equipment consist of the following (in thousands):
| December 31, | ||||||||
| 2017 | 2016 | |||||||
| Software |
$ | 171,701 | $ | 159,442 | ||||
| Buildings |
65,468 | 63,253 | ||||||
| Equipment |
103,542 | 93,553 | ||||||
| Furniture and fixtures |
38,459 | 36,526 | ||||||
| Leasehold improvements |
25,981 | 21,132 | ||||||
| Land |
5,179 | 5,131 | ||||||
|
|
|
|
|
|||||
| 410,330 | 379,037 | |||||||
| Accumulated depreciation and amortization |
(335,078 | ) | (308,127 | ) | ||||
|
|
|
|
|
|||||
| Property and equipment, net |
$ | 75,252 | $ | 70,910 | ||||
|
|
|
|
|
|||||
We periodically assess whether any indicators of impairment existed related to our property and equipment. We incurred non-cash charges of $418,000 and $535,000 during 2017 and 2015, respectively, to write-off certain property and equipment. No such charges were incurred in 2016.
Depreciation and amortization expense related to property and equipment was $25,787,000, $27,493,000 and $26,649,000 in 2017, 2016 and 2015, respectively. Interest charges capitalized in connection with internal-use software development projects in 2017, 2016 and 2015 were immaterial.
(3) Goodwill
The changes in the carrying amount of goodwill for the year ended December 31, 2017 are as follows (in thousands):
| North America | EMEA | APAC | Consolidated | |||||||||||||
| Goodwill |
$ | 379,617 | $ | 151,439 | $ | 13,973 | $ | 545,029 | ||||||||
| Accumulated impairment losses |
(323,422 | ) | (151,439 | ) | (13,973 | ) | (488,834 | ) | ||||||||
| Goodwill acquired during 2016 |
(507 | ) | — | 6,957 | 6,450 | |||||||||||
|
|
|
|
|
|
|
|
|
|||||||||
| Balance at December 31, 2016 |
55,688 | — | 6,957 | 62,645 | ||||||||||||
| Goodwill acquired during 2017 |
64,140 | 4,041 | 605 | 68,786 | ||||||||||||
|
|
|
|
|
|
|
|
|
|||||||||
| Balance at December 31, 2017 |
$ | 119,828 | $ | 4,041 | $ | 7,562 | $ | 131,431 | ||||||||
|
|
|
|
|
|
|
|
|
|||||||||
On September 26, 2017, we acquired Caase.com, which has been integrated into our EMEA business. Under the purchase method of accounting, the purchase price for the acquisition was allocated to the tangible and identifiable intangible assets acquired and liabilities assumed based on their estimated fair values. The excess purchase price over fair value of net assets acquired of approximately $4,041,000 was recorded as goodwill in the EMEA reporting unit (see Note 21). The primary driver for this acquisition was to strengthen our ability to deliver Intelligent Technology Solutions to our clients in the Netherlands, with a view to expand into the wider European region in the near future.
On January 6, 2017, we acquired Datalink, which has been integrated into our North America business. Under the purchase method of accounting, the purchase price for the acquisition was allocated to the tangible and identifiable intangible assets acquired and liabilities assumed based on their estimated fair values. The excess purchase price over fair value of net assets acquired of approximately $64,140,000 was recorded as goodwill in the North America reporting unit (see Note 21). The primary driver for this acquisition was to strengthen our position as a leading IT solutions provider with deep technical talent delivering data center solutions to clients on premise or in the cloud.
On September 1, 2016, we acquired Ignia, which has been integrated into our APAC business. Under the purchase method of accounting, the purchase price for the acquisition was allocated to the tangible and identifiable intangible assets acquired and liabilities assumed based on their estimated fair values. The excess purchase price over fair value of net assets acquired of approximately $6,957,000 was recorded as goodwill in the APAC reporting unit (see Note 21). The primary driver for this acquisition was to expand our global footprint in the areas of application design, digital solutions, cloud, mobility and business analytics, while also building on our unique position to bring solutions powered by Intelligent Technology™ to our clients in the Asia-Pacific region. The change in goodwill in our APAC operating segment as of December 31, 2017 compared to the balance as of December 31, 2016 resulted from a final working capital adjustment of $35,000 during the year and foreign currency translation adjustments associated with the goodwill balance.
62
Table of Contents
INSIGHT ENTERPRISES, INC.
NOTES TO CONSOLIDATED FINANCIAL STATEMENTS (continued)
On October 1, 2015, we acquired BlueMetal, which has been integrated into our North America business. In 2016, we resolved the working capital contingency associated with the acquisition of BlueMetal. We recorded the adjustment of the purchase price allocation as a reduction of goodwill in our North America operating segment upon the receipt of $507,000 in cash during 2016.
During 2017, we periodically assessed whether any indicators of impairment existed which would require us to perform an interim impairment review. As of each interim period end during the year, we concluded that a triggering event had not occurred that would more likely than not reduce the fair value of our reporting units below their carrying values. We performed our annual test of goodwill for impairment during the fourth quarter of 2017. The results of the goodwill impairment test indicated that the fair values of our North America, EMEA and APAC reporting units, estimated using the market approach, were in excess of their respective carrying values.
(4) Intangible Assets
Intangible assets consist of the following (in thousands):
| December 31, | ||||||||
| 2017 | 2016 | |||||||
| Customer relationships |
$ | 133,660 | $ | 41,711 | ||||
| Other |
4,475 | 1,978 | ||||||
|
|
|
|
|
|||||
| 138,135 | 43,689 | |||||||
| Accumulated amortization |
(37,357 | ) | (22,982 | ) | ||||
|
|
|
|
|
|||||
| Intangible assets, net |
$ | 100,778 | $ | 20,707 | ||||
|
|
|
|
|
|||||
In March and December 2017, respectively, the customer relationship intangible assets associated with the 2012 acquisition of Inmac and the 2011 acquisition of Ensynch were fully amortized. As such, the gross intangible assets balance and the accumulated amortization balance were both reduced by approximately $2,516,000, which had no effect on the net intangible assets balance reported in the accompanying consolidated balance sheet as of December 31, 2017.
In September 2016, the customer relationship intangible assets associated with the 2006 acquisition of Software Spectrum Inc. and the 2008 acquisition of MINX Limited in the United Kingdom were fully amortized. As such, the gross intangible assets balance and the accumulated amortization balance were both reduced by approximately $81,817,000, which had no effect on the net intangible assets balance reported in the accompanying consolidated balance sheet as of December 31, 2016.
During 2017, we periodically assessed whether any indicators of impairment existed related to our intangible assets. As of each interim period end during the year, we concluded that a triggering event had not occurred that would more likely than not reduce the fair value of our intangible assets below their carrying values.
Amortization expense recognized in 2017, 2016 and 2015 was $16,812,000, $10,637,000 and $11,308,000, respectively. Future amortization expense for the remaining unamortized balance as of December 31, 2017 is estimated as follows (in thousands):
| Years Ending December 31, |
Amortization Expense | |||
| 2018 |
$ | 14,260 | ||
| 2019 |
11,690 | |||
| 2020 |
11,677 | |||
| 2021 |
11,638 | |||
| 2022 |
11,638 | |||
| Thereafter |
39,875 | |||
|
|
|
|||
| Total amortization expense |
$ | 100,778 | ||
|
|
|
|||
63
Table of Contents
INSIGHT ENTERPRISES, INC.
NOTES TO CONSOLIDATED FINANCIAL STATEMENTS (continued)
(5) Accounts Payable - Inventory Financing Facility
We have entered into an agreement with a financial intermediary to facilitate the purchase of inventory from various suppliers under certain terms and conditions, as described below. These amounts are classified separately as accounts payable - inventory financing facility in the accompanying consolidated balance sheets.
The aggregate availability for vendor purchases under our inventory financing facility is $325,000,000. From time to time and at our option, we may request to increase the aggregate amount available under the inventory financing facility by up to an aggregate of $25,000,000, subject to customary conditions. The facility matures on June 23, 2021. Additionally, the facility may be renewed under certain circumstances described in the agreement for successive 12-month periods. Interest does not accrue on accounts payable under this facility provided the accounts payable are paid within stated vendor terms (typically 60 days). We impute interest on the average daily balance outstanding during these stated vendor terms based on our blended incremental borrowing rate during the period under our senior revolving credit facility and our accounts receivable securitization financing facility. Imputed interest of $6,736,000, $3,385,000 and $3,406,000 was recorded in 2017, 2016 and 2015, respectively. If balances are not paid within stated vendor terms, they will accrue interest at prime plus 1.25%. The facility is guaranteed by the Company and each of its material domestic subsidiaries and is secured by a lien on substantially all of the Company’s and each guarantor’s assets.
(6) Debt, Capital Lease and Other Financing Obligations
Debt
Our long-term debt consists of the following (in thousands):
| December 31, | ||||||||
| 2017 | 2016 | |||||||
| Senior revolving credit facility |
$ | 117,500 | $ | — | ||||
| Term Loan A (less unamortized debt issuance costs of $873) |
165,377 | — | ||||||
| Accounts receivable securitization financing facility |
25,000 | 39,500 | ||||||
| Capital leases and other financing obligations |
5,291 | 1,231 | ||||||
|
|
|
|
|
|||||
| Total |
313,168 | 40,731 | ||||||
| Less: current portion of long-term debt |
(16,592 | ) | (480 | ) | ||||
|
|
|
|
|
|||||
| Long-term debt |
$ | 296,576 | $ | 40,251 | ||||
|
|
|
|
|
|||||
Our senior revolving credit facility (“revolving facility”) is used for general corporate purposes, which may include acquisitions and share repurchases, and may be used for borrowings in certain foreign currencies and for letters of credit, in each case up to specified sublimits. The revolving facility has an aggregate U.S. dollar equivalent maximum borrowing amount of $350,000,000, including a maximum borrowing capacity that may be used for borrowing in certain foreign currencies of $50,000,000. On January 6, 2017, we amended our revolving facility to expand the facility by $175,000,000 in the form of an incremental Term Loan A (“TLA”). Pricing and all other general terms and conditions of the TLA are governed by the existing revolving facility. The TLA requires amortization payments of 5%, 7.5%, 10%, 12.5% and 15% of the original principal balance in years one through five, respectively, to be paid quarterly through March 31, 2021, with the remaining balance of $107,187,500 due at maturity on June 23, 2021. The revolving facility and TLA are guaranteed by the Company’s material domestic subsidiaries and are secured by a lien on substantially all of the Company’s and each guarantor’s assets.
The interest rates applicable to borrowings under the revolving facility and the TLA are based on the leverage ratio of the Company as set forth on a pricing grid in the agreement. Amounts outstanding under the revolving facility and TLA bear interest, payable quarterly, at a floating rate equal to the prime rate plus a predetermined spread of 0.00% to 0.75% or, at our option, a LIBOR rate plus a pre-determined spread of 1.25% to 2.25%. The floating interest rate applicable at December 31, 2017 was 3.49% per annum for the revolving facility and 3.57% per annum for the TLA. In addition, we pay a quarterly commitment fee on the unused portion of the facility of 0.25% to 0.45%, and our letter of credit participation fee ranges from 1.25% to 2.25%. During 2017, 2016 and 2015, due to availability under our ABS facility, weighted average borrowings under our revolving facility were $63,604,000, $35,811,000 and $21,987,000, respectively. Interest expense associated with the revolving facility and TLA was $8,491,000, $2,191,000 and $1,813,000 in 2017, 2016 and 2015, respectively, including the commitment fee and amortization of deferred financing fees. As of December 31, 2017, we had $117,500,000 outstanding under our revolving facility and approximately $166,250,000 outstanding under the TLA. See discussion of the maximum leverage ratio under “Debt Covenants” below. The revolving facility matures on June 23, 2021.
64
Table of Contents
INSIGHT ENTERPRISES, INC.
NOTES TO CONSOLIDATED FINANCIAL STATEMENTS (continued)
Our accounts receivable securitization financing facility (“ABS facility”) has a maximum aggregate borrowing availability of $250,000,000 and matures on June 23, 2019. Under our ABS facility, we can sell receivables periodically to a special purpose accounts receivable and financing entity (the “SPE”), which is exclusively engaged in purchasing receivables from us. The SPE is a wholly-owned, bankruptcy-remote entity that we have included in our consolidated financial statements. The SPE funds its purchases by selling undivided interests in eligible trade accounts receivable to independent financial institution purchasers under the ABS facility (“Purchasers”), which is administered by an independent financial institution agent. The SPE’s assets are available first and foremost to satisfy the claims of the Purchasers, and we cannot convey any interest in the receivables sold to the Purchasers (or allow any adverse claims on the receivables) without the consent of the Purchasers. In addition, the SPE is required to maintain a minimum capital amount and various reserves pursuant to the terms of the ABS facility. We maintain effective control over the receivables that are sold. Accordingly, the receivables remain recorded on our consolidated balance sheets. At December 31, 2017 and 2016, the SPE owned $1,141,520,000 and $936,467,000, respectively, of receivables recorded at fair value and included in the accompanying consolidated balance sheets. While the ABS facility has a stated maximum amount, the actual availability under the ABS facility is limited by the quantity and quality of the underlying accounts receivable. As of December 31, 2017, qualified receivables were sufficient to permit access to the full $250,000,000 facility amount, of which $25,000,000 was outstanding. See discussion of the maximum leverage ratio under “Debt Covenants” below.
Under the amended ABS facility, interest is payable monthly, and the floating interest rate applicable at December 31, 2017 was 2.41% per annum, including a 0.85% usage fee on any outstanding balances. In addition, we pay a monthly commitment fee on the unused portion of the facility of 0.375%. During the years ended December 31, 2017, 2016 and 2015, the weighted average interest rates on amounts outstanding under our ABS facility, including the usage and commitment fees and the amortization of deferred financing fees, were 2.4%, 1.9% and 1.6%, respectively. Weighted average borrowings under our ABS facility in 2017, 2016 and 2015 were $153,759,000, $145,376,000 and $112,101,000, respectively.
Debt Covenants
Our revolving facility, our TLA and our ABS facility contain various covenants customary for transactions of this type, including limitations on the payment of dividends and the requirement that we comply with maximum leverage and minimum fixed charge ratio requirements, comply with a minimum receivables requirement and meet monthly, quarterly and annual reporting requirements. If we fail to comply with these covenants, the lenders would be able to demand payment within a specified period of time. Further, the terms of the ABS facility identify various circumstances that would result in an “amortization event” under the facility.
Our consolidated debt balance that can be outstanding at the end of any fiscal quarter under our revolving facility, our TLA and our ABS facility is limited by certain financial covenants, particularly a maximum leverage ratio. The maximum leverage ratio is calculated as aggregate debt outstanding divided by the sum of our trailing twelve month net earnings (loss) plus (i) interest expense, excluding non-cash imputed interest on our inventory financing facility, (ii) income tax expense (benefit), (iii) depreciation and amortization, (iv) non-cash stock-based compensation, (v) extraordinary or non-recurring non-cash losses or expenses and (vi) certain cash restructuring and acquisition-related charges and synergies, not to exceed a specified cap (“adjusted earnings”). The maximum leverage ratio permitted under the facilities was increased to 3.50 times trailing twelve-month adjusted earnings in conjunction with the acquisition of Datalink effective January 6, 2017. A significant drop in our adjusted earnings would limit the amount of indebtedness that could be outstanding at the end of any fiscal quarter to a level that would be below our consolidated maximum facility amount. Based on our maximum leverage ratio as of December 31, 2017, our aggregate debt balance that could have been outstanding under our revolving facility, our TLA and our ABS facility was the full amount of the maximum borrowing capacity of $766,250,000, of which $117,500,000 was outstanding under our revolving facility, $166,250,000 was outstanding under our TLA and $25,000,000 was outstanding under our ABS facility at December 31, 2017.
65
Table of Contents
INSIGHT ENTERPRISES, INC.
NOTES TO CONSOLIDATED FINANCIAL STATEMENTS (continued)
Capital Lease and Other Financing Obligations
In August 2017, we entered into two 12-month capital leases for certain IT equipment. In May 2017 and March 2016, we entered into capitalized leases with 36-month terms for certain IT equipment. The capital leases were non-cash transactions and, accordingly, have been excluded from our consolidated statements of cash flows for the years ended December 31, 2017 and 2016.
Future minimum payments under the capitalized leases consist of the following as of December 31, 2017 (in thousands):
| Years Ending December 31, |
||||
| 2018 |
$ | 1,550 | ||
| 2019 |
1,016 | |||
| 2020 |
381 | |||
|
|
|
|||
| Total minimum lease payments |
2,947 | |||
| Less amount representing interest |
(145 | ) | ||
|
|
|
|||
| Present value of minimum lease payments |
$ | 2,802 | ||
|
|
|
|||
From time to time, we also enter into other financing agreements with financial intermediaries to facilitate the purchase of products from certain vendors. In conjunction with our acquisition of Datalink effective January 6, 2017, we acquired certain obligations associated with Datalink’s financing of the equipment that it leased to its clients. At December 31, 2017, these financing obligations totaled $2,489,000. No amounts were owed under other financing agreements as of December 31, 2016.
The current and long-term portions of our capital lease and other financing obligations are included in the current and long-term portions of long-term debt in the table above and in our consolidated balance sheets as of December 31, 2017 and 2016.
(7) Operating Leases
We have non-cancelable operating leases with third parties, primarily for administrative and distribution center space and computer equipment. Our facilities leases generally provide for periodic rent increases and many contain escalation clauses and renewal options. We recognize rent expense on a straight-line basis over the lease term. Rental expense for these third-party operating leases was $19,126,000, $14,444,000 and $14,737,000 in 2017, 2016 and 2015, respectively, and is included in selling and administrative expenses in the accompanying consolidated statements of operations.
Future minimum lease payments under non-cancelable operating leases (with initial or remaining lease terms in excess of one year) as of December 31, 2017 are as follows (in thousands):
| Years Ending December 31, |
||||
| 2018 |
18,601 | |||
| 2019 |
16,617 | |||
| 2020 |
12,122 | |||
| 2021 |
9,170 | |||
| 2022 |
6,966 | |||
| Thereafter |
12,023 | |||
|
|
|
|||
| Total minimum lease payments |
$ | 75,499 | ||
|
|
|
|||
Amounts in the table above exclude approximately $1.6 million in each of 2018 and 2019 in non-cancellable rental income.
66
Table of Contents
INSIGHT ENTERPRISES, INC.
NOTES TO CONSOLIDATED FINANCIAL STATEMENTS (continued)
(8) Severance and Restructuring Activities
During 2017, 2016 and 2015, we recorded severance expense associated with the elimination of certain positions based on a re-alignment of roles and responsibilities and a continued review of resource needs. Charges in North America included severance actions taken to realign roles and responsibilities subsequent to the acquisition of Datalink in January 2017, as well as a headcount reduction as part of cost reduction initiatives in the fourth quarter of 2017 and early in 2016. Charges in EMEA included ongoing restructuring activities, primarily in France, Germany, the United Kingdom and the Netherlands, as part our cost reduction and restructuring initiatives in the region. The APAC charges primarily related to severance actions taken subsequent to the acquisition of Ignia. The following table details the activity for each of the three years in the period ending December 31, 2017 related to these resource actions, and the outstanding obligations as of December 31, 2017 (in thousands):
| North America | EMEA | APAC | Consolidated | |||||||||||||
| Balances at December 31, 2014 |
$ | 857 | $ | 2,971 | $ | — | $ | 3,828 | ||||||||
| Severance costs, net of adjustments |
1,126 | 3,781 | — | 4,907 | ||||||||||||
| Cash payments |
(1,456 | ) | (3,534 | ) | — | (4,990 | ) | |||||||||
| Foreign currency translation adjustments |
(22 | ) | (235 | ) | — | (257 | ) | |||||||||
|
|
|
|
|
|
|
|
|
|||||||||
| Balances at December 31, 2015 |
505 | 2,983 | — | 3,488 | ||||||||||||
| Severance costs, net of adjustments |
2,966 | 1,496 | 118 | 4,580 | ||||||||||||
| Cash payments |
(2,524 | ) | (3,239 | ) | (118 | ) | (5,881 | ) | ||||||||
| Foreign currency translation adjustments |
— | (23 | ) | — | (23 | ) | ||||||||||
|
|
|
|
|
|
|
|
|
|||||||||
| Balances at December 31, 2016 |
947 | 1,217 | — | 2,164 | ||||||||||||
| Severance costs, net of adjustments |
4,010 | 4,888 | 104 | 9,002 | ||||||||||||
| Cash payments |
(3,336 | ) | (3,597 | ) | (89 | ) | (7,022 | ) | ||||||||
| Foreign currency translation adjustments |
10 | 486 | — | 496 | ||||||||||||
|
|
|
|
|
|
|
|
|
|||||||||
| Balances at December 31, 2017 |
$ | 1,631 | $ | 2,994 | $ | 15 | $ | 4,640 | ||||||||
|
|
|
|
|
|
|
|
|
|||||||||
Immaterial adjustments were recorded as a reduction to severance and restructuring expense in each of 2017, 2016 and 2015, due to changes in estimates.
The remaining outstanding obligations as of December 31, 2017 are expected to be paid during the next 12 months and are therefore included in accrued expenses and other current liabilities.
(9) Stock-Based Compensation
We recorded the following pre-tax amounts in selling and administrative expenses for stock-based compensation, by operating segment, in the accompanying consolidated financial statements (in thousands):
| Years Ended December 31, | ||||||||||||
| 2017 | 2016 | 2015 | ||||||||||
| North America |
$ | 9,697 | $ | 8,096 | $ | 6,648 | ||||||
| EMEA |
2,737 | 2,530 | 1,908 | |||||||||
| APAC |
392 | 432 | 366 | |||||||||
|
|
|
|
|
|
|
|||||||
| Total Consolidated |
$ | 12,826 | $ | 11,058 | $ | 8,922 | ||||||
|
|
|
|
|
|
|
|||||||
Company Plan
Our Board of Directors adopted the Amended Insight Enterprises, Inc. 2007 Omnibus Plan (the “Plan”) on March 28, 2011. The Plan was approved by our stockholders on May 18, 2011 at our 2011 annual meeting and, unless sooner terminated, will remain in place until May 18, 2021.
The Plan allows the Company to grant options, stock appreciation rights, stock awards, restricted stock, stock units (which may also be referred to as “restricted stock units”), performance shares, performance units, cash-based awards and other awards payable in cash or shares of common stock to eligible non-employee directors, employees and consultants. Consultants and independent contractors are eligible if they provide bona fide services that are not related to capital raising or promoting or maintaining a market for the Company’s stock.
On February 17, 2016, the Board of Directors adopted the First Amendment to the Plan (the “First Amendment”). On May 18, 2016 at our 2016 annual meeting, our stockholders approved the First Amendment. The First Amendment: (a) updates the list of performance criteria contained in Section 16.1 of the Plan; (b) imposes a limit on the dollar value of awards that may be granted to any one participant who is a non-employee director during any one calendar year; and (c) adds an objective clawback provision expressly providing that every award granted under the Plan is subject to potential forfeiture or recovery to the fullest extent called for by law, listing standard or Company policy. The First Amendment did not increase the number of shares available for grant under the Plan or extend the term of the Plan.
The Plan is administered by the Compensation Committee of Insight’s Board of Directors, and, except as provided below, the Compensation Committee has the exclusive authority to administer the Plan, including the power to determine eligibility, the types of awards to be granted, the price and the timing of awards. Under the Plan, the Compensation Committee may delegate some of its authority to our Chief Executive Officer to grant awards to individuals other than individuals who are subject to the reporting requirements of Section 16(a) of the Securities Exchange Act of 1934, as amended. As of December 31, 2017, of the 7,250,000 shares of common stock reserved and available for grant under the Plan, 3,215,540 shares of common stock remain available for grant under the Plan.
67
Table of Contents
INSIGHT ENTERPRISES, INC.
NOTES TO CONSOLIDATED FINANCIAL STATEMENTS (continued)
Accounting for Restricted Stock Units
We issue RSUs as incentives to certain officers and teammates and as compensation to members of our Board of Directors. We recognize compensation expense associated with the issuance of such RSUs over the vesting period for each respective RSU. The total compensation expense associated with RSUs represents the value based upon the number of RSUs awarded multiplied by the closing price of our common stock on the date of grant. The number of RSUs to be awarded under our service-based RSUs is fixed at the grant date. The number of RSUs ultimately awarded under our performance-based RSUs varies based on whether the Company achieves certain financial results. We record compensation expense each period based on our estimate of the most probable number of RSUs that will be issued under the grants of performance-based RSUs. Recipients of RSUs do not have voting or dividend rights until the vesting conditions are satisfied and shares are released.
As of December 31, 2017, total compensation cost related to nonvested RSUs not yet recognized is $17,483,000, which is expected to be recognized over the next 1.25 years on a weighted-average basis.
The following table summarizes our RSU activity during 2017:
| Number | Weighted Average Grant Date Fair Value |
Fair Value | ||||||||||
| Nonvested at the beginning of year |
1,067,557 | $ | 25.37 | |||||||||
| Granted |
369,438 | $ | 44.12 | |||||||||
| Vested, including shares withheld to cover taxes |
(466,839 | ) | $ | 24.88 | $ | 20,284,762 | (a) | |||||
|
|
|
|||||||||||
| Forfeited |
(78,043 | ) | $ | 32.16 | ||||||||
|
|
|
|||||||||||
| Nonvested at the end of year |
892,113 | $ | 32.86 | $ | 34,159,007 | (b) | ||||||
|
|
|
|
|
|||||||||
| (a) | The aggregate fair value of vested RSUs represents the total pre-tax fair value, based on the closing stock price on the day of vesting, which would have been received by holders of RSUs had all such holders sold their underlying shares on that date. The aggregate intrinsic value for RSUs which vested during 2016 and 2015 was $9,235,102 and $9,168,784, respectively. |
| (b) | The aggregate fair value of the nonvested RSUs and the RSUs expected to vest represents the total pre-tax fair value, based on our closing stock price of $38.29 as of December 29, 2017 (December 31, 2017 was not a trading day), which would have been received by holders of RSUs had all such holders sold their underlying shares on that date. |
During each of the years in the three-year period ended December 31, 2017, the RSUs that vested for teammates in the United States were net-share settled such that we withheld shares with value equivalent to the teammates’ minimum statutory United States tax obligation for the applicable income and other employment taxes and remitted the equivalent cash amount to the appropriate taxing authorities. The total shares withheld during 2017, 2016 and 2015 of 122,255, 84,953 and 85,652, respectively, were based on the value of the RSUs on their vesting dates as determined by our closing stock price on such dates. For 2017, 2016 and 2015, total payments for our teammates’ tax obligations to the taxing authorities were $5,318,000, $2,219,000 and $2,265,000, respectively, and are reflected as a financing activity within the accompanying consolidated statements of cash flows. These net-share settlements had the effect of repurchases of our common stock as they reduced the number of shares that would have otherwise been issued as a result of the vesting and did not represent an expense to us.
(10) Assets Held for Sale
In May 2016, we sold real estate that we owned in Bloomingdale, Illinois that was previously classified as a held for sale asset and included in other current assets in the accompanying consolidated balance sheet as of December 31, 2015. In previous years, we recorded non-cash charges to reduce the carrying amount of the related assets to their estimated fair value less costs to sell. During the second quarter of 2016, we recorded a gain on sale of approximately $338,000, which is included in selling and administrative expenses in the accompanying consolidated statement of operations for the year ended December 31, 2016.
68
Table of Contents
INSIGHT ENTERPRISES, INC.
NOTES TO CONSOLIDATED FINANCIAL STATEMENTS (continued)
(11) Income Taxes
The following table presents the United States (“U.S.”) and foreign components of earnings before income taxes and the related income tax expense (in thousands):
Earnings before income taxes:
| Years Ended December 31, | ||||||||||||
| 2017 | 2016 | 2015 | ||||||||||
| United States |
$ | 119,330 | $ | 99,095 | $ | 90,575 | ||||||
| Foreign |
39,768 | 40,363 | 28,601 | |||||||||
|
|
|
|
|
|
|
|||||||
| $ | 159,098 | $ | 139,458 | $ | 119,176 | |||||||
|
|
|
|
|
|
|
|||||||
Income tax expense:
| Years Ended December 31, | ||||||||||||
| 2017 | 2016 | 2015 | ||||||||||
| Current: |
||||||||||||
| U.S. Federal |
$ | 31,067 | $ | 27,947 | $ | 24,369 | ||||||
| U.S. State and local |
3,636 | 2,200 | 2,705 | |||||||||
| Foreign |
14,573 | 14,104 | 11,077 | |||||||||
|
|
|
|
|
|
|
|||||||
| 49,276 | 44,251 | 38,151 | ||||||||||
|
|
|
|
|
|
|
|||||||
| Deferred: |
||||||||||||
| U.S. Federal |
20,327 | 10,395 | 5,104 | |||||||||
| U.S. State and local |
(427 | ) | 1,088 | 602 | ||||||||
| Foreign |
(761 | ) | (966 | ) | (532 | ) | ||||||
|
|
|
|
|
|
|
|||||||
| 19,139 | 10,517 | 5,174 | ||||||||||
|
|
|
|
|
|
|
|||||||
| $ | 68,415 | $ | 54,768 | $ | 43,325 | |||||||
|
|
|
|
|
|
|
|||||||
The following schedule reconciles the differences between the U.S. federal income taxes at the U.S. statutory rate and our income tax expense (dollars in thousands):
| 2017 | 2016 | 2015 | ||||||||||||||||||||||
| Statutory federal income tax rate |
$ | 55,684 | 35.0 | % | $ | 48,810 | 35.0 | % | $ | 41,712 | 35.0 | % | ||||||||||||
| State income tax expense, net of federal income tax benefit |
2,808 | 1.8 | 3,368 | 2.4 | 3,180 | 2.7 | ||||||||||||||||||
| Audits and adjustments, net |
(313 | ) | (0.2 | ) | (1,039 | ) | (0.7 | ) | (886 | ) | (0.7 | ) | ||||||||||||
| Change in valuation allowances |
2,472 | 1.5 | 3,742 | 2.7 | 2,944 | 2.5 | ||||||||||||||||||
| Foreign income taxed at different rates |
(6,057 | ) | (3.8 | ) | (6,611 | ) | (4.7 | ) | (5,729 | ) | (4.8 | ) | ||||||||||||
| U.S. mandatory deemed repatriation |
5,625 | 3.5 | — | — | — | — | ||||||||||||||||||
| Adjustment of net deferred tax assets for enacted U.S. federal tax reform |
7,738 | 4.9 | — | — | — | — | ||||||||||||||||||
| Change in U.S. tax law applicable to certain foreign entities |
— | — | 2,577 | 1.8 | — | — | ||||||||||||||||||
| Non-deductible compensation |
571 | 0.4 | 518 | 0.4 | 474 | 0.4 | ||||||||||||||||||
| Other, net |
(113 | ) | (0.1 | ) | 3,403 | 2.4 | 1,630 | 1.3 | ||||||||||||||||
|
|
|
|
|
|
|
|
|
|
|
|
|
|||||||||||||
| Effective tax rate |
$ | 68,415 | 43.0 | % | $ | 54,768 | 39.3 | % | $ | 43,325 | 36.4 | % | ||||||||||||
|
|
|
|
|
|
|
|
|
|
|
|
|
|||||||||||||
In December 2017, U.S. federal tax reform was enacted as part of the U.S. Tax Cuts and Jobs Act. As part of the change in tax law, beginning in 2018, the U.S. statutory federal income tax rate was reduced from 35% to 21%. This reduction required a remeasurement of our deferred tax balances that resulted in an increase in our 2017 income tax expense. In addition, the change in tax law included provisions requiring mandatory deemed repatriation of undistributed foreign earnings. In 2017, we recorded a tax charge totaling $13,363,000 in connection with the enactment of the U.S. Tax Cuts and Jobs Act. Due to the enactment date and complexities of the new law, we have not completed our accounting related to these items. In accordance with Staff Accounting Bulletin 118, issued on December 22, 2017, we have concluded that the U.S. income taxes attributable to the remeasurement of U.S. deferred income taxes, the mandatory deemed repatriation provision and the state tax effects of these items are provisional amounts.
A change in U.S. tax law was enacted in December 2016 related to the taxation of foreign currency translation gains or losses arising from qualified business units. The change, which increased our U.S. federal income taxes, affects our foreign entities that are treated as branches for U.S. tax purposes. The “Other, net” line item in the schedule above includes $349,000 and $1,296,000 related to the effect of non-deductible acquisition-related expenses incurred during 2017 and 2016, respectively.
69
Table of Contents
INSIGHT ENTERPRISES, INC.
NOTES TO CONSOLIDATED FINANCIAL STATEMENTS (continued)
For foreign entities not treated as branches for U.S. tax purposes, historically, we did not provide for U.S. income taxes on the undistributed earnings of these subsidiaries as these earnings were considered to be reinvested and, in the opinion of management, would continue to be reinvested indefinitely outside of the United States. As a result of U.S. federal tax reform enacted during December 2017, all undistributed foreign earnings are deemed distributed.
The significant components of deferred tax assets and liabilities are as follows (in thousands):
| December 31, | ||||||||
| 2017 | 2016 | |||||||
| Deferred tax assets: |
||||||||
| Net operating losses |
$ | 25,418 | $ | 18,964 | ||||
| Foreign tax credits |
21,346 | 13,115 | ||||||
| Accruals |
5,921 | 6,426 | ||||||
| Goodwill and other intangibles |
4,717 | 35,523 | ||||||
| Stock-based compensation |
3,023 | 4,238 | ||||||
| Accounts receivable |
2,124 | 2,547 | ||||||
| Inventories |
1,930 | 2,598 | ||||||
| Property and equipment |
1,111 | 705 | ||||||
| Deferred revenue |
600 | 468 | ||||||
| Other |
335 | 55 | ||||||
|
|
|
|
|
|||||
| Gross deferred tax assets |
66,525 | 84,639 | ||||||
| Valuation allowances |
(45,995 | ) | (30,972 | ) | ||||
|
|
|
|
|
|||||
| Total deferred tax assets |
20,530 | 53,667 | ||||||
|
|
|
|
|
|||||
| Deferred tax liabilities: |
||||||||
| Goodwill and other intangibles |
(1,587 | ) | (1,221 | ) | ||||
| Accrued withholding tax |
(1,452 | ) | — | |||||
| Prepaid expenses |
(369 | ) | (204 | ) | ||||
| Other |
(775 | ) | (795 | ) | ||||
|
|
|
|
|
|||||
| Total deferred tax liabilities |
(4,183 | ) | (2,220 | ) | ||||
|
|
|
|
|
|||||
| Net deferred tax assets |
$ | 16,347 | $ | 51,447 | ||||
|
|
|
|
|
|||||
The net non-current deferred tax assets and liabilities are as follows (in thousands):
| December 31, | ||||||||
| 2017 | 2016 | |||||||
| Net non-current deferred tax assets |
$ | 17,064 | $ | 52,347 | ||||
| Net non-current deferred tax liabilities |
(717 | ) | (900 | ) | ||||
|
|
|
|
|
|||||
| Net deferred tax assets |
$ | 16,347 | $ | 51,447 | ||||
|
|
|
|
|
|||||
As of December 31, 2017, we have a federal net operating loss carryforward (“NOL”) of $1,455,000 and U.S. state NOLs of $1,977,000 that will expire between 2018 and 2036. We also have NOLs from various non-U.S. jurisdictions of $87,056,000. While the majority of the non-U.S. NOLs have no expiration date, $6,258,000 will expire between 2018 and 2024.
On the basis of currently available information, we have provided valuation allowances for certain of our deferred tax assets where we believe it is more likely than not that the related tax benefits will not be realized. At December 31, 2017 and 2016, our valuation allowances totaled $45,995,000 and $30,972,000, respectively, representing non-U.S. NOLs, foreign depreciation allowances and foreign tax credits.
We believe it is more likely than not that forecasted income, including income that may be generated as a result of prudent and feasible tax planning strategies, together with the tax effects of deferred tax liabilities, will be sufficient to fully recover our remaining deferred tax assets. In the future, if we determine that realization of the remaining deferred tax assets and the availability of certain previously paid taxes to be refunded are not more likely than not, we will need to increase our valuation allowances and record additional income tax expense.
70
Table of Contents
INSIGHT ENTERPRISES, INC.
NOTES TO CONSOLIDATED FINANCIAL STATEMENTS (continued)
The following table summarizes the change in the valuation allowance (in thousands):
| December 31, | ||||||||
| 2017 | 2016 | |||||||
| Valuation allowances at beginning of year |
$ | 30,972 | $ | 28,750 | ||||
| Increase in income tax expense |
2,472 | 3,742 | ||||||
| U.S. federal tax reform |
11,623 | — | ||||||
| Foreign currency translation adjustments |
2,865 | (1,035 | ) | |||||
| Other |
(1,937 | ) | (485 | ) | ||||
|
|
|
|
|
|||||
| Valuation allowances at end of year |
$ | 45,995 | $ | 30,972 | ||||
|
|
|
|
|
|||||
The increase in our valuation allowance related to U.S. federal tax reform in the table above was primarily related to U.S. mandatory deemed repatriation.
Various taxing jurisdictions are examining our tax returns for certain tax years. Although the outcome of tax audits cannot be predicted with certainty, management believes the ultimate resolution of these examinations will not result in a material adverse effect to our financial position, results of operations or cash flows.
As of December 31, 2017 and 2016, we had approximately $4,273,000 and $2,246,000, respectively, of unrecognized tax benefits. Of these amounts, approximately $287,000 and $195,000, respectively, related to accrued interest. A reconciliation of the beginning and ending amounts of unrecognized tax benefits, excluding interest, is as follows (in thousands):
| Balance at December 31, 2016 |
$ | 2,051 | ||
| Additions for tax positions added through acquisition |
2,484 | |||
| Subtractions for tax positions in prior periods |
(59 | ) | ||
| Additions for tax positions in current period |
867 | |||
| Additions due to foreign currency translation |
53 | |||
| Subtractions due to audit settlements and statute expirations |
(1,410 | ) | ||
|
|
|
|||
| Balance at December 31, 2017 |
$ | 3,986 | ||
|
|
|
In the future, if recognized, the liability associated with uncertain tax positions would affect our effective tax rate. We do not believe there will be any changes over the next 12 months that would have a material effect on our effective tax rate.
Several of our subsidiaries are currently under audit for tax years 2012 through 2015. Although the timing of the resolutions and/or closures of audits is highly uncertain, it is reasonably possible that the examination phase of these audits may be concluded within the next 12 months which could significantly increase or decrease the balance of our gross unrecognized tax benefits. However, based on the status of the various examinations in multiple jurisdictions, an estimate of the range of reasonably possible outcomes cannot be made at this time, but the estimated effect on our income tax expense and net earnings is not expected to be significant.
We, including our subsidiaries, file income tax returns in the U.S. federal jurisdiction and many state and local and non-U.S. jurisdictions. In the United States, federal income tax returns for 2014, 2015, 2016 and 2017 remain open to examination. For U.S. state and local taxes as well as in non-U.S. jurisdictions, the statute of limitations generally varies between three and ten years.
(12) Market Risk Management
Interest Rate Risk
We have interest rate exposure arising from our financing facilities, which have variable interest rates. These variable interest rates are affected by changes in short-term interest rates. We currently do not hedge our interest rate exposure.
We do not believe that the effect of reasonably possible near-term changes in interest rates will be material to our financial position, results of operations and cash flows. Our financing facilities expose our net earnings to changes in short-term interest rates since interest rates on the underlying obligations are variable. We had $117,500,000 outstanding under our revolving facility, $166,250,000 outstanding under our TLA and $25,000,000 outstanding under our ABS facility at December 31, 2017. The interest rate attributable to the borrowings under our revolving facility, our TLA and our ABS facility was 3.49%, 3.57% and 2.41%, respectively, per annum at December 31, 2017. The change in annual pre-tax earnings from operations resulting from a hypothetical 10% increase or decrease in the applicable interest rate would have been immaterial.
71
Table of Contents
INSIGHT ENTERPRISES, INC.
NOTES TO CONSOLIDATED FINANCIAL STATEMENTS (continued)
Foreign Currency Exchange Risk
We have foreign currency exchange risk related to the translation of our foreign subsidiaries’ operating results, assets and liabilities (see Note 1 for a description of our Foreign Currencies policy). We also maintain cash accounts denominated in currencies other than the functional currency, which expose us to fluctuations in foreign exchange rates. Remeasurement of these cash balances results in gains/losses that are also reported as a separate component of non-operating (income) expense. We monitor our foreign currency exposure and selectively enter into forward exchange contracts to mitigate risk associated with certain non-functional currency monetary assets and liabilities related to foreign denominated payables, receivables and cash balances. Transaction gains and losses resulting from non-functional currency assets and liabilities are offset by gains and losses on forward contracts in non-operating (income) expense, net in our consolidated statements of operations. The counterparties associated with our foreign exchange forward contracts are large creditworthy commercial banks. The derivatives transacted with these institutions are short in duration and, therefore, we do not consider counterparty concentration and non-performance to be material risks. The Company does not have a significant concentration of credit risk with any single counterparty.
(13) Derivative Financial Instruments
We use derivatives to partially offset our exposure to fluctuations in certain foreign currencies. We do not enter into derivative contracts for speculative or trading purposes. Derivatives are recorded at fair value on the balance sheet based on observable market based inputs or unobservable inputs that are corroborated by market data (Level 2). Gains or losses resulting from changes in fair value of the derivative are recorded currently in income. We do not designate our hedges for hedge accounting, and our foreign currency derivative instruments are not subject to any master netting arrangements with our counterparties.
We use foreign exchange forward contracts to mitigate risk associated with certain non-functional currency assets and liabilities from fluctuations in foreign currency exchange rates. Our non-functional currency assets and liabilities are primarily related to foreign currency denominated payables, receivables, and cash balances. The foreign currency forward contracts, carried at fair value, typically have a maturity of one month or less. We currently enter into approximately four foreign exchange forward contracts per month with an average notional value of $10,610,000 and an average maturity of approximately nine days.
Our derivative financial instruments as of December 31, 2017 were not material. The effect of our derivative financial instruments on our results of operations during the years ended December 31, 2017, 2016 and 2015 were a gain of $159,000, a loss of $2,722,000 and a loss of $942,000, respectively. These amounts are reported within the net foreign currency exchange (gain) loss line item in our consolidated statements of operations.
(14) Fair Value Measurements
Fair value measurements are determined based on the following three categories:
Level 1: Quoted market prices in active markets for identical assets or liabilities.
Level 2: Observable market based inputs or unobservable inputs that are corroborated by market data.
Level 3: Unobservable inputs that are not corroborated by market data.
We have elected to use the income approach to value our foreign exchange derivatives, using observable Level 2 market expectations at the measurement date and standard valuation techniques to convert future amounts to a single present value amount assuming that participants are motivated, but not compelled, to transact. Level 2 inputs for the valuations are limited to quoted prices for similar assets or liabilities in active markets and inputs other than quoted prices that are observable for the asset or liability (specifically LIBOR rates, foreign exchange rates, and foreign exchange forward points). Mid-market pricing is used as a practical expedient for fair value measurements. Fair value measurement of an asset or liability must reflect the nonperformance risk of the entity and the counterparty. Therefore, the impact of the counterparty’s creditworthiness when in an asset position and the Company’s creditworthiness when in a liability position has also been factored into the fair value measurement of the derivative instruments and did not have a material impact on the fair value of these derivative instruments. Both the counterparty and the Company are expected to continue to perform under the contractual terms of the instruments.
72
Table of Contents
INSIGHT ENTERPRISES, INC.
NOTES TO CONSOLIDATED FINANCIAL STATEMENTS (continued)
As of December 31, 2017, we have no non-financial assets or liabilities that are measured and recorded at fair value on a recurring basis, and our other financial assets or liabilities generally consist of cash and cash equivalents, accounts receivable, accounts payable, accrued expenses and other current liabilities and long-term debt. The estimated fair values of our cash and cash equivalents approximate their carrying values and are determined based on quoted prices in active markets for identical assets (Level 1). The estimated fair values of our long-term debt balances approximate their carrying values based on their variable interest rate terms that are based on current market interest rates for similar debt instruments. The fair values of the other financial assets and liabilities are based on the values that would be received or paid in an orderly transaction between market participants and approximate their carrying values due to their nature and short duration.
(15) Benefit Plans
We adopted a defined contribution benefit plan (the “Defined Contribution Plan”) for our U.S. teammates which complies with section 401(k) of the Internal Revenue Code. The Company provides a discretionary match to all participants who make 401(k) contributions pursuant to the Defined Contribution Plan. The discretionary match provided to participants is equivalent to 50% of a participant’s pre-tax contributions up to a maximum of 6% of eligible compensation per pay period. Additionally, we offer several defined contribution benefit plans to our teammates outside of the United States. These plans and their related terms vary by country. Total consolidated contribution expense under these plans was $14,083,000, $7,684,000 and $7,190,000 for 2017, 2016 and 2015, respectively.
(16) Share Repurchase Programs
In February 2016, February 2015 and October 2014, our Board of Directors authorized share repurchase programs of $50,000,000, $75,000,000 and $25,000,000, respectively. No share repurchase program was authorized in 2017. The following table summarizes the shares of our common stock that we repurchased on the open market under these repurchase programs during the years ended December 31, 2017, 2016 and 2015, respectively, in thousands, except per share amounts:
| Year |
Total Number of Shares Purchased |
Average Price Paid per Share |
Approximate Dollar Value of Shares Purchased |
|||||||||
| 2017 |
— | $ | — | $ | — | |||||||
| 2016 |
1,891 | 26.43 | 50,000 | |||||||||
| 2015 |
3,300 | 27.83 | 91,843 | |||||||||
|
|
|
|
|
|||||||||
| Total |
5,191 | $ | 141,843 | |||||||||
|
|
|
|
|
|||||||||
All shares repurchased were retired.
On February 13, 2018, our Board of Directors authorized the repurchase of up to $50,000,000 of our common stock. Our share repurchases will be made on the open market, subject to Rule 10b-18 or in privately negotiated transactions, through block trades, through 10b5-1 plans or otherwise, at management’s discretion. The amount of shares purchased and the timing of the purchases will be based on market conditions, working capital requirements, general business conditions and other factors. We intend to retire the repurchased shares.
(17) Commitments and Contingencies
Contractual
In the ordinary course of business, we issue performance bonds to secure our performance under certain contracts or state tax requirements. As of December 31, 2017, we had approximately $1,962,000 of performance bonds outstanding. These bonds are issued on our behalf by a surety company on an unsecured basis; however, if the surety company is ever required to pay out under the bonds, we have contractually agreed to reimburse the surety company.
73
Table of Contents
INSIGHT ENTERPRISES, INC.
NOTES TO CONSOLIDATED FINANCIAL STATEMENTS (continued)
Management believes that payments, if any, related to these performance bonds are not probable at December 31, 2017. Accordingly, we have not accrued any liabilities related to such performance bonds in our consolidated financial statements.
Employment Contracts and Severance Plans
We have employment contracts with, and plans covering, certain officers and management teammates under which severance payments would become payable in the event of specified terminations without cause or terminations under certain circumstances after a change in control. In addition, vesting of outstanding nonvested RSUs would accelerate following a change in control. If severance payments under the current employment agreements or plan payments were to become payable, the severance payments would generally range from three to twenty-four months of salary.
Indemnifications
From time to time, in the ordinary course of business, we enter into contractual arrangements under which we agree to indemnify either our clients or third-party service providers from certain losses incurred relating to services performed on our behalf or for losses arising from defined events, which may include litigation or claims relating to past performance. These arrangements include, but are not limited to, the indemnification of our clients for certain claims arising out of our performance under our sales contracts, the indemnification of our landlords for certain claims arising from our use of leased facilities and the indemnification of the lenders that provide our credit facilities for certain claims arising from their extension of credit to us. Such indemnification obligations may not be subject to maximum loss clauses.
Management believes that payments, if any, related to these indemnifications are not probable at December 31, 2017. Accordingly, we have not accrued any liabilities related to such indemnifications in the accompanying consolidated financial statements.
We have entered into separate indemnification agreements with certain of our executive officers and with each of our directors. These agreements require us, among other requirements, to indemnify such officers and directors against expenses (including attorneys’ fees), judgments and settlements incurred by such individual in connection with any action arising out of such individual’s status or service as our executive officer or director (subject to exceptions such as where the individual failed to act in good faith or in a manner the individual reasonably believed to be in, or not opposed to, the best interests of the Company) and to advance expenses incurred by such individual with respect to which such individual may be entitled to indemnification by us. There are no pending legal proceedings that involve the indemnification of any of the Company’s directors or officers.
Contingencies Related to Third-Party Review
From time to time, we are subject to potential claims and assessments from third parties. We are also subject to various governmental, client and partner audits. We continually assess whether or not such claims have merit and warrant accrual. Where appropriate, we accrue estimates of anticipated liabilities in our consolidated financial statements. Such estimates are subject to change and may affect our results of operations and our cash flows.
Legal Proceedings
From time to time, we are party to various legal proceedings arising in the ordinary course of business, including preference payment claims asserted in client bankruptcy proceedings, indemnification claims, claims of alleged infringement of patents, trademarks, copyrights and other intellectual property rights, claims of alleged non-compliance with contract provisions and claims related to alleged violations of laws and regulations. We regularly evaluate the status of the legal proceedings in which we are involved to assess whether a loss is probable or there is a reasonable possibility that a loss, or an additional loss, may have been incurred and determine if accruals are appropriate. If accruals are not appropriate, we further evaluate each legal proceeding to assess whether an estimate of possible loss or range of possible loss can be made for disclosure. Although litigation is inherently unpredictable, we believe that we have adequate provisions for any probable and estimable losses. It is possible, nevertheless, that our consolidated financial position, results of operations or liquidity could be materially and adversely affected in any particular period by the resolution of a legal proceeding. Legal expenses related to defense, negotiations, settlements, rulings and advice of outside legal counsel are expensed as incurred.
74
Table of Contents
INSIGHT ENTERPRISES, INC.
NOTES TO CONSOLIDATED FINANCIAL STATEMENTS (continued)
The Company is not involved in any pending or threatened legal proceedings that it believes would reasonably be expected to have a material adverse effect on its business, financial condition or results of operations.
(18) Supplemental Financial Information
Additions and deductions related to the allowance for doubtful accounts receivable for 2017, 2016 and 2015 were as follows (in thousands):
| Balance at Beginning of Year |
Additions | Deductions | Balance at End of Year |
|||||||||||||
| Allowance for doubtful accounts receivable: |
||||||||||||||||
| Year ended December 31, 2017 |
$ | 9,138 | $ | 5,245 | $ | (4,225 | ) | $ | 10,158 | |||||||
|
|
|
|
|
|
|
|
|
|||||||||
| Year ended December 31, 2016 |
$ | 11,872 | $ | 2,452 | $ | (5,186 | ) | $ | 9,138 | |||||||
|
|
|
|
|
|
|
|
|
|||||||||
| Year ended December 31, 2015 |
$ | 19,336 | $ | 6,761 | $ | (14,225 | ) | $ | 11,872 | |||||||
|
|
|
|
|
|
|
|
|
|||||||||
During 2015, we undertook a project to analyze our older accounts receivable to attempt further collection action, or where appropriate, to write off such accounts as uncollectible. Since these aged accounts receivable had been fully reserved against, the write off was accomplished through the elimination of the associated allowance, with no effect on net accounts receivable balances. The reduction of the allowance for doubtful accounts to $11,872,000 at December 31, 2015 was a direct result of the write off of these older fully reserved accounts receivable as well as an overall improvement in managing the receivables portfolio. The reduction of the reserve during 2015 related to these actions had no effect on our results of operations.
(19) Cash Flows
Cash payments for interest on indebtedness and cash payments for taxes on income were as follows (in thousands):
| Years Ended December 31, | ||||||||||||
| 2017 | 2016 | 2015 | ||||||||||
| Supplemental disclosures of cash flow information: |
||||||||||||
| Cash paid during the year for interest |
$ | 10,976 | $ | 3,782 | $ | 2,866 | ||||||
|
|
|
|
|
|
|
|||||||
| Cash paid during the year for income taxes, net of refunds |
$ | 55,470 | $ | 39,051 | $ | 41,062 | ||||||
|
|
|
|
|
|
|
|||||||
Non-cash investing activities for 2017, 2016 and 2015 included $159,000, $791,000 and $662,000, respectively, of capital expenditures in accounts payable, representing additions purchased at period end but not yet paid for in cash.
(20) Segment and Geographic Information
We operate in three reportable geographic operating segments: North America; EMEA; and APAC. Our offerings in North America and certain countries in EMEA and APAC include IT hardware, software and services. Our offerings in the remainder of our EMEA and APAC segments are largely software and certain software-related services.
During the year ended December 31, 2017, subsequent to our acquisition of Datalink, our consolidated net sales from the provision of services approximated 10%. As such, for the year ended December 31, 2017, we began reporting net sales from the provision of services and the related costs of goods sold separately from net sales of products and the related costs of goods on the face of our consolidated statement of operations. For comparability purposes, net sales and costs of goods sold for the years ended December 31, 2016 and 2015 have been expanded to conform to the current year presentation. These changes in presentation had no effect on previously reported total net sales, total costs of goods sold or gross profit amounts.
75
Table of Contents
INSIGHT ENTERPRISES, INC.
NOTES TO CONSOLIDATED FINANCIAL STATEMENTS (continued)
In conjunction with these changes in presentation, because fees earned from activities reported net are considered services revenues, we reclassified certain revenue streams for which we act as the agent in the transaction to net sales from services. Previously, we included these net revenue streams within our software and, to a lesser extent, hardware sales mix categories based on the type of product being sold (e.g., fees earned for the sale of software maintenance and certain software licenses were included in software sales and fees earned for the sale of certain third-party provided training and warranty services were included in hardware sales when we historically disclosed and analyzed our sales mix). For comparability purposes, our sales mix among our hardware, software and services categories for the years ended December 31, 2016 and 2015 has been reclassified to conform to the current year presentation. These reclassifications had no effect on previously reported total net sales amounts. The following tables summarize net sales by offering for North America, EMEA and APAC including the effect of the reclassifications on the previously reported net sales by sales mix amounts for the years ended December 31, 2016 and 2015 (in thousands):
| North America Years Ended December 31, |
||||||||||||
| Sales Mix |
2017 | 2016 | 2015 | |||||||||
| (As Reclassified) | (As Reclassified) | |||||||||||
| Hardware |
$ | 3,352,355 | $ | 2,454,889 | $ | 2,336,764 | ||||||
| Software |
1,310,118 | 1,146,808 | 1,157,168 | |||||||||
| Services |
519,261 | 370,131 | 329,596 | |||||||||
|
|
|
|
|
|
|
|||||||
| $ | 5,181,734 | $ | 3,971,828 | $ | 3,823,528 | |||||||
|
|
|
|
|
|
|
|||||||
In North America, fees earned from activities reported on a net basis of $270,000 and $87,984,000 that were previously reported as part of our hardware and software product categories, respectively, in 2016, and fees earned from activities reported on a net basis of $24,000 and $74,101,000 that were previously reported as part of our hardware and software product categories, respectively, in 2015, were reclassified to services to conform to the current year presentation.
| EMEA Years Ended December 31, |
||||||||||||
| Sales Mix |
2017 | 2016 | 2015 | |||||||||
| (As Reclassified) | (As Reclassified) | |||||||||||
| Hardware |
$ | 536,500 | $ | 481,505 | $ | 531,308 | ||||||
| Software |
710,452 | 762,427 | 756,373 | |||||||||
| Services |
108,464 | 94,628 | 83,456 | |||||||||
|
|
|
|
|
|
|
|||||||
| $ | 1,355,416 | $ | 1,338,560 | $ | 1,371,137 | |||||||
|
|
|
|
|
|
|
|||||||
In EMEA, fees earned from activities reported on a net basis of $48,586,000 and $43,388,000 that were previously reported as part of our software product category in 2016 and 2015, respectively, were reclassified to services to conform to the current year presentation.
| APAC Years Ended December 31, |
||||||||||||
| Sales Mix |
2017 | 2016 | 2015 | |||||||||
| (As Reclassified) | (As Reclassified) | |||||||||||
| Hardware |
$ | 27,907 | $ | 18,916 | $ | 14,327 | ||||||
| Software |
101,412 | 132,718 | 149,607 | |||||||||
| Services |
37,154 | 23,493 | 14,491 | |||||||||
|
|
|
|
|
|
|
|||||||
| $ | 166,473 | $ | 175,127 | $ | 178,425 | |||||||
|
|
|
|
|
|
|
|||||||
In APAC, fees earned from activities reported on a net basis of $9,000 and $10,991,000 that were previously reported as part of our hardware and software product categories, respectively, in 2016, and fees earned from activities reported on a net basis of $6,000 and $8,439,000 that were previously reported as part of our hardware and software product categories, respectively, in 2015, were reclassified to services to conform to the current year presentation.
The method for determining what information regarding operating segments, products and services, geographic areas of operation and major clients to report is based upon the “management approach,” or the way that management organizes the operating segments within a company, for which separate financial information is evaluated regularly by the Chief Operating Decision Maker (“CODM”) in deciding how to allocate resources. Our CODM is our Chief Executive Officer.
All significant intercompany transactions are eliminated upon consolidation, and there are no differences between the accounting policies used to measure profit and loss for our segments or on a consolidated basis. Net sales are defined as net sales to external clients. None of our clients exceeded ten percent of consolidated net sales in 2017, 2016 or 2015.
76
Table of Contents
INSIGHT ENTERPRISES, INC.
NOTES TO CONSOLIDATED FINANCIAL STATEMENTS (continued)
A portion of our operating segments’ selling and administrative expenses arise from shared services and infrastructure that we have historically provided to them in order to realize economies of scale and to use resources efficiently. These expenses, collectively identified as corporate charges, include senior management expenses, internal audit, legal, tax, insurance services, treasury and other corporate infrastructure expenses. Charges are allocated to our operating segments, and the allocations have been determined on a basis that we considered to be a reasonable reflection of the utilization of services provided to or benefits received by the operating segments.
The tables below present information about our reportable operating segments (in thousands):
| Year Ended December 31, 2017 | ||||||||||||||||
| North America |
EMEA | APAC | Consolidated | |||||||||||||
| Net Sales: |
||||||||||||||||
| Products |
$ | 4,662,473 | $ | 1,246,952 | $ | 129,319 | $ | 6,038,744 | ||||||||
| Services |
519,261 | 108,464 | 37,154 | 664,879 | ||||||||||||
|
|
|
|
|
|
|
|
|
|||||||||
| Total net sales |
5,181,734 | 1,355,416 | 166,473 | 6,703,623 | ||||||||||||
|
|
|
|
|
|
|
|
|
|||||||||
| Costs of goods sold: |
||||||||||||||||
| Products |
4,253,587 | 1,140,204 | 118,611 | 5,512,402 | ||||||||||||
| Services |
236,470 | 24,902 | 11,279 | 272,651 | ||||||||||||
|
|
|
|
|
|
|
|
|
|||||||||
| Total costs of goods sold |
4,490,057 | 1,165,106 | 129,890 | 5,785,053 | ||||||||||||
|
|
|
|
|
|
|
|
|
|||||||||
| Gross profit |
691,677 | 190,310 | 36,583 | 918,570 | ||||||||||||
| Operating expenses: |
||||||||||||||||
| Selling and administrative expenses |
530,792 | 164,305 | 28,231 | 723,328 | ||||||||||||
| Severance and restructuring expenses |
4,010 | 4,888 | 104 | 9,002 | ||||||||||||
| Loss on sale of foreign entity |
— | 3,646 | — | 3,646 | ||||||||||||
| Acquisition-related expenses |
3,223 | 106 | — | 3,329 | ||||||||||||
|
|
|
|
|
|
|
|
|
|||||||||
| Earnings from operations |
$ | 153,652 | $ | 17,365 | $ | 8,248 | $ | 179,265 | ||||||||
|
|
|
|
|
|
|
|
|
|||||||||
| Total assets |
$ | 2,337,573 | $ | 530,242 | $ | 101,169 | $ | 2,968,984 | * | |||||||
|
|
|
|
|
|
|
|
|
|||||||||
| Year Ended December 31, 2016 | ||||||||||||||||
| North America |
EMEA | APAC | Consolidated | |||||||||||||
| Net Sales: |
||||||||||||||||
| Products |
$ | 3,601,697 | $ | 1,243,932 | $ | 151,634 | $ | 4,997,263 | ||||||||
| Services |
370,131 | 94,628 | 23,493 | 488,252 | ||||||||||||
|
|
|
|
|
|
|
|
|
|||||||||
| Total net sales |
3,971,828 | 1,338,560 | 175,127 | 5,485,515 | ||||||||||||
|
|
|
|
|
|
|
|
|
|||||||||
| Costs of goods sold: |
||||||||||||||||
| Products |
3,301,148 | 1,129,917 | 140,397 | 4,571,462 | ||||||||||||
| Services |
145,199 | 22,956 | 2,796 | 170,951 | ||||||||||||
|
|
|
|
|
|
|
|
|
|||||||||
| Total costs of goods sold |
3,446,347 | 1,152,873 | 143,193 | 4,742,413 | ||||||||||||
|
|
|
|
|
|
|
|
|
|||||||||
| Gross profit |
525,481 | 185,687 | 31,934 | 743,102 | ||||||||||||
| Operating expenses: |
||||||||||||||||
| Selling and administrative expenses |
401,316 | 160,269 | 23,658 | 585,243 | ||||||||||||
| Severance and restructuring expenses |
2,966 | 1,496 | 118 | 4,580 | ||||||||||||
| Acquisition-related expenses |
4,278 | — | 169 | 4,447 | ||||||||||||
|
|
|
|
|
|
|
|
|
|||||||||
| Earnings from operations |
$ | 116,921 | $ | 23,922 | $ | 7,989 | $ | 148,832 | ||||||||
|
|
|
|
|
|
|
|
|
|||||||||
| Total assets |
$ | 2,204,351 | $ | 562,293 | $ | 119,778 | $ | 2,886,422 | * | |||||||
|
|
|
|
|
|
|
|
|
|||||||||
77
Table of Contents
INSIGHT ENTERPRISES, INC.
NOTES TO CONSOLIDATED FINANCIAL STATEMENTS (continued)
| Year Ended December 31, 2015 | ||||||||||||||||
| North America |
EMEA | APAC | Consolidated | |||||||||||||
| Net Sales: |
||||||||||||||||
| Products |
$ | 3,493,932 | $ | 1,287,681 | $ | 163,934 | $ | 4,945,547 | ||||||||
| Services |
329,596 | 83,456 | 14,491 | 427,543 | ||||||||||||
|
|
|
|
|
|
|
|
|
|||||||||
| Total net sales |
3,823,528 | 1,371,137 | 178,425 | 5,373,090 | ||||||||||||
|
|
|
|
|
|
|
|
|
|||||||||
| Costs of goods sold: |
||||||||||||||||
| Products |
3,196,297 | 1,167,113 | 149,943 | 4,513,353 | ||||||||||||
| Services |
125,668 | 17,737 | — | 143,405 | ||||||||||||
|
|
|
|
|
|
|
|
|
|||||||||
| Total costs of goods sold |
3,321,965 | 1,184,850 | 149,943 | 4,656,758 | ||||||||||||
|
|
|
|
|
|
|
|
|
|||||||||
| Gross profit |
501,563 | 186,287 | 28,482 | 716,332 | ||||||||||||
| Operating expenses: |
||||||||||||||||
| Selling and administrative expenses |
396,603 | 165,879 | 22,424 | 584,906 | ||||||||||||
| Severance and restructuring expenses |
1,126 | 3,781 | — | 4,907 | ||||||||||||
|
|
|
|
|
|
|
|
|
|||||||||
| Earnings from operations |
$ | 103,834 | $ | 16,627 | $ | 6,058 | $ | 126,519 | ||||||||
|
|
|
|
|
|
|
|
|
|||||||||
| Total assets |
$ | 1,999,485 | $ | 543,146 | $ | 114,973 | $ | 2,657,604 | * | |||||||
|
|
|
|
|
|
|
|
|
|||||||||
| * | Consolidated total assets do not reflect intercompany eliminations and corporate assets of $283,333,000, $667,122,000 and $643,587,000 at December 31, 2017, 2016 and 2015, respectively. |
The following is a summary of our geographic net sales and long-lived assets, consisting of property and equipment, net (in thousands):
| United States | United Kingdom | Other Foreign | Total | |||||||||||||
| 2017 |
||||||||||||||||
| Net sales |
$ | 4,933,805 | $ | 684,632 | $ | 1,085,186 | $ | 6,703,623 | ||||||||
| Total long-lived assets |
$ | 50,462 | $ | 14,783 | $ | 10,007 | $ | 75,252 | ||||||||
| 2016 |
||||||||||||||||
| Net sales |
$ | 3,776,352 | $ | 671,999 | $ | 1,037,164 | $ | 5,485,515 | ||||||||
| Total long-lived assets |
$ | 46,774 | $ | 13,570 | $ | 10,566 | $ | 70,910 | ||||||||
| 2015 |
||||||||||||||||
| Net sales |
$ | 3,645,876 | $ | 711,957 | $ | 1,015,257 | $ | 5,373,090 | ||||||||
| Total long-lived assets |
$ | 58,748 | $ | 16,810 | $ | 12,723 | $ | 88,281 | ||||||||
Net sales by geographic area are presented by attributing net sales to external customers based on the domicile of the selling location.
78
Table of Contents
INSIGHT ENTERPRISES, INC.
NOTES TO CONSOLIDATED FINANCIAL STATEMENTS (continued)
We recorded the following pre-tax amounts, by operating segment, for depreciation and amortization in the accompanying consolidated financial statements (in thousands):
| Years Ended December 31, | ||||||||||||
| 2017 | 2016 | 2015 | ||||||||||
| Depreciation and amortization of property and equipment: |
||||||||||||
| North America |
$ | 20,241 | $ | 21,952 | $ | 22,239 | ||||||
| EMEA |
5,025 | 4,908 | 3,757 | |||||||||
| APAC |
521 | 633 | 653 | |||||||||
|
|
|
|
|
|
|
|||||||
| 25,787 | 27,493 | 26,649 | ||||||||||
|
|
|
|
|
|
|
|||||||
| Amortization of intangible assets: |
||||||||||||
| North America |
15,971 | 8,139 | 8,053 | |||||||||
| EMEA |
73 | 1,951 | 2,834 | |||||||||
| APAC |
768 | 547 | 421 | |||||||||
|
|
|
|
|
|
|
|||||||
| 16,812 | 10,637 | 11,308 | ||||||||||
|
|
|
|
|
|
|
|||||||
| Total |
$ | 42,599 | $ | 38,130 | $ | 37,957 | ||||||
|
|
|
|
|
|
|
|||||||
(21) Acquisitions
Caase.com
Effective September 26, 2017, we acquired Caase.com, a Dutch cloud service provider, for a purchase price, net of cash acquired, of approximately $6,038,000, subject to a final working capital adjustment. We believe that this acquisition strengthened our ability to deliver Intelligent Technology Solutions to our clients in the Netherlands, with a view to expand into the wider European region in the near future.
The total fair value of net identifiable assets acquired was approximately $2,107,000, including $68,000 of cash acquired and $2,039,000 of identifiable intangible assets, consisting primarily of customer relationships. The customer relationships identifiable intangible asset is being amortized using the straight-line method over its estimated economic life of 8 years. The preliminary purchase price was allocated under the acquisition method of accounting using the information available at the time. During the fourth quarter of 2017, we finalized the fair value assumptions for identifiable intangible assets acquired and reduced the fair value of identifiable intangible assets acquired by approximately $193,000. Goodwill initially recorded of approximately $4,117,000, which was recorded in our EMEA operating segment, was adjusted to $4,041,000 as of December 31, 2017 as a result of the net effects of the decrease in the value of acquired identifiable intangible assets noted previously, adjustments for deferred taxes and foreign currency translation adjustments. None of the goodwill is tax deductible. We will finalize the purchase price allocation in 2018 when the final working capital adjustment is agreed upon and paid and the evaluation of uncertain tax positions, which could lead to an adjustment of the purchase price allocation, is completed.
We consolidated the results of operations for Caase.com within our EMEA operating segment beginning on the effective date of the acquisition. Our historical results would not have been materially affected by the acquisition of Caase.com and, accordingly, we have not presented pro forma information as if the acquisition had been completed at the beginning of each period presented in our statements of operations.
Datalink
On January 6, 2017, we completed our acquisition of Datalink, a leading provider of IT services and enterprise data center solutions based in Eden Prairie, Minnesota, for a cash purchase price of $257,456,000, which included cash and cash equivalents acquired of $76,597,000. We believe that this acquisition strengthened our position as a leading IT solutions provider with deep technical talent delivering data center solutions to clients on premise or in the cloud.
79
Table of Contents
INSIGHT ENTERPRISES, INC.
NOTES TO CONSOLIDATED FINANCIAL STATEMENTS (continued)
The following table summarizes the purchase price and the estimated fair value of the assets acquired and liabilities assumed at the date of acquisition (in thousands):
| Total purchase price |
$ | 257,456 | ||||||
| Fair value of net assets acquired: |
||||||||
| Current assets |
$ | 238,577 | ||||||
| Identifiable intangible assets – see description below |
94,500 | |||||||
| Property and equipment |
5,843 | |||||||
| Other assets |
17,888 | |||||||
| Current liabilities |
(129,071 | ) | ||||||
| Long-term liabilities, including deferred taxes |
(34,421 | ) | ||||||
|
|
|
|||||||
| Total fair value of net assets acquired |
193,316 | |||||||
|
|
|
|||||||
| Excess purchase price over fair value of net assets acquired (“goodwill”) |
$ | 64,140 | ||||||
|
|
|
Under the acquisition method of accounting, the total purchase price as shown in the table above was allocated to the tangible and identifiable intangible assets acquired and liabilities assumed based on their estimated fair values. The excess of the purchase price over fair value of net assets acquired was recorded as goodwill.
The estimated fair values of current assets and liabilities (other than deferred revenue and related deferred costs) were based upon their historical costs on the date of acquisition due to their short-term nature. The majority of property and equipment were also estimated based upon historical costs as they approximated fair value. Certain long-term assets, including Datalink’s IT system, were written down to the estimated fair value based on the economic benefit expected to be realized from the assets following the acquisition. Deferred revenue acquired primarily represents monies collected prior to January 6, 2017 related to unearned revenues associated with support services to be performed in the future. The estimated fair value of deferred revenue of $65,500,000, which is included in current and long-term liabilities in the table above, was calculated using the adjusted fulfillment cost method as the present value of the costs expected to be incurred by a third party to perform the support services obligations acquired under various customer contracts, plus a reasonable profit associated with the performance effort. The deferred costs acquired represent monies paid prior to January 6, 2017 to purchase third party customer support contracts from manufacturers. The estimated fair value of the deferred costs of $48,029,000, which is included in current and other assets in the table above, was calculated in conjunction with the valuation of deferred revenue discussed above.
Identified intangible assets of $94,500,000 consist primarily of customer relationships, the trade name and non-compete agreements, which were valued at $92,200,000, $2,200,000 and $100,000, respectively. These values were determined using the multiple-period excess earnings method, the relief from royalty method and the lost income method, respectively.
The identifiable intangibles resulting from the acquisition are amortized using the straight-line method over the following estimated useful lives:
| Intangible Assets | Estimated Economic Life | |
| Customer relationships |
10 Years | |
| Trade name |
1 Year | |
| Non-compete agreements |
1 Year |
Amortization expense recognized for the period from the acquisition date through December 31, 2017 was $11,520,000.
Goodwill of $64,140,000, which was recorded in our North America operating segment, represents the excess of the purchase price over the estimated fair value assigned to tangible and identifiable intangible assets acquired and liabilities assumed from Datalink. The addition of the Datalink technical employees to our team and the opportunity to grow our data center solutions business are the primary factors making up the goodwill recognized as part of the transaction. None of the goodwill is tax deductible.
The preliminary purchase price was allocated using information available at the time. During the second quarter of 2017, upon analysis of additional information affecting our estimate of the fair value of net assets acquired, we adjusted the purchase price allocation and reduced the goodwill balance by $945,000. During the remainder of 2017, no further adjustments to the purchase price allocation were made, and the purchase price allocation was finalized.
80
Table of Contents
INSIGHT ENTERPRISES, INC.
NOTES TO CONSOLIDATED FINANCIAL STATEMENTS (continued)
We have consolidated the results of operations for Datalink since its acquisition on January 6, 2017. Consolidated net sales and gross profit for the year ended December 31, 2017 include $524,281,000 and $118,917,000, respectively, from Datalink. The following table reports pro forma information as if the acquisition of Datalink had been completed at the beginning of the earliest period presented (in thousands, except per share amounts):
| Year Ended December 31, | ||||||||||||||
| 2017 | 2016 | 2015 | ||||||||||||
| Net sales |
As reported | $ | 6,703,623 | $ | 5,485,515 | $ | 5,373,090 | |||||||
| Proforma | $ | 6,707,533 | $ | 6,084,484 | $ | 6,033,750 | ||||||||
| Net earnings |
As reported | $ | 90,683 | $ | 84,690 | $ | 75,851 | |||||||
| Proforma | $ | 92,276 | $ | 85,823 | $ | 75,696 | ||||||||
| Diluted earnings per share |
As reported | $ | 2.50 | $ | 2.32 | $ | 1.98 | |||||||
| Proforma | $ | 2.55 | $ | 2.36 | $ | 1.98 | ||||||||
Ignia
Effective September 1, 2016, we acquired Ignia, a business technology consulting and managed services provider headquartered in Perth, Australia, with an additional office in Melbourne, for a cash purchase price, net of cash acquired, of approximately $10,804,000, subject to a final working capital adjustment. We believe that this acquisition expands our global footprint in the areas of application design, digital solutions, cloud, mobility and business analytics, while also building on our unique position to bring solutions powered by Intelligent Technology™ to our clients in the Asia-Pacific region.
The total fair value of net identifiable assets acquired initially recorded was approximately $5,324,000, including $1,463,000 of cash acquired and $4,716,000 of identifiable intangible assets, consisting primarily of customer relationships and restrictive covenant agreements which are being amortized using the straight-line method over their estimated economic lives of eight years and 27 months, respectively. The preliminary purchase price was allocated using the information available at the time. During the fourth quarter of 2016, we finalized the fair value assumptions for identifiable intangible assets acquired and reduced the fair value of identifiable intangible assets acquired by approximately $218,000. Goodwill initially recorded of approximately $7,248,000, which was recorded in our APAC operating segment, was adjusted to $6,957,000 as of December 31, 2016 as a result of the net effects of the decrease in the value of acquired identifiable intangible assets noted previously and foreign currency translation adjustments. None of the goodwill is tax deductible. We finalized the purchase price allocation in the second quarter of 2017 when the final working capital adjustment of $35,000 was agreed upon.
We consolidated the results of operations for Ignia within our APAC operating segment beginning on September 1, 2016, the effective date of the acquisition. Our historical results would not have been materially affected by the acquisition of Ignia and, accordingly, we have not presented pro forma information as if the acquisition had been completed at the beginning of each period presented in our statements of operations.
BlueMetal
Effective October 1, 2015, we acquired BlueMetal, an interactive design and technology architecture firm based in the Boston area, with offices in Chicago and New York, for a cash purchase price, net of cash acquired, of approximately $44,221,000. BlueMetal delivers strategic design, application development, business intelligence solutions and data visualization platforms, and we believe this acquisition strengthens our services capabilities to bring value to our clients’ businesses in the area of application design, mobility and big data.
The total fair value of net assets acquired was approximately $15,412,000, including $15,240,000 of identifiable intangible assets, consisting primarily of customer relationships and restrictive covenant agreements which are being amortized using the straight-line method over their estimated economic lives of eight and three years, respectively. Goodwill acquired approximated $29,938,000, which was recorded in our North America operating segment. In 2016, we resolved the working capital contingency associated with the acquisition of BlueMetal. We recorded an adjustment of the purchase price as a reduction of goodwill in our North America operating segment upon the receipt of $507,000 in cash during 2016. The addition of the BlueMetal employees to our team and the opportunity to grow our services business are the primary factors making up the goodwill recognized as part of the transaction. None of the goodwill is tax deductible.
81
Table of Contents
INSIGHT ENTERPRISES, INC.
NOTES TO CONSOLIDATED FINANCIAL STATEMENTS (continued)
We consolidated the results of operations for BlueMetal beginning on October 1, 2015, the effective date of the acquisition. Our historical results would not have been materially affected by the acquisition of BlueMetal and, accordingly, we have not presented pro forma information as if the acquisition had been completed at the beginning of each period presented in our statements of operations.
(22) Sale of Foreign Entity
On July 19, 2017, we concluded the sale of our operations in Russia, formerly a part of our EMEA operating segment, to one of our global partners that is focused in the region. We recorded a loss on the sale of the foreign entity of approximately $3,646,000 during the third quarter of 2017, including a $2,903,000 charge upon the release of our cumulative translation adjustment account balance as of the sale date.
(23) Selected Quarterly Financial Information (unaudited)
The following tables set forth selected unaudited consolidated quarterly financial information for 2017 and 2016 (in thousands, except per share data):
| Quarters Ended | ||||||||||||||||
| December 31, 2017 |
September 30, 2017 |
June 30, 2017 |
March 31, 2017 |
|||||||||||||
| Net sales |
$ | 1,784,075 | $ | 1,757,973 | $ | 1,684,032 | $ | 1,477,543 | ||||||||
| Costs of goods sold |
1,551,192 | 1,531,892 | 1,432,653 | 1,269,316 | ||||||||||||
|
|
|
|
|
|
|
|
|
|||||||||
| Gross profit |
232,883 | 226,081 | 251,379 | 208,227 | ||||||||||||
| Operating expenses: |
||||||||||||||||
| Selling and administrative expenses |
184,554 | 180,390 | 180,752 | 177,632 | ||||||||||||
| Severance and restructuring expenses |
2,791 | 494 | 1,022 | 4,695 | ||||||||||||
| Loss on sale of foreign entity |
— | 3,646 | — | — | ||||||||||||
| Acquisition-related expenses |
— | 106 | 276 | 2,947 | ||||||||||||
|
|
|
|
|
|
|
|
|
|||||||||
| Earnings from operations |
45,538 | 41,445 | 69,329 | 22,953 | ||||||||||||
| Non-operating (income) expense: |
||||||||||||||||
| Interest income |
(346 | ) | (227 | ) | (205 | ) | (431 | ) | ||||||||
| Interest expense |
5,360 | 5,555 | 4,326 | 3,933 | ||||||||||||
| Net foreign currency exchange (gain) loss |
(117 | ) | 341 | 251 | 380 | |||||||||||
| Other expense, net |
367 | 339 | 326 | 315 | ||||||||||||
|
|
|
|
|
|
|
|
|
|||||||||
| Earnings before income taxes |
40,274 | 35,437 | 64,631 | 18,756 | ||||||||||||
| Income tax expense |
26,106 | 13,025 | 24,376 | 4,908 | ||||||||||||
|
|
|
|
|
|
|
|
|
|||||||||
| Net earnings |
$ | 14,168 | $ | 22,412 | $ | 40,255 | $ | 13,848 | ||||||||
|
|
|
|
|
|
|
|
|
|||||||||
| Net earnings per share: |
||||||||||||||||
| Basic |
$ | 0.40 | $ | 0.63 | $ | 1.13 | $ | 0.39 | ||||||||
|
|
|
|
|
|
|
|
|
|||||||||
| Diluted |
$ | 0.39 | $ | 0.62 | $ | 1.11 | $ | 0.38 | ||||||||
|
|
|
|
|
|
|
|
|
|||||||||
| Shares used in per share calculations: |
||||||||||||||||
| Basic |
35,809 | 35,787 | 35,765 | 35,602 | ||||||||||||
|
|
|
|
|
|
|
|
|
|||||||||
| Diluted |
36,272 | 36,203 | 36,169 | 36,185 | ||||||||||||
|
|
|
|
|
|
|
|
|
|||||||||
82
Table of Contents
INSIGHT ENTERPRISES, INC.
NOTES TO CONSOLIDATED FINANCIAL STATEMENTS (continued)
| Quarters Ended | ||||||||||||||||
| December 31, 2016 |
September 30, 2016 |
June 30, 2016 |
March 31, 2016 |
|||||||||||||
| Net sales |
$ | 1,467,583 | $ | 1,392,716 | $ | 1,456,234 | $ | 1,168,982 | ||||||||
| Costs of goods sold |
1,276,614 | 1,210,908 | 1,247,017 | 1,007,874 | ||||||||||||
|
|
|
|
|
|
|
|
|
|||||||||
| Gross profit |
190,969 | 181,808 | 209,217 | 161,108 | ||||||||||||
| Operating expenses: |
||||||||||||||||
| Selling and administrative expenses |
145,066 | 143,872 | 150,186 | 146,119 | ||||||||||||
| Severance and restructuring expenses |
1,527 | 788 | 909 | 1,356 | ||||||||||||
| Acquisition-related expenses |
3,706 | 741 | — | — | ||||||||||||
|
|
|
|
|
|
|
|
|
|||||||||
| Earnings from operations |
40,670 | 36,407 | 58,122 | 13,633 | ||||||||||||
| Non-operating (income) expense: |
||||||||||||||||
| Interest income |
(282 | ) | (318 | ) | (216 | ) | (250 | ) | ||||||||
| Interest expense |
2,271 | 2,517 | 1,992 | 1,848 | ||||||||||||
| Net foreign currency exchange (gain) loss |
(520 | ) | 579 | (153 | ) | 616 | ||||||||||
| Other expense, net |
311 | 352 | 359 | 268 | ||||||||||||
|
|
|
|
|
|
|
|
|
|||||||||
| Earnings before income taxes |
38,890 | 33,277 | 56,140 | 11,151 | ||||||||||||
| Income tax expense |
17,790 | 11,642 | 21,073 | 4,263 | ||||||||||||
|
|
|
|
|
|
|
|
|
|||||||||
| Net earnings |
$ | 21,100 | $ | 21,635 | $ | 35,067 | $ | 6,888 | ||||||||
|
|
|
|
|
|
|
|
|
|||||||||
| Net earnings per share: |
||||||||||||||||
| Basic |
$ | 0.59 | $ | 0.61 | $ | 0.96 | $ | 0.19 | ||||||||
|
|
|
|
|
|
|
|
|
|||||||||
| Diluted |
$ | 0.59 | $ | 0.60 | $ | 0.96 | $ | 0.18 | ||||||||
|
|
|
|
|
|
|
|
|
|||||||||
| Shares used in per share calculations: |
||||||||||||||||
| Basic |
35,479 | 35,474 | 36,380 | 37,075 | ||||||||||||
|
|
|
|
|
|
|
|
|
|||||||||
| Diluted |
35,963 | 35,790 | 36,612 | 37,386 | ||||||||||||
|
|
|
|
|
|
|
|
|
|||||||||
83
Table of Contents
INSIGHT ENTERPRISES, INC.
| Item 9. | Changes in and Disagreements With Accountants on Accounting and Financial Disclosure |
Not applicable.
| Item 9A. | Controls and Procedures |
(a) Management’s Annual Report on Internal Control Over Financial Reporting
Our management is responsible for establishing and maintaining adequate internal control over financial reporting (as such term is defined under Rules 13a-15(f) and 15d-15(f) of the Securities Exchange Act of 1934, as amended (the “Exchange Act”)). Our management, including our Chief Executive Officer and Chief Financial Officer, conducted an evaluation of the effectiveness of our internal control over financial reporting as of December 31, 2017. In making this assessment, our management used the criteria established in Internal Control – Integrated Framework (2013) issued by the Committee of Sponsoring Organizations of the Treadway Commission (“COSO”). Management has concluded that the Company maintained effective internal control over financial reporting as of December 31, 2017, based on the criteria established in COSO’s Internal Control – Integrated Framework.
KPMG LLP, the independent registered public accounting firm that audited the Consolidated Financial Statements in Part II, Item 8 of this report, has issued an attestation report on the Company’s internal control over financial reporting as of December 31, 2017.
(b) Changes in Internal Control Over Financial Reporting
There was no change in our internal control over financial reporting (as such term is defined in Rules 13a-15(f) and 15d-15(f) under the Exchange Act) during the quarter ended December 31, 2017 that has materially affected, or is reasonably likely to materially affect, our internal control over financial reporting.
(c) Disclosure Controls and Procedures
We maintain disclosure controls and procedures (as defined in Rule 13a-15(e) and 15d-15(e) under the Exchange Act). Our Chief Executive Officer and Chief Financial Officer, as of the end of the period covered by this report, evaluated the effectiveness of our disclosure controls and procedures and determined that as of December 31, 2017 our disclosure controls and procedures were effective to ensure that information required to be disclosed by us in reports that we file or submit under the Exchange Act is recorded, processed, summarized and reported within the time periods specified in the SEC’s rules and forms and that such information is accumulated and communicated to our management, including our Chief Executive Officer and Chief Financial Officer, as appropriate to allow timely decisions regarding required disclosure.
(d) Inherent Limitations of Disclosure Controls and Internal Control Over Financial Reporting
Because of its inherent limitations, internal control over financial reporting may not prevent or detect misstatements. Projections of any evaluation of effectiveness to future periods are subject to risks that controls may become inadequate because of changes in conditions, or that the degree of compliance with the policies or procedures may deteriorate.
| Item 9B. | Other Information |
Not applicable.
84
Table of Contents
INSIGHT ENTERPRISES, INC.
| Item 10. | Directors, Executive Officers and Corporate Governance |
The information required by this item can be found in our definitive Proxy Statement relating to our 2018 Annual Meeting of Stockholders (our “Proxy Statement”) and is incorporated herein by reference.
| Item 11. | Executive Compensation |
The information required by this item can be found in our Proxy Statement and is incorporated herein by reference.
| Item 12. | Security Ownership of Certain Beneficial Owners and Management and Related Stockholder Matters |
The information required by this item can be found in our Proxy Statement and is incorporated herein by reference.
| Item 13. | Certain Relationships and Related Transactions, and Director Independence |
The information required by this item can be found in our Proxy Statement and is incorporated herein by reference.
| Item 14. | Principal Accounting Fees and Services |
The information required by this item can be found in our Proxy Statement and is incorporated herein by reference.
| Item 15. | Exhibits, Financial Statement Schedules |
(a) Financial Statements and Schedules
The Consolidated Financial Statements of Insight Enterprises, Inc. and subsidiaries and the related Reports of Independent Registered Public Accounting Firm are filed herein as set forth under Part II, Item 8 of this report.
Financial statement schedules have been omitted since they are either not required, not applicable, or the information is otherwise included in the Consolidated Financial Statements or notes thereto.
(b) Exhibits
The exhibits list immediately following the signature page is incorporated herein by reference as the list of exhibits required as part of this report.
| Item 16. | Form 10-K Summary |
None.
85
Table of Contents
EXHIBITS TO FORM 10-K
YEAR ENDED DECEMBER 31, 2017
Commission File No. 000-25092
86
Table of Contents
INSIGHT ENTERPRISES, INC.
EXHIBITS TO FORM 10-K (continued)
YEAR ENDED DECEMBER 31, 2017
Commission File No. 000-25092
87
Table of Contents
INSIGHT ENTERPRISES, INC.
EXHIBITS TO FORM 10-K (continued)
YEAR ENDED DECEMBER 31, 2017
Commission File No. 000-25092
88
Table of Contents
INSIGHT ENTERPRISES, INC.
EXHIBITS TO FORM 10-K (continued)
YEAR ENDED DECEMBER 31, 2017
Commission File No. 000-25092
89
Table of Contents
INSIGHT ENTERPRISES, INC.
EXHIBITS TO FORM 10-K (continued)
YEAR ENDED DECEMBER 31, 2017
Commission File No. 000-25092
90
Table of Contents
| (1) | We have entered into a separate indemnification agreement with each of the following directors and executive officers that differ only in names and dates: Richard E. Allen, Bruce W. Armstrong, Linda Breard, Glynis A. Bryan, Catherine Courage, Samuel C. Cowley, Timothy A. Crown, Steven W. Dodenhoff, Bennett Dorrance, Wolfgang Ebermann, Michael M. Fisher, Michael P. Guggemos, Anthony A. Ibargüen, Helen K. Johnson, Kenneth T. Lamneck, Dana A. Leighty, Kathleen S. Pushor and Girish Rishi. Pursuant to the instructions accompanying Item 601 of Regulation S-K, the Registrant is filing the form of such indemnification agreement. |
| (2) | Management contract or compensatory plan or arrangement. |
| (P) | Paper exhibit. |
91
Table of Contents
INSIGHT ENTERPRISES, INC.
Pursuant to the requirements of Section 13 or 15(d) of the Securities Exchange Act of 1934, the registrant has duly caused this report to be signed on its behalf by the undersigned, thereunto duly authorized.
| INSIGHT ENTERPRISES, INC. | ||
| By | /s/ Kenneth T. Lamneck | |
| Kenneth T. Lamneck | ||
| Chief Executive Officer | ||
Dated: February 23, 2018
Pursuant to the requirements of the Securities Exchange Act of 1934, this report has been signed below by the following persons on behalf of the registrant and in the capacities and on the dates indicated.
| Signature |
Title |
Date | ||
| /s/ Kenneth T. Lamneck Kenneth T. Lamneck |
President, Chief Executive Officer and Director (principal executive officer) | February 23, 2018 | ||
| /s/ Glynis A. Bryan Glynis A. Bryan |
Chief Financial Officer (principal financial officer) | February 23, 2018 | ||
| /s/ Dana A. Leighty Dana A. Leighty |
Vice President, Finance (principal accounting officer) | February 23, 2018 | ||
| /s/ Timothy A. Crown* Timothy A. Crown |
Chairman of the Board | February 23, 2018 | ||
| /s/ Richard E. Allen* Richard E. Allen |
Director | February 23, 2018 | ||
| /s/ Bruce W. Armstrong* Bruce W. Armstrong |
Director | February 23, 2018 | ||
| /s/ Linda Breard* Linda Breard |
Director | February 23, 2018 | ||
| /s/ Catherine Courage* Catherine Courage |
Director | February 23, 2018 | ||
| /s/ Bennett Dorrance* Bennett Dorrance |
Director | February 23, 2018 | ||
| /s/ Michael M. Fisher* Michael M. Fisher |
Director | February 23, 2018 | ||
| /s/ Anthony A. Ibargüen* Anthony A. Ibargüen |
Director | February 23, 2018 | ||
| /s/ Kathleen S. Pushor* Kathleen S. Pushor |
Director | February 23, 2018 | ||
| /s/ Girish Rishi* Girish Rishi |
Director | February 23, 2018 | ||
| * By: | /s/ Samuel C. Cowley | |
| Samuel C. Cowley, Attorney in Fact |
92