Attached files
| file | filename |
|---|---|
| 8-K - FORM 8-K - SPIRIT REALTY CAPITAL, INC. | d20038d8k.htm |
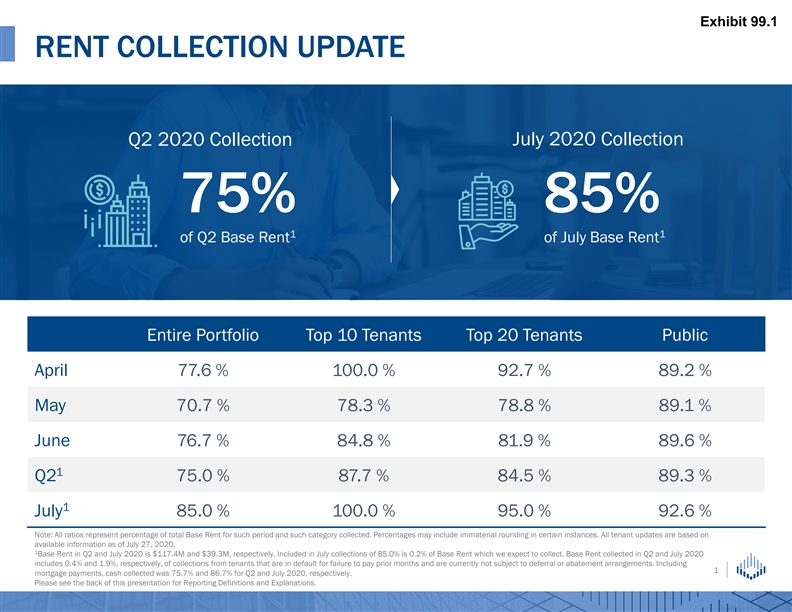
Exhibit 99.1 RENT COLLECTION UPDATE July 2020 Collection Q2 2020 Collection 75% 85% 1 1 of Q2 Base Rent of July Base Rent Entire Portfolio Top 10 Tenants Top 20 Tenants Public April 77.6 % 100.0 % 92.7 % 89.2 % May 70.7 % 78.3 % 78.8 % 89.1 % June 76.7 % 84.8 % 81.9 % 89.6 % 1 Q2 75.0 % 87.7 % 84.5 % 89.3 % 1 July 85.0 % 100.0 % 95.0 % 92.6 % Note: All ratios represent percentage of total Base Rent for such period and such category collected. Percentages may include immaterial rounding in certain instances. All tenant updates are based on available information as of July 27, 2020. 1 Base Rent in Q2 and July 2020 is $117.4M and $39.3M, respectively. Included in July collections of 85.0% is 0.2% of Base Rent which we expect to collect. Base Rent collected in Q2 and July 2020 includes 0.4% and 1.9%, respectively, of collections from tenants that are in default for failure to pay prior months and are currently not subject to deferral or abatement arrangements. Including 1 mortgage payments, cash collected was 75.7% and 86.7% for Q2 and July 2020, respectively. Please see the back of this presentation for Reporting Definitions and Explanations.Exhibit 99.1 RENT COLLECTION UPDATE July 2020 Collection Q2 2020 Collection 75% 85% 1 1 of Q2 Base Rent of July Base Rent Entire Portfolio Top 10 Tenants Top 20 Tenants Public April 77.6 % 100.0 % 92.7 % 89.2 % May 70.7 % 78.3 % 78.8 % 89.1 % June 76.7 % 84.8 % 81.9 % 89.6 % 1 Q2 75.0 % 87.7 % 84.5 % 89.3 % 1 July 85.0 % 100.0 % 95.0 % 92.6 % Note: All ratios represent percentage of total Base Rent for such period and such category collected. Percentages may include immaterial rounding in certain instances. All tenant updates are based on available information as of July 27, 2020. 1 Base Rent in Q2 and July 2020 is $117.4M and $39.3M, respectively. Included in July collections of 85.0% is 0.2% of Base Rent which we expect to collect. Base Rent collected in Q2 and July 2020 includes 0.4% and 1.9%, respectively, of collections from tenants that are in default for failure to pay prior months and are currently not subject to deferral or abatement arrangements. Including 1 mortgage payments, cash collected was 75.7% and 86.7% for Q2 and July 2020, respectively. Please see the back of this presentation for Reporting Definitions and Explanations.
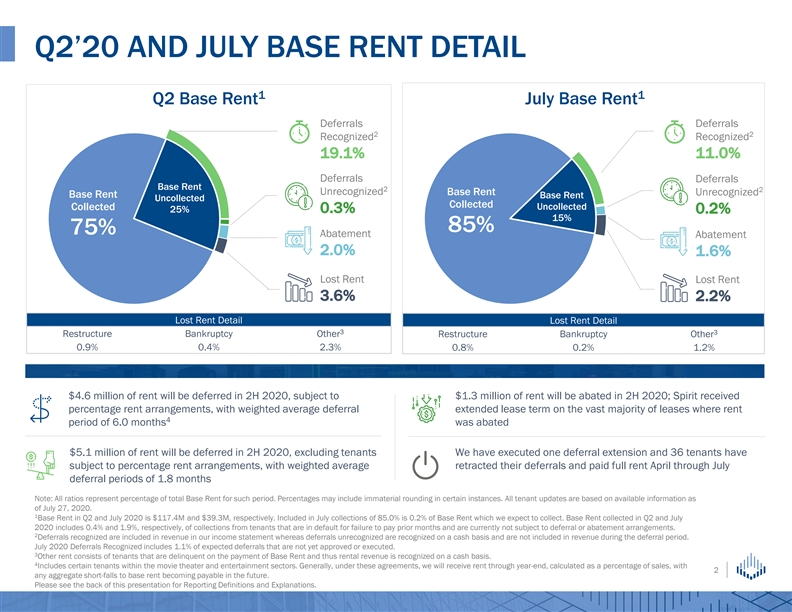
Q2’20 AND JULY BASE RENT DETAIL 1 1 Q2 Base Rent July Base Rent Deferrals Deferrals 2 2 Recognized Recognized 19.1% 11.0% Deferrals Deferrals Base Rent 2 2 Unrecognized Base Rent Unrecognized Base Rent Base Rent Uncollected Collected Collected Uncollected 25% 0.3% 0.2% 15% 85% 75% Abatement Abatement 2.0% 1.6% Lost Rent Lost Rent 3.6% 2.2% Lost Rent Detail Lost Rent Detail 3 3 Restructure Bankruptcy Other Restructure Bankruptcy Other 0.9% 0.4% 2.3% 0.8% 0.2% 1.2% $4.6 million of rent will be deferred in 2H 2020, subject to $1.3 million of rent will be abated in 2H 2020; Spirit received percentage rent arrangements, with weighted average deferral extended lease term on the vast majority of leases where rent 4 period of 6.0 months was abated $5.1 million of rent will be deferred in 2H 2020, excluding tenants We have executed one deferral extension and 36 tenants have subject to percentage rent arrangements, with weighted average retracted their deferrals and paid full rent April through July deferral periods of 1.8 months Note: All ratios represent percentage of total Base Rent for such period. Percentages may include immaterial rounding in certain instances. All tenant updates are based on available information as of July 27, 2020. 1 Base Rent in Q2 and July 2020 is $117.4M and $39.3M, respectively. Included in July collections of 85.0% is 0.2% of Base Rent which we expect to collect. Base Rent collected in Q2 and July 2020 includes 0.4% and 1.9%, respectively, of collections from tenants that are in default for failure to pay prior months and are currently not subject to deferral or abatement arrangements. 2 Deferrals recognized are included in revenue in our income statement whereas deferrals unrecognized are recognized on a cash basis and are not included in revenue during the deferral period. July 2020 Deferrals Recognized includes 1.1% of expected deferrals that are not yet approved or executed. 3 Other rent consists of tenants that are delinquent on the payment of Base Rent and thus rental revenue is recognized on a cash basis. 4 Includes certain tenants within the movie theater and entertainment sectors. Generally, under these agreements, we will receive rent through year-end, calculated as a percentage of sales, with 2 any aggregate short-falls to base rent becoming payable in the future. Please see the back of this presentation for Reporting Definitions and Explanations.Q2’20 AND JULY BASE RENT DETAIL 1 1 Q2 Base Rent July Base Rent Deferrals Deferrals 2 2 Recognized Recognized 19.1% 11.0% Deferrals Deferrals Base Rent 2 2 Unrecognized Base Rent Unrecognized Base Rent Base Rent Uncollected Collected Collected Uncollected 25% 0.3% 0.2% 15% 85% 75% Abatement Abatement 2.0% 1.6% Lost Rent Lost Rent 3.6% 2.2% Lost Rent Detail Lost Rent Detail 3 3 Restructure Bankruptcy Other Restructure Bankruptcy Other 0.9% 0.4% 2.3% 0.8% 0.2% 1.2% $4.6 million of rent will be deferred in 2H 2020, subject to $1.3 million of rent will be abated in 2H 2020; Spirit received percentage rent arrangements, with weighted average deferral extended lease term on the vast majority of leases where rent 4 period of 6.0 months was abated $5.1 million of rent will be deferred in 2H 2020, excluding tenants We have executed one deferral extension and 36 tenants have subject to percentage rent arrangements, with weighted average retracted their deferrals and paid full rent April through July deferral periods of 1.8 months Note: All ratios represent percentage of total Base Rent for such period. Percentages may include immaterial rounding in certain instances. All tenant updates are based on available information as of July 27, 2020. 1 Base Rent in Q2 and July 2020 is $117.4M and $39.3M, respectively. Included in July collections of 85.0% is 0.2% of Base Rent which we expect to collect. Base Rent collected in Q2 and July 2020 includes 0.4% and 1.9%, respectively, of collections from tenants that are in default for failure to pay prior months and are currently not subject to deferral or abatement arrangements. 2 Deferrals recognized are included in revenue in our income statement whereas deferrals unrecognized are recognized on a cash basis and are not included in revenue during the deferral period. July 2020 Deferrals Recognized includes 1.1% of expected deferrals that are not yet approved or executed. 3 Other rent consists of tenants that are delinquent on the payment of Base Rent and thus rental revenue is recognized on a cash basis. 4 Includes certain tenants within the movie theater and entertainment sectors. Generally, under these agreements, we will receive rent through year-end, calculated as a percentage of sales, with 2 any aggregate short-falls to base rent becoming payable in the future. Please see the back of this presentation for Reporting Definitions and Explanations.
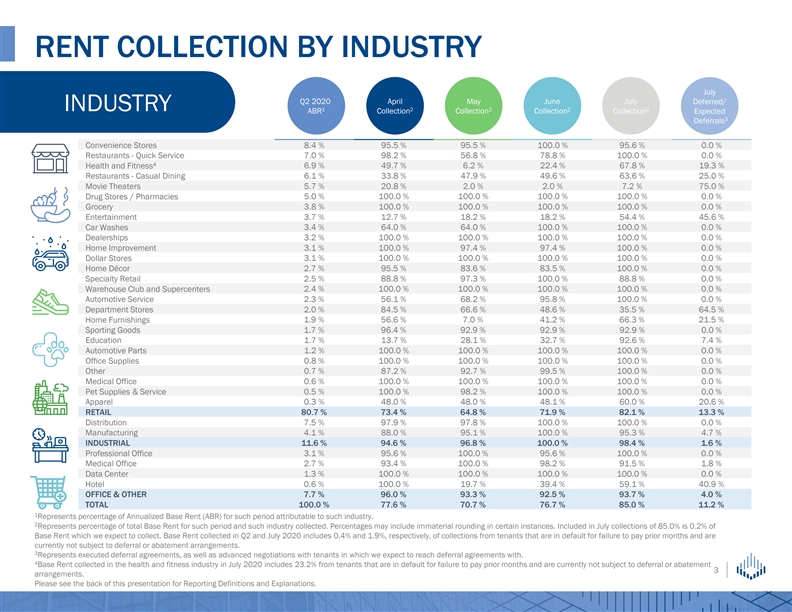
RENT COLLECTION BY INDUSTRY July Q2 2020 April May June July Deferred/ INDUSTRY 1 2 2 2 2 ABR Collection Collection Collection Collection Expected 3 Deferrals Convenience Stores 8.4 % 95.5 % 95.5 % 100.0 % 95.6 % 0.0 % Restaurants - Quick Service 7.0 % 98.2 % 56.8 % 78.8 % 100.0 % 0.0 % 4 Health and Fitness 6.9 % 49.7 % 6.2 % 22.4 % 67.8 % 19.3 % Restaurants - Casual Dining 6.1 % 33.8 % 47.9 % 49.6 % 63.6 % 25.0 % Movie Theaters 5.7 % 20.8 % 2.0 % 2.0 % 7.2 % 75.0 % Drug Stores / Pharmacies 5.0 % 100.0 % 100.0 % 100.0 % 100.0 % 0.0 % Grocery 3.8 % 100.0 % 100.0 % 100.0 % 100.0 % 0.0 % Entertainment 3.7 % 12.7 % 18.2 % 18.2 % 54.4 % 45.6 % Car Washes 3.4 % 64.0 % 64.0 % 100.0 % 100.0 % 0.0 % Dealerships 3.2 % 100.0 % 100.0 % 100.0 % 100.0 % 0.0 % Home Improvement 3.1 % 100.0 % 97.4 % 97.4 % 100.0 % 0.0 % Dollar Stores 3.1 % 100.0 % 100.0 % 100.0 % 100.0 % 0.0 % Home Décor 2.7 % 95.5 % 83.6 % 83.5 % 100.0 % 0.0 % Specialty Retail 2.5 % 88.8 % 97.3 % 100.0 % 88.8 % 0.0 % Warehouse Club and Supercenters 2.4 % 100.0 % 100.0 % 100.0 % 100.0 % 0.0 % Automotive Service 2.3 % 56.1 % 68.2 % 95.8 % 100.0 % 0.0 % Department Stores 2.0 % 84.5 % 66.6 % 48.6 % 35.5 % 64.5 % Home Furnishings 1.9 % 56.6 % 7.0 % 41.2 % 66.3 % 21.5 % Sporting Goods 1.7 % 96.4 % 92.9 % 92.9 % 92.9 % 0.0 % Education 1.7 % 13.7 % 28.1 % 32.7 % 92.6 % 7.4 % Automotive Parts 1.2 % 100.0 % 100.0 % 100.0 % 100.0 % 0.0 % Office Supplies 0.8 % 100.0 % 100.0 % 100.0 % 100.0 % 0.0 % Other 0.7 % 87.2 % 92.7 % 99.5 % 100.0 % 0.0 % Medical Office 0.6 % 100.0 % 100.0 % 100.0 % 100.0 % 0.0 % Pet Supplies & Service 0.5 % 100.0 % 98.2 % 100.0 % 100.0 % 0.0 % Apparel 0.3 % 48.0 % 48.0 % 48.1 % 60.0 % 20.6 % RETAIL 80.7 % 73.4 % 64.8 % 71.9 % 82.1 % 13.3 % Distribution 7.5 % 97.9 % 97.8 % 100.0 % 100.0 % 0.0 % Manufacturing 4.1 % 88.0 % 95.1 % 100.0 % 95.3 % 4.7 % INDUSTRIAL 11.6 % 94.6 % 96.8 % 100.0 % 98.4 % 1.6 % Professional Office 3.1 % 95.6 % 100.0 % 95.6 % 100.0 % 0.0 % Medical Office 2.7 % 93.4 % 100.0 % 98.2 % 91.5 % 1.8 % Data Center 1.3 % 100.0 % 100.0 % 100.0 % 100.0 % 0.0 % Hotel 0.6 % 100.0 % 19.7 % 39.4 % 59.1 % 40.9 % OFFICE & OTHER 7.7 % 96.0 % 93.3 % 92.5 % 93.7 % 4.0 % TOTAL 100.0 % 77.6 % 70.7 % 76.7 % 85.0 % 11.2 % 1 Represents percentage of Annualized Base Rent (ABR) for such period attributable to such industry. 2 Represents percentage of total Base Rent for such period and such industry collected. Percentages may include immaterial rounding in certain instances. Included in July collections of 85.0% is 0.2% of Base Rent which we expect to collect. Base Rent collected in Q2 and July 2020 includes 0.4% and 1.9%, respectively, of collections from tenants that are in default for failure to pay prior months and are currently not subject to deferral or abatement arrangements. 3 Represents executed deferral agreements, as well as advanced negotiations with tenants in which we expect to reach deferral agreements with. 4 Base Rent collected in the health and fitness industry in July 2020 includes 23.2% from tenants that are in default for failure to pay prior months and are currently not subject to deferral or abatement 3 arrangements. Please see the back of this presentation for Reporting Definitions and Explanations.RENT COLLECTION BY INDUSTRY July Q2 2020 April May June July Deferred/ INDUSTRY 1 2 2 2 2 ABR Collection Collection Collection Collection Expected 3 Deferrals Convenience Stores 8.4 % 95.5 % 95.5 % 100.0 % 95.6 % 0.0 % Restaurants - Quick Service 7.0 % 98.2 % 56.8 % 78.8 % 100.0 % 0.0 % 4 Health and Fitness 6.9 % 49.7 % 6.2 % 22.4 % 67.8 % 19.3 % Restaurants - Casual Dining 6.1 % 33.8 % 47.9 % 49.6 % 63.6 % 25.0 % Movie Theaters 5.7 % 20.8 % 2.0 % 2.0 % 7.2 % 75.0 % Drug Stores / Pharmacies 5.0 % 100.0 % 100.0 % 100.0 % 100.0 % 0.0 % Grocery 3.8 % 100.0 % 100.0 % 100.0 % 100.0 % 0.0 % Entertainment 3.7 % 12.7 % 18.2 % 18.2 % 54.4 % 45.6 % Car Washes 3.4 % 64.0 % 64.0 % 100.0 % 100.0 % 0.0 % Dealerships 3.2 % 100.0 % 100.0 % 100.0 % 100.0 % 0.0 % Home Improvement 3.1 % 100.0 % 97.4 % 97.4 % 100.0 % 0.0 % Dollar Stores 3.1 % 100.0 % 100.0 % 100.0 % 100.0 % 0.0 % Home Décor 2.7 % 95.5 % 83.6 % 83.5 % 100.0 % 0.0 % Specialty Retail 2.5 % 88.8 % 97.3 % 100.0 % 88.8 % 0.0 % Warehouse Club and Supercenters 2.4 % 100.0 % 100.0 % 100.0 % 100.0 % 0.0 % Automotive Service 2.3 % 56.1 % 68.2 % 95.8 % 100.0 % 0.0 % Department Stores 2.0 % 84.5 % 66.6 % 48.6 % 35.5 % 64.5 % Home Furnishings 1.9 % 56.6 % 7.0 % 41.2 % 66.3 % 21.5 % Sporting Goods 1.7 % 96.4 % 92.9 % 92.9 % 92.9 % 0.0 % Education 1.7 % 13.7 % 28.1 % 32.7 % 92.6 % 7.4 % Automotive Parts 1.2 % 100.0 % 100.0 % 100.0 % 100.0 % 0.0 % Office Supplies 0.8 % 100.0 % 100.0 % 100.0 % 100.0 % 0.0 % Other 0.7 % 87.2 % 92.7 % 99.5 % 100.0 % 0.0 % Medical Office 0.6 % 100.0 % 100.0 % 100.0 % 100.0 % 0.0 % Pet Supplies & Service 0.5 % 100.0 % 98.2 % 100.0 % 100.0 % 0.0 % Apparel 0.3 % 48.0 % 48.0 % 48.1 % 60.0 % 20.6 % RETAIL 80.7 % 73.4 % 64.8 % 71.9 % 82.1 % 13.3 % Distribution 7.5 % 97.9 % 97.8 % 100.0 % 100.0 % 0.0 % Manufacturing 4.1 % 88.0 % 95.1 % 100.0 % 95.3 % 4.7 % INDUSTRIAL 11.6 % 94.6 % 96.8 % 100.0 % 98.4 % 1.6 % Professional Office 3.1 % 95.6 % 100.0 % 95.6 % 100.0 % 0.0 % Medical Office 2.7 % 93.4 % 100.0 % 98.2 % 91.5 % 1.8 % Data Center 1.3 % 100.0 % 100.0 % 100.0 % 100.0 % 0.0 % Hotel 0.6 % 100.0 % 19.7 % 39.4 % 59.1 % 40.9 % OFFICE & OTHER 7.7 % 96.0 % 93.3 % 92.5 % 93.7 % 4.0 % TOTAL 100.0 % 77.6 % 70.7 % 76.7 % 85.0 % 11.2 % 1 Represents percentage of Annualized Base Rent (ABR) for such period attributable to such industry. 2 Represents percentage of total Base Rent for such period and such industry collected. Percentages may include immaterial rounding in certain instances. Included in July collections of 85.0% is 0.2% of Base Rent which we expect to collect. Base Rent collected in Q2 and July 2020 includes 0.4% and 1.9%, respectively, of collections from tenants that are in default for failure to pay prior months and are currently not subject to deferral or abatement arrangements. 3 Represents executed deferral agreements, as well as advanced negotiations with tenants in which we expect to reach deferral agreements with. 4 Base Rent collected in the health and fitness industry in July 2020 includes 23.2% from tenants that are in default for failure to pay prior months and are currently not subject to deferral or abatement 3 arrangements. Please see the back of this presentation for Reporting Definitions and Explanations.
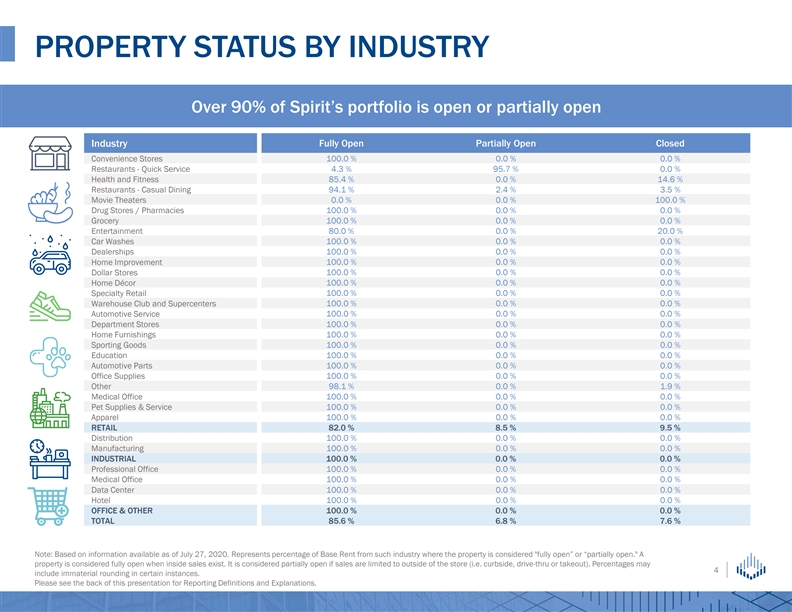
PROPERTY STATUS BY INDUSTRY Over 90% of Spirit’s portfolio is open or partially open Industry Fully Open Partially Open Closed 100.0 % 0.0 % 0.0 % Convenience Stores Restaurants - Quick Service 4.3 % 95.7 % 0.0 % Health and Fitness 85.4 % 0.0 % 14.6 % Restaurants - Casual Dining 94.1 % 2.4 % 3.5 % Movie Theaters 0.0 % 0.0 % 100.0 % Drug Stores / Pharmacies 100.0 % 0.0 % 0.0 % Grocery 100.0 % 0.0 % 0.0 % Entertainment 80.0 % 0.0 % 20.0 % Car Washes 100.0 % 0.0 % 0.0 % Dealerships 100.0 % 0.0 % 0.0 % Home Improvement 100.0 % 0.0 % 0.0 % Dollar Stores 100.0 % 0.0 % 0.0 % Home Décor 100.0 % 0.0 % 0.0 % Specialty Retail 100.0 % 0.0 % 0.0 % Warehouse Club and Supercenters 100.0 % 0.0 % 0.0 % Automotive Service 100.0 % 0.0 % 0.0 % Department Stores 100.0 % 0.0 % 0.0 % 100.0 % 0.0 % 0.0 % Home Furnishings Sporting Goods 100.0 % 0.0 % 0.0 % Education 100.0 % 0.0 % 0.0 % 100.0 % 0.0 % 0.0 % Automotive Parts Office Supplies 100.0 % 0.0 % 0.0 % Other 98.1 % 0.0 % 1.9 % Medical Office 100.0 % 0.0 % 0.0 % Pet Supplies & Service 100.0 % 0.0 % 0.0 % Apparel 100.0 % 0.0 % 0.0 % RETAIL 82.0 % 8.5 % 9.5 % Distribution 100.0 % 0.0 % 0.0 % Manufacturing 100.0 % 0.0 % 0.0 % INDUSTRIAL 100.0 % 0.0 % 0.0 % Professional Office 100.0 % 0.0 % 0.0 % Medical Office 100.0 % 0.0 % 0.0 % Data Center 100.0 % 0.0 % 0.0 % Hotel 100.0 % 0.0 % 0.0 % OFFICE & OTHER 100.0 % 0.0 % 0.0 % TOTAL 85.6 % 6.8 % 7.6 % Note: Based on information available as of July 27, 2020. Represents percentage of Base Rent from such industry where the property is considered fully open” or “partially open. A property is considered fully open when inside sales exist. It is considered partially open if sales are limited to outside of the store (i.e. curbside, drive-thru or takeout). Percentages may 4 include immaterial rounding in certain instances. Please see the back of this presentation for Reporting Definitions and Explanations.PROPERTY STATUS BY INDUSTRY Over 90% of Spirit’s portfolio is open or partially open Industry Fully Open Partially Open Closed 100.0 % 0.0 % 0.0 % Convenience Stores Restaurants - Quick Service 4.3 % 95.7 % 0.0 % Health and Fitness 85.4 % 0.0 % 14.6 % Restaurants - Casual Dining 94.1 % 2.4 % 3.5 % Movie Theaters 0.0 % 0.0 % 100.0 % Drug Stores / Pharmacies 100.0 % 0.0 % 0.0 % Grocery 100.0 % 0.0 % 0.0 % Entertainment 80.0 % 0.0 % 20.0 % Car Washes 100.0 % 0.0 % 0.0 % Dealerships 100.0 % 0.0 % 0.0 % Home Improvement 100.0 % 0.0 % 0.0 % Dollar Stores 100.0 % 0.0 % 0.0 % Home Décor 100.0 % 0.0 % 0.0 % Specialty Retail 100.0 % 0.0 % 0.0 % Warehouse Club and Supercenters 100.0 % 0.0 % 0.0 % Automotive Service 100.0 % 0.0 % 0.0 % Department Stores 100.0 % 0.0 % 0.0 % 100.0 % 0.0 % 0.0 % Home Furnishings Sporting Goods 100.0 % 0.0 % 0.0 % Education 100.0 % 0.0 % 0.0 % 100.0 % 0.0 % 0.0 % Automotive Parts Office Supplies 100.0 % 0.0 % 0.0 % Other 98.1 % 0.0 % 1.9 % Medical Office 100.0 % 0.0 % 0.0 % Pet Supplies & Service 100.0 % 0.0 % 0.0 % Apparel 100.0 % 0.0 % 0.0 % RETAIL 82.0 % 8.5 % 9.5 % Distribution 100.0 % 0.0 % 0.0 % Manufacturing 100.0 % 0.0 % 0.0 % INDUSTRIAL 100.0 % 0.0 % 0.0 % Professional Office 100.0 % 0.0 % 0.0 % Medical Office 100.0 % 0.0 % 0.0 % Data Center 100.0 % 0.0 % 0.0 % Hotel 100.0 % 0.0 % 0.0 % OFFICE & OTHER 100.0 % 0.0 % 0.0 % TOTAL 85.6 % 6.8 % 7.6 % Note: Based on information available as of July 27, 2020. Represents percentage of Base Rent from such industry where the property is considered fully open” or “partially open. A property is considered fully open when inside sales exist. It is considered partially open if sales are limited to outside of the store (i.e. curbside, drive-thru or takeout). Percentages may 4 include immaterial rounding in certain instances. Please see the back of this presentation for Reporting Definitions and Explanations.

REPORTING DEFINITIONS AND EXPLANATIONS Annualized Base Rent (ABR) represents Base Rent and earned income from direct financing leases from the final month of the reporting period, adjusted to exclude amounts from properties sold during that period and to include a full month of rental income for properties acquired during that period. The total is then multiplied by 12. We use ABR when calculating certain metrics that are useful to evaluate portfolio credit and diversification and to manage risk. Base Rent represents rental income for the period, including amounts deferred or abated and excluding percentage rents, from our owned properties recognized during the month. We use Base Rent to monitor cash collection and to evaluate past due receivables. Lost Rent is calculated as Base Rent reserved due to uncollectability divided by Base Rent for the period. 5REPORTING DEFINITIONS AND EXPLANATIONS Annualized Base Rent (ABR) represents Base Rent and earned income from direct financing leases from the final month of the reporting period, adjusted to exclude amounts from properties sold during that period and to include a full month of rental income for properties acquired during that period. The total is then multiplied by 12. We use ABR when calculating certain metrics that are useful to evaluate portfolio credit and diversification and to manage risk. Base Rent represents rental income for the period, including amounts deferred or abated and excluding percentage rents, from our owned properties recognized during the month. We use Base Rent to monitor cash collection and to evaluate past due receivables. Lost Rent is calculated as Base Rent reserved due to uncollectability divided by Base Rent for the period. 5