Attached files
| file | filename |
|---|---|
| EX-32.2 - EXHIBIT 32.2 - SPIRIT REALTY CAPITAL, INC. | a2017q1exhibit322906ceocfo.htm |
| EX-32.1 - EXHIBIT 32.1 - SPIRIT REALTY CAPITAL, INC. | a2017q1exhibit321906ceocfo.htm |
| EX-31.4 - EXHIBIT 31.4 - SPIRIT REALTY CAPITAL, INC. | a2017q1exhibit314302cfosrlp.htm |
| EX-31.3 - EXHIBIT 31.3 - SPIRIT REALTY CAPITAL, INC. | a2017q1exhibit313302ceosrlp.htm |
| EX-31.2 - EXHIBIT 31.2 - SPIRIT REALTY CAPITAL, INC. | a2017q1exhibit312302cfosc.htm |
| EX-31.1 - EXHIBIT 31.1 - SPIRIT REALTY CAPITAL, INC. | a2017q1exhibit311302ceosc.htm |
| EX-10.40 - EXHIBIT 10.40 - SPIRIT REALTY CAPITAL, INC. | a2017q1exhibit1040spiritwe.htm |
UNITED STATES
SECURITIES AND EXCHANGE COMMISSION
Washington, D.C. 20549
Form 10-Q
x | QUARTERLY REPORT PURSUANT TO SECTION 13 OR 15(d) OF THE SECURITIES EXCHANGE ACT OF 1934 |
For the quarterly period ended March 31, 2017
OR
o | TRANSITION REPORT PURSUANT TO SECTION 13 OR 15(d) OF THE SECURITIES EXCHANGE ACT OF 1934 |
For the transition period from to
Commission file number 001-36004
_______________________________________________
SPIRIT REALTY CAPITAL, INC.
SPIRIT REALTY, L.P.
(Exact name of registrant as specified in its charter)
_______________________________________________
Spirit Realty Capital, Inc. | Maryland | 20-1676382 | ||
Spirit Realty, L.P. | Delaware | 20-1127940 | ||
(State or other jurisdiction of incorporation or organization) | (I.R.S. Employer Identification Number) | |||
2727 North Harwood Street, Suite 300, Dallas, Texas 75201 | (972) 476-1900 | |||
(Address of principal executive offices; zip code) | (Registrant’s telephone number, including area code) | |||
(Former name, former address and former fiscal year, if changed since last report)
__________________________________________________________________________
Indicate by check mark whether the registrant (1) has filed all reports required to be filed by Section 13 or 15(d) of the Securities Exchange Act of 1934 during the preceding 12 months (or for such shorter period that the registrant was required to file such reports), and (2) has been subject to such filing requirements for the past 90 days.
Spirit Realty Capital, Inc. Yes x No o | Spirit Realty, L.P. Yes o No x |
Indicate by check mark whether the registrant has submitted electronically and posted on its corporate Web site, if any, every Interactive Data File required to be submitted and posted pursuant to Rule 405 of Regulation S-T (§232.405 of this chapter) during the preceding 12 months (or for such shorter period that the registrant was required to submit and post such files).
Spirit Realty Capital, Inc. Yes x No o | Spirit Realty, L.P. Yes x No o |
Indicate by check mark whether the registrant is a large accelerated filer, an accelerated filer, a non-accelerated filer or a smaller reporting company. See the definitions of “large accelerated filer,” “accelerated filer”, “smaller reporting company” or an emerging growth company. See definitions of "large accelerated filer,", "smaller reporting company," and "emerging growth company" in Rule 12b-2 of the Exchange Act.
Spirit Realty Capital, Inc.
Large accelerated filer x | Accelerated filer o | Non-accelerated filer o |
Smaller reporting company o | Emerging growth company o |
Spirit Realty, L.P.
Large accelerated filer o | Accelerated filer o | Non-accelerated filer x |
Smaller reporting company o | Emerging growth company o |
If an emerging growth company, indicate by check mark if the registrant has elected not to use the extended transition period for complying with any new or revised financial accounting standards provided pursuant to Section 13(a) of the Exchange Act.
Spirit Realty Capital, Inc. o | Spirit Realty, L.P. o |
Indicate by check mark whether the registrant is a shell company (as defined in Rule 12b-2 of the Exchange Act).
Spirit Realty Capital, Inc. Yes o No x | Spirit Realty, L.P. Yes o No x |
As of May 2, 2017, there were 484,008,492 shares of common stock, par value $0.01, of Spirit Realty Capital, Inc. outstanding.
Explanatory Note
This report combines the quarterly reports on Form 10-Q for the three months ended March 31, 2017 of Spirit Realty Capital, Inc., a Maryland corporation, and Spirit Realty, L.P., a Delaware limited partnership. Unless otherwise indicated or unless the context requires otherwise, all references in this report to “we,” “us,” “our,” or the “Company” refer to Spirit Realty Capital, Inc. together with its consolidated subsidiaries, including Spirit Realty, L.P. Unless otherwise indicated or unless the context requires otherwise, all references to the “Operating Partnership” refer to Spirit Realty, L.P. together with its consolidated subsidiaries.
Spirit General OP Holdings, LLC ("OP Holdings") is the sole general partner of the Operating Partnership. The Company is a real estate investment trust, or REIT, and the sole member of OP Holdings, as well as the special limited partner of the Operating Partnership. As sole member of the general partner of our Operating Partnership, our Company has the full, exclusive and complete responsibility for our Operating Partnership’s day-to-day management and control.
We believe combining the quarterly reports on Form 10-Q of our Company and Operating Partnership into a single report results in the following benefits:
• | enhancing investors’ understanding of our Company and Operating Partnership by enabling investors to view the business as a whole, reflective of how management views and operates the business; |
• | eliminating duplicative disclosure and providing a streamlined presentation as a substantial portion of the disclosures apply to both our Company and Operating Partnership; and |
• | creating time and cost efficiencies by preparing one combined report in lieu of two separate reports. |
There are a few differences between our Company and Operating Partnership, which are reflected in the disclosures in this report. We believe it is important to understand these differences in the context of how we operate as an interrelated, consolidated company. Our Company is a REIT, the only material assets of which are the partnership interests in our Operating Partnership. As a result, our Company does not conduct business itself, other than acting as the sole member of the general partner of our Operating Partnership, issuing equity from time to time and guaranteeing certain debt of our Operating Partnership. Our Operating Partnership holds substantially all the assets of our Company. Our Company issued convertible notes and guarantees some of the debt of our Operating Partnership, see footnote 4 to the consolidated financial statements included herein for further discussion. Our Operating Partnership conducts the operations of the business and is structured as a partnership with no publicly traded equity. Except for net proceeds from the issuance of convertible notes and equity issuances by our Company, which are generally contributed to our Operating Partnership in exchange for partnership units of our Operating Partnership, our Operating Partnership generates the capital required by our Company’s business through our Operating Partnership’s operations or our Operating Partnership’s incurrence of indebtedness.
The presentation of stockholders’ equity and partners’ capital are the main areas of difference between the consolidated financial statements of our Company and those of our Operating Partnership. The partnership units in our Operating Partnership are accounted for as partners’ capital in our Operating Partnership’s consolidated financial statements. There are no non-controlling interests in the Company or the Operating Partnership.
To help investors understand the significant differences between our Company and our Operating Partnership, this report presents the consolidated financial statements separately for our Company and our Operating Partnership. All other sections of this report, including “Selected Financial Data,” “Management’s Discussion and Analysis of Financial Condition and Results of Operations” and “Quantitative and Qualitative Disclosures About Market Risk,” are presented together for our Company and our Operating Partnership.
In order to establish that the Chief Executive Officer and the Chief Financial Officer of each entity have made the requisite certifications and that our Company and Operating Partnership are compliant with Rule 13a-15 or Rule 15d-15 of the Securities Exchange Act of 1934, or the Exchange Act, and 18 U.S.C. §1350, this report also includes separate “Item 4. Controls and Procedures” sections and separate Exhibit 31 and 32 certifications for each of our Company and our Operating Partnership.
SPIRIT REALTY CAPITAL, INC.
INDEX
Glossary | |
Item 1. Financial Statements (Unaudited) | |
2
GLOSSARY
Definitions: | |
1031 Exchange | Tax-deferred like-kind exchange of properties held for business or investment purposes, pursuant to Section 1031 of the Code |
2015 Credit Facility | $800.0 million unsecured credit facility pursuant to the Credit Agreement |
2019 Notes | $402.5 million convertible notes of the Corporation due in 2019 |
2021 Notes | $345.0 million convertible notes of the Corporation due in 2021 |
AFFO | Adjusted Funds From Operations |
Amended Incentive Award Plan | Amended and Restated Spirit Realty Capital, Inc. and Spirit Realty, L.P. 2012 Incentive Award Plan |
AOCL | Accumulated Other Comprehensive Loss |
ASC | Accounting Standards Codification |
ASU | Accounting Standards Update |
ATM Program | At the Market equity distribution program, pursuant to which the Corporation may offer and sell registered shares of common stock from time to time |
CMBS | Commercial Mortgage Backed Securities |
Code | Internal Revenue Code of 1986, as amended |
Cole II | Cole Credit Property Trust II, Inc. |
Cole II Merger | Acquisition on July 17, 2013 of Cole II by the Company, in which the Company merged with and into the Cole II legal entity |
Collateral Pools | Pools of collateral assets that are pledged to the indenture trustee for the benefit of the noteholders and secure obligations of issuers under the Spirit Master Funding Program |
Company | The Corporation and its consolidated subsidiaries |
Convertible Notes | The 2019 Notes and 2021 Notes, together |
Corporation | Spirit Realty Capital, Inc., a Maryland corporation |
CPI | Consumer Price Index |
Credit Agreement | 2015 credit facility agreement between the Operating Partnership and certain lenders dated March 31, 2015, as amended or otherwise modified from time to time |
EBITDA | Earnings Before Interest, Taxes, Depreciation and Amortization |
Exchange Act | Securities Exchange Act of 1934, as amended |
FASB | Financial Accounting Standards Board |
FFO | Funds From Operations |
Fitch | Fitch Ratings, Inc. |
GAAP | Generally Accepted Accounting Principles in the United States |
LIBOR | London Interbank Offered Rate |
Master Trust 2013 | The net-lease mortgage securitization trust established in December 2013 under the Spirit Master Funding Program |
Master Trust 2014 | The net-lease mortgage securitization trust established in 2005 and amended and restated in 2014 under the Spirit Master Funding Program |
Master Trust Notes | Master Trust 2013 and Master Trust 2014 notes, together |
Master Trust Release | Proceeds from the sale of assets securing the Master Trust Notes held in restricted accounts until a qualifying substitution is made |
Moody's | Moody's Investor Services |
NAREIT | National Association of Real Estate Investment Trusts |
Normalized Rental Revenue | Total rental revenues and earned income from direct financing leases from our owned properties during the final month of the reporting period, adjusted to exclude amounts from properties sold during that period and to include a full month of rental revenues for properties acquired during that period. |
OP Holdings | Spirit General OP Holdings, LLC |
Operating Partnership | Spirit Realty, L.P., a Delaware limited partnership |
3
Definitions: | |
REIT | Real Estate Investment Trust |
S&P | Standard & Poor's Rating Services |
SEC | Securities and Exchange Commission |
Securities Act | Securities Act of 1933, as amended |
Senior Unsecured Notes | $300 million aggregate principal amount of senior notes issued in August 2016 |
Shopko | Specialty Retail Shops Holding Corp. and certain of its affiliates |
Spirit Master Funding Program | The Company's asset-backed securitization program that comprises Master Trust 2013 and Master Trust 2014 |
Term Loan | $420.0 million senior unsecured term facility pursuant to the Term Loan Agreement |
Term Loan Agreement | Term loan agreement between the Operating Partnership and certain lenders dated November 3, 2015, as amended or otherwise modified from time to time |
TSR | Total Shareholder Return |
U.S. | United States |
Unless otherwise indicated or unless the context requires otherwise, all references to "we," "us" or "our" refer to the Corporation and its consolidated subsidiaries, including the Operating Partnership.
4
PART I — FINANCIAL INFORMATION
Item 1. Financial Statements
SPIRIT REALTY CAPITAL, INC.
Consolidated Balance Sheets
(In Thousands, Except Share and Per Share Data)
(Unaudited)
March 31, 2017 | December 31, 2016 | ||||||
Assets | |||||||
Investments: | |||||||
Real estate investments: | |||||||
Land and improvements | $ | 2,665,959 | $ | 2,704,010 | |||
Buildings and improvements | 4,779,465 | 4,775,221 | |||||
Total real estate investments | 7,445,424 | 7,479,231 | |||||
Less: accumulated depreciation | (966,361 | ) | (940,005 | ) | |||
6,479,063 | 6,539,226 | ||||||
Loans receivable, net | 67,880 | 66,578 | |||||
Intangible lease assets, net | 459,799 | 470,276 | |||||
Real estate assets under direct financing leases, net | 27,386 | 36,005 | |||||
Real estate assets held for sale, net | 130,706 | 160,570 | |||||
Net investments | 7,164,834 | 7,272,655 | |||||
Cash and cash equivalents | 9,309 | 10,059 | |||||
Deferred costs and other assets, net | 160,313 | 140,917 | |||||
Goodwill | 254,340 | 254,340 | |||||
Total assets | $ | 7,588,796 | $ | 7,677,971 | |||
Liabilities and stockholders’ equity | |||||||
Liabilities: | |||||||
2015 Credit Facility | $ | 129,000 | $ | 86,000 | |||
Term Loan, net | 418,672 | 418,471 | |||||
Senior Unsecured Notes, net | 295,169 | 295,112 | |||||
Mortgages and notes payable, net | 2,109,117 | 2,162,403 | |||||
Convertible Notes, net | 705,899 | 702,642 | |||||
Total debt, net | 3,657,857 | 3,664,628 | |||||
Intangible lease liabilities, net | 175,261 | 182,320 | |||||
Accounts payable, accrued expenses and other liabilities | 146,836 | 148,915 | |||||
Total liabilities | 3,979,954 | 3,995,863 | |||||
Commitments and contingencies (see Note 7) | |||||||
Stockholders’ equity: | |||||||
Common stock, $0.01 par value, 750,000,000 shares authorized: 484,026,824 and 483,624,120 shares issued and outstanding at March 31, 2017 and December 31, 2016, respectively | 4,840 | 4,836 | |||||
Capital in excess of par value | 5,179,327 | 5,177,086 | |||||
Accumulated deficit | (1,575,325 | ) | (1,499,814 | ) | |||
Accumulated other comprehensive income | — | — | |||||
Total stockholders’ equity | 3,608,842 | 3,682,108 | |||||
Total liabilities and stockholders’ equity | $ | 7,588,796 | $ | 7,677,971 | |||
See accompanying notes.
5
SPIRIT REALTY CAPITAL, INC.
Consolidated Statements of Operations
(In Thousands, Except Share and Per Share Data)
(Unaudited)
Three Months Ended March 31, | |||||||
2017 | 2016 | ||||||
Revenues: | |||||||
Rentals | $ | 159,220 | $ | 161,819 | |||
Interest income on loans receivable | 892 | 1,659 | |||||
Earned income from direct financing leases | 612 | 724 | |||||
Tenant reimbursement income | 3,965 | 3,824 | |||||
Other income | 733 | 331 | |||||
Total revenues | 165,422 | 168,357 | |||||
Expenses: | |||||||
General and administrative | 13,418 | 11,649 | |||||
Restructuring charges | — | 649 | |||||
Property costs | 9,051 | 7,327 | |||||
Real estate acquisition costs | 153 | 57 | |||||
Interest | 46,623 | 53,017 | |||||
Depreciation and amortization | 64,994 | 64,664 | |||||
Impairments | 34,376 | 12,618 | |||||
Total expenses | 168,615 | 149,981 | |||||
(Loss) income before other expense and income tax expense | (3,193 | ) | 18,376 | ||||
Other expense: | |||||||
Loss on debt extinguishment | (30 | ) | (5,341 | ) | |||
Total other expense | (30 | ) | (5,341 | ) | |||
(Loss) income before income tax expense | (3,223 | ) | 13,035 | ||||
Income tax expense | (165 | ) | (81 | ) | |||
(Loss) income before gain on disposition of assets | (3,388 | ) | 12,954 | ||||
Gain on disposition of assets | 16,217 | 10,146 | |||||
Net income attributable to common stockholders | $ | 12,829 | $ | 23,100 | |||
Net income per share attributable to common stockholders—basic | $ | 0.03 | $ | 0.05 | |||
Net income per share attributable to common stockholders—diluted | $ | 0.03 | $ | 0.05 | |||
Weighted average shares of common stock outstanding: | |||||||
Basic | 482,607,198 | 441,365,927 | |||||
Diluted | 482,609,096 | 441,368,407 | |||||
Dividends declared per common share issued | $ | 0.18000 | $ | 0.17500 | |||
See accompanying notes.
6
SPIRIT REALTY CAPITAL, INC.
Consolidated Statements of Comprehensive Income
(In Thousands)
(Unaudited)
Three Months Ended March 31, | |||||||
2017 | 2016 | ||||||
Net income attributable to common stockholders | $ | 12,829 | $ | 23,100 | |||
Other comprehensive income: | |||||||
Change in net unrealized losses on cash flow hedges | — | (856 | ) | ||||
Net cash flow hedge losses reclassified to operations | — | 235 | |||||
Total comprehensive income | $ | 12,829 | $ | 22,479 | |||
See accompanying notes.
7
SPIRIT REALTY CAPITAL, INC.
Consolidated Statement of Stockholders’ Equity
(In Thousands, Except Share Data)
(Unaudited)
Common Stock | ||||||||||||||||||
Shares | Par Value | Capital in Excess of Par Value | Accumulated Deficit | Total Stockholders’ Equity | ||||||||||||||
Balances, December 31, 2016 | 483,624,120 | $ | 4,836 | $ | 5,177,086 | $ | (1,499,814 | ) | $ | 3,682,108 | ||||||||
Net income | — | — | — | 12,829 | 12,829 | |||||||||||||
Dividends declared on common stock | — | — | — | (87,122 | ) | (87,122 | ) | |||||||||||
Tax withholdings related to net stock settlements | (74,882 | ) | (1 | ) | — | (804 | ) | (805 | ) | |||||||||
Stock-based compensation, net | 477,586 | 5 | 2,241 | (414 | ) | 1,832 | ||||||||||||
Balances, March 31, 2017 | 484,026,824 | $ | 4,840 | $ | 5,179,327 | $ | (1,575,325 | ) | $ | 3,608,842 | ||||||||
See accompanying notes.
8
SPIRIT REALTY CAPITAL, INC.
Consolidated Statements of Cash Flows
(In Thousands)
(Unaudited)
Three Months Ended March 31, | |||||||
2017 | 2016 | ||||||
Operating activities | |||||||
Net income attributable to common stockholders | $ | 12,829 | $ | 23,100 | |||
Adjustments to reconcile net income to net cash provided by operating activities: | |||||||
Depreciation and amortization | 64,994 | 64,664 | |||||
Impairments | 34,376 | 12,618 | |||||
Amortization of deferred financing costs | 2,401 | 2,166 | |||||
Derivative net settlements, amortization and terminations | — | 30 | |||||
Amortization of debt discounts | 3,061 | 760 | |||||
Stock-based compensation expense | 2,246 | 2,305 | |||||
Loss on debt extinguishment | 30 | 5,341 | |||||
Debt extinguishment costs | (544 | ) | (540 | ) | |||
Gains on dispositions of real estate and other assets, net | (16,217 | ) | (10,146 | ) | |||
Non-cash revenue | (6,390 | ) | (6,587 | ) | |||
Other | 1,337 | (14 | ) | ||||
Changes in operating assets and liabilities: | |||||||
Deferred costs and other assets, net | 534 | 95 | |||||
Accounts payable, accrued expenses and other liabilities | (2,398 | ) | (3,085 | ) | |||
Accrued restructuring charges | — | (1,072 | ) | ||||
Net cash provided by operating activities | 96,259 | 89,635 | |||||
Investing activities | |||||||
Acquisitions of real estate | (135,616 | ) | (72,458 | ) | |||
Capitalized real estate expenditures | (13,312 | ) | (3,552 | ) | |||
Investments in loans receivable | (3,000 | ) | — | ||||
Collections of principal on loans receivable and real estate assets under direct financing leases | 1,151 | 2,151 | |||||
Proceeds from dispositions of real estate and other assets | 134,712 | 89,349 | |||||
Transfers of net sales proceeds from restricted accounts pursuant to 1031 Exchanges | — | 39,867 | |||||
Transfers of net sales proceeds to Master Trust Release | (15,984 | ) | (30,578 | ) | |||
Net cash (used in) provided by investing activities | (32,049 | ) | 24,779 | ||||
9
Three Months Ended March 31, | |||||||
2017 | 2016 | ||||||
Financing activities | |||||||
Borrowings under 2015 Credit Facility | 230,200 | 60,000 | |||||
Repayments under 2015 Credit Facility | (187,200 | ) | (36,000 | ) | |||
Repayments under mortgages and notes payable | (19,335 | ) | (96,732 | ) | |||
Borrowings under Term Loan | — | 45,000 | |||||
Repayments under Term Loan | — | (36,000 | ) | ||||
Deferred financing costs | (51 | ) | (125 | ) | |||
Proceeds from issuance of common stock, net of offering costs | — | 13,923 | |||||
Repurchase of shares of common stock | (804 | ) | (738 | ) | |||
Distributions paid | (87,218 | ) | (77,381 | ) | |||
Transfers (from) to reserve/escrow deposits with lenders | (552 | ) | 841 | ||||
Net cash used in financing activities | (64,960 | ) | (127,212 | ) | |||
Net decrease in cash and cash equivalents | (750 | ) | (12,798 | ) | |||
Cash and cash equivalents, beginning of period | 10,059 | 21,790 | |||||
Cash and cash equivalents, end of period | $ | 9,309 | $ | 8,992 | |||
See accompanying notes.
10
SPIRIT REALTY, L.P.
Consolidated Balance Sheets
(In Thousands, Except Share and Per Share Data)
(Unaudited)
March 31, 2017 | December 31, 2016 | ||||||
Assets | |||||||
Investments: | |||||||
Real estate investments: | |||||||
Land and improvements | $ | 2,665,959 | $ | 2,704,010 | |||
Buildings and improvements | 4,779,465 | 4,775,221 | |||||
Total real estate investments | 7,445,424 | 7,479,231 | |||||
Less: accumulated depreciation | (966,361 | ) | (940,005 | ) | |||
6,479,063 | 6,539,226 | ||||||
Loans receivable, net | 67,880 | 66,578 | |||||
Intangible lease assets, net | 459,799 | 470,276 | |||||
Real estate assets under direct financing leases, net | 27,386 | 36,005 | |||||
Real estate assets held for sale, net | 130,706 | 160,570 | |||||
Net investments | 7,164,834 | 7,272,655 | |||||
Cash and cash equivalents | 9,309 | 10,059 | |||||
Deferred costs and other assets, net | 160,313 | 140,917 | |||||
Goodwill | 254,340 | 254,340 | |||||
Total assets | $ | 7,588,796 | $ | 7,677,971 | |||
Liabilities and partners' capital | |||||||
Liabilities: | |||||||
2015 Credit Facility | $ | 129,000 | $ | 86,000 | |||
Term Loan, net | 418,672 | 418,471 | |||||
Senior Unsecured Notes, net | 295,169 | 295,112 | |||||
Mortgages and notes payable, net | 2,109,117 | 2,162,403 | |||||
Notes payable to Spirit Realty Capital, Inc., net | 705,899 | 702,642 | |||||
Total debt, net | 3,657,857 | 3,664,628 | |||||
Intangible lease liabilities, net | 175,261 | 182,320 | |||||
Accounts payable, accrued expenses and other liabilities | 146,836 | 148,915 | |||||
Total liabilities | 3,979,954 | 3,995,863 | |||||
Commitments and contingencies (see Note 7) | |||||||
Partners' capital: | |||||||
Partnership units | |||||||
General partner's capital: 3,988,218 units issued and outstanding as of both March 31, 2017 and December 31, 2016 | 25,957 | 26,586 | |||||
Limited partners' capital: 480,038,606 and 479,635,902 units issued and outstanding as of March 31, 2017 and December 31, 2016, respectively | 3,582,885 | 3,655,522 | |||||
Total partners' capital | 3,608,842 | 3,682,108 | |||||
Total liabilities and partners' capital | 7,588,796 | 7,677,971 | |||||
See accompanying notes.
11
SPIRIT REALTY, L.P.
Consolidated Statements of Operations
(In Thousands, Except Unit and Per Unit Data)
(Unaudited)
Three Months Ended March 31, | |||||||
2017 | 2016 | ||||||
Revenues: | |||||||
Rentals | $ | 159,220 | $ | 161,819 | |||
Interest income on loans receivable | 892 | 1,659 | |||||
Earned income from direct financing leases | 612 | 724 | |||||
Tenant reimbursement income | 3,965 | 3,824 | |||||
Other income | 733 | 331 | |||||
Total revenues | 165,422 | 168,357 | |||||
Expenses: | |||||||
General and administrative | 13,418 | 11,649 | |||||
Restructuring charges | — | 649 | |||||
Property costs | 9,051 | 7,327 | |||||
Real estate acquisition costs | 153 | 57 | |||||
Interest | 46,623 | 53,017 | |||||
Depreciation and amortization | 64,994 | 64,664 | |||||
Impairments | 34,376 | 12,618 | |||||
Total expenses | 168,615 | 149,981 | |||||
(Loss) income before other expense and income tax expense | (3,193 | ) | 18,376 | ||||
Other expense: | |||||||
Loss on debt extinguishment | (30 | ) | (5,341 | ) | |||
Total other expense | (30 | ) | (5,341 | ) | |||
(Loss) income before income tax expense | (3,223 | ) | 13,035 | ||||
Income tax expense | (165 | ) | (81 | ) | |||
(Loss) income before gain on disposition of assets | (3,388 | ) | 12,954 | ||||
Gain on disposition of assets | 16,217 | 10,146 | |||||
Net income | $ | 12,829 | $ | 23,100 | |||
Net income attributable to the general partner | $ | 109 | $ | 196 | |||
Net income attributable to the limited partners | $ | 12,720 | $ | 22,904 | |||
Net income per partnership unit - basic | $ | 0.03 | $ | 0.05 | |||
Net income per partnership unit - diluted | $ | 0.03 | $ | 0.05 | |||
Weighted average partnership units outstanding: | |||||||
Basic | 482,607,198 | 441,365,927 | |||||
Diluted | 482,609,096 | 441,368,407 | |||||
Distributions declared per partnership unit issued | $ | 0.1800 | $ | 0.1750 | |||
See accompanying notes.
12
SPIRIT REALTY, L.P.
Consolidated Statements of Comprehensive Income
(In Thousands)
(Unaudited)
Three Months Ended March 31, | |||||||
2017 | 2016 | ||||||
Net income | $ | 12,829 | $ | 23,100 | |||
Other comprehensive income: | |||||||
Change in net unrealized losses on cash flow hedges | — | (856 | ) | ||||
Net cash flow hedge losses reclassified to operations | — | 235 | |||||
Total comprehensive income | $ | 12,829 | $ | 22,479 | |||
See accompanying notes.
13
SPIRIT REALTY, L.P.
Consolidated Statements of Partners' Capital
(In Thousands, Except Unit Data)
(Unaudited)
General Partner's Capital (1) | Limited Partners' Capital (2) | Total Partnership Capital | ||||||||||||||||
Units | Amount | Units | Amount | |||||||||||||||
Balances, December 31, 2016 | 3,988,218 | $ | 26,586 | 479,635,902 | $ | 3,655,522 | $ | 3,682,108 | ||||||||||
Net income | — | 109 | — | 12,720 | 12,829 | |||||||||||||
Partnership distributions declared | — | (738 | ) | — | (86,384 | ) | (87,122 | ) | ||||||||||
Tax withholdings related to net partnership unit settlements | — | — | (74,882 | ) | (805 | ) | (805 | ) | ||||||||||
Stock-based compensation | — | — | 477,586 | 1,832 | 1,832 | |||||||||||||
Balances, March 31, 2017 | 3,988,218 | $ | 25,957 | 480,038,606 | $ | 3,582,885 | $ | 3,608,842 | ||||||||||
(1) Consists of general partnership interests held by OP Holdings.
(2) Consists of limited partnership interests held by the Corporation and Spirit Notes Partner, LLC.
See accompanying notes.
14
SPIRIT REALTY, L.P.
Consolidated Statements of Cash Flows
(In Thousands)
(Unaudited)
Three Months Ended March 31, | |||||||
2017 | 2016 | ||||||
Operating activities | |||||||
Net income attributable to partners | $ | 12,829 | $ | 23,100 | |||
Adjustments to reconcile net income to net cash provided by operating activities: | |||||||
Depreciation and amortization | 64,994 | 64,664 | |||||
Impairments | 34,376 | 12,618 | |||||
Amortization of deferred financing costs | 2,401 | 2,166 | |||||
Derivative net settlements, amortization and terminations | — | 30 | |||||
Amortization of debt discounts | 3,061 | 760 | |||||
Stock-based compensation expense | 2,246 | 2,305 | |||||
Loss on debt extinguishment | 30 | 5,341 | |||||
Debt extinguishment costs | (544 | ) | (540 | ) | |||
Gains on dispositions of real estate and other assets, net | (16,217 | ) | (10,146 | ) | |||
Non-cash revenue | (6,390 | ) | (6,587 | ) | |||
Other | 1,337 | (14 | ) | ||||
Changes in operating assets and liabilities: | |||||||
Deferred costs and other assets, net | 534 | 95 | |||||
Accounts payable, accrued expenses and other liabilities | (2,398 | ) | (3,085 | ) | |||
Accrued restructuring charges | — | (1,072 | ) | ||||
Net cash provided by operating activities | 96,259 | 89,635 | |||||
Investing activities | |||||||
Acquisitions of real estate | (135,616 | ) | (72,458 | ) | |||
Capitalized real estate expenditures | (13,312 | ) | (3,552 | ) | |||
Investments in loans receivable | (3,000 | ) | — | ||||
Collections of principal on loans receivable and real estate assets under direct financing leases | 1,151 | 2,151 | |||||
Proceeds from dispositions of real estate and other assets | 134,712 | 89,349 | |||||
Transfers of net sales proceeds from restricted accounts pursuant to 1031 Exchanges | — | 39,867 | |||||
Transfers of net sales proceeds to Master Trust Release | (15,984 | ) | (30,578 | ) | |||
Net cash (used in) provided by investing activities | (32,049 | ) | 24,779 | ||||
15
Three Months Ended March 31, | |||||||
2017 | 2016 | ||||||
Financing activities | |||||||
Borrowings under 2015 Credit Facility | 230,200 | 60,000 | |||||
Repayments under 2015 Credit Facility | (187,200 | ) | (36,000 | ) | |||
Repayments under mortgages and notes payable | (19,335 | ) | (96,732 | ) | |||
Borrowings under Term Loan | — | 45,000 | |||||
Repayments under Term Loan | — | (36,000 | ) | ||||
Deferred financing costs | (51 | ) | (125 | ) | |||
Proceeds from issuance of common stock, net of offering costs | — | 13,923 | |||||
Repurchase of partnership units | (804 | ) | (738 | ) | |||
Distributions paid | (87,218 | ) | (77,381 | ) | |||
Transfers (from) to reserve/escrow deposits with lenders | (552 | ) | 841 | ||||
Net cash used in financing activities | (64,960 | ) | (127,212 | ) | |||
Net decrease in cash and cash equivalents | (750 | ) | (12,798 | ) | |||
Cash and cash equivalents, beginning of period | 10,059 | 21,790 | |||||
Cash and cash equivalents, end of period | $ | 9,309 | $ | 8,992 | |||
See accompanying notes.
16
SPIRIT REALTY CAPITAL, INC. and SPIRIT REALTY, L.P.
Notes to Consolidated Financial Statements
March 31, 2017
(Unaudited)
Note 1. Organization
Company Organization and Operations
Spirit Realty Capital, Inc. (the "Corporation" or, with its consolidated subsidiaries, the "Company") operates as a self-administered and self-managed REIT that seeks to generate and deliver sustainable and attractive returns for stockholders by investing primarily in and managing a portfolio of single-tenant, operationally essential real estate throughout the U.S. that is generally leased on a long-term, triple-net basis to tenants operating within predominantly retail, but also office and industrial property types. Single tenant, operationally essential real estate generally refers to free-standing, commercial real estate facilities where tenants conduct activities that are essential to the generation of their sales and profits.The Company began operations through a predecessor legal entity in 2003.
The Company’s operations are generally carried out through Spirit Realty, L.P. (the "Operating Partnership") and its subsidiaries. Spirit General OP Holdings, LLC ("OP Holdings"), one of the Corporation's wholly-owned subsidiaries, is the sole general partner and owns approximately 1.0% of the Operating Partnership. The Corporation and a wholly-owned subsidiary are the only limited partners and together own the remaining 99.0% of the Operating Partnership.
Note 2. Summary of Significant Accounting Policies
Basis of Accounting and Principles of Consolidation
The accompanying consolidated financial statements of the Company and the Operating Partnership have been prepared pursuant to the rules and regulations of the SEC. In the opinion of management, the consolidated financial statements include the normal, recurring adjustments necessary for a fair statement of the information required to be set forth therein. The results for interim periods are not necessarily indicative of the results for the entire year. Certain information and note disclosures, normally included in financial statements prepared in accordance with GAAP, have been condensed or omitted from these statements pursuant to SEC rules and regulations and, accordingly, these financial statements should be read in conjunction with the Company’s audited consolidated financial statements as filed with the SEC in its Annual Report on Form 10-K for the year ended December 31, 2016.
The consolidated financial statements include the accounts of the Corporation and its wholly owned subsidiaries. The consolidated financial statements of the Operating Partnership include the accounts of the Operating Partnership and its wholly-owned subsidiaries. All significant intercompany balances and transactions have been eliminated in consolidation.
All expenses incurred by the Company have been allocated to the Operating Partnership in accordance with the Operating Partnership's first amended and restated agreement of limited partnership, which management determined to be a reasonable method of allocation. Therefore, expenses incurred would not be materially different if the Operating Partnership had operated as an unaffiliated entity.
The Company has formed numerous special purpose entities to acquire and hold real estate encumbered by indebtedness (see Note 4). Each special purpose entity is a separate legal entity and is the sole owner of its assets and responsible for its liabilities. The assets of these special purpose entities are not available to pay, or otherwise satisfy obligations to, the creditors of any affiliate or owner of another entity unless the special purpose entities have expressly agreed and are permitted under their governing documents. At March 31, 2017 and December 31, 2016, net assets totaling $2.87 billion and $2.95 billion, respectively, were held, and net liabilities totaling $2.20 billion and $2.26 billion, respectively, were owed by these special purpose entities and are included in the accompanying consolidated balance sheets.
Use of Estimates
The preparation of financial statements in conformity with GAAP requires management to make estimates and assumptions that affect the reported amounts of assets and liabilities at the date of the financial statements and the reported amounts of revenues and expenses during the reporting period. Although management believes its estimates are reasonable, actual results could differ from those estimates.
17
SPIRIT REALTY CAPITAL, INC. and SPIRIT REALTY, L.P.
Notes to Consolidated Financial Statements - (continued)
March 31, 2017
(Unaudited)
Segment Reporting
The Company views its operations as one segment, which consists of net leasing operations. The Company has no other reportable segments.
Allowance for Doubtful Accounts
The Company reviews its rent and other tenant receivables for collectability on a regular basis, taking into consideration changes in factors such as the tenant’s payment history, the financial condition of the tenant, business conditions in the industry in which the tenant operates, and economic conditions in the area in which the tenant operates. In the event that the collectability of a receivable with respect to any tenant is in doubt, a provision for uncollectible amounts will be established or a direct write-off of the specific receivable will be made. The Company provided for reserves for uncollectible amounts totaling $11.3 million and $6.4 million at March 31, 2017 and December 31, 2016, respectively, against accounts receivable balances of $28.4 million and $25.3 million, respectively. Receivables are recorded within deferred costs and other assets, net in the accompanying consolidated balance sheets. Receivables are written off against the reserves for uncollectible amounts when all possible means of collection have been exhausted.
For deferred rental revenues related to the straight-line method of reporting rental revenue, the collectability review includes management’s estimates of amounts that will not be realized and an assessment of the risks inherent in the portfolio, giving consideration to historical experience and industry default rates for long-term receivables. The Company established a reserve for losses of $4.9 million at March 31, 2017 and $7.7 million at December 31, 2016, against deferred rental revenue receivables of $73.8 million and $71.1 million, respectively. Deferred rental revenue receivables are recorded within deferred costs and other assets, net in the accompanying consolidated balance sheets.
Restricted Cash and Escrow Deposits
Restricted cash and deposits in escrow, classified within deferred costs and other assets, net in the accompanying consolidated balance sheets consisted of the following (in thousands):
March 31, 2017 | December 31, 2016 | ||||||
Collateral deposits (1) | $ | 1,451 | $ | 1,374 | |||
Tenant improvements, repairs, and leasing commissions (2) | 10,277 | 9,739 | |||||
Master Trust Release (3) | 30,395 | 14,412 | |||||
Loan impounds (4) | 653 | 670 | |||||
Other (5) | 598 | 644 | |||||
$ | 43,374 | $ | 26,839 | ||||
(1) Funds held in reserve by lenders which can be applied at their discretion to the repayment of debt (any funds remaining on deposit after the debt is paid in full are released to the borrower).
(2) Deposits held as additional collateral support by lenders to fund tenant improvements, repairs and leasing commissions incurred to secure a new tenant.
(3) Proceeds from the sale of assets pledged as collateral under the Spirit Master Funding Program, which are held on deposit until a qualifying substitution is made or the funds are applied as prepayment of principal.
(4) Funds held in lender controlled accounts generally used to meet future debt service or certain property operating expenses.
(5) Funds held in lender controlled accounts released after scheduled debt service requirements are met.
Goodwill
Goodwill arises from business combinations and represents the excess of the cost of an acquired entity over the net fair value amounts that were assigned to the identifiable assets acquired and the liabilities assumed. Goodwill is tested for impairment at the reporting unit level on an annual basis and between annual tests if an event occurs or circumstances change that would more likely than not reduce the fair value of the reporting unit below its carrying value.
18
SPIRIT REALTY CAPITAL, INC. and SPIRIT REALTY, L.P.
Notes to Consolidated Financial Statements - (continued)
March 31, 2017
(Unaudited)
Income Taxes
The Company has elected to be taxed as a REIT under the Code. As a REIT, the Company generally will not be subject to federal income tax provided it continues to satisfy certain tests concerning the Company’s sources of income, the nature of its assets, the amounts distributed to its stockholders and the ownership of Company stock. Management believes the Company has qualified and will continue to qualify as a REIT and therefore, no provision has been made for federal income taxes in the accompanying consolidated financial statements. Even if the Company qualifies for taxation as a REIT, it may be subject to state and local income and franchise taxes and to federal income tax and excise tax on its undistributed income.
Franchise taxes are included in general and administrative expenses on the accompanying consolidated statements of operations. Taxable income from non-REIT activities managed through the Company’s taxable REIT subsidiaries are subject to federal, state and local taxes, which are not material.
New Accounting Pronouncements
From time to time, new accounting pronouncements are issued by the FASB or the SEC that are adopted by the Company as of the specified effective date. These new accounting pronouncements entail technical corrections to existing guidance or affect guidance related to specialized industries or entities and therefore will have minimal, if any, impact on the Company's financial position or results of operations upon adoption.
Changes in Accounting Principle
In March 2016, the FASB issued ASU 2016-09, Improvements to Employee Share-Based Payment Accounting, which simplifies many aspects of accounting for share-based payment transactions under ASC Topic 718, Compensation - Stock Compensation, including income tax consequences, classification of awards as either equity or liability, forfeiture rate calculations and classification on the statement of cash flows. The Company adopted this new guidance effective January 1, 2017 and made an accounting policy election to recognize stock-based compensation forfeitures as they occur, whereas previously stock-based compensation forfeitures were estimated and recognized based on historical forfeiture rates. This change in accounting principle has been applied prospectively and the change in accounting principle had no material impact on the financial statements of the Company.
In January 2017, the FASB issued ASU 2017-01, Business Combinations (Topic 805): Clarifying the Definition of a Business, which narrows the definition of a business. The Company early adopted the guidance effective January 1, 2017 and application is on a prospective basis. Under the new guidance, the acquisition of a property with an in-place lease generally will no longer be accounted for as an acquisition of a business, but instead as an asset acquisition, meaning the transaction costs of such an acquisition will now be capitalized instead of expensed. Further, dispositions of properties generally no longer qualify as a disposition of a business and therefore will not generate allocated goodwill when determining gain or loss on sale.
Note 3. Investments
Real Estate Investments
As of March 31, 2017, the Company's gross investment in real estate properties and loans totaled approximately $8.2 billion, representing investments in 2,588 properties, including 74 properties or other related assets securing mortgage loans. The gross investment is comprised of land, buildings, lease intangible assets and lease intangible liabilities, as adjusted for any impairment, and the carrying amount of loans receivable, real estate assets held under direct financing leases and real estate assets held for sale. The portfolio is geographically dispersed throughout 49 states with only one state, Texas, with a real estate investment of 12.6%, accounting for more than 10% of the total dollar amount of the Company’s real estate investment portfolio.
19
SPIRIT REALTY CAPITAL, INC. and SPIRIT REALTY, L.P.
Notes to Consolidated Financial Statements - (continued)
March 31, 2017
(Unaudited)
During the three months ended March 31, 2017, the Company had the following real estate and loan activity, net of accumulated depreciation and amortization:
Number of Properties | Dollar Amount of Investments | |||||||||||||||||||
Owned | Financed | Total | Owned | Financed | Total | |||||||||||||||
(In Thousands) | ||||||||||||||||||||
Gross balance, December 31, 2016 | 2,541 | 74 | 2,615 | $ | 8,181,076 | $ | 66,578 | $ | 8,247,654 | |||||||||||
Acquisitions/improvements (1) | 30 | — | 30 | 148,644 | 3,000 | 151,644 | ||||||||||||||
Dispositions of real estate (2) | (57 | ) | — | (57 | ) | (172,585 | ) | — | (172,585 | ) | ||||||||||
Principal payments and payoffs | — | — | — | — | (1,151 | ) | (1,151 | ) | ||||||||||||
Impairments | — | — | — | (34,376 | ) | — | (34,376 | ) | ||||||||||||
Write-off of gross lease intangibles | — | — | — | (14,467 | ) | — | (14,467 | ) | ||||||||||||
Loan premium amortization and other | — | — | — | (5 | ) | (547 | ) | (552 | ) | |||||||||||
Gross balance, March 31, 2017 | 2,514 | 74 | 2,588 | 8,108,287 | 67,880 | 8,176,167 | ||||||||||||||
Accumulated depreciation and amortization | (1,186,594 | ) | — | (1,186,594 | ) | |||||||||||||||
Net balance, March 31, 2017 | $ | 6,921,693 | $ | 67,880 | $ | 6,989,573 | ||||||||||||||
(1) Includes investments of $12.6 million in revenue producing capitalized expenditures, as well as $0.7 million of non-revenue producing capitalized expenditures as of March 31, 2017.
(2) The total accumulated depreciation and amortization associated with dispositions of real estate was $20.6 million as of March 31, 2017.
Scheduled minimum future contractual rent to be received under the remaining non-cancelable term of the operating leases (including realized rent increases occurring after April 1, 2017) at March 31, 2017 (in thousands):
March 31, 2017 | |||
Remainder of 2017 | $ | 460,417 | |
2018 | 603,955 | ||
2019 | 587,767 | ||
2020 | 569,364 | ||
2021 | 540,081 | ||
Thereafter | 4,127,461 | ||
Total future minimum rentals | $ | 6,889,045 | |
Because lease renewal periods are exercisable at the option of the lessee, the preceding table presents future minimum lease payments due during the initial lease term only. In addition, the future minimum rentals do not include any contingent rentals based on a percentage of the lessees' gross sales or lease escalations based on future changes in the CPI or other stipulated reference rate.
20
SPIRIT REALTY CAPITAL, INC. and SPIRIT REALTY, L.P.
Notes to Consolidated Financial Statements - (continued)
March 31, 2017
(Unaudited)
Loans Receivable
The following table details loans receivable, net of premium and allowance for loan losses (in thousands):
March 31, 2017 | December 31, 2016 | ||||||
Mortgage loans - principal | $ | 54,332 | $ | 55,410 | |||
Mortgage loans - premium, net of amortization | 6,647 | 7,194 | |||||
Mortgages loans, net | 60,979 | 62,604 | |||||
Other note receivables - principal | 7,401 | 4,474 | |||||
Allowance for loan losses | (500 | ) | (500 | ) | |||
Other note receivables | 6,901 | 3,974 | |||||
Total loans receivable, net | $ | 67,880 | $ | 66,578 | |||
The mortgage loans are secured by single-tenant commercial properties and generally have fixed interest rates over the term of the loans. There are four other notes receivable, of which two notes totaling $6.7 million are secured by tenant assets and stock and the remaining two notes are unsecured.
Lease Intangibles, Net
The following table details lease intangible assets and liabilities, net of accumulated amortization (in thousands):
March 31, 2017 | December 31, 2016 | ||||||
In-place leases | $ | 621,372 | $ | 624,723 | |||
Above-market leases | 87,255 | 88,873 | |||||
Less: accumulated amortization | (248,828 | ) | (243,320 | ) | |||
Intangible lease assets, net | $ | 459,799 | $ | 470,276 | |||
Below-market leases | $ | 230,396 | $ | 236,008 | |||
Less: accumulated amortization | (55,135 | ) | (53,688 | ) | |||
Intangible lease liabilities, net | $ | 175,261 | $ | 182,320 | |||
The amounts amortized as a net increase to rental revenue for capitalized above- and below-market leases were $1.8 million and $1.5 million for the three months ended March 31, 2017 and 2016, respectively. The value of in-place leases amortized and included in depreciation and amortization expense was $11.2 million and $11.9 million for the three months ended March 31, 2017 and 2016, respectively.
Real Estate Assets Under Direct Financing Leases
The components of real estate investments held under direct financing leases were as follows (in thousands):
March 31, 2017 | December 31, 2016 | ||||||
Minimum lease payments receivable | $ | 8,837 | $ | 9,456 | |||
Estimated residual value of leased assets | 27,027 | 35,640 | |||||
Unearned income | (8,478 | ) | (9,091 | ) | |||
Real estate assets under direct financing leases, net | $ | 27,386 | $ | 36,005 | |||
21
SPIRIT REALTY CAPITAL, INC. and SPIRIT REALTY, L.P.
Notes to Consolidated Financial Statements - (continued)
March 31, 2017
(Unaudited)
Real Estate Assets Held for Sale
The following table shows the activity in real estate assets held for sale for the three months ended March 31, 2017 (dollars in thousands):
Number of Properties | Carrying Value | |||||
Balance, December 31, 2016 | 44 | $ | 160,570 | |||
Transfers from real estate investments held and used | 27 | 59,015 | ||||
Sales | (12 | ) | (34,619 | ) | ||
Transfers to real estate investments held and used | (6 | ) | (42,644 | ) | ||
Impairments | (11,616 | ) | ||||
Balance, March 31, 2017 | 53 | $ | 130,706 | |||
Impairments
The following table summarizes total impairment losses recognized on the accompanying consolidated statements of operations (in thousands):
Three Months Ended March 31, | |||||||
2017 | 2016 | ||||||
Real estate and intangible asset impairment | $ | 35,220 | $ | 12,630 | |||
Write-off of lease intangibles, net | (844 | ) | 309 | ||||
Loans receivable recovery | — | (324 | ) | ||||
Total impairments from real estate investment net assets | 34,376 | 12,615 | |||||
Other impairment | — | 3 | |||||
Total impairment loss | $ | 34,376 | $ | 12,618 | |||
22
SPIRIT REALTY CAPITAL, INC. and SPIRIT REALTY, L.P.
Notes to Consolidated Financial Statements - (continued)
March 31, 2017
(Unaudited)
Note 4. Debt
The debt of the Company and the Operating Partnership are the same, except for the presentation of the Convertible Notes. The Convertible Notes were issued by the Company. Subsequently, an intercompany note between the Company and the Operating Partnership was executed with terms identical to those of the Convertible Notes. Therefore, in the consolidated balance sheet of the Operating Partnership, the amounts related to the Convertible Notes are reflected as notes payable to Spirit Realty Capital, Inc., net. The Company's debt is summarized below:
Weighted Average Effective Interest Rates (1) | Weighted Average Stated Rates (2) | Weighted Average Maturity (3) | March 31, 2017 | December 31, 2016 | |||||||||||
(in Years) | (In Thousands) | ||||||||||||||
2015 Credit Facility | 4.38 | % | 2.14 | % | 2.0 | $ | 129,000 | $ | 86,000 | ||||||
Term Loan | 2.38 | % | 2.33 | % | 1.6 | 420,000 | 420,000 | ||||||||
Senior Unsecured Notes | 4.69 | % | 4.45 | % | 9.5 | 300,000 | 300,000 | ||||||||
Master Trust Notes | 5.58 | % | 5.03 | % | 6.0 | 1,667,679 | 1,672,706 | ||||||||
CMBS fixed-rate | 5.47 | % | 5.60 | % | 3.9 | 478,687 | 528,427 | ||||||||
Convertible Notes | 5.33 | % | 3.28 | % | 3.0 | 747,500 | 747,500 | ||||||||
Total debt | 5.04 | % | 4.31 | % | 4.8 | 3,742,866 | 3,754,633 | ||||||||
Debt discount, net | (49,923 | ) | (52,894 | ) | |||||||||||
Deferred financing costs, net (4) | (35,086 | ) | (37,111 | ) | |||||||||||
Total debt, net | $ | 3,657,857 | $ | 3,664,628 | |||||||||||
(1) The effective interest rates include amortization of debt discount/premium, amortization of deferred financing costs and credit facility fees, where applicable, calculated for the three months ended March 31, 2017 and based on the average principal balance outstanding during the period.
(2) Represents the weighted average stated interest rate based on the outstanding principal balance as of March 31, 2017.
(3) Represents the weighted average maturity based on the outstanding principal balance as of March 31, 2017.
(4) The Company records deferred financing costs for its 2015 Credit Facility in deferred costs and other assets, net on its consolidated balance sheets.
2015 Credit Facility
On March 31, 2015, the Operating Partnership entered into the Credit Agreement that established a new $600.0 million unsecured credit facility. The 2015 Credit Facility matures on March 31, 2019 (extendable at the Operating Partnership's option to March 31, 2020, subject to satisfaction of certain requirements) and includes an accordion feature to increase the committed facility size up to $1.0 billion, subject to satisfying certain requirements and obtaining additional lender commitments. On April 27, 2016, the Company expanded the borrowing capacity under the 2015 Credit Facility from $600.0 million to $800.0 million by partially exercising the accordion feature under the terms of the Credit Agreement. The 2015 Credit Facility also includes a $50.0 million sub-limit for swing-line loans and up to $60.0 million available for issuances of letters of credit. Swing-line loans and letters of credit reduce availability under the 2015 Credit Facility on a dollar-for-dollar basis. On November 3, 2015, the Company entered into a first amendment to the Credit Agreement. The amendment conforms certain of the terms and covenants to those in the Term Loan Agreement, including limiting the requirement of subsidiary guarantees to material subsidiaries (as defined in the Credit Agreement) meeting certain conditions. At March 31, 2017, there were no subsidiaries meeting this requirement.
Borrowings bear interest at either a specified base rate or LIBOR plus an applicable margin, at the Operating Partnership's option. Per the amendment, the Operating Partnership’s election to change the grid pricing from leverage based to credit rating based pricing initially requires at least two credit ratings of BBB- or better from S&P or Fitch or Baa3 or better from Moody’s. In April 2016, the Corporation received a first time rating of BBB- from Fitch and was upgraded to a BBB- corporate issuer rating by S&P. As a result, the Operating Partnership elected to change the interest rate grid from leverage based pricing to credit rating based pricing in the second quarter of 2016. Under credit rating based pricing, the 2015 Credit Facility bears interest at a rate equal to LIBOR plus 0.875% to 1.55% per annum or a specified base rate plus 0.0% to 0.55% and requires a facility fee in an amount equal to the aggregate revolving credit commitments (whether or not utilized) multiplied by a rate equal to 0.125% to 0.30% per annum, in each case depending
23
SPIRIT REALTY CAPITAL, INC. and SPIRIT REALTY, L.P.
Notes to Consolidated Financial Statements - (continued)
March 31, 2017
(Unaudited)
on the Corporation's credit rating. As of March 31, 2017, the 2015 Credit Facility bore interest at LIBOR plus 1.25% based on the Company's credit rating and incurred a facility fee of 0.25% per annum.
The Operating Partnership may voluntarily prepay the 2015 Credit Facility, in whole or in part, at any time, without premium or penalty, but subject to applicable LIBOR breakage fees, if any. Payment of the 2015 Credit Facility is unconditionally guaranteed by the Corporation and material subsidiaries that meet certain conditions (as defined in the Credit Agreement). The 2015 Credit Facility is full recourse to the Operating Partnership and the aforementioned guarantors.
As a result of entering into the 2015 Credit Facility and expanding the borrowing capacity, the Company incurred costs of $4.8 million. These deferred financing costs are being amortized to interest expense over the remaining initial term of the 2015 Credit Facility. The unamortized deferred financing costs relating to the 2015 Credit Facility were $2.6 million and $2.9 million as of March 31, 2017 and December 31, 2016, respectively, and recorded in deferred costs and other assets, net on the accompanying consolidated balance sheets.
As of March 31, 2017, $129.0 million was outstanding, no letters of credit were issued and $671.0 million of borrowing capacity was available under the 2015 Credit Facility. The Operating Partnership's ability to borrow under the 2015 Credit Facility is subject to ongoing compliance with a number of customary financial covenants and other customary affirmative and negative covenants. As of March 31, 2017, the Corporation and the Operating Partnership were in compliance with these financial covenants.
Term Loan
On November 3, 2015, the Company entered into a Term Loan Agreement among the Operating Partnership, as borrower, the Company as guarantor and the lenders that are parties thereto. The Term Loan Agreement provides for a $325.0 million senior unsecured term facility that has an initial maturity date of November 2, 2018, which may be extended at the Company's option pursuant to two one-year extension options, subject to the satisfaction of certain conditions and payment of an extension fee. In addition, an accordion feature allows the facility to be increased up to $600.0 million, subject to obtaining additional lender commitments. During the fourth quarter of 2015 and 2016, the Company exercised the accordion feature under the Credit Agreement and increased the term facility borrowing capacity from $325.0 million to $370.0 million and $420.0 million, respectively.
The Term Loan Agreement provides that borrowings bear interest at either LIBOR plus 1.35% to 1.80% per annum or a specified base rate plus 0.35% to 0.80% per annum, at the Operating Partnership's option. In each case, the applicable margin is determined based upon the Corporation’s leverage ratio. If the Corporation obtains at least two credit ratings on its senior unsecured long-term indebtedness of BBB- from S&P or Fitch or Baa3 from Moody's, the Operating Partnership may make an irrevocable election to have the margin based upon the Corporation's credit ratings. In April 2016, the Corporation received a first time rating of BBB- from Fitch and was upgraded to a BBB- corporate issuer rating by S&P. As a result, the Operating Partnership elected to change the interest rate grid from leverage based pricing to credit rating based pricing in the second quarter of 2016. Under credit rating based pricing, borrowings bear interest at either LIBOR plus 0.90% to 1.75% per annum or a specified base rate plus 0.0% to 0.75% per annum, in each case depending on the Corporation’s credit ratings. As of March 31, 2017, the Term Loan bore interest at LIBOR plus 1.35% based on the Company's credit rating.
The Operating Partnership may voluntarily prepay the Term Loan, in whole or in part, at any time, without premium or penalty, but subject to applicable LIBOR breakage fees. Borrowings may be repaid without premium or penalty, and may be re-borrowed within 30 days up to the then available loan commitment and subject to occurrence limitations within any twelve-month period. Payment of the Term Loan is unconditionally guaranteed by the Corporation and, under certain circumstances, by one or more material subsidiaries (as defined in the Term Loan Agreement) of the Corporation. The obligations of the Corporation and any guarantor under the Term Loan are full recourse to the Corporation and each guarantor.
As a result of entering into the Term Loan, the Company incurred origination costs of $2.4 million. These deferred financing costs are being amortized to interest expense over the remaining initial term of the Term Loan. As of March 31, 2017 and December 31, 2016, the unamortized deferred financing costs relating to the Term Loan were $1.3 million
24
SPIRIT REALTY CAPITAL, INC. and SPIRIT REALTY, L.P.
Notes to Consolidated Financial Statements - (continued)
March 31, 2017
(Unaudited)
and $1.5 million, respectively, and recorded net against the principal balance of the Term Loan on the accompanying consolidated balance sheets.
As of March 31, 2017, the Term Loan was fully drawn. The Operating Partnership's ability to borrow under the Term Loan is subject to ongoing compliance with a number of customary financial covenants and other customary affirmative and negative covenants. The Corporation has unconditionally guaranteed all obligations of the Operating Partnership under the Term Loan Agreement. As of March 31, 2017, the Corporation and the Operating Partnership were in compliance with these financial covenants.
Senior Unsecured Notes
On August 18, 2016, the Operating Partnership completed a private placement of $300.0 million aggregate principal amount of senior notes, which are guaranteed by the Corporation. The Senior Unsecured Notes were issued at 99.378% of their principal amount, resulting in net proceeds of $296.2 million, after deducting transaction fees and expenses. The Senior Unsecured Notes accrue interest at a rate of 4.45% per year, payable on March 15 and September 15 of each year, until the maturity date of September 15, 2026. The Company has agreed to file with the SEC and cause to become effective a registration statement pursuant to which the Company will offer to exchange the Senior Unsecured Notes for substantially similar registered notes.
The Senior Unsecured Notes are redeemable in whole at any time or in part from time to time, at the Operating Partnership’s option, at a redemption price equal to the sum of: an amount equal to 100% of the principal amount of the Senior Unsecured Notes to be redeemed plus accrued and unpaid interest and liquidated damages, if any, up to, but not including, the redemption date; and a make-whole premium calculated in accordance with the indenture. Notwithstanding the foregoing, if any of the Senior Unsecured Notes are redeemed on or after June 15, 2026 (three months prior to the maturity date of the Senior Unsecured Notes), the redemption price will not include a make-whole premium.
In connection with the offering, the Operating Partnership incurred $3.2 million in deferred financing costs. This amount is being amortized to interest expense over the life of the Senior Unsecured Notes. As of March 31, 2017 and December 31, 2016, the unamortized deferred financing costs relating to the Senior Unsecured Notes were $3.1 million, respectively, and recorded net against the Senior Unsecured Notes principal balance on the accompanying consolidated balance sheets.
In connection with the issuance of the Senior Unsecured Notes, the Corporation and Operating Partnership are subject to ongoing compliance with a number of customary financial covenants and other customary affirmative and negative covenants. As of March 31, 2017, the Corporation and the Operating Partnership were in compliance with these financial covenants.
Master Trust Notes
The Company has access to an asset-backed securitization platform, the Spirit Master Funding Program, to raise capital through the issuance of non-recourse net-lease mortgage notes collateralized by commercial real estate, net-leases and mortgage loans. The Spirit Master Funding Program consists of two separate securitization trusts, Master Trust 2013 and Master Trust 2014, each of which have one or multiple bankruptcy-remote, special purpose entities as issuers or co-issuers of the notes. Each issuer is an indirect wholly-owned special purpose entity of the Corporation.
25
SPIRIT REALTY CAPITAL, INC. and SPIRIT REALTY, L.P.
Notes to Consolidated Financial Statements - (continued)
March 31, 2017
(Unaudited)
The Master Trust Notes are summarized below:
Stated Rates (1) | Maturity | March 31, 2017 | December 31, 2016 | ||||||||||
(in Years) | (in Thousands) | ||||||||||||
Series 2014-1 Class A1 | 5.1 | % | 3.2 | $ | 51,036 | $ | 53,919 | ||||||
Series 2014-1 Class A2 | 5.4 | % | 3.3 | 253,300 | 253,300 | ||||||||
Series 2014-2 | 5.8 | % | 4.0 | 225,404 | 226,283 | ||||||||
Series 2014-3 | 5.7 | % | 5.0 | 311,701 | 311,820 | ||||||||
Series 2014-4 Class A1 | 3.5 | % | 2.8 | 150,000 | 150,000 | ||||||||
Series 2014-4 Class A2 | 4.6 | % | 12.8 | 360,000 | 360,000 | ||||||||
Total Master Trust 2014 notes | 5.1 | % | 6.3 | 1,351,441 | 1,355,322 | ||||||||
Series 2013-1 Class A | 3.9 | % | 1.7 | 125,000 | 125,000 | ||||||||
Series 2013-2 Class A | 5.3 | % | 6.7 | 191,238 | 192,384 | ||||||||
Total Master Trust 2013 notes | 4.7 | % | 4.7 | 316,238 | 317,384 | ||||||||
Total Master Trust notes | 1,667,679 | 1,672,706 | |||||||||||
Debt discount, net | (17,737 | ) | (18,787 | ) | |||||||||
Deferred financing costs, net | (15,607 | ) | (16,376 | ) | |||||||||
Total Master Trust Notes, net | $ | 1,634,335 | $ | 1,637,543 | |||||||||
(1) Represents the individual series stated interest rate as of March 31, 2017 and the weighted average stated rate of the total Master Trust Notes, based on the collective series outstanding principal balances as of March 31, 2017.
As of March 31, 2017, the Master Trust 2014 notes were secured by 847 owned and financed properties issued by five indirect wholly-owned subsidiaries of the Corporation. The notes issued under Master Trust 2014 are cross-collateralized by the assets of all issuers within this trust. As of March 31, 2017, the Master Trust 2013 notes were secured by 304 owned and financed properties issued by a single indirect wholly-owned subsidiary of the Corporation.
CMBS
As of March 31, 2017, indirect wholly-owned special purpose entity subsidiaries of the Corporation were borrowers under 19 fixed-rate non-recourse loans, excluding two loans in default, which have been securitized into CMBS and are secured by the borrowers' respective leased properties and related assets. The stated interest rates of the loans as of March 31, 2017, excluding the defaulted loans, ranged from 3.90% to 6.52% with a weighted average stated interest rate of 5.34%. As of March 31, 2017, these fixed-rate loans were secured by 123 properties. As of March 31, 2017 and December 31, 2016, the unamortized deferred financing costs associated with these fixed-rate loans were $4.5 million and $4.7 million, respectively, and recorded net against the principal balance of the mortgages and notes payable on the accompanying consolidated balance sheets. The deferred financing costs are being amortized to interest expense over the term of the respective loans.
As of March 31, 2017, certain borrowers were in default under the loan agreements relating to two separate CMBS fixed-rate loans, where four properties securing the respective loans were no longer generating sufficient revenue to pay the scheduled debt service. The default interest rate on these loans was between 9.85% and 10.62%. Each defaulted borrower is a bankruptcy remote special purpose entity and the sole owner of the collateral securing the loan obligations. As of March 31, 2017, the aggregate principal balance under the defaulted loans was $27.2 million, which includes $10.1 million of interest capitalized to the principal balance.
26
SPIRIT REALTY CAPITAL, INC. and SPIRIT REALTY, L.P.
Notes to Consolidated Financial Statements - (continued)
March 31, 2017
(Unaudited)
Convertible Notes
In May 2014, the Corporation issued $402.5 million aggregate principal amount of 2.875% convertible notes due in 2019 and $345.0 million aggregate principal amount of 3.75% convertible notes due in 2021. Interest on the Convertible Notes is payable semiannually in arrears on May 15 and November 15 of each year. The 2019 Notes will mature on May 15, 2019 and the 2021 Notes will mature on May 15, 2021.
The Convertible Notes are convertible only during certain periods and, subject to certain circumstances, into cash, shares of the Corporation's common stock, or a combination thereof. The initial conversion rate applicable to each series is 76.3636 per $1,000 principal note (equivalent to an initial conversion price of $13.10 per share of common stock, representing a 22.5% premium above the public offering price of the common stock offered concurrently at the time the Convertible Notes were issued). The conversion rate is subject to adjustment for certain anti-dilution events, including special distributions and regular quarterly cash dividends exceeding $0.16625 per share. As of March 31, 2017, the conversion rate was 76.9167 per $1,000 principal note. Earlier conversion may be triggered if shares of the Corporation's common stock trades higher than the established thresholds, if the Convertible Notes trade below established thresholds, or certain corporate events occur.
In connection with the issuance of the Convertible Notes, the Company recorded a discount of $56.7 million, which represents the estimated value of the embedded conversion feature for each of the Convertible Notes. The discount is being amortized to interest expense using the effective interest method over the term of each of the 2019 Notes and 2021 Notes. As of March 31, 2017 and December 31, 2016, the unamortized discount was $31.0 million and $33.5 million, respectively. The discount is shown net against the aggregate outstanding principal balance of the Convertible Notes on the accompanying consolidated balance sheets. The equity component of the conversion feature is recorded in capital in excess of par value in the accompanying consolidated balance sheets, net of financing transaction costs.
In connection with the offering, the Company also incurred $19.6 million in deferred financing costs. This amount has been allocated on a pro-rata basis to each of the Convertible Notes and is being amortized to interest expense over the term of each note. As of March 31, 2017 and December 31, 2016, the unamortized deferred financing costs relating to the Convertible Notes were $10.6 million and $11.4 million, respectively, and recorded net against the Convertible Notes principal balance on the accompanying consolidated balance sheets.
Debt Extinguishment
During the three months ended March 31, 2017, the Company extinguished a total of $49.2 million aggregate principal amount of senior mortgage indebtedness with a weighted average contractual interest rate of 5.69%. As a result of these transactions, the Company recognized a de minimis net loss. The payment of premium is included in debt extinguishment costs within operating activities in the consolidated statement of cash flows.
During the three months ended March 31, 2016, the Company extinguished a total of $103.8 million aggregate principal amount of senior mortgage indebtedness with a weighted average contractual interest rate of 6.72%. As a result of these transactions, the Company recognized a net loss on debt extinguishment of approximately $5.3 million.
27
SPIRIT REALTY CAPITAL, INC. and SPIRIT REALTY, L.P.
Notes to Consolidated Financial Statements - (continued)
March 31, 2017
(Unaudited)
Debt Maturities
As of March 31, 2017, scheduled debt maturities of the Company’s 2015 Credit Facility, Term Loan, Senior Unsecured Notes, Master Trust Notes, CMBS and Convertible Notes, including balloon payments, are as follows (in thousands):
Scheduled Principal | Balloon Payment | Total | |||||||||
Remainder of 2017 (1) | $ | 19,984 | $ | 139,295 | $ | 159,279 | |||||
2018 (2) | 42,115 | 602,779 | 644,894 | ||||||||
2019 | 44,325 | 541,500 | 585,825 | ||||||||
2020 | 39,096 | 413,206 | 452,302 | ||||||||
2021 | 30,658 | 554,753 | 585,411 | ||||||||
Thereafter | 219,135 | 1,096,020 | 1,315,155 | ||||||||
Total | $ | 395,313 | $ | 3,347,553 | $ | 3,742,866 | |||||
(1) The balloon payment balance in 2017 includes $27.2 million, including $10.1 million of capitalized interest, for the acceleration of principal payable following an event of default under two non-recourse CMBS loans with a stated maturity in 2017.
(2) 2018 includes $420 million unsecured Term Loan that is extendible at borrower's option pursuant to two one-year extension options.
Interest Expense
The following table is a summary of the components of interest expense related to the Company's borrowings (in thousands):
Three Months Ended March 31, | |||||||
2017 | 2016 | ||||||
Interest expense – 2015 Credit Facility (1) | $ | 1,232 | $ | 457 | |||
Interest expense – Term Loan | 2,246 | 1,747 | |||||
Interest expense – Senior Unsecured Notes | 3,338 | — | |||||
Interest expense – mortgages and notes payable | 28,218 | 41,730 | |||||
Interest expense – Convertible Notes (2) | 6,127 | 6,127 | |||||
Non-cash interest expense: | |||||||
Amortization of deferred financing costs | 2,401 | 2,166 | |||||
Amortization of net losses related to interest rate swaps | — | 30 | |||||
Amortization of debt discount, net | 3,061 | 760 | |||||
Total interest expense | $ | 46,623 | $ | 53,017 | |||
(1) Includes facility fees of approximately $0.6 million and $0.4 million for the three months ended March 31, 2017 and 2016, respectively.
(2) Included in interest expense on the Operating Partnership's consolidated statements of operations are amounts paid to the Corporation by the Operating Partnership related to the notes payable to Spirit Realty Capital, Inc.
Note 5. Derivative and Hedging Activities
The Company uses interest rate derivative contracts to manage its exposure to changes in interest rates on its variable rate debt. These derivatives are considered cash flow hedges and are recorded on a gross basis at fair value. Assessments of hedge effectiveness are performed quarterly using regression analysis and the measurement of hedge ineffectiveness is based on the hypothetical derivative method. The effective portion of changes in fair value are recorded in AOCL and subsequently reclassified to earnings when the hedged transactions affect earnings. The ineffective portion is recorded immediately in earnings in general and administrative expenses. The Company does not enter into derivatives contracts for speculative or trading purposes.
The Company is exposed to credit risk in the event of non-performance by its derivative counterparties. The Company evaluates counterparty credit risk through monitoring the creditworthiness of counterparties, which includes review of
28
SPIRIT REALTY CAPITAL, INC. and SPIRIT REALTY, L.P.
Notes to Consolidated Financial Statements - (continued)
March 31, 2017
(Unaudited)
debt ratings and financial performance. To mitigate its credit risk, the Company enters into agreements with counterparties it considers credit-worthy, such as large financial institutions with favorable credit ratings.
The Company has terminated all existing derivative contracts as of June 30, 2016 and has not entered into any new derivative contracts as of March 31, 2017.
The following tables provide information about the amounts recorded in AOCL, as well as the loss recorded in operations, when reclassified out of AOCL or recognized in earnings immediately, for the three months ended March 31, 2016 (in thousands):
Amount of Gain or (Loss) Recognized in AOCL on Derivative (Effective Portion) | ||||
Derivatives in Cash Flow Hedging Relationships | Three Months Ended March 31, 2016 | |||
Interest rate swaps | $ | (856 | ) | |
Amount of Loss Reclassified from AOCL into Operations (Effective Portion) | ||||
Location of Loss Reclassified from AOCL into Operations | Three Months Ended March 31, 2016 | |||
Interest expense | $ | (235 | ) | |
Amount of Loss Recognized in Operations on Derivative (Ineffective Portion) | ||||
Location of Loss Recognized in Operations on Derivatives | Three Months Ended March 31, 2016 | |||
General and administrative expense | $ | — | ||
Note 6. Stockholders’ Equity and Partners' Capital
Issuance of Common Stock
During the three months ended March 31, 2017, portions of awards of restricted common stock and performance share awards granted to certain of the Company's officers and other employees vested. The vesting of these awards, granted pursuant to the Amended Incentive Award Plan, resulted in federal and state income tax liabilities for the recipients. As permitted by the terms of the Amended Incentive Award Plan and the award grants, certain executive officers and employees elected to surrender 0.1 million shares of common stock valued at $0.8 million, solely to pay the associated statutory tax withholdings during the three months ended March 31, 2017.
ATM Program
In November 2016, the Company's Board of Directors approved a new ATM Program and the Company terminated its existing program. As of March 31, 2017, no shares of the Company's common stock had been sold under the new ATM Program and $500.0 million in gross proceeds capacity remained available.
Stock Repurchase Program
In February 2016, the Company's Board of Directors approved a stock repurchase program, which authorizes the Company to repurchase up to $200 million of its common stock. These purchases can be made in the open market or through private transactions from time to time over the 18 month time period following authorization, depending on prevailing market conditions and applicable legal and regulatory requirements. Purchase activity will be dependent on various factors, including the Company's capital position, operating results, funds generated by asset sales, dividends that may be required by those sales, and investment options that may be available, including acquiring new properties or retiring debt. The stock repurchase program does not obligate the Company to repurchase any specific number of shares and may be suspended at any time at the Company's discretion. The Company intends to fund any repurchases with the net proceeds from asset sales, cash flows from operations, existing cash on the balance sheet and other
29
SPIRIT REALTY CAPITAL, INC. and SPIRIT REALTY, L.P.
Notes to Consolidated Financial Statements - (continued)
March 31, 2017
(Unaudited)
sources. During the three months ended March 31, 2017, no stock was repurchased under the stock repurchase program.
Dividends Declared
For the three months ended March 31, 2017, the Corporation's Board of Directors declared the following dividends:
Declaration Date | Dividend Per Share | Record Date | Total Amount | Payment Date | ||||||||
(in thousands) | ||||||||||||
March 15, 2017 | $ | 0.18000 | March 31, 2017 | $ | 87,122 | April 14, 2017 | ||||||
The dividend declared on March 15, 2017 was paid on April 14, 2017 and is included in accounts payable, accrued expenses and other liabilities as of March 31, 2017.
Note 7. Commitments and Contingencies
The Company is periodically subject to claims or litigation in the ordinary course of business, including claims generated from business conducted by tenants on real estate owned by the Company. In these instances, the Company is typically indemnified by the tenant against any losses that might be suffered, and the Company and/or the tenant are typically insured against such claims.
On September 8, 2015, Haggen Holdings, LLC and a number of its affiliates, including Haggen Operations Holdings, LLC (collectively, the "Debtors"), filed petitions for bankruptcy protection under Chapter 11 of the U.S. Bankruptcy Code in the U.S. Bankruptcy Court for the District of Delaware. At the time of the filing, Haggen Operations Holdings, LLC ("Haggen") leased 20 properties on a triple net basis from a subsidiary of the Company under a master lease.
• | On November 25, 2015, Haggen and Spirit restructured the master lease in an initial settlement agreement with approved claims of $21.0 million. |
• | On April 1, 2016, Spirit entered into a second settlement agreement with both Haggen and Albertsons, LLC for $3.4 million and $3.0 million, respectively. |
• | As a result of the settlements, the leases for seven locations were rejected and the leases for thirteen locations were assumed by the Debtors and assigned to the following tenants: five locations to Albertsons, LLC, five locations to Smart & Final, LLC, two locations to Gelson’s Markets and one location to Safeway, Inc. |
• | As of March 31, 2017, the Company had sold six of the properties for total proceeds of $56.6 million, including four of the original seven rejected locations, resulting in 11 locations with leases in-place under substantially the same terms and rent (inclusive of the $3.0 million settlement related to rent reduction for an amended lease with Albertsons, LLC) and three locations that remain vacant. |
• | To date, the Company has collected $5.5 million of the total claims and there is no guaranty that the remaining claims will be paid or otherwise satisfied in full. |
As of March 31, 2017, there were no outstanding claims against the Company that are expected to have a material adverse effect on the Company’s financial position, results of operations or cash flows.
As of March 31, 2017, the Company had commitments totaling $59.0 million, of which $4.7 million relates to future acquisitions with the remainder to fund improvements on properties the Company currently owns. Commitments related to acquisitions contain standard cancellation clauses contingent on the results of due diligence. Of the total commitments of $59.0 million, $58.1 million is expected to be funded during fiscal year 2017. In addition, the Company is contingently liable for $5.7 million of debt owed by one of its tenants and is indemnified by that tenant for any payments the Company may be required to make on such debt.
The Company estimates future costs for known environmental remediation requirements when it is probable that the Company has incurred a liability and the related costs can be reasonably estimated. The Company considers various factors when estimating its environmental liabilities, and adjustments are made when additional information becomes available that affects the estimated costs to study or remediate any environmental issues. When only a wide range of
30
SPIRIT REALTY CAPITAL, INC. and SPIRIT REALTY, L.P.
Notes to Consolidated Financial Statements - (continued)
March 31, 2017
(Unaudited)
estimated amounts can be reasonably established and no other amount within the range is better than another, the low end of the range is recorded in the consolidated financial statements.
Note 8. Fair Value Measurements
Recurring Fair Value Measurements
The Company did not have any assets or liabilities that are required to be measured at fair value on a recurring basis as of March 31, 2017.
Nonrecurring Fair Value Measurements
Fair value measurement of an asset on a nonrecurring basis occurs when events or changes in circumstances related to an asset indicate that the carrying amount of the asset is no longer recoverable. The following table sets forth the Company’s assets that were accounted for at fair value on a nonrecurring basis (in thousands):
Fair Value Hierarchy Level | Impairment Charges (1) | |||||||||||||||||||||||
Description | Fair Value | Dispositions | Level 1 | Level 2 | Level 3 | |||||||||||||||||||
March 31, 2017 | ||||||||||||||||||||||||
Retail | $ | 19,281 | $ | — | $ | — | $ | — | $ | 19,281 | $ | (18,506 | ) | |||||||||||
Industrial | 3,725 | — | — | — | 3,725 | (3,293 | ) | |||||||||||||||||
Office | 6,790 | — | — | — | 6,790 | (1,374 | ) | |||||||||||||||||
Long-lived assets held and used | 29,796 | — | — | — | 29,796 | (23,173 | ) | |||||||||||||||||
Lease intangible assets | 350 | — | — | — | 350 | 322 | ||||||||||||||||||
Long-lived assets held for sale | 22,077 | — | — | — | 22,077 | (11,525 | ) | |||||||||||||||||
$ | (34,376 | ) | ||||||||||||||||||||||
December 31, 2016 | ||||||||||||||||||||||||
Retail | $ | 33,766 | $ | (4,168 | ) | $ | — | $ | — | $ | 37,934 | $ | (37,445 | ) | ||||||||||
Industrial | 2,394 | (1,347 | ) | — | — | 3,741 | (5,948 | ) | ||||||||||||||||
Office | 8,538 | — | — | — | 8,538 | (10,121 | ) | |||||||||||||||||
Long-lived assets held and used | 44,698 | (5,515 | ) | — | — | 50,213 | (53,514 | ) | ||||||||||||||||
Lease intangible assets | 6,384 | — | — | — | 6,384 | (9,116 | ) | |||||||||||||||||
Other assets | 27 | — | — | — | 27 | (198 | ) | |||||||||||||||||
Long-lived assets held for sale | 24,493 | (36,907 | ) | — | — | 61,400 | (25,447 | ) | ||||||||||||||||
$ | (88,275 | ) | ||||||||||||||||||||||
(1) Impairment charges are presented for the three months ended March 31, 2017 and for the year ended December 31, 2016.
Real estate assets and their related intangible assets are evaluated for impairment based on certain indicators including, but not limited to: the asset being held for sale, vacant, non-operating or the lease on the asset expiring in twelve months or less. The fair values of impaired real estate and intangible assets were determined by using the following information, depending on availability, in order of preference: signed purchase and sale agreements or letters of intent; recently quoted bid or ask prices, or market prices for comparable properties; estimates of cash flow, which consider, among other things, contractual and forecasted rental revenues, leasing assumptions, and expenses based upon market conditions; and expectations for the use of the real estate. Based on these inputs, the Company determined that its valuation of the impaired real estate and intangible assets falls within Level 3 of the fair value hierarchy.
During the three months ended March 31, 2017 and for the year ended December 31, 2016, we determined that 22 and 33 long-lived assets held and used, respectively, were impaired. The Company estimated the fair value of these properties using weighted average sales price per square foot of comparable properties for four of the 22 impaired
31
SPIRIT REALTY CAPITAL, INC. and SPIRIT REALTY, L.P.
Notes to Consolidated Financial Statements - (continued)
March 31, 2017
(Unaudited)
properties during the three months ended March 31, 2017 and for 16 of the 33 impaired properties during the year ended December 31, 2016.
The following table provides information about the weighted average sales price per square foot of comparable properties used to estimate fair value (price per square foot in dollars):
March 31, 2017 | December 31, 2016 | |||||||||||||||||
Description | Range | Weighted Average | Square Footage | Range | Weighted Average | Square Footage | ||||||||||||
Long-lived assets held and used by asset type | ||||||||||||||||||
Retail | $44.19 - $80.11 | $ | 56.28 | 113,943 | $17.17 - $502.23 | $ | 58.78 | 290,770 | ||||||||||
Industrial | — | — | — | $26.43 | $ | 26.43 | 104,864 | |||||||||||
Office | — | — | — | $35.00 | $ | 35.00 | 135,675 | |||||||||||
The Company estimated the fair value on the 18 remaining impaired properties using the weighted average listing price or broker opinion of value per square foot during the three months ended March 31, 2017 and on 17 of the 33 impaired properties during the year ended December 31, 2016.
The following table provides information about the weighted average listing price and broker opinion of value per square foot of comparable properties used to estimate fair value (price per square foot in dollars):
March 31, 2017 | December 31, 2016 | |||||||||||||||||
Description | Range | Weighted Average | Square Footage | Range | Weighted Average | Square Footage | ||||||||||||
Long-lived assets held and used by asset type | ||||||||||||||||||
Retail | $9.13 - $139.1 | $ | 35.02 | 376,426 | $15.40 - $170.02 | $ | 40.80 | 516,916 | ||||||||||
Industrial | $4.01 - $14.61 | $ | 6.33 | 588,906 | $9.09 | $ | 9.09 | 149,627 | ||||||||||
Office | $62.89 | $ | 62.89 | 141,525 | 56.81 | $ | 56.81 | 34,992 | ||||||||||
Estimated Fair Value of Financial Instruments
Financial assets and liabilities for which the carrying values approximate their fair values include cash and cash equivalents, restricted cash and escrow deposits, and accounts receivable and payable. Generally, these assets and liabilities are short-term in duration and are recorded at cost, which approximates fair value, on the accompanying consolidated balance sheets.
In addition to the disclosures for assets and liabilities required to be measured at fair value at the balance sheet date, companies are required to disclose the estimated fair values of all financial instruments, even if they are not carried at their fair values. The fair values of financial instruments are estimates based upon market conditions and perceived risks at March 31, 2017 and December 31, 2016. These estimates require management’s judgment and may not be indicative of the future fair values of the assets and liabilities.
32
SPIRIT REALTY CAPITAL, INC. and SPIRIT REALTY, L.P.
Notes to Consolidated Financial Statements - (continued)
March 31, 2017
(Unaudited)
The estimated fair values of the loans receivable, 2015 Credit Facility, Term Loan, Senior Unsecured Notes, Convertible Notes and the fixed-rate mortgages and notes payable have been derived based on market quotes for comparable instruments or discounted cash flow analyses using estimates of the amount and timing of future cash flows, market rates and credit spreads. The loans receivable, 2015 Credit Facility, Term Loan, Senior Unsecured Notes, Convertible Notes and the mortgages and notes payable were measured using a market approach from nationally recognized financial institutions with market observable inputs such as interest rates and credit analytics. These measurements are classified as Level 2 of the fair value hierarchy. The following table discloses fair value information for these financial instruments (in thousands):
March 31, 2017 | December 31, 2016 | ||||||||||||||
Carrying Value | Estimated Fair Value | Carrying Value | Estimated Fair Value | ||||||||||||
Loans receivable, net | $ | 67,880 | $ | 72,865 | $ | 66,578 | $ | 71,895 | |||||||
2015 Credit Facility | 129,000 | 129,007 | 86,000 | 87,718 | |||||||||||
Term Loan, net (1) | 418,672 | 420,051 | 418,471 | 428,441 | |||||||||||
Senior Unsecured Notes, net (1) | 295,169 | 295,692 | 295,112 | 283,473 | |||||||||||
Mortgages and notes payable, net (1) | 2,109,117 | 2,231,381 | 2,162,403 | 2,282,142 | |||||||||||
Convertible Notes, net (1) | 705,899 | 762,847 | 702,642 | 784,175 | |||||||||||
(1) The carrying value of the debt instruments are net of unamortized deferred financing costs and certain debt discounts/premiums.
Note 9. Significant Credit and Revenue Concentration
As of March 31, 2017 and December 31, 2016, the Company’s real estate investments are operated by 431 and 450 tenants, respectively, that operate within retail, office and industrial property types across various industries throughout the U.S. Shopko operates in the general merchandise industry and is the Company’s largest tenant as a percentage of rental revenue. Total rental revenues from properties leased to Shopko for the three months ended March 31, 2017 and 2016, contributed 8.3% and 9.4% of the rental revenue shown in the accompanying consolidated statements of operations. No other tenant contributed 4% or more of the rental revenue during any of the periods presented. As of March 31, 2017 and December 31, 2016, the Company's net investment in Shopko properties represents approximately 5.7% and 5.8%, respectively, of the Company’s total assets and the Company's real estate investment in Shopko represents approximately 7.6% and 7.7%, respectively, of the Company's total real estate investment portfolio.
Note 10. Supplemental Cash Flow Information
The following table presents the supplemental cash flow disclosures (in thousands):
Three Months Ended March 31, | |||||
2017 | 2016 | ||||
Supplemental Disclosures of Non-Cash Investing and Financing Activities: | |||||
Reduction of debt in exchange for collateral assets | 35,522 | 13,631 | |||
Reclass of residual value on expired deferred financing lease to operating asset | 8,613 | — | |||
Net real estate and other collateral assets surrendered | 35,008 | 19,942 | |||
Accrued interest capitalized to principal (1) | 714 | 1,260 | |||
Accrued performance share dividend rights | 414 | 174 | |||
Distributions declared and unpaid | 87,864 | 77,899 | |||
Accrued deferred financing costs | 74 | 125 | |||
(1) Accrued and overdue interest on certain CMBS notes that have been intentionally placed in default.
33
SPIRIT REALTY CAPITAL, INC. and SPIRIT REALTY, L.P.
Notes to Consolidated Financial Statements - (continued)
March 31, 2017
(Unaudited)
Note 11. Incentive Award Plan
Restricted Shares of Common Stock
During the three months ended March 31, 2017, the Company granted 0.5 million restricted shares under the Amended Incentive Award Plan to certain executive officers and employees. The Company recorded $5.2 million in deferred compensation associated with these grants, which will be recognized in expense over the service period of the awards. As of March 31, 2017, there were approximately 1.3 million unvested restricted shares outstanding.
Performance Share Awards
During the three months ended March 31, 2017, the Board of Directors or committee thereof approved an initial target grant of 0.4 million performance shares to executive officers of the Company. The performance period of this grant runs from January 1, 2017 through December 31, 2019. Potential shares of the Corporation's common stock that each participant is eligible to receive is based on the initial target number of shares granted multiplied by a percentage range between 0% and 250%. Grant date fair value was calculated using the Monte Carlo simulation model, which incorporated stock price correlation, projected dividend yields and other variables over the time horizons matching the performance periods. Stock-based compensation expense associated with unvested performance share awards is recognized on a straight-line basis over the minimum required service period, which is generally three years. Based on the grant date fair value, the Corporation expects to recognize $5.8 million in compensation expense on a straight-line basis over the requisite service period.
Approximately $0.8 million and $0.5 million in dividend rights have been accrued for non-vested performance share awards outstanding as of March 31, 2017 and December 31, 2016, respectively. For outstanding non-vested awards at March 31, 2017, 0.3 million shares would have been released based on the Corporation's TSR relative to the specified peer groups through that date.
Stock-based Compensation Expense
For the three months ended March 31, 2017 and 2016, the Company recognized $2.2 million and $2.3 million, respectively, in stock-based compensation expense, which is included in general and administrative expenses in the accompanying consolidated statements of operations.
As of March 31, 2017, the remaining unamortized stock-based compensation expense, including amounts relating to the performance share awards, totaled $21.7 million, including $13.3 million related to restricted stock awards and $8.4 million related to performance share awards, which is recognized as the greater of the amount amortized on a straight-line basis over the service period of each applicable award or the amount vested over the vesting periods.
Note 12. Income Per Share and Partnership Unit
Income per share has been computed using the two-class method which is computed by dividing the sum of distributed earnings to common stockholders and undistributed earnings allocated to common stockholders by the weighted average number of shares of common stock outstanding for the period. In applying the two-class method, undistributed earnings are allocated to both shares of common stock and participating securities based on the weighted average shares outstanding during the period. Classification of the Company's unvested restricted stock, which contain rights to receive non-forfeitable dividends, are deemed participating securities under the two-class method. Under the two-class method, earnings attributable to unvested restricted shares are deducted from income from continuing operations in the computation of net income attributable to common stockholders.
34
SPIRIT REALTY CAPITAL, INC. and SPIRIT REALTY, L.P.
Notes to Consolidated Financial Statements - (continued)
March 31, 2017
(Unaudited)
The table below is a reconciliation of the numerator and denominator used in the computation of basic and diluted net income per share computed using the two-class method (dollars in thousands):
Three Months Ended March 31, | |||||||
2017 | 2016 | ||||||
Basic and diluted income: | |||||||
(Loss) income before gain on disposition of assets | $ | (3,388 | ) | $ | 12,954 | ||
Gain on disposition of assets | 16,217 | 10,146 | |||||
Less: income attributable to unvested restricted stock | (234 | ) | (127 | ) | |||
Net income attributable to common stockholders used in basic and diluted income per share | $ | 12,595 | $ | 22,973 | |||
Basic weighted average shares of common stock outstanding: | |||||||
Weighted average shares of common stock outstanding | 483,752,233 | 442,033,226 | |||||
Less: unvested weighted average shares of restricted stock | (1,145,035 | ) | (667,299 | ) | |||
Weighted average shares of common stock outstanding used in basic income per share | 482,607,198 | 441,365,927 | |||||
Net income per share attributable to common stockholders—basic | $ | 0.03 | $ | 0.05 | |||
Diluted weighted average shares of common stock outstanding: (1) | |||||||
Stock options | 1,898 | 2,480 | |||||
Weighted average shares of common stock outstanding used in diluted income per share | 482,609,096 | 441,368,407 | |||||
Net income per share attributable to common stockholders—diluted | $ | 0.03 | $ | 0.05 | |||
Potentially dilutive shares of common stock | |||||||
Unvested shares of restricted stock | 78,637 | 67,709 | |||||
Total | 78,637 | 67,709 | |||||
(1) Assumes the most dilutive issuance of potentially issuable shares between the two-class and treasury stock method unless the result would be anti-dilutive.
The Corporation intends to satisfy its exchange obligation for the principal amount of the Convertible Notes to the note holders entirely in cash, therefore, the "if-converted" method does not apply and the treasury stock method is being used. For the three months ended March 31, 2017, the Corporation's average stock price was below the conversion price, resulting in zero potentially dilutive shares related to the conversion spread.
Note 13. Costs Associated With Restructuring Activities
On November 16, 2015, the Company’s Board of Directors approved the strategic decision to relocate its headquarters from Scottsdale, Arizona to Dallas, Texas. The Company began occupying temporary office space in the new headquarters building in the spring of 2016, and finalized the move with the opening of the new office space in late September 2016. As a result of moving its corporate headquarters, the Company incurred various restructuring charges, including employee separation and relocation costs. Restructuring charges for the three months ended March 31, 2016 totaled $0.6 million, and are included within restructuring charges on the accompanying consolidated statements of operations. As of and for the three months ended March 31, 2017, the Company no longer had any accrued restructuring charges and incurred no additional restructuring charges.
35
Item 2. Management’s Discussion and Analysis of Financial Condition and Results of Operations
Special Note Regarding Forward-looking Statements
This quarterly report contains forward-looking statements within the meaning of Section 27A of the Securities Act and Section 21E of the Exchange Act. When used in this quarterly report, the words “estimate,” “anticipate,” “expect,” “believe,” “intend,” “may,” “will,” “should,” “seek,” “approximately” or “plan,” or the negative of these words or similar words or phrases that are predictions of or indicate future events or trends and which do not relate solely to historical matters are intended to identify forward-looking statements. You can also identify forward-looking statements by discussions of strategy, plans or intentions of management.
Forward-looking statements involve numerous risks and uncertainties and you should not rely on them as predictions of future events. Forward-looking statements depend on assumptions, data or methods which may be incorrect or imprecise and we may not be able to realize them. We do not guarantee that the transactions and events described will happen as described (or that they will happen at all).
The following risks and uncertainties, among others, could cause actual results and future events to differ materially from those set forth or contemplated in the forward-looking statements:
• | industry and economic conditions; |
• | volatility and uncertainty in the financial markets, including potential fluctuations in the CPI; |
• | our success in implementing our business strategy and our ability to identify, underwrite, finance, consummate, integrate and manage diversifying acquisitions or investments; |
• | the financial performance of our retail tenants and the demand for retail space, particularly with respect to challenges being experienced by general merchandise retailers; |
• | our ability to diversify our tenant base and reduce the concentration of our significant tenant; |
• | the nature and extent of future competition; |
• | increases in our costs of borrowing as a result of changes in interest rates and other factors; |
• | our ability to access debt and equity capital markets; |
• | our ability to pay down, refinance, restructure and/or extend our indebtedness as it becomes due; |
• | our ability and willingness to renew our leases upon expiration and to reposition our properties on the same or better terms upon expiration in the event such properties are not renewed by tenants or we exercise our rights to replace existing tenants upon default; |
• | the impact of any financial, accounting, legal or regulatory issues or litigation that may affect us or our major tenants; |
• | our ability to manage our expanded operations; |
• | our ability and willingness to maintain our qualification as a REIT; and |
• | other risks inherent in the real estate business, including tenant defaults, potential liability relating to environmental matters, illiquidity of real estate investments and potential damages from natural disasters. |
The factors included in this quarterly report, including the documents incorporated by reference, and documents we subsequently file with the SEC and incorporate by reference, are not exhaustive and additional factors could adversely affect our business and financial performance. For a discussion of additional risk factors, see the factors included under the caption “Risk Factors” in our most recent Annual Report on Form 10-K, as well as those risk factors discussed in Part II Item 1a "Risk Factors" herein. All forward-looking statements are based on information that was available, and speak only, as of the date on which they were made. We disclaim any obligation to publicly update or revise any forward-looking statement to reflect changes in underlying assumptions or factors, new information, data or methods, future events or other changes, except as required by law.
36
Overview
Spirit Realty Capital, Inc. is a New York Stock Exchange listed company under the ticker symbol "SRC." We are a self-administered and self-managed REIT with in-house capabilities including acquisition, portfolio management, asset management, credit research, real estate research, legal, finance and accounting and capital markets. We primarily invest in single-tenant, operationally essential real estate assets throughout the U.S., which are generally acquired through strategic sale-leaseback transactions and subsequently leased on long-term, triple-net basis to high quality tenants with business operations within predominantly retail, but also office and industrial property types. Single tenant, operationally essential real estate consists of properties that are generally free-standing, commercial real estate facilities where our tenants conduct activities that are essential to the generation of their sales and profits. In support of our primary business of owning and leasing real estate, we have also strategically originated or acquired long-term, commercial mortgage and other loans to provide a range of financing solutions to our tenants. As of March 31, 2017, our owned real estate represented investments in 2,514 properties. Our properties are leased to 431 tenants across 49 states and 30 industries. As of March 31, 2017, our owned properties were approximately 97.7% occupied (based on number of properties). In addition, our investment in real estate includes commercial mortgage and other loans receivable primarily secured by an additional 74 real estate properties or other related assets.
Our operations are primarily carried out through the Operating Partnership. OP Holdings, one of our wholly owned subsidiaries, is the sole general partner and owns approximately 1% of the Operating Partnership. We and one of our wholly-owned subsidiaries are the only limited partners, and together own the remaining 99% of the Operating Partnership. Although the Operating Partnership is wholly-owned by us, in the future, we may issue partnership interests in the Operating Partnership to third parties in exchange for property owned by such third parties. In general, any partnership interests in the Operating Partnership issued to third parties would be exchangeable for cash or, at our election, shares of our common stock at specified ratios set when such partnership interests in the Operating Partnership are issued.
We have elected to be taxed as a REIT for federal income tax purposes and believe we have been organized and have operated in a manner that has allowed us to qualify as a REIT for federal income tax purposes, and we intend to continue operating in such a manner.
Highlights
For the three months ended March 31, 2017:
• | Generated net income of $0.03 per diluted share, AFFO of $0.20 per diluted share and FFO of $0.20 per diluted share. |
• | Closed 15 real estate acquisitions totaling $147.9 million, including revenue producing capital expenditures, adding 26 properties to our portfolio, earning an initial weighted average cash yield of 7.13% under leases and a weighted average term of 14.1 years. |
• | Sold 57 properties for $172.6 million in gross proceeds, including the sale of 39 vacant properties for $79.9 million in gross proceeds. The remaining 18 properties were income producing and were sold for $92.7 million in gross proceeds, with a weighted average capitalization rate of 7.88%. |
• | Extinguished $49.2 million of high coupon debt that had a 5.69% weighted average rate. |
• | Sold 3 Shopko stores for $21.0 million in gross proceeds, resulting in a reduction in Shopko concentration to 8.1% of Normalized Rental Revenue at March 31, 2017 compared to 9.1% at March 31, 2016. |
• | Sold 17 Shopko stores for $99.8 million in gross proceeds since January 1, 2016 though March 31, 2017. |
• | Subsequent to March 31, 2017, we sold an additional 5 Shopko stores for $25.5 million in gross proceeds. |
37
Factors that May Influence Our Operating Results
ACQUISITIONS AND LEASE STRUCTURE
Our principal business is acquiring commercial real estate properties and leasing these properties to our tenants. Our ability to grow revenue and produce superior risk adjusted returns depends on our ability to acquire additional properties at a yield sufficiently in excess of our cost of capital. We focus on opportunities to acquire attractive commercial real estate by providing capital to small and middle-market companies that we conclude have stable and proven operating histories and attractive credit characteristics. Small and middle-market companies are often willing to enter into leases with structures and terms that we consider appealing and that we believe increase the security of rental payments.
Portfolio Diversification
Our strategy emphasizes a portfolio that (1) derives no more than 10% of its annual rent from any single tenant and no more than 1.0% of its annual rent from any single property, (2) is leased to tenants operating in various industries and (3) is located across the U.S. without significant geographic concentration.
A core component of our business is investing in and managing a portfolio of single-tenant, operationally essential retail real estate throughout the U.S. Accordingly, our performance is substantially dependent on the performance of our retail tenants. The market for retail space has previously been, and could continue to be, adversely affected by weakness in the national, regional and local economies, the adverse financial condition of some retail companies, the ongoing consolidation in the retail industry, the excess amount of retail space in a number of markets and increasing consumer purchases through catalogs or over the internet.
In particular, we have experienced and expect to continue to experience challenges with some of our retailers through increased credit losses. These credit losses resulted in lower revenues from non-performing leases and certain charges for the write-off of unrecoverable receivables. We expect the non-performance for certain of these leases to continue.
As of March 31, 2017, Shopko represents our most significant tenant. Currently we lease 111 properties to Shopko, pursuant to three master leases and two single site leases, under which we receive approximately $4.3 million in rental revenues per month. We reduced our Shopko tenant concentration to 8.1% of Normalized Rental Revenue at March 31, 2017 compared to 9.1% at March 31, 2016. During the three months ended March 31, 2017, we sold three Shopko properties for $21.0 million in gross proceeds as we continue our objective to reduce our exposure to Shopko.
As a result of the significant number of properties leased to Shopko, our results of operations and financial condition are closely tied to Shopko's performance under its leases, which is ultimately tied to the performance of its stores and the retail industry in which it operates. Shopko operates as a multi-department general merchandise retailer and retail health services provider primarily in mid-size and large communities in the Midwest, Pacific Northwest, North Central and Western Mountain states. Given recent liquidity events and other challenges, including bankruptcies, impacting the retail industry relative to recent years and our monitoring of Shopko's financial information, we have increased our scrutiny on Shopko. If Shopko experiences a decline in its business, financial condition, results of operations or loses access to liquidity, it may request discounts or deferrals on the rents it pays to us, seek to terminate its master leases with us or close certain of its stores, all of which could decrease the amount of revenue we receive from it. Shopko is current on all of its obligations to us under our lease arrangements with them.
Operationally Essential Real Estate with Long-Term Leases
We seek to own properties that are operationally essential to our tenants, thereby reducing the risk that our tenants would choose not to renew an expiring lease or reject a lease in bankruptcy. We also seek to enter into leases with relatively long initial terms, typically 15 to 20 years, and renewal options with attractive rent escalation provisions. As of both March 31, 2017 and March 31, 2016, our leases had a weighted average remaining lease term of approximately 10.6 years (based on Normalized Rental Revenue).
Rent Escalators
Our leases generally contain provisions contractually increasing the rental revenue over the term of the lease at specified dates by (1) a fixed amount or (2) the lesser of 1 to 1.25 times any increase in CPI over a specified period or a fixed amount (typically 1-2% per year). The percentage of our single-tenant properties (based on Normalized Rental Revenue) containing rent escalators remained consistent at approximately 89% as of both March 31, 2017 and March 31, 2016, respectively.
38
Master Lease Structure
Where appropriate, we seek to enter into master leases, whereby we lease multiple properties to a single tenant on an “all or none” basis. The master lease structure prevents a tenant from unilaterally giving up under-performing properties while retaining well-performing properties. Master lease revenue contributed approximately 44% of our Normalized Rental Revenue as of March 31, 2017, compared to approximately 46% as of March 31, 2016.
Triple-Net Leases
Our leases are predominantly triple-net leases, whereby the tenant pays all property operating expenses, including but not limited to real estate taxes, insurance premiums and repair and maintenance costs. As of March 31, 2017, approximately 83% of our properties (based on Normalized Rental Revenue) are subject to triple-net leases, compared to approximately 86% as of March 31, 2016.
ASSET MANAGEMENT
The stability of the rental revenue generated by our properties depends principally on our tenants’ ability to pay rent and our ability to:
• | collect rent due, |
• | renew expiring leases or re-lease space upon expiration or other termination, |
• | lease currently vacant properties and |
• | maintain or increase rental rates. |
Each of these could be negatively impacted by adverse economic conditions, particularly those that affect the markets in which our properties are located, downturns in our tenants’ industries, increased competition for our tenants at our property locations, or the bankruptcy of one or more of our tenants. We seek to manage these risks by using our developed underwriting and risk management processes to structure and manage our portfolio.
Active Management and Monitoring of Risks Related to Our Investments
We seek to measure tenant financial distress risk and lease renewal risk through various processes. Many of our tenants are required to provide corporate-level and/or unit-level financial information, which includes balance sheet, income statement and cash flow statement data on a quarterly and/or annual basis. Our underwriting and risk management processes are designed to structure new investments and manage existing investments to mitigate tenant credit quality risks and preserve the long-term return on our invested capital. Since our inception, our occupancy has never been below 96.1% (based on number of properties), despite the economic downturn of 2008 through 2010. The percentage of our properties that were occupied decreased slightly to approximately 97.7% as of March 31, 2017 from approximately 98.7% as of March 31, 2016.
On September 8, 2015, Haggen Holdings, LLC and a number of its affiliates, including Haggen Operations Holdings, LLC, filed petitions for bankruptcy protection under Chapter 11 of the U.S. Bankruptcy Code. At the time of the filing, Haggen Operations Holdings, LLC leased 20 properties on a triple net basis from a subsidiary of ours under a master lease. For discussion of the related settlement and current status of these properties, see footnote 7 to the consolidated financial statements herein.
CAPITAL RECYCLING
We continuously evaluate opportunities for the disposition of properties in our portfolio when we believe such disposition is appropriate in view of our business objectives, considering criteria including, but not limited to, tenant concentration, tenant credit quality, local market conditions and lease rates, associated indebtedness, asset location and tenant operation type (e.g., industry, sector, or concept/brand), as well as potential uses of proceeds and tax considerations. As part of this strategy, we may enter into 1031 Exchanges to defer some or all of the taxable gains on the dispositions, if any, for federal and state income tax purposes. We can provide no assurance that we will dispose of any additional properties or that future acquisitions and/or dispositions, if any, will qualify as 1031 Exchanges. Furthermore, we can provide no assurance that we will deploy the proceeds from future dispositions in a manner that produces comparable or better yields. We plan to deliberately slow down our acquisition activity for the remainder of 2017 and be selective with our dispositions. Additionally, we expect termination fees, which are recognized when there is a signed termination agreement and all of the conditions of the agreement have been met, may be less than in prior periods.
CAPITAL FUNDING
Our principal demands for funds are for property acquisitions, payment of principal and interest on our outstanding indebtedness, operating and property maintenance expenses and distributions to our stockholders. Generally, property
39
acquisitions are temporarily funded through our 2015 Credit Facility, followed by permanent financing through asset level financing or issuance of debt or equity securities. Our remaining cash needs are typically met by cash flows from operations, which are primarily driven by the rental income received from our leased properties, interest income earned on loans receivable and interest income on our cash balances.
Interest Costs
Our fixed-rate debt structure provides us with a stable and predictable cash requirement related to our debt service. Any changes to our debt structure, including borrowings under our 2015 Credit Facility or debt financing associated with property acquisitions, could materially influence our operating results depending on the terms of any such indebtedness. A significant amount of our debt provides for scheduled principal payments. As principal is repaid, our interest expense decreases. Fluctuations in interest rates will affect the interest expense we incur on unhedged variable interest rate debt and may impact our ability to refinance maturing debt.
Critical Accounting Policies and Estimates
The preparation of financial statements in conformity with GAAP requires management to use judgment in the application of accounting policies, including making estimates and assumptions. We base estimates on the best information available to us at the time, our experience and various other assumptions deemed reasonable under the circumstances. From time to time, we re-evaluate our estimates and assumptions. In the event estimates or assumptions prove to be different from actual results, adjustments are made in subsequent periods to reflect more current estimates and assumptions about matters that are inherently uncertain. A summary of our critical accounting policies is included in our Annual Report on Form 10-K for the year ended December 31, 2016 in the section entitled “Management’s Discussion and Analysis of Financial Condition and Results of Operations.” We have not made any material changes to these policies during the periods covered by this quarterly report.
40
Results of Operations
Three Months Ended March 31, | ||||||||||||||
(In Thousands) | 2017 | 2016 | Change | % Change | ||||||||||
Revenues: | ||||||||||||||
Rentals | $ | 159,220 | $ | 161,819 | $ | (2,599 | ) | (1.6 | )% | |||||
Interest income on loans receivable | 892 | 1,659 | (767 | ) | (46.2 | )% | ||||||||
Earned income from direct financing leases | 612 | 724 | (112 | ) | (15.5 | )% | ||||||||
Tenant reimbursement income | 3,965 | 3,824 | 141 | 3.7 | % | |||||||||
Other income | 733 | 331 | 402 | NM | ||||||||||
Total revenues | 165,422 | 168,357 | (2,935 | ) | (1.7 | )% | ||||||||
Expenses: | ||||||||||||||
General and administrative | 13,418 | 11,649 | 1,769 | 15.2 | % | |||||||||
Restructuring charges | — | 649 | (649 | ) | (100.0 | )% | ||||||||
Property costs | 9,051 | 7,327 | 1,724 | 23.5 | % | |||||||||
Real estate acquisition costs | 153 | 57 | 96 | NM | ||||||||||
Interest | 46,623 | 53,017 | (6,394 | ) | (12.1 | )% | ||||||||
Depreciation and amortization | 64,994 | 64,664 | 330 | 0.5 | % | |||||||||
Impairments | 34,376 | 12,618 | 21,758 | NM | ||||||||||
Total expenses | 168,615 | 149,981 | 18,634 | 12.4 | % | |||||||||
(Loss) income from continuing operations before other expenses and income tax expense | (3,193 | ) | 18,376 | (21,569 | ) | NM | ||||||||
Other expense: | ||||||||||||||
Loss on debt extinguishment | (30 | ) | (5,341 | ) | 5,311 | (99.4 | )% | |||||||
Total other expense | (30 | ) | (5,341 | ) | 5,311 | (99.4 | )% | |||||||
(Loss) income from continuing operations before income tax expense | (3,223 | ) | 13,035 | (16,258 | ) | NM | ||||||||
Income tax expense | (165 | ) | (81 | ) | (84 | ) | NM | |||||||
(Loss) income from continuing operations | $ | (3,388 | ) | $ | 12,954 | $ | (16,342 | ) | NM | |||||
Gain on disposition of assets | $ | 16,217 | $ | 10,146 | $ | 6,071 | 59.8 | % | ||||||
NM - Percentages over 100% are not displayed.
REVENUES
Rentals
The decrease in rental revenue for the comparative period was primarily attributable to tenant credit losses. The majority of our nonperforming properties were in the convenience store and movie theater industries. As of March 31, 2017 and 2016, respectively, 57 and 31 of our properties, representing approximately 2.3% and 1.3% of our owned properties, were vacant and not generating rent. Of the 57 vacant properties, 13 were held for sale as of March 31, 2017.
The decrease from tenant credit losses was partially offset by the acquisition of 280 properties representing an investment in real estate of $777.3 million during the twelve-month period ended March 31, 2017. The acquisitions were partially offset by the sale of 237 properties during the same period having an investment value of $660.1 million. Non-cash rentals for the three months ended March 31, 2017 and 2016 were $8.1 million and $7.2 million, respectively. These amounts represent approximately 5.1% and 4.4% of total rental revenue for the three months ended March 31, 2017 and 2016, respectively.
41
Interest income on loans receivable
The decrease in interest income on loans receivable is a result of a decrease in financed properties from 143 at March 31, 2016 to 74 financed properties at March 31, 2017, resulting in a decrease of 37.4% in mortgage loans receivable balances for the comparative period.
Tenant reimbursement income
We have a number of leases that require our tenants to reimburse us for certain property costs we incur. Tenant reimbursement income is driven by the tenant reimbursable property costs described below.
EXPENSES
General and administrative
The year-over-year increase in general and administrative expenses is primarily due to $0.8 million of bad debt expense recorded in the three months ended March 31, 2017 in relation to 15 restaurant-casual dining properties, for which the rent has been determined to be uncollectible. Additionally, there was an increase in compensation and benefit expenses of $0.9 million for the comparable periods.
Property costs
The increase in property costs is primarily due to an increase in non-reimbursable property taxes of $1.2 million which resulted from the increase in vacant properties as compared to the same period a year ago, as well as due to tenant credit losses. Additionally, tenant reimbursables for the three months ended March 31, 2017 were $5.1 million, an increase from $4.6 million for the same period in 2016.
Interest
The decrease in interest expense is primarily due to the extinguishment of $828.4 million of mortgage debt with a weighted average interest rate of 5.9% during the twelve months ended March 31, 2017. This was partially offset by an increase in interest from our Term Loan, which was entered into during November 2015, and our Senior Unsecured Notes, which were issued in August 2016.
The following table summarizes our interest expense on related borrowings:
Three Months Ended March 31, | |||||||
(In Thousands) | 2017 | 2016 | |||||
Interest expense – 2015 Credit Facility (1) | $ | 1,232 | $ | 457 | |||
Interest expense – Term Loan | 2,246 | 1,747 | |||||
Interest expense – Senior Unsecured Notes | 3,338 | — | |||||
Interest expense – mortgages and notes payable | 28,218 | 41,730 | |||||
Interest expense – Convertible Notes | 6,127 | 6,127 | |||||
Non-cash interest expense: | |||||||
Amortization of deferred financing costs | 2,401 | 2,166 | |||||
Amortization of net losses related to interest rate swaps | — | 30 | |||||
Amortization of debt discount, net | 3,061 | 760 | |||||
Total interest expense | $ | 46,623 | $ | 53,017 | |||
(1) Includes facility fees of approximately $0.6 million and $0.4 million for the three months ended March 31, 2017 and March 31, 2016, respectively.
42
Depreciation and amortization
During the twelve months ended March 31, 2017, we acquired 280 properties representing an investment in real estate of $777.3 million and we disposed of 237 properties with a gross investment of $660.1 million. Our net acquisitions during this period were offset by a reduction in our real estate investment value due to impairment charges during the twelve-month period ended March 31, 2017 on properties that remain in our portfolio and a higher real estate value of properties held for sale compared to the prior period. Properties held for sale are no longer depreciated. As a result, depreciation and amortization remained flat. The following table summarizes our depreciation and amortization expense:
Three Months Ended March 31, | |||||||
(In Thousands) | 2017 | 2016 | |||||
Depreciation of real estate assets | $ | 53,663 | $ | 52,679 | |||
Other depreciation | 139 | 93 | |||||
Amortization of lease intangibles | 11,192 | 11,892 | |||||
Total depreciation and amortization | $ | 64,994 | $ | 64,664 | |||
Impairment
Impairment charges for the three months ended March 31, 2017 include $11.9 million on properties held for sale, including $11.3 million on vacant held for sale properties, and $12.6 on vacant properties not classified as held for sale. Impairment charges also include $11.1 million on eight underperforming properties within the drug store/pharmacy, consumer electronics and general merchandise industries.
For the same period in 2016, impairment charges included $5.3 million on two properties within the restaurant-casual dining industry, $2.9 million on a single movie theatre property, $4.7 million in properties held for sale and intangible lease write-offs and a $0.3 million impairment recovery on a loan receivable.
Loss on debt extinguishment
During the three months ended March 31, 2017, we extinguished $49.2 million of mortgage debt related to two loans and recorded a de minimis loss. For the same period in 2016, we extinguished $103.8 million of mortgage debt and recorded a loss on debt extinguishment of $5.3 million.
Gain on disposition of assets
For the three months ended March 31, 2017, the gain on disposition of 57 properties included $7.0 million from the sale of three Shopko properties, $4.5 million on the sale of a multi-tenant property and $4.1 million from the sale of 34 convenience store properties. For the same period in 2016, the gain on disposition of assets included $5.2 million from the sale of five pizza restaurants and $2.2 million from the sale of eight quick service restaurants.
43
Property Portfolio Information
PROPERTY PORTFOLIO DIVERSIFICATION
2,514 | 97.7% | 49 | 431 | 30 |
Properties | Occupancy | States | Tenants | Industries |
Diversification By Tenant
Tenant concentration represents the tenant's contribution to Normalized Rental Revenue of our owned real estate properties as of March 31, 2017:
Tenant (1) | Number of Properties | Total Square Feet (in thousands) | Percent of Normalized Rental Revenue | ||||||
Shopko (Specialty Retail Shops Holding Corp.) | 111 | 7,406 | 8.1 | % | |||||
Walgreen Company | 47 | 689 | 2.6 | ||||||
AMC Entertainment, Inc. | 17 | 862 | 2.3 | ||||||
Church's Chicken (Cajun Global, LLC) | 190 | 269 | 2.1 | ||||||
Circle K (Alimentation Couche-Tard, Inc.) | 83 | 250 | 1.9 | ||||||
Academy Sports + Outdoors (Academy, LTD ) | 6 | 2,769 | 1.9 | ||||||
Albertsons (AB Acquisition, LLC) | 23 | 1,030 | 1.8 | ||||||
CVS Caremark Corporation | 36 | 405 | 1.5 | ||||||
GPM Investments, LLC | 105 | 272 | 1.5 | ||||||
Regal Entertainment Group | 15 | 656 | 1.5 | ||||||
Other | 1,824 | 34,749 | 74.8 | ||||||
Vacant | 57 | 2,682 | — | ||||||
Total | 2,514 | 52,039 | 100.0 | % | |||||
(1) Tenants represent legal entities ultimately responsible for obligations under the lease agreements or affiliated entities. Other tenants may operate the same or similar business concepts or brands set forth above.
Diversification By Asset Type
Asset type concentration represents the type of asset's contribution to Normalized Rental Revenue of our owned real estate properties among different asset types as of March 31, 2017:
Asset Type | Number of Properties | Total Square Feet (in thousands) | ||||
Retail | 2,322 | 39,084 | ||||
Industrial | 73 | 10,709 | ||||
Office | 119 | 2,246 | ||||
Total | 2,514 | 52,039 | ||||
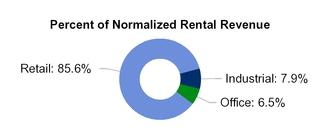
44
Diversification By Industry
Industry concentration represents the industry's contribution to Normalized Rental Revenue of our owned real estate properties as of March 31, 2017:
Industry | Number of Properties | Total Square Feet (in thousands) | Percent of Normalized Rental Revenue | ||||||
General Merchandise | 149 | 8,604 | 9.7 | % | |||||
Restaurants - Casual Dining | 315 | 1,909 | 8.3 | ||||||
Restaurants - Quick Service | 595 | 1,380 | 8.0 | ||||||
Movie Theaters | 62 | 3,114 | 7.2 | ||||||
Convenience Stores | 315 | 1,089 | 7.1 | ||||||
Grocery | 67 | 3,187 | 6.0 | ||||||
Drug Stores / Pharmacies | 109 | 1,527 | 5.2 | ||||||
Medical / Other Office | 122 | 1,295 | 4.9 | ||||||
Health and Fitness | 45 | 1,800 | 4.2 | ||||||
Sporting Goods | 24 | 3,847 | 3.6 | ||||||
Specialty Retail | 37 | 1,926 | 2.9 | ||||||
Entertainment | 24 | 1,159 | 2.7 | ||||||
Automotive Services | 131 | 796 | 2.7 | ||||||
Home Furnishings | 32 | 1,869 | 2.7 | ||||||
Education | 55 | 821 | 2.6 | ||||||
Building Materials | 65 | 2,315 | 2.5 | ||||||
Home Improvement | 15 | 1,666 | 2.4 | ||||||
Apparel | 13 | 1,994 | 2.3 | ||||||
Automotive Dealers | 23 | 665 | 2.3 | ||||||
Car Washes | 40 | 228 | 1.7 | ||||||
Distribution | 11 | 935 | 1.5 | ||||||
Manufacturing | 18 | 2,467 | 1.4 | ||||||
Dollar Stores | 82 | 848 | 1.3 | ||||||
Automotive Parts | 61 | 523 | 1.2 | ||||||
Wholesale Clubs | 5 | 513 | 1.1 | ||||||
Financial Services | 4 | 342 | 1.0 | ||||||
Pet Supplies & Service | 6 | 1,016 | 1.0 | ||||||
Other | 5 | 626 | 0.9 | ||||||
Consumer Electronics | 10 | 505 | 0.9 | ||||||
Office Supplies | 17 | 391 | 0.7 | ||||||
Vacant | 57 | 2,682 | — | ||||||
Total | 2,514 | 52,039 | 100.0 | % | |||||
45
Diversification By Geography
Geographic concentration represents the geographic region's contribution to Normalized Rental Revenue of our owned real estate properties as of March 31, 2017:
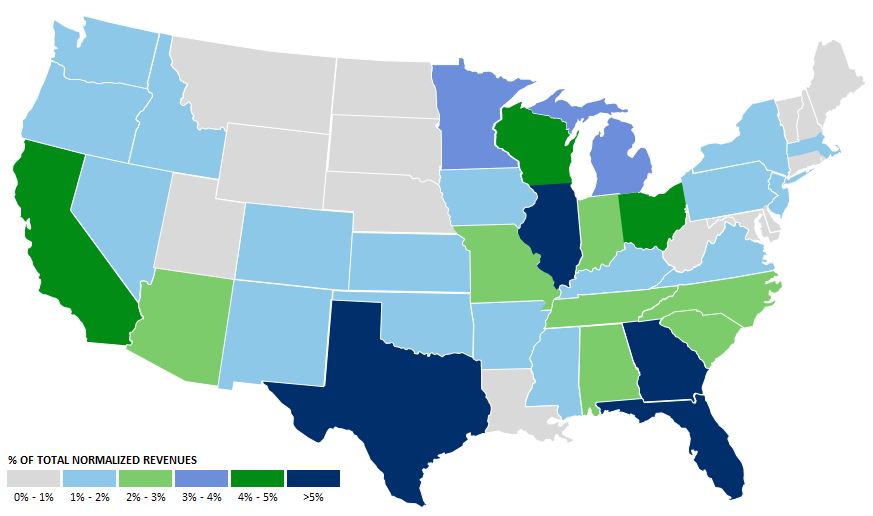
Location | Number of Properties | Total Square Feet (in thousands) | Percent of Normalized Rental Revenue | Location (continued) | Number of Properties | Total Square Feet (in thousands) | Percent of Normalized Rental Revenue | ||||||||||||
Texas | 318 | 6,312 | 12.3 | % | Nevada | 5 | 1,036 | 1.3 | |||||||||||
Georgia | 186 | 3,081 | 6.3 | Arkansas | 52 | 664 | 1.3 | ||||||||||||
Florida | 153 | 1,568 | 5.7 | New Jersey | 15 | 895 | 1.2 | ||||||||||||
Illinois | 118 | 3,260 | 5.5 | Massachusetts | 4 | 1,125 | 1.1 | ||||||||||||
California | 37 | 1,421 | 4.7 | Idaho | 16 | 679 | 1.1 | ||||||||||||
Ohio | 130 | 2,545 | 4.5 | Oregon | 10 | 444 | 1.1 | ||||||||||||
Wisconsin | 51 | 3,376 | 4.1 | Iowa | 35 | 638 | 1.0 | ||||||||||||
Minnesota | 55 | 2,274 | 3.6 | Mississippi | 46 | 422 | 1.0 | ||||||||||||
Michigan | 140 | 1,920 | 3.5 | New Hampshire | 16 | 640 | 0.8 | ||||||||||||
Tennessee | 110 | 1,510 | 3.0 | Louisiana | 25 | 215 | 0.7 | ||||||||||||
Indiana | 80 | 1,243 | 2.8 | Maryland | 19 | 242 | 0.7 | ||||||||||||
Missouri | 93 | 1,405 | 2.8 | Nebraska | 14 | 520 | 0.6 | ||||||||||||
Arizona | 61 | 854 | 2.8 | Connecticut | 5 | 686 | 0.6 | ||||||||||||
South Carolina | 45 | 814 | 2.7 | South Dakota | 9 | 395 | 0.6 | ||||||||||||
North Carolina | 71 | 1,408 | 2.6 | Montana | 7 | 431 | 0.6 | ||||||||||||
Alabama | 109 | 829 | 2.5 | West Virginia | 18 | 297 | 0.5 | ||||||||||||
Virginia | 60 | 1,358 | 1.9 | Utah | 8 | 615 | 0.4 | ||||||||||||
Colorado | 35 | 1,050 | 1.9 | Maine | 26 | 79 | 0.4 | ||||||||||||
Kansas | 40 | 851 | 1.8 | North Dakota | 5 | 236 | 0.3 | ||||||||||||
Pennsylvania | 55 | 1,119 | 1.6 | Rhode Island | 4 | 117 | 0.3 | ||||||||||||
New Mexico | 38 | 548 | 1.6 | Wyoming | 9 | 186 | 0.2 | ||||||||||||
Oklahoma | 68 | 622 | 1.6 | Alaska | 5 | 63 | 0.1 | ||||||||||||
Kentucky | 49 | 635 | 1.5 | Virgin Islands | 1 | 38 | 0.1 | ||||||||||||
Washington | 16 | 628 | 1.4 | Delaware | 1 | 5 | — | ||||||||||||
New York | 39 | 738 | 1.3 | Vermont | 2 | 2 | — | ||||||||||||
46
Lease Expirations
The following table sets forth a summary schedule of expiration dates for leases in place as of March 31, 2017. As of March 31, 2017, the weighted average remaining non-cancelable initial term of our leases (based on Normalized Rental Revenue) was 10.6 years. The information set forth in the table assumes that tenants do not exercise renewal options and or any early termination rights:
Leases Expiring In: | Number of Properties | Normalized Rental Revenue Annualized (in thousands) (1) | Total Square Feet (in thousands) | Percent of Normalized Rental Revenue | |||||||||
Remainder of 2017 | 53 | $ | 15,751 | 1,940 | 2.5 | % | |||||||
2018 | 69 | 21,862 | 1,519 | 3.4 | |||||||||
2019 | 106 | 21,791 | 1,917 | 3.4 | |||||||||
2020 | 74 | 20,783 | 1,586 | 3.2 | |||||||||
2021 | 187 | 44,484 | 3,805 | 7.0 | |||||||||
2022 | 110 | 29,656 | 2,502 | 4.7 | |||||||||
2023 | 110 | 33,860 | 3,466 | 5.3 | |||||||||
2024 | 58 | 20,410 | 1,187 | 3.2 | |||||||||
2025 | 77 | 36,513 | 2,080 | 5.7 | |||||||||
2026 | 199 | 46,880 | 5,216 | 7.4 | |||||||||
2027 and thereafter | 1,414 | 345,698 | 24,139 | 54.2 | |||||||||
Vacant | 57 | — | 2,682 | — | |||||||||
Total owned properties | 2,514 | $ | 637,688 | 52,039 | 100.0 | % | |||||||
(1) Normalized Rental Revenues for the month ended March 31, 2017 for properties owned at March 31, 2017 multiplied by twelve.
Liquidity and Capital Resources
SHARE REPURCHASE PROGRAM
In February 2016, Spirit's Board of Directors authorized a share repurchase program, under which the Company may repurchase up to $200.0 million of its outstanding common stock. These purchases can be made in the open market or through private transactions from time to time over the 18 month period following authorization, depending on prevailing market conditions and applicable legal and regulatory requirements. Purchase activity will be dependent on various factors, including the Company's capital position, operating results, funds generated by asset sales, dividends that may be required by those sales, and investment options that may be available, including acquiring new properties or retiring debt. The share repurchase program does not obligate the Company to repurchase any specific number of shares and may be suspended at any time at the Company's discretion. As of May 3, 2017, no purchases have been made.
SHORT-TERM LIQUIDITY AND CAPITAL RESOURCES
On a short-term basis, our principal demands for funds are for financing of acquisitions, distributions to stockholders, payment of interest and principal on our indebtedness and operating expenses (including property improvements and re-leasing costs). We expect to fund these demands primarily through cash provided by operating activities and borrowings under the 2015 Credit Facility. As of March 31, 2017, $671.0 million borrowing capacity was available under the 2015 Credit Facility.
LONG-TERM LIQUIDITY AND CAPITAL RESOURSES
We plan to meet our long-term capital needs, including long-term financing of property acquisitions, by issuing registered debt or equity securities, obtaining asset level financing and occasionally by issuing fixed rate secured or unsecured notes and bonds.
We have a shelf registration statement on file with the SEC under which we may offer shares of our common stock from time to time in amounts, at prices and on terms to be announced when and if such shares are offered. We may
47
issue common stock when we believe our share price is at a level that allows for any offering proceeds to be accretively invested into additional properties or to permanently finance properties that were initially financed by our 2015 Credit Facility, Term Loan or other indebtedness.
In the future, some of our property acquisitions could be made by exchanging partnership units in our Operating Partnership for property owned by third parties. These partnership units would be exchangeable for cash or, at our election, shares of our common stock.
We continually evaluate alternative financing and believe that we can obtain financing on reasonable terms. However, we cannot assure that we will have access to the capital markets at times and on terms that are acceptable to us.
DESCRIPTION OF CERTAIN DEBT
The following descriptions of debt should be read in conjunction with footnote 4 to the combined, consolidated financial statements herein.
Spirit Master Funding Program
The Spirit Master Funding Program is an asset-backed securitization platform through which we raise capital by issuing non-recourse net lease mortgage notes collateralized by commercial real estate, net leases and mortgage loans. The commercial real estate is managed by the Company in our capacity as property manager. Rental and mortgage receipts with respect to the leases and mortgage loans are deposited with the indenture trustee, who first utilizes these funds to satisfy the debt service requirements on the notes and any fees and costs of administration of the Spirit Master Funding Program. Any remaining funds are remitted to the issuers on the monthly note payment date.
Upon satisfaction of certain conditions, we may, from time to time, sell or exchange real estate properties or mortgage loans from the Collateral Pools. Proceeds from the sale of these assets are held on deposit by the indenture trustee until a qualifying substitution is made or the amounts are distributed as an early repayment of principal. At March 31, 2017, $30.4 million was held on deposit and classified as restricted cash within deferred costs and other assets, net in our consolidated balance sheets.
The Spirit Master Funding Program consists of two separate securitization trusts that have one or multiple bankruptcy-remote, special purpose entities as issuers of the Master Trust 2013 and Master Trust 2014 notes. Each issuer is an indirect wholly-owned subsidiary of ours. All outstanding series of Master Trust Notes were rated investment grade as of March 31, 2017.
The Master Trust Notes as of March 31, 2017 are summarized below (principal in thousands):
Stated Rates (1) | Maturity | March 31, 2017 | December 31, 2016 | ||||||||||
(in Years) | (in Thousands) | ||||||||||||
Series 2014-1 Class A1 | 5.1 | % | 3.2 | $ | 51,036 | $ | 53,919 | ||||||
Series 2014-1 Class A2 | 5.4 | % | 3.3 | 253,300 | 253,300 | ||||||||
Series 2014-2 | 5.8 | % | 4.0 | 225,404 | 226,283 | ||||||||
Series 2014-3 | 5.7 | % | 5.0 | 311,701 | 311,820 | ||||||||
Series 2014-4 Class A1 | 3.5 | % | 2.8 | 150,000 | 150,000 | ||||||||
Series 2014-4 Class A2 | 4.6 | % | 12.8 | 360,000 | 360,000 | ||||||||
Total Master Trust 2014 notes | 5.1 | % | 6.3 | 1,351,441 | 1,355,322 | ||||||||
Series 2013-1 Class A | 3.9 | % | 1.7 | 125,000 | 125,000 | ||||||||
Series 2013-2 Class A | 5.3 | % | 6.7 | 191,238 | 192,384 | ||||||||
Total Master Trust 2013 notes | 4.7 | % | 4.7 | 316,238 | 317,384 | ||||||||
Total Master Trust notes | 1,667,679 | 1,672,706 | |||||||||||
Debt discount, net | (17,737 | ) | (18,787 | ) | |||||||||
Deferred financing costs, net | (15,607 | ) | (16,376 | ) | |||||||||
Total Master Trust Notes, net | $ | 1,634,335 | $ | 1,637,543 | |||||||||
(1) Represents the individual series stated interest rate as of March 31, 2017 and the weighted average stated rate of the total Master Trust Notes, based on the collective series outstanding principal balances as of March 31, 2017.
48
Convertible Notes
The Convertible Notes are comprised of two series of notes: $402.5 million aggregate principal amount of 2.875% convertible notes maturing on May 15, 2019 and $345.0 million aggregate principal amount of 3.75% convertible notes maturing on May 15, 2021. Interest on the Convertible Notes is payable semiannually in arrears on May 15 and November 15 of each year. As of March 31, 2017, the carrying amount of the Convertible Notes was $705.9 million, which is net of discounts (for the value of the embedded conversion feature) and unamortized deferred financing costs.
Holders may convert notes of either series prior to November 15, 2018, in the case of the 2019 Notes, or November 15, 2020, in the case of the 2021 Notes, only under specific circumstances. On or after November 15, 2018, in the case of the 2019 Notes, or November 15, 2020, in the case of the 2021 Notes, until the close of business on the second scheduled trading day immediately preceding the maturity date of the Convertible Notes, holders may convert the Convertible Notes of the applicable series at any time, regardless of the foregoing circumstances. If we undergo a fundamental change (as defined in the Convertible Notes supplemental indentures), holders may require us to repurchase all or any portion of their notes at a repurchase price equal to 100% of the principal amount of the notes to be repurchased, plus accrued and unpaid interest. Upon conversion, we will pay or deliver cash, shares of common stock or a combination of cash and shares of common stock, at our election. As of March 31, 2017, the conversion rate was 76.9167 per $1,000 principal note.
2015 Credit Facility
As of March 31, 2017, the borrowing capacity under the 2015 Credit Facility was $800.0 million, which may be increased up to $1.0 billion by exercising an accordion feature, subject to satisfying certain requirements and obtaining additional lender commitments. The 2015 Credit Facility also includes a $50.0 million sub-limit for swing-line loans and up to $60.0 million available for issuances of letters of credit. Swing-line loans and letters of credit reduce availability under the 2015 Credit Facility on a dollar-for-dollar basis. As of March 31, 2017, the 2015 Credit Facility bore interest at LIBOR plus 1.25% based on our credit rating and incurred a facility fee of 0.25% per annum. As of March 31, 2017, $129.0 million borrowings were outstanding and $671.0 million of borrowing capacity was available under the 2015 Credit Facility.
Amounts available for borrowing under the 2015 Credit Facility remain subject to compliance with certain customary restrictive covenants. As of March 31, 2017, the Corporation and the Operating Partnership were in compliance with these covenants.
Term Loan
As of March 31, 2017, the borrowing capacity under the Term Loan was $420.0 million and may be increased up to $600.0 million by exercising an accordion feature, subject to obtaining additional lender commitments. The Term Loan has an initial maturity date of November 2, 2018, which may be extended at our option pursuant to two one-year extension options, subject to the satisfaction of certain conditions and payment of an extension fee. As of March 31, 2017, the Term Loan bore interest at LIBOR plus 1.35% based on our credit rating and the Term Loan was fully drawn.
Amounts available for borrowing under the Term Loan remain subject to compliance with certain customary restrictive covenants. As of March 31, 2017, the Corporation and the Operating Partnership were in compliance with these financial covenants.
Senior Unsecured Notes
The Senior Unsecured Notes of the Operating Partnership have an aggregate principal amount of $300.0 million and are guaranteed by the Corporation. The Senior Unsecured Notes accrue interest at a rate of 4.45% per year, payable on March 15 and September 15 of each year, until the maturity date of September 15, 2026. We filed a registration statement in March 2017 (as amended in April 2017), under which the Senior Unsecured Notes may be exchanged for publicly registered notes with substantially identical terms.
The Senior Unsecured Notes are redeemable in whole at any time or in part from time to time, at the Operating Partnership’s option, at a redemption price equal to the sum of: an amount equal to 100% of the principal amount of the Senior Unsecured Notes to be redeemed plus accrued and unpaid interest and liquidated damages, if any, up to, but not including, the redemption date; and a make-whole premium calculated in accordance with the indenture. Notwithstanding the foregoing, if any of the Senior Unsecured Notes are redeemed on or after June 15, 2026, the redemption price will not include a make-whole premium.
49
In connection with the issuance of the Senior Unsecured Notes, the Corporation and the Operating Partnership remain subject to compliance with certain customary restrictive covenants. As of March 31, 2017, the Corporation and the Operating Partnership were in compliance with these financial covenants.
CMBS
We may use long-term, fixed-rate debt to finance our properties on a “match-funded” basis. In such events, we generally seek to use asset level financing that bears annual interest less than the annual rent on the related lease(s) and that matures prior to the expiration of such lease(s). In general, the obligor of our asset level debt is a special purpose entity that holds the real estate and other collateral securing the indebtedness. Each special purpose entity is a bankruptcy remote separate legal entity, and is the sole owner of its assets and solely responsible for its liabilities other than typical non-recurring covenants.
As of March 31, 2017, we had 21 fixed rate CMBS loans with $478.7 million of outstanding principal, a weighted average contractual interest rate of 5.6% and a weighted average maturity of 3.9 years. Approximately 53% of this debt is partially amortizing and requires a balloon payment at maturity. These balances include two CMBS fixed-rate loans that are in default, discussed further below. The following table shows the outstanding principal of the CMBS fixed-rate loans excluding the defaulted loans as of March 31, 2017 (dollars in thousands):
Year of Maturity | Number of Loans | Number of Properties | Stated Interest Rate Range | Weighted Average Stated Rate | Scheduled Principal | Balloon | Total | ||||||||||||||||
Remainder of 2017 | 8 | 8 | 5.53% - 6.52% | 5.78 | % | $ | 3,118 | $ | 112,142 | $ | 115,260 | ||||||||||||
2018 | 4 | 10 | 3.90% - 4.65% | 4.03 | % | 3,854 | 57,779 | 61,633 | |||||||||||||||
2019 | 1 | 5 | 4.61% | 3.32 | % | 3,905 | 10,000 | 13,905 | |||||||||||||||
2020 | — | — | — | — | 4,100 | — | 4,100 | ||||||||||||||||
2021 | — | — | — | — | 4,365 | — | 4,365 | ||||||||||||||||
Thereafter | 6 | 100 | 4.67% - 6.00% | 5.75 | % | 11,891 | 240,381 | 252,272 | |||||||||||||||
Total | 19 | 123 | 5.34 | % | $ | 31,233 | $ | 420,302 | $ | 451,535 | |||||||||||||
CMBS Liquidity Matters
As of March 31, 2017, we are in default on two CMBS fixed-rate loans due to the underperformance of the four properties securing the loans. The aggregate principal balance under the defaulted loans was $27.2 million, including $10.1 million of accrued interest. We believe the value of the four properties is less than the related debt. As a result, we have notified the lender of the special purpose entity that we anticipate either surrendering these properties to the lender or selling them in exchange for relieving the indebtedness, including any accrued interest, encumbering the properties.
The following table provides key elements of the defaulted mortgage loans as of March 31, 2017 (dollars in thousands):
Industry | Properties | Net Book Value | Monthly Base Rent | Pre-Default Outstanding Principal | Capitalized interest | Total Debt Outstanding | Restricted Cash (2) | Stated Rate | Default Rate | Accrued Interest (1) | |||||||||||||||||||||||||||
Manufacturing | 3 | $ | 20,751 | $ | — | $ | 10,730 | $ | 10,021 | $ | 20,751 | $ | — | 5.85 | % | 9.85 | % | $ | 176 | ||||||||||||||||||
Sporting Goods | 1 | 6,402 | — | 6,321 | 81 | 6,402 | 293 | 5.62 | % | 10.62 | % | 59 | |||||||||||||||||||||||||
Total | 4 | $ | 27,153 | $ | — | $ | 17,051 | $ | 10,102 | $ | 27,153 | $ | 293 | — | % | — | % | $ | 235 | ||||||||||||||||||
(1) Interest capitalized to principal that remains unpaid.
(2) Represents restricted cash controlled by the lender that may be applied to reduce the outstanding principal balance.
50
DEBT MATURITIES
Future principal payments due on our various types of debt outstanding as of March 31, 2017 (in thousands):
Total | Remainder of 2017 | 2018 | 2019 | 2020 | 2021 | Thereafter | ||||||||||||||||||||||
2015 Credit Facility | $ | 129,000 | $ | — | $ | — | $ | 129,000 | $ | — | $ | — | $ | — | ||||||||||||||
Term Loan (1) | 420,000 | — | 420,000 | — | — | — | — | |||||||||||||||||||||
Senior Unsecured Notes | 300,000 | — | — | — | — | — | 300,000 | |||||||||||||||||||||
Master Trust Notes | 1,667,679 | 16,866 | 163,262 | 40,420 | 448,202 | 236,046 | 762,883 | |||||||||||||||||||||
CMBS - fixed-rate (2) | 478,687 | 142,413 | 61,632 | 13,905 | 4,100 | 4,365 | 252,272 | |||||||||||||||||||||
Convertible Notes | 747,500 | — | — | 402,500 | — | 345,000 | — | |||||||||||||||||||||
$ | 3,742,866 | $ | 159,279 | $ | 644,894 | $ | 585,825 | $ | 452,302 | $ | 585,411 | $ | 1,315,155 | |||||||||||||||
(1) 2018 includes $420 million unsecured Term Loan that is extendible at borrower's option pursuant to two one-year extension options.
(2) The CMBS - fixed-rate payment balance in 2017 includes $27.2 million, including $10.1 million of capitalized interest, for the acceleration of principal payable following an event of default under two CMBS fixed-rate loans with stated maturities in 2017.
CONTRACTUAL OBLIGATIONS
There were no material changes outside the ordinary course of business to the information regarding specified contractual obligations contained in our Annual Report on Form 10-K for the year ended December 31, 2016, as filed with the SEC.
We may enter into commitments to purchase goods and services in connection with the operations of our properties. Those commitments generally have terms of one-year or less and reflect expenditure levels comparable to our historical expenditures.
DISTRIBUTION POLICY
Distributions from our current or accumulated earnings and profits are generally classified as ordinary income, whereas distributions in excess of our current and accumulated earnings and profits, to the extent of a stockholder’s federal income tax basis in our common stock, are generally characterized as a return of capital. Distributions in excess of a stockholder’s federal income tax basis in our common stock are generally characterized as capital gain.
We are required to distribute 90% of our taxable income (subject to certain adjustments and excluding net capital gains) on an annual basis to maintain qualification as a REIT for federal income tax purposes and are required to pay federal income tax at regular corporate rates to the extent we distribute less than 100% of our taxable income (including capital gains).
We intend to make distributions that will enable us to meet the distribution requirements applicable to REITs and to eliminate or minimize our obligation to pay corporate-level federal income and excise taxes.
Any distributions will be at the sole discretion of our board of directors, and their form, timing and amount, if any, will depend upon a number of factors, including our actual and projected results of operations, FFO, liquidity, cash flows and financial condition, the revenue we actually receive from our properties, our operating expenses, our debt service requirements, our capital expenditures, prohibitions and other limitations under our financing arrangements, our REIT taxable income, the annual REIT distribution requirements, applicable laws and such other factors as our board of directors deems relevant.
51
Cash Flows
The following table presents a summary of our cash flows for the three months ended March 31, 2017 and March 31, 2016, respectively:
Three Months Ended March 31, | |||||||||||
2017 | 2016 | Change | |||||||||
(in Thousands) | |||||||||||
Net cash provided by operating activities | $ | 96,259 | $ | 89,635 | $ | 6,624 | |||||
Net cash (used in) provided by investing activities | (32,049 | ) | 24,779 | (56,828 | ) | ||||||
Net cash used in financing activities | (64,960 | ) | (127,212 | ) | 62,252 | ||||||
Net decrease in cash and cash equivalents | $ | (750 | ) | $ | (12,798 | ) | $ | 12,048 | |||
As of March 31, 2017, we had $9.3 million of cash and cash equivalents as compared to $10.1 million as of December 31, 2016.
Operating Activities
Our cash flows from operating activities are primarily dependent upon the occupancy level of our portfolio, the rental rates specified in our leases, the collectability of rent and the level of our operating expenses and other general and administrative costs.
The increase in net cash provided by operating activities was primarily attributable to net changes in operating assets and liabilities of $6.6 million and decreases in cash paid for interest of $2.6 million and restructuring charge payments of $1.7 million. This was partially offset by a reduction in cash revenue of $2.7 million, driven by tenant credit losses and the timing of acquisitions and dispositions.
Investing Activities
Cash used in investing activities is generally used to fund property acquisitions, for investments in loans receivable and, to a lessor extent, for capital expenditures. Cash provided by investing activities generally relates to the disposition of real estate and other assets.
Net cash used by investing activities during the three months ended March 31, 2017 included $135.6 million to fund the acquisition of 26 properties and capitalized real estate expenditures of $13.3 million, partially offset by cash proceeds of $134.7 million from the disposition of 57 properties. Net cash provided by investing activities also includes the collections of principal on loans receivable and real estate assets under direct financing leases totaling $1.2 million.
During the same period in 2016, net cash provided by investing activities included proceeds of $89.3 million from the disposition of 33 properties (4 of which were disposed of through a $21.0 million 1031 Exchange) partially offset by $72.5 million to fund the acquisition of 15 properties (10 of which were acquired through a $60.9 million non-cash 1031 Exchange) and capitalized real estate expenditures of $3.6 million. Net cash provided by investing activities also included the release of sales proceeds from restricted cash accounts of $30.6 million and collections of principal on loans receivable and real estate assets under direct financing leases totaling $2.2 million.
Financing Activities
Generally, our net cash used in and provided by financing activities is impacted by our net borrowings and common stock offerings, including sales of our common stock under our ATM Program, common stock offerings, borrowings under our 2015 Credit Facility and Term Loan, and issuances of net-lease mortgage notes under our Spirit Master Funding Program.
Net cash used in financing activities during the three months ended March 31, 2017 was primarily attributable to the repayment of our indebtedness of $19.3 million and the payment of dividends to equity owners of $87.2 million, both of which were paid primarily through sources from our operating cash flows and net borrowings under our 2015 Credit Facility. These amounts were partially offset by net borrowings under our 2015 Credit Facility of $43.0 million.
During the same period in 2016, net cash used in financing activities was primarily attributable to repayment of our indebtedness of $96.7 million and the payment of dividends to equity owners of $77.4 million, both of which were paid primarily through operating cash flows. These amounts were partially offset by the issuance and sale of 1.3 million
52
shares of our common stock in an underwritten public offering and the sale of 6.6 million shares of our common stock under our ATM Program for aggregate net proceeds of $13.9 million, and net borrowings under our 2015 Credit Facility and Term Loan of $24.0 million and $9.0 million, respectively.
Off-Balance Sheet Arrangements
As of March 31, 2017, we did not have any material off-balance sheet arrangements.
New Accounting Pronouncements
See footnote 2 to the consolidated financial statements herein.
Non-GAAP Financial Measures
FFO AND AFFO
We calculate FFO in accordance with the standards established by NAREIT. FFO represents net income (loss) attributable to common stockholders (computed in accordance with GAAP), excluding real estate-related depreciation and amortization, impairment charges and net losses (gains) from property dispositions. FFO is a supplemental non-GAAP financial measure. We use FFO as a supplemental performance measure because we believe that FFO is beneficial to investors as a starting point in measuring our operational performance. Specifically, in excluding real estate related depreciation and amortization, gains and losses from property dispositions and impairment charges, which do not relate to or are not indicative of operating performance, FFO provides a performance measure that, when compared year-over-year, captures trends in occupancy rates, rental rates and operating costs. We also believe that, as a widely recognized measure of the performance of equity REITs, FFO will be used by investors as a basis to compare our operating performance with that of other equity REITs. However, because FFO excludes depreciation and amortization and does not capture the changes in the value of our properties that result from use or market conditions, all of which have real economic effects and could materially impact our results from operations, the utility of FFO as a measure of our performance is limited. In addition, other equity REITs may not calculate FFO as we do, and, accordingly, our FFO may not be comparable to such other equity REITs’ FFO. Accordingly, FFO should be considered only as a supplement to net income (loss) attributable to common stockholders as a measure of our performance.
AFFO is a non-GAAP financial measure of operating performance used by many companies in the REIT industry. Accordingly, AFFO should be considered only as a supplement to net income (loss) attributable to common stockholders as a measure of our performance. We adjust FFO to eliminate the impact of certain items that we believe are not indicative of our core operating performance, including restructuring costs, other general and administrative costs associated with relocation of our headquarters, default interest on non-recourse mortgage indebtedness, debt extinguishment gains (losses), transaction costs incurred in connection with the acquisition of real estate investments subject to existing leases and certain non-cash items. These certain non-cash items include non-cash revenues (comprised of straight-line rents, amortization of above and below market rent on our leases, amortization of lease incentives, amortization of net premium (discount) on loans receivable and amortization of capitalized lease transaction costs), non-cash interest expense (comprised of amortization of deferred financing costs and amortization of net debt discount/premium) and non-cash compensation expense (stock-based compensation expense). In addition, other equity REITs may not calculate AFFO as we do, and, accordingly, our AFFO may not be comparable to such other equity REITs' AFFO. AFFO does not represent cash generated from operating activities determined in accordance with GAAP, is not necessarily indicative of cash available to fund cash needs and should not be considered as an alternative to net income determined in accordance with GAAP as a performance measure. A reconciliation of our FFO and AFFO to net income (loss) attributable to common stockholders (computed in accordance with GAAP) is included in the financial information accompanying this report.
53
Adjusted EBITDA and Annualized Adjusted EBITDA
Adjusted EBITDA represents EBITDA modified to include other adjustments to GAAP net income (loss) attributable to common stockholders for restructuring charges, real estate acquisition costs, impairment losses, gains/losses from the sale of real estate and debt transactions and other items that we do not consider to be indicative of our on-going operating performance. We focus our business plans to enable us to sustain increasing shareholder value. Accordingly, we believe that excluding these items, which are not key drivers of our investment decisions and may cause short-term fluctuations in net income, provides a useful supplemental measure to investors and analysts in assessing the net earnings contribution of our real estate portfolio. Because these measures do not represent net income (loss) that is computed in accordance with GAAP, they should not be considered alternatives to net income (loss) or as an indicator of financial performance. A reconciliation of net income (loss) attributable to common stockholders (computed in accordance with GAAP) to EBITDA, Adjusted EBITDA and Annualized Adjusted EBITDA is included in the financial information accompanying this report.
Adjusted Debt
Adjusted Debt represents interest bearing debt (reported in accordance with GAAP) adjusted to exclude unamortized debt discount/premium and deferred financing costs, as further reduced by cash and cash equivalents and cash reserves on deposit with lenders as additional security. By excluding unamortized debt discount/premium and deferred financing costs, cash and cash equivalents, and cash reserves on deposit with lenders as additional security, the result provides an estimate of the contractual amount of borrowed capital to be repaid, net of cash available to repay it. We believe this calculation constitutes a beneficial supplemental non-GAAP financial disclosure to investors in understanding our financial condition.
Adjusted Debt to Annualized Adjusted EBITDA is a supplemental non-GAAP financial measure we use to evaluate the level of borrowed capital being used to increase the potential return of our real estate investments, and a proxy for a measure we believe is used by many lenders and ratings agencies to evaluate our ability to repay and service our debt obligations over time. We believe the ratio is a beneficial disclosure to investors as a supplemental means of evaluating our ability to meet obligations senior to those of our equity holders. Our computation of this ratio may differ from the methodology used by other equity REITs, and, therefore, may not be comparable to such other REITs. A reconciliation of interest bearing debt (reported in accordance with GAAP) to Adjusted Debt is included in the financial information accompanying this report.
Initial Cash Yield
We calculate initial cash yield from properties by dividing the annualized first month base rent (excluding any future rent escalations provided for in the lease) by the gross investment in the related properties. Gross investment for an acquired property represents gross acquisition costs including the contracted purchase price and related capitalized transaction costs. Initial cash yield is a measure (expressed as a percentage) of the contractual cash rent expected to be earned on an acquired property in the first year. Because it excludes any future rent increases or additional rent that may be contractually provided for in the lease, as well as any other income or fees that may be earned from lease modifications or asset dispositions, initial cash yield does not represent the annualized investment rate of return of our acquired properties. Additionally, actual contractual cash rent earned from the properties acquired may differ from the initial cash yield based on other factors, including difficulties collecting anticipated rental revenues and unanticipated expenses at these properties that we cannot pass on to tenants, as well as the risk factors set forth in our Annual Report on Form 10-K for the year ended December 31, 2016.
Capitalization Rate
We calculate the capitalization rate for disposed properties as the annualized cash rent on the date of disposition divided by the gross sales price. For multi-tenant properties, non-reimbursable property costs are deducted from the annualized cash rent prior to computing the capitalization rate. Annualized cash rent for a disposed property represents the annualized monthly contractual cash rent under the related lease at time of disposition.
54
FFO and AFFO
The following is a reconciliation of net income attributable to common stockholders (which we believe is the most comparable GAAP measure) to FFO and AFFO. Also presented is information regarding distributions paid to common stockholders and the weighted average shares of common stock outstanding used for the basic and diluted computations per share (dollars in thousands, except per share amounts):
Three Months Ended March 31, | |||||||
2017 | 2016 | ||||||
(Unaudited) | |||||||
Net income attributable to common stockholders | $ | 12,829 | $ | 23,100 | |||
Add/(less): | |||||||
Portfolio depreciation and amortization | 64,857 | 64,571 | |||||
Portfolio impairments | 34,376 | 12,938 | |||||
Realized gains on sales of real estate | (16,217 | ) | (10,146 | ) | |||
Total adjustments to net income | 83,016 | 67,363 | |||||
FFO | $ | 95,845 | $ | 90,463 | |||
Add/(less): | |||||||
Loss on debt extinguishment | 30 | 5,341 | |||||
Restructuring charges | — | 649 | |||||
Other costs included in general and administrative associated with headquarters relocation | — | 812 | |||||
Real estate acquisition costs | 153 | 57 | |||||
Non-cash interest expense | 5,461 | 2,956 | |||||
Accrued interest and fees on defaulted loans | 674 | 1,855 | |||||
Non-cash revenues, net | (6,390 | ) | (6,587 | ) | |||
Non-cash compensation expense | 2,246 | 2,305 | |||||
Total adjustments to FFO | 2,174 | 7,388 | |||||
AFFO | $ | 98,019 | $ | 97,851 | |||
Dividends declared to common stockholders | $ | 87,122 | $ | 77,601 | |||
Net income per share of common stock | |||||||
Basic (1) | $ | 0.03 | $ | 0.05 | |||
Diluted (1) | $ | 0.03 | $ | 0.05 | |||
FFO per share of common stock | |||||||
Diluted (1) | $ | 0.20 | $ | 0.20 | |||
AFFO per share of common stock | |||||||
Diluted (1) | $ | 0.20 | $ | 0.22 | |||
Weighted average shares of common stock outstanding: | |||||||
Basic | 482,607,198 | 441,365,927 | |||||
Diluted | 482,609,096 | 441,368,407 | |||||
(1) For the three months ended March 31, 2017 and 2016, dividends paid to unvested restricted stockholders of $0.2 million and $0.1 million, respectively, are deducted from net income, FFO and AFFO attributable to common stockholders in the computation of per share amounts (see footnote 12 to the combined, consolidated financial statements herein).
55
Adjusted Debt, Adjusted EBITDA and Annualized Adjusted EBITDA - Leverage
The following provides a calculation of adjusted debt and a reconciliation of EBITDA and annualized adjusted EBITDA (dollars in thousands):
March 31, | |||||||
2017 | 2016 | ||||||
(Unaudited) | |||||||
2015 Credit Facility | $ | 129,000 | $ | 24,000 | |||
Term Loan, net | 418,672 | 332,019 | |||||
Unsecured Senior Notes, net | 295,169 | — | |||||
Mortgages and notes payable, net | 2,109,117 | 2,969,893 | |||||
Convertible Notes, net | 705,899 | 693,173 | |||||
3,657,857 | 4,019,085 | ||||||
Add/(less): | |||||||
Unamortized debt discount, net | 49,923 | 51,707 | |||||
Unamortized deferred financing costs | 35,086 | 39,779 | |||||
Cash and cash equivalents | (9,309 | ) | (8,992 | ) | |||
Cash reserves on deposit with lenders as additional security classified as other assets | (12,326 | ) | (23,789 | ) | |||
Total adjustments | 63,374 | 58,705 | |||||
Adjusted Debt | $ | 3,721,231 | $ | 4,077,790 | |||
Three Months Ended March 31, | |||||||
2017 | 2016 | ||||||
(Unaudited) | |||||||
Net income attributable to common stockholders | $ | 12,829 | $ | 23,100 | |||
Add/(less): | |||||||
Interest | 46,623 | 53,017 | |||||
Depreciation and amortization | 64,994 | 64,664 | |||||
Income tax expense | 165 | 81 | |||||
Total adjustments | 111,782 | 117,762 | |||||
EBITDA | $ | 124,611 | $ | 140,862 | |||
Add/(less): | |||||||
Restructuring charges | — | 649 | |||||
Other costs in general and administrative associated with headquarters relocation | — | 812 | |||||
Real estate acquisition costs | 153 | 57 | |||||
Impairments on real estate assets | 34,376 | 12,938 | |||||
Realized gain on sales of real estate | (16,217 | ) | (10,146 | ) | |||
Loss on debt extinguishment | 30 | 5,341 | |||||
Total adjustments to EBITDA | 18,342 | 9,651 | |||||
Adjusted EBITDA | $ | 142,953 | $ | 150,513 | |||
Annualized Adjusted EBITDA (1) | $ | 571,812 | $ | 602,052 | |||
Adjusted Debt / Annualized Adjusted EBITDA | 6.5 | x | 6.8 | x | |||
(1) Adjusted EBITDA of the current quarter multiplied by 4. | |||||||
56
Item 3. Quantitative and Qualitative Disclosures About Market Risk
We are exposed to financial market risks, especially interest rate risk. Interest rates and other factors, such as occupancy, rental rates and the financial condition of our tenants, influence our performance more so than does inflation. Changes in interest rates do not necessarily correlate with inflation rates or changes in inflation rates. As described in Item 2, we generally offer leases that provide for payments of base rent with scheduled increases and, to a lesser extent, contingent rent based on a percentage of the tenant’s gross sales to help mitigate the effect of inflation. Because the properties in our portfolio are generally leased to tenants under triple-net leases, our exposure to rising property operating costs due to inflation is mitigated.
Interest rates are highly sensitive to many factors, including governmental monetary policies and domestic and global economic and political conditions, which are beyond our control. Our operating results depend heavily on the difference between the revenue from our assets and the interest expense incurred on our borrowings. We may incur additional variable rate debt in the future, including amounts that we may borrow under our 2015 Credit Facility and Term Loan. In addition, decreases in interest rates may lead to additional competition for the acquisition of real estate due to a reduction in desirable alternative income-producing investments, which may lead to a decrease in the yields on real estate we have targeted for acquisition. In such circumstances, if we are not able to offset the decrease in yields by obtaining lower interest costs on our borrowings, our results of operations will be adversely affected. Significant increases in interest rates may also have an adverse impact on our earnings if we are unable to acquire real estate with rental rates high enough to offset the increase in interest rates on our borrowings.
In the event interest rates rise significantly or there is an economic downturn, defaults may increase and result in credit losses, which may adversely affect our liquidity and operating results. In a decreasing interest rate environment, borrowers are generally more likely to prepay their loans in order to obtain financing at lower interest rates. However, the vast majority of our mortgage notes payable have prepayment clauses that make refinancing during a decreasing interest rate environment uneconomical. Investments in our mortgage loans receivable, however, have significant prepayment protection in the form of yield maintenance provisions, which provide us with substantial yield protection in a decreasing interest rate environment with respect to this portion of our investment portfolio.
The objective of our interest rate risk management policy is to match fund fixed-rate assets with fixed-rate liabilities. As of March 31, 2017, our assets were primarily long-term, fixed-rate leases (though most have scheduled rental increases during the terms of the leases). As of March 31, 2017, $3.2 billion of our indebtedness was fixed-rate, consisting of our Master Trust Notes, fixed-rate CMBS loans, Senior Unsecured Notes and Convertible Notes, with a weighted average stated interest rate of 4.65%, excluding amortization of deferred financing costs and debt discounts/premiums. As of March 31, 2017, $549.0 million of our indebtedness was variable-rate, consisting of our 2015 Credit Facility and Term Loan, with a weighted average stated interest rate of 2.29%, excluding amortization of deferred financing costs and debt discounts/premiums. If one-month LIBOR as of March 31, 2017 increased by 100 basis points, or 1.0%, the resulting increase in annual interest expense with respect to the $420.0 million outstanding under the Term Loan would impact our future earnings and cash flows by $5.5 million.
The estimated fair values of our debt instruments have been derived based on market quotes for comparable instruments or discounted cash flow analysis using estimates of the amount and timing of future cash flows, market rates and credit spreads. The debt instrument balances as of March 31, 2017 are as follows (in thousands):
Carrying Value | Estimated Fair Value | ||||||
2015 Credit Facility | $ | 129,000 | $ | 129,007 | |||
Term Loan, net (1) | 418,672 | 420,051 | |||||
Senior Unsecured Notes, net (1) | 295,169 | 295,692 | |||||
Mortgages and notes payable, net (1) | 2,109,117 | 2,231,381 | |||||
Convertible Notes, net (1) | 705,899 | 762,847 | |||||
(1) The carrying value of the debt instruments are net of unamortized deferred financing costs and certain debt discounts/premiums.
57
Item 4. Controls and Procedures
SPIRIT REALTY CAPITAL, INC.
Evaluation of Disclosure Controls and Procedures
An evaluation was performed under the supervision and with the participation of Spirit Realty Capital, Inc.'s management, including the Chief Executive Officer and Chief Financial Officer, of the effectiveness as of March 31, 2017 of the design and operation of Spirit Realty Capital, Inc.'s disclosure controls and procedures as defined in Rules 13a-15(e) and 15d-15(e) under the Exchange Act. Based on that evaluation, the Chief Executive Officer and Chief Financial Officer concluded that the design and operation of these disclosure controls and procedures were effective as of the end of the period covered by this quarterly report.
Changes in Internal Control over Financial Reporting
There were no changes to Spirit Realty Capital, Inc.'s internal control over financial reporting (as defined in Rule 13a-15(e) and 15d-15(e) under the Exchange Act) that occurred during the quarter ended March 31, 2017 that have materially affected, or are reasonably likely to materially affect, Spirit Realty Capital, Inc.'s internal control over financial reporting.
SPIRIT REALTY, L.P.
Evaluation of Disclosure Controls and Procedures
An evaluation was performed under the supervision and with the participation of Spirit Realty, L.P.'s management, including the Chief Executive Officer and Chief Financial Officer, of the effectiveness as of March 31, 2017 of the design and operation of Spirit Realty, L.P.'s disclosure controls and procedures as defined in Rules 13a-15(e) and 15d-15(e) under the Exchange Act. Based on that evaluation, the Chief Executive Officer and Chief Financial Officer concluded that the design and operation of these disclosure controls and procedures were effective as of the end of the period covered by this quarterly report.
Changes in Internal Control over Financial Reporting
There were no changes to Spirit Realty, L.P.'s internal control over financial reporting (as defined in Rule 13a-15(e) and 15d-15(e) under the Exchange Act) that occurred during the quarter ended March 31, 2017 that have materially affected, or are reasonably likely to materially affect, Spirit Realty, L.P.'s internal control over financial reporting.
58
PART II — OTHER INFORMATION
Item 1. Legal Proceedings.
From time-to-time, we may be subject to certain claims and lawsuits in the ordinary course of business, the outcome of which cannot be determined at this time. We are not currently a party as plaintiff or defendant to any legal proceedings that we believe to be material or that individually or in the aggregate would be expected to have a material effect on our business, financial condition or results of operations if determined adversely to us.
Item 1A. Risk Factors.
Please review the Risk Factors disclosed in the section entitled “Risk Factors” beginning on page 13 of our Annual Report on Form 10-K for the year ended December 31, 2016 and filed with the SEC on February 24, 2017. We have updated two of the Risk Factors subsequent to our Annual Report, as discussed below. There were no other material changes to the Risk Factors as described in our Annual Report on Form 10-K.
A substantial number of our properties are leased to one tenant, which may result in increased risk due to tenant and industry concentration.
Currently, we lease 111 properties to Shopko, primarily pursuant to 3 master leases. The Shopko leases are guaranteed by Specialty Retail Shops Holding Corp., the parent company of Shopko. Revenues generated from Shopko represented 8.1% of our Normalized Rental Revenue for the month ended March 31, 2017. Because a significant portion of our revenues are derived from rental revenues received from Shopko, any default, breach or delay in the payment of rent by Shopko may materially and adversely affect us.
As a result of the significant number of properties leased to Shopko, our results of operations and financial condition are closely tied to Shopko's performance under its leases, which is ultimately tied to the performance of its stores and the retail industry in which it operates. Shopko operates as a multi-department general merchandise retailer and retail health services provider primarily in mid-size and large communities in the Midwest, Pacific Northwest, North Central and Western Mountain states. Shopko is subject to the following risks, as well as other risks that we are not currently aware of, that could adversely affect its performance and thus its ability to pay rent to us:
• | The retail industry in which Shopko operates is highly competitive, which could limit its growth opportunities and reduce profitability. Shopko competes with other discount retail merchants as well as mass merchants, catalog merchants, internet retailers and other general merchandise, apparel and household merchandise retailers. It faces strong competition from large national discount retailers, such as Walmart, Kmart and Target, and mid-tier merchants such as Kohl’s and J.C. Penney. |
• | Shopko stores are geographically concentrated in the Midwest, Pacific Northwest, North Central and Western Mountain states. As a result, adverse economic conditions in these regions may materially and adversely affect its results of operations and retail sales. |
• | The seasonality in retail operations may cause fluctuations in Shopko’s quarterly performance and results of operations and could adversely affect its cash flows. |
• | Shopko stores are dependent on the efficient functioning of its distribution networks. Problems that cause delays or interruptions in the distribution networks could materially and adversely affect its results of operations. |
• | Shopko stores depend on attracting and retaining quality employees. Many employees are entry-level or part-time with historically high rates of turnover. |
Given recent liquidity events and other challenges, including bankruptcies, impacting the retail industry, we have increased our scrutiny on our tenants in retail industries, including Shopko. If Shopko experiences a decline in its business, financial condition, results of operations or loses access to liquidity, it may request discounts or deferrals on the rents it pays to us, seek to terminate its master leases with us or close certain of its stores, all of which could decrease the amount of revenue we receive from it.
While we seek to reduce the tenant concentration of Shopko, we may have difficulty in selling or leasing to other tenants the properties currently leased by Shopko, due to, among other things, market demand or tax constraints. Furthermore, we can provide no assurance that we will deploy the proceeds from the disposition of any Shopko properties in a manner that would produce comparable or better yields.
59
Decrease in demand for retail and restaurant space may materially and adversely affect us.
As of March 31, 2017, leases representing approximately 74% and 16% of our Normalized Rental Revenue were with tenants in the retail and restaurant industries, respectively, and we may acquire additional retail and restaurant properties in the future. Accordingly, decreases in the demand for retail and/or restaurant spaces adversely impact us. The market for retail and restaurant space has previously been, and could continue to be, adversely affected by weakness in the national, regional and local economies, the adverse financial condition of some large retail and restaurant companies, the ongoing consolidation in the retail and restaurant industries, the excess amount of retail and restaurant space in a number of markets and, in the case of the retail industry, increasing consumer purchases through catalogs or over the Internet. In recent years a number of companies in the retail industry, including some of our tenants, have declared bankruptcy, have gone out of business or have significantly reduced the number of their retail stores. In particular, we have experienced, and expect to continue to experience, challenges with some of our general merchandise retailers through increased credit losses.
To the extent that the adverse conditions listed above continue, they are likely to negatively affect market rents for retail and restaurant space, thereby reducing rents payable to us, and they may lead to increased vacancy rates at our properties and diminish our ability to attract and retain retail and restaurant tenants.
Item 2. Unregistered Sales of Equity Securities and Use of Proceeds.
None.
Item 3. Defaults Upon Senior Securities.
None.
Item 4. Mine Safety Disclosures.
None.
Item 5. Other Information.
None.
60
Item 6. Exhibits.
Exhibit No. | Description |
2.1 | Agreement and Plan of Merger, dated as of January 22, 2013, as amended by the First Amendment to Agreement and Plan of Merger, dated as of May 8, 2013, by and among Spirit Realty Capital, Inc. (f/k/a Cole Credit Property Trust II, Inc.), a Maryland corporation, Spirit Realty Capital, Inc., a Maryland corporation, Cole Operating Partnership II, LP, a Delaware limited partnership and Spirit Realty, L.P., a Delaware limited partnership. Previously filed by Spirit Realty Capital, Inc. as an exhibit to the Company’s Form 8-K filed with the Securities and Exchange Commission on January 22, 2013 and Exhibit 2.1 to the Company’s Form 8-K filed with the Securities and Exchange Commission on May 9, 2013, respectively. |
2.2 | Articles of Merger by and between Spirit Realty Capital, Inc. (f/k/a Cole Credit Property Trust II, Inc.), a Maryland corporation, and Spirit Realty Capital, Inc., a Maryland corporation and the Amended and Restated Charter of Spirit Realty Capital, Inc. (f/k/a Cole Credit Property Trust II, Inc.) filed as Exhibit (Incorporated by reference to Exhibit 3.1 to the Company’s Current Report on Form 8-K (File No. 000-51963), filed on July 17, 2013). |
3.1 | Articles of Restatement of Spirit Realty Capital, Inc. filed Exhibit 3.1 to the Company's Registration Statement on Form S-3 on November 8, 2013 and incorporated herein by reference. |
3.2 | Articles of Amendment of Spirit Realty Capital, Inc. filed as Exhibit 3.1 to the Company's Form 8-K on May 13, 2014 and incorporated herein by reference. |
3.3 | Third Amended and Restated Bylaws of Spirit Realty Capital, Inc. filed as Exhibit 10.5 to the Company’s Form 8-K on August 28, 2015 and incorporated herein by reference. |
4.1 | Form of Certificate for Common Stock of Spirit Realty Capital, Inc. filed as Exhibit 4.1 to the Registration Statement on Form S-4 on March 29, 2013 and incorporated herein by reference. |
4.2 | Second Amended and Restated Master Indenture among Spirit Master Funding, LLC, Spirit Master Funding II, LLC, Spirit Master Funding III, LLC and Citibank, N.A., dated May 20, 2014 filed as Exhibit 4.1 to the Company's Form 8-K on May 20, 2014 and incorporated herein by reference. |
4.3 | Amendment No. 1 to the Second Amended and Restated Master Indenture among Spirit Master Funding, LLC, Spirit Master Funding II, LLC, Spirit Master Funding III, LLC and Citibank, N.A., dated November 26, 2014 filed as Exhibit 4.1 to the Company's Form 8-K on December 1, 2014 and incorporated herein by reference. |
4.4 | Series 2014-1 Indenture Supplement among Spirit Master Funding, LLC, Spirit Master Funding II, LLC, Spirit Master Funding III, LLC and Citibank, N.A., dated May 20, 2014 filed as Exhibit 4.2 to the Company's Form 8-K on May 20, 2014 and incorporated herein by reference. |
4.5 | Series 2014-2 Indenture Supplement among Spirit Master Funding, LLC, Spirit Master Funding II, LLC, Spirit Master Funding III, LLC and Citibank, N.A., dated May 20, 2014 filed as Exhibit 4.3 to the Company's Form 8-K on May 20, 2014 and incorporated herein by reference. |
4.6 | Series 2014-3 Indenture Supplement among Spirit Master Funding, LLC, Spirit Master Funding II, LLC, Spirit Master Funding III, LLC and Citibank, N.A., dated May 20, 2014 filed as Exhibit 4.3 to the Company's Form 8-K on May 20, 2014 and incorporated herein by reference. |
4.7 | Series 2014-4 Indenture Supplement among Spirit Master Funding, LLC, Spirit Master Funding II, LLC, Spirit Master Funding III, LLC, Spirit Master Funding VI, LLC, Spirit Master Funding VIII, LLC and Citibank, N.A., dated November 26, 2014 filed as Exhibit 4.2 to the Company's Form 8-K on December 1, 2014 and incorporated herein by reference. |
4.8 | Master Indenture, between Citibank, N.A. and Spirit Master Funding VII, LLC, dated as of December 23, 2013. Previously filed by Spirit Realty Capital, Inc. as Exhibit 10.21 to the Company's Annual Report on Form 10-K on March 4, 2014 and incorporated herein by reference. |
4.9 | Series 2013-1 Supplement, between Citibank, N.A. and Spirit Master Funding VII, LLC, dated as of December 23, 2013, filed as Exhibit 10.22 to the Company's Annual Report on Form 10-K filed with the Securities and Exchange Commission on March 4, 2014 and incorporated herein by reference. |
4.10 | Series 2013-2 Supplement, between Citibank, N.A. and Spirit Master Funding VII, LLC, dated as of December 23, 2013, filed as Exhibit 10.23 to the Company's Annual Report on Form 10-K on March 4, 2014 and incorporated herein by reference. |
61
Exhibit No. | Description |
4.11 | Indenture, dated May 20, 2014, between the Company and Wilmington Trust, National Association, filed as Exhibit 4.1 to the Company's Form 8-K on May 20, 2014 and incorporated herein by reference. |
4.12 | First Supplemental Indenture, dated May 20, 2014, by and between Spirit Realty Capital, Inc. and Wilmington Trust, National Association (including the form of 2.875% Convertible Senior Note due 2019) filed as Exhibit 4.2 to the Company's Form 8-K on May 20, 2014 and incorporated herein by reference. |
4.13 | Second Supplemental Indenture, dated May 20, 2014, by and between Spirit Realty Capital, Inc. and Wilmington Trust, National Association (including the form of 3.75% Convertible Senior Note due 2021) filed as Exhibit 4.3 to the Company's Form 8-K on May 20, 2014 and incorporated herein by reference. |
4.14 | Indenture, dated August 18, 2016, between Spirit Realty, L.P. and U.S. Bank National Association. |
4.15 | First Supplemental Indenture, dated August 18, 2016, among Spirit Realty, L.P., Spirit Realty Capital, Inc., and U.S. Bank National Association (including the form of 4.450% Senior Notes due 2026). |
4.16 | Registration Rights Agreement, dated August 18, 2016, by and among Spirit Realty, L.P., Spirit Realty Capital, Inc., J.P. Morgan Securities LLC, Wells Fargo Securities, LLC, Merrill Lynch, Pierce, Fenner & Smith Incorporated and Morgan Stanley & Co. LLC. |
10.1 | Amended and Restated Spirit Realty Capital, Inc. and Spirit Realty, L.P. 2012 Incentive Award Plan filed within the Company’s Definitive Proxy Statement on Schedule 14A filed with the Commission on April 11, 2016 and incorporated herein by reference. |
10.2 | Form of 2012 Incentive Award Plan Restricted Stock Award Grant Notice and Agreement filed as Exhibit 10.9 to the Company’s Form 8-K on July 17, 2013 and incorporated herein by reference. |
10.3 | Form of 2012 Incentive Award Plan Stock Payment Award Grant Notice and Agreement filed as Exhibit 10.9 to the Company’s Form 8-K on July 17, 2013 and incorporated herein by reference. |
10.4 | Form of Performance Share Award Agreement. Previously filed by Spirit Realty Capital, Inc. as an exhibit to the Company’s Form 8-K filed with the Securities and Exchange Commission on July 17, 2013 and incorporated herein by reference. |
10.5 | Credit Agreement, by and among Deutsche Bank Securities Inc., Deutsche Bank AG New York Branch, Spirit Realty, L.P. and various lenders, dated as of July 17, 2013 filed as Exhibit 10.01 to the Company’s Form 8-K on July 17, 2013 and incorporated herein by reference. |
10.6 | Guaranty, by and among Spirit Realty Capital, Inc., Spirit General OP Holdings, LLC, Deutsche Bank Securities Inc. and various lenders, dated as of July 17, 2013 filed as Exhibit 10.2 to the Company’s Form 8-K filed on July 17, 2013 and incorporated herein by reference. |
10.7 | Security Agreement, by and among Spirit Realty Capital, Inc., Spirit General OP Holdings, LLC, Spirit Realty, L.P., Spirit Master Funding IV, LLC, Spirit Master Funding V, LLC, Deutsche Bank Securities Inc. and various lenders, dated as of July 17, 2013 filed as Exhibit 10.3 to the Company’s Form 8-K on July 17, 2013 and incorporated herein by reference. |
10.8 | Omnibus Collateral Assignment of Material Agreements, Permits and Licenses, by and among Spirit Realty Capital, Inc., Spirit General OP Holdings, LLC, Spirit Realty, L.P., Spirit Master Funding IV, LLC, Spirit Master Funding V, LLC, Deutsche Bank Securities Inc. and various lenders, dated as of July 17, 2013. Previously filed by Spirit Realty Capital, Inc. as an exhibit to the Company’s Form 8-K filed with the Securities and Exchange Commission on July 17, 2013 and incorporated herein by reference. |
10.9 | Loan Agreement, between German American Capital Corporation and Spirit SPE Loan Portfolio 2013-2, LLC, dated as of July 17, 2013, filed as Exhibit 10.4 to the Company’s Form 8-K on July 17, 2013 and incorporated herein by reference. |
10.10 | Guaranty of Recourse Obligations of Borrower, by Spirit Realty, L.P. in favor of German American Capital Corporation, dated as of July 17, 2013, filed as Exhibit 10.6 to the Company’s Form 8-K on July 17, 2013 and incorporated herein by reference. |
10.11 | Loan Agreement, between Barclays Bank PLC and Spirit SPE Loan Portfolio 2013-3, LLC, dated as of July 17, 2013 filed as Exhibit 10.7 to the Company’s Form 8-K on July 17, 2013 and incorporated herein by reference. |
62
Exhibit No. | Description |
10.12 | Guaranty of Recourse Obligations of Borrower by Spirit Realty, L.P. in favor of Barclays Bank PLC, dated as of July 17, 2013, filed as Exhibit 10.8 to the Company’s Form 8-K on July 17, 2013 and incorporated herein by reference. |
10.13 | Second Amended and Restated Property Management and Servicing Agreement dated May 20, 2014, by and among Spirit Realty, L.P., Spirit Master Funding, LLC, Spirit Master Funding II, LLC, Spirit Master Funding III, LLC and Midland Loan Services, a division of PNC Bank, National Association filed as Exhibit 1.1 of the Company's Form 8-K on May 20, 2014 and incorporated herein by reference. |
10.14 | Amendment No. 1 to the Second Amended and Restated Property Management and Servicing Agreement dated November 26, 2014, by and among Spirit Realty, L.P., Spirit Master Funding, LLC, Spirit Master Funding II, LLC, Spirit Master Funding III, LLC and Midland Loan Services, a division of PNC Bank, National Association filed as Exhibit 1.2 of the Company's Form 8-K on December 1, 2014 and incorporated herein by reference. |
10.15 | Property Management and Servicing Agreement, between Midland Loan Services, Spirit Master Funding VII, LLC and Spirit Realty, L.P., dated as of December 23, 2013, filed as Exhibit 10.24 to the Company's Annual Report on Form 10-K filed on March 4, 2014 and incorporated herein by reference. |
10.16 | Defeasance, Assignment, Assumption and Release Agreement, dated June 5, 2014, by and among Spirit SPE Portfolio 2006-1, LLC and Spirit SPE Portfolio 2006-2, LLC, U.S. Bank, National Association as Trustee for the Lender, Midland Loan Servicer, a division of PNC Bank, National Association as servicer and U.S. Bank, National Association as Securities Intermediary and Custodian filed as Exhibit 1.1 of the Company's Form 8-K on June 6, 2014 and incorporated herein by reference. |
10.17 | First Amended and Restated Agreement of Limited Partnership of Spirit Realty, L.P. on September 12, 2014 and incorporated herein by reference. |
10.18 | Amended and Restated Master Lease between Spirit SPE Portfolio 2006-1, LLC and Spirit SPE Portfolio 2006-2, LLC, and Shopko Stores Operating CO., LLC, dated December 15, 2014 filed as Exhibit 1.2 of the Company's Form 8-K on December 1, 2014 and incorporated herein by reference. |
10.19 | Form of Indemnification Agreement of Spirit Realty Capital, Inc. filed as Exhibit 10.1 of the Company's Form 8-K on July 17, 2013 and incorporated herein by reference. |
10.21 | Amended and Restated Employment Agreement among Spirit Realty Capital, Inc. and Michael A. Bender, dated as of July 17, 2013 filed as Exhibit 10.3 of the Company's Form 8-K on July 17, 2013 and incorporated herein by reference. |
10.23 | Transition and Separation Agreement among Spirit Realty Capital, Inc. and Michael A. Bender dated as of August 27, 2015 and filed as Exhibit 10.4 of the Company's form 8-K on August 28, 2015 and incorporated herein by reference. |
10.25 | Director Compensation Program of Spirit Realty Capital, Inc. as of January 1, 2015 filed within as Exhibit 10.25 of the Company's Form 10-Q on August 4, 2016. |
10.26 | Employment Agreement among Spirit Realty Capital, Inc. and Phillip D. Joseph, Jr., dated as of March 25, 2015 filed as Exhibit 10.1 of the Company's Form 8-K on March 25, 2015 and incorporated herein by reference. |
10.27 | Employment Letter Agreement between Spirit Realty Capital, Inc. and Philip D. Joseph, Jr. dated as of October 14, 2015 filed as Exhibit 10.27 of the Company's Annual Report on Form 10-K on February 26, 2016 and incorporated herein by reference. |
10.28 | First Amended and Restated Employment Agreement among Spirit Realty Capital, Inc. and Phillip D. Joseph, Jr, dated as of February 23, 2016 filed as Exhibit 10.28 of the Company's Annual Report on Form 10-K on February 26, 2016 and incorporated herein by reference. |
10.29 | Credit Agreement among Spirit Realty L.P., Wells Fargo Bank, N.A., as the administrative agent, and the various financial institutions as are or may become parties thereto, dated as of March 31, 2015, filed as Exhibit 10.1 of the Company's Form 8-K on March 31, 2015 and incorporated herein by reference. |
63
Exhibit No. | Description |
10.30 | Second Amended and Restated Employment Agreement among Spirit Realty Capital, Inc. and Thomas H. Nolan, Jr., dated as of August 27, 2015 filed as Exhibit 10.1 of the Company's Form 8-K on August 28, 2015 and incorporated herein by reference. |
10.31 | Third Amended and Restated Employment Agreement among Spirit Realty Capital, Inc. and Gregg A. Seibert, dated as of August 27, 2015 filed as Exhibit 10.2 of the Company's Form 8-K on August 28, 2015 and incorporated herein by reference. |
10.32 | Second Amended and Restated Employment Agreement among Spirit Realty Capital, Inc. and Mark Manheimer, dated as of August 27, 2015 filed as Exhibit 10.3 of the Company's Form 8-K on August 28, 2015 and incorporated herein by reference. |
10.33 | Term Loan Agreement among Spirit Realty L.P., various financial institutions, as lenders, and Bank of America, N.A., as the administrative agent, dated as of November 3, 2015, filed as Exhibit 10.1 of the Company's Form 8-K on November 6, 2015 and incorporated herein by reference. |
10.34 | First Amendment to the Credit Agreement among Spirit Realty L.P., various financial institutions, as lenders, and Wells Fargo Bank, N.A., as the administrative agent, dated as of November 3, 2015, filed as Exhibit 10.34 of the Company's Annual Report Form 10-K on February 26, 2016 and incorporated herein by reference. |
10.35 | Credit Agreement Guaranty dated as of March 31, 2015 in favor of Wells Fargo Bank National Association, the Administrative Agent for the lenders, and among Spirit Realty, L.P., filed as Exhibit 10.35 of the Company's Annual Report on Form 10-K on February 26, 2016 and incorporated herein by reference. |
10.36 | The 2016 executive cash bonus program, was approved by the Compensation Committee of the Board of Directors of Spirit Realty Capital, Inc. on February 18, 2016 and filed as Exhibit 10.36 of the Company's Annual Report on Form 10-K on February 26, 2016 and incorporated herein by reference. |
10.37 | Employment Agreement among Spirit Realty Capital, Inc. and Boyd Messmann, dated as of June 3, 2016, filed as Exhibit 10.1 of the Company's Form 8-K on June 6, 2016 and incorporated herein by reference. |
10.38 | Employment Agreement among Spirit Realty Capital, Inc. and Jackson Hsieh, dated as of September 7, 2016 filed as Exhibit 10.1 of the Company's Form 8-K on July 27, 2016 and incorporated herein by reference. |
10.40* | Second Amendment among Spirit Realty L.P., various financial institutions, as lenders, and Wells Fargo Bank, National Association, as the administrative agent, dated as of April 28, 2017. |
31.1* | Certification of Chief Executive Officer pursuant to Rule 13a-14(a) or Rule 15d-14(a) under the Exchange Act, as adopted pursuant to Section 302 of the Sarbanes-Oxley Act of 2002 for Spirit Realty Capital, Inc. |
31.2* | Certification of Chief Financial Officer pursuant to Rule 13a-14(a) or Rule 15d-14(a) under the Exchange Act, as adopted pursuant to Section 302 of the Sarbanes-Oxley Act of 2002 for Spirit Realty Capital, Inc. |
31.3* | Certification of Chief Executive Officer pursuant to Rule 13a-14(a) or Rule 15d-14(a) under the Exchange Act, as adopted pursuant to Section 302 of the Sarbanes-Oxley Act of 2002 for Spirit Realty, L.P. |
31.4* | Certification of Chief Financial Officer pursuant to Rule 13a-14(a) or Rule 15d-14(a) under the Exchange Act, as adopted pursuant to Section 302 of the Sarbanes-Oxley Act of 2002 for Spirit Realty, L.P. |
32.1* | Certification of Chief Executive Officer and Chief Financial Officer pursuant to 18 U.S.C. Section 1350, as adopted pursuant to Section 906 of the Sarbanes-Oxley Act of 2002 for Spirit Realty Capital, Inc. |
32.2* | Certification of Chief Executive Officer and Chief Financial Officer pursuant to 18 U.S.C. Section 1350, as adopted pursuant to Section 906 of the Sarbanes-Oxley Act of 2002 for Spirit Realty, L.P. |
101.INS | XBRL Instance Document |
64
Exhibit No. | Description |
101.SCH | XBRL Taxonomy Extension Schema |
101.CAL | XBRL Taxonomy Extension Calculation Linkbase |
101.DEF | XBRL Taxonomy Extension Definition Linkbase |
101.LAB | XBRL Taxonomy Extension Label Linkbase |
101.PRE | XBRL Taxonomy Extension Presentation Linkbase |
* | Filed herewith. |
65
SIGNATURES
Pursuant to the requirements of the Securities Exchange Act of 1934, the registrants have duly caused this report to be signed on their behalf by the undersigned thereunto duly authorized.
SPIRIT REALTY CAPITAL, INC. (Registrant) | ||
By: | /s/ Prakash J. Parag | |
Name: | Prakash J. Parag | |
Title: | Chief Accounting Officer and Senior Vice President (Principal Accounting Officer) | |
SPIRIT REALTY, L.P. (Registrant) | ||
By: | Spirit General OP Holdings, LLC, as general partner of Spirit Realty, L.P. | |
/s/ Prakash J. Parag | ||
Prakash J. Parag | ||
Chief Accounting Officer and Senior Vice President (Principal Accounting Officer) | ||
Date: May 3, 2017
66