Attached files
| file | filename |
|---|---|
| 8-K - 8-K - CARPENTER TECHNOLOGY CORP | d86215d8k.htm |

4th Quarter Fiscal Year 2020 Earnings Call July 30, 2020 Carpenter Technology Corporation Exhibit 99.1
Cautionary Statement Forward-Looking Statements This presentation contains forward-looking statements within the meaning of the Private Securities Litigation Act of 1995. These forward-looking statements are subject to risks and uncertainties that could cause actual results to differ from those projected, anticipated or implied. The most significant of these uncertainties are described in Carpenter Technology’s filings with the Securities and Exchange Commission, including its report on Form 10-K for the year ended June 30, 2019, Form 10-Q for the quarters ended September 30, 2019, December 31, 2019 and March 31, 2020 and the exhibits attached to those filings. They include but are not limited to: (1) the cyclical nature of the specialty materials business and certain end-use markets, including aerospace, defense, medical, transportation, energy, industrial and consumer, or other influences on Carpenter Technology’s business such as new competitors, the consolidation of competitors, customers, and suppliers or the transfer of manufacturing capacity from the United States to foreign countries; (2) the ability of Carpenter Technology to achieve cash generation, growth, earnings, profitability, operating income, cost savings and reductions, qualifications, productivity improvements or process changes; (3) the ability to recoup increases in the cost of energy, raw materials, freight or other factors; (4) domestic and foreign excess manufacturing capacity for certain metals; (5) fluctuations in currency exchange rates; (6) the effect of government trade actions; (7) the valuation of the assets and liabilities in Carpenter Technology’s pension trusts and the accounting for pension plans; (8) possible labor disputes or work stoppages; (9) the potential that our customers may substitute alternate materials or adopt different manufacturing practices that replace or limit the suitability of our products; (10) the ability to successfully acquire and integrate acquisitions; (11) the availability of credit facilities to Carpenter Technology, its customers or other members of the supply chain; (12) the ability to obtain energy or raw materials, especially from suppliers located in countries that may be subject to unstable political or economic conditions; (13) Carpenter Technology’s manufacturing processes are dependent upon highly specialized equipment located primarily in facilities in Reading and Latrobe, Pennsylvania and Athens, Alabama for which there may be limited alternatives if there are significant equipment failures or a catastrophic event; (14) the ability to hire and retain key personnel, including members of the executive management team, management, metallurgists and other skilled personnel; (15) fluctuations in oil and gas prices and production; (16) uncertainty regarding the return to service of the Boeing 737 MAX aircraft and the related supply chain disruption; (17) potential impacts of the COVID-19 pandemic on our operations, financial results and financial position; (18) our efforts and efforts by governmental authorities to mitigate the COVID-19 pandemic, such as travel bans, shelter in place orders and business closures, and the related impact on resource allocations and manufacturing and supply chains; (19) our status as a “critical”, “essential” or “life-sustaining” business in light of COVID-19 business closure laws, orders and guidance being challenged by a governmental body or other applicable authority; (20) our ability to execute our business continuity, operational, budget and fiscal plans in light of the COVID-19 outbreak; and (21) our ability to successfully carry out restructuring and business exit activities on the expected terms and timelines. Any of these factors could have an adverse and/or fluctuating effect on Carpenter Technology’s results of operations. The forward-looking statements in this document are intended to be subject to the safe harbor protection provided by Section 27A of the Securities Act of 1933, as amended (the “Securities Act”), and Section 21E of the Securities Exchange Act of 1934, as amended. Carpenter Technology undertakes no obligation to update or revise any forward-looking statements. Non-GAAP Financial Measures Some of the information included in this presentation is derived from Carpenter Technology's consolidated financial information but is not presented in Carpenter Technology's financial statements prepared in accordance with U.S. Generally Accepted Accounting Principles (GAAP). Certain of these data are considered “non-GAAP financial measures” under SEC rules. These non-GAAP financial measures supplement our GAAP disclosures and should not be considered an alternative to the GAAP measure. Reconciliations to the most directly comparable GAAP financial measures and management’s rationale for the use of the non-GAAP financial measures can be found in the Appendix to this presentation.
4th Quarter Fiscal Year 2020 Tony Thene President and Chief Executive Officer
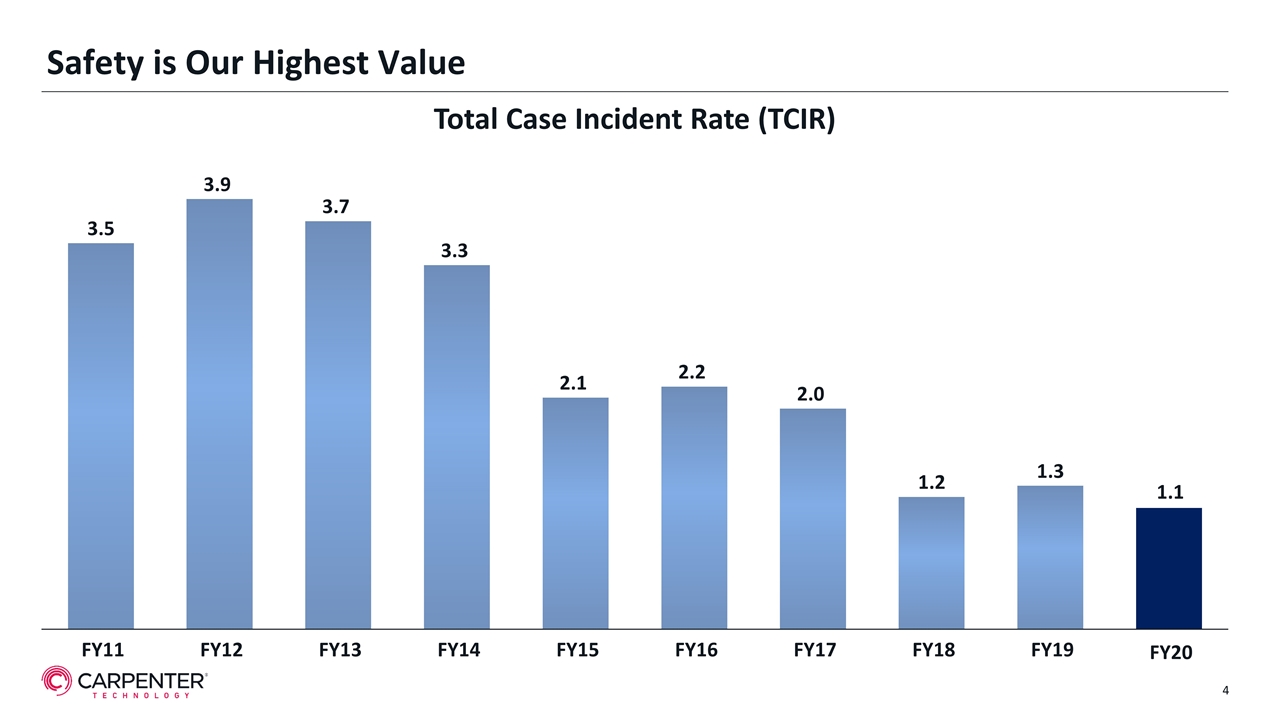
Safety is Our Highest Value Total Case Incident Rate (TCIR) FY20
Results Negatively Impacted by COVID-19 and Accelerated Inventory Reduction; Liquidity Position Strengthened and Remain Critical Supply Chain Partner Across Attractive End-Use Markets 4th Quarter Summary Executed targeted portfolio restructurings and cost reduction initiatives expected to deliver $60-$70 million of annual cost savings Sales ex-surcharge down 30% year-over-year and 24% sequentially Operating results impacted by volume deterioration, COVID-19 protocol costs and strategic decision to accelerate inventory reduction Generated $100 million of free cash flow; total liquidity position at fiscal year end of $417 million including $193 million of cash on hand Facilities operating continuously driven by core safety values and commitment to employees and customers Long-term growth potential supported by critical supply chain position, strong customer relationships and leading position in emerging technologies
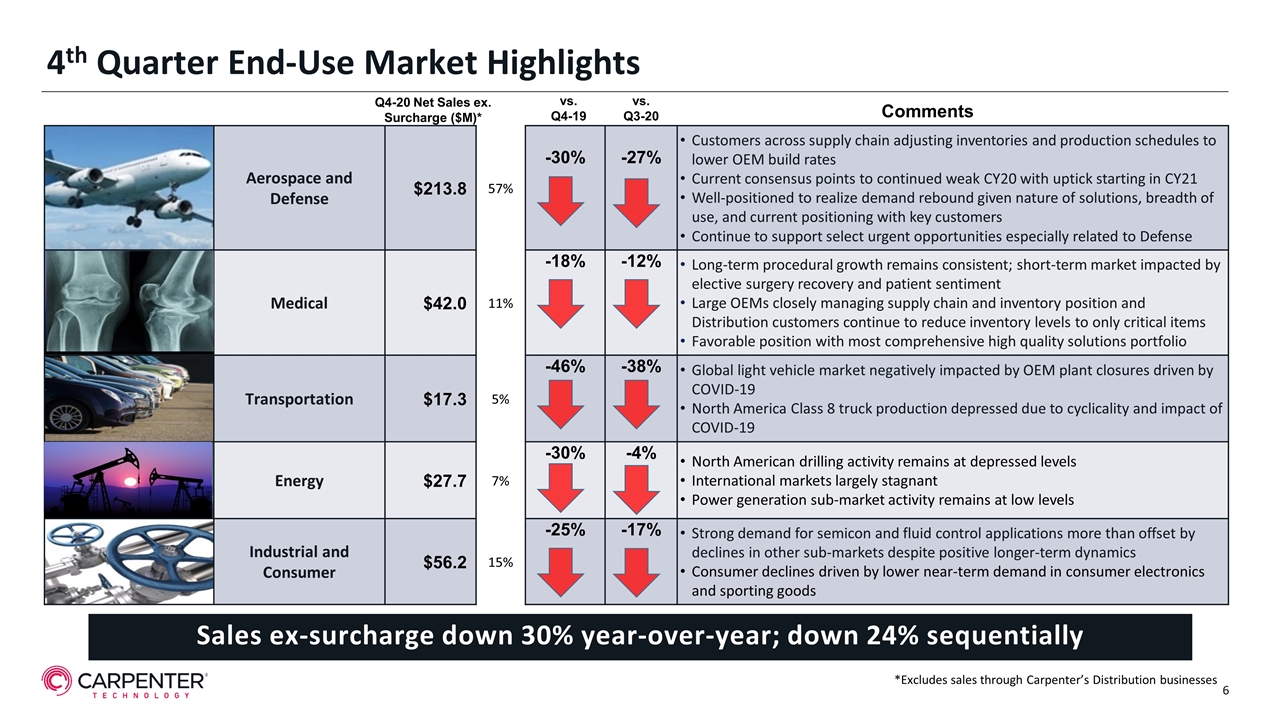
Aerospace and Defense $213.8 57% -30% -27% Customers across supply chain adjusting inventories and production schedules to lower OEM build rates Current consensus points to continued weak CY20 with uptick starting in CY21 Well-positioned to realize demand rebound given nature of solutions, breadth of use, and current positioning with key customers Continue to support select urgent opportunities especially related to Defense Medical $42.0 11% -18% -12% Long-term procedural growth remains consistent; short-term market impacted by elective surgery recovery and patient sentiment Large OEMs closely managing supply chain and inventory position and Distribution customers continue to reduce inventory levels to only critical items Favorable position with most comprehensive high quality solutions portfolio Transportation $17.3 5% -46% -38% Global light vehicle market negatively impacted by OEM plant closures driven by COVID-19 North America Class 8 truck production depressed due to cyclicality and impact of COVID-19 Energy $27.7 7% -30% -4% North American drilling activity remains at depressed levels International markets largely stagnant Power generation sub-market activity remains at low levels Industrial and Consumer $56.2 15% -25% -17% Strong demand for semicon and fluid control applications more than offset by declines in other sub-markets despite positive longer-term dynamics Consumer declines driven by lower near-term demand in consumer electronics and sporting goods Comments Q4-20 Net Sales ex. Surcharge ($M)* vs. Q4-19 vs. Q3-20 *Excludes sales through Carpenter’s Distribution businesses 4th Quarter End-Use Market Highlights Sales ex-surcharge down 30% year-over-year; down 24% sequentially 6
4th Quarter Financial Overview and Business Update Tim Lain Vice President and Chief Financial Officer
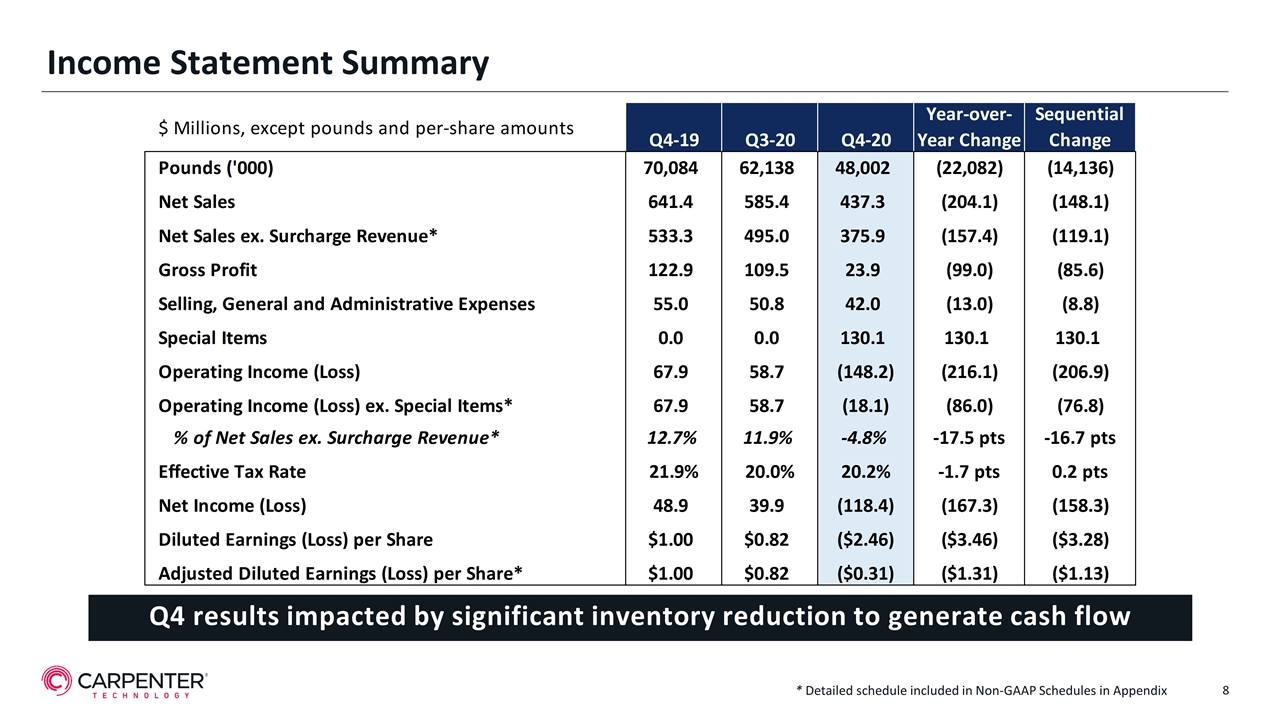
Q4 results impacted by significant inventory reduction to generate cash flow Income Statement Summary * Detailed schedule included in Non-GAAP Schedules in Appendix
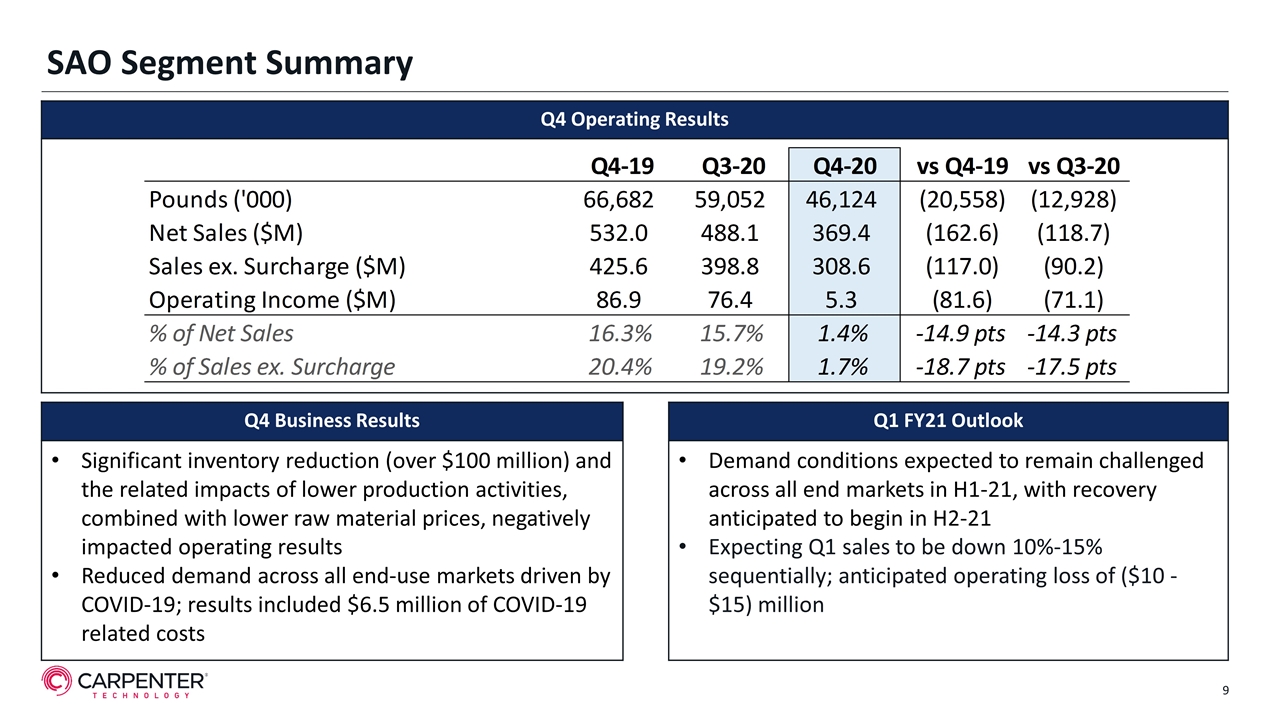
SAO Segment Summary Q4 Operating Results Q4 Business Results Q1 FY21 Outlook Significant inventory reduction (over $100 million) and the related impacts of lower production activities, combined with lower raw material prices, negatively impacted operating results Reduced demand across all end-use markets driven by COVID-19; results included $6.5 million of COVID-19 related costs Demand conditions expected to remain challenged across all end markets in H1-21, with recovery anticipated to begin in H2-21 Expecting Q1 sales to be down 10%-15% sequentially; anticipated operating loss of ($10 -$15) million Q4-19 Q3-20 Q4-20 vs Q4-19 vs Q3-20 Pounds ('000) 66682 59052 46124 -20558 -12928 Net Sales ($M) 532 488.1 369.4 -,162.60000000000002 -,118.70000000000005 Sales ex. Surcharge ($M) 425.6 398.8 308.60000000000002 -117 -90.199999999999989 Operating Income ($M) 86.9 76.400000000000006 5.3 -81.600000000000009 -71.100000000000009 % of Net Sales 0.16334586466165416 0.15652530219217373 1.4% -14.9 pts -14.3 pts % of Sales ex. Surcharge 0.20418233082706766 0.19157472417251756 1.7% -18.7 pts -17.5 pts Q4-19 Q3-20 Q4-20 vs Q4-19 vs Q3-20 Pounds ('000) 2956 3096 2512 -444 -584 Sales ex. Surcharge ($M) 91.4 90.2 80.400000000000006 -11 -9.7999999999999972 Op Inc ex. EID ($M) -0.4 -1.3 -2.8 -2.4 -1.4999999999999998 % of Sales ex. Surcharge -0.4% -1.4% -3.5% -3.1% -2.1% Q4-19 90.2 Q4-20 0 vs Q4-19 Op Income Adjusted ($M)* 63.5 #REF! 35.1 -28.4 Diluted EPS Reported $0.56999999999999995 #REF! $-0.03 $-0.6 Diluted EPS Adjusted** $0.56999999999999995 $0.32 $-0.24999999999999994
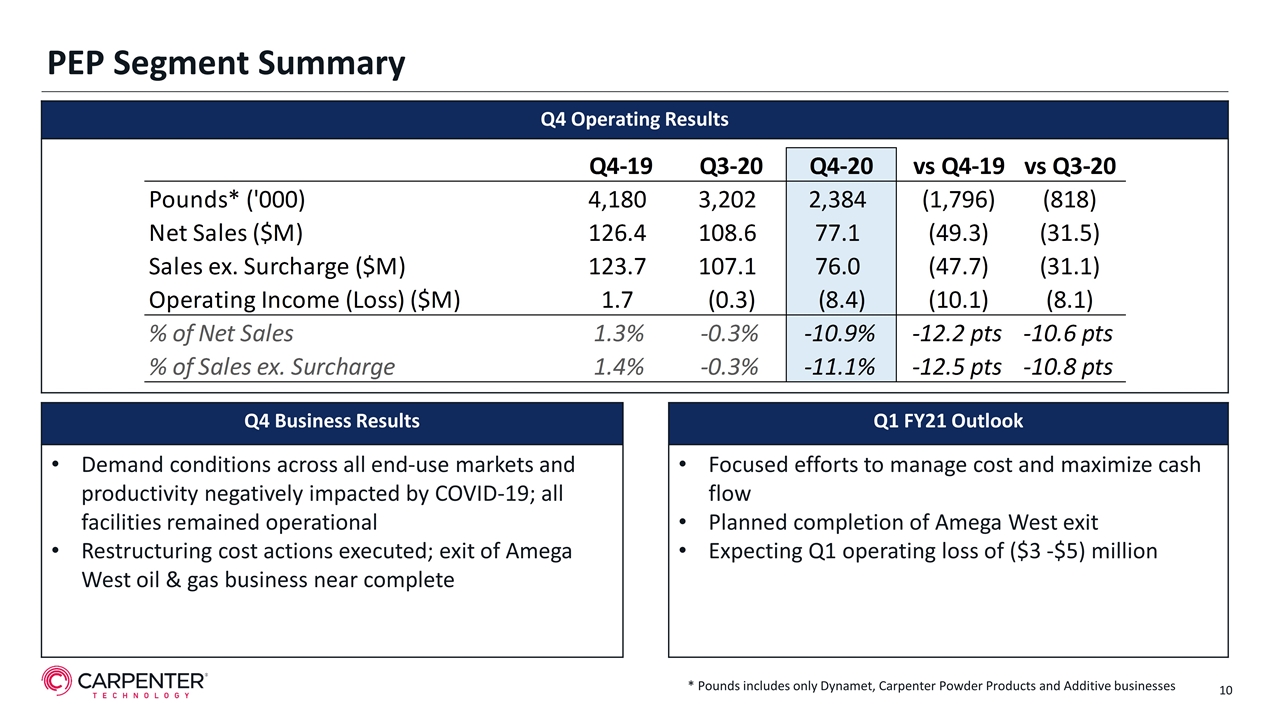
PEP Segment Summary Q4 Operating Results Q4 Business Results Q1 FY21 Outlook Demand conditions across all end-use markets and productivity negatively impacted by COVID-19; all facilities remained operational Restructuring cost actions executed; exit of Amega West oil & gas business near complete Focused efforts to manage cost and maximize cash flow Planned completion of Amega West exit Expecting Q1 operating loss of ($3 -$5) million * Pounds includes only Dynamet, Carpenter Powder Products and Additive businesses Q4-19 Q3-20 Q4-20 vs Q4-19 vs Q3-20 Pounds* ('000) 4180 3202 2384 -1796 -818 Net Sales ($M) 126.4 108.6 77.099999999999994 -49.300000000000011 -31.5 Sales ex. Surcharge ($M) 123.7 107.1 76 -47.7 -31.099999999999994 Operating Income (Loss) ($M) 1.7 -0.3 -8.4 -10.1 -8.1 % of Net Sales 1.3% -0.3% -0.10894941634241247 -12.2 pts -10.6 pts % of Sales ex. Surcharge 1.4% -0.3% -0.11052631578947369 -12.5 pts -10.8 pts Q4-19 Q3-20 Q4-20 vs Q4-19 vs Q3-20 Pounds ('000) 2956 3096 2512 -444 -584 Sales ex. Surcharge ($M) 91.4 90.2 80.400000000000006 -11 -9.7999999999999972 Op Inc ex. EID ($M) -0.4 -1.3 -2.8 -2.4 -1.4999999999999998 % of Sales ex. Surcharge -0.4% -1.4% -3.5% -3.1% -2.1% Q4-19 90.2 Q4-20 0 vs Q4-19 Op Income Adjusted ($M)* 63.5 #REF! 35.1 -28.4 Diluted EPS Reported $0.56999999999999995 #REF! $-0.03 $-0.6 Diluted EPS Adjusted** $0.56999999999999995 $0.32 $-0.24999999999999994
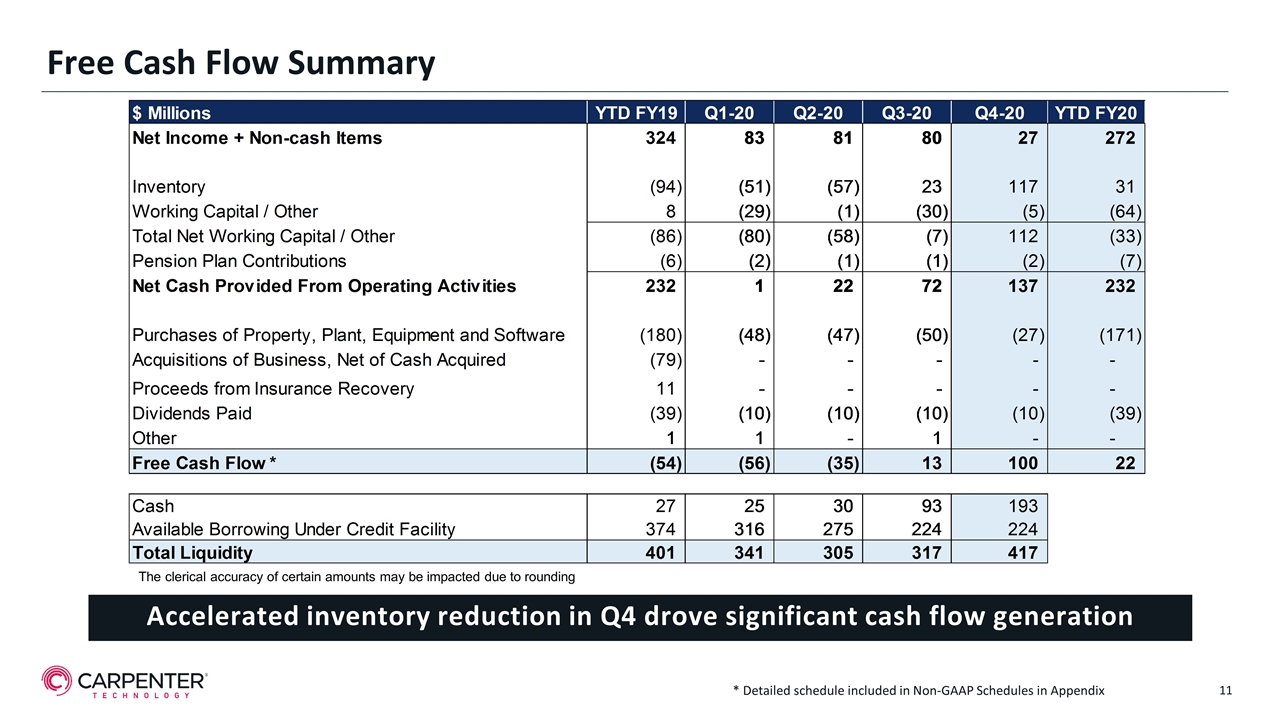
Accelerated inventory reduction in Q4 drove significant cash flow generation Free Cash Flow Summary The clerical accuracy of certain amounts may be impacted due to rounding * Detailed schedule included in Non-GAAP Schedules in Appendix $ Millions FY11 YTD FY19 Q1-20 Q2-20 Q3-20 Q4-20 YTD FY20 Net Income + Non-cash Items 196 324 83 81 80 27 272 Inventory -116 -94 -51 -57 23 117 31 Working Capital / Other -16 8 -29 -1 -30 -5 -64 Total Net Working Capital / Other -132 -86 -80 -58 -7 112 -33 Pension Plan Contributions -6 -2 -1 -1 -2 -7 Net Cash Provided From Operating Activities #REF! 232 1 22 72 137 232 Purchases of Property, Plant, Equipment and Software -80 -180 -48 -47 -50 -27 -171 Acquisitions of Business, Net of Cash Acquired -79 0 0 0 0 0 Proceeds from Insurance Recovery 11 0 0 0 0 0 Dividends Paid -32 -39 -10 -10 -10 -10 -39 Other 1 1 0 1 0 0 Free Cash Flow * #REF! -54 -56 -35 13 100 22 Cash 21 27 25 30 93 193 Available Borrowing Under Credit Facility 385 374 316 275 224 224 Total Liquidity 406 401 341 305 317 417
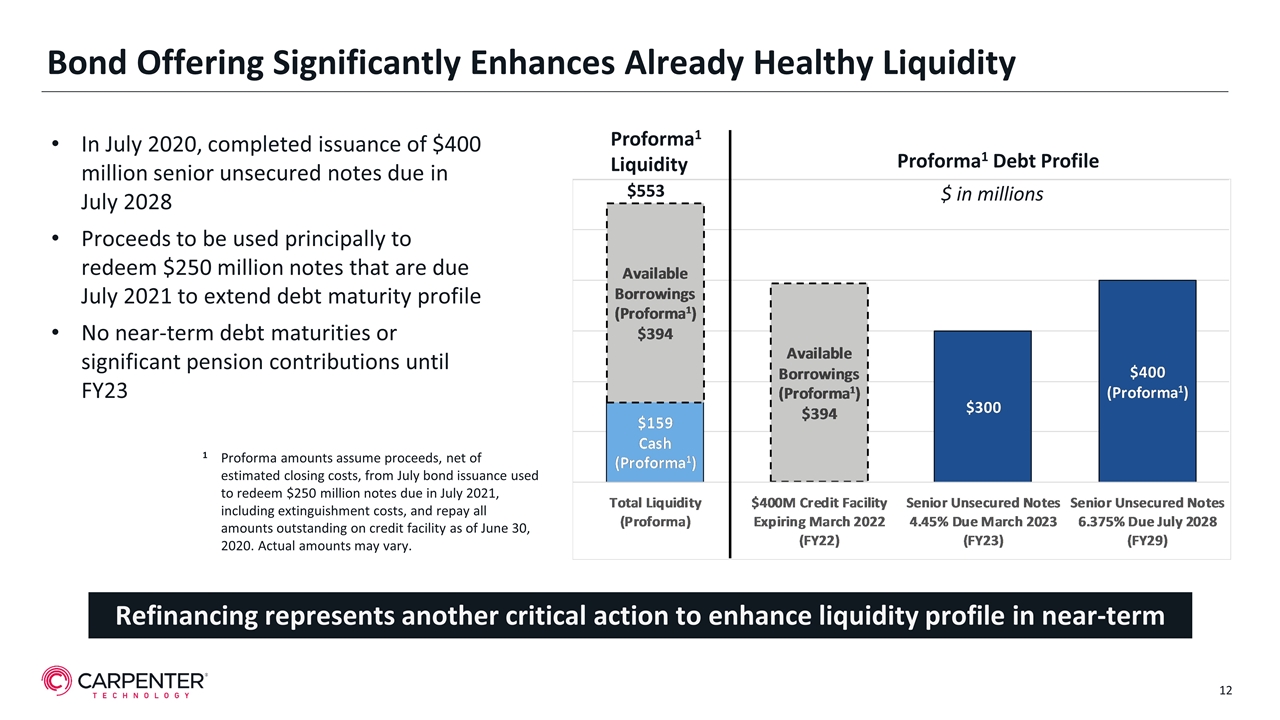
Bond Offering Significantly Enhances Already Healthy Liquidity Proforma1 Debt Profile Proforma1 Liquidity Refinancing represents another critical action to enhance liquidity profile in near-term $553 In July 2020, completed issuance of $400 million senior unsecured notes due in July 2028 Proceeds to be used principally to redeem $250 million notes that are due July 2021 to extend debt maturity profile No near-term debt maturities or significant pension contributions until FY23 1 Proforma amounts assume proceeds, net of estimated closing costs, from July bond issuance used to redeem $250 million notes due in July 2021, including extinguishment costs, and repay all amounts outstanding on credit facility as of June 30, 2020. Actual amounts may vary. $ in millions
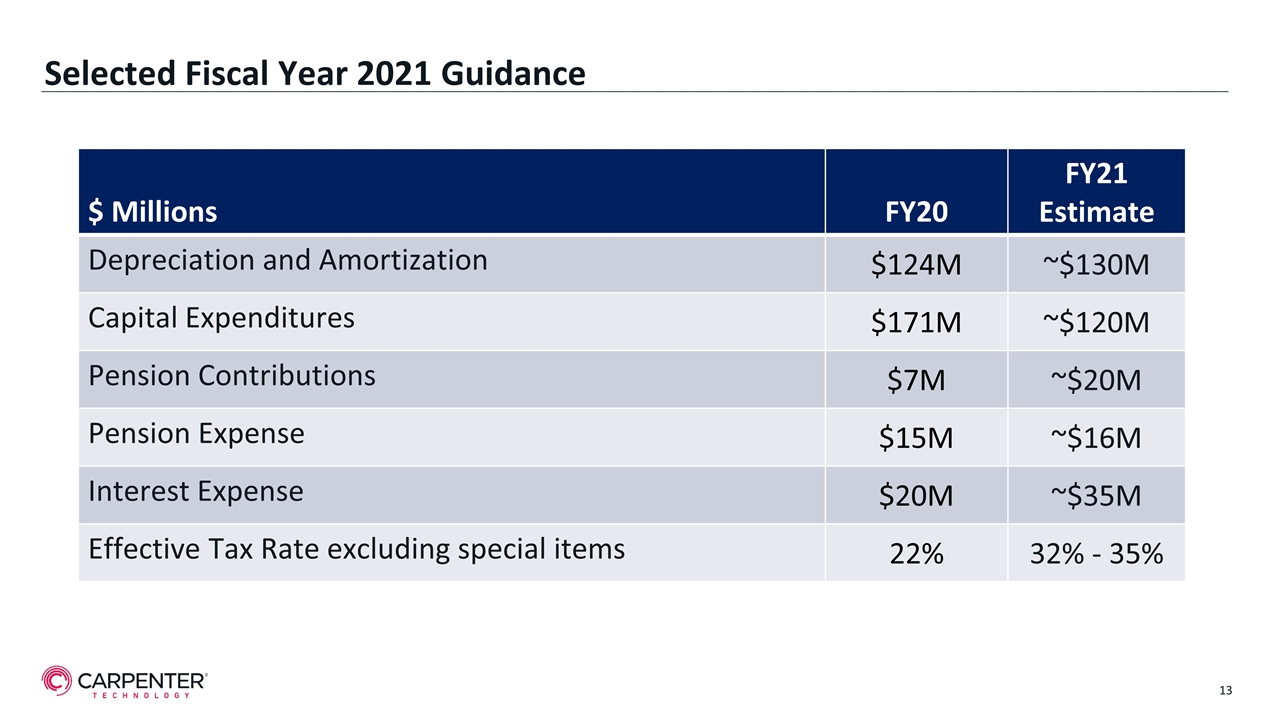
Selected Fiscal Year 2021 Guidance $ Millions FY20 FY21 Estimate Depreciation and Amortization $124M ~$130M Capital Expenditures $171M ~$120M Pension Contributions $7M ~$20M Pension Expense $15M ~$16M Interest Expense $20M ~$35M Effective Tax Rate excluding special items 22% 32% - 35%
4th Quarter Fiscal Year 2020 Closing Comments Tony Thene President and Chief Executive Officer
Immediate Priorities Ensuring the Safety of our Employees and Communities Rapid Response Team continues to implement COVID-19 policies to protect employees Maintain frequent, effective communication to all key constituencies Monitor and track situations and employees globally and on a daily basis Solidifying and Strengthening our Liquidity Position Executed restructuring with hiring, salary and furlough actions Reducing capital expenditures and reprioritizing investments based on most current outlooks Targeted portfolio actions Prioritize cash generation Continuing to Support our Customers most Critical Needs Working collaboratively to address demand shocks and other unconventional demand adjustments Re-prioritizing order sequence to accommodate changing and most urgent orders Reinforcing strong customer relationships and enhancing supply agreements across key markets
Near-Term Priorities Focused on Employee Safety and Sustaining Operations; Liquidity Position, Solutions Portfolio and Critical Supply Chain Position Supports Sustainable Long-Term Growth Profile Closing Comments Expecting market conditions to remain challenging through first half of fiscal year 2021 First quarter FY21 net sales expected to decline by 10%-15% sequentially Anticipated loss per share of ($0.55) – ($0.65) for Q1 fiscal 2021 Ample liquidity to navigate current operating conditions $417 million of total liquidity as of fourth quarter of fiscal year 2020 Recent debt refinancing significantly enhances financial flexibility Additional cost reduction actions available Critical supply chain partner across multiple attractive end-use markets Aerospace and Defense: broad market and platform exposure supported by strong customer relationships and solution expertise Medical: expect to benefit from additional capacity and increasing market adjacencies Transportation: leading solutions portfolio supported by soft magnetics solutions that address electrification trend Industrial and Consumer: gaining share in high-value applications Expect to generate positive free cash flow and positive adjusted EBITDA in fiscal year 2021
Appendix of Non-GAAP Schedules
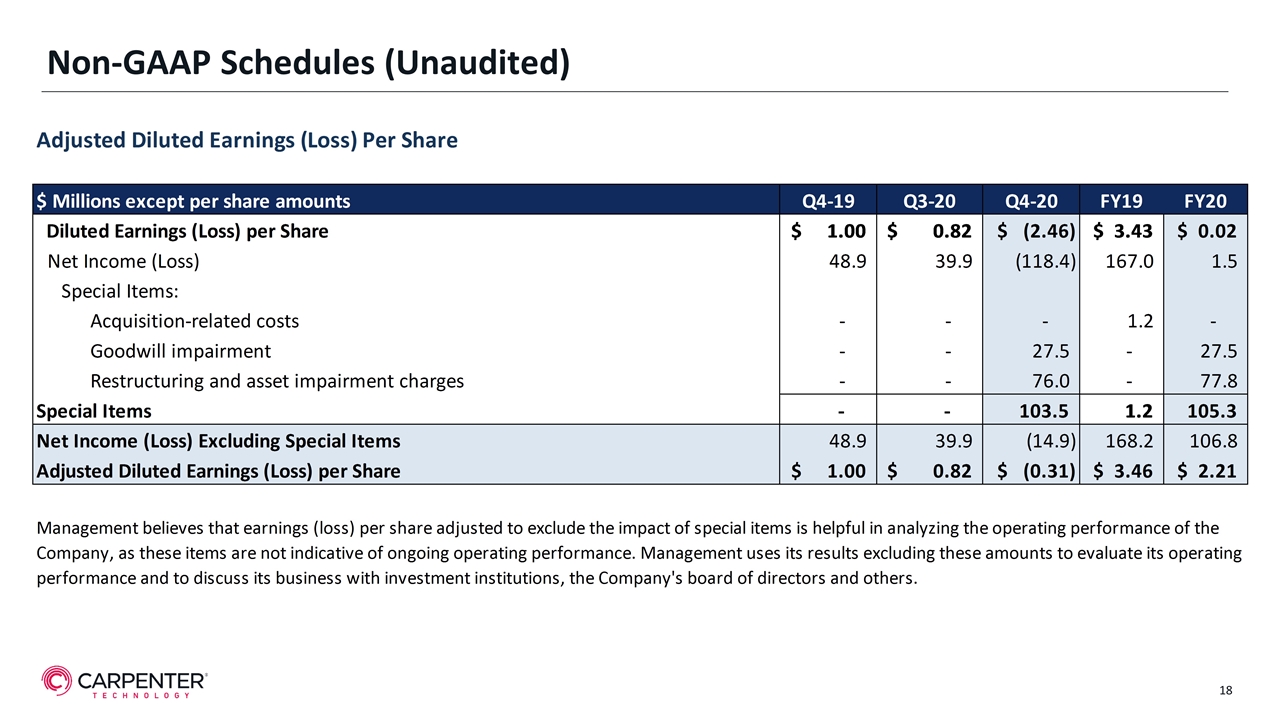
Non-GAAP Schedules (Unaudited) Adjusted Diluted Earnings (Loss) Per Share $ Millions except per share amounts Q4-19 Q3-20 Q4-20 FY19 FY20 Diluted Earnings (Loss) per Share $1 $0.82 $-2.46 $3.43 $0.02 Net Income (Loss) 48.9 39.9 -,118.4 167 1.5 Special Items: Acquisition-related costs 0 0 0 1.2 0 Goodwill impairment 0 0 27.5 0 27.5 Restructuring and asset impairment charges 0 0 76 0 77.8 Special Items 0 0 103.5 1.2 105.3 Net Income (Loss) Excluding Special Items 48.9 39.9 -14.900000000000006 168.2 106.8 Adjusted Diluted Earnings (Loss) per Share $1 $0.82 $-0.31 $3.46 $2.21 Management believes that earnings (loss) per share adjusted to exclude the impact of special items is helpful in analyzing the operating performance of the Company, as these items are not indicative of ongoing operating performance. Management uses its results excluding these amounts to evaluate its operating performance and to discuss its business with investment institutions, the Company's board of directors and others.
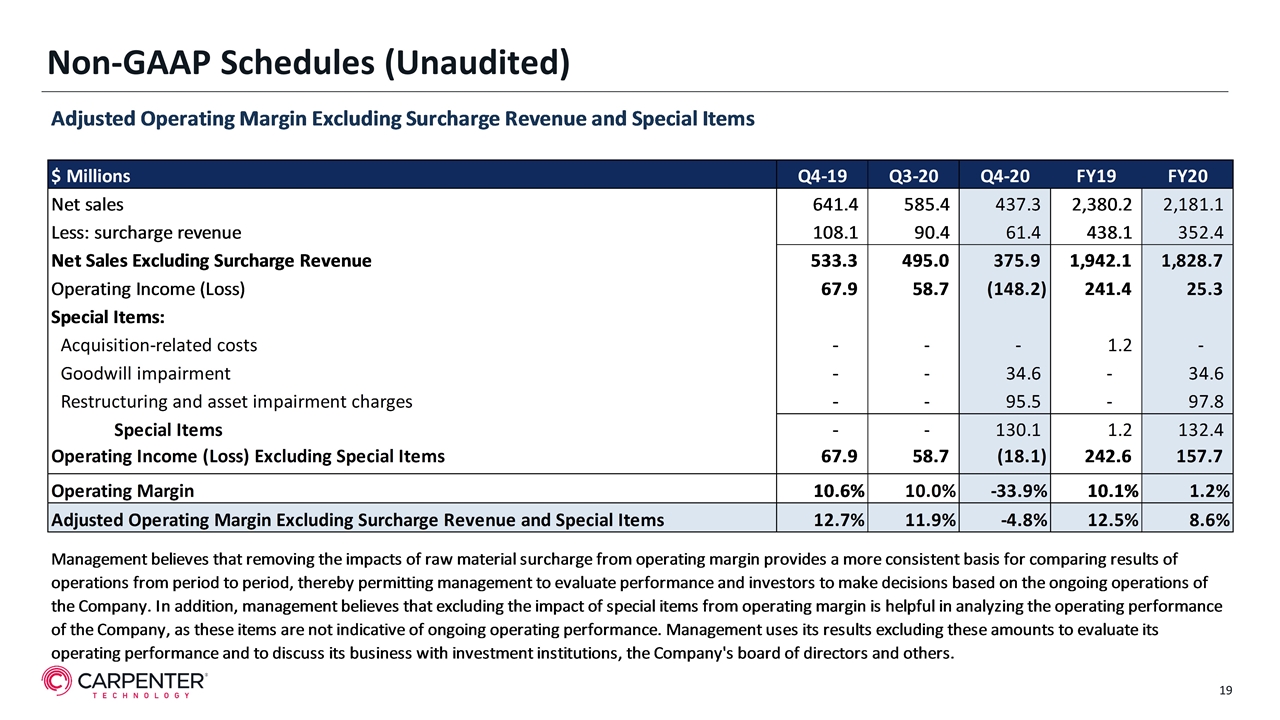
Non-GAAP Schedules (Unaudited)
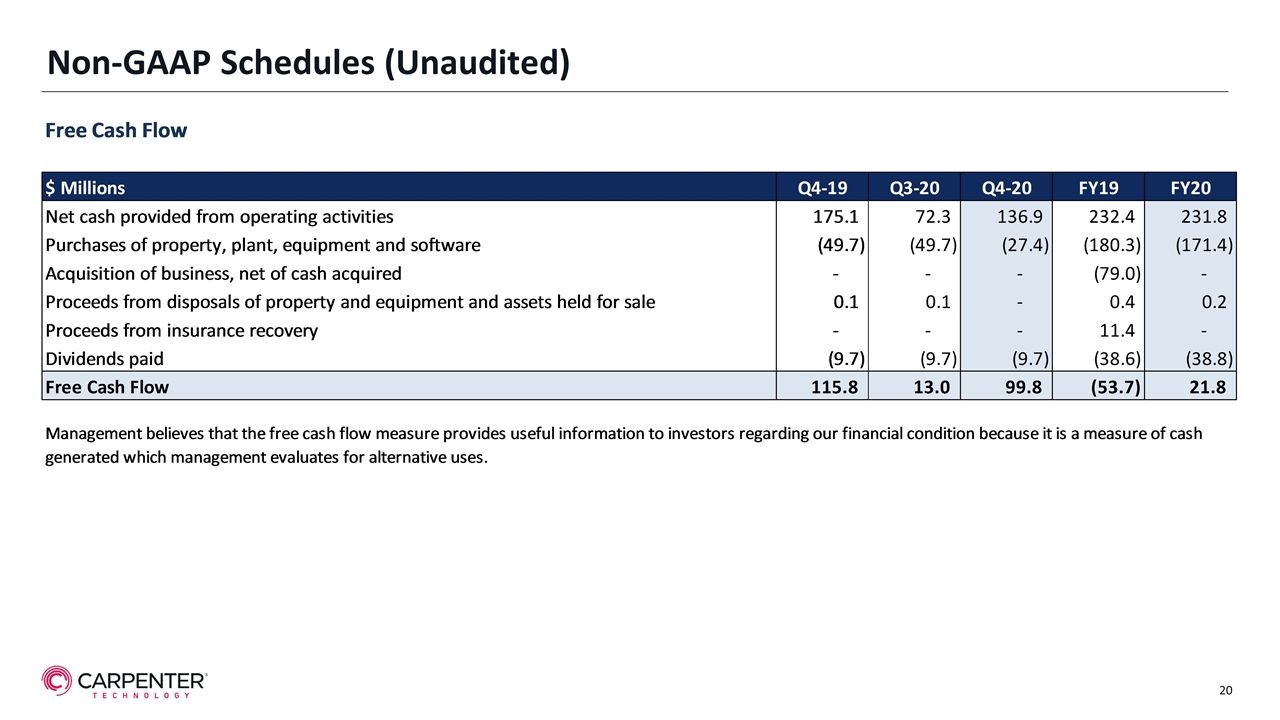
Non-GAAP Schedules (Unaudited) Free Cash Flow $ Millions Q4-19 Q3-17 Q3-20 Q4-20 FY19 FY20 Net cash provided from operating activities 175.1 61.3 72.3 136.9 232.4 231.8 Purchases of property, plant, equipment and software -49.7 -18 -49.7 -27.4 -,180.3 -,171.4 Acquisition of business, net of cash acquired 0 -35.299999999999997 0 0 -79 0 Proceeds from disposals of property and equipment and assets held for sale 0.1 0 0.1 0 0.4 0.2 Proceeds from insurance recovery 0 0 0 11.4 0 Dividends paid -9.6999999999999993 -8.6 -9.6999999999999993 -9.6999999999999993 -38.6 -38.799999999999997 Free Cash Flow 115.79999999999998 5.7000000000000011 12.999999999999996 99.8 -53.70000000000001 21.800000000000011 Management believes that the free cash flow measure provides useful information to investors regarding our financial condition because it is a measure of cash generated which management evaluates for alternative uses.
