Attached files
| file | filename |
|---|---|
| 8-K - 8-K - PACIFIC PREMIER BANCORP INC | ppbi-20200619.htm |

Exhibit 99.1 Investor Presentation June 22, 2020 Steve Gardner Chairman, President & Chief Executive Officer sgardner@ppbi.com 949-864-8000 Ronald J. Nicolas, Jr. Sr. EVP & Chief Financial Officer rnicolas@ppbi.com 949-864-8000
FORWARD LOOKING STATEMENTS AND WHERE TO FIND MORE INFORMATION Forw ard Looking Statements Thi s investor presentation contains “forward-looki ng statements” within the meani ng of the P ri va te Securities Li ti gation Reform A ct of 1995 regarding the fi nanci al condition, results of operations, business plans and the future performance of PacificPremier Bancorp, Inc. (“PPBI” or the “Company”), incl uding its wholl y-owned subsidiary Pacific P rem ie r Bank (“Pacific Premier”). Words su ch as “anticipates,” “believes,” “e stim ate s,” “e xpe cts,” “fo re ca sts,” “i ntends,” “plans,” “proj ects,” “could,” “ma y , ” “shoul d,” “will”or other similar words and expressions are intended to identify these forward- looking statements. T he se forward-looking statements are based on PPBI’s current expectations and beliefs concerning future devel opments and thei r potential effects on the Company incl uding, wi thout limitation, pl ans, strategies and goal s, and statements about the Company’s expectations regarding revenue and a sse t growth, financi al performance and profitability, l oan and deposi t growth, yields and returns, loan di ve rsi fi ca tio n and credi t management, stockholder valu e creation, tax rates and the impact of the acqui si tion of Opus Bank (“Opus” or “OPB”) and otheracquisitions. B e cau se forward-looking statem ents relate to future re sul t s and occurrences, they are subject to inherent uncertainties, ri sks, and changes in ci rcum sta nce s that a re difficult to predi ct. Many po ssi bl e events or factors coul d affect PPBI’s future financial re sul ts and performance and coul d cau se actual re sul ts or performance to di ffer materially from anticipated re sul ts orperformance. The COVID-19 pandemi c isadversely affecting u s, our cu stome rs, counterparties, empl oyees, and thi rd-party se rvi ce providers, and the ul tim ate extent of the impacts on ourb u sine ss, fi nancial posi tion, re sul ts of operations, liquidity, and prospects is uncertai n. Conti nued deteriorati on in general business and economi c conditions, including further increases in unemployment rates, or turbulence in domestic or gl obal financial markets could adversel y affect our revenues and the values of our a sse ts and liabilities, reduce the availability of funding, l ead to a tightening of credi t, and further increase sto ck p ri ce volatility, whi ch coul d result in impai rment to our goodwill in future periods. In addi tion, changes to statutes, regulations, or regul atory policies or practices as a result of, orin response to COVID-19, could affect us in substantial and unpredi ctabl e wa ys, including the potential adverse impact of loan modifications and payment deferralsimplemented con si sten t with recent regulatory guidance. Other ri sks and uncertainties incl ude, but a re not limited to, the followi ng: the strength of the United States economy in general and the strength of the local economies in whi ch we con du ct operations; the effects of, and changes i n, trade, monetary and fi scal pol i cies and laws, includi ng interest rate poli ci es of the Board of Governors of the Federal Reserve S ystem ; inflation/deflation, interest rate, market and monetary fluctuations; the effect of acquisitions we ha ve made or may make, su ch as our recent a cqu i siti on of Opus, including, without limitation, the failure to achieve the expected revenue growth and/or expense savings from su ch acqui si tions, and/or the failure to effectively integrate an a cq ui si tion target into our operations; the timely devel opment of com pe ti ti ve new products and se rvi ce s and the acceptance of these products and se rvi ce s by new and exi sti ng cu stome rs; the impact of changes in financial services pol icies, laws and regulations, includi ng tho se concerning ta xe s, banking, securities and insurance, and the application thereof by regul atory bodies; the effectiveness of our ri sk management framework and quanti tati ve model s; changes in the level of our nonperforming a sse ts and charge-offs; uncertainty regarding the future of LIBOR and potential alternative reference rates, i ncluding SOFR; the effect of changes in accounting policies and practices or accounting standards, as may be adopted from time-to-time by bank regulatory agencies, the U.S. Securities and Exchange Commi ssi on (“SEC”), the Publi c Company Accounting Ove rsi gh t Board, the Fi nanci al Accounti ng Standards Board or other accounting standards se tte rs, incl uding ASU 2016-13 (T opi c 326), “Measurement of Credi t Lo sse s on Financial Instruments,” commonl y referenced as the CE CL model, whi ch has changed how we e stim ate c re di t lo sse s and may further i ncrease the requi red level of our allowance for c re di t lo sse s in future periods; po ssi b le credi t related impai rments of securities hel d by us; p o ssi ble impai rment charges to goodwi ll; the impact of current governmental efforts to restructure the U.S. fi nancial regulatory syste m, includi ng any amendments to the Dodd-Frank Wall Street Reform and Consumer Protecti on Act; changes in consumer spending, borrowing and savings habits; the effects of our lack of a di ve rsi fie d loan portfolio, includi ng the ri sks of geographi c and industry concentrations; ourability to attract deposits and other sources of liquidity; the po ssi b ili ty that we may reduce or di scontinue the payments of di vi dends on common sto ck; changes in the fi nanci al performance and/or condi tion of our borrowers; changes in the competi ti ve envi ronment among fi nanci al and bank holding companies and other financial se rvi ce providers; geopolitical condi ti ons, incl udi ng a cts or threats of terrorism, actions taken by the Uni ted States or other governments in response to a cts or threats of terrorism and/or military con fli cts, whi ch could impact bu si ne ss and economi c conditions in the Uni ted States and abroad; publi c heal th cri se s and pandemi cs, incl uding the COVID-19 pandemi c, and thei r effects on the economic and business environments in wh ich we operate, i ncluding on our c re dit quality and business operations, as wel l as the im pa ct on general economi c and financial market condi tions; cybersecurity threats and the co st of defending against them, includi ng the co sts of compli ance wi th potential legislation to combat cybersecurity at a state, nati onal or global le vel ; unanti cipated regulatory or l egal proceedings; and our abi li ty to manage the ri sk s i nvol ved in the foregoing. Additi onal factors that co uld ca u se actual re sul ts to di ffer materially f rom those expressed in the forward-looking statements are di scu sse d in the Company’s Annual Report on Fo rm 10-K for the year ended December31, 2019, its Quarterly Report on Fo rm 10-Q for the quarter ended March 31, 2020, and other filings filed with the SEC andavailable at theSEC’sInternet si te (http://www.se c.gov). The Company undertakes no obligati on to re vi se or publ i cl y release any re vi sio n or update to the se forward-looking statements to refl e ct events or ci rcum stan ce s that occur after the date on whi ch su ch statementswere made. Non-U.S. GAAP Financial Measures Thi s presentati on contains non-U.S. GAAP financial measures. Fo r purposes of Regulation G promul gated by the SEC, a non-U.S. GAAP fi nanci al measure isa numerical measure of the regi strant’s hi sto ri cal or future financial performance, financial position or ca sh fl ows that excluding amounts or is subject to adjustments that ha ve the effect of excludi ng amounts that are included in the mo st directlycomparable measure calculated and presentedin accordance wi th U.S. GAAP in the statement of income, statement of fi nanci al conditi on or statement of ca sh fl ows (or equi valent sta teme nts) of the i ssu e r; orincl udes amounts, orissubject to adjustments that have the effect of incl udi ng amounts, that are excluded f rom the m o st directly comparable measure so calculated and presented in thi s regard. U.S. GAAP refers to generall y accepted accounting principles in the Uni te d States. Pursuant to the requi rements of Regulation G, PPBI has provided reconciliations within thi s presentation, as necessary, of the non-U.S GAAP fi nanci al measures to the mo st directly comparabl e U.S. GAAP fi nanci al measures. Fo r more detai l s on PPBI’s non-U.S. GAAP measures, refer to the Appendix inthispresentation. © 2020 Pacif ic Premier Bancorp, Inc. | All rights reserved 2

PACIFIC PREMIER BANCORP, INC. Premier banking franchise in key metropolitan areas throughout the Western U.S. Corporate Overview Branch Footprint Headquarters Irvine, CA Exchange/Listing NASDAQ: PPBI Washington 16 Seattle MSA (15) (1) Market Cap. $2.0 billion Other (1) Average Daily Volume 695,316 Shares(2) 2 Washington/Oregon Portland MSA (2) Outstanding Shares 94,347,766(1) Dividend Yield (Annualized) 4.6%(1) Northern California 3 San Francisco MSA (3) # of Research Analysts 6 Analysts Client Focus Small & Mi ddle-Market Businesses Central Coast California Total Assets (as of 3/31/2020) $20.0 billion (w/ OpusBank (“OPB”))(3) 11 San Luis Obispo (9) Santa Barbara (2) Branch Network 86 Full Service Branch Locations(Including OPB) Nevada 1 Las Vegas (1) Financial Highlights 49 Southern California Balance Sheet and Capital Ratios(3) Profitability Metrics Los Angeles-Orange (31) San Diego (7) Riv erside-San Bernardino (11) Asse ts $ 20,030 ROAA 0.89% (4) Loans HFI $ 14,602 ROATCE 9.96% (4) (4) TCE / TA 8.68% Efficiency Ratio 52.6% (4) Arizona Total RBC Ratio 13.48% PTPP ROAA 2.03% 4 Phoenix (1) Scottsdale (1) Tucson (2) Note: All dollars in millions 1. Market data as of June 18, 2020 2. 3-month av erage as of June 18, 2020 3. Amounts are pro f orma for PPBI’s acquisition of OPB as if it occurred on March 31, 2020 4. Please ref er to non-U.S. GAAP reconciliation in appendix © 2020 Pacif ic Premier Bancorp, Inc. | All rights reserved 3

KEY INVESTMENT HIGHLIGHTS • One of the premier commercial bank franchises in the Western U.S. Strong • Benefits from strength and size of attractive Western U.S. and Southern California economies Franchise Completed acquisition of Opus Bank on June 1, 2020 • Comprehensive product offering targeting small & mid-market businesses • Strong risk management culture with robust governance processes and experienced credit personnel Prudent Risk • Consistent excellent asset quality metrics and better-than-peer average credit losses and nonperforming loans Management • Proactive credit risk management – limited net loan growth over the last 7 quarters • Solid profitability for Q1 2020 despite elevated provision expense from adoption of CECL ROAA of 0.89% and ROATCE of 9.96%(1) Financial • Pre-tax pre-provision income of $58.7 million(1) in Q1 2020, compared to $56.2 million(1) in Q1 2019 Performance Annualized pre-tax pre-provision ROAA of 2.03%(1) • Efficiency ratio of 52.6%(1) and noninterest expense of $64.9 million(2) – continued focus on expense management Experienced • Management team, on average over 25 years of banking experience Management • Continuous strengthening and improvement of executive and senior managers • Deep in-market relationships drive client-focused business model 1. Please ref er to non-U.S. GAAP reconciliation in appendix 2. Noninterest expense, excluding merger related expense 3. Amounts are pro f orma for PPBI’s acquisition of OPB as if it occurred on March 31, 2020 © 2020 Pacif ic Premier Bancorp, Inc. | All rights reserved 4

ENHANCED SCARCITY VALUE IN THE WESTERN U.S. • Listed below are banks and thrifts headquartered in the Western U.S. with assets between $5 and $50 billion(1) • PPBI ranks 5th in assets in the Western U.S. Note: All dollars in millions Source: S&P Global. Market data as of June 18, 2020. Financial data as of March 31, 2020 1. Def ined as banks headquartered in AZ, CA, ID, MT, OR, WA and WY with shares listed on the NASDAQ, NYSE or OTC exchanges. Sorted by total assets 2. Amounts are pro f orma for PPBI’s acquisition of OPB as if it occurred on March 31, 2020 © 2020 Pacif ic Premier Bancorp, Inc. | All rights reserved 5
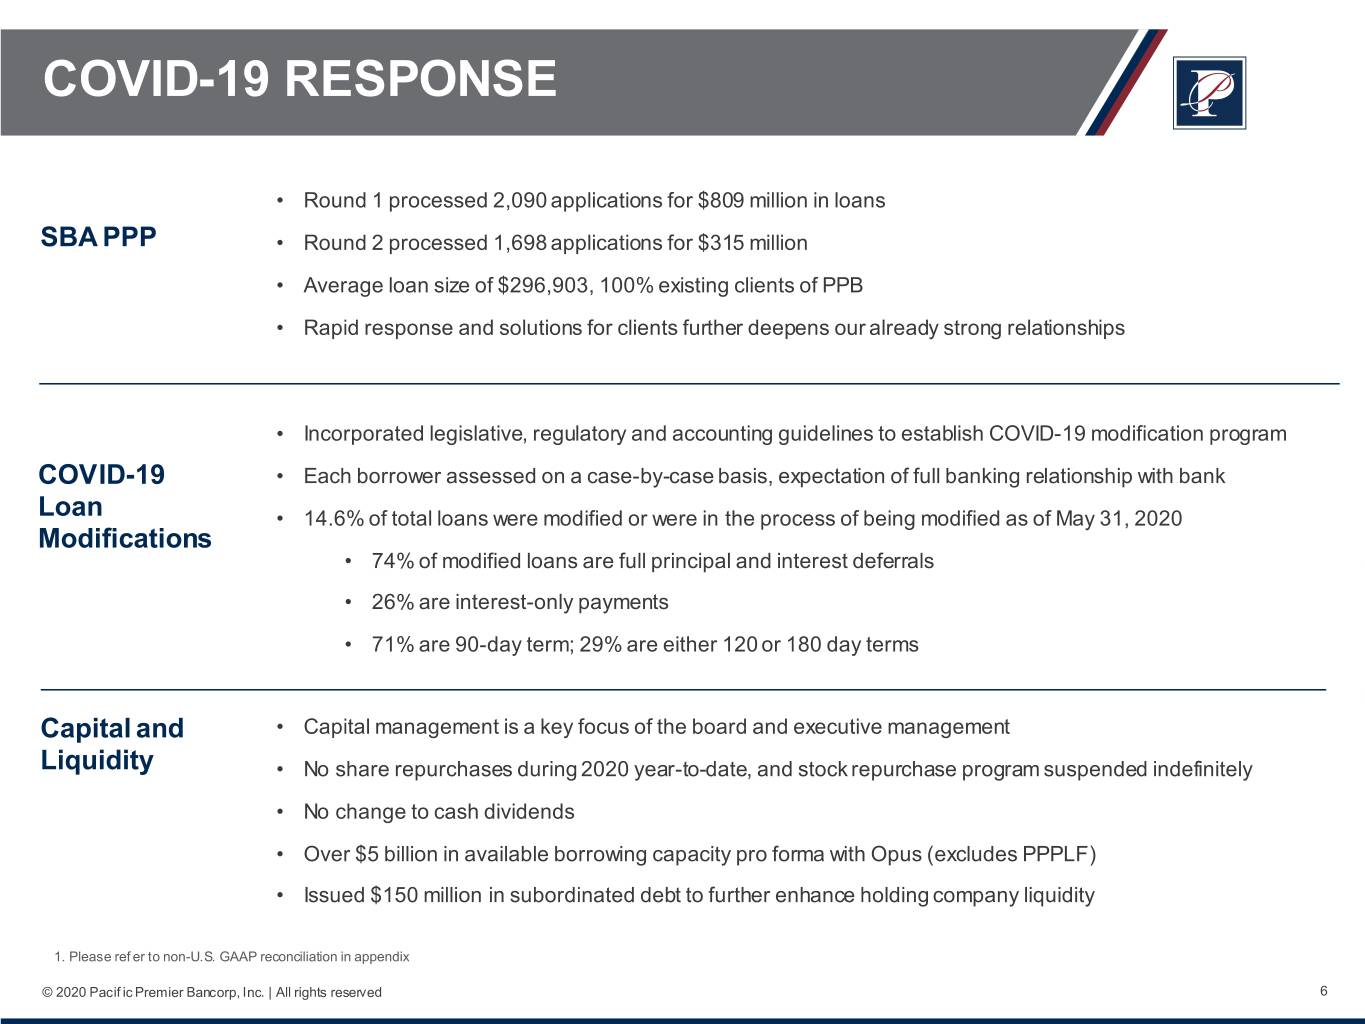
COVID-19 RESPONSE • Round 1 processed 2,090 applications for $809 million in loans SBA PPP • Round 2 processed 1,698 applications for $315 million • Average loan size of $296,903, 100% existing clients of PPB • Rapid response and solutions for clients further deepens our already strong relationships • Incorporated legislative, regulatory and accounting guidelines to establish COVID-19 modification program COVID-19 • Each borrower assessed on a case-by-case basis, expectation of full banking relationship with bank Loan • 14.6% of total loans were modified or were in the process of being modified as of May 31, 2020 Modifications • 74% of modified loans are full principal and interest deferrals • 26% are interest-only payments • 71% are 90-day term; 29% are either 120 or 180 day terms Capital and • Capital management is a key focus of the board and executive management Liquidity • No share repurchases during 2020 year-to-date, and stock repurchase program suspended indefinitely • No change to cash dividends • Over $5 billion in available borrowing capacity pro forma with Opus (excludes PPPLF) • Issued $150 million in subordinated debt to further enhance holding company liquidity 1. Please ref er to non-U.S. GAAP reconciliation in appendix © 2020 Pacif ic Premier Bancorp, Inc. | All rights reserved 6

LOAN MODIFICATIONS Loan Modifications Loan Modifications by Loan Type Commercial real estate 50.7% Multifamily 22.4% SFR and other 0.5% Franchise Commercial 21.8% and industrial 4.5% Interest-Only vs. Full Payment Deferrals by Term (in months) COVID-19 Loan Modification Approach • Established to support customers through the COVID-19 quarantines Interest- 6M Only 26.5% 4M • Needs based – not provided automatically for 3M Full Payment commercial credits Deferrals 3M 73.5% • Interest only or full payment deferral, for 3, 4 or 6 payments 6M 4M • Borrowers contacted prior to expiration to assess current condition – intent to limit further extension of original modification term when reasonable Note: Financial information as of May 31, 2020 1. Pro-Forma loan balances 2. Based on executed modification date and deferment plan selected © 2020 Pacif ic Premier Bancorp, Inc. | All rights reserved 7

CAPITAL RATIOS • Strong capitalization across all regulatory capital ratios Pro Forma Q1 2020 w/ OPB(3) Well Capitalized Q1 2020 $150 million Regulatory Q4 2019 Q1 2020 w/OPB(2) Subordinated Debt Minimum Lev el Consolidated PPBI Common Equity Ratio 17.09% 16.72% 13.31% 13.21% N/A Tangible Common Equity Ratio(1) 10.30% 10.06% 8.68% 8.62% N/A Leverage Ratio 10.54% 10.68% 9.23% 9.15% 5.00% Common Equity Tier 1 Ratio (CE T1 ) 11.35% 11.59% 10.62% 10.62% 7.00% Tier 1 Ratio 11.42% 11.66% 10.62% 10.62% 8.50% Risk Based Capital Ratio 13.81% 14.23% 13.48% 14.40% 10.50% Pacific Premier Bank Leverage Ratio 12.39% 12.54% 10.36% 10.28% 5.00% Common Equity Tier 1 Ratio (CET1) 13.43% 13.70% 11.93% 11.93% 7.00% Tier 1 Ratio 13.43% 13.70% 11.93% 11.93% 8.50% Risk Based Capital Ratio 13.83% 14.28% 13.51% 13.51% 10.50% 1. Please ref er to non-U.S. GAAP reconciliation in appendix 2. Amounts are pro f orma for PPBI’s acquisition of OPB as if it occurred on March 31, 2020 3. Pro f orma as of March 31, 2020 for $150 million in subordinated debt sold in June 2020. Net cash proceeds of $147.4 million (after underwriting discounts and other assumed expenses) is assumed to carry a 0% risk-weighting. © 2020 Pacif ic Premier Bancorp, Inc. | All rights reserved 8

Opus Bank Acquisition Closed June 1, 2020
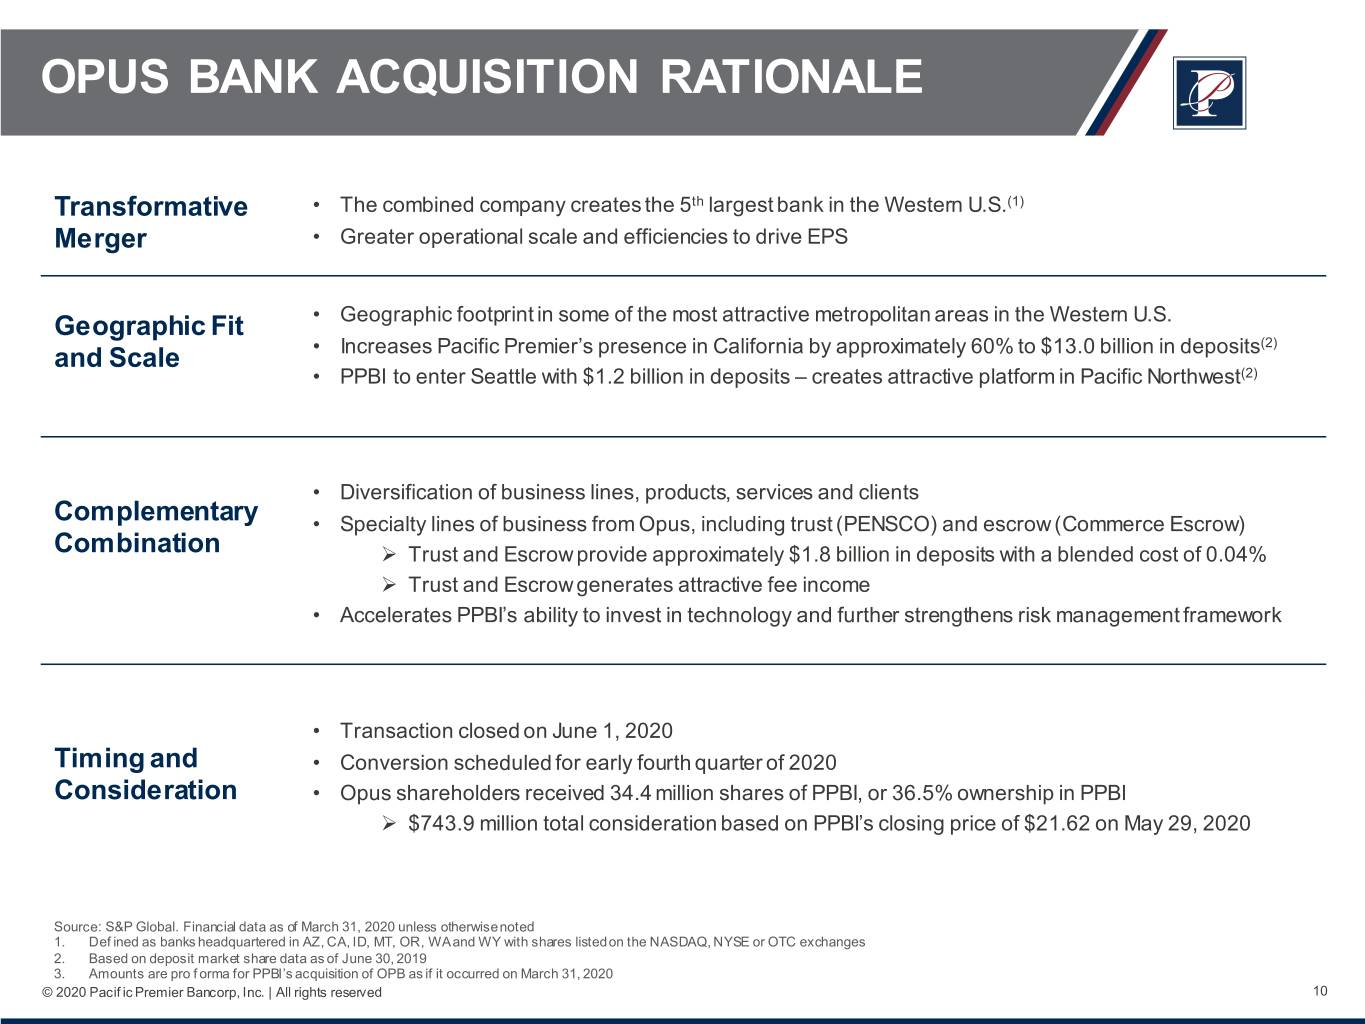
OPUS BANK ACQUISITION RATIONALE Transformative • The combined company creates the 5th largest bank in the Western U.S.(1) Merger • Greater operational scale and efficiencies to drive EPS • Geographic footprint in some of the most attractive metropolitan areas in the Western U.S. Geographic Fit • Increases Pacific Premier’s presence in California by approximately 60% to $13.0 billion in deposits(2) and Scale • PPBI to enter Seattle with $1.2 billion in deposits – creates attractive platform in Pacific Northwest(2) • Diversification of business lines, products, services and clients Complementary • Specialty lines of business from Opus, including trust (PENSCO) and escrow (Commerce Escrow) Combination Trust and Escrow provide approximately $1.8 billion in deposits with a blended cost of 0.04% Trust and Escrow generates attractive fee income • Accelerates PPBI’s ability to invest in technology and further strengthens risk management framework • Transaction closed on June 1, 2020 Timing and • Conversion scheduled for early fourth quarter of 2020 Consideration • Opus shareholders received 34.4 million shares of PPBI, or 36.5% ownership in PPBI $743.9 million total consideration based on PPBI’s closing price of $21.62 on May 29, 2020 Source: S&P Global. Financial data as of March 31, 2020 unless otherwise noted 1. Def ined as banks headquartered in AZ, CA, ID, MT, OR, WA and WY with shares listed on the NASDAQ, NYSE or OTC exchanges 2. Based on deposit market share data as of June 30, 2019 3. Amounts are pro f orma for PPBI’s acquisition of OPB as if it occurred on March 31, 2020 © 2020 Pacif ic Premier Bancorp, Inc. | All rights reserved 10

ATTRACTIVE FUNDING PROFILE Pro Forma(1) Noninterest- NOW & Interest- Bearing Demand Bearing Demand Noninterest- 12.5% 20.7% Bearing Demand Noninterest- 43.4% Bearing Demand 30.3% CDs 12.6% NOW & CDs Interest- 11.8% Bearing Demand NOW & Interest- 40.1% CDs Bearing Demand 12.2% MMDA & 6.4% MMDA & MMDA & Savings 34.8% Savings Savings 36.9% 38.5% Total Deposits: $9.1 Billion Total Deposits: $6.7 Billion Total Deposits: $15.8 Billion MRQ Cost of Deposits: 0.48% MRQ Cost of Deposits: 0.91% MRQ Cost of Deposits: 0.66% • $1.8 billion in deposits with a blended deposit cost of • Greater deposit diversification 0.04% from PENSCO and Commerce Escrow divisions • Ability to run-off and replace Opus’ higher-cost funding • Strong pro forma core deposit franchise with core deposits at PPBI Note: Financial information as of March 31, 2020 1. Excludes purchase accounting adjustments © 2020 Pacif ic Premier Bancorp, Inc. | All rights reserved 11

DIVERSIFIES PPBI’S REVENUE STREAM Noninterest Income • 3x increase in PPBI’s pro forma noninterest income to 0.45% 0.42% $100 ~$82 million(1) $90 0.40% $80 0.35% $82 $70 • 11% of pro forma operating revenue from noninterest 0.30% $60 income 0.23% $50 0.25% $56 $40 • $1.8 billion in deposits with a blended deposit cost of 0.20% $30 $20 0.04% 0.15% $27 $10 0.10% $- • Meaningful opportunities to expand both lines of PPBI OPB Pro Forma (1) business over time Noninterest Income Noninterest Income / Average Assets Specialized Lines of Business Pro Forma Operating Revenue Opus Noninterest Income Mix (% of Total) (% of Total) Pacific Premier Trust Commerce Escrow 21% • Previously PENSCO Trust Company • Escrow company with 1031 exchange practice • IRA custodian for alternative assets, such as private equity or real estate • Synergies with PPBI’s existing escrow held in retirement accounts deposit business 11% $56mm Annualized • $14 billion in assets under custody • Provides the bank with $500 million in Q1 2020 deposits at 0.09% cost of funds 6% • 45,000 customer accounts • $6 million in fee income (annualized • Stable source of low-cost core deposits based on Q1 results) • $29 million fee income (annualized • Acquired by Opus in 2015 PPBI OPB Pro Forma (1) based on Q1 results) • Acquired by Opus in 2016 Note: All dollars in millions. Financial information for three months ended March 31, 2020 Note: Noninterest income excludes gain on sale of investment securities 1. Includes $1.0 million reduction in interchange fees due to Durbin Amendment © 2020 Pacif ic Premier Bancorp, Inc. | All rights reserved 12

LOAN PORTFOLIO COMPOSITION • Diversified loan portfolio with $14.7 billion(1) in outstanding loans • 80.0%(1) of loan portfolio is real estate secured PPBI w/ OPB(1) Weighted PPBI Average Q1 2020 Q1 2020 % of (2) Non-CRE Balance Balance Total Rates 21.9% Investor real estate secured Loans by CRE non-owner occupied $ 2,040,198 $ 2,803,259 19.0 % 4.47 % (1) Type Multifamily 1,625,682 5,537,969 37.6 4.16 Construction and land 377,525 426,778 2.9 5.65 SBA secured by real estate(3) 61,665 65,044 0.4 6.46 CRE Total investor real estate secured 4,105,070 8,833,050 59.9 4.35 78.1% Business real estate secured CRE owner-occupied 1,887,632 2,201,053 14.9 4.68 Franchise real estate secured 371,428 371,428 2.5 5.30 SBA secured by real estate(4) 83,640 105,202 0.7 6.25 Total business real estate secured 2,342,700 2,677,684 18.2 4.83 Comme rcial Commercial and industrial 1,458,969 2,326,007 15.8 4.23 Franchise non-real estate secured 547,793 547,793 3.7 5.71 SBA non-real estate secured 16,265 25,362 0.2 6.56 Total commercial 2,023,027 2,899,162 19.7 4.53 Los Angeles 26.6% Consumer Single family residential 237,180 285,088 1.9 4.67 Consumer 46,892 50,076 0.3 3.36 Other States 14.1% Orange Total consumer 284,072 335,163 2.3 4.47 Loans by County Total (1)(5) Geography 12.1% California Total loans held for investment $ 8,754,869 $ 14,745,059 100.0 % 4.47 % AZ 73.4% 6.1% WA 6.4% Note: All dollars in thousands Note: SBA loans are unguaranteed portion and represent approximately 20% of principal balance for the respective borrower Other CA 1. Amounts are pro forma for PPBI’s acquisition of OPB as if it occurred on March 31, 2020, excluding purchase 34.7% accounting adjustments 2. As of March 31, 2020 and excludes the impact of fees, discounts and premiums 3. SBA loans that are collateralized by hotel/motel real property 4. SBA loans that are collateralized by real property other than hotel/motel real property 5. Based on state of primary real property collateral if available, otherwise borrower address is used. All California information is for respective county © 2020 Pacif ic Premier Bancorp, Inc. | All rights reserved 13

PPB Standalone Loan Portfolio

MANAGED LOAN GROWTH • Prudent, limited net loan growth and proactive credit risk management • PPBI has considered risks of growth at late stages of an economic cycle $16.0 June 2020 Opus Bank ($6.0B loans(1)) $14.6 $14.0 July 2018 $12.0 Acquired Grandpoint No significant organic net loan growth over last 7 quarters Capital, Inc. Nov ember 2017 ($2.4B loans) Acquired Plaza Bancorp $10.0 ($1.1B loans) $8.8 $8.8 $8.9 $8.8 $8.8 $8.7 $8.8 April 2017 $8.0 Acquired Heritage Oaks Bancorp ($1.4B loans) $6.2 $6.2 $6.3 $6.0 $4.9 $5.0 $4.0 $3.4 $2.0 $0.0 Q1 2017 Q2 2017 Q3 2017 Q4 2017 Q1 2018 Q2 2018 Q3 2018 Q4 2018 Q1 2019 Q2 2019 Q3 2019 Q4 2019 Q1 2020 Q1 2020 w/ OPB(2) Loans Held for Investment Note: All dollars in billions 1. Loan balance as of March 31, 2020 2. Amount is pro f orma for PPBI’s acquisition of OPB as if it occurred on March 31, 2020 © 2020 Pacif ic Premier Bancorp, Inc. | All rights reserved 15

LOAN PORTFOLIO COMPOSITION • Diversified loan portfolio with $8.8 billion loans outstanding • 76.4% of loan portfolio is real estate secured SBA non-real estate secured Single family residential Weighted 2.7% 0.2% Consumer % of Average 0.5% Franchise non-real Balance Total Rates (1) estate secured (dollars in thousands) 6.2% CRE non- Investor real estate secured Commercial owner CRE non-owner occupied $ 2,040,198 23.3% 4.50% Loans by and industrial occupied 16.7% Multifamily 1,625,682 18.6% 4.27% Type 23.3% Construction and land 377,525 4.3% 5.76% SBA secured by real estate (3) SBA secured by real estate (2) 61,665 0.7% 6.49% 1.0% Total investor real estate secured 4,105,070 46.9% 4.56% Multifamily Franchise 18.6% real estate CRE owner- Business real estate secured secured occupied 4.2% 21.6% CRE owner-occupied 1,887,632 21.6% 4.77% Construction and land Franchise real estate secured 371,428 4.2% 5.30% 4.3% SBA secured by real estate (3) 83,640 1.0% 6.67% SBA secured by real estate (2) Total business real estate secured 2,342,700 26.8% 4.92% 0.7% Commercial Commercial and industrial 1,458,969 16.7% 4.75% Franchise non-real estate secured 547,793 6.2% 5.71% WA Other States 1.5% SBA non-real estate secured 16,265 0.2% 6.86% 16.3% Los Angeles 22.3% NV Total commercial 2,023,027 23.1% 5.02% 2.2% Loans by Total Consumer AZ 5.4% Geography* California Single family residential 237,180 2.7% 4.65% Other CA Orange 74.7% 5.2% County Consumer 46,892 0.5% 3.26% Ventura 11.7% 1.4% Total consumer 284,072 3.2% 4.43% Santa Riverside Barbara San 8.8% Total loans held for investment $ 8,754,869 100.0% 4.76% 4.9% Diego San Luis 8.1% Obispo San Bernardino Note: SBA loans are unguaranteed portion and represent approximately 20% of principal balance for the respective borrower 6.8% 5.5% 1. As of 3/31/2020 and excluding the impact of fees, discounts and premiums *Based on state of primary real property collateral if available, otherwise borrower address is used. All California 2. SBA loans that are collateralized by hotel/motel real property information is for respective county. 3. SBA loans that are collateralized by real property other than hotel/motel real property © 2020 Pacif ic Premier Bancorp, Inc. | All rights reserved 16

INVESTOR REAL ESTATE SECURED: CRE NON-OWNER OCCUPIED Portfolio Characteristics – CRE Non-Owner Occupied Other Hotel and Loan Balance Outstanding* $2.0 billion 16% Motel 17% Number of Loans 1,158 By Industrial Average Loan Size $1.8 million 12% Property Retail Type 26% Loan-to-Value (Weighted Average) 50% DSCR (Weighted Average) 2.2x Office 29% Seasoning (Weighted Average) 45 months Net Charge-Offs in 2019 0.03% *Excludes SBA loans WA Portfolio Fundamentals 2% Other NV States 3% Los 8% • Loans to seasoned ow ners and managers of income producing real estate Angeles AZ 20% w ho have w eathered past dow nturns 10% • Core competency for PPBI, an asset class w hich performed w ell for the bank By Other CA 4% during the Great Recession of 2008 Geography Orange (1) Ventura County 1% 12% • Secured by seasoned properties w ith stabilized cash flow s Santa Barbara • Properties located in job centers, w ith emphasis on metro markets and 5% San Luis supporting suburbs, primarily in California and Western states Obispo Riverside 12% San Diego 6% 12% • Strong underw riting standards w ith minimum DSCR of 1.25x and maximum loan-to-value of 75%, majority w ith personal guarantees San Bernardino 4% • Global cash flow and global DSCR for all loans over $1 million • Disciplined underw riting uses the lesser of actual or market rents and market vacancy, not projections or pro formas 1. Based on state of primary real property collateral if available, otherwise borrower address is • 79% of loans are to borrow ers w ho maintain a deposit relationship used. All California information is for respective county. © 2020 Pacif ic Premier Bancorp, Inc. | All rights reserved 17

INVESTOR REAL ESTATE SECURED: CRE NON- OWNER OCCUPIED (“NOO”) RETAIL AND OFFICE Portfolio Characteristics – Re tail and Office CRE NOO WA Other Re tail Office Other Los HotelAngeles and 2% States 16% 30%Motel 9% 17% NV Loan Balance Outstanding* $529 million $592 million Retail: 4% Number of Loans 329 246 Industrial AZ 12% By Retail Orange Average Loan Size $1.6 million $2.4 million Geography 10%26% County (1) 6% Loan-to-Value (Weighted Average) 47% 55% Other CA Riverside 4% SanOffice 9% Ventura DSCR (Weighted Average) 2.3x 1.9x Diego29% 2% 7% Santa San Bernardino Seasoning (Weighted Average) 45 months 35 months Barbara 4% 4% San Luis Obispo Net Charge-Offs in 2019 0.00% 0.00% 8% *Excludes SBA loans Portfolio Fundamentals WA Other Los Angeles 2% States 17% 8% Office: NV • Disciplined underw riting uses the lesser of actual or market rents and market 3% vacancy, w hile considering lease expirations, rollover risk and capital costs By AZ Orange Other CA 8% County Retail Geography 1% (1) 23% • PPBI lends on seasoned Class B and C neighborhood centers in w ell Ventura established higher density markets 1% Santa Barbara San Luis • No exposure to malls and minimal exposure to big-box retailers 4% Obispo San Riverside 14% Diego 5% Office 9% San Bernardino • PPBI lends on seasoned Class B and C properties located near job centers, 4% w ith emphasis on metro markets and supporting suburbs • Properties are generally low -rise and garden-style, w ith minimal exposure to 1. Based on state of primary real property collateral if available, otherwise borrower address is used. All California information is for respective county Class A high-rise projects © 2020 Pacif ic Premier Bancorp, Inc. | All rights reserved 18

INVESTOR REAL ESTATE SECURED: CRE NOO / SBA HOTEL / MOTEL Portfolio Characteristics – Hotel / Motel CRE, non-SBA Loan Balance Outstanding, Total $418 million 85% CRE, non-SBA SBA SBA vs . Loan Balance Outstanding $356 million $62 million non-SBA Number of Loans 112 111 SBA 15% Average Loan Size $3.2 million $555,000 Loan-to-Value (Weighted Average) 47% 70% DSCR (Weighted Average) 2.0x 1.5x Seasoning (Weighted Average) 57 months 33 months Net Charge-Offs in 2019 0.18% 1.08% NV 3% Los Angeles Other States 5% 18% Portfolio Fundamentals AZ 8% Orange County Other CA 7% • No exposure to large conference center hotels, large resorts or casinos 7% By Geography Riverside • Mix of flagged properties and boutique hotels w ithout significant exposure to (1) 4% Santa central business districts Barbara San • Loans to seasoned hotel operators, generally w ith significant resources and 9% Bernardino San Luis San Diego experience w eathering past dow nturns Obispo 20% 1% 19% • Underw riting consistent w ith management’s conservative approach to Investor Secured CRE, emphasizing actual results and not relying on projections or positive market trends Note: SBA loans are unguaranteed portion and represent approximately 20% of principal balance for the respective borrower • SBA represents the retained, unguaranteed portion of approximately 20% of 1. Based on state of primary real property collateral if available, otherwise borrower address is used. All California information is for respective county the total outstanding balance © 2020 Pacif ic Premier Bancorp, Inc. | All rights reserved 19

INVESTOR REAL ESTATE SECURED: MULTIFAMILY Portfolio Characteristics – Multifamily Geographic Distribution Loan Balance Outstanding $1.6 billion Number of Loans 818 Average Loan Size $2.0 million Loan-to-Value (Weighted Average) 57% Other DSCR (Weighted Average) 1.7x States 15% Los Angeles 35% Seasoning (Weighted Average) 35 months WA4% NV 4% Net Charge-Offs in 2019 0.00% AZ 7% Portfolio Fundamentals Other CA Orange 8% County San 7% • Loans to seasoned ow ners of multifamily properties w ith significant operating Diego 9% experience Santa Barbara • Core competency for PPBI, an asset class w hich performed w ell for the bank Riverside 1% during the Great Recession of 2008 5% San Luis San Bernardino • Disciplined underw riting uses the lesser of actual or market rents and market Obispo 4% vacancy, not projections or positive market rent trends 1% • Loans are typically guaranteed by principals or entities w ith significant net w orth and liquidity • Limited non-recourse lending reflects seasoned stabilized properties w ith modest leverage and strong operating results • 71% of multifamily loans are secured by real estate is in California © 2020 Pacif ic Premier Bancorp, Inc. | All rights reserved 20
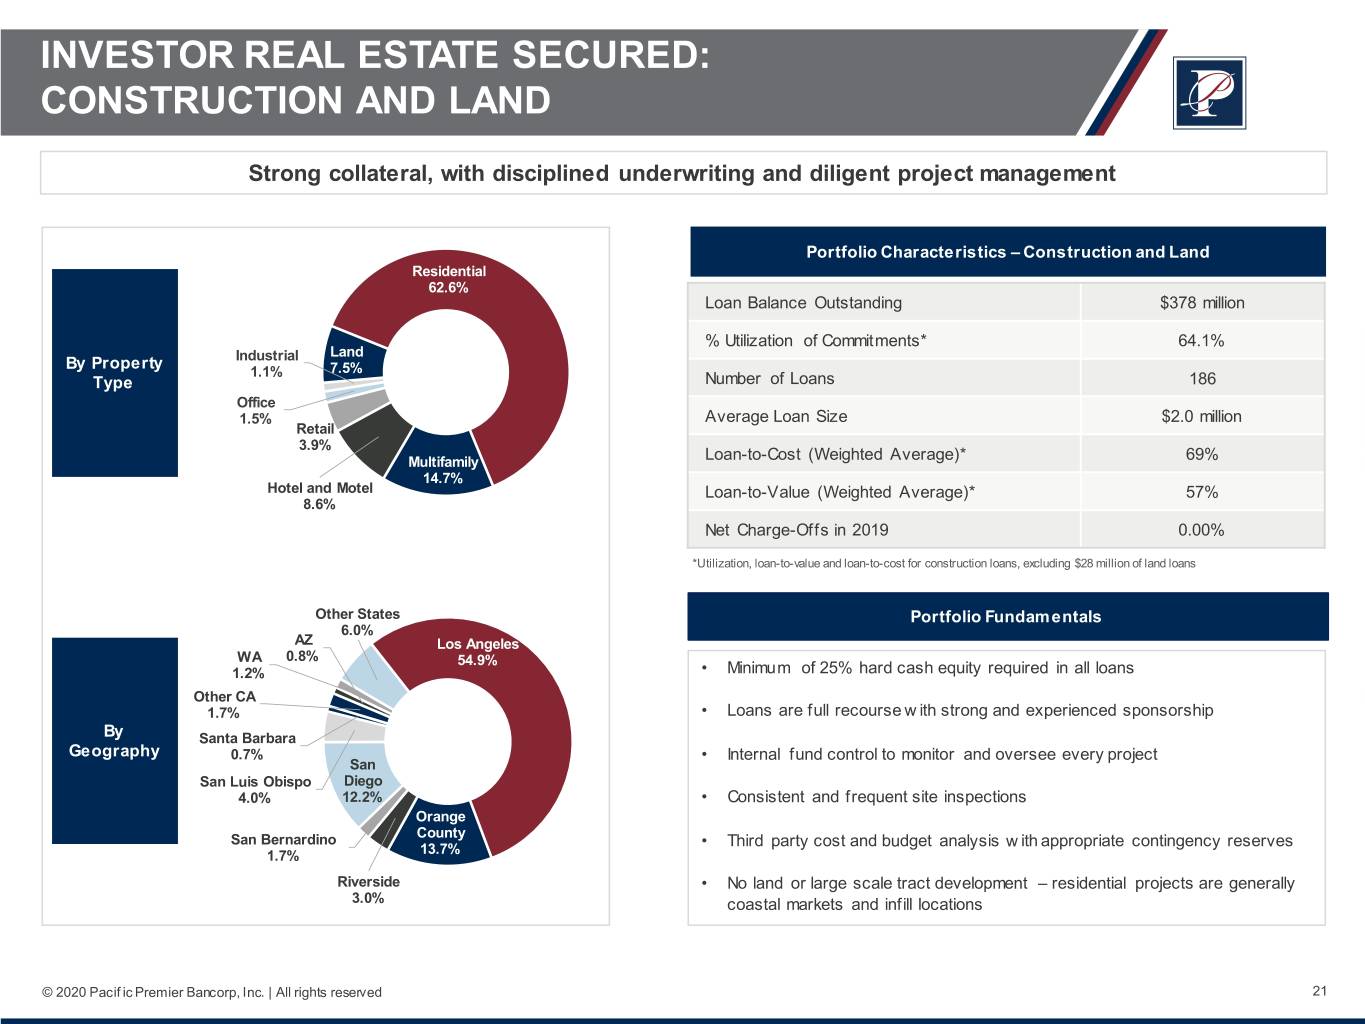
INVESTOR REAL ESTATE SECURED: CONSTRUCTION AND LAND Strong collateral, with disciplined underwriting and diligent project management Portfolio Characteristics – Construction and Land Residential 62.6% Loan Balance Outstanding $378 million % Utilization of Commitments* 64.1% Land By Property Industrial 1.1% 7.5% Type Number of Loans 186 Office 1.5% Average Loan Size $2.0 million Retail 3.9% Multifamily Loan-to-Cos t (Weighted Average)* 69% 14.7% Hotel and Motel Loan-to-Value (Weighted Average)* 57% 8.6% Net Charge-Offs in 2019 0.00% *Utilization, loan-to-value and loan-to-cost for construction loans, excluding $28 million of land loans Other States Portfolio Fundamentals 6.0% AZ Los Angeles WA 0.8% 54.9% 1.2% • Minimum of 25% hard cash equity required in all loans Other CA 1.7% • Loans are full recourse with strong and experienced sponsorship By Santa Barbara Geography 0.7% • Internal fund control to monitor and oversee every project San San Luis Obispo Diego 4.0% 12.2% • Consistent and frequent site inspections Orange San Bernardino County • Third party cost and budget analysis w ith appropriate contingency reserves 1.7% 13.7% Riverside • No land or large scale tract development – residential projects are generally 3.0% coastal markets and infill locations © 2020 Pacif ic Premier Bancorp, Inc. | All rights reserved 21

BUSINESS REAL ESTATE SECURED: CRE OWNER OCCUPIED Portfolio Characteristics – CRE Owner Occupied Accommodation and Other Food Services Real Estate Services 6% Loan Balance Outstanding* $1.9 billion 10% 9% Construction 6% Retail Number of Loans 1,569 Trade 12% Educational Services By 5% Average Loan Size $1.2 million Industry(1) Agriculture Health 5% Loan-to-Value (Weighted Average) 53% Care 13% Wholesale Trade 5% DSCR (Weighted Average) 1.9x Professional Services Manufacturing 5% 13% Seasoning (Weighted Average) 43 months Entertainment 3% Other Financial Net Charge-Offs in 2019 0.00% 1% Transport and Services Administrative Warehouse 3% and Support 2% *Excludes SBA and Franchise loans 2% Other States 1% WA 1% NV Los Angeles 2% 21% AZ 5% Portfolio Fundamentals Orange Other CA County By 7% 10% • Business loans backed by ow ner occupied commercial real estate Geography (2) Ventura 3% • Properties located in job centers, w ith emphasis on metro markets and Santa Barbara supporting suburbs, primarily in California and Western states 8% Riverside 17% San Luis • Relationship borrow ers w ho are core banking clients of PPBI Obispo 9% San San Diego Bernardino • Repayment based on operating cash flow s of the business 7% 11% • Disciplined underw riting based on actual results, not projections 1 Distribution by North American Industry Classification System (NAICS) 2. Based on state of primary real property collateral if available, otherwise borrower address is used. All California • Diversified by industry and geography information is for respective county. © 2020 Pacif ic Premier Bancorp, Inc. | All rights reserved 22

COMMERCIAL AND INDUSTRIAL Portfolio Characteristics – Commercial and Industrial Financial Services Manufacturing Loan Balance Outstanding* $1.5 billion 11% 10% Construction 14% Professional Services Number of Loans 5,245 8% By Average Loan Size $278,000 (1) Industry Agriculture Real 8% Estate Number of Relationships 3,561 15% Other Other Services Average Relationship Size $819,000 8% 3% Health Care Administrative and Support 6% Net Charge-Offs in 2019 0.15% 2% Wholesale Trade *Excludes SBA and Franchise loans Entertainment 5% 2% Transport and Warehouse Retail Trade Accommodation and 2% 2% Food Services 3% WA 1% Los Angeles Other 17% NV States Portfolio Fundamentals 2% AZ 8% 3% Other CA • Lending focused on small and middle market businesses 4% Orange Ventura County • Diversified by industry and geography By 2% 23% Geography Santa (2) Barbara • 96% of borrow ers have a deposit relationship 8% • Repayment based on operating cash flow s of the business San Luis Obispo San Riverside 6% Diego 13% 7% • Disciplined underw riting based on actual results, not projections San Bernardino 5% • Minimal exposure to syndicated or leveraged loans 1 Distribution by North American Industry Classification System (NAICS) 2. Based on state of primary real property collateral if available, otherwise borrower address is used. All California information is for respective county. © 2020 Pacif ic Premier Bancorp, Inc. | All rights reserved 23
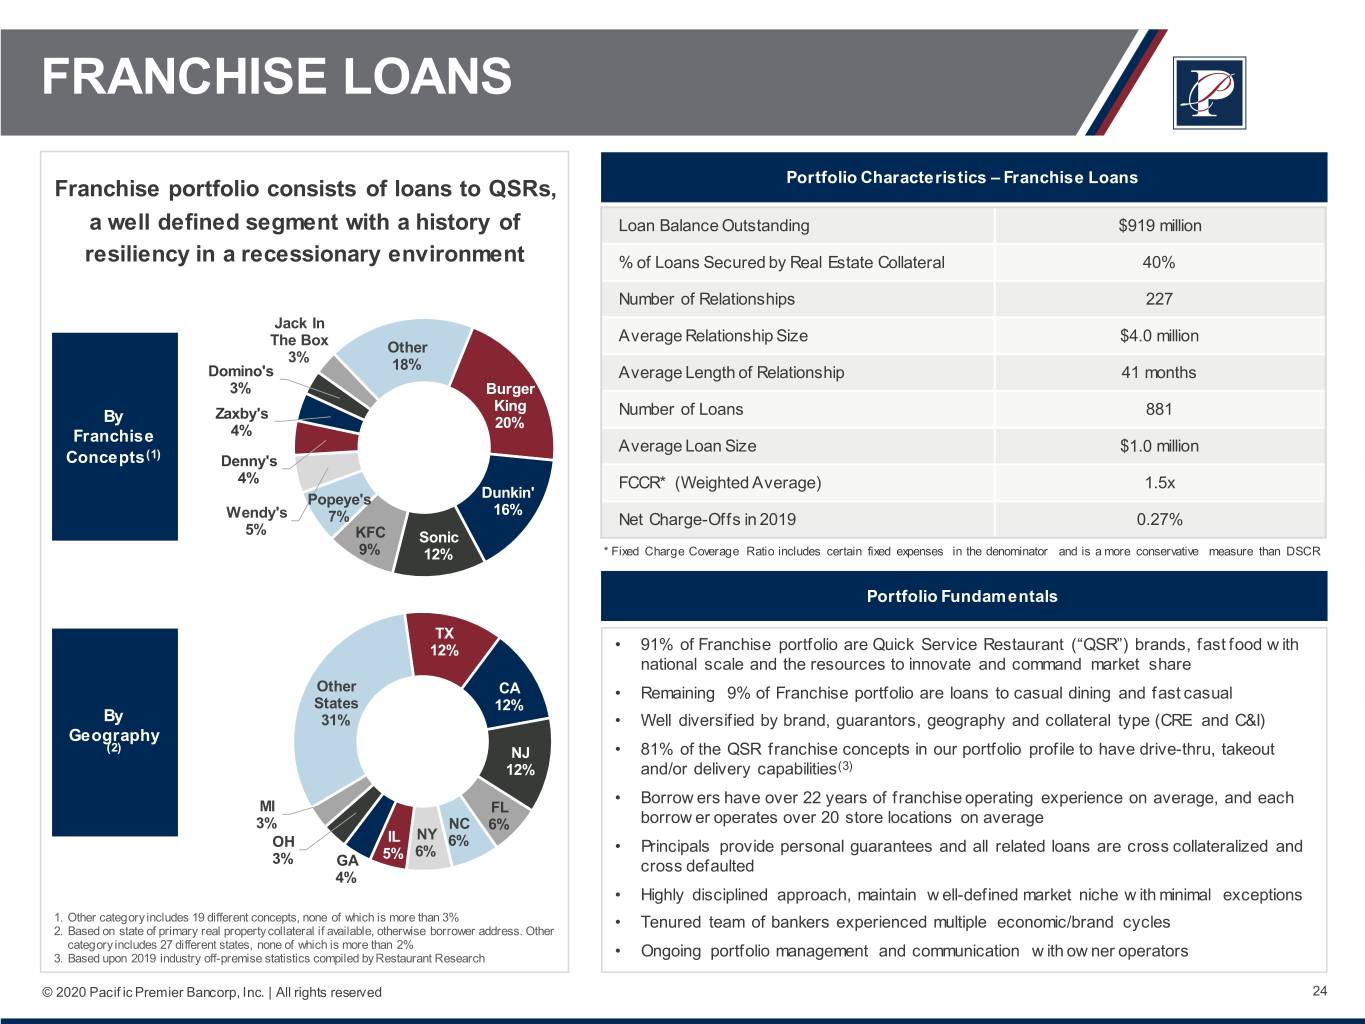
FRANCHISE LOANS Portfolio Characteristics – Franchise Loans Franchise portfolio consists of loans to QSRs, a well defined segment with a history of Loan Balance Outstanding $919 million resiliency in a recessionary environment % of Loans Secured by Real Estate Collateral 40% Number of Relationships 227 Jack In Average Relationship Size $4.0 million The Box Other 3% Domino's 18% Average Length of Relationship 41 months 3% Burger King Zaxby's Number of Loans 881 By 20% Franchise 4% Average Loan Size $1.0 million Concepts(1) Denny's 4% FCCR* (Weighted Average) 1.5x Popeye's Dunkin' 16% Wendy's 7% Net Charge-Offs in 2019 0.27% 5% KFC Sonic 9% 12% * Fixed Charge Coverage Ratio includes certain fixed expenses in the denominator and is a more conservative measure than DSCR Portfolio Fundamentals TX 12% • 91% of Franchise portfolio are Quick Service Restaurant (“QSR”) brands, fast food w ith national scale and the resources to innovate and command market share Other CA • Remaining 9% of Franchise portfolio are loans to casual dining and fast casual States 12% By 31% • Well diversified by brand, guarantors, geography and collateral type (CRE and C&I) Geography (2) NJ • 81% of the QSR franchise concepts in our portfolio profile to have drive-thru, takeout 12% and/or delivery capabilities(3) • Borrow ers have over 22 years of franchise operating experience on average, and each MI FL 3% NC 6% borrow er operates over 20 store locations on average OH IL NY 6% 5% 6% • Principals provide personal guarantees and all related loans are cross collateralized and 3% GA cross defaulted 4% • Highly disciplined approach, maintain w ell-defined market niche w ith minimal exceptions 1. Other category includes 19 different concepts, none of which is more than 3% 2. Based on state of primary real property collateral if available, otherwise borrower address. Other • Tenured team of bankers experienced multiple economic/brand cycles category includes 27 different states, none of which is more than 2% 3. Based upon 2019 industry off-premise statistics compiled by Restaurant Research • Ongoing portfolio management and communication w ith ow ner operators © 2020 Pacif ic Premier Bancorp, Inc. | All rights reserved 24

CRE TO CAPITAL CONCENTRATION RATIO Experience in managing CRE concentrations well in excess of 300% • CRE concentrations are well-managed across the organization, and semi annually stress tested CRE as a Percent of Total Capital 1000% Annualized Net Charge-Offs (1) Commercial Real Estate 0.10% 800% Multi-Family 0.05% 627% Ma na ged Growth 600% Decreased 499% Grandpoint 415% 389% Acquisition 410% 372% 362% 365%376% 400% 349% 336% 352% 340%336% 356%341%342%332% 310% 316% 326%306% 287%287%275% 295% 200% 0% 2008 2009 2010 2011 2012 2013 2014 2015 1Q'16 2Q'16 3Q'16 4Q'16 1Q'17 2Q'17 3Q'17 4Q'17 1Q'18 2Q'18 3Q'18 4Q'18 1Q'19 2Q'19 3Q'19 4Q'19 1Q'20 1Q'20 Pro Forma 1. January 1, 2009 – September 30, 2019 © 2020 Pacif ic Premier Bancorp, Inc. | All rights reserved 25

CREDIT RISK MANAGEMENT • Credit quality has historically been better than peers, even through the 2009-2011 credit cycle Nonperforming Assets to Total Assets Comparison PPBI Peers 5.00% 4.39 4.26 4.29 4.50% 4.11 4.24 4.23 4.06 3.96 4.04 4.00% 4.30 3.77 3.62 3.48 3.39 3.50% 3.26 3.21 2.93 2.96 3.00% CNB PDNB Acquisition Acquisition 2.50% 2/11/11 4/27/12 2.00% 1.70 1.58 1.66 1.67 1.62 1.36 1.31 1.50% 1.24 1.18 1.08 0.91 1.00% 0.55 0.74 0.74 1.04 0.58 0.59 0.48 0.49 0.44 0.33 0.39 0.40 0.40 0.34 0.50% 0.21 0.48 0.38 0.15 0.20 0.12 0.18 0.17 0.40 0.17 0.11 0.18 0.02 0.01 0.07 0.11 0.07 0.00% Q1 Q3 Q1 Q3 Q1 Q3 Q1 Q3 Q1 Q3 Q1 Q3 Q1 Q3 Q1 Q3 Q1 Q3 Q1 Q3 Q1 Q3 Q1 2009 2009 2010 2010 2011 2011 2012 2012 2013 2013 2014 2014 2015 2015 2016 2016 2017 2017 2018 2018 2019 2019 2020 Source: Federal Deposit Insurance Corporation (“FDIC”) Note: California peer group consists of all insured California institutions Note: As of the date of this presentation, peer data for Q1 2020 had not yet been disclosed by the FDIC © 2020 Pacif ic Premier Bancorp, Inc. | All rights reserved 26

DELINQUENT LOANS Minor increase in Q1 2020 still reflects low portfolio delinquency 30-59 Days Past Due (% of Total Loans) 60-89 Days Past Due (% of Total Loans) 90+ Days Past Due (% of Total Loans) Total Delinquent Loans / Allowance for Credit Losses © 2020 Pacif ic Premier Bancorp, Inc. | All rights reserved 27
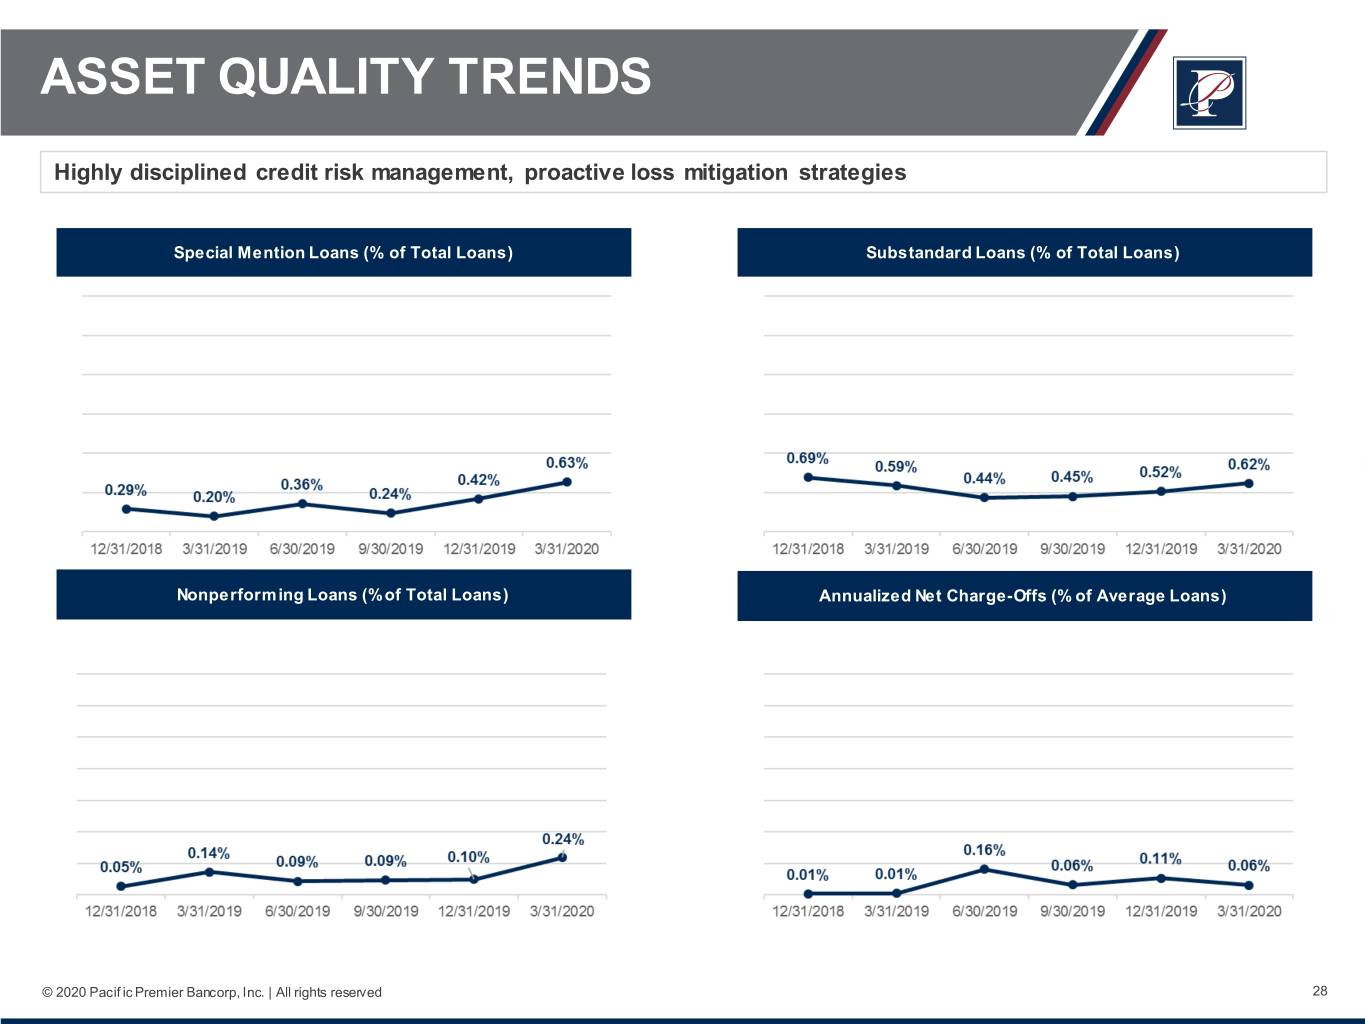
ASSET QUALITY TRENDS Highly disciplined credit risk management, proactive loss mitigation strategies Special Mention Loans (% of Total Loans) Substandard Loans (% of Total Loans) Nonperforming Loans (% of Total Loans) Annualized Net Charge-Offs (% of Average Loans) © 2020 Pacif ic Premier Bancorp, Inc. | All rights reserved 28

PPBI Q1 2020 Financial Overview
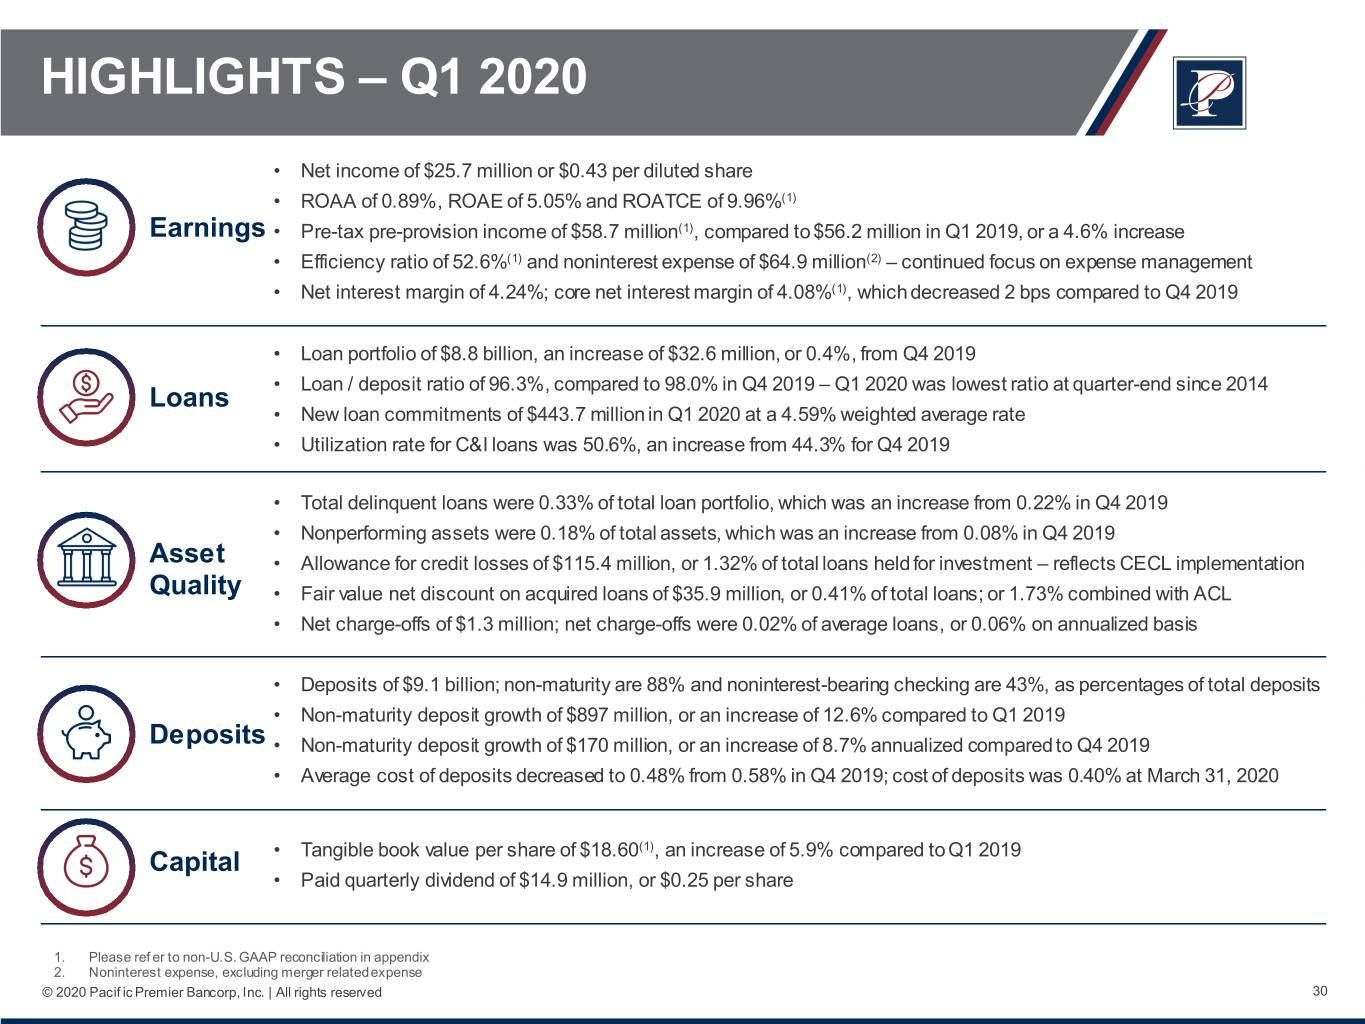
HIGHLIGHTS – Q1 2020 • Net income of $25.7 million or $0.43 per diluted share • ROAA of 0.89%, ROAE of 5.05% and ROATCE of 9.96%(1) Earnings • Pre-tax pre-provision income of $58.7 million(1), compared to $56.2 million in Q1 2019, or a 4.6% increase • Efficiency ratio of 52.6%(1) and noninterest expense of $64.9 million(2) – continued focus on expense management • Net interest margin of 4.24%; core net interest margin of 4.08%(1), which decreased 2 bps compared to Q4 2019 • Loan portfolio of $8.8 billion, an increase of $32.6 million, or 0.4%, from Q4 2019 • Loan / deposit ratio of 96.3%, compared to 98.0% in Q4 2019 – Q1 2020 was lowest ratio at quarter-end since 2014 Loans • New loan commitments of $443.7 million in Q1 2020 at a 4.59% weighted average rate • Utilization rate for C&I loans was 50.6%, an increase from 44.3% for Q4 2019 • Total delinquent loans were 0.33% of total loan portfolio, which was an increase from 0.22% in Q4 2019 • Nonperforming assets were 0.18% of total assets, which was an increase from 0.08% in Q4 2019 Asset • Allowance for credit losses of $115.4 million, or 1.32% of total loans held for investment – reflects CECL implementation Quality • Fair value net discount on acquired loans of $35.9 million, or 0.41% of total loans; or 1.73% combined with ACL • Net charge-offs of $1.3 million; net charge-offs were 0.02% of average loans, or 0.06% on annualized basis • Deposits of $9.1 billion; non-maturity are 88% and noninterest-bearing checking are 43%, as percentages of total deposits • Non-maturity deposit growth of $897 million, or an increase of 12.6% compared to Q1 2019 Deposits • Non-maturity deposit growth of $170 million, or an increase of 8.7% annualized compared to Q4 2019 • Average cost of deposits decreased to 0.48% from 0.58% in Q4 2019; cost of deposits was 0.40% at March 31, 2020 • Tangible book value per share of $18.60(1), an increase of 5.9% compared to Q1 2019 Capital • Paid quarterly dividend of $14.9 million, or $0.25 per share 1. Please ref er to non-U.S. GAAP reconciliation in appendix 2. Noninterest expense, excluding merger related expense © 2020 Pacif ic Premier Bancorp, Inc. | All rights reserved 30

CORE EARNINGS AND EFFICIENCIES • Capital generation from pre-tax pre-provision income and operating efficiencies • Since 2013: Compound annual growth for total revenue of 38% and pre-tax pre-provision income of 45%(1) Efficiency ratio improved from 64.7% to 52.6%(1) Revenue and Efficiency Ratio(1) Pre-Tax Pre-Provision Income(1) 70.0% $600.0 5.00% $235.0 $250.0 $224.1 64.7% 65.0% $494.6 $482.5 $500.0 61.3% 4.00% $192.3 $200.0 $423.7 60.0% 55.9% $400.0 55.0% 53.6% 3.00% $150.0 52.6% $131.7 $278.6 $300.0 2.19% 50.8% 1.99% 2.16% 2.03% 50.0% 51.0% 1.96% 1.94% 51.6% 2.00% 1.84% $100.0 1.62% $172.7 $200.0 $79.0 45.0% $120.7 $52.2 $87.0 1.00% $50.0 $67.3 $100.0 $33.6 40.0% $23.4 35.0% $- 0.00% $- 2013 2014 2015 2016 2017 2018 2019 Q1 2020 2013 2014 2015 2016 2017 2018 2019 Q1 2020 (2)(1) (1)(2) Total Revenue Efficiency Ratio Pre-Tax Pre-Provision Income PTPP / Average Assets Note: All dollars in millions 1. Please ref er to non-U.S. GAAP reconciliation in appendix 2. Annualized © 2020 Pacif ic Premier Bancorp, Inc. | All rights reserved 31

NET INTEREST MARGIN • Stable core net interest margin, despite challenging interest rate environment • 79% of loan portfolio is currently at the floor rate, fixed rate or fixed period adjustable rate loans Reported and Core Net Interest Margin 5.70% 5.59% 5.52% 5.56% 5.57% 5.59% 5.39%5.45% 5.44% 5.50% 5.32% 5.31% 5.27% 5.30% Loan 5.37% 5.34% 4.60% 4.48% 4.43% 4.44% 5.10% 5.28% 5.31% 5.31% 4.37% 4.36% Yields 5.18% 5.18% 5.17% 4.28% 4.33% 4.90% 5.13% 5.08% 4.40% 4.21% 4.25% 4.24% 5.04% 4.18% 4.70% 4.20% 4.24% 4.50% 4.20% 4.18% 4.21% 4.00% 4.12% 4.30% 4.09% 4.06% 4.08% 4.10% 4.08% 3.80% 3.93% 4.10% 3.60% 3.90% 3.70% 3.40% 2013 2014 2015 2016 2017 2018 Q1 Q2 Q3 Q4 Q1 3.20% 2019 2019 2019 2019 2020 3.00% Reported Loan Yield Core Loan Yield (1) 2.80% 2.60% 2013 2014 2015 2016 2017 2018 Q1 Q2 Q3 Q4 Q1 0.80% 0.73% 0.72% 2019 2019 2019 2019 2020 0.70% 0.63% 0.58% Reported Net Interest Margin Core Net Interest Margin (1) 0.60% 0.51% Cost of 0.48% Deposits 0.50% 0.40% 0.34% 0.34% 0.32% 0.28% 0.28% 0.30% 0.20% 0.10% 0.00% 2013 2014 2015 2016 2017 2018 Q1 Q2 Q3 Q4 Q1 2019 2019 2019 2019 2020 Cost of Deposits 1. Please ref er to non-U.S. GAAP reconciliation in appendix. Core net interest margin and core loan yield exclude accretion and other one-time adjustments. © 2020 Pacif ic Premier Bancorp, Inc. | All rights reserved 32
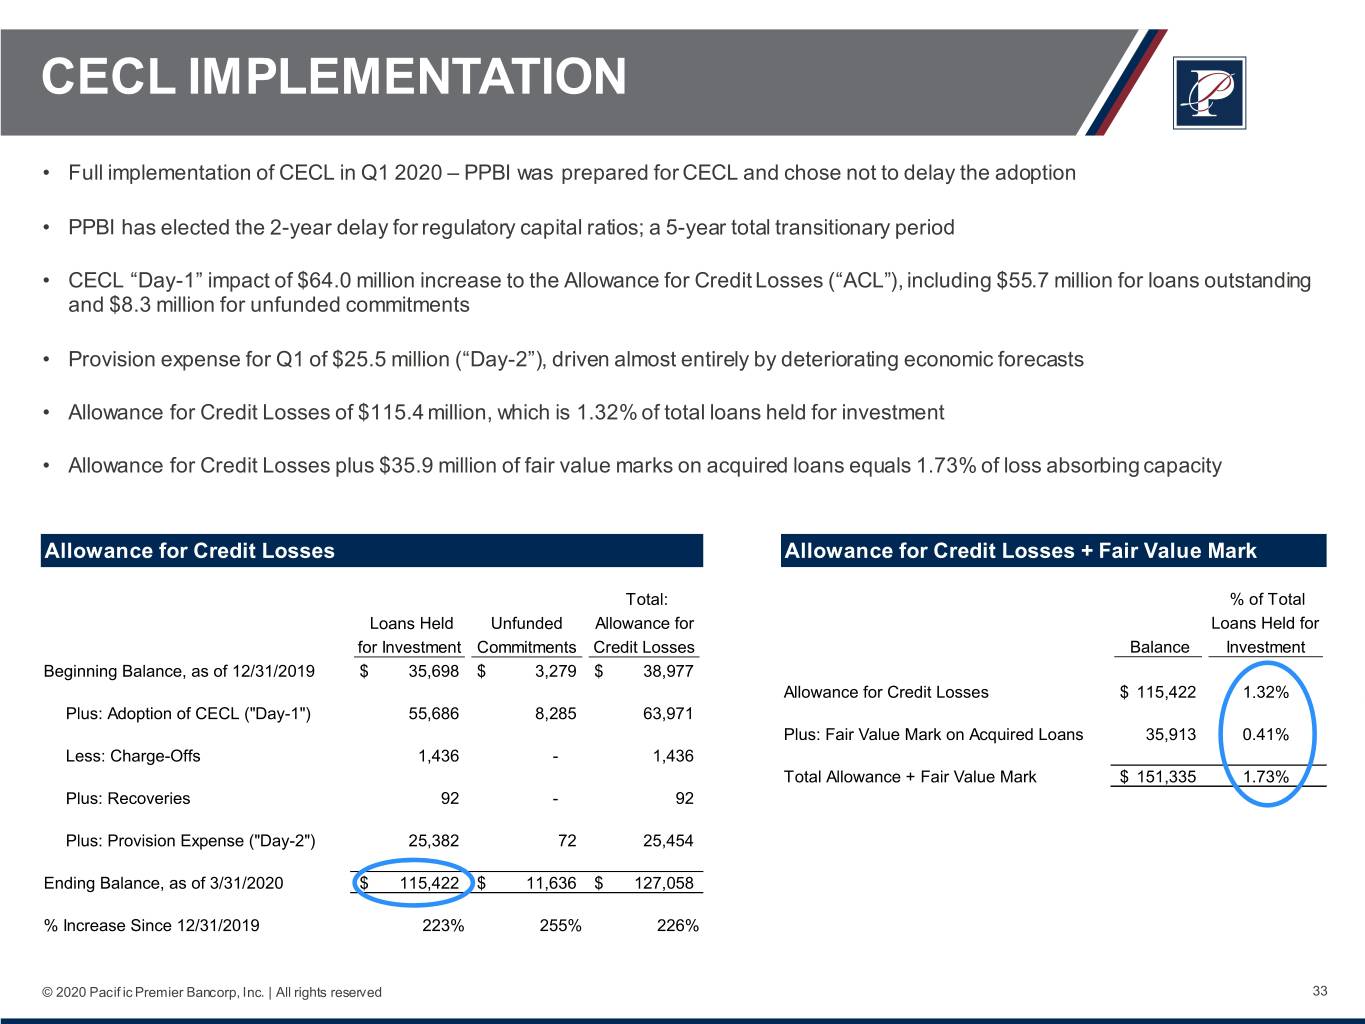
CECL IMPLEMENTATION • Full implementation of CECL in Q1 2020 – PPBI was prepared for CECL and chose not to delay the adoption • PPBI has elected the 2-year delay for regulatory capital ratios; a 5-year total transitionary period • CECL “Day-1” impact of $64.0 million increase to the Allowance for Credit Losses (“ACL”), including $55.7 million for loans outstanding and $8.3 million for unfunded commitments • Provision expense for Q1 of $25.5 million (“Day-2”), driven almost entirely by deteriorating economic forecasts • Allowance for Credit Losses of $115.4 million, which is 1.32% of total loans held for investment • Allowance for Credit Losses plus $35.9 million of fair value marks on acquired loans equals 1.73% of loss absorbing capacity Allowance for Credit Losses Allowance for Credit Losses + Fair Value Mark Total: % of Total Loans Held Unfunded Allowance for Loans Held for for Investment Commitments Credit Losses Balance Investment Beginning Balance, as of 12/31/2019 $ 35,698 $ 3,279 $ 38,977 Allowance for Credit Losses $ 115,422 1.32% Plus: Adoption of CECL ("Day-1") 55,686 8,285 63,971 Plus: Fair Value Mark on Acquired Loans 35,913 0.41% Less: Charge-Offs 1,436 - 1,436 Total Allowance + Fair Value Mark $ 151,335 1.73% Plus: Recoveries 92 - 92 Plus: Provision Expense ("Day-2") 25,382 72 25,454 Ending Balance, as of 3/31/2020 $ 115,422 $ 11,636 $ 127,058 % Increase Since 12/31/2019 223% 255% 226% © 2020 Pacif ic Premier Bancorp, Inc. | All rights reserved 33

CECL – MODEL ASSUMPTIONS . Life-of-loan CECL re serves Allowance for Credit Losses – by Loan Type ₋ Driven by our portfolio characteristics, risk-grading Day-1 Day-2 methodology, the macro-economic outlook, and 12/31/2019 1/1/2020 3/31/2020 modeling methodology ALLL % of ALLL % of ALLL % of Balance Loans Balance Loans Balance Loans Investor real estate secured . Key methodology assumptions CRE non-owner occupied $ 1,899 0.09 % $ 10,322 0.50 % $ 15,896 0.78 % Multifamily 729 0.05 9,903 0.63 14,722 0.91 ₋ Quantitative model uses loan-level probability of default Construction and land 4,484 1.02 4,360 0.99 9,222 2.44 (1) / loss given default discounted cash flows as the SBA secured by real estate 1,915 2.80 514 0.75 935 1.52 primary basis for loss estimation Business real estate secured CRE owner-occupied 2,781 0.15 22,947 1.24 26,793 1.42 ₋ Reasonable and supportable weighted, multi-scenario Franchise real estate secured 592 0.17 5,791 1.64 7,503 2.02 (2) 2-year economic forecast SBA secured by real estate 2,119 2.40 4,326 4.89 4,044 4.84 Commercial loans ₋ 3-year linear reversion to mean historical loss Commercial and industrial 13,857 0.99 13,944 1.00 15,742 1.08 Franchise non-real estate secured 5,816 1.03 15,030 2.66 16,616 3.03 SBA non-real estate secured 445 2.55 663 3.80 516 3.17 . Updated economic forecast Consumer Single family residential 655 0.26 1,196 0.47 1,137 0.48 ₋ Moody’s probability weighted critical pandemic forecast Consumer loans 406 0.80 2,388 4.68 2,296 4.90 as of March 20th Totals $ 35,698 0.41 % $ 91,384 1.05 % $ 115,422 1.32 % ₋ Subsequently benchmarked against updated Moody’s “Critical Pandemic” baseline as of March 27th ACL Key Attributions (% of Total) ₋ Key economic inputs include GDP, Unemployment, and CRE pricing index Day-1 Day-2 Acquired ₋ Based on economic data and forecasts since March portfolios st 31% Economic 31 , likely higher provisioning at June 30, 2020 forecast Economic 79% forecast Portfolio / Life of 6% Asse t Qua lity loan changes loss -4% 50% Note: All dollars in thousands Unfunded 1. SBA loans that are collateralized by hotel/motel real property Commitments Qual. economic 2. SBA loans that are collateralized by real property other than hotel/motel real property 13% factors 25% © 2020 Pacif ic Premier Bancorp, Inc. | All rights reserved 34

PPBI’s Key Attributes
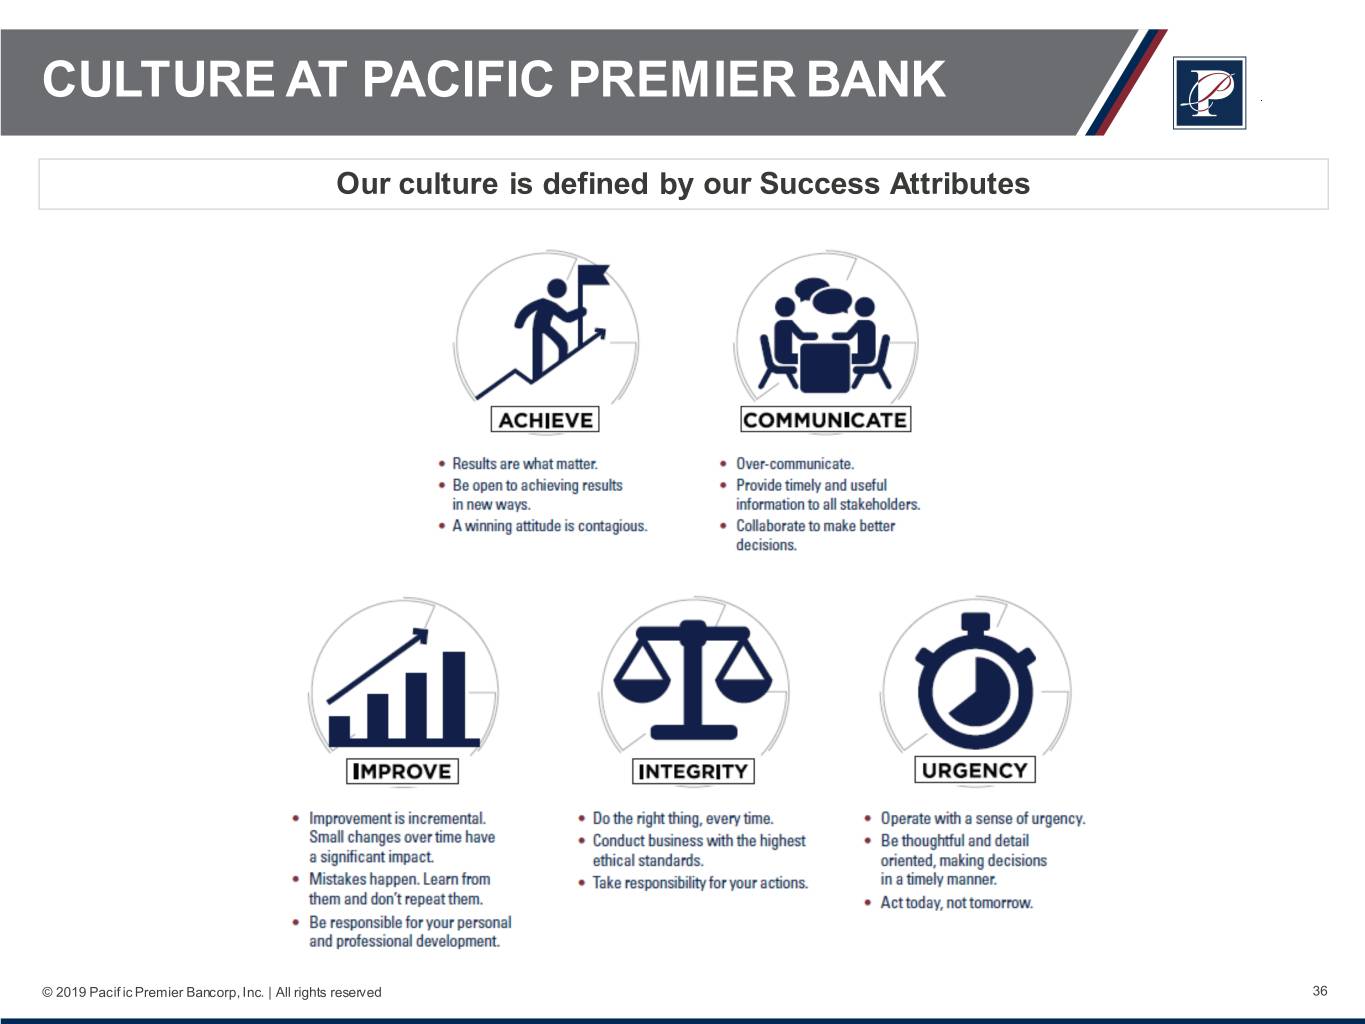
CULTURE AT PACIFIC PREMIER BANK Our culture is defined by our Success Attributes © 2019 Pacif ic Premier Bancorp, Inc. | All rights reserved 36

ENVIRONMENTAL, SOCIAL, GOVERNANCE Corporate giving and We believe in doing our part to strengthen our communities through responsible employee business practices, robust responsibility is a pillar of corporate governance and shareholder friendly policies. our business culture 2019 Highlights(1): Our employees are leaders working with our 300+ community partners: #1 Rating ISS Composite QualityScore for Governance $2,961,972 Charitable Community Support Serve on Boards Provide financial and Promote community and committees technical expertise development missions 5,196 Volunteer Hours 3,959 466 2019 Recycling By shredding Trees Barrels of Oil 465,765 233 and recycling Pounds Tons we have saved: 699 1,630,176 Cubic Yards Gallons of Water of Landfill 1. Data from 1/1/2019-12/31/2019 © 2020 Pacif ic Premier Bancorp, Inc. | All rights reserved 37
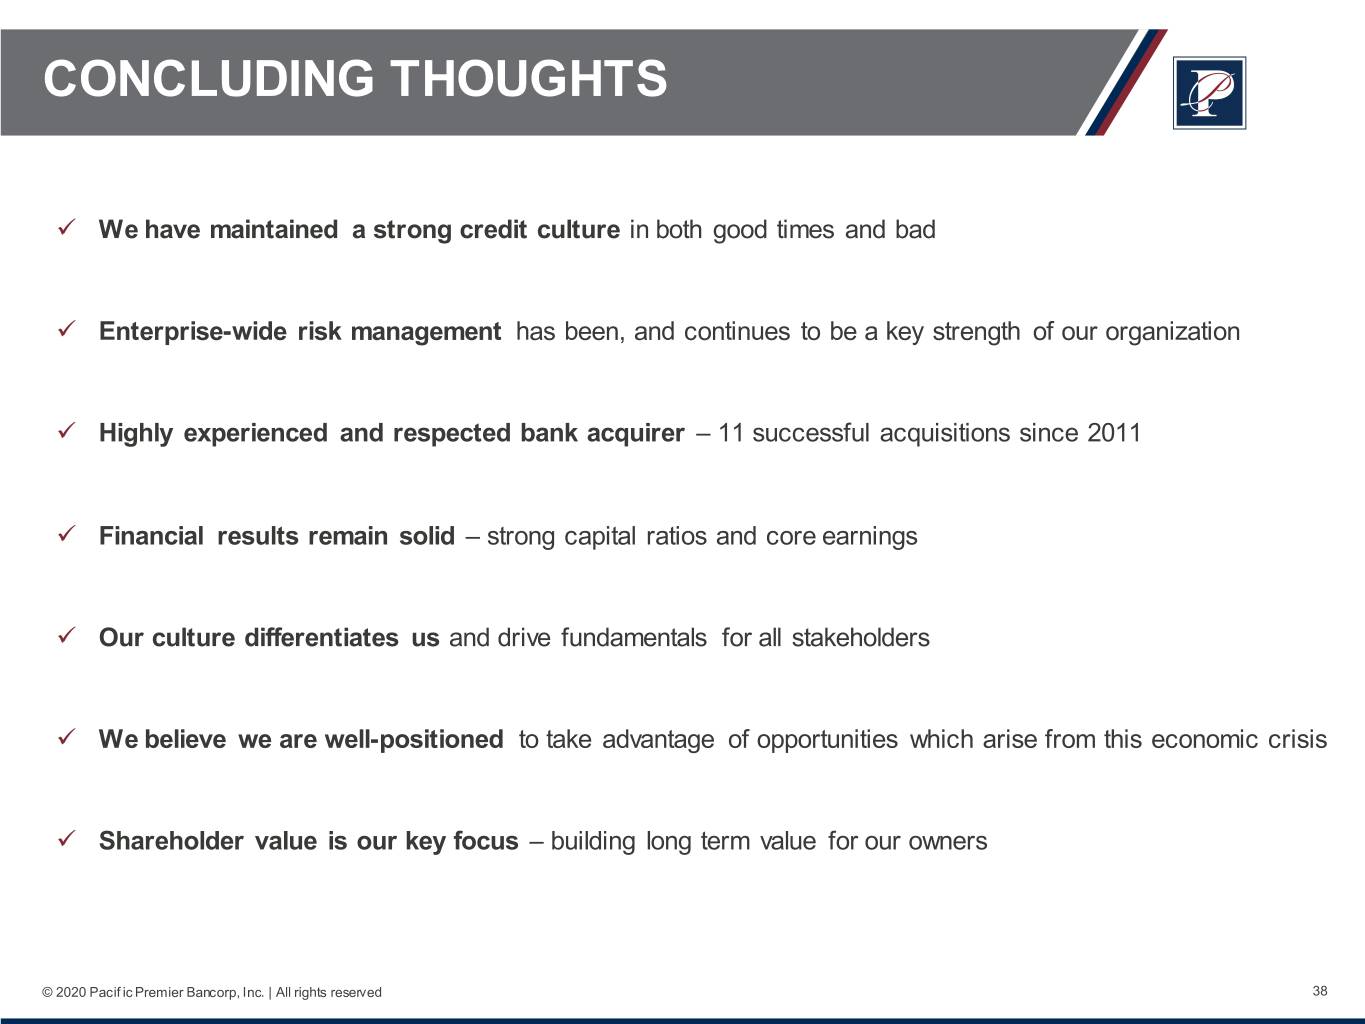
CONCLUDING THOUGHTS We have maintained a strong credit culture in both good times and bad Enterprise-wide risk management has been, and continues to be a key strength of our organization Highly experienced and respected bank acquirer – 11 successful acquisitions since 2011 Financial results remain solid – strong capital ratios and core earnings Our culture differentiates us and drive fundamentals for all stakeholders We believe we are well-positioned to take advantage of opportunities which arise from this economic crisis Shareholder value is our key focus – building long term value for our owners © 2020 Pacif ic Premier Bancorp, Inc. | All rights reserved 38

Appendix Material

NON-U.S. GAAP FINANCIAL MEASURES Tangible common equity to tangible assets (the "tangible common equity ratio") and tangible book value per share are non-U.S. GAAP financial measures derived from U.S. GAAP-based amounts. We calculate the tangible common equity ratio by excluding the balance of intangible assets from common stockholders' equity and dividing by tangible assets. We calculate tangible book value per share by dividing tangible common equity by common shares outstanding, as compared to book value per common share, w hich we calculate by dividing common stockholders’ equity by common shares outstanding. We believe that this information is consistent w ith the treatment by bank regulatory agencies, w hich exclude intangible assets from the calculation of risk-based capital ratios. Accordingly, w e believe that these non-U.S. GAAP financial measures provide information that is important to investors and that is useful in understanding our capital position and ratios. How ever, these non-U.S. GAAP financial measures are supplemental and are not a substitute for an analysis based on U.S. GAAP measures. As other companies may use different calculations for these measures, this presentation may not be comparable to other similarly titled measures reported by other companies. A reconciliation of the non-U.S. GAAP measure of tangible common equity ratio to the U.S. GAAP measure of common equity ratio and tangible book value per share to the U.S. GAA P measure of book value per share are set forth below . Q1 Q4 Q1 Q1 2020 2019 2019 2020 w/ OPB(1) Total stockholders' equity $ 2,007,064 $ 2,012,594 $ 2,002,917 $ 2,664,982 Less: Intangible assets (904,846) (891,634) (887,671) (1,013,814) Tangible common equity $ 1,102,218 $ 1,120,960 $ 1,115,246 $ 1,651,168 Total assets $ 11,580,495 $ 11,776,012 $ 11,976,209 $ 20,029,815 Less: Intangible assets (904,846) (891,634) (887,671) (1,013,814) Tangible assets $ 10,675,649 $ 10,884,378 $ 11,088,538 $ 19,016,001 Common equity ratio 17.33% 17.09% 16.72% 13.31% Less: intangible ratio (7.01%) (6.79%) (6.66%) (4.62%) Tangible common equity ratio 10.32% 10.30% 10.06% 8.68% Basic shares outstanding 62,773,147 59,506,057 59,975,281 94,382,767 Book value per share $ 31.97 $ 33.82 $ 33.40 $ 28.24 Less: Intangible book value per share (14.41) (14.98) (14.80) (10.74) Tangible book value per share $ 17.56 $ 18.84 $ 18.60 $ 17.49 Note: All dollars in thousands, except per share data 1. Amount is pro f orma for PPBI’s acquisition of OPB as if it occurred on March 31, 2020 © 2020 Pacif ic Premier Bancorp, Inc. | All rights reserved 40

NON-U.S. GAAP FINANCIAL MEASURES Return on average tangible common equity is a non-U.S. GAAP financial measure derived from U.S. GAAP-based amounts. We calculate this figure by excluding CDI amortization expense and excluding the average CDI and average goodw ill from the average stockholders’ equity during the period. We believe that this non-U.S. GAAP financial measure provides information that is important to investors and that is useful in understanding our performance. This non-U.S. GAAP financial measure is supplemental and is not a substitute for an analysis based on U.S. GAAP measures. As companies may use different calculations for this measure, this presentation may not be comparable to other similarly titled measures reported by other companies. A reconciliation of the U.S. GAAP measure of return on average equity to the non-U.S. GAAP measure of return on average tangible common equity is set forth below . Three Months Ended, 3/31/2019 12/31/2019 3/31/2020 Net Income $38,718 $41,098 $25,740 Plus: CDI amortization expense 4,436 4,247 3,965 Less: CDI amortization expense tax adjustment(1) 1,288 1,218 1,137 Net income for average tangible common equity $41,866 $44,127 $28,568 Average stockholders' equity $1,991,861 $2,004,815 $2,037,126 Less: Average CDI 98,984 85,901 81,744 Less: Average goodwill 808,726 808,322 808,322 Average tangible common equity $1,084,151 $1,110,592 $1,147,060 Return on average equity(2) 7.78% 8.20% 5.05% Return on average tangible common equity(2) 15.45% 15.89% 9.96% Note: All dollars in thousands 1. CDI amortization expense adjusted by statutory tax rate 2. Annualized © 2020 Pacif ic Premier Bancorp, Inc. | All rights reserved 41

NON-U.S. GAAP FINANCIAL MEASURES For periods presented below , efficiency ratio is a non-U.S. GAAP financial measure derived from U.S. GAAP-based amounts. This figure represents the ratio of noninterest expense less other real estate ow ned operations, core deposit intangible amortization and merger-related expense to the sum of net interest income before provision for loan losses and total noninterest income, less gains/(loss) on sale of securities, OTTI impairment - securities, gain/(loss) on sale of other real estate ow ned, and gain / (loss) from debt extinguishment. Management believes that the exclusion of such items from this financial measures provides useful information to gain an understanding of the operating results of our core business. This non-U.S. GAAP financial measure is supplemental and is not a substitute for an analysis based on U.S. GAAP measures. As companies may use different calculations for this measure, this presentation may not be comparable to other similarly titled measures reported by other companies. A calculation of the non-U.S. GAAP measure of efficiency ratio is set forth below . QTD FY 2013 FY 2014 FY 2015 FY 2016 FY 2017 FY 2018 FY 2019 Q1 2020 Total noninterest expense $ 50,815 $ 54,938 $ 73,332 $ 98,063 $ 167,958 $ 249,905 $ 259,065 $ 66,631 Less: CDI amortization 764 1,014 1,350 2,039 6,144 13,594 17,245 3,965 Less: Merger-related expense 6,926 1,490 4,799 4,388 21,002 18,454 656 1,724 Less: Other real estate owned operations, net 618 75 121 385 72 4 160 14 Noninterest expense, adjusted $ 42,507 $ 52,359 $ 67,062 $ 91,251 $ 140,740 $ 217,853 $ 241,004 $ 60,928 Net interest income $ 58,444 $ 73,635 $ 106,299 $ 153,075 $ 247,502 $ 392,711 $ 447,301 $ 109,175 Add: Total noninterest income (loss) 8,811 13,377 14,388 19,602 31,114 31,027 35,236 14,475 Less: Net gain (loss) from investment securities 1,544 1,547 290 1,797 2,737 1,399 8,571 7,760 Less: OTTI impairment - securities (4) (29) - (205) 1 4 2 - Less: Net gain (loss) from other real estate owned - - - - 46 281 52 - Less: Net gain (loss) from debt extinguishment - - - - - - (612) - Revenue, adjusted $ 65,715 $ 85,494 $ 120,397 $ 171,085 $ 275,832 $ 422,054 $ 474,524 $ 115,890 Efficiency Ratio 64.7% 61.3% 55.9% 53.6% 51.0% 51.6% 50.8% 52.6% Note: All dollars in thousands © 2020 Pacif ic Premier Bancorp, Inc. | All rights reserved 42

NON-U.S. GAAP FINANCIAL MEASURES Pr e-tax pre-provision income is a non-U.S. GAAP financial measure derived from U.S. GAAP-based amounts. We calculate the pre-tax pre-provision income by excluding income tax, provision for credit losses, and merger related expenses from the net income. Management believes that the exclusion of such items from this financial measures provides useful information to gain an understanding of the operating results of our core business. This non-U.S. GAAP financial measure is supplemental and is not a substitute for an analysis based on U.S. GAAP measures. As companies may use different calculations for this measure, this presentation may not be comparable to other similarly titled measures reported by other companies. A calculation of the non-U.S. GAAP measure of pre-tax pre-provision income is set forth below . QTD QTD FY 2013 FY 2014 FY 2015 FY 2016 FY 2017 FY 2018 FY 2019 Q1 2019 Q1 2020 Q1 2020(1) Interest income $ 63,800 $ 81,339 $ 118,356 $ 166,605 $ 270,005 $ 448,423 $ 526,107 $ 131,243 $ 123,789 $ 495,156 Interest expense 5,356 7,704 12,057 13,530 22,503 55,712 78,806 19,837 14,614 58,456 Net interest income 58,444 73,635 106,299 153,075 247,502 392,711 447,301 111,406 109,175 436,700 Noninterest income 8,811 13,377 14,388 19,602 31,114 31,027 35,236 7,681 14,475 57,900 Revenue 67,255 87,012 120,687 172,677 278,616 423,738 482,537 119,087 123,650 494,600 Noninterest expense 50,815 54,938 73,332 98,063 167,958 249,905 259,065 63,577 66,631 266,524 Add: Merger related expense 6,926 1,490 4,799 4,388 21,002 18,454 656 655 1,724 6,896 Pre-tax pre-provision income $ 23,366 $ 33,564 $ 52,154 $ 79,002 $ 131,660 $ 192,287 $ 224,128 $ 56,165 $ 58,743 $ 234,972 Average Assets $ 1,441,555 $ 1,827,935 $ 2,622,476 $ 3,601,411 $ 6,094,883 $ 9,794,917 $ 11,546,912 $ 11,563,529 $ 11,591,336 $ 11,591,336 PTPP / Average Assets 1.62% 1.84% 1.99% 2.19% 2.16% 1.96% 1.94% 0.49% 0.51% 2.03% Note: All dollars in thousands 1. Annualized © 2020 Pacif ic Premier Bancorp, Inc. | All rights reserved 43
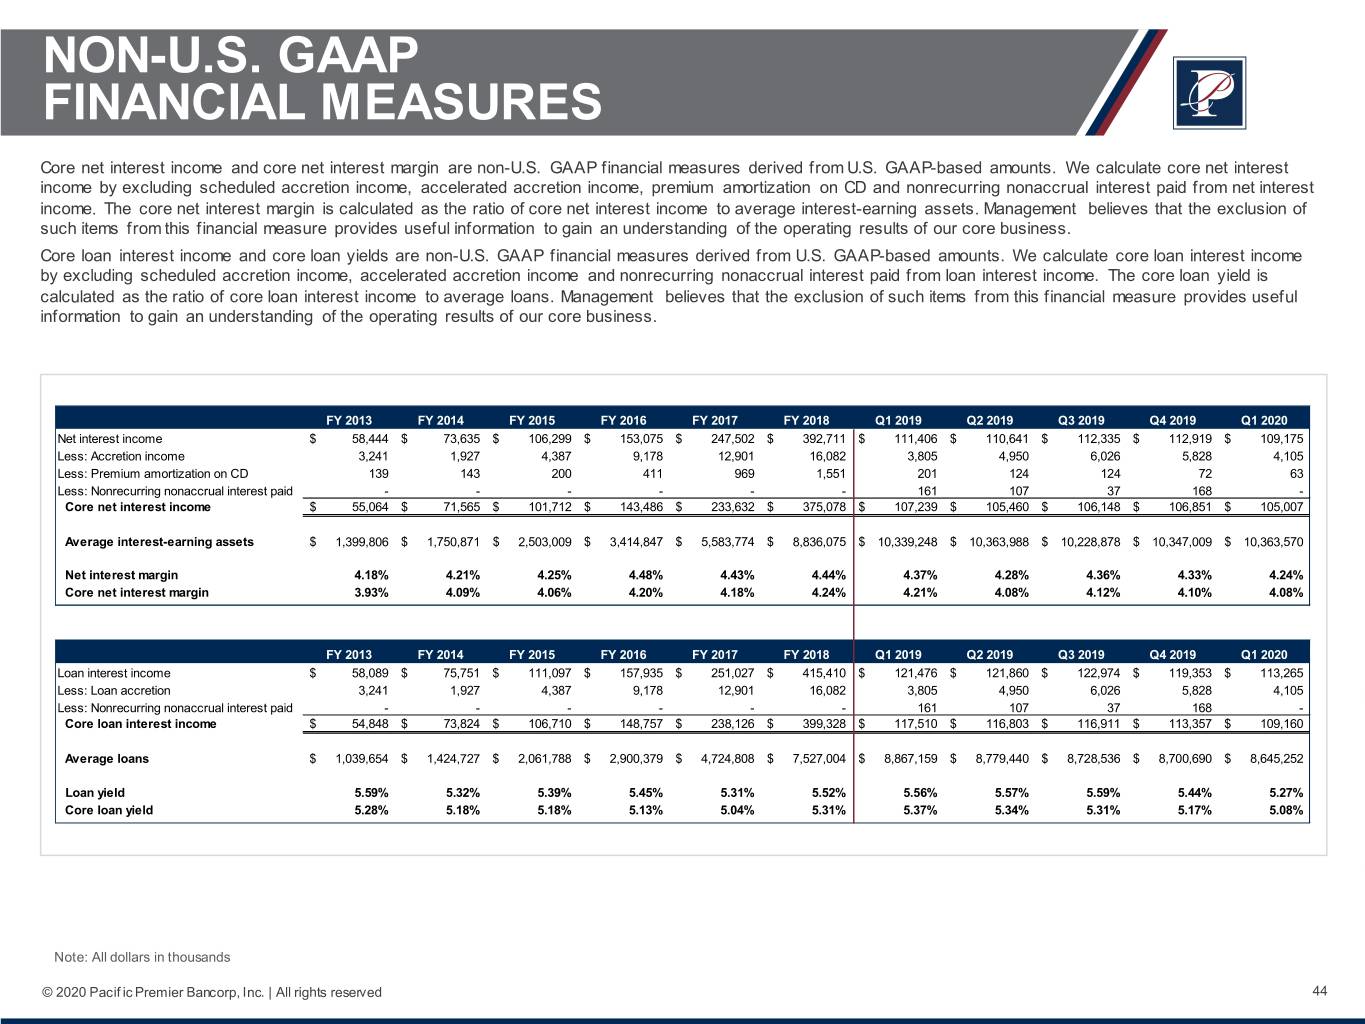
NON-U.S. GAAP FINANCIAL MEASURES Core net interest income and core net interest margin are non-U.S. GAAP financial measures derived from U.S. GAAP-based amounts. We calculate core net interest income by excluding scheduled accretion income, accelerated accretion income, premium amortization on CD and nonrecurring nonaccrual interest paid from net interest income. The core net interest margin is calculated as the ratio of core net interest income to average interest-earning assets. Management believes that the exclusion of such items from this financial measure provides useful information to gain an understanding of the operating results of our core business. Core loan interest income and core loan yields are non-U.S. GAAP financial measures derived from U.S. GAAP-based amounts. We calculate core loan interest income by excluding scheduled accretion income, accelerated accretion income and nonrecurring nonaccrual interest paid from loan interest income. The core loan yield is calculated as the ratio of core loan interest income to average loans. Management believes that the exclusion of such items from this financial measure provides useful information to gain an understanding of the operating results of our core business. FY 2013 FY 2014 FY 2015 FY 2016 FY 2017 FY 2018 Q1 2019 Q2 2019 Q3 2019 Q4 2019 Q1 2020 Net interest income $ 58,444 $ 73,635 $ 106,299 $ 153,075 $ 247,502 $ 392,711 $ 111,406 $ 110,641 $ 112,335 $ 112,919 $ 109,175 Less: Accretion income 3,241 1,927 4,387 9,178 12,901 16,082 3,805 4,950 6,026 5,828 4,105 Less: Premium amortization on CD 139 143 200 411 969 1,551 201 124 124 72 63 Less: Nonrecurring nonaccrual interest paid - - - - - - 161 107 37 168 - Core net interest income $ 55,064 $ 71,565 $ 101,712 $ 143,486 $ 233,632 $ 375,078 $ 107,239 $ 105,460 $ 106,148 $ 106,851 $ 105,007 Average interest-earning assets $ 1,399,806 $ 1,750,871 $ 2,503,009 $ 3,414,847 $ 5,583,774 $ 8,836,075 $ 10,339,248 $ 10,363,988 $ 10,228,878 $ 10,347,009 $ 10,363,570 Net interest margin 4.18% 4.21% 4.25% 4.48% 4.43% 4.44% 4.37% 4.28% 4.36% 4.33% 4.24% Core net interest margin 3.93% 4.09% 4.06% 4.20% 4.18% 4.24% 4.21% 4.08% 4.12% 4.10% 4.08% FY 2013 FY 2014 FY 2015 FY 2016 FY 2017 FY 2018 Q1 2019 Q2 2019 Q3 2019 Q4 2019 Q1 2020 Loan interest income $ 58,089 $ 75,751 $ 111,097 $ 157,935 $ 251,027 $ 415,410 $ 121,476 $ 121,860 $ 122,974 $ 119,353 $ 113,265 Less: Loan accretion 3,241 1,927 4,387 9,178 12,901 16,082 3,805 4,950 6,026 5,828 4,105 Less: Nonrecurring nonaccrual interest paid - - - - - - 161 107 37 168 - Core loan interest income $ 54,848 $ 73,824 $ 106,710 $ 148,757 $ 238,126 $ 399,328 $ 117,510 $ 116,803 $ 116,911 $ 113,357 $ 109,160 Average loans $ 1,039,654 $ 1,424,727 $ 2,061,788 $ 2,900,379 $ 4,724,808 $ 7,527,004 $ 8,867,159 $ 8,779,440 $ 8,728,536 $ 8,700,690 $ 8,645,252 Loan yield 5.59% 5.32% 5.39% 5.45% 5.31% 5.52% 5.56% 5.57% 5.59% 5.44% 5.27% Core loan yield 5.28% 5.18% 5.18% 5.13% 5.04% 5.31% 5.37% 5.34% 5.31% 5.17% 5.08% Note: All dollars in thousands © 2020 Pacif ic Premier Bancorp, Inc. | All rights reserved 44
