Attached files
| file | filename |
|---|---|
| EX-32 - PPBI 2010 10-K EXHIBIT 32 - PACIFIC PREMIER BANCORP INC | ppbi_10k-2010ex32.htm |
| EX-23 - PPBI 2010 10-K EXHIBIT 23 - PACIFIC PREMIER BANCORP INC | ppbi_10k-2010ex23.htm |
| EX-31.2 - PPBI 2010 10-K EXHIBIT 31.2 - PACIFIC PREMIER BANCORP INC | ppbi_10k-2010ex312.htm |
| EX-31.1 - PPBI 2010 10-K EXHIBIT 31.1 - PACIFIC PREMIER BANCORP INC | ppbi_10k-2010ex311.htm |
|
UNITED STATES SECURITIES AND EXCHANGE COMMISSION
|
Washington, DC 20549
FORM 10-K
ANNUAL REPORT PURSUANT TO SECTION 13 OF THE SECURITIES EXCHANGE ACT OF 1934
For the fiscal year ended December 31, 2010
or
TRANSITION REPORT PURSUANT TO SECTION 13 OR 15(d) OF THE SECURITIES EXCHANGE ACT OF 1934
For the transition period from to .
Commission File No.: 0-22193
Pacific Premier Bancorp, Inc.
(Exact name of registrant as specified in its charter)
Delaware 33-0743196
(State of Incorporation) (I.R.S. Employer Identification No)
1600 Sunflower Ave. 2nd Floor, Costa Mesa, California 92626
(Address of Principal Executive Offices and Zip Code)
Registrant’s telephone number, including area code: (714) 431-4000
----------------
Securities registered pursuant to Section 12(b) of the Act:
|
Title of class
|
Name of each exchange on which registered
|
|
Common Stock, par value $0.01 per share
|
NASDAQ Global Market
|
Securities registered pursuant to Section 12(g) of the Act:
None
----------------
Indicate by check mark if the registrant is a well-known seasoned issuer, as defined in Rule 405 of the Securities Act. Yes [__] No [X]
Indicate by check mark if the registrant is not required to file reports pursuant to Section 13 or Section 15(d) of the Act. Yes [__] No [X]
Indicate by check mark whether the registrant (1) has filed all reports required to be filed by Section 13 or 15(d) of the Securities Exchange Act of 1934 during the preceding 12 months (or for such shorter period that the registrant was required to file such reports), and (2) has been subject to such filing requirements for the past 90 days. Yes [X] No [_]
Indicate by check mark whether the registrant has submitted electronically and posted on its corporate Web site, if any, every Interactive Data File required to be submitted and posted pursuant to Rule 405 of Regulation S-T (§ 232.405 of this chapter) during the preceding 12 months (or for such shorter period that the registrant was required to submit and post such files). Yes [ ] No [ ]
Indicate by check mark if disclosure of delinquent filers pursuant to Item 405 of Regulation S-K is not contained herein, and will not be contained, to the best of the registrant's knowledge, in definitive proxy or information statements incorporated by reference in Part III of this Form 10-K or any amendment to this Form 10-K. [X]
Indicate by check mark whether the Registrant is a large accelerated filer, an accelerated filer, a non-accelerated filer, or a smaller reporting company. See definitions of “large accelerated filer”, “accelerated filer” and “smaller reporting company” in Rule 12b-2 of the Exchange Act (Check one).
|
Large accelerated filer
|
[ ]
|
Accelerated filer
|
[ ]
|
|
|
Non-accelerated filer
|
[ ]
|
(Do not check if a smaller reporting company)
|
Smaller reporting company
|
[X]
|
Indicate by check mark whether the registrant is a shell company (as defined in Rule 12b-2 of the Act). Yes [__] No [X]
The aggregate market value of the voting stock held by non-affiliates of the registrant, i.e., persons other than directors and executive officers of the registrant, was approximately $40,776,900 and was based upon the last sales price as quoted on The NASDAQ Stock Market as of June 30, 2010, the last business day of the most recently completed second fiscal quarter.
As of March 29, 2011, the Registrant had 10,068,226 shares outstanding.
DOCUMENTS INCORPORATED BY REFERENCE
Portions of the registrant’s definitive proxy statement filed under Regulation 14A promulgated by the Securities and Exchange Commission under the Securities Exchange Act of 1934, which definitive proxy statement is to be filed within 120 days after the registrant’s fiscal year ended December 31, 2010, are incorporated by reference in Part III hereof.
INDEX
Forward-Looking Statements
All references to “we”, “us”, “our”, or the “Company” mean Pacific Premier Bancorp, Inc. and our consolidated subsidiaries, including Pacific Premier Bank, our primary operating subsidiary. All references to ‘‘Bank’’ refer to Pacific Premier Bank. All references to the “Corporation” refer to Pacific Premier Bancorp, Inc.
This Annual Report on Form 10-K contains certain forward-looking statements within the meaning of Section 27A of the Securities Act of 1933, as amended, or the Securities Act, and Section 21E of the Securities Exchange Act of 1934, as amended (the “Exchange Act”). These forward-looking statements represent plans, estimates, objectives, goals, guidelines, expectations, intentions, projections and statements of our beliefs concerning future events, business plans, objectives, expected operating results and the assumptions upon which those statements are based. Forward-looking statements include without limitation, any statement that may predict, forecast, indicate or imply future results, performance or achievements, and are typically identified with words such as “may,” “could,” “should,” “will,” “would,” “believe,” “anticipate,” “estimate,” “expect,” “intend,” “plan,” or words or phases of similar meaning. We caution that the forward-looking statements are based largely on our expectations and are subject to a number of known and unknown risks and uncertainties that are subject to change based on factors which are, in many instances, beyond our control. Actual results, performance or achievements could differ materially from those contemplated, expressed, or implied by the forward-looking statements.
The following factors, among others, could cause our financial performance to differ materially from that expressed in such forward-looking statements:
|
·
|
The strength of the United States economy in general and the strength of the local economies in which we conduct operations;
|
|
·
|
The effects of, and changes in, trade, monetary and fiscal policies and laws, including interest rate policies of the Board of Governors of the Federal Reserve System (the “Federal Reserve”);
|
|
·
|
Inflation/deflation, interest rate, market and monetary fluctuations;
|
|
·
|
The timely development of competitive new products and services and the acceptance of these products and services by new and existing customers;
|
|
·
|
The willingness of users to substitute competitors’ products and services for our products and services;
|
|
·
|
The impact of changes in financial services policies, laws and regulations, including those concerning taxes, banking, securities and insurance, and the application thereof by regulatory bodies;
|
|
·
|
Technological changes;
|
|
·
|
The effect of acquisitions we may make, if any, including, without limitation, the failure to achieve the expected revenue growth and/or expense savings from such acquisitions;
|
|
·
|
Changes in the level of our nonperforming assets and charge-offs;
|
|
·
|
Oversupply of inventory and continued deterioration in values of California real estate, both residential and commercial;
|
|
·
|
The effect of changes in accounting policies and practices, as may be adopted from time-to-time by bank regulatory agencies, the SEC, the Public Company Accounting Oversight Board, the Financial Accounting Standards Board or other accounting standards setters;
|
|
·
|
Possible other-than-temporary impairments (“OTTI”) of securities held by us;
|
|
·
|
The impact of current governmental efforts to restructure the U.S. financial regulatory system, including enactment of the Dodd-Frank Wall Street Reform and Consumer Protection Act;
|
|
·
|
Changes in consumer spending, borrowing and savings habits;
|
|
·
|
The effects of our lack of a diversified loan portfolio, including the risks of geographic and industry concentrations;
|
|
·
|
Ability to attract deposits and other sources of liquidity;
|
|
·
|
Changes in the financial performance and/or condition of our borrowers;
|
|
·
|
Changes in the competitive environment among financial and bank holding companies and other financial service providers;
|
|
·
|
Geopolitical conditions, including acts or threats of terrorism, actions taken by the United States or other governments in response to acts or threats of terrorism and/or military conflicts, which could impact business and economic conditions in the United States and abroad;
|
|
·
|
Unanticipated regulatory or judicial proceedings; and
|
|
·
|
Our ability to manage the risks involved in the foregoing.
|
If one or more of the factors affecting our forward-looking information and statements proves incorrect, then our actual results, performance or achievements could differ materially from those expressed in, or implied by, forward-looking information and statements contained in this Annual Report on Form 10-K. Therefore, we caution you not to place undue reliance on our forward-looking information and statements. We will not update the forward-looking statements to reflect actual results or changes in the factors affecting the forward-looking statements.
Overview
We are a California-based bank holding company incorporated in 1997 in the State of Delaware and registered as a banking holding company under the Bank Holding Company Act of 1956, as amended ("BHCA”), for Pacific Premier Bank, a California state-chartered commercial bank. The Bank is subject to examination and regulation by the California Department of Financial Institutions (the “DFI”), the Federal Reserve, and by the Federal Deposit Insurance Corporation (the “FDIC”).
We conduct business throughout Southern California from our nine locations in the counties of Los Angeles, Orange, Riverside and San Bernardino. We operate depository branches in the cities of Palm Desert, Palm Springs, San Bernardino, Seal Beach, Huntington Beach, Los Alamitos, Costa Mesa and Newport Beach, California. Our corporate headquarters are located in Costa Mesa, California.
We provide banking services within our targeted markets in Southern California to businesses and consumers in the communities we serve. Through our branches and our Internet website at www.ppbi.com, we offer a broad array of deposit products and services for both business and consumer customers, including checking, money market and savings accounts, cash management services, electronic banking, and on-line bill payment. We offer a wide array of loan products, such as commercial business loans, lines of credit, commercial real estate loans, and U.S. Small Business Administration (“SBA”) loans. At December 31, 2010, we had consolidated total assets of $826.8 million, net loans of $555.5 million, total deposits of $659.2 million, and consolidated total stockholders’ equity of $78.6 million. At December 31, 2010, the Bank was considered a “well-capitalized” financial institution for regulatory capital purposes.
Acquisition of Canyon National Bank
Effective February 11, 2011, the Bank assumed all of the deposits and acquired essentially all of the assets of Canyon National Bank (“Canyon National”) from the FDIC, as receiver for Canyon National (the “Acquisition”), pursuant to the terms of a Purchase and Assumption Agreement dated as of February 11, 2011 (the “Agreement”) with the FDIC. Canyon National was the wholly owned subsidiary of Canyon Bancorp and was a national bank headquartered in Palm Springs, California with three branches in Palm Springs and Palm Desert, California. Neither the Company nor the Bank acquired any assets or assumed any liabilities of Canyon Bancorp. The transaction was structured as a whole bank purchase and assumption without a loss sharing agreement. The Bank participated in a competitive bid process with the FDIC. The FDIC accepted Pacific Premier’s bid, which included an asset discount bid of $27.9 million and no deposit premium. Canyon National had approximately $216.2 million in total assets including approximately $164.7 million in gross loans, and $204.3 million in total deposits at February 11, 2011. The foregoing amounts represent Canyon National’s book value and do not necessarily reflect the fair value of the assets acquired or liabilities assumed.
Operating Strategy
The Bank was founded in 1983 as a state chartered savings and loan, became a federally chartered stock savings bank in 1991 and, in March 2007, converted to a California-chartered commercial bank. In the fourth quarter of 2000, our management implemented a new business plan to refocus Pacific Premier’s business model, emphasizing community banking. To achieve the Bank’s goals, we implemented a three-phase strategic plan which involved:
• Phase 1: lowering the risk profile of the Bank and re-capitalizing Pacific Premier;
• Phase 2: growing the balance sheet through the origination of adjustable rate multi-family residential loans; and
• Phase 3: transforming the institution to a commercial banking business model.
The first two phases of our strategic plan were completed in 2002 and 2004, respectively. Our transition to a commercial banking platform began in 2005 as we recruited experienced business bankers from other regional and national commercial banks. These business bankers helped us to introduce new credit and deposit products as well as on-line banking and cash management services. This in turn allowed us to begin to capture small business customers in our market. Our transition to a commercial banking platform is being achieved by retaining and growing the number of business banking relationships within the Southern California market.
Our primary goal is to develop the Bank into one of Southern California’s top performing commercial banks as an alternative to the large regional and national banks for businesses, professionals, entrepreneurs and non-profit organizations for the long term benefit of our stockholders, customers and employees. The following are our operating strategies which we have adopted in order to achieve this goal:
• Expansion through Acquisitions. The consolidation and current turmoil in the banking industry has created an opportunity in our markets and we expect to expand the Bank’s franchise through acquisitions. Many banks have been negatively impacted by the sluggish economic environment, which we expect will lead to the continued consolidation and elimination of certain of our competitors. We intend to take advantage of this opportunity over the next couple of years by pursuing whole bank acquisitions or all or part of failing bank acquisitions through FDIC-assisted transactions and/or through traditional merger and acquisitions opportunities of existing banks.
• Expansion through Relationship Banking. The industry wide consolidation and turmoil is also creating opportunities to acquire new business banking customers. Profitable businesses are not having their needs met either from a service level or credit availability basis and we intend to convert these businesses to customers of the Bank. We believe customer relationships are built through a series of consistently executed experiences in both routine transactions and higher value interactions. Our business bankers are focused on developing long term relationships with business owners, professionals, entrepreneurs, and non-profit organizations through consistent and frequent contact. Additionally, our bankers are actively involved in community organizations and events, thus building and capitalizing on the Bank’s reputation within our local communities.
• Reduction in Wholesale Funding and Brokered Deposits. As we transitioned towards a commercial banking platform, we have reduced our reliance on wholesale borrowings, such as advances from the Federal Home Loan Bank (“FHLB”) and brokered deposits.
• Diversifying our Loan Portfolio. We believe it is important to diversify our loan portfolio in order to better manage credit risks. As part of our transition to a commercial banking platform, we have increased the amount of owner-occupied commercial real estate (“CRE”) loans, commercial and industrial (“C&I”) loans and Small Business Administration (“SBA”) loans within the portfolio.
• Proactive Asset Management and Sound Credit Quality. Our conservative credit and risk management culture has resulted in relatively low levels of nonperforming loans and an overall high credit quality within the loan portfolio as compared to our peer banks. Our portfolio management strategies involve the early identification of loan weakness, aggressive collection techniques, loss mitigation through loan sales and/or working with third parties to refinance the credit. We will continue to monitor economic trends and conditions that could positively or negatively impact our business. We seek to take advantage of these trends by entering or exiting certain lines of business or offering or eliminating various loan product types, as evidenced by our decision to curtail our multi-family and commercial non-owner occupied real estate lending. We will continue to adjust our risk management practices to the on-going changes in our local economy that impact our business.
Our executive offices are located at 1600 Sunflower Avenue, 2nd Floor, Costa Mesa, California 92626 and our telephone number is (714) 431-4000. Our Internet website address is www.ppbi.com. Our Annual Reports on Form 10-K, Quarterly Reports on Form 10-Q and Current Reports on Form 8-K, and all amendments thereto, from 1998 to present that have been filed with the SEC, are available free of charge on our Internet website. Also on our website are our Code of Ethics, Insider Trading and Beneficial Ownership forms, and Corporate Governance Guidelines. The information contained in our website, or in any websites linked by our website, is not a part of this Annual Report on Form 10-K.
Lending Activities
General. In 2010, we maintained our commitment to a high level of credit quality in our lending activities. We expanded our efforts to diversify our loan portfolio and focused our efforts on meeting the financial needs of qualified individuals and local businesses. The Company offers a full complement of flexible and structured loan products tailored to meet the needs of our customers.
During 2010, we made loans to borrowers secured by real property and business assets located principally in Southern California, our market area. We emphasize relationship lending and focus on generating loans with customers who also maintain full depository relationships with us. These efforts assist us in establishing and expanding depository relationships consistent with the Company’s strategic direction. The Company has generally ceased or minimized making loans secured by multi-family or commercial non-owner occupied real estate, although such loans continue to make up a substantial portion of our loan portfolio. We maintain a house lending limit below our $23.0 million legal lending limit for secured loans and $13.8 million for unsecured loans as of December 31, 2010. During 2010, we originated or purchased $64.3 million of C&I loans, $27.0 million of owner-occupied commercial real estate loans, $15.0 million of other loans, $2.6 million of non-owner occupied commercial real estate loans and $2.3 million of SBA loans. At December 31, 2010, we had $567.6 million in total gross loans outstanding.
Multi-family Real Estate Lending. Although we were not an active multi-family lender in 2010, on occasion, we originate and purchase loans secured by multi-family residential properties (five units and greater) located predominantly in Southern California. Pursuant to our underwriting policies, multi-family residential loans may be made in an amount up to 75% of the lesser of the appraised value or the purchase price of the collateral property. In addition, we generally require a stabilized minimum debt service coverage ratio of 1.15:1, based on the qualifying loan interest rate. Loans are made for terms of up to 30 years with amortization periods up to 30 years. As part of our desired strategy to diversify the loan portfolio, we have substantially reduced the origination of multi-family real estate loans beginning in late 2007. Historically, we have managed our concentration in multi-family real estate loans by selling excess loan production. However, in recent periods, the level of loan sales has decreased significantly due to dislocations in the credit markets. Multi-family loan sales remain a strategic option for us as the Bank continues its transition to a traditional commercial bank. At December 31, 2010, we had $243.6 million of multi-family real estate secured loans, constituting 42.9% of our loan portfolio.
Commercial Non-Owner Occupied Real Estate Lending. Although we were not an active commercial non-owner occupied real estate lender in 2010, on occasion, we originate and purchase loans that are not occupied by the borrower and are secured by commercial real estate, such as retail centers, small office and light industrial buildings, and mixed-use commercial properties located predominantly in Southern California. Pursuant to our underwriting policies, commercial non-owner occupied real estate loans may be made in amounts up to 75% of the lesser of the appraised value or the purchase price of the collateral property. We consider the net operating income of the property and typically require a stabilized debt service coverage ratio of at least 1.20:1, based on the qualifying interest rate. Loans are generally made for terms up to 15 years with amortization periods up to 30 years. At December 31, 2010, we had $130.5 million of commercial non-owner occupied real estate secured loans, constituting 23.0% of our loan portfolio.
One-to-Four Family Real Estate Lending. We participate in single family lending on occasion through purchases to diversify our portfolio; and, in keeping with the Company’s strategy of offering a full complement of loan products to customers, we occasionally fund home loans to banking customers. When we do originate or purchase loans we do not engage in Alt-A or subprime lending. The Company’s portfolio of one-to-four family loans at December 31, 2010 totaled $20.3 million, constituting 3.6% of our loan portfolio, of which $13.5 million consists of loans secured by first liens on real estate and $6.8 million, consists of loans secured by second or junior liens on real estate.
Commercial Owner-Occupied Business Lending. We originate and purchase loans secured by commercial owner-occupied real estate, such as retail buildings, small office and light industrial buildings, and mixed-use commercial properties located predominantly in Southern California. We will also, from time to time, make a loan secured by a special purpose property, such as a gas station. Pursuant to our underwriting policies, commercial owner-occupied real estate loans may be made in amounts of up to 75% of the lesser of the appraised value or the purchase price of the collateral property. Loans are generally made for terms up to 15 years with amortization periods up to 30 years. Commercial owner-occupied real estate loans originated or purchased in 2010 had an average balance of $422,000 and an average loan-to-value ratio of 36.3% at origination or purchase. At December 31, 2010, we had $113.0 million of commercial owner-occupied real estate secured loans, constituting 20.0% of our loan portfolio.
Commercial and Industrial Lending. We originate C&I loans secured by business assets including inventory, receivables, machinery and equipment to businesses located in our primary market area. In many instances, real estate holdings of the borrower, its principals or loan guarantors are also taken as collateral. Loan types include revolving lines of credit, term loans, seasonal loans and loans secured by liquid collateral such as cash deposits or marketable securities. We also issue letters of credit on behalf of our customers, backed by loans or deposits with the Company. At December 31, 2010, C&I loans totaled $54.7 million, constituting 9.6% of our loan portfolio, and had additional commitments to extend credit of $30.1 million.
SBA Lending. The Company is approved to originate loans under the SBA’s Preferred Lenders Program (“PLP”). The PLP lending status affords the Company a higher level of delegated credit autonomy, translating to a significantly shorter turnaround time from application to funding, which is critical to our marketing efforts. We originate loans under the SBA’s 7(a), 504, and Express loan programs, in conformity with SBA underwriting and documentation standards. The guaranteed portion of the 7(a) loans is typically sold on the secondary market. At December 31, 2010, we had $4.1 million of SBA loans, constituting 0.7% of our loan portfolio.
Other Loans. We originate other consumer loan products, generally for banking customers only, which consist primarily of saving account and auto loans. Before we make a consumer loan, we assess the applicant’s ability to repay the loan and, if applicable, the value of the collateral securing the loan. At December 31, 2010, we had $1.4 million in other loans that represented 0.02% of our gross loans.
Interest Rates on Our Loans. We employ a risk-based pricing strategy on all loans that we fund. The interest rates, fees and loan structure of our loans generally vary based on a number of factors, including the degree of credit risk, size, maturity of the loan, a borrower’s business or property management expertise, and prevailing market rates for similar types of loans as well as the deposit balances the borrower maintains with us. Adjustable rate C&I and SBA loans are typically priced based on a margin over the Prime rate. Commercial real estate loans are typically 3, 5, 7, or 10-year fixed rate hybrid adjustable-rate loans and are based on one of several interest rate indices. Many of the C&I loans and substantially all of the non-owner occupied real estate loans originated by the Company in 2010 had minimum interest rates, or floor rates, below which the rate charged may not be reduced regardless of further reductions in the underlying interest rate index. Substantially all commercial real estate loans also include prepayment penalties.
Lending Risks on Our Loans. Lending risks vary by the type of loan extended. In our C&I and SBA lending activities, collectability of the loans may be adversely affected by risks generally related to small businesses, such as:
|
·
|
Changes or continued weakness in general or local economic conditions;
|
|
·
|
Changes or continued weakness in specific industry segments, including weakness affecting the business’ customer base;
|
|
·
|
Changes in consumer behavior;
|
|
·
|
Changes in a business’ personnel;
|
|
·
|
Increases in supplier costs that cannot be passed along to customers;
|
|
·
|
Increases in operating expenses (including energy costs);
|
|
·
|
Changes in governmental rules, regulations and fiscal policies;
|
|
·
|
Increases in interest rates, tax rates; and
|
|
·
|
Other factors beyond the control of the borrower or the lender.
|
In our investor real estate loans, payment performance and the liquidation values of collateral properties may be adversely affected by risks generally incidental to interests in real property, such as:
|
·
|
Changes or continued weakness in general or local economic conditions;
|
|
·
|
Changes or continued weakness in specific industry segments;
|
|
·
|
Declines in real estate values;
|
|
·
|
Declines in rental rates;
|
|
·
|
Declines in occupancy rates;
|
|
·
|
Increases in other operating expenses (including energy costs);
|
|
·
|
The availability of property financing;
|
|
·
|
Changes in governmental rules, regulations and fiscal policies, including rent control ordinances, environmental legislation and taxation;
|
|
·
|
Increases in interest rates, real estate and personal property tax rates; and
|
|
·
|
Other factors beyond the control of the borrower or the lender.
|
We attempt to mitigate these risks through sound and prudent underwriting practices, as well as a proactive loan review process and our risk management practices. See “Lending Activities - Underwriting and Approval Authority for Our Loans” immediately below. We will not extend credit to any one borrower that is in excess of regulatory limits.
Underwriting and Approval Authority for Our Loans. Our board of directors establishes our lending policies. Each loan must meet minimum underwriting criteria established in our lending policies and must fit within our overall strategies for yield, interest rate risk, and portfolio concentrations. The underwriting and quality control functions are managed through our corporate office. Each loan application is evaluated from a number of underwriting perspectives. For C&I and SBA loans, underwriting considerations include historic business cash flows, debt service coverage, loan-to-value ratios of underlying collateral, if any, debt to equity ratios, credit history, business experience, history of business, forecasts of operations, economic conditions, business viability, net worth, and liquidity. For loans secured by real estate, underwriting considerations include property appraised value, loan-to-value ratios, level of debt service coverage utilizing both the actual net operating income and forecasted net operating income and use and condition of the property, as well as the borrower’s liquidity, income, credit history, net worth, and operating experience. We do not offer loans on a limited- or no-documentation basis unless fully secured by cash collateral.
Business loans are generally originated as recourse or with full guarantees from key borrowers or borrower principals. Loans secured by real estate are likewise originated on a full recourse basis. On loans made to entities, such as partnerships, limited liability companies, corporations or trusts, we typically obtain personal guarantees from the appropriate managing members, major stockholders, trustees or other appropriate principals. In 2010, substantially all of our loans to entities were originated with full recourse and/or personal guarantees from the principals of the borrowers.
Prior to processing and underwriting any loan request, we issue a letter of interest based on a preliminary analysis by our bankers, which letter details the terms and conditions on which we will consider the loan request. Upon receipt of the signed letter of interest, a completed loan application and a deposit, a credit report and other required reports are ordered and, if necessary, additional information is requested. Upon receipt of all requested information, we process and underwrite each loan application and prepare all the loan documentation after the loan has been approved.
Our credit memorandums, which are prepared by our underwriters, include a description of the transaction and prospective borrower and guarantors, the collateral securing the loan, if any, the proposed uses of loan proceeds and source(s) of repayment, as well as an analysis of the borrower’s business and personal financial statements and creditworthiness. The financial statements and creditworthiness of any guarantors are also analyzed. For loans secured by real property, the credit memorandum will include an analysis of the property. Loans for which real estate is the primary collateral require an independent appraisal conducted by a licensed appraiser. All appraisal reports are appropriately reviewed by our appraisal department. Our board of directors reviews and approves annually the independent list of acceptable appraisers. When appropriate, environmental reports are obtained and reviewed as well.
Following loan approval and prior to funding, our underwriting and processing departments ensure that all loan approval terms have been satisfied, that those terms conform with lending policies (or are properly documented as exceptions with required approvals), and that all the required documentation is present and in proper form.
Business loans are subject to the Company’s guidelines regarding appropriate covenants and periodic monitoring requirements which may include, but are not limited to:
|
·
|
Capital and lease expenditures;
|
|
·
|
Capital levels;
|
|
·
|
Salaries and other withdrawals;
|
|
·
|
Working capital levels;
|
|
·
|
Debt to net worth ratios;
|
|
·
|
Sale of assets;
|
|
·
|
Change of management;
|
|
·
|
Change of ownership;
|
|
·
|
Cash flow requirements;
|
|
·
|
Profitability requirements;
|
|
·
|
Debt service ratio;
|
|
·
|
Collateral coverage ratio; and
|
|
·
|
Current and quick ratios.
|
Subject to the above standards, our board of directors delegates authority and responsibility to management for loan approvals of up to $1.5 million for all loans secured by real estate and up to $250,000 for loans not secured by real estate. Loan approvals at the management level require the approval of at least two members of our Management Loan Committee, consisting of our President and Chief Executive Officer, Chief Credit Officer, and Chief Banking Officer. All loans in excess of $1.5 million, including total aggregate borrowings by one borrower in excess of $1.5 million, and any loan in excess of $250,000 not secured by real estate, require a majority approval of our board’s Credit Committee, which is comprised of three directors, including our President and Chief Executive Officer.
Portfolio Management and Loan Servicing. Portfolio management and loan servicing activities are centralized at our corporate headquarters. Our loan servicing operations are designed to provide prompt customer service and accurate and timely information for account follow-up, financial reporting and loss mitigation. Following the funding of an approved loan, the data is entered into our data processing system, which provides monthly billing statements, tracks payment performance, and effects agreed upon interest rate adjustments. Loan servicing activities include (i) the collection and remittance of loan payments, (ii) accounting for principal and interest and other collections and expenses, and (iii) holding and disbursing escrow or impounding funds for real estate taxes and insurance premiums.
Our portfolio management operations are designed to ensure that management and the board of directors has timely and comprehensive information regarding the performance of our loan portfolio. This information provides an essential leading indicator of potential performance issues prior to loan payment delinquency. For each of the Company’s non-homogeneous loans, our Portfolio Managers collect financial information from borrowers and guarantors in order to conduct a detailed loan review in accordance with our policies, generally annually or more often as appropriate. The Portfolio Managers also visit properties and businesses on a periodic basis to perform inspections of our collateral and associated revenue-generating activities of borrowers. In conjunction with the loan review process, all loans in the portfolio are assigned a risk grade that, among other purposes, factors into the Company’s allowance for loan and lease loss calculations.
When payments are not received by their contractual due date, collection efforts are initiated by our loss mitigation personnel. Accounts past-due by more than 10 days are assigned to our collector for comprehensive payment collection efforts. Our Portfolio Managers conduct an evaluation of all loans 90 days or more past due by obtaining an estimate of value on the underlying collateral and an analysis of such collateral. The evaluation may result in our partial or complete charge off of the loan, but collection efforts still continue. Portfolio Managers also conduct discussions with borrowers in order to identify whether alternatives to foreclosure exist. When foreclosure will maximize the Company’s recovery for a non-performing loan, the Portfolio Managers will carry out the foreclosure process, including any associated judicial legal actions.
Loan Portfolio Composition. At December 31, 2010, our net loans receivable held for investment totaled $555.5 million and we had no loans receivable held for sale. The types of loans that the Company may originate are subject to federal and state law.
The following table sets forth the composition of our loan portfolio in dollar amounts and as a percentage of the portfolio at the dates indicated:
|
At December 31,
|
||||||||||||||||||||||||||||||||||||
|
2010
|
2009
|
2008
|
||||||||||||||||||||||||||||||||||
|
Amount
|
% of Total
|
Weighted Average Interest Rate
|
Amount
|
% of Total
|
Weighted Average Interest Rate
|
Amount
|
% of Total
|
Weighted Average Interest Rate
|
||||||||||||||||||||||||||||
|
(dollars in thousands)
|
||||||||||||||||||||||||||||||||||||
|
Real estate loans:
|
||||||||||||||||||||||||||||||||||||
|
Multi-family
|
$ | 243,584 | 42.9 | % | 6.2 | % | $ | 278,744 | 48.4 | % | 6.2 | % | $ | 287,592 | 45.7 | % | 6.3 | % | ||||||||||||||||||
|
Commercial investor
|
130,525 | 23.0 | % | 6.7 | % | 149,577 | 26.0 | % | 6.8 | % | 163,428 | 26.0 | % | 7.0 | % | |||||||||||||||||||||
|
One-to-four family (1)
|
20,318 | 3.6 | % | 5.4 | % | 8,491 | 1.5 | % | 8.3 | % | 9,925 | 1.6 | % | 8.8 | % | |||||||||||||||||||||
|
Construction
|
- | 0.0 | % | 0.0 | % | - | 0.0 | % | 0.0 | % | 2,733 | 0.4 | % | 8.0 | % | |||||||||||||||||||||
|
Land
|
- | 0.0 | % | 0.0 | % | - | 0.0 | % | 0.0 | % | 2,550 | 0.4 | % | 0.0 | % | |||||||||||||||||||||
|
Business loans:
|
||||||||||||||||||||||||||||||||||||
|
Commercial owner occupied (2)
|
113,025 | 20.0 | % | 6.6 | % | 103,019 | 17.9 | % | 7.1 | % | 112,406 | 17.9 | % | 7.1 | % | |||||||||||||||||||||
|
Commercial and industrial
|
54,687 | 9.6 | % | 6.3 | % | 31,109 | 5.4 | % | 7.0 | % | 43,235 | 6.9 | % | 6.8 | % | |||||||||||||||||||||
|
SBA
|
4,088 | 0.7 | % | 5.9 | % | 3,337 | 0.5 | % | 5.7 | % | 4,942 | 0.8 | % | 6.3 | % | |||||||||||||||||||||
|
Other loans
|
1,417 | 0.2 | % | 4.5 | % | 1,991 | 0.3 | % | 1.3 | % | 1,956 | 0.3 | % | 2.3 | % | |||||||||||||||||||||
|
Total gross loans
|
567,644 | 100.0 | % | 6.4 | % | 576,268 | 100.0 | % | 6.6 | % | 628,767 | 100.0 | % | 6.7 | % | |||||||||||||||||||||
|
Less loans held for sale
|
- | - | 668 | |||||||||||||||||||||||||||||||||
|
Total gross loans held for investment
|
567,644 | 576,268 | 628,099 | |||||||||||||||||||||||||||||||||
|
Less (plus):
|
||||||||||||||||||||||||||||||||||||
|
Deferred loan origination costs (fees) and premiums (discounts)
|
(3,227 | ) | (779 | ) | 252 | |||||||||||||||||||||||||||||||
|
Allowance for loan losses
|
(8,879 | ) | (8,905 | ) | (5,881 | ) | ||||||||||||||||||||||||||||||
|
Loans held for investment, net
|
$ | 555,538 | $ | 566,584 | $ | 622,470 | ||||||||||||||||||||||||||||||
| At December 31, | ||||||||||||||||||||||||
|
2007
|
2006
|
|||||||||||||||||||||||
|
Amount
|
% of Total
|
Weighted Average Interest Rate
|
Amount
|
% of Total
|
Weighted Average Interest Rate
|
|||||||||||||||||||
|
(dollars in thousands)
|
||||||||||||||||||||||||
|
Real estate loans:
|
||||||||||||||||||||||||
|
Multi-family
|
$ | 341,263 | 54.5 | % | 6.8 | % | $ | 357,275 | 58.8 | % | 6.9 | % | ||||||||||||
|
Commercial investor
|
142,134 | 22.7 | % | 7.2 | % | 170,175 | 28.0 | % | 7.4 | % | ||||||||||||||
|
One-to-four family (1)
|
13,080 | 2.1 | % | 8.6 | % | 12,825 | 2.1 | % | 9.5 | % | ||||||||||||||
|
Construction
|
2,048 | 0.3 | % | 7.8 | % | - | 0.0 | % | 0.0 | % | ||||||||||||||
|
Land
|
5,389 | 0.9 | % | 11.9 | % | 3,277 | 0.5 | % | 8.9 | % | ||||||||||||||
|
Business loans:
|
||||||||||||||||||||||||
|
Commercial owner occupied (2)
|
57,614 | 9.2 | % | 7.6 | % | 35,929 | 5.9 | % | 7.3 | % | ||||||||||||||
|
Commercial and industrial
|
50,992 | 8.1 | % | 8.1 | % | 22,762 | 3.8 | % | 9.1 | % | ||||||||||||||
|
SBA
|
13,995 | 2.2 | % | 8.5 | % | 5,312 | 0.9 | % | 9.9 | % | ||||||||||||||
|
Other loans
|
177 | 0.0 | % | 8.6 | % | 63 | 0.0 | % | 9.4 | % | ||||||||||||||
|
Total gross loans
|
626,692 | 100.0 | % | 7.2 | % | 607,618 | 100.0 | % | 7.2 | % | ||||||||||||||
|
Less loans held for sale
|
749 | 795 | ||||||||||||||||||||||
|
Total gross loans held for investment
|
625,943 | 606,823 | ||||||||||||||||||||||
|
Less (plus):
|
||||||||||||||||||||||||
|
Deferred loan origination costs (fees) and premiums (discounts)
|
769 | 1,024 | ||||||||||||||||||||||
|
Allowance for loan losses
|
(4,598 | ) | (3,543 | ) | ||||||||||||||||||||
|
Loans held for investment, net
|
$ | 622,114 | $ | 604,304 | ||||||||||||||||||||
|
(1) Includes second trust deeds.
|
||||||||||||||||||||||||
|
(2) Secured by real estate
|
||||||||||||||||||||||||
Loan Portfolio Characteristics. In general, the Company does not require regular updates of collateral valuations for non-homogeneous loans that are not classified as potential problem or problem loans. However, updated valuations are obtained for collateral securing non-homogeneous loans that are identified as potential problem or problem loans at least every twenty-four months. Updated collateral valuations may be required more frequently at the discretion of the Company’s management or for loans identified as impaired in accordance with the Company’s allowance for loan loss policy. Market values may be substantiated by obtaining an appraisal or an appropriate evaluation by the Company’s Chief Appraiser. At December 31, 2010, 21.4% of multi-family, 23.2% of commercial investor and 28.8% of commercial owner occupied loans had current updated collateral valuations within the last twenty-four months.
The following table sets forth by loan category our average loan size, months of seasoning, average loan-to-value ratio (the proportion of the principal amount of the loan to the most current market value of the collateral property) and debt coverage ratio (the proportion of the property's annual net operating income to its annual debt service, which includes principal and interest payments) at the date indicated.
|
At December 31, 2010
|
||||||||||||||||
|
Average
Loan Size
|
Seasoning (months)
|
Loan-to-
Value Ratio
|
Debt
Coverage Ratio
|
|||||||||||||
|
(dollars in thousands)
|
||||||||||||||||
|
Real estate loans:
|
||||||||||||||||
|
Multi-family
|
$ | 1,041 | 65 | 69 | % | 1.20 | ||||||||||
|
Commercial investor
|
1,165 | 56 | 59 | % | 1.29 | |||||||||||
|
One-to-four family
|
109 | 110 | 67 | % | N/A | |||||||||||
|
Business loans:
|
||||||||||||||||
|
Commercial owner occupied
|
706 | 85 | 51 | % | N/A | |||||||||||
|
Commercial and industrial
|
511 | 38 | N/A | N/A | ||||||||||||
|
SBA
|
151 | 34 | N/A | N/A | ||||||||||||
|
Other loans
|
80 | 27 | N/A | N/A | ||||||||||||
Loan Maturity. For our commercial real estate and business loans, repayment typically depends on the successful operation of the businesses or the properties securing the loans. Several months before a loan matures, our portfolio managers contact our borrowers to obtain personal and/or business financial and operations data and property information for review. When deemed appropriate, business and property visits are made to assess the borrower’s revenue-generating activities and to perform inspections of our collateral. This information is reviewed and evaluated for indications of potential payoff issues prior to maturity. If potential issues are discovered, our portfolio managers work on a strategy with the borrower well in advance of the loan maturing in order to maximize the benefit to the Company. At December 31, 2010, we had $26.8 million or 4.7% of total gross loans held for investment that were due to mature in one year or less, primarily in our loan category of total C&I loans of $25.8 million.
The following table does not reflect prepayment assumptions, but rather shows the contractual maturity of the Company's loans at the date indicated:
|
At December 31, 2010
|
||||||||||||||||||||||||||||||||
|
Multifamily
|
Commercial Investor
|
One-to-Four Family
|
Commercial
Owner Occupied
|
Commercial and Industrial
|
SBA
|
Other
Loans
|
Total
|
|||||||||||||||||||||||||
|
(in thousands)
|
||||||||||||||||||||||||||||||||
|
Amounts due
|
||||||||||||||||||||||||||||||||
|
One year or less
|
$ | - | $ | - | $ | 2 | $ | 423 | $ | 25,829 | $ | - | $ | 583 | $ | 26,837 | ||||||||||||||||
|
More than one year to three years
|
758 | 4,240 | 315 | 4,634 | 1,747 | 1,057 | 31 | 12,782 | ||||||||||||||||||||||||
|
More than three years to five years
|
446 | 21,624 | 507 | 5,310 | 5,471 | 271 | 27 | 33,656 | ||||||||||||||||||||||||
|
More than five years to 10 years
|
7,107 | 91,657 | 6,326 | 38,044 | 5,749 | 2,760 | 122 | 151,765 | ||||||||||||||||||||||||
|
More than 10 years to 20 years
|
2,269 | 5,405 | 4,823 | 33,912 | 3,281 | - | 654 | 50,344 | ||||||||||||||||||||||||
|
More than 20 years
|
233,004 | 7,599 | 8,345 | 30,702 | 12,610 | - | - | 292,260 | ||||||||||||||||||||||||
|
Total gross loans
|
243,584 | 130,525 | 20,318 | 113,025 | 54,687 | 4,088 | 1,417 | 567,644 | ||||||||||||||||||||||||
|
Less (plus)
|
||||||||||||||||||||||||||||||||
|
Deferred loan origination (fees) costs
|
(176 | ) | (121 | ) | (1,676 | ) | (151 | ) | (4 | ) | (1,316 | ) | 217 | (3,227 | ) | |||||||||||||||||
|
Allowance for loan losses (allocated)
|
(2,730 | ) | (1,580 | ) | (332 | ) | (1,687 | ) | (2,356 | ) | (145 | ) | (49 | ) | (8,879 | ) | ||||||||||||||||
|
Total loans, net
|
240,678 | 128,824 | 18,310 | 111,187 | 52,327 | 2,627 | 1,585 | 555,538 | ||||||||||||||||||||||||
|
Loans held for sale, net
|
- | - | - | - | - | - | - | - | ||||||||||||||||||||||||
|
Loans held for investment, net
|
$ | 240,678 | $ | 128,824 | $ | 18,310 | $ | 111,187 | $ | 52,327 | $ | 2,627 | $ | 1,585 | $ | 555,538 | ||||||||||||||||
The following table sets forth at December 31, 2010 the dollar amount of gross loans receivable contractually due after December 31, 2011 and whether such loans have fixed interest rates or adjustable interest rates.
|
At December 31, 2010
|
||||||||||||
|
Loans Due After December 31, 2011
|
||||||||||||
|
Fixed
|
Adjustable
|
Total
|
||||||||||
|
(in thousands)
|
||||||||||||
|
Real estate loans:
|
||||||||||||
|
Multi-family
|
$ | 1,493 | $ | 242,091 | $ | 243,584 | ||||||
|
Commercial investor
|
17,226 | 113,299 | 130,525 | |||||||||
|
One-to-four family
|
4,576 | 15,740 | 20,316 | |||||||||
|
Business loans:
|
||||||||||||
|
Commercial owner occupied
|
59,134 | 53,468 | 112,602 | |||||||||
|
Commercial and industrial
|
3,182 | 25,676 | 28,858 | |||||||||
|
SBA
|
49 | 4,039 | 4,088 | |||||||||
|
Other loans
|
812 | 22 | 834 | |||||||||
|
Total gross loans
|
$ | 86,472 | $ | 454,335 | $ | 540,807 | ||||||
The following table sets forth the Company’s loan originations, purchases, sales, and principal repayments for the periods indicated:
|
For the Year Ended December 31,
|
||||||||||||
|
2010
|
2009
|
2008
|
||||||||||
|
(in thousands)
|
||||||||||||
|
Beginning balance of gross loans
|
$ | 576,268 | $ | 628,767 | $ | 626,692 | ||||||
|
Loans originated:
|
||||||||||||
|
Real estate loans:
|
||||||||||||
|
Multi-family
|
- | 494 | 34,166 | |||||||||
|
Commercial investor
|
- | - | 33,058 | |||||||||
|
One-to-four family
|
- | 200 | 250 | |||||||||
|
Business loans:
|
||||||||||||
|
Commercial owner occupied
|
600 | 365 | 5,375 | |||||||||
|
Commecial and industrial
|
63,530 | 4,249 | 17,512 | |||||||||
|
SBA
|
2,322 | 1,150 | 907 | |||||||||
|
Other loans
|
5,183 | 958 | 1,215 | |||||||||
|
Total loans originated
|
71,635 | 7,416 | 92,483 | |||||||||
|
Loans purchased:
|
||||||||||||
|
Multi-family
|
- | 4,051 | 4,577 | |||||||||
|
Commercial investor
|
2,579 | - | 9,305 | |||||||||
|
Commercial owner occupied
|
26,380 | - | 53,710 | |||||||||
|
Commecial and industrial
|
745 | - | - | |||||||||
|
Other loans
|
9,884 | - | - | |||||||||
|
Total loans purchased
|
39,588 | 4,051 | 67,592 | |||||||||
|
Total loan production
|
111,223 | 11,467 | 160,075 | |||||||||
|
Total
|
687,491 | 640,234 | 786,767 | |||||||||
|
Less:
|
||||||||||||
|
Principal repayments
|
61,983 | 56,808 | 161,352 | |||||||||
|
Change in undisbursed loan funds
|
21,984 | (4,701 | ) | (10,854 | ) | |||||||
|
Sales of loans
|
29,977 | 2,515 | 6,235 | |||||||||
|
Charge-offs
|
2,339 | 4,811 | 1,174 | |||||||||
|
Transfer to other real estate owned
|
3,564 | 4,533 | 93 | |||||||||
|
Total gross loans
|
567,644 | 576,268 | 628,767 | |||||||||
|
Ending balance loans held for sale, gross
|
- | - | 668 | |||||||||
|
Ending balance loans held for investment, gross
|
$ | 567,644 | $ | 576,268 | $ | 628,099 | ||||||
Delinquent Loans. When a borrower fails to make required payments on a loan and does not cure the delinquency within 30 days, we normally record a notice of default and, after providing the required notices to the borrower, commence foreclosure proceedings. If the loan is not reinstated within the time permitted by law, we may sell the property at a foreclosure sale. At these foreclosure sales, we generally acquire title to the property. At December 31, 2010, loans delinquent 60 or more days as a percentage of total gross loans was 0.54%, down from 0.95% at year-end 2009.
The following table sets forth delinquencies in the Company's loan portfolio at the dates indicated:
|
30 - 59 Days
|
60 - 89 Days
|
90 Days or More (1)
|
||||||||||||||||||||||
|
# of
Loans
|
Principal
Balance
of Loans
|
# of
Loans
|
Principal
Balance
of Loans
|
# of
Loans
|
Principal
Balance
of Loans
|
|||||||||||||||||||
|
(dollars in thousands)
|
||||||||||||||||||||||||
|
At December 31, 2010
|
||||||||||||||||||||||||
|
Real estate loans:
|
||||||||||||||||||||||||
|
Commercial investor
|
2 | $ | 617 | - | $ | - | - | $ | - | |||||||||||||||
|
One-to-four family
|
3 | $ | 402 | 1 | $ | 17 | 1 | $ | 20 | |||||||||||||||
|
Business loans:
|
||||||||||||||||||||||||
|
Commercial owner occupied
|
1 | 184 | - | - | 3 | 2,225 | ||||||||||||||||||
|
SBA
|
- | - | - | - | 7 | 846 | ||||||||||||||||||
|
Total
|
6 | $ | 1,203 | 1 | $ | 17 | 11 | $ | 3,091 | |||||||||||||||
|
Delinquent loans to total gross loans
|
0.21 | % | 0.00 | % | 0.54 | % | ||||||||||||||||||
|
At December 31, 2009
|
||||||||||||||||||||||||
|
Real estate loans:
|
||||||||||||||||||||||||
|
Multi-family
|
1 | $ | 3,150 | - | $ | - | 3 | $ | 2,073 | |||||||||||||||
|
Commercial investor
|
1 | 694 | - | - | 1 | 1,851 | ||||||||||||||||||
|
One-to-four family
|
3 | 44 | - | - | 4 | 97 | ||||||||||||||||||
|
Business loans:
|
||||||||||||||||||||||||
|
Commercial owner occupied
|
- | - | - | - | 2 | 996 | ||||||||||||||||||
|
SBA
|
1 | 69 | 1 | 52 | 3 | 463 | ||||||||||||||||||
|
Other
|
1 | 18 | - | - | - | - | ||||||||||||||||||
|
Total
|
7 | $ | 3,975 | 1 | $ | 52 | 13 | $ | 5,480 | |||||||||||||||
|
Delinquent loans to total gross loans
|
0.69 | % | 0.01 | % | 0.95 | % | ||||||||||||||||||
|
At December 31, 2008
|
||||||||||||||||||||||||
|
Real estate loans:
|
||||||||||||||||||||||||
|
Multi-family
|
- | $ | - | - | $ | - | 1 | $ | 350 | |||||||||||||||
|
Commercial investor
|
1 | 1,062 | 1 | 317 | 1 | 638 | ||||||||||||||||||
|
One-to-four family
|
4 | 129 | 2 | 32 | 8 | 637 | ||||||||||||||||||
|
Land
|
- | - | - | - | 1 | 2,550 | ||||||||||||||||||
|
Business loans:
|
||||||||||||||||||||||||
|
SBA
|
1 | 216 | - | - | 2 | 127 | ||||||||||||||||||
|
Total
|
6 | $ | 1,407 | 3 | $ | 349 | 13 | $ | 4,302 | |||||||||||||||
|
Delinquent loans to total gross loans
|
0.22 | % | 0.06 | % | 0.68 | % | ||||||||||||||||||
|
At December 31, 2007
|
||||||||||||||||||||||||
|
Real estate loans:
|
||||||||||||||||||||||||
|
Commercial investor
|
1 | $ | 641 | 1 | $ | 641 | 1 | $ | 3,125 | |||||||||||||||
|
One-to-four family and other loans
|
8 | 251 | 15 | 719 | 7 | 284 | ||||||||||||||||||
|
Business loans:
|
||||||||||||||||||||||||
|
Commercial and industrial
|
2 | 208 | 3 | 458 | - | - | ||||||||||||||||||
|
SBA
|
2 | 119 | 5 | 804 | - | - | ||||||||||||||||||
|
Total
|
13 | $ | 1,219 | 24 | $ | 2,622 | 8 | $ | 3,409 | |||||||||||||||
|
Delinquent loans to total gross loans
|
0.19 | % | 0.42 | % | 0.54 | % | ||||||||||||||||||
|
At December 31, 2006
|
||||||||||||||||||||||||
|
Real estate loans:
|
||||||||||||||||||||||||
|
One-to-four family and other loans
|
4 | $ | 108 | 4 | $ | 182 | 13 | $ | 634 | |||||||||||||||
|
Total
|
4 | $ | 108 | 4 | $ | 182 | 13 | $ | 634 | |||||||||||||||
|
Delinquent loans to total gross loans
|
0.02 | % | 0.03 | % | 0.10 | % | ||||||||||||||||||
(1) All 90 day or greater delinquency are on nonaccrual status and are reported as part of nonperforming loans.
Allowance for Loan Losses. We maintain an allowance for loan losses to absorb losses inherent in the loans held for investment portfolio at the balance sheet date. Management evaluates the adequacy of the allowance quarterly to maintain the allowance at levels sufficient to provide for these inherent losses. The allowance for loan losses is reported as a reduction of loans held for investment. The allowance is increased by a provision for loan losses which is charged to expense and reduced by charge-offs, net of recoveries. Loans held for sale are carried at the lower of amortized cost or fair value. Net unrealized losses, if any, are recorded in current earnings.
The federal banking agencies adopted an interagency policy statement on the allowance for loan and lease losses. The policy statement provides guidance for financial institutions on both the responsibilities of management for the assessment and establishment of adequate allowances and guidance for banking agency examiners to use in determining the adequacy of general valuation allowances. Generally, the policy statement recommends that institutions establish and maintain effective systems and controls to identify, monitor and address asset quality problems; that management analyzes all significant factors that affect the collectability of the portfolio in a reasonable manner; and that management establishes acceptable allowance evaluation processes that meet the objectives set forth in the policy statement. Federal regulations require that the Bank utilize an internal asset classification system to identify and report problem and potential problem assets. The Bank’s Chief Credit Officer has responsibility for identifying and reporting problem assets to the Bank’s Credit and Investment Review Committee (“CIRC”), which operates pursuant to the board-approved CIRC policy. The policy incorporates the regulatory requirements of monitoring and classifying all of our assets.
We separate our assets, largely loans, by type, and we use various asset classifications to segregate the assets into various risk categories. We use the various asset classifications as a means of measuring risk for determining the valuation allowance for groups and individual assets at a point in time. Currently, we designate our assets into a category of “Pass,”, “Special Mention”, “Substandard” or “Loss.” A brief description of these classifications follows:
|
·
|
Pass classifications represent assets with a level of credit quality which contain no well-defined deficiency or weakness.
|
|
·
|
Special Mention assets do not currently expose the Bank to sufficient risk to warrant classification in one of the adverse categories, but possess correctable deficiency or potential weaknesses deserving management’s close attention.
|
|
·
|
Substandard assets are inadequately protected by the current net worth and paying capacity of the obligor or of the collateral pledged, if any. These assets are characterized by the distinct possibility that the Bank will sustain some loss if the deficiencies are not corrected. Other real estate owned (“OREO”) acquired from foreclosure is classified as substandard.
|
|
·
|
Loss assets are those that are considered uncollectible and of such little value that their continuance as assets is not warranted. Amounts classified as loss are promptly charged off.
|
Our determination as to the classification of assets and the amount of valuation allowances necessary are subject to review by bank regulatory agencies, which can order a change in a classification or an increase to the allowance. While we believe that an adequate allowance for estimated loan losses has been established, there can be no assurance that our regulators, in reviewing assets including the loan portfolio, will not request us to materially increase our allowance for estimated loan losses, thereby negatively affecting our financial condition and earnings at that time. In addition, actual losses are dependent upon future events and, as such, further increases to the level of allowances for estimated loan losses may become necessary.
The Company’s CIRC reviews the Chief Credit Officer’s recommendations for classifying our assets quarterly and reports the results of our review to the board of directors. At December 31, 2010, we had $20.6 million of assets classified as substandard, compared to $36.9 million at December 31, 2009. The decrease was primarily in our loan categories of $13.7 million and OREO of $3.3 million.
The following tables set forth information concerning substandard assets at the dates indicated:
|
At December 31, 2010
|
||||||||||||||||||||||||||||||||
|
Loans
|
OREO
|
Securities
|
Total Substandard Assets
|
|||||||||||||||||||||||||||||
|
Gross Balance
|
# of Loans
|
Balance
|
# of Properties
|
Fair Value
|
# of Securities
|
Balance
|
# of Assets
|
|||||||||||||||||||||||||
|
(dollars in thousands)
|
||||||||||||||||||||||||||||||||
|
Real estate loans:
|
||||||||||||||||||||||||||||||||
|
Multi-family
|
$ | 4,153 | 5 | $ | - | - | -- | -- | $ | 4,153 | 5 | |||||||||||||||||||||
|
Commercial investor
|
5,435 | 8 | - | - | -- | -- | 5,435 | 8 | ||||||||||||||||||||||||
|
One-to-four family
|
495 | 9 | 34 | 1 | -- | -- | 529 | 10 | ||||||||||||||||||||||||
|
Business loans:
|
||||||||||||||||||||||||||||||||
|
Commercial owner occupied
|
4,476 | 7 | - | - | -- | -- | 4,476 | 7 | ||||||||||||||||||||||||
|
Commercial and industrial
|
1,139 | 5 | - | - | -- | -- | 1,139 | 5 | ||||||||||||||||||||||||
|
SBA
|
1,132 | 11 | - | - | -- | -- | 1,132 | 11 | ||||||||||||||||||||||||
|
Securities
|
-- | -- | -- | -- | 3,781 | 52 | 3,781 | 52 | ||||||||||||||||||||||||
|
Total substandard assets
|
$ | 16,830 | 45 | $ | 34 | 1 | $ | 3,781 | 52 | $ | 20,645 | 98 | ||||||||||||||||||||
|
At December 31, 2009
|
||||||||||||||||||||||||||||||||
|
Loans
|
OREO
|
Securities
|
Total Substandard Assets
|
|||||||||||||||||||||||||||||
|
Gross Balance
|
# of Loans
|
Balance
|
# of Properties
|
Fair Value
|
# of Securities
|
Balance
|
# of Assets
|
|||||||||||||||||||||||||
|
(dollars in thousands)
|
||||||||||||||||||||||||||||||||
|
Real estate loans:
|
||||||||||||||||||||||||||||||||
|
Multi-family
|
$ | 12,268 | 10 | $ | - | - | -- | -- | $ | 12,268 | 10 | |||||||||||||||||||||
|
Commercial investor
|
10,712 | 12 | 515 | 1 | -- | -- | 11,227 | 13 | ||||||||||||||||||||||||
|
One-to-four family
|
724 | 16 | - | - | -- | -- | 724 | 16 | ||||||||||||||||||||||||
|
Land
|
- | - | 2,138 | 1 | -- | -- | 2,138 | 1 | ||||||||||||||||||||||||
|
Business loans:
|
||||||||||||||||||||||||||||||||
|
Commercial owner occupied
|
3,576 | 7 | 727 | 1 | -- | -- | 4,303 | 8 | ||||||||||||||||||||||||
|
Commercial and industrial
|
2,102 | 6 | - | - | -- | -- | 2,102 | 6 | ||||||||||||||||||||||||
|
SBA
|
1,146 | 11 | - | - | -- | -- | 1,146 | 11 | ||||||||||||||||||||||||
|
Securities
|
-- | -- | -- | -- | 2,988 | 27 | 2,988 | 27 | ||||||||||||||||||||||||
|
Total substandard assets
|
$ | 30,528 | 62 | $ | 3,380 | 3 | $ | 2,988 | 27 | $ | 36,896 | 92 | ||||||||||||||||||||
In determining the allowance for loan losses, we evaluate loan credit losses on an individual basis in accordance with FASB Statement No. 114, Accounting by Creditors for Impairment of a Loan, and on a collective basis based on FASB Statement No. 5, Accounting for Contingencies. For loans evaluated on an individual basis, we analyze the borrower’s creditworthiness, cash flows and financial status, and the condition and estimated value of the collateral. Loans evaluated individually that are deemed to be impaired are separated from our collective credit loss analysis.
Unless an individual borrower relationship warrants a separate analysis, the majority of our loans are evaluated for credit losses on a collective basis through a quantitative analysis to arrive at base loss factors that are adjusted through a qualitative analysis for internal and external identified risks. The adjusted factor is applied against the loan risk category to determine the appropriate allowance. Our base loss factors are calculated using our trailing twelve-month and annualized trailing six-month actual charge-off data for all loan types except (1) loans fully secured by cash deposits, the guaranteed portion of SBA loans and FHA/VA guaranteed 1st TD loans, for which there is no loss exposure, (2) certain loan segments for which we have no recent loss experience and for which we rely on charge-off data for all FDIC insured commercial banks and savings institutions based in California, and (3) negative deposit accounts. Then adjustments for the following internal and external risk factors are added to the base factors:
Internal Factors
· Changes in lending policies and procedures, including underwriting standards and collection, charge-offs, and recovery practices;
· Changes in the nature and volume of the loan portfolio and the terms of loans, as well as new types of lending;
· Changes in the experience, ability, and depth of lending management and other relevant staff that may have an impact on our loan portfolio;
· Changes in the volume and severity of past due and classified loans, and in the volume of non-accruals, troubled debt restructurings, and other loan modifications;
· Changes in the quality of our loan review system and the degree of oversight by our board of directors; and
· The existence and effect of any concentrations of credit and changes in the level of such concentrations.
External Factors
· Changes in national, state and local economic and business conditions and developments that affect the collectability of the portfolio, including the condition of various market segments (includes trends in real estate values and the interest rate environment);
· Changes in the value of the underlying collateral for collateral-dependent loans; and
· The effect of external factors, such as competition, legal developments and regulatory requirements on the level of estimated credit losses in our current loan portfolio.
The factor adjustment for each of the nine above-described risk factors are determined by the Chief Credit Officer and approved by the CIRC on a quarterly basis.
The allowance for loan loss (“ALLL”) factors are reviewed for reasonableness against the 10-year average, 15-year average, and trailing twelve month total charge-off data for all FDIC insured commercial banks and savings institutions based in California. Given the above evaluations, the amount of the allowance for loan losses is based upon the total loans evaluated individually and collectively.
As of December 31, 2010, the allowance for loan losses totaled $8.9 million, essentially unchanged from December 31, 2009 and up from $5.9 million at December 31, 2008. At December 31, 2010, the allowance for loan losses as a percent of nonperforming loans was 270.9%, compared with 88.9% at December 31, 2009 and 113.1% at December 31, 2008. At December 31, 2010, the allowance for loan losses as a per-cent of gross loans was 1.56%, compared with 1.55% at December 31, 2009 and 0.94% at December 31, 2008.
The following table sets forth the Company’s allowance for loan losses and the percent of gross loans to total gross loans in each of the categories listed for the periods indicated:
|
For the Year Ended December 31,
|
||||||||||||||||||||
|
2010
|
2009
|
2008
|
2007
|
2006
|
||||||||||||||||
|
(dollars in thousands)
|
||||||||||||||||||||
|
Allowance for Loan Losses
|
||||||||||||||||||||
|
Balance at beginning of period
|
8,905 | 5,881 | 4,598 | 3,543 | 3,050 | |||||||||||||||
|
ALLL Transfer In *
|
- | - | 8 | - | - | |||||||||||||||
|
Provision for loan losses
|
2,092 | 7,735 | 2,241 | 1,651 | 531 | |||||||||||||||
|
Charge-offs:
|
||||||||||||||||||||
|
Real estate:
|
||||||||||||||||||||
|
Multi-family
|
334 | 1,527 | - | - | - | |||||||||||||||
|
Commercial investor
|
512 | 317 | - | - | - | |||||||||||||||
|
One-to-four family
|
123 | 125 | 226 | 101 | 266 | |||||||||||||||
|
Business loans:
|
||||||||||||||||||||
|
Commercial owner occupied
|
264 | 59 | - | - | - | |||||||||||||||
|
Commercial and industrial
|
708 | 1,409 | - | - | - | |||||||||||||||
|
SBA
|
398 | 906 | 948 | 600 | - | |||||||||||||||
|
Other loans
|
- | 468 | - | - | - | |||||||||||||||
|
Total charge-offs
|
2,339 | 4,811 | 1,174 | 701 | 266 | |||||||||||||||
|
Recoveries:
|
||||||||||||||||||||
|
Real estate:
|
||||||||||||||||||||
|
One-to-four family
|
40 | 26 | 88 | 103 | 225 | |||||||||||||||
|
Business loans:
|
||||||||||||||||||||
|
Commercial and industrial
|
13 | 4 | - | - | - | |||||||||||||||
|
SBA
|
154 | 31 | - | - | - | |||||||||||||||
|
Other loans
|
14 | 39 | 120 | 2 | 3 | |||||||||||||||
|
Total recoveries
|
221 | 100 | 208 | 105 | 228 | |||||||||||||||
|
Net loan charge-offs
|
2,118 | 4,711 | 966 | 596 | 38 | |||||||||||||||
|
Balance at end of period
|
$ | 8,879 | $ | 8,905 | $ | 5,881 | $ | 4,598 | $ | 3,543 | ||||||||||
|
Ratios
|
||||||||||||||||||||
|
Net charge-offs to average net loans
|
0.39 | % | 0.79 | % | 0.16 | % | 0.10 | % | 0.01 | % | ||||||||||
|
Allowance for loan losses to gross loans at end of period
|
1.56 | % | 1.55 | % | 0.94 | % | 0.73 | % | 0.58 | % | ||||||||||
|
* Note: Represents the addition of valuation reserves for overdrafts that were previously held outside of the General Allowance.
|
||||||||||||||||||||
The following table sets forth the Company’s allowance for loan losses and the percent of gross loans to total gross loans in each of the categories listed at the dates indicated:
|
At December 31,
|
||||||||||||||||||||||||||||||||||||
|
2010
|
2009
|
2008
|
||||||||||||||||||||||||||||||||||
|
% of Loans in
|
Allowance as
|
% of Loans in
|
Allowance as
|
% of Loans in
|
Allowance as
|
|||||||||||||||||||||||||||||||
|
Category to
|
a % of Loan
|
Category to
|
a % of Loan
|
Category to
|
a % of Loan
|
|||||||||||||||||||||||||||||||
|
Balance at End of
Period Applicable to
|
Amount
|
Total Loans
|
Category Balance
|
Amount
|
Total Loans
|
Category Balance
|
Amount
|
Total Loans
|
Category Balance
|
|||||||||||||||||||||||||||
|
(dollars in thousands)
|
||||||||||||||||||||||||||||||||||||
|
Real estate loans:
|
||||||||||||||||||||||||||||||||||||
|
Multi-family
|
$ | 2,730 | 42.9 | % | 1.12 | % | $ | 3,386 | 48.4 | % | 1.21 | % | $ | 1,958 | 45.7 | % | 0.68 | % | ||||||||||||||||||
|
Commercial investor
|
1,580 | 23.0 | % | 1.21 | % | 1,602 | 26.0 | % | 1.07 | % | 1,373 | 26.0 | % | 0.84 | % | |||||||||||||||||||||
|
One-to-four family
|
332 | 3.6 | % | 1.63 | % | 272 | 1.5 | % | 3.20 | % | 231 | 1.6 | % | 2.33 | % | |||||||||||||||||||||
|
Construction
|
- | 0.0 | % | 0.00 | % | - | 0.0 | % | 0.00 | % | 78 | 0.4 | % | 2.84 | % | |||||||||||||||||||||
|
Land
|
- | 0.0 | % | 0.00 | % | - | 0.0 | % | 0.00 | % | - | 0.4 | % | 0.00 | % | |||||||||||||||||||||
|
Business loans:
|
- | - | - | |||||||||||||||||||||||||||||||||
|
Commercial owner occupied
|
1,687 | 20.0 | % | 1.49 | % | 907 | 17.9 | % | 0.88 | % | 935 | 17.9 | % | 0.83 | % | |||||||||||||||||||||
|
Commercial and industrial
|
2,356 | 9.6 | % | 4.31 | % | 2,410 | 5.4 | % | 7.75 | % | 1,123 | 6.9 | % | 2.60 | % | |||||||||||||||||||||
|
SBA
|
145 | 0.7 | % | 3.55 | % | 326 | 0.5 | % | 9.78 | % | 177 | 0.8 | % | 3.57 | % | |||||||||||||||||||||
|
Other Loans
|
49 | 0.2 | % | 3.46 | % | 2 | 0.3 | % | 0.10 | % | 7 | 0.3 | % | 0.37 | % | |||||||||||||||||||||
|
Total
|
$ | 8,879 | 100.0 | % | 1.56 | % | $ | 8,905 | 100.0 | % | 1.55 | % | $ | 5,881 | 100.0 | % | 0.94 | % | ||||||||||||||||||
| At December 31, | ||||||||||||||||||||||||
|
2007
|
2006
|
|||||||||||||||||||||||
|
% of Loans in
|
Allowance as
|
% of Loans in
|
Allowance as
|
|||||||||||||||||||||
|
Balance at End of
|
Category to
|
a % of Loan
|
Category to
|
a % of Loan
|
||||||||||||||||||||
|
Period Applicable to
|
Amount
|
Total Loans
|
Category Balance
|
Amount
|
Total Loans
|
Category Balance
|
||||||||||||||||||
|
Real estate loans:
|
||||||||||||||||||||||||
|
Multi-family
|
$ | 1,718 | 54.5 | % | 0.50 | % | $ | 1,488 | 58.8 | % | 0.42 | % | ||||||||||||
|
Commercial investor
|
1,349 | 22.7 | % | 0.95 | % | 933 | 28.0 | % | 0.55 | % | ||||||||||||||
|
One-to-four family
|
197 | 2.1 | % | 1.51 | % | 350 | 2.1 | % | 2.73 | % | ||||||||||||||
|
Construction
|
24 | 0.3 | % | 1.17 | % | - | 0.0 | % | 0.00 | % | ||||||||||||||
|
Land
|
- | 0.9 | % | 0.00 | % | - | 0.5 | % | 0.00 | % | ||||||||||||||
|
Business loans:
|
- | - | ||||||||||||||||||||||
|
Commercial owner occupied
|
296 | 9.2 | % | 0.51 | % | 190 | 5.9 | % | 0.53 | % | ||||||||||||||
|
Commercial and industrial
|
765 | 8.1 | % | 1.50 | % | 506 | 3.8 | % | 2.22 | % | ||||||||||||||
|
SBA
|
247 | 2.2 | % | 1.77 | % | 72 | 0.9 | % | 1.36 | % | ||||||||||||||
|
Other Loans
|
1 | 0.0 | % | 0.68 | % | 4 | 0.0 | % | 6.72 | % | ||||||||||||||
|
Total
|
$ | 4,598 | 100.0 | % | 0.73 | % | $ | 3,543 | 100.0 | % | 0.58 | % | ||||||||||||
The following table sets forth the allowance for loan losses amounts calculated by the categories listed at the dates indicated:
|
At December 31,
|
||||||||||||||||||||||||||||||||||||||||
|
2010
|
2009
|
2008
|
2007
|
2006
|
||||||||||||||||||||||||||||||||||||
|
% of
|
% of
|
% of
|
% of
|
% of
|
||||||||||||||||||||||||||||||||||||
|
Balance at End of
|
Allowance
|
Allowance
|
Allowance
|
Allowance
|
Allowance
|
|||||||||||||||||||||||||||||||||||
|
Period Applicable to
|
Amount
|
to Total
|
Amount
|
to Total
|
Amount
|
to Total
|
Amount
|
to Total
|
Amount
|
to Total
|
||||||||||||||||||||||||||||||
|
(dollars in thousands)
|
||||||||||||||||||||||||||||||||||||||||
|
Allocated allowance
|
$ | 8,832 | 99.5 | % | $ | 8,905 | 100.0 | % | $ | 5,881 | 100.0 | % | $ | 4,598 | 100.0 | % | $ | 3,377 | 95.3 | % | ||||||||||||||||||||
|
Specific allowance
|
47 | 0.5 | % | - | 0.0 | % | - | 0.0 | % | - | 0.0 | % | 166 | 4.7 | % | |||||||||||||||||||||||||
|
Total
|
$ | 8,879 | 100.0 | % | $ | 8,905 | 100.0 | % | $ | 5,881 | 100.0 | % | $ | 4,598 | 100.0 | % | $ | 3,543 | 100.0 | % | ||||||||||||||||||||
Investment Activities
Our investment policy as established by our board of directors attempts to provide and maintain liquidity, generate a favorable return on investments without incurring undue interest rate and credit risk and complement our lending activities. Specifically, our policies limit investments to U.S. government securities, federal agency-backed securities, non-government guaranteed mortgage-backed securities (“MBS”), municipal bonds, and corporate bonds.
Our investment securities portfolio amounted to $168.4 million at December 31, 2010, as compared to $137.7 million at December 31, 2009, representing a 22.3% increase. As of December 31, 2010, the portfolio consisted of $159,000 in U.S. Treasuries, $130.6 million in government sponsor entities (“GSE”) MBS, $19.8 million in municipal bonds, $4.6 million of private label MBS, $11.3 million of FHLB stock, and $2.0 million of stock of the Federal Reserve Bank of San Francisco (the “Federal Reserve Bank”). In addition, $38.3 million of the GSE securities have been pledged as collateral for the Company’s $28.5 million of inverse putable reverse repurchase agreements.
In the third quarter of 2009 through the beginning of 2010, we began restructuring our investment portfolio to reduce the level of private label MBS and reinvest in government sponsored enterprise-backed securities and municipal bonds. All of our $19.8 million municipal bond securities in our portfolio have an underlying rating of investment grade with the majority insured by the largest bond insurance companies to bring each of these securities to a Moody’s AA- rating or better. The Company has only purchased general obligation bonds that are risk-weighted at 20% for regulatory capital purposes. The Company has reduced its exposure to any single adverse event by holding securities from geographically diversified municipalities. We are continually monitoring the quality of our municipal bond portfolio in light of the current financial problems. To our knowledge, none of the municipalities in which we hold bonds are exhibiting financial problems that would require us to record an OTTI charge.
In June 2008, the Company redeemed its shares in two AMF mutual funds it owned and received a pro rata distribution in kind of the securities held by the mutual funds. The managers of the mutual funds had limited redemptions to payment-in-kind only and did not permit the owners of the funds to redeem their shares for cash. In aggregate, the Company received cash of $2.9 million and 160 securities with a market value totaling $21.3 million. The Company’s redemption of its shares in the mutual funds resulted in a charge to earnings of approximately $3.6 million (pre-tax). The charge is the difference between the total purchase price of $27.7 million, paid by the Company for the mutual funds and the market value of the cash and securities of $24.1 million at the close of business on June 18, 2008, which is the date the Company redeemed its shares in the mutual funds. For 2010, the Company took OTTI charges of $1.1 million, compared with $2.0 million in 2009, all of which for both years were related to the private label MBS received from these mutual funds.
Below is a table of our securities by security type further separated by rating agency grade at the date indicated:
|
At December 31, 2010
|
|||||||||||||||||||||
|
Security Type
|
Ratings
|
Number
|
Face Value
|
Amortized Cost
|
Fair Value
|
Unrealized Gain/(Loss)
|
|||||||||||||||
|
(dollars in thousands)
|
|||||||||||||||||||||
|
U.S. Treasury
|
AAA
|
2 | $ | 146 | $ | 148 | $ | 159 | $ | 11 | |||||||||||
|
Government Sponsored Enterprise
|
AAA
|
76 | 126,297 | 130,353 | 130,581 | 228 | |||||||||||||||
|
Municipal bonds
|
AAA/AA
|
29 | 20,145 | 20,555 | 19,759 | (796 | ) | ||||||||||||||
|
Private Label:
|
|||||||||||||||||||||
|
Investment Grade
|
AAA
|
6 | 189 | 189 | 179 | (10 | ) | ||||||||||||||
|
Investment Grade
|
AA-BBB
|
24 | 908 | 885 | 635 | (250 | ) | ||||||||||||||
|
Non-investment Grade *
|
Below BBB
|
49 | 8,986 | 4,517 | 3,781 | (736 | ) | ||||||||||||||
|
Total investment securities available for sale
|
186 | $ | 156,671 | $ | 156,647 | $ | 155,094 | $ | (1,553 | ) | |||||||||||
|
* Non-investment grade includes all ratings below BBB.
|
|||||||||||||||||||||
The following table sets forth the amortized costs and fair values of the Company's investment securities available for sale and stock at the dates indicated:
|
At December 31,
|
||||||||||||||||
|
|
2010
|
2009
|
||||||||||||||
|
Amortized
|
Fair
|
Amortized
|
Fair
|
|||||||||||||
|
Cost
|
Value
|
Cost
|
Value
|
|||||||||||||
|
(in thousands)
|
||||||||||||||||
|
Investment securities available for sale
|
||||||||||||||||
|
U.S. Treasury
|
$ | 148 | $ | 159 | $ | 148 | $ | 154 | ||||||||
|
Municipal bonds
|
20,555 | 19,759 | 17,918 | 17,965 | ||||||||||||
|
Mortgage-backed securities
|
135,944 | 135,176 | 108,300 | 105,288 | ||||||||||||
|
Total investment securities available for sale
|
156,647 | 155,094 | 126,366 | 123,407 | ||||||||||||
|
Stock
|
||||||||||||||||
|
FHLB
|
11,315 | 11,315 | 12,731 | 12,731 | ||||||||||||
|
Federal Reserve Bank
|
2,019 | 2,019 | 1,599 | 1,599 | ||||||||||||
|
Total stock
|
13,334 | 13,334 | 14,330 | 14,330 | ||||||||||||
|
Total securities
|
$ | 169,981 | $ | 168,428 | $ | 140,696 | $ | 137,737 | ||||||||
The following table sets forth the fair values and weighted average yields on our investment securities available for sale portfolio and stock by contractual maturity at the date indicated.
|
At December 31, 2010
|
||||||||||||||
|
One Year
|
More than One
|
More than Five Years
|
More than
|
|
||||||||||
|
or Less
|
to Five Years
|
to Ten Years
|
Ten Years
|
Total
|
||||||||||
|
Weighted
|
Weighted
|
Weighted
|
Weighted
|
Weighted
|
||||||||||
|
Fair
|
Average
|
Fair
|
Average
|
Fair
|
Average
|
Fair
|
Average
|
Fair
|
Average
|
|||||
|
Value
|
Yield
|
Value
|
Yield
|
Value
|
Yield
|
Value
|
Yield
|
Value
|
Yield
|
|||||
|
(dollars in thousands)
|
||||||||||||||
|
Investment securities available for sale
|
||||||||||||||
|
U.S. Treasury
|
$ -
|
0.00%
|
$ 79
|
3.53%
|
$ 80
|
4.15%
|
$ -
|
0.00%
|
$ 159
|
3.84%
|
||||
|
Municipal bonds
|
-
|
0.00%
|
-
|
0.00%
|
-
|
0.00%
|
19,759
|
3.92%
|
19,759
|
3.92%
|
||||
|
Mortgage-backed securities
|
-
|
0.00%
|
37
|
6.06%
|
127
|
5.31%
|
135,012
|
2.95%
|
135,176
|
2.95%
|
||||
|
Total investment securities available for sale
|
-
|
0.00%
|
116
|
4.34%
|
207
|
4.86%
|
154,771
|
3.07%
|
$155,094
|
3.07%
|
||||
|
Stock
|
||||||||||||||
|
FHLB
|
11,315
|
0.00%
|
-
|
0.00%
|
-
|
0.00%
|
-
|
0.00%
|
11,315
|
0.00%
|
||||
|
Federal Reserve Bank
|
2,019
|
6.00%
|
-
|
0.00%
|
-
|
0.00%
|
-
|
0.00%
|
2,019
|
6.00%
|
||||
|
Total stock
|
13,334
|
0.91%
|
-
|
0.00%
|
-
|
0.00%
|
-
|
0.00%
|
$ 13,334
|
0.91%
|
||||
|
Total securities
|
$ 13,334
|
0.91%
|
$ 116
|
4.34%
|
$ 207
|
4.86%
|
$154,771
|
3.07%
|
$168,428
|
2.90%
|
||||
Nonperforming Assets. Nonperforming assets consist of loans on which we have ceased accruing interest (nonaccrual loans), loans restructured at an interest rate below market and OREO. Nonaccrual loans consisted of all loans 90 days or more past due and on loans where, in the opinion of management, there is reasonable doubt as to the collection of interest. A “restructured loan” is one where the terms of the loan were renegotiated to provide a reduction or deferral of interest or principal because of deterioration in the financial position of the borrower. We did not include in interest income any interest on restructured loans during the periods presented. At December 31, 2010, we had $3.3 million of nonperforming assets, which consisted of $3.3 million of net nonperforming loans and $34,000 of OREO. At December 31, 2009, we had $13.4 million of nonperforming assets, which consisted of $10.0 million of nonperforming loans and $3.4 million of OREO.
OREO consisted of one residential one-to-four family property, compared to three properties at December 31, 2009. Properties acquired through or in lieu of foreclosure are recorded at fair value less cost to sell. The Company generally obtains an appraisal and/or a market evaluation on all OREO prior to obtaining possession. After foreclosure, valuations are periodically performed by management as needed due to changing market conditions or factors specifically attributable to the property’s condition. If the carrying value of the property exceeds its fair value less estimated cost to sell, the asset is written down and a charge to operations is recorded.
We recognized loan interest income on nonperforming loans of $264,000 in 2010, $95,000 in 2009 and $212,000 in 2008. If these loans had paid in accordance with their original loan terms, we would have recorded additional loan interest income of $600,000 in 2010, $781,000 in 2009 and $491,000 in 2008.
The following table sets forth composition of nonperforming assets at the date indicated:
|
At December 31,
|
||||||||||||||||||||
|
2010
|
2009
|
2008
|
2007
|
2006
|
||||||||||||||||
|
(dollars in thousands)
|
||||||||||||||||||||
|
Nonperforming assets
|
||||||||||||||||||||
|
Real estate loans:
|
||||||||||||||||||||
|
Multi-family
|
$ | - | $ | 5,223 | $ | 350 | $ | - | $ | - | ||||||||||
|
Commercial investor
|
- | 1,851 | 3,188 | 3,125 | - | |||||||||||||||
|
One-to-four family
|
27 | 107 | 637 | 284 | 634 | |||||||||||||||
|
Business loans:
|
||||||||||||||||||||
|
Commercial owner occupied
|
2,225 | 996 | - | - | - | |||||||||||||||
|
Commercial and industrial
|
54 | 955 | - | - | - | |||||||||||||||
|
SBA (1)
|
971 | 880 | 1,025 | 784 | - | |||||||||||||||
|
Other loans
|
- | - | - | - | - | |||||||||||||||
|
Total nonaccrual loans
|
3,277 | 10,012 | 5,200 | 4,193 | 634 | |||||||||||||||
|
Specific allowance
|
- | - | - | - | (60 | ) | ||||||||||||||
|
Total nonperforming loans, net
|
3,277 | 10,012 | 5,200 | 4,193 | 574 | |||||||||||||||
|
Other real estate owned
|
34 | 3,380 | 37 | 711 | 138 | |||||||||||||||
|
Total nonperforming assets, net
|
$ | 3,311 | $ | 13,392 | $ | 5,237 | $ | 4,904 | $ | 712 | ||||||||||
|
Allowance for loan losses
|
$ | 8,879 | $ | 8,905 | $ | 5,881 | $ | 4,598 | $ | 3,543 | ||||||||||
|
Allowance for loan losses as a percent of total nonperforming loans, gross
|
270.95 | % | 88.94 | % | 113.10 | % | 109.48 | % | 558.83 | % | ||||||||||
|
Nonperforming loans, net of specific allowances, as a percent of gross loans receivable (2)
|
0.58 | % | 1.74 | % | 0.83 | % | 0.67 | % | 0.09 | % | ||||||||||
|
Nonperforming assets, net of specific allowances, as a percent of total assets
|
0.40 | % | 1.66 | % | 0.71 | % | 0.64 | % | 0.10 | % | ||||||||||
|
(1)
|
The SBA totals include the guaranteed amount, which was $245,000 as of December 31, 2010.
|
|
(2)
|
Gross loans include loans receivable held for investment and held for sale.
|
It is our policy to take appropriate, timely and aggressive action when necessary to resolve nonperforming assets. When resolving problem loans, it is our policy to determine collectability under various circumstances which are intended to result in our maximum financial benefit. We accomplish this by working with the borrower to bring the loan current, selling the loan to a third party or by foreclosing and selling the asset.
Sources of Funds
General. Deposits, loan repayments and prepayments, and cash flows generated from operations and borrowings are the primary sources of the Company’s funds for use in lending, investing and other general purposes.
Deposits. Deposits represent our primary source of funds for our lending and investing activities. The Company offers a variety of deposit accounts with a range of interest rates and terms. The deposit accounts are offered through our six branch network in Southern California. The Company’s deposits consist of passbook savings, checking accounts, money market accounts and certificates of deposit. Total deposits at December 31, 2010 were $659.2 million, compared to $618.7 million at December 31, 2009. At December 31, 2010, certificates of deposit constituted 62.0% of total deposits, compared to 68.4% at the year-end 2009. The terms of the fixed-rate certificates of deposit offered by the Company vary from three months to five years. Specific terms of an individual account vary according to the type of account, the minimum balance required, the time period funds must remain on deposit and the interest rate, among other factors. The flow of deposits is influenced significantly by general economic conditions, changes in money market rates, prevailing interest rates and competition. At December 31, 2010, the Company had $236.8 million of certificate of deposit accounts maturing in one year or less.
The Company relies primarily on customer service, marketing efforts, business development, cross-selling of deposit products to loan customers, and long-standing relationships with customers to attract and retain local deposits. However, market interest rates and rates offered by competing financial institutions significantly affect the Company’s ability to attract and retain deposits. Additionally, from time to time, the Company will utilize both wholesale and brokered deposits to supplement its generation of deposits from businesses and consumers. During 2010, the Company decreased the amount of wholesale and broker deposits by $3.7 million to $1.9 million.
The following table presents the deposit activity for the periods indicated.
|
For the Year Ended December 31,
|
||||||||||||
|
2010
|
2009
|
2008
|
||||||||||
|
(in thousands)
|
||||||||||||
|
Net deposits
|
$ | 30,962 | $ | 141,471 | $ | 45,820 | ||||||
|
Interest credited on deposit accounts
|
9,544 | 20,135 | 24,573 | |||||||||
|
Total increase in deposit accounts
|
$ | 40,506 | $ | 161,606 | $ | 70,393 | ||||||
The following table sets forth the distribution of the Company’s deposit accounts at the dates indicated and the weighted average interest rates on each category of deposits presented:
|
At December 31,
|
|||||||||||||||||||||||||||||||||
|
2010
|
2009
|
2008
|
|||||||||||||||||||||||||||||||
|
Balance
|
% of Total Deposits
|
Weighted Average Rate
|
Balance
|
% of Total Deposits
|
Weighted Average Rate
|
Balance
|
% of Total Deposits
|
Weighted Average Rate
|
|||||||||||||||||||||||||
|
(dollars in thousands)
|
|||||||||||||||||||||||||||||||||
|
Transaction accounts:
|
|||||||||||||||||||||||||||||||||
|
Non-interest bearing checking
|
$ | 47,229 | 7.2 | % | 0.00 | % | $ | 33,885 | 5.5 | % | 0.00 | % | $ | 29,443 | 6.5 | % | 0.00 | % | |||||||||||||||
|
Interest bearing checking
|
21,137 | 3.2 | % | 0.14 | % | 22,406 | 3.6 | % | 0.39 | % | 20,989 | 4.6 | % | 0.97 | % | ||||||||||||||||||
|
Money market
|
113,333 | 17.2 | % | 0.97 | % | 77,687 | 12.6 | % | 1.17 | % | 23,463 | 5.1 | % | 2.00 | % | ||||||||||||||||||
|
Regular passbook
|
68,559 | 10.4 | % | 0.96 | % | 61,779 | 9.9 | % | 1.33 | % | 14,401 | 3.1 | % | 2.56 | % | ||||||||||||||||||
|
Total transaction accounts
|
250,258 | 38.0 | % | 0.72 | % | 195,757 | 31.6 | % | 0.93 | % | 88,296 | 19.3 | % | 1.18 | % | ||||||||||||||||||
|
Certificates of deposit accounts:
|
|||||||||||||||||||||||||||||||||
|
Less than 1.00%
|
46,528 | 7.1 | % | 0.46 | % | 30,867 | 5.0 | % | 0.82 | % | 32 | 0.0 | % | 0.75 | % | ||||||||||||||||||
| 1.00-1.99 | 172,974 | 26.2 | % | 1.61 | % | 91,207 | 14.7 | % | 1.63 | % | 97 | 0.1 | % | 1.77 | % | ||||||||||||||||||
| 2.00-2.99 | 186,173 | 28.2 | % | 2.31 | % | 292,689 | 47.3 | % | 2.44 | % | 23,080 | 5.0 | % | 2.63 | % | ||||||||||||||||||
| 3.00-3.99 | 984 | 0.1 | % | 3.24 | % | 3,427 | 0.6 | % | 3.29 | % | 233,179 | 51.0 | % | 3.67 | % | ||||||||||||||||||
| 4.00-4.99 | 1,097 | 0.2 | % | 4.41 | % | 3,463 | 0.6 | % | 4.40 | % | 110,625 | 24.2 | % | 4.24 | % | ||||||||||||||||||
| 5.00-5.99 | 1,226 | 0.2 | % | 5.30 | % | 1,324 | 0.2 | % | 5.34 | % | 1,819 | 0.4 | % | 5.53 | % | ||||||||||||||||||
|
Total certificates of deposit accounts
|
408,982 | 62.0 | % | 1.82 | % | 422,977 | 68.4 | % | 2.18 | % | 368,832 | 80.7 | % | 3.79 | % | ||||||||||||||||||
|
Total deposits
|
$ | 659,240 | 100.0 | % | 1.40 | % | $ | 618,734 | 100.0 | % | 2.09 | % | $ | 457,128 | 100.0 | % | 3.51 | % | |||||||||||||||
|
At December 31, 2010
|
|||||||||||||||||||||||||||||||||||
|
Weighted
|
|||||||||||||||||||||||||||||||||||
|
Less than
|
1.00% | 2.00% | 3.00% | 4.00% | 5.00% |
% of
|
Average
|
||||||||||||||||||||||||||||
| 1.00% | 1.99% | 2.99% | 3.99% | 4.99% |
and greater
|
Total
|
Total
|
Rate
|
|||||||||||||||||||||||||||
|
(in thousands)
|
|||||||||||||||||||||||||||||||||||
|
Certificates of deposit accounts
|
|||||||||||||||||||||||||||||||||||
|
Within 3 months
|
$ | 17,697 | $ | 1,728 | $ | 36,904 | $ | 144 | $ | - | $ | 3 | $ | 56,476 | 13.8 | % | 1.62 | % | |||||||||||||||||
|
4 to 6 months
|
15,536 | 2,081 | 11,957 | 33 | 28 | 104 | 29,739 | 7.3 | % | 1.43 | % | ||||||||||||||||||||||||
|
7 to 12 months
|
12,180 | 73,276 | 64,287 | 1 | 626 | 210 | 150,580 | 36.8 | % | 1.89 | % | ||||||||||||||||||||||||
|
13 to 24 months
|
1,045 | 95,263 | 60,820 | 152 | 252 | 221 | 157,753 | 38.6 | % | 1.80 | % | ||||||||||||||||||||||||
|
25 to 36 months
|
- | 151 | 1,580 | 30 | 189 | 195 | 2,145 | 0.5 | % | 2.75 | % | ||||||||||||||||||||||||
|
37 to 60 months
|
- | 450 | 10,510 | 611 | - | 145 | 11,716 | 2.9 | % | 2.91 | % | ||||||||||||||||||||||||
|
Over 60 months
|
70 | 25 | 115 | 13 | 2 | 348 | 573 | 0.1 | % | 3.96 | % | ||||||||||||||||||||||||
|
Total
|
$ | 46,528 | $ | 172,974 | $ | 186,173 | $ | 984 | $ | 1,097 | $ | 1,226 | $ | 408,982 | 100.0 | % | 1.82 | % | |||||||||||||||||
With the enactment of the Dodd-Frank Wall Street Reform and Consumer Protection Act (the “Dodd-Frank Act,” deposit insurance coverage was made unlimited for non-interest bearing transaction accounts until December 31, 2012 and up to $250,000 per depositor for all other accounts. At December 31, 2010, the Company had $35.9 million in certificate accounts in amounts of $250,000 or more maturing as follows:
|
At December 31,
|
||||||||
|
Weighted
|
||||||||
|
Maturity Period
|
Amount
|
Average Rate
|
||||||
|
(dollars in thousands)
|
||||||||
|
Three months or less
|
$ | 6,305 | 0.88 | % | ||||
|
Over three months through 6 months
|
478 | 0.50 | % | |||||
|
Over 6 months through 12 months
|
13,074 | 2.15 | % | |||||
|
Over 12 months
|
16,090 | 1.83 | % | |||||
|
Total
|
$ | 35,947 | 1.76 | % | ||||
FHLB Advances. The FHLB system functions as a source of credit to financial institutions that are members. Advances are secured by certain real estate loans, investment securities, and the capital stock of the FHLB owned by the Company. Subject to the FHLB’s advance policies and requirements, these advances can be requested for any business purpose in which the Company is authorized to engage. In granting advances, the FHLB considers a member’s creditworthiness and other relevant factors. The Company has a line of credit with the FHLB which provides for advances totaling up to 45% of its assets, equating to a credit line of $367.4 million as of December 31, 2010. At December 31, 2010, the Company had two FHLB term advances outstanding totaling $40.0 million with a weighted average interest rate of 0.61% and a weighted average remaining maturity of 1.0 years. At December 31, 2010, one advance for $20.0 million was due in December of 2012 and the other for $20.0 million was due in January of 2011.
Other Borrowings. The Company maintains lines of credit totaling $48.8 million with seven correspondent banks to purchase federal funds as business needs dictate. Federal funds purchased are short-term in nature and utilized to meet short-term funding needs. As of December 31, 2010, we had no outstanding balance with any of our correspondent banks. Additionally, in 2008 the Company entered into three inverse putable reverse repurchase agreements (the “repurchase agreements”) totaling $28.5 million with a weighted average interest rate of 3.04% as of December 31, 2010 secured by GSE MBS totaling $38.3 million. The terms of each repurchase agreements is for 10 years with the buyers of the repurchase agreements having the option to terminate the repurchase agreements after the fixed interest rate period has expired. The interest rates reset quarterly with the maximum reset rate being 2.89% on one $10.0 million repurchase agreement, 3.47% on the other $10.0 million repurchase agreement, and 2.70% on the $8.5 million repurchase agreement.
Debentures. On March 25, 2004, the Corporation issued $10,310,000 of Floating Rate Junior Subordinated Deferrable Interest Debentures (the “Debt Securities”) to PPBI Trust I, a statutory trust created under the laws of the State of Delaware. The Debt Securities are subordinated to effectively all borrowings of the Corporation and are due and payable on April 7, 2034. Interest is payable quarterly on the Debt Securities at three-month LIBOR plus 2.75% for an effective rate of 3.04% as of December 31, 2010.
The following table sets forth certain information regarding the Company's borrowed funds at or for the years ended on the dates indicated:
|
At or For Year Ended December 31,
|
||||||||||||
|
2010
|
2009
|
2008
|
||||||||||
|
(dollars in thousands)
|
||||||||||||
|
FHLB advances
|
||||||||||||
|
Average balance outstanding
|
$ | 38,178 | $ | 127,653 | $ | 236,494 | ||||||
|
Maximum amount outstanding at any month-end during the year
|
63,000 | 150,000 | 303,500 | |||||||||
|
Balance outstanding at end of year
|
40,000 | 63,000 | 181,400 | |||||||||
|
Weighted average interest rate during the year
|
4.88 | % | 4.77 | % | 4.24 | % | ||||||
|
Other borrowings
|
||||||||||||
|
Average balance outstanding
|
$ | 28,500 | $ | 28,500 | $ | 14,787 | ||||||
|
Maximum amount outstanding at any month-end during the year
|
28,500 | 28,500 | 28,500 | |||||||||
|
Balance outstanding at end of year
|
28,500 | 28,500 | 28,500 | |||||||||
|
Weighted average interest rate during the year
|
3.08 | % | 2.61 | % | 1.80 | % | ||||||
|
Debentures
|
||||||||||||
|
Average balance outstanding
|
$ | 10,310 | $ | 10,310 | $ | 10,310 | ||||||
|
Maximum amount outstanding at any month-end during the year
|
10,310 | 10,310 | 10,310 | |||||||||
|
Balance outstanding at end of year
|
10,310 | 10,310 | 10,310 | |||||||||
|
Weighted average interest rate during the year
|
3.05 | % | 3.57 | % | 6.29 | % | ||||||
|
Total borrowings
|
||||||||||||
|
Average balance outstanding
|
$ | 76,988 | $ | 166,463 | $ | 261,591 | ||||||
|
Maximum amount outstanding at any month-end during the year
|
101,810 | 188,810 | 342,310 | |||||||||
|
Balance outstanding at end of year
|
78,810 | 101,810 | 220,210 | |||||||||
|
Weighted average interest rate during the year
|
3.97 | % | 4.33 | % | 4.19 | % | ||||||
Subsidiaries
At December 31, 2010, we had two subsidiaries, the Bank, a wholly-owned consolidated subsidiary with no subsidiaries of its own, and PPBI Trust I, which is a wholly-owned special purpose entity accounted for using the equity method under which the subsidiaries’ net earnings are recognized in our operations and the investment in the Trust is included in other assets on our balance sheet.
Personnel
As of December 31, 2010, we had 102 full-time employees and 3 part-time employees. The employees are not represented by a collective bargaining unit and we consider our relationship with our employees to be satisfactory.
Competition
The banking business in California, in general, and specifically in our market areas, is highly competitive with respect to virtually all products and services. The industry continues to consolidate, and unregulated competitors have entered banking markets with focused products targeted at highly profitable customer segments. Many largely unregulated competitors are able to compete across geographic boundaries, and provide customers increasing access to meaningful alternatives to nearly all significant banking services and products. These competitive trends are likely to continue.
The banking business is largely dominated by a relatively small number of major banks with many offices operating over a wide geographical area. These banks have, among other advantages, the ability to finance wide-ranging and effective advertising campaigns and to allocate their resources to regions of highest yield and demand. Many of the major banks operating in the area offer certain services that we do not offer directly but may offer indirectly through correspondent institutions. By virtue of their greater total capitalization, such banks also have substantially higher lending limits than those of the Company.
In addition to other local community banks, our competitors include commercial banks, savings banks, credit unions, and numerous non-banking institutions, such as finance companies, leasing companies, insurance companies, brokerage firms and investment banking firms. In recent years, increased competition has also developed from specialized finance and non-finance companies that offer wholesale finance, credit card, and other consumer finance services, including on-line banking services and personal financial software. Strong competition for deposit and loan products affects the rates of those products, as well as the terms on which they are offered to customers. Mergers between financial institutions have placed additional pressure on banks within the industry to streamline their operations, reduce expenses, and increase revenues to remain competitive.
Technological innovations have also resulted in increased competition in the financial services market. Such innovation has, for example, made it possible for non-depository institutions to offer customers automated transfer payment services that previously were considered traditional banking products. In addition, many customers now expect a choice of delivery systems and channels, including telephone, mail, home computer, ATMs, self-service branches, and/or in-store branches. The sources of competition in such products include commercial banks, as well as credit unions, brokerage firms, money market and other mutual funds, asset management groups, finance and insurance companies, internet-only financial intermediaries and mortgage banking firms.
In order to compete with these other institutions, the Company primarily relies on local promotional activities, personal relationships established by officers, directors and employees of the Company and specialized services tailored to meet the individual needs of the Company’s customers.
SUPERVISION AND REGULATION
General. Bank holding companies, such as the Corporation, and banks, such as the Bank, are subject to extensive regulation and supervision by federal and state regulators. Various requirements and restrictions under state and federal law affect our operations, including reserves against deposits, ownership of deposit accounts, loans, investments, mergers and acquisitions, borrowings, dividends, locations of branch offices and capital requirements. The following is a summary of certain statutes and rules applicable to us. This summary is qualified in its entirety by reference to the particular statute and regulatory provisions referred to below and is not intended to be an exhaustive description of all applicable statutes and regulations.
As a bank holding company, the Corporation is subject to regulation and supervision by the Federal Reserve. We are required to file with the Federal Reserve quarterly and annual reports and such additional information as the Federal Reserve may require pursuant to the BHCA. The Federal Reserve may conduct examinations of bank holding companies and their subsidiaries. The Corporation is also a bank holding company within the meaning of the California Financial Code (the “Financial Code”). As such, the Corporation and its subsidiaries are subject to examination by, and may be required to file reports with, the DFI.
Under changes made by the Dodd-Frank Wall Street Reform and Consumer Protection Act (“Dodd-Frank Act”), a bank holding company must act as a source of financial and managerial strength to each of its subsidiary banks and to commit resources to support each such subsidiary bank. In order to fulfill its obligations as a source of strength, the Federal Reserve may require a bank holding company to make capital injections into a troubled subsidiary bank. In addition, the Federal Reserve may charge the bank holding company with engaging in unsafe and unsound practices if the bank holding company fails to commit resources to a subsidiary bank or if it undertakes actions that the Federal Reserve believes might jeopardize the bank holding company’s ability to commit resources to such subsidiary bank. The Federal Reserve also has the authority to require a bank holding company to terminate any activity or to relinquish control of a nonbank subsidiary (other than a nonbank subsidiary of a bank) upon the Federal Reserve’s determination that such activity or control constitutes a serious risk to the financial soundness and stability of any bank subsidiary of the bank holding company.
As a California state-chartered commercial bank, which is a member of the Federal Reserve System, the Bank is subject to supervision, periodic examination and regulation by the DFI and the Federal Reserve. The Bank’s deposits are insured by the FDIC through the Deposit Insurance Fund (“DIF”). In general terms, federal deposit insurance coverage is unlimited for non-interest bearing transaction accounts until December 31, 2012 and up to $250,000 per depositor for all other accounts in accordance with the recently enacted Dodd-Frank Act for all insured depository institutions. As a result of this deposit insurance function, the FDIC also has certain supervisory authority and powers over the Bank as well as all other FDIC insured institutions. If, as a result of an examination of the Bank, the regulators should determine that the financial condition, capital resources, asset quality, earnings prospects, management, liquidity or other aspects of the Bank’s operations are unsatisfactory or that the Bank or our management is violating or has violated any law or regulation, various remedies are available to the regulators. Such remedies include the power to enjoin unsafe or unsound practices, to require affirmative action to correct any conditions resulting from any violation or practice, to issue an administrative order that can be judicially enforced, to direct an increase in capital, to restrict growth, to assess civil monetary penalties, to remove officers and directors and ultimately to request the FDIC to terminate the Bank’s deposit insurance. As a California-chartered commercial bank, the Bank is also subject to certain provisions of California law.
In response to the recent economic downturn and financial industry instability, legislative and regulatory initiatives have been, and will likely continue to be, introduced and implemented, which could substantially intensify the regulation of the financial services industry. We cannot predict whether or when potential legislation or new regulations will be enacted, and if enacted, the effect that new legislation or any implemented regulations and supervisory policies would have on our financial condition and results of operations. Moreover, in the current economic environment, bank regulatory agencies have been more aggressive in responding to concerns and trends identified in examinations, and this has resulted in the increased issuance of enforcement actions to financial institutions requiring action to address credit quality, liquidity and risk management and capital adequacy, as well as other safety and soundness concerns.
Dodd-Frank Act
On July 21 2010, sweeping financial regulatory reform legislation entitled the “Dodd-Frank Wall Street Reform and Consumer Protection Act” was signed into law by President Obama. The Dodd-Frank Act will likely result in dramatic changes across the financial regulatory system, some of which become effective immediately and some of which will not become effective until various future dates. Implementation of the Dodd-Frank Act will require many new rules to be made by various federal regulatory agencies over the next several years. Uncertainty remains until final rulemaking is complete as to the ultimate impact of the Dodd-Frank Act, which could have a material adverse impact either on the financial services industry as a whole or on the Bank’s business, results of operations, and financial condition. Provisions in the legislation that affect deposit insurance assessments, payment of interest on demand deposits, and interchange fees could increase the costs associated with deposits and place limitations on certain revenues those deposits may generate. The Dodd-Frank Act includes provisions that, among other things, will:
|
·
|
Centralize responsibility for consumer financial protection by creating a new agency, the Consumer Financial Protection Bureau (“CFPB”), responsible for implementing, examining and enforcing compliance with federal consumer financial laws.
|
|
·
|
Limit the preemption of state law by federal law and disallow subsidiaries and affiliates of national banks from availing themselves of such preemption.
|
|
·
|
Require federal bank regulators to seek to make their capital requirements countercyclical so that capital requirements increase in times of economic expansion and decrease in times of economic contraction.
|
|
·
|
Require bank holding companies and banks to be both well-capitalized and well-managed in order to engage in interstate bank acquisitions.
|
|
·
|
Impose comprehensive regulation of the over-the-counter derivatives market, which would include certain provisions that would effectively prohibit insured depository institutions from conducting certain derivatives businesses in the institution itself.
|
|
·
|
Implement corporate governance revisions, including with regard to executive compensation and proxy access by shareholders.
|
|
·
|
Make permanent the $250,000 limit for federal deposit insurance and increase the cash limit of Securities Investor Protection Corporation protection from $100,000 to $250,000 and provide unlimited federal deposit insurance through December 31, 2012 for non-interest bearing demand transaction accounts at all insured depository institutions.
|
|
·
|
Repeal the federal prohibitions on the payment of interest on demand deposits, thereby permitting depository institutions to pay interest on business transaction and other accounts.
|
|
·
|
Amend the Electronic Fund Transfer Act to, among other things, give the Federal Reserve the authority to establish rules regarding interchange fees charged for electronic debit transactions by payment card issuers having assets over $10 billion and to enforce a new statutory requirement that such fees be reasonable and proportional to the actual cost of a transaction to the issuer.
|
|
·
|
Increase the authority of the Federal Reserve to examine bank holding companies, such as the Corporation, and their non-bank subsidiaries.
|
|
·
|
Mandates certain corporate governance and executive compensation initiatives be implemented, including (i) an advisory vote on executive compensation by a public company’s stockholders; (ii) enhancement of independence requirements for compensation committee members; (iii) adoption of incentive-based compensation clawback policies for executive officers; and (iv) adoption of proxy access rules allowing stockholders of publicly traded companies to nominate candidates for election as a director and have those nominees included in a company's proxy materials.
|
|
·
|
Exempt non-accelerated filers, such as the Corporation, from the auditor attestation requirements on management’s assessment of internal controls. However, the requirement of an assessment by management of the issuer’s internal controls is not affected by this amendment.
|
Many aspects of the Dodd-Frank Act are subject to rulemaking and will take effect over several years, making it difficult to anticipate the overall financial impact on the Company, its customers or the financial industry generally. Provisions in the legislation that affect deposit insurance assessments, payment of interest on demand deposits and interchange fees could increase the costs associated with deposits as well as place limitations on certain revenues those deposits may generate.
Activities of Bank Holding Companies. The activities of bank holding companies are generally limited to the business of banking, managing or controlling banks, and other activities that the Federal Reserve has determined to be so closely related to banking or managing or controlling banks as to be a proper incident thereto. Bank holding companies that qualify and register as “financial holding companies” are also able to engage in certain additional financial activities, such as merchant banking and securities and insurance underwriting, subject to limitations set forth in federal law. We are not at this date a “financial holding company.”
The BHCA requires a bank holding company to obtain prior approval of the Federal Reserve before: (1) taking any action that causes a bank to become a controlled subsidiary of the bank holding company; (2) acquiring direct or indirect ownership or control of voting shares of any bank or bank holding company, if the acquisition results in the acquiring bank holding company having control of more than 5% of the outstanding shares of any class of voting securities of such bank or bank holding company, unless such bank or bank holding company is majority-owned by the acquiring bank holding company before the acquisition; (3) acquiring all or substantially all the assets of a bank; or (4) merging or consolidating with another bank holding company.
Permissible Activities of the Bank. Because California permits commercial banks chartered by the state to engage in any activity permissible for national banks, the Bank can form subsidiaries to engage in activates “closely related to banking” or “nonbanking” activities and expanded financial activities. However, to form a financial subsidiary, the Bank must be well capitalized and would be subject to the same capital deduction, risk management and affiliate transaction rules as applicable to national banks. Generally, a financial subsidiary is permitted to engage in activities that are “financial in nature” or incidental thereto, even though they are not permissible for the national bank to conduct directly within the bank. The definition of “financial in nature” includes, among other items, underwriting, dealing in or making a market in securities, including, for example, distributing shares of mutual funds. The subsidiary may not, however, engage as principal in underwriting insurance (other than credit life insurance), issue annuities or engage in real estate development or investment or merchant banking. Presently, the Bank does not have any subsidiaries.
Incentive Compensation. In June 2010, the federal banking agencies issued their final guidance on incentive compensation policies intended to ensure that the incentive compensation policies of banking organizations do not undermine the safety and soundness of such organizations by encouraging excessive risk-taking. The final guidance, which covers all employees that have the ability to materially affect the risk profile of an organization, is based upon the key principles that a banking organization’s incentive compensation arrangements should (i) provide incentives that do not encourage risk-taking beyond the organization’s ability to effectively identify and manage risks, (ii) be compatible with effective internal controls and risk management, and (iii) be supported by strong corporate governance, including active and effective oversight by the organization’s board of directors. The Federal Reserve indicated that all banking organizations are to evaluate their incentive compensation arrangements and related risk management, control, and corporate governance processes and immediately address deficiencies in these arrangements or processes that are inconsistent with safety and soundness.
The Federal Reserve will review, as part of the regular, risk-focused examination process, the incentive compensation arrangements of banking organizations, such as the Company, that are not “large, complex banking organizations.” These reviews will be tailored to each organization based on the scope and complexity of the organization’s activities and the prevalence of incentive compensation arrangements. The findings of the supervisory initiatives will be included in reports of examination. Deficiencies will be incorporated into the organization’s supervisory ratings, which can affect the organization’s ability to make acquisitions and take other actions. Enforcement actions may be taken against a banking organization if its incentive compensation arrangements, or related risk-management control or governance processes, pose a risk to the organization’s safety and soundness and the organization is not taking prompt and effective measures to correct the deficiencies.
In February 2011, the federal banking agencies approved a joint proposed rulemaking to implement Section 956 of the Dodd-Frank Act, which prohibits incentive-based compensation arrangements that encourage inappropriate risk taking by covered financial institutions (generally institutions that have over $1 billion in assets) and are deemed to be excessive, or that may lead to material losses.
The scope and content of the U.S. banking regulators’ policies on executive compensation are continuing to develop and are likely to continue evolving in the near future. It cannot be determined at this time whether compliance with such policies will adversely affect the Company’s ability to hire, retain and motivate its key employees.
Capital Requirements. The federal banking agencies have adopted regulations establishing minimum capital adequacy requirements for banking organizations. These agencies may establish higher minimum requirements if, for example, a banking organization previously has received special attention or has a high susceptibility to interest rate risk. Under federal regulations, bank holding companies and banks must have a minimum ratio of 8% of qualifying total capital to risk-weighted assets, and a minimum ratio of 4% of qualifying Tier 1 capital to risk-weighted assets. At least half of the total capital is required to be “Tier I capital,” principally consisting of common stockholders’ equity, noncumulative perpetual preferred stock, and a limited amount of cumulative perpetual preferred stock, less certain goodwill items. The remainder (“Tier II capital”) may consist of a limited amount of subordinated debt, certain hybrid capital instruments and other debt securities, perpetual preferred stock, and a limited amount of the allowance for loan loss.
In addition to the risk-based guidelines, federal banking regulators require banking organizations to maintain a minimum amount of Tier I capital to total assets, referred to as the leverage ratio. For a banking organization rated in the highest of the five categories used by regulators to rate banking organizations, the minimum leverage ratio of Tier I capital to total assets is 3%. For all banking organizations not rated in the highest category, the minimum leverage ratio must be at least 4%. In addition to these uniform risk-based capital guidelines and leverage ratios that apply across the industry, the regulators have the discretion to set individual minimum capital requirements for specific institutions at rates significantly above the minimum guidelines and ratios. Future changes in regulations or practices could further reduce the amount of capital recognized for purposes of capital adequacy. Such a change could affect our ability to grow and could restrict the amount of profits, if any, available for the payment of dividends.
In addition, the Dodd-Frank Act requires the federal banking agencies to adopt capital requirements that address the risks that the activities of an institution poses to the institution and the public and private stakeholders, including risks arising from certain enumerated activities. The federal banking agencies will likely change existing capital guidelines or adopt new capital guidelines in the future pursuant to the Dodd-Frank Act or other regulatory or supervisory changes. We will be assessing the impact on us of these new regulations as they are proposed and implemented.
The regulatory capital requirements, as well as the actual capital ratios for the Corporation and the Bank as of December 31, 2010, are presented in detail in Note 2, Regulatory Capital Requirements and Other Regulatory Matters in Item 8 hereof. See also “Capital Resources” within Management’s Discussion and Analysis in Item 7 hereof. As of December 31, 2010, the Bank was considered well capitalized for regulatory purposes.
Under applicable regulatory guidelines, the trust preferred securities issued by our unconsolidated subsidiary capital trust qualify as Tier I capital up to a maximum limit of 25% of total Tier I capital. Any additional portion of our trust preferred securities would qualify as Tier II capital. As of December 31, 2010, the subsidiary trust had $10.3 million in trust preferred securities outstanding, of which $10.0 million qualifies as Tier I capital.
Prompt Corrective Action Regulations. The federal banking regulators are required to take “prompt corrective action” with respect to capital-deficient institutions. Federal banking regulations define, for each capital category, the levels at which institutions are “well capitalized,” “adequately capitalized,” “undercapitalized,” “significantly undercapitalized” and “critically undercapitalized.” A “well capitalized” institution has a total risk-based capital ratio of 10.0% or higher; a Tier I risk-based capital ratio of 6.0% or higher; a leverage ratio of 5.0% or higher; and is not subject to any written agreement, order or directive requiring it to maintain a specific capital level for any capital measure. An “adequately capitalized” institution has a total risk-based capital ratio of 8.0% or higher; a Tier I risk-based capital ratio of 4.0% or higher; a leverage ratio of 4.0% or higher (3.0% or higher if the bank was rated a composite 1 in its most recent examination report and is not experiencing significant growth); and does not meet the criteria for a well capitalized bank. An institution is “undercapitalized” if it fails to meet any one of the ratios required to be adequately capitalized. An “undercapitalized” institution has a total risk-based capital ratio that is less than 8.0%; a Tier 1 risk-based capital ratio of less than 4.0% or a leverage ratio of less than 4.0%. A “significantly undercapitalized” institution has a total risk-based capital ratio of less than 6.0%; a Tier 1 risk-based capital ratio of less than 3.0% or a leverage ratio of less than 3.0%. A “critically undercapitalized” institution’s tangible equity is equal to or less than 2.0% of average quarterly tangible assets. An institution may be downgraded to, or deemed to be in, a capital category that is lower than indicated by its capital ratios if it is determined to be in an unsafe or unsound condition or if it receives an unsatisfactory examination rating with respect to certain matters. An institution’s capital category is determined solely for the purpose of applying prompt corrective action regulations, and the capital category may not constitute an accurate representation of the institution’s overall financial condition or prospects for other purposes.
In the event an institution becomes “undercapitalized,” it must submit a capital restoration plan. The capital restoration plan will not be accepted by the regulators unless each company having control of the undercapitalized institution guarantees the subsidiary’s compliance with the capital restoration plan up to a certain specified amount. Any such guarantee from a depository institution’s holding company is entitled to a priority of payment in bankruptcy. The aggregate liability of the holding company of an undercapitalized bank is limited to the lesser of 5% of the institution’s assets at the time it became undercapitalized or the amount necessary to cause the institution to be “adequately capitalized.” The bank regulators have greater power in situations where an institution becomes “significantly” or “critically” undercapitalized or fails to submit a capital restoration plan. In addition to requiring undercapitalized institutions to submit a capital restoration plan, bank regulations contain broad restrictions on certain activities of undercapitalized institutions including asset growth, acquisitions, branch establishment and expansion into new lines of business. With certain exceptions, an insured depository institution is prohibited from making capital distributions, including dividends, and is prohibited from paying management fees to control persons if the institution would be undercapitalized after any such distribution or payment.
As an institution’s capital decreases, the regulators’ enforcement powers become more severe. A significantly undercapitalized institution is subject to mandated capital raising activities, restrictions on interest rates paid and transactions with affiliates, removal of management, and other restrictions. A regulator has limited discretion in dealing with a critically undercapitalized institution and is virtually required to appoint a receiver or conservator.
Banks with risk-based capital and leverage ratios below the required minimums may also be subject to certain administrative actions, including the termination of deposit insurance upon notice and hearing, or a temporary suspension of insurance without a hearing in the event the institution has no tangible capital.
In addition, the DFI has authority to take possession of the business and properties of a bank in the event that the tangible shareholders’ equity of a bank is less than the greater of (i) 4% of the bank’s total assets or (ii) $1.0 million.
As of December 31, 2010, the Bank was “well capitalized” according to the guidelines as generally discussed above.
Dividends. It is the Federal Reserve’s policy that bank holding companies, such as the Corporation, should generally pay dividends on common stock only out of income available over the past year, and only if prospective earnings retention is consistent with the organization’s expected future needs and financial condition. It is also the Federal Reserve’s policy that bank holding companies should not maintain dividend levels that undermine their ability to be a source of strength to its banking subsidiaries. Additionally, in consideration of the current financial and economic environment, the Federal Reserve has indicated that bank holding companies should carefully review their dividend policy and has discouraged payment ratios that are at maximum allowable levels unless both asset quality and capital are very strong.
The Bank's ability to pay dividends to the Corporation is subject to restrictions set forth in the Financial Code. The Financial Code provides that a bank may not make a cash distribution to its stockholders in excess of the lesser of a bank’s (1) retained earnings; or (2) net income for its last three fiscal years, less the amount of any distributions made by the bank or by any majority-owned subsidiary of the bank to the stockholders of the bank during such period. However, a bank may, with the approval of the DFI, make a distribution to its stockholders in an amount not exceeding the greatest of (a) its retained earnings; (b) its net income for its last fiscal year; or (c) its net income for its current fiscal year. In the event that bank regulators determine that the stockholders' equity of a bank is inadequate or that the making of a distribution by the bank would be unsafe or unsound, the regulators may order the bank to refrain from making a proposed distribution. The payment of dividends could, depending on the financial condition of the Bank, be deemed to constitute an unsafe or unsound practice. Under these provisions, the amount available for distribution from the Bank to the Corporation was approximately $3.5 million at December 31, 2010.
Approval of the Federal Reserve is required for payment of any dividend by a state chartered bank that is a member of the Federal Reserve Board System, such as the Bank, if the total of all dividends declared by the bank in any calendar year would exceed the total of its retained net income for that year combined with its retained net income for the preceding two years. In addition, a state member bank may not pay a dividend in an amount greater than its undivided profits without regulatory and stockholder approval. The Bank is also prohibited under federal law from paying any dividend that would cause it to become undercapitalized.
It is our policy to retain earnings, if any, to provide funds for use in our business. We have never declared or paid dividends on our common stock and do not anticipate declaring or paying any cash dividends in the foreseeable future.
FDIC Insurance of Certain Accounts and Regulation by the FDIC. The Bank’s deposits are insured by the FDIC through the DIF. The FDIC utilizes a risk-based assessment system that imposes insurance premiums based upon a risk matrix that takes into account a bank’s capital level and supervisory rating. The risk matrix utilizes four risk categories which are distinguished by capital levels and supervisory ratings. In general terms, insurance coverage is unlimited for non-interest bearing transaction accounts until December 31, 2012 and up to $250,000 per depositor for all other accounts in accordance with the recently enacted Dodd-Frank Act. The FDIC’s base assessment schedule can be adjusted up or down, and premiums for 2010 ranged from 12 basis points in the lowest risk category to 45 basis points for banks in the highest risk category. During 2009, the FDIC also imposed a special assessment for all insured depositories that amounted to $360,000 for the Bank.
In November 2009, the FDIC issued a rule that required all insured depository institutions, with limited exceptions, to prepay their estimated quarterly risk-based assessments for the fourth quarter of 2009 and for all of 2010, 2011 and 2012. The FDIC also adopted a uniform three-basis point increase in assessment rates effective on January 1, 2011; however, the FDIC has elected to forgo this increase under a recently adopted DIF restoration plan. In October 2010, the FDIC adopted a new DIF restoration plan to ensure that the fund reserve ratio reaches 1.35% by September 30, 2020, as required by the Dodd-Frank Act. Under the new restoration plan, the FDIC will forego the uniform three-basis point increase in initial assessment rates scheduled to take place on January 1, 2011 and maintain the current schedule of assessment rates for all depository institutions. The FDIC also proposed to raise its industry target ratio of reserves to insured deposits to 2 percent, 65 basis points above the statutory minimum.
In February 2011, the FDIC adopted new rules that amend its current deposit insurance assessment regulations. The new rules implement a provision in the Dodd-Frank Act that changes the assessment base for deposit insurance premiums from one based on domestic deposits to one based on average consolidated total assets minus average tangible equity. The rules also change the assessment rate schedules for insured depository institutions so that approximately the same amount of revenue would be collected under the new assessment base as would be collected under the current rate schedule and the schedules previously proposed by the FDIC in October 2010. In addition, the new rules revise the risk-based assessment system for large insured depository institutions (generally, institutions with at least $10 billion in total assets) and “highly complex” institutions by requiring that the FDIC use a scorecard method to calculate assessment rates for all such institutions. The Bank will not be deemed a “highly complex” institution for these purposes.
Under the new rules, the FDIC set initial base assessment rates from 5 basis points in the lowest risk category to 35 basis points for banks in the higher risk category, which are effective April 1, 2011. The Bank’s FDIC insurance expense totaled $1.3 million in 2010, $1.4 million in 2009 and $264,000 in 2008. We cannot provide any assurance as to the amount of any proposed increase in our deposit insurance premium rate, as such changes are dependent upon a variety of factors, some of which are beyond our control.
The FDIC is authorized to terminate a depository institution’s deposit insurance upon a finding by the FDIC that the institution’s financial condition is unsafe or unsound or that the institution has engaged in unsafe or unsound practices or has violated any applicable rule, regulation, order or condition enacted or imposed by the institution’s regulators.
In addition to the assessment for deposit insurance, the Bank, as a former member of the Savings Association Insurance Fund, also pays assessments towards the retirement of the Financing Corporation Bonds issued in the 1980s to assist in the recovery of the savings and loan industry. These assessments will continue until these bonds mature in 2017. This payment is established quarterly and during the year ending December 31, 2010, averaged 1.04 basis points of assessable deposits.
Transactions with Related Parties. Depository institutions are subject to the restrictions contained in the Federal Reserve Act (the “FRA”) with respect to loans to directors, executive officers and principal stockholders. Under the FRA, loans to directors, executive officers and stockholders who own more than 10% of a depository institution and certain affiliated entities of any of the foregoing, may not exceed, together with all other outstanding loans to such person and affiliated entities, the institution’s loans-to-one-borrower limit as discussed in the above section. Federal regulations also prohibits loans above amounts prescribed by the appropriate federal banking agency to directors, executive officers, and stockholders who own more than 10% of an institution, and their respective affiliates, unless such loans are approved in advance by a majority of the board of directors of the institution. Any “interested” director may not participate in the voting. The prescribed loan amount, which includes all other outstanding loans to such person, as to which such prior board of director approval is required, is the greater of $25,000 or 5% of capital and surplus up to $500,000. The Federal Reserve also requires that loans to directors, executive officers, and principal stockholders be made on terms substantially the same as offered in comparable transactions to non-executive employees of the bank and must not involve more than the normal risk of repayment. There are additional limits on the amount a bank can loan to an executive officer.
Transactions between a bank and its “affiliates” are quantitatively and qualitatively restricted under Sections 23A and 23B of the FRA. Section 23A restricts the aggregate amount of covered transactions with any individual affiliate to 10% of the capital and surplus of the financial institution. The aggregate amount of covered transactions with all affiliates is limited to 20% of the institution’s capital and surplus. Certain transactions with affiliates are required to be secured by collateral in an amount and of a type described in Section 23A and the purchase of low quality assets from affiliates are generally prohibited. Section 23B generally provides that certain transactions with affiliates, including loans and asset purchases, must be on terms and under circumstances, including credit standards, that are substantially the same or at least as favorable to the institution as those prevailing at the time for comparable transactions with non-affiliated companies. The Federal Reserve has promulgated Regulation W, which codifies prior interpretations under Sections 23A and 23B of the FRA and provides interpretive guidance with respect to affiliate transactions. Affiliates of a bank include, among other entities, a bank’s holding company and companies that are under common control with the bank. We are considered to be an affiliate of the Bank.
The Dodd-Frank Act generally enhances the restrictions on transactions with affiliates under Section 23A and 23B of the FRA, including an expansion of the definition of “covered transactions” and an increase in the amount of time for which collateral requirements regarding covered credit transactions must be satisfied. Insider transaction limitations are expanded through the strengthening of loan restrictions to insiders and the expansion of the types of transactions subject to the various limits, including derivatives transactions, repurchase agreements, reverse repurchase agreements and securities lending or borrowing transactions. Restrictions are also placed on certain asset sales to and from an insider to an institution, including requirements that such sales be on market terms and, in certain circumstances, approved by the institution's board of directors.
Safety and Soundness Standards. The federal banking agencies have adopted guidelines designed to assist the federal banking agencies in identifying and addressing potential safety and soundness concerns before capital becomes impaired. The guidelines set forth operational and managerial standards relating to (i) internal controls, information systems and internal audit systems; (ii) loan documentation; (iii) credit underwriting; (iv) asset growth; (v) earnings; and (vi) compensation, fees and benefits.
In addition, the federal banking agencies have also adopted safety and soundness guidelines with respect to asset quality and for evaluating and monitoring earnings to ensure that earnings are sufficient for the maintenance of adequate capital and reserves. These guidelines provide six standards for establishing and maintaining a system to identify problem assets and prevent those assets from deteriorating. Under these standards, an insured depository institution should (i) conduct periodic asset quality reviews to identify problem assets; (ii) estimate the inherent losses in problem assets and establish reserves that are sufficient to absorb estimated losses; (iii) compare problem asset totals to capital; (iv) take appropriate corrective action to resolve problem assets; (v) consider the size and potential risks of material asset concentrations; and (vi) provide periodic asset quality reports with adequate information for management and the board of directors to assess the level of asset risk.
Loans-to-One Borrower. Under California law, our ability to make aggregate secured and unsecured loans-to-one-borrower is limited to 25% and 15%, respectively, of unimpaired capital and surplus. At December 31, 2010, the Bank’s limit on aggregate secured loans-to-one-borrower was $23.0 million and unsecured loans-to-one borrower was $13.8 million. The Bank has established internal loan limits which are lower than the legal lending limits for a California bank.
Community Reinvestment Act and the Fair Lending Laws. The Bank is subject to certain fair lending requirements and reporting obligations involving home mortgage lending operations and Community Reinvestment Act (“CRA”) activities. The CRA generally requires the federal banking regulators to evaluate the record of a financial institution in meeting the credit needs of their local communities, including low and moderate income neighborhoods. In addition to substantial penalties and corrective measures that may be required for a violation of certain fair lending laws, the federal banking agencies may take compliance with such laws and CRA into account when regulating and supervising other activities. A bank’s compliance with its CRA obligations is based on a performance-based evaluation system which bases CRA ratings on an institution’s lending service and investment performance, resulting in a rating by the appropriate bank regulator of “outstanding,” “satisfactory,” “needs to improve” or “substantial noncompliance.” Based on its last CRA examination, the Bank received a “satisfactory” rating.
Bank Secrecy Act and Money Laundering Control Act. In 1970, Congress passed the Currency and Foreign Transactions Reporting Act, otherwise known as the Bank Secrecy Act (the “BSA”), which established requirements for recordkeeping and reporting by banks and other financial institutions. The BSA was designed to help identify the source, volume and movement of currency and other monetary instruments into and out of the U.S. in order to help detect and prevent money laundering connected with drug trafficking, terrorism and other criminal activities. The primary tool used to implement BSA requirements is the filing of Suspicious Activity Reports. Today, the BSA requires that all banking institutions develop and provide for the continued administration of a program reasonably designed to assure and monitor compliance with certain recordkeeping and reporting requirements regarding both domestic and international currency transactions. These programs must, at a minimum, provide for a system of internal controls to assure ongoing compliance, provide for independent testing of such systems and compliance, designate individuals responsible for such compliance and provide appropriate personnel training.
USA Patriot Act of 2001. On October 26, 2001, President Bush signed the USA Patriot Act of 2001 (the “Patriot Act”). Enacted in response to the terrorist attacks in New York, Pennsylvania and Washington, D.C. on September 11, 2001, the Patriot Act is intended to strengthen U.S. law enforcement’s and the intelligence communities’ ability to work cohesively to combat terrorism on a variety of fronts. The potential impact of the Act on financial institutions of all kinds is significant and wide ranging. The Patriot Act contains sweeping anti-money laundering and financial transparency laws and requires various regulations, including:
|
·
|
due diligence requirements for financial institutions that administer, maintain, or manage private bank accounts or correspondent accounts for non-U.S. persons;
|
|
·
|
standards for verifying customer identification at account opening; and
|
|
·
|
rules to promote cooperation among financial institutions, regulators, and law enforcement entities in identifying parties that may be involved in terrorism or money laundering.
|
Consumer Laws and Regulations. The Bank is also subject to certain consumer laws and regulations that are designed to protect consumers in transactions with banks. These laws include, among others, Truth in Lending Act; Truth in Savings Act; Electronic Funds Transfer Act; Expedited Funds Availability Act; Equal Credit Opportunity Act; Fair and Accurate Credit Transactions Act; Fair Housing Act; Fair Credit Reporting Act; Fair Debt Collection Act; Home Mortgage Disclosure Act; Real Estate Settlement Procedures Act; laws regarding unfair and deceptive acts and practices; and usury laws. These laws and regulations mandate certain disclosure requirements and regulate the manner in which financial institutions must deal with customers when taking deposits or making loans to such customers. The Bank must comply with the applicable provisions of these consumer protection laws and regulations as part of their ongoing customer relations. Failure to comply with these laws and regulations could give rise to regulatory sanctions, customer rescission rights, action by state and local attorneys general, and civil or criminal liability. The creation of the CFPB by the Dodd-Frank Act is likely to lead to enhanced and strengthened enforcement of consumer financial protection laws.
In addition, federal law currently contains extensive customer privacy protection provisions. Under these provisions, a financial institution must provide to its customers, at the inception of the customer relationship and annually thereafter, the institution’s policies and procedures regarding the handling of customers’ nonpublic personal financial information. These provisions also provide that, except for certain limited exceptions, a financial institution may not provide such personal information to unaffiliated third parties unless the institution discloses to the customer that such information may be so provided and the customer is given the opportunity to opt out of such disclosure.
Sarbanes-Oxley Act of 2002. The Sarbanes-Oxley Act of 2002 (the “SOX”) was enacted to increase corporate responsibility, to provide for enhanced penalties for accounting and auditing improprieties at publicly traded companies and to protect investors by improving the accuracy and reliability of corporate disclosures pursuant to the securities laws. The SOX generally applies to all companies, both U.S. and non-U.S., that file or are required to file periodic reports with the SEC under the Securities Exchange Act of 1934, as amended (the “Exchange Act”), including us.
The SOX includes additional disclosure requirements and new corporate governance rules, requires the SEC and securities exchanges to adopt extensive additional disclosure, corporate governance and other related rules and mandates further studies of specified issues by the SEC and the Comptroller General. The SEC has promulgated regulations to implement various provisions of the SOX, including additional disclosure requirements and certifications in periodic filings under the Exchange Act. We have revised our internal policies and Exchange Act disclosures to comply with these new requirements.
Federal and State Taxation
The Corporation and the Bank report their income on a consolidated basis using the accrual method of accounting, and are subject to federal income taxation in the same manner as other corporations with some exceptions. The Company has not been audited by the IRS. For its 2010 or 2009 taxable year, the Company is subject to a maximum federal income tax rate of 34% and state income tax rate of 10.84%.
RISK FACTORS
Ownership of our common stock involves certain risks. The risks and uncertainties described below are not the only ones we face. You should carefully consider the risks described below, as well as all other information contained in this Annual Report on Form 10-K. Additional risks and uncertainties not presently known to us or that we currently deem immaterial may also impair our business operations. If any of these risks actually occurs, our business, financial condition or results of operations could be materially, adversely affected.
Risks Related to Our Business
The current economic environment poses significant challenges for the Company and could adversely affect our financial condition and results of operations.
We are operating in a challenging and uncertain economic environment, including generally uncertain national and local conditions. Financial institutions continue to be affected by sluggish real estate markets and constrained financial markets. Declines in the housing markets, with falling home prices and increasing foreclosures and continued high unemployment, have resulted in significant write-downs of asset values by financial institutions. Uncertainties in the direction of real estate values, home sales volumes and financial stress on borrowers as a result of the uncertain economic environment could have an adverse effect on our borrowers or their customers, which could adversely affect our financial condition and results of operations. A worsening of these conditions would likely exacerbate the adverse effects on us and others in the financial institutions industry. For example, further deterioration in economic conditions in our markets could drive losses beyond that which is provided for in our allowance for loan losses. We may also face the following risks in connection with these events:
|
·
|
Economic conditions that negatively affect real estate values and the job market have resulted, and may continue to result, in a deterioration in credit quality of our loan portfolio, and such deterioration in credit quality has had, and could continue to have, a negative impact on our business.
|
|
·
|
Market developments may affect consumer confidence levels and may cause adverse changes in payment patterns, causing increases in delinquencies and default rates on loans and other credit facilities.
|
|
·
|
The processes we use to estimate allowance for loan losses and reserves may no longer be reliable because they rely on complex judgments, including forecasts of economic conditions, which may no longer be capable of accurate estimation.
|
|
·
|
Our ability to assess the creditworthiness of our customers may be impaired if the models and approaches we use to select, manage, and underwrite its customers become less predictive of future charge-offs.
|
|
·
|
We expect to face increased regulation of its industry, and compliance with such regulation may increase our costs, limit our ability to pursue business opportunities and increase compliance challenges.
|
As these conditions or similar ones continue to exist or worsen, we could experience continuing or increased adverse effects on its financial condition and results of operations.
Our business is subject to various lending and other economic risks that could adversely impact our results of operations and financial condition.
In recent years, there was significant disruption and volatility in the financial and capital markets. The financial markets and the financial services industry in particular suffered unprecedented disruption, causing a number of institutions to fail or require government intervention to avoid failure. These conditions were largely the result of the erosion of the U.S. and global credit markets, including a significant and rapid deterioration in the mortgage lending and related real estate markets. Continued declines in real estate values, high unemployment and financial stress on borrowers as a result of the uncertain economic environment could have an adverse effect on our borrowers or their customers, which could adversely affect our financial condition and results of operations.
As a consequence of the difficult economic environment, we experienced losses, resulting primarily from significant provisions for loan losses and substantial impairment charges on our investment securities. There can be no assurance that the economic conditions that have adversely affected the financial services industry, and the capital, credit and real estate markets generally, will improve in the near term, in which case we could continue to experience losses and write-downs of assets, and could face capital and liquidity constraints or other business challenges. A further deterioration in economic conditions, particularly within our geographic region, could result in the following consequences, any of which could have a material adverse effect on our business:
|
·
|
Loan delinquencies may further increase causing additional increases in our provision and allowance for loan losses.
|
|
·
|
Our ability to assess the creditworthiness of our customers may be impaired if the models and approaches we use to select, manage, and underwrite our customers become less predictive of future charge-offs.
|
|
·
|
Collateral for loans, especially real estate, may continue to decline in value, in turn reducing a client’s borrowing power, and reducing the value of assets and collateral associated with our loans held for investment.
|
|
·
|
Consumer confidence levels may decline and cause adverse changes in payment patterns, resulting in increased delinquencies and default rates on loans and other credit facilities and decreased demand for our products and services.
|
|
·
|
Performance of the underlying loans in the private label mortgage backed securities may continue to deteriorate potentially causing further OTTI markdowns to our investment portfolio.
|
We may suffer losses in our loan portfolio in excess of our allowance for loan losses.
Although down from the previous year, we have experienced increases in the levels of our nonperforming assets, loan charge-offs and provision for loan losses in recent periods. Our total nonperforming assets amounted to $3.3 million, or 0.40% of our total assets, at December 31, 2010, down from $13.4 million or 1.7% at December 31, 2009. We had $2.1 million of net loan charge-offs for 2010, down from $4.7 million in 2009. Our provision for loan losses was $2.1 million in 2010, down from $7.7 million in 2009. Additional increases in our nonperforming assets, loan charge-offs or provision for loan losses may have an adverse effect upon our future results of operations.
We seek to mitigate the risks inherent in our loan portfolio by adhering to specific underwriting practices. These practices include analysis of a borrower’s prior credit history, financial statements, tax returns and cash flow projections, valuation of collateral based on reports of independent appraisers and liquid asset verifications. Although we believe that our underwriting criteria are appropriate for the various kinds of loans we make, we may incur losses on loans that meet our underwriting criteria, and these losses may exceed the amounts set aside as reserves in our allowance for loan losses. We create an allowance for estimated loan losses in our accounting records, based on estimates of the following:
• Historical experience with our loans;
• Industry historical losses as reported by the FDIC;
• Evaluation of economic conditions;
• Regular reviews of the quality, mix and size of the overall loan portfolio;
• Regular reviews of delinquencies; and
• The quality of the collateral underlying our loans.
Although we maintain an allowance for loan losses at a level that we believe is adequate to absorb losses inherent in our loan portfolio, changes in economic, operating and other conditions, including the sharp decline in real estate values and changes in interest rates, which are beyond our control, may cause our actual loan losses to exceed our current allowance estimates. If the actual loan losses exceed the amount reserved, it will adversely affect our financial condition and results of operations.
In addition, the Federal Reserve and the DFI, as part of their supervisory function, periodically review our allowance for loan losses. Either agency may require us to increase our provision for loan losses or to recognize further loan losses, based on their judgments, which may be different from those of our management. Any increase in the allowance required by them could also adversely affect our financial condition and results of operations.
Deteriorating economic conditions in California may cause us to suffer higher default rates on our loans and reduce the value of the assets we hold as collateral.
Our business activities and credit exposure are concentrated in Southern California. As a result, a deterioration in economic conditions, including state and local government deficits, in Southern California may cause us to incur losses associated with higher default rates and decreased collateral values in our loan portfolio. In addition, demand for our products and services may decline. The significant decline in the Southern California real estate market could hurt our business because the vast majority of our loans are secured by real estate located within Southern California. As of December 31, 2010, approximately 99% of our loan portfolio consisted of loans secured by real estate located in Southern California. As real estate values decline, especially in Southern California, the collateral for our loans provide less security. As a result, our ability to recover on defaulted loans by selling the underlying real estate would be diminished, and we would be more likely to suffer losses on defaulted loans.
Our level of credit risk is increasing due to our focus on commercial lending and the concentration on small businesses customers with heightened vulnerability to economic conditions.
As of December 31, 2010, our commercial real estate loans amounted to $374.1 million, or 65.9% of our total loan portfolio, and our commercial business loans amounted to $167.7 million, or 29.6% of our total loan portfolio. At such date, our largest outstanding commercial real estate loan amounted was $11.4 million and our largest outstanding commercial business loan was $9.4 million. Commercial real estate and commercial business loans generally are considered riskier than single-family residential loans because they have larger balances to a single borrower or group of related borrowers. Commercial real estate and commercial business loans involve risks because the borrowers’ ability to repay the loans typically depends primarily on the successful operation of the businesses or the properties securing the loans. Most of the Company’s commercial business loans are made to small business or middle market customers who may have a heightened vulnerability to economic conditions. Moreover, a portion of these loans have been made or acquired by us in recent years and the borrowers may not have experienced a complete business or economic cycle. Furthermore, the deterioration of our borrowers’ businesses may hinder their ability to repay their loans with us, which could adversely affect our results of operations.
Nonperforming assets take significant time to resolve and adversely affect our results of operations and financial condition.
Nonperforming assets adversely affect our net income in various ways. Until economic and market conditions improve, we may expect to continue to incur losses relating to nonperforming assets and higher loan administration costs. We generally do not record interest income on nonperforming loans or other real estate owned, which adversely affects our income. When we take collateral in foreclosures and similar proceedings, we are required to mark the related asset to the then fair market value of the collateral, which may ultimately result in a loss. An increase in the level of nonperforming assets increases our risk profile and may impact the capital levels our regulators believe are appropriate in light of the ensuing risk profile. While we reduce problem assets through loan sales, workouts, restructurings and otherwise, decreases in the value of the underlying collateral, or in these borrowers’ performance or financial condition, whether or not due to economic and market conditions beyond our control, could adversely affect our business, results of operations and financial condition. In addition, the resolution of nonperforming assets requires significant commitments of time from management and our directors, which can be detrimental to the performance of their other responsibilities. There can be no assurance that we will not experience future increases in nonperforming assets.
We may be unable to successfully compete in our industry.
We face direct competition from a significant number of financial institutions, many with a state-wide or regional presence, and in some cases, a national presence, in both originating loans and attracting deposits. Competition in originating loans comes primarily from other banks and mortgage companies that make loans in our primary market areas. We also face substantial competition in attracting deposits from other banking institutions, money market and mutual funds, credit unions and other investment vehicles. In addition banks with larger capitalizations and non-bank financial institutions that are not governed by bank regulatory restrictions have larger lending limits and are better able to serve the needs of larger customers. Many of these financial institutions are also significantly larger and have greater financial resources than we have, and have established customer bases and name recognition. We compete for loans principally on the basis of interest rates and loan fees, the types of loans we offer and the quality of service that we provide to our borrowers. Our ability to attract and retain deposits requires that we provide customers with competitive investment opportunities with respect to rate of return, liquidity, risk and other factors. To effectively compete, we may have to pay higher rates of interest to attract deposits, resulting in reduced profitability. In addition, we rely upon local promotional activities, personal relationships established by our officers, directors and employees and specialized services tailored to meet the individual needs of our customers in order to compete. If we are not able to effectively compete in our market area, our profitability may be negatively affected.
Interest rate fluctuations, which are out of our control, could harm profitability.
Our profitability depends to a large extent upon net interest income, which is the difference between interest income and dividends on interest-earning assets, such as loans and investments, and interest expense on interest-bearing liabilities, such as deposits and borrowings. Any change in general market interest rates, whether as a result of changes in the monetary policy of the Federal Reserve or otherwise, may have a significant effect on net interest income. The assets and liabilities may react differently to changes in overall interest rates or conditions. In general, higher interest rates are associated with a lower volume of loan originations while lower interest rates are usually associated with higher loan originations. Further, if interest rates decline, our loans may be refinanced at lower rates or paid off and our investments may be prepaid earlier than expected. If that occurs, we may have to redeploy the loan or investment proceeds into lower yielding assets, which might also decrease our income. Also, as many of our loans currently have interest rate floors, a rise in rates may increase the cost of our deposits while the rates on the loans remain at their floors, which could decrease our net interest margin. Accordingly, changes in levels of market interest rates could materially and adversely affect our net interest margin, asset quality and loan origination volume.
Adverse outcomes of litigation against us could harm our business and results of operations.
We are currently involved in litigation relating to the origination of certain subprime mortgages that prior management purchased on the secondary market (and later sold), as well as other actions arising in the ordinary course of business. A significant judgment against us in connection with any pending or future litigation could harm our business and results of operations.
Changes in the fair value of our securities may reduce our stockholders’ equity and net income.
At December 31, 2010, $155.1 million of our securities were classified as available-for-sale. At such date, the aggregate net unrealized losses on our available-for-sale securities was $1.6 million. We increase or decrease stockholders’ equity by the amount of change from the unrealized gain or loss (the difference between the estimated fair value and the amortized cost) of our available-for-sale securities portfolio, net of the related tax, under the category of accumulated other comprehensive income/loss. Therefore, a decline in the estimated fair value of this portfolio will result in a decline in reported stockholders’ equity, as well as book value per common share and tangible book value per common share. This decrease will occur even though the securities are not sold. In the case of debt securities, if these securities are never sold and there are no credit impairments, the decrease will be recovered over the life of the securities. In the case of equity securities which have no stated maturity, the declines in fair value may or may not be recovered over time.
For the year ended December 31, 2010, we reported a non-cash, OTTI charge of $1.1 million on our securities portfolio. We continue to monitor the fair value of our entire securities portfolio as part of our ongoing OTTI evaluation process. No assurance can be given that we will not need to recognize additional OTTI charges related to securities in the future. In addition, as a condition to membership in the FHLB of San Francisco, we are required to purchase and hold a certain amount of FHLB stock. Our stock purchase requirement is based, in part, upon the outstanding principal balance of advances from the FHLB. At December 31, 2010, we had stock in the FHLB of San Francisco totaling $11.3 million. The FHLB stock held by us is carried at cost and is subject to recoverability testing under applicable accounting standards. For the year ended December 31, 2010, we did not recognize an impairment charge related to our FHLB stock holdings. There can be no assurance, however, that future negative changes to the financial condition of the FHLB may not require us to recognize an impairment charge with respect to such holdings.
Conditions in the financial markets may limit our access to additional funding to meet our liquidity needs.
Liquidity is essential to our business, as we must maintain sufficient funds to respond to the needs of depositors and borrowers. An inability to raise funds through deposits, repurchase agreements, federal funds purchased, FHLB advances, the sale or pledging as collateral of loans and other assets could have a substantial negative effect on our liquidity. Our access to funding sources in amounts adequate to finance our activities could be impaired by factors that affect us specifically or the financial services industry in general. Factors that could negatively affect our access to liquidity sources include negative operating results, a decrease in the level of our business activity due to a market downturn or negative regulatory action against us. Our ability to borrow could also be impaired by factors that are not specific to us, such as severe disruption of the financial markets or negative news and expectations about the prospects for the financial services industry as a whole, as evidenced by recent turmoil in the domestic and worldwide credit markets.
The soundness of other financial institutions could negatively affect us.
Financial services institutions are interrelated as a result of trading, clearing, counterparty, or other relationships. We have exposure to many different industries and counterparties, and we routinely execute transactions with counterparties in the financial services industry, including commercial banks, brokers and dealers, investment banks and other institutional clients. Many of these transactions expose us to credit risk in the event of a default by a counterparty or client. In addition, our credit risk may be exacerbated when the collateral held by us cannot be realized upon or is liquidated at prices not sufficient to recover the full amount of the credit or derivative exposure due to us. Any such losses could have a material adverse effect on our financial condition and results of operations.
We are subject to extensive regulation which could adversely affect our business.
Our operations are subject to extensive regulation by federal, state and local governmental authorities and are subject to various laws and judicial and administrative decisions imposing requirements and restrictions on part or all of our operations. Given the current disruption in the financial markets and potential new regulatory initiatives, including the Obama Administration’s recent financial regulatory reform proposal, new regulations and laws that may affect us are increasingly likely. Because our business is highly regulated, the laws, rules and regulations applicable to us are subject to regular modification and change. There are currently proposed laws, rules and regulations that, if adopted, would impact our operations. These proposed laws, rules and regulations, or any other laws, rules or regulations, may be adopted in the future, which could (1) make compliance much more difficult or expensive, (2) restrict our ability to originate, broker or sell loans or accept certain deposits, (3) further limit or restrict the amount of commissions, interest or other charges earned on loans originated or sold by us, or (4) otherwise adversely affect our business or prospects for business.
Moreover, banking regulators have significant discretion and authority to prevent or remedy unsafe or unsound practices or violations of laws or regulations by financial institutions and holding companies in the performance of their supervisory and enforcement duties. The exercise of regulatory authority may have a negative impact on our financial condition and results of operations.
Additionally, in order to conduct certain activities, including acquisitions, we are required to obtain regulatory approval. There can be no assurance that any required approvals can be obtained, or obtained without conditions or on a timeframe acceptable to us.
The enactment of the Dodd-Frank Wall Street Reform and Consumer Protection Act of 2010 may have a material effect on our operations.
On July 21, 2010, President Obama signed into law the Dodd-Frank Act, which imposes significant regulatory and compliance changes. The key provisions of the Dodd-Frank Act that are anticipated to effect our operations include:
|
·
|
changes to regulatory capital requirements;
|
|
·
|
creation of new government regulatory agencies, including the CFPB;
|
|
·
|
limitation on federal preemption;
|
|
·
|
changes in insured depository institution regulations and assessments; and
|
|
·
|
mortgage loan origination and risk retention.
|
Many of the requirements of the Dodd-Frank Act will be implemented over time and most will be subject to regulations implemented over the course of several years. Given the uncertainty associated with the manner in which the provisions of the Dodd-Frank Act will be implemented by the various regulatory agencies and through regulations, the full extent of the impact such requirements will have on our operations is unclear. The changes resulting from the Dodd-Frank Act may impact the profitability of our business activities, require changes to certain of our business practices, impose upon us more stringent capital, liquidity and leverage requirements or otherwise adversely affect our business. These changes may also require us to invest significant management attention and resources to evaluate and make any changes necessary to comply with new statutory and regulatory requirements. Failure to comply with the new requirements or with any future changes in laws or regulations may negatively impact our results of operations and financial condition.
Changes in laws, government regulation and monetary policy may have a material effect on our results of operations.
Financial institutions have been the subject of substantial legislative and regulatory changes and may be the subject of further legislation or regulation in the future, none of which is within our control. Significant new laws or regulations or changes in, or repeals of, existing laws or regulations may cause our results of operations to differ materially. In addition, the cost and burden of compliance with applicable laws and regulations have significantly increased and could adversely affect our ability to operate profitably. Further, federal monetary policy significantly affects credit conditions for us, as well as for our borrowers, particularly as implemented by the Federal Reserve, primarily through open market operations in U.S. government securities, the discount rate for bank borrowings and reserve requirements. A material change in any of these conditions could have a material impact on us or our borrowers, and therefore on our results of operations.
We expect to face increased regulation and supervision of our industry as a result of the existing financial crisis, and there will be additional requirements and conditions imposed on us to the extent that we participate in any of the programs established or to be established by the Treasury or by the federal bank regulatory agencies. Such additional regulation and supervision may increase our costs and limit our ability to pursue business opportunities. The affects of such recently enacted, and proposed, legislation and regulatory programs on us cannot reliably be determined at this time.
Federal and State banking agencies periodically conduct examinations of our business, including compliance with laws and regulations, and our failure to comply with any supervisory actions to which we are or become subject as a result of such examinations may adversely affect us.
Federal and state banking agencies, including the Federal Reserve, the FDIC and the DFI, periodically conduct examinations of our business, including compliance with laws and regulations. If, as a result of an examination, a federal banking agency were to determine that the financial condition, capital resources, asset quality, earnings prospects, management, liquidity or other aspects of any of our operations had become unsatisfactory, or that the Company or its management was in violation of any law or regulation, it may take a number of different remedial actions as it deems appropriate. These actions include the power to enjoin "unsafe or unsound" practices, to require affirmative actions to correct any conditions resulting from any violation or practice, to issue an administrative order that can be judicially enforced, to direct an increase in our capital, to restrict our growth, to assess civil monetary penalties against our officers or directors, to remove officers and directors and, if it is concluded that such conditions cannot be corrected or there is an imminent risk of loss to depositors, to terminate our deposit insurance. If we become subject to such regulatory actions, our business, results of operations and reputation may be negatively impacted.
We may in the future engage in additional FDIC-assisted transactions, which could present additional risk to our business.
On February 11, 2011, we completed the acquisition of assets and assumption of deposits and liabilities of Canyon National from the FDIC. We acquired the assets and assumed the liabilities of Canyon National without entering into a loss sharing agreement with the FDIC. In the current economic environment, and subject to any requisite regulatory consent, we may potentially be presented with additional opportunities to acquire the assets and liabilities of other failed banks in FDIC-assisted transactions. The Canyon National acquisition and any future acquisitions involve risks similar to acquiring existing banks even though the FDIC might provide assistance to mitigate certain risks such as sharing in exposure to loan losses and providing indemnification against certain liabilities of the failed institution. However, because FDIC-assisted transactions are structured in a manner that would not allow us the time normally associated with preparing for and evaluating an acquisition, including preparing for integration of an acquired institution, we may face additional risks if we engage in FDIC-assisted transactions. The risks related to the Canyon National and other future FDIC-assisted transactions include, among other things, the loss of customers, strain on management resources related to collection and management of problem loans and problems related to integration of personnel and operating systems. We may not be successful in overcoming these risks or any other problems encountered in connection with the Canyon National or other future FDIC-assisted transactions. Our inability to overcome these risks could have an adverse effect on our ability to achieve our business strategy and maintain our market value and profitability.
Moreover, even if we were inclined to participate in additional FDIC-assisted transactions, there are no assurances that the FDIC would allow us to participate or what the terms of such transaction might be or whether we would be successful in acquiring the bank or assets that we are seeking. We may be required to raise additional capital as a condition to, or as a result of, participation in FDIC-assisted transactions. Any such transactions and related issuances of stock may have a dilutive effect on earnings per share and share ownership.
Furthermore, to the extent we are allowed to, and choose to, participate in additional FDIC-assisted transactions, we may face competition from other financial institutions with respect to the proposed FDIC-assisted transactions. To the extent that our competitors are selected to participate in FDIC-assisted transactions, our ability to identify and attract acquisition candidates and/or make acquisitions on favorable terms may be adversely affected.
Potential acquisitions may disrupt our business and dilute stockholder value.
We evaluate merger and acquisition opportunities and conduct due diligence activities related to possible transactions with other financial institutions on an ongoing basis. As a result, merger or acquisition discussions and, in some cases, negotiations may take place and future mergers or acquisitions involving cash, debt or equity securities may occur at any time. Acquisitions typically involve the payment of a premium over book and market values, and, therefore, some dilution of our stock’s tangible book value and net income per common share may occur in connection with any future transaction. Furthermore, failure to realize the expected revenue increases, cost savings, increases in geographic or product presence, and/or other projected benefits from an acquisition could have a material adverse effect on our financial condition and results of operations.
We may seek merger or acquisition partners that are culturally similar and have experienced management and possess either significant market presence or have potential for improved profitability through financial management, economies of scale or expanded services. We do not currently have any specific plans, arrangements or understandings regarding such expansion. We cannot say with any certainty that we will be able to consummate, or if consummated, successfully integrate future acquisitions or that we will not incur disruptions or unexpected expenses in integrating such acquisitions. In attempting to make such acquisitions, we anticipate competing with other financial institutions, many of which have greater financial and operational resources. Acquiring other banks, businesses, or branches involves various risks commonly associated with acquisitions, including, among other things:
• Potential exposure to unknown or contingent liabilities of the target company;
• Exposure to potential asset quality issues of the target company;
• Difficulty and expense of integrating the operations and personnel of the target company;
• Potential disruption to our business;
• Potential diversion of management’s time and attention;
• The possible loss of key employees and customers of the target company;
• Difficulty in estimating the value of the target company; and
• Potential changes in banking or tax laws or regulations that may affect the target company.
Increases in FDIC deposit insurance premiums could adversely affect our earnings.
Market developments have significantly depleted the deposit insurance fund, or DIF, of the FDIC and reduced the ratio of reserves to insured deposits. As a result of recent economic conditions and the enactment of the Dodd-Frank Act, the FDIC revised its assessment rates which raised deposit premiums for certain insured depository institutions. If these increases are insufficient for the DIF to meet its funding requirements, further special assessments or increases in deposit insurance premiums may be required. We are generally unable to control the amount of premiums that we are required to pay for FDIC insurance. If there are additional bank or financial institution failures, we may be required to pay even higher FDIC premiums than the recently increased levels. Any future assessments, increases or required prepayments in FDIC insurance premiums may materially adversely affect results of operations.
Liquidity risk could impair our ability to fund our operations and jeopardize our financial condition.
Liquidity is essential to our business. An inability to raise funds through deposits, borrowings, equity/debt offerings and other sources could have a substantial negative effect on our liquidity. Our access to funding sources in amounts adequate to finance our activities, or on terms attractive to us, could be impaired by factors that affect us specifically or the financial services industry in general. Factors that could detrimentally impact our access to liquidity sources include a reduction in our credit ratings, if any, an increase in costs of capital in financial capital markets, a decrease in the level of our business activity due to a market downturn or adverse regulatory action against us, or a decrease in depositor or investor confidence. Our ability to borrow could also be impaired by factors such as a severe disruption of the financial markets or negative views and expectations about the prospects for the financial services industry as a whole.
Our controls and procedures may fail or be circumvented.
Management regularly reviews and updates our internal controls, disclosure controls and procedures, and corporate governance policies and procedures. Any system of controls, however well designed and operated, is based in part on certain assumptions and can provide only reasonable, not absolute, assurances that the objectives of the system are met. Any failure or circumvention of our controls and procedures or failure to comply with regulations related to controls and procedures could have a material adverse effect on our business, results of operations and financial condition.
Environmental liabilities with respect to properties on which we take title may have a material effect on our results of operations.
We could be subject to environmental liabilities on real estate properties we foreclose and take title in the normal course of our business. In connection with environmental contamination, we may be held liable to governmental entities or to third parties for property damage, personal injury, investigation and clean-up costs incurred by these parties, or we may be required to investigate or clean-up hazardous or toxic substances at a property. The investigation or remediation costs associated with such activities could be substantial. Furthermore, we may be subject to common law claims by third parties based on damages and costs resulting from environmental contamination even if we were the former owner of a contaminated site. The incurrence of a significant environmental liability could adversely affect our business, financial condition and results of operations.
Confidential customer information transmitted through the Bank’s online banking service is vulnerable to security breaches and computer viruses, which could expose the Bank to litigation and adversely affect its reputation and ability to generate deposits.
The Bank provides its customers the ability to bank online. The secure transmission of confidential information over the Internet is a critical element of online banking. The Bank’s network could be vulnerable to unauthorized access, computer viruses, phishing schemes and other security problems. The Bank may be required to spend significant capital and other resources to protect against the threat of security breaches and computer viruses, or to alleviate problems caused by security breaches or viruses. To the extent that the Bank’s activities or the activities of its customers involve the storage and transmission of confidential information, security breaches and viruses could expose the Bank to claims, litigation and other possible liabilities. Any inability to prevent security breaches or computer viruses could also cause existing customers to lose confidence in the Bank’s systems and could adversely affect its reputation and ability to generate deposits.
We are dependent on our key personnel.
Our future operating results depend in large part on the continued services of our key personnel, including Steven R. Gardner, our President and Chief Executive Officer, who developed and implemented our new business strategy in late 2000. The loss of Mr. Gardner could have a negative impact on the success of our business strategy. In addition, we rely upon the services of Eddie Wilcox, our Executive Vice President and Chief Banking Officer, and our ability to attract and retain highly skilled personnel. We do not maintain key-man life insurance on any employee other than Mr. Gardner. We cannot assure you that we will be able to continue to attract and retain the qualified personnel necessary for the development of our business. The unexpected loss of services of our key personnel could have a material adverse impact on our business because of their skills, knowledge of our market, years of industry experience and the difficulty of promptly finding qualified replacement personnel. In addition, recent regulatory proposals and guidance relating to compensation may negatively impact our ability to retain and attract skilled personnel.
A natural disaster or recurring energy shortage, especially in California, could harm our business.
We are based in Costa Mesa, California, and approximately 99% of our total loan portfolio was secured by real estate located in Southern California at December 31, 2010. In addition, the computer systems that operate our Internet websites and some of their back-up systems are located in Costa Mesa, California. Historically, California has been vulnerable to natural disasters. Therefore, we are susceptible to the risks of natural disasters, such as earthquakes, wildfires, floods and mudslides. Natural disasters could harm our operations directly through interference with communications, including the interruption or loss of our websites, which would prevent us from gathering deposits, originating loans and processing and controlling our flow of business, as well as through the destruction of facilities and our operational, financial and management information systems. A natural disaster or recurring power outages may also impair the value of our largest class of assets, our loan portfolio, which is comprised substantially of real estate loans. Uninsured or underinsured disasters may reduce borrowers’ ability to repay mortgage loans. Disasters may also reduce the value of the real estate securing our loans, impairing our ability to recover on defaulted loans through foreclosure and making it more likely that we would suffer losses on defaulted loans. California has also experienced energy shortages, which, if they recur, could impair the value of the real estate in those areas affected. Although we have implemented several back-up systems and protections (and maintain business interruption insurance), these measures may not protect us fully from the effects of a natural disaster. The occurrence of natural disasters or energy shortages in California could have a material adverse effect on our business prospects, financial condition and results of operations.
Risks Related to Ownership of Our Common Stock
The price of our common stock may fluctuate significantly, and this may make it difficult for you to resell your shares of common stock at times or at prices you find attractive.
Stock price volatility may make it difficult for you to resell your common stock when you want and at prices you find attractive. Our stock price can fluctuate significantly in response to a variety of factors including, among other things:
|
·
|
Actual or anticipated variations in quarterly results of operations;
|
|
·
|
Recommendations by securities analysts;
|
|
·
|
Operating and stock price performance of other companies that investors deem comparable to us;
|
|
·
|
News reports relating to trends, concerns and other issues in the financial services industry, including the failures of other financial institutions in the current economic downturn;
|
|
·
|
Perceptions in the marketplace regarding us and/or our competitors;
|
|
·
|
New technology used, or services offered, by competitors;
|
|
·
|
Significant acquisitions or business combinations, strategic partnerships, joint ventures or capital commitments by or involving us or our competitors;
|
|
·
|
Failure to integrate acquisitions or realize anticipated benefits from acquisitions;
|
|
·
|
Changes in government regulations; and
|
|
·
|
Geopolitical conditions such as acts or threats of terrorism or military conflicts.
|
General market fluctuations, industry factors and general economic and political conditions and events, such as economic slowdowns or recessions, interest rate changes or credit loss trends, could also cause our stock price to decrease regardless of operating results as evidenced by the current volatility and disruption of capital and credit markets.
Only a limited trading market exists for our common stock, which could lead to significant price volatility.
Our common stock is traded on the NASDAQ Global Market under the trading symbol “PPBI,” but there is low trading volumes in our common stock. The limited trading market for our common stock may cause fluctuations in the market value of our common stock to be exaggerated, leading to price volatility in excess of that which would occur in a more active trading market of our common stock. Future sales of substantial amounts of common stock in the public market, or the perception that such sales may occur, could adversely affect the prevailing market price of the common stock. In addition, even if a more active market in our common stock develops, we cannot assure you that such a market will continue.
Upon exercise by certain stockholders of warrants for our common stock, stockholders will experience significant dilution in their shares of common stock.
We have issued warrants to certain stockholders representing the right to purchase 966,400 shares of our common stock at an exercise price of $0.75 per share outstanding as of December 31, 2010. The aggregate number of shares of our common stock subject to these warrants represents approximately 9.6% of our issued and outstanding shares as of December 31, 2010. The trading price of our common stock has been significantly higher than the exercise price of the warrants for the last three consecutive fiscal years. Upon exercise of the warrants, existing stockholders will experience significant dilution on the shares of our common stock that they hold.
We do not expect to pay cash dividends in the foreseeable future.
We do not intend to pay cash dividends on our common stock in the foreseeable future. Instead, we intend to reinvest our earnings in our business. In addition, in order to pay cash dividends to our stockholders, we would most likely need to obtain funds from the Bank. The Bank’s ability, in turn, to pay dividends to us is subject to restrictions set forth in the California Financial Code. The California Financial Code provides that a bank may not make a cash distribution to its stockholders in excess of the lesser of (1) a bank’s retained earnings; or (2) a bank’s net income for its last three fiscal years, less the amount of any distributions made by the bank or by any majority-owned subsidiary of the bank to the stockholders of the bank during such period. However, a bank may, with the approval of the DFI, make a distribution to its stockholders in an amount not exceeding the greatest of (a) its retained earnings; (b) its net income for its last fiscal year; or (c) its net income for its current fiscal year. In the event that Bank regulators determine that the stockholders’ equity of a bank is inadequate or that the making of a distribution by the bank would be unsafe or unsound, the regulators may order the bank to refrain from making a proposed distribution. The payment of dividends could, depending on the financial condition of the Bank, be deemed to constitute an unsafe or unsound practice.
Approval of the Federal Reserve is required for payment of any dividend by a state chartered bank that is a member of the Federal Reserve Board System, such as Pacific Premier Bank, if the total of all dividends declared by the bank in any calendar year would exceed the total of its retained net income for that year combined with its retained net income for the preceding two ears. In addition, a state member bank may not pay a dividend in an amount greater than it undivided profits without regulatory and stockholder approval. The Bank is also prohibited under federal law from paying any dividend that would cause it to become undercapitalized.
Anti-takeover defenses may delay or prevent future transactions
Our certificate of incorporation and bylaws, among other things:
|
·
|
divide the board of directors into three classes with directors of each class serving for a staggered three year period;
|
|
·
|
provide that our directors must fill vacancies on the board of directors;
|
|
·
|
permit the issuance, without stockholder approval, of shares of preferred stock having rights and preferences determined by the board of directors;
|
|
·
|
provide that stockholders holding 80% of our issued and outstanding shares must vote to approve certain business combinations and other transactions involving holders of more than 10% of our common stock or our affiliates;
|
|
·
|
provide that stockholders holding 80% of our issued and outstanding shares must vote to remove directors for cause; and
|
|
·
|
provide that record holders of our common stock who beneficially own in excess of 10% of our common stock are not entitled to vote shares held by them in excess of 10% of our common stock.
|
These provisions in our certificate of incorporation and bylaws could make the removal of incumbent directors more difficult and time-consuming and may have the effect of discouraging a tender offer or other takeover attempts not previously approved by our board of directors.
None
|
Location
|
Leased or
Owned
|
Original Year
Leased or
Acquired
|
Date of
Lease
Expiration
|
Net Book Value of
Property or Leasehold
Improvements at
December 31, 2010
|
|||
|
|
|||||||
|
Corporate Headquarters:
|
|||||||
|
1600 Sunflower Ave
|
|||||||
|
Costa Mesa, CA 92626
|
Owned (a)
|
2002
|
N.A.
|
$ | 4,435,809 | ||
|
|
|||||||
|
Branch Office:
|
|||||||
|
1598 E Highland Avenue
|
|||||||
|
San Bernardino, CA 92404
|
Leased
|
1986
|
2015
|
$ | 315,695 | ||
|
|
|||||||
|
Branch Office:
|
|||||||
|
19011 Magnolia Avenue
|
|||||||
|
Huntington Beach, CA 92646
|
Owned (b) (c)
|
2005
|
2023
|
$ | 1,220,809 | ||
|
|
|||||||
|
Branch Office:
|
|||||||
|
13928 Seal Beach Blvd.
|
|||||||
|
Seal Beach, CA 90740
|
Leased
|
1999
|
2012
|
$ | 13,431 | ||
|
Branch Office:
|
|||||||
|
4957 Katella Avenue, Suite B
|
|||||||
|
Los Alamitos, CA 90720
|
Leased
|
2005
|
2015
|
$ | 209,825 | ||
|
Branch Office:
|
|||||||
|
4667 MacArthur Blvd.
|
|||||||
|
Newport Beach, CA 92660
|
Leased
|
2005
|
2016
|
$ | 535,322 | ||
|
(a) We lease to three tenants approximately 11,050 square feet of the 36,159 square feet of our corporate headquarters for $16,262 per month.
|
|||||||
|
(b) The building is owned, but the land is leased on a long-term basis.
|
|||||||
|
(c) We lease to two tenants approximately 2,724 square feet of the 9,937 square feet of our Huntington Beach branch for $7,491 per month.
|
|||||||
In February 2004, the Bank was named in a class action lawsuit titled “James Baker v. Century Financial, et al”, alleging various violations of Missouri’s Second Mortgage Loans Act by charging and receiving fees and costs that were either wholly prohibited by or in excess of that allowed by the Act relating to origination fees, interest rates, and other charges. The class action lawsuit was filed in the Circuit Court of Clay County, Missouri. The complaint seeks restitution of all improperly collected charges, interest thereon, the right to rescind the mortgage loans or a right to offset any illegal collected charges and interest against the principal amounts due on the loans and punitive damages. In March 2005, the Bank’s motion for dismissal due to limitations was denied by the trial court without comment. The Bank’s “preemption” motion was denied in August 2006. The Bank has answered the plaintiffs’ complaint and the parties have exchanged and answered initial discovery requests. When the record is more fully developed, the Bank intends to raise the limitations issue again in the form of a motion for summary judgment.
The Company is not involved in any other material pending legal proceedings other than legal proceedings occurring in the ordinary course of business. Management believes that none of these legal proceedings, individually or in the aggregate, will have a material adverse impact on the results of operations or financial condition of the Company.
PRICE RANGE BY QUARTERS
The common stock of the Corporation has been publicly traded since 1997 and is currently traded on the NASDAQ Global Market under the symbol PPBI. However, until recently, trading in the common stock has not been extensive and such trades cannot be characterized as constituting an active trading market.
As of March 17, 2011, there were approximately 1,350 holders of record of the common stock. The following table summarizes the range of the high and low closing sale prices per share of our common stock as quoted by the NASDAQ Global Market for the periods indicated.
|
Sale Price of
|
||||||
|
Common Stock
|
||||||
|
High
|
Low
|
|||||
|
2009
|
||||||
|
First Quarter
|
$ | 4.60 | $ | 2.79 | ||
|
Second Quarter
|
$ | 5.63 | $ | 3.85 | ||
|
Third Quarter
|
$ | 5.10 | $ | 3.98 | ||
|
Fourth Quarter
|
$ | 4.76 | $ | 3.15 | ||
|
2010
|
||||||
|
First Quarter
|
$ | 5.00 | $ | 3.32 | ||
|
Second Quarter
|
$ | 5.20 | $ | 4.10 | ||
|
Third Quarter
|
$ | 4.54 | $ | 3.78 | ||
|
Fourth Quarter
|
$ | 6.48 | $ | 4.14 | ||
Stock Performance Graph. The graph below compares the performance of our common stock with that of the NASDAQ Composite Index (U.S. companies) and the NASDAQ Bank Stocks Index from December 31, 2005 through December 31, 2010. The graph is based on an investment of $100 in our common stock at its closing price on December 31, 2005. The Corporation has not paid any dividends on its common stock.
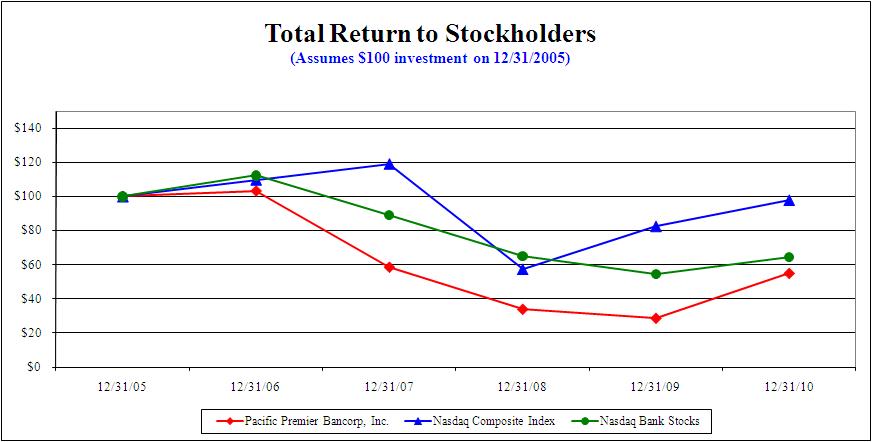
|
Total Return Analysis
|
12/3/2005
|
12/31/2006
|
12/31/2007
|
12/30/2008
|
12/29/2009
|
12/29/2010
|
|
Pacific Premier Bancorp, Inc.
|
$100.00
|
$103.22
|
$58.56
|
$33.90
|
$28.64
|
$54.92
|
|
NASDAQ Bank Stocks Index
|
$100.00
|
$112.23
|
$88.95
|
$64.86
|
$54.35
|
$64.28
|
|
NASDAQ Composite Index
|
$100.00
|
$109.84
|
$119.14
|
$57.41
|
$82.53
|
$97.95
|
DIVIDENDS
It is our policy to retain earnings, if any, to provide funds for use in our business. We have never declared or paid dividends on our common stock and do not anticipate declaring or paying any cash dividends in the foreseeable future.
Our ability to pay dividends on our common stock is dependent on the Bank’s ability to pay dividends to the Company. Various statutory provisions restrict the amount of dividends that the Bank can pay without regulatory approval. For information on the statutory and regulatory limitations on the ability of the Company to pay dividends to its stockholders and on the Bank to pay dividends to the Corporation, see “Item 1. Business-Supervision and Regulation—Dividends” and “Item 7. Management’s Discussion and Analysis of Financial Condition and Results of Operations – Liquidity.”
ISSUER PURCHASES OF EQUITY SECURITIES
In February 2007, our board of directors authorized the management of the Company to purchase and retain up to 600,000 shares of our issued and outstanding common stock on a negotiated, non-open market basis by dealing directly with investment bankers representing stockholders of larger blocks of stock. The plan has no expiration date and remains open. No determination has been made to terminate the plan or to cease making purchases. At December 31, 2010, the Corporation had purchased 432,837 shares pursuant to that authorization.
The following table provides information with respect to purchases made by or on behalf of us or any “affiliated purchaser” (as defined in Rule 10b-18(a)(3) under the Securities Exchange Act of 1934) of the our common stock during the fourth quarter of 2010.
|
Month of Purchase
|
Total Number of shares purchased/ returned
|
Average price paid per share
|
Total number of shares repurchased as part of the publicly announced program
|
Maximum number of shares that may yet be purchased under the program at end of month
|
||||||||||||
|
Oct-10
|
- | - | - | 167,163 | ||||||||||||
|
Nov-10
|
- | - | - | 167,163 | ||||||||||||
|
Dec-10
|
- | - | - | 167,163 | ||||||||||||
|
Total/Average
|
- | $ | - | - | 167,163 | |||||||||||
The selected financial data presented below is derived from the audited consolidated financial statements of the Company and should be read in conjunction with the Consolidated Financial Statements presented elsewhere herein.
|
For the Year Ended December 31,
|
||||||||||||||||||||
|
2010
|
2009
|
2008
|
2007
|
2006
|
||||||||||||||||
|
Operating Data
|
(dollars in thousands)
|
|||||||||||||||||||
|
Interest income
|
$ | 41,103 | $ | 43,439 | $ | 46,522 | $ | 49,432 | $ | 44,128 | ||||||||||
|
Interest expense
|
12,666 | 20,254 | 25,404 | 31,166 | 27,003 | |||||||||||||||
|
Net interest income
|
28,437 | 23,185 | 21,118 | 18,266 | 17,125 | |||||||||||||||
|
Provision for loan losses
|
2,092 | 7,735 | 2,241 | 1,651 | 531 | |||||||||||||||
|
Net interest income after provision for loans losses
|
26,345 | 15,450 | 18,877 | 16,615 | 16,594 | |||||||||||||||
|
Net gains (losses) from loan sales
|
(3,332 | ) | (351 | ) | 92 | 3,720 | 3,697 | |||||||||||||
|
Other noninterest income (loss)
|
2,256 | 1,048 | (2,264 | ) | 2,639 | 2,818 | ||||||||||||||
|
Noninterest expense
|
18,948 | 16,694 | 15,964 | 17,248 | 15,231 | |||||||||||||||
|
Income (loss) before income tax (benefit)
|
6,321 | (547 | ) | 741 | 5,726 | 7,878 | ||||||||||||||
|
Income tax (benefit) (1)
|
2,083 | (87 | ) | 33 | 2,107 | 450 | ||||||||||||||
|
Net income (loss)
|
$ | 4,238 | $ | (460 | ) | $ | 708 | $ | 3,619 | $ | 7,428 | |||||||||
|
As of and For the Year Ended December 31,
|
||||||||||||||||||||
|
2010
|
2009
|
2008
|
2007
|
2006
|
||||||||||||||||
|
Share Data
|
(dollars in thousands, except per share data)
|
|||||||||||||||||||
|
Net income (loss) per share:
|
||||||||||||||||||||
|
Basic
|
$ | 0.42 | $ | (0.08 | ) | $ | 0.14 | $ | 0.70 | $ | 1.41 | |||||||||
|
Diluted
|
$ | 0.38 | $ | (0.08 | ) | $ | 0.11 | $ | 0.55 | $ | 1.11 | |||||||||
|
Weighted average common shares outstanding:
|
||||||||||||||||||||
|
Basic
|
10,033,836 | 5,642,589 | 4,948,359 | 5,189,104 | 5,261,897 | |||||||||||||||
|
Diluted
|
11,057,404 | 5,642,589 | 6,210,387 | 6,524,753 | 6,684,915 | |||||||||||||||
|
Book value per share (basic)
|
$ | 7.83 | $ | 7.33 | $ | 11.74 | $ | 11.77 | $ | 11.03 | ||||||||||
|
Book value per share (diluted)
|
$ | 7.18 | $ | 6.75 | $ | 9.60 | $ | 9.69 | $ | 9.16 | ||||||||||
|
Selected Balance Sheet Data
|
||||||||||||||||||||
|
Total assets
|
$ | 826,816 | $ | 807,323 | $ | 739,956 | $ | 763,420 | $ | 730,874 | ||||||||||
|
Securities and FHLB stock
|
168,428 | 137,737 | 70,936 | 73,042 | 77,144 | |||||||||||||||
|
Loans held for sale, net
|
- | - | 668 | 749 | 795 | |||||||||||||||
|
Loans held for investment, net
|
555,538 | 566,584 | 622,470 | 622,114 | 604,304 | |||||||||||||||
|
Allowance for loan losses
|
8,879 | 8,905 | 5,881 | 4,598 | 3,543 | |||||||||||||||
|
Total deposits
|
659,240 | 618,734 | 457,128 | 386,735 | 339,449 | |||||||||||||||
|
Total borrowings
|
78,810 | 101,810 | 220,210 | 308,275 | 326,801 | |||||||||||||||
|
Total stockholders' equity
|
78,602 | 73,502 | 57,548 | 60,750 | 58,038 | |||||||||||||||
|
Performance Ratios
|
||||||||||||||||||||
|
Return on average assets
|
0.53 | % | (0.06 | )% | 0.09 | % | 0.50 | % | 1.07 | % | ||||||||||
|
Return on average equity
|
5.57 | % | (0.76 | )% | 1.20 | % | 6.03 | % | 13.47 | % | ||||||||||
|
Average equity to average assets
|
9.55 | % | 7.74 | % | 7.96 | % | 8.16 | % | 7.94 | % | ||||||||||
|
Equity to total assets at end of period
|
9.51 | % | 9.10 | % | 7.78 | % | 7.96 | % | 7.94 | % | ||||||||||
|
Average interest rate spread
|
3.67 | % | 3.00 | % | 2.81 | % | 2.44 | % | 2.39 | % | ||||||||||
|
Net interest margin
|
3.77 | % | 3.12 | % | 2.99 | % | 2.63 | % | 2.58 | % | ||||||||||
|
Efficiency ratio (2)
|
59.24 | % | 63.81 | % | 83.66 | % | 69.87 | % | 64.26 | % | ||||||||||
|
Average interest-earning assets to average interest-bearing liabilities
|
105.88 | % | 104.21 | % | 105.01 | % | 104.20 | % | 104.83 | % | ||||||||||
|
Pacific Premier Bank Capital Ratios
|
||||||||||||||||||||
|
Tier 1 capital to adjusted total assets
|
10.29 | % | 9.72 | % | 8.71 | % | 8.81 | % | 8.38 | % | ||||||||||
|
Tier 1 capital to total risk-weighted assets
|
14.03 | % | 13.30 | % | 10.71 | % | 10.68 | % | 10.94 | % | ||||||||||
|
Total capital to total risk-weighted assets
|
15.28 | % | 14.55 | % | 11.68 | % | 11.44 | % | 11.55 | % | ||||||||||
|
Pacific Premier Bancorp. Inc. Capital Ratios (3)
|
||||||||||||||||||||
|
Tier 1 capital to adjusted total assets
|
10.41 | % | 9.89 | % | 8.99 | % | 8.90 | % | N/A | |||||||||||
|
Tier 1 capital to total risk-weighted assets
|
14.07 | % | 13.41 | % | 11.11 | % | 10.81 | % | N/A | |||||||||||
|
Total capital to total risk-weighted assets
|
15.32 | % | 14.67 | % | 12.07 | % | 11.56 | % | N/A | |||||||||||
|
Asset Quality Ratios
|
||||||||||||||||||||
|
Nonperforming loans, net, to total loans
|
0.58 | % | 1.74 | % | 0.83 | % | 0.67 | % | 0.09 | % | ||||||||||
|
Nonperforming assets, net as a percent of total assets
|
0.40 | % | 1.66 | % | 0.71 | % | 0.64 | % | 0.10 | % | ||||||||||
|
Net charge-offs to average total loans, net
|
0.39 | % | 0.79 | % | 0.16 | % | 0.10 | % | 0.01 | % | ||||||||||
|
Allowance for loan losses to total loans at period end
|
1.56 | % | 1.55 | % | 0.94 | % | 0.73 | % | 0.58 | % | ||||||||||
|
Allowance for loan losses as a percent of nonperforming loans at period end
|
270.95 | % | 88.94 | % | 113.10 | % | 109.48 | % | 558.83 | % | ||||||||||
|
(1)
|
In the year ended December 31, 2006, we reversed $2.4 million of our deferred tax valuation allowance due to our improved financial outlook.
|
|
(2)
|
Represents the ratio of noninterest expense less other real estate owned operations, gain/(loss) on sale of loans, and gain/(loss) on sale of securities, net to the sum of net interest income before provision for loan losses and total noninterest income.
|
|
(3)
|
Years prior to 2007 are not applicable due to change in the Bank’s charter to that of a commercial bank in March 2007.
|
Summary
Our principal business is attracting deposits from small businesses and consumers and investing those deposits together with funds generated from operations and borrowings, primarily in commercial business loans and various types of commercial real estate loans. In 2011, the Company expects to fund substantially all of the loans that it originates or purchases through deposits, FHLB advances and internally generated funds. Deposit flows and cost of funds are influenced by prevailing market rates of interest primarily on competing investments, account maturities and the levels of savings in the Company’s market area. The Company’s ability to originate and purchase loans is influenced by the general level of product available. The Company’s results of operations are also affected by the Company’s provision for loan losses and the level of operating expenses. The Company’s operating expenses primarily consist of employee compensation and benefits, premises and occupancy expenses, and other general expenses. The Company's results of operations are also affected by prevailing economic conditions, competition, government policies and other actions of regulatory agencies.
Critical Accounting Policies and Estimates
We have established various accounting policies that govern the application of accounting principles generally accepted in the United States of America in the preparation of the Company’s financial statements in Item 8 hereof. The Company’s significant accounting policies are described in the Note 1 to the Consolidated Financial Statements. Certain accounting policies require management to make estimates and assumptions that have a material impact on the carrying value of certain assets and liabilities; management considers these to be critical accounting policies. The estimates and assumptions management uses are based on historical experience and other factors, which management believes to be reasonable under the circumstances. Actual results could differ significantly from these estimates and assumptions, which could have a material impact on the carrying value of assets and liabilities at balance sheet dates and the Company’s results of operations for future reporting periods.
We consider the allowance for loan losses and the determination of the other-than-temporary impairment (“OTTI”) of investment securities to be a critical accounting policy that requires judicious estimates and assumptions in the preparation of the Company’s financial statements that is particularly susceptible to significant change. For further information on the Allowance for loan losses, see “Business—Allowances for Loan Losses” and Note 1 to the Consolidated Financial Statements in Item 8 hereof. For further information on OTTI of investment securities, see “Business—Investment Activities” and Note 1 to the Consolidated financial Statements in Item 8 hereof.
Allowance for loan losses
The Company maintains an allowance for loan losses at a level deemed appropriate by management to provide for known or inherent risks in the portfolio at the balance sheet date. The Company has implemented and adheres to an internal asset review system and loss allowance methodology designed to provide for the detection of problem assets and an adequate allowance to cover loan losses. Management’s determination of the adequacy of the loan loss allowance is based on an evaluation of the composition of the portfolio, actual loss experience, industry charge-off experience on income property loans, current economic conditions, and other relevant factors in the area in which the Company’s lending and real estate activities are based. These factors may affect the borrowers’ ability to pay and the value of the underlying collateral. The allowance is calculated by applying loss factors to loans held for investment according to loan program type and loan classification. The loss factors are established based primarily upon the Bank’s historical loss experience and the industry charge-off experience and are evaluated on a quarterly basis. Various regulatory agencies, as an integral part of their examination process, periodically review the Company’s allowance for loan losses. Such agencies may require the Bank to recognize additions to the allowance based on judgments different from those of management. In the opinion of management, and in accordance with the credit loss allowance methodology, the present allowance is considered adequate to absorb estimable and probable credit losses. Additions and reductions to the allowance are reflected in current operations. Charge-offs to the allowance are made when specific assets are considered uncollectible or are transferred to other real estate owned and the fair value of the property is less than the loan’s recorded investment. Recoveries are credited to the allowance.
Although management uses the best information available to make these estimates, future adjustments to the allowance may be necessary due to economic, operating, regulatory and other conditions that may be beyond the Company’s control.
Other-Than-Temporary Impairment of Investment Securities
The Company has investment securities classified available for sale. Under the available for sale classification, securities can be sold in response to certain conditions, such as changes in interest rates, fluctuations in deposit levels or loan demand or need to restructure the portfolio to better match the maturity of interest rate characteristics of liabilities with assets. Securities classified as available for sale are accounted for at their current fair value. Unrealized holding gains and losses, net of tax, are excluded from earnings and reported as a separate component of stockholders’ equity as accumulated other comprehensive income.
At each reporting date, investment securities available for sale are assessed to determine whether there is OTTI. If it is probable that the Company will be unable to collect all amounts due from the contractual terms of a debt security, OTTI is charged to operations with a corresponding write-down to the fair value of the security. These related write-downs are included in operations as realized losses in the category of other-than-temporary impairment loss on investment securities, net. In estimating OTTI losses, management considers: (i) the length of time and the extent to which the market value has been less than cost; (ii) the financial condition and near-term prospects of the issuer; (iii) the intent and ability of the Company to retain its investment in a security for a period of time sufficient to allow for any anticipated recovery in market value; and (iv) general market conditions which reflect prospects for the economy as a whole, including interest rates and sector credit spreads.
Operating Results
General. The Company reported net income for 2010 of $4.2 million or $0.38 per share on a diluted basis, compared with a net loss of $460,000 or $0.08 per share on a diluted basis for 2009 and net income of $708,000 or $0.11 per share on a diluted basis for 2008.
The Company’s pre-tax income totaled $6.3 million in 2010, compared with a pre-tax loss of $547,000 in 2009. The $6.8 million increase in the Company’s pre-tax income for 2010 compared to 2009 was primarily due to:
|
·
|
A $5.6 million decrease in provision for loan losses due to improved loan credit quality; and
|
|
·
|
A $5.3 million increase in net interest income due to a higher net interest margin and a higher level of interest earning assets.
|
Partially offsetting the above favorable items were the following:
|
·
|
A $2.3 million increase in noninterest expense, primarily associated with higher costs related to other real estate owned (“OREO”) operations, compensation and benefits costs, legal and audit fees, and office expenses; and
|
|
·
|
A $1.8 million unfavorable change in noninterest income (loss), primarily due to losses on the sale of loans, partially offset by lower other-than-temporary impairment (“OTTI”) charges taken on our private label securities and higher gains on sales of investment securities available for sale.
|
The $1.3 million decrease in the Company’s pre-tax income/(loss) for 2009, compared to 2008 was due primarily to a $5.5 million increase in provision for loan losses and a $0.7 million increase in noninterest expense, primarily associated with higher costs related to Federal Deposit Insurance Corporation (“FDIC”) insurance premiums, OREO operations, net and professional fees, partially offset by lower compensation and benefits expense. Offsetting these items were a $2.1 million increase in net interest income due to a higher level of interest earning assets and a higher net interest margin and a $2.9 million favorable change in noninterest income (loss) category, primarily associated with a lower OTTI charge taken on private label securities in 2009 and higher deposit fee income, partially offset by lower loan servicing fee income and losses on loan sales, compared to gains in the prior year.
For 2010, our return on average assets was 0.53% and our return on average equity was 5.57%. These returns were up from our 2009 negative returns of 0.06% on average assets and 0.76% on average equity and up from our 2008 returns of 0.09% on average assets and 1.20% on average equity.
Net Interest Income. Our primary source of revenue is net interest income, which is the difference between the interest and dividends earned on loans, mortgage-backed securities and investment securities (“interest-earning assets”) and the interest paid on deposits and borrowings (“interest-bearing liabilities”). The difference between the yield on interest-earning assets and the cost of interest-bearing liabilities (“net interest rate spread”) and the relative dollar amount of these assets and liabilities principally affects our net interest income.
Net interest income totaled $28.4 million for 2010, up $5.3 million or 22.7% from 2009. The increase reflected a higher net interest margin of 3.77% in the current year, compared with 3.12% in the prior year and to a lesser extent higher average interest-earning assets in 2010 of $754.7 million, compared with 2009 of $743.6 million. The increase in the 2010 net interest margin of 65 basis points primarily reflected a faster decrease in the average costs on interest-bearing liabilities of 106 basis points than interest-earning assets, which decreased 39 basis points. For 2010, the decrease in costs on our interest-bearing liabilities resulted from a decline in our cost of deposits of 87 basis points, as the mix of deposits shifted to lower costing transaction accounts, and a decline in the cost of borrowings of 67 basis points, as lower costing borrowings replaced those that matured during the year. The decrease in our yield on interest-earning assets during 2010 was primarily due to a decrease in our average interest rate on investment securities of 115 basis points that more than offset both a 6 basis points increase in the loan average interest rate.
Net interest income totaled $23.2 million in 2009, up $2.1 million or 9.8% from 2008. The increase reflected a $36.8 million or 5.2% increase in average interest-earning assets to $743.6 million and an increase of 13 basis points in the net interest margin to 3.12% in 2009. The increase in 2009 from a year ago primarily reflected the average costs on interest-bearing liabilities decreasing more rapidly than the average yield on interest-earning assets. The slower decline in interest-earning assets was primarily due to interest rate floors we have on our adjustable rate loans, which allowed only a 16 basis point decrease in yield. In contrast, our cost of funds declined 94 basis points, primarily due to a decrease in market interest rates that lowered our deposit rates by 113 basis points. The lower yield on our interest-earning assets was also unfavorably impacted by a lower yield on our investment securities of 141 basis points. This decline was primarily due to our decision to reduce the credit risk exposure in the securities portfolio by selling private label securities with higher credit risk and replacing them with lower yielding, lower credit risk GSE securities. These GSE securities also enhanced our regulatory capital as they have a lower asset risk weighting than the private label securities.
The following table presents for the periods indicated the average dollar amounts from selected balance sheet categories calculated from daily average balances and the total dollar amount, including adjustments to yields and costs, of:
|
·
|
Interest income earned from average interest-earning assets and the resultant yields; and
|
|
·
|
Interest expense incurred from average interest-bearing liabilities and resultant costs, expressed as rates.
|
The table also sets forth our net interest income, net interest rate spread and net interest rate margin for the periods indicated. The net interest rate spread represents the difference between the yield on interest-earning assets and the cost of interest-bearing liabilities. The net interest rate margin reflects the relative level of interest-earning assets to interest-bearing liabilities and equals our net interest rate spread divided by average interest-earning assets for the year.
|
For the Year Ended December 31,
|
||||||||||||||||||||||||||||||||||||
|
2010
|
2009
|
2008
|
||||||||||||||||||||||||||||||||||
|
Average
|
Average
|
Average
|
Average
|
Average
|
Average
|
|||||||||||||||||||||||||||||||
|
Balance
|
Interest
|
Yield/Cost
|
Balance
|
Interest
|
Yield/Cost
|
Balance
|
Interest
|
Yield/Cost
|
||||||||||||||||||||||||||||
|
(dollars in thousands)
|
||||||||||||||||||||||||||||||||||||
|
Assets
|
||||||||||||||||||||||||||||||||||||
|
Interest-earning assets:
|
||||||||||||||||||||||||||||||||||||
|
Cash and cash equivalents
|
$ | 53,322 | $ | 120 | 0.23 | % | $ | 52,544 | $ | 122 | 0.23 | % | $ | 7,288 | $ | 34 | 0.47 | % | ||||||||||||||||||
|
Federal funds sold
|
29 | - | 0.00 | % | 3,000 | 8 | 0.27 | % | 1,081 | 22 | 2.04 | % | ||||||||||||||||||||||||
|
Investment securities
|
157,782 | 4,474 | 2.84 | % | 93,606 | 3,739 | 3.99 | % | 80,906 | 4,365 | 5.40 | % | ||||||||||||||||||||||||
|
Loans receivable, net (1)
|
543,567 | 36,509 | 6.72 | % | 594,483 | 39,570 | 6.66 | % | 617,569 | 42,101 | 6.82 | % | ||||||||||||||||||||||||
|
Total interest-earning assets
|
754,700 | 41,103 | 5.45 | % | 743,633 | 43,439 | 5.84 | % | 706,844 | 46,522 | 6.58 | % | ||||||||||||||||||||||||
|
Noninterest-earning assets
|
41,349 | 36,146 | 32,612 | |||||||||||||||||||||||||||||||||
|
Total assets
|
$ | 796,049 | $ | 779,779 | $ | 739,456 | ||||||||||||||||||||||||||||||
|
Liabilities and Equity
|
||||||||||||||||||||||||||||||||||||
|
Interest-bearing liabilities:
|
||||||||||||||||||||||||||||||||||||
|
Transaction accounts
|
$ | 232,567 | 1,710 | 0.74 | % | $ | 130,594 | 1,429 | 1.09 | % | $ | 96,917 | 1,448 | 1.49 | % | |||||||||||||||||||||
|
Retail certificates of deposit
|
400,556 | 7,871 | 1.97 | % | 405,886 | 11,310 | 2.79 | % | 281,397 | 11,936 | 4.24 | % | ||||||||||||||||||||||||
|
Wholesale/brokered certificates of deposit
|
2,699 | 30 | 1.11 | % | 10,632 | 309 | 2.91 | % | 33,205 | 1,069 | 3.22 | % | ||||||||||||||||||||||||
|
Total interest-bearing deposits
|
635,822 | 9,611 | 1.51 | % | 547,112 | 13,048 | 2.38 | % | 411,519 | 14,453 | 3.51 | % | ||||||||||||||||||||||||
|
FHLB advances and other borrowings
|
66,678 | 2,741 | 4.11 | % | 156,153 | 6,839 | 4.38 | % | 251,281 | 10,302 | 4.10 | % | ||||||||||||||||||||||||
|
Subordinated debentures
|
10,310 | 314 | 3.05 | % | 10,310 | 368 | 3.57 | % | 10,310 | 649 | 6.29 | % | ||||||||||||||||||||||||
|
Total borrowings
|
76,988 | 3,055 | 3.97 | % | 166,463 | 7,207 | 4.33 | % | 261,591 | 10,951 | 4.19 | % | ||||||||||||||||||||||||
|
Total interest-bearing liabilities
|
712,810 | 12,666 | 1.78 | % | 713,575 | 20,255 | 2.84 | % | 673,110 | 25,404 | 3.77 | % | ||||||||||||||||||||||||
|
Noninterest-bearing liabilities
|
7,208 | 5,887 | 7,495 | |||||||||||||||||||||||||||||||||
|
Total liabilities
|
720,018 | 719,462 | 680,606 | |||||||||||||||||||||||||||||||||
|
Stockholders' equity
|
76,031 | 60,317 | 58,850 | |||||||||||||||||||||||||||||||||
|
Total liabilities and equity
|
$ | 796,049 | $ | 779,779 | $ | 739,456 | ||||||||||||||||||||||||||||||
|
Net interest income
|
$ | 28,437 | $ | 23,184 | $ | 21,118 | ||||||||||||||||||||||||||||||
|
Net interest rate spread
|
3.67 | % | 3.00 | % | 2.81 | % | ||||||||||||||||||||||||||||||
|
Net interest margin
|
3.77 | % | 3.12 | % | 2.99 | % | ||||||||||||||||||||||||||||||
|
Ratio of interest-earning assets to interest-bearing liabilities
|
105.88 | % | 104.21 | % | 105.01 | % | ||||||||||||||||||||||||||||||
|
(1)
|
Average balance includes loans held for sale and nonperforming loans and is net of deferred loan origination fees, unamortized discounts and premiums, and allowance for loan losses.
|
Changes in our net interest income are a function of changes in both volumes and rates of interest-earning assets and interest-bearing liabilities. The following table presents the impact the volume and rate changes have had on our net interest income for the years indicated. For each category of interest-earning assets and interest-bearing liabilities, we have provided information on changes to our net interest income with respect to:
|
·
|
Changes in volume (changes in volume multiplied by prior rate);
|
|
·
|
Changes in interest rates (changes in interest rates multiplied by prior volume); and
|
|
·
|
The net change or the combined impact of volume and rate changes allocated proportionately to changes in volume and changes in interest rates.
|
|
Year Ended December 31, 2010
|
Year Ended December 31, 2009
|
|||||||||||||||||||||||
|
Compared to
|
Compared to
|
|||||||||||||||||||||||
|
Year Ended December 31, 2009
|
Year Ended December 31, 2008
|
|||||||||||||||||||||||
|
Increase (decrease) due to
|
Increase (decrease) due to
|
|||||||||||||||||||||||
|
Average
|
Average
|
Average
|
Average
|
|||||||||||||||||||||
|
Rate
|
Volume
|
Net
|
Rate
|
Volume
|
Net
|
|||||||||||||||||||
|
(in thousands)
|
||||||||||||||||||||||||
|
Interest-earning assets
|
||||||||||||||||||||||||
|
Cash and cash equivalents
|
$ | (4 | ) | $ | 2 | $ | (2 | ) | $ | (25 | ) | $ | 113 | $ | 88 | |||||||||
|
Federal funds sold
|
(4 | ) | (4 | ) | (8 | ) | (30 | ) | 16 | (14 | ) | |||||||||||||
|
Investment securities
|
(1,307 | ) | 2,042 | 735 | (1,244 | ) | 618 | (626 | ) | |||||||||||||||
|
Loans receivable, net
|
354 | (3,415 | ) | (3,061 | ) | (976 | ) | (1,555 | ) | (2,531 | ) | |||||||||||||
|
Total interest-earning assets
|
(961 | ) | (1,375 | ) | (2,336 | ) | (2,275 | ) | (808 | ) | (3,083 | ) | ||||||||||||
|
Interest-bearing liabilities
|
||||||||||||||||||||||||
|
Transaction accounts
|
(578 | ) | 859 | 281 | (446 | ) | 427 | (19 | ) | |||||||||||||||
|
Retail certificates of deposit
|
(3,291 | ) | (147 | ) | (3,438 | ) | (4,895 | ) | 4,268 | (627 | ) | |||||||||||||
|
Wholesale/brokered certificates of deposit
|
(126 | ) | (153 | ) | (279 | ) | (94 | ) | (665 | ) | (759 | ) | ||||||||||||
|
FHLB advances and other borrowings
|
(398 | ) | (3,700 | ) | (4,098 | ) | 663 | (4,127 | ) | (3,464 | ) | |||||||||||||
|
Subordinated debentures
|
(54 | ) | - | (54 | ) | (281 | ) | - | (281 | ) | ||||||||||||||
|
Total interest-bearing liabilities
|
(4,447 | ) | (3,141 | ) | (7,588 | ) | (5,053 | ) | (97 | ) | (5,150 | ) | ||||||||||||
|
Changes in net interest income
|
$ | 3,486 | $ | 1,766 | $ | 5,252 | $ | 2,778 | $ | (711 | ) | $ | 2,067 | |||||||||||
Provision for Loan Losses. During 2010, the provision for loan losses totaled $2.1 million, down from $7.7 million in 2009. Net loan charge-offs amounted to $2.1 million in 2010, down from $4.7 million in 2009. Although weakness in the California economy continues, our recent charge-off history and strong credit quality metrics within our loan portfolio were significant determinates in estimating the adequacy of our allowance for loan losses during 2010 and our ultimate determination to record a lower provision in 2010 versus 2009. The loan charge offs we experienced are in response to the uncertainty and sluggish economic conditions in our primary markets as well as constraints on the financial markets in which we lend. These conditions continue to adversely affect our borrowers and their businesses and, consequently, the collateral securing our loans.
During 2009, the provision for loan losses increased $5.5 million from $2.2 million in 2008 primarily due to the weakness in the California economy and our charge-off history we have experienced, which were the dominating factors in determining our provision and the adequacy of our allowance for loan losses during 2009. Net loan charge-offs increased $3.7 million in 2009 from $966,000 in 2008 also in response to the uncertainty and recessionary conditions in our primary markets as well as constraints on the financial markets in which we lend.
Noninterest Income (Loss). For 2010, our noninterest loss totaled $1.1 million, compared with noninterest income of $697,000 in 2009. The unfavorable change was primarily related to higher losses on the sales of loans of $3.0 million, partially offset by an improvement in OTTI charges of $943,000 and higher gains on sales of investment securities available for sale of $333,000 in 2010. The losses on sales of loans in 2010 were essentially all from the sale of $14.6 million of sub-performing and nonperforming loans included in loan sales. The OTTI charges in 2010 of $1.1 million and 2009 of $2.0 million were all on private label securities received by the Company when it redeemed its shares in two mutual funds in 2008.
Noninterest income was $0.7 million for the year ended December 31, 2009, compared to a loss of $2.2 million for the year ended December 31, 2008. The favorable change between years of $2.9 million was primarily due to a lower loss on the sale of investments of $3.5 million, mostly associated with a loss of $3.6 million from the sale of mutual fund investment securities in 2008, partially offset by lower loan servicing fees of $0.5 million and an unfavorable change in losses on the sales of loans of $443,000 in 2009.
Noninterest Expense. For 2010, noninterest expense totaled $18.9 million, up $2.3 million or 13.5% from 2009. The increase was due primarily to an increase in OREO operations costs of $998,000 from higher losses on sales of $489,000 and writedowns of $380,000; an increase in compensation and benefits costs of $436,000, primarily from annual incentive costs and an increase in employee count; an increase in legal and audit fees of $337,000, primarily from loan workouts; an increase in office and postage expenses of $235,000; and an increase in data processing and communication costs of $173,000.
Noninterest expense for 2009 was $16.7 million, compared to $16.0 million for 2008. The $0.7 million or 4.5% increase in noninterest expense was principally due to increases in FDIC insurance premiums of $1.1 million and higher expenses for other real estate owned of $259,000, which was partially offset by decreases in compensation and benefits of $0.9 million and marketing expenses of $117,000. The decrease in compensation and benefits during 2009 is attributable primarily to staff reductions related to the Company’s overall lower loan production levels in 2009.
Income Taxes. The Company recorded income taxes of $2.1 million in 2010, compared with a benefit for income taxes of $87,000 in 2009 and income taxes of $33,000 in 2008. The Company had income before income taxes of $6.3 million in 2010, compared with a loss before income taxes of $547,000 in 2009 and income before income taxes of $741,000 in 2008.
Financial Condition
At December 31, 2010, total assets of the Company were $826.8 million, up $19.5 million or 2.4% from total assets of $807.3 million at December 31, 2009. The increase was primarily due to increases in investment securities of $31.7 million and cash and cash equivalents of $3.8 million, partially offset by a decrease in loans held for investment of $11.1 million and OREO of $3.3 million.
At December 31, 2010, total liabilities of the Company were $748.2 million, compared with $733.8 million at December 31, 2009. The $14.4 million, or 2.0%, increase during 2010 was due to an increase in deposits of $40.5 million to $659.2 million, partially offset by a decrease in borrowings of $23.0 million to $78.8 million and accrued expenses and other liabilities of $3.1 million.
At December 31, 2010, our stockholders’ equity amounted to $78.6 million, compared with $73.5 million at December 31, 2009. The increase of $5.1 million or 6.9% in stockholders’ equity is primarily due to net income in 2010 of $4.2 million and a decrease in accumulated other comprehensive loss of $827,000 due to the increase in value of our investment securities available for sale at December 31, 2010 from December 31, 2009.
Liquidity
Our primary sources of funds are principal and interest payments on loans, deposits, FHLB advances and other borrowings. While maturities and scheduled amortization of loans are a predictable source of funds, deposit flows and loan prepayments are greatly influenced by general interest rates, economic conditions and competition. We seek to maintain a level of liquid assets to ensure a safe and sound operation. Our liquid assets are comprised of cash and unpledged investments. At December 31, 2010, our liquidity ratio was 32.04%, compared with 23.39% at December 31, 2009 and 8.52% at December 31, 2008. The liquidity ratio is calculated by dividing the sum of cash balances plus unpledged securities by the sum of deposits that mature in one year or less plus transaction accounts and FHLB advances. Our liquidity is monitored daily.
We believe our level of liquid assets is sufficient to meet current and anticipated funding needs. At December 31, 2010, liquid assets of the Company represented approximately 21.6% of total assets, compared to 16.9% at December 31, 2009 and 8.5% at December 31, 2008. At December 31, 2010, the Company had six unsecured lines of credit with other correspondent banks to purchase federal funds totaling $44.0 million and access through the Federal Reserve Board discount window to borrow $4.8 million, as business needs dictate. We also have a line of credit with the FHLB allowing us to borrow up to 45% of the Bank’s total assets. At December 31, 2010, we had a borrowing capacity of $227.7 million, based on collateral pledged at the FHLB, of which $40.0 million was outstanding. The FHLB advance line is collateralized by eligible loan collateral and FHLB stock. At December 31, 2010, we had approximately $411.3 million of loans pledged to secure FHLB borrowings.
At December 31, 2010 we had outstanding commitments to originate or purchase loans for $1.8 million and at December 31, 2009 we had no outstanding commitments to originate or purchase loans.
At December 31, 2010, the Company’s loan to deposit and borrowing ratio was 76.5%, compared with 79.9% at December 31, 2009. The decline in the ratio from year-end 2009 to 2010 was primarily associated with decreasing loan balance and higher deposit balances that more than offset a decline in borrowing balances. Certificates of deposit, which are scheduled to mature in one year or less from December 31, 2010, totaled $236.0 million. We expect to retain a substantial portion of the maturing certificates of deposit at maturity.
The Company has a policy in place that permits the purchase of brokered funds, in an amount not to exceed 5% of total deposits, as a secondary source for funding. At December 31, 2010, the balance of brokered time deposits was approximately $1.9 million, compared with $3.3 million at December 31, 2009.
The Corporation is a company separate and apart from the Bank that must provide for its own liquidity. The Corporation’s primary sources of liquidity are dividends from the Bank. There are statutory and regulatory provisions that limit the ability of the Bank to pay dividends to the Corporation. Management believes that such restrictions will not have a material impact on the ability of the Corporation to meet its ongoing cash obligations.
The Financial Code provides that a bank may not make a cash distribution to its shareholders in excess of the lesser of a (a) bank’s retained earnings; or (b) bank’s net income for its last three fiscal years, less the amount of any distributions made by the bank or by any majority-owned subsidiary of the bank to the shareholders of the bank during such period. However, a bank may, with the approval of the DFI, make a distribution to its shareholders in an amount not exceeding the greatest of (x) its retained earnings; (y) its net income for its last fiscal year; or (z) its net income for its current fiscal year. In the event that the DFI determines that the shareholders’ equity of a bank is inadequate or that the making of a distribution by the bank would be unsafe or unsound, the DFI may order the bank to refrain from making a proposed distribution. Under these provisions, the amount available for distribution from the Bank to the Corporation was approximately $3.5 million at December 31, 2010.
Capital Resources
The Company and the Bank are subject to various regulatory capital requirements administered by federal banking agencies. Failure to meet minimum capital requirements can trigger certain mandatory and possibly additional discretionary actions by regulators that, if undertaken, could have a direct material effect on our financial condition and results of operations. Under capital adequacy guidelines and the regulatory framework for prompt corrective action, the Bank must meet specific capital guidelines that involve quantitative measures of the Bank’s assets, liabilities and certain off-balance sheet items as calculated under regulatory accounting practices. The Bank’s capital amounts and classification are also subject to qualitative judgments by the regulators about components, risk weightings and other factors.
In the fourth quarter of 2009, the Company raised gross proceeds of $15.5 million in capital by issuing 5,030,385 shares of its common stock at a public offering price of $3.25 per share. The Company injected $14.0 million of the proceeds from the offering into the Bank, which enhanced the Bank’s regulatory capital ratios. At December 31, 2010, the Bank’s leverage capital amounted to $82.8 million and risk-based capital amounted to $90.2 million. At December 31, 2009, the Bank’s leverage capital was $78.5 million and risk-based capital was $85.9 million. Pursuant to regulatory guidelines under prompt corrective action rules, a bank must have total risk-based capital of 10.00% or greater, Tier 1 risk-based capital of 6.00% or greater and Tier I capital to adjusted tangible assets of 5.00% or greater to be considered ‘‘well capitalized.’’ At December 31, 2010, the Bank’s total risk-based capital ratio was 15.28%, Tier 1 risk-based capital ratio was 14.03% and Tier I capital ratio was 10.29%.
Contractual Obligations and Commitments
The Company enters into contractual obligations in the normal course of business as a source of funds for its asset growth and to meet required capital needs. The following schedule summarizes maturities and payments due on our obligations and commitments, excluding accrued interest, at the date indicated:
|
At December 31, 2010
|
||||||||||||||||||||
|
Less than
|
1 - 3 | 3 - 5 |
More than
|
|||||||||||||||||
|
1 year
|
years
|
years
|
5 years
|
Total
|
||||||||||||||||
|
(in thousands)
|
||||||||||||||||||||
|
Contractual Obligations
|
||||||||||||||||||||
|
FHLB advances
|
$ | 20,000 | $ | 20,000 | $ | - | $ | - | $ | 40,000 | ||||||||||
|
Other borrowings
|
- | - | - | 28,500 | 28,500 | |||||||||||||||
|
Subordinated debentures
|
- | - | - | 10,310 | 10,310 | |||||||||||||||
|
Certificates of deposit
|
236,795 | 159,898 | 11,716 | 573 | 408,982 | |||||||||||||||
|
Operating leases
|
663 | 1,182 | 1,185 | 2,708 | 5,738 | |||||||||||||||
|
Total contractual cash obligations
|
$ | 257,458 | $ | 181,080 | $ | 12,901 | $ | 42,091 | $ | 493,530 | ||||||||||
Off-Balance Sheet Arrangements
The following table summarizes our contractual commitments with off-balance sheet risk by expiration period at the date indicated:
|
At December 31, 2010
|
||||||||||||||||||||
|
Less than
|
1 - 3 | 3 - 5 |
More than
|
|||||||||||||||||
|
1 year
|
years
|
years
|
5 years
|
Total
|
||||||||||||||||
|
(in thousands)
|
||||||||||||||||||||
|
Other unused commitments:
|
||||||||||||||||||||
|
Home equity lines of credit
|
$ | - | $ | - | $ | - | $ | 3,185 | $ | 3,185 | ||||||||||
|
Commercial lines of credit
|
21,241 | 315 | - | 8,870 | 30,426 | |||||||||||||||
|
Other lines of credit
|
77 | - | - | 10 | 87 | |||||||||||||||
|
Standby letters of credit
|
1,008 | - | - | - | 1,008 | |||||||||||||||
|
Total commitments
|
$ | 22,326 | $ | 315 | $ | - | $ | 12,065 | $ | 34,706 | ||||||||||
Impact of Inflation and Changing Prices
Our consolidated financial statements and related data presented in this annual report on Form 10-K have been prepared in accordance with accounting principles generally accepted in the United States which require the measurement of financial position and operating results in terms of historical dollar amounts (except with respect to securities classified as available for sale which are carried at market value) without considering the changes in the relative purchasing power of money over time due to inflation. The impact of inflation is reflected in the increased cost of our operations. Unlike most industrial companies, substantially all of our assets and liabilities are monetary in nature. As a result, interest rates have a greater impact on our performance than do the effects of general levels of inflation. Interest rates do not necessarily move in the same direction or to the same magnitude as the price of goods and services.
Impact of New Accounting Standards
See Note 1 to the Consolidated Financial Statements included in Item 8 hereof for a listing of recently issued accounting pronouncements and the impact of them on the Company.
Asset/Liability Management and Market Risk
Market risk is the risk of loss or reduced earnings from adverse changes in market prices and interest rates. Our market risk arises primarily from interest rate risk in our lending and deposit taking activities. Interest rate risk primarily occurs to the degree that our interest-bearing liabilities reprice or mature on a different basis and frequency than our interest-earning assets. Since our earnings depend primarily on our net interest income, which is the difference between the interest and dividends earned on interest-earning assets and the interest paid on interest-bearing liabilities, our principal objectives are to actively monitor and manage the effects of adverse changes in interest rates on net interest income.
In addition to the interest rate risk associated with our lending for investment and deposit-taking activities, we also have market risk associated with loans held for sale. Changes in interest rates, primarily fixed rate loans, impact the fair value of loans held for sale. Rising interest rates typically result in a decrease in loan market value while declining interest rates typically result in an increase in loan market value.
Our Asset/Liability Committee is responsible for implementing the Bank’s interest rate risk management policy which sets forth limits established by the board of directors of acceptable changes in net interest income and economic value of equity (“EVE”) from specified changes in interest rates. Our Asset/Liability Committee reviews, among other items, economic conditions, the interest rate outlook, the demand for loans, the availability of deposits and borrowings, and our current operating results, liquidity, capital and interest rate exposure. Based on these reviews, our Asset/Liability Committee formulates a strategy that is intended to implement the objectives set forth in our business plan without exceeding the net interest income and EVE limits set forth in our guidelines approved by our board of directors.
Interest Rate Risk Management. The principal objective of the Company’s interest rate risk management function is to evaluate the interest rate risk included in certain balance sheet accounts, determine the level of appropriate risk and manage the risk consistent with prudent asset and liability concentration guidelines approved by our board of directors. We monitor asset and liability maturities and repricing characteristics on a regular basis and review various simulations and other analyses to determine the potential impact of various business strategies in controlling the Company’s interest rate risk and the potential impact of those strategies upon future earnings under various interest rate scenarios. Our primary strategy in managing interest rate risk is to emphasize the origination for investment of adjustable rate loans or loans with relatively short maturities. Interest rates on adjustable rate loans are primarily tied to 3-month or 6-month London Inter-Bank Offered Rate ("LIBOR") index, 12-month moving average of yields on actively traded U.S. Treasury securities adjusted to a constant maturity of one year ("MTA") index and the Wall Street Journal Prime Rate (“Prime”) index. Also as part of this strategy, we seek to lengthen our deposit maturities when deposit rates are considered in the lower end of the interest rate cycle and shorten our deposit maturities when deposit rates are considered in the higher end of the interest rate cycle.
Management monitors its interest rate risk as such risk relates to its operational strategies. The Company’s board of directors reviews on a quarterly basis the Company’s asset/liability position, including simulations of the effect on the Bank’s capital in various interest rate scenarios. The extent of the movement of interest rates, higher or lower, is an uncertainty that could have a negative impact on the earnings of the Company. If interest rates rise we may be subject to interest rate spread compression, which would adversely impact our net interest income. This is primarily due to the lag in repricing of the indices, to which our adjustable rate loans and mortgage-backed securities are tied, as well as the repricing frequencies and interest rate caps and floors on these adjustable rate loans and mortgage-backed securities. The extent of the interest rate spread compression depends, among other things, upon the frequency and severity of such interest rate fluctuations.
Economic Value of Equity. The Company’s interest rate sensitivity is monitored by management through the use of a model that estimates the change in the Company’s EVE under alternative interest rate scenarios, primarily parallel, instantaneous and sustained movements in interest rates in 100 basis point increments. The model computes the net present value of capital by discounting all expected cash flows from assets, liabilities and off-balance sheet contracts under each rate scenario. First, we estimate our net interest income for the next twelve months and the current EVE assuming no change in interest rates from those at period end. Once this "base-case" has been estimated, we make calculations for each of the defined changes in interest rates and include any anticipated differences in the prepayment speeds of loans. We then compare those results against the base case to determine the estimated change to net interest income and EVE due to the changes in interest rates. An EVE ratio is defined as the EVE divided by the market value of assets within the same scenario. The sensitivity measure is the largest decline in the EVE ratio, measured in basis points, caused by an increase or decrease in rates, and the higher an institution’s sensitivity measure, the greater exposure it has to interest rate risk.
The following table shows the EVE and projected change in the EVE of the Company at December 31, 2010, assuming an instantaneous and sustained change in market interest rates of 100, 200, and 300 basis points ("BP"):
|
As of December 31, 2010
|
||||||||||||||||||||
|
(dollars in thousands)
|
||||||||||||||||||||
|
EVE as % of Portfolio
|
||||||||||||||||||||
|
Economic Value of Equity
|
Value of Assets
|
|||||||||||||||||||
|
Change in Rates
|
$ Amount
|
$ Change
|
% Change
|
EVE Ratio
|
% Change (BP)
|
|||||||||||||||
|
+300 BP
|
$ | 91,220 | $ | (52,356 | ) | (36.5 | )% | 11.43 | % |
-502 BP
|
||||||||||
|
+200 BP
|
110,417 | (33,159 | ) | (23.1 | )% | 13.42 | % |
-303 BP
|
||||||||||||
|
+100 BP
|
126,161 | (17,415 | ) | (12.1 | )% | 14.90 | % |
-155 BP
|
||||||||||||
|
Static
|
143,576 | -- | -- | 16.45 | % | -- | ||||||||||||||
|
-100 BP
|
149,853 | 6,277 | 4.4 | % | 16.94 | % |
49 BP
|
|||||||||||||
|
-200 BP
|
144,769 | 1,193 | 0.8 | % | 16.32 | % |
-13 BP
|
|||||||||||||
|
-300 BP
|
138,616 | (4,960 | ) | (3.5 | )% | 15.61 | % |
-84 BP
|
||||||||||||
Certain shortcomings are inherent in the methodology used in the above interest rate risk measurements. Modeling changes in EVE requires numerous assumptions that may tend to oversimplify the manner in which actual yields and costs respond to changes in market interest rates. First, the models assume that the composition of the Company’s interest sensitive assets and liabilities existing at the beginning of a period remains constant over the period being measured. Second, the models assume that a particular change in interest rates is reflected uniformly across the yield curve regardless of the duration to maturity or repricing of specific assets and liabilities. Third, the model does not take into account the impact of the Company’s business or strategic plans on the structure of interest-earning assets and interest-bearing liabilities. Although the EVE measurement provides an indication of the Company’s interest rate risk exposure at a particular point in time, such measurement is not intended to provide a precise forecast of the effect of changes in market interest rates on the Company’s net interest income and will differ from actual results.
Selected Assets and Liabilities which are Interest Rate Sensitive. The following table provides information regarding the Company’s primary categories of assets and liabilities that are sensitive to changes in interest rates for the year ended December 31, 2010. The information presented reflects the expected cash flows of the primary categories by year, including the related weighted average interest rate. The cash flows for loans are based on maturity and re-pricing date. The loans and MBSs that have adjustable rate features are presented in accordance with their next interest-repricing date. Cash flow information on interest-bearing liabilities, such as passbooks, NOW accounts and money market accounts is also adjusted for expected decay rates, which are based on historical information. In addition, for purposes of cash flow presentation, premiums or discounts on purchased assets and mark-to-market adjustments are excluded from the amounts presented. All certificates of deposit and borrowings are presented by maturity date. The weighted average interest rates for the various assets and liabilities presented are based on the actual rates that existed at December 31, 2010. The degree of market risk inherent in loans with prepayment features may not be completely reflected in the disclosures. Although we have taken into consideration historical prepayment trends adjusted for current market conditions to determine expected maturity categories, changes in prepayment behavior can be triggered by changes in many variables, including market rates of interest. Unexpected changes in these variables may increase or decrease the rate of prepayments from those anticipated. As such, the potential loss from such market rate changes may be significantly larger.
|
At December 31, 2010
|
||||||||||||||||||||||||||||
|
Maturities and Repricing
|
||||||||||||||||||||||||||||
|
2011
|
2012
|
2013
|
2014
|
2015
|
Total
|
|||||||||||||||||||||||
|
Year 1
|
Year 2
|
Year 3
|
Year 4
|
Year 5
|
Thereafter
|
Balance
|
||||||||||||||||||||||
|
(dollars in thousands)
|
||||||||||||||||||||||||||||
|
Selected Assets
|
||||||||||||||||||||||||||||
|
Investments and federal funds, other than MBS
|
$ | 13,362 | $ | - | $ | 79 | $ | - | $ | - | $ | 19,839 | $ | 33,280 | ||||||||||||||
|
Weighted average interest rate
|
0.91 | % | 0.00 | % | 3.53 | % | 0.00 | % | 0.00 | % | 4.08 | % | 2.81 | % | ||||||||||||||
|
Mortgage - backed securities
|
||||||||||||||||||||||||||||
|
Fixed rate
|
$ | - | $ | - | $ | - | $ | - | $ | 37 | $ | 56,721 | $ | 56,758 | ||||||||||||||
|
Weighted average interest rate
|
0.00 | % | 0.00 | % | 0.00 | % | 0.00 | % | 6.06 | % | 3.31 | % | 3.31 | % | ||||||||||||||
|
Mortgage - backed securities
|
||||||||||||||||||||||||||||
|
Adjustable rate
|
$ | 10,413 | $ | - | $ | - | $ | - | $ | 58,698 | $ | 9,308 | $ | 78,419 | ||||||||||||||
|
Weighted average interest rate
|
3.45 | % | 0.00 | % | 0.00 | % | 0.00 | % | 2.47 | % | 3.31 | % | 2.70 | % | ||||||||||||||
|
Loans - fixed rate
|
$ | 1,569 | $ | 2,696 | $ | 4,227 | $ | 1,865 | $ | 5,448 | $ | 71,275 | $ | 87,080 | ||||||||||||||
|
Weighted average interest rate
|
0.65 | % | 7.25 | % | 7.49 | % | 8.03 | % | 6.77 | % | 6.50 | % | 6.51 | % | ||||||||||||||
|
Loans - adjustable rate
|
$ | 293,454 | $ | 75,931 | $ | 48,914 | $ | 16,756 | $ | 9,525 | $ | 35,984 | $ | 480,564 | ||||||||||||||
|
Weighted average interest rate
|
6.20 | % | 6.72 | % | 6.52 | % | 6.59 | % | 6.33 | % | 6.45 | % | 6.35 | % | ||||||||||||||
|
Total interest-sensitive assets
|
$ | 318,798 | $ | 78,627 | $ | 53,220 | $ | 18,621 | $ | 73,708 | $ | 193,127 | $ | 736,101 | ||||||||||||||
|
Weighted average interest rate
|
5.86 | % | 6.74 | % | 6.59 | % | 6.74 | % | 3.29 | % | 5.15 | % | 5.58 | % | ||||||||||||||
|
Selected Liabilities
|
||||||||||||||||||||||||||||
|
Interest-bearing transaction accounts
|
$ | 250,258 | $ | - | $ | - | $ | - | $ | - | $ | - | $ | 250,258 | ||||||||||||||
|
Weighted average interest rate
|
0.72 | % | 0.00 | % | 0.00 | % | 0.00 | % | 0.00 | % | 0.00 | % | 0.72 | % | ||||||||||||||
|
Certificates of deposit
|
$ | 236,795 | $ | 157,753 | $ | 2,145 | $ | 676 | $ | 11,040 | $ | 573 | $ | 408,982 | ||||||||||||||
|
Weighted average interest rate
|
1.77 | % | 1.80 | % | 2.75 | % | 2.39 | % | 2.94 | % | 3.96 | % | 1.82 | % | ||||||||||||||
|
FHLB advances
|
$ | 20,000 | $ | 20,000 | $ | - | $ | - | $ | - | $ | - | $ | 40,000 | ||||||||||||||
|
Weighted average interest rate
|
0.27 | % | 0.95 | % | 0.00 | % | 0.00 | % | 0.00 | % | 0.00 | % | 0.61 | % | ||||||||||||||
|
Other borrowings and subordinated debentures
|
$ | 28,500 | $ | - | $ | - | $ | - | $ | - | $ | 10,310 | $ | 38,810 | ||||||||||||||
|
Weighted average interest rate
|
3.04 | % | 0.00 | % | 0.00 | % | 0.00 | % | 0.00 | % | 3.04 | % | 3.04 | % | ||||||||||||||
|
Total interest-sensitive liabilities
|
$ | 535,553 | $ | 177,753 | $ | 2,145 | $ | 676 | $ | 11,040 | $ | 10,883 | $ | 738,050 | ||||||||||||||
|
Weighted average interest rate
|
1.29 | % | 1.70 | % | 2.75 | % | 2.39 | % | 2.94 | % | 3.09 | % | 1.45 | % | ||||||||||||||
The Company does not have any direct market risk from foreign exchange or commodity exposures.
Report of Independent Registered Public Accounting Firm
Board of Directors and Stockholders
Pacific Premier Bancorp, Inc. and Subsidiaries
Costa Mesa, California
We have audited the accompanying consolidated statements of financial condition of Pacific Premier Bancorp, Inc. and Subsidiaries (the "Company") as of December 31, 2010 and 2009, and the related consolidated statements of operations, stockholders' equity and comprehensive income (loss), and cash flows for each of the three years in the period ended December 31, 2010. These consolidated financial statements are the responsibility of the Company's management. Our responsibility is to express an opinion on these consolidated financial statements based on our audits.
We conducted our audits in accordance with the standards of the Public Company Accounting Oversight Board (United States). Those standards require that we plan and perform the audits to obtain reasonable assurance about whether the consolidated financial statements are free of material misstatement. An audit includes examining, on a test basis, evidence supporting the amounts and disclosures in the consolidated financial statements. An audit also includes assessing the accounting principles used and significant estimates made by management, as well as, evaluating the overall financial statement presentation. We believe that our audits provide a reasonable basis for our opinion.
In our opinion, the consolidated financial statements referred to above present fairly, in all material respects, the financial position of the Company as of December 31, 2010 and 2009, and the results of its operations, changes in its stockholders' equity, and its cash flows for each of the three years in the period ended December 31, 2010 in conformity with accounting principles generally accepted in the United States of America.
/s/ Vavrinek, Trine, Day & Co., LLP
Rancho Cucamonga, California
March 30, 2011
|
PACIFIC PREMIER BANCORP, INC. AND SUBSIDIARIES
|
||||||||
|
CONSOLIDATED STATEMENTS OF FINANCIAL CONDITION
|
||||||||
|
(dollars in thousands, except share data)
|
||||||||
|
|
||||||||
|
At December 31,
|
||||||||
|
ASSETS
|
2010
|
2009
|
||||||
|
Cash and due from banks
|
$ | 63,433 | $ | 59,677 | ||||
|
Federal funds sold
|
29 | 29 | ||||||
|
Cash and cash equivalents
|
63,462 | 59,706 | ||||||
|
Investment securities available for sale
|
155,094 | 123,407 | ||||||
|
FHLB stock/Federal Reserve Bank stock, at cost
|
13,334 | 14,330 | ||||||
|
Loans held for investment
|
564,417 | 575,489 | ||||||
|
Allowance for loan losses
|
(8,879 | ) | (8,905 | ) | ||||
|
Loans held for investment, net
|
555,538 | 566,584 | ||||||
|
Accrued interest receivable
|
3,755 | 3,520 | ||||||
|
Other real estate owned
|
34 | 3,380 | ||||||
|
Premises and equipment
|
8,223 | 8,713 | ||||||
|
Deferred income taxes
|
11,103 | 11,465 | ||||||
|
Bank owned life insurance
|
12,454 | 11,926 | ||||||
|
Other assets
|
3,819 | 4,292 | ||||||
|
TOTAL ASSETS
|
$ | 826,816 | $ | 807,323 | ||||
|
LIABILITIES AND STOCKHOLDERS’ EQUITY
|
||||||||
|
LIABILITIES:
|
||||||||
|
Deposit accounts:
|
||||||||
|
Noninterest bearing
|
$ | 47,229 | $ | 33,885 | ||||
|
Interest bearing:
|
||||||||
|
Transaction accounts
|
203,029 | 161,872 | ||||||
|
Retail certificates of deposit
|
407,108 | 417,377 | ||||||
|
Wholesale/brokered certificates of deposit
|
1,874 | 5,600 | ||||||
|
Total deposits
|
659,240 | 618,734 | ||||||
|
FHLB advances and other borrowings
|
68,500 | 91,500 | ||||||
|
Subordinated debentures
|
10,310 | 10,310 | ||||||
|
Accrued expenses and other liabilities
|
10,164 | 13,277 | ||||||
|
TOTAL LIABILITIES
|
748,214 | 733,821 | ||||||
|
COMMITMENTS AND CONTINGENCIES (Note 11)
|
- | - | ||||||
|
STOCKHOLDERS’ EQUITY:
|
||||||||
|
Preferred stock, $.01 par value; 1,000,000 shares authorized; no shares outstanding
|
- | - | ||||||
|
Common stock, $.01 par value; 15,000,000 shares authorized; 10,033,836 shares at December 31, 2010 and December 31, 2009 issued and outstanding
|
100 | 100 | ||||||
|
Additional paid-in capital
|
79,942 | 79,907 | ||||||
|
Accumulated deficit
|
(526 | ) | (4,764 | ) | ||||
|
Accumulated other comprehensive loss, net of tax benefit of $639 at December 31, 2010, $1,217 at December 31, 2009
|
(914 | ) | (1,741 | ) | ||||
|
TOTAL STOCKHOLDERS’ EQUITY
|
78,602 | 73,502 | ||||||
|
TOTAL LIABILITIES AND STOCKHOLDERS’ EQUITY
|
$ | 826,816 | $ | 807,323 | ||||
See Notes to Consolidated Financial Statements.
|
PACIFIC PREMIER BANCORP, INC. AND SUBSIDIARIES
|
||||||||||||
|
CONSOLIDATED STATEMENTS OF OPERATIONS
|
||||||||||||
|
(dollars in thousands, except per share data)
|
||||||||||||
|
For the Years ended December 31,
|
||||||||||||
|
2010
|
2009
|
2008
|
||||||||||
|
INTEREST INCOME
|
||||||||||||
|
Loans
|
$ | 36,509 | $ | 39,570 | $ | 42,101 | ||||||
|
Investment securities and other interest-earning assets
|
4,594 | 3,869 | 4,421 | |||||||||
|
Total interest income
|
41,103 | 43,439 | 46,522 | |||||||||
|
INTEREST EXPENSE
|
||||||||||||
|
Interest-bearing deposits:
|
||||||||||||
|
Interest on transaction accounts
|
1,710 | 1,429 | 1,448 | |||||||||
|
Interest on certificates of deposit
|
7,901 | 11,618 | 13,005 | |||||||||
|
Total interest-bearing deposits
|
9,611 | 13,047 | 14,453 | |||||||||
|
FHLB advances and other borrowings
|
2,741 | 6,839 | 10,302 | |||||||||
|
Subordinated debentures
|
314 | 368 | 649 | |||||||||
|
Total interest expense
|
12,666 | 20,254 | 25,404 | |||||||||
|
NET INTEREST INCOME BEFORE PROVISION FOR LOAN LOSSES
|
28,437 | 23,185 | 21,118 | |||||||||
|
PROVISION FOR LOAN LOSSES
|
2,092 | 7,735 | 2,241 | |||||||||
|
NET INTEREST INCOME AFTER PROVISION FOR LOAN LOSSES
|
26,345 | 15,450 | 18,877 | |||||||||
|
NONINTEREST INCOME
|
||||||||||||
|
Loan servicing fees
|
400 | 486 | 989 | |||||||||
|
Deposit fees
|
817 | 851 | 601 | |||||||||
|
Net gain (loss) from sales of loans
|
(3,332 | ) | (351 | ) | 92 | |||||||
|
Net gain (loss) from sales of investment securities
|
1,020 | 687 | (3,586 | ) | ||||||||
|
Other-than-temporary impairment loss on investment securities, net
|
(1,087 | ) | (2,030 | ) | (1,300 | ) | ||||||
|
Other income
|
1,106 | 1,054 | 1,032 | |||||||||
|
Total noninterest income (loss)
|
(1,076 | ) | 697 | (2,172 | ) | |||||||
|
NONINTEREST EXPENSE
|
||||||||||||
|
Compensation and benefits
|
8,483 | 8,047 | 8,986 | |||||||||
|
Premises and occupancy
|
2,623 | 2,559 | 2,529 | |||||||||
|
Data processing and communications
|
806 | 633 | 570 | |||||||||
|
Other real estate owned operations, net
|
1,371 | 373 | 114 | |||||||||
|
FDIC insurance premiums
|
1,258 | 1,382 | 264 | |||||||||
|
Legal and audit
|
1,134 | 797 | 602 | |||||||||
|
Marketing expense
|
786 | 664 | 781 | |||||||||
|
Office and postage expense
|
530 | 295 | 344 | |||||||||
|
Other expense
|
1,957 | 1,944 | 1,774 | |||||||||
|
Total noninterest expense
|
18,948 | 16,694 | 15,964 | |||||||||
|
INCOME (LOSS) BEFORE INCOME TAX (BENEFIT)
|
6,321 | (547 | ) | 741 | ||||||||
|
INCOME TAX (BENEFIT)
|
2,083 | (87 | ) | 33 | ||||||||
|
NET INCOME (LOSS)
|
$ | 4,238 | $ | (460 | ) | $ | 708 | |||||
|
EARNINGS (LOSS) PER SHARE
|
||||||||||||
|
Basic
|
$ | 0.42 | $ | (0.08 | ) | $ | 0.14 | |||||
|
Diluted
|
$ | 0.38 | $ | (0.08 | ) | $ | 0.11 | |||||
|
WEIGHTED AVERAGE SHARES OUTSTANDING
|
||||||||||||
|
Basic
|
10,033,836 | 5,642,589 | 4,948,359 | |||||||||
|
Diluted
|
11,057,404 | 5,642,589 | 6,210,387 | |||||||||
See Notes to Consolidated Financial Statements.
|
PACIFIC PREMIER BANCORP, INC. AND SUBSIDIARIES
|
||||||||||||||||||||||||||||
|
CONSOLIDATED STATEMENT OF STOCKHOLDERS' EQUITY AND OTHER COMPREHENSIVE INCOME (LOSS)
|
||||||||||||||||||||||||||||
|
FOR THE THREE YEARS ENDED DECEMBER 31, 2010
|
||||||||||||||||||||||||||||
|
(dollars in thousands)
|
||||||||||||||||||||||||||||
|
Accumulated
|
||||||||||||||||||||||||||||
|
|
Additional
|
Other
|
Total
|
|||||||||||||||||||||||||
|
Common Stock
|
Paid-in
|
Accumulated
|
Comprehensive
|
Comprehensive
|
Stockholders’
|
|||||||||||||||||||||||
|
Shares
|
Amount
|
Capital
|
Deficit
|
Income (loss)
|
Income (Loss)
|
Equity
|
||||||||||||||||||||||
|
Balance at December 31, 2007
|
5,163,488 | $ | 52 | $ | 66,418 | $ | (5,012 | ) | $ | (708 | ) | $ | 60,750 | |||||||||||||||
|
Comprehensive income:
|
||||||||||||||||||||||||||||
|
Net income
|
708 | $ | 708 | 708 | ||||||||||||||||||||||||
|
Unrealized holding losses on securities arising during the period, net of tax
|
(3,389 | ) | ||||||||||||||||||||||||||
|
Reclassification adjustment for net loss on sales of securities included in net income, net of tax
|
1,221 | |||||||||||||||||||||||||||
|
Net unrealized loss on securities, net of tax
|
(2,168 | ) | (2,168 | ) | (2,168 | ) | ||||||||||||||||||||||
|
Total comprehensive loss
|
$ | (1,460 | ) | |||||||||||||||||||||||||
|
Share-based compensation expense
|
326 | 326 | ||||||||||||||||||||||||||
|
Restricted stock expense adjustment
|
6 | 6 | ||||||||||||||||||||||||||
|
Repurchase of common stock
|
(260,037 | ) | (3 | ) | (2,071 | ) | (2,074 | ) | ||||||||||||||||||||
|
Balance at December 31, 2008
|
4,903,451 | $ | 49 | $ | 64,679 | $ | (4,304 | ) | $ | (2,876 | ) | $ | 57,548 | |||||||||||||||
|
Comprehensive income:
|
||||||||||||||||||||||||||||
|
Net loss
|
(460 | ) | $ | (460 | ) | (460 | ) | |||||||||||||||||||||
|
Unrealized holding gains on securities arising during the period, net of tax
|
1,310 | |||||||||||||||||||||||||||
|
Reclassification adjustment for gain on sales of securities included in net income, net of tax
|
(175 | ) | ||||||||||||||||||||||||||
|
Net unrealized gain on securities, net of tax
|
1,135 | 1,135 | 1,135 | |||||||||||||||||||||||||
|
Total comprehensive income
|
$ | 675 | ||||||||||||||||||||||||||
|
Share-based compensation expense
|
271 | 271 | ||||||||||||||||||||||||||
|
Issuance of common stock, net of issuance costs
|
5,030,385 | 50 | 15,191 | 15,241 | ||||||||||||||||||||||||
|
Warrant exercise
|
200,000 | 2 | 148 | 150 | ||||||||||||||||||||||||
|
Repurchase of common stock
|
(100,000 | ) | (1 | ) | (382 | ) | (383 | ) | ||||||||||||||||||||
|
Balance at December 31, 2009
|
10,033,836 | $ | 100 | $ | 79,907 | $ | (4,764 | ) | $ | (1,741 | ) | $ | 73,502 | |||||||||||||||
|
Comprehensive income:
|
||||||||||||||||||||||||||||
|
Net income
|
4,238 | $ | 4,238 | 4,238 | ||||||||||||||||||||||||
|
Unrealized holding gains on securities arising during the period, net of tax
|
462 | |||||||||||||||||||||||||||
|
Reclassification adjustment for gain on sales of securities included in net income, net of tax
|
365 | |||||||||||||||||||||||||||
|
Net unrealized gain on securities, net of tax
|
827 | 827 | 827 | |||||||||||||||||||||||||
|
Total comprehensive income
|
$ | 5,065 | ||||||||||||||||||||||||||
|
Share-based compensation expense
|
86 | 86 | ||||||||||||||||||||||||||
|
Reclassification adjustment for Common Stock
|
(51 | ) | (51 | ) | ||||||||||||||||||||||||
|
Balance at December 31, 2010
|
10,033,836 | $ | 100 | $ | 79,942 | $ | (526 | ) | $ | (914 | ) | $ | 78,602 | |||||||||||||||
See Notes to Consolidated Financial Statements.
|
PACIFIC PREMIER BANCORP, INC. AND SUBSIDIARIES
|
||||||||||||
|
CONSOLIDATED STATEMENTS OF CASH FLOWS
|
||||||||||||
|
(dollars in thousands)
|
||||||||||||
|
For the Years ended December 31,
|
||||||||||||
|
2010
|
2009
|
2008
|
||||||||||
|
CASH FLOWS FROM OPERATING ACTIVITIES
|
||||||||||||
|
Net income (loss)
|
$ | 4,238 | $ | (460 | ) | $ | 708 | |||||
|
Adjustments to net income (loss):
|
||||||||||||
|
Depreciation and amortization expense
|
991 | 1,017 | 967 | |||||||||
|
Provision for loan losses
|
2,092 | 7,735 | 2,241 | |||||||||
|
Share-based compensation expense
|
86 | 271 | 326 | |||||||||
|
Loss (gain) on sale of other real estate owned
|
461 | (28 | ) | - | ||||||||
|
Write down of other real estate owned
|
698 | 319 | 57 | |||||||||
|
Loss on sale and disposal on premises and equipment
|
30 | 25 | 3 | |||||||||
|
Amortization of premium/discounts on securities available for sale, net
|
835 | 70 | (150 | ) | ||||||||
|
Gain on sale of loans held for sale
|
- | (7 | ) | (25 | ) | |||||||
|
Net loss (gain) from sales of investment securities available for sale
|
(1,020 | ) | (687 | ) | 3,586 | |||||||
|
Write down of investment securities available for sale
|
1,087 | 2,030 | 1,300 | |||||||||
|
Recoveries on loans and investment securities
|
272 | 100 | 208 | |||||||||
|
Purchase and origination of loans held for sale
|
- | - | (408 | ) | ||||||||
|
Proceeds from the sales of and principal payments from loans held for sale
|
- | 549 | 514 | |||||||||
|
Loss (gain) on sale of loans held for investment
|
3,332 | 351 | (92 | ) | ||||||||
|
Deferred income tax benefit
|
(216 | ) | (1,831 | ) | (2,234 | ) | ||||||
|
Change in accrued expenses and other liabilities, net
|
(3,113 | ) | (31 | ) | (2,590 | ) | ||||||
|
Federal Home Loan Bank stock dividend
|
- | - | (568 | ) | ||||||||
|
Income from bank owned life insurance
|
(528 | ) | (531 | ) | (526 | ) | ||||||
|
Change in accrued interest receivable and other assets, net
|
187 | (3,164 | ) | 332 | ||||||||
|
Net cash provided by operating activities
|
9,432 | 5,728 | 3,649 | |||||||||
|
CASH FLOW FROM INVESTING ACTIVITIES
|
||||||||||||
|
Proceeds from sale and principal payments on loans held for investment
|
88,628 | 54,818 | 156,393 | |||||||||
|
Net change in undisbursed loan funds
|
21,984 | (4,701 | ) | (10,854 | ) | |||||||
|
Purchase and origination of loans held for investment
|
(108,775 | ) | (6,731 | ) | (149,221 | ) | ||||||
|
Proceeds from sale of other real estate owned
|
5,751 | 886 | 710 | |||||||||
|
Principal payments on securities available for sale
|
21,562 | 14,430 | 11,811 | |||||||||
|
Purchase of securities available for sale
|
(156,347 | ) | (218,896 | ) | (33,401 | ) | ||||||
|
Proceeds from sale or maturity of securities available for sale
|
103,550 | 146,418 | 14,179 | |||||||||
|
Purchase of premises and equipment
|
(531 | ) | (167 | ) | (1,102 | ) | ||||||
|
Proceeds from sale and disposal of premises and equipment
|
- | - | 20 | |||||||||
|
Change in FHLB and FRB stock
|
996 | - | 3,248 | |||||||||
|
Net cash used in investing activities
|
(23,182 | ) | (13,943 | ) | (8,217 | ) | ||||||
|
CASH FLOW FROM FINANCING ACTIVITIES
|
||||||||||||
|
Net increase in deposit accounts
|
40,506 | 161,606 | 70,393 | |||||||||
|
Proceeds from FHLB advances and other borrowings
|
40,000 | - | 27,835 | |||||||||
|
Repayments of FHLB advances and other borrowings
|
(63,000 | ) | (118,400 | ) | (115,900 | ) | ||||||
|
Proceeds from issuance of common stock, net of issuance cost
|
- | 15,241 | - | |||||||||
|
Proceeds from exercise of warrants
|
- | 150 | - | |||||||||
|
Repurchase of common stock
|
- | (383 | ) | (2,074 | ) | |||||||
|
Net cash provided by (used in) financing activities
|
17,506 | 58,214 | (19,746 | ) | ||||||||
|
Net increase (decrease) in cash and cash equivalents
|
3,756 | 49,999 | (24,314 | ) | ||||||||
|
Cash and cash equivalents, beginning of year
|
59,706 | 9,707 | 34,021 | |||||||||
|
Cash and cash equivalents, end of year
|
$ | 63,462 | $ | 59,706 | $ | 9,707 | ||||||
|
SUPPLEMENTAL CASH FLOW DISCLOSURES
|
||||||||||||
|
Interest paid
|
$ | 12,711 | $ | 20,455 | $ | 25,540 | ||||||
|
Income taxes paid
|
$ | 2,300 | $ | 1,110 | $ | 2,765 | ||||||
| NONCASH OPERATING ACTIVITIES DURING THE PERIOD | ||||||||||||
|
Restricted stock vested
|
$ | - | $ | 104 | $ | 112 | ||||||
| NONCASH INVESTING ACTIVITIES DURING THE PERIOD | ||||||||||||
|
Loan transfers to loans held for investment from loans held for sale
|
$ | - | $ | 126 | $ | - | ||||||
|
Transfers from loans to other real estate owned
|
$ | 3,564 | $ | 4,533 | $ | 93 | ||||||
|
Investment securities available for sale purchased and not settled
|
$ | 5,125 | $ | 8,238 | $ | - | ||||||
See Notes to Consolidated Financial Statements.
PACIFIC PREMIER BANCORP, INC., AND SUBSIDIARIES
NOTES TO CONSOLIDATED FINANCIAL STATEMENTS
1. Description of Business and Summary of Significant Accounting Policies
Principles of Consolidation—The consolidated financial statements include the accounts of Pacific Premier Bancorp, Inc., (the ‘‘Corporation’’) and its wholly owned subsidiary, Pacific Premier Bank (the ‘‘Bank’’) (collectively, the ‘‘Company’’). The Company accounts for its investments in its wholly-owned special purpose entity, PPBI Statutory Trust I, ( the “Trust”) using the equity method under which the subsidiaries’ net earnings are recognized in the Company’s Statement of Operations and the investment in the Trust is included in Other Assets on the Company’s Balance Sheet. All significant intercompany accounts and transactions have been eliminated in consolidation.
Description of Business—The Corporation, a Delaware corporation organized in 1997, is a California-based bank holding company that owns 100% of the capital stock of the Bank, the Corporation’s principal operating subsidiary. The Bank was incorporated and commenced operations in 1983.
The principal business of the Company is attracting deposits from the general public and investing those deposits, together with funds generated from operations and borrowings, primarily in multi-family (apartment buildings of five units or more) and commercial real estate property loans. At December 31, 2010, the Company had six depository branches located in the cities of Costa Mesa, Huntington Beach, Los Alamitos, Newport Beach, San Bernardino, and Seal Beach. The Company is subject to competition from other financial institutions. The Company is subject to the regulations of certain governmental agencies and undergoes periodic examinations by those regulatory authorities.
Basis of Financial Statement Presentation—The accompanying consolidated financial statements have been prepared in conformity with account principles generally accepted in the United States of America. In preparing the consolidated financial statements, management is required to make estimates and assumptions that affect the reported amounts of assets and liabilities as of the dates of the balance sheets and the results of operations for the reporting periods. Actual results could differ significantly from those estimates. Material estimates that are particularly susceptible to significant change in the near term relate to the determination of the allowance for loan losses, the valuation of foreclosed real estate, OTTI on investment securities available for sale and the deferred tax asset.
Cash and cash equivalents—Cash and cash equivalents include cash on hand, due from banks and fed funds sold. At December 31, 2010, $1.7 million was allocated to cash reserves required by the Federal Reserve for depository institutions based on the amount of deposits held. The Company maintains amounts due from banks that exceed federally insured limits. The Company has not experienced any losses in such accounts.
Securities—The Company has established written guidelines and objectives for its investing activities. At the time of purchase, management designates the security as either held to maturity, available for sale or held for trading based on the Company’s investment objectives, operational needs and intent. The investments are monitored to ensure that those activities are consistent with the established guidelines and objectives.
Securities Held to Maturity—Investments in debt securities that management has the positive intent and ability to hold to maturity are reported at cost and adjusted for unamortized premiums and unearned discounts that are recognized in interest income using the interest method over the period to maturity. If the cost basis of these securities is determined to be other than temporarily impaired, the amount of the impairment is charged to operations. The Company had no investment securities classified as held to maturity at December 31, 2010 or 2009.
Securities Available for Sale—Investments in debt securities that management has no immediate plan to sell, but which may be sold in the future, are valued at fair value. Premiums and discounts are amortized using the interest method over the remaining period to the call date for premiums or contractual maturity for discounts and, in the case of mortgage-backed securities, adjusted for anticipated prepayments. Unrealized holding gains and losses, net of tax, are excluded from earnings and reported as a separate component of stockholders’ equity as accumulated other comprehensive income. If the cost basis of the security is deemed other than temporarily impaired the amount of the impairment is charged to operations. Realized gains and losses on the sales of securities are determined on the specific identification method, recorded on a trade date basis based on the amortized cost basis of the specific security and are included in noninterest income as net gain (loss) on investment securities.
Securities Held to Trading—Securities held for trading are carried at fair value. Realized and unrealized gains and losses are reflected in earnings. The Company had no investment securities classified as held for trading at December 31, 2010 or 2009.
Impairment of Investments—Declines in the fair value of individual held to maturity and available for sale securities below their cost that are OTTI result in write-downs of the individual securities to their fair value. The related write-downs are included in operations as realized losses in the category of other-than-temporary impairment loss on investment securities, net. In estimating OTTI losses, management considers: (i) the length of time and the extent to which the market value has been less than cost; (ii) the financial condition and near-term prospects of the issuer; (iii) the intent and ability of the Company to retain its investment in a security for a period of time sufficient to allow for any anticipated recovery in market value; and (iv) general market conditions which reflect prospects for the economy as a whole, including interest rates and sector credit spreads.
Loans Held for Sale—The Company identifies at origination those loans which foreseeably may be sold prior to maturity as loans held for sale and records them at the lower of amortized cost or fair value. Premiums paid and discounts obtained on such loans are deferred as an adjustment to the carrying value of the loans until the loans are sold. Interest is recognized as revenue when earned according to the terms of the loans and when, in the opinion of management, it is collectible. Loans are evaluated for collectability, and if appropriate, previously accrued interest is reversed. The Company may sell loans which had been held for investment. In such occurrences, the loans are transferred to the held for sale portfolio at the lower of amortized cost or fair value. If any part of a decline in value of the loans transferred is due to credit deterioration, that decline is recorded as a charge-off to the allowance for loan losses at the time of transfer. Gains or losses on sales of loans are recognized at the time of sale and are determined by the difference between the net sales proceeds and the basis of the loans sold. There were no loans held for sale at December 31, 2010 or 2009.
Loans Held for Investment—Loans held for investment are carried at amortized cost, net of discounts and premiums, deferred loan origination fees and costs and allowance for loan losses. Net deferred loan origination fees and costs on loans are amortized or accreted using the interest method over the expected life of the loans. Amortization of deferred loan fees and costs are discontinued for loans placed on nonaccrual. Any remaining deferred fees or costs and prepayment fees associated with loans that payoff prior to contractual maturity are included in loan interest income in the period of payoff. Loan commitment fees received to originate or purchase a loan are deferred and, if the commitment is exercised, recognized over the life of the loan as an adjustment of yield or, if the commitment expires unexercised, recognized as income upon expiration of the commitment. Loans held for investment are not adjusted to the lower of cost or estimated market value because it is management's intention, and the Company has the ability, to hold these loans to maturity.
Interest on loans is credited to income as earned. Interest receivable is accrued only if deemed collectible. Loans on which the accrual of interest has been discontinued are designated as nonaccrual loans. The accrual of interest on loans is discontinued when principal or interest is past due 90 days based on contractual terms of the loan or when, in the opinion of management, there is reasonable doubt as to collection of interest. When loans are placed on nonaccrual status, all interest previously accrued but not collected is reversed against current period interest income. Interest income generally is not recognized on impaired loans unless the likelihood of further loss is remote. Interest payments received on such loans are applied as a reduction to the loan principal balance. Interest accruals are resumed on such loans only when they are brought current with respect to interest and principal and when, in the judgment of management, the loans are estimated to be fully collectible as to all principal and interest.
A loan is considered to be impaired when it is probable that the Company will be unable to collect all amounts due (principal and interest) according to the contractual terms of the loan agreement. Measurement of impairment is based on the loan’s expected future cash flows discounted at the loan’s effective interest rate, measured by reference to an observable market value, if one exists, or the fair value of the collateral if the loan is deemed collateral dependent. The Company selects the measurement method on a loan-by-loan basis except those loans deemed collateral dependent. All loans are generally charged-off at such time the loan is classified as a loss.
Allowance for Loan Losses—The Company maintains an allowance for loan losses at a level deemed appropriate by management to provide for known or inherent risks in the portfolio at the balance sheet date. The Company has implemented and adheres to an internal asset review system and loss allowance methodology designed to provide for the detection of problem assets and an adequate allowance to cover loan losses. Management’s determination of the adequacy of the loan loss allowance is based on an evaluation of the composition of the portfolio, actual loss experience, industry charge-off experience on income property loans, current economic conditions, and other relevant factors in the area in which the Company’s lending and real estate activities are based. These factors may affect the borrowers’ ability to pay and the value of the underlying collateral. The allowance is calculated by applying loss factors to loans held for investment according to loan program type and loan classification. The loss factors are established based primarily upon the Bank’s historical loss experience and the industry charge-off experience and are evaluated on a quarterly basis. Various regulatory agencies, as an integral part of their examination process, periodically review the Company’s allowance for loan losses. Such agencies may require the Bank to recognize additions to the allowance based on judgments different from those of management. In the opinion of management, and in accordance with the credit loss allowance methodology, the present allowance is considered adequate to absorb estimable and probable credit losses. Additions and reductions to the allowance are reflected in current operations. Charge-offs to the allowance are made when specific assets are considered uncollectible or are transferred to other real estate owned and the fair value of the property is less than the loan’s recorded investment. Recoveries are credited to the allowance.
Although management uses the best information available to make these estimates, future adjustments to the allowance may be necessary due to economic, operating, regulatory and other conditions that may be beyond the Company’s control.
Other Real Estate Owned—The Company obtains an appraisal and/or market valuation on all other real estate owned at the time of possession. Real estate properties acquired through, or in lieu of, loan foreclosure are recorded at fair value less cost to sell with any excess loan balance charged against the allowance for estimated loan losses. After foreclosure, valuations are periodically performed by management. Any subsequent fair value losses are recorded to other real estate owned operations with a corresponding write-down to the asset. All legal fees and direct costs, including foreclosure and other related costs are expensed as incurred. Revenue and expenses from continued operations are included in other real estate owned operations in the consolidated statement of operations.
Premises and Equipment—Premises and equipment are stated at cost less accumulated depreciation and amortization. Depreciation and amortization are computed using the straight-line method over the estimated useful lives of the assets, which range from 40 years for buildings, seven years for furniture, fixtures and equipment, and three years for computer and telecommunication equipment. The cost of leasehold improvements is amortized using the straight-line method over the shorter of the estimated useful life of the asset or the term of the related leases.
The Company periodically evaluates the recoverability of long-lived assets, such as premises and equipment, to ensure the carrying value has not been impaired. Assets to be disposed of are reported at the lower of the carrying amount or fair value less costs to sell.
Securities Sold Under Agreements to Repurchase—The Company enters into sales of securities under agreement to repurchase. These agreements are treated as financing arrangements and, accordingly, the obligations to repurchase the securities sold are reflected as liabilities in the Company’s consolidated financial statements. The securities collateralizing these agreements are delivered to several major national brokerage firms who arranged the transactions. The securities are reflected as assets in the Company’s consolidated financial statements. The brokerage firms may loan such securities to other parties in the normal course of their operations and agree to return the identical security to the Company at the maturity of the agreements.
Subordinated Debentures—Long-term borrowings are carried at cost, adjusted for amortization of premiums and accretion of discounts which are recognized in interest expense using the interest method. Debt issuance costs are recognized in interest expense using the interest method over the life of the instrument.
Income Taxes—Deferred tax assets and liabilities are recorded for the expected future tax consequences of events that have been recognized in the Company’s financial statements or tax returns using the asset liability method. In estimating future tax consequences, all expected future events other than enactments of changes in the tax law or rates are considered. The effect on deferred taxes of a change in tax rates is recognized in income in the period that includes the enactment date. Deferred tax assets are to be recognized for temporary differences that will result in deductible amounts in future years and for tax carryforwards if, in the opinion of management, it is more likely than not that the deferred tax assets will be realized. As of December 31, 2010, there was no valuation allowance deemed necessary against the Company’s deferred tax asset.
Bank owned life insurance—Bank owned life insurance is accounted for using the cash surrender value method and is recorded at its realizable value. The change in the net asset value is included in other assets and other noninterest income.
Comprehensive Income—The Company classifies items of other comprehensive income by their nature in the financial statements and displays the accumulated other comprehensive income as a separate component of stockholders’ equity on the Balance Sheet. Changes in unrealized gain (loss) on available-for-sale securities net of income taxes is the only component of accumulated other comprehensive income for the Company.
Share-Based Compensation—The Company recognizes in the income statement the grant-date fair value of stock options and other equity-based forms of compensation issued to employees over the employees’ requisite service period (generally the vesting period).
Recent Accounting Pronouncements
During 2010 , the following accounting guidance relevant to the Company has been issued by the Financial Accounting Standards Board (the “FASB”), and/or became effective.
Fair Value Measurements: In January 2010, the Financial Accounting Standards Board (FASB) issued Accounting Standards Update (ASU) No. 2010-06, “Fair Value Measurements and Disclosures (Topic 820): Improving Disclosures about Fair Value Measurements.” ASU 2010-06 revises two disclosure requirements concerning fair value measurements and clarifies two others. It requires separate presentation of significant transfers into and out of Levels 1 and 2 of the fair value hierarchy and disclosure of the reasons for such transfers. It will also require the presentation of purchases, sales, issuances, and settlements within Level 3 on a gross basis rather than a net basis. The amendments also clarify that disclosures should be disaggregated by class of asset or liability and that disclosures about inputs and valuation techniques should be provided for both recurring and non-recurring fair value measurements. The Company’s disclosures about fair value measurements are presented in Note 15 – Fair Value Disclosures. These new disclosure requirements were effective for the period ended September 30, 2010, except for the requirement concerning gross presentation of Level 3 activity, which is effective for fiscal years beginning after December 15, 2010. There was no significant effect to the Company’s financial statement disclosure upon adoption of this ASU. The Company adopted this new accounting standard as of January 1, 2010 and the impact of adoption was not material to the Company’s consolidated financial position, results of operations or cash flows.
Subsequent Events: In February 2010, the Financial Accounting Standards Board (FASB) issued Accounting Standards Update (ASU) No. 2010-09, Subsequent Events (Topic 855): Amendments to Certain Recognition and Disclosure Requirements. The amendments remove the requirement for an SEC registrant to disclose the date through which subsequent events were evaluated as this requirement would have potentially conflicted with SEC reporting requirements. Removal of the disclosure requirement did not have an effect on the nature or timing of subsequent events evaluations performed by the Company. ASU 2010-09 became effective upon issuance.
Disclosures about Credit Quality: In July 2010, the FASB issued ASU No. 2010-20, “Disclosures about the Credit Quality of Financing Receivables and the Allowance for Credit Losses,” which will require the Company to provide a greater level of disaggregated information about the credit quality of the Company’s loans and leases and the Allowance for Loan and Lease Losses (the “Allowance”). This ASU will also require the Company to disclose additional information related to credit quality indicators, past due information, and information related to loans modified in a troubled debt restructuring. The provisions of this ASU are effective for the Company’s reporting period ending December 31, 2010. As this ASU amends only the disclosure requirements for loans and leases and the allowance, the adoption will have no impact on the Company’s statements of income or condition.
Reclassifications –Certain amounts reflected in the 2009 and 2008 consolidated financial statements have been reclassified where practicable, to conform to the presentation for 2010. These classifications are of a normal recurring nature.
2. Regulatory Capital Requirements and Other Regulatory Matters
The Company and the Bank are subject to various regulatory capital requirements administered by federal banking agencies. Failure to meet minimum capital requirements can initiate certain mandatory, and possibly additional discretionary, actions by regulators that, if undertaken, could have a direct material effect on the Company’s and the Bank’s financial statements. Under capital adequacy guidelines and the regulatory framework for prompt corrective action, the Company and the Bank must meet specific capital guidelines that involve quantitative measures of the Company’s and the Bank’s assets, liabilities and certain off-balance sheet items as calculated under regulatory accounting practices. The Company’s and the Bank’s capital amounts and classification are also subject to qualitative judgments by the regulators about components, risk weightings and other factors.
Quantitative measures established by regulation to ensure capital adequacy require the Bank to maintain capital in order to meet certain capital ratios to be considered adequately capitalized or well capitalized under the regulatory framework for prompt corrective action. As of the most recent formal notification from the Federal Reserve, the Bank was categorized as “well capitalized”. There are no conditions or events since that notification that management believes have changed the Bank’s categorization. As defined in applicable regulations and set forth in the table below, at December 31, 2010, the Bank continues to exceed the “well capitalized” standards for Tier I capital to adjusted tangible assets of 5.00%, Tier I risk-based capital to risk-weighted assets of 6.00% and total capital to risk-weighted assets of 10.00%.
In the fourth quarter of 2009, the Company raised $15.5 million in capital by issuing 5,030,385 shares of its common stock at a public offering price of $3.25 per share. The Company injected $14.0 million of the proceeds from the offering into the Bank, which enhanced the Bank’s regulatory capital ratios.
The Company’s and Bank’s actual capital amounts and ratios are presented in the table below:
|
Actual
|
Minimum Required for Capital Adequacy Purposes
|
Required to be Well Capitalized Under Prompt Corrective Action Regulations
|
||||||||||||||||||||||
|
Amount
|
Ratio
|
Amount
|
Ratio
|
Amount
|
Ratio
|
|||||||||||||||||||
|
(dollars in thousands)
|
||||||||||||||||||||||||
|
At December 31, 2010
|
||||||||||||||||||||||||
|
Tier 1 Capital (to adjusted tangible assets)
|
||||||||||||||||||||||||
|
Bank
|
82,784 | 10.29 | % | $ | 32,183 | 4.00 | % | $ | 40,229 | 5.00 | % | |||||||||||||
|
Consolidated
|
83,711 | 10.41 | % | 32,176 | 4.00 | % | N/A | N/A | ||||||||||||||||
|
Tier 1 Risk-Based Capital (to risk-weighted assets)
|
||||||||||||||||||||||||
|
Bank
|
82,784 | 14.03 | % | 23,608 | 4.00 | % | 35,412 | 6.00 | % | |||||||||||||||
|
Consolidated
|
83,711 | 14.07 | % | 23,796 | 4.00 | % | N/A | N/A | ||||||||||||||||
|
Total Capital (to risk-weighted assets)
|
||||||||||||||||||||||||
|
Bank
|
90,180 | 15.28 | % | 47,216 | 8.00 | % | 59,020 | 10.00 | % | |||||||||||||||
|
Consolidated
|
91,167 | 15.32 | % | 47,592 | 8.00 | % | N/A | N/A | ||||||||||||||||
|
At December 31, 2009
|
||||||||||||||||||||||||
|
Tier 1 Capital (to adjusted tangible assets)
|
||||||||||||||||||||||||
|
Bank
|
$ | 78,463 | 9.72 | % | $ | 32,300 | 4.00 | % | $ | 40,375 | 5.00 | % | ||||||||||||
|
Consolidated
|
79,801 | 9.89 | % | 32,275 | 4.00 | % | N/A | N/A | ||||||||||||||||
|
Tier 1 Risk-Based Capital (to risk-weighted assets)
|
||||||||||||||||||||||||
|
Bank
|
78,463 | 13.30 | % | 23,600 | 4.00 | % | 35,401 | 6.00 | % | |||||||||||||||
|
Consolidated
|
79,801 | 13.41 | % | 23,798 | 4.00 | % | N/A | N/A | ||||||||||||||||
|
Total Capital (to risk-weighted assets)
|
||||||||||||||||||||||||
|
Bank
|
85,855 | 14.55 | % | 47,201 | 8.00 | % | 59,001 | 10.00 | % | |||||||||||||||
|
Consolidated
|
87,256 | 14.67 | % | 47,596 | 8.00 | % | N/A | N/A | ||||||||||||||||
3. Investment Securities
The amortized cost and estimated fair value of securities were as follows:
|
December 31, 2010
|
||||||||||||||||
|
Amortized
|
Unrealized
|
Unrealized
|
Estimated
|
|||||||||||||
|
Cost
|
Gain
|
Loss
|
Fair Value
|
|||||||||||||
|
(in thousands)
|
||||||||||||||||
|
Investment securities available for sale:
|
||||||||||||||||
|
U.S. Treasury
|
$ | 148 | $ | 11 | $ | - | $ | 159 | ||||||||
|
Municipal bonds
|
20,555 | 7 | (803 | ) | 19,759 | |||||||||||
|
Mortgage-backed securities
|
135,944 | 1,292 | (2,060 | ) | 135,176 | |||||||||||
|
Total securities available for sale
|
156,647 | 1,310 | (2,863 | ) | 155,094 | |||||||||||
|
FHLB stock
|
11,315 | - | - | 11,315 | ||||||||||||
|
Federal Reserve Bank stock
|
2,019 | - | - | 2,019 | ||||||||||||
|
Total equities held at cost
|
13,334 | - | - | 13,334 | ||||||||||||
|
Total securities
|
$ | 169,981 | $ | 1,310 | $ | (2,863 | ) | $ | 168,428 | |||||||
|
December 31, 2009
|
||||||||||||||||
|
Amortized
|
Unrealized
|
Unrealized
|
Estimated
|
|||||||||||||
|
Cost
|
Gain
|
Loss
|
Fair Value
|
|||||||||||||
|
(in thousands)
|
||||||||||||||||
|
Investment securities available for sale:
|
||||||||||||||||
|
U.S. Treasury
|
$ | 148 | $ | 6 | $ | - | $ | 154 | ||||||||
|
Municipal bonds
|
17,918 | 200 | (153 | ) | 17,965 | |||||||||||
|
Mortgage-backed securities
|
108,300 | 307 | (3,319 | ) | 105,288 | |||||||||||
|
Total securities available for sale
|
126,366 | 513 | (3,472 | ) | 123,407 | |||||||||||
|
FHLB stock
|
12,731 | - | - | 12,731 | ||||||||||||
|
Federal Reserve Bank stock
|
1,599 | - | - | 1,599 | ||||||||||||
|
Total equities held at cost
|
14,330 | - | - | 14,330 | ||||||||||||
|
Total securities
|
$ | 140,696 | $ | 513 | $ | (3,472 | ) | $ | 137,737 | |||||||
The investment in FHLB stock is redeemable five years after the FHLB receives written notice from the Bank and only if the Bank has excess stock at the time of redemption. The investment in FHLB stock is periodically evaluated for impairment based on, among other things, the capital adequacy of the FHLB and its overall financial condition. No impairment losses have been recorded through December 31, 2010.
At December 31, 2010, MBS with an estimated value of $38.3 million and a book value of $40.2 million were pledged as collateral for the Bank’s three inverse putable reverse repurchases totaling $28.5 million.
The Company reviewed individual securities classified as available-for-sale to determine whether a decline in fair value below the amortized cost basis is other-than-temporary. If it is probable that the Company will be unable to collect all amounts due according to contractual terms of the debt security not impaired at acquisition, an OTTI shall be considered to have occurred. If an OTTI occurs, the cost basis of the security would have been written down to its fair value as the new cost basis and the write down accounted for as a realized loss. Securities with OTTI at December 31, 2010 consisted of 27 private label MBS with a book value of $1.6 million. The Company realized OTTI losses of $1.1 million in 2010. Additionally, the Bank took an OTTI charges in 2009 of $2.0 million and in 2008 of $1.3 million.
The table below shows the number, fair value and gross unrealized holding losses of the Company’s investment securities by investment category and length of time that the securities have been in a continuous loss position.
|
December 31, 2010
|
||||||||||||||||||||||||||||||||||||
|
Less than 12 months
|
12 months or Longer
|
Total
|
||||||||||||||||||||||||||||||||||
|
Gross
|
Gross
|
Gross
|
||||||||||||||||||||||||||||||||||
|
Unrealized
|
Unrealized
|
Unrealized
|
||||||||||||||||||||||||||||||||||
|
Fair
|
Holding
|
Fair
|
Holding
|
Fair
|
Holding
|
|||||||||||||||||||||||||||||||
|
Number
|
Value
|
Losses
|
Number
|
Value
|
Losses
|
Number
|
Value
|
Losses
|
||||||||||||||||||||||||||||
|
(dollars in thousands)
|
||||||||||||||||||||||||||||||||||||
|
Municipal bonds
|
27 | $ | 19,316 | $ | (803 | ) | - | $ | - | $ | - | 27 | $ | 19,316 | $ | (803 | ) | |||||||||||||||||||
|
Mortgage-backed securities
|
15 | 39,851 | (886 | ) | 55 | 2,561 | (1,174 | ) | 70 | 42,412 | (2,060 | ) | ||||||||||||||||||||||||
|
Total
|
42 | $ | 59,167 | $ | (1,689 | ) | 55 | $ | 2,561 | $ | (1,174 | ) | 97 | $ | 61,728 | $ | (2,863 | ) | ||||||||||||||||||
|
December 31, 2009
|
||||||||||||||||||||||||||||||||||||
|
Less than 12 months
|
12 months or Longer
|
Total
|
||||||||||||||||||||||||||||||||||
|
Gross
|
Gross
|
Gross
|
||||||||||||||||||||||||||||||||||
|
Unrealized
|
Unrealized
|
Unrealized
|
||||||||||||||||||||||||||||||||||
|
Fair
|
Holding
|
Fair
|
Holding
|
Fair
|
Holding
|
|||||||||||||||||||||||||||||||
|
Number
|
Value
|
Losses
|
Number
|
Value
|
Losses
|
Number
|
Value
|
Losses
|
||||||||||||||||||||||||||||
|
(dollars in thousands)
|
||||||||||||||||||||||||||||||||||||
|
Municipal bonds
|
13 | $ | 11,303 | $ | (153 | ) | - | $ | - | $ | - | 13 | $ | 11,303 | $ | (153 | ) | |||||||||||||||||||
|
Mortgage-backed securities
|
29 | 64,903 | (843 | ) | 63 | 4,761 | (2,476 | ) | 92 | 69,664 | (3,319 | ) | ||||||||||||||||||||||||
|
Total
|
42 | $ | 76,206 | $ | (996 | ) | 63 | $ | 4,761 | $ | (2,476 | ) | 105 | $ | 80,967 | $ | (3,472 | ) | ||||||||||||||||||
The amortized cost and estimated fair value of investment securities available for sale at December 31, 2010, by contractual maturity are shown in the table below.
|
One Year
|
More than One
|
More than Five Years
|
More than
|
|
||||||||||||||||||||||||||||||||||||
|
or Less
|
to Five Years
|
to Ten Years
|
Ten Years
|
Total
|
||||||||||||||||||||||||||||||||||||
|
Amortized
|
Fair
|
Amortized
|
Fair
|
Amortized
|
Fair
|
Amortized
|
Fair
|
Amortized
|
Fair
|
|||||||||||||||||||||||||||||||
|
Cost
|
Value
|
Cost
|
Value
|
Cost
|
Value
|
Cost
|
Value
|
Cost
|
Value
|
|||||||||||||||||||||||||||||||
|
(dollars in thousands)
|
||||||||||||||||||||||||||||||||||||||||
|
Investement securities available for sale:
|
||||||||||||||||||||||||||||||||||||||||
|
U.S. Treasury
|
$ | - | $ | - | $ | 74 | $ | 79 | $ | 74 | $ | 80 | $ | - | $ | - | $ | 148 | $ | 159 | ||||||||||||||||||||
|
Municipal bonds
|
- | - | - | - | - | - | 20,555 | 19,759 | 20,555 | 19,759 | ||||||||||||||||||||||||||||||
|
Mortgage-backed securities
|
- | - | 35 | 37 | 118 | 127 | 135,791 | 135,012 | 135,944 | 135,176 | ||||||||||||||||||||||||||||||
|
Total investment securities available for sale
|
- | - | 109 | 116 | 192 | 207 | 156,346 | 154,771 | 156,647 | 155,094 | ||||||||||||||||||||||||||||||
|
Stock:
|
||||||||||||||||||||||||||||||||||||||||
|
FHLB
|
11,315 | 11,315 | - | - | - | - | - | - | 11,315 | 11,315 | ||||||||||||||||||||||||||||||
|
Federal Reserve Bank
|
2,019 | 2,019 | - | - | - | - | - | - | 2,019 | 2,019 | ||||||||||||||||||||||||||||||
|
Total stock
|
13,334 | 13,334 | - | - | - | - | - | - | 13,334 | 13,334 | ||||||||||||||||||||||||||||||
|
Total securities
|
$ | 13,334 | $ | 13,334 | $ | 109 | $ | 116 | $ | 192 | $ | 207 | $ | 156,346 | $ | 154,771 | $ | 169,981 | $ | 168,428 | ||||||||||||||||||||
The temporary impairment in both years is a result of the change in market interest rates and not the underlying issuers’ ability to repay. The Company has the intent and ability to hold these securities until the temporary impairment is eliminated. Accordingly, the Company has not recognized the temporary impairment in earnings of either year.
In 2010, net unrealized gains on investment securities available for sale were recognized in stockholders’ equity to reduce the accumulated other comprehensive loss to $1.6 million, or $914,000 net of tax, at December 31, 2010 and from $3.0 million or $1.7 million net of tax, at December 31, 2009.
4. Loans Held for Investment
Loans held for investment consisted of the following at December 31:
|
2010
|
2009
|
|||||||
|
(in thousands)
|
||||||||
|
Real estate loans:
|
||||||||
|
Multi-family
|
$ | 243,584 | $ | 278,744 | ||||
|
Commercial investor
|
130,525 | 149,577 | ||||||
|
One-to-four family
|
20,318 | 8,491 | ||||||
|
Business loans:
|
||||||||
|
Commercial owner occupied
|
113,025 | 103,019 | ||||||
|
Commercial and industrial
|
54,687 | 31,109 | ||||||
|
SBA
|
4,088 | 3,337 | ||||||
|
Other loans
|
1,417 | 1,991 | ||||||
|
Total gross loans
|
567,644 | 576,268 | ||||||
|
Plus (less):
|
||||||||
|
Deferred loan origination costs-net
|
(3,227 | ) | (779 | ) | ||||
|
Allowance for estimated loan losses
|
(8,879 | ) | (8,905 | ) | ||||
|
Loans held for investment, net
|
$ | 555,538 | $ | 566,584 | ||||
From time to time, we may purchase or sell loans in order to manage concentrations, maximize interest income, change risk profiles, improve returns and generate liquidity.
The Company grants residential and commercial loans held for investment to customers located primarily in Southern California. Consequently, the underlying collateral for our loans and a borrower’s ability to repay may be impacted unfavorably by adverse changes in the economy and real estate market in the region.
Under applicable laws and regulations, the Bank may not make secured loans to one borrower in excess of 25% of unimpaired capital plus surplus and likewise in excess of 15% for unsecured loans. These loans-to-one-borrower limitations result in a dollar limitation of $23.0 million for secured loans and $13.8 million for unsecured loans at December 31, 2010. At December 31, 2010, the Bank’s largest aggregate outstanding balance of loans to one borrower was $11.4 million of secured credit.
Loans serviced for others are not included in the accompanying balance sheets. The unpaid principal balance of loans and participations serviced for others were $33.2 million at December 31, 2010 and $36.5 million at December 31, 2009, for which we have no capitalized servicing rights.
Concentration of Credit Risk
The Company’s loan portfolio was collateralized by various forms of real estate and business assets located principally in Southern California. The Company’s loan portfolio contains concentrations of credit in multi-family real estate, commercial non-owner occupied real estate and commercial owner occupied business loans. The Company maintains Board approved policies that address these concentrations and continues to diversify its loan portfolio through loan originations, purchases and sales to meet approved concentration levels. While Management believes that the collateral presently securing these loans is adequate, there can be no assurances that further significant deterioration in the California real estate market and economy would not expose the Company to significantly greater credit risk.
Impaired Loans
The following table provides a summary of the Company’s investment in impaired loans as of and for the year ended December 31, 2010:
|
Impaired Loans
|
||||||||||||||||||||||||||||
|
Recorded Investment
|
Unpaid Principal Balance
|
With Specific Allowance
|
Without Specific Allowance
|
Specific Allowance for Impaired Loans
|
Average Recorded Investment
|
Interest Income Recognized
|
||||||||||||||||||||||
|
(dollars in thousands)
|
||||||||||||||||||||||||||||
|
Real estate loans:
|
||||||||||||||||||||||||||||
|
Multi-family
|
$ | 1,156 | $ | 1,156 | $ | - | $ | 1,156 | $ | - | $ | 2,114 | $ | 94 | ||||||||||||||
|
Commercial investor
|
2,068 | 2,068 | 465 | 1,603 | 47 | 1,949 | 127 | |||||||||||||||||||||
|
One-to-four family
|
223 | 224 | - | 223 | - | 249 | 15 | |||||||||||||||||||||
|
Business loans:
|
||||||||||||||||||||||||||||
|
Commercial owner occupied
|
2,225 | 2,342 | - | 2,225 | - | 1,332 | - | |||||||||||||||||||||
|
Commercial and industrial
|
54 | 169 | - | 54 | - | 270 | 14 | |||||||||||||||||||||
|
SBA
|
1,092 | 1,751 | - | 1,092 | - | 970 | 14 | |||||||||||||||||||||
|
Totals
|
$ | 6,818 | $ | 7,710 | $ | 465 | $ | 6,353 | $ | 47 | $ | 6,882 | $ | 264 | ||||||||||||||
The Company considers a loan to be impaired when, based on current information and events, it is probable the Company will be unable to collect all amounts due according to the contractual terms of the loan agreement or it is determined that the likelihood of the Company receiving all scheduled payments, including interest, when due is remote. The Company has no commitments to lend additional funds to debtors whose loans have been impaired.
The Company reviews loans for impairment when the loan is classified as substandard or worse, delinquent 90 days, or determined by management to be collateral dependent, or when the borrower files bankruptcy or is granted a troubled debt restructure. Measurement of impairment is based on the loan’s expected future cash flows discounted at the loan’s effective interest rate, measured by reference to an observable market value, if one exists, or the fair value of the collateral if the loan is deemed collateral dependent. All loans are generally charged-off at such time the loan is classified as a loss. Valuation allowances are determined on a loan-by-loan basis or by aggregating loans with similar risk characteristics.
The following table summarizes impaired loan balances for prior periods as presented below:
|
December 31,
|
||||||||
|
2009
|
2008
|
|||||||
|
(dollars in thousands)
|
||||||||
|
Nonaccruing loans
|
$ | 8,191 | $ | 4,301 | ||||
|
Loans 90 days or more past due
|
5,466 | 899 | ||||||
|
Total impaired loans
|
$ | 13,657 | $ | 5,200 | ||||
|
Impaired loans without a valuation allowance
|
$ | 13,041 | $ | 5,200 | ||||
|
Imparied loans with a valuation allowance
|
$ | 616 | $ | - | ||||
|
Valuation allowance related to impaired loans
|
$ | 179 | $ | - | ||||
|
Average recorded investment in impaired loans
|
$ | 11,228 | $ | 5,353 | ||||
When loans are placed on nonaccrual status all accrued interest is reversed from earnings. Payments received on nonaccrual loans are generally applied as a reduction to the loan principal balance. If the likelihood of further loss is remote, the Company will recognize interest on a cash basis only. Loans may be returned to accruing status if the Company believes that all remaining principal and interest is fully collectible and there has been at least six months of sustained repayment performance since the loan was placed on nonaccrual.
The Company does not accrue interest on loans 90 days or more past due or when, in the opinion of management, there is reasonable doubt as to the collection of interest. The Company had loans on nonaccrual status at December 31, 2010 of $3.3 million, 2009 of $10.0 million, and 2008 of $5.2 million. If such loans had been performing in accordance with their original terms, the Company would have recorded additional loan interest income of $600,000 in 2010, $781,000 in 2009, and $491,000 in 2008. The Company did not record income from the receipt of cash payments related to nonaccruing loans during the years ended December 31, 2010, 2009 and 2008. The Company had no loans 90 day or more past due and still accruing or troubled debt restructures at December 31, 2010 or 2009.
Credit Quality and Credit Risk Management
The Company’s credit quality is maintained and credit risk managed in two distinct areas. The first is the loan origination process, wherein the Bank underwrites credit quality and chooses which risks it is willing to accept. The second is in the ongoing oversight of the loan portfolio, where existing credit risk is measured and monitored, and where performance issues are dealt with in a timely and comprehensive fashion.
The Company maintains a comprehensive credit policy which sets forth minimum and maximum tolerances for key elements of loan risk. The policy identifies and sets forth specific guidelines for analyzing each of the loan products the Company offers from both an individual and portfolio wide basis. The credit policy is reviewed annually by the Board of Directors. Seasoned underwriters ensure all key risk factors are analyzed with nearly all underwriting including a comprehensive global cash flow analysis. The credit approval process mandates multiple-signature approval by either the management or Board credit committee for every loan which requires any subjective credit analysis.
Credit risk is managed within the loan portfolio by the Company’s Portfolio Management department based on a comprehensive credit and investment review policy. This policy requires a program of financial data collection and analysis, comprehensive loan reviews, property and/or business inspections and monitoring of portfolio concentrations and trends. The Portfolio Management department also monitors asset-based lines of credit, loan covenants and other conditions associated with the Company’s business loans in order to ensure that the protections built into the loan approvals serve as the early warning and risk mitigation mechanisms. Individual loans, excluding the homogeneous loan portfolio, are reviewed at least biennially, or more frequently, if deemed necessary, and includes the assignment of a risk grade.
Risk grades are based on a six-grade Pass scale, along with Special Mention, Substandard, Doubtful and Loss classifications as such classifications are defined by the regulatory agencies. The assignment of risk grades allows the Company to, among other things, identify the risk associated with each credit in the portfolio, and to provide a basis for estimating credit losses inherent in the portfolio. Risk grades are reviewed regularly by the Company’s Credit and Investment Review committee, and are scrutinized by annual independent loan reviews performed by a third-party, as well as by regulatory agencies during scheduled examinations.
The following provides brief definitions for risk grades assigned to loans in the portfolio:
• Pass – Pass credits are well protected by the current sound worth and paying capacity of the obligor or of the collateral pledged, if any. Such credits exhibit few weaknesses, if any, but may include credits with exposure to certain factors that may adversely impact the credit if they materialize. The Company has established six subcategories within the pass grade to stratify risk associated with pass loans. The Company maintains a subset of pass credits designated as “watch” loans which, for any of a variety of reasons, require the Company’s closer attention. Watch credits are more heavily scrutinized than other pass credits so that any potential weaknesses that may develop in such credits are more quickly identified, thereby serving to mitigate potential losses.
• Special Mention – Loans graded special mention exhibit potential weaknesses that deserve management’s close attention. If left uncorrected, these potential weaknesses may, at some future date, result in the deterioration of the repayment prospects for the loan or the institution’s credit position. Special mention credits are not considered as part of the classified extensions of credit category and do not expose the Company to sufficient risk to warrant classification.
• Substandard – Substandard credits are inadequately protected by the current sound worth and paying capacity of the obligor or of the collateral pledged, if any. Extensions of credit so classified must have a well-defined weakness or weaknesses that jeopardize the liquidation of the debt. (The term “liquidation” as used here refers to the orderly repayment of the debt and not to a forced sale of the loan or its underlying collateral.) They are characterized by the distinct possibility that the bank will sustain some loss if the deficiencies are not corrected. Loss potential, while existing in the aggregate amount of substandard credits, does not have to exist in individual extensions of credit classified substandard.
• Doubtful – Doubtful credits have all the weaknesses inherent in substandard credits, with the added characteristic that the weaknesses make collection or liquidation in full, on the basis of currently existing facts, conditions, and values, highly questionable and improbable. The possibility of loss is extremely high, but because of certain important and reasonably specific pending factors that may work to the advantage of and strengthen the credit, its classification as an estimated loss is deferred until its more exact status may be determined.
The Portfolio Management department also manages loan performance risks, handling collections, workouts, bankruptcies and foreclosures. These risks are controlled by moving quickly and assertively when problems are identified. Collection efforts are immediate upon non-payment, and the portfolio managers seek to determine right away the appropriate steps to minimize the Company’s risk of loss. When foreclosure will maximize the Company’s recovery for a non-performing loan, the portfolio managers will prosecute the foreclosure process, including any associated judicial legal actions. When appropriate, the Company’s General Counsel or outside legal advisors are consulted to ensure that legal risks are appropriately addressed in handling loan performance issues.
When a loan is graded as special mention or worse, the Company obtains an updated valuation of the underlying collateral. If the credit in question is also identified as impaired, a valuation allowance, if necessary, is established against such loan or a loss is recognized by a charge to the allowance for loan losses if management believes that the full amount of the Company’s recorded investment in the loan is no longer collectable. The Company typically continues to obtain updated valuations of underlying collateral for special mention and classified loans on an annual basis in order to have the most current indication of fair value. Once a loan is identified as impaired, an analysis of the underlying collateral is performed at least quarterly, and corresponding changes in any related valuation allowance are made or balances deemed to be fully uncollectable are charged-off.
The following table stratifies the loan portfolio by the Company’s internal risk grading system as well as certain other information concerning the credit quality of the loan portfolio as of December 31, 2010:
|
Credit Risk Grades
|
||||||||||||||||
|
Special
|
Total Gross
|
|||||||||||||||
|
Pass
|
Mention
|
Substandard
|
Loans
|
|||||||||||||
|
(dollars in thousands)
|
||||||||||||||||
|
Real estate loans:
|
||||||||||||||||
|
Multi-family
|
$ | 226,270 | $ | 13,161 | $ | 4,153 | $ | 243,584 | ||||||||
|
Commercial investor
|
124,513 | 577 | 5,435 | 130,525 | ||||||||||||
|
One-to-four family
|
19,823 | - | 495 | 20,318 | ||||||||||||
|
Business loans:
|
||||||||||||||||
|
Commercial owner occupied
|
104,475 | 4,074 | 4,476 | 113,025 | ||||||||||||
|
Commercial and industrial
|
53,188 | 360 | 1,139 | 54,687 | ||||||||||||
|
SBA
|
2,956 | - | 1,132 | 4,088 | ||||||||||||
|
Other loans
|
1,417 | - | - | 1,417 | ||||||||||||
|
Totals
|
$ | 532,642 | $ | 18,172 | $ | 16,830 | $ | 567,644 | ||||||||
|
Days Past Due
|
||||||||||||||||||||
|
Total
|
Non-
|
|||||||||||||||||||
| 30-59 | 60-89 | 90+ |
Past Due
|
Accruing
|
||||||||||||||||
|
Real estate loans:
|
||||||||||||||||||||
|
Multi-family
|
$ | - | $ | - | $ | - | $ | - | $ | - | ||||||||||
|
Commercial investor
|
617 | - | - | 617 | - | |||||||||||||||
|
One-to-four family
|
402 | 17 | 20 | 439 | 26 | |||||||||||||||
|
Business loans:
|
- | |||||||||||||||||||
|
Commercial owner occupied
|
184 | - | 2,225 | 2,409 | 2,225 | |||||||||||||||
|
Commercial and industrial
|
- | - | - | - | 54 | |||||||||||||||
|
SBA
|
- | - | 846 | 846 | 971 | |||||||||||||||
|
Other loans
|
- | - | - | - | - | |||||||||||||||
|
Totals
|
$ | 1,203 | $ | 17 | $ | 3,091 | $ | 4,311 | $ | 3,277 | ||||||||||
5. Allowance for Loan Losses
The Company’s Allowance for Loan Losses (“ALLL”) covers estimated credit losses on individually evaluated loans that are determined to be impaired as well as estimated credit losses inherent in the remainder of the loan portfolio. The ALLL is prepared using the information provided by the Company’s credit and investment review process along with data from peer institutions and economic information gathered from published sources.
The loan portfolio is segmented into groups of loans with similar risk characteristics. Each segment possesses varying degrees of risk based on, among other things, the type of loan, the type of collateral, and the sensitivity of the borrower or industry to changes in external factors such as economic conditions. An estimated loss rate calculated using the Company’s actual historical loss rates adjusted for current portfolio trends, economic conditions, and other relevant internal and external factors, is applied to each group’s aggregate loan balances.
The following provides a summary of the ALLL calculation for the major segments within the Company’s loan portfolio.
Multi-Family and Non-Owner Occupied Commercial Real Estate Loans
The Company's base ALLL factor for multi-family and non-owner occupied commercial real estate loans is determined by Management using the Bank's actual trailing twenty-four month, trailing twelve month and annualized trailing six month charge-off data. Adjustments to those base factors are made for relevant internal and external factors. For multi-family and non-owner occupied commercial real estate loans, those factors include:
|
·
|
Changes in national, regional and local economic conditions, including trends in real estate values and the interest rate environment,
|
|
·
|
Changes in volume and severity of past due loans, the volume of nonaccrual loans, and the volume and severity of adversely classified or graded loans, and
|
|
·
|
The existence and effect of concentrations of credit, and changes in the level of such concentrations.
|
The resulting total ALLL factor is compared for reasonableness against the 10-year average, 15-year average, and trailing twelve month total charge-off data for all FDIC insured commercial banks and savings institutions based in California. This factor is applied to balances graded pass-1 through pass-5. For loans risk graded as watch or worse, progressively higher potential loss factors are applied based on Management’s judgment, taking into consideration the specific characteristics of the Bank’s portfolio and analysis of results from a select group of the Company’s peers.
Owner Occupied Commercial Real Estate Loans, Commercial Business Loans and SBA Loans
The Company's base ALLL factor for owner occupied commercial real estate loans, commercial business loans and SBA loans is determined by Management using the Bank's actual trailing twenty-four month, trailing twelve month and annualized trailing six month charge-off data. Adjustments to those base factors are made for relevant internal and external factors. For owner occupied commercial real estate loans, commercial business loans and SBA loans, those factors include:
|
·
|
Changes in national, regional and local economic conditions, including trends in real estate values and the interest rate environment,
|
|
·
|
Changes in the nature and volume of the loan portfolio, including new types of lending,
|
|
·
|
Changes in volume and severity of past due loans, the volume of nonaccrual loans, and the volume and severity of adversely classified or graded loans, and
|
|
·
|
The existence and effect of concentrations of credit, and changes in the level of such concentrations.
|
The resulting total ALLL factor is compared for reasonableness against the 10-year average, 15-year average, and trailing twelve month total charge-off data for all FDIC insured commercial banks and savings institutions based in California. This factor is applied to balances graded pass-1 through pass-5. For loans risk graded as watch or worse, progressively higher potential loss factors are applied based on Management’s judgment, taking into consideration the specific characteristics of the Bank’s portfolio and analysis of results from a select group of the Company’s peers.
Single Family and Consumer Loans
The Company's base ALLL factor for single family and consumer loans is determined by Management using the Bank's actual trailing twenty-four month, trailing twelve month and annualized trailing six month charge-off data. Adjustments to those base factors are made for relevant internal and external factors. For single family and consumer loans, those factors include:
|
·
|
Changes in national, regional and local economic conditions, including trends in real estate values and the interest rate environment.
|
The resulting total ALLL factor is compared for reasonableness against the 10-year average, 15-year average, and trailing twelve month total charge-off data for all FDIC insured commercial banks and savings institutions based in California. This factor is applied to balances graded pass-1 through pass-5. For loans risk graded as watch or worse, progressively higher potential loss factors are applied based on Management’s judgment, taking into consideration the specific characteristics of the Bank’s portfolio and analysis of results from a select group of the Company’s peers.
The following table summarizes the allocation of the allowance as well as the activity in the allowance attributed to various segments in the loan portfolio as of and for the year ended December 31, 2010:
|
Multi-family
|
Commercial investor
|
One-to-four family
|
Commercial owner occupied
|
Commercial and industrial
|
SBA
|
Other loans
|
Total
|
|||||||||||||||||||||||||
|
(dollars in thousands)
|
||||||||||||||||||||||||||||||||
|
Balance, December 31, 2009
|
$ | 3,386 | $ | 1,602 | $ | 272 | $ | 907 | $ | 2,410 | $ | 326 | $ | 2 | $ | 8,905 | ||||||||||||||||
|
Charge-offs
|
(334 | ) | (512 | ) | (123 | ) | (264 | ) | (708 | ) | (398 | ) | - | (2,339 | ) | |||||||||||||||||
|
Recoveries
|
- | - | 40 | - | 13 | 154 | 14 | 221 | ||||||||||||||||||||||||
|
Provisions for (reduction in) loan losses
|
(322 | ) | 490 | 143 | 1,044 | 641 | 63 | 33 | 2,092 | |||||||||||||||||||||||
|
Balance, December 31, 2010
|
$ | 2,730 | $ | 1,580 | $ | 332 | $ | 1,687 | $ | 2,356 | $ | 145 | $ | 49 | $ | 8,879 | ||||||||||||||||
|
Amount of allowance attributed to:
|
||||||||||||||||||||||||||||||||
|
Specifically evaluated impaired loans
|
$ | - | $ | 47 | $ | - | $ | - | $ | - | $ | - | $ | - | $ | 47 | ||||||||||||||||
|
General portfolio allocation
|
$ | 2,730 | $ | 1,533 | $ | 332 | $ | 1,687 | $ | 2,356 | $ | 145 | $ | 49 | $ | 8,832 | ||||||||||||||||
|
Loans individually evaluated for impairment
|
$ | 1,156 | $ | 2,068 | $ | 223 | $ | 2,225 | $ | 54 | $ | 1,092 | $ | - | $ | 6,817 | ||||||||||||||||
|
Specific reserves to total loans individually evaluated for impairment
|
0.00 | % | 2.27 | % | 0.00 | % | 0.00 | % | 0.00 | % | 0.00 | % | 0.00 | % | 0.69 | % | ||||||||||||||||
|
Loans collectively evaluated for impairment
|
$ | 242,428 | $ | 128,457 | $ | 20,095 | $ | 110,800 | $ | 54,633 | $ | 2,996 | $ | 1,417 | $ | 560,827 | ||||||||||||||||
|
General reserves to total loans collectively evaluated for impairment
|
1.13 | % | 1.19 | % | 1.65 | % | 1.52 | % | 4.31 | % | 4.84 | % | 3.46 | % | 1.57 | % | ||||||||||||||||
|
Total gross loans
|
$ | 243,584 | $ | 130,525 | $ | 20,318 | $ | 113,025 | $ | 54,687 | $ | 4,088 | $ | 1,417 | $ | 567,644 | ||||||||||||||||
|
Total allowance to gross loans
|
1.12 | % | 1.21 | % | 1.63 | % | 1.49 | % | 4.31 | % | 3.55 | % | 3.46 | % | 1.56 | % | ||||||||||||||||
The following table summarizes activity in the allowance for loan losses for the prior periods presented:
|
For the years ended December 31,
|
||||||||
|
2009
|
2008
|
|||||||
|
(dollars in thousands)
|
||||||||
|
Balance at beginning of period
|
$ | 5,881 | $ | 4,606 | ||||
|
Provision for loan losses
|
7,735 | 2,241 | ||||||
|
Loans charged-off:
|
||||||||
|
Real estate:
|
||||||||
|
Multi-family
|
(1,527 | ) | - | |||||
|
Commercial real estate
|
(317 | ) | - | |||||
|
One-to-four family
|
(125 | ) | (226 | ) | ||||
|
Business loans:
|
||||||||
|
Commercial owner occupied
|
(59 | ) | - | |||||
|
Commercial and industrial
|
(1,409 | ) | - | |||||
|
SBA
|
(906 | ) | (948 | ) | ||||
|
Other
|
(468 | ) | - | |||||
|
Total charge-offs
|
(4,811 | ) | (1,174 | ) | ||||
|
Recoveries
|
100 | 208 | ||||||
|
Balance at end of period
|
$ | 8,905 | $ | 5,881 | ||||
6. Other Real Estate Owned
Other real estate owned was $34,000 at December 31, 2010 and $3.4 million at December 31, 2009. The following summarizes the activity in the other real estate owned for the years ended December 31:
|
2010
|
2009
|
|||||||
|
(in thousands)
|
||||||||
|
Balance, beginning of year
|
$ | 3,380 | $ | 37 | ||||
|
Additions – foreclosures
|
3,564 | 4,533 | ||||||
|
Sales
|
(6,212 | ) | (871 | ) | ||||
|
Write downs
|
(698 | ) | (319 | ) | ||||
|
Balance, end of year
|
$ | 34 | $ | 3,380 | ||||
7. Premises and Equipment
Premises and equipment consisted of the following at December 31:
|
2010
|
2009
|
|||||||
|
(in thousands)
|
||||||||
|
Land
|
$ | 1,410 | $ | 1,410 | ||||
|
Premises
|
5,638 | 5,633 | ||||||
|
Leasehold improvements
|
2,467 | 2,444 | ||||||
|
Furniture, fixtures and equipment
|
4,010 | 3,672 | ||||||
|
Automobiles
|
107 | 83 | ||||||
|
Subtotal
|
13,632 | 13,242 | ||||||
|
Less: accumulated depreciation
|
(5,409 | ) | (4,529 | ) | ||||
|
Total
|
$ | 8,223 | $ | 8,713 | ||||
Depreciation expense was $991,000 for 2010, $1.0 million for 2009 and $967,000 for 2008.
8. Deposit Accounts
Deposit accounts and weighted average interest rates consisted of the following at December 31:
|
Weighted
|
Weighted
|
|||||||||||||||
|
2010
|
Average
|
2009
|
Average
|
|||||||||||||
|
Balance
|
Interest Rate
|
Balance
|
Interest Rate
|
|||||||||||||
|
(dollars in thousands)
|
||||||||||||||||
|
Transaction accounts
|
||||||||||||||||
|
Noninterest-bearing checking
|
$ | 47,229 | 0.00 | % | $ | 33,885 | 0.00 | % | ||||||||
|
Interest-bearing checking
|
21,137 | 0.14 | % | 22,406 | 0.39 | % | ||||||||||
|
Money market
|
113,333 | 0.97 | % | 77,687 | 1.17 | % | ||||||||||
|
Regular passbook
|
68,559 | 0.96 | % | 61,779 | 1.33 | % | ||||||||||
|
Total transaction accounts
|
250,258 | 0.72 | % | 195,757 | 0.93 | % | ||||||||||
|
Certificates of deposit accounts
|
||||||||||||||||
|
Up to $100,000
|
207,164 | 1.76 | % | 233,089 | 2.17 | % | ||||||||||
|
Over $100,000 to $250,000
|
165,871 | 1.91 | % | 154,021 | 2.24 | % | ||||||||||
|
Over $250,000
|
35,947 | 1.76 | % | 35,867 | 2.03 | % | ||||||||||
|
Total certificates of deposit accounts
|
408,982 | 1.82 | % | 422,977 | 2.18 | % | ||||||||||
|
Total deposits
|
$ | 659,240 | 1.40 | % | $ | 618,734 | 2.09 | % | ||||||||
The aggregate annual maturities of certificates of deposit accounts at December 31, 2010 are as follows:
|
2010
|
||||||||
|
Balance
|
Weighted average interest rate
|
|||||||
|
(in thousands)
|
||||||||
|
Within 3 months
|
$ | 56,476 | 1.62 | % | ||||
|
4 to 6 months
|
29,739 | 1.43 | % | |||||
|
7 to 12 months
|
150,580 | 1.89 | % | |||||
|
13 to 24 months
|
157,753 | 1.80 | % | |||||
|
25 to 36 months
|
2,145 | 2.75 | % | |||||
|
37 to 60 months
|
11,716 | 2.91 | % | |||||
|
Over 60 months
|
573 | 3.96 | % | |||||
|
Total
|
$ | 408,982 | 1.82 | % | ||||
The weighted average cost of deposits averaged 1.51% for 2010 and 2.38% for 2009.
Interest expense on deposit accounts for the years ended December 31 is summarized as follows:
|
2010
|
2009
|
2008
|
||||||||||
|
(in thousands)
|
||||||||||||
|
Checking accounts
|
$ | 55 | $ | 173 | $ | 246 | ||||||
|
Passbook accounts
|
716 | 545 | 431 | |||||||||
|
Money market accounts
|
939 | 711 | 771 | |||||||||
|
Certificates of deposit accounts
|
7,901 | 11,618 | 13,005 | |||||||||
|
Total
|
$ | 9,611 | $ | 13,047 | $ | 14,453 | ||||||
Accrued interest on deposits, which is included in accrued expenses and other liabilities, was $55,000 at December 31, 2010 and $90,000 at December 31, 2009.
9. Federal Home Loan Bank Advances and Other Borrowings
At December 31, 2010, FHLB borrowings totaled $40.0 million, compared to $63.0 million at December 31, 2009. FHLB advances were collateralized by real estate loans with an aggregate principal balance of $411.3 million and FHLB stock of $11.3 million at December 31, 2010 and real estate loans of $483.9 million and FHLB stock of $12.7 million at December 31, 2009.
The following table summarizes activities in advances from the FHLB for the periods indicated:
|
Years Ended December 31,
|
||||||||
|
2010
|
2009
|
|||||||
|
(dollars in thousands)
|
||||||||
|
Average balance outstanding
|
$ | 38,178 | $ | 127,653 | ||||
|
Maximum amount outstanding at any month-end during the year
|
63,000 | 150,000 | ||||||
|
Balance outstanding at end of year
|
40,000 | 63,000 | ||||||
|
Weighted average interest rate during the year
|
4.88 | % | 4.77 | % | ||||
In addition to the collateral securing existing advances, the Company had an additional $321.7 million in loans available at the FHLB as collateral for available advances of $187.7 million as of December 31, 2010.
Credit facilities have been established with Citigroup and Barclays Bank. The credit facilities are secured by pledged investment securities. At December 31, 2010 and 2009, the Company had borrowings of $18.5 million with Citigroup and $10.0 million with Barclays Bank. The borrowings are secured by MBS with an estimated fair value of $38.3 million.
At December 31, 2010, the Bank had unsecured lines of credit with seven correspondent banks for a total amount of $48.8 million. At December 31, 2010 and 2009, the Company had no outstanding balances against these lines. The following summarizes activities in other borrowings:
|
Year Ended December 31,
|
||||||||
|
2010
|
2009
|
|||||||
|
(dollars in thousands)
|
||||||||
|
Average balance outstanding
|
$ | 28,500 | $ | 28,500 | ||||
|
Maximum amount outstanding at any month-end during the year
|
28,500 | 28,500 | ||||||
|
Balance outstanding at end of year
|
28,500 | 28,500 | ||||||
|
Weighted average interest rate during the year
|
3.08 | % | 2.61 | % | ||||
10. Subordinated Debentures
On March 25, 2004 the Corporation issued $10,310,000 of Floating Rate Junior Subordinated Deferrable Interest Debentures (the “Debt Securities”) to PPBI Trust I, a statutory trust created under the laws of the State of Delaware. The Debt Securities are subordinated to effectively all borrowings of the Corporation and are due and payable on April 7, 2034. Interest is payable quarterly on the Debt Securities at three-month LIBOR plus 2.75% for a rate of 3.04% at December 31, 2010 and 3.03% at December 31 2009. The Debt Securities may be redeemed, in part or whole, on or after April 7, 2009 at the option of the Corporation, at par. The Debt Securities can also be redeemed at par if certain events occur that impact the tax treatment or the capital treatment of the issuance. The Corporation also purchased a 3% minority interest totaling $310,000 in PPBI Trust I. The balance of the equity of PPBI Trust I is comprised of mandatorily redeemable preferred securities (“Trust Preferred Securities”) and is included in other assets. PPBI Trust I sold $10,000,000 of Trust Preferred Securities to investors in a private offering.
11. Income Taxes
Income taxes for the years ended December 31 consisted of the following:
|
2010
|
2009
|
2008
|
||||||||||
|
(in thousands)
|
||||||||||||
|
Current income tax provision:
|
||||||||||||
|
Federal
|
$ | 1,697 | $ | 953 | $ | 1,750 | ||||||
|
State
|
602 | 791 | 517 | |||||||||
|
Total current income tax provision
|
2,299 | 1,744 | 2,267 | |||||||||
|
Deferred income tax provision (benefit):
|
||||||||||||
|
Federal
|
(121 | ) | (1,250 | ) | (1,578 | ) | ||||||
|
State
|
(95 | ) | (581 | ) | (656 | ) | ||||||
|
Total deferred income tax provision (benefit)
|
(216 | ) | (1,831 | ) | (2,234 | ) | ||||||
|
Total income tax provision (benefit)
|
$ | 2,083 | $ | (87 | ) | $ | 33 | |||||
A reconciliation from statutory federal income taxes to the Company's effective income taxes for the years ended December 31 are as follows:
|
2010
|
2009
|
2008
|
||||||||||
|
(in thousands)
|
||||||||||||
|
Statutory federal income tax provision (benefit)
|
$ | 2,149 | $ | (186 | ) | $ | 252 | |||||
|
California franchise tax (benefit), net of federal income tax effect
|
335 | 139 | (92 | ) | ||||||||
|
Other, including tax exempt income
|
(401 | ) | (40 | ) | (127 | ) | ||||||
|
Total
|
$ | 2,083 | $ | (87 | ) | $ | 33 | |||||
Deferred tax assets (liabilities) were comprised of the following temporary difference between the financial statement carrying amounts and the tax basis of assets at December 31:
|
2010
|
2009
|
|||||||
|
(in thousands)
|
||||||||
|
Deferred tax assets:
|
||||||||
|
Accrued expenses
|
$ | 842 | $ | 608 | ||||
|
Depreciation on premises and equipment
|
185 | 103 | ||||||
|
Net operating loss
|
4,490 | 4,807 | ||||||
|
Allowance for loan losses, net of bad debt charge-offs
|
3,981 | 3,991 | ||||||
|
Unrealized losses on available for sale securities
|
639 | 1,217 | ||||||
|
Capital loss on mutual funds
|
1,034 | 1,232 | ||||||
|
Other-than-temporary impairment
|
1,977 | 1,489 | ||||||
|
Other
|
21 | 18 | ||||||
|
Total deferred tax assets
|
13,169 | 13,465 | ||||||
|
Deferred tax liabilities:
|
||||||||
|
State taxes
|
(757 | ) | (695 | ) | ||||
|
Federal Home Loan Bank stock dividends
|
(1,073 | ) | (1,171 | ) | ||||
|
Restricted stock and options expense
|
7 | 7 | ||||||
|
Other
|
(243 | ) | (141 | ) | ||||
|
Total deferred tax liabilities
|
(2,066 | ) | (2,000 | ) | ||||
|
Net deferred tax asset
|
$ | 11,103 | $ | 11,465 | ||||
At December 31, 2010, there was no valuation allowance against the Company’s deferred tax asset. The Company has a net operating loss carryforward of approximately $11.4 million for federal income tax purposes which expires in 2023. In addition, the Company has a net operating loss carryforward of approximately $5.5 million for California franchise tax purposes. However, the state of California has suspended the net operating loss deduction utilization for the tax years 2009 and 2010. The net operating loss deduction for the state is now scheduled to expire in 2015. With the completion of the secondary offering in October 2003, the Company had an “ownership change” as defined under Internal Revenue Code Section 382. Under Section 382, which has also been adopted under California law, if during any three-year period there is more than a 50 percentage point change in the ownership of the Company, then the future use of any pre-change net operating losses or built-in losses of the Company may be subject to an annual percentage limitation based on the value of the company at the ownership change date. The ownership change reduced the net operating loss carryforward for federal tax purposes by $5.8 million and for state tax purposes by $3.3 million. The annual usable net operating loss carryforward going forward is approximately $932,000 per year.
As of December 31, 2010, tax years for 2005 through 2009 remain open to audit by the Internal Revenue Service and by the California state tax authority. Currently, the Bank is undergoing an examination of its 2005 and 2006 income tax returns by the California Franchise Tax Board. In connection with this examination, the state examiners reviewed, among other matters, whether our enterprise zone net interest deductions taken in tax years 2005 and 2006 are allowable. The enterprise zone net interest deductions for 2005 totaled $2.4 million and for 2006 totaled $2.2 million. After their review, the state disallowed our enterprise zone net interest deductions of $141,000 for the year ended December 31, 2005 and $121,000 for the year ended December 31, 2006. Based on their findings, the Company recorded an additional income tax for years 2005 through 2009 of $445,000.
12. Commitments, Contingencies and Concentrations of Risk
Legal Proceedings – In February 2004, the Bank was named in a class action lawsuit titled, “James Baker v. Century Financial, et al”, alleging various violations of Missouri's Second Mortgage Loans Act (the “Missouri Act”) by charging and receiving fees and costs that were either wholly prohibited by or in excess of that allowed by the Missouri Act relating to origination fees, interest rates, and other charges. The class action lawsuit was filed in the Circuit Court of Clay County, Missouri. The complaint seeks restitution of all improperly collected charges, interest plus the right to rescind the mortgage loans or a right to offset any illegal collected charges, interest against the principal amounts due on the loans and punitive damages. In March 2005, the Bank’s motion for dismissal due to limitations was denied by the trial court without comment. The Bank’s “preemption” motion was denied in August 2006. The Bank has answered the plaintiffs’ complaint and the parties have exchanged and answered initial discovery requests. When the record is more fully developed, the Bank intends to raise the limitations issue again in the form of a motion for summary judgment.
The Company is not involved in any other pending legal proceedings other than legal proceedings occurring in the ordinary course of business. Management believes that none of these legal proceedings, individually or in the aggregate, will have a material adverse impact on the results of operations or financial condition of the Company.
Lease Commitments – The Company leases a portion of its facilities from non-affiliates under operating leases expiring at various dates through 2023. The following schedule shows the minimum annual lease payments, excluding any renewals and extensions, property taxes, and other operating expenses, due under these agreements:
|
Year ending December 31,
|
||||
|
(in thousands)
|
||||
|
2011
|
$ | 663 | ||
|
2012
|
595 | |||
|
2013
|
587 | |||
|
2014
|
605 | |||
|
2015
|
580 | |||
|
Thereafter
|
2,708 | |||
|
Total
|
$ | 5,738 | ||
Rental expense under all operating leases totaled $676,000 for 2010, $646,000 for 2009, and $643,000 for 2008.
Share-Based Compensation – The following table provides a summary of the expenses the Company has recognized related to share-based compensation awards. The table below also shows the impact those expenses have had on diluted earnings per share and the remaining expense associated with those awards for the years ended December 31:
|
2010
|
2009
|
2008
|
||||||||||
|
(in thousands, except per share data)
|
||||||||||||
|
Share-based compensation expense:
|
||||||||||||
|
Stock option expense
|
$ | 86 | $ | 256 | $ | 214 | ||||||
|
Restricted stock expense
|
- | 15 | 112 | |||||||||
|
Total share-based compensation expense
|
86 | 271 | 326 | |||||||||
|
Total share-based compensation expense, net of tax
|
$ | 51 | $ | 160 | $ | 192 | ||||||
|
Diluted shares outstanding
|
11,057,404 | 5,642,589 | 6,210,387 | |||||||||
|
Impact on diluted earnings per share
|
$ | 0.005 | $ | 0.028 | $ | 0.031 | ||||||
|
Unrecognized compensation expense:
|
||||||||||||
|
Stock option expense
|
$ | 26 | $ | 148 | $ | 559 | ||||||
|
Restricted stock expense
|
- | - | 14 | |||||||||
|
Total unrecognized share-based compensation expense
|
26 | 148 | 573 | |||||||||
|
Total unrecognized share-based compensation expense, net of tax
|
$ | 15 | $ | 87 | $ | 338 | ||||||
Employment Agreements—The Company has entered into a three-year employment agreement with our Chief Executive Officer (“CEO”). This agreement provides for the payment of a base salary and a bonus based upon the CEO’s individual performance and the Company’s overall performance, provides a vehicle for the CEO’s use, and provides for the payment of severance benefits upon termination under specified circumstances. Additionally, the Bank has entered into three-year employment agreements with the Chief Banking Officer and the Chief Financial Officer. The agreements provide for the payment of a base salary, a bonus based upon the individual’s performance and the overall performance of the Bank and the payment of severance benefits upon termination under specified circumstances.
Availability of Funding Sources—The Company funds substantially all of the loans, which it originates or purchases, through deposits, internally generated funds, and/or borrowings. The Company competes for deposits primarily on the basis of rates, and, as a consequence, the Company could experience difficulties in attracting deposits to fund its operations if the Company does not continue to offer deposit rates at levels that are competitive with other financial institutions. To the extent that the Company is not able to maintain its currently available funding sources or to access new funding sources, it would have to curtail its loan production activities or sell loans earlier than is optimal. Any such event could have a material adverse effect on the Company’s results of operations, financial condition and cash flows.
13. Benefit Plans
401(k) Plan—The Bank maintains an Employee Savings Plan (the “401(k) Plan”) which qualifies under Section 401(k) of the Internal Revenue Code. Under the 401(k) Plan, employees may contribute between 1% to 50% of their compensation. In 2010, 2009 and 2008, the Bank matched 100% of contributions for the first three percent contributed and 50% on the next two percent contributed. Contributions made to the 401(k) Plan by the Bank amounted to $148,000 for 2010, $161,000 for 2009 and $186,000 for 2008.
Pacific Premier Bancorp, Inc. 2004 Long-Term Incentive Plan (the “Plan”)—The Plan was approved by the Corporation’s stockholders in May 2004. The Plan authorizes the granting of options equal to 525,500 shares of the common stock of the Corporation for issuances to executives, key employees, officers, and directors. The Plan will be in effect for a period of ten years from February 25, 2004, the date the Plan was adopted. Options granted under the Plan will be made at an exercise price equal to the fair market value of the stock on the date of grant. Awards granted to officers and employees may include incentive stock options, nonstatutory stock options and limited rights, which are exercisable only upon a change in control of the Corporation. The options granted pursuant to the Plan originally vested at a rate of 33.3% per year. On March 4, 2005, the Corporation chose to accelerate the vesting on all outstanding options.
Below is a summary of the activity in the Corporation’s 2000 Stock Incentive Plan and the Plan for the years ended December 31, 2010, 2009, and 2008.
|
2010
|
2009
|
2008
|
||||||||||||||||||||||
|
Shares
|
Weighted average exercise price per share
|
Shares
|
Weighted average exercise price per share
|
Shares
|
Weighted average exercise price per share
|
|||||||||||||||||||
|
Options outstanding at the beginning of the year
|
553,500 | $ | 8.74 | 633,550 | $ | 8.75 | 392,625 | $ | 10.72 | |||||||||||||||
|
Granted
|
- | - | - | - | 265,750 | 5.90 | ||||||||||||||||||
|
Exercised
|
(20,000 | ) | 3.44 | - | - | - | - | |||||||||||||||||
|
Forfeited & Expired
|
(28,000 | ) | 14.94 | (80,050 | ) | 8.78 | (24,825 | ) | 9.45 | |||||||||||||||
|
Options outstanding at the end of the year
|
505,500 | $ | 8.61 | 553,500 | $ | 8.74 | 633,550 | $ | 8.75 | |||||||||||||||
|
Options exercisable at the end of the year
|
431,250 | 374,250 | 376,800 | |||||||||||||||||||||
|
Weighted average remaining contractual life of options outstanding at end of year
|
5.5 Years
|
6.1 Years
|
7.0 Years
|
|||||||||||||||||||||
The aggregate intrinsic value (the amount by which a call option is in the money, calculated by taking the difference between the strike price and the market price of the underlier) of options outstanding was $202,000 at December 31, 2010, zero at December 31, 2009, and $11,000 at December 31, 2008.
The amount charged against compensation expense in relation to the stock options was $86,000 for 2010 and $256,000 for 2009. At December 31, 2010, unrecognized compensation expense related to the options is approximately $25,000 for 2011, and less than $1,000 for 2012.
There were no options granted under the Plan during 2010 or 2009. Options granted under the Plan during 2008 were valued using the Black-Scholes model with the following average assumptions:
|
Year Ended December 31, 2008
|
|
|
Expected volatility
|
29.3% to 66.2%
|
|
Expected term
|
10.0 Years
|
|
Expected dividends
|
None
|
|
Risk free rate
|
2.69% to 3.96%
|
|
Weighted-average grant date fair value
|
$2.57 to $2.81
|
During 2006, restricted stock awards were granted for 35,050 shares of the Corporation’s common stock. These shares vested with respect to each employee over a three-year period from the date of grant, provided the individual remains in the employment of the Company as of the vesting date. Additionally, these shares (or a portion thereof) could vest earlier in the event of a change in control of the Company. Compensation expenses relating to these grants were zero for 2010, $15,000 for 2009 and $112,000 for 2008. As of September 8, 2009, all restricted stock awards were fully vested. The table below summarizes the restricted stock award activity for the periods indicated.
|
2010
|
2009
|
2008
|
||||||||||||||||||||||
|
Weighted
|
Weighted
|
Weighted
|
||||||||||||||||||||||
|
Average
|
Average
|
Average
|
||||||||||||||||||||||
|
Restricted stock awards
|
Shares
|
Grant Price
|
Shares
|
Grant Price
|
Shares
|
Grant Price
|
||||||||||||||||||
|
Outstanding grants at beginning of year
|
- | $ | - | 8,900 | $ | 11.70 | 20,300 | $ | 11.63 | |||||||||||||||
|
Granted
|
- | - | - | - | - | - | ||||||||||||||||||
|
Vested
|
- | - | (8,900 | ) | 11.70 | (10,566 | ) | 11.58 | ||||||||||||||||
|
Cancelled
|
- | - | - | - | (834 | ) | 11.34 | |||||||||||||||||
|
Outstanding grants at end of year
|
- | $ | - | - | $ | - | 8,900 | $ | 11.70 | |||||||||||||||
Restricted stock awards were expensed evenly over the vesting period. At December 31, 2009 there was zero remaining to be expensed for restricted stock awards that had been granted under the Plan.
Salary Continuation Plan—The Bank implemented a non-qualified supplemental retirement plan in 2006 (the “Salary Continuation Plan”) for certain executive officers of the Bank. The Salary Continuation Plan is unfunded. The amounts expensed in 2010 and 2009 under the Salary Continuation Plan amounted to $71,000 and $36,000, respectively. As of December 31, 2010 and 2009, $389,000 and $327,000, respectively, were recorded in other liabilities on the consolidated statements of condition for the Salary Continuation Plan.
Directors’ Deferred Compensation Plan—The Bank created a Directors’ Deferred Compensation Plan in September 2006 which allows directors to defer board of directors’ fees. The deferred compensation is credited with interest by the Bank at prime plus one percent and the accrued liability is payable upon retirement or resignation. The Directors’ Deferred Compensation Plan is unfunded. The Company is under no obligation to make matching contributions to the plan. At December 31, 2010 the liability for the plan was $154,000 compared to $102,000, at December 31, 2009. The interest expense for 2010 was $5,000, compared to $3,000 for 2009 and $2,000 for 2008.
Long-Term Care Insurance Plan—The Bank implemented a Long-Term Care Insurance Plan in September 2006 for the executive officers and directors of the Bank. The non-employee directors may elect not to participate in the insurance plan. For those who opt out, the amount of the insurance premium, up to $4,000 annually, will be recorded each month to their deferred compensation account with interest. The expense for 2010 and 2009 was $34,000 and $35,000, respectively, for this plan. As of December 31, 2010 and 2009, $46,000 and $35,000, respectively, was recorded in other liabilities on the consolidated statements of condition for the insurance plan.
14. Financial Instruments with Off Balance Sheet Risk
The Company is a party to financial instruments with off- balance sheet risk in the normal course of business to meet the financing needs of its customers. These financial instruments include commitments to extend credit in the form of originating loans or providing funds under existing lines or letters of credit. These commitments are agreements to lend to a customer as long as there is no violation of any condition established in the contract. Commitments generally have fixed expiration dates and may require payment of a fee. Since many commitments are expected to expire, the total commitment amounts do not necessarily represent future cash requirements. Commitments involve, to varying degrees, elements of credit and interest rate risk in excess of the amounts recognized in the accompanying consolidated statements of financial condition.
The Company's exposure to credit loss in the event of nonperformance by the other party to the financial instrument for commitments to extend credit is represented by the contractual or notional amount of those instruments. The Company controls credit risk of its commitments to fund loans through credit approvals, limits and monitoring procedures. The Company uses the same credit policies in making commitments and conditional obligations as it does for on-balance sheet instruments. The Company evaluates each customer for creditworthiness.
The Company receives collateral to support commitments when deemed necessary. The most significant categories of collateral include real estate properties underlying mortgage loans, liens on personal property and cash on deposit with the Bank.
The Company maintains an allowance for credit losses to provide for commitments related to loans associated with undisbursed loan funds and unused lines of credit. The allowance for these commitments was $77,000 at December 31, 2010 and $13,000 at December 31, 2009.
The Company’s commitments to extend credit at December 31, 2010 were $34.7 million and at December 31, 2009 was $13.0 million. The 2010 balance is primarily composed of $30.4 million of undisbursed C&I loans.
15. Fair Value of Financial Instruments
Fair Value of Financial Instruments—The Company’s estimated fair value amounts have been determined by the Company using available market information and appropriate valuation methodologies.
However, considerable judgment is required to develop the estimates of fair value. Accordingly, the estimates are not necessarily indicative of the amounts the Company could have realized in a current market exchange. The use of different market assumptions and/or estimation methodologies may have a material effect on the estimated fair value amounts.
Although management is not aware of any factors that would significantly affect the estimated fair value amounts, such amounts have not been comprehensively revalued for purposes of these financial statements since the balance sheet date and, therefore, current estimates of fair value may differ significantly from the amounts presented.
Cash and Cash Equivalents—The carrying amount approximates fair value due to their short-term repricing characteristics.
Securities Available for Sale—Fair values are based on quoted market prices from securities dealers or readily available market quote systems.
FHLB and Federal Reserve Bank Stock – The carrying value approximates the fair value based upon the redemption provisions of the stock.
Loans Held for Sale—Fair values are based on quoted market prices or dealer quotes.
Loans Held for Investment—The fair value of gross loans receivable has been estimated using the present value of cash flow method, discounting expected future cash flows by estimated market interest rates for loans with similar characteristics, including credit ratings and maturities. Consideration is also given to estimated prepayments and credit losses.
Accrued Interest Receivable/Payable—The carrying amount approximates fair value.
Deposit Accounts—The fair value disclosed for checking, passbook and money market accounts is the amount payable on demand at the reporting date. The fair value of certificates of deposit accounts is estimated using a discounted cash flow calculation based on interest rates currently offered for certificate of deposits of similar remaining maturities.
FHLB Advances and Other Borrowings—The fair value disclosed for FHLB advances and other borrowings is determined by discounting contractual cash flows at current market interest rates for similar instruments with similar terms.
Subordinated Debentures – The fair value of subordinated debentures is estimated by discounting the balance by the current three-month LIBOR rate plus the current market spread. The fair value is determined based on the maturity date as the Company does not currently have intentions to call the debenture.
Off-balance sheet commitments and standby letters of credit – The notional amount disclosed for off-balance sheet commitments and standby letters of credit is the amount available to be drawn down all lines and letters of credit. The cost to assume is calculated at 10% of the notional amount.
The fair value estimates presented herein are based on pertinent information available to management as of December 31, 2010 and 2009.
|
|
At December 31, 2010
|
|||||||
|
Carrying
|
Estimated
|
|||||||
|
Amount
|
Fair Value
|
|||||||
|
(in thousands)
|
||||||||
|
Assets:
|
||||||||
|
Cash and cash equivalents
|
$ | 63,462 | $ | 63,462 | ||||
|
Securities available for sale
|
155,094 | 155,094 | ||||||
|
Federal Reserve Bank and FHLB stock, at cost
|
13,334 | 13,334 | ||||||
|
Loans held for investment, net
|
555,538 | 603,749 | ||||||
|
Accrued interest receivable
|
3,755 | 3,755 | ||||||
|
Liabilities:
|
||||||||
|
Deposit accounts
|
659,240 | 670,776 | ||||||
|
FHLB advances
|
40,000 | 40,032 | ||||||
|
Other borrowings
|
28,500 | 30,052 | ||||||
|
Subordinated debentures
|
10,310 | 5,232 | ||||||
|
Accrued interest payable
|
125 | 125 | ||||||
|
Notional Amount
|
Cost to Cede
or Assume
|
|||||||
|
Off-balance sheet commitments and standby letters of credit
|
$ | 34,706 | $ | 3,471 | ||||
|
|
At December 31, 2009
|
|||||||
|
Carrying
|
Estimated
|
|||||||
|
Amount
|
Fair Value
|
|||||||
|
(in thousands)
|
||||||||
|
Assets:
|
||||||||
|
Cash and cash equivalents
|
$ | 59,706 | $ | 59,706 | ||||
|
Securities available for sale
|
123,407 | 123,407 | ||||||
|
Federal Reserve Bank and FHLB stock, at cost
|
14,330 | 14,330 | ||||||
|
Loans held for sale, net
|
- | - | ||||||
|
Loans held for investment, net
|
566,584 | 558,901 | ||||||
|
Accrued interest receivable
|
3,520 | 3,520 | ||||||
|
Liabilities:
|
||||||||
|
Deposit accounts
|
618,734 | 632,135 | ||||||
|
FHLB advances
|
63,000 | 64,666 | ||||||
|
Other borrowings
|
28,500 | 35,384 | ||||||
|
Subordinated debentures
|
10,310 | 5,378 | ||||||
|
Accrued interest payable
|
161 | 161 | ||||||
|
Notional Amount
|
Cost to Cede
or Assume
|
|||||||
|
Off-balance sheet commitments and standby letters of credit
|
$ | 13,027 | $ | 1,303 | ||||
16. Fair Value Disclosures
Fair value is the exchange price that would be received for an asset or paid to transfer a liability (an exit price) in the principal or most advantageous market for the asset or liability in an orderly transaction between market participants on the measurement date. The fair value hierarchy prioritizes inputs to valuation techniques used in fair value calculations. The three levels of inputs are defined as follows:
Level 1 – unadjusted quoted prices for identical assets or liabilities in active markets accessible by the Company
Level 2 – inputs that are observable in the marketplace other than those inputs classified as Level 1
Level 3 – inputs that are unobservable in the marketplace and significant to the valuation
The Company maximizes the use of observable inputs and minimizes the use of unobservable inputs. If a financial instrument uses inputs that fall in different levels of the hierarchy, the instrument will be categorized based upon the lowest level of input that is significant to the fair value calculation.
The Company’s financial assets and liabilities measured at fair value on a recurring basis include securities available for sale, loans held for sale, and impaired loans. Securities available for sale include mortgage-backed securities and equity securities. Loans held for sale include the guarantee portion of our saleable SBA loans. Impaired loans include loans that are in a non-accrual status and where the Bank has reduced the principal to the value of the underlying collateral less the anticipated selling cost.
Marketable Securities. Where possible, the Company utilizes quoted market prices to measure debt and equity securities; such items are classified as Level 1 in the hierarchy and include equity securities, US government bonds and securities issued by federally sponsored agencies. When quoted market prices for identical assets are unavailable or the market for the asset is not sufficiently active, varying valuation techniques are used. Common inputs in valuing these assets include, among others, benchmark yields, issuer spreads, forward mortgage-backed securities trade prices and recently reported trades. Such assets are classified as Level 2 in the hierarchy and typically include private label mortgage-backed securities and corporate bonds. Pricing on these securities are provided to the Company by a pricing service vendor. In the Level 3 category, the Company is classifying all the securities that our pricing service vendor cannot price due to lack of trade activity in these securities.
Loans held for sale. The fair value of loans held for sale is determined, when possible, using quoted secondary-market prices. If no such quoted price exists, the fair value of a loan is determined using quoted prices for a similar asset or assets, adjusted for the specific attributes of that loan.
A loan is considered impaired when it is probable that payment of interest and principal will not be made in accordance with the contractual terms of the loan agreement. Impairment is measured based on the fair value of the underlying collateral or the discounted expected future cash flows. The Company measures impairment on all non-accrual loans for which it has reduced the principal balance to the value of the underlying collateral less the anticipated selling cost. As such, the Company records impaired loans as non-recurring Level 2 when the fair value of the underlying collateral is based on an observable market price or current appraised value. When current market prices are not available or the Company determines that the fair value of the underlying collateral is further impaired below appraised values, the Company records impaired loans as Level 3. At December 31, 2010, substantially all the Company’s impaired loans were evaluated based on the fair value of their underlying collateral based upon the most recent appraisal available to management.
The Company’s valuation methodologies may produce a fair value calculation that may not be indicative of net realizable value or reflective of future fair values. While management believes the Company’s valuation methodologies are appropriate and consistent with other market participants, the use of different methodologies or assumptions to determine the fair value of certain financial instruments could result in a different estimate of fair value at the reporting date.
The following fair value hierarchy table presents information about the Company’s assets measured at fair value on a recurring basis at the dates indicated:
|
At December 31, 2010
|
||||||||||||||||
|
Fair Value Measurement Using
|
||||||||||||||||
|
Level 1
|
Level 2
|
Level 3
|
Assets at
Fair Value
|
|||||||||||||
|
(in thousands)
|
||||||||||||||||
|
Assets
|
||||||||||||||||
|
Marketable securities
|
$ | 150,499 | $ | 3,090 | $ | 1,505 | $ | 155,094 | ||||||||
|
Total assets
|
$ | 150,499 | $ | 3,090 | $ | 1,505 | $ | 155,094 | ||||||||
|
At December 31, 2009
|
||||||||||||||||
|
Fair Value Measurement Using
|
||||||||||||||||
|
Level 1
|
Level 2
|
Level 3
|
Assets at
Fair Value
|
|||||||||||||
|
(in thousands)
|
||||||||||||||||
|
Assets
|
||||||||||||||||
|
Marketable securities
|
$ | 117,729 | $ | 5,055 | $ | 623 | $ | 123,407 | ||||||||
|
Total assets
|
$ | 117,729 | $ | 5,055 | $ | 623 | $ | 123,407 | ||||||||
The following table provides a summary of the changes in balance sheet carrying values associated with Level 3 financial instruments during the twelve months ended December 31, 2010:
|
Fair Value Measurement Using
|
||||
|
Significant Other Unobservable Inputs
|
||||
|
(Level 3)
|
||||
|
Marketable
|
||||
|
securities
|
||||
|
Beginning Balance, January 1, 2010
|
$ | 623 | ||
|
Total gains or losses (realized/unrealized):
|
||||
|
Included in earnings (or changes in net assets)
|
(195 | ) | ||
|
Included in other comprehensive income
|
(139 | ) | ||
|
Purchases, issuances, and settlements
|
(63 | ) | ||
|
Transfer in and/or out of Level 3
|
1,279 | |||
|
Ending Balance, December 31, 2010
|
$ | 1,505 | ||
The following table provides a summary of the financial instruments the Company measures at fair value on a non-recurring basis as of December 31, 2010:
|
Fair Value Measurement Using
|
||||||||||||||||
|
Level 1
|
Level 2
|
Level 3
|
Assets at Fair Value
|
|||||||||||||
|
(in thousands)
|
||||||||||||||||
|
Assets
|
||||||||||||||||
|
Impaired Loans
|
$ | - | $ | 6,818 | $ | - | $ | 6,818 | ||||||||
|
Other real estate owned
|
- | 34 | - | 34 | ||||||||||||
|
Total assets
|
$ | - | $ | 6,852 | $ | - | $ | 6,852 | ||||||||
17. Earnings (loss) Per Share
Earnings (loss) per share of common stock is calculated on both a basic and diluted basis based on the weighted average number of common and common equivalent shares outstanding, excluding common shares in treasury. Basic earnings (loss) per share excludes dilution and is computed by dividing income available to stockholders by the weighted average number of common shares outstanding for the period. Diluted earnings per share reflects the potential dilution that could occur if securities or other contracts to issue common stock were exercised or converted into common stock or resulted from the issuance of common stock that then would share in earnings.
A reconciliation of the numerators and denominators used in basic and diluted earnings per share computations is presented in the table below. Excluded from the diluted earnings per share calculation were options of 448,332 for the year ended December 31, 2010 and 606,050 for the year ended December 31, 2008, as the exercise prices exceeded the stock price at the end of each period. For the year ended December 31, 2009, 533,500 options and 966,400 warrants were excluded from the diluted earnings per share calculation due to the Company recording a net loss for the year.
|
Income/(Loss)
|
Shares
|
Per Share
|
||||||||||
|
(numerator)
|
(denominator)
|
Amount
|
||||||||||
|
(dollars in thousands, except share data)
|
||||||||||||
|
For the year ended December 31, 2010:
|
||||||||||||
|
Net income applicable to earnings per share
|
$ | 4,238 | ||||||||||
|
Basic earnings per share: Income available to common stockholders
|
4,238 | 10,033,836 | $ | 0.42 | ||||||||
|
Effect of dilutive securities : Warrants and stock option plans
|
- | 1,023,568 | ||||||||||
|
Diluted earnings per share: Income available to common stockholders
|
$ | 4,238 | 11,057,404 | $ | 0.38 | |||||||
|
For the year ended December 31, 2009:
|
||||||||||||
|
Net loss applicable to earnings per share
|
$ | (460 | ) | |||||||||
|
Basic loss per share: loss available to common stockholders
|
(460 | ) | 5,642,589 | $ | (0.08 | ) | ||||||
|
Diluted loss per share: loss available to common stockholders
|
$ | (460 | ) | 5,642,589 | $ | (0.08 | ) | |||||
|
For the year ended December 31, 2008:
|
||||||||||||
|
Net income applicable to earnings per share
|
$ | 708 | ||||||||||
|
Basic earnings per share: Income available to common stockholders
|
708 | 4,948,359 | $ | 0.14 | ||||||||
|
Effect of dilutive securities : Warrants and stock option plans
|
- | 1,262,028 | ||||||||||
|
Diluted earnings per share: Income available to common stockholders
|
$ | 708 | 6,210,387 | $ | 0.11 | |||||||
18. Related Parties
Loans to our executive officers and directors are made in the ordinary course of business and are made on substantially the same terms as comparable transactions. In 2009, the Bank had three loans outstanding to the partnership of McKennon Wilson & Morgan LLP, of which Michael L. McKennon, a director of the Corporation, is a partner. All three of these loans were paid off in April 2009. There were no new loans made or outstanding to any officers or directors in 2010.
The following table shows the activity of loans to all officers and directors of the Company for the periods specified:
|
2010
|
2009
|
|||||||
|
(in thousands)
|
||||||||
|
Balance, beginning of year
|
$ | - | $ | 422 | ||||
|
Originations/advances
|
- | - | ||||||
|
Principal payments
|
- | 422 | ||||||
|
Balance, end of year
|
$ | - | $ | - | ||||
At the end of 2010 we had related party deposits of $1.4 million, compared to $1.5 million at the end of 2009.
19. Quarterly Results of Operations (Unaudited)
The following is a summary of selected financial data presented below by quarter for the years ended December 31:
|
First
|
Second
|
Third
|
Fourth
|
|||||||||||||
|
Quarter
|
Quarter
|
Quarter
|
Quarter
|
|||||||||||||
|
(dollars in thousands, except per share data)
|
||||||||||||||||
|
2010
|
||||||||||||||||
|
Interest income
|
$ | 10,184 | $ | 9,990 | $ | 10,480 | $ | 10,449 | ||||||||
|
Interest expense
|
3,524 | 3,148 | 3,078 | 2,916 | ||||||||||||
|
Provision for estimated loan losses
|
1,056 | 639 | 397 | - | ||||||||||||
|
Noninterest income (loss)
|
(726 | ) | (1,038 | ) | 674 | 14 | ||||||||||
|
Noninterest expense
|
4,322 | 4,808 | 4,809 | 5,009 | ||||||||||||
|
Income tax provision
|
100 | 20 | 1,025 | 938 | ||||||||||||
|
Net income
|
$ | 456 | $ | 337 | $ | 1,845 | $ | 1,600 | ||||||||
|
Earnings per share:
|
||||||||||||||||
|
Basic
|
$ | 0.05 | $ | 0.03 | $ | 0.18 | $ | 0.16 | ||||||||
|
Diluted
|
$ | 0.04 | $ | 0.03 | $ | 0.17 | $ | 0.14 | ||||||||
|
2009
|
||||||||||||||||
|
Interest income
|
$ | 10,952 | $ | 11,295 | $ | 10,757 | $ | 10,435 | ||||||||
|
Interest expense
|
5,675 | 5,306 | 5,004 | 4,269 | ||||||||||||
|
Provision for estimated loan losses
|
1,160 | 2,374 | 2,001 | 2,200 | ||||||||||||
|
Noninterest income
|
630 | (328 | ) | 256 | 139 | |||||||||||
|
Noninterest expense
|
3,930 | 4,592 | 4,119 | 4,053 | ||||||||||||
|
Income tax provision (benefit)
|
280 | (592 | ) | (104 | ) | 329 | ||||||||||
|
Net income (loss)
|
$ | 537 | $ | (713 | ) | $ | (7 | ) | $ | (277 | ) | |||||
|
Earnings (loss) per share:
|
||||||||||||||||
|
Basic
|
$ | 0.11 | $ | (0.15 | ) | -- | $ | (0.04 | ) | |||||||
|
Diluted
|
$ | 0.09 | $ | (0.15 | ) | -- | $ | (0.04 | ) | |||||||
20. Parent Company Financial Information
The Corporation is a California-based bank holding company organized in 1997 as a Delaware corporation and owns 100% of the capital stock of the Bank, its principal operating subsidiary. The Bank was incorporated and commenced operations in 1983. Condensed financial statements of the Corporation are as follows:
|
PACIFIC PREMIER BANCORP, INC.
|
||||||||
|
STATEMENTS OF FINANCIAL CONDITION
|
||||||||
|
(Parent company only)
|
||||||||
|
At December 31,
|
||||||||
|
2010
|
2009
|
|||||||
|
(in thousands)
|
||||||||
|
Assets:
|
||||||||
|
Cash and cash equivalents
|
$ | 1,248 | $ | 1,581 | ||||
|
Investment in subsidiaries
|
83,101 | 77,590 | ||||||
|
Deferred income taxes
|
4,574 | 4,573 | ||||||
|
Other assets
|
328 | 326 | ||||||
|
Total Assets
|
$ | 89,251 | $ | 84,070 | ||||
|
Liabilities:
|
||||||||
|
Subordinated debentures
|
$ | 10,310 | $ | 10,310 | ||||
|
Accrued expenses and other liabilities
|
339 | 258 | ||||||
|
Total Liabilities
|
10,649 | 10,568 | ||||||
|
Total Stockholders’ Equity
|
78,602 | 73,502 | ||||||
|
Total Liabilities and Stockholders’ Equity
|
$ | 89,251 | $ | 84,070 | ||||
|
PACIFIC PREMIER BANCORP, INC.
|
||||||||||||
|
STATEMENTS OF OPERATIONS
|
||||||||||||
|
(Parent company only)
|
||||||||||||
|
For the Years Ended December 31,
|
||||||||||||
|
2010
|
2009
|
2008
|
||||||||||
|
(in thousands)
|
||||||||||||
|
Income:
|
||||||||||||
|
Interest income
|
$ | 9 | $ | 23 | $ | 6 | ||||||
|
Noninterest income
|
35 | 26 | 76 | |||||||||
|
Total income
|
44 | 49 | 82 | |||||||||
|
Expense:
|
||||||||||||
|
Interest expense
|
314 | 368 | 649 | |||||||||
|
Noninterest expense
|
488 | 642 | 552 | |||||||||
|
Total expense
|
802 | 1,010 | 1,201 | |||||||||
|
Loss before income tax provision
|
(758 | ) | (961 | ) | (1,119 | ) | ||||||
|
Income tax benefit
|
(312 | ) | (395 | ) | (459 | ) | ||||||
|
Net loss (parent only)
|
(446 | ) | (566 | ) | (660 | ) | ||||||
|
Equity in net earnings of subsidiaries
|
4,684 | 106 | 1,368 | |||||||||
|
Net income (loss)
|
$ | 4,238 | $ | (460 | ) | $ | 708 | |||||
|
PACIFIC PREMIER BANCORP, INC.
|
||||||||||||
|
SUMMARY STATEMENTS OF CASH FLOWS
|
||||||||||||
|
(Parent company only)
|
||||||||||||
|
For the Years Ended December 31,
|
||||||||||||
|
2010
|
2009
|
2008
|
||||||||||
|
CASH FLOWS FROM OPERATING ACTIVITIES
|
(in thousands)
|
|||||||||||
|
Net income (loss)
|
$ | 4,238 | $ | (460 | ) | $ | 708 | |||||
|
Adjustments to reconcile net income to cash used in operating activities:
|
||||||||||||
|
Share-based compensation expense
|
86 | 271 | 333 | |||||||||
|
Equity in net earnings of subsidiaries
|
(4,684 | ) | (106 | ) | (1,368 | ) | ||||||
|
Increase (decrease) in accrued expenses and other liabilities
|
81 | 126 | (130 | ) | ||||||||
|
Increase in current and deferred taxes
|
(1 | ) | (34 | ) | (41 | ) | ||||||
|
Decrease (increase) in other assets
|
(53 | ) | 3 | 51 | ||||||||
|
Net cash used in operating activities
|
(333 | ) | (200 | ) | (447 | ) | ||||||
|
CASH FLOWS FROM INVESTING ACTIVITIES:
|
||||||||||||
|
Investment in subsidiaries
|
- | (14,000 | ) | - | ||||||||
|
Net cash used in investing activities
|
- | (14,000 | ) | - | ||||||||
|
CASH FLOWS FROM FINANCING ACTIVITIES:
|
||||||||||||
|
Dividend from Bank
|
- | - | 2,700 | |||||||||
|
Proceeds from issuance of common stock, net of issuance cost
|
- | 15,241 | ||||||||||
|
Repurchase of common stock
|
- | (383 | ) | (2,074 | ) | |||||||
|
Proceeds from exercise of warrants
|
- | 150 | - | |||||||||
|
Net cash provided by financing activities
|
- | 15,008 | 626 | |||||||||
|
Net Increase (Decrease) In Cash And Cash Equivalents
|
(333 | ) | 808 | 179 | ||||||||
|
Cash And Cash Equivalents, Beginning Of Year
|
1,581 | 773 | 594 | |||||||||
|
Cash And Cash Equivalents, End Of Year
|
$ | 1,248 | $ | 1,581 | $ | 773 | ||||||
21. Subsequent Events
Acquisition of Canyon National Bank
On February 11, 2011, we entered into a modified whole-bank purchase and assumption agreement without loss share with the FDIC, the receiver of Canyon National Bank to purchase certain assets and assume certain liabilities of Canyon National Bank (the “P&A Agreement”). The purchase price reflected an asset discount of
$27.9 million and no deposit premium.
At December 31, 2010 Canyon National Bank reported gross loans totaling $166.3 million and deposits totaling $205.3 million. Balances are subject to change based upon the activities between the bid valuation date and the purchase date. The assets acquired and liabilities assumed are also subject to fair value adjustments in accordance with FASB ASC 805, Business Combinations upon finalizing the valuation process.
Due to the timing of the acquisition and the substantial effort required to determine the fair values of the assets purchased and liabilities assumed, the accounting for the acquisition is not complete at the time the accompanying consolidated financial statements are filed. Until the fair values are established, any goodwill or bargain purchase gain to be recognized resulting from the acquisition during the first quarter of 2011 has not been determined.
The P&A Agreement only covers designated assets and liabilities of Canyon National Bank. Common stock of Canyon National Bank, certain assets and certain liabilities, such as claims against any officer, director, employee, accountant, attorney, or any other person employed by the former Canyon National Bank, were not purchased or assumed by us.
Purchase of Warrants
On February 11, 2011, the Company repurchased two outstanding warrants that were exercisable for an aggregate of 600,000 shares a strike price of $0.75 per share of the Company’s common stock in a private transaction. The purchase reduced the outstanding warrants from 966,400 to 366,400. The result of this repurchase was to reduce the total amount of fully diluted outstanding shares by approximately 5.4%.
None
Evaluation of Disclosure Controls and Procedures
Our management, with the participation of our Chief Executive Officer and Chief Financial Officer, evaluated the effectiveness of our disclosure controls and procedures pursuant to Rule 13a-15 under the Exchange Act, as of the end of the period covered by this report. In designing and evaluating the disclosure controls and procedures, management recognizes that any controls and procedures, no matter how well designed and operated, can provide only reasonable assurance of achieving the desired control objectives. In addition, the design of disclosure controls and procedures must reflect the fact that there are resource constraints and that management is required to apply its judgment in evaluating the benefits of possible controls and procedures relative to their costs.
Based on our evaluation, our Chief Executive Officer and Chief Financial Officer concluded that the Company’s disclosure controls and procedures are effective as of the end of the period covered by this report in providing reasonable assurance that information we are required to disclose in reports that we file or submit under the Exchange Act is recorded, processed, summarized and reported within the time periods specified in the SEC’s rules and forms, and that such information is accumulated and communicated to our management, including our Chief Executive Officer and Chief Financial Officer, as appropriate, to allow timely decisions regarding required disclosure.
Management’s Report on Internal Control over Financial Reporting
Our management is responsible for establishing and maintaining adequate internal control over financial reporting as defined in Rules 13a-15(f) and 15d-15(f) under the Exchange Act. Our internal control over financial reporting is designed to provide reasonable assurance regarding the reliability of financial reporting and the preparation of financial statements for external purposes in accordance with United States generally accepted accounting principles. Our internal control over financial reporting includes those policies and procedures that:
|
(1)
|
pertain to the maintenance of records that, in reasonable detail, accurately and fairly reflect the transactions and dispositions of our assets;
|
|
(2)
|
provide reasonable assurance that transactions are recorded as necessary to permit preparation of financial statements in accordance with United States generally accepted accounting principles, and that our receipts and expenditures are being made only in accordance with the authorization of its management and directors; and
|
|
(3)
|
provide reasonable assurance regarding prevention or timely detection of unauthorized acquisition, use or disposition of our assets that could have a material effect on the financial statements.
|
Our management assessed the effectiveness of its internal control over financial reporting as of December 31, 2010. In making this assessment, management used the framework set forth in the report entitled “Internal Control—Integrated Framework” issued by the Committee of Sponsoring Organizations of the Treadway Commission, or COSO. The COSO framework summarizes each of the components of a company’s internal control system, including (i) the control environment, (ii) risk assessment, (iii) control activities, (iv) information and communication, and (v) monitoring. Based on this assessment, our management believes that, as of December 31, 2010, our internal control over financing reporting is effective based on those criteria.
The Company’s Annual Report on Form 10-K does not include an attestation report of our registered public accounting firm regarding internal control over financial reporting. Management’s report was not subject to attestation by the Company’s registered public accounting firm pursuant to temporary rules of the SEC that permit the Company to provide only management’s report in its Annual Report on Form 10-K.
Changes in Internal Control over Financial Reporting
We regularly review our system of internal control over financial reporting and make changes to our processes and systems to improve controls and increase efficiency, while ensuring that we maintain an effective internal control environment. Changes may include such activities as implementing new, more efficient systems, consolidating activities, and migrating processes.
There were no changes in our internal controls over financial reporting during the fiscal period to which this report relates that has materially affected, or is reasonably likely to materially affect, our internal control over financial reporting.
None
The information required by this item with respect to our directors and certain corporate governance practices is contained in our Proxy Statement for our 2011 Annual Meeting of Stockholders (the “Proxy Statement”), expected to be filed with the SEC within 120 days after the end of the Company’s fiscal year ended December 31, 2010, under the headings “Corporate Governance;” “Item 1—Election of Directors;” and “Section 16(a) Beneficial Ownership Reporting Compliance,” which information is incorporated herein by reference. The information required by this item with respect to our executive officers is contained in the Proxy Statement under the headings “Corporate Governance” and “Section 16(a) Beneficial Ownership Reporting Compliance,” which information is incorporated herein by reference.
We maintain a code of ethics applicable to our Board of Directors, principal executive officer, and principal financial officer, as well as all of our other employees. Our code of ethics can be found on our internet website located at www.ppbi.com.
The information required by this item is contained in the Proxy Statement under the headings “Executive Compensation;” “Compensation Committee Interlocks and Insider Participation;” and “Compensation Committee Report,” which information is incorporated herein by reference.
Equity Compensation Plan Information
The following table provides information as of December 31, 2010, with respect to options outstanding and available under the Company’s 2000 Stock Incentive Plan and the Company’s 2004 Long-Term Incentive Plan.
|
Plan Category
|
Number of Securities to be Issued Upon Exercise of Outstanding Options/Warrants
|
Weighted-Average Exercise Price of Outstanding Options/Warrants
|
Number of Securities Remaining Available for Future Issuance
|
|||||||||
|
Equity compensation plans approved by security holders:
|
||||||||||||
|
2000 & 2004 Stock Incentive Plans
|
505,500 | $ | 8.61 | 66,101 | ||||||||
|
Equity compensation plans not approved by security holders:
|
- | - | - | |||||||||
|
Total Equity Compensation plans
|
505,500 | $ | 8.61 | 66,101 | ||||||||
Additional information required by this item is contained in the Proxy Statement under the headings “Principal Holders of Common Stock” and “Security Ownership of Directors and Executives Officers,” which information is incorporated herein by reference.
The information required by this item is contained in the Proxy Statement under the headings “Transactions with Certain Related Persons” and “Item 1—Election of Directors”, which information is incorporated herein by reference.
The information required by this item is contained in the Proxy Statement under the heading “Item 2—Ratification of Appointment of Independent Auditors,” which information is incorporated herein by reference.
(a) Documents filed as part of this report.
|
|
(1)
|
The following financial statements are incorporated by reference from Item 8 hereof:
|
Independent Auditors’ Report.
Consolidated Statements of Financial Condition as of December 31, 2010 and 2009.
Consolidated Statements of Operations for the Years Ended December 31, 2010, 2009 and 2008.
Consolidated Statement of Stockholders’ Equity and Other Comprehensive Income for the Years Ended December 31, 2010, 2009 and 2008.
Consolidated Statements of Cash Flows for the Years Ended December 31, 2010, 2009 and 2008.
Notes to Consolidated Financial Statements.
|
|
(2)
|
All schedules for which provision is made in the applicable accounting regulation of the SEC are omitted because they are not applicable or the required information is included in the consolidated financial statements or related notes thereto.
|
|
|
(3)
|
The following exhibits are filed as part of this Form 10-K, and this list includes the Exhibit Index.
|
|
Exhibit No.
|
Description
|
|
3.1.0
|
Certificate of Incorporation of Pacific Premier Bancorp, Inc. (1)
|
|
3.1.1
|
First Certificate of Amendment to Certificate of Incorporation of Pacific Premier Bancorp, Inc. (2)
|
|
3.1.2
|
Second Certificate of Amendment to Certificate of Incorporation of Pacific Premier Bancorp, Inc. (2)
|
|
3.1.3
|
Third Certificate of Amendment to Certificate of Incorporation of Pacific Premier Bancorp, Inc. (2)
|
|
3.1.4
|
Fourth Certificate of Amendment to Certificate of Incorporation of Pacific Premier Bancorp, Inc. (3)
|
|
3.2
|
Bylaws of Pacific Premier Bancorp, Inc., as amended. (1)
|
|
4.1
|
Specimen Stock Certificate of Pacific Premier Bancorp, Inc. (4)
|
|
4.2
|
Form of Warrant to Purchase Shares of Common Stock of Pacific Premier Bancorp, Inc. (5)
|
|
4.3
|
Indenture from PPBI Trust I. (7)
|
|
10.1
|
2000 Stock Incentive Plan. (6)*
|
|
10.2
|
Employment Agreement between Pacific Premier Bancorp, Inc. and Pacific Premier Bank and Steven Gardner dated January 1, 2011. (10)*
|
|
10.3
|
Employment Agreement between Pacific Premier Bancorp, Inc. and Pacific Premier Bank and Kent Smith dated January 1, 2011. (10)*
|
|
10.4
|
Employment Agreement between Pacific Premier Bancorp, Inc. and Pacific Premier Bank and Eddie Wilcox dated January 1, 2011. (10)*
|
|
10.5
|
Amended and Restated Declaration of Trust from PPBI Trust I. (7)
|
|
10.6
|
Guarantee Agreement from PPBI Trust I. (7)
|
|
10.7
|
Salary Continuation Agreements between Pacific Premier Bank and Steven R. Gardner. (8)*
|
|
10.8
|
Form of Pacific Premier Bancorp, Inc. 2004 Long-Term Incentive Plan agreement. (9)*
|
|
10.9
|
2004 Stock Incentive Plan (11)*
|
|
10.10
|
Form of 2004 Stock Incentive Plan Incentive Stock Option Agreement (11)
|
|
10.11
|
Form of 2004 Stock Incentive Plan Nonqualified Stock Option Agreement (11)
|
|
10.12
|
Form of 2004 Stock Incentive Plan Restricted Stock Agreement (11)
|
|
21
|
Subsidiaries of Pacific Premier Bancorp, Inc. (Reference is made to “Item 1. Business” for the required information.)
|
|
23
|
Consent of Vavrinek, Trine, Day and Co., LLP.
|
|
31.1
|
Certification of Chief Executive Officer pursuant to Section 302 of the Sarbanes-Oxley Act.
|
|
31.2
|
Certification of Chief Financial Officer pursuant to Section 302 of the Sarbanes-Oxley Act.
|
|
32
|
Certification of Chief Executive Officer and Chief Financial Officer pursuant to Section 906 of the Sarbanes-Oxley Act.
|
|
|
________________
|
|
(1)
|
Incorporated by reference from the Registrant’s Form 10-K filed with the SEC on March 31, 2003.
|
|
(2)
|
Incorporated by reference from the Registrant’s Form 10-K/A filed with the SEC on August 28, 2003.
|
|
(3)
|
Incorporated by reference from the Registrant’s Form 10-Q filed with the SEC on August 14, 2003.
|
|
(4)
|
Incorporated by reference from the Registrant’s Registration Statement on Form S-1 (Registration No. 333-20497) filed with the SEC on January 27, 1997.
|
|
(5)
|
Incorporated by reference from the Registrant’s Proxy Statement filed with the SEC on December 14, 2001.
|
|
(6)
|
Incorporated by reference from the Registrant’s Proxy Statement filed with the SEC on May 1, 2001.
|
|
(7)
|
Incorporated by reference from the Registrant’s Form 10-Q filed with the SEC on May 3, 2004.
|
|
(8)
|
Incorporated by reference from the Registrant’s Form 8-K filed with the SEC on May 19, 2006.
|
|
(9)
|
Incorporated by reference from the Registrant’s Form 10-K/A filed with the SEC on April 4, 2007.
|
|
(10)
|
Incorporated by reference from the Registrant’s Form 8-K filed with the SEC on January 6, 2011.
|
|
(11)
|
Incorporated by reference from the Registrant’s Post-Effective Amendment No. 1 to Form S-8 (Registration No. 333-117857) filed with the SEC on September 3, 2004.
|
|
*
|
Management contract or compensatory plan or arrangement.
|
Pursuant to the requirements of Section 13 or 15(d) of the Securities Exchange Act of 1934, the Registrant has duly caused this report to be signed on its behalf by the undersigned, thereunto duly authorized.
PACIFIC PREMIER BANCORP, INC.
By: /s/ Steven R. Gardner
Steven R. Gardner
President and Chief Executive Officer
DATED: March 30, 2011
Pursuant to the requirements of the Securities Exchange Act of 1934, this report has been signed below by the following persons on behalf of the Registrant and in the capacities and on the dates indicated.
|
Signature
|
Title
|
Date
|
|
/s/ Steven R. Gardner
|
President and Chief Executive Officer (principal executive officer)
|
March 30, 2011
|
|
Steven R. Gardner
|
||
|
/s/ Kent J. Smith
|
Executive Vice President and Chief Financial Officer (principal financial and accounting officer)
|
March 30, 2011
|
|
Kent J. Smith
|
||
|
/s/ Ronald G. Skipper
|
Chairman of the Board of Directors
|
March 30, 2011
|
|
Ronald G. Skipper
|
||
|
/s/ John D. Goddard
|
Director
|
March 30, 2011
|
|
John D. Goddard
|
||
|
/s/ Michael L. McKennon
|
Director
|
March 30, 2011
|
|
Michael L. McKennon
|
||
|
/s/ Kenneth Boudreau
|
Director
|
March 30, 2011
|
|
Kenneth Boudreau
|
||
|
/s/ Jeff C. Jones
|
Director
|
March 30, 2011
|
|
Jeff C. Jones
|
||
|
/s/David L. Hardin
|
Director
|
March 30, 2011
|
|
David L. Hardin
|