Attached files
| file | filename |
|---|---|
| 8-K - FORM 8-K - EAGLE BANCORP INC | tm2022293-1_8k.htm |
Exhibit 99.1
 |
Investor Presentation June 2020 Ticker: EGBN EagleBankCorp.com |
 |
Forward Looking Statements This presentation contains forward looking statements within the meaning of the Securities and Exchange Act of 1934, as amended, including statements of goals, intentions, and expectations as to future trends, plans, events or results of Company operations and policies and regarding general economic conditions. In some cases, forward-looking statements can be identified by use of words such as “may,” “will,” “anticipates,” “believes,” “expects,” “plans,” “estimates,” “potential,” “continue,” “should,” and similar words or phrases. These statements are based upon current and anticipated economic conditions, nationally and in the Company’s market, interest rates and interest rate policy, competitive factors and other conditions which by their nature, are not susceptible to accurate forecast and are subject to significant uncertainty. For details on factors that could affect these expectations, see the risk factors and other cautionary language included in the Company’s Annual Report on Form 10-K and other periodic and current reports filed with the SEC. Because of these uncertainties and the assumptions on which this discussion and the forward-looking statements are based, actual future operations and results in the future may differ materially from those indicated herein. Readers are cautioned against placing undue reliance on any Company’s past results are not necessarily indicative of future undertake to publicly revise or update forward-looking statements such forward-looking statements. The performance. The Company does not in this presentation to reflect events or circumstances that arise after the date of this presentation, except as may be required under applicable law. This presentation was delivered digitally. The Company makes no representation that subsequent to delivery of the presentation it was not altered. For the most current, accurate information, please refer to www.eaglebankcorp.com and go to the Investor Relations tab. For further information on the Company please contact: Michael T. Flynn P 240-497-2040 E mflynn@eaglebankcorp.com 2 |
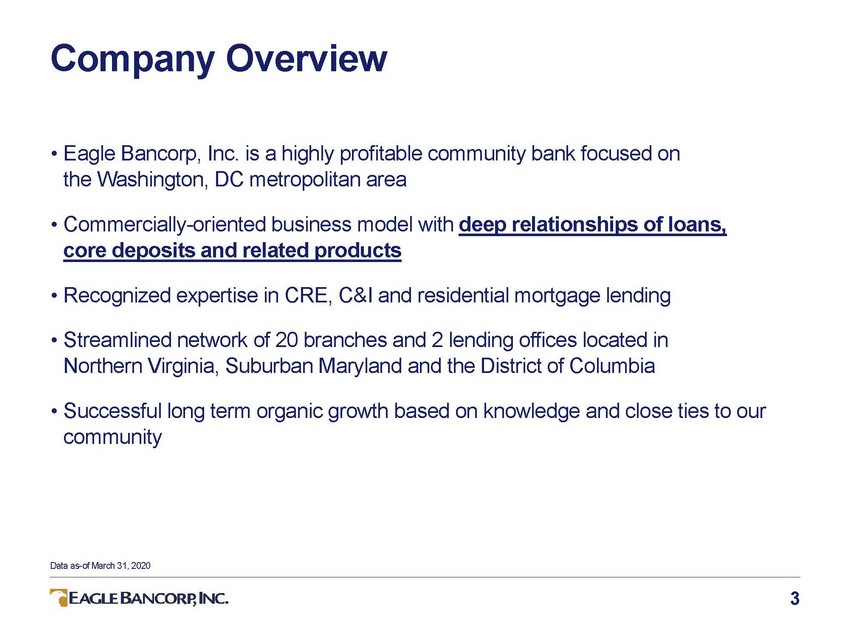 |
Company Overview • Eagle Bancorp, Inc. is a highly profitable community bank focused on the Washington, DC metropolitan area • Commercially-oriented business model with deep relationships of loans, core deposits and related products • Recognized expertise in CRE, C&I and residential mortgage lending • Streamlined network of 20 branches and 2 lending offices located in Northern Virginia, Suburban Maryland and the District of Columbia • Successful long term organic growth based on knowledge and close ties to our community Data as-of March 31, 2020 3 |
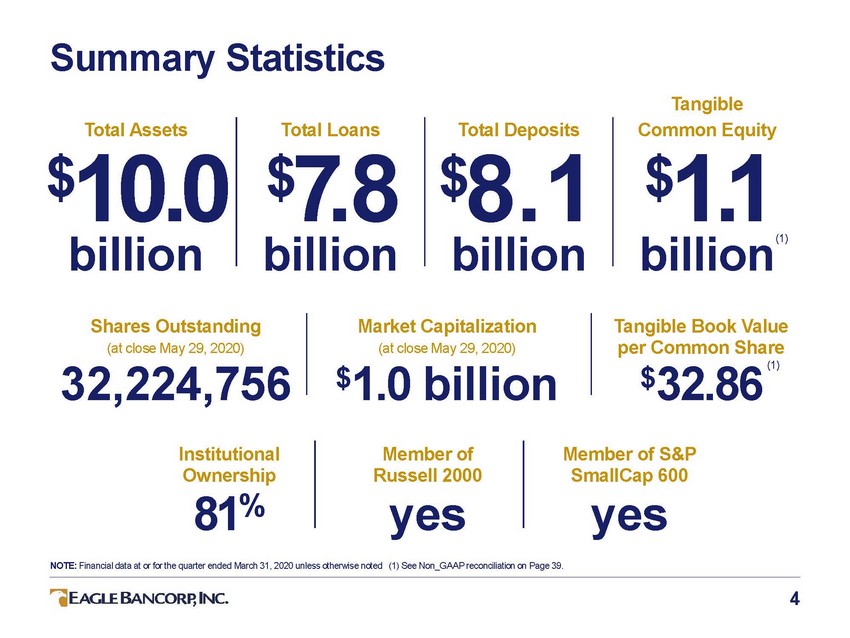 |
Summary Statistics Tangible Common Equity Total Assets Total Loans Total Deposits $10.0 $7.8 billion $8.1 billion $1.1 billion(1) Tangible Book Value per Common Share billion Shares Outstanding (at close May 29, 2020) 32,224,756 Institutional Ownership 81% Market Capitalization (at close May 29, 2020) $1.0 billion (1) $32.86 Member of Russell 2000 yes Member of S&P SmallCap 600 yes NOTE: Financial data at or for the quarter ended March 31, 2020 unless otherwise noted (1) See Non_GAAP reconciliation on Page 39. 4 |
 |
Investment Rationale Highly profitable, with balanced financial performance Strategically positioned in the 5th largest regional economy in the U.S. Strong capital ratios NOTE: Financial data at or for the quarter ended December 31, 2019 5 |
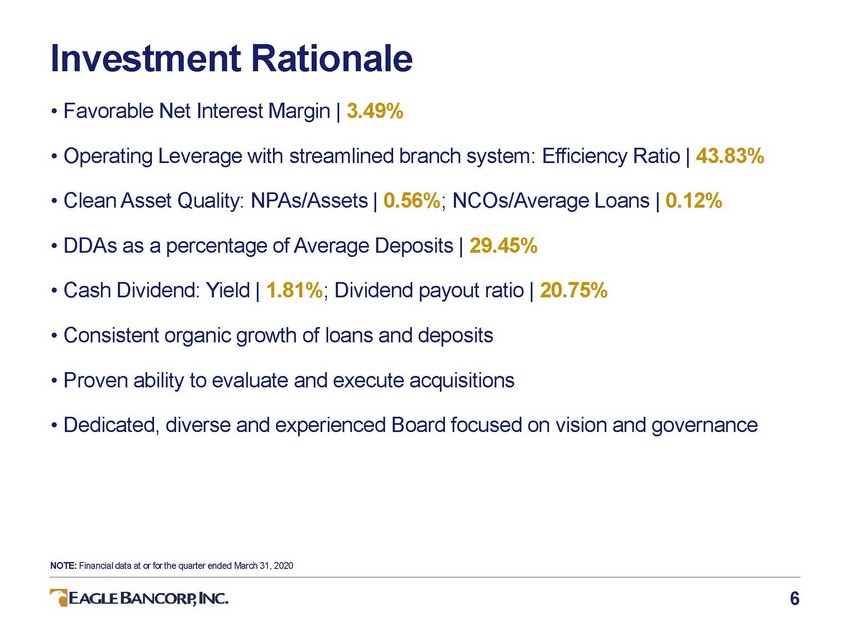 |
Investment Rationale • Favorable Net Interest Margin | 3.49% • Operating Leverage with streamlined branch system: Efficiency Ratio | 43.83% • Clean Asset Quality: NPAs/Assets | 0.56%; NCOs/Average Loans | 0.12% • DDAs as a percentage of Average Deposits | 29.45% • Cash Dividend: Yield | 1.81%; Dividend payout ratio | 20.75% • Consistent organic growth of loans and deposits • Proven ability to evaluate and execute acquisitions • Dedicated, diverse and experienced Board focused on vision and governance NOTE: Financial data at or for the quarter ended March 31, 2020 6 |
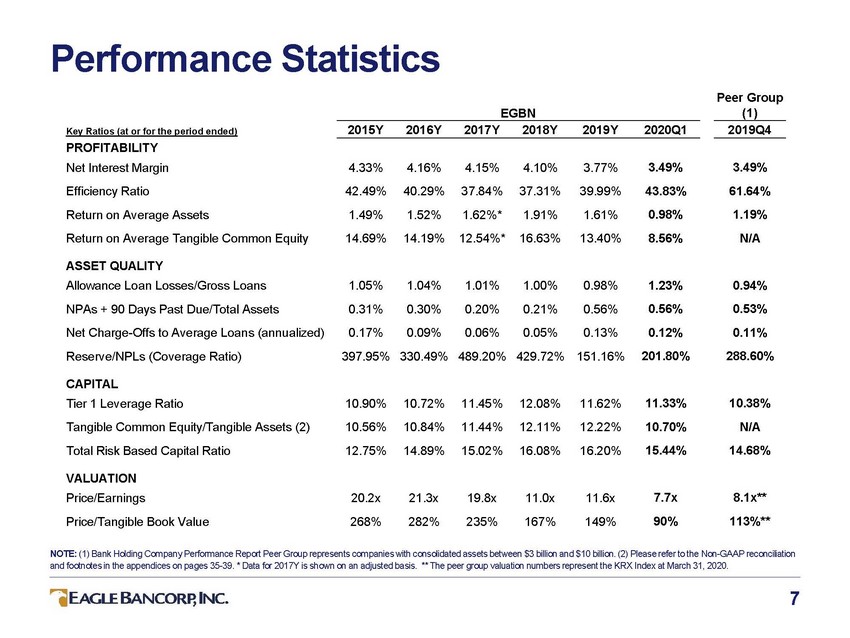 |
Performance Statistics EGBN Peer Group (1) 2015Y 2016Y 2017Y 2018Y 2019Y 2020Q1 2019Q4 Key Ratios (at or for the period ended) PROFITABILITY Net Interest Margin Efficiency Ratio Return on Average Assets Return on Average Tangible Common Equity 4.33% 42.49% 1.49% 14.69% 4.16% 40.29% 1.52% 14.19% 4.15% 37.84% 1.62%* 12.54%* 4.10% 37.31% 1.91% 16.63% 3.77% 39.99% 1.61% 13.40% 3.49% 43.83% 0.98% 8.56% 3.49% 61.64% 1.19% N/A ASSET QUALITY Allowance Loan Losses/Gross Loans NPAs + 90 Days Past Due/Total Assets Net Charge-Offs to Average Loans (annualized) Reserve/NPLs (Coverage Ratio) 1.05% 0.31% 0.17% 397.95% 1.04% 0.30% 0.09% 330.49% 1.01% 0.20% 0.06% 489.20% 1.00% 0.21% 0.05% 429.72% 0.98% 0.56% 0.13% 151.16% 1.23% 0.56% 0.12% 201.80% 0.94% 0.53% 0.11% 288.60% CAPITAL Tier 1 Leverage Ratio Tangible Common Equity/Tangible Assets (2) Total Risk Based Capital Ratio 10.90% 10.56% 12.75% 10.72% 10.84% 14.89% 11.45% 11.44% 15.02% 12.08% 12.11% 16.08% 11.62% 12.22% 16.20% 11.33% 10.70% 15.44% 10.38% N/A 14.68% VALUATION Price/Earnings Price/Tangible Book Value 20.2x 268% 21.3x 282% 19.8x 235% 11.0x 167% 11.6x 149% 7.7x 90% 8.1x** 113%** NOTE: (1) Bank Holding Company Performance Report Peer Group represents companies with consolidated assets between $3 billion and $10 billion. (2) Please refer to the Non-GAAP reconciliation and footnotes in the appendices on pages 35-39. * Data for 2017Y is shown on an adjusted basis. ** The peer group valuation numbers represent the KRX Index at March 31, 2020. 7 |
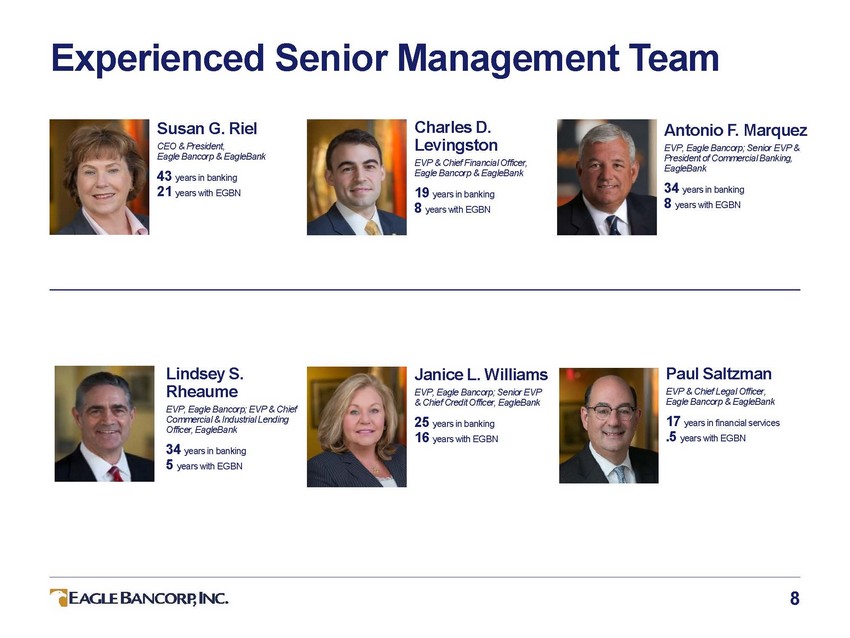 |
Experienced Senior Management Team Charles D. Levingston EVP & Chief Financial Officer, Eagle Bancorp & EagleBank 19 years in banking 8 years with EGBN Susan G. Riel CEO & President, Eagle Bancorp & EagleBank 43 years in banking 21 years with EGBN Antonio F. Marquez EVP, Eagle Bancorp; Senior EVP & President of Commercial Banking, EagleBank 34 years in banking 8 years with EGBN Lindsey S. Rheaume EVP, Eagle Bancorp; EVP & Chief Commercial & Industrial Lending Officer, EagleBank 34 years in banking 5 years with EGBN Janice L. Williams EVP, Eagle Bancorp; Senior EVP & Chief Credit Officer, EagleBank 25 years in banking 16 years with EGBN Paul Saltzman EVP & Chief Legal Officer, Eagle Bancorp & EagleBank 17 years in financial services .5 years with EGBN 8 |
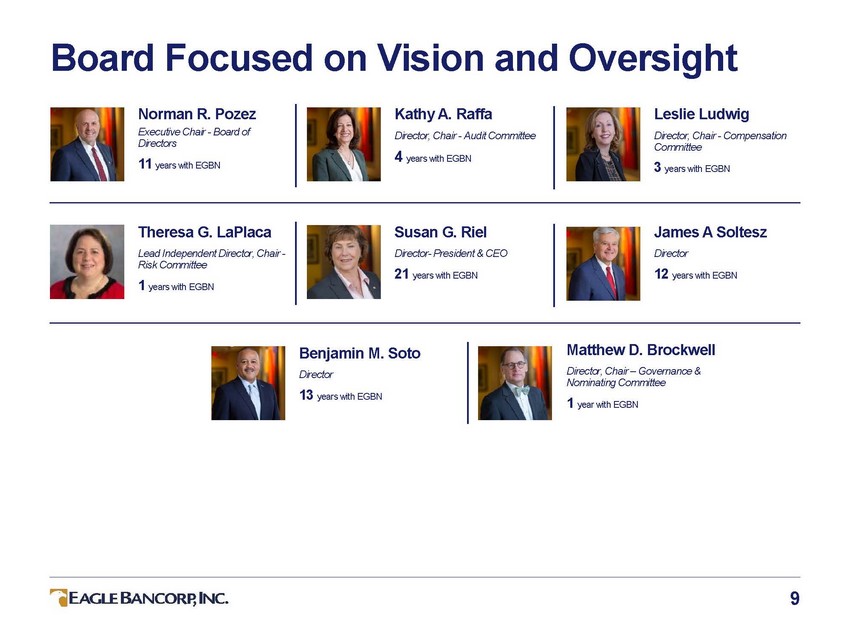 |
Board Focused on Vision and Oversight Norman R. Pozez Executive Chair - Board of Directors 11 years with EGBN Kathy A. Raffa Director, Chair - Audit Committee 4 years with EGBN Leslie Ludwig Director, Chair - Compensation Committee 3 years with EGBN Theresa G. LaPlaca Lead Independent Director, Chair - Risk Committee 1 years with EGBN Susan G. Riel Director-President & CEO 21 years with EGBN James A Soltesz Director 12 years with EGBN Matthew D. Brockwell Director, Chair – Governance & Nominating Committee 1 year with EGBN Benjamin M. Soto Director 13 years with EGBN 9 |
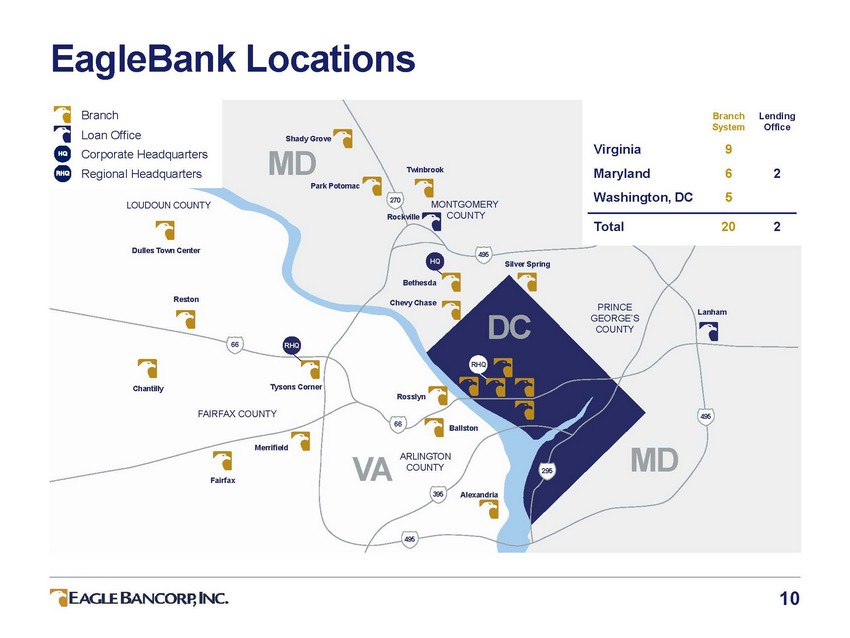 |
EagleBank Locations Branch Loan Office Corporate Headquarters Regional Headquarters Branch System Lending Office Shady Grove MD Park Potomac Virginia Maryland Washington, DC 9 6 5 Twinbrook 2 270 MONTGOMERY COUNTY LOUDOUN COUNTY Rockville Tot9a5 l 20 2 Dulles Town Center 495 HQ Silver Spring Bethesda Reston Chevy Chase PRINCE GEORGE’S COUNTY Lanham DC 66 RHQ RHQ Tysons Corner Chantilly Rosslyn FAIRFAX COUNTY 495 66 Ballston Merrifield MD ARLINGTON COUNTY VA 295 Fairfax 395 Alexandria 495 10 |
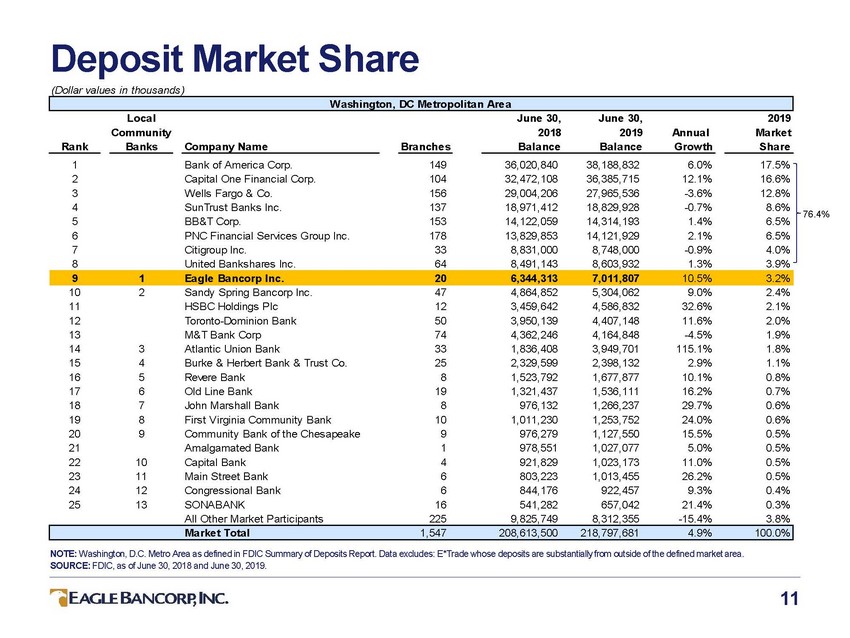 |
Deposit (Dollar values in thousands) Market Share Local Community Ba nks June 30, 2018 June 30, 2019 2019 Market Sha re Annual Ra nk Compa ny Na me Bra nche s Ba la nce Ba la nce Grow th 1 2 3 4 5 6 7 8 Bank of America Corp. Capital One Financial Corp. Wells Fargo & Co. SunTrust Banks Inc. BB&T Corp. PNC Financial Services Group Inc. Citigroup Inc. United Bankshares Inc. 149 104 156 137 153 178 33 64 36,020,840 32,472,108 29,004,206 18,971,412 14,122,059 13,829,853 8,831,000 8,491,143 38,188,832 36,385,715 27,965,536 18,829,928 14,314,193 14,121,929 8,748,000 8,603,932 6.0% 12.1% -3.6% -0.7% 1.4% 2.1% -0.9% 1.3% 17.5% 16.6% 12.8% 8.6% 6.5% 6.5% 4.0% 3.9% 76.4% 10 11 12 13 14 15 16 17 18 19 20 21 22 23 24 25 2 Sandy Spring Bancorp Inc. HSBC Holdings Plc Toronto-Dominion Bank M&T Bank Corp Atlantic Union Bank Burke & Herbert Bank & Trust Co. Revere Bank Old Line Bank John Marshall Bank First Virginia Community Bank Community Bank of the Chesapeake Amalgamated Bank Capital Bank Main Street Bank Congressional Bank SONABANK All Other Market Participants 47 12 50 74 33 25 8 19 8 10 9 1 4 6 6 16 225 4,864,852 3,459,642 3,950,139 4,362,246 1,836,408 2,329,599 1,523,792 1,321,437 976,132 1,011,230 976,279 978,551 921,829 803,223 844,176 541,282 9,825,749 5,304,062 4,586,832 4,407,148 4,164,848 3,949,701 2,398,132 1,677,877 1,536,111 1,266,237 1,253,752 1,127,550 1,027,077 1,023,173 1,013,455 922,457 657,042 8,312,355 9.0% 32.6% 11.6% -4.5% 115.1% 2.9% 10.1% 16.2% 29.7% 24.0% 15.5% 5.0% 11.0% 26.2% 9.3% 21.4% -15.4% 2.4% 2.1% 2.0% 1.9% 1.8% 1.1% 0.8% 0.7% 0.6% 0.6% 0.5% 0.5% 0.5% 0.5% 0.4% 0.3% 3.8% 3 4 5 6 7 8 9 10 11 12 13 NOTE: Washington, D.C. Metro Area as defined in FDIC Summary of Deposits Report. Data excludes: E*Trade whose deposits are substantially from outside of the defined market area. SOURCE: FDIC, as of June 30, 2018 and June 30, 2019. 11 Market Total 1,547 208,613,500 218,797,681 4.9% 100.0% 9 1 Eagle Bancorp Inc. 20 6,344,313 7,011,807 10.5% 3.2% Washington, DC Metropolitan Area |
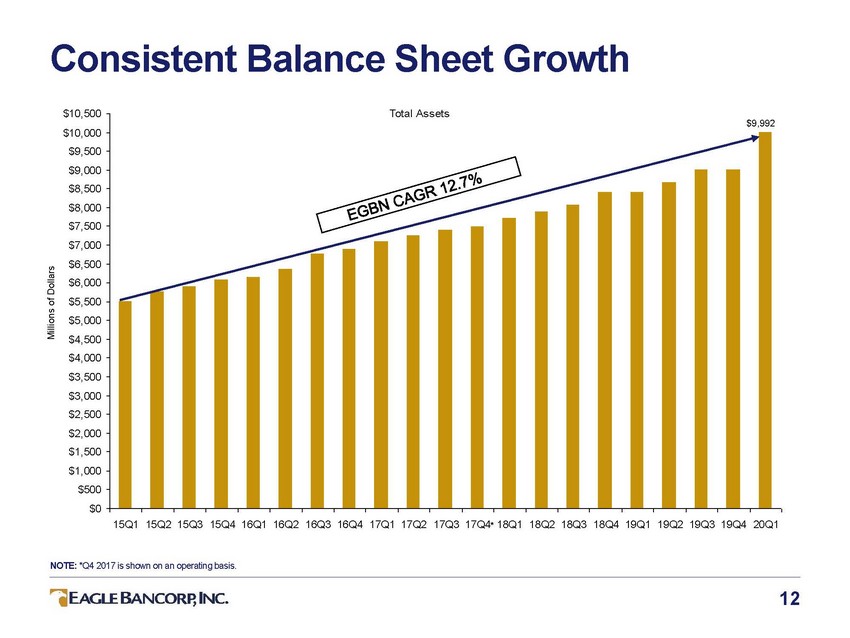 |
Consistent Balance Sheet Total Assets Growth $10,500 $10,000 $9,500 $9,000 $8,500 $8,000 $7,500 $7,000 $6,500 $6,000 $5,500 $5,000 $4,500 $4,000 $3,500 $3,000 $2,500 $2,000 $1,500 $1,000 $500 $0 $9,992 15Q1 15Q2 15Q3 15Q4 16Q1 16Q2 16Q3 16Q4 17Q1 17Q2 17Q3 17Q4* 18Q1 18Q2 18Q3 18Q4 19Q1 19Q2 19Q3 19Q4 20Q1 NOTE: *Q4 2017 is shown on an operating basis. 12 Millions of Dollars |
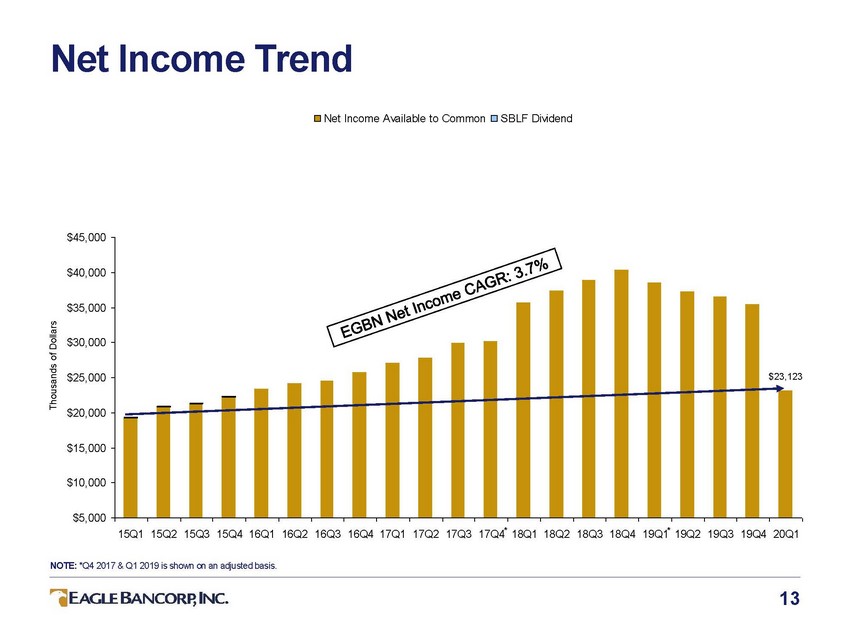 |
Net Income Trend Net Income Available to Common SBLF Dividend $45,000 $40,000 $35,000 $30,000 $25,000 $20,000 $15,000 $10,000 $5,000 15Q1 15Q2 15Q3 15Q4 16Q1 16Q2 16Q3 16Q4 17Q1 17Q2 17Q3 17Q4* 18Q1 18Q2 18Q3 18Q4 19Q1* 19Q2 19Q3 19Q4 20Q1 NOTE: *Q4 2017 & Q1 2019 is shown on an adjusted basis. 13 Thousands of Dollars $23,123 |
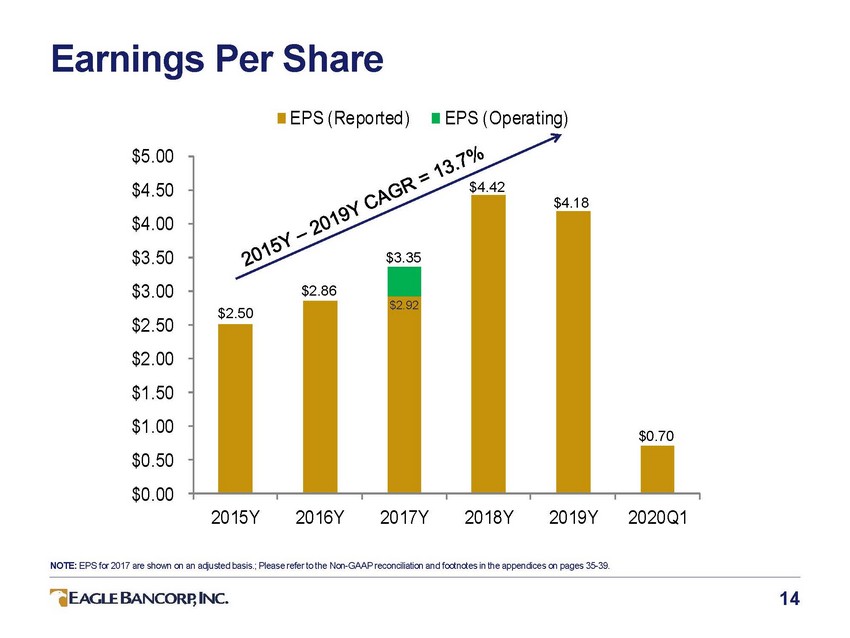 |
Earnings Per Share EPS (Reported) EPS (Operating) $5.00 $4.50 $4.00 $3.50 $3.00 $2.50 $2.00 $1.50 $1.00 $0.50 $0.00 2015Y 2016Y 2017Y 2018Y 2019Y 2020Q1 NOTE: EPS for 2017 are shown on an adjusted basis.; Please refer to the Non-GAAP reconciliation and footnotes in the appendices on pages 35-39. 14 $4.42 $3.35 $4.18 $0.70 $2.86 $2.92 $2.50 |
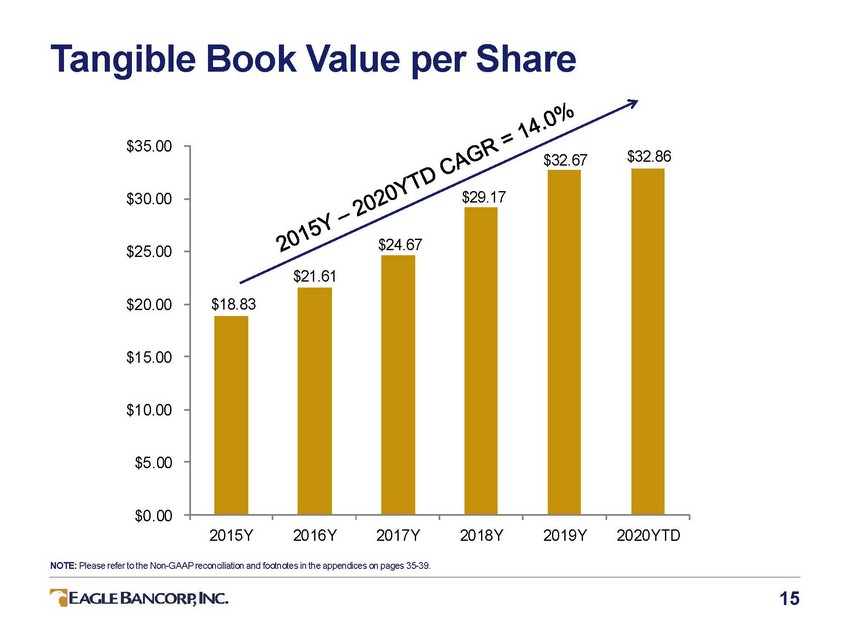 |
Tangible Book Value per Share $35.00 $30.00 $25.00 $20.00 $15.00 $10.00 $5.00 $0.00 2015Y 2016Y 2017Y 2018Y 2019Y 2020YTD NOTE: Please refer to the Non-GAAP reconciliation and footnotes in the appendices on pages 35-39. 15 $32.67$32.86 $29.17 $24.67 $21.61 $18.83 |
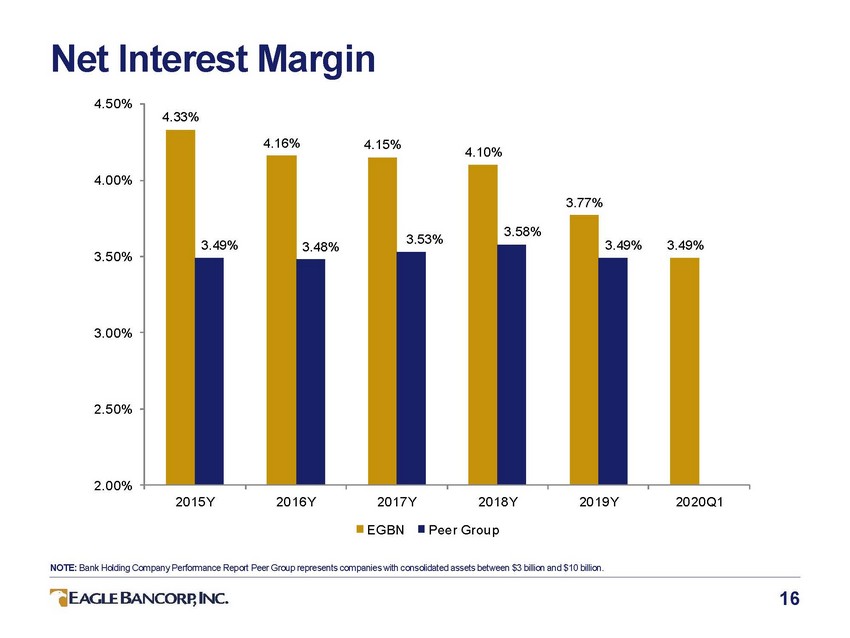 |
Net Interest Margin 4.50% 4.00% 3.50% 3.00% 2.50% 2.00% 2015Y 2016Y 2017Y 2018Y 2019Y 2020Q1 EGBN Peer Group NOTE: Bank Holding Company Performance Report Peer Group represents companies with consolidated assets between $3 billion and $10 billion. 16 4.33% 4.16% 4.15% 4.10% 3.49% 3.48% 3.53% 3.77% 3.58% 3.49% 3.49% |
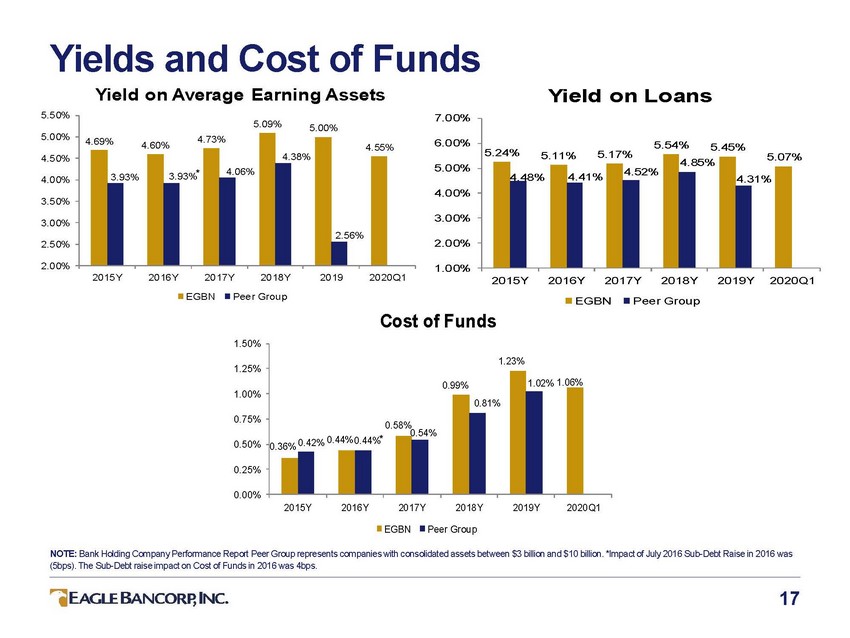 |
Yields and Cost of Funds Yield on Average Earning Assets Yield on Loans 5.50% 7.00% 5.00% 6.0 0% 5.24% 5.17% 5.11% 4.50% 5.0 0% 4.00% 4.0 0% 3.50% 3.0 0% 3.00% 2.0 0% 2.50% 2.00% 1.0 0% 2015Y 2016Y 2017Y 2018Y 2019 2020Q1 20 15 Y 20 16 Y 20 17 Y 20 18 Y 20 19 Y 20 20 Q1 EGBN Peer Group EGBN Pee r Grou p Cost of Funds 1.50% 1.25% 1.00% 0.75% 0.54% 0.50% 0.36% 0.25% 0.00% 2015Y 2016Y 2017Y 2018Y 2019Y 2020Q1 EGBN Peer Group NOTE: Bank Holding Company Performance Report Peer Group represents companies with consolidated assets between $3 billion and $10 billion. *Impact of July 2016 Sub-Debt Raise in 2016 was (5bps). The Sub-Debt raise impact on Cost of Funds in 2016 was 4bps. 17 1.23% 0.99% 1.02% 1.06% 0.58% 0.81% 0.42% 0.44% 0.44%* 5.54% 5.45% 4.85% 5.07% 4.48% 4.41% 4.52% 4.31% 5.09% 5.00% 4.69% 4.60% 4.73% 4.38% 4.55% 4.06% 3.93% 3.93%* 2.56% |
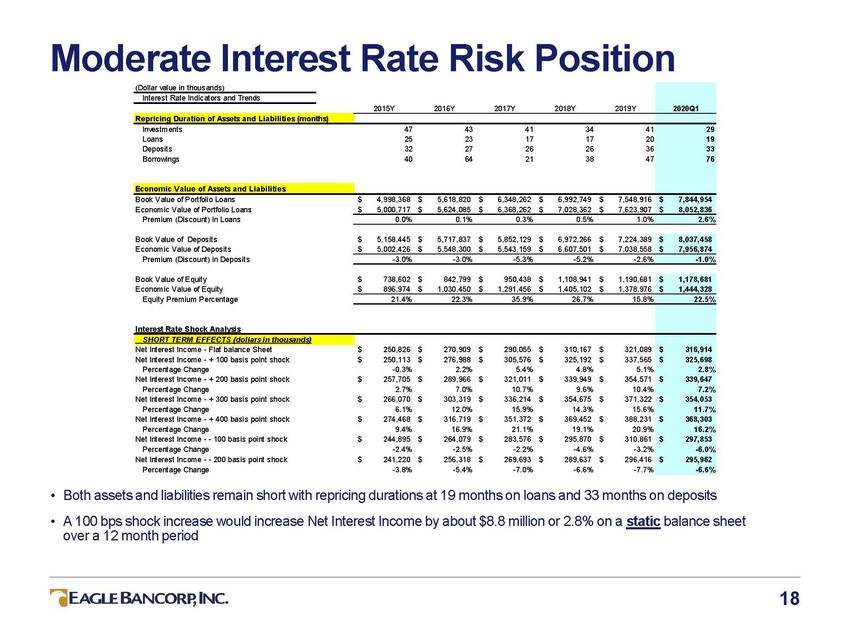 |
Moderate Interest Rate Risk Position Book Value of Deposits Economic Value of Deposits Premium (Discount) in Deposits • Both assets and liabilities remain short with repricing durations at 19 months on loans and 33 months on deposits • A 100 bps shock increase would increase Net Interest Income by about $8.8 million or 2.8% on a static balance sheet over a 12 month period 18 Book Value of Equity Economic Value of Equity Equity Premium Percentage Interest Rate Shock Analysis $738,602 $842,799 $950,438 $1,108,941 $1,190,681 $896,974 $1,030,450 $1,291,456 $1,405,102 $1,378,976 $1,178,681 $1,444,328 21.4%22.3%35.9%26.7%15.8% 22.5% SHORT TERM EFFECTS (dollars in thousands) $316,914 $325,698 2.8% $339,647 7.2% $354,053 11.7% $368,303 16.2% $297,853 -6.0% $295,962 -6.6% Net Interest Income - Flat balance Sheet$250,826 $270,909 $290,055 $310,167 $321,089 Net Interest Income - + 100 basis point shock$250,113 $276,988 $305,576 $325,192 $337,565 Percentage Change -0.3%2.2%5.4%4.8%5.1% Net Interest Income - + 200 basis point shock$257,705 $289,966 $321,011 $339,949 $354,571 Percentage Change2.7%7.0% 10.7%9.6%10.4% Net Interest Income - + 300 basis point shock$266,070 $303,319 $336,214 $354,675 $371,322 Percentage Change6.1% 12.0% 15.9%14.3%15.6% Net Interest Income - + 400 basis point shock$274,468 $316,719 $351,372 $369,452 $388,231 Percentage Change9.4% 16.9% 21.1%19.1%20.9% Net Interest Income - - 100 basis point shock$244,895 $264,079 $283,576 $295,870 $310,861 Percentage Change -2.4%-2.5%-2.2%-4.6%-3.2% Net Interest Income - - 200 basis point shock$241,220 $256,318 $269,693 $289,637 $296,416 Percentage Change-3.8%-5.4%-7.0%-6.6%-7.7% $5,158,445 $5,717,837 $5,852,129 $6,972,266 $7,224,389 $5,002,426 $5,548,300 $5,543,159 $6,607,501 $7,038,558 $8,037,458 $7,956,874 -3.0%-3.0%-5.3%-5.2%-2.6% -1.0% (Dollar value in thousands) Interest Rate Indicators and Trends 2015Y2016Y2017Y2018Y2019Y 2020Q1 Repricing Duration of Assets and Liabilities (months) Investments4743413441 Loans2523171720 Deposits3227262636 Borrowings4064213847 29 19 33 76 Economic Value of Assets and Liabilities Book Value of Portfolio Loans Economic Value of Portfolio Loans Premium (Discount) in Loans $4,998,368 $5,618,820 $6,348,262 $6,992,749 $7,548,916 $5,000,717 $5,624,085 $6,368,262 $7,028,362 $7,623,907 $7,844,954 $8,052,836 0.0%0.1%0.3%0.5%1.0% 2.6% |
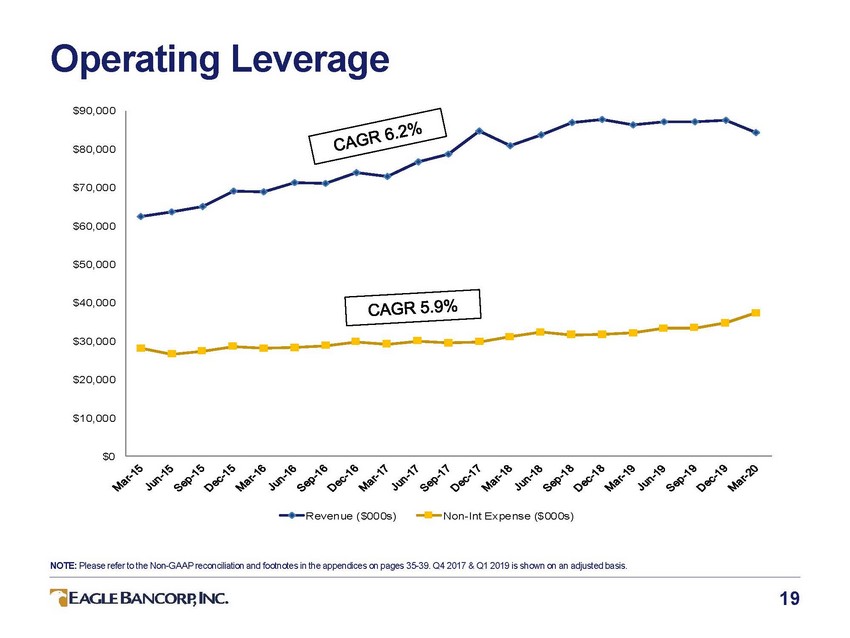 |
Operating Leverage $90,000 $80,000 $70,000 $6 0,00 0 $50,000 $40,000 $30,000 $2 0,00 0 $10,000 $0 Reven ue ($00 0s) Non-Int Expense ($000s) NOTE: Please refer to the Non-GAAP reconciliation and footnotes in the appendices on pages 35-39. Q4 2017 & Q1 2019 is shown on an adjusted basis. 19 |
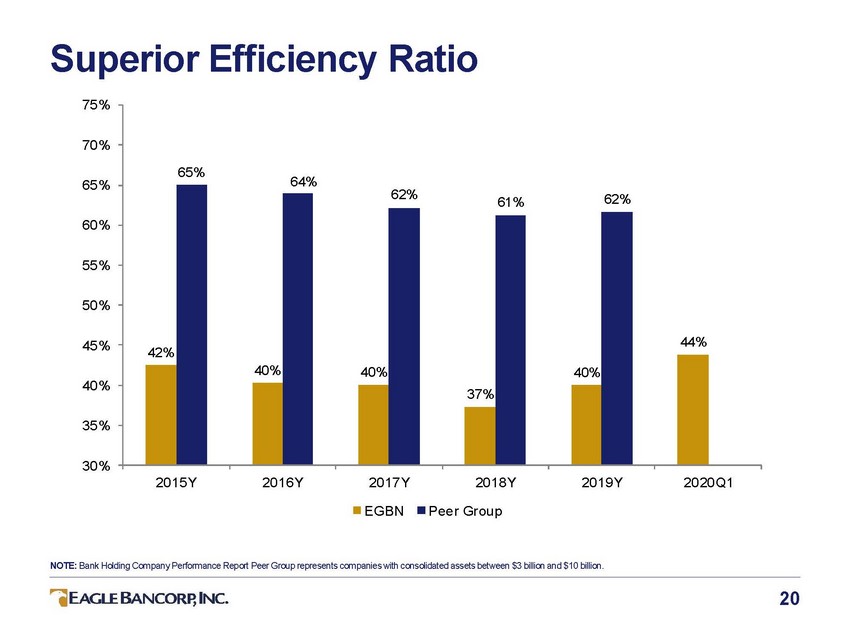 |
Superior Efficiency Ratio 75% 70% 65% 60% 55% 50% 45% 40% 40% 35% 30% 2015Y 2016Y 2017Y 2018Y 2019Y 2020Q1 EGBN Peer Group NOTE: Bank Holding Company Performance Report Peer Group represents companies with consolidated assets between $3 billion and $10 billion. 20 65% 64% 42% 40% 62% 61% 62% 40% 37% 44% |
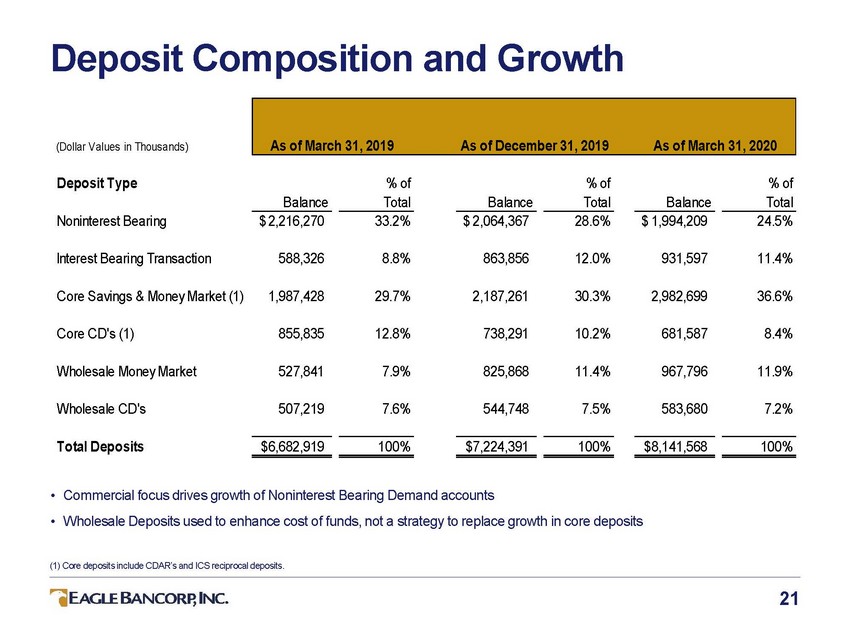 |
Deposit Composition and Growth (Dollar Values in Thousands) Deposit Type % of Total % of Total % of Total Balance Balance Balance Noninterest Bearing $ 2,216,270 33.2% $ 2,064,367 28.6% $ 1,994,209 24.5% Interest Bearing Transaction 588,326 8.8% 863,856 12.0% 931,597 11.4% Core Savings & Money Market (1) 1,987,428 29.7% 2,187,261 30.3% 2,982,699 36.6% Core CD's (1) 855,835 12.8% 738,291 10.2% 681,587 8.4% Wholesale Money Market 527,841 7.9% 825,868 11.4% 967,796 11.9% Wholesale CD's 507,219 7.6% 544,748 7.5% 583,680 7.2% Total Deposits $6,682,919 100% $7,224,391 100% $8,141,568 100% • Commercial focus drives growth of Noninterest Bearing Demand accounts • Wholesale Deposits used to enhance cost of funds, not a strategy to replace growth in core deposits (1) Core deposits include CDAR’s and ICS reciprocal deposits. 21 As of March 31, 2019As of December 31, 2019As of March 31, 2020 |
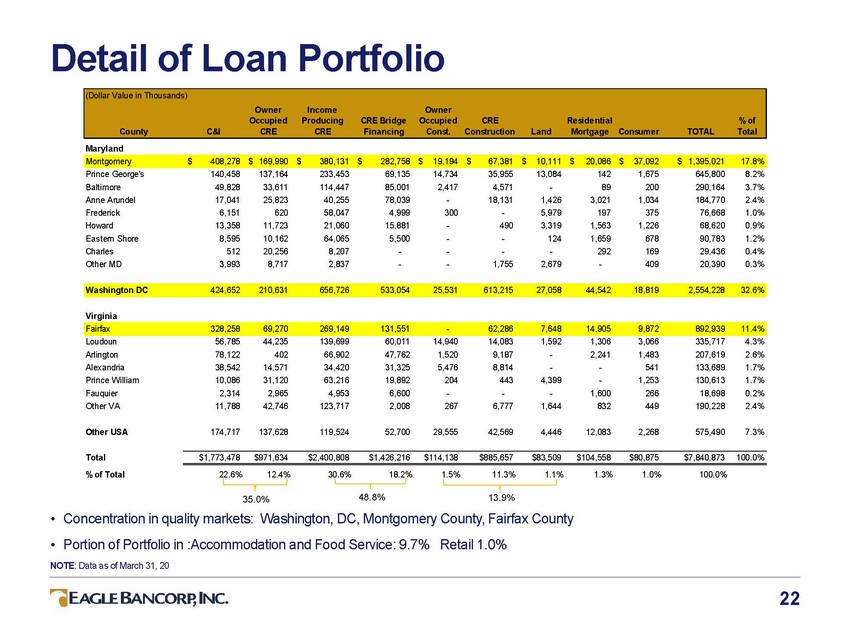 |
Detail of Loan Portfolio Maryland Prince George's Baltimore Anne Arundel Frederick Howard Eastern Shore Charles Other MD 140,458 49,828 17,041 6,151 13,358 8,595 512 3,993 137,164 33,611 25,823 620 11,723 10,162 20,256 8,717 233,453 114,447 40,255 58,047 21,060 64,065 8,207 2,837 69,135 85,001 78,039 4,999 15,881 5,500 - - 14,734 2,417 - 300 - - - - 35,955 4,571 18,131 - 490 - - 1,755 13,084 - 1,426 5,979 3,319 124 - 2,679 142 89 3,021 197 1,563 1,659 292 - 1,675 200 1,034 375 1,226 678 169 409 645,800 290,164 184,770 76,668 68,620 90,783 29,436 20,390 8.2% 3.7% 2.4% 1.0% 0.9% 1.2% 0.4% 0.3% Virginia Loudoun Arlington Alexandria Prince William Fauquier Other VA 56,785 78,122 38,542 10,086 2,314 11,788 44,235 402 14,571 31,120 2,965 42,746 139,699 66,902 34,420 63,216 4,953 123,717 60,011 47,762 31,325 19,892 6,600 2,008 14,940 1,520 5,476 204 - 267 14,083 9,187 8,814 443 - 6,777 1,592 - - 4,399 - 1,644 1,306 2,241 - - 1,600 832 3,066 1,483 541 1,253 266 449 335,717 207,619 133,689 130,613 18,698 190,228 4.3% 2.6% 1.7% 1.7% 0.2% 2.4% Other USA 174,717 137,628 119,524 52,700 29,555 42,569 4,446 12,083 2,268 575,490 7.3% Total % of Total $1,773,478 $971,634 $2,400,808 $1,426,216 $114,138 $885,657 $83,509 $104,558 $80,875 $7,840,873 100.0% 22.6% 12.4% 30.6% 18.2% 1.5% 11.3% 1.1% 1.3% 1.0% 100.0% 48.8% 13.9% 35.0% • Concentration in quality markets: Washington, DC, Montgomery County, Fairfax County • Portion of Portfolio in :Accommodation and Food Service: 9.7% Retail 1.0% NOTE: Data as of March 31, 20 22 Fairfax 328,258 69,270 269,149 131,551 - 62,286 7,648 14,905 9,872 892,939 11.4% Washington DC 424,652 210,631 656,726 533,054 25,531 613,215 27,058 44,542 18,819 2,554,228 32.6% Montgomery $ 408,278 $ 169,990 $ 380,131 $ 282,758 $ 19,194 $ 67,381 $ 10,111 $ 20,086 $ 37,092 $ 1,395,021 17.8% (Dollar Value in Thousands) Owner Income Owner Occupied Producing CRE Bridge Occupied CRE Residential % of County C&I CRE CRE Financing Const. Construction Land Mortgage Consumer TOTAL Total |
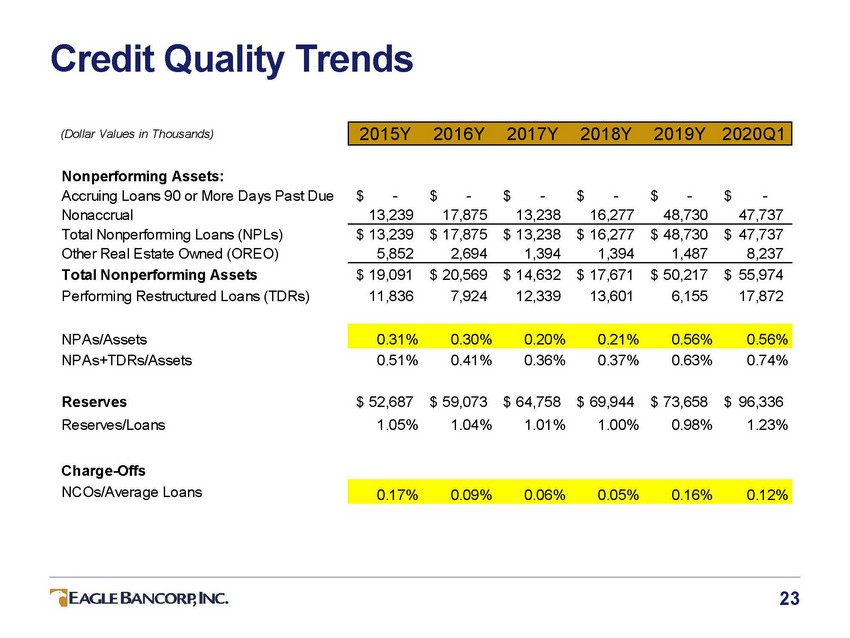 |
Credit Quality Trends (Dollar Values in Thousands) Nonperforming Assets: Accruing Loans 90 or More Days Past Due Nonaccrual Total Nonperforming Loans (NPLs) Other Real Estate Owned (OREO) Total Nonperforming Assets Performing Restructured Loans (TDRs) $ - $ - $ - $ - $ - $ - 13,239 17,875 13,238 16,277 48,730 47,737 $ 13,239 $ 17,875 $ 13,238 $ 16,277 $ 48,730 $ 47,737 5,852 2,694 1,394 1,394 1,487 8,237 $ 19,091 11,836 $ 20,569 7,924 $ 14,632 12,339 $ 17,671 13,601 $ 50,217 6,155 $ 55,974 17,872 NPAs/Assets NPAs+TDRs/Assets 0.51% 0.41% 0.36% 0.37% 0.63% 0.74% Reserves Reserves/Loans $ 52,687 1.05% $ 59,073 1.04% $ 64,758 1.01% $ 69,944 1.00% $ 73,658 0.98% $ 96,336 1.23% Charge-Offs NCOs/Average Loans 23 0.17%0.09%0.06%0.05%0.16%0.12% 0.31%0.30%0.20%0.21%0.56%0.56% 2015Y 2016Y 2017Y 2018Y 2019Y 2020Q1 |
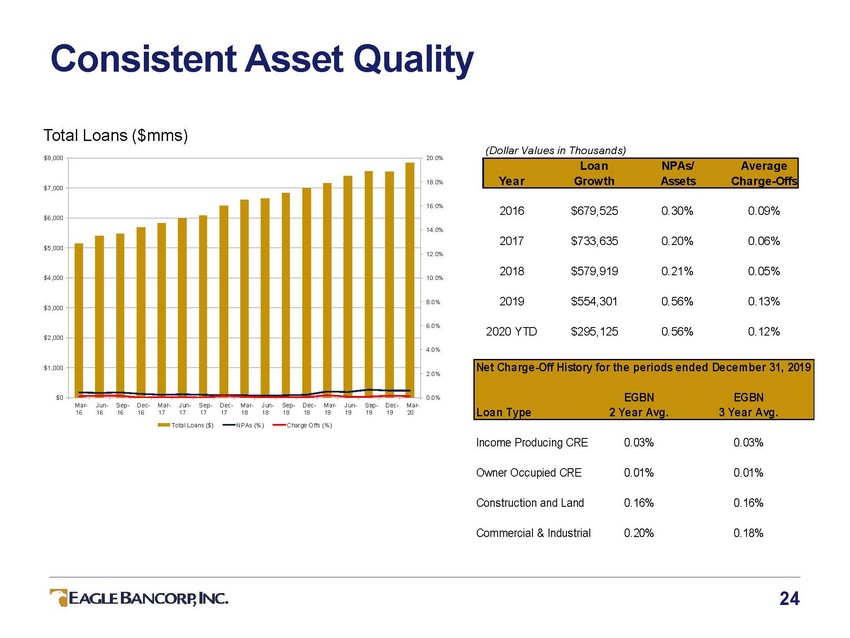 |
Consistent Asset Quality Total Loans ($mms) (Dollar Values in Thousands) $8,000 20.0% 18.0% $7,000 16.0% 2016 $679,525 0.30% 0.09% $6,000 14.0% 2017 $733,635 0.20% 0.06% $5,000 12.0% 2018 $579,919 0.21% 0.05% $4,000 10.0% 2019 $554,301 0.56% 0.13% 8.0% $3,000 6.0% 2020 YTD $295,125 0.56% 0.12% $2,000 4.0% $1,000 2.0% $0 0.0% Mar-Jun-Sep-Dec-Mar-Jun-Sep-17 Dec-Mar-Jun-Sep-Dec-Mar-Jun-Sep-Dec-Mar-16 16 16 16 17 17 17 18 18 18 18 19 19 19 19 20 Total Loans ($) NPAs (%) Charge Offs (%) Income Producing CRE 0.03% 0.03% Owner Occupied CRE 0.01% 0.01% Construction and Land 0.16% 0.16% Commercial & Industrial 0.20% 0.18% 24 Net Charge-Off History for the periods ended December 31, 2019 EGBNEGBN Loan Type2 Year Avg.3 Year Avg. Loan NPAs/ Average Year Growth Assets Charge-Offs |
 |
Strength in C&I Lending • At 23% of the Loan Portfolio, EagleBank has a much larger focus on C&I Lending than other local peer banks • C&I Loan Portfolio is predominantly variable rate loans • Owner Occupied Loans are key to small and mid-market relationships • DDA Operating Accounts of C&I relationships are a critical component of deposit composition strategy • Treasury Management services provide opportunity for relationship retention and expansion 25 |
 |
CRE Risk Management • Executive & Board Level Oversight Approval Process of • Disciplined Underwriting • Proactive Portfolio Management • Quarterly Stress Testing of CRE Portfolio • Quarterly Independent Credit Review • Dedicated Special Assets Team 26 |
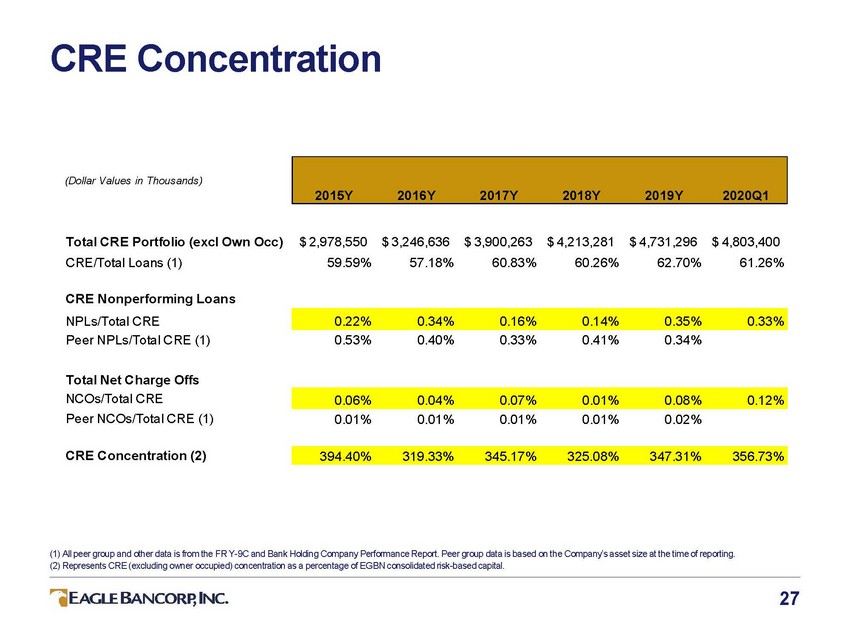 |
CRE Concentration (Dollar Values in Thousands) Total CRE Portfolio (excl Own Occ) CRE/Total Loans (1) $ 2,978,550 59.59% $ 3,246,636 57.18% $ 3,900,263 60.83% $ 4,213,281 60.26% $ 4,731,296 62.70% $ 4,803,400 61.26% CRE Nonperforming Loans NPLs/Total CRE Peer NPLs/Total CRE (1) 0.53% 0.40% 0.33% 0.41% 0.34% Total Net Charge Offs NCOs/Total CRE Peer NCOs/Total CRE (1) 0.01% 0.01% 0.01% 0.01% 0.02% CRE Concentration (2) 394.40% 319.33% 345.17% 325.08% 347.31% 356.73% (1) All peer group and other data is from the FR Y-9C and Bank Holding Company Performance Report. Peer group data is based on the Company’s asset size at the time of reporting. (2) Represents CRE (excluding owner occupied) concentration as a percentage of EGBN consolidated risk-based capital. 27 0.06% 0.04% 0.07% 0.01% 0.08% 0.12% 0.22% 0.34% 0.16% 0.14% 0.35% 0.33% 2015Y 2016Y 2017Y 2018Y 2019Y 2020Q1 |
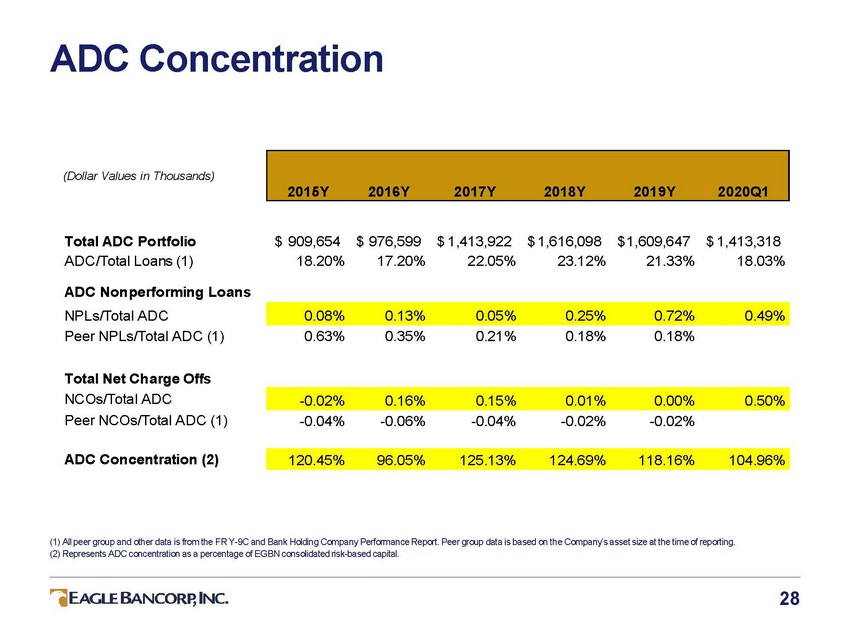 |
ADC Concentration (Dollar Values in Thousands) Total ADC Portfolio ADC/Total Loans (1) $ 909,654 18.20% $ 976,599 17.20% $ 1,413,922 22.05% $ 1,616,098 23.12% $1,609,647 21.33% $ 1,413,318 18.03% ADC Nonperforming Loans NPLs/Total ADC Peer NPLs/Total ADC (1) 0.63% 0.35% 0.21% 0.18% 0.18% Total Net Charge Offs NCOs/Total ADC Peer NCOs/Total ADC (1) -0.04% -0.06% -0.04% -0.02% -0.02% ADC Concentration (2) (1) All peer group and other data is from the FR Y-9C and Bank Holding Company Performance Report. Peer group data is based on the Company’s asset size at the time of reporting. (2) Represents ADC concentration as a percentage of EGBN consolidated risk-based capital. 28 120.45% 96.05% 125.13% 124.69% 118.16% 104.96% -0.02% 0.16% 0.15% 0.01% 0.00% 0.50% 0.08% 0.13% 0.05% 0.25% 0.72% 0.49% 2015Y 2016Y 2017Y 2018Y 2019Y 2020Q1 |
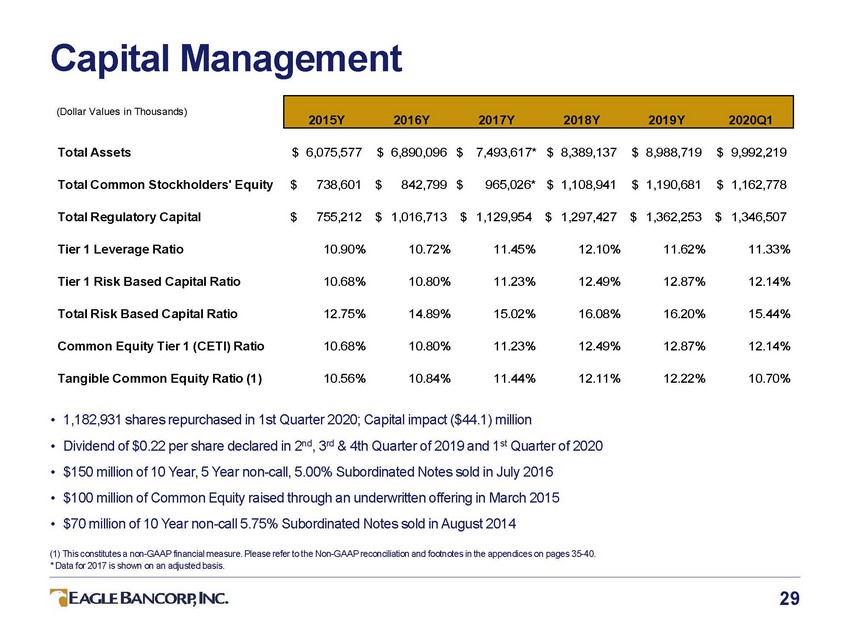 |
Capital Management (Dollar Values in Thousands) Total Assets $ 6,075,577 $ 6,890,096 $ 7,493,617* $ 8,389,137 $ 8,988,719 $ 9,992,219 Total Common Stockholders' Equity $ 738,601 $ 842,799 $ 965,026* $ 1,108,941 $ 1,190,681 $ 1,162,778 Total Regulatory Capital $ 755,212 $ 1,016,713 $ 1,129,954 $ 1,297,427 $ 1,362,253 $ 1,346,507 Tier 1 Leverage Ratio 10.90% 10.72% 11.45% 12.10% 11.62% 11.33% Tier 1 Risk Based Capital Ratio 10.68% 10.80% 11.23% 12.49% 12.87% 12.14% Total Risk Based Capital Ratio 12.75% 14.89% 15.02% 16.08% 16.20% 15.44% Common Equity Tier 1 (CETI) Ratio 10.68% 10.80% 11.23% 12.49% 12.87% 12.14% Tangible Common Equity Ratio (1) 10.56% 10.84% 11.44% 12.11% 12.22% 10.70% • • • • • 1,182,931 shares repurchased in 1st Quarter 2020; Capital impact ($44.1) million Dividend of $0.22 per share declared in 2nd, 3rd & 4th Quarter of 2019 and 1st Quarter of 2020 $150 million of 10 Year, 5 Year non-call, 5.00% Subordinated Notes sold in July 2016 $100 million of Common Equity raised through an underwritten offering in March 2015 $70 million of 10 Year non-call 5.75% Subordinated Notes sold in August 2014 (1) This constitutes a non-GAAP financial measure. Please refer to the Non-GAAP reconciliation and footnotes in the appendices on pages 35-40. * Data for 2017 is shown on an adjusted basis. 29 2015Y 2016Y 2017Y 2018Y 2019Y 2020Q1 |
 |
Key Success Factors • Building and maintaining core relationships – Cross sales – Focus on key customers • Maintenance of strong credit culture – – – – – Conservative underwriting criteria and loan policies Disciplined committee approval and review process Portfolio is balanced among C&I, CRE and Construction loans Periodic loan and portfolio stress testing Proactive identification and resolution of problem credits • Built and preserved a strong capital position and balance sheet – – – Nine capital raising events since August 2008 Consistent quarterly profitability bolsters the capital position Strong Capital Ratios even after returning $128 million of capital to shareholders through the Cash Dividend and Share Repurchase Program initiated in 2019 30 |
 |
Key Success factors (continued) • Disciplined ALCO process • Maintained focus on areas of strength – Concentration on core geographic markets and products • Proper infrastructure to support the increased volume of business and regulation • Comprehensive Management and Board level reporting • Human Resources – – – Recruiting of strong, seasoned bankers with local market knowledge and experience Well designed, incentive based compensation plans Stability of staff, low turnover rate 31 |
 |
EagleBank Growth Strategy – Pricing discipline to sustain Net Interest Margin – Prudent expense management with streamlined branch system to maintain Efficiency Ratio • Profitability • Sustain Credit Quality – – – Maintain balanced portfolio mix: C&I, CRE and Construction Enhanced monitoring of individual credits Expanded stress testing • Emphasis on Organic Growth – – Only 3.2% deposit market share in DC Metro Area Significant opportunities to expand C&I business lines including loans and treasury management products Attract new relationships and develop cross sell opportunities Enhance infrastructure to support growth beyond $10 billion in assets – – • Opportunities for Noninterest Income – Residential mortgage origination, SBA guaranteed loan origination & sales, FHA commercial mortgage origination & sales, treasury management services, insurance 32 |
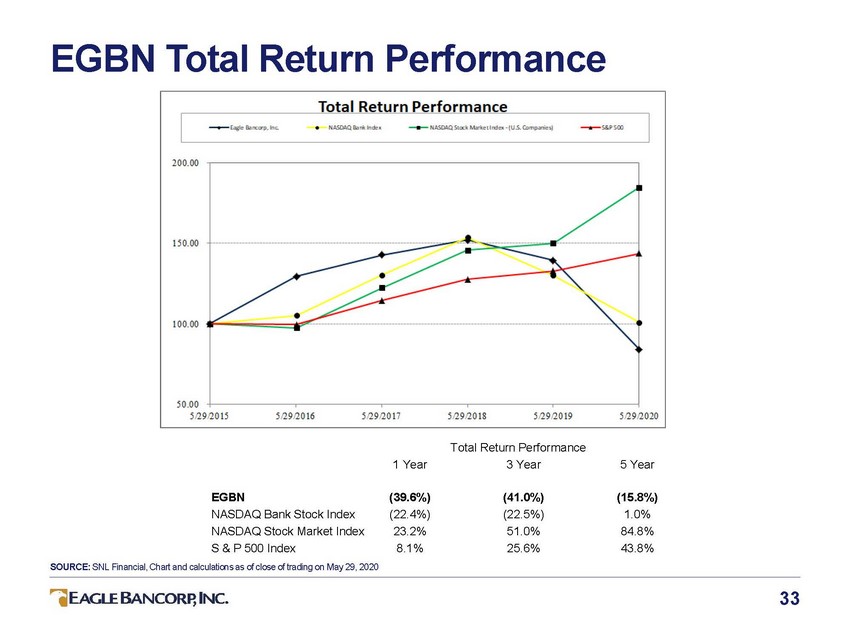 |
EGBN Total Return Performance Total Return Performance 3 Year 1 Year 5 Year EGBN NASDAQ Bank Stock Index NASDAQ Stock Market Index S & P 500 Index SOURCE: SNL Financial, Chart and calculations as of close of trading on May 29, 2020 (39.6%) (22.4%) 23.2% 8.1% (41.0%) (22.5%) 51.0% 25.6% (15.8%) 1.0% 84.8% 43.8% 33 |
 |
Appendices 34 t EAGLE BANCORP, INC. |
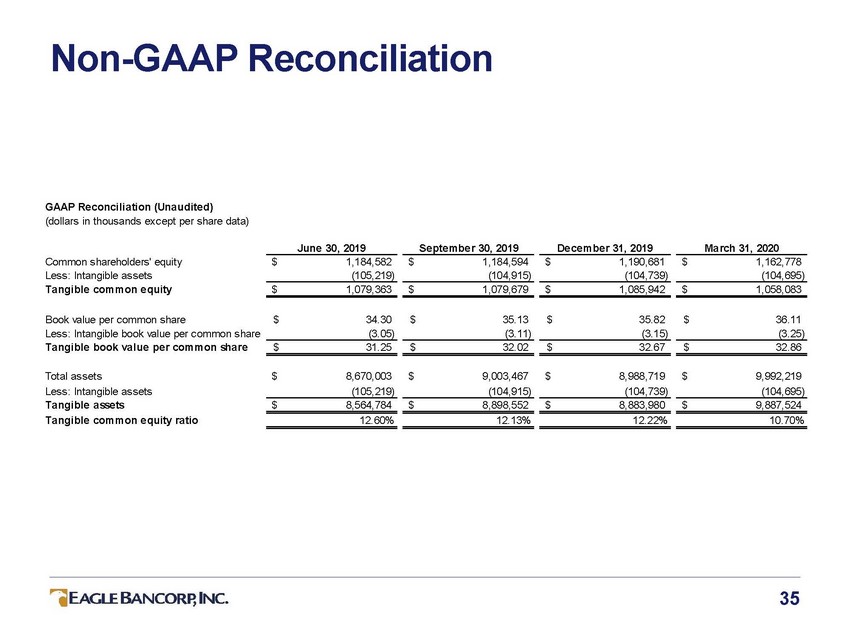 |
Non-GAAP Reconciliation GAAP Reconciliation (Unaudited) (dollars in thousands except per share data) June 30, 2019 Se pte mbe r 30, 2019 De ce mbe r 31, 2019 Ma rch 31, 2020 Common shareholders' equity Less: Intangible assets Tangible common equity $ 1,184,582 $ 1,184,594 $ 1,190,681 $ 1,162,778 (105,219) (104,915) (104,739) (104,695) $ 1,079,363 $ 1,079,679 $ 1,085,942 $ 1,058,083 Book value per common share $ 34.30 $ 35.13 $ 35.82 $ 36.11 Less: Intangible book value per common share (3.05) (3.11) (3.15) (3.25) Tangible book value per common share $ 31.25 $ 32.02 $ 32.67 $ 32.86 Total assets Less: Intangible assets Tangible assets Tangible common equity ratio $ 8,670,003 $ 9,003,467 $ 8,988,719 $ 9,992,219 (105,219) (104,915) (104,739) (104,695) $ 8,564,784 $ 8,898,552 $ 8,883,980 $ 9,887,524 12.60% 12.13% 12.22% 10.70% 35 |
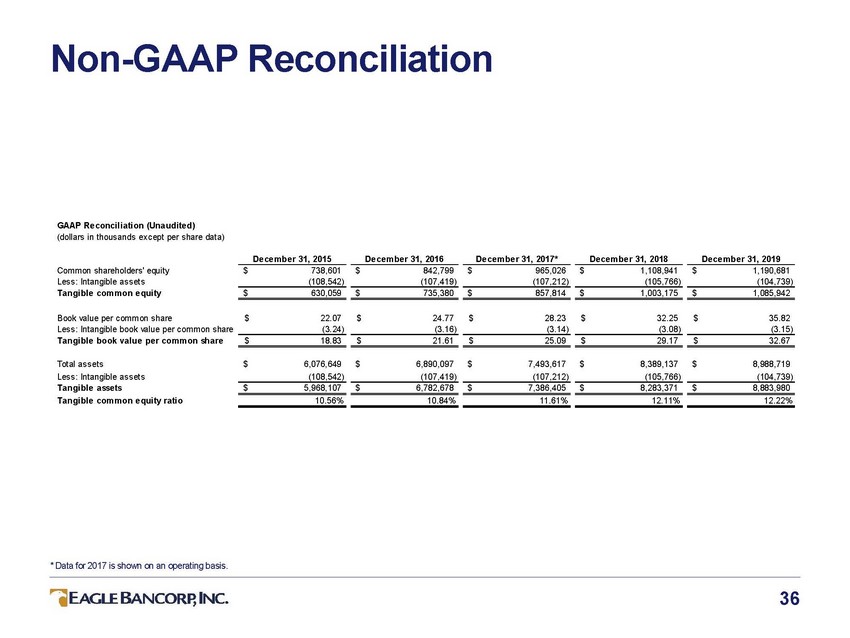 |
Non-GAAP Reconciliation GAAP Reconciliation (Unaudited) (dollars in thousands except per share data) De ce mbe r 31, 2015 De ce mbe r 31, 2016 De ce mbe r 31, 2017* De ce mbe r 31, 2018 De ce mbe r 31, 2019 Common shareholders' equity Less: Intangible assets Tangible common equity $ 738,601 $ 842,799 $ 965,026 $ 1,108,941 $ 1,190,681 (108,542) (107,419) (107,212) (105,766) (104,739) $ 630,059 $ 735,380 $ 857,814 $ 1,003,175 $ 1,085,942 Book value per common share $ 22.07 $ 24.77 $ 28.23 $ 32.25 $ 35.82 Less: Intangible book value per common share (3.24) (3.16) (3.14) (3.08) (3.15) Tangible book value per common share $ 18.83 $ 21.61 $ 25.09 $ 29.17 $ 32.67 Total assets Less: Intangible assets Tangible assets Tangible common equity ratio $ 6,076,649 $ 6,890,097 $ 7,493,617 $ 8,389,137 $ 8,988,719 (108,542) (107,419) (107,212) (105,766) (104,739) $ 5,968,107 $ 6,782,678 $ 7,386,405 $ 8,283,371 $ 8,883,980 10.56% 10.84% 11.61% 12.11% 12.22% * Data for 2017 is shown on an operating basis. 36 |
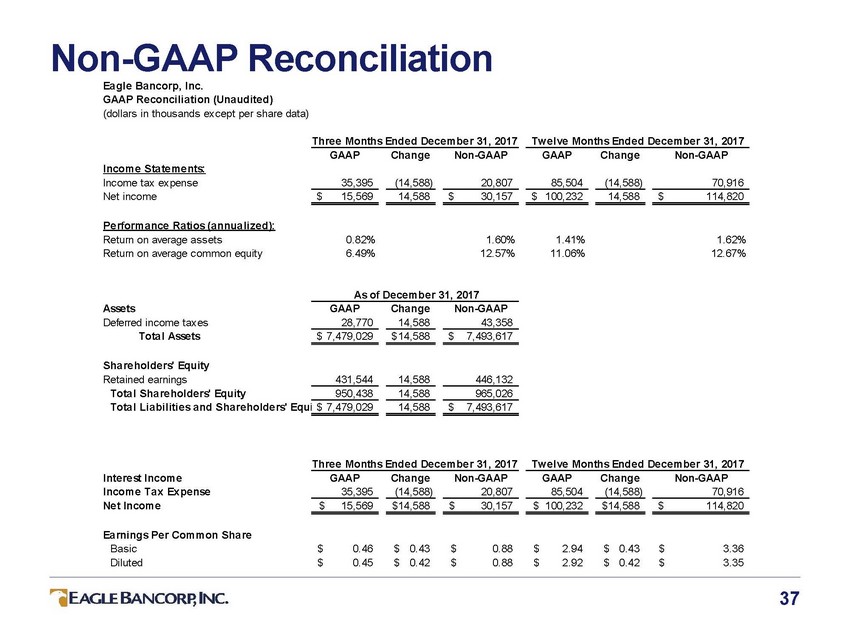 |
Non-GAAP Reconciliation Eagle Bancorp, Inc. GAAP Reconciliation (Unaudited) (dollars in thousands except per share data) Thre e Months Ende d De ce mbe r 31, 2017 Tw e lve Months Ende d De ce mbe r 31, 2017 GAAP Change Non-GAAP GAAP Change Non-GAAP Income Sta te me nts: Income tax expense Net income 35,395 (14,588) 20,807 85,504 (14,588) 70,916 $ 15,569 14,588 $ 30,157 $ 100,232 14,588 $ 114,820 Pe rforma nce Ra tios (a nnua lize d): Return on average assets Return on average common equity 0.82% 6.49% 1.60% 12.57% 1.41% 11.06% 1.62% 12.67% As of De ce mbe r 31, 2017 Assets Deferred income taxes Total Assets GAAP 28,770 Change 14,588 Non-GAAP 43,358 $ 7,479,029 $14,588 $7,493,617 Shareholders' Equity Retained earnings Total Shareholders' Equity 431,544 14,588 446,132 950,438 14,588 965,026 Total Liabilities and Shareholders' Equ $ 7,479,029 14,588 $7,493,617 Three Months Ended December 31, 2017 Twelve Months Ended December 31, 2017 Interest Income Income Tax Expense Net Income GAAP 35,395 Change (14,588) Non-GAAP 20,807 GAAP 85,504 Change (14,588) Non-GAAP 70,916 $ 15,569 $14,588 $ 30,157 $ 100,232 $14,588 $ 114,820 Earnings Per Common Share Basic Diluted $ $ 0.46 0.45 $ 0.43 $ 0.42 $ $ 0.88 0.88 $ $ 2.94 2.92 $ 0.43 $ 0.42 $ $ 3.36 3.35 37 |
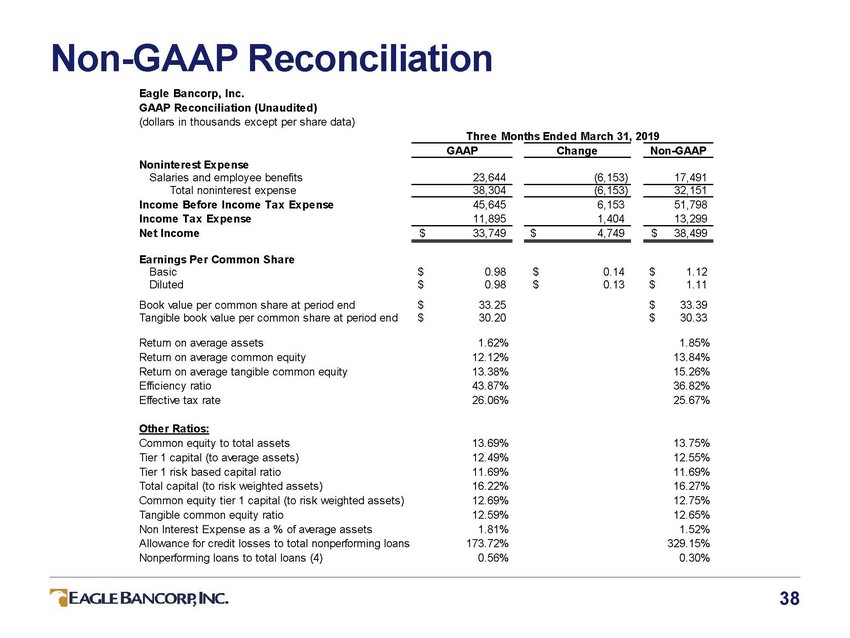 |
Non-GAAP Reconciliation Eagle Bancorp, Inc. GAAP Reconciliation (Unaudited) (dollars in thousands except per share data) Thre e Months Ende d Ma rch 31, 2019 GAAP Cha nge Non-GAAP Noninterest Expense Salaries and employee benefits Total noninterest expense Income Before Income Tax Expense Income Tax Expense Net Income 23,644 (6,153) 17,491 38,304 (6,153) 32,151 45,645 11,895 6,153 1,404 51,798 13,299 $ 33,749 $ 4,749 $ 38,499 Earnings Per Common Share Basic Diluted Book value per common share at period end Tangible book value per common share at period end $ $ $ $ 0.98 0.98 33.25 30.20 $ $ 0.14 0.13 $ $ $ $ 1.12 1.11 33.39 30.33 Return on average assets Return on average common equity Return on average tangible common equity Efficiency ratio Effective tax rate 1.62% 12.12% 13.38% 43.87% 26.06% 1.85% 13.84% 15.26% 36.82% 25.67% Othe r Ra tios: Common equity to total assets Tier 1 capital (to average assets) Tier 1 risk based capital ratio Total capital (to risk weighted assets) Common equity tier 1 capital (to risk weighted assets) Tangible common equity ratio Non Interest Expense as a % of average assets Allowance for credit losses to total nonperforming loans Nonperforming loans to total loans (4) 13.69% 12.49% 11.69% 16.22% 12.69% 12.59% 1.81% 173.72% 0.56% 13.75% 12.55% 11.69% 16.27% 12.75% 12.65% 1.52% 329.15% 0.30% 38 |
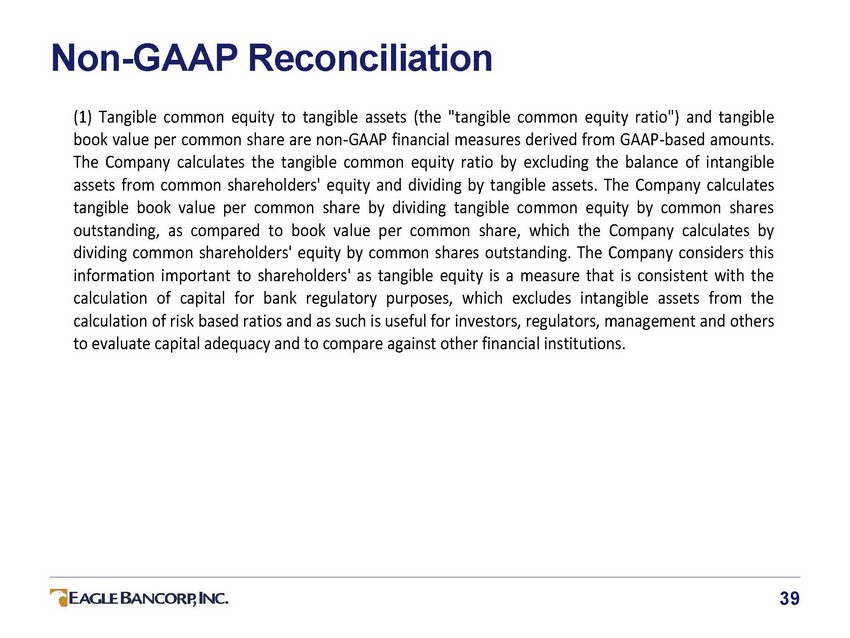 |
Non-GAAP Reconciliation (1) Tangible common equity to tangible assets (the "tangible common equity ratio") and tangible book value per common share are non-GAAP financial measures derived from GAAP-based amounts. The Company calculates the tangible common equity ratio by excluding the balance of intangible assets from common shareholders' equity and dividing by tangible assets. The Company calculates tangible book value per common share by dividing tangible common equity by common shares outstanding, as compared to book value per common share, which the Company calculates by dividing common shareholders' equity by common shares outstanding. The Company considers this information important to shareholders' as tangible equity is a measure that is consistent with the calculation of capital for bank regulatory purposes, which excludes intangible assets from the calculation of risk based ratios and as such is useful for investors, regulators, management and others to evaluate capital adequacy and to compare against other financial institutions. 39 |
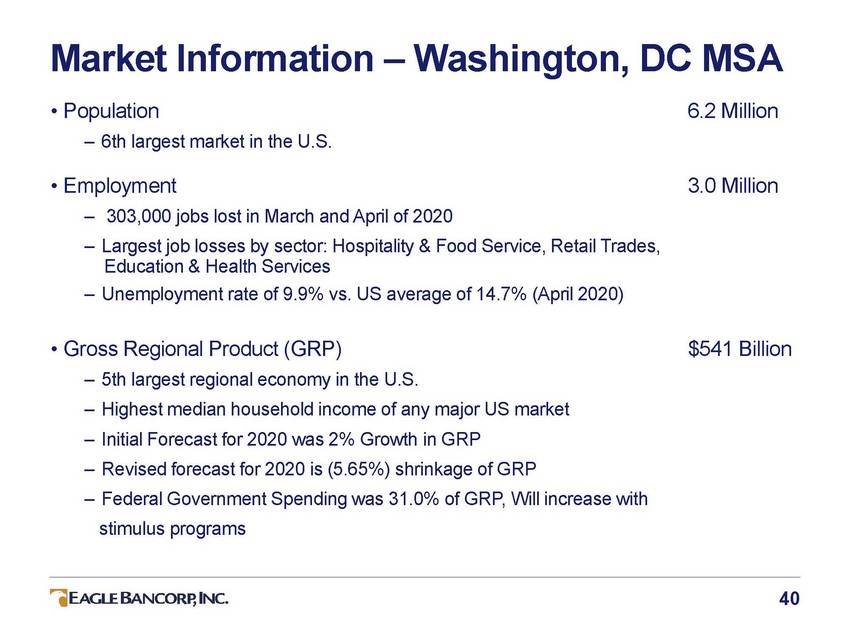 |
Market Information • Population – 6th largest market in the U.S. – Washington, DC MSA 6.2 Million • Employment 3.0 Million – – 303,000 jobs lost in March and April of 2020 Largest job losses by sector: Hospitality & Food Service, Retail Trades, Education & Health Services Unemployment rate of 9.9% vs. US average of 14.7% (April 2020) – • Gross Regional Product (GRP) $541 Billion – – – – – 5th largest regional economy in the U.S. Highest median household income of any major US market Initial Forecast for 2020 was 2% Growth in GRP Revised forecast for 2020 is (5.65%) shrinkage of GRP Federal Government Spending was 31.0% of GRP, Will increase with stimulus programs 40 |
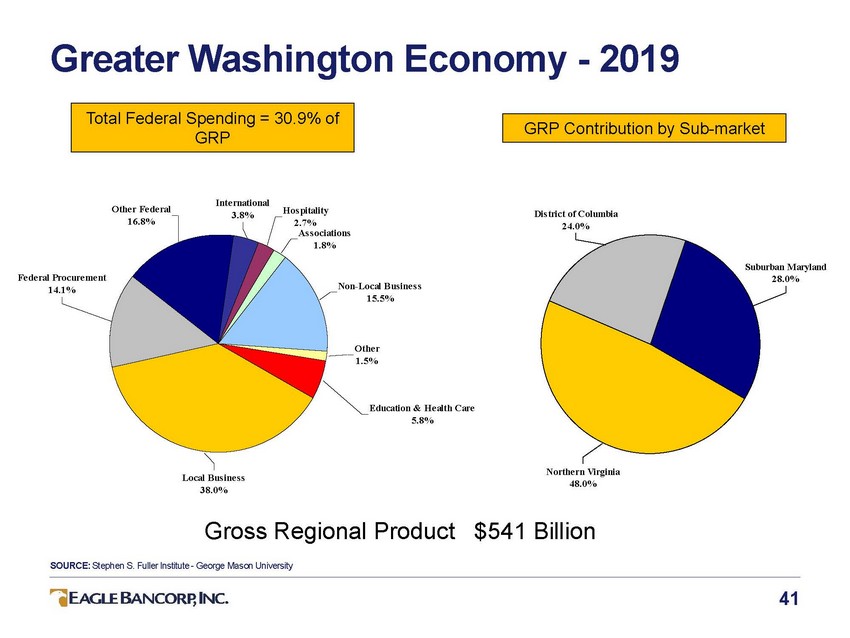 |
Greater Washington Economy - 2019 Inte rnational Othe r Fe de ral Hos pitality 2.7% As s ociations Dis trict of Columbia 24.0% 3.8% 16.8% 1.8% Suburban Maryland 28.0% Fe de ral Procure me nt 14.1% Non-Local B us ine s s 15.5% Othe r 1.5% Education & He alth Care 5.8% Northe rn Virginia 48.0% Local B us ine s s 38.0% Gross Regional Product $541 Billion SOURCE: Stephen S. Fuller Institute - George Mason University 41 GRP Contribution by Sub-market Total Federal Spending = 30.9% of GRP |
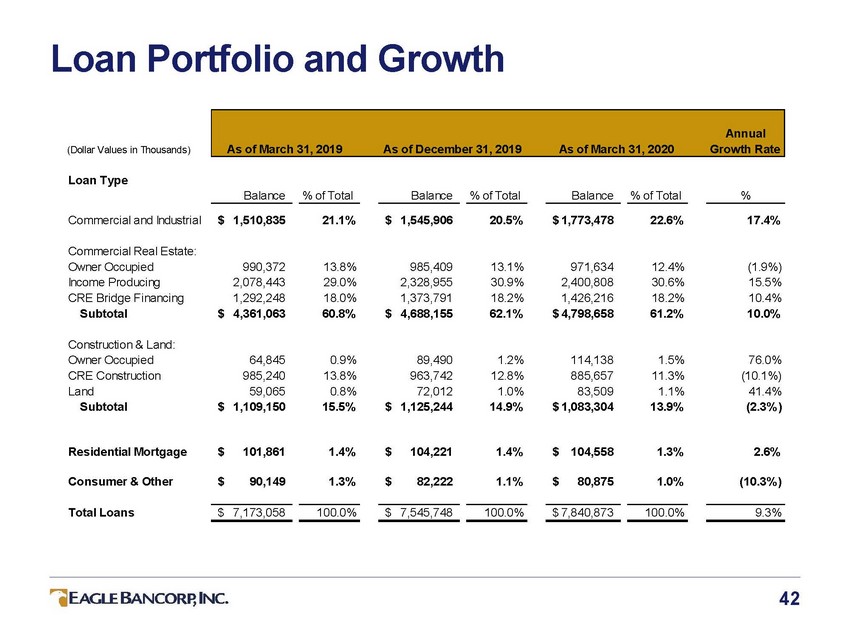 |
Loan Portfolio and Growth (Dollar Values in Thousands) Loan Type Balance % of Total Balance % of Total Balance % of Total % Commercial and Industrial $ 1,510,835 21.1% $ 1,545,906 20.5% $ 1,773,478 22.6% 17.4% Commercial Real Estate: Owner Occupied Income Producing CRE Bridge Financing Subtotal 990,372 2,078,443 1,292,248 4,361,063 13.8% 29.0% 18.0% 60.8% 985,409 2,328,955 1,373,791 4,688,155 13.1% 30.9% 18.2% 62.1% 971,634 2,400,808 1,426,216 $ 4,798,658 12.4% 30.6% 18.2% 61.2% (1.9%) 15.5% 10.4% 10.0% $ $ Construction & Land: Owner Occupied CRE Construction Land Subtotal 64,845 985,240 59,065 1,109,150 0.9% 13.8% 0.8% 15.5% 89,490 963,742 72,012 1,125,244 1.2% 12.8% 1.0% 14.9% 114,138 885,657 83,509 $ 1,083,304 1.5% 11.3% 1.1% 13.9% 76.0% (10.1%) 41.4% (2.3% ) $ $ Residential Mortgage $ 101,861 1.4% $ 104,221 1.4% $104,558 1.3% 2.6% Consumer & Other $ 90,149 1.3% $ 82,222 1.1% $ 80,875 1.0% (10.3% ) Total Loans $ 7,173,058 100.0% $ 7,545,748 100.0% $ 7,840,873 100.0% 9.3% 42 Annual As of March 31, 2019As of December 31, 2019As of March 31, 2020Growth Rate |
 |
Geographic Detail – Income Producing CRE Maryland Prince George's Baltimore Anne Arundel Frederick Eastern Shore Howard Charles Other MD 32,432 2,219 1,902 6,115 1,833 2,227 6,341 - 101,856 15,295 9,730 - 58,458 - - - 2,670 85,681 - 2,621 - - - 155 - 1,823 - - - - - 1,305 31,129 6,599 8,598 39,378 501 10,061 623 1,377 35,557 1,100 20,025 2,195 - 6,459 - - 2,425 1,730 - 3,461 1,319 790 - - 27,384 - - 4,277 1,954 1,523 1,243 - 233,453 114,447 40,255 58,047 64,065 21,060 8,207 2,837 9.7% 4.8% 1.7% 2.4% 2.7% 0.9% 0.3% 0.1% Virginia Loudoun Arlington Alexandria Prince William Fauquier Other VA 42,145 13,825 24,054 8,992 - 61,872 - 46,373 - 27,687 - - - - 7,808 - - 5,598 41,000 241 - - - 15,362 7,912 - 2,558 10,667 4,953 37,252 27,018 - - 3,577 - 218 1,131 4,563 - 1,461 - 1,533 20,493 1,900 - 10,832 - 1,882 139,699 66,902 34,420 63,216 4,953 123,717 5.8% 2.8% 1.4% 2.6% 0.2% 5.2% Other USA 3,857 2,277 447 31,521 8,008 - 5,077 68,337 119,524 5.0% Total $533,237 $443,838 $418,964 $319,552 $265,796 $117,424 $109,941 $192,056 $2,400,808 100.0% % of Total 22.2% 18.4% 17.5% 13.3% 11.1% 4.9% 4.6% 8.0% 100.0% • Focus in core sub-markets: Washington, DC, Montgomery County, Fairfax County NOTE: Data as of March 31, 2020 43 Fairfax 185,078 - 1,033 1,048 41,460 550 5,061 34,919 269,149 11.2% Washington DC 71,928 137,746 172,913 155,054 36,313 3,282 75,035 4,455 656,726 27.4% Montgomery $ 68,417 $ 44,416 $ 140,038 $ 72,198 $ 18,407 $ 17,443 $ 6,355 $ 12,857 $ 380,131 15.8% (Dollar Value in Thousands) Single Office/ Mixed Multi-Redevel./& 1-4 County Condo Hotel Use Family Retail Industrial Family Other TOTAL Total |
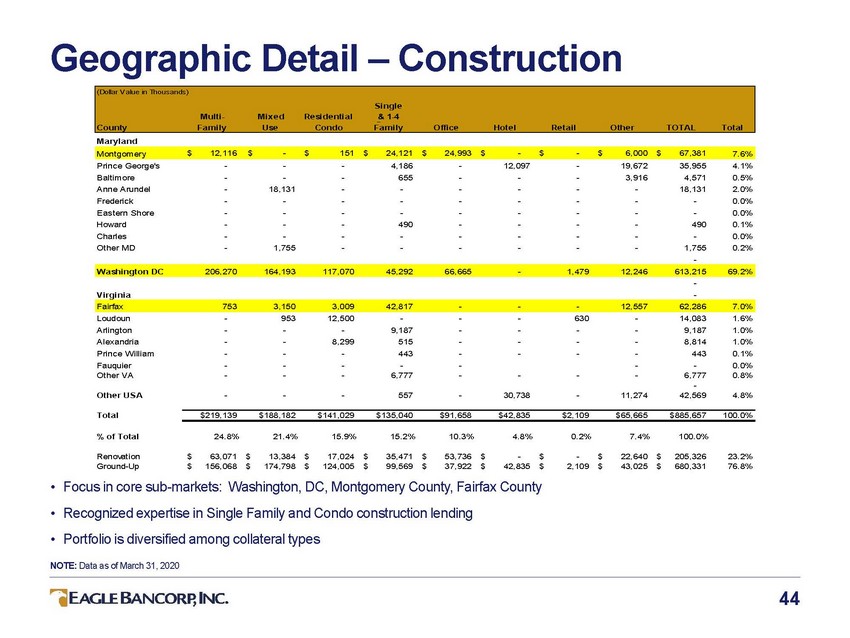 |
Geographic Detail – Construction Maryland Prince George's Baltimore Anne Arundel Frederick Eastern Shore Howard Charles Other MD - - - - - - - - - - 18,131 - - - - 1,755 - - - - - - - - 4,186 655 - - - 490 - - - - - - - - - - 12,097 - - - - - - - - - - - - - - - 19,672 3,916 - - - - - - 35,955 4,571 18,131 - - 490 - 1,755 - 4.1% 0.5% 2.0% 0.0% 0.0% 0.1% 0.0% 0.2% - - Virginia Loudoun Arlington Alexandria Prince William Fauquier Other VA - - - - - - 953 - - - - - 12,500 - 8,299 - - - - 9,187 515 443 - 6,777 - - - - - - - - - - 630 - - - - - - - - - 14,083 9,187 8,814 443 - 6,777 - 42,569 1.6% 1.0% 1.0% 0.1% 0.0% 0.8% - - Othe r USA - - - 557 - 30,738 - 11,274 4.8% Total $219,139 $188,182 $141,029 $135,040 $91,658 $42,835 $2,109 $65,665 $885,657 100.0% % of Total 24.8% 21.4% 15.9% 15.2% 10.3% 4.8% 0.2% 7.4% 100.0% Renovation Ground-Up $ 63,071 $ 156,068 $ $ 13,384 174,798 $ 17,024 $ 124,005 $ $ 35,471 99,569 $ $ 53,736 37,922 $ $ - 42,835 $ $ - 2,109 $ $ 22,640 43,025 $ 205,326 $ 680,331 23.2% 76.8% • • • Focus in core sub-markets: Washington, DC, Montgomery County, Fairfax County Recognized expertise in Single Family and Condo construction lending Portfolio is diversified among collateral types NOTE: Data as of March 31, 2020 44 Fairfax 753 3,150 3,009 42,817 - - - 12,557 62,286 7.0% Washington DC 206,270 164,193 117,070 45,292 66,665 - 1,479 12,246 613,215 69.2% Montgomery $ 12,116 $ - $ 151 $ 24,121 $ 24,993 $ - $ - $ 6,000 $ 67,381 7.6% (Dollar Value in Thousands) Single Multi-Mixed Reside ntial & 1-4 County Fa mily Use Condo Fa mily Office Hotel Retail Othe r TOTAL Total |
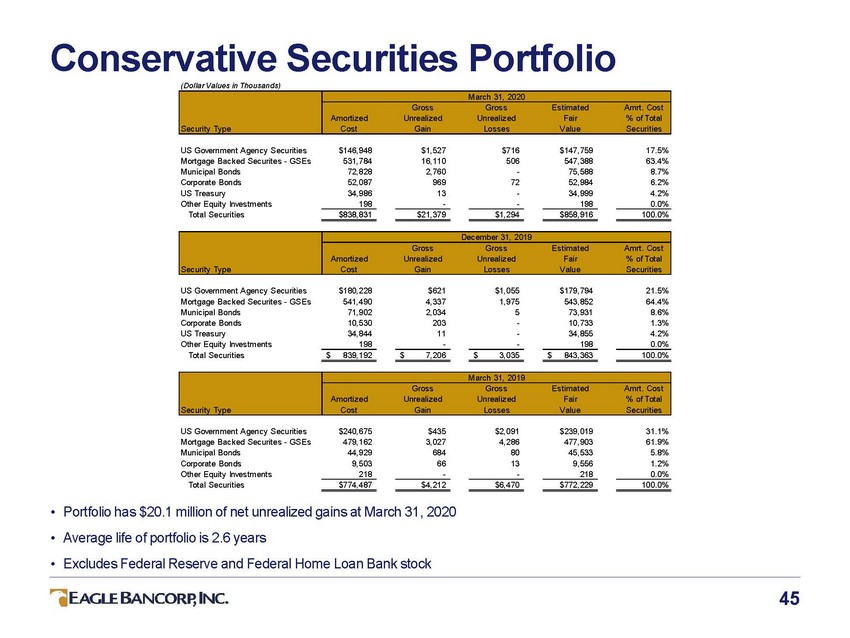 |
Conservative Securities (Dollar Values in Thousands) Portfolio US Government Agency Securities Mortgage Backed Securites - GSEs Municipal Bonds Corporate Bonds US Treasury Other Equity Investments Total Securities $146,948 531,784 72,828 52,087 34,986 198 $1,527 16,110 2,760 969 13 - $716 506 - 72 - - $147,759 547,388 75,588 52,984 34,999 198 17.5% 63.4% 8.7% 6.2% 4.2% 0.0% $838,831 $21,379 $1,294 $858,916 100.0% US Government Agency Securities Mortgage Backed Securites - GSEs Municipal Bonds Corporate Bonds US Treasury Other Equity Investments Total Securities $180,228 541,490 71,902 10,530 34,844 198 $621 4,337 2,034 203 11 - $1,055 1,975 5 - - - $179,794 543,852 73,931 10,733 34,855 198 21.5% 64.4% 8.6% 1.3% 4.2% 0.0% $ 839,192 $ 7,206 $ 3,035 $ 843,363 100.0% US Government Agency Securities Mortgage Backed Securites - GSEs Municipal Bonds Corporate Bonds Other Equity Investments Total Securities $240,675 479,162 44,929 9,503 218 $435 3,027 684 66 - $2,091 4,286 80 13 - $239,019 477,903 45,533 9,556 218 31.1% 61.9% 5.8% 1.2% 0.0% $774,487 $4,212 $6,470 $772,229 100.0% • • • Portfolio has $20.1 million of net unrealized gains at March 31, 2020 Average life of portfolio is 2.6 years Excludes Federal Reserve and Federal Home Loan Bank stock 45 Security Type March 31, 2019 Gross Gross EstimatedAmrt. Cost AmortizedUnrealizedUnrealizedFair % of Total Cost GainLossesValueSecurities Security Type December 31, 2019 Gross Gross EstimatedAmrt. Cost AmortizedUnrealizedUnrealizedFair % of Total Cost GainLossesValueSecurities Security Type March 31, 2020 Gross Gross EstimatedAmrt. Cost AmortizedUnrealizedUnrealizedFair % of Total Cost GainLossesValueSecurities |
 |
Nationally Recognized Financial Performance • “Sm-All Stars” Designation 2011, 2013, 2014, 2015, 2016 & 2017 • Member of KBW Bank Honor Roll 2010-2018 • Named as one of Top 100 Performing Community Banks 2018 • Community Bankers Cup Award 2012-2019 46 Independent Community Bankers of America |
 |
Highly Regarded by Bank Rating Firms FIRM BANK RATING A-300/300 BAUERFINANCIAL, INC Green - *** 47 |
 |
Experienced Management Team Susan G. Riel, Chief Executive Officer & President Eagle Bancorp & EagleBank Ms. Riel, President - Chief Executive Officer of the Bank and Bancorp, and formerly Chief Operating Officer. Ms. Riel has been with the bank for 20 years. She previously served as Executive Vice President - Chief Operating Officer of Columbia First Bank, FSB from 1989 until that institution’s acquisition by First Union Bancorp in 1995. She is one of the founding officers of EagleBank. Ms. Riel has over 42 years of experience in the commercial banking industry. Ms. Riel was recently included in the Bisnow 2017 Power Series: Women of Influence in Commercial Real Estate. Charles D. Levingston, EVP, Chief Financial Officer, Eagle Bancorp, Inc. and EagleBank Mr. Levingston, Executive Vice President and Chief Financial Officer of the Bank and Company as of April 2017, most recently served as Executive Vice President of Finance at the Bank. Mr. Levingston, a CPA, served in various financial and senior management roles at the bank prior to his current role. Mr. Levingston joined the bank in January 2012, and previously worked at the Federal Reserve Banks of Atlanta and Philadelphia as a commissioned Bank Examiner, and at PriceWaterhouseCoopers as a Manager in the Advisory practice. He has over 18 years of experience in the banking industry. Antonio F. Marquez, EVP, Chief Commercial Real Estate Lending Officer Mr. Marquez, Executive Vice President, joined EagleBank in 2011 as the Chief Real Estate Lender. Prior to joining EagleBank, Mr. Marquez established the real estate lending franchise for HSBC for the Washington, DC market Earlier he was the head of Commercial Real Estate lending at Chevy Chase Bank from 1999 to 2005 and prior to that held various lending positions at Chase Manhattan Bank in New York and The Riggs National Bank in Washington, D.C. Mr. Marquez has over 33 years of experience in the banking industry in the Washington, DC metropolitan area. 48 |
 |
Experienced Management Team Lindsey S. Rheaume, EVP, Chief C&I Lending Officer Mr. Rheaume joined EagleBank as Chief C&I Lending Officer in December 2014 and has over 33 years of commercial lending, credit risk and managerial experience in the financial industry. Most recently, he served as relationship executive for JP Morgan Chase, responsible for business development in the DC, suburban Maryland and Northern Virginia market with clients ranging in revenue from $20MM to $500MM. Previously, he served as executive vice president and commercial lending manager at Virginia Commerce Bank—which was acquired by United Bank in 2014— where he managed the bank’s entire commercial and industrial lending activities. Earlier in his career, he held senior commercial lending and credit positions with SunTrust Bank, GE Capital and Bank of America. Paul Saltzman, EVP, Chief Legal Officer Paul Saltzman is Executive Vice President & Chief Legal Officer at EagleBank. He is responsible for all legal and compliance oversight at the bank. Saltzman was recently a Partner in the Banking and Financial Institutions Advisory Practice at White & Case and Vice Chairman at Deutsche Bank, where he helped lead capital stress testing, regulatory remediation and transaction banking in the Americas region. He holds a B.A. from Clark University and a J.D. from Boston University School of Law. Janice L. Williams, EVP, Chief Credit Officer Ms. Williams, Executive Vice President and Chief Credit Officer of the Bank, has served the Bank as Credit Officer, Senior Credit Officer and Chief Credit Officer for the past 15 years. Prior to employment with the Bank, Ms. Williams was with Capital Bank, Sequoia Bank, and American Security Bank. Additionally, Ms. Williams, a graduate of Georgetown University Law Center and a Member of the Maryland Bar, was previously employed in the private practice of law in Maryland. 49 |
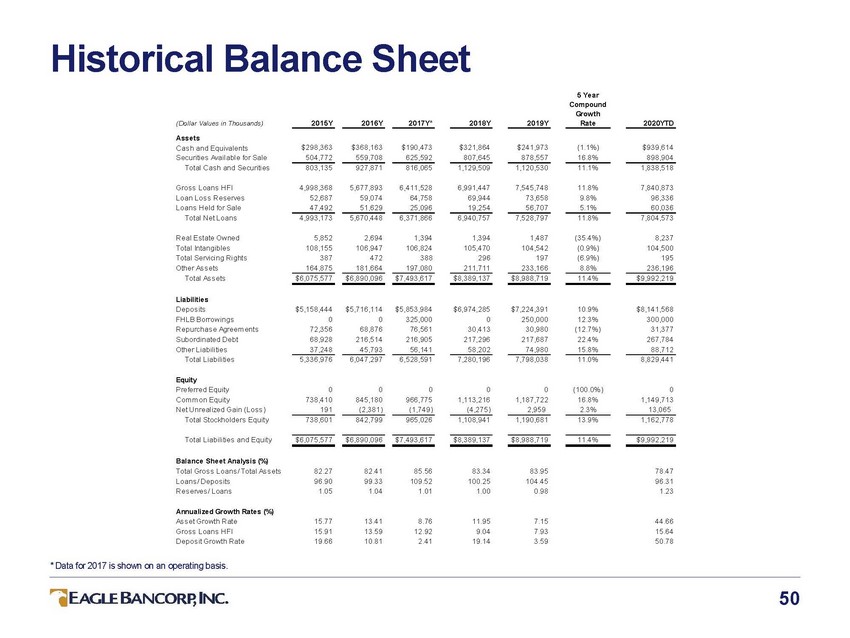 |
Historical Balance Sheet 5 Year Compound Growth Rate 2015Y 2016Y 2017Y* 2018Y 2019Y 2020YTD (Dollar Values in Thousands) Assets Cas h and Equivalents Securities Available for Sale Total Cas h and Securities $298,363 504,772 $368,163 559,708 $190,473 625,592 $321,864 807,645 $241,973 878,557 (1.1%) 16.8% $939,614 898,904 803,135 927,871 816,065 1,129,509 1,120,530 11.1% 1,838,518 Gros s Loans HFI Loan Los s Res erves Loans Held for Sale Total Net Loans 4,998,368 52,687 47,492 5,677,893 59,074 51,629 6,411,528 64,758 25,096 6,991,447 69,944 19,254 7,545,748 73,658 56,707 11.8% 9.8% 5.1% 7,840,873 96,336 60,036 4,993,173 5,670,448 6,371,866 6,940,757 7,528,797 11.8% 7,804,573 Real Es tate Owned Total Intangibles Total Servicing Rights Other As s ets Total As s ets 5,852 108,155 387 164,875 2,694 106,947 472 181,664 1,394 106,824 388 197,080 1,394 105,470 296 211,711 1,487 104,542 197 233,166 (35.4%) (0.9%) (6.9%) 8.8% 8,237 104,500 195 236,196 $6,075,577 $6,890,096 $7,493,617 $8,389,137 $8,988,719 11.4% $9,992,219 Liabilities Depos its FHLB Borrowings Repurchas e Agreem ents Subordinated Debt Other Liabilities Total Liabilities $5,158,444 0 72,356 68,928 37,248 $5,716,114 0 68,876 216,514 45,793 $5,853,984 325,000 76,561 216,905 56,141 $6,974,285 0 30,413 217,296 58,202 $7,224,391 250,000 30,980 217,687 74,980 10.9% 12.3% (12.7%) 22.4% 15.8% $8,141,568 300,000 31,377 267,784 88,712 5,336,976 6,047,297 6,528,591 7,280,196 7,798,038 11.0% 8,829,441 Equity Preferred Equity Com m on Equity Net Unrealized Gain (Los s ) Total Stockholders Equity 0 738,410 191 0 845,180 (2,381) 0 966,775 (1,749) 0 1,113,216 (4,275) 0 1,187,722 2,959 (100.0%) 16.8% 2.3% 0 1,149,713 13,065 738,601 842,799 965,026 1,108,941 1,190,681 13.9% 1,162,778 Total Liabilities and Equity $6,075,577 $6,890,096 $7,493,617 $8,389,137 $8,988,719 11.4% $9,992,219 Balance Sheet Analysis (%) Total Gros s Loans / Total As s ets Loans / Depos its Res erves / Loans 82.27 96.90 1.05 82.41 99.33 1.04 85.56 109.52 1.01 83.34 100.25 1.00 83.95 104.45 0.98 78.47 96.31 1.23 Annualized Growth Rates (%) As s et Growth Rate Gros s Loans HFI Depos it Growth Rate 15.77 15.91 19.66 13.41 13.59 10.81 8.76 12.92 2.41 11.95 9.04 19.14 7.15 7.93 3.59 44.66 15.64 50.78 * Data for 2017 is shown on an operating basis. 50 |
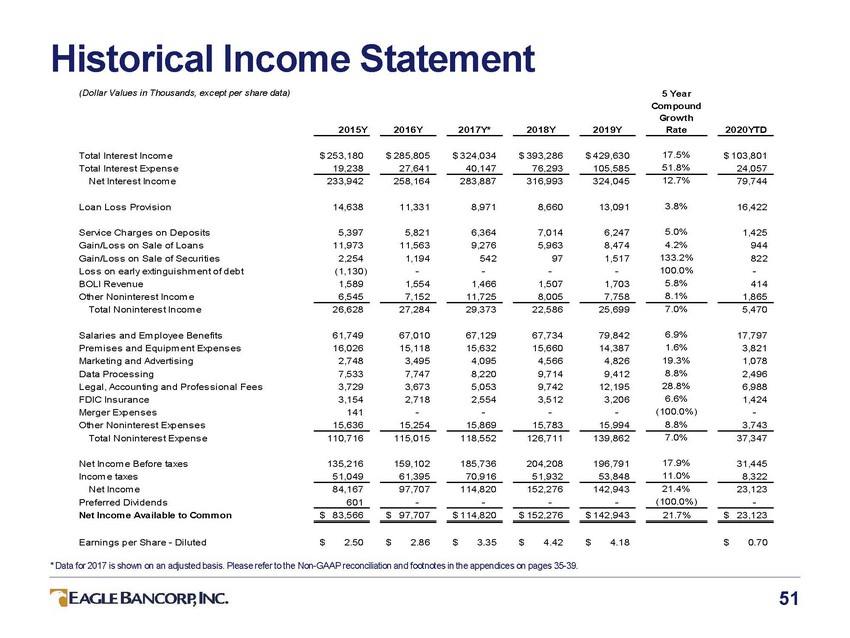 |
Historical Income Statement (Dollar Values in Thousands, except per share data) 5 Year Compound Growth Rate 2015Y 2016Y 2017Y* 2018Y 2019Y 2020YTD 17.5% 51.8% Total Interes t Incom e Total Interes t Expens e Net Interes t Incom e $ 253,180 19,238 $ 285,805 27,641 $ 324,034 40,147 $ 393,286 76,293 $ 429,630 105,585 $ 103,801 24,057 12.7% 233,942 258,164 283,887 316,993 324,045 79,744 3.8% Loan Los s Provis ion 14,638 11,331 8,971 8,660 13,091 16,422 Service Charges on Depos its Gain/Los s on Sale of Loans Gain/Los s on Sale of Securities Los s on early extinguis hm ent of debt BOLI Revenue Other Noninteres t Incom e Total Noninteres t Incom e 5,397 11,973 2,254 (1,130) 1,589 6,545 5,821 11,563 1,194 - 1,554 7,152 6,364 9,276 542 - 1,466 11,725 7,014 5,963 97 - 1,507 8,005 6,247 8,474 1,517 - 1,703 7,758 5.0% 4.2% 133.2% 100.0% 5.8% 8.1% 1,425 944 822 - 414 1,865 7.0% 26,628 27,284 29,373 22,586 25,699 5,470 Salaries and Em ployee Benefits Prem is es and Equipm ent Expens es Marketing and Advertis ing Data Proces s ing Legal, Accounting and Profes s ional Fees FDIC Ins urance Merger Expens es Other Noninteres t Expens es Total Noninteres t Expens e 61,749 16,026 2,748 7,533 3,729 3,154 141 15,636 67,010 15,118 3,495 7,747 3,673 2,718 - 15,254 67,129 15,632 4,095 8,220 5,053 2,554 - 15,869 67,734 15,660 4,566 9,714 9,742 3,512 - 15,783 79,842 14,387 4,826 9,412 12,195 3,206 - 15,994 6.9% 1.6% 19.3% 8.8% 28.8% 6.6% (100.0%) 8.8% 17,797 3,821 1,078 2,496 6,988 1,424 - 3,743 110,716 115,015 118,552 126,711 139,862 7.0% 37,347 17.9% 11.0% Net Incom e Before taxes Incom e taxes Net Incom e Preferred Dividends Net Income Available to Common 135,216 51,049 159,102 61,395 185,736 70,916 204,208 51,932 196,791 53,848 31,445 8,322 21.4% (100.0%) 84,167 601 97,707 - 114,820 - 152,276 - 142,943 - 23,123 - $ 83,566 $ 97,707 $ 114,820 $ 152,276 $ 142,943 21.7% $ 23,123 Earnings per Share - Diluted $ 2.50 $ 2.86 $ 3.35 $ 4.42 $ 4.18 $ 0.70 * Data for 2017 is shown on an adjusted basis. Please refer to the Non-GAAP reconciliation and footnotes in the appendices on pages 35-39. 51 |