Attached files
| file | filename |
|---|---|
| EX-99.3 - EX-99.3 - Ceres Tactical Commodity L.P. | d859151dex993.htm |
| EX-99.2 - EX-99.2 - Ceres Tactical Commodity L.P. | d859151dex992.htm |
| EX-99.1 - EX-99.1 - Ceres Tactical Commodity L.P. | d859151dex991.htm |
| EX-32.2 - EX-32.2 - Ceres Tactical Commodity L.P. | d859151dex322.htm |
| EX-32.1 - EX-32.1 - Ceres Tactical Commodity L.P. | d859151dex321.htm |
| EX-31.2 - EX-31.2 - Ceres Tactical Commodity L.P. | d859151dex312.htm |
| EX-31.1 - EX-31.1 - Ceres Tactical Commodity L.P. | d859151dex311.htm |
| EX-4.1 - EX-4.1 - Ceres Tactical Commodity L.P. | d859151dex41.htm |
UNITED STATES
SECURITIES AND EXCHANGE COMMISSION
WASHINGTON, D.C. 20549
FORM 10-K
(X) ANNUAL REPORT PURSUANT TO SECTION 13 OR 15(d)
OF THE SECURITIES EXCHANGE ACT OF 1934
For the fiscal year ended December 31, 2019
OR ( ) TRANSITION REPORT PURSUANT TO SECTION 13 OR 15(d)
OF THE SECURITIES EXCHANGE ACT OF 1934
For the Transition period from to
Commission File Number 000-52602
CERES TACTICAL COMMODITY L.P.
(Exact name of registrant as specified in its charter)
| New York | 20-2718952 | |
| (State or other jurisdiction of | (I.R.S. Employer | |
| incorporation or organization) | Identification No.) |
c/o Ceres Managed Futures LLC
522 Fifth Avenue
New York, New York 10036
(Address and Zip Code of principal executive offices)
(855) 672-4468
(Registrant’s telephone number, including area code)
Securities registered pursuant to Section 12(b) of the Act:
| Title of each class | Trading symbol(s) | Name of each exchange on which registered | ||
| N/A | N/A | N/A |
Securities registered pursuant to Section 12(g) of the Act: Redeemable Units of Limited Partnership Interest
(Title of Class)
Indicate by check mark if the registrant is a well-known seasoned issuer, as defined in Rule 405 of the Securities Act.
Yes _ No X
Indicate by check mark if the registrant is not required to file reports pursuant to Section 13 or Section 15(d) of the Act.
Yes _ No X
Indicate by check mark whether the registrant: (1) has filed all reports required to be filed by Section 13 or 15(d) of the Securities Exchange Act of 1934 during the preceding 12 months (or for such shorter period that the registrant was required to file such reports), and (2) has been subject to such filing requirements for the past 90 days.
Yes X No _
Indicate by check mark whether the registrant has submitted electronically every Interactive Data File required to be submitted pursuant to Rule 405 of Regulation S-T (§232.405 of this chapter) during the preceding 12 months (or for such shorter period that the registrant was required to submit such files).
Yes X No _
Indicate by check mark whether the registrant is a large accelerated filer, an accelerated filer, a non-accelerated filer, a smaller reporting company or an emerging growth company. See the definitions of “large accelerated filer,” “accelerated filer,” “smaller reporting company” and “emerging growth company” in Rule 12b-2 of the Exchange Act.
| Large accelerated filer _ |
Accelerated filer _ |
Non-accelerated filer X | ||
| Smaller reporting company _ |
Emerging growth company _ |
If an emerging growth company, indicate by check mark if the registrant has elected not to use the extended transition period for complying with any new or revised financial accounting standards provided pursuant to Section 13(a) of the Exchange Act. __
Indicate by check mark whether the registrant is a shell company (as defined in Rule 12b-2 of the Exchange Act).
Yes _ No X
Limited Partnership Class A Redeemable Units, Limited Partnership Class D Redeemable Units and Limited Partnership Class Z Redeemable Units with aggregate values of $101,227,212, $622,287 and $103,580, respectively, were outstanding and held by non-affiliates as of the last business day of the registrant’s most recently completed second fiscal quarter.
As of February 29, 2020, 64,524.6137 Limited Partnership Class A Redeemable Units were outstanding, 600.0580 Limited Partnership Class D Redeemable Units were outstanding and 21.8090 Limited Partnership Class Z Redeemable Units were outstanding.
DOCUMENTS INCORPORATED BY REFERENCE
[None]
PART I
Item 1. Business.
(a) General Development of Business. Ceres Tactical Commodity L.P. (formerly, Managed Futures Premier Aventis II L.P.) (the “Partnership”) is a limited partnership organized on April 20, 2005 under the partnership laws of the State of New York to engage, directly or indirectly, in the speculative trading of commodity interests on U.S. and international futures, options on futures and forward markets. The Partnership may also engage, directly or indirectly, in swap transactions and other derivative transactions with the approval of the General Partner (as defined below). Initially, the Partnership’s investment strategy focused on energy and energy-related investments. While the Partnership is expected to continue to have significant exposure to energy and energy-related markets, such trading will no longer be the Partnership’s primary focus. Therefore, the Partnership’s past trading performance will not necessarily be indicative of future results. The commodity interests that are traded by the Partnership, directly or indirectly through its investment in the Funds (as defined below) are volatile and involve a high degree of market risk. The General Partner may also determine to invest up to all of the Partnership’s assets (directly or indirectly through its investment in the Funds) in United States (“U.S.”) Treasury bills and/or money market mutual funds, including money market mutual funds managed by Morgan Stanley or its affiliates. During the initial offering period, the Partnership sold 11,925 redeemable units of limited partnership interest (“Redeemable Units”). The Partnership commenced trading on September 6, 2005. The Partnership privately and continuously offers Redeemable Units to qualified investors. There is no maximum number of Redeemable Units that may be sold by the Partnership.
Subscriptions and redemptions of Redeemable Units and General Partner contributions and redemptions for the years ended December 31, 2019, 2018 and 2017 are reported in the Statements of Changes in Partners’ Capital under “Item 8. Financial Statements and Supplementary Data.”
Ceres Managed Futures LLC, a Delaware limited liability company, acts as the general partner (the “General Partner”) and commodity pool operator of the Partnership and is the trading manager (the “Trading Manager”) of NL Master (as defined below) and Aquantum Master (as defined below). The General Partner was also the Trading Manager of Harbour Square Master (as defined below) prior to its termination. As of January 1, 2017, the General Partner is a wholly-owned subsidiary of Morgan Stanley Domestic Holdings, Inc. (“MSD Holdings”). MSD Holdings is ultimately owned by Morgan Stanley. Morgan Stanley is a publicly held company whose shares are listed on the New York Stock Exchange. Morgan Stanley is engaged in various financial services and other businesses. Prior to January 1, 2017, the General Partner was a wholly-owned subsidiary of Morgan Stanley Smith Barney Holdings LLC.
On February 1, 2013, the Partnership allocated substantially all of its capital to MB Master Fund L.P. (“MB Master”), a limited partnership organized under the partnership laws of the State of Delaware. Effective November 30, 2018, the Partnership fully redeemed its investment in MB Master. On January 1, 2018, the Partnership allocated a portion of its assets to CMF Harbour Square Master Fund LLC (“Harbour Square Master”), a limited liability company organized under the limited liability company laws of the State of Delaware. Effective March 31, 2019, the Partnership fully redeemed its investment in Harbour Square Master. Effective June 1, 2019, the assets allocated to Aquantum (defined below) were transferred into CMF Aquantum Master Fund LLC (“Aquantum Master”), a limited liability company organized under the limited liability company laws of the State of Delaware. On April 1, 2019, the Partnership allocated a portion of its assets to CMF NL Master Fund LLC (“NL Master”), a limited liability company organized under the limited liability company laws of the State of Delaware. NL Master and Aquantum Master are collectively referred to as the “Funds.” Reference herein to the “Funds” may also include, as relevant, MB Master and Harbour Square Master.
During the years ended December 31, 2019, 2018 and 2017, the Partnership’s/Funds’ commodity broker was Morgan Stanley & Co. LLC (“MS&Co.”), a registered futures commission merchant. During prior periods included in this report, the Partnership/Funds deposited a portion of their cash in non-trading bank accounts at JPMorgan Chase Bank, N.A.
3
As of December 31, 2019, all trading decisions are made for the Partnership by Millburn Ridgefield Corporation (“Millburn”), Ospraie Management, LLC (“Ospraie”), Aquantum GmbH (“Aquantum”), Pan Capital Management L.P. (“Pan”), and Northlander Commodity Advisors LLP (“Northlander”) (each an “Advisor” and, collectively, the “Advisors”), each, a registered commodity trading advisor. On November 30, 2018, Aventis Asset Management, LLC (“Aventis”) ceased to act as a commodity trading advisor for the Partnership. On March 31, 2019, Harbour Square Capital Management LLC (“Harbour Square”) ceased to act as a commodity trading advisor to the Partnership. References herein to the “Advisors” may also include, as relevant, Harbour Square and Aventis. From February 1, 2013 until December 31, 2017, all trading decisions were made by Aventis. A description of the trading activities and focus of each Advisor is included under “Item 7. Management’s Discussion and Analysis of Financial Condition and Results of Operations.” Each Advisor is allocated a portion of the Partnership’s assets to manage. The Partnership invests the portion of its assets allocated to each of the Advisors either directly, through individually managed accounts, or indirectly through investment in the Funds. The Advisors are not affiliated with one another, are not affiliated with the General Partner or MS&Co., and are not responsible for the organization or operation of the Partnership.
As of June 13, 2018, the Partnership began offering three classes of limited partnership interests, Class A Redeemable Units, Class D Redeemable Units and Class Z Redeemable Units. All Redeemable Units issued prior to October 31, 2016 were deemed “Class A Redeemable Units.” Class Z Redeemable Units were first issued on January 1, 2017. The rights, liabilities, risks and fees associated with investment in the Class A Redeemable Units were not changed. Class D Redeemable Units were first issued July 1, 2018. The rights, liabilities, risks, and fees associated with investment in the Class A Redeemable Units and Class Z Redeemable Units were not changed. Class A Redeemable Units, Class D Redeemable Units and Class Z Redeemable Units will each be referred to as a “Class” and collectively referred to as the “Classes.” Class A Redeemable Units and Class D Redeemable Units are available to taxable U.S. individuals and institutions, U.S. tax exempt individuals and institutions and non-U.S. investors. Class Z Redeemable Units are offered to limited partners who receive advisory services from Morgan Stanley Smith Barney LLC (doing business as Morgan Stanley Wealth Management) (“Morgan Stanley Wealth Management”) and may also be offered to certain employees of Morgan Stanley and/or its subsidiaries (and their family members). Class A Redeemable Units, Class D Redeemable Units and Class Z Redeemable Units are identical, except that Class A Redeemable Units are subject to a monthly ongoing selling agent fee equal to 1/12 of 2.00% (a 2.00% annual rate) of the net assets of Class A as of the end of each month, which differs from the Class D Redeemable Units monthly ongoing selling agent fee of 1/12 of 0.75% (a 0.75% annual rate) of the net assets of Class D as of the end of each month. Class Z Redeemable Units are not subject to a monthly ongoing selling agent fee.
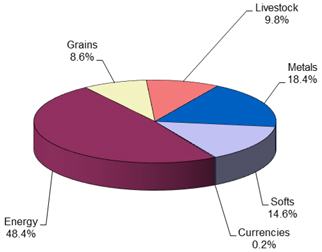
For the period January 1, 2019 through December 31, 2019, the approximate average market sector distribution for the Partnership was as follows:
4
At December 31, 2019, the Partnership owned approximately 20.4% of NL Master and 43.1% of Aquantum Master. At December 31, 2018, the Partnership owned approximately 68.7% of Harbour Square Master. The performance of the Partnership is directly affected by the performance of the Funds.
The Partnership’s/Funds’ trading of futures, forward, swap and option contracts, if applicable, on commodities is done primarily on U.S. commodity exchanges and foreign commodity exchanges. The Partnership/Funds engaged in such trading through commodity brokerage accounts maintained with MS&Co.
The General Partner and each limited partner of the Partnership share in the profits and losses of the Partnership in proportion to the amount of Partnership interest owned by each, except that no limited partner is liable for obligations of the Partnership in excess of its capital contribution and profits, if any, net of distributions or redemptions and losses, if any.
The Partnership will be liquidated upon the first of the following to occur: December 31, 2055; the net asset value per Redeemable Unit decreases to less than $400 as of a close of any business day; or under certain circumstances as set forth in the limited partnership agreement of the Partnership, as amended and restated from time to time (the “Limited Partnership Agreement.”) In addition, the General Partner may, in its sole discretion, cause the Partnership to dissolve if the Partnership’s aggregate net assets decline to less than $1,000,000.
The General Partner administers the business and affairs of the Partnership, including selecting one or more advisors to make trading decisions for the Partnership. As of December 31, 2019, the Partnership paid the General Partner a monthly General Partner fee in return for its services to the Partnership equal to 1/12 of 0.75% (0.75% per year) of month-end Net Assets per Class, for each outstanding Class of the Partnership. Prior to January 1, 2019, the Partnership paid the General Partner a monthly General Partner fee in return for its services to the Partnership equal to 1/12 of 1% (1% per year) of month-end Net Assets per Class, for each outstanding Class of the Partnership. Month-end Net Assets per Class, for the purpose of calculating the General Partner fee are Net Assets, as defined in the Limited Partnership Agreement, prior to the reduction of the current month’s management fee, incentive fee accrual, the General Partner fee and any redemptions or distributions as of the end of such month. This fee may be increased or decreased at the discretion of the General Partner.
The General Partner, on behalf of the Partnership, entered into management agreements (each, a “Management Agreement”) with the Advisors. The Advisors are not affiliated with one another, are not affiliated with the General Partner or MS&Co. and are not responsible for the organization or operation of the Partnership. The Partnership pays Millburn a monthly management fee equal to 1/12 of 2.0% (2.0% per year) of month-end Net Assets per Class, for each outstanding Class, allocated to Millburn. The Partnership pays Ospraie a monthly management fee equal to 1/12 of 1.5% (1.5% per year) of month-end Net Assets per Class, for each outstanding Class, allocated to Ospraie. The Partnership pays Aquantum a monthly management fee equal to 1/12 of 1.25% (1.25% per year) of month-end Net Assets per Class, for each outstanding Class, allocated to Aquantum. The Partnership pays Pan a monthly management fee equal to 1/12 of 1.25% (1.25% per year) of month-end Net Assets per Class, for each outstanding Class, allocated to Pan. The Partnership pays Northlander a monthly management fee equal to 1/12 of 1.25% (1.25% per year) of month-end Net Assets per Class, for each outstanding Class, allocated to Northlander. Prior to its termination on November 30, 2018, Aventis was paid a monthly management fee equal to 1/12 of 1.25% (1.25% per year) of month-end Net Assets per Class, for each outstanding Class, allocated to Aventis. Prior to its termination on March 31, 2019, Harbour Square was paid a monthly management fee equal to 1/12 of 1.15% (1.15% per year) of month-end Net Assets per Class, for each outstanding Class, allocated to Harbour Square. Month-end Net Assets, for the purpose of calculating management fees are Net Assets per Class, for each outstanding Class, as defined in the Limited Partnership Agreement, prior to the reduction of the current month’s management fee, incentive fee accrual, the General Partner fee and any redemptions or distributions as of the end of such month.
5
In addition, the Partnership is obligated to pay each Advisor an incentive fee. The Partnership pays Millburn, Ospraie and Northlander each an incentive fee, payable annually, equal to 20% of New Trading Profits, as defined in each Management Agreement, earned by the relevant Advisor for the Partnership during each calendar year. The Partnership pays Aquantum a semi-annual incentive fee of 20% of New Trading Profits, as defined in the Management Agreement, earned by Aquantum for the Partnership each calendar half-year. The Partnership pays Pan a quarterly incentive fee of 20% of New Trading Profits, as defined in the Management Agreement, earned by Pan for the Partnership each quarter. Prior to its termination on November 30, 2018, Aventis was eligible to receive an incentive fee, payable quarterly, equal to 20% of New Trading Profits, as defined in the Management Agreement. Prior to its termination on March 31, 2019, Harbour Square was eligible to receive an incentive fee, payable quarterly, equal to 20% of New Trading Profits, as defined in the Management Agreement. An Advisor’s incentive fee is allocated proportionally to each Class based on the net asset value of the respective Class. To the extent an Advisor incurs a loss for the Partnership, the Advisor will not be paid an incentive fee until the Advisor recovers the net loss incurred and earns additional new trading profits for the Partnership. Each Management Agreement can be terminated upon notice by either party. In allocating substantially all of the assets of the Partnership among the Advisors, the General Partner considers, among other factors, the Advisors’ past performance, trading style, volatility of markets traded and fee requirements. The General Partner may modify or terminate the allocation of assets among the Advisors and may allocate assets to additional advisors at any time.
The Partnership has entered into a customer agreement with MS&Co. (the “Customer Agreement”). Under the Customer Agreement, the Partnership pays trading fees for the clearing and, where applicable, the execution of transactions, as well as exchange, user, give-up, floor brokerage and National Futures Association fees (collectively, the “clearing fees”) directly and indirectly through its investment in the Funds. Clearing fees are allocated to the Partnership based on its proportionate share of each Fund. Clearing fees are also borne directly by the Partnership for its direct trading. Clearing fees will be paid for the life of the Partnership, although the rate at which such fees are paid may be changed. All of the Partnership’s assets available for trading in commodity interests not held in the Funds’ accounts at MS&Co. are deposited in the Partnership’s accounts at MS&Co. The Partnership’s cash deposited by MS&Co. is held in segregated bank accounts to the extent required by Commodity Futures Trading Commission (“CFTC”) regulations. MS&Co. has agreed to pay the Partnership interest on 100% of the average daily equity maintained in cash in the Partnership’s (or the Partnership’s allocable portion of the Funds’) brokerage account at the rate equal to the monthly average of the 4-week U.S. Treasury bill discount rate. Prior to November 1, 2016, MS&Co. paid the Partnership interest on 80% of the average daily equity maintained in cash in the Partnership’s (or the Partnership’s allocable portion of MB Master’s) brokerage account at the rate equal to the monthly average of the 4-week U.S. Treasury bill discount rate. The Customer Agreement may generally be terminated upon notice by either party.
The Partnership has also entered into a selling agreement (the “Selling Agreement”) with Morgan Stanley Wealth Management. Pursuant to the Selling Agreement, the Partnership pays Morgan Stanley Wealth Management a monthly ongoing selling agent fee equal to (i) 2.0% per year of month-end Net Assets of Class A Redeemable Units and (ii) 0.75% per year of month-end Net Assets of Class D Redeemable Units. Morgan Stanley Wealth Management pays a portion of its ongoing selling agent fees to properly registered or exempted financial advisors who have sold Class A and Class D Redeemable Units in the Partnership. Month-end net assets, for the purpose of calculating ongoing selling agent fees are net assets, as defined in the Limited Partnership Agreement, prior to the reduction of the current month’s ongoing selling agent fee, management fee, incentive fee accrual, the General Partner fee and other expenses and any redemptions or distributions as of the end of such month. Class Z Redeemable Units are not subject to a monthly ongoing selling agent fee.
Generally, a limited partner/member in the Funds withdraws all or part of its capital contribution and undistributed profits, if any, from the Funds as of the end of any month (the “Redemption Date”) after a request has been made to the General Partner/Trading Manager at least three days in advance of the Redemption Date. Such withdrawals are classified as a liability when the limited partner/member elects to redeem and informs the Funds. However, a limited partner/member may request a withdrawal as of the end of any day if such request is received by the General Partner/Trading Manager at least three days in advance of the proposed withdrawal day.
The General Partner has delegated certain administrative functions to SS&C Technologies, Inc., a Delaware corporation, currently doing business as SS&C GlobeOp (the “Administrator”). Pursuant to a master services agreement, the Administrator furnishes certain administrative, accounting, regulatory reporting, tax and other services as agreed from time to time. In addition, the Administrator maintains certain books and records of the Partnership. The cost of retaining the Administrator is allocated among the pools operated by the General Partner, including the Partnership.
(b) Financial Information about Segments. The Partnership’s business consists of only one segment, speculative trading of commodity interests. The Partnership does not engage in sales of goods or services. The Partnership’s net income (loss) from operations for the years ended December 31, 2019, 2018, 2017, 2016 and 2015 is set forth under “Item 6. Selected Financial Data.” The Partnership’s capital as of December 31, 2019 was $91,893,284.
6
(c) Narrative Description of Business. See Paragraphs (a) and (b) above.
(i) through (xii) — Not applicable.
(xiii) — The Partnership has no employees.
(d) Financial Information About Geographic Areas. The Partnership does not engage in the sale of goods or services or own any long-lived assets, and therefore this item is not applicable.
(e) Available Information. The Partnership does not have an Internet address. The Partnership will provide paper copies of its Annual Report on Form 10-K, Quarterly Reports on Form 10-Q, Current Reports on Form 8-K and any amendments to these reports free of charge upon request.
(f) Reports to Security Holders. Not applicable.
(g) Enforceability of Civil Liabilities Against Foreign Persons. Not applicable.
(h) Smaller Reporting Companies. Not applicable.
7
Item 1A. Risk Factors.
As a result of leverage, small changes in the price of the Partnership’s positions may result in major losses.
The trading of commodity interests is speculative, volatile and involves a high degree of leverage. A small change in the market price of a commodity interest contract can produce major losses for the Partnership. Market prices can be influenced by, among other things, changing supply and demand relationships, governmental, agricultural, commercial and trade programs and policies, national and international political and economic events, weather and climate conditions, insects and plant disease, purchases and sales by foreign countries and changing interest rates.
An investor may lose all of their investment.
Due to the speculative nature of trading commodity interests, an investor could lose all of their investment in the Partnership.
The Partnership will pay substantial fees and expenses regardless of profitability.
Regardless of its trading performance, the Partnership will incur fees and expenses, including but not limited to trading and transaction fees, ongoing selling agent fees, General Partner fees and management fees. Substantial incentive fees may be paid to one or more of the Advisors even if the Partnership experiences a net loss for the full year.
An investor’s ability to redeem Redeemable Units is limited.
An investor’s ability to redeem Redeemable Units is limited and no market exists for the Redeemable Units.
Conflicts of interest exist.
The Partnership is subject to numerous conflicts of interest including those that arise from the fact that:
| 1. | The General Partner and the Partnership’s/Funds’ commodity broker are affiliates; |
| 2. | The Advisors, the Partnership’s/Funds’ commodity broker, the General Partner and their respective principals and affiliates may trade in commodity interests for their own accounts; |
| 3. | An investor’s financial advisor will receive ongoing compensation for providing services to the investor’s account; and |
| 4. | The General Partner, on behalf of the Partnership, may purchase shares from money market mutual funds affiliated and/or unaffiliated with the General Partner. |
Investing in Redeemable Units may not provide the desired diversification of an investor’s overall portfolio.
One of the Partnership’s objectives is to add an element of diversification to a traditional stock and bond portfolio, but any benefit of portfolio diversification is dependent upon the Partnership/Funds achieving positive returns and such returns being independent of stock and bond market returns.
Past performance is no assurance of future results.
The Advisors’ trading strategies may not perform as they have performed in the past, and past performance does not necessarily predict future returns. The Advisors have from time to time incurred substantial losses in trading on behalf of clients.
An investor’s tax liability may exceed cash distributions.
Investors are taxed on their share of the Partnership’s income, even though the Partnership does not intend to make any distributions.
8
The General Partner may allocate the Partnership’s assets to undisclosed advisors.
The General Partner at any time may select and allocate the Partnership’s assets to undisclosed advisors. Investors may not be advised of such changes in advance, or at all. Investors must rely on the ability of the General Partner to select commodity trading advisors and allocate assets among them.
Regulatory changes could restrict the Partnership’s operations and increase its operational costs.
Regulatory changes could adversely affect the Partnership by restricting its markets or activities, limiting its trading and/or increasing the costs or taxes to which investors are subject. Pursuant to the mandate of the Dodd-Frank Wall Street Reform and Consumer Protection Act, signed into law on July 21, 2010, the CFTC and the Securities and Exchange Commission (the “SEC”) have promulgated rules to regulate trading in swaps and swap dealers and to mandate additional reporting and disclosure requirements and continue to promulgate rules regarding capital and margin requirements, to require that certain swaps be traded on an exchange or a swap execution facility, and to require that derivatives (such as those traded by the Partnership) be moved into central clearinghouses. The CFTC and the prudential regulators that oversee swap dealers have adopted rules regarding margin requirements for certain derivatives. In addition, the CFTC and such prudential regulators have proposed or adopted, respectively, rules regarding capital requirements for swap dealers. These rules may negatively impact the manner in which swap contracts are traded and/or settled, increase the cost of such trades, and limit trading by speculators (such as the Partnership) in futures and over-the-counter (“OTC”) markets.
Speculative position and trading limits may reduce profitability.
The CFTC and U.S. exchanges have established “speculative position limits” on the maximum net long or net short positions which any person or a group of persons may hold or control in particular futures and options on futures. Most commodity exchanges also limit the amount of fluctuation in commodity futures contract prices on a single trading day. The Advisors believe that established speculative position and trading limits will not materially adversely affect trading for the Partnership. The trading instructions of an Advisor, however, may have to be modified, and positions held by the Partnership directly and indirectly through its investment in the Funds may have to be liquidated, in order to avoid exceeding these limits. Such modification or liquidation could adversely affect the operations and profitability of the Partnership/Funds by increasing transaction costs to liquidate positions and limiting potential profits on liquidated positions.
In January 2020, the CFTC re-proposed new rules regarding speculative position limits. These rules, if adopted in substantially the same form, will impose position limits on certain futures and option contracts and physical commodity swaps that are “economically equivalent” to such contracts. If enacted, these rules could have an adverse effect on an Advisor’s trading for the Partnership.
The General Partner, the Partnership and its service providers (including the Advisors) and their respective operations are potentially vulnerable to cyber-security attacks or incidents.
Like other business enterprises, the use of the internet and other electronic media and technology exposes the General Partner, the Partnership and its service providers, and their respective operations, to potential risks from cyber-security attacks or incidents (collectively, “cyber events”). Cyber events may include, for example, unauthorized access to systems, networks or devices, infection from computer viruses or other malicious software code, mishandling or misuse of information and attacks which shut down, disable, slow or otherwise disrupt operations, business processes or website access or functionality. In addition to intentional cyber events, unintentional cyber events can occur. Unintentional cyber events may include, for example, the inadvertent release of confidential information, the mishandling or misuse of information and/or technological limitations or hardware failures (in the markets or otherwise) that constrain the Partnership’s and/or the Funds’ ability to gather, process and communicate information efficiently and securely, without interruption.
Any cyber event could adversely affect the Partnership’s business, financial condition or results of operations and cause the Partnership to incur financial loss and expense, as well as face exposure to regulatory penalties or legal claims, reputational damage and additional costs associated with corrective measures. A cyber-security breach could also jeopardize a limited partner’s personal, confidential, proprietary or other information processed and stored in, and transmitted through, the General Partner’s or a service provider’s computer systems. A cyber event may cause the Partnership or its service providers to lose proprietary information, suffer data corruption, lose operational capacity (such as, for example, the loss of the ability to process transactions, calculate the Partnership’s net asset value, or allow investors to transact business) and/or fail to comply with applicable privacy and other laws. Among other potentially harmful effects, cyber events also may result in theft, unauthorized monitoring and failures in the physical infrastructure or operating systems that support the Partnership or its service providers.
9
The nature of malicious cyber-attacks is becoming increasingly sophisticated and neither the General Partner nor the Partnership can control the cyber systems and cyber-security systems of the Advisors or other third-party service providers.
Tax Laws Are Subject To Change at Any Time.
Tax laws and court and Internal Revenue Service (“IRS”) interpretations thereof are subject to change at any time, possibly with retroactive effect.
On December 22, 2017, the Tax Cuts and Jobs Act was signed into law and is generally effective after December 31, 2017. The Tax Cuts and Jobs Act makes significant changes to the U.S. federal income tax rules for taxation of individuals and corporations, including, in the case of individuals, reducing the top federal income rate to 37%, and eliminating or limiting various deductions, including capping the deduction for state and local taxes at $10,000 per year. Most of the changes applicable to individuals are temporary and apply only to taxable years beginning after December 31, 2017 and before January 1, 2026. For corporations, the Tax Cuts and Jobs Act reduces the top corporate income tax rate to 21%.
The Partnership does not anticipate that a limited partner’s share of income from the Partnership will be eligible for the 20% deduction established by the Tax Cuts and Jobs Act for qualified business income. However, in certain limited circumstances unlikely to apply to the Partnership, a portion of a limited partner’s gain upon a taxable disposition of an interest in the Partnership or a complete withdrawal may be eligible for the deduction.
The Tax Cuts and Jobs Act makes numerous other large and small changes to the federal income tax rules that may affect the Partnership’s investors and may directly or indirectly affect the Partnership. Moreover, Congressional leaders have recognized that the process of adopting extensive tax legislation in a short amount of time without hearings and substantial time for review is likely to have led to drafting errors, issues needing clarification, and unintended consequences that will have to be reviewed in subsequent tax legislation. At this point, it is not clear when Congress will address these issues or when the IRS will issue administrative guidance on the changes made in the Tax Cuts and Jobs Act.
Prospective investors are urged to consult with their tax advisors with respect to the Tax Cuts and Jobs Act and any other regulatory or administrative developments and proposals, and their potential effects on them based on their unique circumstances.
The continuing spread of a new strain of coronavirus, which causes the viral disease known as COVID-19, may adversely affect our investments and operations.
Since its discovery in December 2019, a new strain of coronavirus, which causes the viral disease known as COVID-19, has spread from China to many other countries, including the United States. The outbreak has been declared a pandemic by the World Health Organization, and the U.S. Health and Human Services Secretary has declared a public health emergency in the United States in response to the outbreak.
The outbreak of the novel coronavirus in many countries is having and will likely continue to have an adverse impact on global commercial activity, which has contributed to significant volatility in financial markets. The global impact of the outbreak has been rapidly evolving, and as cases of the virus have been identified in additional countries, many countries have reacted by instituting quarantines and restrictions on travel. These actions are creating disruption in supply chains, and adversely impacting a number of industries, including but not limited to transportation, hospitality, and entertainment.
The impact of COVID-19 on the U.S. and world economies, and the extent of and effectiveness of any responses taken on a national and local level, is uncertain and could result in a world-wide economic downturn and disrupt financial markets that impact trading programs in unanticipated and unintended ways.
The rapid development of this situation precludes any prediction as to the ultimate adverse impact of the novel coronavirus. Nevertheless, the novel coronavirus presents material uncertainty and risk with respect to the Partnership’s investments and operations.
Item 2. Properties.
The Partnership does not own or lease any properties. The General Partner operates out of facilities provided by Morgan Stanley and/or one of its subsidiaries.
10
Item 3. Legal Proceedings.
This section describes the major pending legal proceedings, other than ordinary routine litigation incidental to the business, to which MS&Co. or its subsidiaries is a party or to which any of their property is subject. There are no material legal proceedings pending against the Partnership or the General Partner.
On June 1, 2011, Morgan Stanley & Co. Incorporated converted from a Delaware corporation to a Delaware limited liability company. As a result of that conversion, Morgan Stanley & Co. Incorporated is now named Morgan Stanley & Co. LLC (“MS&Co.”).
MS&Co. is a wholly-owned, indirect subsidiary of Morgan Stanley, a Delaware holding company. Morgan Stanley files periodic reports with the SEC as required by the Securities Exchange Act of 1934, as amended (the “Exchange Act”) which include current descriptions of material litigation and material proceedings and investigations, if any, by governmental and/or regulatory agencies or self-regulatory organizations concerning Morgan Stanley and its subsidiaries, including MS&Co. As a consolidated subsidiary of Morgan Stanley, MS&Co. does not file its own periodic reports with the SEC that contain descriptions of material litigation, proceedings and investigations. As a result, we refer you to the “Legal Proceedings” section of Morgan Stanley’s SEC 10-K filings for 2018, 2017, 2016, 2015 and 2014. In addition, MS&Co. annually prepares an Audited, Consolidated Statement of Financial Condition (“Audited Financial Statement”) that is publicly available on Morgan Stanley’s website at www.morganstanley.com. We refer you to the Commitments, Guarantees and Contingencies – Legal section of MS&Co.’s 2018 Audited Financial Statement.
In addition to the matters described in those filings, in the normal course of business, each of Morgan Stanley and MS&Co. has been named, from time to time, as a defendant in various legal actions, including arbitrations, class actions, and other litigation, arising in connection with its activities as a global diversified financial services institution. Certain of the legal actions include claims for substantial compensatory and/or punitive damages or claims for indeterminate amounts of damages. Each of Morgan Stanley and MS&Co. is also involved, from time to time, in investigations and proceedings by governmental and/or regulatory agencies or self-regulatory organizations, certain of which may result in adverse judgments, fines or penalties. The number of these investigations and proceedings has increased in recent years with regard to many financial services institutions, including Morgan Stanley and MS&Co.
MS&Co. is a Delaware limited liability company with its main business office located at 1585 Broadway, New York, New York 10036. Among other registrations and memberships, MS&Co. is registered as a futures commission merchant and is a member of the National Futures Association.
During the preceding five years, the following administrative, civil, or criminal actions pending, on appeal or concluded against MS&Co. or any of its principals are material within the meaning of CFTC Rule 4.24(l)(2) or 4.34(k)(2):
Regulatory and Governmental Matters.
On February 25, 2015, MS&Co. reached an agreement in principle with the United States Department of Justice, Civil Division and the United States Attorney’s Office for the Northern District of California, Civil Division (collectively, the “Civil Division”) to pay $2.6 billion to resolve certain claims that the Civil Division indicated it intended to bring against MS&Co. That settlement was finalized on February 10, 2016.
11
In October 2014, the Illinois Attorney General’s Office (“ILAG”) sent a letter to MS&Co. alleging that MS&Co. knowingly made misrepresentations related to RMBS purchased by certain pension funds affiliated with the State of Illinois and demanding that MS&Co. pay ILAG approximately $88 million. The Company and ILAG reached an agreement to resolve the matter on February 10, 2016.
On January 13, 2015, the New York Attorney General’s Office (“NYAG”), which is also a member of the RMBS Working Group, indicated that it intended to file a lawsuit related to approximately 30 subprime securitizations sponsored by MS&Co. NYAG indicated that the lawsuit would allege that MS&Co. misrepresented or omitted material information related to the due diligence, underwriting and valuation of the loans in the securitizations and the properties securing them and indicated that its lawsuit would be brought under the Martin Act. MS&Co. and NYAG reached an agreement to resolve the matter on February 10, 2016.
On July 23, 2014, the U.S. Securities and Exchange Commission (“SEC”) approved a settlement by MS&Co. and certain affiliates to resolve an investigation related to certain subprime RMBS transactions sponsored and underwritten by those entities in 2007. Pursuant to the settlement, the Company and certain affiliates were charged with violating Sections 17(a)(2) and 17(a)(3) of the Securities Act, agreed to pay disgorgement and penalties in an amount of $275 million and neither admitted nor denied the SEC’s findings.
On April 21, 2015, the Chicago Board Options Exchange, Incorporated (CBOE) and the CBOE Futures Exchange, LLC (CFE) filed statements of charges against MS&Co. in connection with trading by one of MS&Co.’s former traders of EEM options contracts that allegedly disrupted the final settlement price of the November 2012 VXEM futures. CBOE alleged that MS&Co. violated CBOE Rules 4.1, 4.2 and 4.7, Sections 9(a) and 10(b) of the Exchange Act and Rule 10b-5 thereunder. CFE alleged that MS&Co. violated CFE Rules 608, 609 and 620. The matters were resolved on July 12, 2016 and June 28, 2016, respectively, without any findings of fraud. Pursuant to the settlements, MS&Co. was required to pay a $750,000 penalty to the CBOE (for which MS&Co. and an individual were jointly and severally liable) and a $400,000 penalty to the CFE (for which MS&Co. and an individual were jointly and severally liable) and $152,664 in disgorgement.
On June 18, 2015, MS&Co. entered into a settlement with the SEC and paid a fine of $500,000 as part of the Municipalities Continuing Disclosure Corporation Initiative to resolve allegations that MS&Co. failed to form a reasonable basis through adequate due diligence for believing the truthfulness of the assertions by issuers and/or obligors regarding their compliance with previous continuing disclosure undertakings pursuant to Rule 15c2-12 under the Exchange Act in connection with offerings in which MS&Co. acted as senior or sole underwriter.
On August 6, 2015, MS&Co. consented to and became the subject of an order by the CFTC to resolve allegations that MS&Co. violated CFTC Regulation 22.9(a) by failing to hold sufficient US Dollars in cleared swap segregated accounts in the United States to meet all US Dollar obligations to cleared swaps customers. Specifically, the CFTC found that while MS&Co. at all times held sufficient funds in segregation to cover its obligations to its customers, on certain days during 2013 and 2014, it held currencies, such as euros, instead of US dollars, to meet its US dollar obligations. In addition, the CFTC found that MS&Co. violated CFTC Regulation 166.3 by failing to have in place adequate procedures to ensure that it complied with CFTC Regulation 22.9(a). Without admitting or denying the findings or conclusions and without adjudication of any issue of law or fact, MS&Co. accepted and consented to the entry of findings, the imposition
12
of a cease and desist order, a civil monetary penalty of $300,000, and undertakings related to public statements, cooperation, and payment of the monetary penalty.
On December 20, 2016, MS&co. consented to and became the subject of an order by the SEC in connection with allegations that MS&Co. willfully violated Sections 15(c)(3) and 17(a)(1) of the Exchange Act and Rules 15c3-3(e), 17a-5(a), and 17a-5(d) thereunder, by inaccurately calculating its Reserve Account requirement under Rule 15c3-3 by including margin loans to an affiliate in its calculations, which resulted in making inaccurate records and submitting inaccurate reports to the SEC. Without admitting or denying the underlying allegations and without adjudication of any issue of law or fact, MS&Co. consented to a cease and desist order, a censure, and a civil monetary penalty of $7,500,000.
On September 28, 2017, the CFTC issued an order filing and simultaneously settling charges against MS&Co. regarding violations of CFTC Rule 166.3 by failing to diligently supervise the reconciliation of exchange and clearing fees with the amounts it ultimately charged customers for certain transactions on multiple exchanges. The order and settlement required MS&Co. to pay a $500,000 penalty and cease and desist from violating CFTC Rule 166.3.
On November 2, 2017, the CFTC issued an order filing and simultaneously settling charges against MS&Co. for non-compliance with applicable rules governing Part 17 Large Trader reports to the CFTC. The order requires MS&Co. to pay a $350,000 penalty and cease and desist from further violations of the Commodity Exchange Act.
Civil Litigation
On July 15, 2010, China Development Industrial Bank (“CDIB”) filed a complaint against MS&Co., styled China Development Industrial Bank v. Morgan Stanley & Co. Incorporated et al., which is pending in the Supreme Court of the State of New York, New York County (“Supreme Court of NY”). The complaint relates to a $275 million credit default swap referencing the super senior portion of the STACK 2006-1 CDO. The complaint asserts claims for common law fraud, fraudulent inducement and fraudulent concealment and alleges that MS&Co. misrepresented the risks of the STACK 2006-1 CDO to CDIB, and that MS&Co. knew that the assets backing the CDO were of poor quality when it entered into the credit default swap with CDIB. The complaint seeks compensatory damages related to the approximately $228 million that CDIB alleges it has already lost under the credit default swap, rescission of CDIB’s obligation to pay an additional $12 million, punitive damages, equitable relief, fees and costs. On February 28, 2011, the court denied MS&Co.’s motion to dismiss the complaint. On June 27, 2018, MS&Co. filed a motion for summary judgment and spoliation sanctions against CDIB. On December 21, 2018, the court denied MS&Co.’s motion for summary judgment and granted in part MS&Co.’s motion for sanctions relating to spoliation of evidence. On January 18, 2019, CDIB filed a motion to clarify and resettle the portion of the court’s December 21, 2018 order granting spoliation sanctions. On January 24, 2019, CDIB filed a notice of appeal from the court’s December 21, 2018 order, and on January 25, 2019, MS&Co. filed a notice of appeal from the same order. On March 7, 2019, the court denied the relief that CDIB sought in a motion to clarify and resettle the portion of the court’s December 21, 2018 order granting spoliation sanctions. On December 5, 2019, the Appellate Division, First Department (“First Department”) heard the parties’ cross-appeals. Based on currently available information, MS&Co. believes it could incur a loss in this action of up to approximately $240 million plus pre- and post-judgment interest, fees and costs.
13
On October 15, 2010, the Federal Home Loan Bank of Chicago filed a complaint against MS&CO. and other defendants in the Circuit Court of the State of Illinois, styled Federal Home Loan Bank of Chicago v. Bank of America Funding Corporation et al. A corrected amended complaint was filed on April 8, 2011, which alleges that defendants made untrue statements and material omissions in the sale to plaintiff of a number of mortgage pass-through certificates backed by securitization trusts containing residential mortgage loans and asserts claims under Illinois law. The total amount of certificates allegedly sold to plaintiff by MS&Co. at issue in the action was approximately $203 million. The complaint seeks, among other things, to rescind the plaintiff’s purchase of such certificates. The defendants filed a motion to dismiss the corrected amended complaint on May 27, 2011, which was denied on September 19, 2012. On December 13, 2013, the court entered an order dismissing all claims related to one of the securitizations at issue. On January 18, 2017, the court entered an order dismissing all claims related to an additional securitization at issue. After those dismissals, the remaining amount of certificates allegedly issued by MS&Co. or sold to plaintiff by MS&Co. was approximately $65 million. At December 25, 2019, the current unpaid balance of the mortgage pass-through certificates at issue in this action was approximately $35 million, and the certificates had not yet incurred actual losses. Based on currently available information, the Company believes it could incur a loss in this action up to the difference between the $35 million unpaid balance of these certificates (plus any losses incurred) and their fair market value at the time of a judgment against MS&Co., plus pre- and post-judgment interest, fees and costs. MS&Co. may be entitled to be indemnified for some of these losses and to an offset for interest received by the plaintiff prior to a judgment.
On May 17, 2013, plaintiff in IKB International S.A. in Liquidation, et al. v. Morgan Stanley, et al. filed a complaint against MS&Co. and certain affiliates in the Supreme Court of NY. The complaint alleges that defendants made material misrepresentations and omissions in the sale to plaintiff of certain mortgage pass-through certificates backed by securitization trusts containing residential mortgage loans. The total amount of certificates allegedly sponsored, underwritten and/or sold by MS&Co. to plaintiff was approximately $133 million. The complaint alleges causes of action against MS&Co. for common law fraud, fraudulent concealment, aiding and abetting fraud, and negligent misrepresentation, and seeks, among other things, compensatory and punitive damages. On October 29, 2014, the court granted in part and denied in part MS&Co.’s motion to dismiss. All claims regarding four certificates were dismissed. After these dismissals, the remaining amount of certificates allegedly issued by MS&Co. or sold to plaintiff by MS&Co. was approximately $116 million. On August 11, 2016, the First Department affirmed the trial court’s decision denying in part MS&Co’s motion to dismiss the complaint. At December 25, 2019, the current unpaid balance of the mortgage pass-through certificates at issue in this action was approximately $22 million, and the certificates had incurred actual losses of $59 million. Based on currently available information, MS&Co. believes it could incur a loss in this action up to the difference between the $22 million unpaid balance of these certificates (plus any losses incurred) and their fair market value at the time of a judgment against MS&Co., or upon sale, plus pre- and post-judgment interest, fees and costs. MS&Co. may be entitled to be indemnified for some of these losses and to an offset for interest received by the plaintiff prior to a judgment.
In August of 2017, MS&Co. was named as a defendant in a purported antitrust class action in the United States District Court for the United States District Court for the Southern District of New York styled Iowa Public Employees’ Retirement System et al. v. Bank of America Corporation et al. Plaintiffs allege, inter alia, that MS&Co., together with a number of other financial institution defendants, violated U.S. antitrust laws and New York state law in connection with their alleged efforts to prevent the development of electronic exchange-based
14
platforms for securities lending. The class action complaint was filed on behalf of a purported class of borrowers and lenders who entered into stock loan transactions with the defendants. The class action complaint seeks, among other relief, certification of the class of plaintiffs and treble damages. On September 27, 2018, the court denied the defendants’ motion to dismiss the class action complaint.
Settled Civil Litigation
On December 23, 2009, the Federal Home Loan Bank of Seattle filed a complaint against MS&Co. and another defendant in the Superior Court of the State of Washington, styled Federal Home Loan Bank of Seattle v. Morgan Stanley & Co. Inc., et al. The amended complaint, filed on September 28, 2010, alleges that defendants made untrue statements and material omissions in the sale to plaintiff of certain mortgage pass-through certificates backed by securitization trusts containing residential mortgage loans. The total amount of certificates allegedly sold to plaintiff by MS&Co. was approximately $233 million. The complaint raised claims under the Washington State Securities Act and sought, among other things, to rescind the plaintiff’s purchase of such certificates. On January 23, 2017, the parties reached an agreement to settle the litigation.
On March 15, 2010, the Federal Home Loan Bank of San Francisco filed a complaint against MS&Co. and other defendants in the Superior Court of the State of California styled Federal Home Loan Bank of San Francisco v. Deutsche Bank Securities Inc. et al. An amended complaint, filed on June 10, 2010, alleges that defendants made untrue statements and material omissions in connection with the sale to plaintiff of certain mortgage pass-through certificates backed by securitization trusts containing residential mortgage loans. The amount of certificates allegedly sold to plaintiff by the Company was approximately $276 million. The complaint raised claims under both the federal securities laws and California law and sought, among other things, to rescind the plaintiff’s purchase of such certificates. On December 21, 2016, the parties reached an agreement to settle the litigation.
On October 25, 2010, MS&Co., certain affiliates and Pinnacle Performance Limited, a special purpose vehicle (“SPV”), were named as defendants in a purported class action in the United States District Court for the Southern District of New York (“SDNY”), styled Ge Dandong, et al. v. Pinnacle Performance Ltd., et al. On January 31, 2014, the plaintiffs in the action, which related to securities issued by the SPV in Singapore, filed a second amended complaint, which asserted common law claims of fraud, aiding and abetting fraud, fraudulent inducement, aiding and abetting fraudulent inducement, and breach of the implied covenant of good faith and fair dealing. On July 17, 2014, the parties reached an agreement to settle the litigation, which received final court approval on July 2, 2015.
On July 18, 2011, the Western and Southern Life Insurance Company and certain affiliated companies filed a complaint against MS&Co. and other defendants in the Court of Common Pleas in Ohio, styled Western and Southern Life Insurance Company, et al. v. Morgan Stanley Mortgage Capital Inc., et al. An amended complaint was filed on April 2, 2012 and alleges that defendants made untrue statements and material omissions in the sale to plaintiffs of certain mortgage pass-through certificates backed by securitization trusts containing residential mortgage loans. The amount of the certificates allegedly sold to plaintiffs by MS&Co. was approximately $153 million. On June 8, 2015, the parties reached an agreement to settle the litigation.
15
On April 25, 2012, The Prudential Insurance Company of America and certain affiliates filed a complaint against MS&Co. and certain affiliates in the Superior Court of the State of New Jersey, styled The Prudential Insurance Company of America, et al. v. Morgan Stanley, et al. On October 16, 2012, plaintiffs filed an amended complaint. The amended complaint alleged that defendants made untrue statements and material omissions in connection with the sale to plaintiffs of certain mortgage pass-through certificates backed by securitization trusts containing residential mortgage loans. The total amount of certificates allegedly sponsored, underwritten and/or sold by MS&Co. was approximately $1.073 billion. The amended complaint raised claims under the New Jersey Uniform Securities Law, as well as common law claims of negligent misrepresentation, fraud, fraudulent inducement, equitable fraud, aiding and abetting fraud, and violations of the New Jersey RICO statute, and included a claim for treble damages. On January 8, 2016, the parties reached an agreement to settle the litigation.
In re Morgan Stanley Mortgage Pass-Through Certificates Litigation, which had been pending in the SDNY, was a putative class action involving allegations that, among other things, the registration statements and offering documents related to the offerings of certain mortgage pass-through certificates in 2006 and 2007 contained false and misleading information concerning the pools of residential loans that backed these securitizations. On December 18, 2014, the parties’ agreement to settle the litigation received final court approval, and on December 19, 2014, the court entered an order dismissing the action.
On November 4, 2011, the Federal Deposit Insurance Corporation (“FDIC”), as receiver for Franklin Bank S.S.B, filed two complaints against MS&Co. in the District Court of the State of Texas. Each was styled Federal Deposit Insurance Corporation as Receiver for Franklin Bank, S.S.B v. Morgan Stanley & Company LLC F/K/A Morgan Stanley & Co. Inc. and alleged that MS&Co. made untrue statements and material omissions in connection with the sale to plaintiff of mortgage pass-through certificates backed by securitization trusts containing residential mortgage loans. The amount of certificates allegedly underwritten and sold to plaintiff by MS&Co. in these cases was approximately $67 million and $35 million, respectively. On July 2, 2015, the parties reached an agreement to settle the litigation.
On February 14, 2013, Bank Hapoalim B.M. filed a complaint against MS&Co. and certain affiliates in the Supreme Court of NY, styled Bank Hapoalim B.M. v. Morgan Stanley et al. The complaint alleged that defendants made material misrepresentations and omissions in the sale to plaintiff of certain mortgage pass-through certificates backed by securitization trusts containing residential mortgage loans. The total amount of certificates allegedly sponsored, underwritten and/or sold by MS&Co. to plaintiff was approximately $141 million. On July 28, 2015, the parties reached an agreement to settle the litigation, and on August 12, 2015, the plaintiff filed a stipulation of discontinuance with prejudice.
On September 23, 2013, the plaintiff in National Credit Union Administration Board v. Morgan Stanley & Co. Inc., et al. filed a complaint against MS&Co. and certain affiliates in the SDNY. The complaint alleged that defendants made untrue statements of material fact or omitted to state material facts in the sale to the plaintiff of certain mortgage pass-through certificates issued by securitization trusts containing residential mortgage loans. The total amount of certificates allegedly sponsored, underwritten and/or sold by MS&Co. to plaintiffs in the matter was approximately $417 million. The complaint alleged violations of federal and various state securities laws and sought, among other things, rescissionary and compensatory damages. On November 23, 2015, the parties reached an agreement to settle the matter.
16
On September 16, 2014, the Virginia Attorney General’s Office filed a civil lawsuit, styled Commonwealth of Virginia ex rel. Integra REC LLC v. Barclays Capital Inc., et al., against MS&Co. and several other defendants in the Circuit Court of the City of Richmond related to RMBS. The lawsuit alleged that MS&Co. and the other defendants knowingly made misrepresentations and omissions related to the loans backing RMBS purchased by the Virginia Retirement System. The complaint asserted claims under the Virginia Fraud Against Taxpayers Act, as well as common law claims of actual and constructive fraud, and sought, among other things, treble damages and civil penalties. On January 6, 2016, the parties reached an agreement to settle the litigation. An order dismissing the action with prejudice was entered on January 28, 2016.
On April 20, 2011, the Federal Home Loan Bank of Boston filed a complaint against MS&Co. and other defendants in the Superior Court of the Commonwealth of Massachusetts styled Federal Home Loan Bank of Boston v. Ally Financial, Inc. F/K/A GMAC LLC et al. An amended complaint was filed on June 29, 2012 and alleged that defendants made untrue statements and material omissions in the sale to plaintiff of certain mortgage pass-through certificates backed by securitization trusts containing residential mortgage loans. The total amount of certificates allegedly issued by MS&Co. or sold to plaintiff by MS&Co. was approximately $385 million. The amended complaint raised claims under the Massachusetts Uniform Securities Act, the Massachusetts Consumer Protection Act and common law and sought, among other things, to rescind the plaintiff’s purchase of such certificates. On November 25, 2013, July 16, 2014, and May 19, 2015, respectively, the plaintiff voluntarily dismissed its claims against MS&Co. with respect to three of the securitizations at issue. After these voluntary dismissals, the remaining amount of certificates allegedly issued by MS&Co. or sold to plaintiff by MS&Co. was approximately $332 million. On July 13, 2018, the parties reached an agreement in principle to settle the litigation.
On May 3, 2013, plaintiffs in Deutsche Zentral-Genossenschaftsbank AG et al. v. Morgan Stanley et al. filed a complaint against MS&Co., certain affiliates, and other defendants in the Supreme Court of NY. The complaint alleged that defendants made material misrepresentations and omissions in the sale to plaintiffs of certain mortgage pass-through certificates backed by securitization trusts containing residential mortgage loans. The total amount of certificates allegedly sponsored, underwritten and/or sold by MS&Co. to plaintiff was approximately $634 million. The complaint alleged causes of action against MS&Co. for common law fraud, fraudulent concealment, aiding and abetting fraud, negligent misrepresentation, and rescission and sought, among other things, compensatory and punitive damages. On June 26, 2018, the parties entered into an agreement to settle the litigation.
On April 1, 2016, the California Attorney General’s Office filed an action against MS&Co. in California state court styled California v. Morgan Stanley, et al., on behalf of California investors, including the California Public Employees’ Retirement System and the California Teachers’ Retirement System. The complaint alleged that MS&Co. made misrepresentations and omissions regarding residential mortgage-backed securities and notes issued by the Cheyne SIV, and asserted violations of the California False Claims Act and other state laws and sought treble damages, civil penalties, disgorgement, and injunctive relief. On April 24, 2019, the parties reached an agreement to settle the litigation.
Beginning on March 25, 2019, MS&Co. was named as a defendant in a series of putative class action complaints filed in the Southern District of NY, the first of which is styled Alaska Electrical Pension Fund v. BofA Secs., Inc., et al. Each complaint alleged a conspiracy to fix prices and restrain competition in the market for unsecured bonds issued by the following
17
Government-Sponsored Enterprises: the Federal National Mortgage Associate; the Federal Home Loan Mortgage Corporation; the Federal Farm Credit Banks Funding Corporation; and the Federal Home Loan Banks. The purported class period for each suit is from January 1, 2012 to June 1, 2018. Each complaint raised a claim under Section 1 of the Sherman Act and sought, among other things, injunctive relief and treble compensatory damages. On May 23, 2019, plaintiffs filed a consolidated amended class action complaint styled In re GSE Bonds Antitrust Litigation, with a purported class period from January 1, 2009 to January 1, 2016. On June 13, 2019, the defendants filed a joint motion to dismiss the consolidated amended complaint. On August 29, 2019, the court denied MS&Co.’s motion to dismiss. On December 15, 2019, MS&Co. and certain other defendants entered into a stipulation of settlement to resolve the action as against each of them in its entirety. On February 3, 2020, the court granted preliminary approval of that settlement.
Additional lawsuits containing claims similar to those described above may be filed in the future. In the course of its business, MS&Co., as a major futures commission merchant, is party to various civil actions, claims and routine regulatory investigations and proceedings that the General Partner believes do not have a material effect on the business of MS&Co. MS&Co. may establish reserves from time to time in connections with such actions.
Item 4. Mine Safety Disclosures. Not Applicable.
18
PART II
Item 5. Market for Registrant’s Common Equity, Related Stockholder Matters and Issuer Purchases of Equity Securities.
| (a) | Market Information. The Partnership has issued no stock. There is no public market for the Redeemable Units. |
| (b) | Holders. The number of holders of Redeemable Units as of February 29, 2020 was 868 for Class A Redeemable Units, 2 for Class D Redeemable Units and 2 for Class Z Redeemable Units. |
| (c) | Dividends. The Partnership did not declare any distributions in 2019 or 2018. The Partnership does not intend to declare distributions in the foreseeable future. |
| (d) | Securities Authorized for Issuance Under Equity Compensatory Plans. None. |
| (e) | Performance Graph. Not applicable. |
| (f) | Recent Sales of Unregistered Securities – Use of Proceeds from Registered Securities. For the year ended December 31, 2019, there were subscriptions of 39,975.1700 Class A Redeemable Units totaling $52,019,698 and 99.2020 Class Z Redeemable Units totaling $100,000. For the year ended December 31, 2018, there were subscriptions of 6,166.2010 Class A Redeemable Units totaling $7,965,516 and 600.0580 Class D Redeemable Units totaling $600,000. For the year ended December 31, 2017, there were subscriptions of 6,106.3820 Class A Redeemable Units totaling $8,154,804. |
Redeemable Units are issued in reliance upon applicable exemptions from registration under Section 4(a)(2) of the Securities Act of 1933, as amended (the “Securities Act”), and Section 506 of Regulation D promulgated thereunder. The Redeemable Units are purchased by accredited investors, as described in Regulation D. In determining the applicability of the exemption, the General Partner relies on the fact that the Redeemable Units are purchased by accredited investors in a private offering.
Proceeds from the sale of Redeemable Units are used in the trading of commodity interests including futures, option and forward contracts and any other interests pertaining thereto, including interests in commodity pools.
| (g) | Purchases of Equity Securities by the Issuer and Affiliated Purchasers. |
The following chart sets forth the purchases of limited partner Redeemable Units for each Class by the Partnership.
| Period | Class A (a) Total Number of Redeemable Units Purchased * |
Class A (b) Average Price Paid per Redeemable Unit ** |
Class Z (a) Total Number of Redeemable Units Purchased * |
Class Z (b) Average Price Paid per Redeemable Unit ** |
(c) Total Number of Redeemable Units Purchased as Part of Publicly Announced Plans or Programs |
(d) Maximum Number (or Approximate Dollar Value) of Redeemable Units that May Yet Be Purchased Under the Plans or Programs |
||||||||||||||||||
|
October 1, 2019 - October 31, 2019 |
1,934.4420 | $ | 1,306.43 | N/A | N/A | N/A | N/A | |||||||||||||||||
| November 1, 2019 - November 30, 2019 |
1,695.3210 | $ | 1,334.10 | N/A | N/A | N/A | N/A | |||||||||||||||||
|
December 1, 2019 - December 31, 2019 |
2,857.4430 | $ | 1,344.11 | 99.2020 | $ | 1,069.04 | N/A | N/A | ||||||||||||||||
| 6,487.2060 | $ | 1,330.26 | 99.2020 | $ | 1,069.04 | |||||||||||||||||||
| * | Generally, limited partners are permitted to redeem their Redeemable Units as of the end of each month on three business days’ notice to the General Partner. Under certain circumstances, the General Partner can compel redemption, although to date, the General Partner has not exercised this right. Purchases of Redeemable Units by the Partnership reflected in the chart above were made in the ordinary course of the Partnership’s business in connection with effecting redemptions for limited partners. |
| ** | Redemptions of Redeemable Units are effected as of the last day of each month at the net asset value per Redeemable Unit as of that day. No fee will be charged for redemptions. |
19
Item 6. Selected Financial Data.
Total investment income, total expenses, total trading results, net income (loss) and increase (decrease) in net asset value per Redeemable Unit for the years ended December 31, 2019, 2018, 2017, 2016 and 2015 and net asset value per Redeemable Unit and total assets as of December 31, 2019, 2018, 2017, 2016 and 2015 were as follows:
| 2019 | 2018 | 2017 | 2016 | 2015 | ||||||||||||||||
| Total investment income |
$ | 2,024,717 | $ | 1,114,605 | $ | 727,298 | $ | 233,243 | $ | 3,602 | ||||||||||
| Total expenses |
(7,333,577) | (5,186,549) | (5,609,943) | (7,857,986) | (11,487,773) | |||||||||||||||
| Total trading results |
8,682,432 | 5,918,058 | (163,000) | 13,999,398 | (4,099,362) | |||||||||||||||
|
|
|
|
|
|
|
|
|
|
|
|||||||||||
| Net income (loss) |
$ | 3,373,572 | $ | 1,846,114 | $ | (5,045,645) | $ | 6,374,655 | $ | (15,583,533) | ||||||||||
|
|
|
|
|
|
|
|
|
|
|
|||||||||||
| Increase (decrease) in net asset value per Redeemable Unit: |
||||||||||||||||||||
| Class A |
$ | 43.45 | $ | 35.02 | $ | (70.06) | $ | 67.32 | $ | (129.88) | ||||||||||
|
|
|
|
|
|
|
|
|
|
|
|||||||||||
| Class D |
$ | 47.02 | $ | 10.75 | * | $ | - | $ | - | $ | - | |||||||||
|
|
|
|
|
|
|
|
|
|
|
|||||||||||
| Class Z |
$ | 55.21 | $ | 47.07 | $ | (33.24) | $ | - | $ | - | ||||||||||
|
|
|
|
|
|
|
|
|
|
|
|||||||||||
| Net asset value per Redeemable Unit: |
||||||||||||||||||||
| Class A |
$ | 1,344.11 | $ | 1,300.66 | $ | 1,265.64 | $ | 1,335.70 | $ | 1,268.38 | ||||||||||
|
|
|
|
|
|
|
|
|
|
|
|||||||||||
| Class D |
$ | 1,057.77 | $ | 1,010.75 | $ | - | $ | - | $ | - | ||||||||||
|
|
|
|
|
|
|
|
|
|
|
|||||||||||
| Class Z |
$ | 1,069.04 | $ | 1,013.83 | $ | 966.76 | $ | - | $ | - | ||||||||||
|
|
|
|
|
|
|
|
|
|
|
|||||||||||
| Total assets |
$ | 97,392,825 | $ | 61,729,152 | $ | 77,823,076 | $ | 105,816,771 | $ | 137,909,370 | ||||||||||
|
|
|
|
|
|
|
|
|
|
|
|||||||||||
* From July 1, 2018, the date Class D Redeemable Units were first issued, to December 31, 2018.
Item 7. Management’s Discussion and Analysis of Financial Condition and Results of Operations.
Overview
The Partnership, directly and through its investment in the Funds, seeks to achieve capital appreciation through speculative trading in U.S. and international futures contracts, options on futures contracts and forward markets. The Partnership may also engage, directly or indirectly, in swap transactions and other derivative transactions with the approval of the General Partner/Trading Manager. Initially, the Partnership’s investment strategy focused on energy and energy-related investments. While the Partnership is expected to continue to have significant exposure to energy and energy-related markets, such trading will no longer be the Partnership’s primary focus. Therefore, the Partnership’s past trading performance will not necessarily be indicative of future results.
The General Partner/Trading Manager manages all business of the Partnership/Funds. The General Partner delegated its responsibility for the investment of the Partnership’s assets to the Advisors. The General Partner/Trading Manager engages a team of approximately 20 professionals, whose primary emphasis is on attempting to maintain quality control among the advisors to the funds operated or managed by the General Partner/Trading Manager. A full-time staff of due diligence professionals use proprietary technology and on-site evaluations to monitor new and existing futures money managers. The accounting and operations staff provide processing of subscriptions and redemptions and reporting to limited partners and regulatory authorities. The General Partner also engages staff involved in marketing and sales support. In selecting an Advisor for the Partnership, the General Partner considers, among other factors, the Advisor’s past performance, trading style, volatility of markets traded and fee requirements. The General Partner may modify or terminate the allocation of assets to an Advisor and allocate assets to additional advisors at any time.
Responsibilities of the General Partner include:
| • | due diligence examinations of the Advisors; |
| • | selection, appointment and termination of the Advisors; |
| • | negotiation of the Management Agreements; and |
| • | monitoring the activity of the Advisors. |
20
In addition, the General Partner/Trading Partner prepares, or assists the Administrator in preparing, the books and records and provides, or assists the Administrator in providing, the administrative and compliance services that are required by law or regulation, from time to time, in connection with the operation of the Partnership/Funds.
While the Partnership and the Funds have the right to seek lower commission rates from other commodity brokers at any time, the General Partner believes that the customer agreements and other arrangements with the commodity broker are fair, reasonable and competitive.
The programs traded by each Advisor on behalf of the Partnership are: Millburn — Commodity Program, Ospraie — Commodity Program, Aquantum — Aquantum Commodity Spread Program, Pan – Energy Trading Program, Northlander – Commodity Program and prior to Harbour Square’s termination effective March 31, 2019, Harbour Square – Discretionary Energy Program and prior to Aventis’s termination effective November 30, 2018, Aventis — Aventis Diversified Commodity Strategy. The General Partner may modify or terminate the allocation of assets among the Advisors at any time and may allocate assets to additional Advisors at any time. As of December 31, 2019 and September 30, 2019, the Partnership’s assets were allocated among the Advisors in the following approximate percentages:
| Advisor |
December 31, 2019 | December 31, 2019 (percentage of Partners’ Capital) |
September 30, 2019 | September 30, 2019 (percentage of Partners’ Capital) |
||||||||||||
| Millburn |
$ | 24,154,287 | 26% | $ | 23,539,413 | 24% | ||||||||||
| Ospraie |
22,368,484 | 24% | 25,780,116 | 27% | ||||||||||||
| Aquantum |
15,433,367 | 17% | 18,629,646 | 19% | ||||||||||||
| Pan |
25,509,636 | 28% | 24,279,747 | 25% | ||||||||||||
| Northlander |
4,427,510 | 5% | 4,950,827 | 5% | ||||||||||||
Millburn Ridgefield Corporation
Millburn trades the Partnership’s assets in accordance with its Millburn Commodity Program. Millburn is the corporate successor to a futures trading and advisory organization that has been continuously managing assets in the currency and futures markets using quantitative, systematic techniques since 1971. The Millburn Commodity Program trades a diverse group of global commodity futures markets – currently approximately 54 – although it may not trade in all such markets at all times and the number of markets may increase or decrease from time to time. It strives to maintain a diversified portfolio of commodity futures, allocated according to volatility based risk (not face value), subject to constraints, in order to take advantage of global economic cycles and commodity price fluctuations. The portfolio is intended to be as diversified as market liquidity permits, and each market is traded using a diversified set of directional trading systems. Maximum market allocations for each market in the portfolio are determined based on factors including, among others, exchange regulations and depth of market. Millburn seeks to increase the number of commodity futures markets traded in the portfolio over time as new futures contracts become available, but it is also likely that certain futures contracts will be removed from the portfolio due to diminishing liquidity. The Millburn Commodity Program may in the future also access commodity markets through investing and trading in forward, option and swap contracts.
Millburn makes its systematically-based investment and trading decisions pursuant to its investment and trading methods, which may include technical trend analysis, certain nontraditional technical systems (i.e., systems falling outside of traditional technical trend analysis) and money management principles, each of which may be revised from time to time. The objective of the investment and trading systems employed by Millburn is to consider multiple data inputs, or “factors,” in order to arrive at relatively near-term return forecasts for each traded instrument, and take appropriate, risk-managed positions. These factors include price data, but also a range of price derivative and non-price data. The Millburn Commodity Program employs models that analyze data inputs over a time spectrum from several minutes to multiple years.
Trades generated by quantitative models may be profitable or unprofitable. The Millburn Commodity Program’s objective is to have its profitable trades offset and exceed losses from its unprofitable trades. During periods in which market behavior differs significantly from that analyzed to build models, substantial losses are possible, and even likely. Successful systematic futures trading depends on several elements. Two of the main factors are the development and selection of the trading systems used in each market, and the allocation of portfolio risk among the markets available for trading.
21
Market environments change over time, and particular systems may perform well in one environment but poorly in another. Likewise, market sectors and individual markets go through periods where systematic trading is very profitable and other periods where no system is able to generate any profits. The goal of Millburn’s research has been to develop and select a mix of systems in each market and to allocate risk across a wide array of markets, so as to contain overall portfolio risk within a targeted range while allowing exposure to profitable opportunities.
Over more than 47 years, Millburn and its predecessor entities have developed hundreds of trading systems. These trading systems generate buy or sell decisions in a particular market based on the analysis of price movements in the market, some non-price information or a combination of both. Of course, systems can be materially different –better in some periods and worse in others. The main distinguishing features are: the time frame over which systems work (intra-day to long term); the granularity of data fed into them (tick data to daily, weekly or monthly frequencies); type (market or economic statistics); source (cash, futures, forward or option markets generated data or government and industry generated statistical information), and the objective of the system (profiting from momentum, mean reversion, trading ranges or volatility). No single approach will work all the time. Therefore, Millburn’s objective is to have several approaches and several data inputs operating in conjunction with one another.
When arriving at the portfolio allocation, Millburn generally seeks maximum diversification subject to liquidity and sector concentration constraints and subject to the mandate of the strategy. Each market is traded using a diversified set of trading systems, which may be optimized for groups of markets, sectors or specific markets. The markets trade and allocations are reviewed at least monthly, although changes may occur more or less frequently. The following factors, among others, are considered in constructing a universe of markets to trade for each portfolio: profitability, liquidity of markets, professional judgment, desired diversification, transaction costs, exchange regulations and depth of market. For the Millburn Commodity Program, the current allocation to any market in the portfolio does not exceed 6%. The portfolio weightings will be determined, taking into account statistical data on the returns in each market, liquidity constraints and Millburn’s judgment and experience.
Risk is a function of both price level and price volatility. For example, for any given level of volatility, a 100,000 barrel crude oil position is worth more and is, therefore, probably more risky with oil at $90 per barrel than with oil at $50 per barrel. Similarly, oil would be more risky if prices are moving in a 5% daily range than if prices are moving in a 1% daily range. Millburn sizes the position in each market taking into account its measurement of risk based on price level and volatility in that market. Market exposure is then managed by the position-sizing models which measure the risk in the portfolio’s position in each market. In the event the model determines that the risk has changed beyond an acceptable threshold, it will signal a change in the position — a decrease in position size when risk increases and an increase in position size when risk decreases. Millburn’s position-sizing models maintain overall portfolio risk and distribution of risk across markets within designated ranges. The position-sizing model manages the position traded by each of the (directional) trading systems discussed above.
In addition, Millburn’s risk management processes focus on money management principles applicable to the portfolio as a whole rather than to individual markets. The first principle is portfolio diversification which attempts to improve the quality of profits by reducing volatility. Additional money management principles applicable to the portfolio as a whole include:
(1) limiting the assets committed as margin or collateral, generally within a range of 5% to 35% of an account’s net assets, though the amount may at any time be higher or lower; and
(2) prohibiting pyramiding — that is, using unrealized profits in a particular market as margin for additional positions solely in the same market.
Another important risk management function is the careful control of leverage or total portfolio exposure. Leverage levels are determined by simulating the entire portfolio — all markets, all systems, all risk control models, the exact weightings of the markets in the portfolio and the proposed level of leverage — over the past five or ten years to determine the portfolio’s simulated risk and return characteristics as well as the worst case experienced by the portfolio in the simulation period. The worst case, or peak-to-trough drawdown, is measured from a daily high in portfolio assets to the subsequent daily low whether that occurs days, weeks or months after the daily high. If Millburn considers the drawdown too severe or the portfolio’s simulated volatility too high, it reduces the leverage or total portfolio exposure. There are, however, no restrictions on the amount of leverage Millburn may use at any given time. Decisions whether to trade a particular market require the exercise of judgment. The decision not to trade certain markets for certain periods, or to reduce the size of a position in a particular market, may result at times in missing significant profit opportunities.
22
In some cases, Millburn employs discretion in the execution of trades where The Millburn Corporation’s trader expertise plays a role in timing of orders and, from time to time, Millburn may adjust the size of a position, long or short, in any given market indicated by its systematic trading strategies. This exercise of discretion (other than in trade execution) generally occurs only in response to unusual market conditions that may not have been factored into the design of the trading systems and is generally intended to reduce risk. Decisions to make such adjustments also require the exercise of judgment and may include consideration of the volatility of the particular market; the pattern of price movements, both inter-day and intra-day; open interest; volume of trading; changes in spread relationships between various forward contracts; and overall portfolio balance and risk exposure. With respect to the execution of trades, Millburn may rely to an extent upon the judgment of others, including dealers and bank traders. No assurance is given that it will be possible to execute trades regularly at or near the desired buy or sell point.
The trading method, systems and money management principles utilized by Millburn are proprietary and confidential. The foregoing description is general and is not intended to be complete. Millburn and its principals may, from time to time, trade futures, forward, and option contracts and securities for their own proprietary accounts. Such trades may or may not be in accordance with the Millburn trading program described above. The trading records of those accounts are not available for inspection.
Ospraie Management, LLC
Ospraie trades the Partnership’s assets in accordance with the Commodity Program. The primary investment objective is the appreciation of capital through active, leveraged trading and investment on a global basis primarily in a portfolio of commodities and related derivative instruments. Such commodity trading includes futures, forward, option and swap contracts and physical commodities in energy, industrial metals, precious metals, grains, softs/meats, freight and related markets, among other commodity sectors. The cornerstone of Ospraie’s approach to commodity investing is fundamental research. Ospraie uses a similar analytical methodology for each commodity market in which it elects to invest. This methodology incorporates the multiple variables that determine the end price of a commodity, including, but not limited to, the available supply of the commodity and the cost of production including extracting or harvesting, transporting, processing and distributing such commodity. It also incorporates current and projected demand for the commodity based on relative and absolute price levels and global economic factors. In addition, the relative availability of inventory in respect of a specified commodity to the world markets is factored into Ospraie’s analytical model. This analytical methodology guides Ospraie’s investment decisions with respect to an industry and results in a view as to its likely economic prospects. The investment thesis is then expressed in the global capital markets principally through futures and options instruments. The majority of the portfolio will include long/short directional investments based on Ospraie’s view on the future movements of prices of applicable commodities. Ospraie will also seek to maximize returns by investing in relative value opportunities, including investments based on intra-commodity curve related spreads (i.e., entering into a long and short position in a commodity interest with different delivery months) and inter-commodity price spreads (i.e., entering into a long position in a commodity interest and entering into a short position in a related commodity interest). Ospraie may also invest in foreign exchange, primarily for hedging purposes.
While the portfolio will generally be based upon Ospraie’s long-term views, the investment process will also include a subjective overlay as to the short-term profitability of an investment. Ospraie intends to dynamically size and scale back its trades based on its continued fundamental analysis, current level of conviction, the likely timing of realization, and current market conditions applicable to each investment. The portfolio will be principally comprised of highly liquid investment assets in order to maximize liquidity for investors. The portfolio’s liquidity will be achieved through the use of various instruments to access what Ospraie believes is the most efficient combination of liquidity and risk/reward consideration for each position.
Aquantum GmbH
The portion of the Partnership’s assets that are allocated to Aquantum for trading are not invested in commodity interests directly. Aquantum’s allocation of the Partnership’s assets is currently invested in Aquantum Master. Aquantum trades the Partnership’s assets allocated to it pursuant to its Aquantum Commodity Spread Program. The Aquantum Commodity Spread Program is a systematic commodity market-neutral trading program. It is designed to benefit from seasonal price dislocations in the forward structure of numerous commodity futures markets across all sectors (energy, softs, grains, livestock, and metals) which are the result of changing market participants’ expectations and fundamental factors like weather, climate, trends in consumption, harvest cycles, feed and storage costs, which typically trigger supply and demand dislocations.
While the Aquantum Commodity Spread Program may combine multiple spread positions per market, each individual trade is implemented as an intra-market calendar spread and is placed according to a 100% systematic methodology. Due to the seasonal character of the patterns traded, the Aquantum Commodity Spread Program is a “time” based strategy.
23
Pan Capital Management L.P.
Pan trades the Partnership’s assets allocated to it directly pursuant to its Energy Trading Program, a proprietary, discretionary trading program. The Energy Trading Program’s primary objective is to produce absolute returns through active trading of the U.S. energy markets, while offering investors an opportunity to diversify their overall portfolios. The Energy Trading Program also strives to minimize the risk of capital loss.
Pan trades listed exchange-traded futures and options on futures in the U.S. natural gas market and, with the consent of the General Partner, other liquid U.S. energy markets, including, but not limited to, electricity and crude oil. With the General Partner’s consent Pan may also trade swaps on behalf of the Partnership. Pan bases energy trading on fundamental analysis rather than market timing and seeks to structure trades with asymmetric risk return.
Pan firmly believes solid and thorough fundamental analysis, rigorous risk management and deep understanding of energy markets are required to achieve the Energy Trading Program’s investment objectives.
Northlander Commodity Advisors LLP
The portion of the Partnership’s assets that are allocated to Northlander for trading are not invested in commodity interests directly. Northlander’s allocation of the Partnership’s assets is currently invested in NL Master. Northlander trades the Partnership’s assets allocated to it pursuant to its Northlander Commodity Program. The Northlander Commodity Program is a commodity focused trading program which invests in energy products globally, but with an emphasis on European power, European gas, European emissions, and international coal markets. The program is an absolute return strategy which seeks to identify value in mispriced markets through careful fundamental analysis by focusing on market dynamics and market structure and then expressing its thesis through its proprietary portfolio construction and risk management procedures.
Harbour Square Capital Management LLC
The Discretionary Energy Program focused on a proprietary process that involved applying simulations to in-house models that emulated the fundamental elements of natural gas supply and demand to build distributions of possible fundamental outcomes. Harbour Square analyzed the changes to these distributions to determine underlying skew variations throughout time. This analysis of the change and rate of change in fundamental distributions while evaluating the concurrent natural gas price movements along the forward curve allowed Harbour Square to identify optimal risk/reward investment opportunities. Harbour Square looked to capitalize on short-to-intermediate term price dislocations by trading exchange-cleared futures, options and swaps in the U.S. natural gas market.
Aventis Asset Management, LLC
Aventis traded the Partnership’s assets in accordance with its Aventis Diversified Commodity Strategy. The Aventis Diversified Commodity Strategy was a proprietary trading program developed and refined by Aventis, which was the synthesis of disparate fundamental views and technical indicators overlaid with strict risk management policies on a position, sector and portfolio basis. The Aventis Diversified Commodity Strategy had the following characteristics:
| • | Ensemble of Three Sub-Programs: The Aventis Diversified Commodity Strategy was based on an ensemble of three discretionary sub-programs: spreads, directional and short term trading. This type of trading was based primarily on the fundamentals of the market (i.e., changes in supply or demand of a commodity). It also included supply and demand of the pit (i.e., discovery of over bought and over sold conditions). |
| • | Spread Trading: Approximately 60% of trading activity was based on calendar, intra-market and inter-market spreads. Intra-market spreads are where one is simultaneously long and short different delivery months of the same contract (i.e., long April Live Cattle versus short June Live Cattle). Inter-market spreads are where one is long one contract and simultaneously short a completely different contract (i.e., long December Natural Gas and short December Crude Oil). |
| • | Directional Trading: Approximately 35% of the strategy was directional in nature utilizing outright and spread positions. |
| • | Short Term Trading: Approximately 5% of the strategy was involved in short term trading. |
24
| • | Markets Followed: The Aventis Diversified Commodity Strategy traded on behalf of the Partnership in the following markets, among others: grains, currencies, energies, softs, meats and metals. |
| • | Risk Management: Effective risk management was also a crucial aspect of the program. Account size, expectation, volatility of markets traded and the nature of other positions taken were all factors in deciding whether to take a position and determining the amount of equity committed to that position. |
Please note that the percentage of assets allocated to the three discretionary sub-programs (spreads, directional and short term trading) was made pursuant to Aventis’s sole discretion and not in order to maintain any constant percentage allocation among the different sub-programs. As a result, the amount of assets allocated to each sub-program, both on a dollar amount and percentage basis, varied greatly over the life of the Partnership’s investment.
Trading decisions may have required the exercise of judgment by Aventis. Therefore, successful trading depended on Aventis’s trading ability, knowledge and judgment. Aventis exercised its judgment and discretion in interpreting the data generated by its trading program, and made all decisions regarding trading, including selecting the markets which were followed and traded. In addition, Aventis determined the method by which orders were placed, the types of orders that were placed, the overall leverage for the portfolio, and, when applicable, the time at which orders were placed with, and executed by, a broker.
The trading program that was followed by Aventis did not assure successful trading. Investment decisions made in accordance with the Aventis Diversified Commodity Strategy was based on an assessment of available market information. However, because of the large quantity of information at hand, the number of available facts that may have been overlooked and the variables that may have shifted, any investment decision must, in the final analysis, have been based on the judgment of Aventis.
The decision by Aventis not to trade certain markets or not to make certain trades may have resulted at times in missing price moves and hence profits of great magnitude, which other trading advisors who were willing to trade these markets may have been able to capture. Aventis’s approach was dependent in part on the existence of certain technical or fundamental indicators. There have been periods in the past when there were no such market indicators present.
Aventis believed that the development of a trading strategy was a continual process. As a result of further analysis and research, changes were made from time to time in the specific manner in which the Aventis Diversified Commodity Strategy evaluated price movements in various markets.
The Aventis Diversified Commodity Strategy was a proprietary and confidential program, and the foregoing description is, of necessity, general and is not intended to be exhaustive. Consequently, an investor cannot determine the full details of the program, or whether the program was being followed. There was no assurance that any trading strategy of Aventis was able to produce profitable results. As a managed futures partnership, the Partnership’s performance is dependent upon the successful trading of the Advisors to achieve the Partnership’s objectives. It is the business of the General Partner to monitor an Advisor’s performance to assure compliance with the Partnership’s trading policies and to determine if the Advisor’s performance is meeting the Partnership’s objectives.
No assurance can be given that the Advisors’ strategies will be successful or that they will generate profits for the Partnership.
Specific Fund level performance information is included in Note 6 to the financial statements included in “Item 8. Financial Statements and Supplementary Data.”
25
For the period January 1, 2019 through December 31, 2019, the average allocation by commodity market sector for NL Master and Aquantum Master was as follows:
| NL Master * | ||||
| Energy |
100.0 | % | ||
| * From April 1, 2019, commencement of operations for NL Master, through December 31, 2019. |
||||
| Aquantum Master ** | ||||
| Energy |
54.3 | % | ||
| Grains |
6.5 | % | ||
| Livestock |
29.0 | % | ||
| Softs |
10.2 | % | ||
** From June 1, 2019, commencement of operations for Aquantum Master, through December 31, 2019.
| (a) | Liquidity. |
The Partnership does not engage in sales of goods or services. Its assets are its (i) investment in the Funds, (ii) redemptions receivable from the Funds, (iii) equity in trading account, consisting of unrestricted and restricted cash, net unrealized appreciation on open futures contracts, net unrealized appreciation on open forward contracts, options purchased at fair value and investment in U.S. Treasury bills at fair value, if applicable, and (iv) interest receivable. Because of the low margin deposits normally required in commodity futures trading, relatively small price movements may result in substantial losses to the Partnership, through its investment in the Funds and its direct investments. While substantial losses could lead to a material decrease in liquidity, no such illiquidity occurred during the year ended December 31, 2019.
To minimize the risk relating to low margin deposits, the Partnership/Funds follow certain trading policies, including:
| (i) | The Partnership/Funds invest their assets only in commodity interests that the Advisors believe are traded in sufficient volume to permit ease of taking and liquidating positions. Sufficient volume, in this context, refers to a level of liquidity that the Advisors believe will permit them to enter and exit trades without noticeably moving the market. |
| (ii) | An Advisor will not initiate additional positions in any commodity if these positions would result in aggregate positions requiring a margin of more than 66 2/3% of the Partnership’s net assets allocated to such Advisor. |
| (iii) | The Partnership/Funds may occasionally accept delivery of a commodity. Unless such delivery is disposed of promptly by retendering the warehouse receipt representing the delivery to the appropriate clearinghouse, the physical commodity position is fully hedged. |
| (iv) | The Partnership/Funds do not employ the trading technique commonly known as “pyramiding,” in which the speculator uses unrealized profits on existing positions as margin for the purchases or sale of additional positions in the same or related commodities. |
| (v) | The Partnership/Funds do not utilize borrowings other than short-term borrowings if the Partnership/Funds takes delivery of any cash commodities. |
| (vi) | The Advisors may, from time to time, employ trading strategies such as spreads or straddles on behalf of the Partnership/Funds. The terms “spread” and “straddle” describe commodity futures trading strategies involving the simultaneous buying and selling of futures contracts on the same commodity but involving different delivery dates or markets. |
| (vii) | The Partnership/Funds will not permit the churning of its commodity trading account. The term “churning” refers to the practice of entering and exiting trades with a frequency unwarranted by legitimate efforts to profit from the trades, driven by the desire to generate commission income. |
26
From January 1, 2019 through December 31, 2019, the Partnership’s average margin to equity ratio (i.e., the percentage of assets on deposit required for margin) was approximately 7.4%. The foregoing margin to equity ratio takes into account cash held in the Partnership’s name, as well as the allocable value of the positions and cash held on behalf of the Partnership in the name of the Funds.
In the normal course of business, the Partnership and the Funds are parties to financial instruments with off-balance-sheet risk, including derivative financial instruments and derivative commodity instruments. These financial instruments may include forwards, futures, options and swaps, whose values are based upon an underlying asset, index, or reference rate, and generally represent future commitments to exchange currencies or cash balances, to purchase or sell other financial instruments at specific terms at specified future dates, or, in the case of derivative commodity instruments, to have a reasonable possibility to be settled in cash, through physical delivery or with another financial instrument. These instruments may be traded on an exchange, a swap execution facility or OTC. Exchange-traded instruments include futures and certain standardized forward, swap and option contracts. Specific market movements of commodities or futures contracts underlying an option cannot accurately be predicted. The purchaser of an option may lose the entire premium paid for the option. The writer or seller of an option has unlimited risk. Certain swap contracts may also be traded on a swap execution facility or OTC. OTC contracts are negotiated between contracting parties and also include certain forward and option contracts. Each of these instruments is subject to various risks similar to those related to the underlying financial instruments, including market and credit risk. In general, the risks associated with OTC contracts are greater than those associated with exchange-traded instruments because of the greater risk of default by the counterparty to an OTC contract. None of the Partnership’s/Funds’ contracts are traded OTC, although contracts may be traded OTC in the future.
As both a buyer and seller of options, the Partnership/Funds pay or receive a premium at the outset and then bears the risk of unfavorable changes in the price of the contract underlying the option. Written options expose the Partnership/Funds to potentially unlimited liability; for purchased options the risk of loss is limited to the premiums paid. Certain written put options permit cash settlement and do not require the option holder to own the reference asset. The Partnership/Funds do not consider these contracts to be guarantees.
The Partnership/Funds do not isolate the portion of the results of operations arising from the effect of changes in foreign exchange rates on investments from fluctuations due to changes in market prices of investments held. Such fluctuations are included in total trading results in the Partnership’s/Funds’ Statements of Income and Expenses.
Market risk is the potential for changes in the value of the financial instruments traded by the Partnership/Funds due to market changes, including interest and foreign exchange rate movements and fluctuations in commodity or security prices. Market risk is directly impacted by the volatility and liquidity in the markets in which the related underlying assets are traded. The Partnership and the Funds are exposed to market risk equal to the value of the futures and forward contracts held and unlimited liability on such contracts sold short.
Credit risk is the possibility that a loss may occur due to the failure of a counterparty to perform according to the terms of a contract. The Partnership’s/Funds’ risk of loss in the event of counterparty default is typically limited to the amounts recognized in the Statements of Financial Condition and is not represented by the contract or notional amounts of the instruments. The Partnership’s/Funds’ risk of loss is reduced through the use of legally enforceable master netting agreements with counterparties that permit the Partnership/Funds to offset unrealized gains and losses and other assets and liabilities with such counterparties upon the occurrence of certain events. The Partnership/Funds have credit risk and concentration risk, as MS&Co. or an MS&Co. affiliate are counterparties or brokers with respect to the Partnership’s/Funds’ assets. Credit risk with respect to exchange-traded instruments is reduced to the extent that, through MS&Co. or an MS&Co. affiliate, the Partnership’s/Funds’ counterparty is an exchange or clearing organization.
The risk to the limited partners that have purchased Redeemable Units is limited to the amount of their share of the Partnership’s net assets and undistributed profits. The limited liability is a result of the organization of the Partnership as a limited partnership under New York law.
The General Partner monitors and attempts to mitigate the Partnership’s/Funds’ risk exposure on a daily basis through financial, credit and risk management monitoring systems, and believes, accordingly, that it has effective procedures for evaluating and limiting the credit and market risks to which the Partnership/Funds may be subject. These monitoring systems generally allow the General Partner to statistically analyze actual trading results with risk-adjusted performance indicators and correlation statistics. In addition, online monitoring systems provide account analysis of futures, exchange-cleared swap and option contracts by sector, margin requirements, gain and loss transactions and collateral positions. (See also “Item 8. Financial Statements and Supplementary Data.” for further information on financial instrument risk included in the notes to the financial statements.)
27
The majority of these financial instruments mature within one year of the inception date. However, due to the nature of the Partnership’s/Funds’ business, these instruments may not be held to maturity.
Other than the risks inherent in commodity futures, forwards, options and swaps trading, U.S. Treasury bills and money market mutual fund securities, the General Partner knows of no trends, demands, commitments, events or uncertainties which will result in or which are reasonably likely to result in the Partnership’s/Funds’ liquidity increasing or decreasing in any material way. The Limited Partnership Agreement provides that the Partnership shall cease trading operations and liquidate all open positions under certain circumstances, including a decrease in net asset value per Redeemable Unit to less than $400 as of the close of business on any business day.
| (b) | Capital Resources. |
| (i) | The Partnership has made no material commitments for capital expenditures. |
| (ii) | The Partnership’s capital consists of the capital contributions of the partners, as increased or decreased by net income or losses on trading and by expenses, interest income, subscriptions and redemptions of Redeemable Units and distributions of profits, if any. Gains or losses on trading cannot be predicted. Market movements in commodities are dependent upon fundamental and technical factors which the Advisors may or may not be able to identify, such as changing supply and demand relationships, weather, government, agricultural, commercial and trade programs and policies, national and international political and economic events and changes in interest rates. Partnership expenses consist of, among other things, clearing fees, ongoing selling agent fees, management fees and General Partner fees. The level of these expenses is dependent upon trading performance and the level of net assets maintained. In addition, the amount of interest income earned by the Partnership is dependent upon (1) the average daily equity maintained in cash in the Partnership’s and/or applicable Funds’ accounts, (2) the amount of U.S. Treasury bills and/or money market mutual fund securities held by the Partnership and/or the Funds and (3) interest rates over which none of the Partnership, the Funds or MS&Co. has control. |
No forecast can be made as to the level of redemptions in any given period. A limited partner may require the Partnership to redeem some or all of its Redeemable Units at their net asset value as of the end of each month on three business days’ notice to the General Partner. There is no fee charged to limited partners in connection with redemptions. Redemptions are generally funded out of the Partnership’s cash holdings and/or redemptions from the Funds.
For the year ended December 31, 2019, 16,683.8500 Class A Redeemable Units were redeemed totaling $22,078,526, 99.2020 Class Z Redeemable Units were redeemed totaling $106,051 and 297.7320 Class Z General Partner Redeemable Units were redeemed totaling $315,025. For the year ended December 31, 2018, 16,927.6520 Class A Redeemable Units were redeemed totaling $21,858,538 and 50.9290 Class Z General Partner Redeemable Units were redeemed totaling $50,000. For the year ended December 31, 2017, 28,163.7770 Class A Redeemable Units were redeemed totaling $36,425,540, 904.7535 Class A General Partner Redeemable Units were redeemed totaling $1,208,476 and 511.6350 Class Z General Partner Redeemable Units were redeemed totaling $500,000.
For the year ended December 31, 2019, there were subscriptions of 39,975.1700 Class A Redeemable Units totaling $52,019,698, 99.2020 Class Z Redeemable Units totaling $100,000 and 671.4640 Class Z General Partner Redeemable Units totaling $680,750. For the year ended December 31, 2018, there were subscriptions of 6,166.2010 Class A Redeemable Units totaling $7,965,516 and 600.0580 Class D Redeemable Units totaling $600,000. For the year ended December 31, 2017, there were subscriptions of 6,106.3820 Class A Redeemable Units totaling $8,154,804 and 1,307.5870 Class Z General Partner Redeemable Units totaling $1,307,587.
(c) Results of Operations.
For the year ended December 31, 2019, the net asset value per Class A Redeemable Unit increased 3.3% from $1,300.66 to $1,344.11. For the year ended December 31, 2019, the net asset value per Class D Redeemable Unit increased 4.7% from $1,010.75 to $1,057.77. For the year ended December 31, 2019, the net asset value per Class Z Redeemable Unit increased 5.4% from $1,013.83 to $1,069.04. For the year ended December 31, 2018, the net asset value per Class A Redeemable Unit increased 2.8% from $1,265.64 to $1,300.66. For the period July 1, 2018 (date of first issuance) to December 31, 2018, the net asset value per Class D Redeemable Unit increased 1.1% from $1,000.00 to $1,010.75. For the year ended December 31, 2018, the net asset value per Class Z Redeemable Unit increased 4.9% from $966.76 to $1,013.83. For the year ended December 31, 2017, the net asset value per Class A Redeemable Unit decreased 5.2% from $1,335.70 to $1,265.64, and the net asset value per Class Z Redeemable Unit decreased 3.3% from $1,000.00 to 966.76.
28
The Partnership experienced a net trading gain before fees and expenses for the year ended December 31, 2019 of $8,682,432. Gains were primarily attributable to the Partnership’s/Funds’ trading of commodity futures in currencies, energy, grains, metals and softs and were partially offset by losses in livestock. The net trading gain or loss for the Partnership is discussed under “Item 8. Financial Statements and Supplementary Data.”
During the first quarter of 2019, the most notable gains were recorded during February and March from long futures positions in Brent crude oil and oil distillates as prices advanced amid signs of tightening global crude supply and strong U.S. demand for distillate products. In the livestock markets, gains were achieved during February and March from long positions in lean hog futures as prices increased amid a rise in U.S. exports as the African swine virus diminished global supplies. Gains within the metals complex were experienced during January and February from long positions in industrial metals futures as prices rebounded amid a decrease in the relative value of the U.S. dollar and optimism of U.S. trade negotiations with China. In the grains sector, smaller gains were achieved throughout the first quarter from positions in corn and wheat. The Partnership’s overall trading gains for the first quarter were partially offset by trading losses within the soft commodities sector primarily during March from long positions in coffee futures positions as prices decreased due to ample supplies.
During the second quarter of 2019, the most notable losses were recorded in livestock markets during May and June from long positions in lean hogs futures as prices dropped amid dampened concerns regarding the African swine flu’s effect on supply. Losses within the energy complex were incurred in May from long positions in Brent crude oil and oil distillates as prices suffered amid trade tensions and rising stockpiles. Additional losses in this sector were incurred during June from short positions in natural gas as prices spiked after forecasts of U.S. temperatures rose, increasing the potential of higher electricity demand. Smaller losses were incurred in the metals complex during June from short gold futures positions as prices benefited from weakness in the U.S. dollar and speculation of looser monetary policy globally. The Partnership’s overall trading losses for the second quarter were partially offset by trading gains within the soft commodities sector primarily during May from long coffee positions as prices surged on concern that wet weather could delay the harvest or erode bean quality in Brazil, the world’s top coffee bean grower.
During the third quarter of 2019, the most notable losses were recorded in livestock markets during July and September from long and short positions in lean hogs as prices whipsawed as investors wrestled with demand, the U.S.-Chinese trade war, and a swine flu epidemic. Losses within the metals complex were incurred during August from short positions in nickel futures as prices soared amid concerns that Indonesia may bring forward a ban on nickel exports. The Partnership’s overall trading losses for the third quarter were partially offset by trading gains within the soft commodities sector primarily during September from long coffee futures positions as prices increased as hot, dry weather in Brazil’s coffee region threatened to stunt crop bloom. Gains were also achieved within the energy complex, during the first half of September, from long natural gas futures positions as a late summer heat stoked power-plant demand, pushing prices higher. Additional gains were recorded during September from long crude oil futures positions. Within the grains market, gains were experienced during July from short positions in corn futures as better growing conditions and U.S. dollar strength pressured market prices lower.
During the fourth quarter of 2019, the most notable gains were recorded within the energy complex throughout the quarter from tactical long and short positioning in natural gas futures as prices fluctuated with U.S. temperatures and natural gas storage levels. Within the metals complex, gains were achieved during November from short precious metals positions as prices fell amid easing of geopolitical tensions. Within the grain markets, gains were experienced during November from short positions in soybeans and corn as prices fell due to weak demand for U.S. exports and positive growing conditions in South America. Within the soft commodity markets, gains were experienced during the second half of October from long coffee futures positions as prices increased amid unrest in North-West Cameroon’s coffee growing region. The Partnership’s overall trading gains for the fourth quarter were partially offset by trading losses within the livestock markets during November from long positions in lean hogs futures as prices fell amid supply demand uncertainty caused by the U.S.-China trade talks.
The Partnership experienced a net trading gain of $5,918,058 before fees and expenses for the year ended December 31, 2018. Gains were primarily attributable to the Partnership’s/Funds’ trading of energy, livestock and softs and were partially offset by losses in currencies, grains and metals.
29
During the first quarter of 2018, the most notable gains were recorded during January and March from long positions in crude oil and its related products as prices advanced due to tensions in the Middle East and expectations OPEC was going to continue to curb oil production. Further gains were recorded from long positions in natural gas futures. In the agriculturals, gains were achieved primarily in January from long positions in the grain markets as damaging weather in the U.S. Midwest threatened to delay the planting season, pushing prices higher. Further gains were experienced during January from short positions in sugar and in March from short live cattle positions. The Partnership’s overall trading gains for the first quarter were partially offset by trading losses within the metals sector from long positions in industrial metals as prices weakened during March amid concerns of a burgeoning global trade war.
During the second quarter of 2018, the most notable gains were recorded throughout the quarter from long positions in crude oil and its related products as prices advanced due to tensions in the Middle East and expectations of constrained supplies. In the soft commodities markets, gains were achieved primarily from short positions in cocoa futures as prices fell dramatically amid weakening demand and growing global supplies. Gains were also recorded within the metals complex primarily during April from long positions in palladium and aluminum as prices soared amid the possibility of sanctions against Russian metals exports. Smaller gains were experienced in livestock futures and options trading during May and June. The Partnership’s overall trading gains for the second quarter were partially offset by trading losses incurred primarily during June from long grain positions as prices fell amid favorable growing conditions within the U.S. and after China announced plans to levy tariffs on U.S. agricultural products.
During the third quarter of 2018, the most significant gains were recorded throughout the quarter from long positions in crude oil and its related products as prices advanced due to continued tensions in the Middle East and further expectations for constrained supplies. Gains were also recorded in the grains market during July from long soybean futures positions as prices bounced higher after the U.S. government announced a possible aid package for farmers. Additional gains were recorded from long wheat futures positions as prices rose amid droughts in key growing regions. Smaller gains were experienced in livestock markets during August from short futures positions in lean hogs as prices moved lower due to ample supply and negative market sentiment caused by trade tensions. The Partnership’s overall trading gains for the third quarter were partially offset by trading losses incurred primarily during July and August from long positions in industrial and precious metals futures as prices declined amid global trade fears coupled with the rising value of the U.S. dollar.
During the fourth quarter of 2018, the most notable gains were achieved from short positions in crude oil and oil distillates as prices decreased due to global growth concerns and a smaller-than-expected production cut from OPEC. Additional energy gains were recorded during November and December from positions in natural gas. Gains in the soft commodity markets were recorded primarily during October from long positions in cocoa and coffee futures as prices rose with a strengthening of Brazil’s currency. Smaller gains in these markets were experience during November and December. Further gains were experienced in the grains markets during October and December. A portion of the Partnership’s gains for the fourth quarter was offset by losses experienced in the metals complex primarily during December from short positions in gold and silver as prices advanced amid increased demand for the relative safety of precious metals.
The results of operations for the twelve months ended 2017 is discussed under “Item 7. Management’s Discussion and Analysis of Financial Condition and Results of Operations.” in the Partnership’s Annual Report on Form 10-K for the fiscal year ended December 31, 2017.
Interest income on 100% of the average daily equity maintained in cash in the Partnership’s (or the Partnership’s allocable portion of the Funds’) brokerage account during each month is earned at a rate equal to the monthly average of the 4-week U.S. Treasury bill discount rate. Prior to November 1, 2016, MS&Co. paid the Partnership interest on 80% of the average daily equity maintained in cash in the Partnership’s (or the Partnership’s allocable portion of the Funds’) brokerage account at the rate equal to the monthly average of the 4-week U.S. Treasury bill discount rate. For the avoidance of doubt, the Partnership/Funds will not receive interest on amounts in the futures brokerage account that are committed to margin. Any interest earned on the Partnership’s and/or the Funds’ account in excess of the amounts described above, if any, will be retained by MS&Co. and/or shared with the General Partner. All interest income earned on U.S. Treasury bills and money market mutual fund securities will be retained by the Partnership and/or the Funds, as applicable. Interest income earned for the three and twelve months ended December 31, 2019 increased by $38,773 and $910,112, respectively, as compared to the corresponding periods in 2018. The increase in interest income was primarily due to higher average daily equity and higher interest rates during the three and twelve months ended December 31, 2019 as compared to the corresponding periods in 2018. Interest earned by the Partnership will increase the net asset value of the Partnership. The amount of interest income earned by the Partnership depends on (1) the average daily equity maintained in cash in the Partnership’s and/or the applicable Funds’ accounts, (2) the amount of U.S. Treasury bills and/or money market mutual fund securities held by the Partnership and/or the Funds and (3) interest rates over which none of the Partnership, the Funds or MS&Co. has control.
30
Certain clearing fees are based on the number of trades executed by the Advisors for the Partnership/Funds. Accordingly, they must be compared in relation to the number of trades executed during the period. Clearing fees related to direct investments for the three and twelve months ended December 31, 2019 increased by $118,694 and $640,775, respectively, as compared to the corresponding periods in 2018. The increase in these clearing fees was primarily due to an increase in the number of direct trades made by the Partnership during the three and twelve months ended December 31, 2019 as compared to the corresponding periods in 2018.
Ongoing selling agent fees are calculated as a percentage of the Partnership’s adjusted net asset value of Class A Redeemable Units and Class D Redeemable Units as of the end of each month and are affected by trading performance, subscriptions and redemptions. Accordingly, they must be analyzed in relation to the fluctuations in the monthly net asset values. Ongoing selling agent fees for the three and twelve months ended December 31, 2019 increased by $163,846 and $750,496, respectively, as compared to the corresponding periods in 2018. This increase was due to higher average net assets attributable to Class A Redeemable Units and Class D Redeemable Units during the three and twelve months ended December 31, 2019 as compared to the corresponding periods in 2018.
Management fees are calculated as a percentage of the Partnership’s net assets per Class as of the end of each month and are affected by trading performance, subscriptions and redemptions. Accordingly, they must be analyzed in relation to the fluctuations in the monthly net asset values. Management fees for the three and twelve months ended December 31, 2019 increased by $109,559 and $524,377, respectively, as compared to the corresponding periods in 2018. This increase was due to higher average net assets per Class during the three and twelve months ended December 31, 2019 as compared to the corresponding periods in 2018.
General Partner fees are calculated as a percentage of the Partnership’s adjusted net assets per Class as of the end of each month and are affected by trading performance, subscriptions and redemptions. Accordingly, they must be analyzed in relation to the fluctuations in the monthly net asset values. General Partner fees for the three and twelve months ended December 31, 2019 increased by $21,965 and $121,356, respectively, as compared to the corresponding periods in 2018. This increase was due to higher average net assets per Class during the three and twelve months ended December 31, 2019 as compared to the corresponding periods in 2018.
Incentive fees are based on the Net Trading Profits (as defined in the respective management agreements between the Partnership, the General Partner and each Advisor) generated by each Advisor at the end of each quarter, half year or year, as applicable. Trading performance for the three and twelve months ended December 31, 2019 resulted in incentive fees of $738,566 and $1,057,828, respectively. Trading performance for the three and twelve months ended December 31, 2018 resulted in incentive fees of $372,041 and $1,017,644, respectively. To the extent an Advisor incurs a loss for the Partnership, the Advisor will not be paid incentive fees until such Advisor recovers any net loss incurred and earns additional new trading profits for the Partnership.
The Partnership pays professional fees, which generally include professional fees made up of legal and accounting expenses, as well as certain offering costs and filing, administrative, reporting and data processing fees. Professional fees for the years ended December 31, 2019 and 2018 were $394,964 and $351,346, respectively.
In the General Partner’s opinion, the Partnership’s Advisors continue to employ trading methods consistent with the objectives of the Partnership/Funds and expectations of the Advisors’ respective programs. The General Partner monitors the Advisors’ performance on a daily, weekly, monthly and annual basis to assure these objectives are met.
Commodity markets are highly volatile. Broad price fluctuations and rapid inflation increase not only the risks involved in commodity trading, but also the possibility of profit. The profitability of the Partnership/Funds depends on the existence of major price trends and the ability of the Advisors to correctly identify those price trends. Price trends are influenced by, among other factors, changing supply and demand relationships, weather, governmental, agricultural, commercial and trade programs and policies, national and international political and economic events and changes in interest rates. To the extent that market trends exist and the Advisors are able to identify them, the Partnership/Funds expect to increase capital through operations.
In allocating substantially all of the assets of the Partnership among the Advisors, the General Partner considers, among other factors, each Advisor’s past performance, trading style, volatility of markets traded and fee requirements. The General Partner may modify or terminate the allocation of assets to the Advisors and allocate assets to additional advisors at any time. Each Advisor’s percentage allocation and trading program is described in the “Overview” section of this Item 7.
(d) Off-balance Sheet Arrangements. None.
(e) Contractual Obligations. None.
(f) Operational Risk.
31
The Partnership, directly or indirectly through its investment in the Funds, is directly exposed to market risk and credit risk, which arise in the normal course of its business activities. Slightly less direct, but of critical importance, are risks pertaining to operational and back office support. This is particularly the case in a rapidly changing and increasingly global environment with increasing transaction volumes and an expansion in the number and complexity of products in the marketplace.
Such risks include:
Operational/Settlement Risk — the risk of financial and opportunity loss and legal liability attributable to operational problems, such as inaccurate pricing of transactions, untimely trade execution, clearance and/or settlement, or the inability to process large volumes of transactions. The Partnership/Funds are subject to increased risks with respect to their trading activities in emerging market instruments, where clearance, settlement, and custodial risks are often greater than in more established markets.
Technological Risk — the risk of loss attributable to technological limitations or hardware failure that constrain the Partnership’s/Funds’ ability to gather, process, and communicate information efficiently and securely, without interruption, to customers, and in the markets where the Partnership and the Funds participate. Additionally, the General Partner’s computer systems may be vulnerable to unauthorized access, mishandling or misuse, computer viruses or malware, cyber attacks and other events that could have a security impact on such systems. If one or more of such events occur, this potentially could jeopardize a limited partner’s personal, confidential, proprietary or other information processed and stored in, and transmitted through, the General Partner’s computer systems, and adversely affect the Partnership’s business, financial condition or results of operations.
Legal/Documentation Risk — the risk of loss attributable to deficiencies in the documentation of transactions (such as trade confirmations) and customer relationships (such as master netting agreements) or errors that result in noncompliance with applicable legal and regulatory requirements.
Financial Control Risk — the risk of loss attributable to limitations in financial systems and controls. Strong financial systems and controls ensure that assets are safeguarded, that transactions are executed in accordance with the General Partner’s authorization, and that financial information utilized by the General Partner and communicated to external parties, including the Partnership’s Redeemable Unit holders, creditors and regulators, is free of material errors.
(g) Critical Accounting Policies.
The preparation of financial statements in conformity with accounting principles generally accepted in the United States of America (“GAAP”) requires the General Partner to make estimates and assumptions that affect the reported amounts of assets and liabilities and disclosures of contingent assets and liabilities at the date of the financial statements and the reported amounts of income and expenses during the reporting period. As a result, actual results could differ from these estimates. A summary of the Partnership’s significant accounting policies is described in Note 2 to the Partnership’s financial statements included in “Item 8. Financial Statements and Supplementary Data.”
As of December 31, 2019, the Partnership’s most significant accounting policy is the valuation of its investment in the Funds and in futures, option and forward contracts and U.S. Treasury bills, as applicable. The fair value of the investment in the Funds is determined based on the Partnership’s (1) net contribution to the Funds and (2) its allocated share of the undistributed profits and losses, including realized gains (losses) and net change in unrealized gains (losses), of the Funds. The fair value of exchange-traded futures, option and forward contracts is determined by the various exchanges, and reflects the settlement price for each contract as of the close of business on the last business day of the reporting period. The fair value of foreign currency forward contracts is extrapolated on a forward basis from the spot prices quoted as of approximately 3:00 P.M. (E.T.) on the last business day of the reporting period from various exchanges. The fair value of non-exchange-traded foreign currency option contracts is calculated by applying an industry standard model application for options valuation of foreign currency options, using as inputs the spot prices, interest rates, and option implied volatilities quoted as of approximately 3:00 P.M. (E.T.) on the last business day of the reporting period. U.S. Treasury bills are valued at the last available bid price received from independent pricing services as of the close of the last business day of the reporting period.
32
Item 7A. Quantitative and Qualitative Disclosures About Market Risk.
Introduction
The Partnership/Funds are speculative commodity pools. The market sensitive instruments held by the Partnership/Funds are acquired for speculative trading purposes, and all or substantially all of the Partnership’s/Funds’ assets are subject to the risk of trading loss. Unlike an operating company, the risk of market sensitive instruments is integral, not incidental, to the Partnership’s/Funds’ main line of business.
The limited partners will not be liable for losses exceeding the current net asset value of their investment. This limited liability is a result of the organization of the Partnership as a limited partnership under New York law.
Market movements result in frequent changes in the fair value of the Partnership’s/Funds’ open positions and, consequently, in their earnings and cash balances. The Partnership’s/Funds’ market risk is influenced by a wide variety of factors, including the level and volatility of interest rates, exchange rates, equity price levels, the market value of financial instruments and contracts, the diversification effects among the Partnership’s/Funds’ open contracts and the liquidity of the markets in which they trade.
The Partnership/Funds rapidly acquire and liquidate both long and short positions in a wide range of different markets. Consequently, it is not possible to predict how a particular future market scenario will affect performance, and the Partnership’s/Funds’ past performance is not necessarily indicative of their future results.
“Value at Risk” is a measure of the maximum amount which the Partnership/Funds could reasonably be expected to lose in a given market sector. However, the inherent uncertainty of the Partnership’s/Funds’ speculative trading and the recurrence in the markets traded by the Partnership/Funds of market movements far exceeding expectations could result in actual trading or non-trading losses far beyond the indicated Value at Risk or the Partnership’s/Funds’ experience to date (i.e., “risk of ruin”). In light of the foregoing, as well as the risks and uncertainties intrinsic to all future projections, the inclusion of the quantification in this section should not be considered to constitute any assurance or representation that the Partnership’s/Funds’ losses in any market sector will be limited to Value at Risk or by the Partnership’s/Funds’ attempts to manage their market risk.
Materiality as used in this section is based on an assessment of reasonably possible market movements and the potential losses caused by such movements, taking into account the leverage, optionality and multiplier features of the Partnership’s/Funds’ market sensitive instruments.
Quantifying the Partnership’s and the Funds’ Trading Value at Risk
The following quantitative disclosures regarding the Partnership’s/Funds’ market risk exposures contain “forward-looking statements” within the meaning of the safe harbor from civil liability provided for such statements by the Private Securities Litigation Reform Act of 1995 (set forth in Section 27A of the Securities Act and Section 21E of the Securities Exchange Act of 1934, as amended (the “Exchange Act”)). All quantitative disclosures in this section are deemed to be forward-looking statements for purposes of the safe harbor except for statements of historical fact (such as the terms of particular contracts and the number of market risk sensitive instruments held during or at the end of the reporting period).
The Partnership/Funds account for open positions on the basis of fair value accounting principles. Any loss in the market value of the Partnership’s/Funds’ open positions is directly reflected in the Partnership’s/Funds’ earnings and cash flow.
The Partnership’s/Funds’ risk exposure in the market sectors traded by the Advisors is estimated below in terms of Value at Risk. Please note that the Value at Risk model is used to numerically quantify market risk for historic reporting purposes only and is not utilized by either the General Partner or the Advisors in their daily risk management activities.
Exchange margin requirements have been used by the Partnership/Funds as the measure of its Value at Risk. Margin requirements are set by exchanges to equal or exceed the maximum losses reasonably expected to be incurred in the fair value of any given contract in 95%-99% of any one-day interval. The margin levels are established by dealers and exchanges using historical price studies as well as an assessment of current market volatility (including the implied volatility of the options on a given futures contract) and economic fundamentals to provide a probabilistic estimate of the maximum expected near-term one-day price fluctuation.
In the case of market sensitive instruments which are not exchange-traded (almost exclusively currencies in the case of the Partnership/Funds), the margin requirements for the equivalent futures positions have been used as Value at Risk. In those rare cases in which a futures-equivalent margin is not available, dealers’ margins have been used.
33
The fair value of the Partnership’s/Funds’ futures and forward positions does not have any optionality component. However, the Advisors may trade commodity options. The Value at Risk associated with options is reflected in the following table as the margin requirement attributable to the instrument underlying each option. Where this instrument is a futures contract, the futures margin has been used, and where this instrument is a physical commodity, the futures-equivalent margin has been used. This calculation is conservative in that it assumes that the fair value of an option will decline by the same amount as the fair value of the underlying instrument, whereas, in fact, the fair values of the options traded by the Partnership/Funds in almost all cases fluctuate to a lesser extent than those of the underlying instruments.
In quantifying the Partnership’s/Funds’ Value at Risk, 100% positive correlation in the different positions held in each market risk category has been assumed. Consequently, the margin requirements applicable to the open contracts have simply been added to determine each trading category’s aggregate Value at Risk. The diversification effects resulting from the fact that the Partnership’s/Funds’ positions are rarely, if ever, 100% positively correlated have not been reflected.
The Partnership’s and the Funds’ Trading Value at Risk in Different Market Sectors
Value at Risk tables represent a probabilistic assessment of the risk of loss in market sensitive instruments. Aquantum and Northlander trade the Partnership’s assets indirectly in master fund managed accounts established in the name of the master funds over which they had been granted limited authority to make trading decisions. Harbour Square Master did not have any open positions as of December 31, 2018. Millburn, Ospraie and Pan directly trade managed accounts in the name of the Partnership. The first trading Value at Risk table reflects the market sensitive instruments held by the Partnership directly and through its investments in the Funds as of December 31, 2019. The remaining trading Value at Risk tables reflect the market sensitive instruments held by the Partnership directly (i.e in the managed accounts in the Partnership’s name traded by certain Advisors) as of December 31, 2019 and December 31, 2018 and indirectly by each Fund separately as of December 31, 2019. There have been no material changes in the trading Value at Risk information previously disclosed in the Partnership’s Annual Report on Form 10-K for the year ended December 31, 2018.
The following table indicates the trading Value at Risk associated with the Partnership’s open positions by market category as of December 31, 2019. As of December 31, 2019, the Partnership’s total capitalization was $91,893,284.
December 31, 2019
| % of Total | ||||||||
| Market Sector |
Value at Risk | Capitalization | ||||||
| Energy |
$ | 4,297,296 | 4.68 | % | ||||
| Grains |
491,840 | 0.53 | ||||||
| Livestock |
243,586 | 0.26 | ||||||
| Metals |
841,069 | 0.92 | ||||||
| Softs |
354,990 | 0.39 | ||||||
|
|
|
|
|
|||||
| Total |
$ | 6,228,781 | 6.78 | % | ||||
|
|
|
|
|
|||||
34
The following tables indicate the trading Value at Risk associated with the Partnership’s direct investments as of December 31, 2019 and 2018 and indirect investment in the Funds as of December 31, 2019, and the highest, lowest and average values during the twelve months ended December 31, 2019 and 2018, as applicable. All open contracts trading risk exposures have been included in calculating the figures set forth below.
As of December 31, 2019 and 2018, the Partnership’s Value at Risk for the portion of its assets that are traded directly was as follows:
| December 31, 2019 |
| |||||||||||||||||||
| Twelve Months Ended December 31, 2019 | ||||||||||||||||||||
| Market Sector |
Value at Risk | % of Total Capitalization |
High Value at Risk |
Low Value at Risk |
Average Value at Risk* |
|||||||||||||||
| Energy |
$ | 3,787,513 | 4.12 | % | $ | 6,862,028 | $ | 1,785,115 | $ | 3,660,802 | ||||||||||
| Grains |
491,840 | 0.54 | 1,155,704 | 110,693 | 653,440 | |||||||||||||||
| Livestock |
82,060 | 0.09 | 2,177,333 | 47,850 | 680,893 | |||||||||||||||
| Metals |
841,069 | 0.92 | 4,134,491 | 357,863 | 1,604,503 | |||||||||||||||
| Softs |
335,111 | 0.36 | 2,302,157 | 190,851 | 1,135,043 | |||||||||||||||
|
|
|
|
|
|||||||||||||||||
| Total |
$ | 5,537,593 | 6.03 | % | ||||||||||||||||
|
|
|
|
|
|||||||||||||||||
* Annual average of daily Values at Risk.
| December 31, 2018 |
| |||||||||||||||||||
| Twelve Months Ended December 31, 2018 | ||||||||||||||||||||
| Market Sector |
Value at Risk | % of Total Capitalization |
High Value at Risk |
Low Value at Risk |
Average Value at Risk* |
|||||||||||||||
| Currencies |
$ | 92,400 | 0.16 | % | $ | 112,860 | $ | - | $ | 50,959 | ||||||||||
| Energy |
3,193,250 | 5.48 | 3,193,250 | - | 1,285,758 | |||||||||||||||
| Grains |
420,242 | 0.72 | 1,663,797 | - | 555,538 | |||||||||||||||
| Livestock |
699,318 | 1.20 | 699,318 | - | 161,965 | |||||||||||||||
| Metals |
1,616,158 | 2.78 | 3,546,300 | - | 1,831,200 | |||||||||||||||
| Softs |
1,061,055 | 1.82 | 1,614,949 | - | 749,472 | |||||||||||||||
|
|
|
|
|
|||||||||||||||||
| Total |
$ | 7,082,423 | 12.16 | % | ||||||||||||||||
|
|
|
|
|
|||||||||||||||||
* Annual average of month-end Values at Risk.
As of December 31, 2019, NL Master’s total capitalization was $21,701,870, and the Partnership owned approximately 20.4% of NL Master. As of December 31, 2019, NL Master’s Value at Risk for its assets (including the portion of the Partnership’s assets allocated to NL Master for trading) was as follows:
| December 31, 2019 |
| |||||||||||||||||||
| Twelve Months Ended December 31, 2019* | ||||||||||||||||||||
| Market Sector |
Value at Risk | % of Total Capitalization |
High Value at Risk |
Low Value at Risk |
Average Value at Risk** |
|||||||||||||||
| Energy |
$ | 402,025 | 1.85 | % | $ | 1,612,667 | $ | - | $ | 556,623 | ||||||||||
|
|
|
|
|
|||||||||||||||||
| Total |
$ | 402,025 | 1.85 | % | ||||||||||||||||
|
|
|
|
|
|||||||||||||||||
* From April 1, 2019, commencement of operations for NL Master, through December 31, 2019.
** Annual average of daily Values at Risk.
35
As of December 31, 2019, Aquantum Master’s total capitalization was $35,530,342, and the Partnership owned approximately 43.1% of Aquantum Master. As of December 31, 2019, Aquantum Master’s Value at Risk for its assets (including the portion of the Partnership’s assets allocated to Aquantum Master for trading) was as follows:
| December 31, 2019 |
| |||||||||||||||||||
| Twelve Months Ended December 31, 2019* | ||||||||||||||||||||
| Market Sector |
Value at Risk | % of Total Capitalization |
High Value at Risk |
Low Value at Risk |
Average Value at Risk** |
|||||||||||||||
| Energy |
$ | 992,506 | 2.79 | % | $ | 1,985,763 | $ | 318,007 | $ | 1,030,946 | ||||||||||
| Livestock |
374,770 | 1.05 | 1,959,045 | 69,520 | 578,628 | |||||||||||||||
| Softs |
46,122 | 0.13 | 1,258,748 | - | 190,317 | |||||||||||||||
|
|
|
|
|
|||||||||||||||||
| Total |
$ | 1,413,398 | 3.97 | % | ||||||||||||||||
|
|
|
|
|
|||||||||||||||||
* From June 1, 2019, commencement of operations for Aquantum Master, through December 31, 2019.
** Annual average of daily Values at Risk.
As of March 31, 2019, the Partnership fully redeemed its investment in Harbour Square Master. As of December 31, 2018, Harbour Square Master’s total capitalization was $7,972,677, and the Partnership owned approximately 68.7% of Harbour Square Master. As of December 31, 2018, Harbour Square Master had no Value at Risk for its assets (including the portion of the Partnership’s assets allocated to Harbour Square Master for trading).
Material Limitations on Value at Risk as an Assessment of Market Risk
The face value of the market sector instruments held by the Partnership/Funds is typically many times the applicable margin requirement (margin requirements generally range between 1% and 15% of contract face value, although an exchange may increase margin requirements on short notice), as well as many times the capitalization of the Partnership/Funds. The magnitude of the Partnership’s/Funds’ open positions creates a “risk of ruin” not typically found in most other investment vehicles. Because of the size of their positions, certain market conditions — unusual, but historically recurring from time to time — could cause the Partnership/Funds to incur severe losses over a short period of time. The foregoing Value at Risk tables — as well as the past performance of the Partnership/Funds — give no indication of this “risk of ruin.”
Non-Trading Risk
The Partnership/Funds have non-trading market risk on its foreign cash balances not needed for margin. These balances and any market risk they may represent are immaterial.
A decline in short-term interest rates would result in a decline in the Partnership’s/Funds’ cash management income. This cash flow risk is not considered to be material.
Materiality, as used throughout this section, is based on an assessment of reasonably possible market movements and any associated potential losses, taking into account the leverage, optionality and multiplier features of the Partnership’s/Funds’ market-sensitive instruments, in relation to the Partnership’s/Funds’ net assets.
Qualitative Disclosures Regarding Primary Trading Risk Exposures
The following qualitative disclosures regarding the Partnership’s/Funds’ market risk exposures — except for (i) those disclosures that are statements of historical fact and (ii) the descriptions of how the Partnership/Funds manage their primary market risk exposures — constitute forward-looking statements within the meaning of Section 27A of the Securities Act and Section 21E of the Exchange Act. The Partnership’s/Funds’ primary market risk exposures as well as the strategies used and to be used by the General Partner and the Advisors for managing such exposures are subject to numerous uncertainties, contingencies and risks, any one of which could cause the actual results of the Partnership’s/Funds’ risk controls to differ materially from the objectives of such strategies. Government interventions, defaults and expropriations, illiquid markets, the emergence of dominant fundamental factors, political upheavals, changes in historical price relationships, an influx of new market participants, increased regulation and many other factors could result in material losses as well as in material changes to the risk exposures and the management strategies of the Partnership/Funds. There can be no assurance that the Partnership’s/Funds’ current market exposure and/or risk management strategies will not change materially or that any such strategies will be effective in either the short- or long- term. Investors must be prepared to lose all or substantially all of their investment in the Partnership.
36
The following were the primary trading risk exposures of the Partnership/Funds at December 31, 2019 by market sector. It may be anticipated, however, that these market exposures will vary materially over time.
Energy. The Partnership’s/Funds’ primary energy market exposure is to oil and natural gas price movements, often resulting from political developments in the Middle East, adverse weather conditions, and other factors contributing to supply and demand. Energy prices can be volatile and substantial profits and losses, which have been experienced in the past, are expected to continue to be experienced in these markets in the future.
Metals. The Partnership’s/Funds’ primary metal market exposure as of December 31, 2019 was to fluctuations in the prices of copper, nickel, aluminum, gold, silver, and zinc.
Grains. The Partnership’s/Funds’ trading risk exposure in the grains is primarily to agricultural price movements, which are often directly affected by severe or unexpected weather conditions. Corn, the soybean complex and wheat accounted for the majority of the Partnership’s/Funds’ grain exposure as of December 31, 2019.
Softs. The Partnership’s/Funds’ trading risk exposure in soft commodities is primarily to agricultural-related price movements, which are often directly affected by severe or unexpected weather conditions. Cocoa, coffee, and sugar accounted for the majority of the Partnership’s/Funds’ soft commodities exposure as of December 31, 2019.
Livestock. The Partnership’s/Funds’ primary risk exposure in livestock is to fluctuations in hog and cattle prices.
Qualitative Disclosures Regarding Non-Trading Risk Exposure
The following was the only non-trading risk exposure of the Partnership/Funds as of December 31, 2019.
Foreign Currency Balances. The Partnership/Funds may hold various foreign balances. The Advisors regularly convert foreign currency balances to U.S. dollars in an attempt to manage the Partnership’s/Funds’ non-trading risk.
Qualitative Disclosures Regarding Means of Managing Risk Exposure
The General Partner/Trading Manager monitors and attempts to mitigate the Partnership’s/Funds’ risk exposure on a daily basis through financial, credit and risk management monitoring systems and, accordingly, believes that it has effective procedures for evaluating and limiting the credit and market risks to which the Partnership/Funds may be subject.
The General Partner/Trading Manager monitors the Partnership’s/Funds’ performance and the concentration of open positions, and consults with the Advisors concerning the Partnership’s/Funds’ overall risk profile. If the General Partner/Trading Manager felt it necessary to do so, the General Partner/Trading Manager could require an Advisor to close out positions as well as enter positions traded on behalf of the Partnership/Funds. However, any such intervention would be a highly unusual event. The General Partner/Trading Manager primarily relies on the Advisors’ own risk control policies while maintaining a general supervisory overview of the Partnership’s/Funds’ market risk exposures.
The Advisors apply their own risk management policies to their trading. The Advisors often follow diversification guidelines, margin limits and stop loss points to exit a position. The Advisors’ research of risk management often suggests ongoing modifications to their trading programs.
As part of the General Partner’s risk management, the General Partner periodically meets with the Advisors to discuss their risk management and to look for any material changes to the Advisors’ portfolio balance and trading techniques. The Advisors are required to notify the General Partner of any material changes to their programs.
37
Item 8. Financial Statements and Supplementary Data.
CERES TACTICAL COMMODITY L.P.
The following financial statements and related items of the Partnership are filed under this Item 8: Oath or Affirmation, Management’s Report on Internal Control over Financial Reporting, Report of Independent Registered Public Accounting Firm, for the years ended December 31, 2019, 2018, and 2017; Statements of Financial Condition at December 31, 2019 and 2018; Condensed Schedules of Investments at December 31, 2019 and 2018; Statements of Income and Expenses for the years ended December 31, 2019, 2018, and 2017; Statements of Changes in Partners’ Capital for the years ended December 31, 2019, 2018, and 2017; and Notes to Financial Statements. Additional financial information has been filed as Exhibits to this Form 10-K.
38
To the Limited Partners of
Ceres Tactical Commodity L.P.
To the best of the knowledge and belief of the undersigned, the information contained herein is accurate and complete.
|
| ||
| By: | Patrick T. Egan | |
| President and Director | ||
| Ceres Managed Futures LLC | ||
| General Partner, | ||
| Ceres Tactical Commodity L.P. | ||
| Ceres Managed Futures LLC | ||
| 522 Fifth Avenue | ||
| New York, NY 10036 | ||
| (855) 672-4468 | ||

Management’s Report on Internal Control over
Financial Reporting
The management of Ceres Tactical Commodity L.P. (the “Partnership”), Ceres Managed Futures LLC, is responsible for establishing and maintaining adequate internal control over financial reporting as defined in Rules 13a-15(f) and 15d-15(f) under the Securities Exchange Act of 1934 and for our assessment of internal control over financial reporting. The Partnership’s internal control over financial reporting is a process designed to provide reasonable assurance regarding the reliability of financial reporting and the preparation of financial statements for external purposes in accordance with accounting principles generally accepted in the United States of America. The Partnership’s internal control over financial reporting includes those policies and procedures that:
| (i) | pertain to the maintenance of records that, in reasonable detail, accurately and fairly reflect the transactions and dispositions of the assets of the Partnership; |
| (ii) | provide reasonable assurance that transactions are recorded as necessary to permit preparation of financial statements in accordance with accounting principles generally accepted in the United States of America, and that receipts and expenditures of the Partnership are being made only in accordance with authorizations of management and directors of the Partnership; and |
| (iii) | provide reasonable assurance regarding prevention or timely detection and correction of unauthorized acquisition, use or disposition of the Partnership’s assets that could have a material effect on the financial statements. |
Because of its inherent limitations, internal control over financial reporting may not prevent or detect misstatements. Also, projections of any evaluation of effectiveness to future periods are subject to the risk that controls may become inadequate because of changes in conditions, or that the degree of compliance with the policies or procedures may deteriorate.
The management of Ceres Tactical Commodity L.P. has assessed the effectiveness of the Partnership’s internal control over financial reporting as of December 31, 2019. In making this assessment, management used the criteria set forth in the Internal Control-Integrated Framework (2013) issued by the Committee of Sponsoring Organizations of the Treadway Commission. Based on our assessment, management concluded that the Partnership maintained effective internal control over financial reporting as of December 31, 2019 based on the criteria referred to above.
|
|
| |||
| Patrick T. Egan | Steven Ross | |||
| President and Director | Chief Financial Officer and Director | |||
| Ceres Managed Futures LLC | Ceres Managed Futures LLC | |||
| General Partner, | General Partner, | |||
| Ceres Tactical Commodity L.P. | Ceres Tactical Commodity L.P. |


Report of Independent Registered Public Accounting Firm
To the Partners of Ceres Tactical Commodity L.P.,
Opinion on the Financial Statements
We have audited the accompanying statements of financial condition of Ceres Tactical Commodity L.P. (the “Partnership”), including the condensed schedules of investments, as of December 31, 2019 and 2018, and the related statements of income and expenses and changes in partners’ capital for each of the three years in the period then ended, and the related notes (collectively referred to as the “financial statements”). In our opinion, the financial statements present fairly, in all material respects, the financial position of the Partnership at December 31, 2019 and 2018, and the results of its operations and the changes in its partners’ capital for each of the three years in the period then ended, in conformity with U.S. generally accepted accounting principles.
Basis for Opinion
These financial statements are the responsibility of the Partnership’s management. Our responsibility is to express an opinion on the Partnership’s financial statements based on our audits. We are a public accounting firm registered with the Public Company Accounting Oversight Board (United States) (“PCAOB”) and are required to be independent with respect to the Partnership in accordance with the U.S. federal securities laws and the applicable rules and regulations of the Securities and Exchange Commission and the PCAOB.
We conducted our audits in accordance with the standards of the PCAOB. Those standards require that we plan and perform the audits to obtain reasonable assurance about whether the financial statements are free of material misstatement, whether due to error or fraud. The Partnership is not required to have, nor were we engaged to perform, an audit of the Partnership’s internal control over financial reporting. As part of our audits, we are required to obtain an understanding of internal control over financial reporting, but not for the purpose of expressing an opinion on the effectiveness of the Partnership’s internal control over financial reporting. Accordingly, we express no such opinion.
Our audits included performing procedures to assess the risks of material misstatement of the financial statements, whether due to error or fraud, and performing procedures that respond to those risks. Such procedures included examining, on a test basis, evidence regarding the amounts and disclosures in the financial statements. Our procedures included confirmation of securities owned as of December 31, 2019, by correspondence with the custodian and brokers. Our audits also included evaluating the accounting principles used and significant estimates made by management, as well as evaluating the overall presentation of the financial statements. We believe that our audits provide a reasonable basis for our opinion.
/s/ Ernst & Young LLP
We have served as the auditor of the Partnership since 2017.
Boston, MA
March 19, 2020
Ceres Tactical Commodity L.P.
Statements of Financial Condition
December 31, 2019 and 2018
| December 31, 2019 |
December 31, 2018 |
|||||||
| Assets: |
||||||||
| Investment in the Fund(s)(1), at fair value (Note 6) |
$ | 19,760,928 | $ | 5,489,732 | ||||
| Redemptions receivable from the Fund(s) |
2,050,873 | 21,653 | ||||||
|
|
|
|
|
|||||
| Equity in trading account: |
||||||||
| Unrestricted cash (Note 3c) |
66,262,634 | 46,452,179 | ||||||
| Restricted cash (Note 3c) |
5,558,690 | 7,608,136 | ||||||
| Net unrealized appreciation on open futures contracts |
3,104,619 | 1,757,511 | ||||||
| Net unrealized appreciation on open forward contracts |
255,669 | - | ||||||
| Options purchased, at fair value (premiums paid $804,127 and $555,793 at December 31, 2019 and 2018, respectively) |
308,284 | 305,214 | ||||||
|
|
|
|
|
|||||
| Total equity in trading account |
75,489,896 | 56,123,040 | ||||||
|
|
|
|
|
|||||
| Interest receivable (Note 3c) |
91,128 | 94,727 | ||||||
|
|
|
|
|
|||||
| Total assets |
$ | 97,392,825 | $ | 61,729,152 | ||||
|
|
|
|
|
|||||
| Liabilities and Partners’ Capital: |
||||||||
| Liabilities: |
||||||||
| Net unrealized depreciation on open forward contracts |
$ | - | $ | 364,117 | ||||
| Options written, at fair value (premiums received $690,626 and $506,194 at December 31, 2019 and 2018, respectively) |
169,935 | 409,571 | ||||||
| Accrued expenses: |
||||||||
| Ongoing selling agent fees (Note 3d) |
159,170 | 99,660 | ||||||
| Management fees (Note 3b) |
121,136 | 82,317 | ||||||
| General Partner fees (Note 3a) |
60,522 | 50,530 | ||||||
| Incentive fees (Note 3b) |
814,167 | 957,011 | ||||||
| Professional fees |
227,842 | 220,343 | ||||||
| Redemptions payable to Limited Partners (Note 7) |
3,946,769 | 1,326,737 | ||||||
|
|
|
|
|
|||||
| Total liabilities |
5,499,541 | 3,510,286 | ||||||
|
|
|
|
|
|||||
| Partners’ Capital (Notes 1 and 7): |
||||||||
| General Partner, Class Z, 1,118.7550 and 745.0230 Redeemable Units outstanding at December 31, 2019 and 2018, respectively |
1,195,989 | 755,325 | ||||||
| Limited Partners, Class A, 67,005.2267 and 43,713.9067 Redeemable Units outstanding at December 31, 2019 and 2018, respectively |
90,062,572 | 56,857,034 | ||||||
| Limited Partners, Class D, 600.0580 Redeemable Units outstanding at December 31, 2019 and 2018 |
634,723 | 606,507 | ||||||
|
|
|
|
|
|||||
| Total partners’ capital (net asset value) |
91,893,284 | 58,218,866 | ||||||
|
|
|
|
|
|||||
| Total liabilities and partners’ capital |
$ | 97,392,825 | $ | 61,729,152 | ||||
|
|
|
|
|
|||||
| Net asset value per Redeemable Unit: |
||||||||
| Class A |
$ | 1,344.11 | $ | 1,300.66 | ||||
|
|
|
|
|
|||||
| Class D |
$ | 1,057.77 | $ | 1,010.75 | ||||
|
|
|
|
|
|||||
| Class Z |
$ | 1,069.04 | $ | 1,013.83 | ||||
|
|
|
|
|
|||||
| (1) | Defined in Note 1. |
See accompanying notes to financial statements.
Ceres Tactical Commodity L.P.
Condensed Schedule of Investments
December 31, 2019
| Number of Contracts |
Fair Value | % of Partners’ Capital |
||||||||||
| Futures Contracts Purchased |
||||||||||||
| Energy |
12,781 | $ | (7,621,903) | (8.29) | % | |||||||
| Grains |
453 | 274,002 | 0.30 | |||||||||
| Indices |
440 | (354,176) | (0.39) | |||||||||
| Livestock |
56 | 10,540 | 0.01 | |||||||||
| Metals |
165 | 285,840 | 0.31 | |||||||||
| Softs |
343 | 253,714 | 0.28 | |||||||||
|
|
|
|
|
|||||||||
| Total futures contracts purchased |
(7,151,983) | (7.78) | ||||||||||
|
|
|
|
|
|||||||||
| Futures Contracts Sold |
||||||||||||
| Energy |
||||||||||||
| NAT GAS LAST DAY Mar 20 - Mar 22 |
2,556 | 5,386,190 | 5.86 | |||||||||
| Other |
10,416 | 4,966,843 | 5.41 | |||||||||
| Grains |
590 | (256,702) | (0.28) | |||||||||
| Indices |
380 | 322,626 | 0.35 | |||||||||
| Livestock |
54 | 10,710 | 0.01 | |||||||||
| Metals |
66 | 4,075 | 0.00 | * | ||||||||
| Softs |
323 | (177,140) | (0.19) | |||||||||
|
|
|
|
|
|||||||||
| Total futures contracts sold |
10,256,602 | 11.16 | ||||||||||
|
|
|
|
|
|||||||||
| Net unrealized appreciation on open futures contracts |
$ | 3,104,619 | 3.38 | % | ||||||||
|
|
|
|
|
|||||||||
| Unrealized Appreciation on Open Forward Contracts |
||||||||||||
| Metals |
658 | $ | 3,736,333 | 4.07 | % | |||||||
|
|
|
|
|
|||||||||
| Total unrealized appreciation on open forward contracts |
3,736,333 | 4.07 | ||||||||||
|
|
|
|
|
|||||||||
| Unrealized Depreciation on Open Forward Contracts |
||||||||||||
| Metals |
616 | (3,480,664) | (3.79) | |||||||||
|
|
|
|
|
|||||||||
| Total unrealized depreciation on open forward contracts |
(3,480,664) | (3.79) | ||||||||||
|
|
|
|
|
|||||||||
| Net unrealized appreciation on open forward contracts |
$ | 255,669 | 0.28 | % | ||||||||
|
|
|
|
|
|||||||||
| Options Purchased |
||||||||||||
| Calls |
||||||||||||
| Energy |
950 | $ | 186,010 | 0.21 | % | |||||||
| Metals |
131 | 3,869 | 0.00 | * | ||||||||
| Puts |
||||||||||||
| Energy |
58 | 41,395 | 0.05 | |||||||||
| Metals |
68 | 77,010 | 0.08 | |||||||||
|
|
|
|
|
|||||||||
| Total options purchased (premiums paid $804,127) |
$ | 308,284 | 0.34 | % | ||||||||
|
|
|
|
|
|||||||||
| Options Written |
||||||||||||
| Calls |
||||||||||||
| Energy |
1,094 | $ | (52,690) | (0.06) | % | |||||||
| Metals |
120 | (3,869) | (0.00) | * | ||||||||
| Puts |
||||||||||||
| Energy |
57 | (36,366) | (0.04) | |||||||||
| Metals |
68 | (77,010) | (0.08) | |||||||||
|
|
|
|
|
|||||||||
| Total options written (premiums received $690,626) |
$ | (169,935) | (0.18) | % | ||||||||
|
|
|
|
|
|||||||||
| Fair Value | % of Partners’ Capital |
|||||||||||
| Investment in the Funds |
||||||||||||
| CMF NL Master Fund LLC |
$ | 4,427,510 | 4.82 | % | ||||||||
| CMF Aquantum Master Fund LLC |
15,333,418 | 16.68 | ||||||||||
|
|
|
|
|
|||||||||
| Total investment in the Funds |
$ | 19,760,928 | 21.50 | % | ||||||||
|
|
|
|
|
|||||||||
* Due to rounding.
See accompanying notes to financial statements.
Ceres Tactical Commodity L.P.
Condensed Schedule of Investments
December 31, 2018
| Number of Contracts |
Fair Value | % of Partners’ Capital |
||||||||||
| Futures Contracts Purchased |
||||||||||||
| Currencies |
35 | $ | 13,419 | 0.02 | % | |||||||
| Energy |
1,827 | (3,537,375) | (6.08) | |||||||||
| Grains |
269 | (34,732) | (0.06) | |||||||||
| Livestock |
424 | (133,210) | (0.22) | |||||||||
| Metals |
132 | (17,816) | (0.03) | |||||||||
| Softs |
284 | (15,437) | (0.03) | |||||||||
|
|
|
|
|
|||||||||
| Total futures contracts purchased |
(3,725,151) | (6.40) | ||||||||||
|
|
|
|
|
|||||||||
| Futures Contracts Sold |
||||||||||||
| Energy |
2,168 | 5,226,770 | 8.98 | |||||||||
| Grains |
306 | 125,329 | 0.22 | |||||||||
| Livestock |
501 | 197,475 | 0.34 | |||||||||
| Metals |
127 | (151,374) | (0.26) | |||||||||
| Softs |
367 | 84,462 | 0.14 | |||||||||
|
|
|
|
|
|||||||||
| Total futures contracts sold |
5,482,662 | 9.42 | ||||||||||
|
|
|
|
|
|||||||||
| Net unrealized appreciation on open futures contracts |
$ | 1,757,511 | 3.02 | % | ||||||||
|
|
|
|
|
|||||||||
| Unrealized Appreciation on Open Forward Contracts |
||||||||||||
| Metals |
677 | $ | 2,203,511 | 3.78 | % | |||||||
|
|
|
|
|
|||||||||
| Total unrealized appreciation on open forward contracts |
2,203,511 | 3.78 | ||||||||||
|
|
|
|
|
|||||||||
| Unrealized Depreciation on Open Forward Contracts |
||||||||||||
| Metals |
774 | (2,567,628) | (4.41) | |||||||||
|
|
|
|
|
|||||||||
| Total unrealized depreciation on open forward contracts |
(2,567,628) | (4.41) | ||||||||||
|
|
|
|
|
|||||||||
| Net unrealized depreciation on open forward contracts |
$ | (364,117) | (0.63) | % | ||||||||
|
|
|
|
|
|||||||||
| Options Purchased |
||||||||||||
| Calls |
||||||||||||
| Grains |
110 | $ | 27,500 | 0.05 | % | |||||||
| Metals |
244 | 37,084 | 0.06 | |||||||||
| Puts |
||||||||||||
| Energy |
36 | 35,640 | 0.06 | |||||||||
| Livestock |
62 | 19,620 | 0.03 | |||||||||
| Metals |
94 | 185,370 | 0.32 | |||||||||
|
|
|
|
|
|||||||||
| Total options purchased (premiums paid $555,793) |
$ | 305,214 | 0.52 | % | ||||||||
|
|
|
|
|
|||||||||
| Options Written |
||||||||||||
| Calls |
||||||||||||
| Energy |
44 | $ | (34,760) | (0.06) | % | |||||||
| Livestock |
18 | (17,820) | (0.03) | |||||||||
| Metals |
141 | (13,833) | (0.02) | |||||||||
| Softs |
27 | (44,820) | (0.08) | |||||||||
| Puts |
||||||||||||
| Metals |
117 | (225,236) | (0.39) | |||||||||
| Softs |
104 | (73,102) | (0.12) | |||||||||
|
|
|
|
|
|||||||||
| Total options written (premiums received $506,194) |
$ | (409,571) | (0.70) | % | ||||||||
|
|
|
|
|
|||||||||
| Fair Value | % of Partners’ Capital |
|||||||||||
| Investment in the Fund |
||||||||||||
| CMF Harbour Square Master Fund LLC |
$ | 5,489,732 | 9.43 | % | ||||||||
|
|
|
|
|
|||||||||
| Total investment in the Fund |
$ | 5,489,732 | 9.43 | % | ||||||||
|
|
|
|
|
|||||||||
See accompanying notes to financial statements.
Ceres Tactical Commodity L.P.
Statements of Income and Expenses
For the Years Ended December 31, 2019, 2018 and 2017
| 2019 | 2018 | 2017 | ||||||||||
| Investment Income: |
||||||||||||
| Interest income (Note 3c) |
$ | 1,716,370 | $ | 719,779 | $ | - | ||||||
| Interest income allocated from the Fund(s) (Note 3c) |
308,347 | 394,826 | 727,298 | |||||||||
|
|
|
|
|
|
|
|||||||
| Total investment income |
2,024,717 | 1,114,605 | 727,298 | |||||||||
|
|
|
|
|
|
|
|||||||
| Expenses: |
||||||||||||
| Expenses allocated from the Fund(s) |
345,086 | 318,864 | 1,273,261 | |||||||||
| Clearing fees related to direct investments (Note 3c) |
1,138,045 | 497,270 | - | |||||||||
| Ongoing selling agent fees (Note 3d) |
2,062,779 | 1,312,283 | 1,859,839 | |||||||||
| Management fees (Note 3b) |
1,550,912 | 1,026,535 | 1,171,819 | |||||||||
| General Partner fees (Note 3a) |
783,963 | 662,607 | 937,457 | |||||||||
| Incentive fees (Note 3b) |
1,057,828 | 1,017,644 | - | |||||||||
| Professional fees |
394,964 | 351,346 | 367,567 | |||||||||
|
|
|
|
|
|
|
|||||||
| Total expenses |
7,333,577 | 5,186,549 | 5,609,943 | |||||||||
|
|
|
|
|
|
|
|||||||
| Net investment loss |
(5,308,860) | (4,071,944) | (4,882,645) | |||||||||
|
|
|
|
|
|
|
|||||||
| Trading Results: |
||||||||||||
| Net gains (losses) on trading of commodity interests and investment in the Fund(s): |
||||||||||||
| Net realized gains (losses) on closed contracts |
10,192,456 | 4,886,607 | - | |||||||||
| Net realized gains (losses) on closed contracts allocated from the Fund(s) |
(2,988,301) | (113,328) | 704,058 | |||||||||
| Net change in unrealized gains (losses) on open contracts |
2,156,294 | 1,238,838 | - | |||||||||
| Net change in unrealized gains (losses) on open contracts allocated from the Fund(s) |
(678,017) | (94,059) | (867,058) | |||||||||
|
|
|
|
|
|
|
|||||||
| Total trading results |
8,682,432 | 5,918,058 | (163,000) | |||||||||
|
|
|
|
|
|
|
|||||||
| Net income (loss) |
$ | 3,373,572 | $ | 1,846,114 | $ | (5,045,645) | ||||||
|
|
|
|
|
|
|
|||||||
| Net income (loss) per Redeemable Unit:* (Note 8): |
||||||||||||
| Class A |
$ | 43.45 | $ | 35.02 | $ | (70.06) | ||||||
|
|
|
|
|
|
|
|||||||
| Class D |
$ | 47.02 | $ | 10.75 | ** | $ | - | |||||
|
|
|
|
|
|
|
|||||||
| Class Z |
$ | 55.21 | $ | 47.07 | $ | (33.24) | ||||||
|
|
|
|
|
|
|
|||||||
| Weighted average Redeemable Units outstanding: |
||||||||||||
| Class A |
77,176.4275 | 50,108.3523 | 71,151.3143 | |||||||||
|
|
|
|
|
|
|
|||||||
| Class D |
600.0580 | 583.3817 | ** | - | ||||||||
|
|
|
|
|
|
|
|||||||
| Class Z |
1,308.9342 | 757.7553 | 1,159.9809 | |||||||||
|
|
|
|
|
|
|
|||||||
* Represents the change in net asset value per Redeemable Unit.
** From July 1, 2018, the date Class D Redeemable Units were first issued, to December 31, 2018.
See accompanying notes to financial statements.
Ceres Tactical Commodity L.P.
Statements of Changes in Partners’ Capital
For the Years Ended December 31, 2019, 2018 and 2017
| Class A | Class D | Class Z | Total | |||||||||||||||||||||||||||||
| Amount | Redeemable Units |
Amount | Redeemable Units |
Amount | Redeemable Units |
Amount | Redeemable Units |
|||||||||||||||||||||||||
| Partners’ Capital, December 31, 2016 |
$ | 103,433,044 | 77,437.5062 | $ | - | - | $ | - | - | $ | 103,433,044 | 77,437.5062 | ||||||||||||||||||||
| Subscriptions - General Partner |
- | - | - | - | 1,307,587 | 1,307.5870 | 1,307,587 | 1,307.5870 | ||||||||||||||||||||||||
| Subscriptions - Limited Partners |
8,154,804 | 6,106.3820 | - | - | - | - | 8,154,804 | 6,106.3820 | ||||||||||||||||||||||||
| Redemptions - General Partner |
(1,208,476) | (904.7535) | - | - | (500,000) | (511.6350) | (1,708,476) | (1,416.3885) | ||||||||||||||||||||||||
| Redemptions - Limited Partners |
(36,425,540) | (28,163.7770) | - | - | - | - | (36,425,540) | (28,163.7770) | ||||||||||||||||||||||||
| Net income (loss) |
(5,007,550) | - | - | - | (38,095) | - | (5,045,645) | - | ||||||||||||||||||||||||
|
|
|
|
|
|
|
|
|
|
|
|
|
|
|
|
|
|||||||||||||||||
| Partners’ Capital, December 31, 2017 |
68,946,282 | 54,475.3577 | - | - | 769,492 | 795.9520 | 69,715,774 | 55,271.3097 | ||||||||||||||||||||||||
| Subscriptions - Limited Partners |
7,965,516 | 6,166.2010 | 600,000 | 600.0580 | - | - | 8,565,516 | 6,766.2590 | ||||||||||||||||||||||||
| Redemptions - General Partner |
- | - | - | - | (50,000) | (50.9290) | (50,000) | (50.9290) | ||||||||||||||||||||||||
| Redemptions - Limited Partners |
(21,858,538) | (16,927.6520) | - | - | - | - | (21,858,538) | (16,927.6520) | ||||||||||||||||||||||||
| Net income (loss) |
1,803,774 | - | 6,507 | - | 35,833 | - | 1,846,114 | - | ||||||||||||||||||||||||
|
|
|
|
|
|
|
|
|
|
|
|
|
|
|
|
|
|||||||||||||||||
| Partners’ Capital, December 31, 2018 |
56,857,034 | 43,713.9067 | 606,507 | 600.0580 | 755,325 | 745.0230 | 58,218,866 | 45,058.9877 | ||||||||||||||||||||||||
| Subscriptions - General Partner |
- | - | - | - | 680,750 | 671.4640 | 680,750 | 671.4640 | ||||||||||||||||||||||||
| Subscriptions - Limited Partners |
52,019,698 | 39,975.1700 | - | - | 100,000 | 99.2020 | 52,119,698 | 40,074.3720 | ||||||||||||||||||||||||
| Redemptions - General Partner |
- | - | - | - | (315,025) | (297.7320) | (315,025) | (297.7320) | ||||||||||||||||||||||||
| Redemptions - Limited Partners |
(22,078,526) | (16,683.8500) | - | - | (106,051) | (99.2020) | (22,184,577) | (16,783.0520) | ||||||||||||||||||||||||
| Net income (loss) |
3,264,366 | - | 28,216 | - | 80,990 | - | 3,373,572 | - | ||||||||||||||||||||||||
|
|
|
|
|
|
|
|
|
|
|
|
|
|
|
|
|
|||||||||||||||||
| Partners’ Capital, December 31, 2019 |
$ | 90,062,572 | 67,005.2267 | $ | 634,723 | 600.0580 | $ | 1,195,989 | 1,118.7550 | $ | 91,893,284 | 68,724.0397 | ||||||||||||||||||||
|
|
|
|
|
|
|
|
|
|
|
|
|
|
|
|
|
|||||||||||||||||
Net asset value per Redeemable Unit:
| Class A | Class D | Class Z | ||||||||||
| 2017: |
$ | 1,265.64 | $ | - | $ | 966.76 | ||||||
|
|
|
|
|
|
|
|||||||
| 2018: |
$ | 1,300.66 | $ | 1,010.75 | $ | 1,013.83 | ||||||
|
|
|
|
|
|
|
|||||||
| 2019: |
$ | 1,344.11 | $ | 1,057.77 | $ | 1,069.04 | ||||||
|
|
|
|
|
|
|
|||||||
See accompanying notes to financial statements.
46
Ceres Tactical Commodity L.P.
Notes to Financial Statements
| 1. | Organization: |
Ceres Tactical Commodity L.P. (formerly, Managed Futures Premier Aventis II L.P.) (the “Partnership”) is a limited partnership organized on April 20, 2005 under the partnership laws of the State of New York to engage, directly or indirectly, in the speculative trading of commodity interests on U.S. and international futures, options on futures and forward markets. The Partnership may also engage, directly or indirectly, in swap transactions and other derivative transactions with the approval of the General Partner (as defined below). Initially, the Partnership’s investment strategy focused on energy and energy-related investments. While the Partnership is expected to continue to have significant exposure to energy and energy-related markets, such trading will no longer be the Partnership’s primary focus. Therefore, the Partnership’s past trading performance will not necessarily be indicative of future results. The sectors traded include energy, grains, livestock, metals and softs. The commodity interests that are traded by the Partnership directly or indirectly through its investment in the Funds (as defined below) are volatile and involve a high degree of market risk. The General Partner may also determine to invest up to all of the Partnership’s assets (directly or indirectly through its investment in the Funds) in United States (“U.S.”) Treasury bills and/or money market mutual funds, including money market mutual funds managed by Morgan Stanley or its affiliates. During the initial offering period, the Partnership sold 11,925 redeemable units of limited partnership interest (“Redeemable Units”). The Partnership commenced trading on September 6, 2005. The Partnership privately and continuously offers Redeemable Units to qualified investors. There is no maximum number of Redeemable Units that may be sold by the Partnership.
Ceres Managed Futures LLC, a Delaware limited liability company, acts as the general partner (the “General Partner”) and commodity pool operator of the Partnership and is the trading manager (the “Trading Manager”) of NL Master (as defined below) and Aquantum Master (as defined below). The General Partner was also the Trading Manager of Harbour Square Master (as defined below). The General Partner is a wholly-owned subsidiary of Morgan Stanley Domestic Holdings, Inc. (“MSD Holdings”). MSD Holdings is ultimately owned by Morgan Stanley. Morgan Stanley is a publicly held company whose shares are listed on the New York Stock Exchange. Morgan Stanley is engaged in various financial services and other businesses.
As of December 31, 2019, all trading decisions are made for the Partnership by Millburn Ridgefield Corporation (“Millburn”), Ospraie Management, LLC (“Ospraie”), Aquantum GmbH (“Aquantum”), Pan Capital Management L.P. (“Pan”), and Northlander Commodity Advisors LLP (“Northlander”) (each, an “Advisor” and, collectively, the “Advisors”), each, a registered commodity trading advisor. On November 30, 2018, Aventis Asset Management, LLC (“Aventis”) ceased to act as a commodity trading advisor to the Partnership. On March 31, 2019, Harbour Square Capital Management LLC (“Harbour Square”) ceased to act as a commodity trading advisor to the Partnership. Each Advisor is allocated a portion of the Partnership’s assets to manage. The Partnership invests the portion of its assets allocated to each of the Advisors either directly, through individually managed accounts, or indirectly through its investment in the Funds. References herein to the “Advisors” may also include, as relevant, Harbour Square and Aventis.
During the periods covered by this report, the Partnership’s/Funds’ commodity broker was Morgan Stanley & Co. LLC (“MS&Co.”), a registered futures commission merchant. During prior periods included in this report, the Partnership/Funds deposited a portion of their cash in non-trading bank accounts at JPMorgan Chase Bank, N.A.
The Partnership, CMF NL Master Fund LLC (“NL Master”) and CMF Aquantum Master Fund LLC (“Aquantum Master”) have entered, and (prior to their respective terminations) CMF Harbour Square Master Fund LLC (“Harbour Square Master”) and MB Master Fund L.P. (“MB Master”) had entered, into futures brokerage account agreements with MS&Co. NL Master and Aquantum Master are collectively referred to as the “Funds.” References herein to the Funds may also include, as relevant, Harbour Square Master and MB Master.
Ceres Tactical Commodity L.P.
Notes to Financial Statements
As of June 13, 2018, the Partnership began offering three classes of limited partnership interests, Class A Redeemable Units, Class D Redeemable Units and Class Z Redeemable Units. All Redeemable Units issued prior to October 31, 2016 were deemed “Class A Redeemable Units.” Class Z Redeemable Units were first issued on January 1, 2017. The rights, liabilities, risks and fees associated with investment in the Class A Redeemable Units were not changed. Class D Redeemable Units were first issued July 1, 2018. The rights, liabilities, risks and fees associated with investment in the Class A Redeemable Units and Class Z Redeemable Units were not changed. Class A Redeemable Units, Class D Redeemable Units and Class Z Redeemable Units will each be referred to as a “Class” and collectively referred to as the “Classes.” Class A Redeemable Units and Class D Redeemable Units are available to taxable U.S. individuals and institutions, U.S. tax exempt individuals and institutions and non-U.S. investors. Class Z Redeemable Units are offered to limited partners who receive advisory services from Morgan Stanley Smith Barney LLC (doing business as Morgan Stanley Wealth Management) (“Morgan Stanley Wealth Management”) and may also be offered to certain employees of Morgan Stanley and/or its subsidiaries (and their family members). Class A Redeemable Units, Class D Redeemable Units and Class Z Redeemable Units are identical, except that Class A Redeemable Units are subject to a monthly ongoing selling agent fee equal to 1/12 of 2.00% (a 2.00% annual rate) of the net assets of Class A as of the end of each month, which differs from the Class D monthly ongoing selling agent fee of 1/12 of 0.75% (a 0.75% annual rate) of the net assets of Class D as of the end of each month. Class Z Redeemable Units are not subject to a monthly ongoing selling agent fee.
Millburn, Ospraie and Pan directly trade the Partnership’s assets allocated to each Advisor through managed accounts in the name of the Partnership pursuant to Millburn’s Commodity Program, Ospraie’s Commodity Program and Pan’s Energy Trading Program, respectively.
The Partnership will be liquidated upon the first to occur of the following: December 31, 2055; the net asset value per Redeemable Unit decreases to less than $400 as of a close of any business day; or under certain other circumstances as set forth in the limited partnership agreement of the Partnership, as may be amended or restated from time to time (the “Limited Partnership Agreement”). In addition, the General Partner may, in its sole discretion, cause the Partnership to dissolve if the Partnership’s aggregate net assets decline to less than $1,000,000.
The General Partner has delegated certain administrative functions to SS&C Technologies, Inc., a Delaware corporation, currently doing business as SS&C GlobeOp (the “Administrator”). Pursuant to a master services agreement, the Administrator furnishes certain administrative, accounting, regulatory reporting, tax and other services as agreed from time to time. In addition, the Administrator maintains certain books and records of the Partnership. The cost of retaining the Administrator is allocated among the pools operated by the General Partner, including the Partnership.
| 2. | Basis of Presentation and Summary of Significant Accounting Policies: |
| a. | Use of Estimates. The preparation of financial statements and accompanying notes in conformity with accounting principles generally accepted in the United States of America (“GAAP”) requires the General Partner to make estimates and assumptions that affect the reported amounts of assets and liabilities, income and expenses, and related disclosures of contingent assets and liabilities in the financial statements and accompanying notes. As a result, actual results could differ from these estimates, and those differences could be material. |
| b. | Profit Allocation. The General Partner and each limited partner of the Partnership share in the profits and losses of the Partnership in proportion to the amount of Partnership interest owned by each, except that no limited partner is liable for obligations of the Partnership in excess of its capital contribution and profits, if any, net of distributions or redemptions and losses, if any. |
| c. | Statement of Cash Flows. The Partnership has not provided a Statement of Cash Flows, as permitted by Accounting Standards Codification (“ASC”) 230, “Statement of Cash Flows.” The Statements of Changes in Partners’ Capital is included herein, and as of and for the years ended December 31, 2019, 2018 and 2017, the Partnership carried no debt and all of the Partnership’s and the Funds’ investments were carried at fair value and classified as Level 1 or Level 2 measurements. |
Ceres Tactical Commodity L.P.
Notes to Financial Statements
| d. | Partnership’s Investment in the Funds. The Partnership carries its investment in the Funds based on the Partnership’s (1) net contribution to the Funds and (2) its allocated share of the undistributed profits and losses, including realized gains or losses and net change in unrealized gains or losses, of the Funds. |
| e. | Partnership’s/Funds’ Derivative Investments. All commodity interests held by the Partnership/Funds, including derivative financial instruments and derivative commodity instruments, are held for trading purposes. The commodity interests are recorded on the trade date and open contracts are recorded at fair value (as described in Note 5, “Fair Value Measurements”) at the measurement date. Investments in commodity interests denominated in foreign currencies are translated into U.S. dollars at the exchange rates prevailing at the measurement date. Gains or losses are realized when contracts are liquidated and are determined using the first-in, first-out method. Net unrealized gains or losses on open contracts are included as a component of equity in trading account in the Partnership’s/Funds’ Statements of Financial Condition. Net realized gains or losses and net change in unrealized gains or losses are included in the Partnership’s/Funds’ Statements of Income and Expenses. |
The Partnership/Funds do not isolate the portion of the results of operations arising from the effect of changes in foreign exchange rates on investments due to fluctuations from changes in market prices of investments held. Such fluctuations are included in total trading results in the Partnership’s/Funds’ Statements of Income and Expenses.
| f. | Partnership’s Cash. The Partnership’s restricted and unrestricted cash includes cash denominated in foreign currencies of $447,427 (cost of $437,431) and ($142,547) (proceeds of $141,947) as of December 31, 2019 and 2018, respectively. |
| g. | Income Taxes. Income taxes have not been recorded as each partner is individually liable for the taxes, if any, on its share of the Partnership’s income and expenses. The Partnership follows the guidance of ASC 740, “Income Taxes,” which prescribes a recognition threshold and measurement attribute for financial statement recognition and measurement of tax positions taken or expected to be taken in the course of preparing the Partnership’s tax returns to determine whether the tax positions are “more-likely-than-not” of being sustained “when challenged” or “when examined” by the applicable tax authority. Tax positions determined not to meet the more-likely-than-not threshold would be recorded as a tax benefit or liability in the Partnership’s Statements of Financial Condition for the current year. If a tax position does not meet the minimum statutory threshold to avoid the incurring of penalties, an expense for the amount of the statutory penalty and interest, if applicable, shall be recognized in the Partnership’s Statements of Income and Expenses in the years in which the position is claimed or expected to be claimed. The General Partner has concluded that there are no significant uncertain tax positions that would require recognition in the financial statements. The Partnership files U.S. federal and various state and local tax returns. No income tax returns are currently under examination. The 2016 through 2019 tax years remain subject to examination by U.S. federal and most state tax authorities. |
| h. | Investment Company Status. The Partnership has adopted Accounting Standards Update 2013-08, “Financial Services — Investment Companies (Topic 946): Amendments to the Scope, Measurement and Disclosure Requirements” and based on the General Partner’s assessment, the Partnership has been deemed to be an investment company since inception. Accordingly, the Partnership follows the investment company accounting and reporting guidance of Topic 946 and reflects its investments at fair value with unrealized gains and losses resulting from changes in fair value reflected in the Partnership’s Statements of Income and Expenses. |
| i. | Net Income (Loss) per Redeemable Unit. Net income (loss) per Redeemable Unit for each Class is calculated in accordance with ASC 946, “Financial Services — Investment Companies.” See Note 8, “Financial Highlights.” |
Ceres Tactical Commodity L.P.
Notes to Financial Statements
| 3. | Agreements: |
| a. | Limited Partnership Agreement: |
The General Partner administers the business and affairs of the Partnership, including selecting one or more advisors to make trading decisions for the Partnership. As of December 31, 2019, the Partnership paid the General Partner a monthly General Partner fee in return for its services to the Partnership equal to 1/12 of 0.75% (0.75% per year) of month-end net assets per Class, for each outstanding Class of the Partnership. Prior to January 1, 2019, the Partnership paid the General Partner a monthly General Partner fee in return for its services to the Partnership equal to 1/12 of 1% (1% per year) of month-end net assets per Class, for each outstanding Class of the Partnership. Month-end net assets per Class, for the purpose of calculating the General Partner fee are Net Assets, as defined in the Limited Partnership Agreement, prior to the reduction of the current month’s management fee, incentive fee accrual, the General Partner fee and any redemptions or distributions as of the end of such month. This fee may be increased or decreased at the discretion of the General Partner.
| b. | Management Agreement: |
The General Partner, on behalf of the Partnership, entered into management agreements (each, a “Management Agreement”) with the Advisors. The Advisors are not affiliated with one another, are not affiliated with the General Partner or MS&Co. and are not responsible for the organization or operation of the Partnership. The Partnership pays Millburn a monthly management fee equal to 1/12 of 2.0% (2.0% per year) of month-end Net Assets per Class, for each outstanding Class, allocated to Millburn. The Partnership pays Ospraie a monthly management fee equal to 1/12 of 1.5% (1.5% per year) of month-end Net Assets per Class, for each outstanding Class, allocated to Ospraie. The Partnership pays Aquantum a monthly management fee equal to 1/12 of 1.25% (1.25% per year) of month-end Net Assets per Class, for each outstanding Class, allocated to Aquantum. The Partnership pays Pan a monthly management fee equal to 1/12 of 1.25% (1.25% per year) of month-end Net Assets per Class, for each outstanding Class, allocated to Pan. The Partnership pays Northlander a monthly management fee equal to 1/12 of 1.25% (1.25% per year) of month-end Net Assets per Class, for each outstanding Class, allocated to Northlander. Prior to its termination on November 30, 2018, Aventis was paid a monthly management fee equal to 1/12 of 1.25% (1.25% per year) of month-end Net Assets per Class, for each outstanding Class, allocated to Aventis. Prior to its termination on March 31, 2019, Harbour Square was paid a monthly management fee equal to 1/12 of 1.15% (1.15% per year) of month-end Net Assets per Class, for each outstanding Class, allocated to Harbour Square. Month-end Net Assets, for the purpose of calculating management fees are Net Assets per Class, for each outstanding Class, as defined in the Limited Partnership Agreement, prior to the reduction of the current month’s management fee, incentive fee accrual, the General Partner fee and any redemptions or distributions as of the end of such month.
In addition, the Partnership is obligated to pay each Advisor an incentive fee. The Partnership pays Millburn, Ospraie and Northlander each an incentive fee, payable annually, equal to 20% of New Trading Profits, as defined in each Management Agreement, earned by the relevant Advisor for the Partnership during each calendar year. The Partnership pays Aquantum a semi-annual incentive fee of 20% of New Trading Profits, as defined in the Management Agreement, earned by Aquantum for the Partnership each calendar half-year. The Partnership pays Pan a quarterly incentive fee of 20% of New Trading Profits, as defined in the Management Agreement, earned by Pan for the Partnership each quarter. Prior to its termination on November 30, 2018, Aventis was eligible to receive an incentive fee, payable quarterly, equal to 20% of New Trading Profits, as defined in the Management Agreement. Prior to its termination on March 31, 2019, Harbour Square was eligible to receive an incentive fee, payable quarterly, equal to 20% of New Trading Profits, as defined in the Management Agreement. An Advisor’s incentive fee is allocated proportionally to each Class based on the net asset value of the respective Class. To the extent an Advisor incurs a loss for the Partnership, the Advisor will not be paid an incentive fee until the Advisor recovers the net loss incurred and earns additional new trading profits for the Partnership. Each Management Agreement can be terminated upon notice by either party.
Ceres Tactical Commodity L.P.
Notes to Financial Statements
In allocating substantially all of the assets of the Partnership among the Advisors, the General Partner considers, among other factors, the Advisors’ past performance, trading style, volatility of markets traded and fee requirements. The General Partner may modify or terminate the allocation of assets among the Advisors and may allocate assets to additional advisors at any time.
| c. | Customer Agreement: |
The Partnership has entered into a customer agreement with MS&Co. (the “Partnership Customer Agreement”). Under the Partnership Customer Agreement, the Partnership pays trading fees for the clearing and, where applicable, the execution of transactions, as well as exchange, user, give-up, floor brokerage and National Futures Association fees (collectively, the “clearing fees”) directly and indirectly through its investment in the Funds. Clearing fees are allocated to the Partnership based on its proportionate share of each Fund. Clearing fees are also borne directly by the Partnership for its direct trading. Clearing fees will be paid for the life of the Partnership, although the rate at which such fees are paid may be changed. All of the Partnership’s assets available for trading in commodity interests not held in the Funds’ accounts at MS&Co. are deposited in the Partnership’s accounts at MS&Co. The Partnership’s cash deposited by MS&Co. is held in segregated bank accounts to the extent required by Commodity Futures Trading Commission regulations. The Partnership’s restricted cash is equal to the cash portion of assets on deposit to meet margin requirements, as determined by the exchange or counterparty, and required by MS&Co. At December 31, 2019 and 2018, the amount of cash held for margin requirements was $5,558,690 and $7,608,136, respectively. Cash that is not classified as restricted cash is therefore classified as unrestricted cash. MS&Co. has agreed to pay the Partnership interest on 100% of the average daily equity maintained in cash in the Partnership’s (or the Partnership’s allocable portion of the Funds’) brokerage account at the rate equal to the monthly average of the 4-week U.S. Treasury bill discount rate. The Partnership Customer Agreement may generally be terminated upon notice by either party.
| d. | Selling Agreement: |
The Partnership has entered into a selling agreement (the “Selling Agreement”) with Morgan Stanley Wealth Management. Pursuant to the Selling Agreement, the Partnership pays Morgan Stanley Wealth Management a monthly ongoing selling agent fee equal to (i) 2.0% per year of month-end Net Assets of Class A Redeemable Units and (ii) 0.75% per year of month-end Net Assets of Class D Redeemable Units. The ongoing selling agent fee received by Morgan Stanley Wealth Management is shared with the properly registered or exempted financial advisors of Morgan Stanley Wealth Management who have sold Class A and Class D Redeemable Units in the Partnership. Class Z Redeemable Units are not subject to a monthly ongoing selling agent fee. Month-end Net Assets, for the purpose of calculating ongoing selling agent fees are Net Assets, as defined in the Limited Partnership Agreement, prior to the reduction of the current month’s ongoing selling agent fee, management fee, incentive fee accrual, the General Partner fee and other expenses and any redemptions or distributions as of the end of such month.
| 4. | Trading Activities: |
The Partnership was formed for the purpose of trading contracts in a variety of commodity interests, including derivative financial instruments and derivative commodity interests. The results of the Partnership’s trading activities are shown in the Statements of Income and Expenses. The Partnership also invests certain of its assets through a “master/feeder” structure. The Partnership’s pro-rata share of the results of the Funds’ trading activities is shown in the Partnership’s Statements of Income and Expenses.
The Partnership Customer Agreement and the Funds’ futures brokerage account agreements with MS&Co. (the “Master Customer Agreements” and, together with the Partnership Customer Agreement, the “Customer Agreements”) give the Partnership and the Funds, respectively, the legal right to net unrealized gains and losses on open futures and forward contracts in their respective Statements of Financial Condition. The Partnership and the Funds net, for financial reporting purposes, the unrealized gains and losses on open futures and open forward contracts in their respective Statements of Financial Condition, as the criteria under ASC 210-20, “Balance Sheet,” have been met.
Ceres Tactical Commodity L.P.
Notes to Financial Statements
All of the commodity interests owned directly by the Partnership are held for trading purposes. All of the commodity interests owned by the Funds are held for trading purposes. The monthly average number of futures contracts traded directly by the Partnership during the years ended December 31, 2019 and 2018 was 26,471 and 4,091, respectively. The monthly average number of metals forward contracts traded directly by the Partnership during the years ended December 31, 2019 and 2018 was 1,538 and 1,035, respectively. The monthly average number of option contracts traded directly by the Partnership during the years ended December 31, 2019 and 2018 was 2,251 and 1,205, respectively.
Trading and transaction fees are based on the number of trades executed by the Advisors for the Partnership/Funds and the Partnership’s respective percentage ownership of each Fund.
All clearing fees paid to MS&Co. for direct trading are borne directly by the Partnership. In addition, clearing fees are borne by the Funds for indirect trading and allocated to the Funds’ limited partners/members, including the Partnership.
The following tables summarize the gross and net amounts recognized relating to assets and liabilities of the Partnership’s derivatives and their offsetting subject to master netting arrangements or similar agreements as of December 31, 2019 and 2018, respectively.
| Gross Amounts | Amounts | Gross Amounts Not Offset in the | ||||||||||||||||||||||
| Offset in the | Presented in the | Statements of Financial Condition | ||||||||||||||||||||||
| Gross | Statements of | Statements of | Cash Collateral | |||||||||||||||||||||
| Amounts | Financial | Financial | Financial | Received/ | ||||||||||||||||||||
| December 31, 2019 |
Recognized | Condition | Condition | Instruments | Pledged* | Net Amount | ||||||||||||||||||
| Assets |
||||||||||||||||||||||||
| Futures |
$ | 12,487,330 | $ | (9,382,711) | $ | 3,104,619 | $ | - | $ | - | $ | 3,104,619 | ||||||||||||
| Forwards |
3,736,333 | (3,480,664) | 255,669 | - | - | 255,669 | ||||||||||||||||||
|
|
|
|
|
|
|
|
|
|
|
|
|
|||||||||||||
| Total assets |
$ | 16,223,663 | $ | (12,863,375) | $ | 3,360,288 | $ | - | $ | - | $ | 3,360,288 | ||||||||||||
|
|
|
|
|
|
|
|
|
|
|
|
|
|||||||||||||
| Liabilities |
||||||||||||||||||||||||
| Futures |
$ | (9,382,711) | $ | 9,382,711 | $ | - | $ | - | $ | - | $ | - | ||||||||||||
| Forwards |
(3,480,664) | 3,480,664 | - | - | - | - | ||||||||||||||||||
|
|
|
|
|
|
|
|
|
|
|
|
|
|||||||||||||
| Total liabilities |
$ | (12,863,375) | $ | 12,863,375 | $ | - | $ | - | $ | - | $ | - | ||||||||||||
|
|
|
|
|
|
|
|
|
|
|
|
|
|||||||||||||
| Net fair value |
$ | 3,360,288 | * | |||||||||||||||||||||
|
|
|
|||||||||||||||||||||||
Ceres Tactical Commodity L.P.
Notes to Financial Statements
| Gross Amounts | Amounts | Gross Amounts Not Offset in the | ||||||||||||||||||||||
| Offset in the | Presented in the | Statements of Financial Condition | ||||||||||||||||||||||
| Gross | Statements of | Statements of | Cash Collateral | |||||||||||||||||||||
| Amounts | Financial | Financial | Financial | Received/ | ||||||||||||||||||||
| December 31, 2018 |
Recognized | Condition | Condition | Instruments | Pledged* | Net Amount | ||||||||||||||||||
| Assets |
||||||||||||||||||||||||
| Futures |
$ | 6,579,887 | $ | (4,822,376) | $ | 1,757,511 | $ | - | $ | - | $ | 1,757,511 | ||||||||||||
| Forwards |
2,203,511 | (2,203,511) | - | - | - | - | ||||||||||||||||||
|
|
|
|
|
|
|
|
|
|
|
|
|
|||||||||||||
| Total assets |
$ | 8,783,398 | $ | (7,025,887) | $ | 1,757,511 | $ | - | $ | - | $ | 1,757,511 | ||||||||||||
|
|
|
|
|
|
|
|
|
|
|
|
|
|||||||||||||
| Liabilities |
||||||||||||||||||||||||
| Futures |
$ | (4,822,376) | $ | 4,822,376 | $ | - | $ | - | $ | - | $ | - | ||||||||||||
| Forwards |
(2,567,628) | 2,203,511 | (364,117) | - | 364,117 | - | ||||||||||||||||||
|
|
|
|
|
|
|
|
|
|
|
|
|
|||||||||||||
| Total liabilities |
$ | (7,390,004) | $ | 7,025,887 | $ | (364,117) | $ | - | $ | 364,117 | $ | - | ||||||||||||
|
|
|
|
|
|
|
|
|
|
|
|
|
|||||||||||||
| Net fair value |
$ | 1,757,511 | * | |||||||||||||||||||||
|
|
|
|||||||||||||||||||||||
* In the event of default by the Partnership, MS&Co., the Partnership’s commodity futures broker and the sole counterparty to the Partnership’s non-exchange-traded contracts, as applicable, has the right to offset the Partnership’s obligation with the Partnership’s cash and/or U.S. Treasury bills held by MS&Co., thereby minimizing MS&Co.’s risk of loss. In certain instances, MS&Co. may not post collateral and as such, in the event of default by MS&Co., the Partnership is exposed to the amount shown in the Statements of Financial Condition. In the case of exchange-traded contracts, the Partnership’s exposure to counterparty risk may be reduced since the exchange’s clearinghouse interposes its credit between buyer and seller and the clearinghouse’s guarantee funds may be available in the event of a default.
Ceres Tactical Commodity L.P.
Notes to Financial Statements
The following tables indicate the gross fair values of derivative instruments of futures, forward and option contracts held directly by the Partnership as separate assets and liabilities as of December 31, 2019 and 2018, respectively.
| December 31, 2019 |
||||
| Assets |
||||
| Futures Contracts |
||||
| Energy |
$ | 11,219,295 | ||
| Grains |
282,619 | |||
| Indices |
322,626 | |||
| Livestock |
25,050 | |||
| Metals |
320,318 | |||
| Softs |
317,422 | |||
|
|
|
|||
| Total unrealized appreciation on open futures contracts |
12,487,330 | |||
|
|
|
|||
| Liabilities |
||||
| Futures Contracts |
||||
| Energy |
(8,488,165) | |||
| Grains |
(265,319) | |||
| Indices |
(354,176) | |||
| Livestock |
(3,800) | |||
| Metals |
(30,403) | |||
| Softs |
(240,848) | |||
|
|
|
|||
| Total unrealized depreciation on open futures contracts |
(9,382,711) | |||
|
|
|
|||
| Net unrealized appreciation on open futures contracts |
$ | 3,104,619 | * | |
|
|
|
|||
| Assets |
||||
| Forward Contracts |
||||
| Metals |
$ | 3,736,333 | ||
|
|
|
|||
| Total unrealized appreciation on open forward contracts |
3,736,333 | |||
|
|
|
|||
| Liabilities |
||||
| Forward Contracts |
||||
| Metals |
(3,480,664) | |||
|
|
|
|||
| Total unrealized depreciation on open forward contracts |
(3,480,664) | |||
|
|
|
|||
| Net unrealized appreciation on open forward contracts |
$ | 255,669 | ** | |
|
|
|
|||
| Assets |
||||
| Options Purchased |
||||
| Energy |
$ | 227,405 | ||
| Metals |
80,879 | |||
|
|
|
|||
| Total options purchased |
$ | 308,284 | *** | |
|
|
|
|||
| Liabilities |
||||
| Options Written |
||||
| Energy |
$ | (89,056) | ||
| Metals |
(80,879) | |||
|
|
|
|||
| Total options written |
$ | (169,935) | **** | |
|
|
|
|||
| * | This amount is in “Net unrealized appreciation on open futures contracts” in the Statements of Financial Condition. |
| ** | This amount is in “Net unrealized appreciation on open forward contracts” in the Statements of Financial Condition. |
| *** | This amount is in “Options purchased, at fair value” in the Statements of Financial Condition. |
| **** | This amount is in “Options written, at fair value” in the Statements of Financial Condition. |
Ceres Tactical Commodity L.P.
Notes to Financial Statements
| December 31, 2018 |
||||
| Assets |
||||
| Futures Contracts |
||||
| Currencies |
$ | 14,578 | ||
| Energy |
5,628,038 | |||
| Grains |
157,540 | |||
| Livestock |
317,100 | |||
| Metals |
125,934 | |||
| Softs |
336,697 | |||
|
|
|
|||
| Total unrealized appreciation on open futures contracts |
6,579,887 | |||
|
|
|
|||
| Liabilities |
||||
| Futures Contracts |
||||
| Currencies |
(1,159) | |||
| Energy |
(3,938,643) | |||
| Grains |
(66,943) | |||
| Livestock |
(252,835) | |||
| Metals |
(295,124) | |||
| Softs |
(267,672) | |||
|
|
|
|||
| Total unrealized depreciation on open futures contracts |
(4,822,376) | |||
|
|
|
|||
| Net unrealized appreciation on open futures contracts |
$ | 1,757,511 | * | |
|
|
|
|||
| Assets |
||||
| Forward Contracts |
||||
| Metals |
$ | 2,203,511 | ||
|
|
|
|||
| Total unrealized appreciation on open forward contracts |
2,203,511 | |||
|
|
|
|||
| Liabilities |
||||
| Forward Contracts |
||||
| Metals |
(2,567,628) | |||
|
|
|
|||
| Total unrealized depreciation on open forward contracts |
(2,567,628) | |||
|
|
|
|||
| Net unrealized depreciation on open forward contracts |
$ | (364,117) | ** | |
|
|
|
|||
| Assets |
||||
| Options Purchased |
||||
| Energy |
$ | 35,640 | ||
| Grains |
27,500 | |||
| Livestock |
19,620 | |||
| Metals |
222,454 | |||
|
|
|
|||
| Total options purchased |
$ | 305,214 | *** | |
|
|
|
|||
| Liabilities |
||||
| Options Written |
||||
| Energy |
$ | (34,760) | ||
| Livestock |
(17,820) | |||
| Metals |
(239,069) | |||
| Softs |
(117,922) | |||
|
|
|
|||
| Total options written |
$ | (409,571) | **** | |
|
|
|
|||
| * | This amount is in “Net unrealized appreciation on open futures contracts” in the Statements of Financial Condition. |
| ** | This amount is in “Net unrealized depreciation on open forward contracts” in the Statements of Financial Condition. |
| *** | This amount is in “Options purchased, at fair value” in the Statements of Financial Condition. |
| **** | This amount is in “Options written, at fair value” in the Statements of Financial Condition. |
Ceres Tactical Commodity L.P.
Notes to Financial Statements
The following table indicates the trading gains and losses, by market sector, on derivative instruments traded directly by the Partnership for the years ended December 31, 2019 and 2018, respectively. During the year ended December 31, 2017, no derivative instruments were traded directly by the Partnership.
| Sector |
2019 | 2018 | ||||||
| Currencies |
$ | 102,185 | $ | (361,231) | ||||
| Energy |
8,018,754 | 5,468,819 | ||||||
| Grains |
896,448 | 147,389 | ||||||
| Indices |
56,860 | - | ||||||
| Interest Rates Non-U.S. |
- | 17,430 | ||||||
| Livestock |
1,749,339 | 570,324 | ||||||
| Metals |
117,352 | (865,848) | ||||||
| Softs |
1,407,812 | 1,148,562 | ||||||
|
|
|
|
|
|||||
| Total |
$ | 12,348,750 | ***** | $ | 6,125,445 | ***** | ||
|
|
|
|
|
|||||
| ***** | This amount is included in “Total trading results” in the Statements of Income and Expenses. |
| 5. | Fair Value Measurements: |
Partnership’s and the Funds’ Fair Value Measurements. Fair value is defined as the value that would be received to sell an asset or paid to transfer a liability in an orderly transaction between market participants at the measurement date under current market conditions. The fair value hierarchy gives the highest priority to unadjusted quoted prices in active markets for identical assets or liabilities (Level 1) and the lowest priority to fair values derived from unobservable inputs (Level 3). The level in the fair value hierarchy within which the fair value measurement in its entirety falls shall be determined based on the lowest level input that is significant to the fair value measurement in its entirety.
The fair value of exchange-traded futures, option and forward contracts is determined by the various exchanges, and reflects the settlement price for each contract as of the close of business on the last business day of the reporting period. The fair value of foreign currency forward contracts is extrapolated on a forward basis from the spot prices quoted as of approximately 3:00 P.M. (E.T.) on the last business day of the reporting period from various exchanges. The fair value of non-exchange-traded foreign currency option contracts is calculated by applying an industry standard model application for options valuation of foreign currency options, using as inputs the spot prices, interest rates, and option implied volatilities quoted as of approximately 3:00 P.M. (E.T.) on the last business day of the reporting period. U.S. Treasury bills are valued at the last available bid price received from independent pricing services as of the close of the last business day of the reporting period.
The Partnership and the Funds consider prices for commodity futures, swap and option contracts to be based on unadjusted quoted prices in active markets for identical assets and liabilities (Level 1). The values of U.S. Treasury bills, non-exchange-traded forward, swap and certain option contracts for which market quotations are not readily available are priced by pricing services that derive fair values for those assets and liabilities from observable inputs (Level 2). As of and for the years ended December 31, 2019 and 2018, the Partnership and the Funds did not hold any derivative instruments that were priced at fair value using unobservable inputs through the application of the General Partner’s assumptions and internal valuation pricing models (Level 3).
Ceres Tactical Commodity L.P.
Notes to Financial Statements
| December 31, 2019 |
Total | Level 1 | Level 2 | Level 3 | ||||||||||||
| Assets |
||||||||||||||||
| Futures |
$ | 12,487,330 | $ | 12,487,330 | $ | - | $ | - | ||||||||
| Forwards |
3,736,333 | - | 3,736,333 | - | ||||||||||||
| Options purchased |
308,284 | 308,284 | - | - | ||||||||||||
|
|
|
|
|
|
|
|
|
|||||||||
| Total assets |
$ | 16,531,947 | $ | 12,795,614 | $ | 3,736,333 | $ | - | ||||||||
|
|
|
|
|
|
|
|
|
|||||||||
| Liabilities |
||||||||||||||||
| Futures |
$ | 9,382,711 | $ | 9,382,711 | $ | - | $ | - | ||||||||
| Forwards |
3,480,664 | - | 3,480,664 | - | ||||||||||||
| Options written |
169,935 | 169,935 | - | - | ||||||||||||
|
|
|
|
|
|
|
|
|
|||||||||
| Total liabilities |
$ | 13,033,310 | $ | 9,552,646 | $ | 3,480,664 | $ | - | ||||||||
|
|
|
|
|
|
|
|
|
|||||||||
| December 31, 2018 |
Total | Level 1 | Level 2 | Level 3 | ||||||||||||
| Assets |
||||||||||||||||
| Futures |
$ | 6,579,887 | $ | 6,579,887 | $ | - | $ | - | ||||||||
| Forwards |
2,203,511 | - | 2,203,511 | - | ||||||||||||
| Options purchased |
305,214 | 305,214 | - | - | ||||||||||||
|
|
|
|
|
|
|
|
|
|||||||||
| Total assets |
$ | 9,088,612 | $ | 6,885,101 | $ | 2,203,511 | $ | - | ||||||||
|
|
|
|
|
|
|
|
|
|||||||||
| Liabilities |
||||||||||||||||
| Futures |
$ | 4,822,376 | $ | 4,822,376 | $ | - | $ | - | ||||||||
| Forwards |
2,567,628 | - | 2,567,628 | - | ||||||||||||
| Options written |
409,571 | 409,571 | - | - | ||||||||||||
|
|
|
|
|
|
|
|
|
|||||||||
| Total liabilities |
$ | 7,799,575 | $ | 5,231,947 | $ | 2,567,628 | $ | - | ||||||||
|
|
|
|
|
|
|
|
|
|||||||||
| 6. | Investment in the Funds: |
On April 1, 2019, the Partnership allocated a portion of its assets to NL Master, a limited liability company organized under the limited liability company laws of the State of Delaware. NL Master permits accounts managed by Northlander using Northlander’s Commodity Program, a proprietary, discretionary trading system, to invest together in one trading vehicle. The General Partner is also the trading manager of NL Master. Individual and pooled accounts currently managed by Northlander, including the Partnership, are permitted to be members of NL Master. The Trading Manager and Northlander believe that trading through this master/feeder structure should promote efficiency and economy in the trading process.
On December 1, 2018, the Partnership allocated a portion of its assets to Aquantum, which were managed and traded directly by Aquantum pursuant to Aquantum’s Commodity Spread Program through a trading account in the Partnership’s name from December 1, 2018 until May 31, 2019. Effective June 1, 2019, the assets allocated to Aquantum were transferred into Aquantum Master, a limited liability company organized under the limited liability company laws of the State of Delaware, through which they are managed and traded by Aquantum pursuant to the same strategy. Aquantum Master permits accounts managed by Aquantum using Aquantum’s Commodity Spread Program, a proprietary, systematic trading system, to invest together in one trading vehicle. The General Partner is also the trading manager of Aquantum Master. Individual and pooled accounts currently managed by Aquantum, including the Partnership, are permitted to be members of Aquantum Master. The Trading Manager and Aquantum believe that trading through this master/feeder structure should promote efficiency and economy in the trading process.
Ceres Tactical Commodity L.P.
Notes to Financial Statements
On February 1, 2013, the Partnership allocated substantially all of its capital to MB Master, a limited partnership organized under the partnership laws of the State of Delaware. Effective November 30, 2018, the Partnership fully redeemed its investment in MB Master.
On January 1, 2018, the Partnership allocated a portion of its assets to Harbour Square Master, a limited liability company organized under the limited liability company laws of the State of Delaware. Harbour Square Master permitted accounts managed by Harbour Square using Harbour Square’s Discretionary Energy Program, a proprietary, discretionary trading system, to invest together in one trading vehicle. Effective March 31, 2019, the Partnership fully redeemed its investment in Harbour Square Master.
The General Partner is not aware of any material changes to the trading programs discussed above or in Note 1, “Organization” during the year ended December 31, 2019.
The Partnership’s/Funds’ trading of futures, forward, swap and option contracts, if applicable, on commodities is done primarily on U.S. commodity exchanges and foreign commodity exchanges. The Partnership/Funds engage in such trading through commodity brokerage accounts maintained with MS&Co.
Generally, a limited partner/member in the Funds withdraws all or part of its capital contribution and undistributed profits, if any, from the Funds as of the end of any month (the “Redemption Date”) after a request has been made to the General Partner/Trading Manager at least three days in advance of the Redemption Date. Such withdrawals are classified as a liability when the limited partner/member elects to redeem and informs the Funds. However, a limited partner/member may request a withdrawal as of the end of any day if such request is received by the General Partner/Trading Manager at least three days in advance of the proposed withdrawal day.
Management fees, General Partner fees, ongoing selling agent fees and incentive fees are charged at the Partnership level. All clearing fees paid to MS&Co. are borne directly by the Partnership for its direct trading. In addition, clearing fees are borne by the Funds and allocated to the Funds’ limited partners/members, including the Partnership. Professional fees are borne by the Funds and allocated to the Partnership, and are also charged directly at the Partnership level.
At December 31, 2019, the Partnership owned approximately 20.4% of NL Master and 43.1% of Aquantum Master. At December 31, 2018, the Partnership owned approximately 68.7% of Harbour Square Master. It is the Partnership’s intention to continue to invest in the Funds. The performance of the Partnership is directly affected by the performance of the Funds. Expenses to limited partners as a result of the investment in the Funds are approximately the same as they would be if the Partnership traded directly and redemption rights are not affected.
Summarized information reflecting the total assets, liabilities and partners’/members’ capital of the Funds is shown in the following tables:
| December 31, 2019 | ||||||||||||
| Total Assets | Total Liabilities | Total Capital | ||||||||||
| NL Master |
$ | 22,919,671 | $ | 1,217,801 | $ | 21,701,870 | ||||||
| Aquantum Master |
37,857,547 | 2,327,205 | 35,530,342 | |||||||||
| December 31, 2018 | ||||||||||||
| Total Assets | Total Liabilities | Total Capital | ||||||||||
| Harbour Square Master |
$ | 10,504,910 | $ | 2,532,233 | $ | 7,972,677 | ||||||
Ceres Tactical Commodity L.P.
Notes to Financial Statements
Summarized information reflecting the net investment income (loss), total trading results and net income (loss) of the Funds is shown in the following tables:
| For the year ended December 31, 2019 | ||||||||||||
| Net Investment
Income (Loss) |
Total Trading
Results |
Net Income (Loss) | ||||||||||
| Harbour Square Master(a) |
$ | (14,678) | $ | 160,848 | $ | 146,170 | ||||||
| NL Master(b) |
152,833 | (6,328,890) | (6,176,057) | |||||||||
| Aquantum Master(c) |
(121,296) | (4,828,049) | (4,949,345) | |||||||||
| For the year ended December 31, 2018 | ||||||||||||
| Net Investment
Income (Loss) |
Total Trading Results |
Net Income (Loss) | ||||||||||
| MB Master(d) |
$ | 52,415 | $ | (951,117) | $ | (898,702) | ||||||
| Harbour Square Master |
244,803 | 416,882 | 661,685 | |||||||||
| (a) | From January 1, 2019 through March 31, 2019, the date Harbour Square Master terminated operations. |
| (b) | From April 1, 2019, commencement of operations for NL Master, through December 31, 2019. |
| (c) | From June 1, 2019, commencement of operations for Aquantum Master, through December 31, 2019. |
| (d) | Summarized information presented is for the twelve months ended December 31, 2018. The Partnership was invested in MB Master from January 1, 2018 to November 30, 2018. |
Summarized information reflecting the Partnership’s investments in and the Partnership’s pro-rata share of the results of operations of the Funds is shown in the following tables:
| December 31, 2019 | For the year ended December 31, 2019 | |||||||||||||||||||||||||||||||
| % of | Expenses | Net | ||||||||||||||||||||||||||||||
| Partners’ | Fair | Income | Clearing | Professional | Income | Investment | Redemptions | |||||||||||||||||||||||||
| Funds |
Capital | Value | (Loss) | Fees | Fees | (Loss) | Objective | Permitted | ||||||||||||||||||||||||
| Harbour Square Master(a) |
- % | $ | - | $ | 141,964 | $ | 7,656 | $ | 29,566 | $ | 104,742 | Commodity Portfolio | Monthly | |||||||||||||||||||
| NL Master(b) |
4.82% | 4,427,510 | (1,327,556) | 19,738 | 14,904 | (1,362,198) | Commodity Portfolio | Monthly | ||||||||||||||||||||||||
| Aquantum Master(c) |
16.68% | 15,333,418 | (2,172,379) | 239,973 | 33,249 | (2,445,601) | Commodity Portfolio | Monthly | ||||||||||||||||||||||||
|
|
|
|
|
|
|
|
|
|
|
|||||||||||||||||||||||
| Total |
$ | 19,760,928 | $ | (3,357,971) | $ | 267,367 | $ | 77,719 | $ | (3,703,057) | ||||||||||||||||||||||
|
|
|
|
|
|
|
|
|
|
|
|||||||||||||||||||||||
| December 31, 2018 | For the year ended December 31, 2018 | |||||||||||||||||||||||||||||||
| % of | Expenses | Net | ||||||||||||||||||||||||||||||
| Partners’ | Fair | Income | Clearing | Professional | Income | Investment | Redemptions | |||||||||||||||||||||||||
| Funds |
Capital | Value | (Loss) | Fees | Fees | (Loss) | Objective | Permitted | ||||||||||||||||||||||||
| MB Master(d) |
- % | $ | - | $ | (384,502) | $ | 172,975 | $ | 30,426 | $ | (587,903) | Commodity Portfolio | Monthly | |||||||||||||||||||
| Harbour Square Master |
9.43% | 5,489,732 | 571,941 | 74,003 | 41,460 | 456,478 | Commodity Portfolio | Monthly | ||||||||||||||||||||||||
|
|
|
|
|
|
|
|
|
|
|
|||||||||||||||||||||||
| Total |
$ | 5,489,732 | $ | 187,439 | $ | 246,978 | $ | 71,886 | $ | (131,425) | ||||||||||||||||||||||
|
|
|
|
|
|
|
|
|
|
|
|||||||||||||||||||||||
| (a) | From January 1, 2019 through March 31, 2019, the date the Partnership fully redeemed its investment in Harbour Square Master. |
| (b) | From April 1, 2019, the date the Partnership invested into NL Master, through December 31, 2019. |
| (c) | From June 1, 2019, the date the Partnership invested into Aquantum Master, through December 31, 2019. |
| (d) | The Partnership fully redeemed its investment in MB Master as of November 30, 2018. |
Ceres Tactical Commodity L.P.
Notes to Financial Statements
| 7. | Subscriptions, Distributions and Redemptions: |
Subscriptions are accepted monthly from investors who become limited partners on the first day of the month after their subscription is processed. Distributions are made on a pro-rata basis at the sole discretion of the General Partner. No distributions have been made to date. The General Partner does not intend to make any distributions of the Partnership’s profits. A limited partner may require the Partnership to redeem its Redeemable Units at their net asset value per Redeemable Unit as of the end of each month on three business days’ notice to the General Partner. There is no fee charged to limited partners in connection with redemptions.
| 8. | Financial Highlights: |
Financial highlights for the limited partner Classes as a whole for the years ended December 31, 2019, 2018 and 2017 were as follows:
| 2019 | 2018 | 2017 | ||||||||||||||||||||||||||||||||||||||||||||||
| Class A | Class D | Class Z*** | Class A | Class D***** | Class A | |||||||||||||||||||||||||||||||||||||||||||
| Per Redeemable Unit Performance |
| |||||||||||||||||||||||||||||||||||||||||||||||
| Net realized and unrealized gains (losses) |
$ | 111.36 | $ | 87.51 | $ | 90.94 | $ | 115.36 | $ | 36.19 | $ | (1.95) | ||||||||||||||||||||||||||||||||||||
| Net investment loss |
(67.91) | (40.49) | (29.94) | (80.34) | (25.44) | (68.11) | ||||||||||||||||||||||||||||||||||||||||||
|
|
|
|
|
|
|
|
|
|
|
|
|
|||||||||||||||||||||||||||||||||||||
| Increase (decrease) for the period/year |
43.45 | 47.02 | 61.00 | 35.02 | 10.75 | (70.06) | ||||||||||||||||||||||||||||||||||||||||||
| Net asset value per Redeemable Unit, beginning of period/year |
1,300.66 | 1,010.75 | 1,008.04 | 1,265.64 | 1,000.00 | 1,335.70 | ||||||||||||||||||||||||||||||||||||||||||
|
|
|
|
|
|
|
|
|
|
|
|
|
|||||||||||||||||||||||||||||||||||||
| Net asset value per Redeemable Unit, end of period/year |
$ | 1,344.11 | $ | 1,057.77 | $ | 1,069.04 | $ | 1,300.66 | $ | 1,010.75 | $ | 1,265.64 | ||||||||||||||||||||||||||||||||||||
|
|
|
|
|
|
|
|
|
|
|
|
|
|||||||||||||||||||||||||||||||||||||
| 2019 | 2018 | 2017 | ||||||||||||||||||||||
| Class A | Class D | Class Z**** | Class A | Class D****** | Class A | |||||||||||||||||||
| Ratios to Average Limited Partners’ Capital: |
| |||||||||||||||||||||||
| Net investment loss** |
(5.2)% | (3.9)% | (3.0)% | (6.4)% | (4.1)% | (5.4) | % | |||||||||||||||||
|
|
|
|
|
|
|
|
|
|
|
|
|
|||||||||||||
| Operating expenses |
6.1 | % | 4.8 | % | 4.0 | % | 6.5 | % | 5.1 % | 6.2 | % | |||||||||||||
| Incentive fees |
1.0 | % | 1.0 | % | 0.9 | % | 1.6 | % | 1.0 % | - | % | |||||||||||||
|
|
|
|
|
|
|
|
|
|
|
|
|
|||||||||||||
| Total expenses |
7.1 | % | 5.8 | % | 4.9 | % | 8.1 | % | 6.1 % | 6.2 | % | |||||||||||||
|
|
|
|
|
|
|
|
|
|
|
|
|
|||||||||||||
| Total return: |
| |||||||||||||||||||||||
| Total return before incentive fees |
4.4 | % | 5.7 | % | 7.0 | % | 4.4 | % | 2.1 % | (5.2) | % | |||||||||||||
| Incentive fees |
(1.1)% | (1.0)% | (0.9)% | (1.6)% | (1.0)% | - | % | |||||||||||||||||
|
|
|
|
|
|
|
|
|
|
|
|
|
|||||||||||||
| Total return after incentive fees |
3.3 | % | 4.7 | % | 6.1 | % | 2.8 | % | 1.1 % | (5.2) | % | |||||||||||||
|
|
|
|
|
|
|
|
|
|
|
|
|
|||||||||||||
| * | Net investment loss per Redeemable Unit is calculated by dividing the interest income less total expenses by the average number of Redeemable Units outstanding during the period/year. The net realized and unrealized gains (losses) per Redeemable Unit is a balancing amount necessary to reconcile the change in net asset value per Redeemable Unit with the other per unit information. |
| ** | Interest income less total expenses. |
| *** | For the period from February 1, 2019 to December 31, 2019. |
| **** | Annualized (except for incentive fees) and for the period from February 1, 2019 to December 31, 2019. |
| ***** | For the period from July 1, 2018 to December 31, 2018. |
| ****** | Annualized (except for incentive fees) and for the period from July 1, 2018 to December 31, 2018. |
The above ratios and total return may vary for individual investors based on the timing of capital transactions during the year. Additionally, these ratios are calculated for the limited partner Classes using the limited partners’ share of income, expenses and average partner’s capital of the Partnership and include the income and expenses allocated from the Funds.
Ceres Tactical Commodity L.P.
Notes to Financial Statements
| 9. | Financial Instrument Risks: |
In the normal course of business, the Partnership and the Funds are parties to financial instruments with off-balance-sheet risk, including derivative financial instruments and derivative commodity instruments. These financial instruments may include forwards, futures, options and swaps, whose values are based upon an underlying asset, index, or reference rate, and generally represent future commitments to exchange currencies or cash balances, to purchase or sell other financial instruments at specific terms at specified future dates, or, in the case of derivative commodity instruments, to have a reasonable possibility to be settled in cash, through physical delivery or with another financial instrument. These instruments may be traded on an exchange, a swap execution facility or over-the-counter (“OTC”). Exchange-traded instruments include futures and certain standardized forward, swap and option contracts. Specific market movements of commodities or futures contracts underlying an option cannot accurately be predicted. The purchaser of an option may lose the entire premium paid for the option. The writer or seller of an option has unlimited risk. Certain swap contracts may also be traded on a swap execution facility or OTC. OTC contracts are negotiated between contracting parties and also include certain forward and option contracts. Each of these instruments is subject to various risks similar to those related to the underlying financial instruments, including market and credit risk. In general, the risks associated with OTC contracts are greater than those associated with exchange-traded instruments because of the greater risk of default by the counterparty to an OTC contract. None of the Partnership’s/Funds’ contracts are traded OTC, although contracts may be traded OTC in the future.
Futures Contracts. The Partnership and the Funds trade futures contracts. A futures contract is a firm commitment to buy or sell a specified quantity of investments, currency or a standardized amount of a deliverable grade commodity, at a specified price on a specified future date, unless the contract is closed before the delivery date or the delivery quantity is something where physical delivery cannot occur (such as the S&P 500 Index), whereby such contract is settled in cash. Payments (“variation margin”) may be made or received by the Partnership and the Funds each business day, depending on the daily fluctuations in the value of the underlying contracts, and are recorded as unrealized gains or losses by the Partnership and the Funds. When the contract is closed, the Partnership and the Funds record a realized gain or loss equal to the difference between the value of the contract at the time it was opened and the value at the time it was closed. Transactions in futures contracts require participants to make both initial margin deposits of cash or other assets and variation margin deposits, through the futures broker, directly with the exchange on which the contracts are traded. Net realized gains (losses) and net change in unrealized gains (losses) on futures contracts are included in the Partnership’s/Funds’ Statements of Income and Expenses.
London Metal Exchange Forward Contracts. Metal contracts traded on the London Metal Exchange (“LME”) represent a firm commitment to buy or sell a specified quantity of aluminum, copper, lead, nickel, tin, zinc or other metals. LME contracts traded by the Partnership and the Funds are cash settled based on prompt dates published by the LME. Variation margin may be made or received by the Partnership and the Funds each business day, depending on the daily fluctuations in the value of the underlying contracts, and are recorded as unrealized gains or losses by the Partnership and the Funds. A contract is considered offset when all long positions have been matched with a like number of short positions settling on the same prompt date. When the contract is closed at the prompt date, the Partnership and the Funds record a realized gain or loss equal to the difference between the value of the contract at the time it was opened and the value at the time it was closed. Transactions in LME contracts require participants to make both initial margin deposits of cash or other assets and variation margin deposits, through the broker, directly with the LME. Net realized gains (losses) and net change in unrealized gains (losses) on metal contracts are included in the Partnership’s/Funds’ Statements of Income and Expenses.
Options. The Partnership and the Funds may purchase and write (sell) both exchange-listed and OTC options on commodities or financial instruments. An option is a contract allowing, but not requiring, its holder to buy (call) or sell (put) a specific or standard commodity or financial instrument at a specified price during a specified time period. The option premium is the total price paid or received for the option contract. When the Partnership/Funds write an option, the premium received is recorded as a liability in the Partnership’s/Funds’ Statements of Financial Condition and marked-to-market daily. When the Partnership/Funds purchase an option, the premium paid is recorded as an asset in the Partnership’s/Funds’ Statements of Financial Condition and marked-to-market daily. Net realized gains (losses) and net change in unrealized gains (losses) on option contracts are included in the Partnership’s/Funds’ Statements of Income and Expenses.
Ceres Tactical Commodity L.P.
Notes to Financial Statements
As both a buyer and seller of options, the Partnership/Funds pay or receive a premium at the outset and then bear the risk of unfavorable changes in the price of the contract underlying the option. Written options expose the Partnership/Funds to potentially unlimited liability; for purchased options, the risk of loss is limited to the premiums paid. Certain written put options permit cash settlement and do not require the option holder to own the reference asset. The Partnership/Funds do not consider these contracts to be guarantees.
Futures-style options. The Partnership and the Funds may trade futures-style option contracts. Unlike traditional option contracts, the premiums for futures-style option contracts are not received or paid upon the onset of the trade. The premiums are recognized and received or paid as part of the sales price when the contract is closed. Similar to a futures contract, variation margin for the futures-style option contract may be made or received by the Partnership/Funds each business day, depending on the daily fluctuations in the value of the underlying contracts, and are recorded as unrealized gains or losses by the Partnership/Funds. Transactions in futures-style option contracts require participants to make both initial margin deposits of cash or other assets and variation margin deposits, through the futures broker, directly with the exchange on which the contracts are traded. Futures-style option contracts are presented as part of “Net unrealized appreciation on open futures contracts” or “Net unrealized depreciation on open futures contracts,” as applicable, in the Partnership’s/Funds’ Statements of Financial Condition. Net realized gains (losses) and net change in unrealized gains (losses) on futures-style option contracts are included in the Partnership’s/Funds’ Statements of Income and Expenses.
Market risk is the potential for changes in the value of the financial instruments traded by the Partnership/Funds due to market changes, including interest and foreign exchange rate movements and fluctuations in commodity or security prices. Market risk is directly impacted by the volatility and liquidity in the markets in which the related underlying assets are traded. The Partnership and the Funds are exposed to market risk equal to the value of the futures and forward contracts held and unlimited liability on such contracts sold short.
Credit risk is the possibility that a loss may occur due to the failure of a counterparty to perform according to the terms of a contract. The Partnership’s/Funds’ risk of loss in the event of counterparty default is typically limited to the amounts recognized in the Statements of Financial Condition and is not represented by the contract or notional amounts of the instruments. The Partnership’s/Funds’ risk of loss is reduced through the use of legally enforceable master netting agreements with counterparties that permit the Partnership/Funds to offset unrealized gains and losses and other assets and liabilities with such counterparties upon the occurrence of certain events. The Partnership/Funds have credit risk and concentration risk, as MS&Co. or an MS&Co. affiliate are counterparties or brokers with respect to the Partnership’s/Funds’ assets. Credit risk with respect to exchange-traded instruments is reduced to the extent that, through MS&Co. or an MS&Co. affiliate, the Partnership’s/Funds’ counterparty is an exchange or clearing organization.
The General Partner monitors and attempts to mitigate the Partnership’s/Funds’ risk exposure on a daily basis through financial, credit and risk management monitoring systems and, accordingly, believes that it has effective procedures for evaluating and limiting the credit and market risks to which the Partnership/Funds may be subject. These monitoring systems generally allow the General Partner to statistically analyze actual trading results with risk-adjusted performance indicators and correlation statistics. In addition, online monitoring systems provide account analysis of futures, forward and option contracts by sector, margin requirements, gain and loss transactions and collateral positions.
The majority of these financial instruments mature within one year of the inception date. However, due to the nature of the Partnership’s/Funds’ business, these instruments may not be held to maturity.
The risk to the limited partners that have purchased Redeemable Units is limited to the amount of their share of the Partnership’s net assets and undistributed profits. The limited liability is a result of the organization of the Partnership as a limited partnership under New York law.
Ceres Tactical Commodity L.P.
Notes to Financial Statements
In the ordinary course of business, the Partnership/Funds enter into contracts and agreements that contain various representations and warranties and which provide general indemnifications. The Partnership’s/Funds’ maximum exposure under these arrangements cannot be determined, as this could include future claims that have not yet been made against the Partnership/Funds. The General Partner/Trading Manager consider the risk of any future obligation relating to these indemnifications to be remote.
| 10. | Subsequent Events: |
The General Partner evaluates events that occur after the balance sheet date but before and up until financial statements are available to be issued. The General Partner has assessed the subsequent events through the date the financial statements were issued and has determined that there were no subsequent events requiring adjustment to or disclosure in the financial statements.
Selected unaudited quarterly financial data for the Partnership for the years ended December 31, 2019 and 2018 is summarized below:
| For the period from October 1, 2019 to December 31, 2019 |
For the period from July 1, 2019 to September 30, 2019 |
For the period from April 1, 2019 to June 30, 2019 |
For the period from January 1, 2019 to March 31, 2019 |
|||||||||||||
| Total investment income |
$ | 370,428 | $ | 480,574 | $ | 583,414 | $ | 590,301 | ||||||||
| Total expenses |
(2,160,621) | (1,582,390) | (1,576,213) | (2,014,353) | ||||||||||||
| Total trading results |
5,239,438 | (1,155,845) | (34,710) | 4,633,549 | ||||||||||||
|
|
|
|
|
|
|
|
|
|||||||||
| Net income (loss) |
$ | 3,449,245 | $ | (2,257,661) | $ | (1,027,509) | $ | 3,209,497 | ||||||||
|
|
|
|
|
|
|
|
|
|||||||||
| Increase (decrease) in net asset value per Redeemable Unit: |
||||||||||||||||
| Class A |
$ | 47.12 | $ | (29.12) | $ | (13.19) | $ | 38.64 | ||||||||
|
|
|
|
|
|
|
|
|
|||||||||
| Class D |
$ | 40.30 | $ | (19.57) | $ | (7.02) | $ | 33.31 | ||||||||
|
|
|
|
|
|
|
|
|
|||||||||
| Class Z |
$ | 42.69 | $ | (17.78) | $ | (5.09) | $ | 35.39 | ||||||||
|
|
|
|
|
|
|
|
|
|||||||||
| For the period from October 1, 2018 to December 31, 2018 |
For the period from July 1, 2018 to September 30, 2018 |
For the period from April 1, 2018 to June 30, 2018 |
For the period from January 1, 2018 to March 31, 2018 |
|||||||||||||
| Total investment income |
$ | 331,655 | $ | 290,475 | $ | 263,244 | $ | 229,231 | ||||||||
| Total expenses |
(1,375,069) | (1,236,732) | (1,425,916) | (1,148,832) | ||||||||||||
| Total trading results |
1,369,403 | 891,222 | 2,024,781 | 1,632,652 | ||||||||||||
|
|
|
|
|
|
|
|
|
|||||||||
| Net income (loss) |
$ | 325,989 | $ | (55,035) | $ | 862,109 | $ | 713,051 | ||||||||
|
|
|
|
|
|
|
|
|
|||||||||
| Increase (decrease) in net asset value per Redeemable Unit: |
||||||||||||||||
| Class A |
$ | 6.80 | $ | (1.17) | $ | 16.22 | $ | 13.17 | ||||||||
|
|
|
|
|
|
|
|
|
|||||||||
| Class D |
$ | 8.48 | $ | 2.27 | $ | - | $ | - | ||||||||
|
|
|
|
|
|
|
|
|
|||||||||
| Class Z |
$ | 10.42 | $ | 4.17 | $ | 17.49 | $ | 14.99 | ||||||||
|
|
|
|
|
|
|
|
|
|||||||||
61
Item 9. Changes in and Disagreements with Accountants on Accounting and Financial Disclosure. Not applicable.
Item 9A. Controls and Procedures.
The Partnership’s disclosure controls and procedures are designed to ensure that information required to be disclosed by the Partnership on the reports that it files or submits under the Exchange Act is recorded, processed, summarized and reported within the time periods expected in the SEC’s rules and forms. Disclosure controls and procedures include controls and procedures designed to ensure that information required to be disclosed by the Partnership in the reports it files is accumulated and communicated to management, including the President and Chief Financial Officer (“CFO”) of the General Partner, to allow for timely decisions regarding required disclosure and appropriate SEC filings.
The General Partner is responsible for ensuring that there is an adequate and effective process for establishing, maintaining and evaluating disclosure controls and procedures for the Partnership’s external disclosures.
The General Partner’s President and CFO have evaluated the effectiveness of the Partnership’s disclosure controls and procedures (as defined in Rules 13a-15(e) and 15d-15(e) under the Exchange Act) as of December 31, 2019, and, based on that evaluation, the General Partner’s President and CFO have concluded that at that date the Partnership’s disclosure controls and procedures were effective.
The Partnership’s internal control over financial reporting is a process under the supervision of the General Partner’s President and CFO to provide reasonable assurance regarding the reliability of financial reporting and the preparation of financial statements in accordance with GAAP. These controls include policies and procedures that:
● pertain to the maintenance of records that, in reasonable detail, accurately and fairly reflect the transactions and dispositions of the assets of the Partnership;
● provide reasonable assurance that (i) transactions are recorded as necessary to permit preparation of financial statements in accordance with GAAP and (ii) the Partnership’s receipts are handled and expenditures are made only pursuant to authorizations of the General Partner; and
● provide reasonable assurance regarding prevention or timely detection and correction of unauthorized acquisition, use or disposition of the Partnership’s assets that could have a material effect on the financial statements.
The report included in “Item 8. Financial Statements and Supplementary Data.” includes the General Partner’s report on internal control over financial reporting (“Management’s Report”).
There were no changes in the Partnership’s internal control over financial reporting process during the fiscal quarter ended December 31, 2019 that materially affected, or are reasonably likely to materially affect, the Partnership’s internal control over financial reporting.
Item 9B. Other Information.
Certain impacts to public health conditions particular to the coronavirus (COVID-19) outbreak that occurred subsequent to year end could impact the operations and financial performance of the Partnership investments. The extent of the impact to the financial performance of the Partnership investments will depend on future developments, including (i) the duration and spread of the outbreak, (ii) the restrictions and advisories, (iii) the effects on the financial markets, and (iv) the effects on the economy overall, all of which are highly uncertain and cannot be predicted. If the financial performance of the Partnership investments is impacted because of these factors for an extended period, the Partnership performance may be adversely affected.
62
PART III
Item 10. Directors, Executive Officers and Corporate Governance.
The Partnership has no directors or executive officers and its affairs are managed by its General Partner. Investment decisions are made by the Advisors.
The directors and executive officers of the General Partner are Patrick T. Egan (President and Chairman of the Board of Directors of the General Partner), Steven Ross (Chief Financial Officer and Director), Matthew R. Graver (Director) and Etsuko Jennings (Director). Each director holds office until the earlier of his or her death, resignation or removal. Vacancies on the board of directors may be filled by either (i) the majority vote of the remaining directors or (ii) MSD Holdings, as the sole member of the General Partner. The officers of the General Partner are designated by the General Partner’s board of directors. Each officer will hold office until his or her successor is designated and qualified or until his or her death, resignation or removal.
Directors of the General Partner are responsible for overall corporate governance of the General Partner and meet periodically to consider strategic decisions regarding the General Partner’s activities. Under CFTC rules, each Director of the General Partner is deemed to be a principal of the General Partner and, as a result, is listed as such with NFA. Patrick T. Egan and Steven Ross serve on the General Partner’s Investment Committee and are the trading principals responsible for allocation decisions (or supervising those responsible).
Patrick T. Egan, age 51, has been a Director of the General Partner since December 2010. Since December 2010, Mr. Egan has been a principal and registered as an associated person of the General Partner, and is an associate member of NFA. Since October 2014, Mr. Egan has served as President and Chairman of the Board of Directors of the General Partner. Since August 2013, Mr. Egan has been registered as a swap associated person of the General Partner. From September 2013 to May 2014, Mr. Egan served as a Vice President of Morgan Stanley Strategies LLC, formerly known as Morgan Stanley GWM Feeder Strategies LLC, which acts as a general partner to multiple alternative investment entities, and Morgan Stanley AI GP LLC, formerly known as Morgan Stanley HedgePremier GP LLC, which acts as a general partner and administrative agent to numerous hedge fund feeder funds. From September 2013 to May 2014, Mr. Egan was registered as an associated person and listed as a principal of each such entity. Since January 2013, each such entity has been registered as a commodity pool operator with the CFTC. Mr. Egan was responsible for overseeing the implementation of certain CFTC and NFA regulatory requirements applicable to such entities. From June 2009 to December 2014, Mr. Egan was employed by Morgan Stanley Smith Barney LLC, a financial services firm, where his responsibilities included serving as Executive Director and as Co-Chief Investment Officer for Morgan Stanley Managed Futures from June 2009 through June 2011 and as Chief Risk Officer for Morgan Stanley Managed Futures from June 2011 through October 2014. Since October 2014, Mr. Egan has been responsible for the day-to-day operations and management of Morgan Stanley Managed Futures. Since January 2015, Mr. Egan has been employed by the General Partner. From November 2010 to October 2014, Mr. Egan was registered as an associated person of Morgan Stanley Smith Barney LLC. From April 2007 through June 2009, Mr. Egan was employed by MS & Co., a financial services firm, where his responsibilities included serving as Head of Due Diligence and Manager Research for Morgan Stanley’s Managed Futures Department. From April 2007 through June 2009, Mr. Egan was registered as an associated person of MS & Co. From March 1993 through April 2007, Mr. Egan was employed by Morgan Stanley DW Inc., a financial services firm, where his initial responsibilities included serving as an analyst and manager within the Managed Futures Department (with primary responsibilities for product development, due diligence, investment analysis and risk management of the firm’s commodity pools) and later included serving as Head of Due Diligence and Manager Research for Morgan Stanley’s Managed Futures Department. From February 1998 through April 2007, Mr. Egan was registered as an associated person of Morgan Stanley DW Inc. From August 1991 through March 1993, Mr. Egan was employed by Dean Witter Intercapital, the asset management arm of Dean Witter Reynolds, Inc., where his responsibilities included serving as a mutual fund administration associate. Mr. Egan also served as a Director from November 2004 through October 2006, and from November 2006 through October 2008 of the Managed Funds Association’s Board of Directors, a position he was elected to by industry peers for two consecutive two-year terms. Mr. Egan earned his Bachelor of Business Administration degree with a concentration in Finance in May 1991 from the University of Notre Dame.
63
Steven Ross, age 48, has been Chief Financial Officer and a principal of the General Partner since July 2014 and a Director of the General Partner since February 2016. Mr. Ross has been employed by Morgan Stanley Investment Management, a financial services firm, since September 2005, where his responsibilities include serving as an Assistant Treasurer of Morgan Stanley with respect to certain investment vehicles publicly offered by Morgan Stanley. Mr. Ross is also an Executive Director of the Morgan Stanley Fund Administration Group where he is responsible for finance and accounting matters for certain private funds offered by Morgan Stanley. Before joining Morgan Stanley Investment Management, Mr. Ross was employed by JPMorgan Investor Services Co., a financial services firm, from December 1997 through September 2005, where his responsibilities included serving as a Vice President responsible for the accounting of certain funds sponsored by JPMorgan Chase & Co. and other large fund families serviced by JPMorgan Investor Services Co. From April 1997 to December 1997, Mr. Ross was employed by Investors Bank & Trust, a financial services firm, where his responsibilities included performing mutual fund accounting for financial services firms. Mr. Ross began his career at Putnam Investments LLC, a financial services firm, where he was responsible for providing broker services for certain funds sponsored by Putnam Investments LLC from August 1996 to April 1997. Mr. Ross received a B.S. in Accounting from Rhode Island College in May 1995.
Matthew R. Graver, age 52, has been a Director of the General Partner and listed as a principal since November 2016. Since January 2008, Mr. Graver has served as Managing Director of Morgan Stanley Investment Management, a financial services firm, and Chief Operating Officer for Morgan Stanley AIP Fund of Hedge Funds, a business unit offering managed portfolios of hedge funds. Since November 2015, Mr. Graver has been listed as a principal and director of Morgan Stanley AIP Cayman GP Ltd., a commodity pool operator. From January 2005 to January 2008, Mr. Graver served as Executive Director of Morgan Stanley Investment Management and from August 2003 to January 2005, Mr. Graver served as Vice President of Morgan Stanley Investment Management. From August 2003 to January 2008, Mr. Graver’s primary responsibilities included serving as Head of Operational Due Diligence for Morgan Stanley AIP Fund of Hedge Funds in which role he oversaw due diligence into operational factors of alternative investment entities. From July 1997 to July 2003, Mr. Graver was employed by PricewaterhouseCoopers LLP, an international auditing and professional services firm, where he served as a senior audit manager and was responsible for managing independent audits of financial services firms. From June 1993 to June 1997, Mr. Graver was employed by PNC Bank, a bank offering consumer and corporate services, where he served as a mutual fund accounting manager and was responsible for managing an accounting team that performed daily accounting functions and valuation calculations for a group of mutual funds. From July 1989 through June 1993, Mr. Graver was employed by Coopers & Lybrand LLP, a predecessor accounting firm to PricewaterhouseCoopers LLP, where he was a senior audit associate and was responsible for performing audits of financial services firms. Mr. Graver earned his Bachelor of Science degree in Accounting in May 1989 from Pennsylvania State University and Masters of Business Administration from Villanova University in May 2002.
Etsuko Jennings, age 61, has been a Director of the General Partner since September 2018. She has been a Managing Director of Morgan Stanley Investment Management since January 2007 and is currently head of the Operational Risk group for Morgan Stanley Investment Management’s Global Risk and Analysis division, responsible for ongoing analysis as well as reporting and mitigation of operational risk. She joined Morgan Stanley in 1985 and has approximately 22 years of investment experience. Previously, she managed a variety of strategic initiatives in the Global Operations group. Before that, Ms. Jennings was a member of the firm’s IT department in New York, Tokyo and London where she developed and managed trading and accounting systems. She received a B.A. from Keio University’s School of Letters/International Program in Japan and an M.A. in international relations from the University of North Carolina at Chapel Hill.
The Partnership has not adopted a code of ethics that applies to officers because it has no officers. In addition, the Partnership has not adopted any procedures by which investors may recommend nominees to the Partnership’s board of directors and has not established an audit committee because it has no board of directors.
Item 11. Executive Compensation.
The Partnership has no directors or executive officers. As a limited partnership, the business of the Partnership is managed by the General Partner, which is responsible for the administration of the business affairs of the Partnership. The Partnership pays the General Partner a General Partner fee equal to an annual rate of 0.75% (paid monthly) of the Partnership’s net assets. Prior to January 1, 2019, the Partnership paid the General Partner a General Partner fee equal to an annual rate of 1.0% (paid monthly) of the Partnership’s net assets.
64
Item 12. Security Ownership of Certain Beneficial Owners and Management and Related Stockholder Matters.
(a) Security ownership of certain beneficial owners. As of February 29, 2020, the Partnership knows of no persons who beneficially own more than 5% of the Redeemable Units outstanding.
(b) Security ownership of management. Under the terms of the Limited Partnership Agreement, the Partnership’s affairs are managed by the General Partner. The following table indicates securities owned by the General Partner as of December 31, 2019:
| (1) Title of Class | (2) Name of Beneficial Owner |
(3) Amount and Nature of Beneficial Ownership |
(4) Percent of Class | |||
| Class Z Redeemable Units |
General Partner | 1,118.7550 | 100.0% |
(c) Changes in control. None.
Item 13. Certain Relationships, Related Transactions and Director Independence.
| (a) | Transactions with related persons. None. |
| (b) | Review, approval or ratification of transactions with related persons. Not applicable. |
(c) Promoters and certain control persons. MS&Co., Morgan Stanley Wealth Management and the General Partner could be considered promoters for purposes of item 404(c) of Regulation S-K. The nature and the amounts of compensation each promoter received or will receive, if any, from the Partnership are set forth under “Item 1. Business.”, “Item 8. Financial Statements and Supplementary Data.” and “Item 11. Executive Compensation.”
Item 14. Principal Accountant Fees and Services.
(1) Audit Fees. The aggregate fees billed for each of the last two fiscal years for professional services rendered by Ernst & Young LLP (“EY”) for the years ended December 31, 2019 and 2018 for the audits of the Partnership’s annual financial statements, reviews of financial statements included in the Partnership’s Forms 10-Q and 10-K and other services normally provided in connection with regulatory filings or engagements were:
2019 $126,670
2018 $116,154
(2) Audit-Related Fees. None.
(3) Tax Fees. The Partnership did not pay EY any amounts in 2019 and 2018 for professional services in connection with tax compliance, tax advice and tax planning.
(4) All Other Fees. None.
(5) Not Applicable.
(6) Not Applicable.
65
PART IV
Item 15. Exhibits and Financial Statement Schedules.
(1) Financial Statements:
Statements of Financial Condition at December 31, 2019 and 2018.
Condensed Schedules of Investments at December 31, 2019 and 2018.
Statements of Income and Expenses for the years ended December 31, 2019, 2018 and 2017.
Statements of Changes in Partners’ Capital for the years ended December 31, 2019, 2018 and 2017.
Notes to Financial Statements.
(2) Exhibits:
| 3.1(a) | ||
| (b) | ||
| (c) | ||
| (d) | ||
| (e) | ||
| (f) | ||
| (g) | ||
| (h) | ||
| (i) | ||
| 3.2(a) | ||
| 3.2(b) | ||
| 4.1 | ||
| 10.1(a) | ||
| (b) | ||
| 10.2 | ||
| 10.3 | ||
| 10.4(a) | ||
66
| (b) | ||
| 10.5 | ||
| 10.6 | ||
| 10.7 | ||
| 10.8 | ||
| 10.9 | ||
| 10.10(a) | ||
| (b) | ||
| 10.11 | ||
| 11.1 | ||
| 99.1 | ||
| 99.2 | ||
| 99.3 | ||
| The exhibits required to be filed by Item 601 of Regulation S-K are incorporated herein by reference: | ||
| 31.1 | Rule 13a-14(a)/15d-14(a) Certification (Certification of President and Director) (filed herewith). | |
| 31.2 | ||
| 32.1 | Section 1350 Certification (Certification of President and Director) (filed herewith). | |
| 32.2 | Section 1350 Certification (Certification of Chief Financial Officer and Director) (filed herewith). | |
| 101.INS | XBRL Instance Document. | |
| 101.SCH | XBRL Taxonomy Extension Schema Document. | |
| 101.CAL | XBRL Taxonomy Extension Calculation Linkbase Document. | |
| 101.LAB | XBRL Taxonomy Extension Label Linkbase Document. | |
| 101.PRE | XBRL Taxonomy Extension Presentation Linkbase Document. | |
| 101.DEF | XBRL Taxonomy Extension Definition Linkbase Document. | |
67
SIGNATURES
Pursuant to the requirements of Section 13 or 15(d) of the Securities Exchange Act of 1934, the registrant has duly caused this report to be signed on its behalf by the undersigned, thereunto duly authorized.
| CERES TACTICAL COMMODITY L.P. | ||
| By: | Ceres Managed Futures LLC | |
| (General Partner) | ||
| By: | /s/ Patrick T. Egan | |
|
Patrick T. Egan | ||
| President & Director | ||
| Date: March 26, 2020 | ||
Pursuant to the requirements of the Securities Exchange Act of 1934, this report has been signed below by the following persons on behalf of the Registrant and in the capacities and on the date indicated.
| /s/ Patrick T. Egan |
|
/s/ Matthew R. Graver | /s/ Etsuko Jennings | |||||
| Patrick T. Egan |
Matthew R. Graver | Etusko Jennings | ||||||
| President and Director |
Director | Director | ||||||
| Ceres Managed Futures LLC |
Ceres Managed Futures LLC | Ceres Managed Futures LLC | ||||||
| Date: March 26, 2020 |
Date: March 26, 2020 | Date: March 26, 2020 | ||||||
| /s/ Steven Ross |
||||||||
| Steven Ross |
||||||||
| Chief Financial Officer and Director |
||||||||
| (Principal Accounting Officer) |
||||||||
| Ceres Managed Futures LLC |
||||||||
| Date: March 26, 2020 |
||||||||
Supplemental Information to be Furnished With Reports Filed Pursuant to Section 15(d) of the Exchange Act by Registrants Which Have Not Registered Securities Pursuant to Section 12 of the Exchange Act.
Annual Report to limited partners.
No proxy material has been sent to limited partners.
68