Attached files
| file | filename |
|---|---|
| EX-31.1 - EX-31.1 - Ceres Tactical Commodity L.P. | d101877dex311.htm |
| EX-32.1 - EX-32.1 - Ceres Tactical Commodity L.P. | d101877dex321.htm |
| EX-31.2 - EX-31.2 - Ceres Tactical Commodity L.P. | d101877dex312.htm |
| EX-32.2 - EX-32.2 - Ceres Tactical Commodity L.P. | d101877dex322.htm |
| EX-10.6(B) - EX-10.6(B) - Ceres Tactical Commodity L.P. | d101877dex106b.htm |
UNITED STATES
SECURITIES AND EXCHANGE COMMISSION
WASHINGTON, D.C. 20549
FORM 10-K
(X) ANNUAL REPORT PURSUANT TO SECTION 13 OR 15(d) OF
THE SECURITIES EXCHANGE ACT OF 1934
For the fiscal year ended December 31, 2015
OR ( ) TRANSITION REPORT PURSUANT TO SECTION 13 OR 15(d) OF
THE SECURITIES EXCHANGE ACT OF 1934
For the transition period from to
Commission File Number 000-52602
MANAGED FUTURES PREMIER AVENTIS II L.P.
(Exact name of registrant as specified in its charter)
| New York | 20-2718952 | |||||||
| (State or other jurisdiction of incorporation or organization) |
(I.R.S. Employer Identification No.) |
|||||||
c/o Ceres Managed Futures LLC
522 Fifth Avenue
New York, New York 10036
(Address and Zip Code of principal executive offices)
(855) 672-4468
(Registrant’s telephone number, including area code)
Securities registered pursuant to Section 12(b) of the Act: None
Securities registered pursuant to Section 12(g) of the Act: Redeemable Units of Limited Partnership Interest
(Title of Class)
Indicate by check mark if the registrant is a well-known seasoned issuer, as defined in Rule 405 of the Securities Act.
Yes ¨ No þ
Indicate by check mark if the registrant is not required to file reports pursuant to Section 13 or Section 15(d) of the Act.
Yes ¨ No þ
Indicate by check mark whether the registrant (1) has filed all reports required to be filed by Section 13 or 15(d) of the Securities Exchange Act of 1934 during the preceding 12 months (or for such shorter period that the registrant was required to file such reports), and (2) has been subject to such filing requirements for the past 90 days.
Yes þ No ¨
Indicate by check mark whether the registrant has submitted electronically and posted on its corporate Web site, if any, every Interactive Data File required to be submitted and posted pursuant to Rule 405 of Regulation S-T (§232.405 of this chapter) during the preceding 12 months (or for such shorter period that the registrant was required to submit and post such files).
Yes þ No ¨
Indicate by check mark if disclosure of delinquent filers pursuant to Item 405 of Regulation S-K (§229.405 of this chapter) is not contained herein, and will not be contained, to the best of registrant’s knowledge, in definitive proxy or information statements incorporated by reference in Part III of this Form 10-K or any amendment to this Form 10-K [X]
Indicate by check mark whether the registrant is a large accelerated filer, an accelerated filer, a non-accelerated filer, or a smaller reporting company. See the definitions of “large accelerated filer”, “accelerated filer” and “smaller reporting company” in Rule 12b-2 of the Exchange Act. (Check one):
| Large accelerated filer | ¨ | Accelerated filer | ¨ | Non-accelerated filer | þ | Smaller reporting company | ¨ | |||||||
| (Do not check if a smaller reporting company) | ||||||||||||||
Indicate by check mark whether the registrant is a shell company (as defined in Rule 12b2 of the Exchange Act).
Yes ¨ No þ
Limited Partnership Redeemable Units with an aggregate value of $181,308,433 were outstanding and held by non-affiliates as of the last business day of the registrants most recently completed second fiscal quarter.
As of February 29, 2016, 96,328.3157 Limited Partnership Redeemable Units were outstanding.
DOCUMENTS INCORPORATED BY REFERENCE
[None]
PART I
Item 1. Business.
(a) General Development of Business. Managed Futures Premier Aventis II L.P. (formerly known as Bristol Energy Fund L.P.) (the “Partnership”) is a limited partnership organized on April 20, 2005 under the partnership laws of the State of New York to engage, directly or indirectly, in the speculative trading of commodity interests on U.S. and international futures, options on futures and forward markets. The Partnership may also engage, directly or indirectly, in swap transactions and other derivative transactions with the approval of the General Partner (defined below). Initially, the Partnership’s investment strategy focused on energy and energy-related investments. While the Partnership is expected to continue to have significant exposure to energy and energy-related markets, such trading will no longer be the Partnership’s primary focus. Therefore, the Partnership’s past trading performance will not necessarily be indicative of future results. The commodity interests that are traded by the Partnership, through its investment in MB Master Fund L.P. (“MB Master”), are volatile and involve a high degree of market risk. The General Partner may also determine to invest up to all of the Partnership’s assets (directly or indirect through its investment in MB Master) in United States (“U.S.”) Treasury bills and/or money market mutual funds, including money market mutual funds managed by Morgan Stanley or its affiliates. During the initial offering period, the Partnership sold 11,925 redeemable units of limited partnership interest (“Redeemable Units”). The Partnership commenced trading on September 6, 2005. The Partnership privately and continuously offers Redeemable Units to qualified investors. There is no maximum number of units that may be sold by the Partnership.
Subscriptions and redemptions of Redeemable Units and General Partner contributions and redemptions for the years ended December 31, 2015, 2014 and 2013 are reported in the Statements of Changes in Partners’ Capital under “Item 8. Financial Statements and Supplementary Data.”
Ceres Managed Futures LLC, a Delaware limited liability company, acts as the general partner (the “General Partner”) and commodity pool operator of the Partnership. The General Partner is wholly owned by Morgan Stanley Smith Barney Holdings LLC (“MSSB Holdings”). MSSB Holdings is ultimately owned by Morgan Stanley. Morgan Stanley is a publicly held company whose shares are listed on the New York Stock Exchange. Morgan Stanley is engaged in various financial services and other businesses. Prior to June 28, 2013, Morgan Stanley indirectly owned a majority equity interest in MSSB Holdings, and Citigroup Inc. indirectly owned a minority equity interest in MSSB Holdings. Prior to July 31, 2009, the date as of which MSSB Holdings became the General Partner’s owner, the General Partner was wholly owned by Citigroup Financial Products Inc., a wholly owned subsidiary of Citigroup Global Markets Holdings Inc., the sole owner of which is Citigroup Inc. All trading decisions for the Partnership are made by the Advisor (defined below).
During the years ended December 31, 2015 and 2014, the Partnership’s/Master’s commodity broker was Morgan Stanley & Co. LLC (“MS&Co.”), a registered futures commission merchant. During a prior period included in this report, Citigroup Global Markets Inc. (“CGM”) also served as a commodity broker.
On December 1, 2005, the Partnership allocated substantially all of its capital to CMF SandRidge Master Fund L.P. (“SandRidge Master”), a limited partnership organized under the partnership laws of the State of New York. The Partnership purchased 14,410.6191 units of SandRidge Master with cash equal to $14,477,858 and a contribution of open commodity futures and option contracts with a fair value of $(16,018). SandRidge Master permitted commodity pools managed by SandRidge Capital, L.P. (“SandRidge”) using its Energy Program, a proprietary, discretionary trading system, to invest together in one trading vehicle. On January 31, 2013, the Partnership fully redeemed its investment in SandRidge Master for cash equal to $280,445,995. On February 1, 2013, the Partnership allocated substantially all of its capital to MB Master, a limited partnership organized under the partnership laws of the State of Delaware. The Partnership purchased an interest in MB Master with cash equal to $262,944,186. MB Master permits accounts managed by Aventis Asset Management, LLC (“Aventis”) using its Aventis Diversified Commodity Strategy, a proprietary, discretionary trading program to invest together in one trading vehicle. References to the “Advisor” herein refer to SandRidge and/or Aventis, as applicable. A description of the trading activities and focus of the Advisor is included on page 14 under “Item 7. Management’s Discussion and Analysis of Financial Condition and Results of Operations.” References to the “Master” herein refer to SandRidge Master and/or MB Master, as applicable. The General Partner is also the general partner of the Master. Individual and pooled accounts managed by the Advisor, including the Partnership, are permitted to be limited partners of the Master. The General Partner and the Advisor believe that trading through a master/feeder structure promotes efficiency and economy in the trading process. Expenses to investors as a result of the investment in the Master are approximately the same as trading directly and redemption rights are not affected.
The financial statements of the Master, including the Condensed Schedules of Investments, are contained elsewhere in this report and should be read together with the Partnership’s financial statements.
1
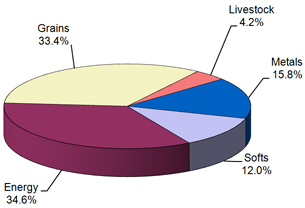
For the period January 1, 2015 through December 31, 2015, the approximate average market sector distribution for the Partnership was as follows:
|
|
At December 31, 2015 and 2014, the Partnership owned approximately 86.4% and 91.7%, respectively, of the Master. During the periods covered by this report, the performance of the Partnership was directly affected by the performance of the Master.
The Master’s trading of futures, forward, swap and option contracts, if applicable, on commodities is done primarily on U.S. commodity exchanges and foreign commodity exchanges. During the years ended December 31, 2015 and 2014, the Master engaged in such trading through a commodity brokerage account maintained with MS&Co. During a prior period included in this report, the Master engaged in such trading through a commodity brokerage account maintained with CGM.
The General Partner and each limited partner share in the profits and losses of the Partnership, in proportion to the amount of Partnership interest owned by each, except that no limited partner is liable for obligations of the Partnership in excess of its capital contribution and profits, if any, net of distributions and losses, if any.
The fourth amended and restated limited partnership agreement of the Partnership, as amended from time to time (the “Limited Partnership Agreement”), provides that the Partnership will be liquidated upon the first of the following to occur: December 31, 2055; the net asset value per Redeemable Unit falls below $400 as of the close of any business day; or under certain circumstances as defined in the Limited Partnership Agreement. In addition, the General Partner may, in its sole discretion, cause the Partnership to dissolve if the Partnership’s aggregate net assets decline to less than $1,000,000.
In July 2015, the General Partner delegated certain administrative functions to SS&C Technologies, Inc., a Delaware corporation, currently doing business as SS&C GlobeOp (the “Administrator”). Pursuant to a master services agreement, the Administrator furnishes certain administrative, accounting, regulatory, reporting, tax and other services as agreed from time to time. In addition, the Administrator maintains certain books and records of the Partnership. The costs of retaining the Administrator are allocated among the pools operated by the General Partner, including the Partnership.
The General Partner administers the business and affairs of the Partnership, including selecting one or more advisors to make trading decisions for the Partnership. Prior to October 1, 2014, the Partnership paid the General Partner a monthly General Partner fee (formerly, the administrative fee) in return for its services to the Partnership equal to 1/24 of 1% (0.5% per year) of month-end Net Assets of the Partnership. Effective October 1, 2014, the General Partner fee was increased to 1/12 of 1% (1.00% per year) of month-end Net Assets of the Partnership. Month-end Net Assets, for the purpose of calculating General Partner fees are Net Assets, as defined in the Limited Partnership Agreement, prior to the reduction of the current month’s management fee, incentive fee/profit share allocation accrual, the General Partner fee and any redemptions or distributions as of the end of such month. This fee may be increased or decreased at the discretion of the General Partner.
The General Partner, on behalf of the Partnership, entered into a management agreement (the “SandRidge Management Agreement”) with SandRidge, a registered commodity trading advisor. SandRidge was not affiliated with the General Partner, MS&Co. or CGM and was not responsible for the organization or operation of the Partnership. The Partnership paid SandRidge a monthly management fee equal to 1/6 of 1% (2% per year) of month-end Net Assets allocated to SandRidge. Month-end Net Assets, for the purpose of calculating management fees were Net Assets, as defined in the Limited Partnership Agreement, prior to the reduction of the current month’s management fee, profit share allocation accrual, the General Partner fee and any redemptions or distributions as of the end of such month.
In addition, the Special Limited Partner of the Partnership received a quarterly profit share allocation to its capital account in the Partnership in the form of Redeemable Units of the Partnership, the value of which was equal to 20% of the New Trading Profits, as defined in the Limited Partnership Agreement, earned on behalf of the Partnership during each calendar quarter and which were issued as Special Limited Partner Redeemable Units. The SandRidge Management Agreement was terminated effective January 15, 2013.
The General Partner, on behalf of the Partnership, entered into a management agreement (the “Aventis Management Agreement”) with Aventis, a registered commodity trading advisor. Aventis is not affiliated with the General Partner, MS&Co. or CGM and is not responsible for the organization or operation of the Partnership. Prior to March 1, 2014, the Partnership paid Aventis a monthly management fee equal to 1/12 of 1.5% (1.5% per year) of month-end Net Assets allocated to Aventis. Effective March 1, 2014, Aventis reduced the management fee rate to 1/12 of 1.25% (1.25% per year) of month-end Net Assets allocated to Aventis. Month-end Net Assets, for the purpose of calculating management fees are Net Assets, as defined in the Limited Partnership Agreement, prior to the reduction of the current month’s management fee, incentive fee, the General Partner fee and any redemptions or distributions as of the end of such month.
Aventis is not a special limited partner and does not receive a profit share allocation. Instead, Aventis receives an incentive fee, the value of which will be equal to 20% of the New Trading Profits, as defined in the Aventis Management Agreement, earned on behalf of the Partnership during each calendar quarter.
2
The Aventis Management Agreement can be terminated upon notice by either party. References to the “Management Agreement” herein refers to the SandRidge Advisory Agreement and/or the Aventis Management Agreement, as applicable.
Prior to and during part of the third quarter of 2013, the Partnership was party to a Customer Agreement with CGM (the “CGM Customer Agreement”). During the third quarter of 2013, the Partnership entered into a Customer Agreement with MS&Co. (the “MS&Co. Customer Agreement”) and, during the fourth quarter of 2013, a Selling Agent Agreement with Morgan Stanley Smith Barney LLC, doing business as Morgan Stanley Wealth Management (“Morgan Stanley Wealth Management”) (the “Selling Agreement”). The Partnership has terminated the CGM Customer Agreement.
Under the CGM Customer Agreement, the Partnership paid CGM a monthly brokerage fee equal to 5/16 of 1.00% (3.75% per year) of month-end Net Assets, in lieu of brokerage fees on a per trade basis. Month-end Net Assets, for the purpose of calculating brokerage fees are Net Assets, as defined in the Limited Partnership Agreement, prior to the reduction of the current month’s brokerage fees, monthly management fee, incentive fee/profit share allocation accrual, the General Partner fee and other expenses and any redemptions or distributions as of the end of such month. The Partnership paid for exchange, service, clearing, user, give-up, floor brokerage and National Futures Association (“NFA”) fees (collectively, the “CGM clearing fees”) through its investment in the Master. The CGM clearing fees were allocated to the Partnership based on its proportionate share of the Master. During the term of the CGM Customer Agreement, all of the Partnership’s assets that were not held in the Master’s accounts at CGM were deposited in the Partnership’s account at CGM. The Partnership’s cash was deposited by CGM in segregated bank accounts to the extent required by Commodity Futures Trading Commission regulations. CGM paid the Partnership interest on 80% of the average daily equity maintained in cash in the Partnership’s (or the Partnership’s allocable portion of the Master’s) brokerage account at a 30-day U.S. Treasury bill rate determined weekly by CGM based on the average non-competitive yield on 3-month U.S. Treasury bills maturing in 30 days from the date on which such weekly rate was determined.
Under the MS&Co. Customer Agreement, the Partnership pays trading fees for the clearing and, where applicable, the execution of transactions, as well as exchange, clearing, user, give-up, floor brokerage and NFA fees (collectively, the “MS&Co. clearing fees” and together with the CGM clearing fees, the “clearing fees”) through its investment in the Master. MS&Co. clearing fees are allocated to the Partnership based on its proportionate share of the Master. Clearing fees will be paid for the life of the Partnership, although the rate at which such fees are paid may be changed. All of the Partnership’s assets not held in the Master’s accounts at MS&Co. are deposited in the Partnership’s account at MS&Co. The Partnership’s cash is deposited by MS&Co. in segregated bank accounts to the extent required by Commodity Futures Trading Commission regulations. MS&Co. has agreed to pay the Partnership interest on 80% of the average daily equity maintained in cash in the Partnership’s (or the Partnership’s allocable portion of the Master’s) brokerage account at the rate equal to the monthly average of the 4-week U.S. Treasury bill discount rate. The MS&Co. Customer Agreement may generally be terminated upon notice by either party.
Under the Selling Agreement with Morgan Stanley Wealth Management, the Partnership pays Morgan Stanley Wealth Management a monthly ongoing selling agent fee. Prior to April 1, 2014, the monthly ongoing selling agent fee was paid at a rate equal to 3.75% per year of month-end Net Assets. Effective April 1, 2014, the monthly ongoing selling agent fee was reduced to a rate equal to 2.50% per year of month-end Net Assets. Effective October 1, 2014, the monthly ongoing selling agent fee was reduced to a rate equal to 2.00% per year of month-end Net Assets. Morgan Stanley Wealth Management pays a portion of its ongoing selling agent fees to properly registered or exempted financial advisors who have sold Redeemable Units. Month-end Net Assets, for the purpose of calculating ongoing selling agent fees are Net Assets, as defined in the Limited Partnership Agreement, prior to the reduction of the current month’s ongoing selling agent fee, management fee, incentive fee accrued, the General Partner fee and other expenses and redemptions or distributions as of the end of such month.
3
Generally, a limited partner in the Master withdraws all or part of its capital contribution and undistributed profits, if any, from the Master as of the end of any month (the “Redemption Date”) after a request has been made to the General Partner at least three days in advance of the Redemption Date. Such withdrawals are classified as a liability when the limited partner in the Master elects to redeem and informs the Master. However, a limited partner in the Master may request a withdrawal as of the end of any day if such request is received by the General Partner at least three days in advance of the proposed withdrawal day.
(b) Financial Information about Segments. The Partnership’s business consists of only one segment, speculative trading of commodity interests. The Partnership does not engage in sales of goods or services. The Partnership’s net income (loss) from operations for the years ended December 31, 2015, 2014, 2013, 2012 and 2011 is set forth under “Item 6. Selected Financial Data.” The Partnership’s capital as of December 31, 2015 was $132,292,532.
(c) Narrative Description of Business.
See Paragraphs (a) and (b) above.
(i) through (xii) — Not applicable.
(xiii) — The Partnership has no employees.
(d) Financial Information About Geographic Areas. The Partnership does not engage in the sale of goods or services or own any long-lived assets, and therefore this item is not applicable.
(e) Available Information. The Partnership does not have an Internet address. The Partnership will provide paper copies of its annual report on Form 10-K, quarterly reports on Form 10-Q, current reports on Form 8-K and any amendments to these reports free of charge upon request.
(f) Reports to Security Holders. Not applicable.
(g) Enforceability of Civil Liabilities Against Foreign Persons. Not applicable.
(h) Smaller Reporting Companies. Not applicable.
4
Item 1A. Risk Factors.
As a result of leverage, small changes in the price of the Partnership’s positions may result in major losses.
The trading of commodity interests is speculative, volatile and involves a high degree of leverage. A small change in the market price of a commodity interest contract can produce major losses for the Master. Market prices can be influenced by, among other things, changing supply and demand relationships, governmental, agricultural, commercial and trade programs and policies, national and international political and economic events, weather and climate conditions, insects and plant disease, purchases and sales by foreign countries and changing interest rates.
An investor may lose all of its investment.
Due to the speculative nature of trading commodity interests, an investor could lose all of its investment in the Partnership.
The Partnership will pay substantial fees and expenses regardless of profitability.
Regardless of its trading performance, the Partnership will incur fees and expenses, including ongoing selling agent fees, clearing fees, General Partner fees and management fees.
An investor’s ability to redeem Redeemable Units is limited.
An investor’s ability to redeem Redeemable Units is limited and no market exists for the Redeemable Units.
Conflicts of interest exist.
The Partnership is subject to numerous conflicts of interest including those that arise from the facts that:
| 1. | The General Partner and the Partnership’s/Master’s commodity broker are affiliates; |
| 2. | The Advisor, the Partnership’s/Master’s commodity broker and their respective principals and affiliates may trade in commodity interests for their own accounts; |
| 3. | An investor’s financial advisor will receive ongoing compensation for providing services to the investor’s account; and |
| 4. | The General Partner, on behalf of the Partnership, may purchase money market mutual fund shares from mutual funds affiliated and/or unaffiliated with the General Partner. |
Investing in Redeemable Units might not provide the desired diversification of an investor’s overall portfolio.
One of the Partnership’s objectives is to add an element of diversification to a traditional stock and bond portfolio, but any benefit of portfolio diversification is dependent upon the Master achieving positive returns and such returns being independent of stock and bond market returns.
Past performance is no assurance of future results.
The Advisor’s trading strategies may not perform as they have performed in the past.
An investor’s tax liability may exceed cash distributions.
Investors are taxed on their share of the Partnership’s income, even though the Partnership does not intend to make any distributions.
5
Regulatory changes could restrict the Partnership’s operations and increase its operational costs.
Regulatory changes could adversely affect the Partnership by restricting its markets or activities, limiting its trading and/or increasing the costs or taxes to which investors are subject. Pursuant to the mandate of the Dodd-Frank Wall Street Reform and Consumer Protection Act, signed into law on July 21, 2010, the CFTC and the Securities and Exchange Commission (the “SEC”) have promulgated rules to regulate swap dealers and to mandate additional reporting and disclosure requirements and continue to promulgate rules regarding capital and margin requirements, to require that certain swaps be traded on an exchange or a swap execution facility, and to require that derivatives (such as those traded by the Partnership) be moved into central clearinghouses. The CFTC and the prudential regulators that oversee swap dealers have adopted rules regarding margin requirements for certain derivatives. In addition, the CFTC and such prudential regulators have proposed or adopted, respectively, rules regarding capital requirements for swap dealers. These rules may negatively impact the manner in which swap contracts are traded and/or settled, increase the cost of such trades, and limit trading by speculators (such as the Partnership) in futures and over-the-counter (“OTC”) markets.
Speculative position and trading limits may reduce profitability.
The CFTC and U.S. Commodity exchanges have established ‘‘speculative position limits” on the maximum net long or net short positions which any person or a group of persons may hold or control in particular futures, options on futures and swaps that perform a significant price discovery function. Most Commodity exchanges also limit the amount of fluctuation in commodity futures contract prices on a single trading day. The Advisor believes that established speculative position and trading limits will not materially adversely affect trading for the Master. The trading instructions of the Advisor, however, may have to be modified, and positions held by the Master may have to be liquidated, in order to avoid exceeding these limits. Such modification or liquidation could have an indirect adverse effect on the operations and profitability of the Partnership by increasing transaction costs to liquidate positions and limiting potential profits on the liquidated positions for the Master.
In November 2013, the CFTC proposed new rules that, if adopted in substantially the same form, will impose position limits on certain futures and option contracts and physical commodity swaps that are “economically equivalent” to such contracts. If enacted, these rules could have an adverse effect on the Advisor’s trading for the Partnership.
6
Item 2. Properties.
The Partnership does not own or lease any properties. The General Partner operates out of facilities provided by Morgan Stanley and/or one of its subsidiaries.
Item 3. Legal Proceedings.
This section describes the major pending legal proceedings, other than ordinary routine litigation incidental to the business, to which MS&Co. or its subsidiaries is a party or to which any of their property is subject. There are no material legal proceedings pending against the Partnership or the General Partner.
On June 1, 2011, Morgan Stanley & Co. Incorporated converted from a Delaware corporation to a Delaware limited liability company. As a result of that conversion, Morgan Stanley & Co. Incorporated is now named Morgan Stanley & Co. LLC (“MS&Co.” or the “Company”).
MS&Co. is a wholly-owned, indirect subsidiary of Morgan Stanley, a Delaware holding company. Morgan Stanley files periodic reports with the SEC as required by the Securities Exchange Act of 1934 (the “Exchange Act”), which include current descriptions of material litigation and material proceedings and investigations, if any, by governmental and/or regulatory agencies or self-regulatory organizations concerning Morgan Stanley and its subsidiaries, including MS&Co. As a consolidated subsidiary of Morgan Stanley, MS&Co. does not file its own periodic reports with the SEC that contain descriptions of material litigation, proceedings and investigations. As a result, we refer you to the “Legal Proceedings” section of Morgan Stanley’s SEC 10-K filings for 2015, 2014, 2013, 2012 and 2011.
In addition to the matters described in those filings, in the normal course of business, each of Morgan Stanley and MS&Co. has been named, from time to time, as a defendant in various legal actions, including arbitrations, class actions, and other litigation, arising in connection with its activities as a global diversified financial services institution. Certain of the legal actions include claims for substantial compensatory and/or punitive damages or claims for indeterminate amounts of damages. Each of Morgan Stanley and MS&Co. is also involved, from time to time, in investigations and proceedings by governmental and/or regulatory agencies or self-regulatory organizations, certain of which may result in adverse judgments, fines or penalties. The number of these investigations and proceedings has increased in recent years with regard to many financial services institutions, including Morgan Stanley and MS&Co.
MS&Co. is a Delaware limited liability company with its main business office located at 1585 Broadway, New York, New York 10036. Among other registrations and memberships, MS&Co. is registered as a futures commission merchant and is a member of the National Futures Association.
Regulatory and Governmental Matters.
The Company has received subpoenas and requests for information from certain federal and state regulatory and governmental entities, including among others various members of the RMBS Working Group of the Financial Fraud Enforcement Task Force, such as the United States Department of Justice, Civil Division and several state Attorney General’s Offices, concerning the origination, financing, purchase, securitization and servicing of subprime and non-subprime residential mortgages and related matters such as residential mortgage backed securities (“RMBS”), collateralized debt obligations (“CDOs”), structured investment vehicles (“SIVs”) and credit default swaps backed by or referencing mortgage pass-through certificates. These matters, some of which are in advanced stages, include, but are not limited to, investigations related to the Company’s due diligence on the loans that it purchased for securitization, the Company’s communications with ratings agencies, the Company’s disclosures to investors, and the Company’s handling of servicing and foreclosure related issues.
On February 25, 2015, the Company reached an agreement in principle with the United States Department of Justice, Civil Division and the United States Attorney’s Office for the Northern District of California, Civil Division (collectively, the “Civil Division”) to pay $2.6 billion to resolve certain claims that the Civil Division indicated it intended to bring against the Company. That settlement was finalized on February 10, 2016.
In May 2014, the California Attorney General’s Office (“CAAG”), which is one of the members of the RMBS Working Group, indicated that it has made certain preliminary conclusions that the Company made knowing and material misrepresentations regarding RMBS and that it knowingly caused material misrepresentations to be made regarding the Cheyne SIV (defined below), which issued securities marketed to the California Public Employees Retirement System. The CAAG has further indicated that it believes the Company’s conduct violated California law and that it may seek treble damages, penalties and injunctive relief. The Company does not agree with these conclusions and has presented defenses to them to the CAAG.
7
In October 2014, the Illinois Attorney General’s Office (“ILAG”) sent a letter to the Company alleging that the Company knowingly made misrepresentations related to RMBS purchased by certain pension funds affiliated with the State of Illinois and demanding that the Company pay ILAG approximately $88 million. The Company and ILAG reached an agreement to resolve the matter on February 10, 2016.
On January 13, 2015, the New York Attorney General’s Office (“NYAG”), which is also a member of the RMBS Working Group, indicated that it intends to file a lawsuit related to approximately 30 subprime securitizations sponsored by the Company. NYAG indicated that the lawsuit would allege that the Company misrepresented or omitted material information related to the due diligence, underwriting and valuation of the loans in the securitizations and the properties securing them and indicated that its lawsuit would be brought under the Martin Act. The Company and NYAG reached an agreement to resolve the matter on February 10, 2016.
On June 5, 2012, the Company consented to and became the subject of an Order Instituting Proceedings Pursuant to Sections 6(c) and 6(d) of the Commodity Exchange Act, as amended, Making Findings and Imposing Remedial Sanctions by the CFTC to resolve allegations related to the failure of a salesperson to comply with exchange rules that prohibit off-exchange futures transactions unless there is an Exchange for Related Position (“EFRP”). Specifically, the CFTC found that from April 2008 through October 2009, the Company violated Section 4c(a) of the Commodity Exchange Act (the “CEA”) and CFTC Regulation 1.38 by executing, processing and reporting numerous off-exchange futures trades to the Chicago Mercantile Exchange (“CME”) and Chicago Board of Trade (“CBOT”) as EFRPs in violation of CME and CBOT rules because those trades lacked the corresponding and related cash, OTC swap, OTC option, or other OTC derivative position. In addition, the CFTC found that the Company violated CFTC Regulation 166.3 by failing to supervise the handling of the trades at issue and failing to have adequate policies and procedures designed to detect and deter the violations of the CEA and CFTC Regulations. Without admitting or denying the underlying allegations and without adjudication of any issue of law or fact, the Company accepted and consented to entry of findings and the imposition of a cease and desist order, a fine of $5,000,000, and undertakings related to public statements, cooperation and payment of the fine. The Company entered into corresponding and related settlements with the CME and CBOT in which the CME found that the Company violated CME Rules 432.Q and 538 and fined the Company $750,000 and CBOT found that the Company violated CBOT Rules 432.Q and 538 and fined the Company $1,000,000.
On July 23, 2014, the SEC approved a settlement by MS&Co. and certain affiliates to resolve an investigation related to certain subprime RMBS transactions sponsored and underwritten by those entities in 2007. Pursuant to the settlement, MS&Co. and certain affiliates were charged with violating Sections 17(a)(2) and 17(a)(3) of the Securities Act of 1933 (the “Securities Act”), agreed to pay disgorgement and penalties in an amount of $275 million and neither admitted nor denied the SEC’s findings.
On April 21, 2015, the Chicago Board Options Exchange, Incorporated (“CBOE”) and the CBOE Futures Exchange, LLC (“CFE”) filed statements of charges against the Company in connection with trading by one of the Company’s former traders of EEM options contracts that allegedly disrupted the final settlement price of the November 2012 VXEM futures. CBOE alleged that the Company violated CBOE Rules 4.1, 4.2 and 4.7, Sections 9(a) and 10(b) of the Exchange Act, and Rule 10b-5 thereunder. CFE alleged that the Company violated CFE Rules 608, 609 and 620. Both matters are ongoing.
On June 18, 2015, the Company entered into a settlement with the SEC and paid a fine of $500,000 as part of the MCDC Initiative to resolve allegations that the Company failed to form a reasonable basis through adequate due diligence for believing the truthfulness of the assertions by issuers and/or obligors regarding their compliance with previous continuing disclosure undertakings pursuant to Rule 15c2-12 in connection with offerings in which the Company acted as senior or sole underwriter.
On August 6, 2015, the Company consented to and became the subject of an order by the CFTC to resolve allegations that the Company violated CFTC Regulation 22.9(a) by failing to hold sufficient U.S. Dollars in cleared swap segregated accounts in the U.S. to meet all U.S. Dollar obligations to cleared swaps customers. Specifically, the CFTC found that while the Company at all times held sufficient funds in segregation to cover its obligations to its customers, on certain days during 2013 and 2014, it held currencies, such as euros, instead of U.S. dollars, to meet its U.S. dollar obligations. In addition, the CFTC found that the Company violated CFTC Regulation 166.3 by failing to have in place adequate procedures to ensure that it complied with CFTC Regulation 22.9(a). Without admitting or denying the findings or conclusions and without adjudication of any issue of law or fact, the Company accepted and consented to the entry of findings, the imposition of a cease and desist order, a civil monetary penalty of $300,000, and undertakings related to public statements, cooperation, and payment of the monetary penalty.
Civil Litigation
On December 23, 2009, the Federal Home Loan Bank of Seattle filed a complaint against the Company and another defendant in the Superior Court of the State of Washington, styled Federal Home Loan Bank of Seattle v. Morgan Stanley & Co. Inc., et al. The amended complaint, filed on September 28, 2010, alleges that defendants made untrue statements and material omissions in the sale to plaintiff of certain mortgage pass-through certificates backed by securitization trusts containing residential mortgage loans. The total amount of certificates allegedly sold to plaintiff by the Company was approximately $233 million. The complaint raises claims under the Washington State Securities Act and seeks, among other things, to rescind the plaintiff’s purchase of such certificates. By orders
8
dated June 23, 2011 and July 18, 2011, the court denied defendants’ omnibus motion to dismiss plaintiff’s amended complaint and on August 15, 2011, the court denied the Company’s individual motion to dismiss the amended complaint. On March 7, 2013, the court granted defendants’ motion to strike plaintiff’s demand for a jury trial. The defendants’ joint motions for partial summary judgment were denied on November 9, 2015. At December 25, 2015, the current unpaid balance of the mortgage pass-through certificates at issue in this action was approximately $46 million, and the certificates had not yet incurred actual losses. Based on currently available information, the Company believes it could incur a loss in this action up to the difference between the $46 million unpaid balance of these certificates (plus any losses incurred) and their fair market value at the time of a judgment against the Company, plus pre- and post-judgment interest, fees and costs. The Company may be entitled to be indemnified for some of these losses and to an offset for interest received by the plaintiff prior to a judgment.
On March 15, 2010, the Federal Home Loan Bank of San Francisco filed a complaint against the Company and other defendants in the Superior Court of the State of California styled Federal Home Loan Bank of San Francisco v. Deutsche Bank Securities Inc. et al. An amended complaint, filed on June 10, 2010, alleges that defendants made untrue statements and material omissions in connection with the sale to plaintiff of certain mortgage pass-through certificates backed by securitization trusts containing residential mortgage loans. The amount of certificates allegedly sold to plaintiff by the Company was approximately $276 million. The complaint raises claims under both the federal securities laws and California law and seeks, among other things, to rescind the plaintiff’s purchase of such certificates. On August 11, 2011, plaintiff’s federal securities law claims were dismissed with prejudice. On February 9, 2012, defendants’ demurrers with respect to all other claims were overruled. On December 20, 2013, plaintiff’s negligent misrepresentation claims were dismissed with prejudice. At December 25, 2015, the current unpaid balance of the mortgage pass-through certificates at issue in these cases was approximately $59 million, and the certificates had incurred actual losses of approximately $1 million. Based on currently available information, the Company believes it could incur a loss for this action up to the difference between the $59 million unpaid balance of these certificates (plus any losses incurred) and their fair market value at the time of a judgment against the Company, or upon sale, plus pre- and post-judgment interest, fees and costs. The Company may be entitled to be indemnified for some of these losses and to an offset for interest received by the plaintiff prior to a judgment.
On July 15, 2010, China Development Industrial Bank (“CDIB”) filed a complaint against the Company, styled China Development Industrial Bank v. Morgan Stanley & Co. Incorporated et al., which is pending in the Supreme Court of the State of New York, New York County (“Supreme Court of NY”). The complaint relates to a $275 million credit default swap referencing the super senior portion of the STACK 2006-1 CDO. The complaint asserts claims for common law fraud, fraudulent inducement and fraudulent concealment and alleges that the Company misrepresented the risks of the STACK 2006-1 CDO to CDIB, and that the Company knew that the assets backing the CDO were of poor quality when it entered into the credit default swap with CDIB. The complaint seeks compensatory damages related to the approximately $228 million that CDIB alleges it has already lost under the credit default swap, rescission of CDIB’s obligation to pay an additional $12 million, punitive damages, equitable relief, fees and costs. On February 28, 2011, the court denied the Company’s motion to dismiss the complaint. Based on currently available information, the Company believes it could incur a loss of up to approximately $240 million plus pre- and post-judgment interest, fees and costs.
On October 15, 2010, the Federal Home Loan Bank of Chicago filed a complaint against the Company and other defendants in the Circuit Court of the State of Illinois, styled Federal Home Loan Bank of Chicago v. Bank of America Funding Corporation et al. A corrected amended complaint was filed on April 8, 2011. The corrected amended complaint alleges that defendants made untrue statements and material omissions in the sale to plaintiff of a number of mortgage pass-through certificates backed by securitization trusts containing residential mortgage loans and asserts claims under Illinois law. The total amount of certificates allegedly sold to plaintiff by the Company at issue in the action was approximately $203 million. The complaint seeks, among other things, to rescind the plaintiff’s purchase of such certificates. The defendants filed a motion to dismiss the corrected amended complaint on May 27, 2011, which was denied on September 19, 2012. On December 13, 2013, the court entered an order dismissing all claims related to one of the securitizations at issue. After that dismissal, the remaining amount of certificates allegedly issued by the Company or sold to plaintiff by the Company was approximately $78 million. At December 25, 2015, the current unpaid balance of the mortgage pass-through certificates at issue in this action was approximately $51 million, and the certificates had not yet incurred actual losses. Based on currently available information, the Company believes it could incur a loss in this action up to the difference between the $51 million unpaid balance of these certificates (plus any losses incurred) and their fair market value at the time of a judgment against the Company, plus pre- and post-judgment interest, fees and costs. The Company may be entitled to be indemnified for some of these losses and to an offset for interest received by the plaintiff prior to a judgment.
On April 20, 2011, the Federal Home Loan Bank of Boston filed a complaint against the Company and other defendants in the Superior Court of the Commonwealth of Massachusetts styled Federal Home Loan Bank of Boston v. Ally Financial, Inc. F/K/A GMAC LLC et al. An amended complaint was filed on June 29, 2012 and alleges that defendants made untrue statements and material omissions in the sale to plaintiff of certain mortgage pass-through certificates backed by securitization trusts containing residential mortgage loans. The total amount of certificates allegedly issued by the Company or sold to plaintiff by the Company was approximately $385 million. The amended complaint raises claims under the Massachusetts Uniform Securities Act, the Massachusetts Consumer Protection Act and common law and seeks, among other things, to rescind the plaintiff’s purchase of such certificates. On May 26, 2011, defendants removed the case to the United States District Court for the District of Massachusetts. The
9
defendants’ motions to dismiss the amended complaint were granted in part and denied in part on September 30, 2013. On November 25, 2013, July 16, 2014, and May 19, 2015, respectively, the plaintiff voluntarily dismissed its claims against the Company with respect to three of the securitizations at issue. After these voluntary dismissals, the remaining amount of certificates allegedly issued by the Company or sold to plaintiff by the Company was approximately $332 million. At December 25, 2015, the current unpaid balance of the mortgage pass-through certificates at issue in this action was approximately $55 million, and the certificates had not yet incurred actual losses. Based on currently available information, the Company believes it could incur a loss in this action up to the difference between the $55 million unpaid balance of these certificates (plus any losses incurred) and their fair market value at the time of a judgment against the Company, or upon sale, plus pre- and post-judgment interest, fees and costs. The Company may be entitled to be indemnified for some of these losses and to an offset for interest received by the plaintiff prior to a judgment.
On May 3, 2013, plaintiffs in Deutsche Zentral-Genossenschaftsbank AG et al. v. Morgan Stanley et al. filed a complaint against the Company, certain affiliates, and other defendants in the Supreme Court of NY. The complaint alleges that defendants made material misrepresentations and omissions in the sale to plaintiffs of certain mortgage pass-through certificates backed by securitization trusts containing residential mortgage loans. The total amount of certificates allegedly sponsored, underwritten and/or sold by the Company to plaintiff currently at issue in this action was approximately $644 million. The complaint alleges causes of action against the Company for common law fraud, fraudulent concealment, aiding and abetting fraud, negligent misrepresentation, and rescission and seeks, among other things, compensatory and punitive damages. On June 10, 2014, the court granted in part and denied in part the Company’s motion to dismiss the complaint. The Company perfected its appeal from that decision on June 12, 2015. At December 25, 2015, the current unpaid balance of the mortgage pass-through certificates at issue in this action was approximately $269 million, and the certificates had incurred actual losses of approximately $83 million. Based on currently available information, the Company believes it could incur a loss in this action up to the difference between the $269 million unpaid balance of these certificates (plus any losses incurred) and their fair market value at the time of a judgment against the Company, or upon sale, plus pre- and post-judgment interest, fees and costs. The Company may be entitled to be indemnified for some of these losses.
On May 17, 2013, plaintiff in IKB International S.A. in Liquidation, et al. v. Morgan Stanley, et al. filed a complaint against the Company and certain affiliates in the Supreme Court of NY. The complaint alleges that defendants made material misrepresentations and omissions in the sale to plaintiff of certain mortgage pass-through certificates backed by securitization trusts containing residential mortgage loans. The total amount of certificates allegedly sponsored, underwritten and/or sold by the Company to plaintiff was approximately $132 million. The complaint alleges causes of action against the Company for common law fraud, fraudulent concealment, aiding and abetting fraud, and negligent misrepresentation, and seeks, among other things, compensatory and punitive damages. On October 29, 2014, the court granted in part and denied in part the Company’s motion to dismiss. All claims regarding four certificates were dismissed. After these dismissals, the remaining amount of certificates allegedly issued by the Company or sold to plaintiff by the Company was approximately $116 million. On August 26, 2015, the Company perfected its appeal from the court’s October 29, 2014 decision. At December 25, 2015, the current unpaid balance of the mortgage pass-through certificates at issue in this action was approximately $28 million, and the certificates had incurred actual losses of $58 million. Based on currently available information, the Company believes it could incur a loss in this action up to the difference between the $28 million unpaid balance of these certificates (plus any losses incurred) and their fair market value at the time of a judgment against the Company, or upon sale, plus pre- and post-judgment interest, fees and costs. The Company may be entitled to be indemnified for some of these losses and to an offset for interest received by the plaintiff prior to a judgment.
Settled Civil Litigation
On August 25, 2008, the Company and two ratings agencies were named as defendants in a purported class action related to securities issued by a structured investment vehicle called Cheyne Finance PLC and Cheyne Finance LLC (together, the “Cheyne SIV”). The case was styled Abu Dhabi Commercial Bank, et al. v. Morgan Stanley & Co. Inc., et al. The complaint alleged, among other things, that the ratings assigned to the securities issued by the Cheyne SIV were false and misleading, including because the ratings did not accurately reflect the risks associated with the subprime residential mortgage backed securities held by the Cheyne SIV. The plaintiffs asserted allegations of aiding and abetting fraud and negligent misrepresentation relating to approximately $852 million of securities issued by the Cheyne SIV. On April 24, 2013, the parties reached an agreement to settle the case, and on April 26, 2013, the court dismissed the action with prejudice. The settlement does not cover certain claims that were previously dismissed.
On March 15, 2010, the Federal Home Loan Bank of San Francisco filed a complaint against the Company and other defendants in the Superior Court of the State of California styled Federal Home Loan Bank of San Francisco v. Credit Suisse Securities (USA) LLC, et al. An amended complaint filed on June 10, 2010 alleged that defendants made untrue statements and material omissions in connection with the sale to plaintiff of a number of mortgage pass-through certificates backed by securitization trusts containing residential mortgage loans. The amount of certificates allegedly sold to plaintiff by the Company was approximately $704 million. The complaint raised claims under both the federal securities laws and California law and sought, among other things, to rescind the plaintiff’s purchase of such certificates. On January 26, 2015, as a result of a settlement with certain other defendants, the plaintiff requested and the court subsequently entered a dismissal with prejudice of certain of the plaintiff’s claims, including all remaining claims against the Company.
10
On July 9, 2010 and February 11, 2011, Cambridge Place Investment Management Inc. filed two separate complaints against the Company and/or its affiliates and other defendants in the Superior Court of the Commonwealth of Massachusetts, both styled Cambridge Place Investment Management Inc. v. Morgan Stanley & Co., Inc., et al. The complaints asserted claims on behalf of certain clients of plaintiff’s affiliates and allege that defendants made untrue statements and material omissions in the sale of a number of mortgage pass-through certificates backed by securitization trusts containing residential mortgage loans. The total amount of certificates allegedly issued by the Company and/or its affiliates or sold to plaintiff’s affiliates’ clients by the Company and/or its affiliates in the two matters was approximately $263 million. On February 11, 2014, the parties entered into an agreement to settle the litigation. On February 20, 2014, the court dismissed the action.
On October 25, 2010, the Company, certain affiliates and Pinnacle Performance Limited, a special purpose vehicle (“SPV”), were named as defendants in a purported class action in the United States District Court for the Southern District of New York (“SDNY”), styled Ge Dandong, et al. v. Pinnacle Performance Ltd., et al. On January 31, 2014, the plaintiffs in the action, which related to securities issued by the SPV in Singapore, filed a second amended complaint, which asserted common law claims of fraud, aiding and abetting fraud, fraudulent inducement, aiding and abetting fraudulent inducement, and breach of the implied covenant of good faith and fair dealing. On July 17, 2014, the parties reached an agreement to settle the litigation, which received final court approval on July 2, 2015.
On July 5, 2011, Allstate Insurance Company and certain of its affiliated entities filed a complaint against the Company in the Supreme Court of NY, styled Allstate Insurance Company, et al. v. Morgan Stanley, et al. An amended complaint was filed on September 9, 2011, and alleges that the defendants made untrue statements and material omissions in the sale to the plaintiffs of certain mortgage pass-through certificates backed by securitization trusts containing residential mortgage loans. The total amount of certificates allegedly issued and/or sold to the plaintiffs by the Company was approximately $104 million. The complaint raised common law claims of fraud, fraudulent inducement, aiding and abetting fraud, and negligent misrepresentation and seeks, among other things, compensatory and/or recessionary damages associated with the plaintiffs’ purchases of such certificates. On March 15, 2013, the court denied in substantial part the defendants’ motion to dismiss the amended complaint, which order the Company appealed on April 11, 2013. On May 3, 2013, the Company filed its answer to the amended complaint. On January 16, 2015, the parties reached an agreement to settle the litigation.
On July 18, 2011, the Western and Southern Life Insurance Company and certain affiliated companies filed a complaint against the Company and other defendants in the Court of Common Pleas in Ohio, styled Western and Southern Life Insurance Company, et al. v. Morgan Stanley Mortgage Capital Inc., et al. An amended complaint was filed on April 2, 2012 and alleges that defendants made untrue statements and material omissions in the sale to plaintiffs of certain mortgage pass-through certificates backed by securitization trusts containing residential mortgage loans. The amount of the certificates allegedly sold to plaintiffs by the Company was approximately $153 million. On June 8, 2015, the parties reached an agreement to settle the litigation.
On September 2, 2011, the Federal Housing Finance Agency (“FHFA”), as conservator for Fannie Mae and Freddie Mac, filed 17 complaints against numerous financial services companies, including the Company and certain affiliates. A complaint against the Company and certain affiliates and other defendants was filed in the Supreme Court of NY, styled Federal Housing Finance Agency, as Conservator v. Morgan Stanley et al. The complaint alleges that defendants made untrue statements and material omissions in connection with the sale to Fannie Mae and Freddie Mac of residential mortgage pass-through certificates with an original unpaid balance of approximately $11 billion. The complaint raised claims under federal and state securities laws and common law and seeks, among other things, rescission and compensatory and punitive damages. On February 7, 2014, the parties entered into an agreement to settle the litigation. On February 20, 2014, the court dismissed the action.
On April 25, 2012, Metropolitan Life Insurance Company and certain affiliates filed a complaint against the Company and certain affiliates in the Supreme Court of NY, styled Metropolitan Life Insurance Company, et al. v. Morgan Stanley, et al. An amended complaint was filed on June 29, 2012, and alleges that the defendants made untrue statements and material omissions in the sale to the plaintiffs of certain mortgage pass-through certificates backed by securitization trusts containing residential mortgage loans. The total amount of certificates allegedly sponsored, underwritten, and/or sold by the Company was approximately $758 million. The amended complaint raised common law claims of fraud, fraudulent inducement, and aiding and abetting fraud and seeks, among other things, rescission, compensatory, and/or rescissionary damages, as well as punitive damages, associated with the plaintiffs’ purchases of such certificates. On April 11, 2014, the parties entered into a settlement agreement.
On April 25, 2012, The Prudential Insurance Company of America and certain affiliates filed a complaint against the Company and certain affiliates in the Superior Court of the State of New Jersey, styled The Prudential Insurance Company of America, et al. v. Morgan Stanley, et al. On October 16, 2012, plaintiffs filed an amended complaint. The amended complaint alleged that defendants made untrue statements and material omissions in connection with the sale to plaintiffs of certain mortgage pass-through certificates backed by securitization trusts containing residential mortgage loans. The total amount of certificates allegedly sponsored, underwritten and/or sold by the Company was approximately $1.073 billion. The amended complaint raises claims under the New Jersey Uniform Securities Law, as well as common law claims of negligent misrepresentation, fraud, fraudulent inducement, equitable fraud, aiding and abetting fraud, and violations of the New Jersey RICO statute, and includes a claim for treble damages. On January 8, 2016, the parties reached an agreement to settle the litigation.
11
In re Morgan Stanley Mortgage Pass-Through Certificates Litigation, which had been pending in the SDNY, was a putative class action involving allegations that, among other things, the registration statements and offering documents related to the offerings of certain mortgage pass-through certificates in 2006 and 2007 contained false and misleading information concerning the pools of residential loans that backed these securitizations. On December 18, 2014, the parties’ agreement to settle the litigation received final court approval, and on December 19, 2014, the court entered an order dismissing the action.
On November 4, 2011, the Federal Deposit Insurance Corporation (“FDIC”), as receiver for Franklin Bank S.S.B, filed two complaints against the Company in the District Court of the State of Texas. Each was styled Federal Deposit Insurance Corporation as Receiver for Franklin Bank, S.S.B v. Morgan Stanley & Company LLC F/K/A Morgan Stanley & Co. Inc. and alleged that the Company made untrue statements and material omissions in connection with the sale to plaintiff of mortgage pass-through certificates backed by securitization trusts containing residential mortgage loans. The amount of certificates allegedly underwritten and sold to plaintiff by the Company in these cases was approximately $67 million and $35 million, respectively. On July 2, 2015, the parties reached an agreement to settle the litigation.
On February 14, 2013, Bank Hapoalim B.M. filed a complaint against the Company and certain affiliates in the Supreme Court of NY, styled Bank Hapoalim B.M. v. Morgan Stanley et al. The complaint alleges that defendants made material misrepresentations and omissions in the sale to plaintiff of certain mortgage pass-through certificates backed by securitization trusts containing residential mortgage loans. The total amount of certificates allegedly sponsored, underwritten and/or sold by the Company to plaintiff was approximately $141 million. On July 28, 2015, the parties reached an agreement to settle the litigation, and on August 12, 2015, the plaintiff filed a stipulation of discontinuance with prejudice.
On September 23, 2013, the plaintiff in National Credit Union Administration Board v. Morgan Stanley & Co. Inc., et al. filed a complaint against the Company and certain affiliates in the SDNY. The complaint alleged that defendants made untrue statements of material fact or omitted to state material facts in the sale to the plaintiff of certain mortgage pass-through certificates issued by securitization trusts containing residential mortgage loans. The total amount of certificates allegedly sponsored, underwritten and/or sold by the Company to plaintiffs in the matter was approximately $417 million. The complaint alleged violations of federal and various state securities laws and sought, among other things, rescissionary and compensatory damages. On November 23, 2015, the parties reached an agreement to settle the matter.
On September 16, 2014, the Virginia Attorney General’s Office filed a civil lawsuit, styled Commonwealth of Virginia ex rel. Integra REC LLC v. Barclays Capital Inc., et al., against the Company and several other defendants in the Circuit Court of the City of Richmond related to RMBS. The lawsuit alleged that the Company and the other defendants knowingly made misrepresentations and omissions related to the loans backing RMBS purchased by the Virginia Retirement System. The complaint asserts claims under the Virginia Fraud Against Taxpayers Act, as well as common law claims of actual and constructive fraud, and seeks, among other things, treble damages and civil penalties. On January 6, 2016, the parties reached an agreement to settle the litigation. An order dismissing the action with prejudice was entered on January 28, 2016.
Additional lawsuits containing claims similar to those described above may be filed in the future. In the course of its business, MS&Co., as a major futures commission merchant, is party to various civil actions, claims and routine regulatory investigations and proceedings that the General Partner believes do not have a material effect on the business of MS&Co. MS&Co. may establish reserves from time to time in connections with such actions.
Item 4. Mine Safety Disclosures. Not Applicable.
12
PART II
Item 5. Market for Registrant’s Common Equity, Related Stockholder Matters and Issuer Purchases of Equity Securities.
| (a) | Market Information. The Partnership has issued no stock. There is no public market for the Redeemable Units. |
| (b) | Holders. The number of holders of Redeemable Units as of February 29, 2016 was 1,607. |
| (c) | Dividends. The Partnership did not declare any distributions in 2015 or 2014. The Partnership does not intend to declare distributions in the foreseeable future. |
| (d) | Securities Authorized for Issuance Under Equity Compensation Plans. None. |
| (e) | Performance Graph. Not applicable. |
| (f) | Recent Sales of Unregistered Securities — Use of Proceeds from Registered Securities. |
| For the year ended December 31, 2015, there were subscriptions of 8,138.7880 Redeemable Units totaling $11,394,455. |
| For the year ended December 31, 2014, there were subscriptions of 10,331.2640 Redeemable Units totaling $14,734,486. |
| For the year ended December 31, 2013, there were subscriptions of 40,735.2062 Redeemable Units totaling $59,560,140. |
The Redeemable Units were issued in reliance upon applicable exemptions from registration under Section 4(a)(2) of the Securities Act, as amended, and Section 506 of Regulation D promulgated thereunder. The Redeemable Units were purchased by accredited investors, as described in Regulation D. In determining the applicability of the exemption, the General Partner relied on the fact that the Redeemable Units were purchased by accredited investors in a private offering.
Proceeds from the subscriptions of Redeemable Units are used in the trading of commodity interests including futures, swap, option and forward contracts and any other interests pertaining thereto, including interests in commodity pools.
| (g) | Purchases of Equity Securities by the Issuer and Affiliated Purchasers. |
The following chart sets forth the purchases of Redeemable Units by the Partnership.
| (d) Maximum Number (or | ||||||||||||
| (c ) Total Number of | Approximate Dollar | |||||||||||
| Redeemable Units | Value) of Redeemable | |||||||||||
| (a) Total Number | (b) Average Price Paid | Purchased as Part of | Units that May Yet Be | |||||||||
| of Reedemable | per Redeemable Unit | Publicly Announced | Purchased Under the | |||||||||
| Period | Units Purchased * | ** | Plans or Programs | Plans or Programs | ||||||||
| October 1, 2015 - October 31, 2015 |
2,103.1970 | $ | 1,314.75 | N/A | N/A | |||||||
| November 1, 2015 - November 30, 2015 |
11,655.4580 | $ | 1,273.40 | N/A | N/A | |||||||
| December 1, 2015 - December 31, 2015 |
3,841.2190 | $ | 1,268.38 | N/A | N/A | |||||||
| 17,599.8740 | $ | 1,277.25 | ||||||||||
| * | Generally, limited partners are permitted to redeem their Redeemable Units as of the end of each month on three business days’ notice to the General Partner. Under certain circumstances, the General Partner can compel redemption, although to date, the General Partner has not exercised this right. Purchases of Redeemable Units by the Partnership reflected in the chart above were made in the ordinary course of the Partnership’s business in connection with effecting redemptions for limited partners. |
| ** | Redemptions of Redeemable Units are effected as of the last day of each month at the net asset value per Redeemable Unit as of that day. No fee will be charged for redemptions. |
13
Item 6. Selected Financial Data.
Total trading results, total investment income, total expenses, net income (loss) and increase (decrease) in net asset value per Redeemable Unit for the years ended December 31, 2015, 2014, 2013, 2012 and 2011 and net asset value per Redeemable Unit and total assets as of December 31, 2015, 2014, 2013, 2012 and 2011 were as follows:
| 2015 | 2014 | 2013 | 2012 | 2011 | ||||||||||||||||
| Total trading results |
$ | (4,099,362) | $ | 6,564,366 | $ | 11,955,236 | $ | 40,915,179 | $ | 48,115,678 | ||||||||||
| Total investment income |
3,602 | 34,622 | 78,603 | 146,336 | 88,938 | |||||||||||||||
| Total expenses |
(11,487,773) | (15,284,432) | (19,989,866) | (20,181,645) | (20,577,259) | |||||||||||||||
|
|
|
|
|
|
|
|
|
|
|
|||||||||||
| Net income (loss) | $ | (15,583,533) | $ | (8,685,444) | $ | (7,956,027) | $ | 20,879,870 | $ | 27,627,357 | ||||||||||
|
|
|
|
|
|
|
|
|
|
|
|||||||||||
| Increase (decrease) in net asset value per Redeemable Unit | $ | (129.88) | $ | (49.75) | $ | (43.18) | $ | 100.25 | $ | 123.85 | ||||||||||
|
|
|
|
|
|
|
|
|
|
|
|||||||||||
| Net asset value per Redeemable Unit | $ | 1,268.38 | $ | 1,398.26 | $ | 1,448.01 | $ | 1,491.19 | $ | 1,390.94 | ||||||||||
|
|
|
|
|
|
|
|
|
|
|
|||||||||||
| Total assets |
$ | 137,909,370 | $ | 209,461,299 | $ | 266,296,505 | $ | 287,857,776 | $ | 290,833,626 | ||||||||||
|
|
|
|
|
|
|
|
|
|
|
|||||||||||
Item 7. Management’s Discussion and Analysis of Financial Condition and Results of Operations.
Overview
The Partnership, through its investment in the Master, seeks to achieve capital appreciation through speculative trading either directly or indirectly in U.S. and international future contracts, options on futures contracts and forward markets. The Partnership may also engage, directly or indirectly, in swap transactions and other derivative transactions with the approval of the General Partner. Initially, the Partnership’s investment strategy focused on energy and energy-related investments. While the Partnership is expected to continue to have significant exposure to energy and energy-related markets, such trading will no longer be the Partnership’s primary focus. Therefore, the Partnership’s past trading performance will not necessarily be indicative of future results.
The General Partner manages all business of the Partnership. The General Partner delegated its responsibility for the investment of the Partnership’s assets to the Advisor. The General Partner engages a team of approximately 30 professionals, whose primary emphasis is on attempting to maintain quality control among the advisors to the funds operated or managed by the General Partner. A full-time staff of due diligence professionals use proprietary technology and on-site evaluations to monitor new and existing futures money managers. The accounting and operations staff provide processing of subscriptions and redemptions and reporting to limited partners and regulatory authorities. The General Partner also includes staff involved in marketing and sales support. In selecting the Advisor for the Partnership, the General Partner considered, among other things, the Advisor’s past performance, trading style, volatility of markets traded and fee requirements. The General Partner may modify or terminate the allocation of assets to the Advisor and allocate assets to additional advisors at any time.
Responsibilities of the General Partner include:
| • | due diligence examinations of the Advisor; |
| • | selection, appointment and termination of the Advisor; |
| • | negotiation of the Management Agreement; and |
| • | monitoring the activity of the Advisor. |
14
In addition, the General Partner will prepare, or will assist the Administrator in preparing, the books and records and will provide, or will assist the Administrator in providing, the administrative and compliance services that are required by law or regulation, from time to time, in connection with the operation of the Partnership/Master.
While the Partnership and the Master have the right to seek lower commission rates from other commodity brokers at any time, the General Partner believes that the customer agreements and other arrangements with the commodity broker are fair, reasonable, and competitive.
Aventis Asset Management, LLC
Effective February 1, 2013, Aventis serves as the Partnership’s sole trading advisor. Aventis trades the Partnership’s assets in accordance with its Aventis Diversified Commodity Strategy. The Aventis Diversified Commodity Strategy is a proprietary trading program developed and refined by Aventis. Aventis synthesizes disparate fundamental views and technical indicators overlaid with strict risk management policies on a position, sector and portfolio basis. Aventis has traded its Aventis Diversified Commodity Strategy for client accounts since September 2006. The Aventis Diversified Commodity Strategy has the following characteristics:
| • | Ensemble of Three Sub-Programs: The Aventis Diversified Commodity Strategy is based on an ensemble of three discretionary sub-programs: spreads, directional and short term trading. This type of trading is based primarily on the fundamentals of the market (i.e., changes in supply or demand of a commodity). It will also include supply and demand of the pit (i.e., discovery of over bought and over sold conditions). |
| • | Spread Trading: Approximately 60% of trading activity will be based on calendar, intra-market and inter-market spreads. Intra-market spreads are where one is simultaneously long and short different delivery months of the same contract (i.e., long April Live Cattle versus short June Live Cattle). Inter-market spreads are where one is long one contract and simultaneously short a completely different contract (i.e., long December Natural Gas and short December Crude Oil). |
| • | Directional Trading: Approximately 35% of the strategy is directional in nature utilizing outright and spread positions. |
| • | Short Term Trading: Approximately 5% of the strategy is involved in short term trading. |
| • | Markets Followed: The Aventis Diversified Commodity Strategy trades on behalf of the Partnership in the following markets, among others: grains, currencies, energies, softs, livestock and metals. |
| • | Risk Management: Effective risk management is also a crucial aspect of the program. Account size, expectation, volatility of markets traded and the nature of other positions taken are all factors in deciding whether to take a position and determining the amount of equity committed to that position. |
Please note that the percentage of assets allocated to the three discretionary sub-programs (spreads, directional and short term trading) will be made pursuant to Aventis’s sole discretion and not in order to maintain any constant percentage allocation among the different sub-programs. As a result, the amount of assets allocated to each sub program—both on a dollar amount and percentage basis — will vary greatly over the life of the Partnership.
Trading decisions may require the exercise of judgment by Aventis. Therefore, successful trading may depend on Aventis’ trading ability, knowledge and judgment. Aventis will exercise its judgment and discretion in interpreting the data generated by its program, and will make all decisions regarding trading, including selecting the markets which will be followed and actively traded. In addition, Aventis will determine the method by which orders are placed, the types of orders that are to be placed, the overall leverage for the portfolio, and, when applicable, the time at which orders are placed with, and executed by, a broker.
The trading program to be followed by Aventis does not assure successful trading. Investment decisions made in accordance with the program will be based on an assessment of available market information. However, because of the large quantity of information at hand, the number of available facts that may be overlooked and the variables that may shift, any investment decision must, in the final analysis, be based on the judgment of Aventis.
15
The decision by Aventis not to trade certain markets or not to make certain trades may result at times in missing price moves and hence profits of great magnitude, which other trading advisors who are willing to trade these markets may be able to capture. Aventis’s approach is dependent in part on the existence of certain technical or fundamental indicators. There have been periods in the past when there were no such market indicators, and those periods may recur.
Aventis believes that the development of a trading strategy is a continual process. As a result of further analysis and research, changes have been made from time to time in the specific manner in which the Aventis Diversified Commodity Strategy evaluates price movements in various markets, and it is likely that similar revisions will be made in the future. As a result of such modifications, the program that may be used by Aventis in the future will differ from that used by Aventis in the past and might differ from that presently being used.
The Aventis Diversified Commodity Strategy is a proprietary and confidential program, and the foregoing description is, of necessity, general and is not intended to be exhaustive. Consequently, an investor will not be able to determine the full details of the program, or whether the program is being followed. There can be no assurance that any trading strategy of Aventis will produce profitable results or will not result in losses. As a managed futures partnership, the Partnership’s/Master’s performance is dependent upon the successful trading of the Advisor to achieve the Partnership’s/Master’s objectives. It is the business of the General Partner to monitor the Advisor’s performance to assure compliance with the Partnership’s/Master’s trading policies and to determine if the Advisor’s performance is meeting the Partnership’s/Master’s objectives. Based on 2015 results, the General Partner believes that both Aventis and the Aventis Diversified Commodity Strategy meet the Partnership’s/Master’s objectives.
| (a) | Liquidity. |
The Partnership does not engage in sales of goods or services. Its only assets are its investment in the Master and cash. The Master does not engage in sales of goods or services. The Master’s only assets are its equity in its trading accounts, consisting of cash and cash margin, net unrealized appreciation on open futures contracts, U.S. Treasury bills, at fair value and options purchased, at fair value, as applicable. Because of the low margin deposits normally required in commodity futures trading, relatively small price movements may result in substantial losses to the Partnership, through its investment in the Master. While substantial losses could lead to a material decrease in liquidity, no such illiquidity occurred during the year ended December 31, 2015.
To minimize the risk relating to low margin deposits, the Master follows certain trading policies, including:
| (i) | The Master invests its assets only in commodity interests that the Advisor believes are traded in sufficient volume to permit ease of taking and liquidating positions. Sufficient volume, in this context, refers to a level of liquidity that the Advisor believes will permit it to enter and exit trades without noticeably moving the market. |
| (ii) | The Advisor will not initiate additional positions in any commodity interest if these positions would result in aggregate positions requiring a margin of more than 66 2/3% of the Master’s net assets allocated to the Advisor. |
| (iii) | The Master may occasionally accept delivery of a commodity. Unless such delivery is disposed of promptly by retendering the warehouse receipt representing the delivery to the appropriate clearinghouse, the physical commodity position is fully hedged. |
| (iv) | The Master does not employ the trading technique commonly known as “pyramiding,” in which the speculator uses unrealized profits on existing positions as margin for the purchases or sale of additional positions in the same or related commodities. |
| (v) | The Master does not utilize borrowings other than short-term borrowings if the Master takes delivery of any cash commodities. |
| (vi) | The Master may, from time to time, employ trading strategies such as spreads or straddles. The terms “spread” and “straddle” describe commodity futures trading strategies involving the simultaneous buying and selling of futures contracts on the same commodity but involving different delivery dates or markets. |
| (vii) | The Master will not permit the churning of its commodity trading account. The term “churning” refers to the practice of entering and exiting trades with a frequency unwarranted by legitimate efforts to profit from the trades, driven by the desire to generate commission income. |
16
From January 1, 2015 through December 31, 2015, the Partnership’s average margin to equity ratio (i.e., the percentage of assets on deposit required for margin) was approximately 4.5%. The foregoing margin to equity ratio takes into account cash held in the Partnership’s name, as well as the allocable value of the positions and cash held on behalf of the Partnership in the name of the Master.
In the normal course of business, the Partnership, through its investment in the Master, is party to financial instruments with off-balance sheet risk, including derivative financial instruments and derivative commodity instruments. These financial instruments may include forwards, futures, options and swaps, whose values are based upon an underlying asset, index, or reference rate, and generally represent future commitments to exchange currencies or cash balances, to purchase or sell other financial instruments at specific terms at specified future dates, or, in the case of derivative commodity instruments, to have a reasonable possibility to be settled in cash, through physical delivery or with another financial instrument. These instruments may be traded on an exchange, a swap execution facility or OTC. Exchange-traded instruments include futures and certain standardized forward, swap and option contracts. Certain swap contracts may also be traded on a swap execution facility or OTC. OTC contracts are negotiated between contracting parties and also include certain forward and option contracts. Specific market movements of commodities or futures contracts underlying an option cannot accurately be predicted. The purchaser of an option may lose the entire premium paid for the option. The writer (or seller) of an option has unlimited risk. Each of these instruments is subject to various risks similar to those related to the underlying financial instruments, including market and credit risk. In general, the risks associated with OTC contracts are greater than those associated with exchange-traded instruments because of the greater risk of default by the counterparty to an OTC contract. None of the Master’s current contracts are traded OTC, although contracts may be traded OTC in the future.
Market risk is the potential for changes in the value of the financial instruments traded by the Partnership/Master due to market changes, including interest and foreign exchange rate movements and fluctuations in commodity or security prices. Market risk is directly impacted by the volatility and liquidity in the markets in which the related underlying assets are traded. The Partnership/Master is exposed to a market risk equal to the value of futures and forward contracts purchased and unlimited liability on such contracts sold short.
Credit risk is the possibility that a loss may occur due to the failure of a counterparty to perform according to the terms of a contract. The Partnership’s/Master’s risk of loss in the event of a counterparty default is typically limited to the amounts recognized in the Statements of Financial Condition and is not represented by the contract or notional amounts of the instruments. The Partnership’s/Master’s risk of loss is reduced through the use of legally enforceable master netting agreements with counterparties that permit the Partnership/Master to offset unrealized gains and losses and other assets and liabilities with such counterparties upon the occurrence of certain events. The Partnership/Master had credit risk and concentration risk during the reporting period, as MS&Co. and/or CGM or their affiliates were the sole counterparties or brokers with respect to the Partnership’s/Master’s assets. Credit risk with respect to exchange-traded instruments is reduced to the extent that, through MS&Co. and/or CGM, the Partnership’s/Master’s counterparty is an exchange or clearing organization. The Partnership/Master continue to be subject to such risk with respect to MS&Co.
SandRidge concentrated the Partnership’s/Master’s trading in energy-related markets. Concentration in a limited number of commodity interests may have subjected the Partnership’s/Master’s account to greater volatility than if a more diversified portfolio of contracts had been traded on behalf of the Partnership/Master. Since February 1, 2013, Aventis has traded a more diversified portfolio of contracts on behalf of the Partnership/Master.
As both a buyer and seller of options, the Partnership/Master pays or receives a premium at the outset and then bears the risk of unfavorable changes in the price of the contract underlying the option. Written options expose the Partnership/Master to potentially unlimited liability; for purchased options the risk of loss is limited to the premiums paid. Certain written put options permit cash settlement and do not require the option holder to own the reference asset. The Master does not consider these contracts to be guarantees.
The General Partner monitors and attempts to control the Partnership’s/Master’s risk exposure on a daily basis through financial, credit and risk management monitoring systems, and believes, accordingly, that it has effective procedures for evaluating and limiting the credit and market risks to which the Partnership/Master may be subject. These monitoring systems generally allow the General Partner to statistically analyze actual trading results with risk-adjusted performance indicators and correlation statistics. In addition, online monitoring systems provide account analysis of futures, exchange-cleared swap and option contracts by sector, margin requirements, gain and loss transactions and collateral positions. (See also “Item 8. Financial Statements and Supplementary Data” for further information on financial instrument risk included in the notes to the financial statements.)
The risk to the limited partners that have purchased Redeemable Units is limited to the amount of their share of the Partnership’s net assets and undistributed profits. The limited liability is a result of the organization of the Partnership as a limited partnership under New York law.
17
Other than the risks inherent in commodity futures, forwards, options and swaps trading, the General Partner knows of no trends, demands, commitments, events or uncertainties which will result in or which are reasonably likely to result in the Master’s liquidity increasing or decreasing in any material way.
| (b) | Capital Resources. |
| (i) | The Partnership has made no material commitments for capital expenditures. |
| (ii) | The Partnership’s capital consists of the capital contributions of the partners, as increased or decreased by net income or losses allocated from the Master on trading and by expenses, interest income allocated from the Master, redemptions of Redeemable Units and distributions of profits, if any. Gains or losses on trading cannot be predicted. Market movements in commodities are dependent upon fundamental and technical factors which the Advisor may or may not be able to identify, such as changing supply and demand relationships, weather, government, agricultural, commercial and trade programs and policies, national and international political and economic events and changes in interest rates. Partnership expenses consist of, among other things, ongoing selling agent fees, clearing fees, advisory fees and administrative fees. The level of these expenses is dependent upon trading performance and the level of Net Assets maintained. In addition, the amount of interest income payable by the Partnership’s commodity broker is dependent upon interest rates over which neither the Partnership nor the commodity broker has control. |
No forecast can be made as to the level of redemptions in any given period. A limited partner may require the Partnership to redeem some or all of its Redeemable Units at their net asset value as of the end of each month on three business days’ notice to the General Partner. There is no fee charged to limited partners in connection with redemptions. Redemptions generally are funded out of the Partnership’s cash holdings and/or redemptions from the Master. For the year ended December 31, 2015, 48,591.4680 Redeemable Units were redeemed totaling $65,921,944 and 426.7770 General Partner Redeemable Units were redeemed totaling $596,636. For the year ended December 31, 2014, 44,156.1010 Redeemable Units were redeemed totaling $62,246,893 and 450.0690 General Partner Redeemable Units were redeemed totaling $650,092. For the year ended December 31, 2013, 47,145.8740 Redeemable Units were redeemed totaling $68,908,448 and 800.7772 Redeemable Units of Special Limited Partner Interest were redeemed totaling $1,194,111.
For the year ended December 31, 2015, there were subscriptions of 8,138.7880 Redeemable Units totaling $11,394,455 and 89.2760 General Partner Redeemable Units totaling $124,831. For the year ended December 31, 2014, there were subscriptions of 10,331.2640 Redeemable Units totaling $14,734,486. For the year ended December 31, 2013, there were subscriptions of 40,735.2062 Redeemable Units totaling $59,560,140.
(c) Results of Operations.
For the year ended December 31, 2015, the net asset value per Redeemable Unit decreased 9.3% from $1,398.26 to $1,268.38. For the year ended December 31, 2014, the net asset value per Redeemable Unit decreased 3.4% from $1,448.01 to $1,398.26. For the year ended December 31, 2013, the net asset value per Redeemable Unit decreased 2.9% from $1,491.19 to $1,448.01.
The Partnership, through its investment in the Master, experienced a net trading loss before fees and expenses of $4,099,362 for the year ended December 31, 2015. Losses were primarily attributable to the Master’s trading of currencies, energy and metals, and were partially offset by gains in grains, livestock and softs. The net trading gain or loss for the Partnership is discussed on page 33 under “Item 8. Financial Statements and Supplementary Data.”
The most significant losses were incurred within the metals complex during May through September from long nickel and copper futures positions as prices moved lower amid ample supply and concern that a slowdown in the Chinese economy would weaken demand. Within the energy sector, losses were recorded during August through December from long positions in crude oil and oil related products as prices decreased considerably due to high production in the U.S. and Middle East, which added to the growing global supply glut. Additional losses in energy were experienced during May from crude oil positions. Within the grain markets, losses were recorded during February from short positions in soybeans as prices increased after the U.S. Department of Agriculture (“USDA”) issued a surprising forecast that U.S. farmers would plant a smaller crop than in 2014. Additional losses were experienced during April from long positions in soybean and wheat futures as prices moved lower after the USDA released a report which indicated that U.S. grain stockpiles were at their highest levels in 28 years. Further losses in the sector were recorded during August and September from long corn and soybean positions as prices decreased following reports of strong U.S. crop yields and concern that China’s economic slowdown will reduce demand. During November, losses were recorded from long positions in corn futures as prices weakened following the release of USDA forecasts, which predicted that global grain inventories will reach record levels in 2016. The Partnership’s losses for the year were partially offset by gains experienced within the soft commodities during April and May from long positions in cocoa futures as prices rallied from weakness in the U.S. dollar and on reports of a fungus outbreak on cocoa farms in West Africa. Additional gains in this sector were experienced during September from long sugar futures positions as prices rose on concern that rain would disrupt the harvest in Brazil, the world’s top sugar producer. Further gains in soft commodities were experienced from long positions in coffee futures. Within the livestock markets, gains were experienced during January and February from short live cattle futures positions as prices declined due to the prospects of heavier cattle weights, increased U.S. imports and cheaper substitution products. Further gains in livestock were achieved during November from short positions in live cattle futures as prices decreased amid persistent worries about the strength of demand.
18
The Partnership, through its investment in the Master, experienced a net trading gain before fees and expenses of $6,564,366 for the year ended December 31, 2014. Gains were primarily attributable to the Master’s trading of grains, and were partially offset by losses in energy, livestock, metals and softs.
The most significant losses were recorded within the energy markets during January and February from short natural gas futures positions as prices advanced following a U.S. government report that showed a record drop in U.S. inventories after cold weather boosted demand for the heating fuel. Additional losses were incurred in this sector during July from long West Texas Intermediate crude oil and oil distillates positions as prices declined amid reports of rising oil stockpiles and speculation of slowing global growth. Further losses were recorded during December from long positions in RBOB gasoline as prices declined as global supplies outstripped demand. Within the livestock markets, losses were incurred during February from short lean hog futures positions as prices rallied due to a spreading virus, which caused slaughter rates to decline and supplies to shrink. Additional losses were incurred during September through November from short cattle futures positions as prices increased amid speculation that the cattle market would remain tight throughout the rest of the year. Within soft commodities markets, losses were incurred during June and July from long cocoa futures positions as prices decreased due to a larger-than-expected crop in the West African region. Additional losses were incurred during September through November from long coffee positions as prices decreased as improving conditions in Brazil caused a selloff in the coffee market. A portion of the Partnership’s losses during the year was offset by gains recorded within the grain sector during May through September from short positions in corn and soybean as prices declined after favorable growing conditions in the U.S. Midwest increased speculation that crop totals would reach record levels during 2014. Gains were achieved in the metals sector during March from long palladium futures positions as prices increased after rising tensions between Russia and Ukraine raised concern of a possible supply disruption.
19
Interest income on 80% of the Partnership’s daily average equity allocated to it by the Master is earned at the 4-week U.S. Treasury bill discount rate. All interest earned on U.S. Treasury bills purchased will be retained by the Partnership and the Master. Interest income allocated from the Master for the three and twelve months ended December 31, 2015 decreased by $11,349 and $31,020, respectively, as compared to the corresponding periods in 2014. The decrease in interest income is due to lower daily average equity and lower U.S. Treasury bill rates during the three and twelve months ended December 31, 2015, as compared to the corresponding periods in 2014. Interest earned by the Partnership will increase the net asset value of the Partnership. The amount of interest income earned by the Partnership during the reporting period depended on the average daily equity in the Master’s account and upon interest rates over which the Partnership, the Master and the commodity broker had no control.
Ongoing selling agent fees are calculated as a percentage of the Partnership’s adjusted net asset value as of the end of each month and are affected by trading performance, subscriptions and redemptions. Accordingly, they must be compared in relation to the fluctuations in the monthly net asset values. Ongoing selling agent fees for the three and twelve months ended December 31, 2015 decreased by $324,353 and $2,609,981, respectively, as compared to the corresponding periods in 2014. The decrease in ongoing selling agent fees is due to lower average net assets during the three and twelve months ended December 31, 2015, as compared to the corresponding periods in 2014, as well as reductions in ongoing selling agent fees effective April 1, 2014 and October 1, 2014.
Management fees are calculated as a percentage of the Partnership’s net asset value as of the end of each month and are affected by trading performance, subscriptions and redemptions. Management fees for the three and twelve months ended December 31, 2015 decreased by $202,741 and $690,756, respectively, as compared to the corresponding periods in 2014. The decrease in management fees is due to lower average net assets during the three and twelve months ended December 31, 2015, as compared to the corresponding periods in 2014, as well as a reduction in management fees paid to Aventis from an annual rate of 1.50% to an annual rate of 1.25% effective March 1, 2014.
General Partner fees are calculated as a percentage of the Partnership’s net asset value as of the end of each month and are affected by trading performance, subscriptions and redemptions. General Partner fees for the three months ended December 31, 2015 decreased by $162,194, as compared to the corresponding period in 2014. The decrease in General Partner fees is due to lower average net assets during the three months ended December 31, 2015, as compared to the corresponding period in 2014. General Partner fees for the twelve months ended December 31, 2015 increased by $415,055, as compared to the corresponding period in 2014. The increase in General Partner fees is due to an increase in the General Partner fee rate from 0.5% per year to 1.00% per year effective October 1, 2014.
Incentive fees are based on the new trading profits generated by Aventis at the end of the quarter, as defined in the Aventis Advisory Agreement. There were no incentive fees paid for the three and twelve months ended December 31, 2015 and 2014. Aventis will not earn an incentive fee until Aventis recovers the net loss incurred prior to the date of the Aventis Management Agreement and earns new trading profits for the Partnership.
The Partnership pays professional fees, which generally include professional fees made up of legal and accounting expenses, as well as certain offering costs and filing, administrative, reporting and data processing fees. Professional fees for the years ended December 31, 2015 and 2014 were $421,428 and $446,773, respectively.
The Partnership, through its investment in the Master, experienced a net trading gain before fees and expenses of $11,955,236 for the year ended December 31, 2013. Gains were primarily attributable to the Master’s trading of energy and grains, and were partially offset by losses in currencies and livestock.
During the year ended December 31, 2013, the Partnership recorded a loss in Net Asset Value per Redeemable Unit as trading gains in grains, soft commodities, and energies were offset by losses within the livestock and metals sectors. The most significant gains were achieved within the grains market during June, July, and September from short positions in corn and soybean futures as prices declined on ideal growing weather in the U.S. and strong crop yields. Further gains in this sector were recorded from short positions during February.
20
Within the soft commodities markets, gains in June through November were mostly attributed to long cocoa futures positions as prices climbed higher due to concern that dry weather in West Africa, the world’s top growing region for cocoa, would potentially damage crops, and amid increased demand due to higher chocolate production. Within the energy complex, gains were experienced from long natural gas positions in December as cold weather encouraged a rally in futures prices, options, and calendar spreads. Additional gains in this sector were the result of a short bias in crude oil during October. The Partnership’s gains for the year were offset by losses recorded within the livestock market, primarily during March, from long positions in live cattle futures as prices declined on speculation of weaker U.S. demand During the third quarter, the Partnership incurred further losses in livestock futures as prices increased on speculation of a decrease in supplies. During October, losses in livestock were attributed to nervousness in the hogs market amid a spreading virus flowing over to the cattle pit and prompting a short covering rally, which hurt Aventis’ spread position. Within the metals complex, losses were recorded in October from short positions in gold futures as prices moved higher during the U.S. Government shutdown as investors sought the safety of the precious metal as a store of value.
In the General Partner’s opinion, the Advisor continues to employ its trading methods in a consistent and disciplined manner and its results are consistent with the objectives of the Partnership and expectations for the Advisor’s program. The General Partner continues to monitor the Advisor’s performance on a daily, weekly, monthly and annual basis.
Commodity futures markets are highly volatile. Broad price fluctuations and rapid inflation increase the risks involved in commodity trading, but also increase the possibility of profit or loss. The profitability of the Partnership depends on the existence of major price trends and the ability of the Advisor to correctly identify those price trends. Price trends are influenced by, among other things, changing supply and demand relationships, weather, governmental, agricultural, commercial and trade programs and policies, national and international political and economic events and changes in interest rates. To the extent that market trends exist and the Advisor is able to identify them, the Partnership expects to increase capital through operations.
21
In allocating substantially all of the assets of the Partnership to the Master, the General Partner considered, among other things, the Advisor’s past performance, trading style, volatility of markets traded and fee requirements. The General Partner may modify or terminate the allocation of assets to the Advisor and allocate assets to additional advisors at any time.
(d) Off-balance Sheet Arrangements. None.
(e) Contractual Obligations. None.
(f) Operational Risk
The Partnership, through its investment in the Master, is directly exposed to market risk and credit risk, which arise in the normal course of its business activities. Slightly less direct, but of critical importance, are risks pertaining to operational and back office support. This is particularly the case in a rapidly changing and increasingly global environment with increasing transaction volumes and an expansion in the number and complexity of products in the marketplace.
Such risks include:
Operational/Settlement Risk — the risk of financial and opportunity loss and legal liability attributable to operational problems, such as inaccurate pricing of transactions, untimely trade execution, clearance and/or settlement, or the inability to process large volumes of transactions. The Partnership/Master is subject to increased risks with respect to its trading activities in emerging market securities, where clearance, settlement, and custodial risks are often greater than in more established markets.
Technological Risk — the risk of loss attributable to technological limitations or hardware failure that constrain the Partnership’s/Master’s ability to gather, process, and communicate information efficiently and securely, without interruption, to customers, and in the markets where the Partnership/Master participates. Additionally, the General Partner’s computer systems may be vulnerable to unauthorized access, mishandling or misuse, computer viruses or malware, cyber attacks and other events that could have a security impact on such systems. If one or more of such events occur, this potentially could jeopardize a limited partner’s personal, confidential, proprietary or other information processed and stored in, and transmitted through, the General Partner’s computer systems, and adversely affect the Partnership’s business, financial condition or results of operations.
Legal/Documentation Risk — the risk of loss attributable to deficiencies in the documentation of transactions (such as trade confirmations) and customer relationships (such as master netting agreements) or errors that result in noncompliance with applicable legal and regulatory requirements.
Financial Control Risk — the risk of loss attributable to limitations in financial systems and controls. Strong financial systems and controls ensure that assets are safeguarded, that transactions are executed in accordance with the General Partner’s authorization, and that financial information utilized by the General Partner and communicated to external parties, including the Partnership’s Redeemable Unit holders, creditors, and regulators, is free of material errors.
22
(g) Critical Accounting Policies.
Partnership’s Investments. The Partnership carries its investment in the Master based on the Partnership’s (1) net contribution to the Master and (2) its allocated share of the undistributed profits and losses, including realized gains or losses and net change in unrealized gains or losses, of the Master.
Master’s Fair Value Measurements. Fair value is defined as the price that would be received to sell an asset or paid to transfer a liability in an orderly transaction between market participants at the measurement date under current market conditions. The fair value hierarchy gives the highest priority to unadjusted quoted prices in active markets for identical assets or liabilities (Level 1) and the lowest priority to fair values derived from unobservable inputs (Level 3). The level in the fair value hierarchy within which the fair value measurement in its entirety falls shall be determined based on the lowest level input that is significant to the fair value measurement in its entirety.
The fair value of exchange-traded futures, option and forward contracts is determined by the various exchanges, and reflects the settlement price for each contract as of the close of business on the last business day of the reporting period. The fair value of foreign currency forward contracts was extrapolated on a forward basis from the spot prices quoted as of approximately 3:00 P.M. (E.T.) on the last business day of the reporting period from various exchanges. The fair value of non-exchange-traded foreign currency option contracts was calculated by applying an industry standard model application for options valuation of foreign currency options, using as input the spot prices, interest rates, and option implied volatilities quoted as of approximately 3:00 P.M. (E.T.) on the last business day of the reporting period. U.S. Treasury bills are valued at the last available bid price received from independent pricing services as of the close of the last business day of the reporting period.
The Master considers prices for exchange-traded commodity futures, forward, swap and option contracts to be based on unadjusted quoted prices in active markets for identical assets and liabilities (Level 1). The values of U.S. Treasury bills, non-exchange-traded forward, swap and certain option contracts for which market quotations are not readily available are priced by broker quotes or pricing services that derive fair values for those assets and liabilities from observable inputs (Level 2). As of and for the years ended December 31, 2015 and 2014, the Master did not hold any derivative instruments that were priced at fair value using unobservable inputs through the application of the General Partner’s assumptions and internal valuation pricing models (Level 3). Transfers between levels are recognized at the end of the reporting period. For the years ended December 31, 2015 and 2014, there were no transfers of assets or liabilities between Level 1 and Level 2.
Futures Contracts. The Master trades futures contracts. A futures contract is a firm commitment to buy or sell a specified quantity of investments, currency or a standardized amount of a deliverable grade commodity, at a specified price on a specified future date, unless the contract is closed before the delivery date or the delivery quantity is something where physical delivery cannot occur (such as the S&P 500 Index), whereby such contract is settled in cash. Payments (“variation margin”) may be made or received by the Master each business day, depending on the daily fluctuations in the value of the underlying contracts, and are recorded as unrealized gains or losses by the Master. When the contract is closed, the Master records a realized gain or loss equal to the difference between the value of the contract at the time it was opened and the value at the time it was closed. Transactions in futures contracts require participants to make both initial margin deposits of cash or other assets and variation margin deposits, through the futures broker, directly with the exchange on which the contracts are traded. Net realized gains (losses) and net change in unrealized gains (losses) on futures contracts are included in the Master’s Statements of Income and Expenses.
Options. The Master may purchase and write (sell) both exchange-listed and OTC options on commodities or financial instruments. An option is a contract allowing, but not requiring, its holder to buy (call) or sell (put) a specific or standard commodity or financial instrument at a specified price during a specified time period. The option premium is the total price paid or received for the option contract. When the Master writes an option, the premium received is recorded as a liability in the Master’s Statements of Financial Condition and marked to market daily. When the Master purchases an option, the premium paid is recorded as an asset in the Master’s Statements of Financial Condition and marked to market daily. Net realized gains (losses) and net change in unrealized gains (losses) on options contracts are included in the Master’s Statement of Income and Expenses.
London Metals Exchange Forward Contracts. Metal contracts traded on the London Metals Exchange (“LME”) represent a firm commitment to buy or sell a specified quantity of aluminum, copper, lead, nickel, tin or zinc. LME contracts traded by the Master are cash settled based on prompt dates published by the LME. Payments (“variation margin”) may be made or received by the Master each business day, depending on the daily fluctuations in the value of the underlying contracts, and are recorded as unrealized gains or losses by the Master. A contract is considered offset when all long positions have been matched with a like number of short positions settling on the same prompt date. When the contract is closed at the prompt date, the Master records a realized gain or loss equal to the difference between the value of the contract at the time it was opened and the value at the time it was closed. Transactions in LME contracts require participants to make both initial margin deposits of cash or other assets and variation margin deposits, through the broker, directly with the LME. Net realized gains (losses) and net change in unrealized gains (losses) on metal contracts are included in the Master’s Statements of Income and Expenses.
23
Item 7A. Quantitative and Qualitative Disclosures About Market Risk.
Introduction
The Master is a speculative commodity pool. The market sensitive instruments held by the Master are acquired for speculative trading purposes, and all or substantially all of the Partnership’s assets are subject to the risk of trading loss, through its investment in the Master. Unlike an operating company, the risk of market sensitive instruments is integral, not incidental, to the Master’s and the Partnership’s main line of business.
The limited partners will not be liable for losses exceeding the current net asset value of their investment. This limited liability is a result of the organization of the Partnership as a limited partnership under New York law.
Market movements result in frequent changes in the fair market value of the Master’s open positions and, consequently, in its earnings and cash flow. The Master’s and the Partnership’s market risk is influenced by a wide variety of factors, including the level and volatility of interest rates, exchange rates, equity price levels, the market value of financial instruments and contracts, the diversification effects among the Master’s open contracts and the liquidity of the markets in which it trades.
24
The Master rapidly acquires and liquidates both long and short positions in a wide range of different markets. Consequently, it is not possible to predict how a particular future market scenario will affect performance, and the Master’s past performance is not necessarily indicative of its future results.
“Value at Risk” is a measure of the maximum amount which the Master could reasonably be expected to lose in a given market sector. However, the inherent uncertainty of the Master’s speculative trading and the recurrence in the markets traded by the Master of market movements far exceeding expectations could result in actual trading or non-trading losses far beyond the indicated Value at Risk or the Master’s experience to date (i.e., “risk of ruin”). In light of the foregoing, as well as the risks and uncertainties intrinsic to all future projections, the inclusion of the quantification in this section should not be considered to constitute any assurance or representation that the Master’s losses in any market sector will be limited to Value at Risk or by the Master’s attempts to manage its market risk.
Materiality as used in this section, “Item 7A. Qualitative and Quantitative Disclosures About Market Risk,” is based on an assessment of reasonably possible market movements and the potential losses caused by such movements, taking into account the leverage, optionality and multiplier features of the Master’s market sensitive instruments.
Quantifying the Partnership’s/Master’s Trading Value at Risk
The following quantitative disclosures regarding the Master’s market risk exposures contain “forward-looking statements” within the meaning of the safe harbor from civil liability provided for such statements by the Private Securities Litigation Reform Act of 1995 (set forth in Section 27A of the Securities Act and Section 21E of the Exchange Act). All quantitative disclosures in this section are deemed to be forward-looking statements for purposes of the safe harbor except for statements of historical fact (such as the terms of particular contracts and the number of market risk sensitive instruments held during or at the end of the reporting period).
The Master’s risk exposure in the various market sectors traded by the Advisor is quantified below in terms of Value at Risk. Due to the Master’s mark-to-market accounting, any loss in the fair value of the Master’s open portion is directly reflected in the Partnership’s earnings (realized or unrealized allocated from the Master).
Exchange margin requirements have been used by the Master as the measure of its Value at Risk. Margin requirements are set by exchanges to equal or exceed the maximum losses reasonably expected to be incurred in the fair value of any given contract in 95%-99% of any one-day interval. The margin levels are established by dealers and exchanges using historical price studies as well as an assessment of current market volatility (including the implied volatility of the options on a given futures contract) and economic fundamentals to provide a probabilistic estimate of the maximum expected near-term one-day price fluctuation.
In the case of market sensitive instruments which are not exchange-traded, the margin requirements for the equivalent futures positions have been used as Value at Risk. In those rare cases in which a futures-equivalent margin is not available, dealers’ margins have been used.
The fair value of the Master’s futures and forward positions does not have any optionality component. However, the Advisor may trade commodity options. The Value at Risk associated with options is reflected in the following table as the margin requirement attributable to the instrument underlying each option. Where this instrument is a futures contract, the futures margin has been used, and where this instrument is a physical commodity, the futures-equivalent margin has been used. This calculation is conservative in that it assumes that the fair value of an option will decline by the same amount as the fair value of the underlying instrument, whereas, in fact, the fair values of the options traded by the Master in almost all cases fluctuate to a lesser extent than those of the underlying instruments.
In quantifying the Master’s Value at Risk, 100% positive correlation in the different positions held in each market risk category has been assumed. Consequently, the margin requirements applicable to the open contracts have simply been added to determine each trading category’s aggregate Value at Risk. The diversification effects resulting from the fact that the Master’s positions are rarely, if ever, 100% positively correlated have not been reflected.
25
The Master’s Trading Value at Risk in Different Market Sectors
Value at Risk tables represent a probabilistic assessment of the risk of loss in market sensitive instruments. The following table indicates the trading Value at Risk associated with MB Master’s open positions by market category as of December 31, 2015, and the highest, lowest and average value at any point during the year. All open position trading risk exposures of MB Master have been included in calculating the figures set forth below. As of December 31, 2015, MB Master’s total capitalization was $159,372,646 and the Partnership owned approximately 86.4% of MB Master. The Partnership invested substantially all of its assets in MB Master. MB Master’s Value at Risk as of December 31, 2015 was as follows:
| December 31, 2015 | ||||||||||||||||||||
| % of Total | High | Low | Average | |||||||||||||||||
| Market Sector |
Value at Risk | Capitalization | Value at Risk | Value at Risk | Value at Risk* | |||||||||||||||
| Energy |
$ | 604,203 | 0.38 | % | $ | 6,373,658 | $ | 85,608 | $ | 3,088,794 | ||||||||||
| Grains |
719,382 | 0.45 | 6,945,244 | 101,193 | 2,873,016 | |||||||||||||||
| Livestock |
142,560 | 0.09 | 2,777,359 | 10,005 | 361,832 | |||||||||||||||
| Softs |
371,327 | 0.23 | 2,986,688 | 336,168 | 1,723,568 | |||||||||||||||
|
|
|
|
|
|||||||||||||||||
| Total |
$ | 1,837,472 | 1.15 | % | ||||||||||||||||
|
|
|
|
|
|||||||||||||||||
| * | Annual average of month-end Values at Risk. |
As of December 31, 2014, MB Master’s total capitalization was $228,148,871 and the Partnership owned approximately 91.7% of MB Master. The Partnership invested substantially all of its assets in MB Master. MB Master’s Value at Risk as of December 31, 2014 was as follows:
| December 31, 2014 | ||||||||||||||||||||
| % of Total | High | Low | Average | |||||||||||||||||
| Market Sector |
Value at Risk | Capitalization | Value at Risk | Value at Risk | Value at Risk* | |||||||||||||||
| Energy |
$ | 4,621,316 | 2.02 | % | $ | 19,263,186 | $ | 1,167,065 | $ | 7,264,460 | ||||||||||
| Grains |
4,007,623 | 1.76 | 12,658,692 | 227,189 | 5,511,816 | |||||||||||||||
| Livestock |
2,120,485 | 0.93 | 2,385,459 | 214 | 519,782 | |||||||||||||||
| Softs |
1,518,859 | 0.67 | 3,591,096 | 1,297,496 | 2,081,253 | |||||||||||||||
|
|
|
|
|
|||||||||||||||||
| Total |
$ | 12,268,283 | 5.38 | % | ||||||||||||||||
|
|
|
|
|
|||||||||||||||||
| * | Annual average of month-end Values at Risk. |
Material Limitations on Value at Risk as an Assessment of Market Risk
The face value of the market sector instruments held by the Master is typically many times the applicable margin requirement (margin requirements generally range between 1% and 15% of contract face value, although an exchange may increase margin requirements on short notice), as well as many times the capitalization of the Master. The magnitude of the Master’s open positions creates a “risk of ruin” not typically found in most other investment vehicles. Because of the size of its positions, certain market conditions — unusual, but historically recurring from time to time — could cause the Master to incur severe losses over a short period of time. The foregoing Value at Risk tables — as well as the past performance of the Master — give no indication of this “risk of ruin.”
Non-Trading Risk
The Master has non-trading market risk on its foreign cash balances not needed for margin. However, these balances (as well as any market risk that they represent) are immaterial.
26
Qualitative Disclosures Regarding Primary Trading Risk Exposures
The following qualitative disclosures regarding the Master’s market risk exposures — except for (i) those disclosures that are statements of historical fact and (ii) the descriptions of how the Master manages its primary market risk exposures — constitute forward-looking statements within the meaning of Section 27A of the Securities Act and Section 21E of the Exchange Act. The Master’s primary market risk exposures as well as the strategies used and to be used by the General Partner and the Advisor for managing such exposures are subject to numerous uncertainties, contingencies and risks, any one of which could cause the actual results of the Master’s risk controls to differ materially from the objectives of such strategies. Government interventions, defaults and expropriations, illiquid markets, the emergence of dominant fundamental factors, political upheavals, changes in historical price relationships, an influx of new market participants, increased regulation and many other factors could result in material losses as well as in material changes to the risk exposures and the management strategies of the Master. There can be no assurance that the Master’s current market exposure and/or risk management strategies will not change materially or that any such strategies will be effective in either the short or long term. Investors must be prepared to lose all or substantially all of their investment in the Partnership.
The following were the primary trading risk exposures of the Master as of December 31, 2015, by market sector.
Metals. The Master’s primary metal market exposure is to fluctuations in the price of gold, silver, platinum and palladium.
Softs. The Master’s primary commodities exposure is to agricultural price movements, which are often directly affected by severe or unexpected weather conditions. Cocoa, coffee, sugar and cotton accounted for the bulk of the Master’s commodity exposure.
Energy. The Master’s primary energy market exposure is to natural gas and oil price movements, often resulting from political developments in the Middle East. Political developments in other countries or regions can also materially impact upon the prices of energy products, as could changing supply and demand relationships, weather, governmental, commercial and trade programs and policies, and other significant economic events. Energy prices can be volatile and substantial profits and losses have been and are expected to continue to be experienced in these markets.
Grains. The Master’s commodities exposure is to agricultural price movements, which are often directly affected by severe or unexpected weather conditions.
Livestock. Live cattle and lean hog accounted for the bulk of the Master’s commodity exposure.
Qualitative Disclosures Regarding Means of Managing Risk Exposure
The General Partner monitors and attempts to control the Partnership’s (through its investment in the Master) risk exposure on a daily basis through financial, credit and risk management monitoring systems, and, accordingly, believes that it has effective procedures for evaluating and limiting the credit and market risks to which the Master may be subject.
The General Partner monitors the Master’s performance and the concentration of open positions, and consults with the Advisor concerning the Master’s overall risk profile. If the General Partner felt it necessary to do so, the General Partner could require the Advisor to close out positions as well as enter positions traded on behalf of the Master. However, any such intervention would be a highly unusual event. The General Partner primarily relies on the Advisor’s own risk control policies while maintaining a general supervisory overview of the Master’s market risk exposures.
The Advisor applies its own risk management policies to its trading. The Advisor often follows diversification guidelines, margin limits and stop loss points to exit a position. The Advisor’s research of risk management often suggests ongoing modifications to its trading programs.
As part of the General Partner’s risk management, the General Partner periodically meets with the Advisor to discuss its risk management and to look for any material changes to the Advisor’s portfolio balance and trading techniques. The Advisor is required to notify the General Partner of any material changes to its programs.
27
Item 8. Financial Statements and Supplementary Data.
MANAGED FUTURES PREMIER AVENTIS II L.P.
The following financial statements and related items of the Partnership are filed under this Item 8: Oath or Affirmation, Management’s Report on Internal Control over Financial Reporting, Report of Independent Registered Public Accounting Firm, for the years ended December 31, 2015, 2014 and 2013; Statements of Financial Condition at December 31, 2015 and 2014; Statements of Income and Expenses for the years ended December 31, 2015, 2014 and 2013; Statements of Changes in Partners’ Capital for the years ended December 31, 2015, 2014 and 2013; and Notes to Financial Statements.
28
To the Limited Partners of
Managed Futures Premier Aventis II L.P.
To the best of the knowledge and belief of the undersigned, the information contained herein is accurate and complete.
|
| ||
| By: | Patrick T. Egan President and Director Ceres Managed Futures LLC General Partner, Managed Futures Premier Aventis II L.P. | |
|
Ceres Managed Futures LLC 522 Fifth Avenue New York, NY 10036 (855) 672-4468 | ||

29
Management’s Report on Internal Control over
Financial Reporting
The management of Managed Futures Premier Aventis II L.P. (formerly, Bristol Energy Fund L.P.) (the “Partnership”), Ceres Managed Futures LLC, is responsible for establishing and maintaining adequate internal control over financial reporting as defined in Rules 13a-15(f) and 15d-15(f) under the Securities Exchange Act of 1934 and for our assessment of internal control over financial reporting. The Partnership’s internal control over financial reporting is a process designed to provide reasonable assurance regarding the reliability of financial reporting and the preparation of financial statements for external purposes in accordance with accounting principles generally accepted in the United States of America. The Partnership’s internal control over financial reporting includes those policies and procedures that:
(i) pertain to the maintenance of records that, in reasonable detail, accurately and fairly reflect the transactions and dispositions of the assets of the Partnership;
(ii) provide reasonable assurance that transactions are recorded as necessary to permit preparation of financial statements in accordance with accounting principles generally accepted in the United States of America, and that receipts and expenditures of the Partnership are being made only in accordance with authorizations of management and directors of the Partnership; and
(iii) provide reasonable assurance regarding prevention or timely detection and correction of unauthorized acquisition, use or disposition of the Partnership’s assets that could have a material effect on the financial statements.
Because of its inherent limitations, internal control over financial reporting may not prevent or detect misstatements. Also, projections of any evaluation of effectiveness to future periods are subject to the risk that controls may become inadequate because of changes in conditions, or that the degree of compliance with the policies or procedures may deteriorate.
The management of Managed Futures Premier Aventis II L.P. has assessed the effectiveness of the Partnership’s internal control over financial reporting as of December 31, 2015. In making this assessment, management used the criteria set forth in the Internal Control-Integrated Framework (2013) issued by the Committee of Sponsoring Organizations of the Treadway Commission. Based on our assessment, management concluded that the Partnership maintained effective internal control over financial reporting as of December 31, 2015 based on the criteria referred to above.

|

| |||
| Patrick T. Egan President and Director Ceres Managed Futures LLC General Partner, Managed Futures Premier Aventis II L.P. |
Steven Ross Chief Financial Officer and Director Ceres Managed Futures LLC General Partner, Managed Futures Premier Aventis II L.P. |
30
REPORT OF INDEPENDENT REGISTERED PUBLIC ACCOUNTING FIRM
To the Partners of Managed Futures Premier Aventis II L.P.:
We have audited the accompanying statements of financial condition of Managed Futures Premier Aventis II L.P. (the “Partnership”) as of December 31, 2015 and 2014, and the related statements of income and expenses and changes in partners’ capital for each of the three years in the period ended December 31, 2015. These financial statements are the responsibility of the Partnership’s management. Our responsibility is to express an opinion on these financial statements based on our audits.
We conducted our audits in accordance with the standards of the Public Company Accounting Oversight Board (United States). Those standards require that we plan and perform the audit to obtain reasonable assurance about whether the financial statements are free of material misstatement. The Partnership is not required to have, nor were we engaged to perform, an audit of its internal control over financial reporting. Our audits included consideration of internal control over financial reporting as a basis for designing audit procedures that are appropriate in the circumstances, but not for the purpose of expressing an opinion on the effectiveness of the Partnership’s internal control over financial reporting. Accordingly, we express no such opinion. An audit also includes examining, on a test basis, evidence supporting the amounts and disclosures in the financial statements, assessing the accounting principles used and significant estimates made by management, as well as evaluating the overall financial statement presentation. We believe that our audits provide a reasonable basis for our opinion.
In our opinion, such financial statements present fairly, in all material respects, the financial position of Managed Futures Premier Aventis II, L.P. as of December 31, 2015 and 2014, and the results of its operations and changes in its partners’ capital for each of the three years in the period ended December 31, 2015, in conformity with accounting principles generally accepted in the United States of America.
/s/ Deloitte & Touche LLP
New York, New York
March 24, 2016
31
Managed Futures Premier Aventis II L.P.
Statements of Financial Condition
December 31, 2015 and 2014
| December 31, | December 31, | |||||||
| 2015 | 2014 | |||||||
| Assets: |
||||||||
| Investment in Master, at fair value (Note 1) |
$ | 137,625,666 | $ | 209,288,768 | ||||
| Cash (Note 3c) |
283,704 | 172,531 | ||||||
|
|
|
|
|
|||||
| Total assets |
$ | 137,909,370 | $ | 209,461,299 | ||||
|
|
|
|
|
|||||
| Liabilities and Partners’ Capital: |
||||||||
| Liabilities: |
||||||||
| Accrued expenses: |
||||||||
| Ongoing selling agent fees (Note 3c) |
$ | 229,849 | $ | 349,102 | ||||
| Management fees (Note 3b) |
143,148 | 217,637 | ||||||
| General Partner fees (Note 3a) |
114,519 | 174,110 | ||||||
| Professional fees |
257,197 | 180,684 | ||||||
| Redemptions payable to Limited Partners (Note 6) |
4,872,125 | 5,664,407 | ||||||
|
|
|
|
|
|||||
| Total liabilities |
5,616,838 | 6,585,940 | ||||||
|
|
|
|
|
|||||
| Partners’ Capital: (Notes 1 and 6) |
||||||||
| General Partner, 1,310.9445 and 1,648.4455 Redeemable Units outstanding at December 31, 2015 and 2014, respectively |
1,662,770 | 2,304,961 | ||||||
| Limited Partners, 102,989.8117 and 143,442.4917 Redeemable Units outstanding at December 31, 2015 and 2014, respectively |
130,629,762 | 200,570,398 | ||||||
|
|
|
|
|
|||||
| Total partners’ capital |
132,292,532 | 202,875,359 | ||||||
|
|
|
|
|
|||||
| Total liabilities and partners’ capital |
$ | 137,909,370 | $ | 209,461,299 | ||||
|
|
|
|
|
|||||
| Net asset value per Redeemable Unit |
$ | 1,268.38 | $ | 1,398.26 | ||||
|
|
|
|
|
|||||
See accompanying notes to financial statements.
32
Managed Futures Premier Aventis II L.P.
Statements of Income and Expenses for the years ended
December 31, 2015, 2014 and 2013
| 2015 | 2014 | 2013 | ||||||||||
| Investment Income: |
||||||||||||
| Interest income allocated from Master (Note 3c) |
$ | 3,602 | $ | 34,622 | $ | 78,603 | ||||||
|
|
|
|
|
|
|
|||||||
| Expenses: |
||||||||||||
| Expenses allocated from Master |
3,254,349 | 4,139,981 | 4,362,862 | |||||||||
| Ongoing selling agent fees (Note 3c) |
3,682,073 | 6,292,054 | 10,101,692 | |||||||||
| Management fees (Note 3b) |
2,294,402 | 2,985,158 | 3,902,950 | |||||||||
| General Partner fees (Note 3a) |
1,835,521 | 1,420,466 | 1,342,201 | |||||||||
| Professional fees |
421,428 | 446,773 | 280,161 | |||||||||
|
|
|
|
|
|
|
|||||||
| Total expenses |
11,487,773 | 15,284,432 | 19,989,866 | |||||||||
|
|
|
|
|
|
|
|||||||
| Net investment loss |
(11,484,171) | (15,249,810) | (19,911,263) | |||||||||
|
|
|
|
|
|
|
|||||||
| Trading Results: |
||||||||||||
| Net gains (losses) on investment in Master: |
||||||||||||
| Net realized gains (losses) on closed contracts allocated from Master |
(2,595,140) | 6,751,678 | 7,387,671 | |||||||||
| Net change in unrealized gains (losses) on open contracts allocated from Master |
(1,504,222) | (187,312) | 4,567,565 | |||||||||
|
|
|
|
|
|
|
|||||||
| Total trading results |
(4,099,362) | 6,564,366 | 11,955,236 | |||||||||
|
|
|
|
|
|
|
|||||||
| Net income (loss) |
$ | (15,583,533) | $ | (8,685,444) | $ | (7,956,027) | ||||||
|
|
|
|
|
|
|
|||||||
| Net income (loss) per Redeemable Unit (Note 7)* |
$ | (129.88) | $ | (49.75) | $ | (43.18) | ||||||
|
|
|
|
|
|
|
|||||||
| Weighted average Redeemable Units outstanding |
133,134.7727 | 162,465.6940 | 184,840.3100 | |||||||||
|
|
|
|
|
|
|
|||||||
| * | Represents the change in net asset value per Redeemable Unit. |
See accompanying notes to financial statements.
33
Managed Futures Premier Aventis II L.P.
Statements of Changes in Partners’ Capital for the years ended
December 31, 2015, 2014 and 2013
| Special | ||||||||||||||||
| Limited | Limited | General | ||||||||||||||
| Partners | Partner | Partner | Total | |||||||||||||
| Partners’ Capital, December 31, 2012 |
$ | 273,898,353 | $ | 1,194,111 | $ | 3,129,284 | $ | 278,221,748 | ||||||||
| Net income (loss) |
(7,865,413) | - | (90,614) | (7,956,027) | ||||||||||||
| Subscriptions of 40,735.2062 Redeemable Units |
59,560,140 | - | - | 59,560,140 | ||||||||||||
| Redemptions of 47,145.8740 Redeemable Units and 800.7772 Redeemable Units of Special Limited Partner Interest |
(68,908,448) | (1,194,111) | - | (70,102,559) | ||||||||||||
|
|
|
|
|
|
|
|
|
|||||||||
| Partners’ Capital, December 31, 2013 |
256,684,632 | - | 3,038,670 | 259,723,302 | ||||||||||||
| Net income (loss) |
(8,601,827) | - | (83,617) | (8,685,444) | ||||||||||||
| Subscriptions of 10,331.2640 Redeemable Units |
14,734,486 | - | - | 14,734,486 | ||||||||||||
| Redemptions of 44,156.1010 Redeemable Units and 450.0690 General Partner Redeemable Units |
(62,246,893) | - | (650,092) | (62,896,985) | ||||||||||||
|
|
|
|
|
|
|
|
|
|||||||||
| Partners’ Capital, December 31, 2014 |
200,570,398 | - | 2,304,961 | 202,875,359 | ||||||||||||
| Net income (loss) |
(15,413,147) | - | (170,386) | (15,583,533) | ||||||||||||
| Subscriptions of 8,138.7880 Redeemable Units and 89.2760 General Partner Redeemable Units |
11,394,455 | - | 124,831 | 11,519,286 | ||||||||||||
| Redemptions of 48,591.4680 Redeemable Units and 426.7770 General Partner Redeemable Units |
(65,921,944) | - | (596,636) | (66,518,580) | ||||||||||||
|
|
|
|
|
|
|
|
|
|||||||||
| Partners’ Capital, December 31, 2015 |
$ | 130,629,762 | $ | - | $ | 1,662,770 | $ | 132,292,532 | ||||||||
|
|
|
|
|
|
|
|
|
|||||||||
Net asset value per Redeemable Unit:
| 2013: |
$ | 1,448.01 | ||
|
|
|
|||
| 2014: |
$ | 1,398.26 | ||
|
|
|
|||
| 2015: |
$ | 1,268.38 | ||
|
|
|
See accompanying notes to financial statements.
34
Managed Futures Premier Aventis II L.P.
Notes to Financial Statements
1. Partnership Organization:
Managed Futures Premier Aventis II L.P. (formerly known as Bristol Energy Fund L.P.) (the “Partnership”) is a limited partnership organized on April 20, 2005 under the partnership laws of the State of New York to engage, directly or indirectly, in the speculative trading of commodity interests on U.S. and international futures, options on futures and forward markets. The Partnership may also engage, directly or indirectly, in swap transactions and other derivative transactions with the approval of the General Partner (defined below). Initially, the Partnership’s investment strategy focused on energy and energy-related investments. While the Partnership is expected to continue to have significant exposure to energy and energy-related markets, such trading will no longer be the Partnership’s primary focus. Therefore, the Partnership’s past trading performance will not necessarily be indicative of future results. The commodity interests that are traded by the Partnership, through its investment in MB Master Fund L.P. (“MB Master”), are volatile and involve a high degree of market risk. The General Partner may also determine to invest up to all of the Partnership’s assets (directly or indirectly through its investment in MB Master) in United States (“U.S.”) Treasury bills and/or money market mutual funds, including money market mutual funds managed by Morgan Stanley or its affiliates. During the initial offering period, the Partnership sold 11,925 redeemable units of limited partnership interest (“Redeemable Units”). The Partnership commenced trading on September 6, 2005. The Partnership privately and continuously offers Redeemable Units to qualified investors. There is no maximum number of Redeemable Units that may be sold by the Partnership.
Ceres Managed Futures LLC, a Delaware limited liability company, acts as the general partner (the “General Partner”) and commodity pool operator of the Partnership. The General Partner is wholly owned by Morgan Stanley Smith Barney Holdings LLC (“MSSB Holdings”). MSSB Holdings is ultimately owned by Morgan Stanley. Morgan Stanley is a publicly held company whose shares are listed on the New York Stock Exchange. Morgan Stanley is engaged in various financial services and other businesses. Prior to June 28, 2013, Morgan Stanley indirectly owned a majority equity interest in MSSB Holdings, and Citigroup Inc. indirectly owned a minority equity interest in MSSB Holdings. Prior to July 31, 2009, the date as of which MSSB Holdings became its owner, the General Partner was wholly owned by Citigroup Financial Products Inc., a wholly owned subsidiary of Citigroup Global Markets Holdings Inc., the sole owner of which is Citigroup Inc. All trading decisions for the Partnership are made by the Advisor (defined below).
During the years ended December 31, 2015 and 2014, the Partnership’s/MB Master’s commodity broker was Morgan Stanley & Co. LLC (“MS&Co.”), a registered futures commission merchant. During a prior period included in this report, Citigroup Global Markets Inc. (“CGM”) also served as a commodity broker.
On December 1, 2005, the Partnership allocated substantially all of its capital to CMF SandRidge Master Fund L.P. (“SandRidge Master”), a limited partnership organized under the partnership laws of the State of New York. The Partnership purchased 14,410.6191 units of SandRidge Master with cash equal to $14,477,858 and a contribution of open commodity futures and option contracts with a fair value of $(16,018). SandRidge Master permitted commodity pools managed by SandRidge Capital, L.P. (“SandRidge”) using its Energy Program, a proprietary, discretionary trading system, to invest together in one trading vehicle. On January 31, 2013, the Partnership fully redeemed its investment in SandRidge Master for cash equal to $280,445,995.
35
Managed Futures Premier Aventis II L.P.
Notes to Financial Statements
On February 1, 2013, the Partnership allocated substantially all of its capital to MB Master, a limited partnership organized under the partnership laws of the State of Delaware. The Partnership purchased an interest in MB Master with cash equal to $262,944,186. MB Master permits accounts managed by Aventis Asset Management, LLC (“Aventis”) using its Aventis Diversified Commodity Strategy, a proprietary, discretionary trading system, to invest together in one trading vehicle. References to the “Master” herein refer to SandRidge Master and/or MB Master, as applicable, and references to the “Advisor” herein refer to SandRidge and/or Aventis, as applicable. In addition, prior to February 1, 2013, SandRidge Partners, L.P. was a special limited partner (“Special Limited Partner”) of the Partnership. The General Partner is also the general partner of the Master. Individual and pooled accounts currently managed by the Advisor, including the Partnership, are permitted to be limited partners of the Master. The General Partner and the Advisor believe that trading through this structure should promote efficiency and economy in the trading process.
Generally, a limited partner in the Master withdraws all or part of its capital contribution and undistributed profits, if any, from the Master as of the end of any month (the “Redemption Date”) after a request has been made to the General Partner at least three days in advance of the Redemption Date. Such withdrawals are classified as a liability when the limited partner in the Master elects to redeem and informs the Master. However, a limited partner in the Master may request a withdrawal as of the end of any day if such request is received by the General Partner at least three days in advance of the proposed withdrawal day.
The financial statements of the Master, including the Condensed Schedules of Investments, are contained elsewhere in this report and should be read together with the Partnership’s financial statements.
At December 31, 2015 and 2014, the Partnership owned approximately 86.4% and 91.7%, respectively, of the Master. During the periods covered by the report, the performance of the Partnership was directly affected by the performance of the Master. Expenses to investors as a result of the investment in the Master were approximately the same and redemption rights were not affected.
The General Partner and each limited partner share in the profits and losses of the Partnership, in proportion to the amount of Partnership interest owned by each, except that no limited partner is liable for obligations of the Partnership in excess of its capital contribution and profits, if any, net of distributions and losses, if any.
The Partnership will be liquidated upon the first to occur of the following: December 31, 2055; the net asset value per Redeemable Unit decreases to less than $400 as of a close of any business day; or under certain other circumstances as defined in the limited partnership agreement of the Partnership (the “Limited Partnership Agreement”). In addition, the General Partner may, in its sole discretion, cause the Partnership to dissolve if the Partnership’s aggregate net assets decline to less than $1,000,000.
In July 2015, the General Partner delegated certain administrative functions to SS&C Technologies, Inc., a Delaware corporation, currently doing business as SS&C GlobeOp (the “Administrator”). Pursuant to a master services agreement, the Administrator furnishes certain administrative, accounting, regulatory, reporting, tax and other services as agreed from time to time. In addition, the Administrator maintains certain books and records of the Partnership. The costs of retaining the Administrator will be allocated among the pools operated by the General Partner, including the Partnership.
36
Managed Futures Premier Aventis II L.P.
Notes to Financial Statements
| 2. | Basis of Presentation and Summary of Significant Accounting Policies: |
| a. | Use of Estimates. The preparation of financial statements and accompanying notes in conformity with accounting principles generally accepted in the United States of America (“GAAP”) requires the General Partner to make estimates and assumptions that affect the reported amounts of assets and liabilities, income and expenses, and related disclosures of contingent assets and liabilities in the financial statements and accompanying notes. As a result, actual results could differ from these estimates. |
| b. | Statement of Cash Flows. The Partnership is not required to provide a Statement of Cash Flows. |
| c. | Partnership’s Investments. The Partnership caries its investment in the Master based on the Partnership’s (1) net contribution to the Master and (2) its allocated share of the undistributed profits and losses, including realized gains or losses and net change in unrealized gains or losses, of the Master. |
Master’s Investments. All commodity interests of the Master, including derivative financial instruments and derivative commodity instruments, are held for trading purposes. The commodity interests are recorded on trade date and open contracts are recorded at fair value (as described in Note 5, “Fair Value Measurements” in the attached Master’s financial statements) at the measurement date. Investments in commodity interests denominated in foreign currencies are translated into U.S. dollars at the exchange rates prevailing at the measurement date. Gains or losses are realized when contracts are liquidated and are determined using the first-in, first-out method. Unrealized gains or losses on open contracts are included as a component of equity in trading account in the Master’s Statements of Financial Condition. Net realized gains or losses and any net change in unrealized gains or losses are included in the Master’s Statements of Income and Expenses.
| d. | Income Taxes. Income taxes have not been listed as each partner is individually liable for the taxes, if any, on its share of the Partnership’s income and expenses. The General Partner concluded that no provision for income tax is required in the Partnership’s financial statements. The Partnership files U.S. federal and various state and local tax returns. No income tax returns are currently under examination. The 2012 through 2015 tax years remain subject to examination by U.S. federal and most state tax authorities. The General Partner does not believe that there are any uncertain tax positions that require recognition of a tax liability. |
| e. | Investment Company Status. Effective January 1, 2014, the Partnership adopted Accounting Standards Update (“ASU”) 2013-08, “Financial Services — Investment Companies (Topic 946): Amendments to the Scope, Measurement and Disclosure Requirements” and based on the General Partner’s assessment, the Partnership has been deemed to be an investment company since inception. Accordingly, the Partnership follows the investment company accounting and reporting guidance of Topic 946 and reflects its investments at fair value with unrealized gains and losses resulting from changes in fair value reflected in the Statements of Income and Expenses. |
| f. | Net Income (Loss) per Redeemable Unit. Net income (loss) per Redeemable Unit is calculated in accordance with investment company guidance. See Note 7, “Financial Highlights.” |
37
Managed Futures Premier Aventis II L.P.
Notes to Financial Statements
| g. | Recent Accounting Pronouncements. In May 2015, the Financial Accounting Standards Board (“FASB”) issued ASU 2015-07, “Disclosures for Investments in Certain Entities That Calculate Net Asset Value per Share (or Its Equivalent),” which relates to disclosures for investments that calculate net asset value per share (potentially funds of fund structures). The ASU requires investments for which the practical expedient is used to measure fair value at Net Asset Value (“NAV”) be removed from the fair value hierarchy. Instead, an entity is required to include those investments as a reconciling line item so that the total fair value amount of investments in the disclosure is consistent with the amount on the balance sheet. Further, the ASU removes the requirement to make certain disclosures for all investments that are eligible to be measured at fair value using the net asset value per share practical expedient. Rather, those disclosures are limited to investments for which the entity has elected to measure the fair value using the practical expedient. The standard is effective for public business entities for fiscal years beginning after December 15, 2015. Early adoption is permitted. The Partnership has elected to adopt the guidance as of June 30, 2015. The adoption did not have any impact on the Partnership’s fair value measurement disclosures. |
In January 2016, the FASB issued ASU 2016-01, “Recognition and Measurement of Financial Assets and Financial Liabilities.” The amendments in this update address certain aspects of recognition, measurement, presentation, and disclosure of financial instruments for all entities that hold financial assets or owe financial liabilities. One of the amendments in this update eliminates the requirement for public business entities to disclose the methods and significant assumptions used to estimate the fair value that is required to be disclosed for financial instruments measured at amortized cost on the balance sheet or a description of changes in the methods and significant assumptions. Additionally, the update eliminates the requirement to disclose the fair value of financial instruments measured at amortized cost for entities that are not public business entities. Investment companies are specifically exempted from ASU 2016-01’s equity investment accounting provisions and will continue to follow the industry specific guidance for investment accounting under Topic 946. For public business entities, this update is effective for fiscal years beginning after December 15, 2017, and interim periods therein. For other entities, it is effective for fiscal years beginning after December 15, 2018, and interim periods within fiscal years beginning after December 15, 2019. The General Partner is currently evaluating the impact this guidance will have on the Partnership’s financial statements and related disclosures.
| h. | Reclassification. Certain prior period amounts have been reclassified to conform to current period presentation. Amounts reported as professional fees in the Statements of Financial Condition and Statements of Income and Expenses were previously reported separately as professional fees and other expenses. In the financial highlights, ongoing selling agent fees and clearing fees allocated from Master, which were previously included in net realized and unrealized gains (losses) per Redeemable Unit and excluded from expenses per Redeemable Unit, are now excluded from net realized and unrealized gains (losses) per Redeemable Unit and included in net investment loss per Redeemable Unit. Interest income per Redeemable Unit and expenses per Redeemable Unit previously presented separately are now combined into net investment loss per Redeemable Unit. |
| i. | Subsequent Events. The General Partner evaluates events that occur after the balance sheet date but before financial statements are issued. The General Partner has assessed the subsequent events through the date of issuance and determined that there were no subsequent events requiring adjustment of or disclosure in the financial statements. |
38
Managed Futures Premier Aventis II L.P.
Notes to Financial Statements
| 3. | Agreements: |
| a. | Limited Partnership Agreement: |
The General Partner administers the business and affairs of the Partnership, including selecting one or more advisors to make trading decisions for the Partnership. Prior to October 1, 2014, the Partnership paid the General Partner a monthly General Partner fee (formerly, the administrative fee) in return for its services to the Partnership equal to 1/24 of 1% (0.5% per year) of month-end Net Assets of the Partnership. Effective October 1, 2014, the General Partner fee was increased to 1/12 of 1% (1.00% per year) of month-end Net Assets of the Partnership. Month-end Net Assets, for the purpose of calculating General Partner fees are Net Assets, as defined in the Limited Partnership Agreement, prior to the reduction of the current month’s management fee, incentive fee/profit share allocation accrual, the General Partner fee and any redemptions or distributions as of the end of such month. This fee may be increased or decreased at the discretion of the General Partner.
| b. | Management Agreement: |
The General Partner, on behalf of the Partnership, entered into a management agreement (the “SandRidge Management Agreement”) with SandRidge, a registered commodity trading advisor. SandRidge was not affiliated with the General Partner, MS&Co. or CGM and was not responsible for the organization or operation of the Partnership. The Partnership paid SandRidge a monthly management fee equal to 1/6 of 1% (2% per year) of month-end Net Assets allocated to SandRidge. Month-end Net Assets, for the purpose of calculating management fees were Net Assets, as defined in the Limited Partnership Agreement, prior to the reduction of the current month’s management fee, profit share allocation accrual, the General Partner fee and any redemptions or distributions as of the end of such month.
In addition, the Special Limited Partner of the Partnership received a quarterly profit share allocation to its capital account in the Partnership in the form of Redeemable Units of the Partnership, the value of which was equal to 20% of the New Trading Profits, as defined in the Limited Partnership Agreement, earned on behalf of the Partnership during each calendar quarter and which were issued as Special Limited Partner Redeemable Units. The SandRidge Management Agreement was terminated effective January 15, 2013.
The General Partner, on behalf of the Partnership, entered into a management agreement (the “Aventis Management Agreement”) with Aventis, a registered commodity trading advisor. Aventis is not affiliated with the General Partner, MS&Co. or CGM and is not responsible for the organization or operation of the Partnership. Prior to March 1, 2014, the Partnership paid Aventis a monthly management fee equal to 1/12 of 1.5% (1.5% per year) of month-end Net Assets allocated to Aventis. Effective March 1, 2014, Aventis reduced the management fee rate to 1/12 of 1.25% (1.25% per year) of month-end Net Assets allocated to Aventis. Month-end Net Assets, for the purpose of calculating management fees are Net Assets, as defined in the Limited Partnership Agreement, prior to the reduction of the current month’s management fee, incentive fee, the General Partner fee and any redemptions or distributions as of the end of such month.
Aventis is not a special limited partner and does not receive a profit share allocation. Instead, Aventis receives an incentive fee, the value of which will be equal to 20% of the New Trading Profits, as defined in the Aventis Management Agreement, earned on behalf of the Partnership during each calendar quarter.
39
Managed Futures Premier Aventis II L.P.
Notes to Financial Statements
The Aventis Management Agreement can be terminated upon notice by either party.
In allocating substantially all the assets of the Partnership to the Advisor, the General Partner considers, among other things, the Advisor’s past performance, trading style, volatility of markets traded and fee requirements. The General Partner may modify or terminate the allocation of assets to the Advisor at any time.
| c. | Customer Agreement/Selling Agent Agreement: |
Prior to and during part of the third quarter of 2013, the Partnership was party to a Customer Agreement with CGM (the “CGM Customer Agreement”). During the third quarter of 2013, the Partnership entered into a Customer Agreement with MS&Co. (the “MS&Co. Customer Agreement”) and, during the fourth quarter of 2013, a Selling Agent Agreement with Morgan Stanley Smith Barney LLC, doing business as Morgan Stanley Wealth Management (“Morgan Stanley Wealth Management”) (the “Selling Agreement”). The Partnership has terminated the CGM Customer Agreement.
Under the CGM Customer Agreement, the Partnership paid CGM a monthly brokerage fee equal to 5/16 of 1.00% (3.75% per year) of month-end Net Assets, in lieu of brokerage fees on a per trade basis. Month-end Net Assets, for the purpose of calculating brokerage fees are Net Assets, as defined in the Limited Partnership Agreement, prior to the reduction of the current month’s brokerage fees, monthly management fee, incentive fee/profit share allocation accrual, the General Partner fee and other expenses and any redemptions or distributions as of the end of such month. The Partnership paid for exchange, service, clearing, user, give-up, floor brokerage and National Futures Association (“NFA”) fees (collectively, the “CGM clearing fees”) through its investment in the Master. The CGM clearing fees were allocated to the Partnership based on its proportionate share of the Master. During the term of the CGM Customer Agreement, all of the Partnership’s assets that were not held in the Master’s accounts at CGM were deposited in the Partnership’s account at CGM. The Partnership’s cash was deposited by CGM in segregated bank accounts to the extent required by Commodity Futures Trading Commission regulations. CGM paid the Partnership interest on 80% of the average daily equity maintained in cash in the Partnership’s (or the Partnership’s allocable portion of the Master’s) brokerage account at a 30-day U.S. Treasury bill rate determined weekly by CGM based on the average non-competitive yield on 3-month U.S. Treasury bills maturing in 30 days from the date on which such weekly rate was determined.
Under the MS&Co. Customer Agreement, the Partnership pays trading fees for the clearing and, where applicable, the execution of transactions, as well as exchange, clearing, user, give-up, floor brokerage and NFA fees (collectively, the “MS&Co. clearing fees” and together with the CGM clearing fees, the “clearing fees”) through its investment in the Master. MS&Co. clearing fees are allocated to the Partnership based on its proportionate share of the Master. Clearing fees will be paid for the life of the Partnership, although the rate at which such fees are paid may be changed. All of the Partnership’s assets not held in the Master’s accounts at MS&Co. are deposited in the Partnership’s account at MS&Co. The Partnership’s cash is deposited by MS&Co. in segregated bank accounts to the extent required by Commodity Futures Trading Commission regulations. MS&Co. has agreed to pay the Partnership interest on 80% of the average daily equity maintained in cash in the Partnership’s (or the Partnership’s allocable portion of the Master’s) brokerage account at the rate equal to the monthly average of the 4-week U.S. Treasury bill discount rate. The MS&Co. Customer Agreement may generally be terminated upon notice by either party.
40
Managed Futures Premier Aventis II L.P.
Notes to Financial Statements
Under the Selling Agreement with Morgan Stanley Wealth Management, the Partnership pays Morgan Stanley Wealth Management a monthly ongoing selling agent fee. Prior to April 1, 2014, the monthly ongoing selling agent fee was paid at a rate equal to 3.75% per year of month-end Net Assets. Effective April 1, 2014, the monthly ongoing selling agent fee was reduced to a rate equal to 2.50% per year of month-end Net Assets. Effective October 1, 2014, the monthly ongoing selling agent fee was reduced to a rate equal to 2.00% per year of month-end Net Assets. Morgan Stanley Wealth Management pays a portion of its ongoing selling agent fees to properly registered or exempted financial advisors who have sold Redeemable Units. Month-end Net Assets, for the purpose of calculating ongoing selling agent fees are Net Assets, as defined in the Limited Partnership Agreement, prior to the reduction of the current month’s ongoing selling agent fee, management fee, incentive fee accrued, the General Partner fee and other expenses and redemptions or distributions as of the end of such month.
| 4. | Trading Activities: |
The Partnership was formed for the purpose of trading contracts in a variety of commodity interests, including derivative financial instruments and derivative commodity interests. The Partnership invests substantially all of its assets through a “master-feeder” structure. The Partnership’s pro-rata share of the results of the Master’s trading activities are shown in the Statements of Income and Expenses.
During the third quarter of 2013, MB Master entered into a futures brokerage account agreement with MS&Co. MB Master commenced futures trading through an account at MS&Co. on or about August 19, 2013.
The MS&Co. Customer Agreements with the Partnership and the Master gives, and the CGM Customer Agreement with the Partnership and the Master gave, the Partnership and the Master, respectively, the legal right to net unrealized gains and losses on open futures, option and forward contracts. The Master nets, for financial reporting purposes, the unrealized gains and losses on open futures, open option and open forward contracts in the Statements of Financial Condition as the criteria under Accounting Standards Codification (“ASC”) 210-20, “Balance Sheet,” have been met.
Brokerage fees previously paid to CGM were calculated as a percentage of the Partnership’s adjusted net asset value on the last day of each month and were affected by trading performance, subscriptions and redemptions. Trading and transaction fees are based on the number of trades executed by the Advisor for the Master and the Partnership’s percentage ownership of the Master. Professional fees and other expenses are borne by the Master and allocated to the Partnership, and also are directly charged at the Partnership level. All other fees are charged at the Partnership level.
For disclosures regarding the Master’s trading activities, see Note 4, “Trading Activities,” in the attached Master’s financial statements.
| 5. | Fair Value Measurements: |
See Notes 2 and 5 of the Master’s financial statements for the determination of the fair value of the Master’s investments and related disclosures, including the fair value hierarchy, pursuant to ASC 820, “Fair Value Measurement.”
| 6. | Subscriptions, Distributions and Redemptions: |
Subscriptions are accepted monthly from investors who become limited partners on the first day of the month after their subscription is processed. Distributions of profits, if any, will be made at the sole discretion of the General Partner and at such times as the General Partner may decide. A limited partner may require the Partnership to redeem its Redeemable Units at their net asset value per Redeemable Unit as of the end of each month on three business days’ notice to the General Partner. There is no fee charged to limited partners in connection with redemptions.
41
Managed Futures Premier Aventis II L.P.
Notes to Financial Statements
| 7. | Financial Highlights: |
Financial highlights for the limited partner class as a whole for the years ended December 31, 2015, 2014 and 2013 were as follows:
| 2015 | 2014 | 2013 | ||||||||||
| Net realized and unrealized gains (losses) |
$ | (43.60) | $ | 43.55 | $ | 64.55 | ||||||
| Net investment loss |
(86.28) | (93.30) | (107.73) | |||||||||
|
|
|
|
|
|
|
|||||||
| Increase (decrease) for the year |
(129.88) | (49.75) | (43.18) | |||||||||
| Net asset value per unit, beginning of year |
1,398.26 | 1,448.01 | 1,491.19 | |||||||||
|
|
|
|
|
|
|
|||||||
| Net asset value per unit, end of year |
$ | 1,268.38 | $ | 1,398.26 | $ | 1,448.01 | ||||||
|
|
|
|
|
|
|
|||||||
| Ratios to average net assets: |
||||||||||||
| Net investment loss* |
(6.4) | % | (6.7) | % | (7.6) | % | ||||||
|
|
|
|
|
|
|
|||||||
| Operating expenses |
6.4 | % | 6.7 | % | 7.6 | % | ||||||
| Incentive fees |
- | % | - | % | - | % | ||||||
|
|
|
|
|
|
|
|||||||
| Total expenses and incentive fees |
6.4 | % | 6.7 | % | 7.6 | % | ||||||
|
|
|
|
|
|
|
|||||||
| Total return: |
||||||||||||
| Total return before incentive fees |
(9.3) | % | (3.4) | % | (2.9) | % | ||||||
| Incentive fees |
- | % | - | % | - | % | ||||||
|
|
|
|
|
|
|
|||||||
| Total return after incentive fees |
(9.3) | % | (3.4) | % | (2.9) | % | ||||||
|
|
|
|
|
|
|
|||||||
| * | Interest income allocated from Master less total expenses. |
The above ratios and total return may vary for individual investors based on the timing of capital transactions during the year. Additionally, these ratios are calculated for the limited partner class using the limited partners’ share of income, expenses and average net assets of the Partnership and includes the income and expenses allocated from the Master.
| 8. | Financial Instrument Risks: |
In the normal course of business, the Partnership, through its investment in the Master, is party to financial instruments with off-balance sheet risk, including derivative financial instruments and derivative commodity instruments. These financial instruments may include futures, forwards, options and swaps, whose values are based upon an underlying asset, index, or reference rate, and generally represent future commitments to exchange currencies or cash balances, to purchase or sell other financial instruments at specific terms at specified future dates, or, in the case of derivative commodity instruments, to have a reasonable possibility to be settled in cash, through physical delivery or with another financial instrument. These instruments may be traded on an exchange, a swap execution facility or over-the-counter (“OTC”). Exchange-traded instruments include futures and certain standardized forward, swap and option contracts. Certain swap contracts may also be traded on a swap execution facility or OTC. OTC contracts are negotiated between contracting parties and also include certain forward and option contracts. Specific market movements of commodities or futures contracts underlying an option cannot accurately be predicted. The purchaser of an option may lose the entire premium paid for the option. The writer (or seller) of an option has unlimited risk. Each of these instruments is subject to various risks similar to those related to the underlying financial instruments, including market and credit risk. In general, the risks associated with OTC contracts are greater than those associated with exchange-traded instruments because of the greater risk of default by the counterparty to an OTC contract.
42
Managed Futures Premier Aventis II L.P.
Notes to Financial Statements
Market risk is the potential for changes in the value of the financial instruments traded by the Master due to market changes, including interest and foreign exchange rate movements and fluctuations in commodity or security prices. Market risk is directly impacted by the volatility and liquidity in the markets in which the related underlying assets are traded. The Master is exposed to a market risk equal to the value of futures and forward contracts purchased and unlimited liability on such contracts sold short.
See Note 8, “Financial Instrument Risks” of the attached Master’s financial statements for risks relating to financial instruments and derivatives that are traded by the Master.
Credit risk is the possibility that a loss may occur due to the failure of a counterparty to perform according to the terms of a contract. The Partnership’s/Master’s risk of loss in the event of a counterparty default is typically limited to the amounts recognized in the Statements of Financial Condition and is not represented by the contract or notional amounts of the instruments. The Partnership’s/Master’s risk of loss is reduced through the use of legally enforceable master netting agreements with counterparties that permit the Partnership/Master to offset unrealized gains and losses and other assets and liabilities with such counterparties upon the occurrence of certain events. The Partnership/Master had credit risk and concentration risk during the reporting period, as MS&Co. and/or CGM or their affiliates were the sole counterparties or brokers with respect to the Partnership’s/Master’s assets. Credit risk with respect to exchange-traded instruments was reduced to the extent that, through MS&Co. and/or CGM, the Partnership’s/Master’s counterparty was an exchange or clearing organization. The Partnership/Master continue to be subject to such risks with respect to MS&Co.
SandRidge concentrated the Partnership’s/Master’s trading in energy related markets. Concentration in a limited number of commodity interests may have subjected the Partnership’s/ Master’s account to greater volatility than if a more diversified portfolio of contracts were traded on behalf of the Partnership/Master.
The General Partner monitors and attempts to control the Partnership’s/Master’s risk exposure on a daily basis through financial, credit and risk management monitoring systems, and accordingly, believes that it has effective procedures for evaluating and limiting the credit and market risks to which the Partnership/Master may be subject. These monitoring systems generally allow the General Partner to statistically analyze actual trading results with risk-adjusted performance indicators and correlation statistics. In addition, online monitoring systems provide account analysis of futures, forward and option contracts by sector, margin requirements, gain and loss transactions and collateral positions.
The risk to the limited partners that have purchased Redeemable Units is limited to the amount of their share of the Partnership’s net assets and undistributed profits. The limited liability is a result of the organization of the Partnership as a limited partnership under New York law.
The majority of these instruments mature within one year of the inception date. However, due to the nature of the Partnership’s/Master’s business, these instruments may not be held to maturity.
43
Selected unaudited quarterly financial data for the Partnership for the years ended December 31, 2015 and 2014 is summarized below:
| For the period from | For the period from | For the period from | For the period from | |||||||||||||
| October 1, 2015 to | July 1, 2015 to | April 1, 2015 to | January 1, 2015 to | |||||||||||||
| December 31, 2015 | September 30, 2015 | June 30, 2015 | March 31, 2015 | |||||||||||||
| Total trading results |
$ | (4,873,705) | $ | (5,347,523) | $ | (236,913) | $ | 6,358,779 | ||||||||
| Total investment income (loss) |
(5,358) | 2,231 | 2,955 | 3,774 | ||||||||||||
| Total expenses |
(2,454,468) | (2,983,375) | (2,996,481) | (3,053,449) | ||||||||||||
|
|
|
|
|
|
|
|
|
|||||||||
| Net income (loss) |
$ | (7,333,531) | $ | (8,328,667) | $ | (3,230,439) | $ | 3,309,104 | ||||||||
|
|
|
|
|
|
|
|
|
|||||||||
| Increase (decrease) in net asset value per Redeemable Unit |
$ | (61.44) | $ | (65.84) | $ | (24.06) | $ | 21.46 | ||||||||
| For the period from | For the period from | For the period from | For the period from | |||||||||||||
| October 1, 2014 to | July 1, 2014 to | April 1, 2014 to | January 1, 2014 to | |||||||||||||
| December 31, 2014 | September 30, 2014 | June 30, 2014 | March 31, 2014 | |||||||||||||
| Total trading results |
$ | (5,398,737) | $ | 11,659,307 | $ | 4,984,169 | $ | (4,680,373) | ||||||||
| Total investment income |
5,991 | 5,652 | 7,443 | 15,536 | ||||||||||||
| Total expenses |
(3,171,757) | (3,578,677) | (3,603,897) | (4,930,101) | ||||||||||||
|
|
|
|
|
|
|
|
|
|||||||||
| Net income (loss) |
$ | (8,564,503) | $ | 8,086,282 | $ | 1,387,715 | $ | (9,594,938) | ||||||||
|
|
|
|
|
|
|
|
|
|||||||||
| Increase (decrease) in net asset value per Redeemable Unit |
$ | (56.57) | $ | 51.60 | $ | 9.37 | $ | (54.15) | ||||||||
44
To the Limited Partners of
MB Master Fund L.P.
To the best of the knowledge and belief of the undersigned, the information contained herein is accurate and complete.

| ||
| By: | Patrick T. Egan | |
| President and Director Ceres Managed Futures LLC General Partner, MB Master Fund L.P. | ||
| Ceres Managed Futures LLC 522 Fifth Avenue New York, NY 10036 855-672-4468 | ||
45
REPORT OF INDEPENDENT REGISTERED PUBLIC ACCOUNTING FIRM
To the Partners of MB Master Fund L.P.:
We have audited the accompanying statements of financial condition of MB Master Fund L.P. (the “Partnership”), including the condensed schedules of investments, as of December 31, 2015 and 2014, and the related statements of income and expenses and changes in partners’ capital for each of the three years in the period ended December 31, 2015. These financial statements are the responsibility of the Partnership’s management. Our responsibility is to express an opinion on these financial statements based on our audits.
We conducted our audits in accordance with the standards of the Public Company Accounting Oversight Board (United States). Those standards require that we plan and perform the audit to obtain reasonable assurance about whether the financial statements are free of material misstatement. The Partnership is not required to have, nor were we engaged to perform, an audit of its internal control over financial reporting. Our audits included consideration of internal control over financial reporting as a basis for designing audit procedures that are appropriate in the circumstances, but not for the purpose of expressing an opinion on the effectiveness of the Partnership’s internal control over financial reporting. Accordingly, we express no such opinion. An audit also includes examining, on a test basis, evidence supporting the amounts and disclosures in the financial statements, assessing the accounting principles used and significant estimates made by management, as well as evaluating the overall financial statement presentation. We believe that our audits provide a reasonable basis for our opinion.
In our opinion, such financial statements present fairly, in all material respects, the financial position of MB Master Fund L.P. as of December 31, 2015 and 2014, and the results of its operations and changes in its partners’ capital for each of the three years in the period ended December 31, 2015, in conformity with accounting principles generally accepted in the United States of America.
/s/ Deloitte & Touche LLP
New York, New York
March 24, 2016
46
MB Master Fund L.P.
Statements of Financial Condition
December 31, 2015 and 2014
| December 31, 2015 |
December 31, 2014 |
|||||||
| Assets: |
||||||||
| Equity in trading account: |
||||||||
| Investment in U.S. Treasury bills, at fair value (amortized cost $136,740,453 and $0 at December 31, 2015 and 2014, respectively) |
$ | 136,729,500 | $ | - | ||||
| Cash (Note 3c) |
18,724,253 | 225,656,546 | ||||||
| Cash margin (Note 3c) |
1,595,848 | 11,952,370 | ||||||
| Net unrealized appreciation on open futures contracts |
1,264,050 | 2,122,505 | ||||||
| Options purchased, at fair value (cost $1,962,640 and $11,720,470 at December 31, 2015 and 2014, respectively) |
1,870,654 | 11,717,392 | ||||||
|
|
|
|
|
|||||
| Total equity in trading account |
160,184,305 | 251,448,813 | ||||||
| Expense reimbursement (Note 3c) |
13,048 | 3,774 | ||||||
|
|
|
|
|
|||||
| Total assets |
$ | 160,197,353 | $ | 251,452,587 | ||||
|
|
|
|
|
|||||
| Liabilities and Partners’ Capital: |
||||||||
| Liabilities: |
||||||||
| Options written, at fair value (premiums received $965,751 and $13,275,727 at December 31, 2015 and 2014, respectively) |
$ | 797,408 | $ | 12,526,839 | ||||
| Accrued expenses: |
||||||||
| Clearing fees due to MS&Co. (Note 3c) |
- | 31,358 | ||||||
| Professional fees |
27,299 | 56,368 | ||||||
| Redemptions payable |
- | 10,689,151 | ||||||
|
|
|
|
|
|||||
| Total liabilities |
824,707 | 23,303,716 | ||||||
|
|
|
|
|
|||||
| Partners’ Capital: |
||||||||
| General Partner |
- | - | ||||||
| Limited Partners |
159,372,646 | 228,148,871 | ||||||
|
|
|
|
|
|||||
| Total liabilities and partners’ capital |
$ | 160,197,353 | $ | 251,452,587 | ||||
|
|
|
|
|
|||||
See accompanying notes to financial statements.
47
MB Master Fund L.P.
Condensed Schedule of Investments
December 31, 2015
| Number of Contracts |
Fair Value | % of Partners’ Capital |
||||||||||
| Futures Contracts Purchased |
||||||||||||
| Energy |
546 | $ | 367,730 | 0.23 | % | |||||||
| Grains |
2,266 | (1,136,894) | (0.71) | |||||||||
| Livestock |
72 | 60,157 | 0.04 | |||||||||
| Softs |
912 | 342,061 | 0.21 | |||||||||
|
|
|
|
|
|||||||||
| Total futures contracts purchased |
(366,946) | (0.23) | ||||||||||
|
|
|
|
|
|||||||||
| Futures Contracts Sold |
||||||||||||
| Energy |
505 | (433,060) | (0.27) | |||||||||
| Grains |
2,317 | 2,490,319 | 1.57 | |||||||||
| Softs |
908 | (426,263) | (0.27) | |||||||||
|
|
|
|
|
|||||||||
| Total futures contracts sold |
1,630,996 | 1.03 | ||||||||||
|
|
|
|
|
|||||||||
| Net unrealized appreciation on open futures contracts |
$ | 1,264,050 | 0.80 | % | ||||||||
|
|
|
|
|
|||||||||
| Options Purchased |
||||||||||||
| Calls |
||||||||||||
| Grains |
1,293 | $ | 295,444 | 0.19 | % | |||||||
| Softs |
2,784 | 1,551,522 | 0.97 | |||||||||
| Puts |
||||||||||||
| Softs |
235 | 23,688 | 0.01 | |||||||||
|
|
|
|
|
|||||||||
| Total options purchased (cost $1,962,640) |
$ | 1,870,654 | 1.17 | % | ||||||||
|
|
|
|
|
|||||||||
| Options Written |
||||||||||||
| Calls |
||||||||||||
| Grains |
644 | $ | (16,100) | (0.01) | % | |||||||
| Softs |
3,460 | (676,499) | (0.42) | |||||||||
| Puts |
||||||||||||
| Softs |
402 | (104,809) | (0.07) | |||||||||
|
|
|
|
|
|||||||||
| Total options written (premiums received $965,751) |
$ | (797,408) | (0.50) | % | ||||||||
|
|
|
|
|
|||||||||
U.S. Government Securities
| Face Amount |
Maturity Date | Description |
Fair Value | % of Partners’ Capital |
||||||||||
| $119,750,000 | 3/3/2016 | U.S. Treasury bills, 0.015% (Amortized cost of $119,742,965) | $ | 119,730,615 | 75.12 | % | ||||||||
| U.S. Treasury bills, 0.190% (Amortized cost of | ||||||||||||||
| $ 17,000,000 | 1/21/2016 | $16,997,488) | 16,998,885 | 10.67 | ||||||||||
|
|
|
|
|
|||||||||||
| Total U.S. Government Securities |
$ | 136,729,500 | 85.79 | % | ||||||||||
|
|
|
|
|
|||||||||||
| Net fair value |
|
$ | 139,066,796 | 87.26 | % | |||||||||
|
|
|
|
|
|||||||||||
See accompanying notes to financial statements.
48
MB Master Fund L.P.
Condensed Schedule of Investments
December 31, 2014
| Number of Contracts |
Fair Value | % of Partners’ Capital |
||||||||
| Futures Contracts Purchased |
||||||||||
| Energy |
||||||||||
| RBOB Gasoline April 15 - June 15 |
1,662 | $ | (26,440,042) | (11.59) | % | |||||
| Other |
103 | (781,530) | (0.34) | |||||||
| Grains |
1,918 | (1,106,332) | (0.49) | |||||||
| Softs |
122 | (143,685) | (0.06) | |||||||
|
|
|
|
|
|||||||
| Total futures contracts purchased |
(28,471,589) | (12.48) | ||||||||
|
|
|
|
|
|||||||
| Futures Contracts Sold |
||||||||||
| Energy |
||||||||||
| NY Harbor ULSD June 15 |
989 | 24,702,136 | 10.83 | |||||||
| Other |
774 | 5,085,247 | 2.23 | |||||||
| Grains |
2,283 | 441,864 | 0.19 | |||||||
| Livestock |
590 | 348,405 | 0.15 | |||||||
| Softs |
259 | 16,442 | 0.01 | |||||||
|
|
|
|
|
|||||||
| Total futures contracts sold |
30,594,094 | 13.41 | ||||||||
|
|
|
|
|
|||||||
| Net unrealized appreciation on open futures contracts |
$ | 2,122,505 | 0.93 | % | ||||||
|
|
|
|
|
|||||||
| Options Purchased |
||||||||||
| Calls |
||||||||||
| Energy |
732 | $ | 104,920 | 0.05 | % | |||||
| Grains |
1,987 | 3,975,845 | 1.74 | |||||||
| Livestock |
802 | 1,404,320 | 0.62 | |||||||
| Softs |
1,720 | 985,384 | 0.43 | |||||||
| Puts |
||||||||||
| Grains |
2,292 | 2,069,042 | 0.91 | |||||||
| Livestock |
1,674 | 842,340 | 0.37 | |||||||
| Softs |
375 | 2,335,541 | 1.02 | |||||||
|
|
|
|
|
|||||||
| Total options purchased (cost $11,720,470) |
$ | 11,717,392 | 5.14 | % | ||||||
|
|
|
|
|
|||||||
| Options Written |
||||||||||
| Calls |
||||||||||
| Grains |
1,987 | $ | (5,323,670) | (2.33) | % | |||||
| Livestock |
802 | (2,728,990) | (1.20) | |||||||
| Softs |
2,468 | (318,207) | (0.14) | |||||||
| Puts |
||||||||||
| Energy |
246 | (678,960) | (0.30) | |||||||
| Grains |
1,222 | (259,655) | (0.11) | |||||||
| Softs |
375 | (3,217,357) | (1.41) | |||||||
|
|
|
|
|
|||||||
| Total options written (premiums received $13,275,727) |
$ | (12,526,839) | (5.49) | % | ||||||
|
|
|
|
|
|||||||
| Net fair value |
$ | 1,313,058 | 0.58 | % | ||||||
|
|
|
|
|
|||||||
See accompanying notes to financial statements.
49
MB Master Fund L.P.
Statements of Income and Expenses for the years ended
December 31, 2015, 2014 and 2013
| 2015 | 2014 | 2013 | ||||||||||
| Investment Income: |
||||||||||||
| Interest income |
$ | 5,090 | $ | 41,225 | $ | 92,224 | ||||||
|
|
|
|
|
|
|
|||||||
| Expenses: |
||||||||||||
| Clearing fees (Note 3c) |
3,610,487 | 4,650,390 | 5,165,063 | |||||||||
| Professional fees |
80,927 | 101,191 | 121,699 | |||||||||
|
|
|
|
|
|
|
|||||||
| Total expenses |
3,691,414 | 4,751,581 | 5,286,762 | |||||||||
| Expense reimbursements (Note 3c) |
(141,378) | (55,053) | (106,566) | |||||||||
|
|
|
|
|
|
|
|||||||
| Net expenses |
3,550,036 | 4,696,528 | 5,180,196 | |||||||||
|
|
|
|
|
|
|
|||||||
| Net investment income (loss) |
(3,544,946) | (4,655,303) | (5,087,972) | |||||||||
|
|
|
|
|
|
|
|||||||
| Trading results: |
||||||||||||
| Net gains (losses) on trading of commodity interests: |
||||||||||||
| Net realized gains (losses) on closed contracts |
(3,595,305) | 7,730,241 | 10,984,676 | |||||||||
| Net change in unrealized gains (losses) on open contracts |
(1,527,908) | (420,888) | 3,236,420 | |||||||||
|
|
|
|
|
|
|
|||||||
| Total trading results |
(5,123,213) | 7,309,353 | 14,221,096 | |||||||||
|
|
|
|
|
|
|
|||||||
| Net income (loss) |
$ | (8,668,159) | $ | 2,654,050 | $ | 9,133,124 | ||||||
|
|
|
|
|
|
|
|||||||
See accompanying notes to financial statements.
50
MB Master Fund L.P.
Statements of Changes in Partners’ Capital for the years ended
December 31, 2015, 2014 and 2013
| Partners’ Capital |
||||
| Partners’ Capital, December 31, 2012 |
$ | 65,893,155 | ||
| Net income (loss) |
9,133,124 | |||
| Subscriptions |
332,941,852 | |||
| Redemptions |
(96,045,270) | |||
| Distribution of interest income to feeder funds |
(92,224) | |||
|
|
|
|||
| Partners’ Capital, December 31, 2013 |
311,830,637 | |||
| Net income (loss) |
2,654,050 | |||
| Subscriptions |
18,248,310 | |||
| Redemptions |
(104,542,901) | |||
| Distribution of interest income to feeder funds |
(41,225) | |||
|
|
|
|||
| Partners’ Capital, December 31, 2014 |
228,148,871 | |||
| Net income (loss) |
(8,668,159) | |||
| Subscriptions |
24,894,677 | |||
| Redemptions |
(84,987,618) | |||
| Distribution of interest income to feeder funds |
(15,125) | |||
|
|
|
|||
| Partners’ Capital, December 31, 2015 |
$ | 159,372,646 | ||
|
|
|
|||
See accompanying notes to financial statements.
51
MB Master Fund L.P.
Notes to Financial Statements
| 1. | Partnership Organization: |
MB Master Fund L.P. (the “Master”) is a limited partnership organized under the partnership laws of the State of Delaware on April 21, 2011, to engage in the speculative trading of a diversified portfolio of commodity interests, including futures, option, swap and forward contracts. The sectors traded include currencies, energy, grains, livestock, metals and softs. The commodity interests that are traded by the Master are volatile and involve a high degree of market risk. The General Partner (defined below) may also determine to invest up to all of the Master’s assets in United States (“U.S.”) Treasury bills and/or money market mutual funds, including money market mutual funds managed by Morgan Stanley or its affiliates.
Ceres Managed Futures LLC, a Delaware limited liability company, acts as the general partner (the “General Partner”) and commodity pool operator of the Master. The General Partner is wholly owned by Morgan Stanley Smith Barney Holdings LLC (“MSSB Holdings”). MSSB Holdings is ultimately owned by Morgan Stanley. Morgan Stanley is a publicly held company whose shares are listed on the New York Stock Exchange. Morgan Stanley is engaged in various financial services and other businesses. Prior to June 28, 2013, Morgan Stanley indirectly owned a majority equity interest in MSSB Holdings, and Citigroup Inc. indirectly owned a minority equity interest in MSSB Holdings. Prior to July 31, 2009, the date as of which MSSB Holdings became its owner, the General Partner was wholly owned by Citigroup Financial Products Inc., a wholly owned subsidiary of Citigroup Global Markets Holdings Inc., the sole owner of which is Citigroup Inc. All trading decisions for the Master are made by the Advisor (defined below).
On May 1, 2011 (commencement of trading operations), Commodity Advisors Fund L.P. (“Commodity Advisors”) allocated a portion of its capital to the Master. Commodity Advisors purchased an interest in the Master with cash equal to $12,756,614. On December 1, 2011, Institutional Futures Portfolio L.P. (“Institutional”) and Morgan Stanley Spectrum Strategic L.P. (“Spectrum Strategic”) each allocated a portion of their capital to the Master. Institutional purchased an interest in the Master with cash equal to $15,739,996 and Spectrum Strategic purchased an interest in the Master with cash equal to $8,952,411. On July 1, 2012, Managed Futures Premier Aventis L.P. (“Premier Aventis”) allocated substantially all of its capital to the Master. Premier Aventis purchased an interest in the Master with cash equal to $4,757,145. On February 1, 2013, Managed Futures Premier Aventis II L.P. (“Premier Aventis II”) allocated substantially all of its capital to the Master. Premier Aventis II purchased an interest in the Master with cash equal to $262,944,186. On June 1, 2013, Morgan Stanley Managed Futures Custom Solutions Fund L.P. (“Custom Solutions”) allocated a portion of its capital to the Master. Custom Solutions purchased an interest in the Master with cash equal to $1,300,000. On December 31, 2014, Premier Aventis redeemed its entire investment in the Master for cash equal to $10,689,151. The Master permits commodity pools managed now and in the future by Aventis Asset Management, LLC (formerly known as Misfit Financial Group, LLC) (the “Advisor”) using the Aventis Diversified Commodity Strategy (formerly known as the Barbarian Program), a proprietary, discretionary trading system, to invest together in one trading vehicle.
During the years ended December 31, 2015 and 2014, the Master’s commodity broker was Morgan Stanley & Co. LLC (“MS&Co.”), a registered futures commission merchant. During a prior period included in this report, Citigroup Global Markets Inc. (“CGM”) also served as a commodity broker.
The Master operates under a structure where its investors consist of Commodity Advisors, Institutional, Spectrum Strategic, Premier Aventis II and Custom Solutions (each a “Feeder”, and collectively, the “Funds”). Commodity Advisors, Institutional, Spectrum Strategic, Premier Aventis II and Custom Solutions each owned approximately 5.4%, 1.3%, 5.6%, 86.4% and 1.3% of the Master at December 31, 2015, respectively. Commodity Advisors, Institutional, Spectrum Strategic, Premier Aventis II and Custom Solutions each owned approximately 3.6%, 1.9%, 1.5%, 91.7% and 1.3% of the Master at December 31, 2014, respectively.
The Master will be liquidated under certain circumstances as set forth in the limited partnership agreement of the Master (the “Limited Partnership Agreement”).
52
MB Master Fund L.P.
Notes to Financial Statements
In July 2015, the General Partner delegated certain administrative functions to SS&C Technologies, Inc., a Delaware corporation, currently doing business as SS&C GlobeOp (the “Administrator”). Pursuant to a master services agreement, the Administrator furnishes certain administrative, accounting, regulatory, reporting, tax and other services as agreed from time to time. In addition, the Administrator maintains certain books and records of the Master.
| 2. | Basis of Presentation and Summary of Significant Accounting Policies: |
| a. | Use of Estimates. The preparation of financial statements and accompanying notes in conformity with accounting principles generally accepted in the United States of America (“GAAP”) requires the General Partner to make estimates and assumptions that affect the reported amounts of assets and liabilities, income and expenses, and related disclosures of contingent assets and liabilities in the financial statements and accompanying notes. As a result, actual results could differ from these estimates. |
| b. | Statement of Cash Flows. The Master is not required to provide a Statement of Cash Flows. |
| c. | Master’s Investments. All commodity interests of the Master, including derivative financial instruments and derivative commodity instruments, are held for trading purposes. The commodity interests are recorded on trade date and open contracts are recorded at fair value (as described in Note 5, “Fair Value Measurements”) at the measurement date. Investments in commodity interests denominated in foreign currencies are translated into U.S. dollars at the exchange rates prevailing at the measurement date. Gains or losses are realized when contracts are liquidated and are determined using the first-in, first-out method. Unrealized gains or losses on open contracts are included as a component of equity in trading account in the Statements of Financial Condition. Net realized gains or losses and any net change in unrealized gains or losses are included in the Statements of Income and Expenses. |
Master’s Cash. The Master’s cash includes cash denominated in foreign currencies of $89,402 and $3,977,703 as of December 31, 2015 and 2014, respectively. The cost of foreign currencies was $91,119 as of December 31, 2015 and based on the General Partner’s assessment, the cost of foreign currencies was not materially different from the fair value as of December 31, 2014.
| d. | Income and Expense Recognition. All of the income and expenses and realized and unrealized gains and losses on trading of commodity interests are determined on each valuation day and allocated pro-rata among the Funds at the time of such determination. |
| e. | Income Taxes. Income taxes have not been listed as each partner is individually liable for the taxes, if any, on its share of the Master’s income and expenses. The General Partner has concluded that no provision for income tax is required in the Master’s financial statements. The Master files U.S. federal and various state and local tax returns. No income tax returns are currently under examination. The 2012 through 2015 tax years remain subject to examination by U.S. federal and most state tax authorities. The General Partner does not believe that there are any uncertain tax positions that require recognition of a tax liability. |
| f. | Investment Company Status. Effective January 1, 2014, the Master adopted Accounting Standards Update (“ASU”) 2013-08, “Financial Services —Investment Companies (Topic 946): Amendments to the Scope, Measurement and Disclosure Requirements” and based on the General Partner’s assessment, the Master has been deemed to be an investment company since inception. Accordingly, the Master follows the investment company accounting and reporting guidance of Topic 946 and reflects its investments at fair value with unrealized gains and losses resulting from changes in fair value reflected in the Statements of Income and Expenses. |
53
MB Master Fund L.P.
Notes to Financial Statements
| g. | Fair Value of Financial Instruments. The carrying value of the Master’s assets and liabilities presented in the Statements of Financial Condition that qualify as financial instruments under the Financial Accounting Standards Board (“FASB”) Accounting Standards Codification (“ASC”) 825, “Financial Instruments,” approximates the fair value due to the short term nature of such balances. |
| h. | Recent Accounting Pronouncement. In January 2016, the FASB issued ASU 2016-01, “Recognition and Measurement of Financial Assets and Financial Liabilities.” The amendments in this update address certain aspects of recognition, measurement, presentation, and disclosure of financial instruments for all entities that hold financial assets or owe financial liabilities. One of the amendments in this update eliminates the requirement for public business entities to disclose the methods and significant assumptions used to estimate the fair value that is required to be disclosed for financial instruments measured at amortized cost on the balance sheet or a description of changes in the methods and significant assumptions. Additionally, the update eliminates the requirement to disclose the fair value of financial instruments measured at amortized cost for entities that are not public business entities. Investment companies are specifically exempted from ASU 2016-01’s equity investment accounting provisions and will continue to follow the industry specific guidance for investment accounting under Topic 946. For public business entities, this update is effective for fiscal years beginning after December 15, 2017, and interim periods therein. For other entities, it is effective for fiscal years beginning after December 15, 2018, and interim periods within fiscal years beginning after December 15, 2019. The General Partner is currently evaluating the impact this guidance will have on the Master’s financial statements and related disclosures. |
| i. | Subsequent Events. The General Partner evaluates events that occur after the balance sheet date but before financial statements are issued. The General Partner has assessed the subsequent events through the date of issuance and determined that there were no subsequent events requiring adjustment of or disclosure in the financial statements. |
| 3. | Agreements: |
| a. | Limited Partnership Agreement: |
The General Partner administers the business and affairs of the Master, including selecting one or more advisors to make trading decisions for the Master.
| b. | Management Agreement: |
The General Partner, on behalf of the Master, has entered into a management agreement (the “Management Agreement”) with the Advisor, a registered commodity trading advisor. The Advisor is not affiliated with the General Partner, MS&Co. or CGM and is not responsible for the organization or operation of the Master. The Management Agreement provides that the Advisor has sole discretion in determining the investment of the assets of the Master. All management fees in connection with the Management Agreement are borne by the Funds. The Management Agreement may be terminated upon notice by either party.
| c. | Customer Agreement: |
Prior to and during part of the third quarter of 2013, the Master was party to a Customer Agreement with CGM (the “CGM Customer Agreement”). During the third quarter of 2013, the Master entered into a Customer Agreement with MS&Co. (the “MS&Co. Customer Agreement”). The Master has terminated the CGM Customer Agreement.
54
MB Master Fund L.P.
Notes to Financial Statements
Under the CGM Customer Agreement, CGM provided services to the Master, including, among other things, the execution and clearing of transactions for the Master’s account in accordance with orders placed by the Advisor. All exchange, clearing, service, user, give-up, floor brokerage and National Futures Association (“NFA”) fees (collectively, the “CGM clearing fees”) were borne by the Master and allocated to the Funds. All other fees, including CGM’s direct brokerage fees, were borne by the Funds. During the term of the CGM Customer Agreement, all of the Master’s assets were deposited in the Master’s account at CGM. The Master’s cash was deposited by CGM in segregated bank accounts to the extent required by Commodity Futures Trading Commission regulations.
Under the MS&Co. Customer Agreement, the Master pays MS&Co. trading fees for the clearing and, where applicable, the execution of transactions. Further, all trading, exchange, clearing, user, give-up, floor brokerage and NFA fees (collectively, the “MS&Co clearing fees,” and together with the CGM clearing fees, the “clearing fees”) are borne by the Master and allocated to the Funds. All other fees are borne by the Funds. All of the Master’s assets are deposited in the Master’s account at MS&Co. The Master’s cash is deposited by MS&Co. in segregated bank accounts to the extent required by Commodity Futures Trading Commission regulations. At December 31, 2015 and 2014, the amount of cash held by the Master for margin requirements was $1,595,848 and $11,952,370, respectively. The MS&Co. Customer Agreement may generally be terminated upon notice by either party
Prior to April 1, 2014, Spectrum Strategic paid to MS&Co. a monthly brokerage fee at a flat rate of 1/12 of 6% per month (a 6% annual rate) of the net assets of Spectrum Strategic allocated to the Advisor as of the first day of each month. Effective April 1, 2014, the flat rate brokerage fee was reduced to 1/2 of 4% per month (a 4% annual rate) of Spectrum Strategic’s net assets. Effective October 1, 2014, the flat rate brokerage fee was separated into (i) a general partner administrative fee payable to the General Partner equal to an annual rate of 2.0% of Spectrum Strategic’s net assets, and (ii) an ongoing placement agent fee payable to Morgan Stanley Wealth Management equal to an annual rate of 2.0% of Spectrum Strategic’s net assets. The October 1, 2014 fee changes, in the aggregate, did not exceed the flat rate brokerage fee and, accordingly, there was no change to the aggregate fees incurred by Spectrum Strategic. The General Partner administrative fees include, and the flat rate brokerage fee included, clearing fees that are charged to the Master, and therefore, the Master receives monthly expense reimbursements on clearing fees incurred during such month, as shown in the Statements of Income and Expenses as expense reimbursements, based on the beginning of the month Partners’ capital allocation percentage for Spectrum Strategic’s investment in the Master. Prior to October 1, 2014, the expense reimbursement was paid by MS&Co. Effective October 1, 2014, the expense reimbursement is paid by the General Partner.
| 4. | Trading Activities: |
The Master was formed for the purpose of trading contracts in a variety of commodity interests, including derivative financial instruments and derivative commodity interests. The results of the Master’s trading activities are shown in the Statements of Income and Expenses.
The MS&Co. Customer Agreement with the Master gives, and the CGM Customer Agreement with the Master gave, the Master the legal right to net unrealized gains and losses on open futures, option and forward contracts. The Master nets, for financial reporting purposes, the unrealized gains and losses on open futures, open option and open forward contracts in the Statements of Financial Condition as the criteria under ASC 210-20, “Balance Sheet,” have been met.
All of the commodity interests owned by the Master are held for trading purposes. The monthly average number of futures contracts traded during the years ended December 31, 2015 and 2014 were 10,087 and 11,926, respectively. The monthly average number of option contracts traded during the years ended December 31, 2015 and 2014 were 24,999 and 53,982, respectively. The monthly average number of metals forward contracts traded during the years ended December 31, 2015 and 2014 were 774 and 0, respectively.
55
MB Master Fund L.P.
Notes to Financial Statements
The following tables summarize the gross and net amounts recognized relating to assets and liabilities of the Master’s derivatives and their offsetting subject to master netting or similar arrangements as of December 31, 2015 and 2014, respectively:
| December 31, 2015 |
Gross Amounts Recognized |
Gross Amounts Offset in the Statements of Financial Condition |
Amounts Presented in the Statements of Financial Condition |
Gross Amounts Not Offset in the Statements of Financial Condition |
||||||||||||||||||||
| Financial Instruments |
Cash Collateral (Received)/Pledged* |
Net Amount | ||||||||||||||||||||||
| Assets |
||||||||||||||||||||||||
| Futures |
$ | 3,779,520 | $ | (2,515,470) | $ | 1,264,050 | $ | - | $ | - | $ | 1,264,050 | ||||||||||||
| Options purchased |
1,870,654 | - | 1,870,654 | (797,408) | - | 1,073,246 | ||||||||||||||||||
|
|
|
|
|
|
|
|
|
|
|
|
|
|||||||||||||
| Total assets |
$ | 5,650,174 | $ | (2,515,470) | $ | 3,134,704 | $ | (797,408) | $ | - | $ | 2,337,296 | ||||||||||||
|
|
|
|
|
|
|
|
|
|
|
|
|
|||||||||||||
| Liabilities |
||||||||||||||||||||||||
| Futures |
$ | (2,515,470) | $ | 2,515,470 | $ | - | $ | - | $ | - | $ | - | ||||||||||||
| Options written |
(797,408) | - | (797,408) | 797,408 | - | - | ||||||||||||||||||
|
|
|
|
|
|
|
|
|
|
|
|
|
|||||||||||||
| Total liabilites |
$ | (3,312,878) | $ | 2,515,470 | $ | (797,408) | $ | 797,408 | $ | - | $ | - | ||||||||||||
|
|
|
|
|
|
|
|
|
|
|
|
|
|||||||||||||
| Net fair value |
$ | 2,337,296 | * | |||||||||||||||||||||
|
|
|
|||||||||||||||||||||||
| December 31, 2014 |
Gross Amounts Recognized |
Gross Amounts Offset in the Statements of Financial Condition |
Amounts Presented in the Statements of Financial Condition |
Gross Amounts Not Offset in the Statements of Financial Condition |
||||||||||||||||||||
| Financial Instruments |
Cash Collateral (Received)/Pledged* |
Net Amount | ||||||||||||||||||||||
| Assets |
||||||||||||||||||||||||
| Futures |
$ | 31,357,685 | $ | (29,235,180) | $ | 2,122,505 | $ | - | $ | - | $ | 2,122,505 | ||||||||||||
| Options purchased |
11,717,392 | - | 11,717,392 | (11,717,392) | - | - | ||||||||||||||||||
|
|
|
|
|
|
|
|
|
|
|
|
|
|||||||||||||
| Total assets |
$ | 43,075,077 | $ | (29,235,180) | $ | 13,839,897 | $ | (11,717,392) | $ | - | $ | 2,122,505 | ||||||||||||
|
|
|
|
|
|
|
|
|
|
|
|
|
|||||||||||||
| Liabilities |
||||||||||||||||||||||||
| Futures |
$ | (29,235,180) | $ | 29,235,180 | $ | - | $ | - | $ | - | $ | - | ||||||||||||
| Options written |
(12,526,839) | - | (12,526,839) | 11,717,392 | - | (809,447) | ||||||||||||||||||
|
|
|
|
|
|
|
|
|
|
|
|
|
|||||||||||||
| Total liabilites |
$ | (41,762,019) | $ | 29,235,180 | $ | (12,526,839) | $ | 11,717,392 | $ | - | $ | (809,447) | ||||||||||||
|
|
|
|
|
|
|
|
|
|
|
|
|
|||||||||||||
| Net fair value |
$ | 1,313,058 | * | |||||||||||||||||||||
|
|
|
|||||||||||||||||||||||
| * | In the event of default by the Master, MS&Co., the Master’s commodity futures broker and the sole counterparty to the Master’s off-exchange-traded contracts, as applicable, has the right to offset the Master’s obligation with the Master’s cash and/or U.S. Treasury bills held by MS&Co., thereby minimizing MS&Co.’s risk of loss. There is no collateral posted by MS&Co. and as such, in the event of default by MS&Co., the Master is exposed to the amount shown in the Statements of Financial Condition. In the case of exchange-traded contracts, the Master’s exposure to counterparty risk may be reduced since the exchange’s clearinghouse interposes its credit between buyer and seller and the clearinghouse’s guarantee fund may be available in the event of a default. |
56
MB Master Fund L.P.
Notes to Financial Statements
The following tables indicate the gross fair values of derivative instruments of futures and option contracts as separate assets and liabilities as of December 31, 2015 and 2014, respectively.
| December 31, 2015 | ||||
| Assets |
||||
| Futures Contracts |
||||
| Energy |
$ | 397,980 | ||
| Grains |
2,554,401 | |||
| Livestock |
64,005 | |||
| Softs |
763,134 | |||
|
|
|
|||
| Total unrealized appreciation on open futures contracts |
3,779,520 | |||
|
|
|
|||
| Liabilities |
||||
| Futures Contracts |
||||
| Energy |
(463,310) | |||
| Grains |
(1,200,976) | |||
| Livestock |
(3,848) | |||
| Softs |
(847,336) | |||
|
|
|
|||
| Total unrealized depreciation on open futures contracts |
(2,515,470) | |||
|
|
|
|||
| Net unrealized appreciation on open futures contracts |
$ | 1,264,050 | * | |
|
|
|
|||
| Assets |
||||
| Options Purchased |
||||
| Grains |
295,444 | |||
| Softs |
1,575,210 | |||
|
|
|
|||
| Total options purchased |
$ | 1,870,654 | ** | |
|
|
|
|||
| Liabilities |
||||
| Options Written |
||||
| Grains |
$ | (16,100) | ||
| Softs |
(781,308) | |||
|
|
|
|||
| Total options written |
$ | (797,408) | *** | |
|
|
|
|||
| * | This amount is in “Net unrealized appreciation on open futures contracts” in the Statements of Financial Condition. |
| ** | This amount is in “Options purchased, at fair value” in the Statements of Financial Condition. |
| *** | This amount is in “Options written, at fair value” in the Statements of Financial Condition. |
57
MB Master Fund L.P.
Notes to Financial Statements
| Assets | December 31, 2014 | |||
| Futures Contracts |
||||
| Energy |
$ | 29,821,382 | ||
| Grains |
1,137,234 | |||
| Livestock |
360,642 | |||
| Softs |
38,427 | |||
|
|
|
|||
| Total unrealized appreciation on open futures contracts |
31,357,685 | |||
|
|
|
|||
| Liabilities |
||||
| Futures Contracts |
||||
| Energy |
(27,255,571) | |||
| Grains |
(1,801,702) | |||
| Livestock |
(12,237) | |||
| Softs |
(165,670) | |||
|
|
|
|||
| Total unrealized depreciation on open futures contracts |
(29,235,180) | |||
|
|
|
|||
| Net unrealized appreciation on open futures contracts |
$ | 2,122,505 | * | |
|
|
|
|||
| Assets |
||||
| Options Purchased |
||||
| Energy |
$ | 104,920 | ||
| Grains |
6,044,887 | |||
| Livestock |
2,246,660 | |||
| Softs |
3,320,925 | |||
|
|
|
|||
| Total options purchased |
$ | 11,717,392 | ** | |
|
|
|
|||
| Liabilities |
||||
| Options Written |
||||
| Energy |
$ | (678,960) | ||
| Grains |
(5,583,325) | |||
| Livestock |
(2,728,990) | |||
| Softs |
(3,535,564) | |||
|
|
|
|||
| Total options written |
$ | (12,526,839) | *** | |
|
|
|
|||
| * | This amount is in “Net unrealized appreciation on open futures contracts” in the Statements of Financial Condition. |
| ** | This amount is in “Options purchased, at fair value” in the Statements of Financial Condition. |
| *** | This amount is in “Options written, at fair value” in the Statements of Financial Condition. |
58
MB Master Fund L.P.
Notes to Financial Statements
The following table indicates the trading gains and losses, by market sector, on derivative instruments for the years ended December 31, 2015, 2014 and 2013.
| Sector |
2015 | 2014 | 2013 | |||||||||
| Currencies |
$ | (34,668) | $ | - | $ | (2,484) | ||||||
| Energy |
(1,963,043) | (2,776,408) | 1,780,340 | |||||||||
| Grains |
2,060,501 | 24,568,447 | 19,550,541 | |||||||||
| Livestock |
1,370,997 | (3,279,875) | (5,696,904) | |||||||||
| Metals |
(7,374,189) | (70,689) | 506,319 | |||||||||
| Softs |
817,189 | (11,132,122) | (1,916,716) | |||||||||
|
|
|
|
|
|
|
|||||||
| Total |
$ | (5,123,213) | * | $ | 7,309,353 | * | $ | 14,221,096 | * | |||
|
|
|
|
|
|
|
|||||||
| * | This amount is in “Total trading results” in the Statements of Income and Expenses. |
| 5. | Fair Value Measurements: |
Master’s Fair Value Measurements. Fair value is defined as the price that would be received to sell an asset or paid to transfer a liability in an orderly transaction between market participants at the measurement date under current market conditions. The fair value hierarchy gives the highest priority to unadjusted quoted prices in active markets for identical assets or liabilities (Level 1) and the lowest priority to fair values derived from unobservable inputs (Level 3). The level in the fair value hierarchy within which the fair value measurement in its entirety falls shall be determined based on the lowest level input that is significant to the fair value measurement in its entirety.
The fair value of exchange-traded futures, option and forward contracts is determined by the various exchanges, and reflects the settlement price for each contract as of the close of business on the last business day of the reporting period. The fair value of foreign currency forward contracts was extrapolated on a forward basis from the spot prices quoted as of approximately 3:00 P.M. (E.T.) on the last business day of the reporting period from various exchanges. The fair value of non-exchange-traded foreign currency option contracts was calculated by applying an industry standard model application for options valuation of foreign currency options, using as input the spot prices, interest rates, and option implied volatilities quoted as of approximately 3:00 P.M. (E.T.) on the last business day of the reporting period. U.S. Treasury bills are valued at the last available bid price received from independent pricing services as of the close of the last business day of the reporting period.
The Master considers prices for exchange-traded commodity futures, forward, swap and option contracts to be based on unadjusted quoted prices in active markets for identical assets and liabilities (Level 1). The values of U.S. Treasury bills, non-exchange-traded forward, swap and certain option contracts for which market quotations are not readily available are priced by broker quotes or pricing services that derive fair values for those assets and liabilities from observable inputs (Level 2). As of and for the years ended December 31, 2015 and 2014, the Master did not hold any derivative instruments that were priced at fair value using unobservable inputs through the application of the General Partner’s assumptions and internal valuation pricing models (Level 3). Transfers between levels are recognized at the end of the reporting period. For the years ended December 31, 2015 and 2014, there were no transfers of assets or liabilities between Level 1 and Level 2.
59
MB Master Fund L.P.
Notes to Financial Statements
| December 31, 2015 |
Total | Level 1 | Level 2 | Level 3 | ||||||||||||
| Assets |
||||||||||||||||
| U.S. Treasury bills |
$ | 136,729,500 | $ | - | $ | 136,729,500 | $ | - | ||||||||
| Futures |
3,779,520 | 3,779,520 | - | - | ||||||||||||
| Options purchased |
1,870,654 | 1,870,654 | - | - | ||||||||||||
|
|
|
|
|
|
|
|
|
|||||||||
| Total assets |
$ | 142,379,674 | $ | 5,650,174 | $ | 136,729,500 | $ | - | ||||||||
|
|
|
|
|
|
|
|
|
|||||||||
| Liabilities |
||||||||||||||||
| Futures |
$ | 2,515,470 | $ | 2,515,470 | $ | - | $ | - | ||||||||
| Options written |
797,408 | 797,408 | - | - | ||||||||||||
|
|
|
|
|
|
|
|
|
|||||||||
| Total liabilities |
$ | 3,312,878 | $ | 3,312,878 | $ | - | $ | - | ||||||||
|
|
|
|
|
|
|
|
|
|||||||||
| Net fair value |
$ | 139,066,796 | $ | 2,337,296 | $ | 136,729,500 | $ | - | ||||||||
|
|
|
|
|
|
|
|
|
|||||||||
| December 31, 2014 |
Total | Level 1 | Level 2 | Level 3 | ||||||||||||
| Assets |
||||||||||||||||
| Futures |
$ | 31,357,685 | $ | 31,357,685 | $ | - | $ | - | ||||||||
| Options purchased |
11,717,392 | 11,717,392 | - | - | ||||||||||||
|
|
|
|
|
|
|
|
|
|||||||||
| Total assets |
$ | 43,075,077 | $ | 43,075,077 | $ | - | $ | - | ||||||||
|
|
|
|
|
|
|
|
|
|||||||||
| Liabilities |
||||||||||||||||
| Futures |
$ | 29,235,180 | $ | 29,235,180 | $ | - | $ | - | ||||||||
| Options written |
12,526,839 | 12,526,839 | - | - | ||||||||||||
|
|
|
|
|
|
|
|
|
|||||||||
| Total liabilities |
$ | 41,762,019 | $ | 41,762,019 | $ | - | $ | - | ||||||||
|
|
|
|
|
|
|
|
|
|||||||||
| Net fair value |
$ | 1,313,058 | $ | 1,313,058 | $ | - | $ | - | ||||||||
|
|
|
|
|
|
|
|
|
|||||||||
60
MB Master Fund L.P.
Notes to Financial Statements
| 6. | Subscriptions, Distributions and Redemptions: |
Subscriptions are accepted monthly from investors who become limited partners on the first day of the month after subscriptions are processed. Generally, a limited partner withdraws all or part of its capital contribution and undistributed profits, if any, from the Master as of the end of any month (the “Redemption Date”) after a request for redemption has been made to the General Partner at least three days in advance of the Redemption Date. Such withdrawals are classified as a liability when the limited partner elects to redeem and informs the Master. However, a limited partner may request a withdrawal as of the end of any day if such request is received by the General Partner at least three days in advance of the proposed withdrawal day.
| 7. | Financial Highlights: |
Financial highlights for the limited partner class as a whole for the years ended December 31, 2015, 2014 and 2013 were as follows:
| 2015 | 2014 | 2013 | ||||||||||
| Ratios to average net assets: |
||||||||||||
| Net investment loss(1) |
(1.7)% | (1.7)% | (1.7)% | |||||||||
|
|
|
|
|
|
|
|||||||
| Operating expenses before expense reimbursements |
1.8% | 1.8% | 1.7% | |||||||||
| Expense reimbursements |
(0.1)% | (0.0)% | (2) | (0.0)% | (2) | |||||||
|
|
|
|
|
|
|
|||||||
| Operating expenses after expense reimbursements |
1.7% | 1.8% | 1.7% | |||||||||
|
|
|
|
|
|
|
|||||||
| Total return |
(4.8)% | 1.2% | 3.0% | |||||||||
|
|
|
|
|
|
|
|||||||
| (1) | Interest income less total expenses, net of expense reimbursements. |
| (2) | Amount less than 0.05%. |
The above ratios and total return may vary for individual investors based on the timing of capital transactions during the year. Additionally, these ratios are calculated for the limited partner class using the limited partners’ share of income, expenses and average net assets.
| 8. | Financial Instrument Risks: |
In the normal course of business, the Master is party to financial instruments with off-balance sheet risk, including derivative financial instruments and derivative commodity instruments. These financial instruments include futures, forward, option and swap contracts, whose values are based upon an underlying asset, index, or reference rate, and generally represent future commitments to exchange currencies or cash balances, or to purchase or sell other financial instruments at specific terms at specified future dates, or, in the case of derivative commodity instruments, to have a reasonable possibility to be settled in cash, through physical delivery or with another financial instrument. These instruments may be traded on an exchange, a swap execution facility or over-the-counter (“OTC”). Exchange-traded instruments include futures and certain standardized forward, swap and option contracts. Certain swap contracts may also be traded on a swap execution facility or OTC. OTC contracts are negotiated between contracting parties and also include certain forward and option contracts. Specific market movements of commodities or futures contracts underlying an option cannot accurately be predicted. The purchaser of an option may lose the entire premium paid for the option. The writer (or seller) of an option has unlimited risk. Each of these instruments is subject to various risks similar to those related to the underlying financial instruments, including market and credit risk. In general, the risks associated with OTC contracts are greater than those associated with exchange-traded instruments because of the greater risk of default by the counterparty to an OTC contract. None of the Master’s current contracts are traded OTC, although contracts may be traded OTC in the future.
61
MB Master Fund L.P.
Notes to Financial Statements
Futures Contracts. The Master trades futures contracts. A futures contract is a firm commitment to buy or sell a specified quantity of investments, currency or a standardized amount of a deliverable grade commodity, at a specified price on a specified future date, unless the contract is closed before the delivery date or the delivery quantity is something where physical delivery cannot occur (such as the S&P 500 Index), whereby such contract is settled in cash. Payments (“variation margin”) may be made or received by the Master each business day, depending on the daily fluctuations in the value of the underlying contracts, and are recorded as unrealized gains or losses by the Master. When the contract is closed, the Master records a realized gain or loss equal to the difference between the value of the contract at the time it was opened and the value at the time it was closed. Transactions in futures contracts require participants to make both initial margin deposits of cash or other assets and variation margin deposits, through the futures broker, directly with the exchange on which the contracts are traded. Net realized gains (losses) and net change in unrealized gains (losses) on futures contracts are included in the Statements of Income and Expenses.
Options. The Master may purchase and write (sell) both exchange-listed and OTC options on commodities or financial instruments. An option is a contract allowing, but not requiring, its holder to buy (call) or sell (put) a specific or standard commodity or financial instrument at a specified price during a specified time period. The option premium is the total price paid or received for the option contract. When the Master writes an option, the premium received is recorded as a liability in the Statements of Financial Condition and marked to market daily. When the Master purchases an option, the premium paid is recorded as an asset in the Statements of Financial Condition and marked to market daily. Net realized gains (losses) and net change in unrealized gains (losses) on options contracts are included in the Statement of Income and Expenses.
London Metals Exchange Forward Contracts. Metal contracts traded on the London Metals Exchange (“LME”) represent a firm commitment to buy or sell a specified quantity of aluminum, copper, lead, nickel, tin or zinc. LME contracts traded by the Master are cash settled based on prompt dates published by the LME. Payments (“variation margin”) may be made or received by the Master each business day, depending on the daily fluctuations in the value of the underlying contracts, and are recorded as unrealized gains or losses by the Master. A contract is considered offset when all long positions have been matched with a like number of short positions settling on the same prompt date. When the contract is closed at the prompt date, the Master records a realized gain or loss equal to the difference between the value of the contract at the time it was opened and the value at the time it was closed. Transactions in LME contracts require participants to make both initial margin deposits of cash or other assets and variation margin deposits, through the broker, directly with the LME. Net realized gains (losses) and net change in unrealized gains (losses) on metal contracts are included in the Statements of Income and Expenses.
The Master does not isolate the portion of the results of operations arising from the effect of changes in foreign exchange rates on investments from fluctuations from changes in market prices of investment held. Such fluctuations are included in total trading results in the Statement of Income and Expenses.
Market risk is the potential for changes in the value of the financial instruments traded by the Master due to market changes, including interest and foreign exchange rate movements and fluctuations in commodity or security prices. Market risk is directly impacted by the volatility and liquidity in the markets in which the related underlying assets are traded. The Master is exposed to a market risk equal to the value of futures and forward contracts purchased and unlimited liability on such contracts sold short.
62
MB Master Fund L.P.
Notes to Financial Statements
Credit risk is the possibility that a loss may occur due to the failure of a counterparty to perform according to the terms of a contract. The Master’s risk of loss in the event of a counterparty default is typically limited to the amounts recognized in the Statements of Financial Condition and is not represented by the contract or notional amounts of the instruments. The Master’s risk of loss is reduced through the use of legally enforceable master netting agreements with counterparties that permit the Master to offset unrealized gains and losses and other assets and liabilities with such counterparties upon the occurrence of certain events. The Master had credit risk and concentration risk during the reporting period and prior periods, as MS&Co. and/or CGM or their affiliates were the sole counterparties or brokers with respect to the Master’s assets. Credit risk with respect to exchange-traded instruments is reduced to the extent that through MS&Co. and/or CGM, the Master’s counterparty is an exchange or clearing organization.
As both a buyer and seller of options, the Master pays or receives a premium at the outset and then bears the risk of unfavorable changes in the price of the contract underlying the option. Written options expose the Master to potentially unlimited liability; for purchased options the risk of loss is limited to the premiums paid. Certain written put options permit cash settlement and do not require the option holder to own the reference asset. The Master does not consider these contracts to be guarantees.
The General Partner monitors and attempts to control the Master’s risk exposure on a daily basis through financial, credit and risk management monitoring systems and accordingly, believes that it has effective procedures for evaluating and limiting the credit and market risks to which the Master may be subject. These monitoring systems generally allow the General Partner to statistically analyze actual trading results with risk-adjusted performance indicators and correlation statistics. In addition, online monitoring systems provide account analysis of futures, forward and option contracts by sector, margin requirements, gain and loss transactions and collateral positions.
The majority of these instruments mature within one year of the inception date. However, due to the nature of the Master’s business, these instruments may not be held to maturity.
63
Selected unaudited quarterly financial data for MB Master for the years ended December 31, 2015 and 2014 is summarized below:
| For the period from October 1, 2015 to December 31, 2015 |
For the period from July 1, 2015 to September 30, 2015 |
For the period from April 1, 2015 to June 30, 2015 |
For the period from January 1, 2015 to March 31, 2015 |
|||||||||||||
| Total trading results |
$ | (5,551,462 | ) | $ | (6,202,832 | ) | $ | (332,117 | ) | $ | 6,963,198 | |||||
| Total investment income (loss) |
(5,348 | ) | 2,752 | 3,403 | 4,283 | |||||||||||
| Net expenses |
(835,987 | ) | (1,079,519 | ) | (880,882 | ) | (753,648 | ) | ||||||||
|
|
|
|
|
|
|
|
|
|||||||||
| Net income (loss) |
$ | (6,392,797 | ) | $ | (7,279,599 | ) | $ | (1,209,596 | ) | $ | 6,213,833 | |||||
|
|
|
|
|
|
|
|
|
|||||||||
| For the period from October 1, 2014 to December 31, 2014 |
For the period from July 1, 2014 to September 30, 2014 |
For the period from April 1, 2014 to June 30, 2014 |
For the period from January 1, 2014 to March 31, 2014 |
|||||||||||||
| Total trading results |
$ | (6,179,917 | ) | $ | 13,292,384 | $ | 5,623,615 | $ | (5,426,729 | ) | ||||||
| Total investment income |
7,059 | 6,660 | 8,812 | 18,694 | ||||||||||||
| Net expenses |
(826,207 | ) | (1,204,074 | ) | (1,202,119 | ) | (1,464,128 | ) | ||||||||
|
|
|
|
|
|
|
|
|
|||||||||
| Net income (loss) |
$ | (6,999,065 | ) | $ | 12,094,970 | $ | 4,430,308 | $ | (6,872,163 | ) | ||||||
|
|
|
|
|
|
|
|
|
|||||||||
64
Item 9. Changes in and Disagreements with Accountants on Accounting and Financial Disclosure.
Not applicable.
Item 9A. Controls and Procedures.
The Partnership’s disclosure controls and procedures are designed to ensure that information required to be disclosed by the Partnership on the reports that it files or submits under the Exchange Act is recorded, processed, summarized and reported within the time periods expected in the SEC’s rules and forms. Disclosure controls and procedures include controls and procedures designed to ensure that information required to be disclosed by the Partnership in the reports it files is accumulated and communicated to management, including the President and Chief Financial Officer (“CFO”) of the General Partner, to allow for timely decisions regarding required disclosure and appropriate SEC filings.
The General Partner is responsible for ensuring that there is an adequate and effective process for establishing, maintaining and evaluating disclosure controls and procedures for the Partnership’s external disclosures.
The General Partner’s President and CFO have evaluated the effectiveness of the Partnership’s disclosure controls and procedures (as defined in Rules 13a-15(e) and 15d-15(e) under the Exchange Act) as of December 31, 2015, and, based on that evaluation, the General Partner’s President and CFO have concluded that at that date the Partnership’s disclosure controls and procedures were effective.
The Partnership’s internal control over financial reporting is a process under the supervision of the General Partner’s President and CFO to provide reasonable assurance regarding the reliability of financial reporting and the preparation of financial statements in accordance with GAAP. These controls include policies and procedures that:
| • | pertain to the maintenance of records that, in reasonable detail, accurately and fairly reflect the transactions and dispositions of the assets of the Partnership; |
| • | provide reasonable assurance that (i) transactions are recorded as necessary to permit preparation of financial statements in accordance with GAAP, and (ii) the Partnership’s receipts are handled and expenditures are made only pursuant to authorizations of the General Partner; and |
| • | provide reasonable assurance regarding prevention or timely detection and correction of unauthorized acquisition, use or disposition of the Partnership’s assets that could have a material effect on the financial statements. |
The report included in “Item 8. Financial Statements and Supplementary Data.” includes management’s report on internal control over financial reporting (“Management’s Report”).
There were no changes in the Partnership’s internal control over financial reporting process during the fiscal quarter ended December 31, 2015 that materially affected, or are reasonably likely to materially affect, the Partnership’s internal control over financial reporting.
Item 9B. Other Information.
Effective February 1, 2016, Steven Ross was appointed as a director of the General Partner and Frank Smith resigned as a director of the General Partner.
Effective February 24, 2016, Edmond Moriarty and Kevin Klingert resigned as directors of the General Partner.
65
PART III
Item 10. Directors, Executive Officers and Corporate Governance.
The Partnership has no directors or executive officers and its affairs are managed by its General Partner. Investment decisions are made by the Advisor.
The directors and executive officers of the General Partner are Patrick T. Egan (President and Chairman of the Board of Directors of the General Partner), Steven Ross (Chief Financial Officer and Director), M. Paul Martin (Director) and Feta Zabeli (Director). Each director holds office until the earlier of his or her death, resignation or removal. Vacancies on the board of directors may be filled by either (i) the majority vote of the remaining directors or (ii) MSSB Holdings, as the sole member of the General Partner. The officers of the General Partner are designated by the General Partner’s board of directors. Each officer will hold office until his or her successor is designated and qualified or until his or her death, resignation or removal.
Directors of the General Partner are responsible for overall corporate governance of the General Partner and meet periodically to consider strategic decisions regarding the General Partner’s activities. Under CFTC rules, each Director of the General Partner is deemed to be a principal of the General Partner and, as a result, is listed as such with the NFA. Patrick T. Egan, Feta Zabeli and Steven Ross serve on the General Partner’s Investment Committee and are the trading principals responsible for allocation decisions (or supervising those responsible).
Patrick T. Egan, age 47, has been a Director of the General Partner since December 2010. Since December 2010, Mr. Egan has been a principal and registered as an associated person of the General Partner, and is an associate member of NFA. Since October 2014, Mr. Egan has served as President and Chairman of the Board of Directors of the General Partner. Since August 2013, Mr. Egan has been registered as a swap associated person of the General Partner. From September 2013 to May 2014, Mr. Egan served as a Vice President of Morgan Stanley Strategies LLC, formerly known as Morgan Stanley GWM Feeder Strategies LLC, which acts as a general partner to multiple alternative investment entities, and Morgan Stanley AI GP LLC, formerly known as Morgan Stanley HedgePremier GP LLC, which acts as a general partner and administrative agent to numerous hedge fund feeder funds. From September 2013 to May 2014, Mr. Egan was registered as an associated person and listed as a principal of each such entity. Since January 2013, each such entity has been registered as a commodity pool operator with the CFTC. Mr. Egan was responsible for overseeing the implementation of certain CFTC and NFA regulatory requirements applicable to such entities. From June 2009 to December 2014, Mr. Egan was employed by Morgan Stanley Smith Barney LLC, a financial services firm, where his responsibilities included serving as Executive Director and as Co-Chief Investment Officer for Morgan Stanley Managed Futures from June 2009 through June 2011 and as Chief Risk Officer for Morgan Stanley Managed Futures from June 2011 through October 2014. Since October 2014, Mr. Egan has been responsible for the day-to-day operations and management of Morgan Stanley Managed Futures. Since January 2015, Mr. Egan has been employed by the General Partner. From November 2010 to October 2014, Mr. Egan was registered as an associated person of Morgan Stanley Smith Barney LLC. From April 2007 through June 2009, Mr. Egan was employed by MS & Co., a financial services firm, where his responsibilities included serving as Head of Due Diligence and Manager Research for Morgan Stanley’s Managed Futures Department. From April 2007 through November 2010, Mr. Egan was registered as an associated person of MS & Co. From March 1993 through April 2007, Mr. Egan was employed by Morgan Stanley DW Inc., a financial services firm, where his initial responsibilities included serving as an analyst and manager within the Managed Futures Department (with primary responsibilities for product development, due diligence, investment analysis and risk management of the firm’s commodity pools) and later included serving as Head of Due Diligence and Manager Research for Morgan Stanley’s Managed Futures Department. From February 1998 through April 2007, Mr. Egan was registered as an associated person of Morgan Stanley DW Inc. From August 1991 through March 1993, Mr. Egan was employed by Dean Witter Intercapital, the asset management arm of Dean Witter Reynolds, Inc., where his responsibilities included serving as a mutual fund administration associate. Mr. Egan also served as a Director from November 2004 through October 2006, and from November 2006 through October 2008 of the Managed Funds Association’s Board of Directors, a position he was elected to by industry peers for two consecutive two-year terms. Mr. Egan earned his Bachelor of Business Administration degree with a concentration in Finance in May 1991 from the University of Notre Dame.
Steven Ross, age 44, has been Chief Financial Officer and a principal of the General Partner since July 2014 and a Director of the General Partner since February 2016. Mr. Ross has been employed by Morgan Stanley Investment Management, a financial services firm, since September 2005, where his responsibilities include serving as an Assistant Treasurer of Morgan Stanley with respect to certain investment vehicles publicly offered by Morgan Stanley. Mr. Ross is also an Executive Director of the Morgan Stanley Fund Administration Group where he is responsible for finance and accounting matters for certain private funds offered by Morgan Stanley. Before joining Morgan Stanley Investment Management, Mr. Ross was employed by JPMorgan Investor Services Co., a financial services firm, from December 1997 through September 2005, where his responsibilities included serving as a Vice President responsible for the accounting of certain funds sponsored by JP Morgan Chase & Co. and other large fund families serviced by JPMorgan Investor Services Co. From April 1997 to December 1997, Mr. Ross was employed by Investors Bank & Trust, a financial services firm, where his responsibilities included performing mutual fund accounting for financial services firms. Mr. Ross began his career at Putnam Investments LLC, a financial services firm, where he was responsible for providing broker services for certain funds sponsored by Putnam Investments LLC from August 1996 to April 1997. Mr. Ross received a B.S. in Accounting from Rhode Island College in May 1995.
66
M. Paul Martin, age 57, has been a Director of the General Partner since October 2014. Mr. Martin has also served as Managing Director – Global Operations of Morgan Stanley Investment Management, a financial services firm, since June 2006, where his responsibilities include managing all elements of in-sourced and out-sourced global operations, and serving as a senior member of Morgan Stanley Investment Management’s Management, Risk Management, & New Products Committees. Mr. Martin has been listed as a principal of the General Partner since October 2014. Mr. Martin previously served as the Managing Director and Chief Operating Officer of Morgan Stanley Fund Services, a financial services firm, where his responsibilities included launching the Hedge Fund Administration business and being responsible for operations, fund accounting and administration, technology and compliance, from May 2004 through May 2006. Previously, Mr. Martin served as Managing Director – Institutional Investment Operations of Morgan Stanley Investment Management from January 1995 until April 2004, where his responsibilities included trading room support, portfolio administration, service provider management, and derivatives processing and control. From April 1994 through January 1995, Mr. Martin served as Senior Vice President and Head of Custody Operations for Fidelity Investments, a financial services firm. From October 1989 through April 1994, Mr. Martin served as Executive Director and Head of Global Operations for Morgan Stanley Trust Company, a financial services firm. Mr. Martin also served as Vice President – Information Technology for MS & Co., a financial services firm, from June 1984 through October 1989, where his responsibilities included acting as Senior Developer and Programming Manager – Prime Brokerage and Securities Clearance Systems, and as Part-time Manager – IT Training Program. From February 1984 through May 1984, Mr. Martin served as a Senior Analyst in the Financial Control Group of Shearson Lehman Brothers, Inc., a financial services firm. From October 1980 through January 1984, Mr. Martin served as a Senior Consultant – Management Information Consulting Division at Arthur Andersen & Co., an accounting firm, where his responsibilities included programming and programming supervisory roles at large governmental agencies. Mr. Martin received a B.S. in Business Administration - Finance from Georgetown University in May 1980 and an M.B.A. in Finance from New York University in June 1993.
Feta Zabeli, age 56, has been a Director of the General Partner since October 2014. Mr. Zabeli has also served as a director on the Board of Directors of Morgan Stanley Investment Management, a financial services firm, since January 2015 and has been listed as a principal since February 2015. Mr. Zabeli is also Global Head of Risk for Morgan Stanley Investment Management’s Traditional Asset Management business where he is responsible for investment risk of all equity, fixed income, money market, multi-asset class and alternatives portfolios. He is also responsible for counterparty and quantitative model risk for the traditional asset management business. He joined Morgan Stanley in January 2012. Mr. Zabeli has been listed as a principal of the General Partner since October 2014. Mr. Zabeli was on garden leave in December 2011. From February 2006 to November 2011, Mr. Zabeli was Senior Vice President, and most recently Global Co-Head of Risk, for AllianceBernstein L.P., a global investment firm, with various risk management assignments in Hong Kong, Tokyo, London and New York. From August 2006 to April 2009, Mr. Zabeli was based in Hong Kong for AllianceBernstein as the Director of Risk Management for Asia Pacific. From April 2009 to July 2011, he was based in Tokyo for AllianceBernstein as both Director of Risk Management for Asia Pacific and Head of Risk Management for Japan. From July 2011 to November 2011, he was based in London for AllianceBernstein as Global Head of Operational & Credit/Counterparty Risk. In these roles at AllianceBernstein he was responsible for the full range of risk management functions including investment, operational and credit/counterparty risk. Prior to his Risk Management roles at Morgan Stanley and AllianceBernstein, Mr. Zabeli held positions as a managing director at Citigroup Asset Management, the asset management division of Citigroup, an international financial services company, from April 1998 to January 2006, where he worked as a quantitative research analyst and portfolio manager, and director at BARRA Inc., a global provider of risk analytic tools to investment institutions, from September 1993 to March 1998, where he developed risk models and applications. Mr. Zabeli received a B.S. in Aerospace Engineering from Rensselaer Polytechnic Institute in May 1982, an M.S. in Electrical Engineering from the University of Southern California in May 1988 and an M.B.A. from the University of California at Los Angeles in August 1992.
The Partnership has not adopted a code of ethics that applies to executive officers because it has no executive officers. In addition, the Partnership has not adopted any procedures by which investors may recommend nominees to the Partnership’s board of directors and has not established an audit committee because it has no board of directors.
67
Item 11. Executive Compensation.
The Partnership has no directors or officers. Its affairs are managed by the General Partner. As compensation for its services, the Partnership pays the General Partner a General Partner fee as described under “Item l. Business.” During the year ended December 31, 2015, the General Partner earned $1,835,521 in General Partner fees. Morgan Stanley Wealth Management, an affiliate of the General Partner, is a selling agent for the Partnership and receives an ongoing selling agent fee for such services, as described under “Item 1. Business.” For the year ended December 31, 2015, Morgan Stanley Wealth Management earned $3,682,073 in ongoing selling agent fees from the Partnership. As compensation for its services, the Partnership pays the Advisor management and incentive fees as described under “Item I. Business.” For the year ended December 31, 2015, the Advisor earned $2,294,402 in management fees. There were no incentive fees earned by the Advisor for the year ended December 31, 2015. The Advisor will not be paid incentive fees until the Advisor recovers the net loss incurred and earns additional new trading profits for the Partnership.
Item 12. Security Ownership of Certain Beneficial Owners and Management and Related Stockholder Matters.
| (a) | Security ownership of certain beneficial owners. As of February 29, 2016, the Partnership knows of one person who beneficially owns more than 5% of the Redeemable Units outstanding. |
| Title of Class | Name and Address of Beneficial Ownership |
Amount and Nature of Beneficial Ownership |
Percent of Class | |||
| Redeemable Units |
Dennis Bearden 10510 West Sam Houston Parkway South Houston, TX 77099-2848 |
6,546.8580 | 6.3% |
| (b) | Security ownership of management. Under the terms of the Limited Partnership Agreement, the Partnership’s affairs are managed by the General Partner. The following table indicates securities owned by the General Partner as of December 31, 2015: |
| (1) Title of Class | (2) Name of Beneficial Owner |
(3) Amount and Nature of Beneficial Ownership |
(4) Percent of Class | |||
| General Partner Redeemable Units |
General Partner | 1,310.9445 | 1.3% |
| (c) | Changes in control. None. |
| Item 13. | Certain Relationships and Related Transactions and Director Independence. |
| (a) | Transactions with related persons. None. |
| (b) | Review, approval or ratification of transactions with related persons. Not applicable. |
| (c) | Promoters and certain control persons. MS&Co., CGM, Morgan Stanley Wealth Management and the General Partner could be considered promoters for purposes of Item 404 (c) of Regulation S-K. The nature and the amounts of compensation each promoter received or will receive from the Partnership are set forth under “Item 1. Business,” “Item 8. Financial Statements and Supplementary Data.” and “Item 11. Executive Compensation.” |
68
Item 14. Principal Accountant Fees and Services.
(1) Audit Fees. The aggregate fees billed for each of the last two fiscal years for professional services rendered by Deloitte & Touche LLP (“Deloitte”) for the years ended December 31, 2015 and 2014, for the audits of the Partnership’s annual financial statements, reviews of financial statements included in the Partnership’s Forms 10-Q and 10-K and other services normally provided in connection with regulatory filings or engagements were:
2015 $ 122,000
2014 $ 115,400
(2) Audit-Related Fees. None.
(3) Tax Fees. The Partnership did not pay Deloitte any amounts in 2015 and 2014 for professional services in connection with tax compliance, tax advice, and tax planning.
| (4) | All Other Fees. None. |
| (5) | Not Applicable. |
| (6) | Not Applicable. |
69
PART IV
| Item 15. | Exhibits and Financial Statement Schedules. |
(a) (1) Financial Statements:
Statements of Financial Condition at December 31, 2015 and 2014.
Statements of Income and Expenses for the years ended December 31, 2015, 2014 and 2013.
Statements of Changes in Partners’ Capital for the years ended December 31, 2015, 2014 and 2013.
Notes to Financial Statements.
(2) Exhibits:
| 3.1(a) | Certificate of Limited Partnership dated April 15, 2005 (filed as Exhibit 3.1 to the General Form for Registration of Securities on Form 10 filed on April 30, 2007 and incorporated herein by reference). |
| (b) | Certificate of Amendment of the Certificate of Limited Partnership dated September 21, 2005 (filed as Exhibit 3.1(a) to the General Form for Registration of Securities on Form 10 filed on April 30, 2007 and incorporated herein by reference). |
| (c) | Certificate of Amendment of the Certificate of Limited Partnership dated September 19, 2008 (filed as Exhibit 3.1(c) to the Quarterly Report on Form 10-Q filed on November 16, 2009 and incorporated herein by reference). |
| (d) | Certificate of Amendment of the Certificate of Limited Partnership dated September 28, 2009 (filed as Exhibit 99.1 to the Current Report on Form 8-K filed on September 30, 2009 and incorporated herein by reference). |
| (e) | Certificate of Amendment of the Certificate of Limited Partnership dated June 29, 2010 (filed as Exhibit 3.1(e) to the Current Report on Form 8-K filed on July 2, 2010 and incorporated herein by reference). |
| (f) | Certificate of Amendment of the Certificate of Limited Partnership dated September 2, 2011 (filed as Exhibit 3.1 to the Current Report on Form 8-K filed on September 7, 2011 and incorporated herein by reference). |
| (g) | Certificate of Amendment of the Certificate of Limited Partnership dated January 28, 2013 (filed as Exhibit 3.1 to the Current Report on Form 8-K filed on February 4, 2013 and incorporated herein by reference). |
| (h) | Certificate of Amendment to the Certificate of Limited Partnership dated August 7, 2013 (filed as Exhibit 3.1(h) to the Quarterly Report on Form 10-Q filed on August 14, 2013 and incorporated herein by reference). |
| 3.2(a) | Fourth Amended and Restated Limited Partnership Agreement (filed as Exhibit 3.2 to the Current Report on Form 8-K filed on February 4, 2013 and incorporated herein by reference). |
| (b) | Amendment Number 1 to the Fourth Amended and Restated Limited Partnership Agreement, effective January 1, 2016 (filed as Exhibit 3.1 to the Current Report on Form 8-K filed on January 6, 2016 and incorporated herein by reference). |
| 10.1 (a) | Advisory Agreement among the Partnership, the General Partner and SandRidge Capital, L.P. (filed as Exhibit 10.1 to the General Form for Registration of Securities on Form 10 filed on April 30, 2007 and incorporated herein by reference). |
| (b) | Letter from the General Partner to SandRidge Capital, L.P. extending the Advisory Agreement through June 30, 2013 (filed as Exhibit 10.1(b) to the Annual Report on Form 10-K filed on March 27, 2013 and incorporated herein by reference). |
| 10.2 (a) | Customer Agreement among the Partnership, the General Partner and CGM (filed as Exhibit 10.2 to the General Form for Registration of Securities on Form 10 filed on April 30, 2007 and incorporated herein by reference). |
| (b) | Addendum to the Customer Agreement among the Partnership, the General Partner and CGM (filed as Exhibit 10.2(a) to the General Form for Registration of Securities on Form 10 filed on April 30, 2007 and incorporated herein by reference). |
| 10.3 (a) | Amended and Restated Commodity Futures Customer Agreement between the Partnership and MS&Co., effective September 4, 2013 (filed as Exhibit 10.9 to the Quarterly Report on Form 10-Q filed on November 14, 2013 and incorporated herein by reference). |
| (b) | U.S. Treasury Securities Purchase Authorization Agreement between the Partnership and MS&Co., effective June 1, 2015 (filed as Exhibit 10.1 to the Current Report on Form 8-K filed on November 4, 2015 and incorporated herein by reference). |
70
| 10.4 | Amended and Restated Alternative Investment Selling Agent Agreement among the Partnership, the General Partner and Morgan Stanley Wealth Management, effective March 3, 2016 (filed as Exhibit 10.1 to the Current Report on Form 8-K filed on March 8, 2016 and incorporated herein by reference). |
| 10.5 | Form of Subscription Agreement (filed as Exhibit 10.4 to the Quarterly Report on Form 10-Q filed on November 14, 2012 and incorporated herein by reference). |
| 10.6 (a) | Management Agreement among the Partnership, the General Partner and Aventis Asset Management, LLC (filed as Exhibit 10.1 to the Current Report on Form 8-K filed on February 4, 2013 and incorporated herein by reference). |
| (b) | Letter from the General Partner to Aventis Asset Management, LLC extending the Management Agreement through June 30, 2016 (filed herewith). |
| (c) | First Amendment to the Management Agreement among the Partnership, the General Partner and Aventis Asset Management, LLC (filed as Exhibit 10.1 to the Current Report on Form 8-K filed on March 6, 2014 and incorporated herein by reference). |
| 10.7 (a) | Escrow Agreement among the General Partner, Morgan Stanley Smith Barney LLC and The Bank of New York (filed as Exhibit 10.7(a) to the Annual Report on Form 10-K filed on March 27, 2013 and incorporated herein by reference). |
| (b) | Amendment No. 5 to Escrow Agreement among the General Partner, Morgan Stanley Smith Barney LLC and The Bank of New York (filed as Exhibit 10.7(b) to the Annual Report on Form 10-K filed on March 27, 2013 and incorporated herein by reference). |
| 10.8 | Amended and Restated Master Services Agreement, by and among the Partnership, the General Partner and SS&C Technologies, Inc. (filed as Exhibit 10.1 to the Current Report on Form 8-K filed on August 6, 2015 and incorporated herein by reference). |
The exhibits required to be filed by Item 601 of Regulation S-K are incorporated herein by reference.
31.1 — Rule 13a-14(a)/15d-14(a) Certification (Certification of President and Director).
31.2 — Rule 13a-14(a)/15d-14(a) Certification (Certification of Chief Financial Officer and Director).
32.1 — Section 1350 Certification (Certification of President and Director).
32.2 — Section 1350 Certification (Certification of Chief Financial Officer and Director).
101.INS XBRL Instance Document.
101.SCH XBRL Taxonomy Extension Schema Document.
101.CAL XBRL Taxonomy Extension Calculation Linkbase Document.
101.LAB XBRL Taxonomy Extension Label Linkbase Document.
101.PRE XBRL Taxonomy Extension Presentation Linkbase Document.
101.DEF XBRL Taxonomy Extension Definition Linkbase Document.
71
SIGNATURES
Pursuant to the requirements of Section 13 or 15(d) of the Securities Exchange Act of 1934, the registrant has duly caused this report to be signed on its behalf by the undersigned, thereunto duly authorized.
| MANAGED FUTURES PREMIER AVENTIS II L.P. | ||
| By: Ceres Managed Futures LLC (General Partner) | ||
| By: |
/s/ Patrick T. Egan | |
| Patrick T. Egan | ||
| President & Director | ||
|
Date: March 28, 2016 | ||
Pursuant to the requirements of the Securities Exchange Act of 1934, this report has been signed below by the following persons on behalf of the Registrant and in the capacities and on the date indicated.
| /s/ Patrick T. Egan |
/s/ Feta Zabeli |
|||||||
| Patrick T. Egan |
Feta Zabeli |
|||||||
| President and Director |
Director |
|||||||
| Ceres Managed Futures LLC |
Ceres Managed Futures LLC |
|||||||
| Date: March 28, 2016 |
Date: March 28, 2016 |
|||||||
| /s/ Steven Ross |
/s/ M. Paul Martin |
|||||||
| Steven Ross |
M. Paul Martin |
|||||||
| Chief Financial Officer and Director |
Director |
|||||||
| (Principal Accounting Officer) |
Ceres Managed Futures LLC |
|||||||
| Ceres Managed Futures LLC |
Date: March 28, 2016 |
|||||||
| Date: March 28, 2016 |
||||||||
72
Supplemental Information to be Furnished With Reports Filed Pursuant to Section 15(d) of the Exchange Act by Registrants Which Have Not Registered Securities Pursuant to Section 12 of the Exchange Act.
Annual Report to Limited Partners
No proxy material has been sent to limited partners.
73