Attached files
| file | filename |
|---|---|
| EX-32 - EXHIBIT 32 - SHYFT GROUP, INC. | ex_177206.htm |
| EX-31.2 - EXHIBIT 31.2 - SHYFT GROUP, INC. | ex_177205.htm |
| EX-31.1 - EXHIBIT 31.1 - SHYFT GROUP, INC. | ex_177204.htm |
| EX-23 - EXHIBIT 23 - SHYFT GROUP, INC. | ex_177215.htm |
| EX-21 - EXHIBIT 21 - SHYFT GROUP, INC. | ex_177108.htm |
| EX-10.25 - EXHIBIT 10.25 - SHYFT GROUP, INC. | ex_177203.htm |
| EX-10.24 - EXHIBIT 10.24 - SHYFT GROUP, INC. | ex_177201.htm |
| EX-10.23 - EXHIBIT 10.23 - SHYFT GROUP, INC. | ex_177202.htm |
| EX-4.3 - EXHIBIT 4.3 - SHYFT GROUP, INC. | ex_176866.htm |
| EX-3.2 - EXHIBIT 3.2 - SHYFT GROUP, INC. | ex_176858.htm |
UNITED STATES
SECURITIES AND EXCHANGE COMMISSION
Washington, D.C. 20549
________________
FORM 10-K
|
☒ |
ANNUAL REPORT PURSUANT TO SECTION 13 OR 15(d) OF THE SECURITIES EXCHANGE ACT OF 1934 |
|
|
|
OR |
|
|
☐ |
TRANSITION REPORT PURSUANT TO SECTION 13 OR 15(d) OF THE SECURITIES EXCHANGE ACT OF 1934 |
|
| For the transition period from ___________________ to ___________________ |
Commission File Number 001-33582

SPARTAN MOTORS, INC.
(Exact Name of Registrant as Specified in Its Charter)
|
Michigan |
|
38-2078923 |
|
41280 Bridge Street Novi, Michigan |
|
|
Registrant’s Telephone Number, Including Area Code: (517) 543-6400
|
Securities registered pursuant to Section 12(b) of the Securities Exchange Act: |
|
Title of Each Class |
Trading Symbol(s) SPAR |
Name of Each Exchange on which Registered |
|
Securities registered pursuant to Section 12(g) of the Securities Exchange Act: None |
Indicate by check mark if the registrant is a well-known seasoned issuer, as defined in Rule 405 of the Securities Act.
|
|
Yes |
☐ |
|
No |
☒ |
|
Indicate by check mark if the registrant is not required to file reports pursuant to Section 13 or Section 15(d) of the Act.
|
|
Yes |
☐ |
|
No |
☒ |
|
Indicate by check mark whether the registrant: (1) has filed all reports required to be filed by Section 13 or 15(d) of the Securities Exchange Act of 1934 during the preceding 12 months (or for such shorter period that the registrant was required to file such reports), and (2) has been subject to such filing requirements for the past 90 days.
Yes ☒ No ☐
Indicate by check mark whether the registrant has submitted electronically every Interactive Data File required to be submitted pursuant to Rule 405 of Regulation S-T (§ 232.405 of this chapter) during the preceding 12 months (or for such shorter period that the registrant was required to submit such files).
Yes ☒ No ☐
|
Large accelerated filer |
☐ |
|
Accelerated filer |
☒ |
Non-accelerated filer |
☐ |
Smaller reporting company |
☐ |
Emerging growth company |
☐ |
If an emerging growth company, indicate by check mark if the registrant has elected not to use the extended transition period for complying with any new or revised financial accounting standards provided pursuant to Section 13(a) of the Exchange Act. ☐
Indicate by check mark whether the registrant is a shell company (as defined in Rule 12b-2 of the Exchange Act).
Yes ☐ No ☒
The aggregate market value of the registrant’s common stock held by non-affiliates of the registrant, based on the last sales price of such stock on NASDAQ Global Select Market on June 28, 2019, the last business day of the registrant’s most recently completed second fiscal quarter: $372,242,152.
The number of shares outstanding of the registrant’s Common Stock, $.01 par value, as of February 28, 2020: 35,427,976 shares
Documents Incorporated by Reference
Portions of the definitive proxy statement for the registrant’s May 20, 2020 annual meeting of shareholders, to be filed with the Securities and Exchange Commission no later than 120 days after December 31, 2019 are incorporated by reference in Part III.
FORWARD-LOOKING STATEMENTS
This Form 10-K contains some statements that are not historical facts. These statements are called “forward-looking statements” within the meaning of Section 27A of the Securities Act of 1933 and Section 21E of the Securities Exchange Act of 1934. These statements involve important known and unknown risks, uncertainties and other factors and can be identified by phrases using “estimate,” “anticipate,” “believe,” “project,” “expect,” “intend,” “predict,” “potential,” “future,” “may,” “will,” “should” and similar expressions or words. Our future results, performance or achievements may differ materially from the results, performance or achievements discussed in the forward-looking statements. These statements are not guarantees of future performance and involve certain risks, uncertainties and assumptions (“Risk Factors”) that are difficult to predict with regard to timing, extent, likelihood and degree of occurrence. Therefore, actual results and outcomes may materially differ from what may be expressed or forecasted in such forward-looking statements.
Risk Factors include the risk factors listed and more fully described in Item 1A below, “Risk Factors”, as well as risk factors that we have discussed in previous public reports and other documents filed with the Securities and Exchange Commission. The list in Item 1A below includes all known risks our management believes could materially affect the results described by forward-looking statements contained in this Form 10-K. However, these risks may not be the only risks we face. Our business, operations, and financial performance could also be affected by additional factors that are not presently known to us or that we currently consider to be immaterial to our operations. In addition, new Risk Factors may emerge from time to time that may cause actual results to differ materially from those contained in any forward-looking statements. Given these risks and uncertainties, although we believe that the forward-looking statements contained in this Form 10-K are reasonable, we cannot provide you with any guarantee that the anticipated results will be achieved. All forward-looking statements in this Form 10-K are expressly qualified in their entirety by the cautionary statements contained in this section and investors should not place undue reliance on forward-looking statements as a prediction of actual results. The Company undertakes no obligation to update or revise any forward-looking statements to reflect developments or information obtained after the date this Form 10-K is filed with the Securities and Exchange Commission.
PART I
|
Item 1. |
Business. |
General
Spartan Motors, Inc. was organized as a Michigan corporation on September 18, 1975, and is headquartered in Novi, Michigan. As used herein, the term “Company”, “we”, “us” or “our” refers to Spartan Motors, Inc. and its subsidiaries unless designated or identified otherwise.
We are a niche market leader in specialty vehicle manufacturing and assembly for the commercial vehicle (including last-mile delivery, specialty service and vocation-specific upfit segments) and recreational vehicle industries. Our products include walk-in vans and truck bodies used in e-commerce/parcel delivery, upfit equipment used in the mobile retail and utility trades, luxury Class A diesel motor home chassis, military vehicles, and contract manufacturing and assembly services. We also supply replacement parts and offer repair, maintenance, field service and refurbishment services for the vehicles that we manufacture. Our operating activities are conducted through our wholly-owned operating subsidiary, Spartan Motors USA, Inc. (“Spartan USA”), with locations in Charlotte, Michigan; Ephrata, Pennsylvania; Pompano Beach, Florida; Bristol, Indiana; North Charleston, South Carolina; Kansas City, Missouri; Montebello, Carson, Union City and Roseville, California; Mesa, Arizona; Dallas and Weatherford, Texas; and Saltillo, Mexico.
Our vehicles, parts and services are sold to commercial users, original equipment manufacturers (OEMs), dealers, individual end users, and municipalities and other governmental entities. Our product portfolio gives us access to multiple differentiated markets and corresponding customer bases which help to mitigate the impact of business cycles. Our diversification across several sectors provides numerous opportunities while reducing overall risk as the various markets we serve tend to have different cyclicality. We have an innovative team focused on building lasting relationships with our customers by designing and delivering market leading specialty vehicles, vehicle components, and services. Additionally, our business structure provides the agility to quickly respond to market needs, take advantage of strategic opportunities when they arise and correctly size and scale operations to ensure stability and growth. Our expansion of equipment upfit services in our Fleet Vehicles and Services segment, and the growing opportunities that we have capitalized on in last mile delivery as a result of the rapidly changing e-commerce market, are excellent examples of our ability to generate growth and profitability by quickly fulfilling customer needs.
Acquisition of Royal Truck Body
On September 9, 2019, the Company completed the acquisition of Fortress Resources, LLC D/B/A Royal Truck Body (“Royal”) for $89.4 million in cash, subject to certain post-closing adjustments. Royal is a leading California-based designer, manufacturer and installer of service truck bodies and accessories. Royal manufactures and assembles truck body options for various trades, service truck bodies, stake body trucks, contractor trucks, and dump bed trucks. Royal is the largest service body company in the western United States with its principal facility in Carson, California. Royal has additional manufacturing, assembly, and service space in branch locations in Union City and Roseville, California; Mesa, Arizona; and Dallas and Weatherford, Texas. This acquisition allows us to quickly expand our footprint in the western United States supporting our strategy of coast-to-coast manufacturing and distribution. Royal is part of our Specialty Chassis and Vehicle segment. See “Note 3 – Acquisition Activities” of the Notes to Consolidated Financial Statements appearing in Item 8 of this Form 10-K for further discussion of this transaction.
Divestiture of the Emergency Response and Vehicle Business
On February 1, 2020, the Company completed the sale of its Emergency Response and Vehicle (“ERV”) business for $55 million in cash, subject to certain post-closing adjustments. The ERV business consisted of the emergency response cab-chassis and apparatus operations in Charlotte, Michigan, and the Spartan apparatus operations in Brandon, South Dakota; Snyder and Neligh, Nebraska; and Ephrata, Pennsylvania. The divestiture will allow us to further focus on accelerating growth and profitability in our commercial, fleet, delivery and specialty vehicles markets. As a result of this divestiture, the ERV business is accounted for as a discontinued operation for all periods presented. See “Note 2 – Discontinued Operations” of the Notes to Consolidated Financial Statements appearing in Item 8 of this Form 10-K for further discussion of this transaction.
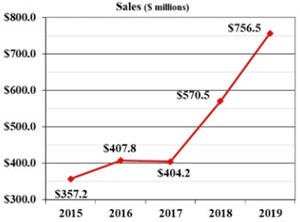
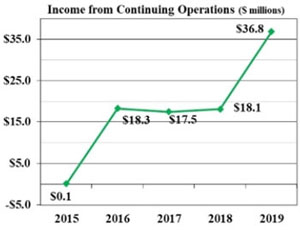
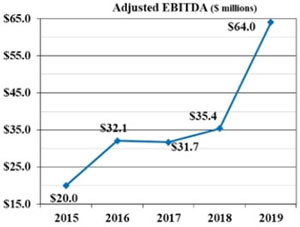
Unless noted otherwise, the data in this Form 10-K reflects our continuing operations and, therefore, excludes the performance of our prior ERV business. Over the past five years our sales have increased by $399.3 million, a compound annual growth rate (CAGR) of 20.6%, while income (loss) from continuing operations and adjusted EBITDA have grown by $36.7 million and $44.0 million, respectively. Please see the reconciliation of income (loss) from continuing operations to adjusted EBITDA below.
 |
 |
 |
Our Segments
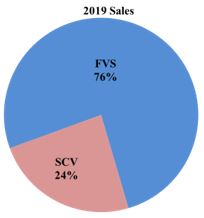
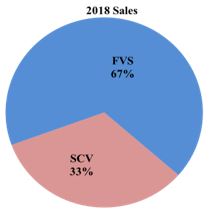
We identify our reportable segments based on our management structure and the financial data utilized by our chief operating decision maker to assess segment performance and allocate resources among our operating units. We have two reportable segments: Fleet Vehicles and Services ("FVS") and Specialty Chassis and Vehicles (“SCV”). For certain financial information related to each segment, see "Note 18 – Business Segments" of the Notes to Consolidated Financial Statements appearing in Item 8 of this Form 10-K. Sales by segment is as follows:
 |
 |
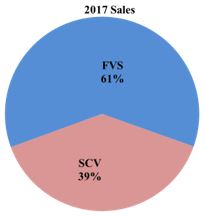 |
Fleet Vehicles and Services Segment
We manufacture commercial vehicles used in the e-commerce/last mile/parcel delivery, beverage and grocery delivery, laundry and linen, mobile retail, and trades and construction industries through our Bristol, Indiana; Ephrata, Pennsylvania; North Charleston, South Carolina; Charlotte, Michigan and Montebello, California locations. Our commercial vehicles are marketed under the Utilimaster brand name, which serves a diverse customer base and sells aftermarket parts and accessories for walk-in vans and other delivery vehicles. We also provide vocation-specific equipment upfit services, which are marketed and sold under the Utilimaster Upfit Services and Strobes-R-Us go-to-market brands, through our manufacturing operations in Kansas City, Missouri; North Charleston, South Carolina; Pompano Beach, Florida; and Saltillo, Mexico. Our Fleet Vehicles and Services segment employed 2,097 associates as of December 31, 2019, of which 838 were contracted associates.
We offer fleet vehicles in class 1 through 7, the largest range of product offerings among our competitors.
|
|
|
|
|
|
Class 1 |
Class 2 |
Class 3 |
Class 4 |
|
|
|
|
|
|
Class 5 |
Class 6 |
Class 7 |


Innovation
Our “Solution Experts” employ a customer-centric approach by working with customers through a process of listening and learning, needs assessment, and design innovation through building and implementing solutions custom designed for our customers. Recent innovations implemented by our Solution Experts include innovative and cost saving solutions for the specialty service segment, utility industry, food and beverage delivery, and mobile retail industry, such as safe loading equipment, keyless entry systems, backup camera systems, and refrigeration solutions. Our teams can deliver product customization ranging from out-of-the-box to 100% custom solutions.
Products
|
|
Walk-in Vans Assembled on a “stripped” truck chassis supplied with engine and drive train components, but without a cab, our walk-in vans are used in the parcel delivery, mobile retail and construction trades industries and feature a durable and lightweight aluminum body with a highly modular cargo area accessible from the cab. Our walk-in vans offer low step-in height for easy entry and exit and the best driver visibility in the industry. |
|
|
|
|
|
Truck Bodies Our truck bodies are the industry standard for heavy-duty commercial delivery and are installed on chassis from a variety of manufacturers that are supplied with a finished cab. They feature a highly customizable cargo area for maximum versatility and are manufactured with anti-rust galvanized steel and aluminum. Available with cargo lengths from 10 to 28 feet and interior heights ranging from 72 to 108 inches. |
|
|
|
|
|
Reach® The Reach is a smaller, more nimble walk-in van. Built on an Isuzu chassis, which has been electrified by Cummings and available in lengths of 12 or 14 feet, the Reach offers a versatile cargo area with integrated logistics tracks allowing for a tailored upfit through either pre-designed vocational or completely custom packages. |
|
|
|
|
|
Cutaway Our cutaway truck bodies are the industry standard for medium-duty commercial delivery and are installed on chassis from a variety of manufacturers that are supplied with a finished cab. The innovative cab can be designed to fit as many as five crew members and can be configured with a set-back walk-through bulkhead allowing access to the cargo area from the cab. Available with cargo lengths from 10 to 18 feet and interior heights ranging from 72 to 90 inches. |
|
|
|
|
|
Velocity® A productive, efficient and ergonomically designed walk-in van designed to make large product/package deliveries easy, with lower entry/exit height and 3-point grab rails at side and rear doors. Economical to operate with a cost of ownership about half that of a traditional walk-in van. |
|
|
|
|
|
Specialty Upfit We install specialty interior and exterior upfit equipment for walk-in vans, truck bodies and passenger vans for added safety, cargo handling efficiency, and vocational functionality. |
|
|
|
|
|
Parts and Accessories We provide a full line of parts and accessories for our walk-in vans and truck bodies. |


Marketing
We market our commercial vehicles, including walk-in vans, cutaway vans and truck bodies, under the Aeromaster®, Velocity, Ultimate, Trademaster®, Metromaster®, Utilivan®, Utilimaster Upfit Services and Reach brand names. We sell our fleet vehicles to leasing companies, national and fleet accounts (national accounts typically have 1,000+ vehicle fleets and fleet accounts typically have 100+ vehicle fleets), and through a network of independent truck dealers in the U.S. and Canada. We also market our truck bodies direct to retail customers in select markets. We provide aftermarket support, including parts sales and field service, to all of our fleet vehicle customers through our Customer Service Department located in Bristol, Indiana, which maintains the only online parts resource among the major delivery vehicle manufacturers. Except in limited circumstances, we do not provide financing to dealers or, fleet or national accounts. We maintain multi-year supply agreements with certain key fleet customers in the parcel and linen/uniform rental industries.
Manufacturing
We are implementing the Spartan Production System, lean manufacturing and continuous improvement to all of our fleet vehicle operations in order to maximize efficiency and reduce costs. We manufacture walk-in vans at our Bristol, Indiana facility and truck bodies at our Ephrata, Pennsylvania; Montebello, California; and Charlotte, Michigan facilities. We have dedicated facilities at Kansas City, Missouri; North Charleston, South Carolina; Pompano Beach, Florida; and Saltillo, Mexico aligned with our commercial and OEM customers for the installation of upfit equipment. Our walk-in vans and truck bodies are manufactured on non-automated assembly lines utilizing a combination of high- and low-skilled tradespeople and assemblers. Our upfit facilities utilize teams of workers requiring minimal capital investment for efficient and timely installation of a variety of equipment.
Specialty Chassis and Vehicles Segment
Our Specialty Chassis and Vehicles segment operates out of our Charlotte, Michigan facility where we engineer and manufacture luxury Class A diesel motor home chassis, manufacture our Reach walk-in van, provide contract assembly of defense vehicles and specialty vehicles and other commercial vehicles, and distribute related aftermarket parts and accessories. Our specialty vehicle products are manufactured to customer specifications upon receipt of confirmed purchase orders. As a specialty chassis and vehicle manufacturer, we believe we hold a unique position for continued growth due to the high quality and performance of our products, our engineering reaction time, manufacturing expertise and flexibility, and the scalability of our operations. Our specialty vehicle products are generally sold through original equipment manufacturers in the case of chassis and vehicles and to dealer distributors or directly to consumers for aftermarket parts and accessories. In addition, beginning in September 2019 with our acquisition of Royal, the Specialty Chassis and Vehicles segment includes operations in Carson, Union City and Roseville, California; Mesa, Arizona; and Dallas and Weatherford, Texas. Royal is a leading California-based designer, manufacturer and installer of service truck bodies and accessories. The Specialty Chassis and Vehicles segment employed 551 associates as of December 31, 2019, of which 116 were contracted associates.
Innovation
We promote effective communication through trade shows and motor home rallies with a wide variety of motor home owners to identify needs and bring our customers the latest technology and highest quality in our motor home and specialty chassis. Over the past few years, we have introduced innovations on our motor home chassis, including: custom tuned suspensions, independent front suspension, and passive steer tag axle that greatly improve ride, handling and maneuverability; adaptive cruise control, collision mitigation, electronic stability control and lane departure warning to improve safety; and automatic air leveling that adds convenience and functionality to top line motor homes.
Products
|
|
Motor Home Chassis We custom manufacture diesel chassis for luxury Class A motor homes to the individual specifications of our motor home OEM customers through our Spartan USA subsidiary. These specifications vary based on specific interior and exterior design specifications, power requirements, horsepower, and electrical needs of the motor home bodies to be attached to the Spartan chassis. Our motor home chassis feature diesel engines of 360 to 605 horsepower and are used in motor homes ranging from 37 to 45 feet. Our motor home chassis are separated into four models: the K1, K2, K3, and K4 series chassis. |
|
|
|
|
|
Isuzu N-gas and F-series We provide final assembly services for Isuzu N-gas and F-series chassis for the North American market. These class 3 and class 5 chassis are utilized in a variety of final configurations for light duty freight hauling and industrial uses. We have a low-cost structure and a highly skilled team of assembly workers, which, along with a dedication to lean manufacturing and continuous improvement allow us to deliver superior value in contract manufacturing. |
|
|
Service Truck Bodies We manufacture and assemble truck body options for a variety of trades, service truck bodies, stake body trucks, contractor trucks and dump bed trucks. |
|
|
|
|
|
Defense and Specialty Chassis and Vehicles We partner with a variety of OEM customers to provide chassis and complete vehicle assembly for military vehicles, drill rigs, shuttle bus chassis and other specialty chassis and vehicles. |
|
|
|
|
|
Parts and Accessories We provide a full line of parts and accessories for our motor home, defense and specialty chassis as well as maintenance and repair services for our motor home and specialty chassis. |


Marketing
We sell our Class A diesel motor home chassis to OEM manufacturers for use in construction of premium motor homes. We actively participate in a variety of trade shows and motor home rallies that promote our products and aftermarket parts and services in addition to providing an opportunity to communicate with our end customers to showcase Spartan’s latest innovations and identify needs and opportunities for continuous improvement of our chassis.
Manufacturing
Our motor home chassis and specialty manufacturing operations benefit from implementing the Spartan Production System, lean manufacturing and continuous improvement to bring efficiency and cost reduction throughout our Specialty Chassis and Vehicles segment. We manufacture motor home chassis, drill rigs, military vehicles and specialty bus chassis on non-automated assembly lines. We assemble Isuzu N-gas and F-series chassis on high-volume assembly lines that utilize a variety of state-of-the-art automation and testing equipment.
Competition
The principal methods we use to build competitive advantages include short engineering reaction time, custom design capability, high product quality, superior customer service and quick delivery. We employ a solutions-based approach to offer specialized products tailored to customer needs across the spectrum of our products. We compete with companies that manufacture for similar markets, including some divisions of large diversified organizations that have total sales and financial resources exceeding ours. Our competition in the fleet vehicle market ranges from one large manufacturer in the walk-in van market to a number of smaller manufacturers in the truck body and equipment upfit markets. Our competitors in the specialty vehicle market are principally large multi-product line manufacturers of specialty and heavy-duty vehicles.
Suppliers
We are dedicated to establishing long-term and mutually beneficial relationships with our suppliers. Through these relationships, we benefit from new innovations, higher quality, reduced lead times, smoother/faster manufacturing ramp-up of new vehicle introductions and lower total costs of doing business. Our accelerating growth and company-wide supply chain management initiatives allow us to benefit from economies of scale and maximize to focus on a common vision.
The single largest commodity directly utilized in production is aluminum, which we purchase under purchase agreements based on forecasted production requirements. To a lesser extent we are dependent upon suppliers of lumber, fiberglass and steel for our manufacturing. We have initiated long-term supplier agreements and are consolidating suppliers where beneficial to gain pricing advantages. There are several readily available sources for the majority of these raw materials. However, we are heavily dependent on specific component part products from a few single source vendors. We maintain a qualification, on-site inspection, assistance, and performance measurement system to control risks associated with reliance on suppliers. We normally do not carry inventories of such raw materials or components in excess of those reasonably required to meet production and shipping schedules. Material and component cost increases are passed on to our customers whenever possible. There can be no assurance that there will not be any supply issues over the long-term.
In the assembly of our fleet vehicles, we use chassis supplied by third parties, and generally do not purchase these chassis for inventory. For this market, we typically accept shipment of truck chassis owned by dealers or end users, for the purpose of installing and/or manufacturing our specialized commercial vehicles on such chassis, but from time to time we do purchase chassis for use in fulfilling certain customer orders.
Research and Development
Our success depends on our ability to innovate and add new products and features ahead of changing market demands and new regulatory requirements. Thus, we emphasize research and development and commit significant resources to develop and adapt new products and production techniques. Our engineering team of nearly 100 technical professionals is looking past “current practices” and “best practices” to deliver “next practices” for our customers and shareholders. Our engineering group is organized as a unified team serving one goal throughout the company: to deliver world class products and manufacturing processes regardless of product line or location, a concept that we refer to as “One Spartan Engineering”. The team balances the synergies of One Spartan Engineering with fully integrated teams dedicated to product line specialization. Results are accomplished with the appropriate blend of predictive analysis and physical property testing in our Research and Development facilities along with ride-and-drive analysis. Our efforts range from executing special orders for current production; to new production development for new functionality and product improvements; to exciting technologies that are new to the markets we serve, like vehicle electrification. Our engineering actions are driven by our firm commitment to safety, quality, delivery, and productivity. We spent $4.9 million, $3.7 million and $3.6 million on research and development in 2019, 2018, and 2017, respectively.
Product Warranties
We provide limited warranties against assembly and construction defects. These warranties generally provide for the replacement or repair of defective parts or workmanship for specified periods, ranging from one year to twenty years, following the date of sale. With the use of validation testing, predictive analysis tools and engineering and design standards, we strive to continuously improve product quality and durability, and reduce our exposure to warranty claims. The end users also may receive limited warranties from suppliers of components that are incorporated into our chassis and vehicles. For more information concerning our product warranties, see "Note 12 – Commitments and Contingent Liabilities" of the Notes to Consolidated Financial Statements appearing in this Form 10-K.
Patents, Trademarks and Licenses
We have 23 United States patents, which include rights to the design and structure of chassis and certain peripheral equipment and we have 14 pending patent applications in the United States. The existing patents will expire on various dates from 2020 through 2033 and all are subject to payment of required maintenance fees. We also own 109 federal, state and international trademark and service mark registrations. The trademark and service mark registrations are generally renewable under applicable laws, subject to payment of required fees and the filing of affidavits of use. In addition, we have various pending trademark applications.
We believe our products are identified by our trademarks and that our trademarks are valuable assets to both of our business segments. We are not aware of any infringing uses or any prior claims of ownership of our trademarks that could materially affect our business. It is our policy to pursue registration of our primary marks whenever possible and to vigorously defend our patents, trademarks and other proprietary marks against infringement or other threats to the greatest extent practicable under applicable laws.
Environmental Matters
Compliance with federal, state and local environmental laws and regulations has not had, nor is it expected to have, a material effect on our capital expenditures, earnings or competitive position.
Spartan believes in the preservation of the environment because it leads to a safer, healthier world for today and in the future. In addition to the various product offerings provided by Spartan, alternative fuel specialty vehicles are offered to help reduce pollutant emissions. Spartan also subscribes to environmentally conscious manufacturing practices while working to obtain ISO 14001 certification for some locations by the end of 2020, and other locations in 2021, and strongly encourages its suppliers to have similar manufacturing philosophies. Spartan recycles waste in many aspects of our daily operations and in the office.
Associates
We employed 2,724 associates as of December 31, 2019 in our continuing operations, substantially all of which are full-time, including 956 contracted associates. Management considers its relations with associates to be positive. Our production processes employ a combination of high- and low-skilled tradespeople and assemblers involved in body, electrical, mechanical, paint, and assembly operations.
Customer Base
We serve customers ranging from municipalities to OEMs to commercial customers and vehicle dealers throughout our product lines. Sales to our top 10 customers in 2019 accounted for 68.1% of our sales. Sales to customers that individually exceeded 10% of our consolidated sales for 2019, 2018 and 2017 are detailed in the chart below.
|
Year |
Customer |
Sales ($ millions) |
Percentage of consolidated sales |
Segment |
||||||||
| 2019 | Amazon | $ | 173.0 | 22.9 | % | FVS | ||||||
| 2019 | USPS | $ | 113.8 | 15.0 | % | FVS | ||||||
| 2018 | USPS | $ | 81.7 | 14.3 | % | FVS | ||||||
| 2018 | Jayco, Inc. | $ | 73.4 | 12.9 | % | SCV | ||||||
| 2018 | Newmar Corporation | $ | 70.5 | 12.4 | % | SCV | ||||||
|
2018 |
Isuzu |
$ | 69.1 | 12.1 |
% |
FVS and SCV |
||||||
| 2017 | Jayco, Inc. | $ | 64.9 | 16.0 | % | SCV | ||||||
| 2017 | Newmar Corporation | $ | 53.6 | 13.3 | % | SCV | ||||||
We do have other significant customers which, if the relationship changes significantly, could have a material adverse impact on our financial position and results of operations. We believe that we have developed strong relationships with our customers and continually work to develop new customers and markets. See related risk factors in Item 1A of this Form 10-K.
Sales to customers outside the United States were $21.4 million, $21.2 million and $13.4 million for the years ended December 31, 2019, 2018 and 2017, respectively, or 2.8%, 3.7% and 3.3%, respectively, of sales for those years. All of our long-lived assets are located in the United States.
Order Backlog
Our order backlog by reportable segment is summarized in the following table (in thousands).
|
December 31, 2019 |
December 31, 2018 |
Increase/(decrease) |
||||||||||
|
FVS |
$ | 305,876 | $ | 218,775 | $ | 87,101 | ||||||
|
SCV |
30,734 | 37,656 | (6,922 |
) |
||||||||
|
Total consolidated |
$ | 336,610 | $ | 256,431 | $ | 80,179 | ||||||
Our FVS backlog increased by $87.1 million, or 39.8%, driven by new orders for walk-in vans offset by the build out of the USPS contract that originated in 2017. Our SCV segment backlog decreased by $6.9 million, or 18.4%, due to a reduction in Class A diesel motor home market demand.
While orders in the backlog are subject to modification, cancellation or rescheduling by customers, this has not been a major factor in the past. Although the backlog of unfilled orders is one of many indicators of market demand, several factors, such as changes in production rates, available capacity, new product introductions and competitive pricing actions, may affect actual sales. Accordingly, a comparison of backlog from period-to-period is not necessarily indicative of eventual actual shipments.
Non-GAAP Financial Measure
This report contains adjusted EBITDA (earnings before interest, taxes, depreciation and amortization), which is a non-GAAP financial measure. This non-GAAP measure is calculated by excluding items that we believe to be infrequent or not indicative of our continuing operating performance. In the fourth quarter of 2019, in connection with the divestiture of our ERV business, we refined the definition of adjusted EBITDA as income from continuing operations before interest, income taxes, depreciation and amortization, as adjusted to eliminate the impact of restructuring charges, acquisition related expenses and adjustments, non-cash stock-based compensation expenses, and other gains and losses not reflective of our ongoing operations. Adjusted EBITDA for all prior years presented has been recast to conform to the current presentation.
We present the non-GAAP measure adjusted EBITDA because we consider it to be an important supplemental measure of our performance. The presentation of adjusted EBITDA enables investors to better understand our operations by removing items that we believe are not representative of our continuing operations and may distort our longer-term operating trends. We believe this measure to be useful to improve the comparability of our results from period to period and with our competitors, as well as to show ongoing results from operations distinct from items that are infrequent or not indicative of our continuing operating performance. We believe that presenting this non-GAAP measure is useful to investors because it permits investors to view performance using the same tools that management uses to budget, make operating and strategic decisions, and evaluate our historical performance. We believe that the presentation of this non-GAAP measure, when considered together with the corresponding GAAP financial measures and the reconciliations to that measure, provides investors with additional understanding of the factors and trends affecting our business than could be obtained in the absence of this disclosure.
Our management uses adjusted EBITDA to evaluate the performance of and allocate resources to our segments. Adjusted EBITDA is also used, along with other financial and non-financial measures, for purposes of determining annual and long-term incentive compensation for our management team.
The following table reconciles Income from continuing operations to Adjusted EBITDA for the periods indicated.
|
2019 |
2018 |
2017 |
2016 |
2015 |
||||||||||||||||
| Income from continuing operations | $ | 36,790 | $ | 18,116 | $ | 17,471 | $ | 18,273 | $ | 149 | ||||||||||
| Net (income) loss attributable to non-controlling interest | (140 | ) | - | 1 | 7 | - | ||||||||||||||
|
Interest expense |
1,839 | 1,080 | 864 | 410 | 365 | |||||||||||||||
|
Income tax |
10,355 | 3,334 | 2,382 | 6,645 | 13,366 | |||||||||||||||
|
Depreciation and amortization |
6,073 | 6,214 | 6,032 | 5,215 | 4,959 | |||||||||||||||
|
Restructuring and other related charges |
316 | 662 | 798 | - | - | |||||||||||||||
|
Acquisition related expenses and adjustments |
3,531 | 1,952 | 588 | 14 | - | |||||||||||||||
|
Non-cash stock-based compensation expense |
5,281 | 4,027 | 3,536 | 1,536 | 1,198 | |||||||||||||||
|
Adjusted EBITDA |
$ | 64,045 | $ | 35,385 | $ | 31,672 | $ | 32,100 | $ | 20,037 | ||||||||||
Available Information
Our Annual Reports on Form 10-K, Quarterly Reports on Form 10-Q, Current Reports on Form 8-K and other reports (and amendments thereto) filed or furnished pursuant to Section 13(a) of the Securities Exchange Act are available, free of charge, on our internet website (www.SpartanMotors.com) as soon as reasonably practicable after we electronically file or furnish such materials with the Securities and Exchange Commission ("SEC").
The public may read and copy materials that we file with the SEC at the SEC’s Public Reference Room at 100 F Street, NW, Washington, DC 20549. The public may obtain information on the operation of the Public Reference Room by calling the SEC at 1-800-SEC-0330. The SEC maintains an internet website (www.sec.gov) that contains reports, proxy and information statements, and other information regarding issuers that file electronically with the SEC.
|
Item 1A. |
Risk Factors. |
Our financial condition, results of operations and cash flows are subject to various risks, many of which are not exclusively within our control that may cause actual performance to differ materially from historical or projected future performance. The risks described below are the risks known to us that we believe could materially affect our business, financial condition, results of operations, or cash flows. However, these risks may not be the only risks we face. Our business could also be affected by additional factors that are not presently known to us, factors we currently consider to be immaterial to our operations, or factors that emerge as new risks in the future.
General economic, market, and/or political conditions, whether on a global, national, or more regional scale, could have a negative effect on our business.
Concerns regarding acts of terrorism, armed conflicts, natural disasters, budget shortfalls, cyber events, civil unrest, governmental actions, and epidemics have in the past and could in the future create significant uncertainties that may have material and adverse effects on consumer demand (particularly the specialty and motor home markets), shipping and transportation, the availability of manufacturing components, commodity prices and our ability to engage in overseas markets as tariffs are implemented. An economic recession, whether resulting from one of these events or others, would have a material adverse impact on our financial condition and results of operations.
Our efforts to remediate a material weakness in our internal control over financial reporting may not be as effective as we currently expect and, in any event, will result in increased costs in the short-term.
As disclosed under Item 9A of this Annual Report on Form 10-K, our management concluded that our internal control over financial reporting was not effective as of December 31, 2019 due to a material weakness in our internal control over financial reporting. As disclosed in more detail in Item 9A below, the material weakness relates to our processes for recognizing revenue within our FVS business unit.
By definition, a material weakness is a deficiency, or combination of deficiencies, in internal control over financial reporting such that there is a reasonable possibility that a material misstatement of annual or interim financial statements will not be prevented or detected on a timely basis. We have concluded that our consolidated financial statements included within this Form 10-K present fairly, in all material respects, our financial position, results of operations, and cash flows for the periods presented, in conformity with GAAP. However, if not effectively and timely corrected, the deficiencies noted in our assessment of the effectiveness of our internal controls as of December 31, 2019 present the risk that future financial statements could contain a material misstatement.
We have already started to implement efforts to remediate these deficiencies and expect that the remediation of this material weakness will be completed prior to the end of fiscal 2020. However, if our remediation efforts take longer than expected or are more difficult to implement than expected, we continue to run the risk of a misstatement of our financial statements. And, even if our remediation efforts are effective, they will result in certain increased costs and expenses, which will negatively impact our near-term financial performance.
The integration of businesses or assets we have acquired or may acquire in the future involves challenges that could disrupt our business and harm our financial condition.
As part of our growth strategy, we have pursued and expect we will continue to selectively pursue, acquisitions of businesses or assets in order to diversify, expand our capabilities, enter new markets, or increase our market share. Integrating any newly acquired business or assets can be expensive and can require a great deal of management time and other resources. If we are unable to successfully integrate the newly acquired businesses with our existing business, we may not realize the synergies we expect from the acquisition and our business and results of operations may be adversely impacted.
The divestiture of our emergency response business could negatively impact our future financial performance.
Effective February 1, 2020, we completed the sale of our Emergency Response and Vehicle (“ERV”) business. Certain aspects of the ERV business were integrated with our continuing operations, including certain information technology, purchasing, human resources, and finance functions and certain physical operations at our Charlotte, Michigan facility. The full separation of the ERV business from our continuing operations and the transition of all aspects of that business to the buyer is expected to take 12 months or more. We expect to incur additional costs and expenses to complete the transition of that business, and we also expect the full separation and transition of that business to divert resources, including certain of our personnel and management resources, away from our continuing operations. Significant systems separation is required to clone, test, cleanse data and support the applications for both the purchaser and our future business during the Transitional Services Agreement. All of these activities represent risk to the ongoing business as well as divert IT resources during this process. In addition, as is generally the case with the sale of a business, we could incur exposure to claims from the purchaser of the ERV business pursuant to the terms and conditions of the purchase agreement. One or more of these matters could have a negative impact on our future financial performance.
Re-configuration or relocation of our production operations could negatively impact our earnings.
We may, from time to time, re-configure our production lines or relocate production of products between buildings or locations or to new locations in order to maximize the efficient utilization of our existing production capacity or take advantage of opportunities to increase manufacturing efficiencies. Costs incurred to effect these re-configurations or re-locations may exceed our estimates, and efficiencies gained may be less than anticipated, each of which may have a negative impact on our results of operations and financial position.
Disruptions within our dealer network could adversely affect our business.
We rely, for certain of our products, on a network of independent dealers to market, deliver, provide training for, and service our products to and for customers. Our business is influenced by our ability to initiate and manage new and existing relationships with dealers.
From time to time, we or an individual dealer may choose to terminate the relationship, or the dealership could face financial difficulty leading to failure or difficulty in transitioning to new ownership. In addition, our competitors could engage in a strategy to attempt to acquire or convert our dealers to carry their products. We do not believe our business is dependent on any single dealer, the loss of which would have a sustained material adverse effect upon our business.
However, disruption of dealer coverage within a specific local market could have an adverse impact on our business within the affected market. The loss or termination of a significant number of dealers could cause difficulties in marketing and distributing our products and have an adverse effect on our business, operating results or financial condition. In the event that a dealer in a strategic market experiences financial difficulty, we may choose to provide financial support such as extending credit to a dealership, reducing the risk of disruption, but increasing our financial exposure.
We may not be able to successfully implement and manage our growth strategy.
Our growth strategy includes expanding existing market share through product innovation, continued expansion into industrial and global markets and merger or acquisition related activities. We believe our future success depends in part on our research and development and engineering efforts, our ability to manufacture or source the products and customer acceptance of our products. As it relates to new markets, our success also depends on our ability to create and implement local supply chain, sales and distribution strategies to reach these markets.
The potential inability to successfully implement and manage our growth strategy could adversely affect our business and our results of operations. The successful implementation of our growth strategy will depend, in part, on our ability to integrate operations with acquired companies.
Our efforts to grow our business in emerging markets are subject to all of these risks plus additional, unique risks. In certain markets, the legal and political environment can be unstable and uncertain which could make it difficult for us to compete successfully and could expose us to liabilities.
We also make investments in new business development initiatives which, like many startups, could have a relatively high failure rate. We limit our investments in these initiatives and establish governance procedures to contain the associated risks, but losses could result and may be material. Our growth strategy also may involve acquisitions, joint venture alliances and additional arrangements of distribution. We may not be able to enter into acquisitions or joint venture arrangements on acceptable terms, and we may not successfully integrate these activities into our operations. We also may not be successful in implementing new distribution channels, and changes could create discord in our existing channels of distribution.
Increased costs, including costs of raw materials, component parts and labor costs, potentially impacted by changes in labor rates and practices and/or new or increased tariffs or similar restrictions, could reduce our operating income.
Our results of operations may be significantly affected by the availability and pricing of manufacturing components and labor, changes in labor rates and practices, and increases in tariffs or similar restrictions on materials we import. Increases in costs of raw materials used in our products could affect the cost of our supply materials and components, as rising steel and aluminum prices as well as increased tariffs have impacted the cost of certain of our manufacturing components. Although we attempt to mitigate the effect of any escalation in components, labor costs, and tariffs by negotiating with current or new suppliers and by increasing productivity or, where possible, by increasing the sales prices of our products, we cannot be certain that we will be able to do so without it having an adverse impact on the competitiveness of our products and, therefore, our sales volume. If we cannot successfully offset increases in our manufacturing costs, this could have a material adverse impact on our margins, operating income and cash flows. Our profit margins may decrease if prices of purchased component parts, labor rates, and/or tariffs increase, and we are unable to pass on those increases to our customers. Even if we were able to offset higher manufacturing costs by increasing the sales prices of our products, the realization of any such increases often lags the rise in manufacturing costs, especially in our operations, due in part to our commitment to give our customers and dealers price protection with respect to previously placed customer orders.
Disruption of our supply base could affect our ability to obtain component parts.
We increasingly rely on component parts from global sources in order to manufacture our products. Disruption of this supply base due to international political events, natural disasters, the recent outbreak of coronavirus or other factors could affect our ability to obtain component parts at acceptable prices, or at all, and have a negative impact on our sales, results of operations and financial position.
When we introduce new products, we may incur expenses that we did not anticipate, such as recall expenses, resulting in reduced earnings.
The introduction of new products is critical to our future success. We have additional costs when we introduce new products, such as initial labor or purchasing inefficiencies, but we may also incur unexpected expenses. For example, we may experience unexpected engineering or design issues that will force a recall of a new product or increase production costs of the product above levels needed to ensure profitability. In addition, we may make business decisions that include offering incentives to stimulate the sales of products not adequately accepted by the market, or to stimulate sales of older or less marketable products. The costs resulting from these types of problems could be substantial and have a significant adverse effect on our earnings.
Any negative change in our relationship with our major customers could have significant adverse effects on revenues and profits.
Our financial success is directly related to the willingness of our customers to continue to purchase our products. Failure to fill customers’ orders in a timely manner or on the terms and conditions they may impose could harm our relationships with our customers. The importance of maintaining excellent relationships with our major customers may also give these customers leverage in our negotiations with them, including pricing and other supply terms, as well as post-sale disputes. This leverage may lead to increased costs to us or decreased margins. Furthermore, if any of our major customers experience a significant downturn in their business or fail to remain committed to our products or brands, then these customers may reduce or discontinue purchases from us, which could have an adverse effect on our business, results of operations and financial condition. There were two customers that accounted for 10 percent or greater of consolidated sales in 2019.
We depend on a small group of suppliers for some of our components, and the loss of any of these suppliers could affect our ability to obtain components at competitive prices, which would decrease our sales or earnings.
Most chassis and specialty vehicle commodity components are readily available from a variety of sources. However, a few proprietary or specialty components are produced by a small group of suppliers.
In addition, we generally do not purchase chassis for our delivery vehicles. Rather, we accept shipments of vehicle chassis owned by dealers or end-users for the purpose of installing and/or manufacturing our specialized truck bodies on such chassis. There are four primary sources for commercial chassis, and we have established relationships with all major chassis manufacturers.
Changes in our relationships with these suppliers, shortages, production delays or work stoppages by the employees of such suppliers could have a material adverse effect on our ability to timely manufacture our products and secure sales. If we cannot obtain an adequate supply of components or commercial chassis, this could result in a decrease in our sales and earnings.
Changes to laws and regulations governing our business could have a material impact on our operations.
Our manufactured products and the industries in which we operate are subject to extensive federal and state regulations. Changes to any of these regulations or the implementation of new regulations could significantly increase the costs of manufacturing, purchasing, operating or selling our products and could have a material adverse effect on our results of operations. Our failure to comply with present or future regulations could result in fines, potential civil and criminal liability, suspension of sales or production, or cessation of operations.
Certain U.S. tax laws currently afford favorable tax treatment for financing the purchase of recreational vehicles that are used as the equivalent of second homes. These laws and regulations have historically been amended frequently, and it is likely that further amendments and additional regulations will be applicable to us and our products in the future. Amendments to these laws and regulations and the implementation of new regulations could have a material adverse effect on our results of operations.
Our operations are subject to a variety of federal and state environmental regulations relating to noise pollution and the use, generation, storage, treatment, emission and disposal of hazardous materials and wastes. Although we believe that we are currently in material compliance with applicable environmental regulations, our failure to comply with present or future regulations could result in fines, potential civil and criminal liability, suspension of production or operations, alterations to the manufacturing process, costly cleanup or capital expenditures.
Our operating results may fluctuate significantly on a quarter-to-quarter basis.
Our quarterly operating results depend on a variety of factors including the timing and volume of orders, the completion of product inspections and acceptance by our customers, and various restructuring initiatives that may be undertaken from time to time. In addition, our Fleet Vehicles and Services segment experiences seasonality whereby product shipments in the first and fourth quarters are generally lower than other quarters as a result of the busy holiday delivery operations experienced by some of its largest customers. Accordingly, our financial results may be subject to significant and/or unanticipated quarter-to-quarter fluctuations.
Our businesses are cyclical, and this can lead to fluctuations in our operating results.
The industries in which we operate are highly cyclical and there can be substantial fluctuations in our manufacturing, shipments and operating results, and the results for any prior period may not be indicative of results for any future period. Companies within these industries are subject to volatility in operating results due to external factors such as economic, demographic and political changes. Factors affecting the manufacture of chassis, specialty vehicles, delivery vehicles and other of our products include but are not limited to:
|
● |
Commodity prices; |
|
|
● |
Fuel availability and prices. |
|
|
● |
Unemployment trends; |
|
|
● |
International tensions and hostilities; |
|
|
● |
General economic conditions; |
|
|
● |
Various tax incentives; |
|
|
● |
Strength of the U.S. dollar compared to foreign currencies; |
|
|
● |
Overall consumer confidence and the level of discretionary consumer spending; |
|
|
● |
Dealers’ and manufacturers’ inventory levels; and |
|
|
● |
Interest rates and the availability of financing. |
Economic, legal and other factors could impact our customers’ ability to pay accounts receivable balances due from them.
In the ordinary course of business, customers are granted terms related to the sale of goods and services delivered to them. These terms typically include a period between when the goods and services are tendered for delivery to the customer and when the customer needs to pay for these goods and services. The amounts due under these payment terms are listed as accounts receivable on our balance sheet. Prior to collection of these accounts receivable, our customers could encounter drops in sales, unexpected increases in expenses, or other factors which could impact their ability to continue as a going concern and which could affect the collectability of these amounts. Writing off uncollectible accounts receivable could have a material adverse effect on our earnings and cash flow as we have major customers with material accounts receivable balances at any given time.
Our business operations could be disrupted if our information technology systems fail to perform adequately or experience a security breach.
We rely on our information technology systems to effectively manage our business data, communications, supply chain, product engineering, manufacturing, accounting and other business processes. While we believe we have robust processes in place to protect our information technology systems, if these systems are damaged, cease to function properly or are subject to a cyber-security breach such as ransomware, phishing, infection with viruses or intentional attacks aimed at theft or destruction of sensitive data, we may suffer an interruption in our ability to manage and operate the business, and our results of operations and financial condition may be adversely affected.
Like most corporations, our information systems are a target of attacks. In addition, third-party providers of data hosting or cloud services, as well as our suppliers, may experience cyber-security incidents that may involve data we share with them. Although the incidents that we have experienced to date have not had a material effect on our business, financial condition or results of operations, there can be no assurance that such incidents will not have a material adverse effect on us in the future. In order to address risks to our information systems, we continue to make investments in personnel, technologies and training of personnel.
Implementing new information systems could interfere with our business or operations.
We are in the process of implementing new information systems infrastructure and applications that impact multiple locations. These projects require significant investment of capital and human resources, the re-engineering of many processes of our business, and the attention of many associates and managers who would otherwise be focused on other aspects of our business. Should the systems not be implemented successfully, we may incur impairment charges that could materially impact our financial results. If the systems do not perform in a satisfactory manner once implementation is complete, our business and operations could be disrupted and our results of operations negatively affected, including our ability to report accurate and timely financial results.
Risks associated with international sales and contracts could have a negative effect on our business.
In 2019, 2018 and 2017 we derived 2.8%, 3.7% and 3.3% of our revenue from sales to, or related to, end customers outside the United States. We face numerous risks associated with conducting international operations, any of which could negatively affect our financial performance, including changes in foreign country regulatory requirements, the strength of the U.S. dollar compared to foreign currencies, import/export restrictions, the imposition of foreign tariffs and other trade barriers and disruptions in the shipping of exported products.
Additionally, as a U.S. corporation, we are subject to the Foreign Corrupt Practices Act, which may place us at a competitive disadvantage to foreign companies that are not subject to similar regulations.
Fuel shortages, or higher prices for fuel, could have a negative effect on sales.
Gasoline or diesel fuel is required for the operation of the specialty vehicles we manufacture. There can be no assurance that the supply of these petroleum products will continue uninterrupted, that rationing will not be imposed or that the price of or tax on these petroleum products will not significantly increase in the future. Increases in gasoline and diesel prices and speculation about potential fuel shortages have had an unfavorable effect on consumer demand for motor homes from time to time in the past and may continue to do so in the future. This, in turn, may have a material adverse effect on our sales volume. Increases in the price of oil also can result in significant increases in the price of many of the components in our products, which may have an adverse impact on margins or sales volumes.
We could incur asset impairment charges for goodwill, intangible assets or other long-lived assets.
We have a significant amount of goodwill, intangible assets and other long-lived assets. At least annually, we review goodwill and non-amortizing intangible assets for impairment. Identifiable intangible assets, goodwill and other long-lived assets are also reviewed for impairment whenever events or changes in circumstances indicate the carrying amount of an asset may not be recoverable from future cash flows. If the operating performance at one or more of our reporting units fails to meet future forecasts, or if future cash flow estimates decline, we could be required, under current U.S. accounting rules, to record impairment charges for our goodwill, intangible assets or other long-lived assets. Any write-off of a material portion of such assets could negatively affect our results of operations or financial position. See “Note 2 – Discontinued Operations” and “Note 7 – Goodwill and Intangible Assets” of the Notes to Consolidated Financial Statements appearing in Item 8 of this Form 10-K for further discussion of goodwill, intangibles and other long-lived assets.
Our stock price has been and may continue to be volatile, which may result in losses to our shareholders.
The market price of our common stock has been and may continue to be subject to wide fluctuations in response to, among other things, quarterly fluctuations in operating results, a failure to meet published estimates of or changes in earnings estimates by securities analysts, sales of common stock by existing stockholders, loss of key personnel, market conditions in our industries, shortages of key product inventory components and general economic conditions.
If there is a rise in the frequency and size of product liability, warranty and other claims against us, including wrongful death claims, our business, results of operations and financial condition may be harmed.
We are frequently subject, in the ordinary course of business, to litigation involving product liability and other claims, including wrongful death claims, related to personal injury and warranties. We partially self-insure our product liability claims and purchase excess product liability insurance in the commercial insurance market. We cannot be certain that our insurance coverage will be sufficient to cover all future claims against us. Any increase in the frequency and size of these claims, as compared to our experience in prior years, may cause the premiums that we are required to pay for such insurance to rise significantly. It may also increase the amounts we pay in punitive damages, which may not be covered by our insurance. In addition, a major product recall or increased levels of warranty claims could have a material adverse effect on our results of operations.
|
Item 1B. |
Unresolved Staff Comments. |
None.
|
Item 2. |
Properties. |
We have 12 company-owned and 26 leased locations, of which our Fleet Vehicle and Services segment operates in 18 locations and our Specialty Chassis and Vehicles segment operates in 18 locations. We consider our properties to generally be in good condition, well maintained, and suitable and adequate to meet our business requirements for the foreseeable future. In 2019, our manufacturing plants, taken as a whole, operated moderately below capacity. We do not anticipate difficulty in renewing existing leases as they expire or in finding alternative facilities.
|
Item 3. |
Legal Proceedings. |
At December 31, 2019, we were parties, both as plaintiff or defendant, to a number of lawsuits and claims arising out of the normal conduct of our businesses. Our management does not currently expect our financial position, future operating results or cash flows to be materially affected by the final outcome of these legal proceedings.
|
Item 4. |
Mine Safety Disclosures. |
Not applicable
PART II
|
Item 5. |
Market for Registrant’s Common Equity, Related Stockholder Matters, and Issuer Purchases of Equity Securities. |
Our common stock is traded on the NASDAQ Global Select Market under the symbol “SPAR.”
The following table sets forth the high and low sale prices for our common stock for the periods indicated, all as reported by the NASDAQ Global Select Market:
|
High |
Low |
|||||||
|
Year Ended December 31, 2019: |
||||||||
|
Fourth Quarter |
$ | 19.31 | $ | 13.18 | ||||
|
Third Quarter |
14.32 | 9.63 | ||||||
|
Second Quarter |
11.05 | 8.38 | ||||||
|
First Quarter |
9.68 | 7.11 | ||||||
|
Year Ended December 31, 2018: |
||||||||
|
Fourth Quarter |
$ | 14.86 | $ | 6.70 | ||||
|
Third Quarter |
16.10 | 13.35 | ||||||
|
Second Quarter |
19.45 | 14.15 | ||||||
|
First Quarter |
18.35 | 13.05 | ||||||
We paid dividends on our outstanding common shares in 2019, 2018 and 2017 as shown in the table below.
|
Date dividend declared |
Record date |
Payment date |
Dividend per share ($) |
||||
|
Nov. 4, 2019 |
Nov. 14, 2019 |
Dec. 16, 2019 |
$ | 0.05 | |||
|
May 6, 2019 |
May 17, 2019 |
June 17, 2019 |
0.05 | ||||
|
Oct. 24, 2018 |
Nov. 14, 2018 |
Dec. 14, 2018 |
0.05 | ||||
|
May 2, 2018 |
May 15, 2018 |
June 15, 2018 |
0.05 | ||||
|
Oct. 24, 2017 |
Nov. 15, 2017 |
Dec. 15, 2017 |
0.05 | ||||
|
May 2, 2017 |
May 15, 2017 |
June 15, 2017 |
0.05 | ||||
No assurance, however, can be given that any future distributions will be made or, if made, as to the amounts or timing of any future distributions as such distributions are subject to earnings, financial condition, liquidity, capital requirements, and such other factors as our Board of Directors deems relevant. The number of shareholders of record of our common stock on February 28, 2020 was 292. See Item 12 below for information concerning our equity compensation plans.
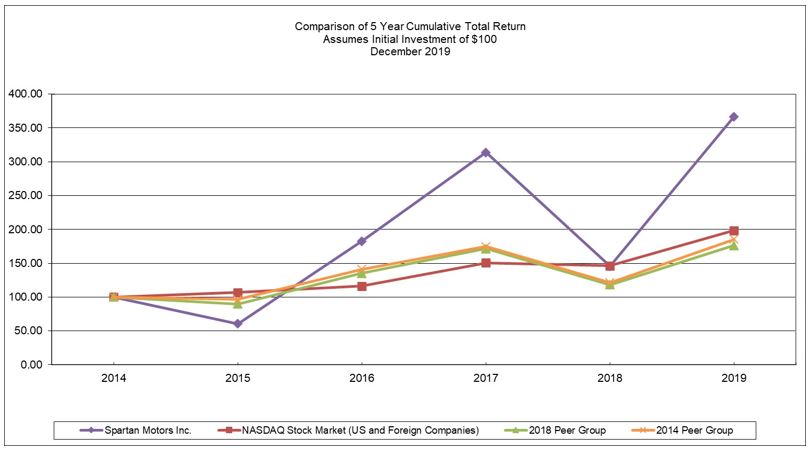
The following graph compares the cumulative total stockholder return on our common stock with the cumulative total return on the Nasdaq Composite Index and company-selected peer group for the period beginning on December 31, 2014 and ending on the last day of 2019. The graph assumes an investment of $100 in our stock, the Nasdaq Composite Index and the company-selected peer groups on December 31, 2014, and further assumes the reinvestment of all dividends. Stock price performance, presented for the period from December 31, 2014 to December 31, 2019, is not necessarily indicative of future results.
The company-selected peer groups were determined based on custom peer groups of companies against whom we compete for sales or management talent, that were identified for the purpose of benchmarking executive officer compensation in 2018 (the “2018 Peer Group”) and 2014 (the “2014 Peer Group”). The change in peer groups was primarily due to changes that have occurred since 2014 in our business mix and that of the companies that make up the 2014 Peer Group. The 2018 Peer Group consists of durable goods manufacturers with revenues ranging from one-half to double that of the Company, and includes: Alamo Group, Inc.; Altra Industrial Motion Corp.; Blue Bird Corp.; Columbus McKinnon Corp.; Commercial Vehicle Group, Inc.; Douglas Dynamics, Inc.; ESCO Technologies, Inc.; Federal Signal Corp.; LCI Industries, Inc.; Methode Electronics, Inc.; Miller Industries, Inc.; Shiloh Industries, Inc.; Standard Motor Products; The Manitowoc Company, Inc.; Wabash National Corp.; and Winnebago Industries, Inc. The 2014 Peer Group consists of companies in the specialty manufacturing and automotive industries, and includes: Alamo Group, Inc.; Altra Industrial Motion Corp.; Commercial Vehicle Group, Inc.; ESCO Technologies, Inc.; Federal Signal Corp.; LCI Industries, Inc.; Methode Electronics, Inc.; Miller Industries, Inc.; Shiloh Industries, Inc.; Standard Motor Products, Inc.; Twin Disc, Inc.; and Winnebago Industries, Inc.
|
12/31/2014 |
12/31/2015 |
12/31/2016 |
12/31/2017 |
12/31/2018 |
12/31/2019 |
|||||||||||||||||||
|
Spartan Motors, Inc. |
$ | 100.00 | $ | 60.50 | $ | 182.60 | $ | 313.68 | $ | 145.36 | $ | 366.53 | ||||||||||||
|
NASDAQ Stock Market |
$ | 100.00 | $ | 106.99 | $ | 116.42 | $ | 150.60 | $ | 146.15 | $ | 198.45 | ||||||||||||
|
2018 Peer Group |
$ | 100.00 | $ | 89.91 | $ | 135.24 | $ | 171.64 | $ | 118.25 | $ | 176.17 | ||||||||||||
|
2014 Peer Group |
$ | 100.00 | $ | 96.44 | $ | 141.32 | $ | 174.70 | $ | 121.30 | $ | 185.39 | ||||||||||||
The stock price performance graph and related information shall not be deemed “filed” with the Securities and Exchange Commission, nor shall such information be incorporated by reference by any general statement incorporating by reference this annual report on Form 10-K into any filing under the Securities Act of 1933 or the Securities Exchange Act of 1934, each as amended, except to the extent that we specifically incorporate this information by reference.
Issuer Purchases of Equity Securities
On April 28, 2016, our Board of Directors authorized the repurchase of up to 1.0 million shares of our common stock in open market transactions. At December 31, 2019 there were 0.8 million shares remaining under this repurchase authorization. If we were to repurchase the remaining 0.8 million shares of stock under the repurchase program, it would cost us $11.9 million based on the closing price of our stock on February 28, 2020. We believe that we have sufficient resources to fund any potential stock buyback in which we may engage.
During the quarter ended December 31, 2019, no shares were repurchased under this authorization. A summary of our purchases of our common stock during the fourth quarter of fiscal year 2019 is as follows:
|
|
|
Average |
Total Number of |
Number of Shares that Purchased |
||||||||||||
|
October 2019 |
- | $ | - | - | 808,994 | |||||||||||
|
November 2019 |
- | - | - | 808,994 | ||||||||||||
|
December 2019 |
- | - | - | 808,994 | ||||||||||||
|
Total |
- | $ | - | - | 808,994 | |||||||||||
|
Item 6. |
Selected Financial Data. |
The selected financial data shown below for each of the five years in the period ended December 31, 2019 has been derived from our Consolidated Financial Statements. The following data should be read in conjunction with the Consolidated Financial Statements and related Notes thereto and “Management’s Discussion and Analysis of Financial Condition and Results of Operations” included in this Form 10-K.
|
Five-Year Operating and Financial Summary |
|
(In Thousands, Except Per Share Data) |
|
2019 |
2018 |
2017 |
2016 |
2015 |
||||||||||||||||
|
Sales |
$ | 756,542 | $ | 570,527 | $ | 404,248 | $ | 407,795 | $ | 357,195 | ||||||||||
|
Cost of products sold |
639,509 | 497,370 | 341,176 | 343,896 | 311,982 | |||||||||||||||
|
Restructuring charges |
6 | 13 | 120 | - | - | |||||||||||||||
|
Gross profit |
117,027 | 73,144 | 62,952 | 63,899 | 45,213 | |||||||||||||||
|
Operating expenses: |
||||||||||||||||||||
|
Research and development |
4,864 | 3,771 | 3,596 | 4,870 | 3,326 | |||||||||||||||
|
Selling, general and administrative |
64,473 | 46,206 | 39,329 | 34,330 | 29,080 | |||||||||||||||
|
Restructuring charges |
76 | 649 | 678 | - | - | |||||||||||||||
|
Operating income |
47,614 | 22,518 | 19,349 | 24,699 | 12,807 |
|
||||||||||||||
|
Other (expense) income, net |
(469 |
) |
(1,068 |
) |
504 |
|
219 | 708 |
|
|||||||||||
|
Income before taxes |
47,145 | 21,450 | 19,853 | 24,918 | 13,515 |
|
||||||||||||||
|
Income tax expense |
10,355 | 3,334 | 2,382 | 6,645 | 13,366 | |||||||||||||||
|
Income from continuing operations |
36,790 | 18,116 | 17,471 | 18,273 | 149 |
|
||||||||||||||
|
Loss from discontinued operations, net of income taxes |
(49,216 |
) |
(3,104 |
) |
(1,537 | ) | (9,670 |
) |
(17,121 | ) | ||||||||||
|
(Loss) income |
(12,426 | ) | 15,012 | 15,934 | 8,603 | (16,972 | ) | |||||||||||||
|
Less: income (loss) attributable to non-controlling interest |
140 | - | (1 |
) |
(7 |
) |
- |
|
||||||||||||
|
(Loss) income attributable to Spartan Motors, Inc. |
$ | (12,566 | ) | $ | 15,012 | $ | 15,935 | $ | 8,610 | $ | (16,972 |
) |
||||||||
|
Basic earnings (loss) per share attributable to Spartan Motors, Inc.: |
||||||||||||||||||||
|
Continuing operations |
$ | 1.03 | $ | 0.52 | $ | 0.50 | $ | 0.53 | $ | - | ||||||||||
|
Discontinued operations |
(1.39 |
) |
(0.09 |
) |
(0.04 | ) | (0.28 |
) |
(0.50 | ) | ||||||||||
|
Basic earnings per share |
$ | (0.36 | ) | $ | 0.43 | $ | 0.46 | $ | 0.25 | $ | (0.50 |
) |
||||||||
|
Diluted earnings (loss) per share attributable to Spartan Motors, Inc.: |
||||||||||||||||||||
|
Continuing operations |
$ | 1.03 | $ | 0.52 | $ | 0.50 | $ | 0.53 | $ | - | ||||||||||
|
Discontinued operations |
(1.39 |
) |
(0.09 |
) |
(0.04 | ) | (0.28 |
) |
(0.50 | ) | ||||||||||
|
Diluted earnings per share |
$ | (0.36 | ) | $ | 0.43 | $ | 0.46 | $ | 0.25 | $ | (0.50 |
) |
||||||||
|
Cash dividends per common share |
$ | 0.10 | $ | 0.10 | $ | 0.10 | $ | 0.10 | $ | 0.10 | ||||||||||
|
Basic weighted average common shares outstanding |
35,318 | 35,187 | 34,949 | 34,405 | 33,826 | |||||||||||||||
|
Diluted weighted average common shares outstanding |
35,416 | 35,187 | 34,949 | 34,405 | 33,826 | |||||||||||||||
|
Balance Sheet Data: |
||||||||||||||||||||
|
Total assets |
450,537 | 353,784 | 301,164 | 243,294 | 228,151 | |||||||||||||||
|
Long-term debt, including current portion |
88,847 | 25,607 | 17,989 | 139 | 5,187 | |||||||||||||||
|
Shareholders’ equity |
171,747 | 186,082 | 168,269 | 152,952 | 148,491 | |||||||||||||||
|
Item 7. |
Management’s Discussion and Analysis of Financial Condition and Results of Operations. |
General
Spartan Motors, Inc. was organized as a Michigan corporation on September 18, 1975, and is headquartered in Novi, Michigan. We are a niche market leader in specialty vehicle manufacturing and assembly for the commercial vehicle (including last-mile delivery, specialty service and vocation-specific upfit segments) and recreational vehicle industries. Our products include walk-in vans and truck bodies used in e-commerce/parcel delivery, upfit equipment used in the mobile retail, and utility trades, luxury Class A diesel motor home chassis, military vehicles, and contract manufacturing and assembly services. We also supply replacement parts and offer repair, maintenance, field service and refurbishment services for the vehicles that we manufacture. Our operating activities are conducted through our wholly-owned operating subsidiary, Spartan Motors USA, Inc. (“Spartan USA”), with locations in Charlotte, Michigan; Ephrata, Pennsylvania; Pompano Beach, Florida; Bristol, Indiana; North Charleston, South Carolina; Kansas City, Missouri; Montebello, Carson, Union City and Roseville, California; Mesa, Arizona; Dallas and Weatherford, Texas; and Saltillo, Mexico.
Our diversification across several product lines provides numerous opportunities while reducing overall risk as the various markets we serve tend to have different cyclicality. We have an innovative team focused on building lasting relationships with our customers by designing and delivering market leading specialty vehicles, vehicle components, and services. Additionally, our business structure provides the agility to quickly respond to market needs, take advantage of strategic opportunities when they arise and correctly size and scale operations to ensure stability and growth. Our expansion of equipment upfit services in our Fleet Vehicles and Services segment and the growing opportunities that we have capitalized on in last mile delivery as a result of the rapidly changing e-commerce market are excellent examples of our ability to generate growth and profitability by quickly fulfilling customer needs.
We believe we can best carry out our long-term business plan and obtain optimal financial flexibility by using a combination of borrowings under our credit facilities, as well as internally or externally generated equity capital, as sources of expansion capital.
On February 1, 2020, the Company completed the sale of its Emergency Response and Vehicle (“ERV”) business for $55 million in cash, subject to certain post-closing adjustments. The ERV business consisted of the emergency response cab-chassis and apparatus operations in Charlotte, Michigan, and the Spartan apparatus operations in Brandon, South Dakota; Snyder and Neligh, Nebraska; and Ephrata, Pennsylvania. The divestiture will allow us to further focus on accelerating growth and profitability in our commercial, fleet, delivery and specialty vehicles markets. As a result of this divestiture, the ERV business is accounted for as a discontinued operation for all periods presented. See “Note 2 – Discontinued Operations” of the Notes to Consolidated Financial Statements appearing in Item 8 of this Form 10-K for further discussion of this transaction.
Executive Overview
|
● |
Sales of $756.5 million in 2019, compared to $570.5 million in 2018. |
|
● |
Gross margin of 15.5% in 2019, compared to 12.8% in 2018. |
|
● |
Operating expense of $69.4 million, or 9.2% of sales in 2019, compared to $50.6 million or 8.9% of sales in 2018. |
|
● |
Operating income of $47.6 million in 2019, compared to $22.5 million in 2018. |
|
● |
Income tax expense of $10.4 million in 2019, compared to $3.3 million in 2018. |
|
● |
Income from continuing operations of $36.8 million in 2019, compared to $18.1 million in 2018. |
|
● |
Earnings per share from continuing operations of $1.03 in 2019, compared to $0.52 in 2018. |
|
● |
Operating cash flow of $34.2 million in 2019, compared to $8.0 million in 2018. |
|
● |
Order backlog of $336.6 million at December 31, 2019, compared to $256.4 million at December 31, 2018. |
The following table shows our sales by market for the years ended December 31, 2019, 2018 and 2017 as a percentage of total sales:
|
2019 |
2018 |
2017 |
||||||||||
|
Fleet vehicles |
66.6 |
% |
52.2 |
% |
51.4 |
% |
||||||
|
Motor home chassis |
16.8 |
% |
26.2 |
% |
30.8 |
% |
||||||
|
Other vehicles |
5.7 |
% |
3.9 |
% |
4.6 |
% |
||||||
|
Aftermarket parts and accessories |
10.9 |
% |
17.7 |
% |
13.2 |
% |
||||||
|
Total sales |
100.0 |
% |
100.0 |
% |
100.0 |
% |
||||||
We continue to focus on growth by expanding our market share in existing markets, pursuing new commercial opportunities through our alliance with Isuzu and other manufacturers and pursuing strategic acquisitions that enable us to expand into existing or new markets as opportunities occur.
We believe we are well positioned to take advantage of long-term opportunities and continue our efforts to bring product innovations to each of the markets we serve. Some of our recent innovations and strategic developments include:
|
● |
Innovative product offerings such as the purpose-built upfit featuring vehicle flooring with integrated mounting for the Ford Transit 130" wheelbase cargo van, which is built to withstand tough conditions, endure extra payload, and offer a quiet ride. The product boasts multiple storage and shelving options, as well as LED lights, a maximum-view partition, and a double-clamp ladder rack. |
|
● |
Our alliance with Motiv Power Systems, a leading producer of all-electric chassis for walk-in vans, box trucks, work trucks, buses and other specialty vehicles that provides us with exclusive access to Motiv’s EPIC™ all-electric chassis in manufacturing Class 4 – Class 6 walk-in vans. This alliance demonstrates our ability to innovate and advance the markets we serve, and places us ahead of the curve in the electric vehicle (EV) fleet market. |
|
● |
Our expansion into the equipment upfit market for vehicles used in the parcel delivery, trades and construction industries. This rapidly expanding market offers an opportunity to add value to current and new customers for our fleet vehicles and vehicles produced by other original equipment manufacturers. |
|
● |
The introduction of our refrigeration technology, which demonstrates our ability to apply the latest technical advancements with our unique understanding of last-mile delivery optimization. Utilimaster's Work-Driven Design™ process provides best-in-class conversion solutions in walk-in vans, truck bodies, and cargo van vehicles. The refrigerated van is upfitted to optimally preserve cold cargo quality while offering customizations such as removable bulkheads and optional thermal curtains. The multi-temperature solution requires no additional fuel source, so it can serve a wide variety of categories from food and grocery to time and temperature sensitive healthcare deliveries. |
|
● |
The introduction of the K3 605 chassis. The K3 605 is equipped with Spartan Connected Coach, a technology bundle featuring the new digital dash display and keyless push-button start. It also features Spartan's Advanced Protection System, a collection of safety systems that includes collision mitigation with adaptive cruise control, electronic stability control, automatic traction control, Spartan Safe Haul, and factory chassis-integrated air supply for tow vehicle braking systems. |
|
● |
The introduction of Spartan Safe Haul. Spartan Safe Haul is the motor home industry’s only chassis-integrated air supply for tow vehicle braking systems, available on Spartan Class A motor home chassis for the 2019 model year. |
|
● |
Spartan Connected Coach, a technology bundle for our motor home chassis that includes a 15-inch digital dash displaying gauge functions, tire pressure monitoring, blind spot indicators, navigation, and other information. Spartan Connected Coach also offers passive keyless start and adjustable Adaptive Cruise Control and brings proven automotive technology to the RV market. |
|
● |
The strength of our balance sheet, which includes robust working capital and access to credit through our revolving line of credit. |
The following section provides a narrative discussion about our financial condition and results of operations. Certain amounts in the narrative may not sum due to rounding. The comments should be read in conjunction with our Consolidated Financial Statements and related Notes thereto appearing in Item 8 of this Form 10-K.
Results of Operations
The following table sets forth, for the periods indicated, the components of our consolidated statements of operations, as a percentage of sales (percentages may not sum due to rounding):
|
Year Ended December 31, |
||||||||||||
|
2019 |
2018 |
2017 |
||||||||||
|
Sales |
100.0 | 100.0 | 100.0 | |||||||||
|
Cost of products sold |
84.5 | 87.2 | 84.4 | |||||||||
|
Gross profit |
15.5 | 12.8 | 15.6 | |||||||||
|
Operating expenses: |
||||||||||||
|
Research and development |
0.7 | 0.7 | 0.9 | |||||||||
|
Selling, general and administrative |
8.5 | 8.1 | 9.7 | |||||||||
|
Restructuring charges |
0.0 | 0.1 | 0.2 | |||||||||
|
Operating income |
6.3 | 3.9 | 4.8 | |||||||||
|
Other (expense) income, net |
(0.1 |
) |
(0.2 |
) |
0.1 |
|
||||||
|
Income from continuing operations before income taxes |
6.2 | 3.7 | 4.9 | |||||||||
|
Income tax expense |
1.4 | 0.6 | 0.6 | |||||||||
|
Income from continuing operations |
4.8 | 3.1 | 4.3 | |||||||||
|
Loss from discontinued operations, net of income taxes |
(6.5 |
) |
(0.5 |
) |
(0.4 | ) | ||||||
|
Non-controlling interest |
- | - | - | |||||||||
|
Net (loss) income attributable to Spartan Motors, Inc. |
(1.7 | ) | 2.6 | 3.9 | ||||||||
Year Ended December 31, 2019 compared to Year Ended December 31, 2018
Sales
Consolidated sales for the year ended December 31, 2019 increased by $186.0 million, or 32.6% to $756.5 million from $570.5 million in 2018. Sales in our FVS segment increased by $188.3 million, due to an increase in vehicle sales of $185.0 million in 2019 and $3.3 million due to favorable pricing. Sales in our SCV segment decreased by $7.3 million driven by lower sales of $28.5 million in motor home chassis and other specialty chassis and vehicle sales, partially offset by sales attributable to the Royal acquisition of $17.0 million and favorable pricing of $4.2 million. Inter-segment eliminations increased $5.0 million. These changes in sales are discussed more fully in the discussion of our segments below.
Cost of Products Sold
Cost of products sold increased by $142.1 million, or 28.6%, to $639.5 million for the year ended December 31, 2019 from $497.4 million in 2018, primarily due to increased sales volume in 2019. Cost of products sold increased by $144.6 million due to higher sales volume and by $5.6 million due to product mix. These increases were partially offset by decreases of $8.2 million due to productivity improvements and cost reductions in 2019. As a percentage of sales, cost of products sold decreased to 84.5% in 2019, compared to 87.2% in 2018.
Gross Profit
Gross profit increased by $43.9 million, or 60.0%, to $117.0 million in 2019 from $73.1 million in 2018. The increase was due to favorable volume of $23.2 million, pricing improvements of $7.5 million and productivity and cost reductions of $13.2 million. Gross margin increased to 15.5% in 2019 from 12.8% over the year ended in 2018 due to the items mentioned above.
Operating Expenses
Operating expenses for the year ended December 31, 2019 increased by $18.8 million, or 37.1%, to $69.4 million from $50.6 million in 2018. Research and development expense increased $1.1 million in 2019 due to higher engineering project spending. Selling, general and administrative expense increased by $18.3 million, or 39.5%, to $64.5 million in 2019 from $46.2 million in 2018. This increase was primarily due to $13.2 million in additional salaried associates, annual merit increases and incentive compensation. The remaining increase of $5.1 million related to the expansion of locations and the General Truck Body and Royal Truck Body acquisitions in 2019. Restructuring charges recorded in 2019 decreased $0.5 million compared to 2018 due to decreased severance costs in 2019.
Other Income and Expense
Interest expense for the year ended December 31, 2019 increased by $0.7 million, or 70.3%, to $1.8 million from $1.1 million in 2018. The increase was due primarily to the additional debt incurred for the Royal acquisition. Interest and other income for the year ended December 31, 2019 increased by $1.4 million, or 100%, to $1.4 million from $0.0 million in 2018
Income Tax Expense
Income tax expense for the year ended December 31, 2019 was $10.4 million as compared to the prior year at $3.3 million. Our effective tax rate in 2019 was 22.0%, compared to 15.6% in 2018. As compared to the year ended December 31, 2018, income tax expense incurred in 2019 was greater due to a higher effective tax rate being applied to a higher Income from continuing operations before income taxes amount.
The 2019 effective tax rate was higher than the federal statutory rate of 21% primarily due to state and foreign income taxes recorded at statutory rates. The 2019 effective rate was higher than the 2018 rate as a result of a higher tax benefit for the vesting of certain stock compensation of $1.2 million recorded in 2018 as compared to $0.1 million in 2019.
Income from Continuing Operations
Income from continuing operations for the year ended December 31, 2019 increased by $18.7 million, or 103.1%, to $36.8 million compared to $18.1 million in 2018. On a diluted per share basis, income from continuing operations increased $0.51 to $1.03 in 2019 compared to $0.52 per share in 2018. Driving this increase were the factors noted above.
Loss from Discontinued Operations, Net of Income Taxes
Loss from discontinued operations for the year ended December 31, 2019 increased to $49.2 million compared to $3.1 million in 2018. The increase of $46.1 million loss was primarily due to the impairment of the goodwill and indefinite lived intangible assets of $13.9 million, as well as the impairment of the ERV business held for sale of $39.2 million to its fair value less costs to sell in 2019, offset by improvement on operations.
Year Ended December 31, 2018 compared to Year Ended December 31, 2017
Sales
Consolidated sales for the year ended December 31, 2018 increased by $166.3 million, or 41.1% to $570.5 million from $404.2 million in 2017. Sales in our FVS segment increased by $136.4 million, mainly due to an increase in vehicle sales in 2018, while sales in our SCV segment increased by $34.4 million driven by strong shipments of motor home chassis. Inter-segment eliminations increased by $4.5 million. These changes in sales are discussed more fully in the discussion of our segments.
Cost of Products Sold
Cost of products sold increased by $156.2 million, or 45.8%, to $497.4 million for the year ended December 31, 2018 from $341.2 million in 2017, primarily due to increased sales volume in 2018. Cost of products sold increased by $152.1 million due to the higher sales volumes, $1.2 million due to start-up costs incurred at our truck body operations in Ephrata, Pennsylvania, $5.0 million due to tariffs, commodity and component cost increases of $2.3 million in 2018, and $1.5 million due to chassis disruptions and resulting freight and other costs in 2018. These increases were partially offset by decreases of $2.4 million due to the product mix in 2018 and $3.5 million due to operational and organizational improvements in 2018. As a percentage of sales, cost of products sold increased to 87.2% in 2018, compared to 84.4% in 2017.
Gross Profit
Gross profit increased by $10.1 million, or 16.2%, to $73.1 million in 2018 from $63.0 million in 2017. Savings from increased operational efficiency in 2018 contributed $6.4 million to the increase, while higher overall sales volume contributed $13.2 million to the increase. Pricing adjustments impacting 2018 sales contributed $0.4 million to the increase. These increases were partially offset by a reduction in gross profit of $3.7 million due to a less favorable overall product mix, $5.0 million in tariff-driven commodity and component cost increases, $1.2 million due to start-up costs incurred in our Ephrata truck body operations and $1.5 million due to chassis disruptions and resulting freight and other costs in 2018 compared to 2017.
Operating Expenses
Operating expenses for the year ended December 31, 2018 increased by $7.0 million, or 16.1%, to $50.6 million from $43.6 million in 2017. Research and development expense remained flat. Selling, general and administrative expense increased by $6.9 million, to $46.2 million in 2018 from $39.3 million in 2017. Legal and professional fees increased $2.7 million due to an increase in acquisition activities, trade shows and other promotional activities increased $1.8 million and $3.2 million was due to an increase in information technology related spending. Restructuring charges recorded in 2018 remained flat.
Income Tax Expense
Income tax expense for the year ended December 31, 2018 was $3.3 million as compared to the prior year at $2.4 million. Our effective tax rate in 2018 was 15.6%, compared to 12.0% in 2017.
The 2018 effective tax rate was lower than the federal statutory rate of 21% primarily due to a discrete tax benefit of $1.2 million caused by the vesting of certain stock compensation. The 2018 effective rate was higher than the 2017 rate due to a number of significant one-time adjustments whose net effect reduced our 2017 effective tax rate and did not recur in 2018. Certain of these adjustments included a $3.0 million charge for the remeasurement of our deferred tax assets due to the Tax Cuts and Jobs Act of 2017, offset by a $6.5 million reduction in our valuation allowance related to temporary differences between book and tax bases in assets and liabilities and a $1.0 million benefit from the disposal of stock in an inactive subsidiary that had been deemed worthless.
Income from Continuing Operations
Income from continuing operations for the year ended December 31, 2018 increased by $0.6 million, or 3.7%, to $18.1 million compared to $17.5 million in 2017. On a diluted per share basis, income from continuing operations increased $0.02 to $0.52 in 2018 compared to $0.50 per share in 2017. Driving this increase were the factors noted above.
Loss from Discontinued Operations, Net of Income Taxes
Loss from discontinued operations for the year ended December 31, 2018 increased to $3.1 million compared to $1.5 million in 2017. The increase of $1.6 million loss was primarily due to the year-over-year decrease of income tax benefit of $1.2 million.
Our Segments
We identify our reportable segments based on our management structure and the financial data utilized by our chief operating decision maker to assess segment performance and allocate resources among our operating units. We have two reportable segments: Fleet Vehicles and Services and Specialty Chassis and Vehicles.
We evaluate the performance of our reportable segments based on adjusted EBITDA (earnings before interest, taxes, depreciation and amortization), which is a non-GAAP financial measure. This non-GAAP measure is calculated by excluding items that we believe to be infrequent or not indicative of our continuing operating performance. In the fourth quarter of 2019, in connection with the divestiture of our ERV business, we refined the definition of adjusted EBITDA as income from continuing operations before interest, income taxes, depreciation and amortization, as adjusted to eliminate the impact of restructuring charges, acquisition related expenses and adjustments, non-cash stock-based compensation expenses, and other gains and losses not reflective of our ongoing operations. Adjusted EBITDA for all prior years presented have been recast to conform to the current presentation.
The table below presents the reconciliation of our income from continuing operations before income taxes to segment adjusted EBITDA. Adjusted EBITDA is not a measurement of our financial performance under GAAP and should not be considered as an alternative to net income. Adjusted EBITDA may have limitations as an analytical tool and should not be considered in isolation or as a substitute for analysis of our results as reported under GAAP. In addition, although we have excluded certain charges in calculating Adjusted EBITDA, we may in the future incur expenses similar to these adjustments, despite our assessment that such expenses are infrequent and/or not indicative of our regular, ongoing operating performance. Our presentation of Adjusted EBITDA should not be construed as an inference that our future results will be unaffected by unusual or infrequent items.
|
Year Ended December 31, 2019 |
Year Ended December 31, 2018 |
Year Ended December 31, 2017 |
|
|||||||||
| Income from continuing operations before income taxes | $ | 47,145 | $ | 21,450 | $ | 19,853 | ||||||
|
Net (income) loss attributable to non-controlling interest |
(140 | ) | - | 1 | ||||||||
|
Interest expense |
109 | 481 | 156 | |||||||||
|
Depreciation and amortization expense |
4,570 | 3,896 | 4,675 | |||||||||
|
Restructuring and other related charges |
82 | 176 | 746 | |||||||||
|
Unallocated corporate expenses |
29,613 | 19,297 | 15,585 | |||||||||
|
Total segment adjusted EBITDA |
$ | 81,379 | $ | 45,300 | $ | 41,016 | ||||||
Our FVS segment consists of our operations at our Bristol, Indiana location, along with our operations at our upfit centers in Kansas City, Missouri; Ephrata, Pennsylvania; North Charleston, South Carolina; Pompano Beach, Florida; Montebello, California and Saltillo, Mexico. This segment focuses on designing and manufacturing walk-in vans for the parcel delivery, mobile retail, and trades and construction industries, the production of commercial truck bodies and supplies related aftermarket parts and services under the Utilimaster brand name.
Our SCV segment consists of our Charlotte, Michigan operations that engineer and manufacture motor home chassis, defense vehicles, other specialty chassis and distribute related aftermarket parts and assemblies. In addition, beginning in September 2019 with the acquisition of Royal, the Specialty Chassis and Vehicles segment includes operations in Carson, Union City and Roseville, California; Mesa, Arizona; and Dallas and Weatherford, Texas. Royal is a leading California-based designer, manufacturer and installer of service truck bodies and accessories.
The accounting policies of the segments are the same as those described, or referred to, in "Note 1 – General and Summary of Accounting Policies." Assets and related depreciation expense in the column labeled “Eliminations and other” pertain to capital assets maintained at the corporate level. Eliminations for inter-segment sales are shown in the column labeled “Eliminations and other”. Segment loss from operations in the “Eliminations and other” column contains corporate related expenses not allocable to the operating segments. Interest expense and Taxes on income are not included in the information utilized by the chief operating decision makers to assess segment performance and allocate resources, and accordingly, are excluded from the segment results presented below. Appropriate expense amounts are allocated to the two reportable segments and are included in their reported operating income or loss.
For certain financial information related to each segment, see "Note 18 – Business Segments" of the Notes to Consolidated Financial Statements appearing in Item 8 of this Form 10-K.
Fleet Vehicles and Services
|
Segment Financial Data (Dollars in Thousands) |
Year Ended December 31, |
|||||||||||||||||||||||
|
2019 |
2018 |
2017 |
||||||||||||||||||||||
|
Amount |
Percentage |
Amount |
Percentage |
Amount |
Percentage |
|||||||||||||||||||
|
Sales |
$ | 575,894 | 100.0 |
% |
$ | 387,549 | 100.0 |
% |
$ | 251,095 | 100.0 |
% |
||||||||||||
|
Adjusted EBITDA |
$ | 60,663 | 10.5 |
% |
$ | 26,680 | 6.9 |
% |
$ | 26,958 | 10.7 |
% |
||||||||||||
|
Segment assets |
$ | 154,138 | $ | 117,508 | $ | 60,550 | ||||||||||||||||||
Year ended December 31, 2019 compared to year ended December 31, 2018
Sales in our FVS segment increased by $188.3 million, or 48.6%, to $575.9 million in 2019 from $387.5 million in 2018. This increase was driven by a $185.0 million increase in vehicle sales mainly due to higher unit volumes and $3.3 million in pricing increases. The sales volume increase in 2019 includes $91.4 million of chassis pass-thru sales compared to $65.4 million in 2018.
Adjusted EBITDA in our FVS segment was $60.7 million for the year ended December 31, 2019, an increase of $34.0 million compared to $26.7 million for the year ended December 31, 2018. Higher sales volumes in 2019 contributed $26.2 million to the overall increase while pricing increases contributed $3.7 million and productivity improvements and cost reductions generated $14.2 million. These increases were partially offset by decreases of $5.3 million due to the mix of products sold in 2019 and a $5.9 million increase in marketing, administrative and research and development costs.
Order backlog for our FVS segment increased by $87.1 million, or 39.8%, to $305.9 million in 2019 compared to $218.8 million in 2018, driven by new orders for walk-in vans offset by the build out of the USPS contract that originated in 2017. Our backlog enables visibility into future net sales which can normally range from two to twelve months depending on the product. This visibility allows us to more effectively plan and predict our sales and production activity.
Year ended December 31, 2018 compared to year ended December 31, 2017
Sales in our FVS segment increased by $136.4 million, or 54.3%, to $387.5 million in 2018 from $251.1 million in 2017. This increase was driven by a $105.0 million increase in vehicle sales mainly due to higher unit volume and a $29.3 million increase in aftermarket parts and accessories sales mainly due to higher upfit and truck body sales in 2018. Our adoption of ASC 606, Revenue from Contracts with Customers (“ASC 606”) on January 1, 2018 resulted in an additional $2.1 million increase in revenue recognized during the period compared to what would have been recognized under previous guidance, mainly due to the timing of vehicle production and shipments.
Adjusted EBITDA for our FVS segment was $26.7 million for the year ended December 31, 2018, a decrease of $0.3 million compared to $27.0 million for the year ended December 31, 2017. This decrease was due to tariffs of $5.0 million, product mix of $4.0 million, commodity and component cost increases of $2.1 million and $1.2 million of start-up costs incurred in our Ephrata truck body manufacturing operation. These decreases were partially offset by the impact of $11.9 million in higher volume.
Order backlog for our FVS segment decreased by $48.9 million, or 18.3%, to $218.8 million in 2018 compared to $267.7 million in 2017, driven by the partial build-out of the $214 million contract to supply delivery vehicles to the United States Postal Service we received in September, 2017 which was partially offset by a $48.3 million increase in the backlog for other fleet vehicles. Our backlog enables visibility into future net sales which can normally range from two to twelve months depending on the product. This visibility allows us to more effectively plan and predict our sales and production activity.
Specialty Chassis and Vehicles
|
Segment Financial Data (Dollars in Thousands) |
Year Ended December 31, |
|||||||||||||||||||||||
|
2019 |
2018 |
2017 |
||||||||||||||||||||||
|
Amount |
Percentage |
Amount |
Percentage |
Amount |
Percentage |
|||||||||||||||||||
|
Sales |
$ | 185,926 | 100.0 |
% |
$ | 193,199 | 100.0 |
% |
$ | 158,810 | 100.0 |
% |
||||||||||||
|
Adjusted EBITDA |
$ | 20,716 | 11.1 |
% |
$ | 18,620 | 9.6 |
% |
$ | 14,058 | 8.9 |
% |
||||||||||||
|
Segment assets |
$ | 137,777 | $ | 17,335 | $ | 21,445 | ||||||||||||||||||
Year ended December 31, 2019 compared to year ended December 31, 2018
Sales in our SCV segment decreased by $7.3 million or 3.8%, to $185.9 million in 2019 compared to $193.2 million in 2018. This decrease was driven by a decrease of $23.5 million in motor home chassis sales and a decrease of $5.0 million in other specialty chassis and vehicle sales due to lower unit volumes. This decrease was partially offset by sales attributable to the Royal acquisition of $17.0 million and pricing increases of $4.2 million.
Adjusted EBITDA for our SCV segment was $20.7 million for the year ended December 31, 2019, an increase of $2.1 million compared to $18.6 million for the year ended December 31, 2018. This increase was driven by $2.4 million attributable to acquisitions and pricing increases of $4.2 million. This increase was partially offset by $3.5 million due to lower motor home and specialty chassis sales volume and higher supplier costs of $1.0 million.
Order backlog for our SCV segment decreased by $7.0 million, or 18.4%, to $30.7 million at December 31, 2019 compared to $37.7 million at December 31, 2018. This decrease was due to a reduction in the Class A diesel motor home market demand. Our backlog enables visibility into future net sales which can normally range from less than one month to twelve months depending on the product. This visibility allows us to more effectively plan and predict our sales and production activity.
Year ended December 31, 2018 compared to year ended December 31, 2017
Sales in our SCV segment increased by $34.4 million, to $193.2 million in 2018 compared to $158.8 million in 2017. Motor home chassis sales increased by $24.9 million due to higher unit volume in 2018, which was partially offset by a $1.4 million reduction due to an unfavorable sales mix. Sales of other specialty vehicles and aftermarket parts increased by $4.1 million and $1.7 million in 2018 due to higher unit volumes. Intercompany sales of fleet vehicles increased by $4.7 million due to higher unit volume in 2018. Pricing changes that impacted the year ended December 31, 2018 resulted in increased sales of $0.4 million. Our adoption of ASC 606 in January 2018 had an immaterial impact on sales in our Specialty Chassis and Vehicles segment.
Adjusted EBITDA for our SCV segment was $18.6 million for the year ended December 31, 2018, an increase of $4.5 million compared to $14.1 million for the year ended December 31, 2017. This increase was driven by a $4.3 million increase related to higher motor home chassis sales volume and a $1.0 million increase in other specialty vehicles and related products in 2018. The increases were partially offset by decreases related to product mix of $0.5 million and tariff related costs of $0.2 million. Our adoption of ASC 606 in January 2018 had an immaterial impact on adjusted EBITDA in our Specialty Chassis and Vehicles segment.
Order backlog for our SCV segment increased by $3.9 million, or 11.5%, to $37.7 million at December 31, 2018 compared to $33.8 million at December 31, 2017. This increase was due primarily to a $3.4 million increase in backlog for motor home chassis in 2018. Our backlog enables visibility into future net sales which can normally range from less than one month to twelve months depending on the product. This visibility allows us to more effectively plan and predict our sales and production activity.
Liquidity and Capital Resources
Cash Flows
Our cash flows from operating, investing and financing activities, as reflected in the Consolidated Statements of Cash Flows appearing in Item 8 of this Form 10-K, are summarized in the following table (in thousands):
|
Year Ended December 31, |
||||||||||||
|
2019 |
2018 |
2017 |
||||||||||
|
Cash provided by (used in): |
||||||||||||
|
Operating activities |
$ | 34,181 | $ | 8,026 | $ | 22,016 | ||||||
|
Investing activities |
(98,965 |
) |
(14,185 |
) |
(34,230 |
) |
||||||
|
Financing activities |
56,694 | 75 | 13,696 | |||||||||
|
Net increase (decrease) in cash and cash equivalents |
$ | (8,090 |
) |
$ | (6,084 |
) |
$ | 1,482 | ||||
During 2019, cash and cash equivalents decreased by $8.1 million to a balance of $19.3 million as of December 31, 2019. These funds, in addition to cash generated from future operations and available credit facilities, are expected to be sufficient to finance our foreseeable liquidity and capital needs.
Cash Flow from Operating Activities
We generated $34.2 million of cash from operating activities during the year ended December 31, 2019, an increase of $26.2 million from $8.0 million of cash generated from operating activities in 2018. Cash flow from operating activities increased from 2018 due to a $15.2 million increase in net income net of non-cash charges and a $10.9 million increase from changes in operating assets and liabilities.
We generated $8.0 million of cash from operating activities during the year ended December 31, 2018, a decrease of $14.0 million from $22.0 million of cash generated from operating activities in 2017. Cash flow from operating activities decreased from 2017 due to a $38.5 million increase in cash utilized in the fulfilment of customer orders and a $1.1 million decrease in net income net of non-cash charges. This was offset by a $3.0 million decrease in cash paid for warranty claims in 2018 and a $22.7 million increase in cash generated through changes in other working capital items, mainly accounts payable.
Cash Flow from Investing Activities
We utilized $99.0 million in investing activities during the year ended December 31, 2019, an $84.8 million increase compared to the $14.2 million utilized during the year ended December 31, 2018. This increase is mainly due to the cash needed for our acquisition of Royal for $88.9 million in 2019 compared to our acquisition of Strobes-R-Us, Inc. for $5.2 million in 2018. Purchases of property, plant and equipment also increased $1.0 million to $10.0 million in 2019 from $9.0 million in 2018.
We utilized $14.2 million in investing activities during the year ended December 31, 2018, a $20.0 million decrease compared to the $34.2 million utilized during the year ended December 31, 2017. This decrease is mainly due to the cash needed for our acquisition of Strobes-R-Us for $5.2 million in 2018 compared to our acquisition of Smeal for $28.9 million in 2017. Purchases of property, plant and equipment also increased $3.7 million to $9.0 million in 2018 from $5.3 million in 2017.
Cash Flow from Financing Activities
We generated $56.7 million of cash through financing activities during the year ended December 31, 2019, compared to $0.1 million generated during the year ended December 31, 2018. This increase is primarily due to an increase in borrowings on long-term debt of $84.3 million, offset by an increase in repayments on long-term debt of $30.1 million. Net cash used in the exercise, vesting or cancellation of stock incentive awards decreased $1.9 million.
We generated $0.1 million of cash through financing activities during the year ended December 31, 2018, compared to $13.7 million generated during the year ended December 31, 2017. This decrease is mainly due to decreased advances on long-term debt of $25.2 million offset by decreased repayments on long-term debt of $15.0 million in 2018. Net cash used in the exercise, vesting or cancellation of stock incentive awards increased $2.0 million, the purchase and retirement of common stock increased $0.7 million and the payment of contingent consideration increased $0.7 million in 2018.
Restructuring Activities
During the years ended December 31, 2019, 2018 and 2017, we incurred $0.1 million, $0.7 million and $0.8 million of restructuring charges, respectively for a company-wide initiative to streamline operations. See "Note 6 – Restructuring Charges" in the Notes to Consolidated Financial Statements appearing in Item 8 of this Form 10-K for further information.
Contingent Liabilities
Spartan-Gimaex Joint Venture
In February 2015, Spartan USA and Gimaex Holding, Inc. mutually agreed to begin discussions regarding the dissolution of the Spartan-Gimaex joint venture. In June 2015, Spartan USA and Gimaex Holding, Inc. entered into court proceedings to determine the terms of the dissolution. In February 2017, by agreement of the parties, the court proceeding was dismissed with prejudice and the judge entered an order to this effect as the parties agreed to seek a dissolution plan on their own. In late 2019, Spartan USA initiated additional court proceedings to dissolve and liquidate the joint venture, but no dissolution terms have been determined as of the date of this Form 10-K. Costs associated with the wind-down will be impacted by the final dissolution agreement. In accordance with accounting guidance, the costs we have accrued so far represent the low end of the range of the estimated total charges that we believe we may incur related to the wind-down. While we are unable to determine the final cost of the wind-down with certainty at this time, we may incur additional charges, depending on the final terms of the dissolution, and such charges are not expected to be material to our future operating results. We recorded charges totaling $216 to write down certain inventory items associated with this joint venture to their estimated fair values during the year ended December 31, 2019.
Debt
On August 8, 2018, we entered into a Credit Agreement (the "Credit Agreement") by and among us and certain of our subsidiaries as borrowers, Wells Fargo Bank, National Association ("Wells Fargo"), as administrative agent, and the lenders party thereto consisting of Wells Fargo, JPMorgan Chase Bank, N.A. and PNC Bank National Association (the "Lenders"). Subsequently, the Credit Agreement was amended on May 14, 2019, September 9, 2019 and September 25, 2019 and certain of our other subsidiaries executed guaranties guarantying the borrowers' obligations under the Credit Agreement.
As a result, at December 31, 2019, under the Credit Agreement, as amended, we may borrow up to $175,000 from the Lenders under a secured revolving credit facility which matures August 8, 2023. We may also request an increase in the facility of up to $50,000 in the aggregate, subject to customary conditions. The credit facility is also available for the issuance of letters of credit of up to $20,000 and swing line loans of up to $30,000, subject to certain limitations and restrictions. This revolving credit facility carries an interest rate of either (i) the highest of prime rate, the federal funds effective rate from time to time plus 0.5%, or the one month adjusted LIBOR plus 1.0%; or (ii) adjusted LIBOR, in each case plus a margin based upon our ratio of debt to earnings from time to time. The applicable borrowing rate including margin was 3.7500% (or one-month LIBOR plus 1.25%) at December 31, 2019. The credit facility is secured by security interests in, and liens on, all assets of the borrowers and guarantors, other than real property and certain other excluded assets.
Under the terms of our Credit Agreement, we have the ability to issue letters of credit totaling $20.0 million. At December 31, 2019 and 2018, we had outstanding letters of credit totaling $0.5 million related to our worker's compensation insurance.
Under the terms of our Credit Agreement we are required to maintain certain financial ratios and other financial covenants, which limited our available borrowings (exclusive of outstanding borrowings) under our line of credit to a total of approximately $60.5 million and $86.4 million at December 31, 2019 and 2018, respectively. The Credit Agreement also prohibits us from incurring additional indebtedness; limits certain acquisitions, investments, advances or loans; limits our ability to pay dividends in certain circumstances; and restricts substantial asset sales, all subject to certain exceptions and baskets. At December 31, 2019 and December 31, 2018, we were in compliance with all covenants in our credit agreement.
Concurrent with the close of the sale of the ERV business and effective January 31, 2020, the Credit Agreement was further amended by a fourth amendment, which released certain of our subsidiaries that were sold as part of the ERV business pursuant to the Asset Purchase Agreement. The substantive business terms of the Credit Agreement remain in place and were not changed by the fourth amendment. The Company received proceeds of $55.0 million in cash from the sale. We subsequently paid down our borrowings under the revolving line of credit by $30.0 million. Net proceeds after estimated post-closing adjustments and transaction costs are expected to be $45.7 million.
Equity Securities
On April 28, 2016, our Board of Directors authorized the repurchase of up to 1.0 million additional shares of our common stock in open market transactions. We repurchased a total of 101,006 and 90,000 shares of our common stock during the years ended December 31, 2019 and 2018, respectively. No shares were repurchased in 2017. If we were to repurchase the remaining 0.8 million shares of stock under the repurchase program, it would cost us $11.9 million based on the closing price of our stock on February 28, 2020. We believe that we have sufficient resources to fund any potential stock buyback in which we may engage.
Dividends
We paid dividends on our outstanding common shares in 2019, 2018 and 2017 as shown in the table below.
|
Date dividend declared |
Record date |
Payment date |
Dividend per share ($) |
|||||
|
Nov. 4, 2019 |
Nov. 14, 2019 |
Dec. 16, 2019 |
$ | 0.05 | ||||
|
May 6, 2019 |
May 17, 2019 |
June 17, 2019 |
0.05 | |||||
|
Oct. 24, 2018 |
Nov. 14, 2018 |
Dec. 14, 2018 |
0.05 | |||||
|
May 2, 2018 |
May 15, 2018 |
June 15, 2018 |
0.05 | |||||
|
Oct. 24, 2017 |
Nov. 15, 2017 |
Dec. 15, 2017 |
0.05 | |||||
|
May 2, 2017 |
May 15, 2017 |
June 15, 2017 |
0.05 | |||||
Off-Balance Sheet Arrangements
We have no off-balance sheet arrangements that have or are reasonably likely to have a material current or future effect on our financial condition, cash flows, results of operations, liquidity, capital expenditures or capital resources.
Contractual Obligations and Commercial Commitments
Our future contractual obligations for agreements, including agreements to purchase materials in the normal course of business, are summarized below.
|
Payments Due by Period (in thousands) |
||||||||||||||||||||
|
Less than |
More than |
|||||||||||||||||||
|
Total |
1 Year |
1-3 Years |
4-5 Years |
5 Years |
||||||||||||||||
|
Debt (1) |
$ | 103,199 | 3,488 | 99,711 | - | - | ||||||||||||||
|
Operating lease obligations |
37,951 | 5,937 | 14,287 | 7,978 | 9,749 | |||||||||||||||
|
Purchase obligations |
1,830 | 1,830 | - | - | - | |||||||||||||||
|
Total contractual obligations |
$ | 142,980 | $ | 11,255 | $ | 113,998 | $ | 7,978 | $ | 9,749 | ||||||||||
|
(1) |
Debt includes line of credit revolver estimated interest payments and payments on finance leases. The interest payments on the related variable rate debt were calculated using the effective interest rate of 3.75% at December 31, 2019. |
Critical Accounting Policies and Estimates
The following discussion of critical accounting policies and estimates is intended to supplement "Note 1 – General and Summary of Accounting Policies" of the Notes to Consolidated Financial Statements appearing in Item 8 of this Form 10-K. These policies were selected because they are broadly applicable within our operating units and they involve additional management judgment due to the sensitivity of the methods, assumptions and estimates necessary in determining the related statement of income, asset and/or liability amounts.
Revenue Recognition
Essentially all of our revenue is generated through contracts with our customers. We may recognize revenue over time or at a point in time when or as obligations under the terms of a contract with our customer are satisfied, depending on the terms and features of the contract and the products supplied. Our contracts generally do not have any significant variable consideration. The collectability of consideration on the contract is reasonably assured before revenue is recognized. On certain vehicles, payment may be received in advance of us satisfying our performance obligations. Such payments are recorded in Deposits from customers on the Consolidated Balance Sheets. The corresponding performance obligations are generally satisfied within one year of the contract inception. We have elected to utilize the practical expedient to recognize the incremental costs of obtaining a contract as an expense when incurred because the amortization period for the prepaid costs that would have otherwise been deferred and amortized is one year or less. We use an observable price to allocate the stand-alone selling price to separate performance obligations within a contract or a cost-plus margin approach when an observable price is not available. The estimated costs to fulfill our base warranties are recognized as expense when the products are sold.
Revenue for parts sales for all segments is recognized at the time that control and risk of ownership has passed to the customer, which is generally, when the ordered part is shipped to the customer. Historical return rates on parts sales have been immaterial. Accordingly, no return reserve has been recorded. Instead, returns are recognized as a reduction of revenue at the time that they are received.
Revenue for upfit and field service contracts and walk-in vans and truck bodies built on a chassis owned and controlled by the customer is recognized over time, as equipment is installed in the customer’s vehicle, repairs and enhancements are made to the customer’s vehicles, or as the vehicles are built.
For certain of our vehicles and chassis, we sell separately priced service contracts that provide roadside assistance or extend certain warranty coverage beyond our base warranty agreements. These separately priced contracts range from one to six years from the date of the shipment of the related vehicle or chassis. We receive payment with the shipment of the related vehicle or at the inception of the extended service contract, if later, and recognize revenue over the coverage term of the agreement, generally on a straight-line basis, which approximates the pattern of costs expected to be incurred in satisfying the obligations under the contract.
Accounts Receivable
We maintain an allowance for customer accounts that reduces receivables to amounts that are expected to be collected. In estimating the allowance for doubtful accounts, we make certain assumptions regarding the risk of uncollectable open receivable accounts. This risk factor is applied to the balance on accounts that are aged over 90 days: generally, this reserve has an estimated range from 10-25%. The risk percentage applied to the aged accounts may change based on conditions such as: general economic conditions, industry-specific economic conditions, historical and anticipated customer performance, historical experience with write-offs and the level of past-due amounts from year to year. However, generally our assumptions are consistent year-over-year and there has been little adjustment made to the percentages used. In addition, in the event there are certain known risk factors with an open account, we may increase the allowance to include estimated losses on such specific account balances. These specific reserves are identified by a periodic review of the aged accounts receivable. If there is an account in question, credit checks are made and there is communication with the customer, along with other means to try to assess if a specific reserve is required. Please see "Note 1 – General and Summary of Accounting Policies" in the Notes to Consolidated Financial Statements appearing in Item 8 of this Form 10-K and Appendix A included in this Form 10-K for further details and historical view of our allowance for doubtful accounts balance.
Goodwill and Other Indefinite-Lived Intangible Assets
In accordance with authoritative guidance on goodwill and other indefinite-lived intangible assets, such assets are tested for impairment at least annually, and written down when and to the extent impaired. We perform our annual impairment test for goodwill and indefinite-lived intangible assets as of October 1 of each year, or more frequently if an event occurs or conditions change that would more likely than not reduce the fair value of the asset below its carrying value.
As of October 1, 2019, the most recent annual goodwill impairment assessment date, we had goodwill at our Fleet Vehicles and Services, Specialty Chassis and Vehicles, and Emergency Response Vehicles segments. The Fleet Vehicles and Services and Emergency Response Vehicles, and Specialty Chassis Vehicle segments were determined to be reporting units for goodwill impairment testing. The goodwill recorded in these reporting units was evaluated for impairment as of October 1, 2019 using a discounted cash flow valuation.
We first assess qualitative factors including, but not limited to, macroeconomic conditions, industry conditions, the competitive environment, changes in the market for our products and current and forecasted financial performance to determine whether it is more likely than not that the fair value of a reporting unit is less than its carrying amount. If we determine that it is more likely than not that the fair value of the reporting unit is greater than its carrying amount, we are not required to calculate the fair value of a reporting unit. We have the option to bypass this qualitative assessment and proceed to a quantitative goodwill impairment assessment. If we elect to bypass the qualitative assessment, or if after completing the assessment it is determined to be more likely than not that the fair value of a reporting unit is less than its carrying value, we perform an impairment test by comparing the fair value of a reporting unit with its carrying amount, including goodwill. The fair value of the reporting unit is determined by estimating the future cash flows of the reporting unit to which the goodwill relates, and then discounting the future cash flows at a market-participant-derived weighted-average cost of capital (“WACC”). In determining the estimated future cash flows, we consider current and projected future levels of income based on our plans for that business; business trends, prospects and market and economic conditions; and market-participant considerations. If the fair value of a reporting unit exceeds its carrying amount, goodwill of the reporting unit is considered to not be impaired. If the carrying amount of the reporting unit exceeds its fair value, an impairment loss is recognized in an amount equal to the excess, up to the value of the goodwill.
We evaluate the recoverability of our indefinite lived intangible assets, which, as of October 1, 2019, consisted of our Utilimaster, Smeal, and Royal trade names, by comparing the estimated fair value of the trade names with their carrying values. We estimate the fair value of our trade names based on estimates of future royalty payments that are avoided through our ownership of the trade name, discounted to their present value. In determining the estimated fair value of the trade names, we consider current and projected future levels of revenue based on our plans for Utilimaster, Smeal, and Royal Truck Body branded products, business trends, prospects and market and economic conditions.
Significant judgments inherent in these analyses include assumptions about appropriate sales growth rates, WACC and the amount of expected future net cash flows. The judgments and assumptions used in the estimate of fair value are generally consistent with the projections and assumptions that are used in current operating plans. Such assumptions are subject to change as a result of changing economic and competitive conditions. The determination of fair value is highly sensitive to differences between estimated and actual cash flows and changes in the related discount rate used to evaluate the fair value of the reporting units and trade name.
In 2019, we elected to bypass the qualitative assessment and proceed to the quantitative goodwill impairment assessment for all of our reporting units. The estimated fair values of Fleet Vehicles and Services and Specialty Chassis and Vehicles reporting units exceeded their carrying values by 337% and 67%, respectively, as of October 1, 2019, the most recent annual assessment date. However, the estimated fair value of Emergency Response Vehicles reporting unit was less than its carrying value by 27%, thus goodwill of $11.5 million associated with the Emergency Response Vehicles reporting unit at October 1, 2019 was fully impaired.
The Utilimaster, Smeal and Royal Truck Body trade names have indefinite lives as it is anticipated that they will contribute to our cash flows indefinitely. The estimated fair value of our Utilimaster trade name exceeded its associated carrying value of $55.1 million by 1,921% as of October 1, 2019 and it was determined not to be impaired. However, our Smeal trade name was determined to be fully impaired, resulting in a reduction of its carrying value of $2.4 million, or 100% at October 1, 2019. Because the Royal trade name was recorded at fair value upon their acquisition as of September 9, 2019, an updated recoverability analysis for the Royal trade name was not conducted on October 1, 2019.
See “Note 2 – Discontinued Operations” in the Notes to the Consolidated Financial Statements appearing in Item 8 of this Form 10-K for further details on our goodwill and indefinite-lived intangible assets related to the ERV business. See “Note 7 – Goodwill and Intangible Assets” in the Notes to Consolidated Financial Statements appearing in Item 8 of this Form 10-K for further details on our goodwill and indefinite-lived intangible assets.
Warranties
Our policy is to record a provision for the estimated cost of warranty-related claims at the time of the sale, and periodically adjust the warranty liability to reflect actual experience. The amount of warranty liability accrued reflects actual historical warranty cost, which is accumulated on specific identifiable units. From that point, there is a projection of the expected future cost of honoring our obligations under the warranty agreements. Historically, the cost of fulfilling our warranty obligations has principally involved replacement parts and labor for field retrofit campaigns and recalls, which increase the reserve. Our estimates are based on historical experience, the number of units involved, and the extent of features and components included in product models. See "Note 12 – Commitments and Contingent Liabilities" in the Notes to Consolidated Financial Statements appearing in Item 8 of this Form 10-K for further information regarding warranties.
Provision for Income Taxes
We account for income taxes under a method that requires deferred income tax assets and liabilities to be recognized using enacted tax rates for the effect of temporary differences between the book and tax bases of recorded assets and liabilities. Authoritative guidance also requires deferred income tax assets, which include state tax credit carryforwards, operating loss carryforwards and deductible temporary differences, be reduced by a valuation allowance if it is more likely than not that some portion or all of the deferred income tax assets will not be realized.
We evaluate the likelihood of realizing our deferred income tax assets by assessing our valuation allowance and by adjusting the amount of such allowance, if necessary. The factors used to assess the likelihood of realization include our forecast of future taxable income, the projected reversal of temporary differences and available tax planning strategies that could be implemented to realize the net deferred income tax assets.
We recognize the tax benefit from an uncertain tax position only if it is more likely than not that the tax position will be sustained on examination by the taxing authorities. The determination is based on the technical merits of the position and presumes that each uncertain tax position will be examined by the relevant taxing authority that has full knowledge of all relevant information. Although management believes the estimates are reasonable, no assurance can be given that the final outcome of these matters will not be different than what is reflected in the historical income tax provisions and accruals.
Interest and penalties attributable to income taxes are recorded as a component of income taxes.
New and Pending Accounting Policies
See "Note 1 – General and Summary of Accounting Policies" in the Notes to Consolidated Financial Statements appearing in Item 8 of this Form 10-K.
Effect of Inflation
Inflation affects us in two principal ways. First, our revolving credit agreement is generally tied to the prime and LIBOR interest rates so that increases in those interest rates would be translated into additional interest expense. Second, general inflation impacts prices paid for labor, parts and supplies. Whenever possible, we attempt to cover increased costs of production and capital by adjusting the prices of our products. However, we generally do not attempt to negotiate inflation-based price adjustment provisions into our contracts. Since order lead times can be as much as nine months, we have limited ability to pass on cost increases to our customers on a short-term basis. In addition, the markets we serve are competitive in nature, and competition limits our ability to pass through cost increases in many cases. We strive to minimize the effect of inflation through cost reductions and improved productivity.
|
Item 7A. |
Quantitative and Qualitative Disclosures About Market Risk. |
Interest Rate Risk
We are exposed to market risks related to changes in interest rates and the effect of such a change on outstanding variable rate short-term and long-term debt. At December 31, 2019, we had $87.4 million in debt outstanding under our variable rate short-term and long-term debt agreements. An increase of 100 basis points in interest rates would result in additional interest expense of $0.9 million on an annualized basis. We believe that we have sufficient financial resources to accommodate this hypothetical increase in interest rates. We do not enter into market-risk-sensitive instruments for trading or other purposes.
Commodities Risk
We are also exposed to changes in the prices of raw materials, primarily steel and aluminum, along with components that are made from these raw materials. We generally do not enter into derivative instruments for the purpose of managing exposures associated with fluctuations in steel and aluminum prices. We do, from time to time, engage in pre-buys of components that are impacted by changes in steel, aluminum and other commodity prices in order to mitigate our exposure to such price increases and align our costs with prices quoted in specific customer orders. We also actively manage our material supply sourcing and may employ various methods to limit risk associated with commodity cost fluctuations due to normal market conditions and other factors including tariffs. See Management’s Discussion and Analysis of Financial Condition and Results of Operations included in Part 1, Item 7 of this Form 10-K for information on the impacts of changes in input costs during the year ended December 31, 2019.
We do not believe that there has been a material change in the nature or categories of the primary market risk exposures or in the particular markets that present our primary risk of loss. As of the date of this report, we do not know of or expect any material changes in the general nature of our primary market risk exposure in the near term. In this discussion, “near term” means a period of one year following the date of the most recent balance sheet contained in this report.
Prevailing interest rates, interest rate relationships and commodity costs are primarily determined by market factors that are beyond our control. All information provided in response to this item consists of forward-looking statements. Reference is made to the section captioned “Forward-Looking Statements” before Part I of this Annual Report on Form 10-K for a discussion of the limitations on our responsibility for such statements.
|
Item 8. |
Financial Statements and Supplementary Data. |
Report of Independent Registered Public Accounting Firm
Board of Directors and Shareholders
Spartan Motors, Inc.
Novi, Michigan
Opinion on the Consolidated Financial Statements
We have audited the accompanying consolidated balance sheets of Spartan Motors, Inc. (Company) as of December 31, 2019 and 2018, the related consolidated statements of operations, shareholders’ equity, and cash flows for each of the three years in the period ended December 31, 2019, and the related notes and financial statement schedule (collectively referred to as the consolidated financial statements). In our opinion, the consolidated financial statements present fairly, in all material respects, the financial position of the Company at December 31, 2019 and 2018, and the results of its operations and its cash flows for each of the three years in the period ended December 31, 2019, in conformity with accounting principles generally accepted in the United States of America.
We also have audited, in accordance with the standards of the Public Company Accounting Oversight Board (United States) (PCAOB), the Company’s internal control over financial reporting as of December 31, 2019, based on criteria established in Internal Control – Integrated Framework (2013) issued by the Committee of Sponsoring Organizations of the Treadway Commission (COSO), and our report dated March 16, 2020 expressed an adverse opinion thereon.
Change in Accounting Principle
As discussed in Note 1 to the consolidated financial statements, in 2018, the Company changed its method of accounting for revenue from contracts with customers and in 2019, the Company changed its method of accounting for leases.
Basis for Opinion
These consolidated financial statements are the responsibility of the Company’s management. Our responsibility is to express an opinion on the Company’s consolidated financial statements based on our audits. We are a public accounting firm registered with the PCAOB and are required to be independent with respect to the Company in accordance with the U.S. federal securities laws and the applicable rules and regulations of the Securities and Exchange Commission and the PCAOB.
We conducted our audits in accordance with the standards of the PCAOB. Those standards require that we plan and perform the audits to obtain reasonable assurance about whether the consolidated financial statements are free of material misstatement, whether due to error or fraud.
Our audits included performing procedures to assess the risks of material misstatement of the consolidated financial statements, whether due to error or fraud, and performing procedures that respond to those risks. Such procedures included examining, on a test basis, evidence regarding the amounts and disclosures in the consolidated financial statements. Our audits also included evaluating the accounting principles used and significant estimates made by management, as well as evaluating the overall presentation of the consolidated financial statements. We believe that our audits provide a reasonable basis for our opinion.
/S/ BDO USA, LLP
We have served as the Company's auditor since 2007.
Grand Rapids, MI
March 16, 2020
Report of Independent Registered Public Accounting Firm
Board of Directors and Shareholders
Spartan Motors, Inc.
Novi, Michigan
Opinion on Internal Control over Financial Reporting
We have audited Spartan Motors Inc.’s (the Company’s) internal control over financial reporting as of December 31, 2019, based on criteria established in Internal Control – Integrated Framework (2013) issued by the Committee of Sponsoring Organizations of the Treadway Commission (the COSO criteria). In our opinion, the Company did not maintain, in all material respects, effective internal control over financial reporting as of December 31, 2019, based on the COSO criteria.
We do not express an opinion or any other form of assurance on management's statements referring to any corrective actions taken by the Company after the date of management's assessment.
We also have audited, in accordance with the standards of the Public Company Accounting Oversight Board (United States) (PCAOB), the consolidated balance sheets of the Company as of December 31, 2019 and 2018, the related consolidated statements of operations, shareholders’ equity, and cash flows for each of the three years in the period ended December 31, 2019, and the related notes and schedule, and our report dated March 16, 2020 expressed an unqualified opinion thereon.
Basis for Opinion
The Company’s management is responsible for maintaining effective internal control over financial reporting and for its assessment of the effectiveness of internal control over financial reporting, included in the accompanying Item 9A, Management’s Report on Internal Control over Financial Reporting. Our responsibility is to express an opinion on the Company’s internal control over financial reporting based on our audit. We are a public accounting firm registered with the PCAOB and are required to be independent with respect to the Company in accordance with U.S. federal securities laws and the applicable rules and regulations of the Securities and Exchange Commission and the PCAOB.
We conducted our audit of internal control over financial reporting in accordance with the standards of the PCAOB. Those standards require that we plan and perform the audit to obtain reasonable assurance about whether effective internal control over financial reporting was maintained in all material respects. Our audit included obtaining an understanding of internal control over financial reporting, assessing the risk that a material weakness exists, and testing and evaluating the design and operating effectiveness of internal control based on the assessed risk. Our audit also included performing such other procedures as we considered necessary in the circumstances. We believe that our audit provides a reasonable basis for our opinion.
A material weakness is a deficiency, or a combination of deficiencies, in internal control over financial reporting, such that there is a reasonable possibility that a material misstatement of the company's annual or interim financial statements will not be prevented or detected on a timely basis. A material weakness has been identified and identified in management's assessment regarding the Company’s processes for recognizing revenue within its Fleet Vehicles and Services (FVS) business unit that had been ineffectively designed, implemented and operated. Specifically (1) there was insufficient management review to prevent and detect inaccurate and/or non-existent sales orders, including orders entered without appropriate supporting documentation and orders that were not properly updated to reflect price changes agreed to by customers, and (2) their controls were insufficient to accurately verify the existence, completeness and accuracy of transactions resulting in recognition of revenue, including evidence of contracts with a customer and Company acceptance and approval of those contracts, revenue recognition agreement with contracted terms, and quarterly cut-off errors. This material weakness was considered in determining the nature, timing, and extent of audit tests applied in our audit of the 2019 financial statements, and this report does not affect our report dated March 16, 2020 on those financial statements.
As indicated in the accompanying Item 9A, Management’s Report on Internal Control over Financial Reporting, management’s assessment of and conclusion on the effectiveness of internal control over financial reporting did not include the internal controls of Fortress Resources, LLC D/B/A Royal Truck Body (Royal), which was acquired on September 9, 2019, and which is included in the consolidated balance sheet of the Company as of December 31, 2019, and the related consolidated statements of operations, shareholders’ equity, and cash flows for the year then ended. Royal constituted 24.5% of total assets as of December 31, 2019, and 2.3% of revenues for the year then ended. Management did not assess the effectiveness of internal control over financial reporting of Royal because of the timing of the acquisition which was completed on September 9, 2019. Our audit of internal control over financial reporting of the Company also did not include an evaluation of the internal control over financial reporting of Royal.
Definition and Limitations of Internal Control over Financial Reporting
A company’s internal control over financial reporting is a process designed to provide reasonable assurance regarding the reliability of financial reporting and the preparation of financial statements for external purposes in accordance with generally accepted accounting principles. A company’s internal control over financial reporting includes those policies and procedures that (1) pertain to the maintenance of records that, in reasonable detail, accurately and fairly reflect the transactions and dispositions of the assets of the company; (2) provide reasonable assurance that transactions are recorded as necessary to permit preparation of financial statements in accordance with generally accepted accounting principles, and that receipts and expenditures of the company are being made only in accordance with authorizations of management and directors of the company; and (3) provide reasonable assurance regarding prevention or timely detection of unauthorized acquisition, use, or disposition of the company’s assets that could have a material effect on the financial statements.
Because of its inherent limitations, internal control over financial reporting may not prevent or detect misstatements. Also, projections of any evaluation of effectiveness to future periods are subject to the risk that controls may become inadequate because of changes in conditions, or that the degree of compliance with the policies or procedures may deteriorate.
/S/ BDO USA, LLP
Grand Rapids, MI
March 16, 2020
SPARTAN MOTORS, INC. AND SUBSIDIARIES
CONSOLIDATED BALANCE SHEETS
(In thousands, except par value)
|
December 31, |
December 31, |
|||||||
|
2019 |
2018 |
|||||||
|
ASSETS |
||||||||
|
Current assets: |
||||||||
|
Cash and cash equivalents |
$ | 19,349 | $ | 27,439 | ||||
|
Accounts receivable, less allowance of $228 and $99 |
58,874 | 68,009 | ||||||
|
Contract assets |
10,898 | 9,229 | ||||||
|
Inventories |
59,456 | 39,213 | ||||||
|
Other receivables – chassis pool agreements |
8,162 | - | ||||||
|
Other current assets |
5,344 | 3,952 | ||||||
|
Current assets held for sale |
90,725 | 97,487 | ||||||
|
Total current assets |
252,808 | 245,329 | ||||||
|
Property, plant and equipment, net |
40,074 | 32,485 | ||||||
|
Right of use assets – operating leases |
32,147 | - | ||||||
|
Goodwill |
43,632 | 22,367 | ||||||
|
Intangible assets, net |
54,061 | 5,011 | ||||||
|
Other assets |
2,295 | 2,261 | ||||||
|
Net deferred tax assets |
25,520 | 7,141 | ||||||
|
Noncurrent assets held for sale |
- | 39,190 | ||||||
|
TOTAL ASSETS |
$ | 450,537 | $ | 353,784 | ||||
|
LIABILITIES AND SHAREHOLDERS' EQUITY |
||||||||
|
Current liabilities: |
||||||||
|
Accounts payable |
$ | 54,713 | $ | 73,384 | ||||
|
Accrued warranty |
5,694 | 4,407 | ||||||
|
Accrued compensation and related taxes |
15,841 | 7,678 | ||||||
|
Deposits from customers |
2,640 | 871 | ||||||
|
Operating lease liability |
5,162 | - | ||||||
|
Other current liabilities and accrued expenses |
15,967 | 8,620 | ||||||
|
Short-term debt – chassis pool agreements |
8,162 | - | ||||||
|
Current portion of long-term debt |
177 | 60 | ||||||
|
Current liabilities held for sale |
49,601 | 43,077 | ||||||
|
Total current liabilities |
157,957 | 138,097 | ||||||
|
Other non-current liabilities |
4,922 | 4,058 | ||||||
|
Long-term operating lease liability |
27,241 | - | ||||||
|
Long-term debt, less current portion |
88,670 | 25,547 | ||||||
|
Total liabilities |
278,790 | 167,702 | ||||||
| Commitments and contingent liabilities | ||||||||
|
Shareholders' equity: |
||||||||
|
Preferred stock, no par value: 2,000 shares authorized (none issued) |
- | - | ||||||
|
Common stock, $0.01 par value; 80,000 shares authorized; 35,343 and 35,321 outstanding |
353 | 353 | ||||||
|
Additional paid in capital |
85,148 | 82,816 | ||||||
|
Retained earnings |
86,764 | 103,571 | ||||||
|
Total Spartan Motors, Inc. shareholders’ equity |
172,265 | 186,740 | ||||||
|
Non-controlling interest |
(518 |
) |
(658 |
) |
||||
|
Total shareholders' equity |
171,747 | 186,082 | ||||||
|
TOTAL LIABILITIES AND SHAREHOLDERS' EQUITY |
$ | 450,537 | $ | 353,784 | ||||
See accompanying Notes to Consolidated Financial Statements.
SPARTAN MOTORS, INC. AND SUBSIDIARIES
CONSOLIDATED STATEMENTS OF OPERATIONS
(In thousands, except per share data)
|
Year Ended December 31, |
||||||||||||
|
2019 |
2018 |
2017 |
||||||||||
|
Sales |
$ | 756,542 | $ | 570,527 | $ | 404,248 | ||||||
|
Cost of products sold |
639,509 | 497,370 | 341,176 | |||||||||
|
Restructuring charges |
6 | 13 | 120 | |||||||||
|
Gross profit |
117,027 | 73,144 | 62,952 | |||||||||
|
Operating expenses: |
||||||||||||
|
Research and development |
4,864 | 3,771 | 3,596 | |||||||||
|
Selling, general and administrative |
64,473 | 46,206 | 39,329 | |||||||||
|
Restructuring charges |
76 | 649 | 678 | |||||||||
|
Total operating expenses |
69,413 | 50,626 | 43,603 | |||||||||
|
Operating income |
47,614 | 22,518 | 19,349 | |||||||||
|
Other income (expense): |
||||||||||||
|
Interest expense |
(1,839 |
) |
(1,080 |
) |
(98 |
) |
||||||
|
Interest and other income |
1,370 | 12 | 602 | |||||||||
|
Total other (expense) income |
(469 |
) |
(1,068 |
) |
504 |
|
||||||
|
Income from continuing operations before income taxes |
47,145 | 21,450 | 19,853 | |||||||||
|
Income tax expense |
10,355 | 3,334 | 2,382 | |||||||||
|
Income from continuing operations |
36,790 | 18,116 | 17,471 | |||||||||
|
Loss from discontinued operations, net of income taxes |
(49,216 |
) |
(3,104 |
) |
(1,537 | ) | ||||||
|
Net (loss) income |
(12,426 | ) | 15,012 | 15,934 | ||||||||
|
Less: net income (loss) attributable to non-controlling interest |
140 | - | (1 |
) |
||||||||
|
Net (loss) income attributable to Spartan Motors, Inc. |
$ | (12,566 | ) | $ | 15,012 | $ | 15,935 | |||||
|
Basic earnings per share |
||||||||||||
|
Continuing operations |
$ | 1.03 | $ | 0.52 | $ | 0.50 | ||||||
|
Discontinued operations |
$ | (1.39 |
) |
$ | (0.09 |
) |
$ | (0.04 | ) | |||
|
Basie earnings per share |
$ | (0.36 | ) | $ | 0.43 | $ | 0.46 | |||||
|
Diluted earnings per share |
||||||||||||
|
Continuing operations |
$ | 1.03 | $ | 0.52 | $ | 0.50 | ||||||
|
Discontinued operations |
$ | (1.39 |
) |
$ | (0.09 |
) |
$ | (0.04 | ) | |||
|
Diluted earnings per share |
$ | (0.36 | ) | $ | 0.43 | $ | 0.46 | |||||
|
Basic weighted average common shares outstanding |
35,318 | 35,187 | 34,949 | |||||||||
|
Diluted weighted average common shares outstanding |
35,416 | 35,187 | 34,949 | |||||||||
See accompanying Notes to Consolidated Financial Statements
SPARTAN MOTORS, INC. AND SUBSIDIARIES
CONSOLIDATED STATEMENTS OF SHAREHOLDERS’ EQUITY
YEARS ENDED DECEMBER 31, 2019, 2018 and 2017
(In thousands, except per share data)
|
Number of Shares |
Common Stock |
Additional Paid In Capital |
Retained Earnings |
Non- Controlling Interest |
Total Shareholders' Equity |
|||||||||||||||||||
|
Balance at December 31, 2016 |
34,383 | 344 | 76,837 | 76,428 | (657 |
) |
152,952 | |||||||||||||||||
|
Issuance of common stock related to stock incentive plan transactions |
29 | - | (645 |
) |
- | - | (645 |
) |
||||||||||||||||
|
Dividends declared ($0.10 per share) |
- | - | - | (3,508 |
) |
- | (3,508 |
) |
||||||||||||||||
|
Issuance of restricted stock, net of cancellation |
685 | 7 | (7 |
) |
- | - | - | |||||||||||||||||
|
Stock-based compensation expense |
- | - | 3,536 | - | - | 3,536 | ||||||||||||||||||
|
Net income (loss) |
- | - | - | 15,935 | (1 |
) |
15,934 | |||||||||||||||||
|
Balance at December 31, 2017 |
35,097 | 351 | 79,721 | 88,855 | (658 |
) |
168,269 | |||||||||||||||||
|
Transition adjustment for adoption of new revenue recognition standard |
- | - | - | 3,668 | - | 3,668 | ||||||||||||||||||
|
Balance at December 31, 2017, Adjusted |
35,097 | 351 | 79,721 | 92,523 | (658 | ) | 171,937 | |||||||||||||||||
|
Issuance of common stock related to stock incentive plan transactions |
13 | - | (2,670 |
) |
- | - | (2,670 |
) |
||||||||||||||||
|
Dividends declared ($0.10 per share) |
- | - | - | (3,516 |
) |
- | (3,516 |
) |
||||||||||||||||
| Purchase and retirement of common stock | (90 | ) | (1 | ) | (207 | ) | (448 | ) | (656 | ) | ||||||||||||||
|
Issuance of common stock related to investment in subsidiary |
247 | 2 | 1,946 | - | - | 1,948 | ||||||||||||||||||
|
Issuance of restricted stock, net of cancellation |
54 | 1 | (1 |
) |
- | - | - | |||||||||||||||||
|
Stock-based compensation expense |
- | - | 4,027 | - | - | 4,027 | ||||||||||||||||||
|
Net income |
- | - | - | 15,012 | - | 15,012 | ||||||||||||||||||
|
Balance at December 31, 2018 |
35,321 | 353 | 82,816 | 103,571 | (658 |
) |
186,082 | |||||||||||||||||
| Transition adjustment for adoption of new lease standard | - | - | - | (113 | ) | - | (113 | ) | ||||||||||||||||
|
Balance at December 31, 2018, Adjusted |
35,321 | 353 | 82,816 | 103,458 | (658 |
) |
185,969 | |||||||||||||||||
|
Issuance of common stock related to stock incentive plan transactions |
28 | - | (766 |
) |
- | - | (766 |
) |
||||||||||||||||
|
Dividends declared ($0.10 per share) |
- | - | - | (3,572 |
) |
- | (3,572 |
) |
||||||||||||||||
| Purchase and retirement of common stock | (101 | ) | (1 | ) | (236 | ) | (556 | ) | (793 | ) | ||||||||||||||
|
Cancellation of common stock related to investment in subsidiary |
- |
|
- |
|
(1,946 |
) |
- | - | (1,946 |
) |
||||||||||||||
|
Issuance of restricted stock, net of cancellation |
96 | 1 | (1 |
) |
- | - | - | |||||||||||||||||
|
Stock-based compensation expense |
- | - | 5,281 | - | - | 5,281 | ||||||||||||||||||
|
Net (loss) income |
- | - | - | (12,566 | ) | 140 | (12,426 | ) | ||||||||||||||||
|
Balance at December 31, 2019 |
35,344 | $ | 353 | $ | 85,148 | $ | 86,764 | $ | (518 |
) |
$ | 171,747 | ||||||||||||
See accompanying Notes to Consolidated Financial Statements.
SPARTAN MOTORS, INC. AND SUBSIDIARIES
CONSOLIDATED STATEMENTS OF CASH FLOWS
(In thousands)
|
Year Ended December 31, |
||||||||||||
|
2019 |
2018 |
2017 |
||||||||||
|
Cash flows from operating activities: |
||||||||||||
|
Net (loss) income |
$ | (12,426 | ) | $ | 15,012 | $ | 15,934 | |||||
|
Adjustments to reconcile net (loss) income to net cash provided by operating activities |
||||||||||||
|
Depreciation and amortization |
11,180 | 10,370 | 9,937 | |||||||||
|
Gain on disposal of assets |
(14 | ) | - | (13 |
) |
|||||||
|
Impairment of goodwill and intangible assets |
13,856 | - | - | |||||||||
| Impairment of assets held for sale | 39,275 | - | - | |||||||||
|
Accruals for warranty |
12,671 | 8,660 | 9,099 | |||||||||
|
Expense from changes in fair value of contingent consideration |
- | (693 |
) |
|||||||||
|
Deferred income taxes |
(18,225 |
) |
(755 |
) |
(3,974 |
) |
||||||
|
Non-cash stock based compensation expense |
5,281 | 4,027 | 3,536 | |||||||||
|
Decrease (increase) in operating assets, net of effects of acquisition: |
||||||||||||
|
Accounts receivable |
22,812 | (22,490 |
) |
(18,576 |
) |
|||||||
|
Contract assets |
(10,112 |
) |
(5,467 |
) |
- | |||||||
|
Inventories |
(14,783 |
) |
(24,340 |
) |
42,920 | |||||||
|
Income taxes receivable |
- | - | 1,287 | |||||||||
|
Other assets |
(709 |
) |
(658 |
) |
851 | |||||||
|
Increase (decrease) in operating liabilities, net of effects of acquisition: |
||||||||||||
|
Accounts payable |
(20,404 |
) |
35,297 | 5,366 | ||||||||
|
Cash paid for warranty repairs |
(11,818 |
) |
(10,838 |
) |
(13,854 |
) |
||||||
|
Accrued compensation and related taxes |
7,737 | (2,789 |
) |
(1,530 |
) |
|||||||
|
Deposits from customers |
1,163 | 4,444 | (33,648 |
) |
||||||||
|
Other current liabilities and accrued expenses |
954 | 1,094 | 240 | |||||||||
|
Other long-term liabilities |
291 | (345 |
) |
1,725 | ||||||||
|
Other |
(1,235 |
) |
- | - | ||||||||
|
Accrued income taxes |
8,687 | (2,503 |
) |
2,716 | ||||||||
|
Total adjustments |
46,607 | (6,986 |
) |
6,082 | ||||||||
|
Net cash provided by operating activities |
34,181 | 8,026 | 22,016 | |||||||||
|
Cash flows from investing activities: |
||||||||||||
|
Purchases of property, plant and equipment |
(10,042 |
) |
(8,985 |
) |
(5,340 |
) |
||||||
|
Proceeds from sale of property, plant and equipment |
15 | - | 13 | |||||||||
|
Acquisition of business, net of cash acquired |
(88,938 |
) |
(5,200 |
) |
(28,903 |
) |
||||||
|
Net cash used in investing activities |
(98,965 |
) |
(14,185 |
) |
(34,230 |
) |
||||||
|
Cash flows from financing activities: |
||||||||||||
|
Proceeds from long-term debt |
92,000 | 7,684 | 32,919 | |||||||||
|
Payments on long-term debt |
(30,175 |
) |
(66 |
) |
(15,070 |
) |
||||||
|
Payment of contingent consideration on acquisitions |
- | (701 |
) |
- | ||||||||
|
Purchase and retirement of common stock |
(793 |
) |
(656 |
) |
- | |||||||
|
Net cash used in the exercise, vesting or cancellation of stock incentive awards |
(766 |
) |
(2,670 |
) |
(645 |
) |
||||||
|
Payment of dividends |
(3,572 |
) |
(3,516 |
) |
(3,508 |
) |
||||||
|
Net cash provided by financing activities |
56,694 | 75 | 13,696 | |||||||||
|
Net (decrease) increase in cash and cash equivalents |
(8,090 |
) |
(6,084 |
) |
1,482 | |||||||
|
Cash and cash equivalents at beginning of year |
27,439 | 33,523 | 32,041 | |||||||||
|
Cash and cash equivalents at end of year |
$ | 19,349 | $ | 27,439 | $ | 33,523 | ||||||
Note: Consolidated Statements of Cash Flows include continuing operations and discontinued operations for all years presented.
See accompanying Notes to Consolidated Financial Statements.
SPARTAN MOTORS, INC. AND SUBSIDIARIES
NOTES TO CONSOLIDATED FINANCIAL STATEMENTS
(Dollar amounts in thousands, except per share data)
NOTE 1 – GENERAL AND SUMMARY OF ACCOUNTING POLICIES
Nature of Operations. Spartan Motors, Inc. (the “Company”, “we”, or “us”) is a niche market leader in specialty vehicle manufacturing and assembly for the commercial vehicle (including last-mile delivery, specialty service and vocation-specific upfit segments) and recreational vehicle industries. Our products include walk-in vans and truck bodies used in e-commerce/parcel delivery, upfit equipment used in the mobile retail and utility trades, luxury Class A diesel motor home chassis, military vehicles, and contract manufacturing and assembly services. We also supply replacement parts and offer repair, maintenance, field service and refurbishment services for the vehicles that we manufacture. Our operating activities are conducted through our wholly-owned operating subsidiary, Spartan Motors USA, Inc. (“Spartan USA”), with locations in Charlotte, Michigan; Ephrata, Pennsylvania; Pompano Beach, Florida; Bristol, Indiana; North Charleston, South Carolina; Kansas City, Missouri; Montebello, Carson, Union City and Roseville, California; Mesa, Arizona; Dallas and Weatherford, Texas; and Saltillo, Mexico.
On February 1, 2020, the Company completed its sale of the Emergency Response and Vehicle (“ERV”) business for $55,000 in cash, subject to certain post-closing adjustments. The ERV business consisted of the emergency response cab-chassis and apparatus operations in Charlotte, Michigan, and the Spartan apparatus operations in Brandon, South Dakota; Snyder and Neligh, Nebraska; and Ephrata, Pennsylvania. See “Note 2 – Discontinued Operations” for further discussion regarding this transaction.
On September 9, 2019, the Company entered into a Unit Purchase Agreement with Fortress Resources, LLC D/B/A Royal Truck Body (“Royal”), pursuant to which the Company acquired all the outstanding equity interests of Royal for $89,369 in cash. Royal is a leading California-based designer, manufacturer and installer of service truck bodies and accessories. Royal manufactures and assembles truck body options for various trades, service truck bodies, stake body trucks, contractor trucks, and dump bed trucks. Royal is the largest service body company in the western United States with its principal facility in Carson, California. Royal has additional manufacturing, assembly, and service space in branch locations in Union City and Roseville, California; Mesa, Arizona; and Dallas and Weatherford, Texas. This acquisition allows us to quickly expand our footprint in the western United States supporting our strategy of coast-to-coast manufacturing and distribution. Royal is part of our Specialty Chassis and Vehicle segment.
On June 12, 2019, the Company acquired certain assets and assumed certain liabilities of General Truck Body, Inc., located in Montebello, California, through the Company’s wholly-owned subsidiary, Spartan Motors GTB, LLC (“GTB”). GTB is a provider of upfit services for government and non-government vehicles. The acquisition will enable the Company to increase its product offerings to fleet customers, while further expanding its manufacturing capabilities in the U.S. market. Spartan Motors GTB, LLC is reported as part of the Fleet Vehicles and Services segment.
On December 17, 2018, the Company acquired all of the assets and assumed certain liabilities of Strobes-R-Us, Inc., located in Pompano Beach, Florida, through the Company’s majority-owned subsidiary, Spartan Upfit Services, Inc. dba Strobes-R-Us (“SRUS”). The total purchase price paid was $7,032, consisting of $5,200 in cash plus a $1,832 contingency for performance-based earn-out payments. SRUS is a premier provider of upfit services for government and non-government vehicles. The acquisition will enable the Company to increase its product offerings to fleet customers, while further expanding its manufacturing capabilities into the southeastern U.S. market. As part of this acquisition, Spartan acquired Strobes-R-Us’ state-of-the-art upfit facility and product showroom in Pompano Beach, Florida. Spartan Upfit Services, Inc. and the related noncontrolling interest is reported as part of the Fleet Vehicles and Services segment.
Principles of Consolidation. The consolidated financial statements include our accounts and the accounts of our wholly owned subsidiary, Spartan USA and its subsidiaries. All inter-company transactions have been eliminated.
SPARTAN MOTORS, INC. AND SUBSIDIARIES
NOTES TO CONSOLIDATED FINANCIAL STATEMENTS
(Dollar amounts in thousands, except per share data)
Non-Controlling Interest
At December 31, 2019, Spartan USA held a 50% share in Spartan-Gimaex, however, due to the management and operational structure of the joint venture, Spartan USA was considered to have had the ability to control the operations of Spartan-Gimaex. Accordingly, Spartan-Gimaex is reported as a consolidated subsidiary of Spartan Motors, Inc. The joint venture is not currently active and is in the process of being dissolved. At December 31, 2019, the Company holds an 80% share in SRUS, which is reported as a consolidated subsidiary of the Company within the Fleet Vehicles and Services segment.
Use of Estimates. In the preparation of our financial statements in accordance with U.S. generally accepted accounting principles (“GAAP”), management uses estimates and makes judgments and assumptions that affect asset and liability values and the amounts reported as income and expense during the periods presented. Certain of these estimates, judgments and assumptions, such as the allowance for credit losses, warranty expenses, impairment assessments of tangible and intangible assets, and the provision for income taxes, are particularly sensitive. If actual results are different from estimates used by management, they may have a material impact on the financial statements.
Revenue Recognition. Essentially all of our revenue is generated through contracts with our customers. We may recognize revenue over time or at a point in time when or as obligations under the terms of a contract with our customer are satisfied, depending on the terms and features of the contract and the products supplied. Our contracts generally do not have any significant variable consideration. The collectability of consideration on the contract is reasonably assured before revenue is recognized. On certain vehicles, payment may be received in advance of us satisfying our performance obligations. Such payments are recorded in Deposits from customers on the Consolidated Balance Sheets. The corresponding performance obligations are generally satisfied within one year of the contract inception. In such cases, we have elected to apply the practical expedient to not adjust the promised amount of consideration for the effects of a significant financing component. The financing impact on contracts that contain performance obligations that are not expected to be satisfied within one year are expected to be immaterial to our consolidated financial statements.
We have elected to utilize the practical expedient to recognize the incremental costs of obtaining a contract as an expense when incurred because the amortization period for the prepaid costs that would have otherwise been deferred and amortized is one year or less. We use an observable price to allocate the stand-alone selling price to separate performance obligations within a contract or a cost-plus margin approach when an observable price is not available. The estimated costs to fulfill our base warranties are recognized as expense when the products are sold (see “Note 12 – Commitments and Contingent Liabilities” for further information on warranties). Our contracts with customers do not contain a provision for product returns, except for contracts related to certain parts sales.
Revenue for parts sales for all segments is recognized at the time that control and risk of ownership has passed to the customer, which is generally when the ordered part is shipped to the customer. Historical return rates on parts sales have been immaterial. Accordingly, no return reserve has been recorded. Instead, returns are recognized as a reduction of revenue at the time that they are received.
For certain of our vehicles and chassis, we sell separately priced service contracts that provide roadside assistance or extend certain warranty coverage beyond our base warranty agreements. These separately priced contracts range from one to six years from the date of the shipment of the related vehicle or chassis. We receive payment with the shipment of the related vehicle or at the inception of the extended service contract, if later, and recognize revenue over the coverage term of the agreement, generally on a straight-line basis, which approximates the pattern of costs expected to be incurred in satisfying the obligations under the contract.
Distinct revenue recognition policies for our segments are as follows:
Fleet Vehicles and Services
Our walk-in vans and truck bodies are generally built on a chassis that is owned and controlled by the customer. Due to the customer ownership of the chassis, the performance obligation for these walk-in vans and truck bodies is satisfied as the vehicles are built. Accordingly, the revenue and corresponding cost of products sold associated with these contracts are recognized over time based on the inputs completed for a given performance obligation during the reporting period. Certain contracts will specify that a walk-in van or truck body is to be built on a chassis that we purchase and subsequently sell to the customer. The revenue on these contracts is recognized at the time that the performance obligation is satisfied, and control and risk of ownership has passed to the customer, which is generally upon shipment of the vehicle from our manufacturing facility to the customer or receipt of the vehicle by the customer, depending on contract terms. We have elected to treat shipping and handling costs subsequent to transfer of control as fulfillment activities and, accordingly, recognize these costs as the revenue is recognized.
Revenue for upfit and field service contracts is recognized over time, as equipment is installed in the customer’s vehicle or as repairs and enhancements are made to the customer’s vehicles. Revenue and the corresponding cost of products sold is estimated based on the inputs completed for a given performance obligation. Our performance obligation for upfit and field service contracts is satisfied when the equipment installation or repairs and enhancements of the customer’s vehicle has been completed. Our receivables are generally collected in less than three months, in accordance with our underlying payment terms.
SPARTAN MOTORS, INC. AND SUBSIDIARIES
NOTES TO CONSOLIDATED FINANCIAL STATEMENTS
(Dollar amounts in thousands, except per share data)
Specialty Chassis and Vehicles
We recognize revenue and the corresponding cost of products sold on the sale of motor home chassis when the performance obligation is completed and control and risk of ownership of the chassis has passed to our customer, which is generally upon shipment of the chassis to the customer.
Revenue and the corresponding cost of products sold associated with other specialty chassis is recognized over time based on the inputs completed for a given performance obligation during the reporting period. Other specialty chassis are generally built on a chassis that is owned and controlled by the customer. Due to the customer ownership of the chassis, the performance obligations for other specialty chassis contracts are satisfied as the products are assembled. Our receivables will generally be collected in less than three months, in accordance with our underlying payment terms.
Business Combinations. When acquiring other businesses, we recognize identifiable assets acquired and liabilities assumed at their acquisition date estimated fair values, and separately from any goodwill that may be required to be recognized. Goodwill, when recognizable, is measured as the excess amount of any consideration transferred, which is measured at fair value, over the acquisition date fair values of the identifiable assets acquired and liabilities assumed. Amounts recorded in a business combination may change during the measurement period, which is a period not to exceed one year from the date of acquisition, as additional information about conditions existing at the acquisition date becomes available.
Accounting for such acquisitions requires us to make significant assumptions and estimates and, although we believe any estimates and assumptions we make are reasonable and appropriate at the time they are made, unanticipated events and circumstances may arise that affect their accuracy, which may cause actual results to differ from those estimated by us. When necessary, we will adjust the values of the assets acquired and liabilities assumed against the goodwill or acquisition gain, as initially recorded, for a period of up to one year after the acquisition date.
Costs incurred to effect an acquisition, such as legal, accounting, valuation or other third-party costs, as well as internal general and administrative costs incurred are charged to expense in the periods incurred.
Shipping and Handling of Products. Costs incurred related to the shipment and handling of products are classified in cost of products sold. Amounts billed to customers for shipping and handling of products are included in sales.
Cash and Cash Equivalents include cash on hand, cash on deposit, treasuries and money market funds. We consider all highly liquid investments purchased with an original maturity of three months or less to be cash equivalents.
Accounts Receivable. Our receivables are subject to credit risk, and we do not typically require collateral on our accounts receivable. We perform periodic credit evaluations of our customers’ financial condition and generally require a security interest in the products sold. Receivables generally are due within 30 to 60 days. We maintain an allowance for customer accounts that reduces receivables to amounts that are expected to be collected. In estimating the allowance for doubtful accounts, management makes certain assumptions regarding the risk of uncollectable open receivable accounts. This risk factor is applied to the balance on accounts that are aged over 90 days: generally, this reserve has an estimated range from 10-25%. The risk percentage applied to the aged accounts may change based on conditions such as: general economic conditions, industry-specific economic conditions, historical and anticipated customer performance, historical experience with write-offs and the level of past-due amounts from year to year. However, generally our assumptions are consistent year-over-year and there has been little adjustment made to the percentages used. In addition, in the event there are certain known risk factors with an open account, we may increase the allowance to include estimated losses on such specific account balances. The specific reserves are identified by a periodic review of the aged accounts receivable. If there is an account in question, credit checks are made and there is communication with the customer, along with other means to try to assess if a specific reserve is required. Past due accounts are written off when collectability is determined to be no longer assured.
Inventories are stated at the lower of first-in, first-out cost or net realizable value. Estimated inventory allowances for slow-moving inventory are based upon current assessments about future demands, market conditions and related management initiatives. If market conditions are less favorable than those projected by management, additional inventory allowances may be required.
Contract Assets arise upon the transfer of goods or services to a customer before the customer pays consideration. The Company will present the contract as either a contract asset or as a receivable, depending on the nature of the entity’s right to consideration for its performance. Contract assets are a right to consideration in exchange for goods or services that the Company has transferred to a customer, when the right is conditioned on something other than the passage of time.
SPARTAN MOTORS, INC. AND SUBSIDIARIES
NOTES TO CONSOLIDATED FINANCIAL STATEMENTS
(Dollar amounts in thousands, except per share data)
Property, Plant and Equipment is stated at cost and the related assets are depreciated over their estimated useful lives on a straight-line basis for financial statement purposes and an accelerated method for income tax purposes. Cost includes an amount of interest associated with significant capital projects. Estimated useful lives range from 20 years for buildings and improvements, three to 15 years for plant machinery and equipment, three to seven years for furniture and fixtures and three to five years for vehicles. Leasehold improvements are depreciated over the shorter of the lease term or the estimated useful life of the asset. Maintenance and repair costs are charged to earnings, while expenditures that increase asset lives are capitalized. We review our property, plant and equipment, along with all other long-lived assets that have finite lives, including finite-lived intangible assets, for impairment whenever events or changes in circumstances indicate that their carrying amounts may not be recoverable. See "Note 8 – Property, Plant and Equipment" for further information on our property and equipment.
Assets and Liabilities Held for Sale We classify assets and liabilities (disposal groups) to be sold as held for sale in the period in which all of the following criteria are met: management, having the authority to approve the action, commits to a plan to sell the disposal group; the disposal group is available for immediate sale in its present condition subject only to terms that are usual and customary for sales of such disposal groups; an active program to locate a buyer and other actions required to complete the plan to sell the disposal group have been initiated; the sale of the disposal group is probable, and transfer of the disposal group is expected to qualify for recognition as a completed sale within one year, except if events or circumstances beyond the Company's control extend the period of time required to sell the disposal group beyond one year; the disposal group is being actively marketed for sale at a price that is reasonable in relation to its current fair value; and actions required to complete the plan indicate that it is unlikely that significant changes to the plan will be made or that the plan will be withdrawn.
We initially measure a disposal group that is classified as held for sale at the lower of its carrying value or fair value less costs to sell. Any loss resulting from this measurement is recognized in the period in which the held for sale criteria are met. Conversely, gains are not recognized on the sale of a disposal group until the date of sale. We assess the fair value of a disposal group each reporting period it remains classified as held for sale and reports any subsequent changes as an adjustment to the carrying value of the disposal group, as long as the new carrying value does not exceed the carrying value of the disposal group at the time it was initially classified as held for sale.
Upon determining that a disposal group meets the criteria to be classified as held for sale, the Company reports the assets and liabilities of the disposal group, if material, in the line items assets held for sale and liabilities held for sale in the Consolidated Balance Sheets. Depreciation is not recorded during the period in which the long-lived assets, included in the disposal group, are classified as held for sale.
Additionally, we report the reporting results for a disposal group in discontinued operations separately from continuing operations to distinguish the financial impact of disposal transactions from ongoing operations if the disposal represents a strategic shift that has or will have a major effect on our operations and financial results.
Related Party Transactions. We purchase certain components used in the manufacture of our products and logistics services from parties that could be considered related to us because one or more of our executive officers or board members is also an executive officer or board member of the related party. See "Note 19– Related Party Transactions" for more information regarding our transactions with related parties.
Goodwill and Other Intangible Assets. Goodwill represents the excess of the cost of a business combination over the fair value of the net assets acquired. Goodwill and intangible assets deemed to have indefinite lives are not amortized but are subject to impairment tests on an annual basis, or whenever events or changes in circumstances indicate that the carrying value may not be recoverable. Goodwill is allocated to the reporting unit from which it was created. A reporting unit is an operating segment or sub-segment to which goodwill is assigned when initially recorded. We review indefinite lived intangible assets annually for impairment by comparing the carrying value of those assets to their fair value.
Other intangible assets with finite lives are amortized over their estimated useful lives and are tested for impairment whenever events or changes in circumstances indicate that their carrying amounts may not be recoverable.
We perform our annual goodwill and indefinite lived intangible assets impairment test as of October 1 and monitor for interim triggering events on an ongoing basis. For goodwill we first assess qualitative factors to determine whether it is more likely than not that the fair value of a reporting unit is less than its carrying amount. Under authoritative guidance, we are not required to calculate the fair value of a reporting unit unless we determine that it is more likely than not that the fair value of the reporting unit is less than its carrying amount. We have the option to bypass the qualitative assessment and proceed to a quantitative impairment test.
SPARTAN MOTORS, INC. AND SUBSIDIARIES
NOTES TO CONSOLIDATED FINANCIAL STATEMENTS
(Dollar amounts in thousands, except per share data)
If we elect to bypass the qualitative assessment for a reporting unit, or if after completing the assessment we determine that it is more likely than not that the fair value of a reporting unit is less than its carrying value, we perform a quantitative impairment test, whereby we compare the fair value of a reporting unit with its carrying amount, including goodwill. The fair value of the reporting unit is determined by estimating the future cash flows of the reporting unit to which the goodwill relates, and then discounting the future cash flows at a market-participant-derived weighted-average cost of capital (“WACC”). In determining the estimated future cash flows, we consider current and projected future levels of income based on our plans for that business; business trends, prospects and market and economic conditions; and market-participant considerations. If the fair value of a reporting unit exceeds its carrying amount, goodwill of the reporting unit is considered to not be impaired. If the carrying amount of the reporting unit exceeds its estimated fair value, an impairment loss is recognized in an amount equal to the excess, up to the carrying value of the goodwill.
We evaluate the recoverability of our indefinite lived intangible assets, which consists of our Utilimaster, Smeal and Royal Truck Body trade names, by comparing the estimated fair value of the trade names with their carrying values. We estimate the fair value of our trade names based on estimates of future royalty payments that are avoided through our ownership of the trade name, discounted to their present value. In determining the estimated fair value of the trade names, we consider current and projected future levels of sales based on our plans for Utilimaster, Smeal and Royal Truck Body branded products, business trends, prospects and market and economic conditions.
Significant judgments inherent in these assessments and analyses include assumptions about macroeconomic and industry conditions, appropriate sales growth rates, WACC and the amount of expected future net cash flows. The judgments and assumptions used in the estimate of fair value are generally consistent with the projections and assumptions that are used in current operating plans. Such assumptions are subject to change because of changing economic and competitive conditions. The determination of fair value is highly sensitive to differences between estimated and actual cash flows and changes in the related discount rate used to evaluate the fair value of the reporting units and trade names. See “Note 2 – Discontinued Operations” in the Notes to the Consolidated Financial Statements appearing in Item 8 of this Form 10-K for further details on our goodwill and indefinite-lived intangible assets related to the ERV business. See “Note 7 – Goodwill and Intangible Assets” for further details on our goodwill and other intangible assets.
Warranties. Our policy is to record a provision for the estimated cost of warranty-related claims at the time of the sale, and periodically adjust the warranty liability to reflect actual experience. The amount of warranty liability accrued reflects management’s best estimate of the expected future cost of honoring our obligations under the warranty agreements. Expense related to warranty liabilities accrued for product sales, as well as adjustments to pre-existing warranty liabilities, are reflected within Cost of products sold on our Consolidated Statements of Operations. Our estimates are based on historical experience, the number of units involved, and the extent of features and components included in product models. See "Note 12 – Commitments and Contingent Liabilities" for further information regarding warranties.
Deposits from Customers. We sometimes receive advance payments from customers for product orders and record these amounts as liabilities. We accept such deposits when presented by customers seeking improved pricing in connection with orders that are placed for products to be manufactured and sold at a future date. Sales associated with these deposits are recognized over time based on the inputs completed for a given performance obligation during the reporting period or deferred and recognized upon shipment of the related product to the customer depending on the terms of the contract.
Research and Development. Our research and development costs, which consist of compensation costs, travel and entertainment, administrative expenses and new product development among other items, are expensed as incurred.
Taxes on Income. We recognize deferred income tax assets and liabilities using enacted tax rates for the effect of temporary differences between the book and tax bases of recorded assets and liabilities. Deferred tax liabilities generally represent tax expense recognized for which payment has been deferred, or expenses which have been deducted in our tax returns, but which have not yet been recognized as an expense in our financial statements.
We establish valuation allowances for deferred income tax assets in accordance with GAAP, which provides that such valuation allowances shall be established unless realization of the income tax benefits is more likely than not. The ultimate realization of deferred tax assets is dependent upon the generation of future taxable income during the periods in which those temporary differences become deductible. At each reporting period, we consider the scheduled reversal of deferred tax liabilities, available taxes in carryback periods, tax planning strategies and projected future taxable income in making this assessment.
We recognize the tax benefit from an uncertain tax position only if it is more likely than not that the tax position will be sustained on examination by the taxing authorities. The determination is based on the technical merits of the position and presumes that each uncertain tax position will be examined by the relevant taxing authority that has full knowledge of all relevant information. Although we believe the estimates are reasonable, no assurance can be given that the final outcome of these matters will not be different than what is reflected in the historical income tax provisions and accruals.
SPARTAN MOTORS, INC. AND SUBSIDIARIES
NOTES TO CONSOLIDATED FINANCIAL STATEMENTS
(Dollar amounts in thousands, except per share data)
Interest and penalties attributable to income taxes are recorded as a component of income taxes. See "Note 10 – Taxes on Income" for further details on our income taxes.
Earnings Per Share. Basic earnings per share is based on the weighted average number of common shares outstanding during the period. Diluted earnings per share also include the dilutive effect of additional potential common shares issuable from stock-based awards and are determined using the treasury stock method. Basic earnings per share represents net earnings divided by basic weighted average number of common shares outstanding during the period. Diluted earnings per share represents net earnings divided by diluted weighted average number of common shares outstanding, which includes the average dilutive effect of all potentially dilutive securities that are outstanding during the period. Our unvested restricted stock units and performance stock units are included in the number of shares outstanding for diluted earnings per share calculations, unless a net loss is reported, in which situation unvested stock awards are excluded from the number of shares outstanding for diluted earnings per share calculations. See "Note 15 – Stock-Based Compensation" and "Note 17 – Earnings Per Share" for further details.
Stock-Based Compensation. Stock based compensation costs for equity-based awards is measured on the grant date based on the estimated fair value of the award at that date, and is recognized over the requisite service period, net of estimated forfeitures. Fair value of restricted stock awards, restricted stock units and performance stock units subject to a performance condition is based upon the quoted market price of the common stock on the date of grant. Fair value of performance stock units subject to a market condition is calculated using the Monte Carlo simulation model. Our stock-based compensation plans are described in more detail in "Note 15 – Stock Based Compensation".
Fair Value. We are required to disclose the estimated fair value of our financial instruments. The carrying value at December 31, 2019 and 2018 of cash and cash equivalents, accounts receivable and accounts payable approximate their fair value due to their short-term nature. The carrying value of variable rate debt instruments approximate their fair value based on their relative terms and market rates.
Segment Reporting. We identify our reportable segments based on our management structure and the financial data utilized by the chief operating decision maker to assess segment performance and allocate resources among our operating units. We have two reportable segments: Fleet Vehicles and Services and Specialty Chassis and Vehicles. More detailed information about our reportable segments can be found in "Note 18 – Business Segments".
Supplemental Disclosures of Cash Flow Information. Cash paid for interest was $1,844, $630 and $619 for 2019, 2018 and 2017. Cash paid for income taxes, net of refunds, was $4,942, $5,054 and $0 for 2019, 2018 and 2017. Non-cash investing in 2018 included the issuance of the Company’s stock in the amount of $1,950, which was reversed in 2019, and a contingent liability for the value of future consideration of $1,832 in conjunction with our acquisition of SRUS. See "Note 3 – Acquisition Activities" for further information about the acquisition.
New Accounting Standards
In December 2019, the FASB issued Accounting Standards Update No. 2019-12, Income Taxes (Topic 740): Simplifying the Accounting for Income Taxes (“ASU 2019-12”). ASU 2019-12 is intended to simplify the accounting for income taxes by removing certain exceptions to the general principles of Topic 740 and improving consistent application of GAAP for other areas of Topic 740 by clarifying and amending existing guidance. The provisions of this standard are effective for reporting periods beginning after December 15, 2020 and early adoption is permitted. The adoption of the provisions of ASU 2019-12 is not expected to have a material impact on our consolidated financial position, results of operations or cash flows.
In June 2016, the FASB issued Accounting Standards Update 2016-13, Financial Instruments-Credit Losses: Measurement of Credit Losses on Financial Instruments (“ASU 2016-13”). ASU 2016-13 is intended to introduce a revised approach to the recognition and measurement of credit losses, emphasizing an updated model based on expected losses rather than incurred losses. The provisions of this standard are effective for reporting periods beginning after December 15, 2019 and early adoption is permitted. The adoption of the provisions of ASU 2016-13 is not expected to have a material impact on our consolidated financial position, results of operations or cash flows.
In February 2016, the FASB issued Accounting Standards Update No. 2016-02, Leases (“ASU 2016-02”). The new standard establishes a right-of-use (“ROU”) model that requires a lessee to record a ROU asset and a lease liability on the balance sheet for all leases with terms longer than 12 months. Leases will be classified as either finance or operating, with classification affecting the pattern of expense recognition in the income statement. The new standard is effective for fiscal years beginning after December 15, 2018, including interim periods within those fiscal years. A modified retrospective transition approach is required for lessees for capital and operating leases existing at, or entered into after, the beginning of the earliest comparative period presented in the financial statements, with certain practical expedients available. We adopted ASU 2016-02 as of January 1, 2019 using the modified retrospective approach. See the “Adoption of Lease Accounting Policy” section below and "Note 9 – Leases" for a description of the impact of the adoption of the provisions of ASU 2016-02 on our consolidated financial position, results of operations and cash flows
SPARTAN MOTORS, INC. AND SUBSIDIARIES
NOTES TO CONSOLIDATED FINANCIAL STATEMENTS
(Dollar amounts in thousands, except per share data)
Except for the changes below, we have consistently applied the accounting policies to all periods presented in these consolidated financial statements.
Adoption of Lease Accounting Policy
We applied ASU 2016-02 and all related amendments (“ASC 842”) using the modified retrospective method by recognizing the cumulative effect of adoption as an adjustment to the opening balance of retained earnings at January 1, 2019. Therefore, the comparative information has not been adjusted and continues to be reported under prior leasing guidance. In addition, we elected to apply the following package of practical expedients on a consistent basis permitting entities not to reassess: (i) whether any expired or existing contracts are or contain a lease; (ii) lease classification for any expired or existing leases and (iii) whether initial direct costs for any expired or existing leases qualify for capitalization under the amended guidance. As a result, as of January 1, 2019 we recorded ROU assets of $13,582 for operating leases and $675 for financing leases. We also recorded operating lease liabilities of $13,716 and finance lease liabilities of $696. The decrease to retained earnings was $113, net of the tax effect of $42 reflecting the cumulative impact of the accounting change. The standard did not have a material effect on consolidated net income (loss) or cash flows.
We determine if an arrangement is a lease at inception. Operating leases are included in ROU assets - operating leases, Operating lease liability, and Long-term operating lease liability on our Consolidated Balance Sheets. Finance leases are included in Other assets, Other current liabilities and accrued expenses and Other non-current liabilities on our Consolidated Balance Sheets.
ROU assets represent our right to use an underlying asset for the lease term and lease liabilities represent our obligation to make lease payments arising from the lease. Operating lease ROU assets and liabilities are recognized at commencement date based on the present value of lease payments over the lease term. As most of our leases do not provide an implicit rate, we use our incremental borrowing rate based on the information available at commencement date in determining the present value of lease payments. The operating lease ROU asset also includes any lease payments made and excludes lease incentives and initial direct costs incurred. We include options to extend or terminate the lease in our lease term when it is reasonably certain that we will exercise that option. Lease expense for lease payments on operating leases is recognized on a straight-line basis over the lease term.
We do not record a ROU asset or lease liability for leases with an expected term of 12 months or less. Expenses for these leases are recognized on a straight-line basis over the lease term.
We have lease agreements with lease and non-lease components, which are accounted for separately for leases related to real property. For leases related to personal property we account for lease and non-lease components associated with a lease as a single lease component.
SPARTAN MOTORS, INC. AND SUBSIDIARIES
NOTES TO CONSOLIDATED FINANCIAL STATEMENTS
(Dollar amounts in thousands, except per share data)
NOTE 2 – DISCONTINUED OPERATIONS
On February 1, 2020, we completed the sale of our ERV business for $55,000 in cash, subject to certain post-closing adjustments. The ERV business included the emergency response chassis operations in Charlotte, Michigan, and operations in Brandon, South Dakota; Snyder and Neligh, Nebraska; and Ephrata, Pennsylvania. The ERV business met the accounting criteria for held for sale classification as of December 31, 2019. The results of the ERV business have been reclassified to Loss from discontinued operations, net of tax in the Consolidated Statements of Operations for the years ended December 31, 2019, 2018 and 2017.
The Loss from discontinued operations presented in the Consolidated Statement of Operations for the years ended December 31, 2019, 2018 and 2017:
|
Year Ended December 31, |
||||||||||||
|
2019 |
2018 |
2017 |
||||||||||
|
Sales |
$ | 261,860 | $ | 245,637 | $ | 302,850 | ||||||
|
Cost of products sold |
245,785 | 220,526 | 276,567 | |||||||||
|
Gross profit |
16,075 | 25,111 | 26,283 | |||||||||
|
Operating expenses |
28,864 | 31,516 | 29,461 | |||||||||
|
Operating loss |
(12,789 |
) |
(6,405 |
) |
(3,178 |
) |
||||||
| Loss on asset impairments | 53,131 | - | - | |||||||||
|
Other income (expense) |
1,021 | 2,228 | (651 | ) | ||||||||
|
Loss from discontinued operations before taxes |
(64,899 |
) |
(4,177 |
) |
(3,829 |
) |
||||||
|
Income tax benefit |
15,683 | 1,073 | 2,292 | |||||||||
|
Net loss from discontinued operations |
$ | (49,216 |
) |
$ | (3,104 |
) |
$ | (1,537 | ) | |||
In the annual goodwill and intangible assets impairment test as of October 1, 2019, we determined that the fair value of our ERV business and Smeal trade name were less than their carrying values due to under-performance in 2019 which was expected to continue in future periods. As a result, we recorded impairment expense of $13,856 to write off the goodwill and indefinite lived intangible assets. In conjunction with the classification of the ERV business as held for sale as of December 31, 2019, we recorded a loss of $39,275 to write down the carrying values of the associated assets and liabilities to their fair values less estimated costs to sell of $3,604. The assets and liabilities of the discontinued operations are presented separately under the captions “Current assets held for sale”, “Noncurrent assets held for sale” and “Current liabilities held for sale” in the Consolidated Balance Sheets as of December 31, 2019 and 2018.
SPARTAN MOTORS, INC. AND SUBSIDIARIES
NOTES TO CONSOLIDATED FINANCIAL STATEMENTS
(Dollar amounts in thousands, except per share data)
|
December 31, |
December 31, |
|||||||
| 2019 (1) | 2018 (1) | |||||||
|
Assets: |
||||||||
|
Accounts receivable, net |
$ | 30,760 | $ | 38,792 | ||||
|
Contract assets |
36,740 | 26,798 | ||||||
|
Inventories |
32,329 | 30,779 | ||||||
|
Other current assets |
1,142 | 1,118 | ||||||
|
Property, plant and equipment, |
21,967 | 24,082 | ||||||
|
Right of use assets – operating leases |
5,960 | - | ||||||
|
Goodwill |
- | 11,456 | ||||||
|
Intangible assets |
1,050 | 3,600 | ||||||
|
Other noncurrent assets |
52 | 52 | ||||||
| Impairment of carrying value | (39,275 | ) | - | |||||
|
Total assets held for sale |
$ | 90,725 | $ | 136,677 | ||||
| December 31, | December 31, | |||||||
| 2019(1) | 2018(1) | |||||||
|
Liabilities: |
||||||||
|
Accounts payable |
4,213 | 3,015 | ||||||
|
Accrued warranty |
11,347 | 11,683 | ||||||
|
Accrued compensation and related taxes |
3,047 | 2,842 | ||||||
|
Deposits from customers |
21,409 | 21,761 | ||||||
|
Operating lease liability |
727 | - | ||||||
|
Other current liabilities |
3,495 | 3,776 | ||||||
|
Long-term operating lease liability |
5,363 | - | ||||||
|
Total liabilities held for sale |
$ | 49,601 | $ | 43,077 | ||||
|
(1) As of December 31, 2019, assets and liabilities held for sale were classified as current. As of December 31, 2018, current and noncurrent assets held for sale were $97,487 and $39,190, respectively, and current liabilities held for sale was $43,077. |
||||||||
Total depreciation and amortization and capital expenditures for the discontinued operations for the years ended December 31, 2019, 2018 and 2017:
|
Year Ended December 31, |
||||||||||||
|
2019 |
2018 |
2017 |
||||||||||
|
Depreciation and amortization |
$ | 5,106 | $ | 4,156 | $ | 3,905 | ||||||
|
Capital expenditures |
$ | 2,431 | $ | 4,332 | $ | 1,364 | ||||||
NOTE 3 – ACQUISITION ACTIVITIES
2019 Acquisition
On September 9, 2019, the Company completed the acquisition of Fortress Resources, LLC D/B/A Royal Truck Body (“Royal”) pursuant to which the Company acquired all the outstanding equity interests of Royal. The Company paid $89,369 in cash. The purchase price is subject to certain customary post-closing adjustments. The acquisition was financed using $89,369 borrowed from our existing $175,000 line of credit, as set forth in the Second Amended and Restated Credit Agreement, dated as of August 8, 2018. Included in our results since the September 9, 2019 acquisition are net sales of $17,073 and operating income of $2,382 for the year ended December 31, 2019.
SPARTAN MOTORS, INC. AND SUBSIDIARIES
NOTES TO CONSOLIDATED FINANCIAL STATEMENTS
(Dollar amounts in thousands, except per share data)
Royal is a leading California-based designer, manufacturer and installer of service truck bodies and accessories. Royal manufactures and assembles truck body options for various trades, service truck bodies, stake body trucks, contractor trucks, and dump bed trucks. Royal is the largest service body company in the western United States with its principal facility in Carson, California. Royal has additional manufacturing, assembly, and service space in branch locations in Union City and Roseville, California; Mesa, Arizona; and Dallas and Weatherford, Texas. This acquisition allows us to quickly expand our footprint in the western United States supporting our strategy of coast-to-coast manufacturing and distribution. Royal is part of our Specialty Chassis & Vehicle segment.
During the year ended 2019, we recorded pretax charges totaling $1,691 for legal expenses and other transaction costs related to the acquisition. These charges, which were expensed in accordance with the accounting guidance for business combinations, were recorded in “Selling, general and administrative” and reflected within the “Eliminations and Other” column in the business segment table in "Note 18 – Business Segments."
Purchase Price Allocation
This acquisition was accounted for using the acquisition method of accounting with the purchase price allocated to the assets purchased and liabilities assumed based upon their estimated fair values at the date of acquisition. Identifiable intangible assets include customer relationships, trade names and trademarks, patented technology and non-competition agreements. The preliminary excess of the purchase price over the estimated fair values of the net tangible and intangible assets acquired of $27,476 was recorded as goodwill, which is expected to be deductible for tax purposes. The preliminary goodwill recognized is subject to a final net working capital adjustment.
The fair value of the net assets acquired was based on a preliminary valuation and the estimates and assumptions are subject to change within the measurement period. The Company is working with the buyer to finalize the working capital adjustments which may impact goodwill. The Company will finalize the purchase price allocation as soon as practicable within the measurement period, but in no event later than one year following the acquisition date.
The preliminary allocation of purchase price to assets acquired and liabilities assumed was as follows:
|
Cash and cash equivalents |
$ | 431 | ||
|
Accounts receivable, less allowance |
5,019 | |||
|
Contract assets |
1,499 | |||
|
Inventory |
6,453 | |||
|
Other receivables – chassis pool agreements |
10,424 | |||
|
Property, plant and equipment, net |
4,980 | |||
|
Right of use assets-operating leases |
12,767 | |||
|
Intangible assets |
47,150 | |||
|
Goodwill |
27,476 | |||
|
Total assets acquired |
116,199 | |||
|
Accounts payable |
1,658 | |||
|
Customer prepayments |
255 | |||
|
Accrued warranty |
98 | |||
|
Operating lease liabilities |
1,693 | |||
|
Accrued compensation and related taxes |
569 | |||
|
Other current liabilities and accrued expenses |
30 | |||
|
Short-term debt – chassis pool agreements |
10,424 | |||
|
Long-term operating lease liability |
11,074 | |||
|
Long-term debt, less current portion |
1,029 | |||
|
Total liabilities assumed |
26,830 | |||
|
Total purchase price |
$ | 89,369 |
SPARTAN MOTORS, INC. AND SUBSIDIARIES
NOTES TO CONSOLIDATED FINANCIAL STATEMENTS
(Dollar amounts in thousands, except per share data)
Goodwill Assigned
Intangible assets totaling $47,150 have provisionally been assigned to customer relationships, trade names and trademarks, patented technology and non-competition agreements as a result of the acquisition and consist of the following (in thousands):
|
Amount |
Useful Life (in years) |
|||||
|
Customer relationships |
$ | 30,000 |
15 |
|||
|
Trade names and trademarks |
13,000 |
Indefinite |
||||
|
Patented technology |
2,200 |
8 |
||||
|
Non-competition agreements |
1,950 |
5 |
||||
| $ | 47,150 | |||||
The Company amortizes the customer relationships utilizing an accelerated approach and patented technology and non-competition agreements assets utilizing a straight-line approach. Amortization expense, including the intangible assets preliminarily recorded from the Royal acquisition, is $666 for 2019, and estimated to be $2,665, $2,665, $3,162, and $3,072 for the years 2020 through 2023, respectively.
Goodwill consists of operational synergies that are expected to be realized in both the short and long-term and the opportunity to enter into new markets which will enable us to increase value to our customers and shareholders. Key areas of expected cost savings include an expanded dealer network, complementary product portfolios and manufacturing and supply chain work process improvements.
Pro Forma Results (Unaudited)
The following table provides unaudited pro forma net sales and results of operations for the years ended December 31, 2019 and 2018. The unaudited pro forma results reflect certain adjustments related to the acquisition, such as changes in the depreciation and amortization expense on the Royal assets acquired resulting from the fair valuation of assets acquired, expenses incurred to complete the acquisition and the impact of acquisition financing. The pro forma results do not include any anticipated cost synergies or other effects of the planned integration of Royal. Accordingly, such pro forma amounts are not necessarily indicative of the results that would have occurred nor are they indicative of the future operating results of the combined company.
|
Year ended December 31, |
||||||||
|
2019 |
2018 |
|||||||
|
Pro forma results of operations from continuing operations |
||||||||
|
Net sales |
$ | 789,585 | $ | 612,337 | ||||
|
Net income |
$ | 36,760 | $ | 19,158 | ||||
|
Diluted earnings per share |
$ | 1.04 | $ | 0.54 | ||||
2018 Acquisition
On December 17, 2018, the Company acquired the assets and assumed certain liabilities of Strobes-R-Us, Inc. through the Company’s majority-owned subsidiary, Spartan Upfit Services, Inc. dba Strobes-R-Us (“SRUS”). SRUS is a premier provider of upfit services for government and non-government vehicles. The acquisition enables the Company to increase its product offerings to fleet customers, while further expanding its manufacturing capabilities into the southeastern U.S. market. As part of this acquisition, Spartan acquired Strobes-R-Us’ state-of-the-art upfit facility and product showroom in Pompano Beach, Florida.
Purchase Price Allocation
The total purchase price paid for our acquisition of SRUS was $7,032 consisting of $5,200 in cash, plus a $1,832 contingency for performance-based earn-out payments.
This acquisition was accounted for using the acquisition method of accounting, which requires the purchase price to be allocated to the assets purchased and liabilities assumed based upon their estimated fair values at the date of acquisition. The excess of the estimated purchase price over the preliminary estimated fair values of the net tangible and intangible assets acquired of $195 was recorded as goodwill. During 2019, we made certain adjustments to our purchase price allocation related to the deferred tax asset, stock compensation, identified intangible assets, step-up valuation of fixed assets, and a revaluation of contingent consideration, which resulted in a $6,211 decrease in goodwill. The Company has finalized the purchase price allocation within the measurement period, which was to occur no later than one year following the acquisition date.
SPARTAN MOTORS, INC. AND SUBSIDIARIES
NOTES TO CONSOLIDATED FINANCIAL STATEMENTS
(Dollar amounts in thousands, except per share data)
The allocation of purchase price to assets acquired and liabilities assumed was as follows:
|
Accounts receivable |
$ | 1,165 | ||
|
Inventory |
893 | |||
|
Other current assets |
3 | |||
|
Property, plant and equipment |
1,911 | |||
|
Other Assets |
192 | |||
|
Intangible assets |
3,100 | |||
|
Goodwill |
195 | |||
|
Total assets acquired |
7,459 | |||
|
Accounts payable |
382 | |||
|
Other current liabilities |
45 | |||
|
Total liabilities assumed |
427 | |||
|
Total purchase price |
$ | 7,032 |
Contingent Consideration
Pursuant to the purchase agreement, the former owners of the SRUS business may receive additional consideration through 2021 in the form of certain performance-based earn-out payments, up to an aggregate maximum of $3,250. The purchase agreement specifies annual payments for each calendar year beginning in 2019 through and including 2021 contingent upon earnings for that calendar year exceeding predetermined thresholds. In accordance with accounting guidance for business combinations, at the date of sale the Company recorded a contingent liability of $1,832 for the value of the future consideration, which is ultimately its best estimate of the likelihood of the payments discounted to their present value.
NOTE 4 – REVENUE
Contract Assets and Liabilities
The tables below disclose changes in contract assets and liabilities as of the periods indicated.
|
December 31, 2019 |
December 31, 2018 |
|||||||
|
Contract Assets |
||||||||
|
Contract assets, beginning of year |
$ | 9,229 | $ | 5,200 | ||||
|
Reclassification of the beginning contract assets to receivables, as the result of rights to consideration becoming unconditional |
(9,229 |
) |
(5,200 |
) |
||||
|
Contract assets recognized, net of reclassification to receivables |
10,898 | 9,229 | ||||||
|
Contract assets, end of year |
10,898 | 9,229 | ||||||
|
Contract Liabilities |
||||||||
|
Contract liabilities, beginning of year |
871 | 201 | ||||||
|
Reclassification of the beginning contract liabilities to revenue, as the result of performance obligations satisfied |
(871 |
) |
(201 |
) |
||||
|
Cash received in advance and not recognized as revenue |
2,640 | 871 | ||||||
|
Contract liabilities, end of year |
2,640 | 871 | ||||||
The aggregate amount of the transaction price allocated to remaining performance obligations in existing contracts that are yet to be completed in the Fleet Vehicles and Services ("FVS") and Specialty Chassis and Vehicles ("SCV") segments are $305,796 and $30,777, respectively, with substantially all revenue expected to be recognized within one year as of December 31, 2019.
SPARTAN MOTORS, INC. AND SUBSIDIARIES
NOTES TO CONSOLIDATED FINANCIAL STATEMENTS
(Dollar amounts in thousands, except per share data)
In the following tables, revenue is disaggregated by primary geographical market and timing of revenue recognition for the years ended December 31, 2019, 2018 and 2017. The tables also include a reconciliation of the disaggregated revenue with the reportable segments.
|
Year Ended December 31, 2019 |
||||||||||||||||||||
|
FVS |
SCV |
Total Reportable Segments |
Other |
Total |
||||||||||||||||
|
Primary geographical markets |
||||||||||||||||||||
|
United States |
$ | 554,691 | $ | 185,768 | $ | 740,459 | $ | (5,278 |
) |
$ | 735,181 | |||||||||
|
Other |
21,203 | 158 | 21,361 | - | 21,361 | |||||||||||||||
|
Total sales |
$ | 575,894 | $ | 185,926 | $ | 761,820 | $ | (5,278 |
) |
$ | 756,542 | |||||||||
|
Timing of revenue recognition |
||||||||||||||||||||
|
Products transferred at a point in time |
$ | 164,437 | $ | 137,894 | $ | 302,331 | $ | (5,278 |
) |
$ | 297,053 | |||||||||
|
Products and services transferred over time |
411,457 | 48,032 | 459,489 | - | 459,489 | |||||||||||||||
|
Total sales |
$ | 575,894 | $ | 185,926 | $ | 761,820 | $ | (5,278 |
) |
$ | 756,542 | |||||||||
|
Year Ended December 31, 2018 |
||||||||||||||||||||
|
FVS |
SCV |
Total Reportable Segments |
Other |
Total |
||||||||||||||||
|
Primary geographical markets |
||||||||||||||||||||
|
United States |
$ | 367,730 | $ | 191,814 | $ | 559,544 | $ | (10,221 |
) |
$ | 549,323 | |||||||||
|
Other |
19,819 | 1,385 | 21,204 | - | 21,204 | |||||||||||||||
|
Total sales |
$ | 387,549 | $ | 193,199 | $ | 580,748 | $ | (10,221 |
) |
$ | 570,527 | |||||||||
|
Timing of revenue recognition |
||||||||||||||||||||
|
Products transferred at a point in time |
$ | 113,576 | $ | 160,408 | $ | 273,984 | $ | (10,221 |
) |
$ | 263,763 | |||||||||
|
Products and services transferred over time |
273,973 | 32,791 | 306,764 | - | 306,764 | |||||||||||||||
|
Total sales |
$ | 387,549 | $ | 193,199 | $ | 580,748 | $ | (10,221 |
) |
$ | 570,527 | |||||||||
SPARTAN MOTORS, INC. AND SUBSIDIARIES
NOTES TO CONSOLIDATED FINANCIAL STATEMENTS
(Dollar amounts in thousands, except per share data)
|
Year Ended December 31, 2017 |
||||||||||||||||||||
|
FVS |
SCV |
Total Reportable Segments |
Other |
Total |
||||||||||||||||
|
Primary geographical markets |
||||||||||||||||||||
|
United States |
$ | 238,267 | $ | 158,246 | $ | 396,513 | $ | (5,657 |
) |
$ | 390,856 | |||||||||
|
Other |
12,828 | 564 | 13,392 | - | 13,392 | |||||||||||||||
|
Total sales |
$ | 251,095 | $ | 158,810 | $ | 409,905 | $ | (5,657 |
) |
$ | 404,248 | |||||||||
|
Timing of revenue recognition |
||||||||||||||||||||
|
Products transferred at a point in time |
$ | 251,095 | $ | 158,810 | $ | 409,905 | $ | (5,657 |
) |
$ | 404,248 | |||||||||
|
Products and services transferred over time |
- | - | - | - | - | |||||||||||||||
|
Total sales |
$ | 251,095 | $ | 158,810 | $ | 409,905 | $ | (5,657 |
) |
$ | 404,248 | |||||||||
NOTE 5 – INVENTORIES
Inventories are summarized as follows:
|
December 31, |
||||||||
|
2019 |
2018 |
|||||||
|
Finished goods |
$ | 4,764 | $ | 5,347 | ||||
|
Work in process |
1,773 | 2,190 | ||||||
|
Raw materials and purchased components |
57,679 | 33,418 | ||||||
|
Reserve for slow-moving inventory |
(4,760 |
) |
(1,742 |
) |
||||
|
Total Inventory |
$ | 59,456 | $ | 39,213 | ||||
NOTE 6 – RESTRUCTURING CHARGES
We have incurred restructuring charges for a company-wide initiative to streamline operations. Restructuring charges included in our Consolidated Statements of Operations for the years ended December 31, 2019, 2018 and 2017, broken down by segment, are as follows:
| December 31, | ||||||||||||
|
|
|
2019 |
|
|
2018 |
|
|
2017 |
|
|||
|
FVS |
|
$ |
- |
|
|
$ |
- |
|
|
$ |
644 |
|
|
SCV |
|
|
82 |
|
|
|
180 |
|
|
|
109 |
|
|
Other |
|
|
- |
|
|
|
482 |
|
|
|
45 |
|
|
Total restructuring charges |
|
$ |
82 |
|
|
$ |
662 |
|
|
$ |
798 |
|
The following table summarizes the compensation related charges incurred under these initiatives through year ended December 31, 2019. The accrual balance for severance is reflected within Accrued compensation and related taxes on our Consolidated Balance Sheets.
|
Severance 2019 |
Severance 2018 |
|||||||
|
Accrual balance January 1, |
$ | 199 | $ | 12 | ||||
|
Accrual for severance |
- | 665 | ||||||
|
Payments and adjustments made in period |
(199 |
) |
(478 |
) |
||||
|
Accrual balance December 31, |
$ | - | $ | 199 | ||||
SPARTAN MOTORS, INC. AND SUBSIDIARIES
NOTES TO CONSOLIDATED FINANCIAL STATEMENTS
(Dollar amounts in thousands, except per share data)
NOTE 7 – GOODWILL AND INTANGIBLE ASSETS
Goodwill
We test goodwill for impairment at the reporting unit level on an annual basis as of October 1, or whenever an event or change in circumstances occurs that would more likely than not reduce the fair value of a reporting unit below its carrying amount. See “Goodwill and Other Intangible Assets” within "Note 1– General and Summary of Accounting Policies" for a description of our accounting policies regarding goodwill and other intangible assets.
As described in "Note 3 – Acquisition Activities" at December 31, 2019 and 2018, we had recorded goodwill at our Fleet Vehicles and Services and Specialty Chassis and Vehicles reportable segments. The FVS and SCV segments were determined to be reporting units for goodwill impairment testing. The goodwill recorded in these reporting units was evaluated for impairment as of October 1, 2019 using a discounted cash flow valuation, and it was determined that the estimated fair values of our Fleet Vehicles and Services, and Specialty Chassis and Vehicles reporting units exceeded their carrying values by 337% and 67%, respectively, as of October 1, 2019.
As discussed in "Note 1 – General and Summary of Accounting Policies" there are significant judgments inherent in our impairment assessments and discounted cash flow analyses. These discounted cash flow analyses are most sensitive to the WACC assumption.
The change in the carrying amount of goodwill for the year ended December 31, 2019 and 2018 were as follows (in thousands):
| FVS | SCV | Total | |||||||||||||||||||||
| December 31, | December 31, | December 31, | |||||||||||||||||||||
| 2019 | 2018 | 2019 | 2018 | 2019 | 2018 | ||||||||||||||||||
| Goodwill, beginning of year | $ | 21,729 | $ | 15,323 | $ | 638 | $ | 638 | $ | 22,367 | $ | 15,961 | |||||||||||
| Acquisition and measurement period adjustments | (6,211 | ) | 6,406 | 27,476 | - | 21,265 | 6,406 | ||||||||||||||||
| Goodwill, end of year | $ | 15,518 | $ | 21,729 | $ | 28,114 | $ | 638 | $ | 43,632 | $ |
22,367 |
|||||||||||
Other Intangible Assets
At December 31, 2019, we had other intangible assets associated with our FVS segment, including customer and dealer relationships, non-compete agreements, an acquired product development project and trade names. The non-compete agreement, acquired product development project and certain other intangible assets are being amortized over their expected remaining useful lives based on the pattern of estimated after-tax operating income generated, or on a straight-line basis. Our Utilimaster and Strobes-R-Us trade names have an indefinite life and are not amortized.
At December 31, 2019, we had other intangible assets associated with our SCV segment, including customer relationships, trade names and trademarks, patented technology and non-competition agreements. We amortize the customer relationships utilizing an accelerated approach over an estimated remaining life of 15 years. Patented technology and non-competition agreements are amortized utilizing a straight-line approach over the estimated useful lives of eight years and five years, respectively. The Royal trade names and trademarks are considered to have indefinite lives and are not amortized
SPARTAN MOTORS, INC. AND SUBSIDIARIES
NOTES TO CONSOLIDATED FINANCIAL STATEMENTS
(Dollar amounts in thousands, except per share data)
We evaluate the recoverability of our indefinite lived intangible assets, which, as of October 1, 2019, consisted of our Utilimaster, Strobes-R-Us and Royal trade names, by comparing the estimated fair value of the trade names with their carrying values. We estimate the fair value of our trade names based on estimates of future royalty payments that are avoided through our ownership of the trade name, discounted to their present value. In determining the estimated fair value of the trade names, we consider current and projected future levels of sales based on our plans for these trade name branded products, business trends, prospects and market and economic conditions. Because the evaluation of Royal’s intangible assets including the trade name was assessed as of September 9, 2019, and this amount was determined to approximate the fair value as of October 1, 2019, updated testing was not performed nor was deemed necessary. The fair value of our Utilimaster and Strobes-R-Us trade names exceeded their carrying values, and therefore do not result in an impairment
The following table provides information regarding our other intangible assets:
|
As of December 31, 2019 |
As of December 31, 2018 |
|||||||||||||||||||||||
|
Gross carrying amount |
Accumulated amortization |
Net |
Gross carrying amount |
Accumulated amortization |
Net |
|||||||||||||||||||
|
Customer relationships |
$ | 37,570 | $ | 4,943 | $ | 32,627 | $ | 6,170 | $ | 4,029 | $ | 2,141 | ||||||||||||
|
Acquired product development project |
1,860 | 1,860 | - | 1,860 | 1,860 | - | ||||||||||||||||||
|
Patented technology |
2,200 | 69 | 2,131 | - | - | - | ||||||||||||||||||
|
Non-compete agreements |
2,950 | 617 | 2,333 | 400 | 400 | - | ||||||||||||||||||
|
Backlog |
320 | 320 | - | 320 | 320 | - | ||||||||||||||||||
|
Trade Names |
16,970 | - | 16,970 | 2,870 | - | 2,870 | ||||||||||||||||||
| $ | 61,870 | $ | 7,809 | $ | 54,061 | $ | 11,620 | $ | 6,609 | $ | 5,011 | |||||||||||||
We recorded $1,200, $320 and $683 of intangible asset amortization expense during 2019, 2018 and 2017.
The estimated remaining amortization associated with finite-lived intangible assets is expected to be expensed as follows:
|
Amount |
||||
|
2020 |
$ | 3,151 | ||
|
2021 |
3,127 | |||
|
2022 |
3,624 | |||
|
2023 |
3,511 | |||
|
2024 |
3,181 | |||
|
Thereafter |
20,496 | |||
|
Total |
$ | 37,090 | ||
NOTE 8 – PROPERTY, PLANT AND EQUIPMENT
Property, plant and equipment are summarized by major classifications as follows:
|
December 31, |
||||||||
|
2019 |
2018 |
|||||||
|
Land and improvements |
$ | 8,692 | $ | 7,791 | ||||
|
Buildings and improvements |
38,653 | 36,087 | ||||||
|
Plant machinery and equipment |
33,348 | 27,267 | ||||||
|
Furniture and fixtures |
21,416 | 19,947 | ||||||
|
Vehicles |
1,872 | 1,558 | ||||||
|
Construction in process |
3,527 | 1,157 | ||||||
|
Subtotal |
107,508 | 93,807 | ||||||
|
Less accumulated depreciation |
(67,434 |
) |
(61,322 |
) |
||||
|
Total property, plant and equipment, net |
$ | 40,074 | $ | 32,485 | ||||
We recorded depreciation expense of $5,892, $6,393 and $5,994 during 2019, 2018 and 2017. There were no capitalized interest costs in 2019 or 2018.
SPARTAN MOTORS, INC. AND SUBSIDIARIES
NOTES TO CONSOLIDATED FINANCIAL STATEMENTS
(Dollar amounts in thousands, except per share data)
NOTE 9 – LEASES
We have operating and finance leases for land, buildings and certain equipment. Our leases have remaining lease terms of one year to 17 years, some of which include options to extend the leases for up to 10 years. Our leases do not contain residual value guarantees. As of December 31, 2019, assets recorded under finance leases were immaterial (See "Note 14 – Debt"). Lease expense totaled $4,146, $2,794 and $2,196 for the years ended December 31, 2019, 2018 and 2017.
Operating lease expenses are classified as cost of products sold and operating expenses on the Consolidated Statements of Operations. The components of lease expense were as follows:
|
Year ended December 31, 2019 |
||||
|
Operating leases |
$ | 3,928 | ||
|
Short-term leases(1) |
218 | |||
|
Total lease expense |
$ | 4,146 | ||
|
(1) Includes expenses for month-to-month equipment leases, which are classified as short-term as the Company is not reasonably certain to renew the lease term beyond one month. |
The weighted average remaining lease term and weighted average discount rate were as follows:
|
Year ended December 31, 2019 |
||||
|
Weighted average remaining lease term of operating leases (in years) |
8.4 | |||
|
Weighted average discount rate of operating leases |
3.8 | % | ||
Supplemental cash flow information related to leases was as follows:
|
Year ended December 31, 2019 |
||||
|
Cash paid for amounts included in the measurement of lease liabilities: |
||||
|
Operating cash flow for operating leases |
$ | 4,544 | ||
| Right of use assets obtained in exchange for lease obligations: | ||||
|
Operating leases |
$ | 10,493 | ||
|
Finance leases |
$ | - | ||
Maturities of operating lease liabilities as of December 31, 2019 are as follows:
|
Years ending December 31: |
||||
|
2020 |
$ | 5,937 | ||
|
2021 |
5,054 | |||
|
2022 |
4,614 | |||
|
2023 |
4,619 | |||
|
2024 |
4,390 | |||
|
Thereafter |
13,337 | |||
|
Total lease payments |
37,951 | |||
|
Less: imputed interest |
5,622 | |||
|
Total lease liabilities |
$ | 32,329 |
SPARTAN MOTORS, INC. AND SUBSIDIARIES
NOTES TO CONSOLIDATED FINANCIAL STATEMENTS
(Dollar amounts in thousands, except per share data)
NOTE 10 – TAXES ON INCOME
Income taxes consist of the following:
| Year Ended December 31, | ||||||||||||
| 2019 | 2018 | 2017 | ||||||||||
| Taxes on income from continuing operations | $ | 10,355 | $ | 3,334 | $ | 2,382 | ||||||
| Income tax benefits from discontinued operations | (15,683 | ) | (1,073 | ) | (2,292 | ) | ||||||
| Total taxes on income | $ | (5,328 | ) | $ | 2,261 | $ | 90 | |||||
Income taxes from continuing operations consist of the following:
|
Year Ended December 31, |
||||||||||||
|
2019 |
2018 |
2017 |
||||||||||
|
Current (benefit): |
||||||||||||
|
Federal |
$ | 9,883 | $ | 2,819 | $ | 5,831 | ||||||
|
State |
1,664 | 758 | 240 | |||||||||
|
Foreign |
128 | 67 | - | |||||||||
|
Total current |
11,675 | 3,644 | 6,071 | |||||||||
|
Deferred (benefit): |
||||||||||||
|
Federal |
(705 |
) |
(316 |
) |
(1,333 |
) |
||||||
|
State |
(615 |
) |
6 |
|
(2,356 | ) | ||||||
|
Total deferred |
(1,320 |
) |
(310 |
) |
(3,689 |
) |
||||||
|
Total taxes on income |
$ | 10,355 | $ | 3,334 | $ | 2,382 | ||||||
On December 22, 2017, the Tax Cuts and Jobs Act (the “Tax Act”) was enacted. The Tax Act made broad and complex changes to the U.S. tax code that impacted the Company, most notably a reduction of the U.S. corporate income tax rate from 35 percent to 21 percent for tax years beginning after December 31, 2017. Other changes provided by the 2017 Tax Act included, but are not limited to, the acceleration of depreciation for certain assets placed into service after September 27, 2017, additional limitations on executive compensation, the repeal of the domestic manufacturing deduction and the new foreign derived intangible income deduction.
The SEC staff issued Staff Accounting Bulletin No. 118 (“SAB 118”), which provided guidance on accounting for the tax effects of the Tax Act. We recognized the income tax effects of the Tax Act in our 2017 financial statements in accordance with SAB 118, in the reporting period in which the Tax Act was signed into law.
In accordance with SAB 118, we recorded a provisional amount of $2,963 of the deferred tax expense in connection with the re-measurement of certain deferred tax assets and liabilities as of December 31, 2017. In 2018 we completed the accounting for the effect of the 2017 Tax Act within the measurement period under the SEC guidance and reflected a net $373 decrease in the 2018 income tax expense.
SPARTAN MOTORS, INC. AND SUBSIDIARIES
NOTES TO CONSOLIDATED FINANCIAL STATEMENTS
(Dollar amounts in thousands, except per share data)
Differences between the expected income tax expense derived from applying the federal statutory income tax rate to earnings from continuing operations before taxes on income and the actual tax expense are as follows:
|
Year Ended December 31, |
||||||||||||||||||||||||
|
2019 |
2018 |
2017 |
||||||||||||||||||||||
|
Amount |
Percen- tage |
Amount |
Percen- tage |
Amount |
Percen- tage |
|||||||||||||||||||
|
Federal income taxes at the statutory rate |
$ | 9,901 | 21.0 |
% |
$ | 4,505 | 21.0 |
% |
$ | 6,949 | 35.0 |
% |
||||||||||||
|
State tax expense, net of federal income tax benefit |
577 | 1.2 | 486 | 2.3 | 416 | 2.1 | ||||||||||||||||||
|
Increase (decrease) in income taxes resulting from: |
||||||||||||||||||||||||
|
Deferred income tax re-measurement due to Tax Act |
- |
|
- |
|
(373 |
) |
(1.7 |
) |
2,963 | 14.9 | ||||||||||||||
|
Other deferred income tax adjustment |
(75 |
) |
(0.2 |
) |
13 |
|
- |
|
338 |
|
1.7 |
|
||||||||||||
|
Non-deductible compensation |
511 | 1.1 | - | - | - | - | ||||||||||||||||||
|
Other nondeductible expenses |
115 | 0.2 | 91 | 0.4 | 98 | 0.5 | ||||||||||||||||||
|
Foreign derived intangible income deduction |
(45 |
) |
(0.1 |
) |
(35 |
) |
(0.2 |
) |
- | - | ||||||||||||||
|
Domestic manufacturing deduction |
- | - | - | - | (465 |
) |
(2.3 |
) |
||||||||||||||||
|
Stock based compensation |
(136 |
) |
(0.3 |
) |
(1,207 |
) |
(5.6 |
) |
(381 |
) |
(1.9 |
) |
||||||||||||
|
Worthless stock deduction of dissolved subsidiary |
- | - | - | - | (966 |
) |
(4.9 |
) |
||||||||||||||||
|
Forfeiture of state net operating loss and credit carry-forwards from dissolution of subsidiary |
- | - | - | - | 3,039 | 15.3 | ||||||||||||||||||
|
Foreign tax expense |
128 | 0.3 | 67 | 0.3 | - | - | ||||||||||||||||||
|
Valuation allowance adjustment |
135 | 0.3 | 60 | 0.3 | (9,544 |
) |
(48.0 |
) |
||||||||||||||||
|
Unrecognized tax benefit adjustment |
(61 | ) | (0.1 | ) | 332 | 1.6 | 206 | 1.0 | ||||||||||||||||
|
Federal research and development |
(591 |
) |
(1.3 |
) |
(349 |
) |
(1.6 |
) |
(328 |
) |
(1.7 |
) |
||||||||||||
|
Foreign tax credit |
(38 |
) |
- |
|
(67 |
) |
(0.3 |
) |
- | - | ||||||||||||||
|
Other |
(66 | ) | (0.1 | ) | (189 | ) | (0.9 | ) | 57 |
|
0.3 |
|
||||||||||||
|
Total |
$ | 10,355 | 22.0 |
% |
$ | 3,334 | 15.6 |
% |
$ | 2,382 | 12.0 |
% |
||||||||||||
SPARTAN MOTORS, INC. AND SUBSIDIARIES
NOTES TO CONSOLIDATED FINANCIAL STATEMENTS
(Dollar amounts in thousands, except per share data)
Temporary differences which give rise to deferred income tax assets (liabilities) are as follows:
|
December 31, |
||||||||
|
2019 |
2018 |
|||||||
|
Deferred income tax assets: |
||||||||
| Loss on asset impairment for discontinued operations | $ | 12,764 | $ | - | ||||
|
Warranty reserve |
3,782 | 3,257 | ||||||
|
Inventory costs and reserves |
2,661 | 1,801 | ||||||
|
Contract assets |
7,217 | 1,694 | ||||||
|
Stock-based compensation |
1,195 | 984 | ||||||
|
Net operating loss carry-forwards, net of federal income tax benefit |
449 | 723 | ||||||
|
Compensation related accruals |
698 | 589 | ||||||
|
Credit carry-forwards net of federal income tax benefit |
1,027 | 506 | ||||||
|
Other |
916 | 611 | ||||||
|
Total deferred income tax assets |
$ | 30,709 | $ | 10,165 | ||||
|
Deferred income tax liabilities: |
||||||||
|
Depreciation |
$ | (2,666 |
) |
$ | (1,479 |
) |
||
|
Intangible assets |
(1,974 |
) |
(1,205 |
) |
||||
|
Prepaid expenses |
(295 |
) |
(222 |
) |
||||
|
Total deferred income tax liabilities |
$ | (4,935 |
) |
$ | (2,906 |
) |
||
|
Net deferred income tax assets |
$ | 25,774 | $ | 7,259 | ||||
|
Valuation allowance |
(254 |
) |
(118 |
) |
||||
|
Net deferred tax asset |
$ | 25,520 | $ | 7,141 | ||||
Based upon an assessment of the available positive and negative evidence at December 31, 2019, the net deferred tax asset is more likely than not to be realized based on the consideration of deferred tax liability reversals and future taxable income. The valuation allowance for net deferred income tax assets relates to the impact of the limitation on executive compensation deductibility to Stock based compensation, and a state net operating loss carryforward.
At December 31, 2019 and 2018, we had state deferred income tax assets related to state tax net operating loss carry-forwards, of $569 and $915, which begin expiring in 2020. Also, as of December 31, 2019 and 2018, we had deferred income tax assets related to state tax credit carry-forwards of $1,300 and $640, which begin expiring in 2021. Due to accumulated losses in a certain state jurisdiction, we had recorded valuation allowances against certain deferred income tax assets of $0 and $20 at December 31, 2019 and 2018.
SPARTAN MOTORS, INC. AND SUBSIDIARIES
NOTES TO CONSOLIDATED FINANCIAL STATEMENTS
(Dollar amounts in thousands, except per share data)
A reconciliation of the change in the unrecognized tax benefits (“UTB”) for the three years ended December 31, 2019, 2018 and 2017 is as follows:
|
2019 |
2018 |
2017 |
||||||||||
|
Balance at January 1, |
$ | 827 | $ | 565 | $ | 345 | ||||||
|
Increase (decrease) related to prior year tax positions |
103 | 35 | 168 | |||||||||
|
Increase related to current year tax positions |
578 | 319 | 118 | |||||||||
|
Expiration of statute |
(238 |
) |
(92 |
) |
(66 |
) |
||||||
|
Balance at December 31, |
$ | 1,270 | $ | 827 | $ | 565 | ||||||
As of December 31, 2019, we had an ending UTB balance of $1,270 along with $213 of interest and penalties, for a total liability of $1,483 recorded as a non-current liability. The change in interest and penalties amounted to a decrease of $209 in 2019, and increases of $143 in 2018, and $94 in 2017, which were reflected in Income tax expense within our Consolidated Statements of Operations.
As of December 31, 2019, we are no longer subject to examination by federal taxing authorities for 2015 and earlier years.
We also file tax returns in several states and those jurisdictions remain subject to audit in accordance with relevant state statutes. These audits can involve complex issues that may require an extended period of time to resolve and may cover multiple years. To the extent we prevail in matters for which reserves have been established or are required to pay amounts in excess of our reserves, our effective income tax rate in a given fiscal period could be impacted. However, we do not expect such impacts to be material to our financial statements. An unfavorable tax settlement would require use of our cash and could result in an increase in our effective income tax rate in the period of resolution. A favorable tax settlement could result in a reduction in our effective income tax rate in the period of resolution. We do not expect the total amount of unrecognized tax benefits to significantly increase or decrease over the next twelve months.
NOTE 11 – TRANSACTIONS WITH MAJOR CUSTOMERS
Major customers are defined as those with sales greater than 10 percent of consolidated sales in a given year. We had certain customers whose sales individually represented 10% or more of the Company's total sales as follows:
| Year | Number of major customers | Combined percentage of consolidated sales | Segment | |||
| 2019 | 2 | 37.9 | % | FVS | ||
| 2018 | 4 | 51.7 | % | FVS and SCV | ||
| 2017 | 2 | 29.3 | % | SCV |
NOTE 12 – COMMITMENTS AND CONTINGENT LIABILITIES
Under the terms of our credit agreement with our banks, we have the ability to issue letters of credit totaling $20,000. We had outstanding letters of credit totaling $525 at December 31, 2019 and 2018 related to our worker's compensation insurance.
At December 31, 2019, we and our subsidiaries were parties, both as plaintiff and defendant, to a number of lawsuits and claims arising out of the normal course of our business. In the opinion of management, our financial position, future operating results or cash flows will not be materially affected by the final outcome of these legal proceedings.
Spartan-Gimaex Joint Venture
In February 2015, Spartan USA and Gimaex Holding, Inc. mutually agreed to begin discussions regarding the dissolution of the Spartan-Gimaex joint venture. In June 2015, Spartan USA and Gimaex Holding, Inc. entered into court proceedings to determine the terms of the dissolution. In February 2017, by agreement of the parties, the court proceeding was dismissed with prejudice and the judge entered an order to this effect as the parties agreed to seek a dissolution plan on their own. In late 2019, Spartan USA initiated additional court proceedings to dissolve and liquidate the joint venture, but no dissolution terms have been determined as of the date of this Form 10-K. Costs associated with the wind-down will be impacted by the final dissolution agreement. In accordance with accounting guidance, the costs we have accrued so far represent the low end of the range of the estimated total charges that we believe we may incur related to the wind-down. While we are unable to determine the final cost of the wind-down with certainty at this time, we may incur additional charges, depending on the final terms of the dissolution, and such charges are not expected to be material to our future operating results. We recorded charges totaling $216 to write down certain inventory items associated with this joint venture to their estimated fair values during the year ended December 31, 2019.
SPARTAN MOTORS, INC. AND SUBSIDIARIES
NOTES TO CONSOLIDATED FINANCIAL STATEMENTS
(Dollar amounts in thousands, except per share data)
Warranty Related
We provide limited warranties against assembly/construction defects. These warranties generally provide for the replacement or repair of defective parts or workmanship for a specified period following the date of sale. The end users also may receive limited warranties from suppliers of components that are incorporated into our chassis and vehicles.
Certain warranty and other related claims involve matters of dispute that ultimately are resolved by negotiation, arbitration or litigation. Infrequently, a material warranty issue can arise which is beyond the scope of our historical experience. We provide for any such warranty issues as they become known and are estimable. It is reasonably possible that additional warranty and other related claims could arise from disputes or other matters beyond the scope of our historical experience.
Changes in our warranty liability during the years ended December 31, 2019 and 2018 were as follows:
|
2019 |
2018 |
|||||||
|
Balance of accrued warranty at January 1 |
$ | 4,407 | $ | 4,340 | ||||
|
Provisions for current period sales |
4,383 | 2,537 | ||||||
|
Cash settlements |
(3,489 |
) |
(3,013 |
) |
||||
|
Changes in liability for pre-existing warranties |
295 | 543 | ||||||
|
Acquisitions |
98 | - | ||||||
|
Balance of accrued warranty at December 31 |
$ | 5,694 | $ | 4,407 | ||||
NOTE 13 – DEFINED CONTRIBUTION PLANS
We sponsor defined contribution retirement plans which cover all associates who meet length of service and minimum age requirements. Our matching contributions vest over 5 years and were $1,654, $1,606 and $676 in 2019, 2018 and 2017. These amounts are expensed as incurred.
NOTE 14 – DEBT
Short-term debt consists of the following:
|
December 31, |
December 31, |
|||||||
|
Chassis pool agreements |
$ | 8,162 | $ | - | ||||
|
Total short-term debt |
$ | 8,162 | $ | - | ||||
Chassis Pool Agreements
The Company obtains certain vehicle chassis for its walk-in vans, truck bodies and specialty vehicles directly from the chassis manufacturers under converter pool agreements. Chassis are obtained from the manufacturers based on orders from customers, and in some cases, for unallocated orders. The agreements generally state that the manufacturer will provide a supply of chassis to be maintained at the Company’s facilities with the condition that we will store such chassis and will not move, sell, or otherwise dispose of such chassis except under the terms of the agreement. In addition, the manufacturer typically retains the sole authority to authorize commencement of work on the chassis and to make certain other decisions with respect to the chassis including the terms and pricing of sales of the chassis to the manufacturer’s dealers. The manufacturer also does not transfer the certificate of origin to the Company nor permit the Company to sell or transfer the chassis to anyone other than the manufacturer (for ultimate resale to a dealer). Although the Company is party to related finance agreements with manufacturers, the Company has not historically settled, nor expects to in the future settle, any related obligations in cash. Instead, the obligation is settled by the manufacturer upon reassignment of the chassis to an accepted dealer, and the dealer is invoiced for the chassis by the manufacturer. Accordingly, as of December 31, 2019, the Company’s outstanding chassis converter pool with manufacturers totaled $8,162 and the Company has included this financing agreement on the Company’s Consolidated Balance Sheets within Other receivables – chassis pool agreements and Short-term debt – chassis pool agreements. Typically, chassis are converted and delivered to customers within 90 days of the receipt of the chassis by the Company. The chassis converter pool is a non-cash arrangement and is offsetting between current assets and current liabilities on the Company’s Consolidated Balance Sheets.
SPARTAN MOTORS, INC. AND SUBSIDIARIES
NOTES TO CONSOLIDATED FINANCIAL STATEMENTS
(Dollar amounts in thousands, except per share data)
Long-term debt consists of the following:
|
December 31, |
December 31, |
|||||||
|
Line of credit revolver (1): |
$ | 87,400 | $ | 25,460 | ||||
|
Finance lease obligations |
496 | 147 | ||||||
|
Other |
951 | - | ||||||
|
Total debt |
88,847 | 25,607 | ||||||
|
Less current portion of long-term debt |
(177 |
) |
(60 |
) |
||||
|
Total long-term debt |
$ | 88,670 | $ | 25,547 | ||||
|
(1) |
On August 8, 2018, we entered into a Credit Agreement (the "Credit Agreement") by and among us and certain of our subsidiaries as borrowers, Wells Fargo Bank, National Association ("Wells Fargo"), as administrative agent, and the lenders party thereto consisting of Wells Fargo, JPMorgan Chase Bank, N.A. and PNC Bank National Association (the "Lenders"). Subsequently, the Credit Agreement was amended on May 14, 2019, September 9, 2019 and September 25, 2019 and certain of our other subsidiaries executed guaranties guarantying the borrowers' obligations under the Credit Agreement.
As a result, at December 31, 2019, under the Credit Agreement, as amended, we may borrow up to $175,000 from the Lenders under a secured revolving credit facility which matures August 8, 2023. We may also request an increase in the facility of up to $50,000 in the aggregate, subject to customary conditions. The credit facility is also available for the issuance of letters of credit of up to $20,000 and swing line loans of up to $30,000, subject to certain limitations and restrictions. This revolving credit facility carries an interest rate of either (i) the highest of prime rate, the federal funds effective rate from time to time plus 0.5%, or the one month adjusted LIBOR plus 1.0%; or (ii) adjusted LIBOR, in each case plus a margin based upon our ratio of debt to earnings from time to time. The applicable borrowing rate including margin was 3.7500% (or one-month LIBOR plus 1.25%) at December 31, 2019. The credit facility is secured by security interests in, and liens on, all assets of the borrowers and guarantors, other than real property and certain other excluded assets.
Under the terms of our Credit Agreement, we have the ability to issue letters of credit totaling $20,000. At December 31, 2019 and 2018, we had outstanding letters of credit totaling $525 related to our worker's compensation insurance.
Under the terms of our Credit Agreement, we are required to maintain certain financial ratios and other financial covenants, which limited our available borrowings (exclusive of outstanding borrowings) under our line of credit to a total of approximately $60,499 and $86,410 at December 31, 2019 and 2018, respectively. The Credit Agreement also prohibits us from incurring additional indebtedness; limits certain acquisitions, investments, advances or loans; limits our ability to pay dividends in certain circumstances; and restricts substantial asset sales, all subject to certain exceptions and baskets. At December 31, 2019 and December 31, 2018, we were in compliance with all covenants in our credit agreement.
Concurrent with the close of the sale of the ERV business and effective January 31, 2020, the Credit Agreement was further amended by a fourth amendment, which released certain of our subsidiaries that were sold as part of the ERV business pursuant to the Asset Purchase Agreement. The substantive business terms of the Credit Agreement remain in place and were not changed by the fourth amendment. |
NOTE 15 – STOCK BASED COMPENSATION
We have stock incentive plans covering certain employees and non-employee directors. Shares reserved for stock awards under these plans total 2,856,250. Total shares remaining available for stock incentive grants under these plans totaled 1,412,446 at December 31, 2019. We are currently authorized to grant new stock options, restricted stock, restricted stock units, stock appreciation rights and performance stock units under our Stock Incentive Plan of 2016.
Restricted Stock
We issue restricted stock, at no cash cost, to our directors, officers and key employees. Shares awarded entitle the shareholder to all rights of common stock ownership except that the shares are subject to the risk of forfeiture and may not be sold, transferred, pledged, exchanged or otherwise disposed of during the vesting period, which is generally three to five years. The unearned stock-based compensation related to restricted stock awards, using the market price on the date of grant, is being amortized to compensation expense over the applicable vesting periods. Cash dividends are paid on unvested restricted stock grants and all such dividends vest immediately.
We receive an excess tax benefit or liability during the period the restricted shares vest. The excess tax benefit (liability) is determined by the excess (shortfall) of the market price of the stock on date of vesting over (under) the grant date market price used to amortize the awards to compensation expense. As required, any excess tax benefits or liabilities are reported in the Consolidated Statements of Cash Flows as operating cash flows.
SPARTAN MOTORS, INC. AND SUBSIDIARIES
NOTES TO CONSOLIDATED FINANCIAL STATEMENTS
(Dollar amounts in thousands, except per share data)
Restricted stock activity for the year ended December 31, 2019, is as follows:
|
Total (000) |
|
Weighted |
||||||||||
|
Non-vested shares outstanding at December 31, 2018 |
977 | $ | 7.97 | |||||||||
|
Granted |
279 | 9.38 | ||||||||||
|
Vested |
(467 |
) |
7.50 | |||||||||
|
Forfeited |
(78 |
) |
12.13 | |||||||||
|
Non-vested shares outstanding at December 31, 2019 |
711 | $ | 8.58 | 0.9 | ||||||||
The weighted-average grant date fair value of non-vested shares granted was $9.38, $9.96 and $7.65 for the years ended December 31, 2019, 2018 and 2017. During 2019, 2018 and 2017, we recorded compensation expense, net of cancellations, of $3,983, $4,027 and $3,536, related to restricted stock awards and direct stock grants. The total income tax benefit recognized in the Consolidated Statements of Operations related to restricted stock awards was $759, $846 and $1,238 for 2019, 2018 and 2017. For the years ended December 31, 2019, 2018 and 2017, restricted shares vested with a fair market value of $3,507, $4,318 and $1,356. As of December 31, 2019, we had unearned stock-based compensation of $3,413 associated with these restricted stock grants, which will be recognized over a weighted average of 1.1 years.
Performance Stock Units
During the year ended December 31, 2019, we granted 218,148 performance stock units ("PSUs") to certain employees, which are earned over a three-year service period.
After completion of the performance period, the number of performance units earned will be issued as shares of Common Stock. The aggregate number of shares of Common Stock that ultimately may be issued under performance units where the performance period has not been completed can range from 0% to 200% of the target amount. The awards will generally be forfeited if a participant leaves the Company for reasons other than retirement, disability or death
A dividend equivalent is calculated based on the actual number of units earned at the end of the performance period equal to the dividends that would have been payable on the earned units had they been held during the entire performance period as Common Stock. At the end of the performance period, the dividend equivalents are paid in the form of additional shares of Common Stock based on the then-current market value of the Common Stock.
87,260 of the performance units granted in 2019 are earned based on our three-year cumulative GAAP net income, subject to such adjustments as approved by the Company’s Human Resources and Compensation Committee in its sole discretion (Net Income PSUs), which is a performance condition. The number of shares that may be earned under the Net Income PSUs can range from 0% to 200% of the target amount. The Net Income PSUs are expensed and recorded in Additional paid-in capital on the Consolidated Balance Sheets over the performance period based on the probability that the performance condition will be met. The expense recorded will be adjusted as the estimate of the total number of Net Income PSUs that will ultimately be earned changes. The grant date fair value per share of Net Income PSUs granted was $8.99. The grant date fair value per unit is equal to the closing price of the Company’s stock on the date of grant.
130,888 of the performance units granted in 2019 are earned based on achievement of certain total shareholder return results relative to a comparison group of companies ("TSR PSUs"), which is a market condition. The number of shares that may be earned under the TSR PSUs can range from 0% to 200% of the target amount. The TSR PSUs are expensed and recorded in Additional paid-in capital on the Consolidated Balance Sheets over the performance period.
The fair value of the TSR PSUs was calculated using the Monte Carlo simulation model which resulted in the grant date fair value for these TSR PSUs of $13.71 per unit.
SPARTAN MOTORS, INC. AND SUBSIDIARIES
NOTES TO CONSOLIDATED FINANCIAL STATEMENTS
(Dollar amounts in thousands, except per share data)
The Monte Carlo simulation was computed using the following assumptions:
|
Three-year risk-free interest rate (1) |
2.37 | % | ||
|
Expected term (in years) |
2.7 | |||
|
Estimated volatility (2) |
53.7 | % |
|
(1) |
Based on the U.S. government bond benchmark on the grant date. |
|
(2) |
Represents the historical price volatility of the Company’s common stock for the three-year period preceding the grant date. |
The total PSU expense and associated tax benefit for all outstanding awards for the year ended December 31, 2019 was $642 and $93, respectively. There was no PSU expense or associated tax benefit in the years ended December 31, 2018 and 2017.
The PSU activity for the year ended December 31, 2019 is as follows:
|
Total |
Weighted- Average Grant Date Fair Value per Unit |
|||||||
|
Non-vested as of December 31, 2018 |
- | $ | - | |||||
|
Granted |
218,148 | 11.82 | ||||||
|
Non-vested as of December 31, 2019 |
218,148 | $ | 11.82 | |||||
As of December 31, 2019, there was $1,936 of remaining unrecognized compensation cost related to non-vested PSUs, which is expected to be recognized over a remaining weighted-average period of 2.0 years.
Restricted Stock Units
During the year ended December 31, 2019, we awarded 182,333 restricted stock units ("RSUs") to certain employees and Board members. These RSUs vest ratably over three years after the date of grant for employees and vest one year after date of grant for Board members, at which time the units will be issued as unrestricted shares of Common Stock. RSUs are expensed and recorded in Additional paid-in capital on the Consolidated Balance Sheets over the requisite service period based on the value of the underlying shares on the date of grant. At the time any RSUs vest and are settled through the issuance of Common Stock, the value of the dividends that would have been payable on the shares of Common Stock issued upon settlement of the vested RSUs had such shares been held during the entire vesting period will be paid to the employee or director in cash or, in the discretion of the Human Resources and Compensation Committee, in shares of Common Stock based on the then-current market value of the Common Stock.
The RSU expense and associated tax benefit for all outstanding awards for the year ended December 31, 2019 was $656 and $130, respectively. There was no RSU expense or associated tax benefit in the years ended December 31, 2018 and 2017.
As of December 31, 2019, there was $981 of remaining unrecognized compensation cost related to non-vested RSUs, which is expected to be recognized over a weighted-average period of 1.2 years.
The RSU activity for the year ended December 31, 2019 is as follows:
|
Total |
Weighted- Average Grant Date Fair Value per Unit |
|||||||
|
Non-vested as of December 31, 2018 |
- | $ | - | |||||
|
Granted |
182,333 | 8.98 | ||||||
|
Non-vested as of December 31, 2019 |
182,333 | $ | 8.98 | |||||
Employee Stock Purchase Plan
We instituted an employee stock purchase plan (“ESPP”) beginning on October 1, 2011 whereby essentially all employees who meet certain service requirements can purchase our common stock on quarterly offering dates at 90% of the fair market value of the shares on the purchase date. A maximum of 750,000 shares are authorized for purchase until the ESPP termination date of February 24, 2021, or earlier termination of the ESPP. During the years ended December 31, 2019, 2018 and 2017, we received proceeds of $231, $214 and $98 for the purchase of 22,000, 20,000 and 9,000 shares under the ESPP.
SPARTAN MOTORS, INC. AND SUBSIDIARIES
NOTES TO CONSOLIDATED FINANCIAL STATEMENTS
(Dollar amounts in thousands, except per share data)
NOTE 16 – SHAREHOLDERS EQUITY
On April 28, 2016, our Board of Directors authorized the repurchase of up to one million shares of our common stock in open market transactions.
The following table represents our purchases of our common stock during the years ended December 31, 2019 and 2018 under the share repurchase program.
|
Year Ended December, 31 |
Shares purchased (000) |
Purchase value |
Remaining shares allowable to be purchased |
|||||||||
|
2018 |
90 | $ | 656 | 910 | ||||||||
|
2019 |
101 | $ | 793 | 809 | ||||||||
NOTE 17 – EARNINGS PER SHARE
The table below reconciles basic weighted average common shares outstanding to diluted weighted average shares outstanding for 2019, 2018 and 2017 (in thousands). The stock awards noted as antidilutive were not included in the diluted or basic weighted average common shares outstanding. Although these stock awards were not included in our calculation of basic or diluted earnings per share (“EPS”), they may have a dilutive effect on the EPS calculation in future periods if the price of our common stock increases.
|
Year Ended December 31, |
||||||||||||
|
2019 |
2018 |
2017 |
||||||||||
|
Basic weighted average common shares outstanding |
35,318 | 35,187 | 34,949 | |||||||||
|
Plus dilutive effect of Restricted Stock Units and Performance Stock Units |
98 | - | - | |||||||||
|
Diluted weighted average common shares outstanding |
35,416 | 35,187 | 34,949 | |||||||||
|
Antidilutive stock awards: |
||||||||||||
|
Unvested restricted stock awards |
- | - | - | |||||||||
NOTE 18 – BUSINESS SEGMENTS
We identify our reportable segments based on our management structure and the financial data utilized by our chief operating decision maker to assess segment performance and allocate resources among our operating units. We have two reportable segments: Fleet Vehicles and Services and Specialty Chassis and Vehicles. The Emergency Response Vehicles segment met the held-for-sale criteria at December 31, 2019. Thus it is no longer considered a reportable segment and is reported as a discontinued operation instead.
We evaluate the performance of our reportable segments based on adjusted EBITDA (earnings before interest, taxes, depreciation and amortization), which is a non-GAAP financial measure. This non-GAAP measure is calculated by excluding items that we believe to be infrequent or not indicative of our continuing operating performance. In the fourth quarter of 2019, in connection with the divestiture of our ERV business, we refined the definition of adjusted EBITDA as income from continuing operations before interest, income taxes, depreciation and amortization, as adjusted to eliminate the impact of restructuring charges, acquisition related expenses and adjustments, non-cash stock-based compensation expenses, and other gains and losses not reflective of our ongoing operations. Adjusted EBITDA for all prior years presented have been recast to conform to the current presentation.
Our FVS segment consists of our operations at our Bristol, Indiana location, and beginning in 2018 certain operations at our Ephrata, Pennsylvania location along with our operations at our upfit centers in Kansas City, Missouri; North Charleston, South Carolina; Pompano Beach, Florida; Montebello, California and Saltillo, Mexico. The segment focuses on designing and manufacturing walk-in vans for parcel delivery, mobile retail, and trades and construction industries, the production of commercial truck bodies, and the distribution of related aftermarket parts and accessories.
Our SCV segment consists of our Charlotte, Michigan operations that engineer and manufacture motor home chassis, defense vehicles and other specialty chassis, and distribute related aftermarket parts and assemblies. In addition, beginning in September 2019 with the acquisition of Royal, the SCV segment includes operations in Carson and Union City, California; Mesa, Arizona; and Dallas and Weatherford, Texas. Royal is a leading California-based designer, manufacturer and installer of service truck bodies and accessories.
SPARTAN MOTORS, INC. AND SUBSIDIARIES
NOTES TO CONSOLIDATED FINANCIAL STATEMENTS
(Dollar amounts in thousands, except per share data)
The accounting policies of the segments are the same as those described, or referred to, in "Note 1 – General and Summary of Accounting Policies". Assets and related depreciation expense in the column labeled “Eliminations and Other” pertain to capital assets maintained at the corporate level. Eliminations for inter-segment sales are shown in the column labeled “Eliminations and other”. Segment loss from operations in the “Eliminations and other” column contains corporate related expenses not allocable to the operating segments. Interest expense and Taxes on income are not included in the information utilized by the chief operating decision makers to assess segment performance and allocate resources, and accordingly, are excluded from the segment results presented below.
Sales to customers outside the United States were $21,361, $21,204 and $13,392 for the years ended December 31, 2019, 2018 and 2017, or 2.8%, 3.7% and 3.3%, respectively, of sales for those years. All of our long-lived assets are located in the United States.
Sales and other financial information by business segment are as follows:
Year Ended December 31, 2019
|
Segment |
||||||||||||||||
|
FVS |
SCV |
Eliminations and Other |
Consolidated |
|||||||||||||
|
Fleet vehicles sales |
$ | 504,023 | $ | 5,278 | $ | (5,278 |
) |
$ | 504,023 | |||||||
|
Motor home chassis sales |
- | 127,130 | - | 127,130 | ||||||||||||
|
Other specialty vehicles sales |
- | 43,067 | - | 43,067 | ||||||||||||
|
Aftermarket parts and accessories sales |
71,871 | 10,451 | - | 82,322 | ||||||||||||
|
Total sales |
$ | 575,894 | $ | 185,926 | $ | (5,278 |
) |
$ | 756,542 | |||||||
|
Depreciation and amortization expense |
$ | 2,466 | $ | 2,104 | $ | 1,503 | $ | 6,073 | ||||||||
|
Adjusted EBITDA |
60,663 | 20,716 | (17,334 |
) |
64,045 | |||||||||||
|
Segment assets |
154,138 | 137,777 | 67,897 | 359,812 | ||||||||||||
|
Capital expenditures |
2,851 | 2,220 | 2,525 | 7,596 | ||||||||||||
Year Ended December 31, 2018
|
Segment |
||||||||||||||||
|
FVS |
SCV |
Eliminations and Other |
Consolidated |
|||||||||||||
|
Fleet vehicles sales |
$ | 297,627 | $ | 10,221 | $ | (10,221 |
) |
$ | 297,627 | |||||||
|
Motor home chassis sales |
- | 149,533 | - | 149,533 | ||||||||||||
|
Other specialty vehicles sales |
- | 22,570 | - | 22,570 | ||||||||||||
|
Aftermarket parts and accessories sales |
89,922 | 10,875 | - | 100,797 | ||||||||||||
|
Total sales |
$ | 387,549 | $ | 193,199 | $ | (10,221 |
) |
$ | 570,527 | |||||||
|
Depreciation and amortization expense |
$ | 2,401 | $ | 1,495 | $ | 2,318 | $ | 6,214 | ||||||||
|
Adjusted EBITDA |
26,680 | 18,620 | (9,915 |
) |
35,385 | |||||||||||
|
Segment assets |
117,508 | 17,335 | 82,264 | 217,107 | ||||||||||||
|
Capital expenditures |
1,859 | 116 | 2,678 | 4,653 | ||||||||||||
SPARTAN MOTORS, INC. AND SUBSIDIARIES
NOTES TO CONSOLIDATED FINANCIAL STATEMENTS
(Dollar amounts in thousands, except per share data)
Year Ended December 31, 2017
|
Segment |
||||||||||||||||
|
FVS |
SCV |
Eliminations and Other |
Consolidated |
|||||||||||||
|
Fleet vehicles sales |
$ | 207,666 | $ | 5,657 | $ | (5,657 |
) |
$ | 207,666 | |||||||
|
Motor home chassis sales |
- | 124,584 | - | 124,584 | ||||||||||||
|
Other specialty vehicles sales |
- | 18,416 | - | 18,416 | ||||||||||||
|
Aftermarket parts and accessories sales |
43,429 | 10,153 | - | 53,582 | ||||||||||||
|
Total sales |
$ | 251,095 | $ | 158,810 | $ | (5,657 |
) |
$ | 404,248 | |||||||
|
Depreciation and amortization expense |
$ | 3,361 | $ | 1,314 | $ | 1,357 | $ | 6,032 | ||||||||
|
Adjusted EBITDA |
26,958 | 14,058 | (9,344 |
) |
31,762 | |||||||||||
|
Segment assets |
60,550 | 21,445 | 76,439 | 158,434 | ||||||||||||
|
Capital expenditures |
562 | 386 | 3,028 | 3,976 | ||||||||||||
The table below presents the reconciliation of our consolidated income from continuing operations before taxes to total segment Adjusted EBITDA. Adjusted EBITDA is not a measurement of our financial performance under GAAP and should not be considered as an alternative to net income. Adjusted EBITDA may have limitations as an analytical tool and should not be considered in isolation or as a substitute for analysis of our results as reported under GAAP. In addition, although we have excluded certain charges in calculating Adjusted EBITDA, we may in the future incur expenses similar to these adjustments, despite our assessment that such expenses are infrequent and/or not indicative of our regular, ongoing operating performance. Our presentation of Adjusted EBITDA should not be construed as an inference that our future results will be unaffected by unusual or infrequent items.
|
Year Ended December 31, 2019 |
Year Ended December 31, 2018 |
Year Ended December 31, 2017 |
||||||||||
|
Income from continuing operations before income taxes |
$ | 47,145 | $ | 21,450 | $ | 19,853 | ||||||
|
Net (income) loss attributable to non-controlling interest |
(140 | ) | - | 1 | ||||||||
|
Interest expense |
109 | 481 | 156 | |||||||||
|
Depreciation and amortization expense |
4,570 | 3,896 | 4,675 | |||||||||
|
Restructuring and other related charges |
82 | 176 | 746 | |||||||||
|
Unallocated corporate expenses |
29,613 | 19,297 | 15,585 | |||||||||
|
Total segment adjusted EBITDA |
$ | 81,379 | $ | 45,300 | $ | 41,016 | ||||||
NOTE 19 – RELATED PARTY TRANSACTIONS
Angela Freeman, who serves on the Spartan Motors Board of Directors effective August 5, 2019, is the Chief Human Resources Officer at C.H. Robinson. The Company engaged C.H. Robinson for transportation and logistics services through a competitive bid process in December 2018. During the period August 5, 2019 through December 31, 2019, the Company utilized C.H. Robinson for services totaling $6,723.
Richard Dauch, who serves on the Spartan Motors Board of Directors, was the Chief Executive Officer of Accuride, Inc. through January 6, 2019. During the years ended December 31, 2018 and 2017, we made purchases of $799 and $698 from Accuride Distributing, a subsidiary of Accuride, Inc., for parts used in the manufacture of our products. These purchases were made through a competitive bid process. Purchases made in 2019 through January 6, 2019 were not material.
NOTE 20 – SUBSEQUENT EVENT
Effective February 1, 2020, the Company completed the sale of its ERV business pursuant to the terms and conditions set forth in the Asset Purchase Agreement entered into by and among the Company, the buyer and certain parties, and received cash of $55,000, subject to a post-closing adjustment. In connection with the closing of the sale, the Company and the buyer have entered into a transition services agreement, pursuant to which the parties will provide certain transition services for a specified period following the closing.
SPARTAN MOTORS, INC. AND SUBSIDIARIES
NOTES TO CONSOLIDATED FINANCIAL STATEMENTS
(Dollar amounts in thousands, except per share data)
NOTE 21 – QUARTERLY FINANCIAL DATA (UNAUDITED)
Summarized quarterly financial data for the years ended December 31, 2019 and 2018 is as follows. As discussed in "Note 2 – Acquisition Activities" effective February 1, 2020, we completed the sale of our ERV business. The results of the ERV business have been classified as discontinued operations for all periods presented. Full year amounts may not sum due to rounding.
|
2019 Quarter Ended |
2018 Quarter Ended |
|||||||||||||||||||||||||||||||
|
Mar 31 |
June 30 |
Sept 30 |
Dec 31 |
Mar 31 |
June 30 |
Sept 30 |
Dec 31 |
|||||||||||||||||||||||||
|
Sales |
$ | 172,206 | $ | 179,673 | $ | 224,703 | $ | 179,960 | $ | 106,325 | $ | 124,366 | $ | 165,920 | $ | 173,916 | ||||||||||||||||
|
Gross profit |
20,720 | 20,859 | 38,029 | 37,419 | 14,775 | 19,407 | 19,828 | 19,134 | ||||||||||||||||||||||||
|
Operating expenses |
14,767 | 14,608 | 20,915 | 19,123 | 12,124 | 13,812 | 11,438 | 13,252 | ||||||||||||||||||||||||
|
Income from continuing operations |
4,835 | 4,544 | 13,126 | 14,285 | 3,866 | 2,706 | 7,128 | 4,416 | ||||||||||||||||||||||||
|
(Loss) income from discontinued operations, net of income taxes |
(3,298 | ) | (1,255 | ) | (2,711 | ) | (41,952 | ) | 328 | 1,034 | (1,885 | ) | (2,581 | ) | ||||||||||||||||||
| Net income (loss) attributable to Spartan Motors, Inc. | 1,397 | 3,504 | 10,354 | (27,821 | ) | 4,194 | 3,740 | 5,243 | 1,835 | |||||||||||||||||||||||
|
Basic earnings (loss) per share |
||||||||||||||||||||||||||||||||
|
Continuing operations |
0.13 | 0.14 | 0.37 | 0.40 | 0.11 | 0.08 | 0.20 | 0.12 | ||||||||||||||||||||||||
|
Discontinued operations |
(0.09 | ) | (0.04 | ) | (0.08 | ) | (1.19 | ) | 0.01 | 0.03 | (0.05 | ) | (0.07 | ) | ||||||||||||||||||
| Basic earnings per share | 0.04 | 0.10 | 0.29 | (0.79 | ) | 0.12 | 0.11 | 0.15 | 0.05 | |||||||||||||||||||||||
|
Diluted earnings (loss) per share |
||||||||||||||||||||||||||||||||
|
Continuing operations |
0.13 | 0.14 | 0.37 | 0.40 | 0.11 | 0.08 | 0.20 | 0.12 | ||||||||||||||||||||||||
|
Discontinued operations |
(0.09 | ) | (0.04 | ) | (0.08 | ) | (1.18 | ) | 0.01 | 0.03 | (0.05 | ) | (0.07 | ) | ||||||||||||||||||
| Diluted earnings per share | 0.04 | 0.10 | 0.29 | (0.78 | ) | 0.12 | 0.11 | 0.15 | 0.05 | |||||||||||||||||||||||
|
Item 9. |
Changes in and Disagreements with Accountants on Accounting and Financial Disclosure. |
None.
|
Item 9A. |
Controls and Procedures. |
Evaluation of Disclosure Controls and Procedures.
Our management, with the participation of our Chief Executive Officer (“CEO”) and our Chief Financial Officer (“CFO”), evaluated the effectiveness of our disclosure controls and procedures as of December 31, 2019. The term “disclosure controls and procedures,” as defined in Rules 13a-15(e) and 15d-15(e) under the Securities Exchange Act of 1934, as amended (the “Exchange Act”), means controls and other procedures of a company that are designed to ensure that information required to be disclosed in the reports that it files or submits under the Exchange Act are recorded, processed, summarized and reported, within the time periods specified in the SEC’s rules and forms. Disclosure controls and procedures include, without limitation, controls and procedures designed to ensure that information required to be disclosed by a company in the reports that it files or submits under the Exchange Act is accumulated and communicated to the company’s management, including its principal executive officer and principal financial officer, as appropriate to allow timely decisions regarding required disclosure. In designing and evaluating the disclosure controls and procedures, management recognizes that any controls and procedures, no matter how well designed and operated, can provide only reasonable assurance of achieving the desired control objectives. In addition, the design of disclosure controls and procedures must reflect the fact that there are resource constraints and that management is required to apply its judgment in evaluating the benefits of possible controls and procedures relative to their costs.
As of the end of the period covered by this Annual Report on Form 10-K for the fiscal year ended December 31, 2019 (this “Form 10-K”), we carried out an evaluation, under the supervision and with the participation of our management, including our CEO and CFO, of the effectiveness of our disclosure controls and procedures pursuant to Rule 13a-15 under the Exchange Act. Based upon that evaluation, our CEO and CFO have concluded that, as of the end of the period covered by this Form 10-K, our disclosure controls and procedures were not effective because of the material weakness in internal control over financial reporting described below.
Management’s Report on Internal Control Over Financial Reporting.
Management is responsible for establishing and maintaining adequate “internal control over financial reporting,” as defined in Rules 13a-15(f) and 15d-15(f) under the Exchange Act. Our internal control over financial reporting is designed to provide reasonable assurance regarding the reliability of financial reporting and the preparation of financial statements for external purposes in accordance with U.S. generally accepted accounting principles and includes those policies and procedures that (1) pertain to the maintenance of records that, in reasonable detail, accurately and fairly reflect the transactions and dispositions of the assets of the Company; (2) provide reasonable assurance that transactions are recorded as necessary to permit preparation of financial statements in accordance with generally accepted accounting principles, and that receipts and expenditures of the Company are being made only in accordance with authorizations of management and directors of the Company; and (3) provide reasonable assurance regarding prevention or timely detection of unauthorized acquisition, use, or disposition of the Company’s assets that could have a material effect on the financial statements. All internal control systems, no matter how well designed, have inherent limitations. Therefore, even those systems determined to be effective can provide only reasonable assurance with respect to financial statement preparation and presentation. Because of its inherent limitations, a system of internal control over financial reporting may not prevent or detect misstatements.
A material weakness is a deficiency, or combination of deficiencies, in internal control over financial reporting, such that there is a reasonable possibility that a material misstatement of annual or interim financial statements will not be prevented or detected on a timely basis.
Management assessed the effectiveness of our internal control over financial reporting as of December 31, 2019 using the criteria set forth by the Committee of Sponsoring Organizations of the Treadway Commission in Internal Control-Integrated Framework (2013). As permitted by Securities and Exchange Commission guidance, management excluded from its assessment internal control over financial reporting for Royal, which was acquired on September 9, 2019, which accounted for 24.5% of consolidated total assets and 2.3% of consolidated sales as of and for the year ended December 31, 2019. Based on its assessment, our management, including our CEO and CFO, has concluded that our internal control over financial reporting was not effective as of December 31, 2019 due to a material weakness in our internal control over financial reporting described below.
Management’s assessment of the Company’s internal control over financial reporting as of December 31, 2019 determined that certain of the Company’s processes for recognizing revenue within its FVS business unit had been ineffectively designed, implemented, and operated. Specifically:
|
● |
There was insufficient management review to prevent and detect inaccurate and/or non-existent sales orders, including orders entered without appropriate supporting documentation and orders that were not properly updated to reflect price changes agreed to by customers. |
|
● |
Our controls were insufficient to accurately verify the existence, completeness, and accuracy of transactions resulting in recognition of revenue, including evidence of contracts with a customer and Company acceptance and approval of those contracts, revenue recognition agreement with contracted terms, and quarterly cut-off errors. |
These control deficiencies create a reasonable possibility that a material misstatement to the consolidated financial statements will not be prevented or detected on a timely basis, and therefore, we concluded that the deficiencies represent a material weakness in our internal control over financial reporting, and our internal control over financial reporting was not effective as of December 31, 2019.
Notwithstanding such material weakness in internal control over financial reporting, our management, including our CEO and CFO, has concluded that our consolidated financial statements present fairly, in all material respects, our financial position, results of our operations and our cash flows for the periods presented in this Form 10-K, in conformity with GAAP.
Our independent registered public accounting firm, BDO LLP, who audited the consolidated financial statements included in this annual report, has expressed an adverse report on the operating effectiveness of the Company's internal control over financial reporting. BDO LLP’s report appears on page 34 of this annual report on Form 10-K.
Remediation Plan
We have identified and have begun to implement several steps at the FVS business unit, as further described below, to remediate the material weakness described in this Item 9A and to enhance our overall control environment. We are committed to ensuring that our internal controls over financial reporting are designed and operating effectively. Our remediation process includes, but is not limited to:
|
● |
Strengthening our contract management and revenue controls with improved documentation standards, technical oversight and training; |
|
● |
Implementing new or revised transaction level controls to ensure all transactions have supporting documentation and the sales order entry process is monitored; |
|
● |
Enhancing the automation of processes and controls to allow for the timely completion and enhanced review of the controls and surrounding financial information; |
|
● |
Implementing and enhancing additional management review controls; and |
|
● |
Increasing accounting personnel to devote additional time and internal control resources. |
We believe that these actions will remediate the material weakness. The weakness will not be considered remediated, however, until the applicable controls operate for a sufficient period of time and management has concluded, through testing, that these controls are operating effectively. We expect that the remediation of this material weakness will be completed prior to the end of fiscal 2020.
|
Item 9B. |
Other Information. |
None.
PART III
|
Item 10. |
Directors, Executive Officers, and Corporate Governance. |
The information required by this item, with respect to directors, executive officers, audit committee, and audit committee financial experts of the Company and Section 16(a) beneficial ownership reporting compliance is contained under the captions “Spartan Motors’ Board of Directors and Executive Officers” and “Delinquent Section 16(a) Reports” in our definitive proxy statement for our annual meeting of shareholders to be held on May 20, 2020, to be filed with the Securities and Exchange Commission no later than 120 days after December 31, 2019, and is incorporated herein by reference.
We have adopted a Code of Ethics that applies to our principal executive officer, principal financial officer and principal accounting officer. This Code of Ethics is posted under “Code of Ethics” on our website at www.spartanmotors.com. We have also adopted a Code of Ethics and Compliance applicable to all directors, officers and associates, which is posted under “Code of Conduct” on our website at www.spartanmotors.com. Any waiver from or amendment to a provision of either code will be disclosed on our website.
|
Item 11. |
Executive Compensation. |
The information required by this item is contained under the captions “Executive Compensation,” “Compensation of Directors,” “Compensation Committee Report” and “Compensation Committee Interlocks and Insider Participation” in our definitive proxy statement for our annual meeting of shareholders to be held on May 20, 2020, to be filed with the Securities and Exchange Commission no later than 120 days after December 31, 2019, and is incorporated herein by reference.
|
Item 12. |
Security Ownership of Certain Beneficial Owners and Management and Related Stockholder Matters. |
The information required by this item (other than that set forth below) is contained under the caption “Ownership of Spartan Motors Stock” in our definitive proxy statement for our annual meeting of shareholders to be held on May 20, 2020, to be filed with the Securities and Exchange Commission no later than 120 days after December 31, 2019, and is incorporated herein by reference.
The following table provides information about our equity compensation plans regarding the number of securities to be issued under these plans upon the exercise of outstanding options, the weighted-average exercise prices of options outstanding under these plans, and the number of securities available for future issuance as of December 31, 2019.
|
Equity Compensation Plan Information |
|||||||||||||
|
Plan category |
Number of securities to exercise options, rights |
Weighted average |
Number of securities equity compensation plans (excluding securities reflected in column (a)) (3) |
||||||||||
|
(a) |
(b) |
(c) |
|||||||||||
|
Equity compensation plans approved by security holders (1) |
-- | N/A | 1,356,196 | ||||||||||
|
Equity compensation plans not approved by security holders (2) |
-- | N/A | 56,250 | ||||||||||
|
Total |
-- | N/A | 1,412,446 | ||||||||||
|
(1) |
Consists of the Spartan Motors, Inc. Stock Incentive Plan of 2016 (the “2016 Plan”). |
|
(2) |
Consists of the Spartan Motors, Inc. Directors’ Stock Purchase Plan. This plan provides that non-employee directors of the Company may elect to receive at least 25% and up to 100% of their “director’s fees” in the form of the Company’s common stock. The term “director’s fees” means the amount of income payable to a non-employee director for his or her service as a director of the Company, including payments for attendance at meetings of the Company’s Board of Directors or meetings of committees of the board, and any retainer fee paid to such persons as members of the board. A non-employee director who elects to receive Company common stock in lieu of some or all of his or her director’s fees will, on or shortly after each “applicable date,” receive a number of shares of common stock (rounded down to the nearest whole share) determined by dividing (1) the dollar amount of the director’s fees payable to him or her on the applicable date that he or she has elected to receive in common stock by (2) the market value of common stock on the applicable date. The term “applicable date” means any date on which a director’s fee is payable to the participant. To date, no shares have been issued under this plan. |
| (3) | Each of the plans reflected in the above table contains customary anti-dilution provisions that are applicable in the event of a stock split or certain other changes in the Company’s capitalization. In addition, the 2016 Plan provides that if a stock option is canceled, surrendered, modified, expires or is terminated during the term of the plan but before the exercise of the option, the shares subject to the option will be available for other awards under the plan. |
| The numbers of shares reflected in column (c) in the table above with respect to the 2016 Plan (1,356,196 shares) represent new shares that may be granted by the Company, and not shares issuable upon the exercise of an existing option, warrant or right. |
|
Item 13. |
Certain Relationships and Related Transactions, and Director Independence. |
The information required by this item is contained under the captions “Transactions with Related Persons” and “Spartan Motors’ Board of Directors and Executive Officers” in our definitive proxy statement for our annual meeting of shareholders to be held on May 20, 2020, to be filed with the Securities and Exchange Commission no later than 120 days after December 31, 2019, and is incorporated herein by reference.
|
Item 14. |
Principal Accounting Fees and Services. |
The information required by this item is contained under the caption “Independent Auditor Fees” in our definitive proxy statement for our annual meeting of shareholders to be held on May 20, 2020, to be filed with the Securities and Exchange Commission no later than 120 days after December 31, 2019, and is incorporated herein by reference.
PART IV
|
Item 15. |
Exhibits, Financial Statement Schedules. |
|
Item 15(a)(1). |
List of Financial Statements. |
The following consolidated financial statements of the Company and its subsidiaries, and reports of our registered independent public accounting firm, are filed as a part of this report under Item 8 - Financial Statements and Supplementary Data:
| Independent Registered Public Accounting Firm’s Report on Consolidated Financial Statements – Years Ended December 31, 2019, 2018 and 2017 | ||
| Independent Registered Public Accounting Firm’s Report on Internal Control Over Financial Reporting – December 31, 2019 | ||
| Consolidated Balance Sheets – December 31, 2019 and December 31, 2018 | ||
| Consolidated Statements of Operations – Years Ended December 31, 2019, 2018 and 2017 | ||
| Consolidated Statements of Shareholders’ Equity – Years Ended December 31, 2019, 2018 and 2017 | ||
| Consolidated Statements of Cash Flows – Years Ended December 31, 2019, 2018 and 2017 | ||
| Notes to Consolidated Financial Statements | ||
|
Item 15(a)(2). |
Financial Statement Schedules. Attached as Appendix A. |
The following consolidated financial statement schedule of the Company and its subsidiaries is filed as part of this report:
| Schedule II-Valuation and Qualifying Accounts |
All other financial statement schedules are not required under the related instructions or are inapplicable and therefore have been omitted.
|
Item 15(a)(3). |
List of Exhibits. The following exhibits are filed as a part of this report: |
|
Exhibit |
|
|
|
|
|
|
|
3.1 |
|
|
|
|
|
|
|
3.2 |
|
|
|
|
|
|
|
4.1 |
|
Spartan Motors, Inc. Restated Articles of Incorporation. See Exhibit 3.1 above. |
|
|
|
|
|
4.2 |
|
|
Exhibit Number |
||
| 4.3 | Description of Registrant's Common Stock | |
| 4.4 |
|
Form of Stock Certificate. Previously filed as an exhibit to the Registration Statement on Form S-18 (Registration No. 2-90021-C) filed on March 19, 1984 and incorporated herein by reference. |
|
|
|
|
|
4.5 |
|
The Registrant has several classes of long-term debt instruments outstanding, none of which represents an authorized amount of debt exceeding 10% of the Company’s total consolidated assets, except as furnished under Exhibit 10.10 to this Form 10-K below. The Company agrees to furnish copies of any other agreements defining the rights of holders of other such long-term indebtedness to the Securities and Exchange Commission upon request. |
|
|
|
|
|
10.1 |
|
|
|
|
|
|
|
10.2 |
|
|
|
|
|
|
|
10.3 |
|
|
|
|
|
|
|
10.4 |
|
|
| 10.5 |
|
|
|
|
|
|
|
10.6 |
|
|
|
|
|
|
|
10.7 |
|
|
|
|
|
|
|
10.8 |
|
|
|
|
|
|
|
10.9 |
|
|
|
|
|
|
|
Exhibit Number |
|
|
|
10.10 |
|
|
|
|
|
|
|
10.11 |
|
|
|
|
|
|
|
10.12 |
|
|
|
|
|
|
|
10.13 |
|
|
|
|
|
|
|
10.14 |
|
|
|
|
|
|
|
10.15 |
|
|
|
|
|
|
|
10.16 |
|
|
|
|
|
|
|
10.17 |
|
|
|
10.18 |
|
|
|
10.19 |
|
|
|
10.20 |
||
|
10.21 |
||
|
10.22 |
|
Exhibit Number |
|
|
|
10.23 |
||
|
10.24 |
||
| 10.25 | Employment Offer Letter dated January 21, 2020 from Spartan Motors, Inc. to Jonathan C. Douyard.* | |
|
21 |
||
|
23 |
|
Consent of BDO USA, LLP, Independent Registered Public Accounting firm. |
|
|
|
|
|
31.1 |
|
Certification of Chief Executive Officer pursuant to Section 302 of the Sarbanes-Oxley Act. |
|
|
|
|
|
31.2 |
|
Certification of Chief Financial Officer pursuant to Section 302 of the Sarbanes-Oxley Act. |
|
|
|
|
|
32 |
|
|
|
|
|
|
|
101.INS |
|
XBRL Instance Document |
|
|
|
|
|
101.SCH |
|
XBRL Schema Document |
|
|
|
|
|
101.CAL |
|
XBRL Calculation Linkbase Document |
|
|
|
|
|
101.DEF |
|
XBRL Definition Linkbase Document |
|
|
|
|
|
101.LAB |
|
XBRL Label Linkbase Document |
|
|
|
|
|
101.PRE |
|
XBRL Presentation Linkbase Document |
_________________________
*Management contract or compensatory plan or arrangement.
The Company will furnish a copy of any exhibit listed above to any shareholder of the Company without charge upon written request to: Chief Financial Officer, Spartan Motors, Inc., 41280 Bridge Street, Novi, Michigan 48375.
|
Item 16. |
Form 10-K Summary |
None.
SIGNATURES
Pursuant to the requirements of Section 13 or 15(d) of the Securities Exchange Act of 1934, the registrant has duly caused this report to be signed on its behalf by the undersigned, thereunto duly authorized.
|
|
SPARTAN MOTORS, INC. |
|
|
|
|
|
|
March 16, 2020 |
By |
/s/ Frederick J. Sohm |
|
|
|
Frederick J. Sohm (Principal Financial and Accounting Officer) |
Pursuant to the requirements of the Securities Exchange Act of 1934, this report has been signed below by the following persons on behalf of the registrant and in the capacities and on the dates indicated.
|
March 16, 2020 |
By |
/s/ Daryl M. Adams |
|
|
|
Daryl M. Adams Director, President and Chief Executive Officer |
|
|
|
|
|
March 16, 2020 |
By |
/s/ Frederick J. Sohm |
|
|
|
Frederick J. Sohm (Principal Financial and Accounting Officer) |
|
|
|
|
|
March 16, 2020 |
By |
/s/ James A. Sharman |
|
|
|
James A. Sharman, Director |
|
|
|
|
|
March 16, 2020 |
By |
/s/ Thomas R. Clevinger |
|
|
|
Thomas R. Clevinger, Director |
|
March 16, 2020 |
By |
/s/ Richard F. Dauch |
|
|
|
Richard F. Dauch, Director |
|
|
|
|
|
March 16, 2020 |
By |
/s/ Ronald E. Harbour |
|
|
|
Ronald E. Harbour, Director |
|
|
|
|
|
March 16, 2020 |
By |
/s/ Angela K. Freeman |
|
|
|
Angela K. Freeman, Director |
|
|
|
|
|
March 16, 2020 |
By |
/s/ Paul A. Mascarenas |
|
|
|
Paul A. Mascarenas, Director |
|
|
|
|
|
March 16, 2020 |
By |
/s/ Dominic Romeo |
|
|
|
Dominic Romeo, Director |
|
|
|
|
|
March 16, 2020 |
By |
/s/ Andrew M. Rooke |
|
|
|
Andrew M. Rooke, Director |
|
|
|
|
APPENDIX A
SCHEDULE II
VALUATION AND QUALIFYING ACCOUNTS
SPARTAN MOTORS, INC. AND SUBSIDIARIES
|
Column A |
Column B |
Column C |
Column D |
Column E |
||||||||||||||||
|
|
|
|
Additions |
|
|
|||||||||||||||
|
Year ended December 31, 2019: |
||||||||||||||||||||
|
Allowance for doubtful accounts |
$ | 99 | $ | 415 | $ | - | $ | (286 |
) |
$ | 228 | |||||||||
|
Year ended December 31, 2018: |
||||||||||||||||||||
|
Allowance for doubtful accounts |
$ | 98 | $ | 32 | $ | - | $ | (31 |
) |
$ | 99 | |||||||||
|
Year ended December 31, 2017: |
||||||||||||||||||||
|
Allowance for doubtful accounts |
$ | 420 | $ | 78 | $ | - | $ | (400 |
) |
$ | 98 | |||||||||
77