Attached files
| file | filename |
|---|---|
| EX-32.2 - CERTIFICATION - Greenbacker Renewable Energy Co LLC | f10k2019ex32-2_greenbacker.htm |
| EX-32.1 - CERTIFICATION - Greenbacker Renewable Energy Co LLC | f10k2019ex32-1_greenbacker.htm |
| EX-31.2 - CERTIFICATION - Greenbacker Renewable Energy Co LLC | f10k2019ex31-2_greenbacker.htm |
| EX-31.1 - CERTIFICATION - Greenbacker Renewable Energy Co LLC | f10k2019ex31-1_greenbacker.htm |
| EX-21.1 - LIST OF SUBSIDIARIES - Greenbacker Renewable Energy Co LLC | f10k2019ex21-1_greenbacker.htm |
| EX-10.2 - SECOND AMENDED AND RESTATED ADVISORY AGREEMENT BETWEEN REGISTRANT, GREENBACKER R - Greenbacker Renewable Energy Co LLC | f10k2019ex10-2_greenbacker.htm |
UNITED STATES
SECURITIES AND EXCHANGE COMMISSION
Washington, DC 20549
FORM 10-K
(Mark One)
☒ ANNUAL REPORT PURSUANT TO SECTION 13 OR 15(d) OF THE SECURITIES EXCHANGE ACT OF 1934
For the fiscal year ended December 31, 2019
OR
☐ TRANSITION REPORT PURSUANT TO SECTION 13 OR 15(d) OF THE SECURITIES EXCHANGE ACT OF 1934
Commission file number: 000-55610
GREENBACKER RENEWABLE ENERGY COMPANY LLC
(Exact Name of Registrant as Specified in its Charter)
| Delaware | 80-0872648 | |
| (State or Other Jurisdiction of | (I.R.S. Employer | |
| Incorporation or Organization) | Identification No.) |
11 East 44th Street, Suite 1200
New York, NY 10017
Tel (646) 237-7884
(Address, including zip code and telephone number, including area code, of registrants Principal Executive Office)
Charles Wheeler
c/o Greenbacker Capital
Management LLC
30 Danforth Street, Suite 206
Portland, ME 04101
Tel (646) 237-7884
(Name, address, including zip code, and telephone number, including area code, of agent for service)
Securities registered pursuant to Section 12(b) of the Act:
| Title of each class | Trading Symbol(s) | Name of each exchange on which registered | ||
| Limited liability company interest | N/A | N/A |
Securities registered pursuant to section 12(g) of the Act:
Indicate by check mark if the registrant is a well-known seasoned issuer, as defined in Rule 405 of the Securities Act of 1933. Yes ☐ No ☒
Indicate by check mark if the registrant is not required to file reports pursuant to Section 13 or Section 15(d) of the Securities Exchange Act of 1934. Yes ☐ No ☒
Indicate by check mark whether the registrant: (1) has filed all reports required to be filed by Section 13 or 15(d) of the Securities Exchange Act of 1934 during the preceding 12 months (or for such shorter period that the registrant was required to file such reports), and (2) has been subject to such filing requirements for the past 90 days. Yes ☒ No ☐
Indicate by check mark whether the registrant has submitted electronically and posted on its corporate Web site, if any, every Interactive Data File required to be submitted and posted pursuant to Rule 405 of Regulation S-T (§232.405 of this chapter) during the preceding 12 months (or for such shorter period that the registrant was required to submit and post such files). Yes ☒ No ☐
Indicate by check mark if disclosure of delinquent filers pursuant to Item 405 of Regulation S-K (§229.405 of this chapter) is not contained herein, and will not be contained, to the best of the registrant’s knowledge, in definitive proxy or information statements incorporated by reference in Part III of this Form 10-K or any amendment to this Form 10-K. Yes ☒ No ☐
Indicate by check mark whether the registrant is a large accelerated filer, an accelerated filer, a non-accelerated filer or a smaller reporting company. See the definitions of “large accelerated filer,” “accelerated filer” and “smaller reporting company” in Rule 12b-2 of the Exchange Act. (check one):
| Large accelerated filer ☐ | Accelerated filer ☐ |
| Non-accelerated filer ☐ | Smaller reporting company ☐ |
| Emerging growth company ☒ |
If an emerging growth company, indicate by check mark if the registrant has elected not to use the extended transition period for complying with any new or revised financial accounting standards provided pursuant to Section 13(a) of the Exchange Act. ☐
Indicate by check mark whether the registrant is a shell company (as defined in Rule 12b-2 of the Exchange Act). Yes ☐ No ☒
As of March 2, 2020, the registrant had 49,305,069 shares of common interests, $0.001 par value, outstanding.
TABLE OF CONTENTS
i
GLOSSARY OF KEY TERMS
In this annual report on Form 10-K, except as otherwise indicated, the terms:
| ● | The term “LLC” refers to Greenbacker Renewable Energy Company LLC; |
| ● | “we,” “us,” “our” and the “company” refers, collectively, to Greenbacker Renewable Energy Company LLC, Greenbacker Renewable Energy Corporation, and GREC Entity HoldCo LLC; |
| ● | The “advisor” and “GCM” refer to Greenbacker Capital Management LLC, our advisor; |
| ● | The term “Special Unitholder” refers to GREC Advisors, LLC, a Delaware limited liability company, which is a subsidiary of our advisor; |
| ● | The term “special unit” refers to the special unit of limited liability company interest in the LLC entitling the Special Unitholder to an incentive allocation and distribution; |
| ● | The term “SC Distributors” and “dealer manager” refer to SC Distributors, LLC, a Delaware limited liability company, the LLC’s dealer manager; |
| ● | “GREC” refers to Greenbacker Renewable Energy Corporation, a Maryland corporation; |
| ● | “GREC HoldCo” refers to GREC Entity HoldCo LLC, a wholly owned subsidiary of GREC; |
| ● | “Greenbacker Administration” and “Administrator” refers to Greenbacker Administration, LLC, our Administrator; |
| ● | “Greenbacker Group LLC” refers to a sponsor of the company and the parent of GCM; |
| ● | “DRP” — Distribution Reinvestment Plan; |
| ● | “ITC”— Investment Tax Credit; |
| ● | “PTC”— Production Tax Credit; |
| ● | “MWh”— Megawatt Hours; |
| ● | “kW”— Kilowatts; |
| ● | “kWh”— Kilowatt hours; |
| ● | “REC”— Renewable Energy Credit; |
| ● | “SREC”— Solar Renewable Energy Credit; |
| ● | “MW”— Megawatts- (DC) for all Solar assets and (AC) for Wind assets |
| ● | “PPA” — Power Purchase Agreement; |
| ● | “RPS”— Renewable Portfolio Standard; |
| ● | “EEC”— Energy Efficiency Certificate; and |
| ● | “PV”— Photovoltaic. |
ii
FORMATION OF OUR COMPANY
Greenbacker Renewable Energy Company LLC (“LLC”), a Delaware limited liability company, formed in December 2012, is an externally managed energy company that acquires and manages income-generating renewable energy and energy efficiency projects, and other energy-related businesses, as well as finances the construction and/or operation of these and sustainable development projects and businesses. The LLC conducts substantially all of its operations through its wholly-owned subsidiary, Greenbacker Renewable Energy Corporation (“GREC”). GREC is a Maryland corporation formed in November 2011 and the LLC currently holds all of the outstanding shares of capital stock of GREC. GREC Entity HoldCo LLC (“GREC Holdco”), a wholly-owned subsidiary of GREC, was formed in Delaware, in June 2016. We are externally managed and advised by the advisor, a renewable energy, energy efficiency and sustainability related project acquisition, consulting and development company that is registered as an investment adviser under the Investment Advisers Act of 1940, as amended (“Advisers Act”). The LLC’s fiscal year end is December 31.
Pursuant to an initial Registration Statement filed in December 2011 (File No. 333-178786-01) and a second Registration Statement filed in February 2017 (File No. 333-211571), the company offered up to $1,000,000,000 in shares of limited liability company interests, or the shares, including up to $200,000,000 of shares pursuant to the company’s DRP. As of March 29, 2019, the company terminated its public offering of the shares as well as its privately offered Class P-A shares. While the company publicly offered three classes of shares: Class A, C and I, currently the company is only privately offering Class P-I shares on a continuous basis. The share classes had different selling commissions, dealer manager fees and there is an ongoing distribution fee with respect to Class C shares. The company has adopted the DRP pursuant to which a shareholder owning publicly offered share classes may elect to have the full amount of cash distributions reinvested in additional shares. Following the termination of the company’s public offering of shares, the DRP and the share repurchase plan will continue to be available to existing investors. As of June 4, 2019, pursuant to our Registration Statement on Form S-3 (File No. 333-231960) we are offering a maximum of $10,000,000 in shares of our common stock to our existing stockholders pursuant to the DRP.
Each quarter, our advisor, utilizing the services of an independent valuation firm, when necessary, reviews and approves the net asset value for each class of shares, subject to the oversight of the company’s board of directors. To the extent that the net asset value per share on the most recent valuation date increases or decreases, the company will adjust the offering price of the P-I shares to the then-net asset value per share. Five days after the publishing of each quarter-end valuation, Class A, C and I shares are currently offered pursuant to the DRP at a price equal to the net asset value.
OVERVIEW OF OUR BUSINESS
Our business objective is to generate attractive risk-adjusted returns for our investors, consisting of both current income and long-term capital appreciation, by acquiring and financing the construction and/or operation of income-generating renewable energy, energy efficiency and sustainable development projects, primarily within but also outside of North America. We expect the size of our investments to generally range between approximately $1 million and $100 million. We will seek to maximize our risk-adjusted returns by: (1) capitalizing on market opportunities; (2) focusing on hard assets that produce dependable cash flows; (3) efficiently utilizing government incentives where available; (4) employing creative deal structuring to optimize capital and ownership structures; (5) partnering with experienced financial, legal, engineering and other professional firms; (6) employing sound due diligence and risk mitigation processes; and (7) monitoring and managing our portfolio of assets on an ongoing basis.
Our objective has been to assemble a diversified portfolio of renewable energy, energy efficiency and other sustainability related projects and businesses. Renewable energy projects generally earn revenue through the sale of generated electricity as well as frequently through the sale of other commodities such as RECs and EECs. We initially focused on solar energy and wind energy projects as well as energy efficiency projects. In 2019, we invested in our first biomass facility.
We believe solar energy projects generally offer more predictable power generation characteristics, due to the relative predictability of sunlight over the course of time, compared to other renewable energy classes. Therefore, we expect they will provide more stable income streams. However, technological advances in wind turbines and other energy generation technologies, as well as government incentives, make wind energy and other types of projects attractive as well.
1
Solar energy projects provide maximum energy production during the middle of the day and in the summer months when days are longer and nights shorter. Solar energy projects tend to have minimal environmental impact enabling such projects to be developed close to areas of dense population where electricity demand is highest. Since solar technology is scalable and well-established, it has been a relatively straightforward process to integrate new acquisitions and projects into our portfolio.
Over time, we expect to broaden our strategy to include other types of renewable energy projects and energy efficiency projects and businesses, which may include hydropower assets, geothermal plants, and biofuel assets, combined heat and power technology assets, fuel cell assets and other energy efficiency assets, among others. To the extent we deem the opportunity attractive, other energy and sustainability related assets and businesses will be included.
Our preferred investment strategy is to acquire controlling equity stakes in our target assets or to be named the managing member of a limited liability company to oversee and supervise their operations. We define controlling equity stakes as companies in which we own 25% or more of the voting securities of such company or have greater than 50% representation on such company’s board of directors. However, we will also provide financing to projects owned by others, including through the provision of secured loans, which may or may not include some form of equity participation.
Our strategy will be tailored to balance long-term cash flow certainty, which we can achieve through long-term agreements for our products, with shorter term arrangements that allow us to potentially generate higher risk-adjusted returns. We may provide projects with senior unsecured debt, subordinated secured debt, subordinated unsecured debt, mezzanine debt, convertible debt, convertible preferred equity and preferred equity, and we may make minority equity investments. We may also participate in projects by acquiring contractual payment rights or rights to receive a proportional interest in the operating cash flow or net income of a project. We may also make equity investments in or loans to parties financing the supply of renewable energy and energy efficiency to residential and commercial customers or the adoption of strategies to reduce the consumption of energy by those customers.
Overall, management’s strategy of purchasing smaller renewable energy projects where there is less competition from the larger capital providers has enabled us to build a diversified portfolio of high quality, higher returning assets. Having a portfolio of smaller projects is initially more expensive and time consuming to operate than having a smaller number of much larger projects, as all renewable energy projects have similar onboarding and acquisition costs irrespective of their size. At scale, there are considerable efficiencies to be obtained on smaller projects through the streamlining of operations, buying insurance and other services in bulk and obtaining much better financing terms and these benefits are then available to be enjoyed over the whole of the economic life of the assets; which in most cases is 30 -35 years. We view the downside of the additional upfront costs as well worth the investment to provide superior returns over the long term. The larger and more efficient the company becomes the more we create a sustainable competitive advantage in the marketplace. There are other advantages of this strategy as well, including but not limited to, wide geographic diversity, which is very important when weather plays such an important part in the generation of our income, credit risk diversity, operational diversity, technology diversity and smoothing the seasonality. Another key advantage to our approach is that we expect to see a relatively greater number of smaller project investment opportunities in the future as the economy continues to embrace the concept of distributed energy and move away from the traditional centralized generation model. As this trend continues, we expect to see more smaller transactions coming to market and far fewer large transactions. In 2019, we executed 12 portfolio acquisition transactions and four portfolio sales, resulting in a total of 34 portfolios to date. As our access to capital has increased, the average size of the investment that we have executed has increased from 13.98 MW per portfolio in 2018 to 19.83 MW per portfolio in 2019, a 41.85% increase year-over-year.
Our renewable energy projects generate revenue primarily by selling (1) generated electric power to local utilities and other high quality, utility, municipal, corporate and individual residential counterparties, and (2) in some cases, RECs, EECs, and other commodities associated with the generation or savings of power. We seek to acquire or finance projects that contain transmission infrastructures and access to power grids or networks that will enable the generated power to be sold. We generally expect our projects will have PPAs with one or more counterparties, including local utilities or other high credit quality counterparties, who agree to purchase the electricity generated from the project.
We refer to these PPAs as “must-take contracts,” and we refer to these other counterparties as “off-takers.” These must-take contracts guarantee that all electricity generated by each project will be purchased. Although we intend to work primarily with high credit quality counterparties, if an off-taker cannot fulfill its contractual obligation to purchase the power, we generally can sell the power to the local utility or other suitable counterparty, which would potentially ensure revenue is generated for all solar electricity generation. We may also generate revenue from the receipt of interest, fees, capital gains and distributions from investments in our target assets.
Our PPAs, when structured with utilities and other large commercial users of electricity, are generally long-term in nature, tied to 100% of the output of the specific generating asset, and priced at a rate established pursuant to a formula set by the contract. The formula is often dependent upon the type of subsidies, if any, offered by the local and state governments for project development. Although we focus on projects with long-term contracts that ensure price certainty, we may also look for projects with shorter term arrangements that will allow us to participate in market rate changes which may lead to higher current income.
A number of the PPAs for our projects are structured as “behind the meter” agreements with residential, commercial or government entities. Under the agreements, all electricity generated by a project will be purchased by the off-taker at an agreed upon rate that may be set at a slight discount to the retail electric tariff rate for the off-taker. These agreements also typically provide for annual rate increases over the term of the agreement although that is not a necessary requirement. The behind the meter agreement is generally long-term in nature and further typically provides that, should the off-taker fail to fulfill its contractual obligation, any electricity that is not purchased by the off-taker may be sold to the local utility, usually at an equivalent wholesale spot electric rate.
2
We have structured some of our investments in residential solar with a similar commercial arrangement to that of the PPAs with utilities and other large commercial users of electricity for our energy projects, as described above. In addition, we have acquired residential solar assets which have a private purchase agreement with the residential homeowner as counterparty as well as leasing the solar assets to a residential owner on a long-term basis where the residential owner directly receives the benefit of the electricity generated.
The table below sets forth the company’s investments in alternative energy generation portfolios as of December 31, 2019.
| Acquisition Date | Industry | Location(s) | Form of Investment*** | Cost**/Principal Amount* | Assets | Generation Capacity in (MW)* | ||||||||||||
| Conic Portfolio | First quarter 2018, Second quarter 2018, Fourth quarter 2018 | Commercial Solar | Colorado, North Carolina | Managing member, majority equity owner | $ | 12,077,823 | Commercial ground and roof mounted photovoltaic systems | 36.9 | ||||||||||
| East to West Solar Portfolio | First quarter 2015, Second quarter 2015, Fourth quarter 2015, Second quarter 2018 | Commercial Solar | Colorado, Connecticut, Florida, Hawaii, Indiana and North Carolina | 100% equity ownership or Managing member, majority equity owner | $ | 39,109,190 | Commercial ground and roof mounted photovoltaic systems | 32.5 | ||||||||||
| Foresight Solar Portfolio | Fourth quarter 2017 | Commercial Solar | California, Colorado | Managing member, majority equity owner | $ | 13,790,000 | Commercial ground and roof mounted photovoltaic systems | 10.1 | ||||||||||
| Golden Horizons Solar Portfolio | Fourth quarter 2017 | Commercial Solar | California | 100% equity ownership | $ | 9,290,000 | Commercial ground and roof mounted photovoltaic systems | 7.8 | ||||||||||
| Green Maple Portfolio | Fourth quarter 2014, Fourth quarter 2015, Fourth quarter 2019 | Commercial Solar | Vermont | 100% equity ownership | $ | 26,561,596 | Commercial ground and roof mounted photovoltaic systems | 13.1 | ||||||||||
| Longleaf Solar Portfolio | Fourth quarter 2018 | Commercial Solar | North Carolina | Managing member, majority equity owner | $ | 22,797,404 | Commercial ground and roof mounted photovoltaic systems | 21.8 | ||||||||||
| Magnolia Sun Portfolio | Third quarter 2015, First quarter 2016 | Commercial Solar | California, Massachusetts and Tennessee | 100% equity ownership | $ | 10,775,000 | Commercial ground and roof mounted photovoltaic systems | 5.3 | ||||||||||
| Midway III Solar Portfolio | Fourth quarter 2017 | Commercial Solar | California | Managing member, majority equity owner | $ | 10,575,394 | Commercial ground and roof mounted photovoltaic systems | 26.0 | ||||||||||
| Six States Solar Portfolio | Fourth quarter 2015, Third quarter 2017 | Commercial Solar | Arizona, California, Colorado, Connecticut, Indiana and North Carolina | 100% equity ownership | $ | 12,655,306 | Ground and roof mounted solar systems | 12.9 | ||||||||||
3
| Acquisition Date | Industry | Location(s) | Form of Investment*** | Cost**/Principal Amount* | Assets | Generation Capacity in (MW)* | ||||||||||||
| Sunny Mountain Portfolio | Third quarter 2014 | Commercial Solar | Colorado | 100% equity ownership | $ | 884,578 | Commercial and residential ground and roof mounted solar photovoltaic systems | 0.8 | ||||||||||
| Canadian Northern Lights Portfolio | Fourth quarter 2014, Fourth quarter 2015 | Residential Solar | Ontario, Canada | 100% equity ownership | $ | 1,603,136 | Residential rooftop mounted solar photovoltaic systems | 0.6 | ||||||||||
| Greenbacker Residential Solar Portfolio | Third quarter 2016, First quarter 2017, Second quarter 2017 | Residential Solar | Arizona, California, Connecticut, Hawaii, Maryland, Massachusetts, New Jersey and New York | 100% equity ownership or managing member, majority equity owner | $ | 28,100,000 | Residential rooftop mounted solar photovoltaic systems | 18.6 | ||||||||||
| Greenbacker Residential Solar Portfolio II | Second quarter 2017 | Residential Solar | Arizona, California, Connecticut, Maryland, Massachusetts, Nevada, New Jersey and New York | Managing member, majority equity owner | $ | 6,400,000 | Residential rooftop mounted solar photovoltaic systems | 10.2 | ||||||||||
| Greenbacker Wind Portfolio - California | Fourth quarter 2017 | Wind | California | 100% equity ownership | $ | 9,500,000 | Operating wind power facilities | 6.0 | ||||||||||
| Greenbacker Wind Portfolio - HoldCo | Second quarter 2017, Fourth quarter 2017, Second quarter 2019 | Wind | Idaho, Minnesota, Vermont | 100% equity ownership | $ | 25,753,111 | Operating wind power facilities | 51.3 | ||||||||||
| Greenbacker Wind Portfolio - Montana | Fourth quarter 2015, Fourth quarter 2016 | Wind | Montana | Managing member, equity owner | $ | 24,756,684 | Operating wind power facilities | 35.0 | ||||||||||
| Greenbacker Wind Portfolio - Iowa | Third quarter 2019 | Wind | Iowa | 100% equity ownership | $ | 20,440,000 | Operating wind power facilities | 80.0 | ||||||||||
| Greenbacker Wind Portfolio - Massachusetts | Fourth quarter 2019 | Wind | Massachusetts | Managing member, majority equity owner | $ | 10,169,079 | Operating wind power facilities | 5.0 | ||||||||||
Eagle Valley Biomass Portfolio | Second quarter 2019 | Biomass | Colorado | 100% equity ownership | $ | 21,425,600 | Operating biomass facility | 12.0 | ||||||||||
| SE Solar 2019 Portfolio | Fourth quarter 2018 | Pre-Operational Assets | North Carolina | 100% equity ownership | $ | 5,000,000 | Commercial ground and roof mounted photovoltaic systems | 20.8 | ||||||||||
| Turquoise Solar Portfolio | Fourth quarter 2018 | Pre-Operational Assets | Nevada | 100% equity ownership | $ | 26,602,532 | Commercial ground and roof mounted photovoltaic systems | 60.6 | ||||||||||
4
| Acquisition Date | Industry | Location(s) | Form of Investment*** | Cost**/Principal Amount* | Assets | Generation Capacity in (MW)* | ||||||||||||
| Omni DG Portfolio | First Quarter 2019 | Pre-Operational Assets | California, New Jersey, Maryland | 100% equity ownership | $ | 17,900,298 | Commercial ground and roof mounted photovoltaic systems | 19.6 | ||||||||||
| Phoenix Solar Portfolio | Fourth Quarter 2019 | Pre-Operational Assets | Pennsylvania | 100% equity ownership | $ | 4,051,138 | Commercial roof mounted photovoltaic systems | 7.2 | ||||||||||
| Colorado CES Portfolio | Second quarter 2019 | Pre-Operational Assets | Colorado | 100% equity ownership | $ | 4,517,354 | Commercial ground and roof mounted photovoltaic systems | 6.0 | ||||||||||
| Oregon Sun Portfolio | Third quarter 2019 | Pre-Operational Assets | Oregon | 100% equity ownership | $ | 5,404,787 | Commercial ground and roof mounted photovoltaic systems | 9.3 | ||||||||||
| Electric City Solar Portfolio | Fourth quarter 2019 | Pre-Operational Assets | Michigan | 100% equity ownership | $ | 4,208,484 | Commercial ground mounted photovoltaic systems | 18.9 | ||||||||||
| Citrine Portfolio | Fourth quarter 2019 | Pre-Operational Assets | Massachusetts, New Jersey, and Pennsylvania | 100% equity ownership | $ | 3,411,249 | Commercial ground and roof mounted photovoltaic systems | 9.2 | ||||||||||
| Opal Portfolio | Fourth quarter 2019 | Pre-Operational Assets | Vermont | 100% equity ownership | $ | 344,949 | Commercial ground mounted photovoltaic systems | 0.7 | ||||||||||
| Trillium Portfolio | Fourth quarter 2019 | Pre-Operational Assets | Arizona, Colorado, D.C., and Maryland | Managing member, majority equity owner | $ | 24,277,396 | Commercial ground mounted photovoltaic systems | 16.9 | ||||||||||
| Other Portfolios | Third quarter 2018 Fourth quarter 2018, Fourth quarter 2019 |
Pre-Operational Assets | California, Colorado, North Carolina, and Delaware | 100% equity ownership | $ | 12,657,710 | Commercial ground and roof mounted photovoltaic systems | N/A | ||||||||||
| GREC Energy Efficiency Portfolio | Third quarter 2015 | Energy Efficiency | Puerto Rico | Capital lease | $ | 388,044 | Energy efficiency LED lighting | N/A | ||||||||||
| Renew AEC One, LLC | Fourth quarter 2015 | Energy Efficiency | Pennsylvania | Secured loan | $ | 479,140 | Energy efficiency LED lighting | N/A | ||||||||||
| SE Solar Loan | First quarter 2019 | Secured Loan | North Carolina | Secured Loan | $ | 1,000,000 | Loan | N/A | ||||||||||
| Hudson Loan | Third quarter 2019 | Secured Loan | New York | Secured Loan | $ | 9,481,127 | Loan | N/A | ||||||||||
| TUUSSO Loan | Fourth quarter 2019 | Secured Loan | Washington | Secured Loan | $ | 2,621,883 | Loan | N/A | ||||||||||
| Encore Loan | Fourth quarter 2019 | Secured Loan | Vermont | Secured Loan | $ | 5,000,680 | Loan | N/A | ||||||||||
| New Market Loan | Fourth quarter 2019 | Secured Loan | North Carolina | Secured Loan | $ | 5,000,000 | Loan | N/A | ||||||||||
| * | Approximate |
| ** | Does not include assumed project level debt |
| *** | 100% Equity ownership, majority equity owner (≥50%), equity owner (<50%), Managing Member of the Limited Liability Company, secured loan or a capital lease |
5
The investments described above have allowed us to construct a portfolio of projects offering predictable power generation characteristics and generally stable income streams which include seasonal solar generation income (generally stronger in the summer months), wind generation income (generally stronger in the winter months), biomass generation income (consistent throughout the year), and energy efficiency lights investments.
The LLC conducts a significant portion of its operations through GREC, of which the LLC is the sole shareholder–both of the shares of common stock and the special preferred stock. We intend to continue to operate our business in a manner permitting us to maintain our exemption from registration under the Investment Company Act of 1940, as amended (the “Investment Company Act”). We are not a blank check company within the meaning of Rule 419 of the Securities Act of 1933, as amended (the “Securities Act”) and have no specific intent to engage in a merger or acquisition in the next 12 months.
Pursuant to the now-terminated Registration Statement on Form S-1 (File No. 333-211571), we offered on a continuous basis up to $1,000,000,000 in shares of our limited liability company interests, consisting of up to $800,000,000 of shares in the primary offering and up to $200,000,000 of shares pursuant to the Distribution Reinvestment Plan (the “DRP”). The primary offering was terminated on March 29, 2019. SC Distributors, LLC was the dealer manager for the primary offering. The company’s initial offering pursuant to a Registration Statement on Form S-1 (File No. 333-178786-01) terminated on February 7, 2017. As of June 4, 2019, pursuant to our Registration Statement on Form S-3 (File No. 333-231960) we are offering a maximum of $10,000,000 in shares of our common stock to our existing stockholders pursuant to the DRP. Shares of the company’s limited liability company interests issued pursuant to the DRP are initially being offered at the price equal to the then-current offering price per each class of shares.
After the finalization of the December 31, 2019 net asset value, the current offering price of the Class P-I shares is $8.90 per share.
As of December 31, 2019, and December 31, 2018, our advisor owned 23,601 shares.
As of December 31, 2019, we had received subscriptions for and issued 50,190,331 of our shares (including shares issued under the DRP) for gross proceeds of $465,384,994 (before dealer-manager fees of $4,307,374 and selling commissions of $14,190,829 for net proceeds of $446,886,791). As of December 31, 2018, we had received subscriptions for and issued 38,319,164 of our shares (including shares issued under the DRP) for gross proceeds of $360,420,438 (before dealer-manager fees of $4,075,482 and selling commissions of $13,596,582 for net proceeds of $342,748,374).
OUR ADVISOR
GCM, a private firm that is registered as an investment adviser under the Investment Advisers Act of 1940, as amended (the “Advisers Act”), serves as our advisor. Under the direction of our board of directors, GCM manages our day-to-day operations and provides advisory and management services to us.
Led by its Chief Executive Officer, David Sher, who has over 10 years of experience in the energy infrastructure and project finance sector and in excess of 25 years of experience in the financial services sector, its President and Chief Investment Officer, Charles Wheeler (Mr. Wheeler also serves as our President and board of directors’ member, as well as President, CEO and as a director of GREC), who has greater than 30 years of experience in the energy infrastructure and project finance sector as well as the financial services sector, its Chief Financial Officer, Richard Butt, who has over 10 years of experience in the energy infrastructure and project finance sector and over 35 years of experience in the financial services sector, and Managing Director Spencer Mash, who has 9 years of experience in energy infrastructure and over 10 years in the financial services sector, and Director Mehul Mehta, who brings over 10 years of experience in energy finance. GCM’s management team has in excess of 50 years of experience in the energy, infrastructure, and project finance sectors and over 90 years of experience in the financial services sector. Over this time, they have developed significant commercial relationships across multiple industries that we believe will benefit us as we implement our business plan. GCM maintains comprehensive renewable energy, project finance, and capital markets databases and has developed proprietary analytical tools and due diligence processes that will enable GCM to identify prospective projects and to structure transactions quickly and effectively on our behalf. Neither GCM, Greenbacker Group LLC nor our senior management team have previously sponsored any other programs, either public or non-public, or any other programs with similar investment objectives as us.
We will continue to capitalize on the significant investing experience of our advisor’s management team, including the 30+ years of investment banking and renewable energy expertise of Charles Wheeler, our Chief Executive Officer and President, and the Chief Investment Officer and President of GCM. Mr. Wheeler has held various senior positions with Macquarie Group, including Head of Financial Products for North America and Head of Renewables for North America. While serving as Head of Renewables for North America, Mr. Wheeler’s experience included evaluating wind project developers, solar asset acquisitions, assisting in the development of wind and solar greenfield projects, and assisting in the preparation of investment analyses for a biomass facility. Before moving to the United States to serve as Head of Financial Products for Macquarie Group in North America, Mr. Wheeler was a Director of the Financial Products Group in Australia with responsibility for the development, distribution and ongoing management of a wide variety of retail financial products, including Real Estate Investment Trusts, infrastructure bonds, international investment trusts and diversified domestic investment trusts. Mr. Wheeler brings his extensive background in renewable energy and project and structured finance to help us effectively execute our strategy.
6
GCM’s Chief Executive Officer, David Sher has extensive experience in the financial services and capital markets industries as well as significant successful entrepreneurial experience. Mr. Sher was previously a senior adviser at Prospect Capital Corporation, a mezzanine debt and private equity firm that manages a publicly traded, closed-end, dividend-focused business development company. Prior to joining Prospect, Mr. Sher was a serial entrepreneur, founding a number of ventures in the financial services and brokerage industry. Mr. Sher was a founder and Managing Director of ESP Technologies, a leading provider of financial software and services to institutional asset managers and hedge funds. Prior to ESP, Mr. Sher was a founder and CEO of an online brokerage company, ElephantX dot com Inc. He was also co-founder of Lafayette Capital Management LLC, a statistical arbitrage hedge fund, and spent six years at The Bear Stearns and Company, Inc. where he developed trading ideas and strategies for institutional and brokerage correspondent clearing customers.
Together with Charles Wheeler and David Sher, Richard Butt is an integral part of GCM’s management team with extensive experience in the investment management industry. Over the course of his 35+ year career, Mr. Butt has held a variety of senior management positions for global investment and financial institutions. Most recently, from July 2012 to August 2013, he served as President and Chief Executive Officer of P3 Global Management LLC, a firm focused on investing in municipal infrastructure assets. From August 2006 to January 2011, he served as President of Macquarie Capital Investment Management LLC., with offices in New York and Sydney, Australia, responsible for administration, operations, finance, compliance, treasury, marketing, business operations and FX/cash management for portfolios domiciled in North America, Australia, Asia, Europe and the Caribbean. In addition, Mr. Butt served as Chief Financial and Accounting Officer for Macquarie Global Infrastructure Fund, a New York Stock Exchange listed closed end fund (NYSE: MGU). Prior to joining Macquarie, Mr. Butt served as President of Refco Alternative Investments LLC and Refco Fund Holdings LLC, the commodity pool businesses associated with Refco, Inc., from January 2003 to August 2006. In this capacity, Mr. Butt was responsible for the initial development and ongoing operations of numerous public and private commodity pools. During the period from 1990 through 2003, he served in various operational and financial capacities with multiple mutual/hedge fund third party administration firms. Earlier in his career, he served as Vice President at Fidelity Investments, where he was responsible for fund accounting and financial reporting for all equity and global mutual funds. Mr. Butt is a Certified Public Accountant (Inactive) previously working at major accounting firms such as PricewaterhouseCoopers LLP, from July 1978 to July 1984, where he was an Audit Manager, and KPMG from December 1994 to October 1996, where he was a Director in their financial services consulting practice. Mr. Butt holds a bachelor’s degree in Management Science from Duke University.
Spencer Mash, who is responsible for analyzing all potential asset acquisitions, has extensive experience in structuring, modeling, performing diligence for, and executing transactions such as mergers and acquisitions, investments in private debt securities and bankruptcy restructurings. Prior to joining GCM, from 2010 to 2011, Mr. Mash was employed by TM Capital Corp., a boutique investment bank where he focused on sell side mergers and acquisitions assignments and bankruptcy restructurings. From 2008 to 2009, Mr. Mash was an investment analyst at Gandhara Capital LTD, a long/short hedge fund investing in global large cap public equity. From 2005 to 2008, Mr. Mash was employed by Deerfield Capital Management in its Leveraged Finance Group. Mr. Mash’s duties included performing in-depth due diligence and financial analyses, negotiating loan documentation and monitoring for over 20 investments in private middle market first lien, second lien, mezzanine and one-stop senior secured debt investments. From 2003 to 2005, Mr. Mash was an analyst at Bank of America Merrill Lynch, where he analyzed, structured and marketed financial sponsor- and mergers and acquisitions-related leveraged loan and high yield securities.
Mehul Mehta, who is responsible for investment origination, has extensive experience in structuring, modeling, performing diligence for energy finance. He has served as a Vice President of GCM since June 2016 bringing with him 10 years of experience within energy finance, working in a wide variety of roles and functions over that period. From 2015 to 2016 Mehul worked at BlackRock Infrastructure Investment Group as an Associate within the Global Renewable Power team, helping structure and execute investments into the North American renewable power space. Prior to this role, he worked at UBS within the equity research department helping cover alternative energy and semiconductor capital equipment companies, working on a team consistently ranked as a top research team by Institutional Investor. From 2012 to 2014 he worked at Recurrent Energy, a leading solar developer, where he worked in Business Planning and Analysis, helping the company COO oversee development, construction, and operations of solar assets and in the Originations group helping to analyze deals for bidding and executing Power Purchase Agreements. Mehul began his career as a power and natural gas options trader, first at Bank of America Merrill Lynch from 2006 to 2009 and later from 2009 to 2010 at Hess Energy Trading Company (now Hartree, a part of Oaktree Investments). Mehul received his BA in Mathematics and Economics from New York University and his MBA from Yale University.
7
INVESTMENT COMMITTEE OF OUR ADVISOR
Our advisor utilizes an internal investment committee to oversee the implementation of our investment strategy and to govern multiple aspects of our portfolio. The investment committee, among other things:
| ● | determines the composition of our portfolio, the nature and timing of the changes to our portfolio and the manner of implementing such changes; |
| ● | identifies, evaluates and negotiates the structure of the investments we make (including performing due diligence on our prospective projects); |
| ● | closes and monitors the investments we make; and |
| ● | assists in the preparation of requests to members. |
The investment committee is comprised of Charles Wheeler, who also serves as President of the company, and President and Chief Investment Officer of our advisor and a member of our board of directors, David Sher, who serves as Chief Executive Officer of our advisor and is a member of our board of directors, and Robert Brennan, who is a Director of the company, and also serves as Co-Chairmen of Greenbacker Group, LLC. All investments are required to be unanimously approved by the GCM investment committee prior to consideration and approval by the company.
OVERVIEW OF SIGNIFICANT GOVERNMENT INCENTIVES
The renewable energy and energy efficiency sector attract significant U.S. federal, state and local government support and incentives to address technical barriers to the deployment of renewable energy and energy efficiency technologies and to promote the use of renewable energy and energy saving strategies. These U.S. federal, state and local government incentives have historically functioned to increase (1) the revenue generated by, and (2) the equity returns available from, renewable energy projects. Energy efficiency projects are also eligible to receive government incentives at the U.S. federal, state and local levels that can be applied to offset project development costs. Governments in other jurisdictions also provide several types of incentives.
Corporate entities are eligible to receive benefits through tax credits, such as PTCs, ITCs, tax deductions, accelerated depreciation and U.S. federal grants and loan guarantees (from the U.S. Department of Energy, for instance), as described below.
The following is a description of certain U.S. federal and state government incentives, which we may utilize in executing our business strategy.
U.S. Federal Incentives
The impacts of the Tax Cuts and Jobs Act of 2017 (the “TCJA”) that are effective for tax years beginning January 1, 2018 include updates concerning depreciation that have been assessed by our advisor’s management team and are highlighted in the sections below.
Corporate Depreciation: Modified Accelerated Cost Recovery System (“MACRS”). Under MACRS, owners of renewable energy and some energy efficiency projects can recover capital invested through accelerated depreciation, which reduces the payment of corporate tax. Bonus depreciation under Section 168(k) of the Internal Revenue Code of 1986, as amended (the “Internal Revenue Code”) is extended and modified. Businesses can now immediately deduct 100% of the cost of eligible property in the year it is placed in service, through 2022. Also, the TCJA eliminated the rule that made bonus depreciation available only for new property. The changes in the TCJA provide more flexibility than the current bonus depreciation rules in that they permit a taxpayer to depreciate an asset that is not new; however, the asset must be acquired from a third party in an arm’s-length sale.
Production Tax Credits. PTCs are provided to owners of certain renewable energy projects that produce electricity for sale to unrelated persons. This credit is applicable for a 10-year period from the time a project is placed into service and benefits owners with tax liabilities against which to claim the tax credit. As part of the federal tax extenders legislation passed in December 2015, the 2.3 cent-per kilowatt hour PTC for wind has been extended through 2016 and 2.4 cent-per kilowatt hour for 2017 and 2018. Projects that begin construction in 2017 will see a 20% reduction in the incentive. The PTC will then drop 20% each year through 2019 then 100% reduction beginning in 2020 and thereafter.
8
Investment Tax Credits. ITCs provide that eligible systems, such as solar systems and fuel cell systems, receive a credit of 30% of the eligible cost-basis with no maximum limit. This credit is currently structured as a tax credit, whereby the owners of a qualifying renewable energy or energy efficient project can receive the tax credit once the project is placed into service. Also, under the federal tax extenders legislation passed in December 2015, the 30% ITC for solar energy will be extended for another three years. It will then ramp down incrementally through 2021 and remain at 10% permanently beginning in 2022. This provision was unaltered by the TCJA.
State Incentives
Renewable Portfolio Standards. RPSs, while varying based on jurisdiction, specify that a portion of the power utilized by local utilities must be derived from renewable energy sources. Currently, according to the U.S. Energy Information Administration’s (“EIA”) Annual Energy Outlook 2019, more than 30 state and territorial governments have enacted RPS programs, set mandates, or set goals that require utilities to include or obtain a minimum percentage of their energy from specific renewable energy sources. Under the RPS programs, utilities can (1) build or own renewable energy generation facilities, (2) purchase energy or RECs generated from renewable energy generation facilities, or (3) pay a penalty for any shortfalls in meeting the RPS.
Renewable Energy Certificates. RECs (or EECs) are used in conjunction with compliance with an RPS program or as tradable certificates that represents a certain number of kilowatt hours of energy that have been generated by a renewable source or that have been saved by an energy efficiency project, which provide further support to renewable energy initiatives. RECs are produced in conjunction with the generation of renewable energy and can used for state RPS compliance, traded or sold to load-serving entities or to third parties, brokers and other market makers for investment purposes. Many states have specific compliance carve-outs for different types of renewable generation.
Feed-In Tariffs. Certain U.S. states and provinces of Canada have implemented feed-in tariffs (“FITs”) that entitle the renewable energy producer to enter into long-term contracts pursuant to which payment is based on the cost of generation for the diverse types of renewable energy projects. In addition to differences in FITs based on the type of project, FITs vary based on projects in various locations, such as rooftops or ground-mounted for solar PV projects, different sizes, and different geographic regions. FITs are available to anyone including homeowners, business owners, farmers, as well as private investors. The tariffs are typically designed to ratchet downward over time to both track and encourage technological change.
Tax Reform
The TCJA was enacted on December 22, 2017. ASC 740, Accounting for Income Taxes, required companies to recognize the effect of tax law changes in the period of enactment even though the effective date for most provisions was for tax years beginning after December 31, 2017, or in the case of certain other provisions, January 1, 2018. We have completed our assessment during 2017.
The major provisions under the TCJA and impact are discussed below:
Corporate Tax Rate
The law reduced the corporate tax rate to 21% effective December 22, 2017. A company must remeasure its deferred tax assets and liabilities to reflect the effects of enacted changes in tax laws or rates at the date of enactment, i.e., the date the President signed the law, even though the changes may not be effective until future periods. The effect of the remeasurement was reflected in the period ending December 31, 2017 and was allocated directly to income tax expense (benefit) included in Net Investment Income.
9
Repatriation of existing earnings and profits
Under the Act, a company’s foreign earnings and profits (E&P) accumulated in controlled foreign corporations (CFCs) under legacy tax laws are deemed repatriated for the last taxable year of a CFC that begins before January 1, 2018. E&P are determined as the higher of the balance at November 2 or December 31, 2017. The tax on those deemed repatriated earnings is no longer indefinitely deferred but may be paid over eight years with no interest charged:
| — | 8% in each of Years 1 to 5; |
| — | 15% in Year 6; |
| — | 20% in Year 7; and |
| — | 25% in Year 8. |
The Company has one Canadian CFC. This CFC has negative E&P at the end of 12/31/2019. As such, no mandatory repatriation is required.
Cost Recovery
Under the Act, a company can expense 100% of investments in depreciable property other than real property or certain utility property and certain businesses with floor plan indebtedness. The new rules apply to original or used property. The new rules apply to investments after September 27, 2017 and before January 1, 2023 and will phase-out beginning January 1, 2023 through December 31, 2026.
The Company expects to opt out of the 100% deduction on its eligible assets acquired in 2018, 2019 and 2020.
Interest Expense Limitation
Under the Act, effective January 1, 2018, a company can only deduct interest expense up to the amount of business interest income plus 30% of “adjusted taxable income”. For taxable years beginning after December 31, 2017 and before January 1, 2022, the definition of adjusted taxable income is computed without regard to the deduction for depreciation, amortization, or depletion. Beginning in 2022, depreciation, amortization, and depletion must be considered when calculating adjusted taxable income. The disallowed interest expense can be carried forward indefinitely. Certain businesses with average gross receipts of $25 million or less are exempt from the rule.
Since the Company reports depreciation as cost of goods sold for tax purposes, we cannot addback the depreciation expense in calculating the adjusted taxable income. Based on our analysis of the adjusted taxable income calculation we do not expect to be subject to the interest expense limitation.
Net Operating Losses (NOL)
Under the Act, for NOLs generated after December 31, 2017, it can only offset up to 80% of taxable income. The unused NOL can be carried forward indefinitely. The NOL generated before January 1, 2018 remains subject to the old rules (i.e., 100% utilization and 20-year expiration). When scheduling out NOL utilization for the valuation reserve analysis, the Company applied the currently in force NOL limitation rules.
The Company expects to generate adequate future net income within the twenty-year carryforward period to utilize all pre-2017 Federal NOLs and to utilize all post 2018 Federal NOLs with an indefinite carryforward period, as well as using all current State NOL carryforwards except for Montana.
ENVIRONMENTAL REGULATION
Various U.S. federal, state and local permits are required to construct renewable energy and energy efficiency projects. The projects in which we invest must conform to all applicable environmental regulations and codes, including those relating to the discharge of materials into the air, water and ground, which will vary from place to place and time to time, as well as based on the type of renewable energy asset involved in the project.
We seek to purchase, finance or otherwise invest in projects that are at least “shovel ready,” meaning that all, or substantially all, planning, engineering and permitting, including all major permits and approvals from local and state regulatory agencies, are in place and construction can begin immediately or upon receipt of certain final permits that must be obtained immediately prior to construction. However, the projects in which we invest may incur significant costs in the ordinary course of business related to operations, maintenance and continued compliance with these laws, regulations and permit requirements.
10
Failure to comply with these laws, regulations and permit requirements may result in administrative, civil and criminal penalties, imposition of investigatory, clean-up and site restoration costs and liens, denial or revocation of permits or other authorizations and issuance of injunctions to limit or cease operations. In addition, claims for damages to persons or property have been brought and may in the future result from environmental and other impacts of the activities of our projects.
COMPETITION
Although we believe there is currently a capital shortage in the renewable energy sector, we will still compete for projects with other energy corporations including investment funds (including private equity funds and mezzanine funds), traditional financial services companies such as commercial banks and other sources of funding, as well as utilities and other producers of electricity. Moreover, alternative investment vehicles also make investments in renewable energy projects. Our competitors may be substantially larger and have considerably greater financial, technical and marketing resources than we do.
STAFFING
We do not have any employees. Our day-to-day investment operations are managed by GCM. In addition, pursuant to an administration agreement with Greenbacker Administration, it provides us with administrative services including accounting, compliance and asset management services for all our investments. As of the date hereof, Greenbacker Administration has delegated certain of its administrative functions to U.S. Bank Global Fund Services. Greenbacker Administration may enter into similar arrangements with other third-party administrators as necessary in the future. While Greenbacker Administration performs the majority of asset management, accounting and oversight services for the company’s investments, it is anticipated that Greenbacker Administration will continue to delegate certain administrative functions to third parties for the LLC and GREC to recognize certain operational efficiencies for the benefit of the company.
ADVISORY AGREEMENT
Advisory Services
GCM, a private firm that is registered as an investment adviser under the Advisers Act, serves as our advisor. Under the direction of our board of directors, GCM manages our day-to-day operations and provides advisory and management services to us. Under the terms of our advisory agreement, GCM will, among other things:
| ● | determine the composition of our portfolio, the nature and timing of the changes to our portfolio and the manner of implementing such changes; |
| ● | identify, evaluate and negotiate the structure of the investments we make (including performing due diligence on our prospective projects); |
| ● | close and monitor the investments we make; and |
| ● | assist in the preparation of requests to members. |
Our advisor and its officers and employees currently spend substantially all their time and resources on us. Pursuant to our advisory agreement, officers and personnel of the advisor who provide services to us must comply with our code of business conduct and ethics, including the conflicts of interest policy included in the code of business conduct and ethics. However, GCM’s services under the advisory agreement are not exclusive, and it, and its members and affiliates, are free to furnish similar services to other entities so long as its services to us are not impaired. The advisor and its affiliates may face conflicts in the allocation of investment opportunities to us and others. In order to address these conflicts, the company has instituted an investment allocation policy that addresses the allocation of investment opportunities.
The advisory agreement was initially approved by our board of directors and became effective on April 25, 2014. Unless earlier terminated, the advisory agreement will remain in effect for successive one-year periods if approved annually by a majority of our independent directors. The advisory agreement was most recently re-approved in February 2020, for a one-year period commencing April 24, 2020.
We may terminate the advisory agreement, without penalty, upon 60 days’ written notice. The decision to terminate the agreement may be made by a majority of our independent directors. In addition, GCM may terminate the advisory agreement with us upon 120 days’ written notice. If the advisory agreement is terminated or not renewed, we will pay our advisor accrued and unpaid fees and expense reimbursements, including any payment of subordinated fees, earned prior to termination or non-renewal of the advisory agreement. Furthermore, if the advisory agreement is terminated or not renewed, GCM will have no further obligation to incur offering expenses on behalf of the company and we will not have any further obligation to reimburse GCM for operating or offering expenses not reimbursed as of the date of the termination.
11
Pursuant to the advisory agreement, GCM is authorized to retain one or more sub-advisors with expertise in our target assets to assist GCM in fulfilling its responsibilities under the advisory agreement. However, GCM will be required to monitor any sub-advisor to ensure that material information discussed by management of any sub-advisor is communicated to our board of directors, as appropriate. If GCM retains any sub-advisor, our advisor will pay such sub-advisor a portion of the fees that it receives from us. We will not pay any additional fees to a sub-advisor. While our advisor will oversee the performance of any sub-advisor, our advisor will remain primarily liable to us to perform all of its duties under the advisory agreement, including those delegated to any sub-advisor. As of December 31, 2019, no sub-advisors have been retained by GCM.
Management Fee and Incentive Allocation and Distribution
Pursuant to an advisory agreement, we pay GCM a base management fee for advisory and management services. The base management fee is calculated at a monthly rate of 0.167% (2.00% annually) of our gross assets (including amounts borrowed). For services rendered under the advisory agreement, the base management fee is payable monthly in arrears. The base management fee is calculated based on the average of the values of our gross assets for each day of the prior month. Base management fees for any partial period are appropriately pro-rated.
GCM may elect to defer or waive all or a portion of the fees that would otherwise be paid to it in its sole discretion. Any portion of a deferred fee not taken as to any period will be deferred without interest and may be taken in any other period prior to the occurrence of a liquidity event as GCM may determine in its sole discretion. In May 2019, GCM agreed to cap the amount of corporate leverage included in the calculation of gross assets at no more than $50,000,000. GCM has agreed to permanently waive any fees currently earned in excess of this leverage cap.
In addition, the Special Unitholder, an entity affiliated with our advisor, holds the special unit in our company entitling it to an incentive allocation and distribution. Pursuant to the company’s amended and restated limited liability company agreement (“LLC Agreement”), the incentive allocation and distribution, or incentive distribution, is comprised of three parts as follows: The first part, the income incentive distribution, is calculated and payable quarterly in arrears based on our pre-incentive distribution net investment income for the immediately preceding fiscal quarter. For this purpose, pre-incentive distribution net investment income means (1) interest income, (2) dividend income from equity investments (but excluding that portion of distributions that are treated as a return of capital) and (3) any other income (including any other fees, such as commitment, origination, structuring, diligence and consulting fees or other fees that we receive, but excluding any fees for providing managerial assistance) accrued during the fiscal quarter, minus our operating expenses for the fiscal quarter (including the base management fee, expenses payable under the administration agreement with our Administrator, and any interest expense and distributions paid on any issued and outstanding indebtedness and preferred units of limited liability company interest, but excluding the incentive distribution). Pre-incentive distribution net investment income includes, in the case of investments with a deferred interest feature (such as original issue discount, debt instruments with pay in kind interest and zero-coupon securities), accrued income that we have not yet received in cash. If interest income is accrued but never paid, our board of directors would decide to write off the accrual in the fiscal quarter when the accrual is determined to be uncollectible in accordance with U.S. generally accepted accounting principles (“GAAP”). The write off would cause a decrease in interest income for the fiscal quarter equal to the amount of the prior accrual. GCM is not under any obligation to reimburse us for any part of the incentive distribution it received that was based on accrued income that we never receive as a result of a default by an entity on the obligation that resulted in the accrual of such income. Pre-incentive distribution net investment income does not include any realized capital gains, realized capital losses, unrealized capital appreciation or depreciation or any accrued income taxes and other taxes including, but not limited to, franchise, property, and sales taxes. Pre-incentive distribution net investment income, expressed as a rate of return on the value of our average adjusted capital at the end of the fiscal quarter will be compared to a “hurdle rate” of 1.75% per fiscal quarter (7.00% annualized). Our net investment income used to calculate this part of the incentive distribution is also included in the amount of our gross assets used to calculate the 2.00% annualized base management fee.
Adjusted capital shall mean: cumulative gross proceeds generated from sales of our shares and preferred units of limited liability company interests (including our distribution reinvestment plan) reduced for distributions to members of proceeds from non-liquidation dispositions of our assets and amounts paid for share repurchases pursuant to our share repurchase program. Average adjusted capital shall mean: the average value of the adjusted capital for the two most recently completed fiscal quarters.
12
The Special Unitholder shall receive an incentive distribution with respect to our pre-incentive distribution net investment income in each fiscal quarter as follows:
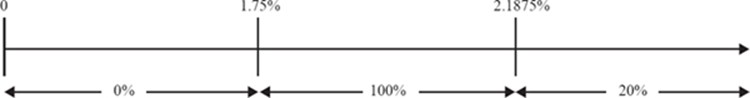
| ● | no incentive distribution in any fiscal quarter in which our pre-incentive distribution net investment income does not exceed the “hurdle rate” of 1.75%; |
| ● | 100% of our pre-incentive distribution net investment income with respect to that portion of such pre-incentive distribution net investment income, if any, that exceeds the hurdle but is less than 2.1875% in any fiscal quarter (8.75% annualized with a 7% annualized hurdle rate). We refer to this portion of our pre-incentive distribution net investment income (which exceeds the hurdle but is less than 2.1875%) as the “catch-up.” The “catch-up” is meant to provide the Special Unitholder with 20% of our pre-incentive distribution net investment income as if a hurdle did not apply if this net investment income exceeds 2.1875% in any fiscal quarter; and |
| ● | 20% of the amount of our pre-incentive distribution net investment income, if any, that exceeds 2.1875% in any fiscal quarter (8.75% annualized with a 7% annualized hurdle rate) is distributed to the Special Unitholder (once the hurdle is reached and the catch-up is achieved, 20% of all pre-incentive distribution investment income thereafter is allocated to the Special Unitholder). |
The following is a graphical representation of the calculation of the income-related portion of the incentive distribution:
Quarterly Incentive Distribution Based on Net Investment Income
Pre-incentive distribution net investment income
(expressed as a percentage of the value of average adjusted capital)
Percentage of pre-incentive distribution net investment income allocated to the Special Unitholder
These calculations are appropriately prorated for any period of less than three months and adjusted for any share issuances or repurchases during the relevant quarter. You should be aware that a rise in the general level of interest rates can be expected to lead to higher interest rates applicable to our debt investments. Accordingly, an increase in interest rates would make it easier for us to meet or exceed the incentive distribution hurdle rate and may result in an increase of the amount of incentive distributions payable to the Special Unitholder with respect to pre-incentive distribution net investment income.
The second part of the incentive distribution, the capital gains incentive distribution, will be determined and payable in arrears as of the end of each fiscal quarter (or upon termination of the advisory agreement, as of the termination date) and will equal 20.0% of our realized capital gains, if any, on a cumulative basis from inception through the end of each fiscal quarter, computed net of all realized capital losses and unrealized capital depreciation on a cumulative basis, less the aggregate amount of any previously paid capital gains incentive distributions. For purposes of calculating the foregoing: (1) the calculation of the incentive distribution shall include any capital gains that result from cash distributions that are treated as a return of capital, (2) any such return of capital will be treated as a decrease in our cost basis of an investment, and (3) all quarterly valuations will be determined by us in accordance with our valuation procedures. In determining the capital gains incentive distribution to which the Special Unitholder may be entitled, we will calculate the aggregate realized capital gains, aggregate realized capital losses and aggregate unrealized capital depreciation, as applicable, with respect to each of our assets. For this purpose, aggregate realized capital gains, if any, will equal the sum of the differences between the net sales price of each investment, when sold or otherwise disposed, and the aggregate cost basis of such investment reduced by cash distributions that are treated as returns of capital. Aggregate realized capital losses will equal the sum of the amounts by which the net sales price of each investment, when sold or otherwise disposed, is less than the aggregate cost basis of such investment reduced by cash distributions that are treated as returns of capital. Aggregate unrealized capital depreciation will equal the sum of the difference, if negative, between the valuation of each investment as of the applicable date and the aggregate cost basis of such investment reduced by cash distributions that are treated as returns of capital. At the end of the applicable period, the amount of capital gains that serves as the basis for our calculation of the capital gains incentive distribution will equal the aggregate realized capital gains, excluding any accrued income taxes and other taxes including, but not limited to, franchise, property, and sales taxes associated with the sale or disposal of the asset, less aggregate realized capital losses and less aggregate unrealized capital depreciation with respect to our assets. If this number is positive at the end of such period, then the capital gains incentive distribution for such period will be equal to 20% of such amount, less the aggregate amount of any capital gains incentive distributions paid in all prior periods.
13
Because of the structure of the incentive distribution, it is possible that the Special Unitholder may be entitled to receive an incentive distribution in a fiscal quarter where we incur a loss. For example, if we receive pre-incentive distribution net investment income in excess of the hurdle rate for a fiscal quarter, we will make the applicable income incentive distribution even if we have incurred a loss in that fiscal quarter due to realized or unrealized losses on our investments.
The third part of the incentive distribution, which we refer to as the liquidation incentive distribution, will equal 20.0% of the net proceeds from a liquidation of our company in excess of adjusted capital, as calculated immediately prior to liquidation. In the event of any liquidity event that involves a listing of our shares, or a transaction in which our members receive shares of a company that is listed, on a national securities exchange, if that liquidity event produces a listing premium (which we define as the amount, if any, by which our listing value following such liquidity event exceeds the adjusted capital, as calculated immediately prior to such listing), the liquidation incentive distribution, which will equal 20% of any listing premium, will be determined and payable in arrears 30 days after the commencement of trading following such liquidity event. To calculate this distribution, our “listing value” will be the product of: (i) the number of listed shares and (ii) average closing price per share over the 30 trading-day period following such liquidity event. To calculate the listing premium, any cash consideration received by members in connection with any such liquidity event will be included in (as an addition to) our listing value. If the members receive non-listed securities as full or partial consideration with respect to any listing, no value will be attributed to such non-listed securities.
The liquidation incentive distribution is payable in cash or shares, or in any combination thereof.
Upon the occurrence of (1) non-renewal of the advisory agreement upon the expiration of its then current term; (2) termination of the advisory agreement for any reason under circumstances where an affiliate of Greenbacker Group LLC does not serve as the advisor under any replacement advisory agreement; or (3) resignation of GCM under the advisory agreement, which we refer to as a “trigger event”, we will have the right, but not the obligation, to repurchase the special unit or the special preferred stock, as applicable, at the fair market value of the special unit or the special preferred stock on the date of termination, as determined by an independent appraiser. In such event, the purchase price will be paid in cash or shares of limited liability company interests, at the option of the Special Unitholder. We must purchase any such interests within 120 days after giving the Special Unitholder written notice of our desire to repurchase the special unit or the special preferred stock. If the advisory agreement is terminated or not renewed, we will pay our advisor accrued and unpaid fees and expense reimbursements, including any payment of subordinated fees, earned prior to termination or non-renewal of the advisory agreement.
Examples of Quarterly Incentive Distribution Calculation
Example 1: Income Related Portion of Incentive Distribution:
Alternative 1
Assumptions
Investment income (including interest, distributions, fees, etc.) = 1.25% Hurdle rate(1) = 1.75%
Management fee(2) = 0.500%
Other operating expenses (i.e. legal, accounting, custodian, transfer agent, etc.) = 0.20%
Pre-incentive distribution net investment income
(investment income – (management fee + other operating expenses)) = 0.55%
Pre-incentive net investment income does not exceed hurdle rate, therefore there is no incentive distribution.
14
Alternative 2
Assumptions
Investment income (including interest, distributions, fees, etc.) = 2.70% Hurdle rate(1) = 1.75%
Management fee(2) = 0.50%
Other operating expenses (i.e. legal, accounting, custodian, transfer agent, etc.) = 0.20%
Pre-incentive distribution net investment income
(investment income – (management fee + other operating expenses)) = 2.00%
Pre-incentive net investment income exceeds hurdle rate, therefore there is an income incentive distribution payable by us to GCM.
| Incentive distribution | = 100% × pre-incentive distribution net investment income, subject to the “catch-up”(3) | |
| = 100% × (2.00 % – 1.75%) | ||
| = 0.25% |
Alternative 3
Assumptions
Investment income (including interest, distributions, fees, etc.) = 3.00% Hurdle rate(1) = 1.75%
Management fee(2) = 0.50%
Other operating expenses (i.e. legal, accounting, custodian, transfer agent, etc.) = 0.20%
Pre-incentive distribution net investment income
(investment income – (management fee + other operating expenses)) = 2.30%
Pre-incentive net investment income exceeds hurdle rate, therefore there is an income incentive distribution made to the Special Unitholder.
Incentive distribution = 20% × pre-incentive distribution net investment income, subject to “catch-up”(3)
Incentive distribution = 100% × “catch-up” + (20% × (pre-incentive distribution net investment income – 2.1875%)) Catch-up = 2.1875% – 1.75%
| = 0.4375% |
Incentive distribution = (100% × 0.4375%) + (20% × (2.3% – 2.1875%))
| = 0.4375% + (20% × 0.1125%) | |
| = 0.4375% + 0.0225% | |
| = 0.46% |
| (1) | Represents 7.00% annualized hurdle rate. |
| (2) | Represents 2.00% annualized management fee. |
| (3) | The “catch-up” provision is intended to provide the Special Unitholder with an incentive distribution of 20% on all our pre-incentive distribution net investment income as if a hurdle rate did not apply when our net investment income exceeds 2.1875% in any fiscal quarter. |
Example 2: Capital Gains Portion of Incentive Distribution:
Alternative 1
Assumptions
| ● | Year 1: $20 million investment made in company A (“Investment A”), and $30 million investment made in company B (“Investment B”) |
| ● | Year 2: Investment A sold for $50 million and fair market value (“FMV”) of Investment B determined to be $32 million |
| ● | Year 3: FMV of Investment B determined to be $25 million |
| ● | Year 4: Investment B sold for $31 million |
15
The capital gains portion of the incentive distribution would be:
| ● | Year 1: None |
| ● | Year 2: Capital gains incentive distribution of $6 million ($30 million realized capital gains on sale of Investment A multiplied by 20%) |
| ● | Year 3: None |
| ● | Year 4: Capital gains incentive distribution of $200,000 |
$6.2 million ($31 million cumulative realized capital gains multiplied by 20%) less $6 million (capital gains fee taken in Year 2)
Alternative 2
Assumptions
| ● | Year 1: $20 million investment made in company A (“Investment A”), $30 million investment made in company B (“Investment B”) and $25 million investment made in company C (“Investment C”) |
| ● | Year 2: Investment A sold for $50 million, FMV of Investment B determined to be $25 million and FMV of Investment C determined to be $25 million |
| ● | Year 3: FMV of Investment B determined to be $27 million and Investment C sold for $30 million |
| ● | Year 4: FMV of Investment B determined to be $35 million |
| ● | Year 5: Investment B sold for $20 million |
The capital gains incentive distribution, if any, would be:
| ● | Year 1: None |
| ● | Year 2: $5 million capital gains incentive distribution |
| ● | 20% multiplied by $25 million ($30 million realized capital gains on Investment A less $5 million unrealized capital depreciation on Investment B) |
| ● | Year 3: $1.4 million capital gains incentive distribution(1) |
$6.4 million (20% multiplied by $32 million ($35 million cumulative realized capital gains less $3 million unrealized capital depreciation)) less $5 million capital gains fee received in Year 2
| ● | Year 4: None |
| ● | Year 5: None |
$5 million (20% multiplied by $25 million (cumulative realized capital gains of $35 million less realized capital losses of $10 million)) less $6.4 million cumulative capital gains fee paid in Year 2 and Year 3
| (1) | As illustrated in Year 3 of Alternative 1 above, if we were to be wound up on a date other than December 31st of any year, we may have paid aggregate capital gains incentive distributions that are more than the amount of such fees that would be payable if we had been wound up on December 31 of such year. |
16
Example 3: Liquidation Incentive Distribution:
Alternative 1
Assumptions
| ● | Year 1: Gross offering proceeds total $85 million. $20 million investment made in company A (“Investment A”), $30 million investment made in company B (“Investment B”) and $25 million investment made in company C (“Investment C”). |
| ● | Year 2: Investment A sold for $25 million and all proceeds, net of any capital gains incentive distributions payable, are returned to members. FMV of Investment B determined to be $30 million and FMV of Investment C determined to be $27 million. |
| ● | Year 3: FMV of Investment B determined to be $31 million. FMV of Investment C Determined to be $20 million. |
| ● | Year 4: FMV of Investment B determined to be $35 million. FMV of Investment C determined to be $25 million. |
| ● | Year 5: Investments B and C sold in an orderly liquidation for total proceeds of $55 million. All proceeds, net of any capital gains incentive distributions payable, are returned to members. |
The capital gains incentive distribution, if any, would be:
| ● | Year 1: None |
| ● | Year 2: Incentive distribution on capital gains during operations of $1 million ($5 million realized capital gains on sale of Investment A multiplied by 20.0%). Adjusted capital now equals $61 million ($85 million gross proceeds less $24 million returned to members from the sale of portfolio investments). |
| ● | Year 3: None |
| ● | Year 4: None |
| ● | Year 5: No liquidation incentive distribution due—Liquidation proceeds of $55 million are less than adjusted capital immediately prior to liquidation ($61 million). |
Alternative 2
Assumptions
| ● | Year 1: Gross offering proceeds total $85 million. $20 million investment made in company A (“Investment A”), $30 million investment made in company B (“Investment B”) and $25 million investment made in company C (“Investment C”). |
| ● | Year 2: Investment A sold for $25 million and all proceeds, net of any capital gains incentive distributions payable, are returned to members. FMV of Investment B determined to be $30 million and FMV of Investment C determined to be $27 million. |
| ● | Year 3: FMV of Investment B determined to be $31 million. FMV of Investment C determined to be $20 million. |
| ● | Year 4: FMV of Investment B determined to be $35 million. FMV of Investment C determined to be $25 million. |
| ● | Year 5: Investments B and C sold in an orderly liquidation for total proceeds of $80 million. All proceeds, net of any capital gains incentive distributions payable, are returned to members. |
The capital gains incentive distribution, if any, would be:
| ● | Year 1: None |
17
| ● | Year 2: Incentive distribution on capital gains during operations of $1 million ($5 million realized capital gains on sale of Investment A multiplied by 20.0%). Adjusted capital now equals $61 million ($85 million gross proceeds less $24 million returned to members from the sale of portfolio investments). |
| ● | Year 3: None |
| ● | Year 4: None |
| ● | Year 5: $3.8 million liquidation incentive distribution—20.0% multiplied by liquidation proceeds ($80 million) in excess of adjusted capital immediately prior to liquidation ($61 million), or $19 million. |
Alternative 3 (If the liquidity event is a listing)
Assumptions
| ● | Year 1: Gross offering proceeds total $85 million. $20 million investment made in company A (“Investment A”), $30 million investment made in company B (“Investment B”) and $25 million investment made in company C (“Investment C”). |
| ● | Year 2: Investment A sold for $25 million and all proceeds, net of any capital gains incentive distributions payable, are returned to members. |
Incentive distribution on capital gains paid to GCM of $1 million ($5 million realized capital gains on sale of Investment A multiplied by 20.0%). Adjusted capital now equals $61 million ($85 million gross proceeds less $24 million returned to members from the sale of portfolio investments).
| ● | Year 3: No change in adjusted capital. |
| ● | Year 4: No change in adjusted capital. |
| ● | Year 5: All shares of the company are listed on a national securities exchange. The listing value is $85 million. |
The liquidation incentive distribution in this example would be:
Year 5: $4.8 million liquidation incentive distribution (20% multiplied by $24 million listing premium ($85 million listing value in excess of $61 million of adjusted capital immediately prior to listing)).
The returns shown are for illustrative purposes only. There is no guarantee that positive returns will be realized and actual returns may vary from those shown in the examples above.
Payment of Our Expenses
Our primary operating expenses are the payment of advisory fees and other expenses under the advisory agreement and other expenses necessary for our operations. Our advisory fee compensates GCM for its work in identifying, evaluating, negotiating, executing, and monitoring our investments. We also pay fees and expenses on a direct cost basis to Greenbacker Administration or others engaged by the Greenbacker Administration for the administrative services they provide directly or indirectly under the administration agreement.
We will bear all other expenses of our operations and transactions, including (without limitation) fees and expenses relating to:
| ● | corporate and organizational expenses relating to offerings of our shares, subject to limitations included in the advisory agreement; |
| ● | the cost of effectuating sales and repurchase of units; |
| ● | the cost of calculating our net asset value, including the related fees and cost of retaining third-party valuation services; |
| ● | investment advisory fees; |
18
| ● | fees payable to third parties relating to, or associated with our financial and legal affairs, making investments, and valuing investments, including fees and expenses associated with performing due diligence reviews of prospective investments and sub-advisors; |
| ● | Certain transfer agent and custodial fees; |
| ● | Federal, state and local taxes/registration fees; |
| ● | costs of board meetings, unitholders’ reports and notices, proxy statements and directors’ fees and expenses; |
| ● | fidelity bond, directors and officers/errors and omissions liability insurance and other insurance premiums; |
| ● | direct costs, including those relating to printing of unitholder reports and advertising or sales materials, mailing, telephone and staff; |
| ● | fees and expenses associated with independent audits and outside legal costs, including compliance with the Sarbanes-Oxley Act of 2002 and applicable federal and state securities laws; |
| ● | costs associated with our reporting and compliance obligations under applicable federal and state securities laws; |
| ● | brokerage commissions, origination fees and any investment banking fees related to our investments; |
| ● | all other expenses incurred by GCM, in performing its obligations subject to the limitations included in the advisory agreement; and |
| ● | all other expenses incurred by either the Administrator, its delegates or us in connection with administering our business, including payments for the administrative services the Administrator provides under the administration agreement that will be based upon our allocable portion (subject to the review and approval of our board of directors) of the Administrator’s overhead and other expenses. |
Organization and Offering Expenses
We reimburse our advisor and its affiliates for organization and offering expenses it may incur on our behalf under any public offering of shares but, with respect to our prior public offering, only to the extent that the reimbursement would not cause the selling commissions, the dealer manager fee and the other organization and offering expenses borne by us to exceed 15.0% of gross offering proceeds as of the date of the reimbursement. These organization and offering expenses included all expenses (other than selling commissions and the dealer manager fee) paid by us relating to the offering, including but not limited to:
| ● | Our legal, accounting, printing, mailing and filing fees; |
| ● | Certain charges of our transfer agent, charges of our advisor for administrative services related to the issuance of shares in the offering; |
| ● | Reimbursement of bona fide due diligence expenses of broker-dealers; |
19
| ● | Reimbursement of our advisor for costs relating to preparing sales materials, the cost of bona fide training and education meetings held by us (primarily the travel, meal and lodging costs of registered representatives of broker-dealers), attendance and sponsorship fees and cost reimbursement for employees of our affiliates to attend retail seminars conducted by broker-dealers; and |
| ● | Reimbursement to participating broker-dealers for technology costs associated with the offering, costs and expenses related to such technology costs and costs and expenses associated with the facilitation of the marketing of shares and the ownership of shares by such broker-dealers’ customers, which will be included in underwriting compensation. |
Organization and offering costs are calculated and borne by the company with respect to each offering pursuant to a separate Registration Statement. For the offering pursuant to the Registration Statement on Form S-1 (File No. 333-178786-01), which was declared effective on August 7, 2013 and was terminated on February 7, 2017, total organization and offering costs borne by the company were approximately $7,556,000, or 4.8% of gross offering proceeds. For the offering pursuant to the Registration Statement on Form S-1 (File No. 333-211571) which commenced on February 8, 2017 and which primary offering terminated as of March 29, 2019, total organization and offering costs borne by the company have been $2,265,560.
Other Operating Expenses
We will reimburse the expenses incurred by GCM, Greenbacker Administration or their affiliates relating to its provision of services to us, including the investigation and monitoring of our investments, oversight of third party service providers including accounting and administration entities, accounting services for any of our investments and any costs incurred in connection with GCM’s valuation methodologies or the effectuating of sales and repurchases of our shares and other securities. We will not reimburse our advisor, Greenbacker Administration or their affiliates for (i) rent or depreciation, utilities, capital equipment and other administrative items; (ii) salaries, fringe benefits and other comparable items incurred or allocated to any controlling person of GCM; (iii) the salaries and benefits paid to any executive officer or board member of GCM; or (iv) any services for which GCM receives a separate fee.
Indemnification
The advisory agreement provides that, absent willful misfeasance, bad faith or negligence in the performance of its duties or by reason of the reckless disregard of its duties and obligations, GCM and its officers, managers, partners, agents, employees, controlling persons, members and any other person or entity affiliated with it are entitled to indemnification from us for any damages, liabilities, costs and expenses (including reasonable attorneys’ fees and amounts reasonably paid in settlement) arising from the rendering of GCM’s services under the advisory agreement or otherwise as advisor of the company. Notwithstanding the above, our LLC Agreement provides that we shall not hold harmless our advisor or any of its affiliates for any loss or liability suffered by us unless all of the following conditions are met:
| ● | the party seeking exculpation or indemnification has determined in good faith that the course of action leading to the loss or liability was in our best interests; |
| ● | the party seeking exculpation or indemnification was acting on our behalf or providing services to us; |
| ● | the loss or liability was not the result of negligence or misconduct; and |
| ● | the indemnification is recoverable only out of net assets and not from our members. |
Organization of GCM
GCM is a Delaware limited liability company. The principal executive offices of GCM are located at 30 Danforth Street, Suite 206, Portland, Maine 04101.
VALUATION PROCESS AND DETERMINATION OF NET ASSET VALUE
Relevance of Our Net Asset Value
Our net asset value is calculated and published on a quarterly basis. For all our current investments, market quotations are not available and are valued at fair value as determined in good faith by our advisor and reviewed by an independent valuation firm, currently Alvarez & Marsal Valuation Services, LLC, subject to the review and approval of the board of directors.
20
Our net asset value will:
| ● | be disclosed in our quarterly and annual consolidated financial statements; |
| ● | determine the price per share that is paid to shareholder participants in our share repurchase program, and the price per share paid by participants in our distribution reinvestment |
| ● | be an input in the computation of fees earned by our advisor and the Special Unitholder whose fees and distributions are linked, directly or indirectly, in whole or part to the value of our gross assets; and |
| ● | be evaluated alongside the net proceeds per share to us from the current offering to ensure the net offering price per share is not above or below our net asset value per share. |
Determination of Our Net Asset Value
We calculate our net asset value per share by subtracting all liabilities from the total carrying amount of our assets, which includes the fair value of our investments, and dividing the result by the total number of outstanding shares on the date of valuation.
We have adopted Accounting Standards Codification Topic 820, Fair Value Measurements and Disclosures (“ASC Topic 820”) which defines fair value, establishes a framework for measuring fair value in accordance with generally accepted accounting principles and expands disclosures about fair value measurements.
ASC Topic 820 defines fair value as “the price that would be received to sell an asset or paid to transfer a liability in an orderly transaction between market participants at the measurement date”, other than a forced sale or liquidation. The transaction to sell the asset or transfer the liability is a hypothetical transaction at the measurement date, considered from the perspective of a market participant that holds the asset or owes the liability. ASC Topic 820 provides a consistent definition of fair value which focuses on exit price and prioritizes, within a measurement of fair value, the use of market-based inputs over entity-specific inputs. In addition, ASC Topic 820 provides a framework for measuring fair value and establishes a three-level hierarchy for fair value measurements based upon the transparency of inputs to the valuation of an asset or liability as of the measurement date. The three levels of valuation hierarchy established by ASC Topic 820 are defined as follows:
| Level 1: | Unadjusted quoted prices for identical assets or liabilities in active markets. |
| Level 2: | Other significant observable inputs that are sourced either directly or indirectly from publications or pricing services, including dealer or broker markets, for identical or comparable assets or liabilities. Generally, these inputs should be widely accepted and public, non-proprietary and sourced from an independent third party. |
| Level 3: | Inputs derived from a significant amount of unobservable market data and derived primarily through the use of internal valuation methodologies |
In all cases, the level in the fair value hierarchy within which the fair value measurement in its entirety falls will be determined based on the lowest level of input that is significant to the fair value measurement. Our assessment of the significance of a particular input to the fair value measurement in its entirety requires judgment and considers factors specific to each investment.
Our board of directors will have the ability to review our advisor’s valuation methodologies each quarter regarding GCM’s presentation of its valuation recommendations to the audit committee. If during the period between quarterly board of directors’ meetings, GCM determines that significant changes have occurred since the prior meeting of the board of directors at which it presented its recommendations on the valuation methodology, then GCM will also prepare and present recommendations to the audit committee of the board of directors of its proposed changes to the current valuation methodology. Any such changes to our valuation methodologies will require the approval of our board of directors, including a majority of our independent directors. We will disclose any material change in our valuation methodologies or any material change in our investment criteria or strategies that would constitute a fundamental change in a registration statement amendment prior to its implementation.
Our board of directors has approved the selection of an independent valuation firm to review our advisor’s valuation methodology and to work with our advisor and officers to provide additional inputs for consideration by our audit committee and to work directly with our full board of directors, at the board of directors’ request, with respect to the fair value of investments. Generally, one quarter of our investments are reviewed by an independent valuation firm each quarter, on a rotating quarterly basis. Accordingly, each such investment would be evaluated by an independent valuation firm at least once per year.
21
The determination of the fair value of our investments requires judgment, especially with respect to investments for which market quotations are not available. For most of our investments, market quotations will not be available. Due to the inherent uncertainty of determining the fair value of investments that do not have a readily available market value, the fair value of the investments may differ significantly from the values that would have been used had a readily available market value existed for such investments, and the differences could be material. Because the calculation of our net asset value is based, in part, on the fair value of our investments as determined by our advisor, who is affiliated with us, our calculation of net asset value is to a degree, subjective and could be adversely affected if the determinations regarding the fair value of our investments were materially higher than the values that we ultimately realize upon the disposal of such investments.
Net Asset Value Determinations in Connection with our Continuous Offerings
Since commencing operations on April 25, 2014, the company has sold shares on a continuous basis at the following prices (in each case, based on the then - current net asset value determination):
| Period | Class | |||||||||||||||||||||||||
| From | To | A | C | I | P-A | P-I | ||||||||||||||||||||
| 25-Apr-14 | 4-Nov-15 | $ | 10.00 | $ | 9.58 | $ | 9.19 | NA | NA | |||||||||||||||||
| 5-Nov-15 | 4-Feb-16 | $ | 10.02 | $ | 9.60 | $ | 9.21 | NA | NA | |||||||||||||||||
| 5-Feb-16 | 5-May-16 | $ | 10.05 | $ | 9.62 | $ | 9.23 | NA | NA | |||||||||||||||||
| 6-May-16 | 3-Aug-16 | $ | 10.07 | $ | 9.64 | $ | 9.25 | $ | 9.59 | $ | 8.81 | |||||||||||||||
| 4-Aug-16 | 6-Nov-16 | $ | 10.23 | $ | 9.79 | $ | 9.39 | $ | 9.79 | $ | 8.95 | |||||||||||||||
| 7-Nov-16 | 7-Feb-17 | $ | 10.28 | $ | 9.58 | $ | 9.45 | $ | 9.78 | $ | 8.83 | |||||||||||||||
| 8-Feb-17 | 4-May-17 | $ | 10.22 | $ | 9.53 | $ | 9.39 | $ | 9.70 | $ | 8.76 | |||||||||||||||
| 5-May-17 | 17-May-17 | $ | 10.17 | $ | 9.48 | $ | 9.34 | $ | 9.70 | $ | 8.69 | |||||||||||||||
| 18-May-17 | 3-Aug-17 | $ | 9.74 | $ | 9.07 | $ | 8.94 | $ | 9.70 | $ | 8.69 | |||||||||||||||
| 4-Aug-17 | 2-Nov-17 | $ | 9.72 | $ | 9.08 | $ | 8.93 | N/A | $ | 8.73 | ||||||||||||||||
| 3-Nov-17 | 5-Feb-18 | $ | 9.74 | $ | 9.09 | $ | 8.94 | N/A | $ | 8.75 | ||||||||||||||||
| 6-Feb-18 | 6-May-18 | $ | 9.78 | $ | 9.09 | $ | 8.98 | $ | 9.65 | * | $ | 8.81 | ||||||||||||||
| 7-May-18 | 2-Aug-18 | $ | 9.80 | $ | 9.12 | $ | 9.01 | $ | 9.68 | $ | 8.84 | |||||||||||||||
| 3-Aug-18 | 31-Oct-18 | $ | 9.83 | $ | 9.17 | $ | 9.03 | $ | 9.69 | $ | 8.90 | |||||||||||||||
| 1-Nov-18 | 6-Feb-19 | $ | 9.79 | $ | 9.15 | $ | 8.99 | $ | 9.68 | $ | 8.89 | |||||||||||||||
| 7-Feb-19 | 6-May-19 | $ | 9.63 | $ | 9.01 | $ | 8.84 | $ | 9.50 | ** | $ | 8.76 | ||||||||||||||
| 7-May-19 | 1-Aug-19 | N/A | N/A | N/A | N/A | $ | 8.76 | |||||||||||||||||||
| 2-Aug-19 | 8-Nov-19 | N/A | N/A | N/A | N/A | $ | 8.77 | |||||||||||||||||||
| 9-Nov-19 | 19-Mar-20 | N/A | N/A | N/A | N/A | $ | 8.93 | |||||||||||||||||||
| 20-Mar-20 | - | N/A | N/A | N/A | N/A | $ | 8.90 | |||||||||||||||||||
| * | Effective April 16, 2018 |
| ** | Ceased February 8, 2019 |
Our advisor, in conjunction with an independent valuation firm, subject to the review and approval of the board of directors, determines our net asset value for each class of our shares at each quarter end. To the extent that our net asset value per share on the most recent valuation date increases above or decreases below our net proceeds per share as stated in this annual report, the company will adjust the offering prices of all classes of shares. The adjustments to the per share offering prices, will ensure that after the effective date of the new offering prices, the offering prices per share, after deduction of selling commissions, dealer manager fees and organization and offering expenses, are not above or below our net asset value per share as of such valuation date.
The purchase price per share to be paid by each investor will be equal to the price that is in effect on the date such investor submits his or her completed subscription agreement to our transfer agent.
22
Investing in our shares involves several significant risks. In addition to the other information contained herein, you should consider carefully the following information before making an investment in our shares. If any of the following events occur, our business, financial condition and results of operations could be materially and adversely affected. In such case, the value of our shares could decline, and you may lose part or all your investment.
Risks Related to Our Business and Structure
Because we have not yet reached a fully invested minimum level of net assets to support distributions exclusively from cash flow from operations, we have a large accumulated deficit.
While we had accumulated deficit balances of $(38,477,220) and $(19,870,206) as of December 31, 2019 and 2018, respectively, the full financial condition of earnings and loss is best understood when accumulated unrealized appreciation is considered alongside accumulated deficit. As of December 31, 2019, and 2018, our total accumulated deficit, accumulated net realized gain on investments and accumulated unrealized appreciation combined was $(105,876) and $(3,519,212) (i.e. net positive (negative) earning), respectively. When we commenced operations, we expected an accumulated deficit in the initial stages of operations for several reasons. Because we had not yet been fully invested and are still in the early stages of our investing cycle, expenses as a percentage of assets have run higher than they would be expected to run on a higher amount of invested assets.
Our ability to achieve our investment objectives depends on GCM’s ability to manage and support our investment process. If GCM were to lose any members of its senior management team, our ability to achieve our investment objectives could be significantly harmed.
We have no internal management capacity or employees other than our appointed executive officers and are dependent on the diligence, skill and network of business contacts of GCM’s senior management team to achieve our investment objective. We also depend, to a significant extent, on GCM’s access to its investment professionals and the information and deal flow generated by these investment professionals. GCM’s senior management team will evaluate, negotiate, structure, close, and monitor our assets. Our success will depend to a significant extent on the continued service of GCM’s senior management team, particularly David Sher, Charles Wheeler, and Richard Butt. The departure of any of GCM’s senior management team could have a material adverse effect on our ability to achieve our investment objectives.
Because our business model depends to a significant extent upon relationships with renewable energy and energy efficiency developers, utilities, energy companies, investment banks, commercial banks, individual and institutional investors, consultants, EPC companies, contractors, and renewable energy and energy efficiency technology manufacturers (such as panel manufacturers), the inability of GCM to maintain relationships, or the failure of these relationships to generate business opportunities, could adversely affect our business.
We rely to a significant extent on GCM’s relationships with renewable energy and energy efficiency developers, energy consultants, retail energy providers, utilities, energy companies, investment banks, commercial banks, individual and institutional investors, consultants, EPC companies, contractors, and renewable energy and energy efficiency technology manufacturers (such as panel manufacturers), among others, as a source of potential investment opportunities. If GCM fails to maintain its relationships with other sponsors or sources of business opportunities, we will not be able to grow our portfolio or will grow it at a slower rate. In addition, individuals with whom GCM’s professionals have relationships are not obligated to provide us with business opportunities, and, therefore, there is no assurance that such relationships will generate business opportunities for us.
23
We may face increasing competition for business opportunities, which could delay deployment of our capital, reduce returns and result in losses.
We will compete for potential projects and business investments with other energy corporations, investment funds (including private equity funds and mezzanine funds), traditional financial services companies such as commercial banks and other sources of funding as well as utilities and other business entities. Moreover, alternative investment vehicles also make investments in renewable energy and energy efficiency projects. Our competitors may be substantially larger and have considerably greater financial, technical and marketing resources than we do. For example, some competitors may have a lower cost of capital and access to funding sources that are not available to us. In addition, some of our competitors may have higher risk tolerances or different risk assessments than we have. These characteristics could allow our competitors to consider a wider variety of investments, establish more relationships and offer better pricing and more flexible structuring than we are able to do. We may lose business opportunities if we do not match our competitors’ pricing, terms and structure. If we are forced to match our competitors’ pricing, terms and structure, we may not be able to achieve acceptable risk-adjusted returns on our projects or may bear risk of loss. A significant part of our competitive advantage stems from the fact that the renewable energy and energy efficiency market is underserved by traditional commercial banks and other financial sources when compared to the size of opportunity. A significant increase in the number and/or the size of our competitors in this target market could force us to accept less attractive investment terms.
The amount of any distributions we may pay is uncertain. We may not be able to sustain the payment of distributions, and our distributions may not grow over time.
Subject to our board of directors’ discretion, based upon management’s recommendations, and applicable legal restrictions, we authorized, declared and paid distributions monthly starting in September 2014. However, while we intend to pay these distributions to our members out of assets legally available for distribution, we cannot assure you that we will achieve investment results that will allow us to make a targeted level of cash distributions or year-to-year increases in cash distributions. Our ability to pay distributions might be adversely affected by, among other things, the impact of the risks described herein. All distributions will be paid at the discretion of our board of directors, based on management’s recommendations, and will depend on our earnings, our financial condition, compliance with applicable regulations and such other factors as our board of directors may deem relevant from time to time. We cannot assure you that we will pay distributions to our members in the future. In the event that we encounter delays in locating suitable business opportunities, we may pay all or a substantial portion of our distributions from borrowings, the proceeds of this offering and other sources, without limitation. During certain periods, the company has paid distributions from sources other than cash flow from operations, including offering proceeds. The company expects to continue to fund distributions from a combination of cash from operations as well as offering proceeds until a minimum of $250 million in net assets is reached, the company is fully invested in operating assets, and our operating assets are appropriately leveraged. If we fund distributions from financings, then such financings will need to be repaid, and if we fund distributions from offering proceeds, then we will have fewer funds available for investments in renewable energy and energy efficiency projects, which may affect our ability to generate future cash flows from operations and, therefore, reduce your overall return. These risks will be greater for persons who acquire our shares relatively early in this offering, before a significant portion of the offering proceeds have been invested. Accordingly, members who receive the payment of a dividend or other distribution from us should not assume that such dividend or other distribution is the result of a net profit earned by us.
There is no public market for our shares and the shares are subject to limited transferability.
There is no public market for our shares, and none is expected to develop. Consequently, you may not be able to liquidate your investment in the event of emergencies or for other reasons or obtain financing from lenders who may not accept our shares as collateral. Your ability to transfer your shares is limited. Pursuant to our LLC Agreement, we have the discretion under certain circumstances to prohibit transfers of shares, or to refuse to consent to the admission of a transferee as a member.
We may change our investment policies and strategies without prior notice or member approval, the effects of which may be adverse.
We have the authority to modify or waive our current investment policies, criteria and strategies without prior notice and without member approval, subject to the review and approval of the board of directors. In such event, we will promptly file a prospectus supplement and a press release on Form 8-K, disclosing any such modification or waiver. We cannot predict the effect any changes to our current investment policies, criteria and strategies would have on our business, operating results and value of our shares. However, the effects might be adverse, which could negatively impact our ability to pay you distributions and cause you to lose all or part of your investment. Moreover, we will have significant flexibility in investing the net proceeds of this offering and may use the net proceeds from this offering in ways with which investors may not agree or for purposes other than those contemplated at the time of this offering.
24
Efforts to comply with the Sarbanes-Oxley Act will involve significant expenditures, and non-compliance with the Sarbanes-Oxley Act may adversely affect us.
We are subject to the Sarbanes-Oxley Act of 2002, or the Sarbanes-Oxley Act, and the related rules and regulations promulgated by the SEC. We will be required to review on an annual basis our internal control over financial reporting, and on a quarterly and annual basis to evaluate and disclose changes in our internal control over financial reporting. As a result, we expect to incur additional expenses in the near term, which may negatively impact our financial performance and our ability to pay distributions. This process also will result in a diversion of management’s time and attention. We cannot be certain as to the timing of completion of our evaluation, testing and remediation actions or the impact of the same on our operations and we may not be able to ensure that the process is effective or that our internal control over financial reporting is or will be effective in a timely manner. If we are unable to maintain or achieve compliance with the Sarbanes-Oxley Act and related rules, we may be adversely affected.
We may experience fluctuations in our quarterly results.
We could experience fluctuations in our quarterly operating results due to a number of factors, including, but not limited to, our ability to consummate transactions, the terms of any transactions that we complete, variations in the earnings and/or distributions paid by our investments, variations in the interest rates on loans we make, the level of our expenses, variations in and the timing of the recognition of realized and unrealized gains or losses, changes in market prices for RECs or EECs, the availability of governmental incentives for our projects, electricity demand, changes in regulated or market electricity prices, marking to market of our hedging arrangements (if any), the degree to which we encounter competition in our markets, the amount of uninvested cash and cash equivalents that we maintain on our balance sheet, the amount of pre-operational assets currently owned, and general economic conditions. Because of these factors, results for any period should not be relied upon as being indicative of performance in future periods.
We may experience fluctuations in our operating expenses.
We could experience fluctuations in our operating expenses due to many factors, including, but not limited to, changes in inflation and the flow on effects on prices generally, the terms of any transactions that we complete, changes in operating conditions, changes to our operating environment, unexpected wear and tear of our investments, changes in the perception of risk associated with operating these assets. Because of these factors, results for any period should not be relied upon as being indicative of performance in future periods.
We are not able to insure against all potential risks and may become subject to higher insurance premiums.
Our business is exposed to the risks inherent in the construction and operation of renewable energy and energy efficiency projects, such as breakdowns, manufacturing defects, natural disasters, terrorist attacks and sabotage. We are also exposed to environmental risks. We have insurance policies covering certain risks associated with our business. However, our insurance policies do not cover losses due to force majeure, terrorist attacks or sabotage, among other things. Further, we do not maintain insurance for certain environmental risks, such as environmental contamination. In addition, we expect our insurance policies will be subject to annual review by our insurers and may not be renewed at all or on similar or favorable terms. A serious uninsured loss or a loss significantly exceeding the limits of our insurance policies could have a material adverse effect on our business, financial condition and results of operations.
In the event we pursue any projects or investments outside of the United States, we will be subject to currency rate exposure and certain other risks associated with the uncertainty of foreign laws and markets.
We may make investments in projects outside of the United States to the extent that such international investments help us meet our investment objectives. To the extent that we invest in international projects, we will be subject to fluctuations in foreign currency exchange rates and the uncertainty of foreign laws and markets, including but not limited to, unexpected changes in regulatory requirements, political and economic instability in certain geographic locations, difficulties in managing international operations, currency exchange, controls, potentially adverse tax consequences, and the administrative burden associated with complying with foreign laws. Changes in foreign currency exchange rates may adversely impact the fair values and earnings streams of our international investments and therefore the returns on our non-dollar denominated investments. Although we may hedge our foreign currency risk, we may not be able to do so successfully and may incur losses on any international investments due to exchange rate fluctuations.
25
If we internalize our management functions or otherwise acquire a portion of GCM, your interest in us could be diluted, and we could incur other significant costs and face other significant risks associated with being self-managed or owning a portion of an asset manager.
We may decide in the future to internalize our management functions. If we do so, we may elect to negotiate to acquire GCM’s assets and personnel. At this time, we cannot anticipate the form or amount of consideration or other terms relating to any such transaction. Such consideration could take many forms, including cash payments, promissory notes and shares. The payment of such consideration could result in dilution of your interests as a member and could reduce the earnings per share attributable to your investment.
In addition, if we internalized our management function, while we would no longer bear the costs of the various fees and expenses we expect to pay to GCM under the advisory agreement, we would incur the compensation and benefits costs of our officers and other employees and consultants that we now expect will be paid by GCM or its affiliates. In addition, we may issue equity awards to officers, employees and consultants, which awards would decrease net income and may further dilute your investment. We cannot reasonably estimate the amount of fees we would save or the costs we would incur if we became self-managed. If the expenses we assume as a result of internalization are higher than the expenses we avoid paying to GCM, our earnings per share would be lower as a result of the internalization than they otherwise would have been, potentially decreasing the amount of funds available to distribute to our members and the value of our shares. As currently organized, we do not expect to have any employees. If we elect to internalize our operations, we would employ personnel and would be subject to potential liabilities commonly faced by employers, such as workers’ disability and compensation claims, potential labor disputes and other employee-related liabilities and grievances.
If we internalize our management functions, we could have difficulty integrating these functions as a stand-alone entity. In addition, we could have difficulty retaining such personnel employed by us. We expect individuals employed by GCM to perform asset management, and an affiliate of GCM to perform general and administrative functions, including accounting and financial reporting for us. These personnel have a great deal of know-how and experience. We may fail to properly identify the appropriate mix of personnel and capital needs to operate as a stand-alone entity. An inability to manage an internalization transaction effectively could result in our incurring excess costs and/or suffering deficiencies in our disclosure controls and procedures or our internal control over financial reporting. Such deficiencies could cause us to incur additional costs, and our management’s attention could be diverted from most effectively managing our assets.
If we seek to internalize management functions, we do so as part of a multi-stepped transaction over an extended period of time, which longer time horizon and more complex set of transactions may increase the risk that we fail to fully consummate the desired internalization and/or that, if consummated, the costs of such transactions are greater than a single-step internalization transaction.
In some cases, internalization transactions involving the acquisition of an advisor have resulted in litigation. If we were to become involved in such litigation regarding an internalization of our management functions, we could be forced to spend significant amounts of money defending ourselves in such litigation, regardless of the merit of the claims against us, which would reduce the amount of funds available to make investments or make distributions to our members.
Your investment return may be reduced if we are required to register as an investment company under the Investment Company Act.
We intend to conduct our operations directly and through wholly or majority-owned subsidiaries, so that the company and each of its subsidiaries do not fall within or are excluded from the definition of an “investment company” under the Investment Company Act. Under Section 3(a)(1)(A) of the Investment Company Act, a company is deemed to be an “investment company” if it is, or holds itself out as being, engaged primarily, or proposes to engage primarily, in the business of investing, reinvesting or trading in securities. Under Section 3(a)(1)(C) of the Investment Company Act, a company is deemed to be an “investment company” if it is engaged, or proposes to engage, in the business of investing, reinvesting, owning, holding or trading in securities and owns or proposes to acquire “investment securities” having a value exceeding 40% of the value of its total assets (exclusive of U.S. Government securities and cash items) on an unconsolidated basis, which we refer to as the “40% test.” Excluded from the term “investment securities,” among other instruments, are U.S. Government securities and securities issued by majority-owned subsidiaries that are not themselves investment companies and are not relying on the exception from the definition of investment company set forth in Section 3(c)(1) or Section 3(c)(7) of the Investment Company Act.
26
We intend to conduct our operations so that the company is not required to register as an investment company. The company is organized as a holding company that conducts its business primarily through its subsidiaries. The company intends to conduct operations so that it and most of its subsidiaries will comply with the 40% test. We will monitor our holdings on an ongoing basis and determine compliance with this test in connection with new acquisitions. We expect that most, if not all, of our wholly-owned and majority-owned subsidiaries will be outside the definitions of investment company under Section 3(a)(1)(A) and Section 3(a)(1)(C) or relying on an exception from the definition of investment company other than the exceptions under Section 3(c)(1) and Section 3(c)(7) of the Investment Company Act. Consequently, interests in these subsidiaries (which are expected to constitute most, if not all, of our assets) generally will not constitute “investment securities.” Accordingly, we believe that the company will not be considered an investment company under Section 3(a)(1)(C) of the Investment Company Act. We believe the company will not be considered an investment company under Section 3(a)(1)(A) of the Investment Company Act because the company will not engage primarily or hold itself out as being engaged primarily in the business of investing, reinvesting or trading in securities. Rather, through the company’s wholly-owned or majority-owned subsidiaries, the company is primarily engaged in the non-investment company businesses of these subsidiaries, namely the business of acquiring and financing renewable energy and energy efficiency projects.
The determination of whether an entity is a majority-owned subsidiary of the company is made by us. The Investment Company Act defines a majority-owned subsidiary of a person as a company that represents 50% or more of the outstanding voting securities of which are owned by such person, or by another company which is a majority-owned subsidiary of such person. The Investment Company Act further defines voting securities as any security presently entitling the owner or holder thereof to vote for the election of directors of a company. We treat companies in which we own at least a majority of the outstanding voting securities as majority-owned subsidiaries for purposes of the 40% test. We have not requested the SEC to approve our treatment of any company as a majority-owned subsidiary and the SEC has not done so. If the SEC, or its staff, were to disagree with our treatment of one of more companies as majority-owned subsidiaries, we would need to adjust our strategy and our assets in order to continue to pass the 40% test. Any such adjustment in our strategy could have a material adverse effect on us.
Some of our majority-owned subsidiaries may also rely on the exceptions from the definition of investment company under Section 3(c)(5)(A) or (B) of the Investment Company Act, which except from the definition of investment company, respectively, (i) any person who is primarily engaged in the business of purchasing or otherwise acquiring notes, drafts, acceptances, open accounts receivable, and other obligations representing part or all of the sales price of merchandise, insurance, and services or (ii) any person who is primarily engaged in the business of making loans to manufacturers, wholesalers, and retailers of, and to prospective purchasers of, specified merchandise, insurance, and services. The SEC staff has issued no-action letters interpreting Section 3(c)(5)(A) and (B) pursuant to which the staff has taken the position that these exceptions are available to a company with at least 55% of its assets consisting of eligible loans and receivables of the type specified in Section 3(c)(5)(A) and (B). We believe that most of the loans that we will provide to finance renewable energy and energy efficiency projects will relate to the purchase price of specific equipment or the cost to engage contractors to install equipment for such projects. Accordingly, we believe that most of these loans will be eligible loans that qualify for this 55% test. However, no assurance can be given that the SEC staff will concur with this position. In addition, the SEC or its staff may, in the future, issue further guidance that may require us to re-classify our assets for purposes of qualifying with this exemption.
A change in the value of our assets could cause us or one or more of our wholly or majority-owned subsidiaries, including those relying on Section 3(c)(5)(A) or (B), to fall within the definition of “investment company” and negatively affect our ability to maintain our exemption from regulation under the Investment Company Act. To avoid being required to register the company or any of its subsidiaries as an investment company under the Investment Company Act, we may be unable to sell assets we would otherwise want to sell and may need to sell assets we would otherwise wish to retain. In addition, we may have to acquire additional income- or loss-generating assets that we might not otherwise have acquired or may have to forgo opportunities to acquire interests in companies that we would otherwise want to acquire and would be important to our investment strategy.
If we become obligated to register the company or any of its subsidiaries as an investment company, the registered entity would have to comply with a variety of substantive requirements under the Investment Company Act imposing, among other things:
|
● | limitations on capital structure; |
|
● | restrictions on specified investments; |
| ● | prohibitions on transactions with affiliates; and |
| ● | compliance with reporting, record keeping, voting, proxy disclosure and other rules and regulations that would significantly change our operations. |
If we were required to register the company as an investment company but failed to do so, we would be prohibited from engaging in our business, and criminal and civil actions could be brought against us. In addition, our contracts would be unenforceable unless a court required enforcement, and a court could appoint a receiver to take control of us and liquidate our business.
27
Risks Related to Our Advisor and Its Affiliates
Our advisor and its affiliates, including our officers and some of our directors will face conflicts of interest including conflicts that may result from compensation arrangements with us and our affiliates, which could result in actions that are not in the best interests of our members.
Our advisor and its affiliates will receive substantial fees from us in return for their services, and these fees could influence the advice provided to us. Among other matters, the compensation arrangements could affect their judgment with respect to public offerings of equity by us, which allow the dealer manager to earn additional dealer manager fees and GCM to earn increased management fees. The incentive distribution that the Special Unitholder, an affiliate of our advisor, may be entitled to receive from us may create an incentive for our advisor to oversee and supervise renewable energy or energy efficiency projects or make investments on our behalf that are risky or more speculative than would be the case in the absence of such compensation arrangement. The way in which the incentive distribution to which the Special Unitholder may be entitled is determined may encourage our advisor to use leverage to increase the return on our portfolio. In addition, the fact that our base management fee is payable based upon the average of the values of our gross assets for each day of the prior month, which would include any borrowings for investment purposes, may encourage GCM to use leverage in connection with the construction of additional projects or to make additional investments. Our LLC Agreement does not impose limitations on the amount of leverage we may employ. At such time when the net proceeds from this offering have been fully invested, we expect that we will generally target a leverage ratio of up to $2 of debt for every $1 of equity on our overall portfolio, with individual allocations of leverage based on the mix of asset types and obligors; however, we will in no event exceed a leverage ratio of $3 of debt for every $1 of equity, unless any excess is approved by a majority of our independent directors. Furthermore, GCM is primarily responsible for calculating the net asset value of our portfolio and, because the base management fee is payable based upon the average of the values of the gross assets for each day of the prior month, a higher net asset value of our portfolio would result in a higher base management fee to our advisor. Under certain circumstances, the use of leverage may increase the likelihood of default, which could adversely affect our results of operations. Such a practice could result in us making more speculative investments than would otherwise be the case, which could result in higher losses, particularly during cyclical economic downturns.
We pay substantial fees and expenses to GCM, which payments increase the risk that you will not earn a profit on your investment.
GCM performs services for us in connection with the identification, selection and acquisition of our investments, and the monitoring and administration of our other investments. We pay GCM fees for advisory and management services, including a base management fee that is not tied to the performance of our portfolio. We pay fees and commissions to the dealer manager in connection with the offer and sale of the shares. Fees paid to the dealer manager under the terminated offering reduced the amount of cash available for investment in power generation assets or distribution to our members. These fees also increased the risk that the amount available for distribution to members upon a liquidation of our portfolio would be less than the purchase price of the shares in our offering and that you may not earn a profit on your investment.
No portion of the net worth of GCM, our sponsor, and its affiliates will be available to us to satisfy our liabilities or other obligations which may expose us to risks associated with leverage.
In order to achieve our investment objectives, we may be required to utilize financial leverage. We may borrow money in order to make investments, for working capital and to make distributions to our members. No portion of the net worth of GCM, our sponsor, and its affiliates will be available to us to satisfy our liabilities or other obligations. Accordingly, we are subject to the risks that our cash flow will not be sufficient to cover the required debt service payments and repayment obligations and, to the extent that we cannot meet our financing obligations, we risk the loss of some or all our assets to liquidation or sale, at significantly depressed prices in some cases due to market conditions or otherwise, to satisfy the obligations. Furthermore, any amounts that we use to service our indebtedness will not be available for distributions to our members.
28
The time and resources that individuals associated with our advisor devote to us may be diverted, and we may face additional competition since GCM is not prohibited from raising money for or managing another entity that makes the same types of investments that we target.
We currently expect our advisor and its officers and employees to spend substantially all of their time and resources on us. However, our advisor and its officers and employees are not required to do so. Moreover, neither GCM nor its affiliates are prohibited from raising money for and managing another investment entity that makes the same types of investments as those we target. Accordingly, our and GCM’s management team may have obligations to investors in entities they work at or manage in the future, the fulfillment of which might not be in the best interests of us or our members or that may require them to devote time to services for other entities, which could interfere with the time available to provide services to us. In addition, we may compete with any such investment entity for the same investors and investment opportunities.
We do not have a policy that expressly prohibits our directors, officers, security holders or affiliates from engaging for their own account in business activities of the types conducted by us.
We do not have a policy that expressly prohibits our directors, officers, security holders or affiliates from engaging for their own account in business activities of the types conducted by us. However, our code of business conduct and ethics contains a general conflicts of interest policy to be followed by our directors and executive officers, as well as personnel of our advisor who provide services to us. In addition, the advisory agreement does not prevent the advisor and its affiliates from engaging in additional management or investment opportunities, some of which could compete with us.
Our advisor can resign on 120 days’ notice and we may not be able to find a suitable replacement within that time, resulting in a disruption in our operations that could adversely affect our financial condition, business and results of operations.
Our advisor has the right, under the advisory agreement, to resign at any time on 120 days’ written notice, whether we have found a replacement or not. If our advisor resigns, we may not be able to contract with a new advisor or hire internal management with similar expertise and ability to provide the same or equivalent services on acceptable terms within 120 days, or at all, in which case our operations are likely to experience a disruption, our financial condition, business and results of operations as well as our ability to pay distributions are likely to be adversely affected. In addition, the coordination of our internal management, acquisition activities and supervision of our businesses is likely to suffer if we are unable to identify and reach an agreement with a single institution or group of executives having the expertise possessed by our advisor and its affiliates. Even if we are able to retain comparable management, whether internal or external, the integration of such management and their lack of familiarity with our businesses may result in additional costs and time delays that may adversely affect our financial condition, business and results of operations.
Exercising our right to repurchase the special unit or the special preferred stock upon certain termination events could be prohibitively expensive and could deter us from terminating the advisory agreement.
The occurrence of a trigger event would give us the right, but not the obligation, to repurchase the special unit or the special preferred stock, as applicable, at the fair market value of the special unit or the special preferred stock on the date of termination, as determined by an independent appraiser. This repurchase could be prohibitively expensive, could require us to have to sell assets to raise sufficient funds to complete the repurchase and could discourage or deter us from terminating the advisory agreement. Alternatively, if we do not exercise our repurchase right, we might be unable to find another entity that would be willing to act as our advisor while an affiliate of GCM owns the special unit or the special preferred stock. If we do find another entity to act as our advisor, we may be subject to higher fees than the fees charged by GCM.
29
Risks Related to Our Investments and Industry Focus
Our strategic focus will be on the renewable energy, energy efficiency and related sectors, which will subject us to more risks than if we were broadly diversified.
Because we are specifically focused on the renewable energy, energy efficiency and related sectors, investments in our shares may present more risks than if we were broadly diversified over more sectors of the economy. Therefore, a downturn in the renewable energy or energy efficiency sectors would have a larger impact on us than on a company that does not concentrate in limited segments of the economy. For example, biofuel companies operating in the renewable energy sector can be significantly affected by the supply of and demand for specific products and services, especially biomass such as corn or soybean oil, the supply and demand for energy commodities, the price of capital expenditures, government regulation, world and regional events and economic conditions. Companies that produce renewable energy can be negatively affected by lower energy output resulting from variable inputs, mechanical breakdowns, faulty technology, competitive electricity markets or changing laws which mandate the use of renewable energy sources by electric utilities.
In addition, companies that engage in energy efficiency projects may be unable to protect their intellectual property or face declines in the demand for their services due to changing governmental policies or budgets. At times, the returns from investments in the renewable energy and energy efficiency sectors may lag the returns of other sectors or the broader market.
Furthermore, with respect to the construction and operation of individual renewable energy and energy efficiency projects, there are several additional risks, including:
| ● | substantial construction risk, including the risk of delay, that may arise due to inclement weather or labor disruptions; |
|
● | the risk of entering into markets where we have limited experience; |
| ● | the need for substantially more capital to complete than initially budgeted and exposure to liabilities as a result of unforeseen environmental, construction, technological or other complications; |
| ● | a decrease in the availability, pricing and timeliness of delivery of raw materials and components, necessary for the projects to function; |
| ● | the continued good standing of permits, authorizations and consents from local city, county, state and U.S. federal governments as well as local and U.S. federal governmental organizations; and |
| ● | the consent and authorization of local utilities or other energy development off takers to ensure successful interconnection to energy grids to enable power sales. |
Our renewable energy and energy efficiency projects may be subject to the risk of fluctuations in commodity prices.
The operations and financial performance of projects in the renewable energy and energy efficiency sectors may be affected by energy commodity prices including wholesale electricity. For example, the price of renewable energy resources will change in relation to the market price of electricity. The market price of electricity is sensitive to cyclical changes in demand and capacity supply, and in the economy, as well as to regulatory trends and developments impacting electricity market rules and pricing, transmission development and investment to power markets within the United States and in other jurisdictions through interconnects and other external factors outside of the control of renewable energy power-producing projects or energy efficiency projects. In addition, volatility of commodity prices, such as the market price of electricity, may also make it more difficult for renewable energy and energy efficiency projects to raise any additional capital that may be necessary to operate, to the extent the market perceives that the project’s performance may be tied directly or indirectly to commodity prices. Accordingly, the potential revenue and cash flow of these projects may be volatile and adversely affect the value of our investments.
Existing regulations and policies and changes to these regulations and policies may present technical, regulatory and economic barriers to the purchase and use of energy generation and consumption projects, including solar and wind energy projects, which may significantly reduce our ability to meet our investment objectives.
The market for electricity generation and consumption projects is influenced by U.S. federal, state and local government regulations and policies concerning the electric utility industry, as well as policies promulgated by electric utilities. Similar government influences apply in the other jurisdictions in which we may invest. These regulations and policies often relate to electricity pricing and technical interconnection of customer-owned electricity generation. In the United States and in several other countries, these regulations and policies are being modified and may continue to be modified. Customer purchases of, or further investment in the research and development of, alternative energy sources, including solar energy technology, could be deterred by these regulations and policies, which could result in a significant reduction in the potential demand for renewable energy and energy efficiency project development and investments. For example, without certain major incentive programs and or the regulatory mandated exception for renewable energy or energy efficiency systems, utility customers are often charged interconnection or standby fees for putting distributed power generation on the electric utility network. These fees could increase the cost to our customers of using our renewable energy and energy efficiency projects and make them less desirable, thereby harming our business, prospects, results of operations and financial condition.
30
We anticipate that our renewable energy and energy efficiency projects will be subject to oversight and regulation in accordance with national and local ordinances relating to building codes, safety, environmental protection, utility interconnection and metering and related matters. It is difficult to track the requirements of individual states and design equipment to comply with the varying standards. Any new government regulations or utility policies pertaining to our renewable energy or energy efficiency projects may result in significant additional expenses or related development costs and, as a result, could cause a significant reduction in demand for our investments.
Certain projects may generate a portion of their revenue from the sales of RECs and EECs, which may be subject to market price fluctuations, and there is a risk of a significant, sustained decline in their market prices. Such a decline may make it more difficult for our projects to grow and become profitable.
We may not be able to foster growth for our projects economically if there is a significant, sustained decline in market prices for electricity, RECs or EECs without a commensurate decline in the cost of equipment, such as solar panels and turbines, and the other capital costs of constructing renewable energy and energy efficiency projects. Electricity prices are affected by numerous factors and may decline for many reasons that are not within our control. Those factors include changes in the cost or availability of fuel, regulatory and governmental actions, changes in the amount of available generating capacity from both traditional and renewable sources, changes in power transmission or fuel transportation capacity, seasonality, weather conditions and changes in demand for electricity. In addition, other power generators may develop innovative technologies or improvements to traditional technologies to produce power that could increase the supply of electricity and cause a sustained reduction in market prices for electricity, RECs and EECs. If governmental action or conditions in the markets for electricity, RECs or EECs cause a significant, sustained decline in the market prices of electricity or those attributes, without an offsetting decline in the cost of turbines or other capital costs of renewable energy and energy efficiency projects, we may not be able to construct our pipeline of projects or achieve expected revenues, which could have a material adverse effect on our business, financial condition and results of operations.
Our business will be subject to the risk of extreme or changing weather patterns.
Extreme weather patterns, such as the 2011 Joplin tornado, Hurricane Sandy in 2012, and wildfires in California in 2017, 2018, and 2019 and Hurricane Maria in Puerto Rico in 2017, could result in significant volatility in the supply and prices of energy. This volatility may create fluctuations in commodity or energy prices and earnings of companies in the renewable energy and energy efficiency sectors. In general, extreme weather, such as hurricanes, lightning strikes, ice storms, tornados, extreme wind, severe storms, wildfires and other unfavorable weather conditions or natural disasters, such as floods, fires and earthquakes, can have an adverse impact on the input and output commodities associated with the renewable energy sector or require us to shut down the equipment associated with our renewable energy projects, such as solar panels, turbines or related equipment and facilities, which would impede the ability of our project facilities ability to maintain and operate, and decrease electricity production levels and our revenue. Operational problems, such as degradation of our project’s equipment due to wear or weather or capacity limitations or outages on the electrical transmission network, can also affect the amount of energy that our projects are able to deliver. Any of these events, to the extent not fully covered by insurance, could have a material adverse effect on our business, financial condition and results of operations.
31
The profitability of our projects may be adversely affected if they are subject to regulation under the Federal Power Act (“FPA”), state, or local public utility laws and regulations that regulate the sale of electricity.
Companies owning or operating electric generation projects may be subject to regulatory requirements under the FPA, state, or local public utility laws. The FPA grants the U.S. Federal Energy Regulatory Commission (“FERC”) jurisdiction over the sale of electric power for resale (i.e., sales at wholesale) in interstate commerce. Jurisdiction over retail sales (i.e., the sale of power to end-users) is left to the states. Rates and charges for wholesale sales of electric power are subject to FERC’s supervision. Upon an appropriate showing, FERC will authorize an entity to engage in wholesale sales of electricity at negotiated rates based on market conditions (i.e., market-based rates) rather than at cost-bases rates pre-approved by FERC. FERC continues to have jurisdiction over entities granted market-based rate authority and retains the authority to remove the authorization to sell at market-based rates and otherwise impose significant regulatory obligations. FERC also has jurisdiction to regulate the issuance of securities by entities subject to its jurisdiction.
On the state level, public utility regulatory commissions have plenary jurisdiction over public utilities in their respective states, including responsibility for approving rates and other terms and conditions under which “public utilities”, as defined by relevant state law, sell retail electric power to consumers.
Certain of our projects may be Qualifying Facilities (“QFs”), and/or Exempt Wholesale Generators (“EWGs”). Depending on their production capacity, certain QFs are exempt from regulation: (i) as public utilities by FERC under the FPA; (ii) under the Public Utility Holding Company Act of 2005 (“PUHCA”); and (iii) under state law as to rates and financial and organizational regulation. EWG’s are exempt from FERC regulation under PUHCA and are subject to FERC regulation under the FPA. To the extent our projects are subject to rate regulation by FERC, their rate schedules for wholesale sales of energy, capacity and ancillary services will need to be approved by FERC. FERC may revoke or revise an entity’s authorization to make wholesale sales at market-based rates if FERC subsequently determines that such entity can exercise market power in transmission or generation, create barriers to entry or engage in abusive affiliate transactions or market manipulation.
Any market-based rate authority that we obtain will be subject to certain market behavior rules. If we are deemed to have violated these rules, we will be subject to potential disgorgement of profits associated with the violation and/or suspension or revocation of our market-based rate authority, as well as potential criminal and civil penalties. If we were to lose market-based rate authority for a project, we would be required to obtain the FERC’s acceptance of a cost-based rate schedule and could become subject to, among other things, the burdensome accounting, record keeping and reporting requirements that are imposed on public utilities with cost-based rate schedules. This could have an adverse effect on the rates we charge for power from our projects and our cost of regulatory compliance.
Certain projects, depending on their production capacity and configuration may be subject to the reliability standards of the North American Electric Reliability Corporation. If we fail to comply with the mandatory reliability standards, we could be subject to sanctions, including substantial monetary penalties.
Although the sale of electric energy has been to some extent deregulated, the industry is subject to increasing regulation and even possible re-regulation. Due to major regulatory restructuring initiatives at the U.S. federal and state levels, the U.S. electric industry has undergone substantial changes over the past several years. We cannot predict the future design of wholesale power markets or the ultimate effect ongoing regulatory changes will have on our business. Other proposals to re-regulate may be made and legislative or other attention to the electric power market restructuring process may delay or reverse the movement toward competitive markets. If deregulation of the electric power markets is reversed, discontinued or delayed, our business, financial condition and results of operations could be adversely affected.
32
Our projects may rely on electric transmission lines and other transmission facilities that are owned and operated by third parties. In these situations, our projects will be exposed to transmission facility curtailment risk, including but not limited to curtailment caused by breakdown of the power grid system, which may delay and increase the costs of our projects or reduce the return to us on those investments.
Our projects may rely on electric transmission lines and other transmission facilities owned and operated by third parties to deliver the electricity our projects generate. We expect some of our projects will have limited access to interconnection and transmission capacity because there are many parties seeking access to the limited capacity that is available. We may not be able to secure access to this limited interconnection or transmission capacity at reasonable prices or at all. Moreover, a failure in the operation by third parties of these transmission facilities could result in our losing revenues because such a failure could limit the amount of electricity we deliver. In addition, our production of electricity may be curtailed due to third-party transmission limitations or limitations on the grid’s ability to accommodate intermittent energy sources, reducing our revenues and impairing our ability to capitalize fully on a project’s potential. Such a failure or curtailment at levels significantly above which we expect could have a material adverse effect on our business, financial condition and results of operations.
We depend in part on U.S. federal, state and local government support for our renewable energy and energy efficiency projects.
We depend in part on government policies that support renewable energy and energy efficiency and enhance the economic feasibility of renewable energy and energy efficiency projects. The U.S. federal government and several of the states in which we operate or into which we sell power provide incentives that support the sale of energy from renewable sources or incentives to reduce energy consumption.
Certain renewable energy and energy efficiency projects, such as solar energy projects, may be eligible for an ITC. The placed-in-service deadline for solar energy projects to produce electricity can be as late as January 1, 2024, however construction must begin before January 1, 2020 for a full credit, dropping to 26% in 2020 with further decreases to 22% in 2021 and 10% in 2022 and beyond. The ITC is a credit claimed against the income tax of the owner of the eligible project.
In addition to U.S. federal incentives, we rely in part on state incentives that support the sale of energy generated from renewable sources and incentives to reduce energy consumption, including state adopted RPS programs. RPS programs generally require that electricity supply companies include a specified percentage of renewable energy in the electricity resources serving a state or purchase credits demonstrating the generation of such electricity by another source. However, the legislation creating such RPS requirements usually grants the relevant state public utility commission the ability to reduce electric supply companies’ obligations to meet the RPS requirements in certain circumstances. If the RPS or EEC requirements are reduced or eliminated, this could result in our receiving lower prices for our power and in a reduction in the value of our RECs, which could have a material adverse effect on us.
We depend on these programs, in part, to finance the projects in our pipeline. If any of these incentives are adversely amended, eliminated, subjected to new restrictions, not extended beyond their current expiration dates, or if funding for these incentives is reduced, it would have a material adverse effect on our ability to obtain financing. A delay or failure by governmental authorities to administer these programs in a timely and efficient manner could have a material adverse effect on our financing.
While certain U.S. federal, state and local laws, programs and policies promote renewable energy or energy efficiency and additional legislation is regularly being considered that would enhance the demand for renewable energy or reduce the consumption of energy, they may be adversely modified, legislation may not pass or may be amended, and governmental support of renewable energy and energy efficiency development may not continue or may be reduced. If governmental authorities do not continue supporting or reduce or eliminate their support of renewable energy or energy efficiency projects, our revenues may be adversely affected, our economic return on certain projects may be reduced, our financing costs may increase, it may become more difficult to obtain financing, and our business and prospects may otherwise be adversely affected.
Liability relating to environmental matters may impact the value of properties that we may acquire or the properties underlying our projects.
Under various U.S. federal, state and local laws, an owner or operator of a project may become liable for the costs of removal of certain hazardous substances released from the project of any underlying real property. These laws often impose liability without regard to whether the owner or operator knew of, or was responsible for, the release of such hazardous substances.
33
The presence of hazardous substances may adversely affect an owner’s ability to sell a contaminated project or borrow using the project as collateral. To the extent that a project owner becomes liable for removal costs, the ability of the owner to make payments to us may be reduced.
We typically have title to projects or their underlying real estate assets underlying our equity investments, or, in the course of our business, we may take title to a project or its underlying real estate assets relating to one of our debt investments, and, in either case, we could be subject to environmental liabilities with respect to these assets. To the extent that we become liable for the removal costs, our results of operation and financial condition may be adversely affected. The presence of hazardous substances, if any, may adversely affect our ability to sell the affected project and we may incur substantial remediation costs, thus harming our financial condition.
Future litigation or administrative proceedings could have a material adverse effect on our business, financial condition and results of operations.
We may become involved in legal proceedings, administrative proceedings, claims and other litigation that arise in the ordinary course of business. Individuals and interest groups may sue to challenge the issuance of a permit for a renewable energy or energy efficiency project or seek to enjoin construction of a renewable energy or energy efficiency project. In addition, we may be subject to legal proceedings or claims contesting the construction or operation of our renewable energy or energy efficiency projects. In defending ourselves in these proceedings, we may incur significant expenses in legal fees and other related expenses, regardless of the outcome of such proceedings. Unfavorable outcomes or developments relating to these proceedings, such as judgments for monetary damages, injunctions or denial or revocation of permits, could have a material adverse effect on our business, financial condition and results of operations. In addition, settlement of claims could adversely affect our financial condition and results of operations.
Our projects and/or other investments may incur liabilities that rank equally with, or senior to, our investments in such companies.
We will invest in various types of debt and equity securities, including first lien, second lien, mezzanine debt, preferred equity and common equity, issued by U.S. and Canadian middle market companies in the renewable energy, energy efficiency and related sectors. Our projects and other investments may have, or may be permitted to incur, other liabilities that rank equally with, or senior to, our positions or investments in such projects or businesses. By their terms, such instruments may entitle the holders to receive payment of interest or principal on or before the dates on which we are entitled to receive payments with respect to the instruments in which we invest. Also, in the event of insolvency, liquidation, dissolution, reorganization or bankruptcy of a portfolio company, holders of instruments ranking senior to our investment in that project or business would typically be entitled to receive payment in full before we receive any distribution. After repaying such senior stakeholders, such project or other investment may not have any remaining assets to use for repaying its obligation to us. In the case of securities ranking equally with instruments we hold, we would have to share on an equal basis any distributions with other stakeholders holding such instrument in the event of an insolvency, liquidation, dissolution, reorganization or bankruptcy of the relevant project or investment.
We may not control the projects and other investments in which we invest.
We may not control the projects and other investments in which we invest. We define control as ownership of 25% or more of the outstanding voting securities of a company, having greater than 50% representation on a company’s board of directors or being a managing member of a limited liability company. As a result, we are subject to the risk that the controlling entity of a project in which we invest may make business decisions with which we disagree and the management of such project, as representatives of the holders of their common equity, may take risks or otherwise act in ways that do not serve our interests.
We may invest in joint ventures, including partnerships, which creates additional risk because, among other things, we cannot exercise sole decision-making power and our partners may have different economic interests than we have.
We may invest in joint ventures, including partnerships, with third parties. There are additional risks involved in joint venture transactions. As a co-investor in a joint venture, we may not be in a position to exercise sole decision-making authority relating to the project or asset, joint venture or other entity. As a result, the operations of a project or other investment may be subject to the risk that the project or other investment owners may make business, financial or management decisions with which we do not agree, or the management of the project may take risks or otherwise act in a manner that does not serve our interests. Because we may not have the ability to exercise control over such operations, we may not be able to realize some or all the benefits that we believe will be created from our involvement. In addition, there is the potential of our joint venture partner becoming bankrupt and the possibility of diverging or inconsistent economic or business interests of us and our partner. These diverging interests could result in, among other things, exposing us to liabilities of the joint venture in excess of our proportionate share of these liabilities. If any of the foregoing were to occur, our business, financial condition and results of operations could suffer as a result.
34
A lack of liquidity in certain of our investments may adversely affect our business.
We invest in certain companies and projects whose securities are not publicly traded or actively traded on the secondary market and whose securities are subject to legal and other restrictions on resale or are otherwise less liquid than publicly traded securities. We invest in other financial instruments that are subject to similar restrictions. The illiquidity of certain of our investments may make it difficult for us to sell these investments when desired. In addition, if we are required to liquidate all or a portion of our portfolio quickly, we may realize significantly less than the value at which we had previously recorded these investments. The reduced liquidity of our investments may make it difficult for us to dispose of them at a favorable price, and, as a result, we may suffer losses.
A significant portion of our investments will be recorded at fair value as determined in good faith by our advisor, subject to the review of the board of directors and, as a result, there will be uncertainty as to the value of our investments.
Our consolidated financial statements will be prepared using the specialized accounting principles of Accounting Standards Codification Topic 946, Financial Services—Investment Companies, or ASC Topic 946, which requires us to carry our investments at fair value or, if fair value is not determinable based on transactions observable in the market, at fair value as determined by our advisor, subject to the oversight of our board of directors. At the direction of our board of directors, an independent valuation firm will review the valuations prepared by GCM. For most of our investments, market quotations will not be available. As a result, we will value these investments quarterly at fair value as determined in good faith.
The determination of fair value is to a degree subjective, and our advisor has a conflict of interest in making the determination. We expect to value our investments quarterly at fair value as determined in good faith by our advisor, subject to the oversight of our board of directors. At the direction of our board of directors, an independent valuation firm will periodically review the valuations prepared by GCM. The types of factors that may be considered in determining the fair values of our investments include available current market data, including relevant and applicable market trading and comparable transactions, applicable market yields and multiples, security covenants, call protection provisions, information rights, the nature and realizable value of any collateral, the project’s ability to make payments, its earnings and discounted cash flows, the markets in which the project does business, comparisons of financial ratios of peer business entities that are public, mergers and comparable acquisitions, the principal market and enterprise values, among other factors. Because such valuations, and particularly valuations of private companies, are inherently uncertain, the valuations may fluctuate significantly over short periods of time due to changes in current market conditions. The determinations of fair value by our advisor, subject to the oversight of our board of directors, may differ materially from the values that would have been used if an active market and market quotations existed for these investments. Our net asset value could be adversely affected if the determinations regarding the fair value of our investments were materially higher than the values that we ultimately realize upon the disposal of such investments.
Risks Related to Investments in the Solar, Wind Power and Energy Efficiency Industries
If the solar power industry experiences a shortage of key inputs, such as polysilicon, the profitability of solar power-producing projects may decrease, which may result in slower growth in the solar power market than we anticipate.
Solar power companies depend on certain technologies and key inputs, such as polysilicon. If the solar power industry experiences shortages of these technologies and key inputs, profitability of the solar businesses in which we invest may be negatively impacted due to the resulting increase in prices of these technologies and key inputs. In addition, increases in polysilicon prices have in the past increased manufacturing costs for solar power producers and may impact manufacturing costs and net income or cause a shortage of polysilicon in the future. Polysilicon is also used in the semiconductor industry generally and any increase in demand from that sector may cause a shortage. To the extent a shortage results in these types of technologies and key inputs due to price increases, the solar power market may experience slower growth than we anticipate.
35
The recently enacted tariff on solar panels may have an adverse effect on the prices of future solar investments.
The United States began levying tariffs on certain types of imported solar panels in January 2018. The tariffs are applicable over a four-year period beginning at 30% the first year and declining to 25%, 20% and 15% respectively, with each subsequent year. For certain sectors of the industry, particularly large utility scale transactions, these tariffs will likely have some pricing impact. However, for the reasons described below, we do not see this market event significantly affecting our investment thesis or the cost of future investments.
| 1. | A PV solar module today costs about $0.32. Over the six months leading up to the tariff enactment, certain developers stockpiled panels at prices as high as $0.35 to $0.36 per module. Given that the tariff maximum is currently 30% declining to 15% in the fourth year, it puts the most expensive modules at approximately $0.31, effectively below where modules have been selling in recent months. In short, developers had already put these higher prices into the market, significantly muting any pricing impact from the tariff enactment. |
|
2. | Furthermore, the first 2.5GW of panels imported for each of the four years are exempt from the tariff, which is likely to mitigate pricing impact. |
| 3. | Over half of the company’s investments are operating plants, where the panels are already installed (where they are producing electricity) so the tariffs will not have an effect on the cost of those systems. |
| 4. | Some developers are moving to thin film modules, which are not likely affected by the tariff. Thin film modules are generally more expensive but if the tariff were to result in higher prices for affected panels, thin film modules would become more cost competitive. Given these and other factors, we expect negligible impact from the tariff as we continue to raise capital, acquire assets and bring the offering towards its eventual close. |
The reduction or elimination of government and economic incentives for solar power production could affect the financial results of our projects that produce solar power.
The market for on-grid applications, where solar power is used to supplement a customer’s electricity purchased from the electric utility network or sold to a utility under tariff, depends in part on the availability and size of government and economic incentives. The reduction or elimination of government and economic incentives would adversely affect the growth of this market or result in increased price competition, either of which could cause solar power producers’ revenue to decline and harm their financial results.
Our solar power projects may not be able to compete successfully and may lose or be unable to gain market share.
Solar power producers also compete against other power generation sources including conventional fossil fuels supplied by utilities, other alternative energy sources such as wind, biomass, and emerging distributed generation technologies such as micro-turbines, sterling engines and fuel cells. In the large-scale on-grid solar power systems market, our solar power projects will face direct competition from several companies that manufacture, distribute, or install solar power systems.
The operating results of the projects in which we invest that produce solar power may be negatively affected by several other factors.
In addition to shortages of technologies and key inputs and changes in governmental policies, the results of the projects in which we invest that produce solar and wind power can be affected by a variety of factors, including the following:
| ● | the average selling price of solar cells, solar panels, solar power systems, wind turbines and other key components of alternative energy power plants; |
36
| ● | a decrease in the availability, pricing and timeliness of delivery of raw materials and components, particularly solar panels, wind turbines and blades and associated components, including steel, necessary for solar and wind power systems to function; |
| ● | the rate and cost at which alternative energy power producers can expand their manufacturing and product assembly capacity to meet customer demand, including costs and timing of adding personnel; |
|
● | construction cost overruns, including those associated with the introduction of new products; |
| ● | the impact of seasonal variations in demand and/or revenue recognition linked to construction cycles and weather conditions; |
| ● | unplanned additional expenses such as manufacturing failures, defects or downtime; |
| ● | the impact of seasonal variations in sunlight on energy production; |
| ● | the impact of weather variations on energy production; |
| ● | acquisition and investment related costs; |
| ● | the loss of one or more key customers or the significant reduction or postponement of orders from these customers; |
|
● | changes in manufacturing costs; |
| ● | the availability, pricing and timeliness of delivery of products necessary for solar power products to operate; |
| ● | changes in electric rates due to changes in fossil fuel prices; |
| ● | the lack of a viable secondary market for positions in solar energy projects; and |
| ● | the ability of a solar and wind energy projects to generate cash and pay yield substantially depends on power generation, which depends on continuing productive capability of the solar energy hardware, including proper operations and maintenance of the alternative energy hardware and fair sunlight and wind for the life of the investment. |
If wind conditions are unfavorable or below our estimates on any of our wind projects, the electricity production on such project and therefore, our income, may be substantially below our estimates.
The financial performance of our projects that produce wind energy will be dependent upon the availability of wind resources. The strength and consistency of wind resources at wind projects will vary. Weather patterns could change, or the historical data could prove to be an inaccurate reflection of the strength and consistency of the wind in the future. If wind resources are insufficient, the assumptions underlying the economic feasibility about the amount of electricity to be generated by wind projects will not be met and the project’s income and cash flows will be adversely impacted. Wind-producing projects and our evaluations of wind projects will be based on assumptions about certain conditions that may exist and events that may occur in the future. A number of additional factors may cause the wind resource and energy capture at wind projects to differ, possibly materially, from those initially assumed by the project’s management, including: the limited time period over which the site-specific wind data were collected; the potential lack of close correlation between site-specific wind data and the longer-term regional wind data; inaccurate assumptions related to wake losses and wind shear; the limitations in the accuracy with which anemometers measure wind speed; the inherent variability of wind speeds; the lack of independent verification of the turbine power curve provided by the manufacturer; the potential impact of global warming and other climatic factors, including icing and soiling of wind turbines; the potential impact of topographical variations, turbine placement and local conditions, including vegetation; the power delivery schedule being subject to uncertainty; the inherent uncertainty associated with the use of models, in particular future-oriented models; and the potential for electricity losses to occur before delivery.
Furthermore, a project’s wind resources may be insufficient for them to become and remain profitable. Wind is naturally variable. The level of electricity production at any of our wind projects, therefore, will also be variable. If there are insufficient wind resources at a project site due to variability, the assumptions underlying the company’s belief about the amount of electricity to be generated by the wind project will not be met. Accordingly, there is no assurance that a project’s wind resources will be sufficient for it to become or remain profitable.
37
If our wind energy production assessments turn out to be wrong, our wind energy projects could suffer several material adverse consequences, including:
|
● | our wind energy production and sales for the project may be significantly lower than we predict; |
|
● | our hedging arrangements may be ineffective or costlier; |
|
● | we may not produce sufficient energy to meet our commitments to sell electricity or RECs and, as a result, we may have to buy electricity or RECs on the open market to cover our obligations or pay damages; and |
| ● | our projects may not generate sufficient cash flow to make payments of principal and interest as they become due on the debt we provided on the project, and we may have difficulty refinancing such debt. |
Risks Related to Debt Financing and Lending
The base management fee payable to GCM increases with the use of leverage and thus, GCM will have a financial incentive to incur leverage; however, if we borrow money, the potential for gain or loss on amounts invested in us will be magnified and may increase the risk of investing in us. Borrowed money may also adversely affect the return on our assets, reduce cash available for distribution to our members, and result in losses.
We currently use leverage to finance certain of our investments. At such time when the net proceeds from this offering have been fully invested, we expect that we will generally target a leverage ratio of up to $2 of debt for every $1 of equity on our overall portfolio, with individual allocations of leverage based on the mix of asset types and obligors; however, we will in no event exceed a leverage ratio of $3 of debt for every $1 of equity, unless any excess is approved by a majority of our independent directors. The amount of leverage that we employ will depend on our advisor’s assessment of market and other factors at the time of any proposed borrowing. Our LLC Agreement does not impose limits on the amount of leverage we may employ. There can be no assurance that leveraged financing will be available to us on attractive terms or at all. The use of leverage increases the volatility of investments by magnifying the potential for gain or loss on invested equity capital. If we use leverage to partially finance our investments, through borrowing from banks and other lenders, you will experience increased risks of investing in our shares. If the value of our assets decreases, leveraging would cause such value to decline more sharply than it otherwise would have had we not leveraged. Similarly, any decrease in our income would cause net income to decline more sharply than it would have had we not borrowed. Such a decline could negatively affect our ability to make distributions to our members. In addition, we and our members will bear the burden of any increase in our expenses as a result of our use of leverage, including interest expenses and any increase in the management fees payable to the advisor. Furthermore, as we expect that the base management fee payable to GCM will be payable based on the average of the values of our gross assets for each day of the prior month, including those assets acquired with leverage, GCM will have a financial incentive to incur leverage, which may not be consistent with our members’ interests. The incentive distribution, to which the Special Unitholder, an affiliate of our advisor, may be entitled, may encourage our advisor to use leverage to increase the return on our portfolio, in the construction of additional projects.
To achieve our investment objectives, we may be required to utilize financial leverage. We may borrow money to make investments, for working capital and to make distributions to our members. No portion of the net worth of GCM, our sponsor, and its affiliates will be available to us to satisfy our liabilities or other obligations. Accordingly, we are subject to the risks that our cash flow will not be sufficient to cover the required debt service payments and, to the extent that we cannot meet our financing obligations, we risk the loss of some or all our assets to liquidation or sale, at significantly depressed prices in some cases due to market conditions or otherwise, to satisfy the obligations.
Furthermore, any amounts that we use to service our indebtedness will not be available for distributions to our members.
We will be exposed to risks associated with changes in interest rates.
To the extent we borrow to finance our investments, we will be subject to financial market risks, including changes in interest rates. An increase in interest rates would make it more expensive to use debt for our financing needs.
38
When we borrow, our net investment income will depend, in part, upon the difference between the rate at which we borrow funds and the rate at which we employ those funds. As a result, we can offer no assurance that a meaningful change in market interest rates will not have a material adverse effect on our net investment income. In periods of rising interest rates when we have debt outstanding, our cost of funds may increase, which could reduce our net investment income. We expect that our long-term fixed-rate investments will be financed primarily with equity and long-term debt. We may use interest rate risk management techniques to limit our exposure to interest rate fluctuations. These techniques may include borrowing at fixed rates or various interest rate hedging activities. These activities may limit our ability to participate in the benefits of lower interest rates with respect to the hedged portfolio. Adverse developments resulting from changes in interest rates or hedging transactions could have a material adverse effect on our business, financial condition and results of operations.
We will be exposed to borrower default, prepayment risk, bankruptcy risk and liquidity risk to the extent we make loans or provide financing to others.
We may provide financing to projects owned by others, including through the provision of secured loans. We may also provide projects with senior unsecured debt, subordinated secured debt, subordinated unsecured debt, mezzanine debt, convertible debt and convertible preferred debt. We may also make loans to parties financing the supply of renewable energy and energy efficiency to residential and commercial customers or the adoption of strategies to reduce the consumption of energy by those customers. As a result, we are subject to the risk of borrower default. Defaults may increase because of economic conditions beyond the control of the company, our advisor and the borrowers, including prevailing interest rates, the value of the U.S. dollar, energy prices, changes in the demand for renewable energy or energy efficiency projects, construction delays, disruptions in the credit markets and other factors. Any such defaults will directly affect the operating results of, and risks of an investment in, the company.
In addition, we face prepayment risk, bankruptcy risk and liquidity risk in lending. There may not be any prepayment penalty for borrowers who prepay their loans. If borrowers choose to prepay their loans, we may not receive the full amount of interest payments otherwise to be received by us. In addition, borrowers may seek the protection of debtor relief under bankruptcy or insolvency laws, which may result in the nonpayment of the underlying loans. Our lending represents binding commitments, and such committed funds generally may not be withdrawn. The loans will not be listed on any securities exchange, generally will not be transferable, and generally must be held by us for the term of the relevant loan. Such prepayment risk, bankruptcy risk and liquidity risk could diminish the value of your investment in us.
Risks Related to Our Shares
Purchases of our shares by our directors, officers and other affiliates should not influence the investment decisions of independent, unaffiliated investors.
Shares purchased by directors, officers and other affiliates of ours will be purchased for investment purposes only. The investment decisions made by any such directors, officers or affiliates should not influence your decision to invest in our shares, and you should make your own independent investment decision concerning the risks and benefits of an investment in our shares.
39
The shares that were sold in our security offerings will not be listed on an exchange or quoted through a quotation system for the foreseeable future, if ever. Therefore, if you purchased Class A, C, I, P-A or P-I shares, you have limited liquidity and may not receive a full return of your invested capital if you sell your shares.
The shares offered by us are illiquid assets for which there is not expected to be any secondary market, nor is it expected that any will develop in the future. Your ability to transfer your shares is limited. Pursuant to our LLC Agreement, we have the discretion under certain circumstances to prohibit transfers of shares, or to refuse to consent to the admission of a transferee as a member. Moreover, you should not rely on our share repurchase program as a method to sell shares within any given timeframe because our share repurchase program includes numerous restrictions that limit your ability to sell your shares to us. Further, we may amend, suspend or terminate our share repurchase program at any time without giving you notice in advance. In particular, the share repurchase program provides that we may make repurchase offers only to members who have purchased Class A, C, I, P-A or P-I shares and have held their shares for a minimum of one year. In addition, we limit repurchases during (i) any 12-month period to 5% of our weighted average number of outstanding shares and (ii) any fiscal quarter to 1.25% of the weighted average number of shares outstanding in the prior four fiscal quarters. Our ability to repurchase shares is subject to and may be limited by the company’s available funds. Therefore, it will be difficult for you to sell your shares promptly or at all. In addition, the price received for any shares sold prior to a liquidity event is likely to be less than the proportionate value of our assets. Investor suitability standards imposed by certain states may also make it more difficult to sell your shares to someone in those states. The shares should be purchased as a long-term investment only.
We intend to explore a potential liquidity event for our members within five years following the completion of our offering stage, which may include additional follow-on offerings of public and private shares. However, there can be no assurance that we will complete a liquidity event within such timeframe or at all. We expect that our board of directors, in the exercise of its fiduciary duty to our members, will determine to pursue a liquidity event when it believes that then-current market conditions are favorable for a liquidity event, and that such an event is in the best interests of our members. A liquidity event could include, but shall not be limited to: (1) the sale of all or substantially all of our assets either on a portfolio basis or individual asset basis, followed by a liquidation, (2) a listing of our shares, or a transaction in which our members receive shares of a company that is listed, on a national securities exchange, or (3) a merger or other transaction approved by our board of directors in which our members will receive cash or shares of a publicly traded company.
In making the decision whether to apply for listing our shares on a national securities exchange, our board of directors will endeavor to determine whether listing our shares or liquidating our assets would result in greater value for our members. In making a determination of which type of liquidity event is in the best interest of our members, our board of directors, including our independent directors, may consider a variety of criteria, including, but not limited to, market conditions, portfolio diversification, portfolio performance, our financial condition, potential access to capital as a listed company, market conditions for the sale of our assets or listing of our shares, internal management requirements to become a perpetual life company and the potential for member liquidity. If our shares are listed, we cannot assure you a public trading market will develop. Since a portion of the offering price from the sale of shares in this offering will be used to pay expenses and fees, the full offering price paid by members will not be invested in our target assets. As a result, even if we do complete a liquidity event, you may not receive a full return of all of your invested capital.
40
We may be unable to invest a significant portion of the net proceeds from our security offerings on acceptable terms within the timeframe contemplated herein.
Delays in our ability to invest the net proceeds of this offering may impair our performance. We cannot assure you that we will be able to identify any investment opportunities that meet our investment objectives or that any investment that we make will produce a positive return on invested capital. We may be unable to invest the net proceeds of this offering on acceptable terms within the timeframe that we anticipate, or at all, which could harm our financial condition, operating results, and the return on your invested capital.
During the offering, we may invest the net proceeds primarily in cash, cash equivalents, U.S. government securities, repurchase agreements and high-quality debt instruments maturing in one year or less from the time of investment (collectively, “cash and cash equivalents”) prior to investing in alternative energy projects. Investing in cash and cash equivalents may produce returns on your invested capital that are significantly lower than the returns we expect to achieve when our portfolio is fully invested in securities meeting our investment objectives.
Your interest in us will be diluted if we issue additional shares, which could reduce the overall value of your investment.
Potential investors in this offering do not have preemptive rights to any shares we issue in the future. Our LLC Agreement authorizes us to issue 400,000,000 shares. Pursuant to our LLC Agreement, a majority of our entire board of directors may amend our LLC Agreement from time to time to increase or decrease the aggregate number of authorized shares or the number of authorized shares of any class or series without member approval. After your purchase in this offering, we may elect to sell additional shares in this or future public offerings, issue equity interests in private offerings or issue share-based awards to our independent directors, GCM and/or employees of GCM. To the extent we issue additional equity interests after your purchase in this offering, your percentage ownership interest in us will be diluted. In addition, depending upon the terms and pricing of any additional offerings and the value of our investments, you may also experience dilution in the value of your shares.
Anti-takeover provisions in our LLC Agreement could inhibit a change in control.
Provisions in our LLC Agreement may make it more difficult and expensive for a third party to acquire control of us, even if a change of control would be beneficial to our shares. Under our LLC Agreement, which will be in effect at the commencement of this offering, our shares have only limited voting rights on matters affecting our business and therefore have limited ability to influence management’s decisions regarding our business. In addition, our LLC Agreement contains several provisions that could make it more difficult for a third party to acquire or may discourage a third party from acquiring control of our company. These provisions include:
| ● | restrictions on our ability to enter into certain transactions with major holders of our shares modeled on the limitation contained in Section 203 of the Delaware General Corporation Law, or the DGCL; |
|
● | allowing only the company’s board of directors to fill vacancies, including newly created directorships; |
| ● | requiring that directors may be removed, with or without cause, only by a vote of a majority of the issued and outstanding shares; |
41
|
● | requiring notice in advance for nominations of candidates for election to our board of directors or for proposing matters that can be acted upon by holders of our shares at a meeting of members; |
|
● | our ability to issue additional securities, including securities that may have preferences or are otherwise senior in priority to our shares; and |
| ● | limitations on the ability of holders of our shares to call special meetings of holders of our shares. |
Moreover, our LLC Agreement also prohibits any person from beneficially or constructively owning, as determined by applying certain attribution rules of the Internal Revenue Code, our shares that would result in GREC being a “closely held C corporation” under Section 465(a)(1)(B) of the Internal Revenue Code. The ownership limits imposed under the Internal Revenue Code are based upon direct or indirect ownership by individuals (as defined in the Internal Revenue Code to include certain entities), but only during the last half of a tax year. The ownership limits contained in our LLC Agreement are based on the ownership at any time by any person, which term includes entities. These ownership limitations in our LLC Agreement are intended to provide added assurance that GREC will not be classified as a closely held C corporation, and to minimize administrative burdens. However, the ownership limit on our shares may also delay or prevent a transaction or a change in our control that could involve a premium price over the then current net asset value of our shares or otherwise be in the best interest of our members.
Risks Related to Tax
Members may realize taxable income without cash distributions and may have to use funds from other sources to fund tax liabilities.
Because we are taxed as a partnership for U.S. federal income tax purposes, members may realize taxable income in excess of cash distributions by us. There can be no assurance that we will pay distributions at a specific rate or at all. As a result, members may have to use funds from other sources to pay their tax liability.
In addition, the payment of the distribution fee over time with respect to the Class C shares will be deemed to be paid from cash distributions that would otherwise be distributable to the holders of Class C shares. Accordingly, the holders of Class C shares will receive a lower cash distribution to the extent of such Class C holder’s obligation to pay such fees. Because the payment of such fees is not a deductible expense for tax purposes, the taxable income of the company allocable to the holders of Class C shares may, therefore, exceed the amount of cash distributions made to the Class C holders.
The U.S. Internal Revenue Service (“IRS”) could adjust or reallocate items of income, gain, deduction, loss and credit with respect to the shares if the IRS does not accept the assumptions or conventions utilized by us.
U.S. federal income tax rules applicable to partnerships are complex and their application is not always clear. Moreover, the rules generally were not written for, and in some respects, are difficult to apply to, publicly traded interests in partnerships. We apply certain assumptions and conventions intended to comply with the intent of the rules and to report income, gain, deduction, loss and credit to members in a manner that reflects members’ economic gains and losses, but these assumptions and conventions require judgement in application with the applicable Treasury Regulations. It is possible therefore that the IRS will successfully assert that these assumptions or conventions do not satisfy the technical requirements of the Internal Revenue Code of 1986 (the “Internal Revenue Code”) and will require that items of income, gain, deduction, loss and credit be adjusted or reallocated in a manner that could be adverse to investors.
If we were to become taxable as a corporation for U.S. federal income tax purposes, we would be required to pay income tax at corporate rates on our net income and distributions by us to members would constitute dividend income taxable to such members, to the extent of our earnings and profits.
We have received the opinion of Alston & Bird LLP to the effect that, although the matter is not free from doubt due to the lack of clear guidance and direct authority, our proposed method of operation, as described herein and as represented by us to Alston & Bird LLP will permit us to not be classified for U.S. federal income tax purposes as an association or a publicly traded partnership taxable as a corporation. Members should be aware that opinions of counsel are not binding on the IRS, and no assurance can be given that the IRS will not challenge the conclusions set forth in such opinion. It must be emphasized that the opinion of Alston & Bird LLP is based on various assumptions relating to our organization, operation, assets and activities, and that all factual representations and statements set forth in all relevant documents, records and instruments are true and correct, all actions described herein are completed in a timely fashion and that we will at all times operate in accordance with the method of operation described in our LLC Agreement and herein, and is conditioned upon factual representations and covenants made by us, and our board of directors regarding our organization, operation, assets, activities, and conduct of our operations, and assumes that such representations and covenants are accurate and complete. Such representations include, as discussed further below, representations to the effect that we will meet the “qualifying income exception”.
42
While it is expected that we will operate so that we will qualify to be treated for U.S. federal income tax purposes as a partnership, and not as an association or a publicly traded partnership taxable as a corporation, given the highly complex nature of the rules governing partnerships, the ongoing importance of factual determinations, the lack of direct guidance with respect to the application of tax laws to the activities we are undertaking and the possibility of future changes in its circumstances, it is possible that we will not so qualify for any particular year. Alston & Bird LLP has no obligation to advise us or our members of any subsequent change in the matters stated, represented or assumed, or of any subsequent change in the applicable law. Our taxation as a partnership will depend on our ability to meet, on a continuing basis, through actual operating results, the “qualifying income exception.” We expect to satisfy this exception by ensuring that most of our investments that do not generate “qualifying income” are held through taxable corporate subsidiaries. However, we may not properly identify income as “qualifying,” and our compliance with the “qualifying income exception” will not be reviewed by Alston & Bird LLP on an on-going basis. Accordingly, no assurance can be given that the actual results of our operations for any taxable year will satisfy this “qualifying income” exception.
If, for any reason we become taxable as a corporation for U.S. federal income tax purposes, our items of income and deduction would not pass through to our members and our members would be treated for U.S. federal income tax purposes as stockholders in a corporation. We would be required to pay income tax at corporate rates on our net income. Distributions by us to members would constitute dividend income taxable to such members, to the extent of our earnings and profits, and the payment of these distributions would not be deductible by us. These consequences would have a material adverse effect on us, our members and the value of the shares.
It is expected that we will operate so that we will qualify to be treated for U.S. federal income tax purposes as a partnership and that a significant portion of our investments will not generate “qualifying income” as the LLC will conduct a significant portion of its operations through GREC, a wholly owned subsidiary of the LLC treated as a C corporation for U.S. federal income tax purposes and subject to U.S. federal income tax on its net income. Conducting the company’s operations through GREC is expected to allow us to effectively utilize tax incentives generated from projects in which we hold controlling equity stakes to reduce the taxable income generated by our other investments through tax incentives that are better utilized by C-corporations than other forms of entities. However, because a significant portion of our investments will be held through GREC, the “pass through” tax benefit of our being a partnership for U.S. federal income tax purposes will be limited to the income generated by the investments that we directly hold.
ITEM 1B. UNRESOLVED STAFF COMMENTS
None.
Our executive offices are located at 11 East 44th Street, Suite 1200, New York, NY 10017. We believe that our office facilities are suitable and adequate for our business as it is contemplated to be conducted.
None of us, GCM, or the Administrator, is currently subject to any material legal proceedings, nor, to our knowledge, is any material legal proceeding threatened against us, or against GCM or the Administrator.
ITEM 4. MINE SAFETY DISCLOSURES
Not applicable.
43
ITEM 5. MARKET FOR REGISTRANT’S COMMON EQUITY, RELATED MEMBER MATTERS AND ISSUER PURCHASES OF EQUITY SECURITIES
PRICE RANGE OF COMMON EQUITY
The company’s Class A, Class C, Class I, Class P-A or Class P-I shares are not listed or traded on any recognized securities exchange. Since the initial closing and through the date of this filing, the company sold shares on a continuous basis at the following prices:
| Period | Class | |||||||||||||||||||||||||
| From | To | A | C | I | P-A | P-I | ||||||||||||||||||||
| 25-Apr-14 | 4-Nov-15 | $ | 10.00 | $ | 9.58 | $ | 9.19 | NA | NA | |||||||||||||||||
| 5-Nov-15 | 4-Feb-16 | $ | 10.02 | $ | 9.60 | $ | 9.21 | NA | NA | |||||||||||||||||
| 5-Feb-16 | 5-May-16 | $ | 10.05 | $ | 9.62 | $ | 9.23 | NA | NA | |||||||||||||||||
| 6-May-16 | 3-Aug-16 | $ | 10.07 | $ | 9.64 | $ | 9.25 | $ | 9.59 | $ | 8.81 | |||||||||||||||
| 4-Aug-16 | 6-Nov-16 | $ | 10.23 | $ | 9.79 | $ | 9.39 | $ | 9.79 | $ | 8.95 | |||||||||||||||
| 7-Nov-16 | 7-Feb-17 | $ | 10.28 | $ | 9.58 | $ | 9.45 | $ | 9.78 | $ | 8.83 | |||||||||||||||
| 8-Feb-17 | 4-May-17 | $ | 10.22 | $ | 9.53 | $ | 9.39 | $ | 9.70 | $ | 8.76 | |||||||||||||||
| 5-May-17 | 17-May-17 | $ | 10.17 | $ | 9.48 | $ | 9.34 | $ | 9.70 | $ | 8.69 | |||||||||||||||
| 18-May-17 | 3-Aug-17 | $ | 9.74 | $ | 9.07 | $ | 8.94 | $ | 9.70 | $ | 8.69 | |||||||||||||||
| 4-Aug-17 | 2-Nov-17 | $ | 9.72 | $ | 9.08 | $ | 8.93 | N/A | $ | 8.73 | ||||||||||||||||
| 3-Nov-17 | 5-Feb-18 | $ | 9.74 | $ | 9.09 | $ | 8.94 | N/A | $ | 8.75 | ||||||||||||||||
| 6-Feb-18 | 6-May-18 | $ | 9.78 | $ | 9.09 | $ | 8.98 | $ | 9.65 | * | $ | 8.81 | ||||||||||||||
| 7-May-18 | 2-Aug-18 | $ | 9.80 | $ | 9.12 | $ | 9.01 | $ | 9.68 | $ | 8.84 | |||||||||||||||
| 3-Aug-18 | 31-Oct-18 | $ | 9.83 | $ | 9.17 | $ | 9.03 | $ | 9.69 | $ | 8.90 | |||||||||||||||
| 1-Nov-18 | 6-Feb-19 | $ | 9.79 | $ | 9.15 | $ | 8.99 | $ | 9.68 | $ | 8.89 | |||||||||||||||
| 7-Feb-19 | 6-May-19 | $ | 9.63 | $ | 9.01 | $ | 8.84 | $ | 9.50 | ** | $ | 8.76 | ||||||||||||||
| 7-May-19 | 1-Aug-19 | N/A | N/A | N/A | N/A | $ | 8.76 | |||||||||||||||||||
| 2-Aug-19 | 8-Nov-19 | N/A | N/A | N/A | N/A | $ | 8.77 | |||||||||||||||||||
| 9-Nov-19 | 19-Mar-20 | N/A | N/A | N/A | N/A | $ | 8.93 | |||||||||||||||||||
| 20-Mar-20 | - | N/A | N/A | N/A | N/A | $ | 8.90 | |||||||||||||||||||
| * | Effective April 16, 2018 |
| ** | Ceased February 8, 2019 |
HOLDERS
As of December 31, 2019, the company has issued 18,841,749 Class A shares (including 23,601 to GCM), 2,752,199 Class C shares, 7,049,189 Class I shares, 58,643 Class P-A shares and 21,488,513 Class P-I shares.
44
DISTRIBUTIONS
The following table reflects the distributions declared during the year ended December 31, 2019:
| Pay Date | Paid in Cash | Values of Shares Issued Under DRP | Total | |||||||||
| February 1, 2019 | $ | 1,317,325 | $ | 583,571 | $ | 1,900,896 | ||||||
| March 1, 2019 | 1,247,614 | 552,615 | 1,800,229 | |||||||||
| April 1, 2019 | 1,452,585 | 611,400 | 2,063,985 | |||||||||
| May 1, 2019 | 1,438,057 | 600,614 | 2,038,671 | |||||||||
| June 3, 2019 | 1,553,801 | 622,584 | 2,176,385 | |||||||||
| July 1, 2019 | 1,764,339 | 383,813 | 2,148,152 | |||||||||
| August 1, 2019 | 1,850,929 | 393,237 | 2,244,166 | |||||||||
| September 2, 2019 | 1,664,451 | 613,333 | 2,277,784 | |||||||||
| October 1, 2019 | 1,647,779 | 589,769 | 2,237,548 | |||||||||
| November 1, 2019 | 1,715,922 | 609,493 | 2,325,415 | |||||||||
| December 2, 2019 | 1,693,670 | 587,119 | 2,280,789 | |||||||||
| January 1, 2020 | 1,784,956 | 605,129 | 2,390,085 | |||||||||
| Total | $ | 19,131,428 | $ | 6,752,677 | $ | 25,884,105 | ||||||
The following table reflects the distributions declared during the year ended December 31, 2018:
Pay Date | Paid in Cash | Value
of | Total | |||||||||
| February 1, 2018 | $ | 728,738 | $ | 464,821 | $ | 1,193,559 | ||||||
| March 1, 2018 | 682,039 | 428,310 | 1,110,349 | |||||||||
| April 2, 2018 | 790,925 | 474,370 | 1,265,295 | |||||||||
| May 1, 2018 | 792,185 | 475,874 | 1,268,059 | |||||||||
| June 1, 2018 | 883,662 | 507,728 | 1,391,390 | |||||||||
| July 2, 2018 | 927,638 | 502,333 | 1,429,971 | |||||||||
| August 1, 2018 | 1,013,883 | 529,333 | 1,543,216 | |||||||||
| September 4, 2018 | 1,078,310 | 541,479 | 1,619,789 | |||||||||
| October 1, 2018 | 1,097,313 | 529,751 | 1,627,064 | |||||||||
| November 1, 2018 | 1,178,736 | 555,383 | 1,734,119 | |||||||||
| December 3, 2018 | 1,177,142 | 546,446 | 1,723,588 | |||||||||
| January 2, 2019 | 1,260,777 | 570,961 | 1,831,738 | |||||||||
| Total | $ | 11,611,348 | $ | 6,126,789 | $ | 17,738,137 | ||||||
45
The following table reflects the distributions declared during the year ended December 31, 2017:
| Pay Date | Paid in Cash | Value of Shares Issued under DRP | Total | |||||||||
| February 1, 2017 | $ | 431,686 | $ | 349,842 | $ | 781,528 | ||||||
| March 1, 2017 | 413,270 | 332,761 | 746,031 | |||||||||
| April 3, 2017 | 482,113 | 371,902 | 854,015 | |||||||||
| May 1, 2017 | 486,864 | 370,463 | 857,327 | |||||||||
| June 1, 2017 | 524,909 | 383,585 | 908,494 | |||||||||
| July 3, 2017 | 534,165 | 382,339 | 916,504 | |||||||||
| August 1, 2017 | 572,833 | 406,993 | 979,826 | |||||||||
| September 1, 2017 | 600,962 | 415,864 | 1,016,826 | |||||||||
| October 2, 2017 | 603,869 | 411,848 | 1,015,717 | |||||||||
| November 1, 2017 | 637,604 | 436,753 | 1,074,357 | |||||||||
| December 1, 2017 | 656,495 | 430,860 | 1,087,355 | |||||||||
| January 2, 2018 | 711,306 | 454,324 | 1,165,630 | |||||||||
| Total | $ | 6,656,076 | $ | 4,747,534 | $ | 11,403,610 | ||||||
PERFORMANCE GRAPH
Not applicable.
SALES OF UNREGISTERED SECURITIES
During the year ended December 31, 2019, the company sold 2,631 Class P-A shares and 9,631,640 Class P-I shares under a private placement memorandum. During the year ended December 31, 2018, the company sold 15,478 Class P-A shares and 8,469,306 Class P-I shares under a private placement memorandum. During the year ended December 31, 2017, the company sold 3,092 Class P-A shares and 3,198,559 Class P-I shares under a private placement memorandum.
ISSUER PURCHASES OF EQUITY SECURITIES
For the year ended December 31, 2019, the company repurchased 558,579 Class A shares, 16,929 Class C shares, 185,871 Class I shares and 223,681 Class P-I shares at a total purchase price of $4,807,693, $142,110, $1,596,905 and $1,975,682, respectively, pursuant to the company’s share repurchase program. For the year ended December 31, 2018, the company repurchased 442,979 Class A shares, 7,601 Class C shares, 59,781 Class I shares and 15,481 Class P-I shares at a total purchase price of $3,743,387, $65,340, $528,898 and $136,845, respectively, pursuant to the company’s share repurchase program. For the year ended December 31, 2017, the company repurchased 368,925 Class A shares, 6,041 Class C shares, 81,315 Class I shares, and 10,309 Class P-I shares at a total purchase price of $3,280,566, $53,073, $724,059 and $90,000, respectively, pursuant to the company’s share repurchase program.
46
The table below provides information concerning the company’s repurchase of shares during the years ended December 31, 2019, 2018 and 2017 pursuant to the company’s share repurchase program.
| Period | Total Number of Shares Purchased | Average Price Paid per Share | Maximum Number of Shares Offered | |||||||||
| January 1 to March 31, 2019 | 141,933 | $ | 8.69 | 320,849 | ||||||||
| April 1 to June 30, 2019 | 292,954 | 8.65 | 333,950 | |||||||||
| July 1 to September 30, 2019 | 297,932 | 8.79 | 333,396 | |||||||||
| October 1 to December 31, 2019 | 252,241 | 8.60 | 333,188 | |||||||||
| Total - 2019 | 985,060 | $ | 8.70 | 1,321,383 | ||||||||
| January 1 to March 31, 2018 | 80,197 | $ | 8.75 | 153,486 | ||||||||
| April 1 to June 30, 2018 | 99,881 | 8.76 | 165,445 | |||||||||
| July 1 to September 30, 2018 | 184,254 | 8.88 | 184,254 | |||||||||
| October 1 to December 31, 2018 | 141,511 | 8.77 | 184,539 | |||||||||
| Total - 2018 | 505,843 | $ | 8.79 | 687,724 | ||||||||
| January 1 to March 31, 2017 | 113,534 | $ | 9.23 | 113,534 | ||||||||
| April 1 to June 30, 2017 | 107,155 | 8.79 | 124,396 | |||||||||
| July 1 to September 30, 2017 | 135,561 | 8.76 | 137,504 | |||||||||
| October 1 to December 31, 2017 | 110,340 | 8.79 | 145,994 | |||||||||
| Total - 2017 | 466,590 | $ | 8.89 | 521,428 | ||||||||
| (1) | The company’s share repurchase program provides that we may make repurchase offers only if we have sufficient funds available for repurchase and to the extent the total number of shares for which repurchase is requested in any fiscal quarter does not exceed 5% of our weighted average number of outstanding shares in any 12-month period. In addition, we will limit repurchases in each fiscal quarter to 1.25% of the weighted average number of shares outstanding in the prior four fiscal quarters, unless otherwise approved by the board. |
ITEM 6. SELECTED CONSOLIDATED FINANCIAL DATA
The following selected financial data of the company as of December 31, 2019, 2018, 2017, 2016 and 2015 and for the years ended December 31, 2019, 2018, 2017, 2016 and 2015 are derived from our consolidated financial statements that have been audited by KPMG, our independent registered public accounting firm. This financial data should be read in conjunction with our consolidated financial statements and related notes thereto and Item 7. Management’s Discussion and Analysis of Financial Condition and Results of Operations included elsewhere in this report:
| As
of December 31, 2019 |
As
of December 31, 2018 |
As
of December 31, 2017 |
As
of December 31, 2016 |
As
of December 31, 2015 |
||||||||||||||||
| Statements of Assets and Liabilities data at period end: | ||||||||||||||||||||
| Investments, at fair value | $ | 475,175,871 | $ | 307,176,115 | $ | 218,386,174 | $ | 115,123,101 | $ | 51,454,566 | ||||||||||
| Swap contracts, at fair value | 21,223 | 435,603 | 156,068 | 90,697 | - | |||||||||||||||
| Cash and cash equivalents | 8,636,839 | 39,122,635 | 10,144,014 | 13,055,090 | 5,889,030 | |||||||||||||||
| Restricted Cash | 429,252 | - | - | - | - | |||||||||||||||
| Other assets | 25,209,403 | 7,210,276 | 4,823,789 | 6,766,392 | 944,879 | |||||||||||||||
| Total assets | 509,472,588 | 353,944,629 | 233,510,045 | 135,035,280 | 58,288,475 | |||||||||||||||
| Swap contracts, at fair value | 4,899,566 | 311,641 | - | - | - | |||||||||||||||
| Payable for investments purchased | 7,502,267 | 8,901 | 15,414,205 | - | - | |||||||||||||||
| Term note payable, net of financing costs | 68,886,785 | 29,527,046 | 12,910,364 | 3,270,399 | - | |||||||||||||||
| Other liabilities | 4,732,379 | 4,040,292 | 2,510,709 | 2,346,081 | 600,397 | |||||||||||||||
| Total liabilities | 86,020,997 | 33,887,880 | 30,835,278 | 5,616,480 | 600,397 | |||||||||||||||
| Total net assets | $ | 423,451,591 | $ | 320,056,749 | $ | 202,674,767 | $ | 129,418,800 | $ | 57,688,078 | ||||||||||
47
| For
the year ended December 31, 2019 |
For
the year ended December 31, 2018 |
For
the year ended December 31, 2017 |
For
the year ended December 31, 2016 |
For
the year ended December 31, 2015 |
||||||||||||||||
| Statement of operations data: | ||||||||||||||||||||
| Total Investment income | $ | 18,762,705 | $ | 19,392,582 | $ | 13,339,269 | $ | 8,236,025 | $ | 1,854,122 | ||||||||||
| Management fee expense | 8,461,616 | 5,803,893 | 3,490,942 | 2,018,434 | 571,271 | |||||||||||||||
| All other expenses | 6,087,286 | 3,907,374 | 2,389,285 | 1,921,793 | 1,054,509 | |||||||||||||||
| Expense reimbursement to (from advisor) | - | - | - | 636,926 | 11,794 | |||||||||||||||
| Net investment income (loss) before taxes | 4,213,803 | 9,681,315 | 7,459,042 | 3,658,872 | 216,548 | |||||||||||||||
| Deferred tax (benefit) expense | (3,188,431 | ) | 1,458,669 | 2,619,076 | (1,142,738 | ) | (522,985 | ) | ||||||||||||
| Franchise tax expense | 125,143 | 138,436 | 23,415 | 121,940 | - | |||||||||||||||
| Net investment income (loss) | 7,277,091 | 8,084,210 | 4,816,551 | 4,679,670 | 739,533 | |||||||||||||||
| Net realized gain on investments | 12,915,738 | - | 693,882 | 4,578 | - | |||||||||||||||
| Net change in unrealized appreciation (depreciation) on investments | 27,296,880 | 2,955,079 | 5,929,033 | (1,473,781 | ) | 1,578,967 | ||||||||||||||
| Net change in unrealized appreciation (depreciation) on foreign currency translation | 7,589 | (118,496 | ) | 97,763 | 40,703 | (196,902 | ) | |||||||||||||
| Net change in unrealized appreciation on swap contracts | (5,002,305 | ) | (32,106 | ) | 65,371 | 90,697 | - | |||||||||||||
| Change in benefit from deferred taxes on unrealized appreciation on investments | (7,926,882 | ) | 2,986,588 | 963,720 | 4,386,656 | 127,015 | ||||||||||||||
| Net increase (decrease) in net assets resulting from operations | $ | 34,568,111 | $ | 13,875,275 | $ | 12,566,320 | $ | 7,728,523 | $ | 2,248,613 | ||||||||||
| Per share data (basic and diluted): (1) | ||||||||||||||||||||
| Net asset value (Class A) | $ | 8.56 | $ | 8.54 | $ | 8.68 | $ | 8.69 | $ | 8.54 | ||||||||||
| Net asset value (Class C) | $ | 8.38 | $ | 8.35 | $ | 8.42 | $ | 8.44 | $ | 8.54 | ||||||||||
| Net asset value (Class I) | $ | 8.56 | $ | 8.54 | $ | 8.68 | $ | 8.69 | $ | 8.54 | ||||||||||
| Net asset value (Class P-A) | $ | 8.60 | $ | 8.55 | - | $ | 8.67 | - | ||||||||||||
| Net asset value (Class P-I) | $ | 8.90 | $ | 8.76 | $ | 8.81 | $ | 8.67 | $ | - | ||||||||||
| Net investment income (loss) | $ | 0.17 | $ | 0.27 | $ | 0.25 | $ | 0.43 | $ | 0.22 | ||||||||||
| Net realized gain on investments | $ | 0.29 | $ | - | $ | 0.04 | $ | - | $ | - | ||||||||||
| Net change in unrealized appreciation (depreciation) on investments, net of incentive allocation to special unitholder. | $ | 0.21 | $ | 0.18 | $ | 0.31 | $ | (0.10 | ) | $ | 0.39 | |||||||||
| Net change in unrealized appreciation (depreciation) on foreign currency translation. | $ | - | $ | - | $ | 0.01 | $ | - | $ | (0.06 | ) | |||||||||
| Change in benefit from deferred taxes on unrealized appreciation on investments | $ | (0.18 | ) | $ | - | $ | 0.05 | $ | 0.40 | $ | 0.04 | |||||||||
| Net increase (decrease) in net assets attributed to common members | $ | 0.67 | $ | 0.45 | $ | 0.60 | $ | 0.73 | $ | 0.59 | ||||||||||
| Distributions declared (Class A) | $ | 0.61 | $ | 0.61 | $ | 0.60 | $ | 0.60 | $ | 0.60 | ||||||||||
| Distributions declared (Class C) | $ | 0.53 | $ | 0.59 | $ | 0.59 | $ | 0.60 | $ | 0.60 | ||||||||||
| Distributions declared (Class I) | $ | 0.61 | $ | 0.61 | $ | 0.60 | $ | 0.60 | $ | 0.60 | ||||||||||
| Distributions declared (Class P-A) | $ | 0.60 | $ | 0.22 | $ | 0.28 | $ | 0.26 | $ | - | ||||||||||
| Distributions declared (Class P-I) | $ | 0.58 | $ | 0.58 | $ | 0.58 | $ | 0.25 | $ | - | ||||||||||
| Other data: | ||||||||||||||||||||
| Weighted average common shares outstanding | 43,788,187 | 29,799,735 | 18,922,343 | 11,043,156 | 3,335,719 | |||||||||||||||
| Total return, net of expense reimbursement to/from advisor, attributed to common shares based on net asset value (Class A) | 8.06 | % | 5.45 | % | 6.90 | % | 8.79 | % | 7.44 | % | ||||||||||
| Total return, net of expense reimbursement to/from advisor, attributed to common shares based on net asset value (Class C) | 7.79 | % | 6.19 | % | 6.77 | % | 5.65 | % | 7.44 | % | ||||||||||
| Total return, net of expense reimbursement to/from advisor, attributed to common shares based on net asset value (Class I) | 8.05 | % | 5.44 | % | 6.90 | % | 8.79 | % | 7.44 | % | ||||||||||
| Total return, net of expense reimbursement to/from advisor, attributed to common shares based on net asset value (Class P-A) | 7.66 | % | 1.06 | % | - | 4.59 | % | - | ||||||||||||
| Total return, net of expense reimbursement to/from advisor, attributed to common shares based on net asset value (Class P-I) | 8.49 | % | 6.16 | % | 8.65 | % | 4.49 | % | - | % | ||||||||||
| Number of portfolio company investments at period end | 34 | 26 | 18 | 9 | 8 | |||||||||||||||
| Purchases of investments | $ | 353,585,860 |
$ | 135,741,382 | $ | 127,069,013 | $ | 91,786,650 | $ | 47,681,029 | ||||||||||
| Principal payments and sales of investments for the period | 53,845,909 | $ | 4,621,231 | $ | 30,496,206 | $ | 26,689,615 | $ | 359,432 | |||||||||||
| (1) | The per share calculation for net asset value was based on shares outstanding. All other per share calculations were derived by using the weighted average shares outstanding. |
48
ITEM 7. MANAGEMENT’S DISCUSSION AND ANALYSIS OF FINANCIAL CONDITION AND RESULTS OF OPERATIONS
Forward Looking Statements
Various statements in this annual report, including those that express a belief, expectation or intention, as well as those that are not statements of historical fact, are forward-looking statements. The forward-looking statements may include projections and estimates concerning the timing and success of specific projects, revenues, income and capital spending. We generally identify forward-looking statements with the words “believe,” “intend,” “expect,” “seek,” “may,” “will,” “should,” “would,” “anticipate,” “could,” “estimate,” “plan,” “predict,” “project” or their negatives, and other similar expressions. All statements we make relating to our estimated and projected earnings, margins, costs, expenditures, cash flows, growth rates and financial results or to our expectations regarding future industry trends are forward-looking statements. These forward-looking statements are subject to risks and uncertainties that may change at any time, and, therefore, our actual results may differ materially from those that we expected. The forward-looking statements contained in this report are largely based on our expectations, which reflect many estimates and assumptions made by our management. These estimates and assumptions reflect our best judgment based on currently known market conditions and other factors. Although we believe such estimates and assumptions are reasonable, we caution that it is very difficult to predict the impact of known factors and it is impossible for us to anticipate all factors that could affect our actual results. In addition, our advisor’s assumptions about future events may prove to be inaccurate. We caution all readers that the forward-looking statements contained in this report are not guarantees of future performance, and we cannot assure any reader that such statements will prove correct or the forward-looking events and circumstances will occur. Actual results may differ materially from those anticipated or implied in the forward-looking statements due to the numerous risks and uncertainties as described under “Risk Factors” and elsewhere in this report. All forward-looking statements are based upon information available to us on the date of this report. We undertake no obligation to update or revise any forward-looking statements because of new information, future events or otherwise, except as otherwise required by law. You are advised to consult any additional disclosures that we may make directly to you or through reports that we in the future may file with the SEC, including Annual Reports on Form 10-K, Quarterly Reports on Form 10-Q and Current Reports on Form 8-K. These cautionary statements qualify all forward-looking statements attributable to us, or persons acting on our behalf. The risks, contingencies and uncertainties associated with our forward-looking statements relate to, among other matters, the following:
| ● | changes in the economy; |
| ● | the ability to complete the renewable energy projects in which we invest; |
| ● | our relationships with project developers, lawyers, investment and commercial banks, individual and institutional investors, consultants, diligence specialists, EPC companies, contractors, renewable energy technology manufacturers (such as panel manufacturers), solar insurance specialists, component manufacturers, software providers and other industry participants in the renewable energy, capital markets and project finance sectors; |
| ● | fluctuations in supply, demand, prices and other conditions for electricity, other commodities and RECs; |
| ● | public response to and changes in the local, state and federal regulatory framework affecting renewable energy projects, including the potential expiration or extension of the PTC, ITC and the related U.S. Treasury grants and potential reductions in RPS requirements; |
| ● | competition from other energy developers; |
| ● | the worldwide demand for electricity and the market for renewable energy; |
| ● | the ability or inability of conventional fossil fuel-based generation technologies to meet the worldwide demand for electricity; |
| ● | our competitive position and our expectation regarding key competitive factors; |
| ● | risks associated with our hedging strategies; |
| ● | potential environmental liabilities and the cost of compliance with applicable environmental laws and regulations, which may be material; |
49
| ● | our electrical production projections (including assumptions of curtailment and facility availability) for our renewable energy projects; |
| ● | our ability to operate our business efficiently, manage costs (including general and administrative expenses) effectively and generate cash flow; |
| ● | availability of suitable renewable energy resources and other weather conditions that affect our electricity production; |
| ● | the effects of litigation, including administrative and other proceedings or investigations relating to our renewable energy projects; |
| ● | non-payment by customers and enforcement of certain contractual provisions; |
| ● | risks associated with possible disruption in our operations or the economy generally due to terrorism or natural disasters; and |
| ● | future changes in laws or regulations and conditions in our operating areas. |
Overview
The LLC, a Delaware limited liability company, formed in December 2012, is an externally managed energy company that acquires and manages income-generating renewable energy and energy efficiency projects, and other energy-related businesses, as well as finances the construction and/or operation of these and sustainable development projects and businesses. The LLC conducts substantially all of its operations through its wholly-owned subsidiary, GREC.
GREC is a Maryland corporation formed in November 2011 and the LLC currently holds all of the outstanding shares of capital stock of GREC. GREC HoldCo, a wholly-owned subsidiary of GREC, was formed in Delaware, in June 2016. We are externally managed and advised by the advisor, a renewable energy, energy efficiency and sustainability related project acquisition, consulting and development company that is registered as an investment adviser under the Investment Advisers Act of 1940, as amended (“Advisers Act”). The LLC’s fiscal year end is December 31.
Our business objective is to generate attractive risk-adjusted returns for our members, consisting of both current income and long-term capital appreciation, by acquiring and financing the construction and/or operation of income-generating renewable energy, energy efficiency and sustainable development projects, primarily within but also outside of North America. We expect the size of our investments to generally range between approximately $1 million and $100 million. We will seek to maximize our risk-adjusted returns by: (1) capitalizing on market opportunities; (2) focusing on hard assets that produce dependable cash flows; (3) efficiently utilizing government incentives where available; (4) employing creative deal structuring to optimize capital and ownership structures; (5) partnering with experienced financial, legal, engineering and other professional firms; (6) employing sound due diligence and risk mitigation processes; and (7) monitoring and managing our portfolio of assets on an ongoing basis.
Our objective has been to assemble a diversified portfolio of renewable energy, energy efficiency and other sustainability related projects and businesses. Renewable energy projects generally earn revenue through the sale of generated electricity as well as frequently through the sale of other commodities such as RECs and EECs. We initially focused on solar energy and wind energy projects as well as energy efficiency projects. In 2019, we invested in our initial biomass facility.
We believe solar energy projects generally offer more predictable power generation characteristics, due to the relative predictability of sunlight over the course of time, compared to other renewable energy classes. Therefore, we expect they will provide more stable income streams. However, technological advances in wind turbines and other energy generation technologies, as well as government incentives make wind energy and other types of projects attractive as well.
Solar energy projects provide maximum energy production during the middle of the day and in the summer months when days are longer and nights shorter. Solar energy projects tend to have minimal environmental impact enabling such projects to be developed close to areas of dense population where electricity demand is highest. Since solar technology is scalable and well-established, it has been a relatively straightforward process to integrate new acquisitions and projects into our portfolio.
Over time, we expect to broaden our strategy to include other types of renewable energy projects and energy efficiency projects and businesses, which may include hydropower assets, and geothermal plants, combined heat and power technology assets, fuel cell assets and other energy efficiency assets, among others. To the extent we deem the opportunity attractive, other energy and sustainability related assets and businesses will be included.
50
Our preferred investment strategy is to acquire controlling equity stakes in our target assets or to be named the managing member of a limited liability company to oversee and supervise their operations. We define controlling equity stakes as companies in which we own 25% or more of the voting securities of such company or have greater than 50% representation on such company’s board of directors. However, we will also provide financing to projects owned by others, including through the provision of secured loans which may or may not include some form of equity participation.
Our strategy will be tailored to balance long-term cash flow certainty, which we can achieve through long-term agreements for our products, with shorter term arrangements that allow us to potentially generate higher risk-adjusted returns. We may provide projects with senior unsecured debt, subordinated secured debt, subordinated unsecured debt, mezzanine debt, convertible debt, convertible preferred equity, preferred equity, and make minority equity investments. We may also participate in projects by acquiring contractual payment rights or rights to receive a proportional interest in the operating cash flow or net income of a project. We may also make equity investments in or loans to parties financing the supply of renewable energy and energy efficiency to residential and commercial customers or the adoption of strategies to reduce the consumption of energy by those customers.
Overall, Management’s strategy of purchasing smaller renewable energy projects where there is less competition from the larger capital providers has enabled us to build a diversified portfolio of high quality, higher returning assets. Having a portfolio of smaller projects is initially more expensive and time consuming to operate than having a smaller number of much larger projects, as all renewable energy projects have similar onboarding and acquisition costs irrespective of their size. Having said that at scale there are considerable efficiencies to be obtained on smaller projects through the streamlining of operations, buying insurance and other services in bulk and obtaining much better financing terms and these benefits are then available to be enjoyed over the whole of the economic life of the assets; which in most cases is 30 -35 years. Management views the downside of the additional upfront costs as well worth the investment to provide superior returns over the long term. The larger and more efficient the company becomes the more we create a sustainable competitive advantage in the marketplace. There are other advantages of this strategy as well such as wide geographic diversity, which is very important when weather plays such an important part in the generation of our income, credit risk diversity, operational diversity, technology diversity and smoothing the seasonality to name just a few. But the other key advantage is that it’s where we expect to see more of the investment opportunities in the future as the economy continues to embrace the concept of distributed energy and move away from the traditional centralized generation model. As this trend continues, we expect to see more smaller transactions coming to market and far fewer large transactions. Through the year to December 31, 2019 we executed 12 portfolio acquisition transactions, and four portfolio sales, bringing us to a total of 34 portfolios to date. As our access to capital has increased the average size of the investment has increased from 13.98 MW per portfolio in 2018 to 19.83 MW per portfolio in 2019, a 41.85% increase year over year.
Our renewable energy projects generate revenue primarily by selling (1) generated electric power to local utilities and other high quality, utility, municipal, corporate and individual residential counterparties, and (2) in some cases, RECs, EECs, and other commodities associated with the generation or savings of power. We seek to acquire or finance projects that contain transmission infrastructures and access to power grids or networks that will enable the generated power to be sold. We generally expect our projects will have PPAs with one or more counterparties, including local utilities or other high credit quality counterparties, who agree to purchase the electricity generated from the project.
We refer to these PPAs as “must-take contracts,” and we refer to these other counterparties as “off-takers.” These must-take contracts guarantee that all electricity generated by each project will be purchased. Although we intend to work primarily with high credit quality counterparties, if an off-taker cannot fulfill its contractual obligation to purchase the power, we would seek to sell the power to the local utility or other suitable counterparty, which would potentially ensure revenue is generated for all solar electricity generation.
We employ a rigorous credit underwriting process for each of our contractual counterparties: (1) identification of high credit quality counterparties with appropriate bonding and insurance capacity; (2) where available, the review of counterparty financial statements and/or publicly available credit rating reports; (3) worst-case analysis testing of assets; (4) ongoing monitoring of acquired assets and counterparty creditworthiness, including monitoring the public credit ratings reports issued by Moody’s and Standard and Poor’s; and (5) individual FICO scores in regard to residential solar where the homeowner is the counterparty.
The following table illustrates the allocation by percentage of the company’s contracted revenue by counterparty type and creditworthiness for the years ended December 31, 2019 and 2018.
| For the year ended December 31, 2019 | For the year ended December 31, 2018 | |||||||
| Investment grade: | ||||||||
| Utility | 60.2 | % | 71.1 | % | ||||
| Municipality | 8.1 | 6.1 | ||||||
| Corporation | 0.2 | 0.6 | ||||||
| Subtotal investment grade | 68.5 | % | 77.8 | % | ||||
| Non-investment grade or no rating: | ||||||||
| Utility | 15.0 | % | 0.2 | % | ||||
| Municipality | 2.4 | 2.7 | ||||||
| Residential | 12.4 | 17.8 | ||||||
| Corporation | 1.7 | 1.5 | ||||||
| Subtotal non-investment grade or no rating | 31.5 | % | 22.2 | % | ||||
| Total | 100.0 | % | 100.0 | % | ||||
51
Our PPAs, when structured with utilities and other large commercial users of electricity, are generally long-term in nature, tied to 100% of the output of the specific generating asset, and priced at a rate established pursuant to a formula set by the contract. The formula is often dependent upon the type of subsidies, if any, offered by the local and state governments for project development. Although we focus on projects with long-term contracts that ensure price certainty, we may also look for projects with shorter term arrangements that will allow us to participate in market rate changes which may lead to higher current income.
A number of the PPAs for our projects are structured as “behind the meter” agreements with residential, commercial or government entities. Under the agreements, all electricity generated by a project will be purchased by the off-taker at an agreed upon rate that may be set at a slight discount to the retail electric tariff rate for the off-taker. These agreements also typically provide for annual rate increases over the term of the agreement although that is not a necessary requirement. The behind the meter agreement is generally long-term in nature and further typically provides that, should the off-taker fail to fulfill its contractual obligation, any electricity that is not purchased by the off-taker may be sold to the local utility, usually at an equivalent wholesale spot electric rate.
We have structured some of our investments in residential solar with a similar commercial arrangement to that of the PPAs with utilities and other large commercial users of electricity for our energy projects, as described above. In addition, we have acquired residential solar assets which have a private purchase agreement with the residential homeowner as counterparty as well as leasing the solar assets to a residential owner on a long-term basis where the residential owner directly receives the benefit of the electricity generated.
We currently finance energy efficiency projects, which seek to enable residential customers, businesses and governmental organizations to consume less energy while at the same time providing the same or greater level of amenity. Financing for energy efficiency projects is generally used to pay for energy efficiency retrofits of buildings, homes, businesses, and replacement of other inefficient energy consuming assets with more modern technologies. These projects are structured to provide predictable long-term cash flows by receiving a portion of the energy savings and the potential sale of associated RECs and EECs generated by such installations. In each of our renewable energy and energy efficiency investments, we intend, where appropriate, to maximize the benefits of renewable portfolio standards or RPS as well as other U.S. federal, state and local government support and incentives for the renewable energy industry.
52
The table below sets forth the company’s investments in alternative energy generation portfolios as of December 31, 2019.
| Acquisition Date | Industry | Location(s) | Form of Investment*** | Cost**/Principal Amount* | Assets | Generation Capacity in (MW)* | ||||||||||||
| Conic Portfolio | First quarter 2018, Second quarter 2018, Fourth quarter 2018 | Commercial Solar | Colorado, North Carolina | Managing member, majority equity owner | $ | 12,077,823 | Commercial ground and roof mounted photovoltaic systems | 36.9 | ||||||||||
| East to West Solar Portfolio | First quarter 2015, Second quarter 2015, Fourth quarter 2015, Second quarter 2018 | Commercial Solar | Colorado, Connecticut, Florida, Hawaii, Indiana and North Carolina | 100% equity ownership or Managing member, majority equity owner | $ | 39,109,190 | Commercial ground and roof mounted photovoltaic systems | 32.5 | ||||||||||
| Foresight Solar Portfolio | Fourth quarter 2017 | Commercial Solar | California, Colorado | Managing member, majority equity owner | $ | 13,790,000 | Commercial ground and roof mounted photovoltaic systems | 10.1 | ||||||||||
| Golden Horizons Solar Portfolio | Fourth quarter 2017 | Commercial Solar | California | 100% equity ownership | $ | 9,290,000 | Commercial ground and roof mounted photovoltaic systems | 7.8 | ||||||||||
| Green Maple Portfolio | Fourth quarter 2014, Fourth quarter 2015, Fourth quarter 2019 | Commercial Solar | Vermont | 100% equity ownership | $ | 26,561,596 | Commercial ground and roof mounted photovoltaic systems | 13.1 | ||||||||||
| Longleaf Portfolio | Fourth quarter 2018 | Commercial Solar | North Carolina | Managing member, majority equity owner | $ | 22,797,404 | Commercial ground and roof mounted photovoltaic systems | 21.8 | ||||||||||
| Magnolia Sun Portfolio | Third quarter 2015, First quarter 2016 | Commercial Solar | California, Massachusetts and Tennessee | 100% equity ownership | $ | 10,775,000 | Commercial ground and roof mounted photovoltaic systems | 5.3 | ||||||||||
| Midway III Solar Portfolio | Fourth quarter 2017 | Commercial Solar | California | Managing member, majority equity owner | $ | 10,575,394 | Commercial ground and roof mounted photovoltaic systems | 26.0 | ||||||||||
| Six States Solar Portfolio | Fourth quarter 2015, Third quarter 2017 | Commercial Solar | Arizona, California, Colorado, Connecticut, Indiana and North Carolina | 100% equity ownership | $ | 12,655,306 | Ground and roof mounted solar systems | 12.9 | ||||||||||
| Sunny Mountain Portfolio | Third quarter 2014 | Commercial Solar | Colorado | 100% equity ownership | $ | 884,578 | Commercial and residential ground and roof mounted solar photovoltaic systems | 0.8 | ||||||||||
| Canadian Northern Lights Portfolio | Fourth quarter 2014, Fourth quarter 2015 | Residential Solar | Ontario, Canada | 100% equity ownership | $ | 1,603,136 | Residential rooftop mounted solar photovoltaic systems | 0.6 | ||||||||||
| Greenbacker Residential Solar Portfolio | Third quarter 2016, First quarter 2017, Second quarter 2017 | Residential Solar | Arizona, California, Connecticut, Hawaii, Maryland, Massachusetts, New Jersey and New York | 100% equity ownership or managing member, majority equity owner | $ | 28,100,000 | Residential rooftop mounted solar photovoltaic systems | 18.6 | ||||||||||
| Greenbacker Residential Solar Portfolio II | Second quarter 2017 | Residential Solar | Arizona, California, Connecticut, Maryland, Massachusetts, Nevada, New Jersey and New York | Managing member, majority equity owner | $ | 6,400,000 | Residential rooftop mounted solar photovoltaic systems | 10.2 | ||||||||||
| Greenbacker Wind Portfolio - California | Fourth quarter 2017 | Wind | California | 100% equity ownership | $ | 9,500,000 | Operating wind power facilities | 6.0 | ||||||||||
| Greenbacker Wind Portfolio - HoldCo | Second quarter 2017, Fourth quarter 2017, Second quarter 2019 | Wind | Idaho, Minnesota, Vermont | 100% equity ownership | $ | 25,753,111 | Operating wind power facilities | 51.3 | ||||||||||
| Greenbacker Wind Portfolio - Montana | Fourth quarter 2015, Fourth quarter 2016 | Wind | Montana | Managing member, equity owner | $ | 24,756,684 | Operating wind power facilities | 35.0 | ||||||||||
53
| Acquisition Date | Industry | Location(s) | Form of Investment*** | Cost**/Principal Amount* | Assets | Generation Capacity in (MW)* | ||||||||||||
| Greenbacker Wind Portfolio - Iowa | Third quarter 2019 | Wind | Iowa | 100% equity ownership | $ | 20,440,000 | Operating wind power facilities | 80.0 | ||||||||||
| Greenbacker Wind Portfolio - Massachusetts | Fourth quarter 2019 | Wind | Massachusetts | Managing member, majority equity owner | $ | 10,169,079 | Operating wind power facilities | 5.0 | ||||||||||
| Eagle Valley Biomass Portfolio | Second quarter 2019 | Biomass | Colorado | 100% equity ownership | $ | 21,425,600 | Operating biomass facility | 12.0 | ||||||||||
| SE Solar 2019 Portfolio | Fourth quarter 2018 | Pre-Operational Assets | North Carolina | 100% equity ownership | $ | 5,000,000 | Commercial ground and roof mounted photovoltaic systems | 20.8 | ||||||||||
| Turquoise Solar Portfolio | Fourth quarter 2018 | Pre-Operational Assets | Nevada | 100% equity ownership | $ | 26,602,532 | Commercial ground and roof mounted photovoltaic systems | 60.6 | ||||||||||
| Omni DG Portfolio | First Quarter 2019 | Pre-Operational Assets | California, New Jersey, Maryland | 100% equity ownership | $ | 17,900,298 | Commercial ground and roof mounted photovoltaic systems | 19.6 | ||||||||||
| Phoenix Solar Portfolio | Fourth Quarter 2019 | Pre-Operational Assets | Pennsylvania | 100% equity ownership | $ | 4,051,138 | Commercial roof mounted photovoltaic systems | 7.2 | ||||||||||
| Colorado CES Portfolio | Second quarter 2019 | Pre-Operational Assets | Colorado | 100% equity ownership | $ | 4,517,354 | Commercial ground and roof mounted photovoltaic systems | 6.0 | ||||||||||
| Oregon Sun Portfolio | Third quarter 2019 | Pre-Operational Assets | Oregon | 100% equity ownership | $ | 5,404,787 | Commercial ground and roof mounted photovoltaic systems | 9.3 | ||||||||||
| Electric City Portfolio | Fourth quarter 2019 | Pre-Operational Assets | Michigan | 100% equity ownership | $ | 4,208,484 | Commercial ground mounted photovoltaic systems | 18.9 | ||||||||||
| Citrine Portfolio | Fourth quarter 2019 | Pre-Operational Assets | Massachusetts, New Jersey, and Pennsylvania | 100% equity ownership | $ | 3,411,249 | Commercial ground and roof mounted photovoltaic systems | 9.2 | ||||||||||
| Opal Portfolio | Fourth quarter 2019 | Pre-Operational Assets | Vermont | 100% equity ownership | $ | 344,949 | Commercial ground mounted photovoltaic systems | 0.7 | ||||||||||
| Trillium Portfolio | Fourth quarter 2019 | Pre-Operational Assets | Arizona, Colorado, D.C., and Maryland | Managing member, majority equity owner | $ | 24,277,396 | Commercial ground mounted photovoltaic systems | 16.9 | ||||||||||
| Other Portfolios | Third quarter 2018 Fourth quarter 2018, Fourth quarter 2019 |
Pre-Operational Assets | California, Colorado, North Carolina, and Delaware | 100% equity ownership | $ | 12,657,710 | Commercial ground and roof mounted photovoltaic systems | N/A | ||||||||||
| GREC Energy Efficiency Portfolio | Third quarter 2015 | Energy Efficiency | Puerto Rico | Capital lease | $ | 388,044 | Energy efficiency LED lighting | N/A | ||||||||||
| Renew AEC One, LLC | Fourth quarter 2015 | Energy Efficiency | Pennsylvania | Secured loan | $ | 479,140 | Energy efficiency LED lighting | N/A | ||||||||||
| SE Solar Loan | First quarter 2019 | Secured Loan | North Carolina | Secured Loan | $ | 1,000,000 | Loan | N/A | ||||||||||
| Hudson Loan | Third quarter 2019 | Secured Loan | New York | Secured Loan | $ | 9,481,127 | Loan | N/A | ||||||||||
| TUUSSO Loan | Fourth quarter 2019 | Secured Loan | Washington | Secured Loan | $ | 2,621,883 | Loan | N/A | ||||||||||
| Encore Loan | Fourth quarter 2019 | Secured Loan | Vermont | Secured Loan | $ | 5,000,680 | Loan | N/A | ||||||||||
| New Market Loan | Fourth quarter 2019 | Secured Loan | North Carolina | Secured Loan | $ | 5,000,000 | Loan | N/A | ||||||||||
| * | Approximate |
| ** | Does not include assumed project level debt |
| *** | 100% Equity ownership, majority equity owner (≥50%), equity owner (<50%), Managing Member of the Limited Liability Company, secured loan or a capital lease |
54
The investments described above have allowed us to execute on our strategy of constructing a portfolio of projects offering predictable power generation characteristics and generally stable income streams which include seasonal solar generation income (generally stronger in the summer months), wind generation income (generally stronger in the winter months), biomass generation income, and energy efficiency lights investments.
The LLC conducts a significant portion of its operations through GREC, of which the LLC is the sole shareholder–both shares of common stock and the special preferred stock. We intend to continue to operate our business in a manner permitting us to maintain our exemption from registration under the Investment Company Act of 1940, as amended (the “Investment Company Act”). We are not a blank check company within the meaning of Rule 419 of the Securities Act of 1933, as amended (the “Securities Act”) and have no specific intent to engage in a merger or acquisition in the next 12 months.
Pursuant to the now-terminated Registration Statement on Form S-1 (File No. 333-211571), we offered on a continuous basis up to $1,000,000,000 in shares of our limited liability company interests, consisting of up to $800,000,000 of shares in the primary offering and up to $200,000,000 of shares pursuant to the Distribution Reinvestment Plan (the “DRP”). The primary offering was terminated on March 29, 2019. SC Distributors, LLC was the dealer manager for the primary offering. The company’s initial offering pursuant to a Registration Statement on Form S-1 (File No. 333-178786-01) terminated on February 7, 2017. As of June 4, 2019, pursuant to our Registration Statement on Form S-3 (File No. 333-231960) we are offering a maximum of $10,000,000 in shares of our common stock to our existing stockholders pursuant to the DRP. Shares of the company’s limited liability company interests issued pursuant to the DRP are initially being offered at the price equal to the then-current offering price per each class of shares.
After the finalization of the December 31, 2019 net asset value, the current offering price of the Class P-I shares is $8.90 per share.
As of December 31, 2019, 2018 and 2017, through initial purchases of shares and participation in the distribution reinvestment program, our advisor owned 23,601 shares.
As of December 31, 2019, we had received subscriptions for and issued 50,190,331 of our shares (including shares issued under the DRP) for gross proceeds of $465,384,994 (before dealer-manager fees of $4,307,374 and selling commissions of $14,190,829 for net proceeds of $446,886,791). As of December 31, 2018, we had received subscriptions for and issued 38,319,164 of our shares (including shares issued under the DRP) for gross proceeds of $360,420,438 (before dealer-manager fees of $4,075,482 and selling commissions of $13,596,582 for net proceeds of $342,748,374).
Current Competition in the Alternative Energy - Solar Marketplace
The solar financing market started as a cottage industry where developers would bring together high net worth investors to fund single solar and wind transactions. Though successful in jump starting the industry, true capital formation is a relatively new phenomenon and is not as well developed as in other asset classes. Currently in the alternative energy — solar marketplace, there are several sources of capital:
| ● | Developer/Owner Operators. The major competition we face in the market for the assets we target comes from privately backed developer/owner operators. The capital from these organizations has generally been sourced from a combination of family offices/private equity funds and hedge funds. These organizations are generally, set up as developers, with investment return expectations in the 20-30% range. |
However, to facilitate the most favorable exit for the sponsors, the developer/owner operators seek to accumulate a significant portfolio of operating assets to provide a base level of stable and predictable earnings for the enterprise. Through a combination of developer profits and leverage they can generate satisfactory ongoing returns with the bulk of the upside being generated for the sponsors through the exit. Particularly in circumstances where equity markets experience a downturn, we are of the opinion this group of buyers will ultimately be capital constrained.
| ● | Single Purpose Limited Partnerships. These entities are typically funded by high net worth individuals or family offices and are generally focused on a small number of deals as they have a limited amount of capital to invest. |
| ● | Utilities. Institutional investors including large life insurance companies, pension funds and infrastructure funds. This sector dominates investment in the larger projects (i.e. $100,000,000 or greater). We tend not to encounter this group in the markets we target because scale is always an important consideration for larger institutions. |
In management’s view, the company has been competitive in bidding for solar assets against all these sources of capital and maintains a significant pipeline of deals which can be consummated as offering proceeds are raised.
55
Opportunities in Solar Power Today
We believe that the greatest opportunity exists within the Small Utility Scale, Commercial Solar and Community Solar segments of the market. In the Small Utility Scale market, the company can buy assets with similar commercial attributes to the Large Utility Scale projects—Investment Grade off-taker, same equipment and warranties, same operations and maintenance service provider —but where returns are higher.
We have also noted a growing trend among U.S. corporations, to work with developers and financiers to provide renewable power for their operations. Driven by a desire to save money, create certainty around long term electricity prices and support Green marketing initiatives, the Commercial and Industrial (C&I) segment is rapidly becoming one of the most exciting parts of the renewable energy project market. These deals tend to be smaller than Utility Scale solar which fits well with our strategy of focusing on the lower middle market segment of the industry.
A number of U.S. States have adopted programs that encourage the development of Community Solar Projects where groups of companies, municipalities and individuals can buy renewable power from solar and wind plants that are located within the customers utility zone. While there are certain complexities associated with such projects, we are closely monitoring the rapid growth of this segment.
In our view, there is a significant opportunity to aggregate portfolios of high-quality Small Utility Scale, Commercial Solar and Community Solar projects working with experienced developers looking for a reliable and sustainable source of capital to increase the certainty of them closing transactions. As a result, we have been focusing on building relationships with respected developers with a view to acquiring pipelines of projects rather than one-off deals.
By working closely with developers to efficiently close their transactions, we are seeking to create a sustainable competitive advantage which will lead to recurring and consistent deal flow. Importantly our strategy is differentiated from the developer/owner operators mentioned above because we do not seek to compete with the developers. Rather, we work with developers so that they can focus their activities on development while we focus on the financing and long-term ownership of their developments. This alignment of interests is mutually beneficial and symbiotic.
Current Competition in the Alternative Energy — Wind Marketplace
Growth in the Wind Project Market has been strong in 2019. According to the American Wind Energy Association’s (AWEA) U.S. Wind Industry Third Quarter 2019 Market Report, the U.S. wind industry installed 3,667 MW of new wind power capacity through the first nine months of the year, a 123% increase over the first nine months of 2018. According to EIA data wind power is on track to surpass hydropower as the U.S. grid’s largest source of renewable electricity in 2019. As a result, we continue to see good investment opportunities in the Wind Project Market.
| ● | The EIA forecasts wind additions will bring installed capacity from 96 gigawatts to 107 gigawatts by the end of the year, with another 7 gigawatts coming in 2020. |
| ● | Renewable portfolio standards are expected to continue to drive development in the wind sector particularly in the Northeast U.S. and California. |
Thus, current market conditions remain favorable for additional wind development in 2019. Particularly for smaller middle market transactions involving assets similar to those in our current portfolio, we believe that we will continue to be competitive in bidding for wind assets. We also believe that we may see opportunities to purchase operating wind assets which have run through their tax credits.
56
Opportunities in Wind Today
We believe that the middle market segment presents the best opportunities for investment. This sector faces less competition for assets than the large utility scale sector, which tends to be fully banked. Furthermore, we believe that targeted investments in select wind opportunities provides us with increased diversification of cash flows stemming from the fact that wind assets tend to perform better in the winter months while solar tends to perform better in the summer months.
We believe that this countercyclical diversification is highly beneficial in managing our cashflows throughout the year. We also believe that we are well positioned to find investable assets in this sector given our track record of purchasing four wind portfolios of this size range over the past two years. These purchases have enabled us to build relationships with respected developers who we may be able to work with in the near future.
Factors Impacting Our Operating Results
The results of our operations are affected by a number of factors and will primarily depend on, among other things, the supply of renewable energy assets in the marketplace, the revenues we receive from renewable energy and energy efficiency projects and businesses, the market price of electricity, the availability of government incentives, local, regional and national economies, general market conditions, and the amount of our assets that are operating versus those that are non-operating because they are currently under construction. Additionally, our operations are impacted by interest rates and the cost of financing provided by other financial market participants. Many of the factors that affect our operating results are beyond our control.
Size of portfolio. The size of our portfolio of investments is a key revenue driver. Generally, as the size of our portfolio grows, the amount of income we receive will increase. In addition, our portfolio of investments may grow at an uneven pace as opportunities to make investments in our target assets may be irregularly timed, and the timing and extent of GCM’s success in identifying such assets, and our success in acquiring such assets, cannot be predicted. Lastly, other than management fees, most of our expenses are of a fixed nature. Therefore, expenses as a percentage of net assets are reduced as the net assets of the company increase.
Pre-operational and non-earning assets. The increasing amount of pre-operational and non-earning assets (defined as deposits and other cash investments not currently generating an investment return) in our portfolio is a significant factor in our revenue and net asset value. The amount of cash invested in these pre-operational and non-earning assets reduces investment income until (1) the asset reaches commercial operation date or (2) otherwise begins generating an investment return and commences regular distributions to the company. We believe these assets, once operational or income generating, will provide returns consistent with the company’s investment strategy.
Credit risk. We encounter credit risk relating to: (1) counterparties to the electricity and environmental credit sales agreements (including PPAs) for our projects; (2) counterparties responsible for project construction and hedging arrangements; (3) companies in which we may invest; and (4) any potential debt financing we or our projects may obtain. We seek to mitigate credit risk by entering into contracts with high quality counterparties. However, it is still possible that these counterparties may be unable to fulfill their contractual obligations to us.
If counterparties to the electricity sales agreements for our projects or the companies in which we invest are unable to make payments to us when due, or at all, our financial condition and results of operations could be materially adversely affected. While we seek to mitigate construction-related credit risk by entering into contracts with high quality EPC companies with appropriate bonding and insurance capacity, if EPCs to the construction agreements for our projects are unable to fulfill their contractual obligations to us, our financial condition and results of operation could be materially adversely affected. We seek to mitigate credit risk by deploying a comprehensive review and asset selection process, including worst case analysis, and careful ongoing monitoring of acquired assets as well as mitigation of negative credit effects through back up planning. Nevertheless, unanticipated credit losses may occur which could adversely impact our operating results.
57
Electricity prices. All our projects benefit from take-or-pay agreements with terms structured to take 100% of the power output. On average, the contracts in our existing portfolio have approximately 16 years remaining prior to exposure to market prices. The credit standing of the contract counterparty is a particular focus in situations where the contracts have a price escalator. Escalating contracts create an incentive for the counterparty to not continue to perform if the contract pricing deviates materially from the market price. If the contract is with a public or investment grade entity, we have generally been confident that the contract terms will be honored. The only exception might apply in situations where rising electricity prices could create pressure around a political change at the state or local level.
Due to the take-or-pay nature of the contracts, we believe that the company is largely insulated from the daily volatility of the electricity market prices. Nevertheless, we monitor these markets to stay abreast of developments in the industry as they occur. Over recent years, we have seen a lot of volatility in gas prices. However, that volatility has been slow to translate into movements in the electricity prices.
Electricity pricing is a function of a range of factors. The price of gas is just one component. Electricity prices also include: (1) a recovery of the cost of the generation plant; (2) the labor to operate it; (3) the cost to transport the fuel to the plant; (4) the cost to wheel the power to the customer; and (5) the cost to administer the utility. Thus, gas price volatility is less impactful on the delivered price of electricity than one might expect.
The U.S. Energy Information Agency of the Department of Energy anticipates that electricity prices will rise annually by between 2.5% and 3.0% nationally for the next 20 years (on a nominal basis). Assuming the price at which we sell the power under our contracts is set at a discount to the current electricity price and the escalator (to the extent there is one) is less than 2.5% per annum, we expect the contracted price will remain close to, if not below, the market price of the electricity throughout the entire term of the contract.
Changes in market interest rates. To the extent that we use debt financing with unhedged floating interest rates, or in the case of any refinancing, general increases in interest rates over time may cause the interest expense associated with our borrowings to increase. This would decrease the value of our debt investments. Conversely, general decreases in interest rates over time may cause the interest expense associated with our borrowings to decrease and the value of our debt investments to increase.
Market conditions. We believe that demand for alternative forms of energy from traditional fossil-fuel energy will continue to grow as countries seek to reduce their dependence on outside sources of energy and as the political and social climate continues to demand social responsibility on environmental matters. Notwithstanding this growing demand, particularly with respect to small and mid-sized projects and businesses that are newly developed, we believe that a significant shortage of capital currently exists in the market to satisfy the demands of the renewable energy sector in the United States and around the world.
Many of the traditional sources of equity capital for the renewable energy marketplace were attracted to renewable energy projects based on their ability to utilize ITCs and tax deductions. We believe that due to changes in their taxable income profiles that have made these tax incentives less valuable, these traditional sources of equity capital have withdrawn from the market. In addition, much of the capital that is available is focused on larger projects that have long-term off-take contracts in place and does not allow project owners to take any “merchant” or investment risk with respect to RECs. We believe many project developers are not finding or are encountering delays in accessing capital for their projects. As a result, we believe a significant opportunity exists for us to provide new forms of capital to meet this demand.
Regulatory matters. Regulatory and tax policy at the federal and state levels tends to be forward looking rather than retrospective. As a result, we do not see many regulatory or tax issues impacting any assets we already own or buy during the operation of a particular regulatory or tax regime.
Future changes, which could impact the returns on future transactions, will be factored into our buying decisions. In the past, we have seen government policy drive a lot of development activity. For example, when the government announces the phasing out of a tax incentive, developers race to get projects to a stage that ensures the project qualifies for the incentive. Policy driven activity is generally short lived but can skew the investment supply and demand dynamic.
58
From the federal perspective, changes in tax and regulatory policy could negatively affect prospective returns. Federal tax incentives are comprised of MACRS depreciation and the ITC. MACRS results in accelerated depreciation of renewable assets over a 5.5-year period. Given the wide application of MACRS to other asset classes, we believe it is less susceptible to change than the ITC. The ITC is a tax incentive that allows an investor to take up to 30% of the installed cost of a solar system as a federal tax credit. This rule was extended at the end of 2015 with the credit amounts incrementally lowered over the next few years from 30% in 2016 to 10% in 2022 and beyond.
Other kinds of regulatory changes that could negatively impact returns include the introduction of some kind of value added tax either at the federal or state level, changes to property tax regimes, or any kind of targeted tax on the income of renewable energy generation assets. None of these possible changes appear likely any time soon but it is impossible to predict the future with any real certainty.
Generally, the policy changes that have occurred over the past decade at the U.S. Environmental Protection Agency and U.S. Department of Energy have been very positive for renewables: stronger emission regulations and other mandates improving the case for renewable energy assets. While the current U.S. administration has indicated greater support for traditional sources of energy and the potential reduction in support for alternative energy production, we believe that any changes enacted by the current U.S. administration will not have a material impact on our operations. In addition, in 2018, the U.S. imposed tariffs on photovoltaic (“PV”) panels imported to the U.S. that could have an impact on overall U.S. demand.
The regulatory market for electric power is highly fragmented with each state having significant influence over the functioning of its respective market. The states are the primary regulator for the utilities and they have implemented widely divergent policies at the state level. For example, some states allow utilities to be vertically integrated: producers of power as well as operators of the grid. Other states have separated those functions entirely.
We believe that this market diversity is a benefit for our program. States have been highly adept at advancing programs designed to benefit renewable energy with or without federal government support. There are currently 29 states that have developed a renewable portfolio standard. As a result, we see state regulatory issues as a shifting mosaic of opportunities where some markets will present opportunities while others become less attractive on a prospective basis.
59
Critical Accounting Policies and Use of Estimates
The following discussion addresses the accounting policies utilized based on our current operations. Our most critical accounting policies involve decisions and assessments that affect our reported assets and liabilities, as well as our reported revenues and expenses. We believe that all of the decisions and assessments upon which our consolidated financial statements are based are reasonable at the time made and based upon information available to us at that time. Our critical accounting policies and accounting estimates may be expanded over time as we continue to implement our business and operating strategy. The material accounting policies and estimates that are most critical to an investor’s understanding of our financial results and condition, as well as those that require complex judgment decisions by our management, are discussed below.
Basis of Presentation
Our consolidated financial statements are prepared in accordance with U.S. generally accepted accounting principles (“GAAP”) which requires the use of estimates, assumptions and the exercise of subjective judgment as to future uncertainties.
Although we are organized and intend to conduct our business in a manner so that we are not required to register as an investment company under the Investment Company Act, our consolidated financial statements are prepared using the specialized accounting principles of Accounting Standards Codification Topic 946, Financial Services — Investment Companies (“ASC Topic 946”). Overall, we believe that the use of investment company accounting makes our consolidated financial statements more useful to investors and other financial statement users since it allows a more appropriate basis of comparison to other entities with similar investment objectives.
Basis of Consolidation
As provided under Regulation S-X and ASC Topic 946, the company will generally not consolidate its investment in a company other than a wholly-owned investment company or controlled operating company whose business consists of providing services to the company. Accordingly, the company consolidated the accounts of the its wholly-owned subsidiaries in its consolidated financial statements. All significant intercompany balances and transactions have been eliminated in consolidation.
Investment Classification
We classify our investments by level of control. “Control Investments” are investments in companies in which we own 25% or more of the voting securities of such company, have greater than 50% representation on such company’s board of directors or that are limited liability companies for which we are the managing member. “Affiliate Investments” are investments in companies in which we own 5% or more and less than 25% of the voting securities of such company. “Non-Control/Non-Affiliate Investments” are investments that are neither Control Investments nor Affiliate Investments. Because our consolidated financial statements are prepared in accordance with ASC Topic 946, we do not consolidate companies in which we have Control Investments nor do we apply the equity method of accounting to our Control Investments or Affiliate Investments.
Valuation of Investments
Our advisor, in conjunction with an independent valuation firm when necessary, subject to the review and approval of the board of directors, is ultimately responsible for the determination, in good faith, of the fair value of investments. In that regard, the advisor has established policies and procedures which have been reviewed and approved by our board of directors, to estimate the fair value of our investments which are detailed below. Any changes to these policies and procedures are required to be approved by our board of directors, including a majority of our independent directors.
Investments for which market quotations are readily available are valued at such market quotations.
For most of our investments, market quotations will not be available. With respect to investments for which market quotations are not readily available, our board of directors has approved a multi-step valuation process each fiscal quarter, as described below:
| 1. | each investment will be valued by GCM. As part of the valuation process, GCM will prepare the valuations and associated supporting materials for review and approval by the board of directors; |
| 2. | our board of directors has approved the selection of an independent valuation firm to assist with the review of the valuations prepared by GCM. At the direction of our board of directors, the independent valuation firm will review valuations prepared by GCM for the appropriate application of its valuation policies and the appropriateness of significant inputs used in the valuation models by performing certain limited procedures, which will include a review of GCM’s estimates of fair value for each investment and providing an opinion that GCM’s estimate of fair value for each investment is reasonable. The independent valuation firm may also provide direct assistance to GCM in preparing fair value estimates if the board of directors approves such assistance. In the event that the independent valuation firm is directly involved in preparing the fair value estimate, our board of directors has the authority to hire a separate valuation firm to review that opinion of value; |
60
| 3. | the audit committee of our board of directors reviews and discusses the preliminary valuation prepared by GCM and the report of the independent valuation firm, if any; and |
| 4. | our board of directors reviews the valuations and approves the fair value of each investment in our portfolio in good faith by GCM. |
Loan investments are valued utilizing a market approach, an income approach, or both approaches, as appropriate. The market approach uses prices and other relevant information generated by market transactions involving identical or comparable assets or liabilities. The income approach uses valuation techniques to convert future amounts (for example, interest and amortization payments) to a single present value amount (discounted) calculated based on an appropriate discount rate. The measurement is based on the net present value using current market expectations about those future amounts. In following these approaches, the types of factors that we may take into account in determining the fair value of our loans include as applicable: debt covenants, call protection provisions, information rights, the nature and realizable value of any collateral, the project’s ability to make payments, its earnings and discounted cash flows, the markets in which the project does business, comparisons of financial ratios of peer business entities that are public, mergers and acquisitions comparables, the principal market and enterprise values, among other factors.
Equity investments are also valued utilizing a market approach, an income approach, or both approaches, as appropriate. The market approach uses prices and other relevant information generated by market transactions involving identical or comparable assets or liabilities. The income approach uses valuation techniques to convert future amounts (for example net cash flows or earnings) to a single present value amount (discounted) calculated based on an appropriate discount rate. The measurement is based on the net present value using current market expectations about those future amounts.
In following these approaches, the types of factors that we may take into account in determining the fair value of our equity investments include, as applicable: available current market data, including relevant and applicable market trading and transaction comparables, applicable market yields and multiples, security covenants, the project’s earnings and discounted cash flows, the markets in which the project does business, comparisons of financial ratios of peer business entities that are public, mergers and acquisitions comparables, the principal market and enterprise values, among other factors.
OTC derivatives including swap contracts are valued on a daily basis using observable inputs, such as quotations provided by an independent pricing service, the counterparty, broker-dealers, whenever available and considered reliable.
We have adopted ASC Topic 820, Fair Value Measurements (“ASC Topic 820”), which defines fair value, establishes a framework for measuring fair value in accordance with GAAP and expands disclosures about fair value measurements.
ASC Topic 820 clarifies that the fair value price is the price in an orderly transaction between market participants to sell an asset or transfer a liability in the market in which the reporting entity would transact for the asset or liability, that is, the principal or most advantageous market for the asset or liability. The transaction to sell the asset or transfer the liability is a hypothetical transaction at the measurement date, considered from the perspective of a market participant that holds the asset or owes the liability. ASC Topic 820 provides a consistent definition of fair value which focuses on exit price and prioritizes, within a measurement of fair value, the use of market-based inputs over entity-specific inputs. In addition, ASC Topic 820 provides a framework for measuring fair value and establishes a three-level hierarchy for fair value measurements based upon the transparency of inputs to the valuation of an asset or liability as of the measurement date. The three levels of valuation hierarchy established by ASC Topic 820 are defined as follows:
Level 1: Unadjusted quoted prices for identical assets or liabilities in active markets.
Level 2: Other significant observable inputs that are sourced either directly or indirectly from publications or pricing services, including dealer or broker markets, for identical or comparable assets or liabilities. Generally, these inputs should be widely accepted and public, non-proprietary and sourced from an independent third party.
61
Level 3: Inputs derived from a significant amount of unobservable market data and derived primarily through the use of internal valuation methodologies.
In all cases, the level in the fair value hierarchy within which the fair value measurement in its entirety falls will be determined based on the lowest level of input that is significant to the fair value measurement. Our assessment of the significance of a particular input to the fair value measurement in its entirety requires judgment and considers factors specific to each investment.
Our board of directors has approved the selection of an independent valuation firm to review our advisor’s valuation methodology and to work with our advisor and officers to provide additional inputs for consideration by our audit committee and to work directly with our full board of directors, at the board of directors’ request, with respect to the fair value of investments. For example, our board of directors may determine to engage more than one independent valuation firm in circumstances in which specific expertise of a particular asset or asset class is needed in connection with the valuation of an investment. In addition, GCM will recommend to our board of directors that one quarter of our investments be valued by an independent valuation firm each quarter, on a rotating quarterly basis. Accordingly, each such investment would be reviewed by an independent valuation firm at least once per year.
Our board of directors will have the ability to review our advisor’s valuation methodologies each quarter in connection with GCM’s presentation of its valuation recommendations to the audit committee. If during the period between quarterly board meetings, GCM determines that significant changes have occurred since the prior meeting of the board of directors at which it presented its recommendations on the valuation methodology, then GCM will also prepare and present recommendations to the audit committee of the board of directors of its proposed changes to the current valuation methodology. Any such changes to our valuation methodologies will require the approval of our board of directors, including a majority of our independent directors. We will disclose any change in our valuation methodologies, or any change in our investment criteria or strategies, that would constitute a fundamental change in a registration statement amendment prior to its implementation.
Foreign Currency Translation
The accounting records of the company are maintained in U.S. Dollars. The fair value of investments and other assets and liabilities denominated in non-U.S. currencies are translated into U.S. Dollars using the exchange rate at 4:00 p.m., Eastern Time, at each quarter end. Amounts related to the purchases and sales of investments, investment income and expenses are translated at the rates of exchange prevailing on the respective dates of such transactions.
Net unrealized currency gains and losses arising from valuing foreign currency-denominated assets and liabilities at the current exchange rate are reflected separately as unrealized appreciation/depreciation on translation of assets and liabilities denominated in foreign currencies.
Foreign security and currency translations may involve certain considerations and risks not typically associated with investing in U.S. companies and U.S. government securities. These risks include, but are not limited to, currency fluctuations and revaluations and future adverse political, social and economic developments, which could cause investments in foreign markets to be less liquid and prices more volatile than those of comparable U.S. companies or U.S. government securities.
Calculation of Net Asset Value
We calculate our net asset value per share by subtracting all liabilities from the total carrying amount of our assets, which includes the fair value of our investments, and dividing the result by the total number of outstanding shares on the date of valuation. For purposes of calculating our net asset value, we expect to carry all liabilities at cost.
The determination of the fair value of our investments requires judgment, especially with respect to investments for which market quotations are not available. For most of our investments, market quotations will not be available. Due to the inherent uncertainty of determining the fair value of investments that do not have a readily available market value, the fair value of the investments may differ significantly from the values that would have been used had a readily available market value existed for such investments, and the differences could be material. Because the calculation of our net asset value is based, in part, on the fair value of our investments as determined by our advisor, which is an affiliated entity of the company, our calculation of net asset value is to a degree subjective and could be adversely affected if the determinations regarding the fair value of our investments were materially higher than the values that we ultimately realize upon the disposal of such investments. Furthermore, the fair value of our investments, as reviewed and approved by our board of directors, may be materially different from the valuation as determined by an independent valuation firm.
62
Revenue Recognition
We record interest income on an accrual basis to the extent that we expect to collect such amounts. We do not accrue as a receivable interest on loans and debt securities for accounting purposes if we have reason to doubt our ability to collect such interest. Original issue discounts, market discounts or premiums are accreted or amortized using the effective interest method as interest income. We record prepayment premiums on loans and debt securities as interest income. Any application, origination or other fees earned by the company in arranging or issuing debt are amortized over the expected term of the loan.
We place loans on non-accrual status when principal and interest are past due 90 days or more or when there is a reasonable doubt that we will collect principal or interest. Accrued interest is generally reversed when a loan is placed on non-accrual. Interest payments received on non-accrual loans may be recognized as income or applied to principal depending upon management’s judgment. Non-accrual loans are generally restored to accrual status when past due and principal and interest is paid and, in our management’s judgment, is likely to remain current.
Dividend income is recorded (1) on the ex-dividend date for publicly issued securities and (2) when received from private investments or our project companies. The timing and amount of dividend income is determined on at least a quarterly basis by GREC. This process includes an analysis at the individual project company level based on cash available from operations and working capital ratios needed for the project company daily operations. Dividend income from our privately held, equity investments are recognized when approved. Dividends received from the company’s private investments, which generally reflect net cash flow from operations, are declared, accrued and paid on a quarterly basis at a minimum. The proceeds related to the dividend receivable amount of $620,846 presented on the consolidated statements of assets and liabilities as of December 31, 2019 were subsequently collected by January 31, 2020.
Net Realized Gains or Losses and Net Change in Unrealized Appreciation or Depreciation on Investments
We measure realized gains or losses by the difference between the net proceeds from the sale, repayment, or disposal of an asset and the adjusted cost basis of the asset, without regard to unrealized appreciation or depreciation previously recognized. Net change in unrealized appreciation or depreciation will reflect the change in investment values during the reporting period, including any reversal of previously recorded unrealized appreciation or depreciation, when gains or losses are realized.
Organization Costs
Organization costs are expensed on the company’s consolidated statements of operations as incurred.
Offering Costs
Offering costs include all costs to be paid by the company in connection with the offering of its shares, including legal, accounting, printing, mailing and filing fees, charges of the company’s escrow holder, transfer agent fees, due diligence expense reimbursements to participating broker-dealers included in detailed and itemized invoices and costs in connection with administrative oversight of the offering and marketing process, and preparing supplemental sales materials, holding educational conferences, and attending retail seminars conducted by broker-dealers. When recognized by the company, offering costs will be recognized as a reduction of the proceeds from the offering.
Deferred Sales Commissions
The company defers certain costs, principally sales commissions and related compensation, which are paid to the dealer manager and may be reallowed to financial advisors and broker/dealers in the future in connection with the sale of Class C shares sold with a reduced front-end load sales charge. The costs expected to be incurred at the time of the sale of Class C shares are recorded as a liability on date of sale and are amortized on a straight-line basis over the period beginning on the time of sale and ending on the date which approximates an expected liquidity event for the company. As of December 31, 2019, and December 31, 2018, the company recorded a liability for deferred sales commissions in the amount of $56,483 and $191,706, respectively.
Financing Costs
Financing costs related to debt liabilities of the company, GREC or GREC HoldCo are presented on the consolidated statements of assets and liabilities as a direct deduction from the carrying amount of that debt liability. Financing costs are deferred and amortized using the straight-line method over the life of the debt liability.
63
Recently Issued Accounting Pronouncements
In August 2018, the FASB issued ASU No. 2018-13, “Fair Value Measurement (Topic 820): Disclosure Framework—Changes to the Disclosure Requirements for Fair Value Measurement”, which modifies the disclosure requirements on fair value measurements. The new guidance is effective for fiscal years, and interim periods within those fiscal years, beginning after December 15, 2019 (fiscal 2020 for the company). Upon the effective date, certain provisions are to be applied prospectively, while others are to be applied retrospectively to all periods presented. An entity is permitted to early adopt any removed or modified disclosures upon issuance of this ASU and delay adoption of the additional disclosures until their effective date. We are currently evaluating the impact of ASU 2018-03 on our consolidated financial statements and disclosures, but do not expect a material impact on our consolidated financial statements and disclosures.
JOBS Act
We qualify as an “emerging growth company” pursuant to the provisions of the JOBS Act, enacted on April 5, 2012. For as long as we are an “emerging growth company,” we may take advantage of certain exemptions from various reporting requirements that are applicable to other public companies that are not “emerging growth companies,” including, but not limited to, not being required to comply with the auditor attestation requirements of Section 404(b) of the Sarbanes-Oxley Act, reduced disclosure obligations regarding executive compensation in our periodic reports and proxy statements, and exemptions from the requirements of holding advisory “say-on-pay” votes on executive compensation and shareholder advisory votes on golden parachute compensation.
Under the JOBS Act, we will remain an “emerging growth company” until the earliest of:
| ● | the last day of the fiscal year during which we have total annual gross revenues of $1 billion or more; |
| ● | the last day of the fiscal year following the fifth anniversary of the completion of our initial public offering; |
| ● | the date on which we have, during the previous three-year period, issued more than $1 billion in non-convertible debt; and |
64
| ● | the date on which we are deemed to be a “large accelerated filer” under the Securities Exchange Act of 1934, as amended (the “Exchange Act”). We will qualify as a large accelerated filer as of the first day of the first fiscal year after we have (i) more than $700,000,000 in outstanding common equity held by our non-affiliates as of the last day of our most recently completed second fiscal quarter, (ii) been a public company for at least 12 months and (iii) filed at least one annual report with the SEC. The value of our outstanding common equity will be measured each year on the last day of our second fiscal quarter. |
The JOBS Act also provides that an “emerging growth company” can utilize the extended transition period provided in Section 7(a)(2)(B) of the Securities Act for complying with new or revised accounting standards. However, we are choosing to opt out of that extended transition period, and, as a result, we will comply with new or revised accounting standards on the relevant dates on which adoption of such standards is required for companies that are not “emerging growth companies.” Section 107 of the JOBS Act provides that our decision to opt out of the extended transition period for complying with new or revised accounting standards is irrevocable.
Portfolio and Investment Activity
As of December 31, 2019, the company invested in numerous solar, wind, biomass, and energy efficiency projects included in 36 investment portfolios, as well as six secured loans, as follows:
Conic Portfolio
Colorado CSG II, a major component of the Conic Portfolio, consists of 12 operational community solar projects located in Colorado with a combined generating capacity of approximately 23.1 MW. The Projects all reached commercial operations date between December 2018 and June 2019. The Projects are part of Xcel Energy’s Community Solar Garden program.
Sun Farm V & VI is also included within the Conic Portfolio and consists of two operating solar PV systems, 6.9 MW Sun Farm V and 7.0 MW Sun Farm VI, located in Perquimans County, North Carolina. The projects were placed in service in the fourth quarter of 2018 and sell power to large utility company through a 15-year fixed price PPA.
East to West Solar Portfolio
The company owns 9.8 MW of operating solar power facilities located on 13 sites in the states of Colorado, Connecticut, Florida, Hawaii, Indiana and North Carolina (the “East to West Solar Portfolio”). The East to West Solar Portfolio consists of ground and roof mounted solar systems (each, a “System”) located on municipal and commercial properties as follows:
| 1. | Denver International Airport – The Denver International Airport System has a generation capacity of 1.6 MW and is located in Denver, Colorado. The System sells power directly to the City and County of Denver Department of Aviation, under a 25-year fixed rate PPA. The System also sells SRECs directly to the local utility, Xcel Energy, under a 20-year contract. |
| 2. | Progress Energy I – The Progress Energy I System has a generation capacity of 2.5 MW and is located in Laurinburg, North Carolina. The system sells power directly to the local utility Duke Energy/Progress Energy Carolinas, Inc. under a 20-year fixed rate PPA. |
| 3. | Progress Energy II – The Progress Energy II System has a generation capacity of 2.5 MW and is located in Laurinburg, North Carolina. The system sells power directly to the local utility, Duke Energy/Progress Energy Carolinas, Inc. under a 15-year fixed rate PPA and also sells SRECs to the same off-taker under a 15-year contract. |
| 4. | SunSense I – The SunSense I System has a generation capacity of 0.5 MW and is located in Raleigh, North Carolina. The system sells power directly to the local utility, Duke Energy/Progress Energy Carolinas, Inc., under a 20-year fixed rate PPA. |
| 5. | SunSense II – The SunSense II System has a generation capacity of 0.5 MW and is located in Clayton, North Carolina. The system sells power directly to the local utility, Duke Energy/Progress Energy Carolinas, Inc., under a 20-year fixed rate PPA. |
| 6. | SunSense III – The SunSense III System has a generation capacity of 0.5 MW and is located in Fletcher, North Carolina. The system sells power directly to the local utility, Duke Energy/Progress Energy Carolinas, Inc. under a 20-year fixed rate PPA. |
| 7. | NIPSCO III – The NIPSCO “Turtle Top” System has a generation capacity of 0.4 MW and is located in New Paris, Indiana. The system sells power directly to the local utility, Northern Indiana Public Service Company (NIPSCO), under a 15-year escalating rate PPA. |
| 8. | OUC I – The OUC I System has a generation capacity of 0.4 MW and is located in Orlando, Florida. The system sells power directly to the local utility, Orlando Utilities Commission, under a 25-year fixed rate PPA. |
| 9. | KIUC – The KIUC System has a generation capacity of 0.4 MW and is located in Koloa, Hawaii. The system sells power directly to the local utility, the Kauai Island Utility Cooperative, under a 20-year fixed rate PPA. |
| 10. | TJ Maxx – The TJ Maxx System has a generation capacity of 0.2 MW and is located in Bloomfield, Connecticut. The system sells power directly to the H.G. Conn. Realty Corp under a 15-year escalating rate PPA. |
65
| 11. | Denver Public Schools (Green Valley) – The Green Valley System has a generation capacity of 0.1 MW and is located in Denver, Colorado. The system sells power directly to the Denver Public Schools under a 20-year escalating rate PPA. The System also sells SRECs directly to the local utility, Xcel Energy, under a 20-year fixed rate contract. |
| 12. | Denver Public Schools (Rachel B. Noel) – The Rachel B. Noel System has a generation capacity of 0.1 MW and is located in Denver, Colorado. The system sells power directly to the Denver Public Schools under a 20-year escalating rate PPA. The System also sells SRECs to the local utility, Xcel Energy, under a 20-year fixed rate contract. |
| 13. | Denver Public Schools (Greenwood) – The Greenwood System has a generation capacity of 0.1 MW and is located in Denver, Colorado. The system sells power directly to the Denver Public Schools under a 20-year escalating rate PPA. The System also sells SRECs directly to the local utility, Xcel Energy, under a 20-year fixed rate contract. |
Separately, the company owns two additional operating solar PV systems, each with approximately 1.0 MW in power generation and together comprising a total of 2.0 MW, located in Gainesville, Florida (the “Gainesville Solar” facilities). Details of Gainesville Solar, which are included in the East to West Solar Portfolio, are as follows:
| 1. | MLH2 - The MLH2 System has a generation capacity of 1.0 MW and is located in Gainesville, Florida, on land owned by the company. The system sells power directly to the local utility, Gainesville Regional Utility, under a 20-year fixed rate PPA. |
| 2. | MLH3 – The MLH3 System has a generation capacity of 1.0 MW and is located in Gainesville, Florida. The system sells power directly to the local utility, Gainesville Regional Utility, under a 20-year fixed rate PPA. |
The company owns two operating solar PV systems comprising a total of 7.6 MW (the “NC Tar Heel” facilities) located in North Carolina through an equity investment of approximately $8,400,000 plus working capital.
Details of the NC Tar Heel facilities, which is included in the East to West Solar Portfolio, are as follows:
| 1. | Person County Solar Park 2 (PCIP) – The PCIP System has a generation capacity of 1.3 MW and is located in Timberlake, North Carolina. The system sells power directly to the local utility, Duke Energy/Progress Energy under a 20-year escalating rate PPA. |
| 2. | South Robeson – The South Robeson System has a generation capacity of 6.4 MW and is located in Rowland, North Carolina. The system sells power directly to the local utility, Duke Energy/Progress Energy Carolinas, Inc. under a 15-year fixed rate PPA. The System also sells RECs to the same off-taker under a 15-year fixed price contract. |
In addition, the company owns Phelps 158 Solar Farm, LLC a solar photovoltaic system with capacity of approximately 6.7 MW located in Conway, North Carolina. Phelps 158 Solar Farm, LLC is included in the East to West Solar Portfolio.
Lastly, the company purchased the managing member interest for a 6.3 MW portfolio of two utility scale solar projects (“Rockville Portfolio”). The Rockville Portfolio projects have been operating since 2014. The projects consist of 3.1 MW site ground-mounted project and a 3.2 MW roof-mounted project, both located in Indianapolis, Indiana. The projects are contracted for 15 years through PPAs with Indianapolis Power& Light.
Foresight Solar Portfolio
The Foresight Solar Portfolio is a 10.0 MW portfolio of operating solar projects located in California and Colorado. The portfolio consists of 6 operating ground mount systems between 0.5 MW and 2.0 MW which have been operational since Q3 2013 through Q4 2014.
66
Golden Horizons Portfolio
The Golden Horizons Portfolio consists of two operating solar photovoltaic PV systems comprising 7.8 MW located in North Palm Springs, California. The projects were placed in service during 2011 and sell power to California utility through a 20-year PPA.
Green Maple Portfolio
The company owns 9 solar power facilities in various locations in the state of Vermont (the “Green Maple Portfolio”). A brief summary of each project is as follows:
| 1. | Charter Hill Solar – The Charter Hill System has a generation capacity of 1.1 MW and is located in Rutland, Vermont. The system sells power directly to the local utility, Green Mountain Power, under a 25-year fixed rate PPA. |
| 2. | Williamstown Solar – The Williamstown System has a generation capacity of 0.8 MW and is located in Williamstown, Vermont. The system sells power to a commercial off-taker under a 20-year fixed rate PPA. |
| 3. | GLC Chester Solar – The GLC Chester System has a generation capacity of 0.8 MW and is located in Chester Township, Vermont. The system sells power to various municipal off-takers under 20-year fixed rate PPAs. |
| 4. | Pittsford Solar – The Pittsford system has a generation capacity of 0.7 MW and is located in Pittsford Township, Vermont. The system sells power to various commercial off-takers under 20-year fixed rate PPAs. |
| 5. | Novus Royalton Solar – The Novus Royalton system has a generation capacity of 0.7 MW and is located in Royalton, Vermont. The system sells power to various municipal off-takers under 20-year fixed rate PPAs. |
| 6. | Proctor GLC Solar LLC – The Proctor GLC system has a generation capacity of 0.7 MW and is located in Proctor, Vermont. The system sells power to a municipal off-taker under a 20-year fixed rate PPA. |
| 7. | Hartford Solarfield LLC – The Hartford Solarfield system has a generation capacity of 0.7 MW and is located in Hartford, Vermont. The system sells power to a municipal off-taker under a 20-year fixed rate PPA. |
| 8. | 46 Precision Drive LLC – The 46 Precision Drive system has a generation capacity of 0.7 MW and is located in North Springfield, Vermont. The system sells power to a municipal off-taker under a 20-year fixed rate PPA. |
| 9. | City Garden Solar LLC – The City Garden system has a generation capacity of 1.2 MW and is located in Rutland, Vermont. The system sells power directly to the local utility, Green Mountain Power, under a 25-year fixed rate PPA. |
Additionally, the company purchased a 5.737 MW portfolio solar project (“Brattleboro”). Brattleboro has been operating since July 2018. The project is located in Brattleboro, Vermont. The project is contracted for 20 years through a PPA with Windham Solid Waste Management District.
Longleaf Portfolio
The company purchased and constructed a 21.8 MW portfolio of three solar projects (“Longleaf Portfolio”) located in Camden, Jamesville and Martin counties, North Carolina. All three facilities reached commercial operations during Q3 2019. The Longleaf Portfolio sells all power generated to an investment grade utility off taker through a 15-year fixed price PPA.
Magnolia Sun Portfolio
| 1. | Powerhouse One — The company owns four solar facilities located in Tennessee, with a total generation capacity of 3.0 MW. The facilities consist of commercial grade, ground mounted solar systems located on leased property within a five-mile radius in Fayetteville, Tennessee. The systems sell power directly to two local utilities; Tennessee Valley Authority and Fayetteville Public Utilities under long term PPAs. |
| 2. | CaMa Solar — The company owns two solar facilities in California, and one in Massachusetts, with a total generation capacity of 0.6 MW. The California systems sell power to municipal off-takers; Santa Cruz City Schools, and Petaluma City Schools of Sonoma County, under long-term PPAs. The Massachusetts systems sells power to the WGBH Educational Foundation, located in Boston, MA, under a long-term PPA. |
| 3. | SolaVerde — The company owns eleven solar facilities in Tennessee with a total capacity of 1.7 MW. Eight of the systems sell power directly to the local utility, Tennessee Valley Authority, under a long-term PPA. Three of the systems sell power to municipal off-takers. |
Midway III Portfolio
The Midway III portfolio, located in California, was operational as of September 6, 2018. It encompasses an approximate generation capacity of 26.0 MW, with all power sold to large utility company in California.
67
Six States Solar Portfolio
The company previously leased 13.0 MW of operating solar power facilities located on 27 sites in the states of Arizona, California, Colorado, Connecticut, Indiana, and North Carolina under a master lease agreement. During the remaining term of the lease, which is approximately 12 years, there is the potential for the company to purchase these assets directly upon agreement and consent of the parties, with over 82% of the contracted revenues from investment grade counterparties. During June 2018 the company acquired twelve solar systems comprising 4.6 MW that were previously leased. The Six States Solar Portfolio now consists of these 13 facilities plus the remaining fourteen facilities that continue to be leased along with the Floyd Road project noted below.
The owned Six States Solar Portfolio (the owned “SSS Portfolio”) consists of ground and roof mounted solar units located on municipal and commercial properties generally described as follows:
| 1. | The Town of Newington — Newington Public Schools - Newington Public Schools (“Newington”). The Newington system has generation capacity of 0.2 MW and is located in the Town of Newington, CT. The system sells power to the Town of Newington, which encompasses seven schools that serve approximately 4,200 students from kindergarten through 12th grade, which are accredited by the New England Association of Schools & Colleges. |
| 2. | Regional School Department — Northwestern Regional School District #7 — Northwestern Regional School District (“Northwestern”). The Northwestern system has generation capacity of 0.4 MW and is located in Winsted, Connecticut. The system sells power to the Northwestern Regional School District which serves the total Regional Community with emphasis on middle school and high school students. |
| 3. | City of Winters — The City of Winters (“Winters”). The Winters system has generation capacity of 0.3 MW and is located in Winters, California. The system sells power to the City of Winters which is part of the Sacramento-Arden-Arcade-Yuba City, California-Nevada region. | |
| 4. | Adams State College — Adams State College (“Adams”). The Adams system has generation capacity of 0.3 MW and is located in Alamosa, CO. The system sells power to Adams State College, a state-supported liberal arts university established in 1921. Additionally, RECs are sold to the local utility, Xcel Energy |
| 5. | Sacramento County Water Agency — Sacramento County Water Agency (“SCWA”). The SCWA system has generation capacity of 0.9 MW and is located in Sacramento, California. The system sells power to the Sacramento County Waste Authority (“SCWA”) which was established in 1952 with the passage of the Sacramento County Water Agency Act and a commitment to providing safe and reliable drinking water to over 55,000 homes and businesses. Additionally, performance-based incentives are sold to the Sacramento Municipality Utility District (“SMUD”). |
| 6. | Tanque Verde School District — Tanque Verde School District (“TVSD”). The TVSD system is comprised of four systems located in Tucson, AZ with a total generation capacity of 1.2 MW. The systems sell power to the TVSD, which encompasses four schools. Additionally, RECs are sold to the local utility, Tuscan Electric Power. |
| 7. | Northern Indiana Public Service Company — Northern Indiana Public Service Company (“NIPSCO”). The NIPSCO system comprised of three systems located in Goshen, Milford, and Topeka, Indiana with a total generation capacity of 1.3 MW. The systems sell power to NIPSCO, Indiana’s largest natural gas distributor and second-largest distributor of electricity serving more than one million customers. |
The leased Six States Solar Portfolio consists of approximately 8.4 MW of ground and roof mounted solar units located on municipal and commercial properties generally described as follows:
| 1. | South Adams County Water and Sanitation District — The South Adams County Water and Sanitation District (“South Adams”). The South Adams system has generation capacity of 0.2 MW and is located in Commerce City, CO. The system sells power under a long-term PPA to the South Adams County Water and Sanitation District, formed in 1953 under the State of Colorado Special District provisions to serve nearly 50,000 customers. Additionally, RECs are sold to the local utility, Xcel Energy. |
68
| 2. | Floyd Road Solar Portfolio — The Floyd Road Solar Portfolio (“Floyd Road”) – The Floyd Road system has generation capacity of 6.8 MW and is located in Gaston, NC. The system sells power directly to the local utility, Dominion Energy, under a 15-year PPA. Additionally, RECs are sold to a third-party. The system achieved commercial operation in the second quarter of 2017. On July 14, 2017, the company sold Floyd Road for approximately $11,400,000 and leased the facility back for a period of 24 years. De Lage Landen Financial Services was the sale/leaseback entity. |
| 3. | Denver Public Schools — Denver Public Schools (“DPS”). The DPS system is comprised of 13 systems located in Denver, CO with a total generation capacity of 1.5 MW. The systems sell power to DPS, which encompasses 185 schools that serve 90,150 students. Additionally, RECs are sold to the local utility, Xcel Energy. |
Sunny Mountain Portfolio
The residential portion of the Sunny Mountain portfolio is comprised of twelve systems located across eight towns in Colorado with a total generation capacity of 0.1 MW while the commercial portion of the portfolio is comprised of 9 systems located in Boulder and Broomfield, CO with a total generation capacity of 0.7 MW. The systems sell power to various commercial and municipal off-takers under long-term PPAs.
With the inclusion of owned and leased assets, the company operates approximately 167.2 MW of operating commercial solar power facilities throughout the United States as of December 31, 2019.
Canadian Northern Lights Portfolio
The company owns a portfolio of 79 rooftop solar photovoltaic systems located within a 60-mile radius of Toronto, Ontario, Canada with a combined generation capacity of approximately 0.6 MW. The company sold one of the locations in June 2017. Standardized lease agreements are in place and the systems sell power directly to the local utility, Ontario Power Authority (“OPA”) under their microFIT solar program at a fixed rate.
There is a standardized lease that is signed with each of the home/building owners that allows the system to be operated and maintained during the term of each OPA contract. The lease has been designed to survive the sale of the home/building and there is a non-disturbance provision which will allow the owner of the system, the company, to operate the system for the entirety of the term. The home/building owner receives a modest annual rental payment for use of the rooftop.
Greenbacker Residential Solar Portfolio
The Greenbacker Residential Solar Portfolio consists of an 18.6 MW portfolio of approximately 2,389 residential rooftop solar systems located across 8 states including Arizona, California, Connecticut, Hawaii, Maryland, Massachusetts, New Jersey and New York. The energy generated by the systems has been sold under a mix of 20-year PPAs and operating leases to the various residential customers who on average have above average FICO Score Ratings.
Greenbacker Residential Solar II Portfolio
The Greenbacker Residential Solar II Portfolio consists of a 10.2 MW portfolio of approximately 1,438 residential rooftop solar systems located across 8 states including Arizona, California, Connecticut, Massachusetts, Maryland, Nevada, New Jersey and New York. The energy generated by the systems has been sold under 20-year PPAs.
69
The company operates approximately 29.4 MW of operating residential solar power facilities throughout the United States and Canada as of December 31, 2019.
Greenbacker Wind — California Portfolio
Wagner Wind, purchased on December 26, 2017, is a 6.0 MW project located in Riverside, California that sells power directly to the City of Riverside California under a 15-year escalating rate PPA. The project consists of two 3.0 MW Vestas V90 turbines. The project was originally placed in service in the fourth quarter of 2012.
GB Wind HoldCo Portfolio
The GB Wind HoldCo Portfolio is comprised of the following three projects, Fossil Gulch Wind Park (Wind – Idaho), Georgia Mountain Community Wind (Wind – Vermont), and Community Wind South (Wind – Minnesota).
The Fossil Gulch Wind Park is a 10.5 MW project located in Hagerman, Idaho. The project sells power directly to the local public utility, Idaho Power Company, under a 20-year escalating PPA. Additionally, RECs are sold to a third party under a fixed-rate contract. The facility originally commenced operations in the third quarter of 2005, and it has been operated continuously since that date.
Georgia Mountain Community Wind, purchased in December 2017, is a 10.0 MW project located in Mendon, Vermont that sells power directly to the City of Burlington Electric Department under a 25-year escalating rate PPA. The project consists of four 2.5 MW Goldwind turbines. The project was originally placed in service in the fourth quarter of 2012.
In August 2019 the company acquired an interest in Community Wind South, a 30.75 MW operating wind farm located in Nobles County, Minnesota (“CWS”). The Project reached Commercial Operations (“COD”) in December 2012 and has 20-year busbar power and REC contracts with Northern States Power (A2/A-), a wholly owned subsidiary of Xcel Energy.
Greenbacker Wind — Iowa Portfolio
The Wind – IA Portfolio is comprised of two projects Elk and Hawkeye. Elk is a 42.5 MW operating wind farm located in Delaware County, Iowa, and Hawkeye is a 37.5 MW operating wind farm located in Fayette County, Iowa. Elk and Hawkeye reached their COD in 2011 and 2012, respectively, and originally secured 20 and 25-year busbar PPA with an investment-grade utility. This acquisition has received regulatory approval in December 2019 and closed subsequent to year-end.
Greenbacker Wind - Massachusetts
In May 2019, the company entered into a short-term secured loan agreement with Holiday Hill Community Wind, LLC. In Q4 of 2019, the loan was settled and the underlying asset, Holiday Hill Community Wind was purchased. The 5.0 MW project is located in Massachusetts and sells power to Russel Municipal Light Department through a 25-year PPA contract. Additionally, RECs are sold to Chicopee Municipal Lighting Plant, and City of Westfield Gas & Electric Department.
Greenbacker Wind — Montana Portfolio
The Fairfield Wind Project is a 10.0 MW facility located in Teton County, MT. The project sells power to NorthWestern Energy under a 20-year fixed-rate PPA. Additionally, RECs are sold to NorthWestern Energy under an escalating capped fixed-rate contract. The facility originally commenced operations in the second quarter of 2014.
The Greenfield Wind Project is a 25.0 MW facility located in Teton County, MT. The project sells power to NorthWestern Energy under a 25-year fixed-rate PPA, which includes the sale of RECs. The facility originally commenced operation in the fourth quarter of 2016.
The company currently operates approximately 177.3 MW of operating wind power facilities throughout the United States.
EVCE Biomass Portfolio-
The EVCE Biomass Portfolio is currently comprised of an operating 12.0 MW biomass facility located in Gypsum, Colorado.
The company currently operates approximately 12.0 MW of biomass generation: an operating biomass facility in Colorado.
Citrine Portfolio
The Citrine Portfolio consists of costs associated with to be constructed solar projects located in New Jersey and Massachusetts. The projects are expected to be placed in service throughout 2020.
70
Colorado CES
The Colorado CES portfolio consists of costs associated with to be constructed community solar projects located in Colorado. The Projects are part of Xcel Energy’s Community Solar Garden program.
Electric City Portfolio
The Electric City Portfolio consists of costs associated with three to be constructed solar projects located in Michigan. The projects comprise a total of 18.9 MWs and are expected to be placed in service in Q3 2020.
Omni Portfolio
The company purchased the rights to a 21.2 MW to-be-constructed solar portfolio located in California, New Jersey and Maryland. The Omni Portfolio started construction in Q1 2019 and is expected to achieve commercial operations in Q1 2020.
Opal Portfolio
The Opal portfolio consists of costs associated with a to be constructed solar project located in Vermont. The Project is expected to reach commercial operations in 2020.
Oregon Sun Portfolio
The Oregon Sun Portfolio is a 9.3 MW to be constructed DG solar Portfolio located in Oregon. The Portfolio started construction in Q3 2019 and is estimated to achieve COD in early 2020.
Phoenix Solar Portfolio
The company purchased the rights to a 3.8 MW project located Northampton County, Pennsylvania. It is expected to reach commercial operation by Q1 2020.
SE Solar 2019 Portfolio
SE Solar 2019 is comprised of 20.8 MW of solar projects located in North Carolina. The Portfolio is expected to reach commercial operations in Q1 2020.
Trillium Portfolio
The Trillium Portfolio is comprised of 6 solar projects, totaling 16.9 MW. The projects are located across Arkansas, Colorado, Maryland, and Washington D.C. The projects will sell their generated electricity to a variety of municipal, commercial, and utility grade off takers through PPA contracts that range 15-28 years. These assets are expected to reach commercial operation date throughout Q1 2020.
Turquoise Solar Portfolio
The company purchased Turquoise Nevada LLC (“Turquoise Solar”), a to-be-constructed 60.6-MW solar project located in Washoe County, NV. Turquoise Solar is estimated to start construction during 2019 and achieve commercial operations in Q2 2020. Once operational, Turquoise Nevada will sell 100% of generated electricity through a 25-year fixed-price PPA with a large regulated utility.
The company has under contract approximately 181.2 MW of pre-operational assets related to future commercial solar power facilities throughout the United States that are expected to become operational in 2020 and beyond.
Other
The other portfolio is currently comprised of acquisition costs related to energy projects being acquired in the United States. Additionally, the company has invested capital to acquire and safe harbor panels that will be used in the construction of various pipeline projects.
GREC Energy Efficiency Portfolio
The company maintains three capital leases with AEC-LEDF, LLC related to the ownership of energy efficient lighting fixtures in three commercial locations in Puerto Rico, United States. The lease period under each of the master lease agreements correspond with underlying equipment service agreements between LED Funding LLC, the seller of the equipment to GREC Energy Efficiency Portfolio, and the owners of the commercial locations. The equipment service agreement terms range from 7 to 10 years. At the end of each of the lease terms, ownership of the fixtures is retained by the owners of the commercial locations.
Renew AEC One, LLC
In September 2015, the company entered into a secured loan agreement with Renew AEC One, LLC to fund the installation and purchase of energy efficiency lighting in a warehouse in Pennsylvania. The loan bears an interest rate of 10.25% per annum with principal amortization over a 10-year period ending in February 2025.
71
LED Funding LLC and Renew AEC One LLC (the “AEC Companies”) are considered related parties as the members of these entities own an indirect, non-controlling ownership interest in the company’s advisor. The loans and capital leases outstanding between the AEC Companies and the company were negotiated at an arm’s length and contain standard terms and conditions that would be included in third party lending agreements including required security and collateral, interest rates based upon risk of the specific loan, and term of the loan. As of December 31, 2019, all loans and capital leases were considered current per their terms.
SE Solar Loan
In February 2019, the company entered into a short-term secured loan agreement with SunEnergy1, LLC. The loan bears an interest rate of 9% and matures on February 21, 2020.
Encore Loan
In October 2019, the company entered into a short-term secured loan agreement with Encore Equipment, LLC. The loan bears an interest rate of 10% and matures on October 11, 2020.
Hudson Loan/Portfolio
In June 2019, the company entered into a short-term secured loan agreement with Hecate Energy New York Holdings LLC. The loan bears an interest rate of 8% and matures on March 31, 2020.
New Market Loan
In October 2019, the company entered into a short-term secured loan agreement with New Market Solar, LLC. The loan bears an interest rate of 9% and matures on October 3, 2020.
TUUSSO Loan
In November 2019, the company entered into a short-term secured loan agreement with TUUSSO Energy, LLC. The loan bears an interest rate of 8% and matures on June 30, 2020.
Portfolio Disposals
The following portfolios were sold during the year ended December 31, 2019:
Raleigh Portfolio
On December 24, 2019, the company entered into an agreement to sell 100% of the equity interests in Holocene Renewable Energy Fund 3, LLC. (“Raleigh Portfolio”). The Raleigh Portfolio was comprised of 26 MW of commercial ground and roof mounted solar photovoltaic systems located in North Carolina. The purchase price consideration for this transaction was $24,200,000 plus working capital, which resulted in a gain of $3,942,930 as it relates to the sale. As of December 31, 2019, the remaining balance is included in the Investment Sales Receivable in the Consolidated Statements of Assets and Liabilities.
Enfinity Colorado DHA Portfolio
On October 18, 2019, the company entered into an agreement to sell 100% of the equity of Enfinity Colorado DHA 1, LLC which was comprised of 666 residential rooftop solar systems, totaling 2.5 MW located in and around Denver, Colorado. The purchase price consideration for this transaction was $6,972,240 plus working capital. The transaction resulted in a gain of $683,377 recorded in the Consolidated Statement of Operations.
Phoenix Portfolio
The company entered into a transaction with Greenbacker Renewable Opportunity Zone Fund, LLC. (“GROZ”) to sell the Sol Phoenix Solar LLC investment on September 30, 2019 for $16,874,761, which was later amended to total $17,175,554 as of December 31, 2019. GROZ is an affiliate of the company, as the fund shares the same advisor as GREC. The company’s policies require that for sales of assets to any of its affiliates, a majority of our board of directors (including a majority of the independent directors) not otherwise interested in the transaction must determine that such transaction is fair and reasonable to the company. The determination of the purchase price was based on the fair value of the investment as determined by an independent third-party appraiser and our board of directors determined that such sale was fair and reasonable to the company. The transaction resulted in a realized gain of $7,494,464 recorded in the Consolidated Statements of Operations. GROZ paid an initial amount of $1,500,000 at closing. An additional $9,684,393 has been paid by GROZ as of December 31, 2019, and the remaining balance is included in Investment Sales Receivable in the Consolidated Statements of Assets and Liabilities.
Fremont Portfolio
On December 10, 2019, the company through its wholly owned subsidiary, Citrine Solar LLC, entered into a second transaction with GROZ to sell the Fremont CO I, LLC asset. The asset was sold for a purchase price of $5,272,475, based upon the fair value of the investment as determined by an independent third-party appraiser. The transaction, which was approved by a majority of our board of directors (including a majority of the independent directors), resulted in a gain of $794,475 recorded in the Consolidated Statement of Operations. As of December 31, 2019, the remaining balance is included in Investment Sales Receivable in the Consolidated Statements of Assets and Liabilities.
72
Portfolio Disposals Subsequent to Year-End
Residential Portfolios
On March 5, 2020, the company signed and closed a transaction to sell the entirety of its investments in the Greenbacker Residential Solar Portfolio and the Greenbacker Residential Solar Portfolio II (collectively the “Residential Portfolios”). Coupled with the recent sale of the Enfinity Colorado DHA Portfolio in December 2019, the company has now effectively exited the US residential solar market. The Residential Portfolios comprised 3,668 individual residential sites which were accumulated through a series of transactions from October 2016 to July 2017 at a total cost of $34,525,000. The Portfolios were sold to a leading residential solar aggregator a considerable premium to our original cost.
Investment Summary
The following table presents the gross purchases of the gross funding of additional capital for new or existing investments for the years ended December 31, 2019, 2018 and 2017:
| For the year ended December 31, 2019 | For the year ended December 31, 2018 | For the year ended December 31, 2017 | ||||||||||
| Biomass | ||||||||||||
| Eagle Valley Biomass Portfolio | $ | 21,256,245 | $ | - | $ | - | ||||||
| Commercial Solar | ||||||||||||
| Conic Portfolio | 14,752,000 | - | - | |||||||||
| East to West Solar Portfolio | 2,201,800 | 13,715,000 | 4,678,000 | |||||||||
| Floyd Road Solar Farm Portfolio | - | - | 9,088,383 | |||||||||
| Foresight Solar Portfolio | 590,000 | 449,929 | 13,200,071 | |||||||||
| Golden Horizons Solar Portfolio | 90,000 | 200,000 | 9,450,000 | |||||||||
| Green Maple Portfolio | 9,230,743 | 4,507,823 | 180,000 | |||||||||
| Longleaf Solar Portfolio | 42,901,695 | - | - | |||||||||
| Midway III Solar Portfolio | 826,488 | 32,986,364 | 10,093,861 | |||||||||
| Raleigh Portfolio | 150,000 | 150,000 | 20,672,198 | |||||||||
| Six States Solar Portfolio | 600,000 | 9,250,000 | 550,000 | |||||||||
| Sun Farm Portfolio | - | 16,010,798 | - | |||||||||
| Residential Solar | ||||||||||||
| Enfinity Colorado DHA Portfolio | 505,000 | - | 1,400,000 | |||||||||
| Greenbacker Residential Solar Portfolio | - | - | 8,250,000 | |||||||||
| Greenbacker Residential Solar Portfolio II | 52,000 | - | 6,400,000 | |||||||||
| Wind | ||||||||||||
| Greenbacker Wind Portfolio - California | - | - | 9,500,000 | |||||||||
| Greenbacker Wind Portfolio - HoldCo* | 29,600,000 | 500,000 | 33,605,000 | |||||||||
| Greenbacker Wind Portfolio - Iowa | 20,440,000 | - | - | |||||||||
| Greenbacker Wind Portfolio - Massachusetts | 25,720,259 | - | - | |||||||||
| Greenbacker Wind Portfolio - Montana | 2,647,196 | 1,750,000 | - | |||||||||
| Pre-Operational Assets | ||||||||||||
| Citrine Portfolio | 18,656,925 | - | - | |||||||||
| Colorado CES Portfolio | 8,468,268 | - | - | |||||||||
| Colorado CSG Solar Portfolio | - | 31,895,702 | - | |||||||||
| Electric City Portfolio | 4,208,484 | - | - | |||||||||
| Omni DG Portfolio | 17,731,756 | - | - | |||||||||
| Opal Portfolio | 27,736,916 | - | - | |||||||||
| Oregon Sun Portfolio | 5,404,787 | - | - | |||||||||
| Phoenix Solar Portfolio | 18,357,312 | 9,964,515 | - | |||||||||
| SE Solar Portfolio | 3,000,000 | 7,178,207 | - | |||||||||
| Trillium Portfolio | 6,318,722 | - | - | |||||||||
| Turquoise Solar Portfolio | 20,725,345 | 5,877,188 | - | |||||||||
| Other Portfolios | 12,003,453 | 1,304,356 | - | |||||||||
| Energy Efficiency | ||||||||||||
| GREC Energy Efficiency Portfolio | - | 1,500 | 1,500 | |||||||||
| Secured Loans | ||||||||||||
| Encore Loan | 5,000,680 | - | - | |||||||||
| Holiday Hill Loan | 10,250,000 | - | - | |||||||||
| Hudson Loan | 11,537,903 | - | - | |||||||||
| New Market Loan | 5,000,000 | - | - | |||||||||
| SE Solar Loan | 5,000,000 | - | - | |||||||||
| TUUSSO Loan | 2,621,883 | - | - | |||||||||
| $ | 353,585,860 | $ | 135,741,382 | $ | 127,069,013 | |||||||
| * | Includes previous year investments of Greenbacker Wind - Idaho, Greenbacker Wind - Minnesota, and Greenbacker Wind - Vermont |
73
For the year ended December 31, 2019, we made an additional 12 portfolio company investments, and four portfolio sales, causing a net increase of our total portfolio investments to 34. In addition to the new portfolios purchased, throughout the year we also added four additional tax equity partnerships that collectively own 12 projects, as of December 31, 2019. As a result of these investments our total gross assets purchased reached $353,585,860, an increase YOY of 160% over 2018. Additionally, as our capital resources have increased, the average size of the investment has increased from 13.98 MW per portfolio in 2018 to 19.83 MW per portfolio in 2019, a 41.85% increase YOY.
For the year ended December 31, 2018, we made an additional eight portfolio company investments, increasing our total portfolio investments to 26. In addition to the new portfolios purchased, we also added three additional tax equity partnerships that collectively own 16 projects, as of December 31, 2018. As a result of these investments our total gross asset purchased reached $135,741,382, an increase YOY of 7% over 2017. Additionally, as our capital resources have increased, the average size of the investment has increased from 10.27 MW per portfolio in 2017 to 13.98 MW per portfolio in 2018, a 36.03% increase YOY.
For the year ended December 31, 2017, we made an additional nine portfolio company investments, increasing our total portfolio investments to 18. In addition to the new portfolios purchased, we also added 7 additional tax equity partnerships that collectively own 12 projects, as of December 31, 2017. As a result of these investments our total gross asset purchased reached $127,069,013, an increase YOY of 38% over 2016. Additionally, as our capital resources have increased, the average size of the investment decreased from 10.88 MW per portfolio in 2016 to 10.27 MW per portfolio in 2017, a 5.53% decrease YOY.
74
The composition of the company’s investments as of December 31, 2019, at fair value, were as follows:
| Investments at Cost | Investments at Fair Value | Fair Value Percentage of Total Portfolio | ||||||||||
| Biomass: | ||||||||||||
| Eagle Valley Biomass Portfolio | 21,425,600 | 21,425,600 | 4.5 | % | ||||||||
| Subtotal | $ | 21,425,600 | $ | 21,425,600 | 4.5 | % | ||||||
| Commercial Solar: | ||||||||||||
| Conic Portfolio | $ | 12,077,823 | $ | 17,828,206 | 3.8 | % | ||||||
| East to West Solar Portfolio | 39,109,190 | 41,214,191 | 8.7 | |||||||||
| Foresight Solar Portfolio | 13,790,000 | 14,965,339 | 3.1 | |||||||||
| Golden Horizons Solar Portfolio | 9,290,000 | 15,132,017 | 3.2 | |||||||||
| Green Maple Portfolio | 26,561,596 | 27,268,058 | 5.7 | |||||||||
| Longleaf Portfolio | 22,797,404 | 24,605,536 | 5.2 | |||||||||
| Magnolia Sun Portfolio | 10,775,000 | 6,460,457 | 1.4 | |||||||||
| Midway III Solar Portfolio | 10,575,394 | 11,475,652 | 2.4 | |||||||||
| Six States Solar Portfolio | 12,655,306 | 12,799,005 | 2.6 | |||||||||
| Sunny Mountain Portfolio | 884,578 | 743,768 | 0.2 | |||||||||
| Subtotal | $ | 158,516,291 | $ | 172,492,229 | 36.3 | % | ||||||
| Residential Solar: | ||||||||||||
| Canadian Northern Lights Portfolio | $ | 1,603,136 | $ | 1,611,955 | 0.3 | % | ||||||
| Greenbacker Residential Solar Portfolio | 28,100,000 | 32,540,979 | 6.9 | |||||||||
| Greenbacker Residential Solar Portfolio II | 6,400,000 | 13,279,521 | 2.8 | |||||||||
| Subtotal | $ | 36,103,136 | $ | 47,432,455 | 10.0 | % | ||||||
| Wind: | ||||||||||||
| Greenbacker Wind Portfolio - California | $ | 9,500,000 | $ | 8,777,056 | 1.8 | % | ||||||
| Greenbacker Wind Portfolio - HoldCo | 25,753,111 | 35,089,021 | 7.4 | |||||||||
| Greenbacker Wind Portfolio - Iowa | 20,440,000 | 20,440,000 | 4.3 | |||||||||
| Greenbacker Wind Portfolio - Massachusetts | 10,169,079 | 10,902,726 | 2.3 | |||||||||
| Greenbacker Wind Portfolio - Montana | 24,756,684 | 26,451,773 | 5.6 | |||||||||
| Subtotal | $ | 90,618,874 | $ | 101,660,576 | 21.4 | % | ||||||
| Pre-Operational Assets: | ||||||||||||
| Citrine Solar Portfolio | $ | 3,411,249 | $ | 3,411,249 | 0.7 | % | ||||||
| Colorado CES Portfolio | 4,517,354 | 4,517,354 | 1.0 | |||||||||
| Electric City Portfolio | 4,208,484 | 4,208,484 | 0.9 | |||||||||
| Omni DG Portfolio | 17,900,298 | 17,900,298 | 3.8 | |||||||||
| Opal Portfolio | 344,949 | 344,949 | 0.1 | |||||||||
| Oregon Sun Portfolio | 5,404,787 | 5,404,787 | 1.1 | |||||||||
| Phoenix Solar Portfolio | 4,051,138 | 4,051,138 | 0.8 | |||||||||
| SE Solar Portfolio | 5,000,000 | 5,000,000 | 1.1 | |||||||||
| Trillium Portfolio | 24,277,396 | 24,277,396 | 5.0 | |||||||||
| Turquoise Solar Portfolio | 26,602,532 | 26,602,532 | 5.6 | |||||||||
| Subtotal | $ | 95,718,187 | $ | 95,718,187 | 20.1 | % | ||||||
| Other Investments: | ||||||||||||
| Other Portfolios | $ | 12,656,710 | $ | 12,473,975 | 2.6 | % | ||||||
| Subtotal | $ | 12,656,710 | $ | 12,473,975 | 2.6 | % | ||||||
| Energy Efficiency: | ||||||||||||
| GREC Energy Efficiency Portfolio | $ | 388,044 | $ | 390,019 | 0.1 | % | ||||||
| Renew AEC One, LLC | 479,140 | 479,140 | 0.1 | |||||||||
| Subtotal | $ | 867,184 | $ | 869,159 | 0.2 | % | ||||||
| Secured Loans | ||||||||||||
| Encore Loan | $ | 5,000,680 | $ | 5,000,680 | 1.1 | % | ||||||
| Hudson Loan | 9,481,127 | 9,481,127 | 2.0 | |||||||||
| New Market Loan | 5,000,000 | 5,000,000 | 1.1 | |||||||||
| SE Solar Loan | 1,000,000 | 1,000,000 | 0.2 | |||||||||
| TUUSSO Loan | 2,621,883 | 2,621,883 | 0.5 | |||||||||
| Subtotal | $ | 23,103,690 | $ | 23,103,690 | 4.9 | % | ||||||
| Total | $ | 439,009,672 | $ | 475,175,871 | 100.0 | % | ||||||
75
The composition of the company’s investments as of December 31, 2018, at fair value, were as follows:
| Investments at Cost | Investments at Fair Value | Fair Value Percentage of Total Portfolio | ||||||||||
| Commercial Solar: | ||||||||||||
| East to West Solar Portfolio | $ | 37,079,887 | $ | 33,665,088 | 10.9 | % | ||||||
| Foresight Solar Portfolio | 13,650,000 | 14,357,201 | 4.7 | |||||||||
| Golden Horizons Solar Portfolio | 9,400,000 | 14,445,071 | 4.7 | |||||||||
| Green Maple Portfolio | 17,582,823 | 16,066,837 | 5.2 | |||||||||
| Magnolia Sun Portfolio | 10,775,000 | 8,258,786 | 2.7 | |||||||||
| Midway III Solar Portfolio | 11,552,904 | 13,265,608 | 4.3 | |||||||||
| Raleigh Portfolio | 20,822,198 | 21,358,997 | 7.0 | |||||||||
| Six States Solar Portfolio | 12,470,306 | 13,440,025 | 4.4 | |||||||||
| Sun Farm Portfolio | 10,514,960 | 11,606,877 | 3.8 | |||||||||
| Sunny Mountain Portfolio | 884,578 | 1,107,041 | 0.4 | |||||||||
| Subtotal | $ | 144,732,656 | $ | 147,571,531 | 48.1 | % | ||||||
| Residential Solar: | ||||||||||||
| Canadian Northern Lights Portfolio | $ | 1,603,136 | $ | 2,081,554 | 0.6 | % | ||||||
| Enfinity Colorado DHA Portfolio | 1,400,000 | 1,700,728 | 0.6 | |||||||||
| Greenbacker Residential Solar Portfolio | 28,100,000 | 27,372,253 | 8.9 | |||||||||
| Greenbacker Residential Solar Portfolio II | 6,400,000 | 10,763,559 | 3.5 | |||||||||
| Subtotal | $ | 37,503,136 | $ | 41,918,094 | 13.6 | % | ||||||
| Wind: | ||||||||||||
| Greenbacker Wind Portfolio - California | $ | 9,500,000 | $ | 8,070,745 | 2.6 | % | ||||||
| Greenbacker Wind Portfolio - Idaho | 7,320,000 | 6,385,631 | 2.1 | |||||||||
| Greenbacker Wind Portfolio - Montana | 21,709,487 | 21,956,868 | 7.1 | |||||||||
| Greenbacker Wind Portfolio - Vermont | 24,917,193 | 28,752,500 | 9.4 | |||||||||
| Subtotal | $ | 63,446,680 | $ | 65,165,744 | 21.2 | % | ||||||
| Pre-Operational Assets: | ||||||||||||
| Colorado CSG Solar Portfolio | $ | 27,333,205 | $ | 27,215,170 | 8.9 | % | ||||||
| Phoenix Solar Portfolio | 9,964,515 | 9,964,515 | 3.2 | |||||||||
| SE Solar Portfolio | 7,178,207 | 7,178,207 | 2.3 | |||||||||
| Turquoise Solar Portfolio | 5,877,188 | 5,877,188 | 1.9 | |||||||||
| Subtotal | 50,353,115 | 50,235,080 | 16.3 | % | ||||||||
| Other Investments: | ||||||||||||
| Other Portfolios | $ | 1,279,273 | 1,263,620 | 0.4 | % | |||||||
| Subtotal | $ | 1,279,273 | 1,263,620 | 0.4 | % | |||||||
| Energy Efficiency: | ||||||||||||
| GREC Energy Efficiency Portfolio | $ | 447,885 | $ | 470,406 | 0.2 | % | ||||||
| Renew AEC One, LLC | 551,640 | 551,640 | 0.2 | |||||||||
| Subtotal | $ | 999,525 | $ | 1,022,046 | 0.4 | % | ||||||
| Total | $ | 298,314,385 | $ | 307,176,115 | 100.0 | % | ||||||
76
Results of Operations
A discussion of the results of operations for the years ended December 31, 2019, 2018 and 2017 are as follows:
Revenues. As the majority of our assets consist of equity investments in entities established to own and operate our renewable energy projects, the majority of the revenue we generate is in the form of dividend income. Dividend income is not equivalent to the gross revenue produced at the project level but is instead the amount of free cash that is distributed from the project entities to the company from time to time after paying for all project level expenses and complying with any specific project level debt and tax equity covenants. Thus, the presentation of investment income in our financial statements differ from the traditional presentation shown in the financial statements or entities not prepared in accordance with ASC 946 and, most notably, is not equivalent to revenue as one might expect to see in financial statements not prepared in accordance with ASC 946.
The timing and amount of dividend income to be distributed to the company is determined on at least a quarterly basis by the company. This process includes an analysis at the individual project entity level of the cash available from operations and necessary working capital needed for the proper daily operations of the project. As a general rule, the dividend income from our equity investments is recognized as income only when it is received by the company whereas the undistributed income is retained within the project entities (i.e., included in working capital of the project company) and is added to the carrying value of those investments on the balance sheet. The other major component of our revenue is interest income earned on our debt investments, including loans to developers and loans made directly or indirectly to renewable energy projects. Dividend income for the years ended December 31, 2019, 2018 and 2017 totaled $17,160,351, $18,503,814 and $13,125,642 respectively, while interest income earned on our cash, cash equivalents, and secured loans (including the amortization of origination and other fees) amounted to $1,602,354, $888,768 and $213,627, respectively.
The decrease in dividend income from the year ended December 31, 2018 to the year ended December 31, 2019 was primarily attributable to the evolution of our investment strategy from acquiring operating renewable energy projects to acquiring renewable energy projects prior to commencement of construction of those projects. This change in strategy, in the short term, resulted in increased expenses at the project level (due to the costs associated with financing and managing the construction of the projects) without any increase in dividend income due to the fact that the projects do not generate income prior to the commencement of operations. As the projects are placed in service and start generating revenue, dividend income from these project companies will commence.
During 2019, our investments increased from $307 million as of December 31, 2018 to $475 million as of December 31, 2019, or a 55% increase. As of December 31, 2019, we have approximately $128,632,161 in currently pre-operational and non-earning assets, which amounts to 19.08% of our gross investment amount. We expect that the majority, but not all, of the assets that are currently pre-operational and non-earning to become revenue generating during 2020 but we also expect to continue to make new investments in projects prior to the commencement of construction. As noted above, the strategy of investing in projects prior to the commencement of construction resulted in an increase in costs with no immediate increase in dividend income from those projects. However, during the year ended December 31, 2019 we were able to transition 17 projects, comprising four portfolios, from the construction phase to the commencement of operations. Managing projects through the construction phase to commercial operation date during the year ended December 31, 2019 has delivered both realized and unrealized gains of $8,289,121, and $5,216,936, respectively, which are now all incorporated in the current net asset value of the company.
| Gross Investment Amount | ||||||||||||
| Balance | 12/31/2019 | 12/31/2018 | 12/31/2017 | |||||||||
| Investments in controlled/affiliated and non-controlled / non-affiliated portfolios at fair value | $ | 475,175,871 | $ | 307,176,115 | $ | 218,386,174 | ||||||
| Notes payable balances of the company and its’ operating entities | $ | 261,850,711 | $ | 92,631,639 | $ | 60,754,292 | ||||||
| Cash, cash equivalents and restricted cash | $ | 9,066,091 | $ | 39,122,635 | $ | 10,144,014 | ||||||
| Less: Note payable balance of the company | $ | (71,990,467 | ) | $ | (30,665,460 | ) | $ | (10,991,000 | ) | |||
| Gross Investment Amount | $ | 674,102,206 | $ | 408,264,929 | $ | 278,293,480 | ||||||
| Additional Metrics | ||||||||||||
| Pre-operational and Non-earning Assets | $ | 128,632,161 | $ | 51,632,387 | $ | 21,079,798 | ||||||
| Pre-operational and Non-earning Assets as a % of Gross Investment Amount | 19.08 | % | 12.65 | % | 7.57 | % | ||||||
The increase in dividend income from the year ended December 31, 2017 to the year ended December 31, 2018 was primarily attributed to the acquisition of operating renewable energy projects throughout the past year as the value of our investments increased from $218 million as of December 31, 2017 to $307 million as of December 31, 2018, or a 41% increase. As new operating projects were purchased by the company, the volume of overall electricity generated by our project investments increased which increased the net income at our project entities and increased the cash available for distribution to the company as dividends.
The increase in the interest income for the year ended December 31, 2019 versus 2018 was primarily attributed to the increase in our interest-bearing loans to unaffiliated entities. The increase in the interest income for the year ended December 31, 2018 versus 2017 was primarily attributed to increased cash and cash equivalent balances throughout the year as well as a slight increase in the average interest rate earned on our cash equivalent balances during the period.
Expenses. For the years ended December 31, 2019, 2018 and 2017, the company incurred $14,548,902, $9,711,267 and $5,880,227 in operating expenses, respectively, including the management fees earned by the advisor.
77
For the years ended December 31, 2019, 2018 and 2017, the advisor earned $8,461,616, $5,803,893 and $3,351,250, respectively, in management fees due to the increase in total assets. The consolidated financial statements reflect a $5,270,670 increase in incentive allocation for the year ended December 31, 2019 based primarily upon unrealized appreciation on investments, a $560,895 increase in incentive allocation for the year ended December 31, 2018 based primarily upon unrealized appreciation on investments and a $1,235,657 increase in incentive allocation for the year ended December 31, 2017, based primarily upon unrealized appreciation on investments. For the year ended December 31, 2019, the Special Unitholder received an incentive distribution in the amount of $170,000. Additional incentive distributions, related to the capital gains incentive earned in 2019, in the amount of $1,124,000, were paid subsequent to year end. There were incentive distributions of nil and $139,692 earned in 2018 and 2017, respectively, by the advisor.
For the year ended December 31, 2019, 2018 and 2017, Greenbacker Administration, LLC invoiced the company nil, nil and $115,849, for expenses, at cost, for services related to asset management and accounting services related to the company’s investments. Effective on April 1, 2017, these expenses were invoiced directly to the company’s investments.
Lastly, for the year ended December 31, 2019, the company incurred a deferred tax (benefit) expense from operations in the amount of $4,738,451, while incurring a deferred tax (benefit) expense in the amounts of $(1,527,917) and $1,655,356 for the years ending December 31, 2018 and 2017, respectively. The deferred tax expense is mainly derived from net operating losses incurred and investment tax credit carryforwards related to the company’s investments which, unlike for financial statement purposes under GAAP, are consolidated for tax purposes offset by unrealized tax basis gains on the company’s investments.
For the years ended December 31, 2019, 2018 and 2017, the net investment income was $7,277,091, $8,084,210 and $4,816,551, respectively, or $0.17, $0.27 and $0.25, respectively, per share.
Going forward, we expect our primary expenses to be the payment of asset management fees under our advisory agreement with the advisor. We will bear other expenses, which are expected to include, among other things:
| ● | the cost of calculating our net asset value, including the related fees and cost of retaining third-party valuation services; |
| ● | the cost of effecting sales and repurchases of units; |
| ● | fees payable to third parties relating to, or associated with our financial and legal affairs, making investments, and valuing investments, including fees and expenses associated with performing due diligence reviews of prospective investments and sub-advisors; |
| ● | fees payable to our advisor; |
| ● | interest payable on debt incurred to finance our investments; |
| ● | transfer agent and custodial fees; |
| ● | federal and state registration fees; |
| ● | costs of board meetings, unitholders’ reports and notices and any proxy statements; |
| ● | directors’ and officers’ errors and omissions liability insurance and other types of insurance; |
| ● | direct costs, including those relating to printing of unitholder reports and advertising or sales materials, mailing, telephone and staff; |
| ● | fees and expenses associated with independent audits and outside legal costs, including compliance with the Sarbanes-Oxley Act of 2002 and applicable federal and state securities laws; and |
| ● | all other expenses incurred by us or the advisor or sub-advisors in connection with administering our investment portfolio, including expenses incurred by our advisor in performing certain of its obligations under the advisory agreement. |
Net Realized Gains or Losses and Net Change in Unrealized Appreciation or Depreciation on Investments and Translation of Assets and Liabilities Denominated in Foreign Currencies. Net realized and unrealized gains and losses from our investments and net realized and unrealized foreign currency gains and losses on translation of assets and liabilities denominated in foreign currencies are reported separately on the consolidated statements of operations. We measure realized gains or losses as the difference between the net proceeds from the sale, repayment, or disposal of an asset and the adjusted cost basis of the asset, without regard to unrealized appreciation or depreciation previously recognized. Net change in unrealized appreciation or depreciation will reflect the change in investment values during the reporting period, including any reversal of previously recorded unrealized appreciation or depreciation, when gains or losses are realized.
78
For the years ended 2019, 2018 and 2017, we recognized a $12,915,738, nil and $693,882 realized gain, respectively. The gain in 2019 related to the sale of the following projects: Phoenix Portfolio, Fremont Portfolio, Enfinity Colorado DHA, and the Raleigh Portfolio. The gain in 2017 related to the sale/leaseback transaction for the Floyd Road project in Q3 (included in Six States portfolio). A net change of $22,302,164, $2,804,477 and $6,092,167 of unrealized appreciation (depreciation), respectively, was recorded for years ended December 31, 2019, 2018 and 2017, of which $27,296,880, $2,955,079 and $5,929,033 of unrealized appreciation related to the change in value of investments, $7,589, $(118,496) and $97,763 of unrealized appreciation (depreciation), respectively, related to change in value based upon changes in foreign currency exchange rates and $(5,002,305), $(32,106), and $65,371 of unrealized appreciation (depreciation), respectively, related to the change in value of swap contracts.
Changes in Net Assets from Operations. For the years ended December 31, 2019, 2018 and 2017, we recorded a net increase in net assets resulting from operations of $34,568,111, $13,875,275 and $12,566,320, respectively. The increase in net assets primarily relates to our net investment income earned during the year and unrealized appreciation related to the change in value of investments.
Dividend Coverage Ratio and Realized Gains
An analysis of the effect of realized gains on the company’s dividend coverage ratio is as follows:
| (in 000’s) | ||||||||||||||||||||
| Description | 2019 | 2018 | 2017 | 2016 | 2015 | |||||||||||||||
| Net Investment Income before taxes | $ | 4,213.80 | $ | 9,681.31 | $ | 7,459.04 | $ | 3,749.56 | $ | 216.54 | ||||||||||
| Shareholder Distributions (total including DRP) | $ | 25,884.10 | $ | 17,738.13 | $ | 11,403.61 | $ | 6,717.87 | $ | 1,990.14 | ||||||||||
| Dividend Coverage Ratio (net investment income/total distributions) | 16.28 | % | 54.58 | % | 65.41 | % | 55.81 | % | 10.88 | % | ||||||||||
| Realized Gains | $ | 12,915.74 | $ | - | $ | 694.00 | $ | - | $ | - | ||||||||||
| Gross Dividend Coverage Ratio (Net Investment Income and Realized Gains/Total Shareholder Distributions) | 66.18 | % | 54.58 | % | 71.49 | % | 55.81 | % | 10.88 | % | ||||||||||
The company has built its business around investing in long-term income producing assets in the renewable energy industry utilizing the cash flow associated with those assets to pay monthly distributions to our investors. When fully invested, we will measure success based upon generating a consolidated cash flow stream which enables the company to pay all shareholder distributions through the operating returns of the company’s projects. As such, our long-term goal has always been to achieve a distribution coverage ratio of at least 1:1 and to grow that ratio meaningfully over time, so we can increase long term returns to investors either through distribution growth or by growing the net asset value of our shares through reinvestment on net investment income.
Investment Company Accounting Considerations
Since the company’s consolidated financial statements are prepared using the specialized accounting principles of ASC Topic 946, our investment advisor produces an estimate of the fair market value of each of our investments quarterly. When valuing our investments under the income method, net operating earnings generated at the project level are included in our valuation models. While the valuation models take into account all revenue, Distribution Income recorded from each of our project companies may be more or less than that included in our valuation models each period due to various cash flow considerations. As an example, since many of our projects are held in tax partnership structures, or in related entities with bank financed project level debt, the company may be contractually limited in its’ ability to make dividend distributions from project companies to the company. Since project entities are not consolidated with the company under ASC Topic 946, in many cases not all net income from operations earned by a project company is distributed to the company. While this non-distributed income is included in the calculation of fair market value and unrealized gain / loss on investments, it is not included in Net Investment Income on the Statement of Operations, and therefore not included in our dividend coverage ratio.
Investing in Asset Classifications other than Operating Assets
We believe that the hallmark of a good investment strategy is the ability to take advantage of new opportunities and adjust to changing market conditions. Towards the end of 2017, our investment advisor began to observe an increase in the opportunities to participate in projects that were largely similar to our operating assets in terms of the long-term risks, but which promised additional returns if we could manage some additional risks in the early stages of the investment lifecycle. As a result, we determined that we should expand our investment capabilities to include four basic investment categories:
| 1. | Operating Assets – As a continuation of our initial strategy, the company will continue to invest in solar, wind and other alternative energy assets that are already in commercial operation and generating investment returns through the sale of contracted electricity and environmental attributes. |
79
| 2. | Commercial Operation Date (“C.O.D.”) – The company will also purchase assets that have been constructed by developers but have not been placed in service. Functionally these assets are generally ready to generate electricity and have reached a milestone known as the C.O.D. While we have determined that a modest investment premium could be obtained by investing at C.O.D., most importantly the term of the contracted cashflows is maximized through this strategy. |
| 3. | Notice to Proceed (“N.T.P”) - We further determined that it could invest in assets that had not yet been constructed but had received substantially all of the permits necessary to begin construction, a milestone known as NTP. While potentially riskier than operating or C.O.D. projects due to the level of construction risk, we believe that the additional return associated with these projects more than compensates for the additional risk. Furthermore, when we invest in NTP assets we have the added benefit of having more control of equipment selection and implementation of construction best practices which positively affects the long-term performance of our plants. With the continued growth of the renewable energy market, driven by increases in the level of Renewable Portfolio Standards in several states and the planned wind down of federal tax incentives, we identified a significant number of NTP transactions coming to market and an opportunity to develop strong pipeline type relationships with the developers of these projects. Besides increasing returns to investors, this has enabled management to substantially increase our access to a proprietary pipeline of sound projects. |
| 4. | Special Situations –We also determined there are market opportunities for selected projects driven by either technical or financial issues, either at the project or owner level, that can be relatively easily resolved by accessing the broad range of expertise we have in-house to deal with our day to day operations. Therefore, we determined that on a limited basis the company would seek investments that had these characteristics since by resolving the issues we have the potential to generate above market returns. |
In order to execute on this strategy, management recognized the need to build a dedicated team of technical asset management professionals. Starting in late 2017, Greenbacker Administration began hiring a team of experienced engineers and construction managers which enabled the company to expand our investment focus into these additional categories of investment. Having access to the technical expertise enabled the company to purchase operationally challenged solar and wind farms while having a sound financial understanding of the costs and time required to resolve the issues. Having an in-house team of technical asset management professionals also increases our ability to extract revenue from aging solar assets through repowers and plant optimization. It also allows us to capitalize on acquisition of “distressed” assets as the number of those assets exponentially increases over the coming years. Lastly, it enabled the company to invest in earlier stage projects where the projects were fully permitted, but construction had not yet commenced. Having access to this level and breath of expertise is a major competitive advantage for the company in the marketplace.
Strategic Considerations of Investing in NTP Projects
We believe that investing across the four investment categories discussed above provides the best opportunity for the company to generate superior investment returns over the medium term, diversify its portfolio, and create a proprietary pipeline of sound investment opportunities for future growth. The downside of this approach is that investing in pre-operational solar and wind projects that are underperforming has a negative impact on near term cashflows and dividend coverage. To minimize the downside effects of the strategy, management has continued to explore more sophisticated financing tools to enable us to direct more of our investable capital into current income generating investments going forward. As the size of our portfolio grows, our ability to access the more sophisticated financial products increases.
80
History of Distribution Coverage
2014 - 2017
During the period from April 2014, when we started raising capital, through the end of 2017, our investment strategy consisted wholly of purchasing operating renewable energy projects that were in-service and generating income from the sale of electricity under long-term power purchase contracts. By investing exclusively in operating assets, the company was able to demonstrate steady improvement in distribution coverage through that period. This initial operational period also corresponded to a significant increase in assets under management as well as the deployment of capital in income producing renewable energy operating assets.
2018
The company began to expand its investment focus during 2018 with the purchase of the Midway III project in September 2018. There were no assets under construction in 2017, whereas by December 31, 2018 the company’s investment portfolio included a total of $67.13 million of to-be-constructed assets. Given the substantial increase in non-income generating assets, the distribution coverage ratio fell to 54.58% on average assets by December 31, 2018.
2019
By December 31, 2019, total capital deployed in pre-operational and non-earning assets reached approximately $128.6 million or 19.08% of Gross Investment Amount. In addition, Greenbacker Administration costs increased approximately $3 million year over year due to the increase in specialist headcount to manage the construction and operational risks associated with these in investment initiatives. These increased costs directly reduced the operating cash flows from project level entities that would otherwise have been available to distribute to the company as dividend income. When these projects commenced operations, any increase in the fair value of the project was recognized as an unrealized gain in the statement of operations, not as investment income. Thus, while costs incurred prior to operation reduce the dividend coverage ratio, any unrealized gains on the value of the project after reaching operations has no effect on the dividend coverage ratio.
Demonstrating Value Creation Through Selected Asset Sales
During 2019, we determined that the company would engage in a process of selling selected projects that it considered to be non-core investments or for which there were compelling opportunities to sell at prices in excess of original cost.
During the year ended December 31, 2019, the company sold two portfolios at commercial operation date, generating a realized gain of $8,288,939, as well as two operating portfolios which generated a gain of $4,626,308. A discussion of the acquisition and sale process for two operating portfolios sold in 2019 are as follows:
Enfinity Colorado DHA Portfolio:
Origination Process:
In the first quarter of 2017, the company purchased a 2.5MW portfolio of residential assets in Denver, CO. determining there were numerous investment merits that made this project a desirable portfolio company. Unlike other residential portfolios which have standalone PPAs with individuals and are rated using FICO scores, this portfolio had a single off-taker, the Denver Housing Authority (“DHA”), an entity providing public housing in the City of Denver. This portfolio provided an attractive cash flow from operations as well as cash yield. Lastly, the company had a positive relationship with the operations and maintenance provider reducing our operational risk.
Sale Process:
In the third quarter of 2019, the company decided to explore the potential exit of the residential solar business to take advantage of market yield compression and a healthy economy. Through ongoing contact during the life of our ownership, the company was aware that DHA was interested in purchasing the project and was willing to purchase at a competitive price. The company managed the due diligence process for the potential sale throughout the summer of 2019, culminating in the execution of a purchase and sale agreement in October 2019 and a final closing in December 2019.
81
Raleigh Portfolio:
Origination Process:
In the third quarter of 2017, the company purchased a 27.8MW portfolio comprised of five commercial solar systems located in North Carolina from Conergy Projects, Inc. The projects were placed in service throughout 2015 and sold 100% of the power produced to Duke Energy, an investment grade offtaker, through a 15-year PPA. We were able to purchase this asset as a part of the global orderly wind down of Conergy, Inc., a multinational EPC, developer and owner of utility scale solar projects. Additionally, the company purchased the asset unlevered which provided immediate flexibility to leverage the asset.
Sale Process:
In mid-2019, we began discussions with USF Holdings Corp to sell 100% of our interest in the five Raleigh projects, in addition to three other projects included in the company’s East to West Portfolio in two separate closings. As these projects were nearing the 10-year mark of their remaining respective PPA terms, the company was looking to sell the Raleigh Portfolio and recirculate the sales proceeds into projects with longer term contracts. The initial close of the Raleigh Portfolio, which included five projects, occurred in December 2019.
| Portfolio | Cost Basis of Investment | Sale Price | Realized Gain | Realized Gain/Cost | ||||||||||||
| Enfinity Colorado DHA Portfolio | $ | 6,288,864 | $ | 6,972,240 | $ | 683,376 | 10.9 | % | ||||||||
| Raleigh Portfolio | $ | 20,892,199 | $ | 24,835,129 | $ | 3,942,930 | 18.9 | % | ||||||||
Electricity Production by Our Investments
Between 2017 through the end of 2019, we observed a 181% YoY growth on total MWh production output across all renewable energy projects in our investment portfolio, resulting in a corresponding growth of revenues earned by our investments. This growth was due in large part to the increase in the capital we deployed in commercial solar and wind projects while increasing the diversification of our portfolio geographically, technologically and across various investment grade off-takers. Also contributing to YoY growth was the purchase of our first Biomass power plant asset in 2019 where we took advantage of a “special situation” investment opportunity and further increased the technology diversification within our portfolio.
Our strategy of purchasing smaller sub-utility-scale projects where there is less competition from large capital providers continues to enable us to build a highly diversified portfolio. While buying and operating smaller projects creates a lot of challenges versus buying large single projects, we see significant benefits in terms of the investment return potential, the ability to buy pipelines of deals from developers, and the overall scalability of the asset class where solar and wind projects can be purchased to match capital inflows.
The most significant growth by segment over the last three years was in commercial solar with a 272% increase in MWh production from 2017 through 2019. This increase is largely due to our 26 MW utility-scale solar photovoltaic project in California (Midway III) and the 25 MW portfolio of community solar gardens in Colorado (Colorado CSG which is part of the Conic Portfolio) achieving commercial operations status towards the end of 2018 and beginning of 2019. Residential solar notably achieved very little growth (9% YoY) during this same period, which is reflective of our prioritization of large utility and commercial scale wind and solar investments. Towards the end of 2019, we increased our wind portfolio capacity by 188% which will significantly increase our wind production and resulting revenues in 2020. Also, at the end of 2019, we had 19 solar assets under construction which is expected to result in an 80% increase in the value of our commercial solar portfolio in 2020. These projects are expected to achieve commercial operations throughout 2020 and will contribute to the continued growth of production and revenues across our entire portfolio.
| MWh by Segment | 2019 | 2018 | 2017 | |||||||||
| Commercial Solar | 245,015 | 140,040 | 65,920 | |||||||||
| Residential Solar | 32,934 | 30,175 | 30,205 | |||||||||
| Wind | 271,118 | 174,765 | 123,749 | |||||||||
| Biomass | 67,892 | 0 | 0 | |||||||||
| Total | 616,959 | 344,980 | 219,874 | |||||||||
82
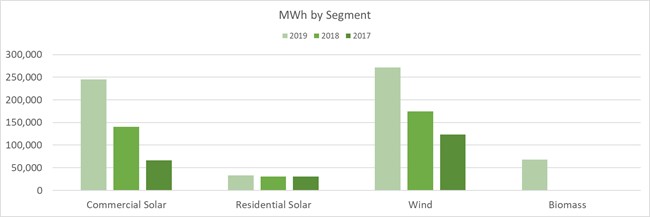
Offering Prices of Our Shares
Based on the net asset value for each quarter ended since Commencement of Operations, the offering price of our shares was adjusted to ensure that the net proceeds per share are no more or less than the then current net asset value per share. The offering prices since inception, and the dates they were effective, are as follows:
| Period | Class | |||||||||||||||||||||
| From | To | A | C | I | P-A | P-I | ||||||||||||||||
| 25-Apr-14 | 4-Nov-15 | $ | 10.00 | $ | 9.58 | $ | 9.19 | NA | NA | |||||||||||||
| 5-Nov-15 | 4-Feb-16 | $ | 10.02 | $ | 9.60 | $ | 9.21 | NA | NA | |||||||||||||
| 5-Feb-16 | 5-May-16 | $ | 10.05 | $ | 9.62 | $ | 9.23 | NA | NA | |||||||||||||
| 6-May-16 | 3-Aug-16 | $ | 10.07 | $ | 9.64 | $ | 9.25 | $ | 9.59 | $ | 8.81 | |||||||||||
| 4-Aug-16 | 6-Nov-16 | $ | 10.23 | $ | 9.79 | $ | 9.40 | $ | 9.74 | $ | 8.95 | |||||||||||
| 7-Nov-16 | 7-Feb-17 | $ | 10.28 | $ | 9.58 | $ | 9.45 | $ | 9.78 | $ | 8.83 | |||||||||||
| 8-Feb-17 | 4-May-17 | $ | 10.22 | $ | 9.53 | $ | 9.39 | $ | 9.70 | $ | 8.76 | |||||||||||
| 5-May-17 | 17-May-17 | $ | 10.17 | $ | 9.48 | $ | 9.34 | $ | 9.70 | $ | 8.69 | |||||||||||
| 18-May-17 | 3-Aug-17 | $ | 9.74 | $ | 9.07 | $ | 8.94 | $ | 9.70 | $ | 8.69 | |||||||||||
| 4-Aug-17 | 2-Nov-17 | $ | 9.72 | $ | 9.08 | $ | 8.93 | N/A | $ | 8.73 | ||||||||||||
| 3-Nov-17 | 5-Feb-18 | $ | 9.74 | $ | 9.09 | $ | 8.94 | N/A | $ | 8.75 | ||||||||||||
| 6-Feb-18 | 6-May-18 | $ | 9.78 | $ | 9.09 | $ | 8.98 | $ | 9.65 | * | $ | 8.81 | ||||||||||
| 7-May-18 | 2-Aug-18 | $ | 9.80 | $ | 9.12 | $ | 9.01 | $ | 9.68 | $ | 8.84 | |||||||||||
| 3-Aug-18 | 31-Oct-18 | $ | 9.83 | $ | 9.17 | $ | 9.03 | $ | 9.69 | $ | 8.90 | |||||||||||
| 1-Nov-18 | 6-Feb-19 | $ | 9.79 | $ | 9.15 | $ | 8.99 | $ | 9.68 | $ | 8.89 | |||||||||||
| 7-Feb-19 | 6-May-19 | $ | 9.63 | $ | 9.01 | $ | 8.84 | $ | 9.50 | ** | $ | 8.76 | ||||||||||
| 7-May-19 | 1-Aug-19 | N/A | N/A | N/A | N/A | $ | 8.76 | |||||||||||||||
| 2-Aug-19 | 8-Nov-19 | N/A | N/A | N/A | N/A | $ | 8.77 | |||||||||||||||
| 9-Nov-19 | 19-Mar-20 | N/A | N/A | N/A | N/A | $ | 8.93 | |||||||||||||||
| 20-Mar-20 | - | N/A | N/A | N/A | N/A | $ | 8.90 | |||||||||||||||
| * | Effective April 16, 2018 |
| ** | Ceased February 8, 2019 |
Liquidity and Capital Resources
As of December 31, 2019, and December 31, 2018, the company had $9,066,091 and $39,122,635 in cash, cash equivalents and restricted cash, respectively. Our current cash balance is generally reflective of the cash necessary to fund normal operations. In 2020, we anticipate continuing to (1) increase our draw on current financing facilities; (2) enter into new financing arrangements and (3) raise additional equity through our current private placement. We use our cash and additional liquidity facilities to fund the acquisition, construction and operation of renewable energy and energy efficiency and sustainable development projects, make investments in renewable energy businesses, repay principal and interest on our borrowings, make distributions to our members and fund our operations. Our primary sources of cash generally consist of:
| ● | the net proceeds of the current offering; |
| ● | dividends, fees, and interest earned from our portfolio of investments, as a result of, among other things, cash flows from a project’s power sales; |
| ● | proceeds from sales of assets and capital repayments from investments; |
| ● | financing fees, retainers and structuring fees; |
| ● | tax equity capital contributions in partnerships where the company is the managing member; and |
| ● | borrowing capacity under current and future financing sources. |
83
Operating entities of the company, which are accounted for as investments using fair value in the company’s consolidated financial statements under ASC 820, had approximately $189,860,244 and $61,916,180 in outstanding notes payable collateralized by certain solar assets and membership interests in limited liability companies included in the East to West, Foresight Solar, Conic, Midway III, Eagle Valley, GB Wind HoldCo and Greenbacker Wind Portfolios as of December 31, 2019 and December 31, 2018, respectively. As of December 31, 2019, the company and GREC provided an unsecured guarantee on the repayment of the Foresight Solar, Midway III and Greenbacker Wind LLC loans.
Since the company maintains operating control over all entities with project level debt outstanding, we have included the total amount of the debt outstanding in the below table summarizing notes payable associated with the company’s operating subsidiaries as well as GREC and the company.
On June 20, 2019, the company, through GREC HoldCo, entered into a new credit agreement, the lenders party thereto and Fifth Third Bank, as administrative agent, as sole lead arranger and sole lead bookrunner, as well as swap counterparty. The new credit facility (the “New Credit Facility”) consists of a loan of up to the lesser of $110,000,000 or a borrowing base amount based on various solar projects (the “Projects”) that act as collateral for the credit facility, of which approximately $58,307,080 was drawn down at closing. The $110,000,000 borrowing base has since been reduced to $96,438,316 as a result of our sale of the Raleigh Portfolio and its removal from the facility. The New Credit Facility allows for additional drawdowns through June 20, 2020, at which point the outstanding loans shall convert to a term loan and matures on June 20, 2025. As of December 2019, the company has drawn down an additional $13,683,387 increasing the total amount drawn on the credit facility.
The company will use the net proceeds of borrowings under the New Credit Facility for investment in additional alternative energy power generation assets that are anticipated to become Projects and for other general corporate purposes. Loans made under the New Credit Facility bear interest at 1.75% in excess of the three-month LIBOR. Until the New Credit Facility converts to a term loan, quarterly commitment fees on the average daily unused portion of the Credit Facility are payable at a rate per annum of 0.50%. In addition to the New Credit Facility, the company has entered into an interest rate swap to hedge the variable interest rate risk on a portion of the New Credit Facility, with current plans to fully hedge the exposure.
Borrowings under the New Credit Facility are back leveraged and secured by all of the assets of GREC HoldCo and the equity interests of each direct and indirect subsidiary of the company. The company, Greenbacker Renewable Energy Corporation and each direct and indirect subsidiary of the company are guarantors of the company’s obligations under the New Credit Facility, and Greenbacker Renewable Energy Corporation has pledged all of the equity interests of the GREC HoldCo as collateral for the New Credit Facility.
As of December 31, 2019, the outstanding balance is approximately $72 million. Financing costs of $3.1 million related to the New Credit Facility have been capitalized and are being amortized over the current term of the New Credit Facility.
On January 5, 2018, the company, through GREC HoldCo, entered into a credit agreement by and among the company, the company’s wholly owned subsidiary, GREC, the lenders party thereto and Fifth Third Bank, as administrative agent, as sole lead arranger and sole lead bookrunner, as well as swap counterparty. The credit facility (the “Credit Facility”) consisted of a loan of up to the lesser of $60,000,000 or a borrowing base amount based on various solar projects that act as collateral for the credit facility, of which approximately $25.7 million was drawn down at closing. The Credit Facility allows for additional drawdowns through December 31, 2018 and is scheduled to convert to a term loan with a maturity on January 5, 2024. The New Credit Facility replaced the previous Credit Facility.
In regard to the Credit Facility, the company has entered into five separate interest rate swap agreements. The first swap (“Swap 1”), effective July 29, 2016, has an initial notional amount of $4,300,000 to swap the floating rate interest payments on the original Facility 1 Term Loan for a corresponding fixed payment. The fixed swap rate is 1.11%. The second swap (“Swap 2”), with a trade date of June 15, 2017 and an effective date of June 18, 2018 and an initial notional amount of $20,920,650, was used to swap the floating rate interest payments on an additional principal amount of the Credit Facility, for a corresponding fixed payment. The fixed swap rate is 2.261%. The third swap (“Swap 3”), with a trade date of January 11, 2018 and an effective date of December 31, 2018 and an initial notional amount of $29,624,945 was used to swap the floating rate interest payments on the remaining unhedged portion of the Credit Facility, as well as the estimated additional drawdowns, for a corresponding fixed payment. The fixed swap rate is 2.65%. The fourth swap (“Swap 4”), with a trade date of February 7, 2018 and an effective date of December 31, 2018 and an initial notional amount of $4,180,063 was used to swap the floating rate interest payments on the remaining unhedged portion of the Credit Facility, as well as the estimated additional drawdowns, for a corresponding fixed payment. The fixed swap rate is 2.97%. The fifth swap (“Swap 5”), with a trade date of January 2, 2019 and an effective date of September 30, 2019 and an initial notional amount of $38,203,506 was used to swap the floating rate interest payments on the remaining unhedged portion of the Credit Facility, as well as the estimated additional drawdowns, for a corresponding fixed payment. The fixed swap rate is 2.69%.
84
If an event of default shall occur and be continuing under the New Credit Facility, the commitments under the New Credit Facility may be terminated and the principal amount outstanding under the New Credit Facility, together with all accrued unpaid interest and other amounts owing in respect thereof, may be declared immediately due and payable.
The weighted average interest rate on all notes payable outstanding at the company’s operating entities was 3.50% as of December 31, 2019.
The following table summarizes the notes payable balances of the company and its investment entities as of December 31, 2019:
| Interest Rates | ||||||||||||
| Range | Weighted Average | Maturity Dates | December 31, 2019 | |||||||||
| Fixed rate notes payable | 1.905% – 6.000% | 2.27 | % | 01/29/2022 – 09/29/2049 | $ | 37,593,348 | ||||||
| Floating rate notes payable | 3.320% – 5.000% | 3.71 | % | 12/31/2025 – 3/30/2040 | 224,257,363 | |||||||
| $ | 261,850,711 | |||||||||||
The following table summarizes the notes payable balances of the company and its investment entities as of December 31, 2018, in addition to committed but undrawn funds on notes payable:
| Interest Rates | ||||||||||||
| Range | Weighted Average | Maturity Dates | December 31, 2018 | |||||||||
| Fixed rate notes payable | 1.775% – 6.250% | 3.54 | % | 03/31/2021 – 04/01/2032 | $ | 8,934,688 | ||||||
| Floating rate notes payable | 3.750% – 6.110% | 4.13 | % | 12/31/2024 – 10/31/2037 | 83,696,951 | |||||||
| $ | 92,631,639 | |||||||||||
The principal payments due on the notes payable for the company and its’ investment entities for each of the next five years ending December 31 and thereafter, including amounts expected to be drawn down on existing commitments, are as follows:
| Year ending December 31: | Principal Payments | |||
| 2020 | 12,819,719 | |||
| 2021 | 16,557,817 | |||
| 2022 | 14,447,850 | |||
| 2023 | 14,615,049 | |||
| 2024 | 15,030,543 | |||
| Thereafter | 188,379,733 | |||
| $ | 261,850,711 | |||
In the future, we expect that our ongoing sources of financing will be through corporate-level credit facilities or other secured and unsecured borrowings. In addition, we expect to use other financing methods at the project level as necessary, including joint venture structures, construction loans, property mortgages, letters of credit, sale and leaseback transactions, other lease transactions and other arrangements, any of which may be unsecured or may be secured by mortgages or other interests in our assets. Other sources of capital may include tax equity financings, whereby an investor receives an allocation of tax benefits as well as cash distribution and governmental grants.
Tax equity investors are passive investors, usually large tax-paying financial entities such as banks, insurance companies and utility affiliates that use these investments to reduce future tax liabilities. Depending on the arrangement, until the tax equity investors achieve their agreed upon rate of return, they may be entitled to substantially all of the applicable project’s operating cash flow, as well as substantially all of the project’s ITCs, accelerated depreciation and taxable income or loss. Typically, tax equity financing transactions are structured so that the tax equity investors reach their target return between five and ten years after the applicable project achieves commercial operation.
As a result, a tax equity financing may substantially reduce the cash distributions from the applicable project available for debt service and the period during which the tax equity investors receive most of the cash distributions may last longer than expected if the portfolio company’s energy projects perform below our expectations. While the terms of a tax equity financing may cause cash to be diverted away from the company to the tax equity investor for certain periods specified in the financing arrangement (often five to ten years, measured from commencement of the tax equity financing), then we expect to couple investments where cash is so restrained with other cash flowing investments so as to provide cash for distributions to investors. To maintain a mix of cash flowing and non-cash flowing investments, our investment strategy will involve a combination of several types of investments.
85
Hedging Activities
In regard to the New Credit Facility, the company has entered into five separate interest rate swap agreements. The first swap (“Swap 1”), effective July 29, 2016, has an initial notional amount of $4,300,000 to swap the floating rate interest payments on the original Facility 1 Term Loan for a corresponding fixed payment. The fixed swap rate is 1.11%. The second swap (“Swap 2”), with a trade date of June 15, 2017 and an effective date of June 18, 2018 and an initial notional amount of $20,920,650, was used to swap the floating rate interest payments on an additional principal amount of the Credit Facility, for a corresponding fixed payment. The fixed swap rate is 2.261%. The third swap (“Swap 3”), with a trade date of January 11, 2018 and an effective date of December 31, 2018 and an initial notional amount of $29,624,945 was used to swap the floating rate interest payments on the remaining unhedged portion of the Credit Facility, as well as the estimated additional drawdowns, for a corresponding fixed payment. The fixed swap rate is 2.65%.
The fourth swap (“Swap 4”), with a trade date of February 7, 2018 and an effective date of December 31, 2018 and an initial notional amount of $4,180,063 was used to swap the floating rate interest payments on the remaining unhedged portion of the Credit Facility, as well as the estimated additional drawdowns, for a corresponding fixed payment. The fixed swap rate is 2.97%. The fifth swap (“Swap 5”), with a trade date of January 2, 2019 and an effective date of September 30, 2019 and an initial notional amount of $38,203,506 was used to swap the floating rate interest payments on the remaining unhedged portion of the Credit Facility, as well as the estimated additional drawdowns, for a corresponding fixed payment. The fixed swap rate is 2.69%.
In regard to our investment in the Canadian Northern Lights Portfolio, with 79 solar assets located in and around Toronto, Ontario, Canada, we have foreign currency risk related to our revenue and operating expenses which are denominated in the Canadian Dollars as opposed to the U.S. Dollars. While we are currently of the opinion that the currency fluctuation between the Canadian and U.S. Dollar will not have a material impact on our operating results, we may in the future hedge this risk through the use of currency swap transactions or other financial instruments if the impact on our results of operations becomes material.
86
Contractual Obligations
While the company does not include a contractual obligations table herein as all obligations of the company are short-term, we have included the following information related to commitments of the company to further assist investors in understanding our outstanding commitments.
Advisory Agreement — GCM, a private firm that is registered as an investment adviser under the Advisers Act serves as our advisor. Under the direction of our board of directors, GCM manages our day-to-day operations and provides advisory and management services to us. The advisory agreement was previously approved by our board of directors and became effective on April 25, 2014. Unless earlier terminated, the advisory agreement will remain in effect for successive one-year periods if approved annually by a majority of our independent directors. The advisory agreement was most recently re-approved in February 2020, for the one-year period commencing April 24, 2020.
Pursuant to the advisory agreement, GCM is authorized to retain one or more sub-advisors with expertise in our target assets to assist GCM in fulfilling its responsibilities under the advisory agreement. However, GCM will be required to monitor any sub-advisor to ensure that material information discussed by management of any sub-advisor is communicated to our board of directors, as appropriate. If GCM retains any sub-advisor, our advisor will pay such sub-advisor a portion of the fees that it receives from us. We will not pay any additional fees to a sub-advisor. While our advisor will oversee the performance of any sub-advisor, our advisor will remain primarily liable to us to perform all of its duties under the advisory agreement, including those delegated to any sub-advisor. As of December 31, 2019, no sub-advisors have been retained by GCM.
We pay GCM a base management fee for advisory and management services. The base management fee is calculated at a monthly rate of 0.167% (2.00% annually) of our gross assets (including amounts borrowed). The Special Unitholder, an entity affiliated with our advisor, will hold the special unit in our company entitling it to an incentive allocation and distribution. Pursuant to our LLC Agreement, the incentive allocation and distribution, or incentive distribution, will have three parts as follows: the Income Incentive Distribution, Capital Gains Incentive Distribution and the Liquidation Incentive Distribution.
Administration Agreement — Greenbacker Administration serves as our Administrator. Since commencement of operations, Greenbacker Administration delegated certain of its administrative functions to U.S. Bancorp Fund Services, LLC (doing business as “U.S. Bank Global Fund Services”). Greenbacker Administration may enter into similar arrangements with other third-party administrators, including with respect to fund accounting and administrative services. Greenbacker Administration performs certain asset management, compliance and oversight services, as well as asset accounting and administrative services, for many of the company’s investments. The fee for these services, which is billed at cost to the company’s individual investments.
Pledge of Collateral and Unsecured Guarantee of Loans to Subsidiaries: Borrowings under the New Credit Facility are secured by the assets, cash, agreements and equity interests in the GREC HoldCo and its subsidiaries. The company is a guarantor of GREC HoldCo’s obligations under the New Credit Facility. The amount of the unsecured guaranty on the outstanding principal of the New Credit Facility is approximately $72 million as of December 31, 2019.
Investment in to be constructed assets: Pursuant to various engineering, procurement and construction contracts to which nine entities of the company are individually a party, the entities, and indirectly the company, has committed an outstanding balance of approximately $163.2 million to complete construction of the facilities. Based upon current construction schedules, the expectation is these commitments will be fulfilled in 2020 into 2021. We also have ten entities of the company that are individually a party, and indirectly the company, and committed an outstanding balance of approximately $180.8 million to membership interest purchase agreements as of December 31, 2019. The company plans to use debt and tax equity financing as well as additional capital raised to fund such commitments.
Investment in operating assets: In September 2019, GREC signed a purchase and sale agreement to acquire an interest in Wind – IA, which is comprised of two projects Elk and Hawkeye. Elk is a 42.5 MW operating wind farm located in Delaware County, Iowa, and Hawkeye is a 37.5 MW operating wind farm located in Fayette County, Iowa. Elk and Hawkeye reached their COD in 2011 and 2012, respectively, and originally secured 20 and 25-year busbar PPA with an investment-grade utility. This acquisition has received regulatory approval in 2019 and closed in early January 2020.
Renewable Energy Credits: For certain solar power systems in the Green Maple Portfolio, Greenbacker Residential Solar Portfolio and the Greenbacker Residential Solar II Portfolio (the “Portfolios”), the company has received incentives in the form of RECs. In certain cases, the Portfolios have entered into fixed price, fixed volume forward sale transactions to monetize these RECs for specific entities. If we are unable to satisfy the transaction requirements due to lack of production, we may have to purchase RECs on the spot market and/or pay specified replacement cost damages. Based upon current production projection, we do not expect a requirement to purchase RECs to fulfill our current REC sales contracts. If RECs earned by the Portfolios are not sold on a forward basis, they are sold in the spot market with revenue recorded in the accounts of the underlying investment when received.
87
Recording of a sale of RECs under GAAP is accounted for under Accounting Standards Codification Topic 606, Revenue Recognition. There are no differences in the process and related revenue recognition between REC sales to utilities and non-utility customers. Revenue is recorded in our wholly owned, single member LLCs when all revenue recognition criteria are met, including that: there is persuasive evidence that an arrangement exists (typically through a contract), services rendered through the production of electricity, pricing is fixed and determinable under the contract and collectability is reasonably assured. The accounting policy adopted by our wholly owned, single member LLC related to RECs is that the revenue recognition criteria are met when the energy is produced, and a REC is created and transferred to a third party.
If any of our REC counterparties fail to satisfy their contractual obligations, our costs may increase under replacement agreements that may be required. We would also likely incur expenses in locating alternative parties to provide the services we expect to receive under our advisory agreement. For the majority of the forward REC contracts currently effective as of December 31, 2019, GREC and/or the company has provided an unsecured guaranty related to the delivery obligations under these contracts. The amount of the unsecured guaranty on REC contracts is approximately $107,025 as of December 31, 2019.
We currently have no off-balance sheet arrangements, including any risk management of commodity pricing or other hedging practices.
Distributions
Subject to the board of directors’ review and approval and applicable legal restrictions, we intend to authorize and declare distributions on a quarterly basis and pay distributions on a monthly basis. We will calculate each member’s specific distribution amount for the period using record and declaration dates, and each member’s distributions will begin to accrue on the date we accept each member’s subscription for shares. From time to time, we may also pay interim special distributions in the form of cash or shares, with the approval of our board of directors.
Distributions will be made on all classes of our shares at the same time. The cash distributions with respect to the Class C shares are lower than the cash distributions with respect to Class A, I, P-A and P-I shares because of the distribution fee relating to Class C shares, which will be allocated as a Class C-specific charge. Amounts distributed to each class will be allocated among the holders of our shares in such class in proportion to their shares.
Cash distributions paid during the periods presented were funded from the following sources noted below:
For the December 31, 2019 |
For the December 31, 2018 |
For the December 31, 2017 | ||||||||||
| Cash from operations | $ | 4,088,660 | $ | 11,611,348 | $ | 6,656,075 | ||||||
| Offering proceeds | 15,042,768 | — | — | |||||||||
| Total cash distributions | $ | 19,131,428 | $ | 11,611,348 | $ | 6,656,075 | ||||||
The company expects to continue to fund distributions from a combination of cash from operations as well as offering proceeds. Due to the company’s change in investment portfolio composition in 2018 to include a greater percentage of pre-operational assets, a significant amount of distributions will continue to be funded from offering proceeds. We expect distributions to continue at the current level and we do not currently anticipate significant changes in the level of distributions in future periods.
Inflation
We do not anticipate that inflation will have a significant effect on our results of operations. However, in the event of a significant increase in inflation, interest rates could rise, and our projects and investments may be materially adversely affected.
Seasonality
Certain types of renewable power generation may exhibit seasonal behavior. For example, wind power generation is generally stronger in winter than in summer as wind speed tends to be higher when the weather is colder. In contrast, solar power generation is typically stronger in the summer than in the winter. This is primarily due to the brighter sunshine, longer days and shorter nights of the summer months, which generally result in the highest power output of the year for solar power. Because these seasonal variations are relatively predictable for these types of assets, we factor in the effects of seasonality when analyzing a potential investment in these target assets. Therefore, the impact that seasonality may have on our business, including the cash flows from our investments in our target assets, will depend on the diversity of our investments in renewable energy, energy efficiency and other sustainability related projects in our overall portfolio at such time as we have fully invested the proceeds from this offering. However, in the early stages of our operations, or to the extent our initial investments are concentrated in either solar or wind power, we expect our business to be seasonal based on the type of investment, as discussed above.
88
ITEM 7A. QUANTITATIVE AND QUALITATIVE DISCLOSURES ABOUT MARKET RISK
The following qualitative disclosures regarding our market risk exposures — except for (i) those disclosures that are statements of historical fact and (ii) the descriptions of how we, along with our advisor, manage our primary market risk exposures, constitute forward-looking statements within the meaning of Section 27A of the Securities Act and Section 21E of the Exchange Act. Our primary market risk exposures as well as the strategies used and to be used by the advisor managing such exposures are subject to numerous uncertainties, contingencies and risks, any one of which could cause the actual results of our risk controls to differ materially from the objectives of such strategies. Government interventions, defaults and expropriations, illiquid markets, the emergence of dominant fundamental factors, political upheavals, changes in historical price relationships, an influx of new market participants, increased regulation and many other factors could result in material losses as well as in material changes to our risk exposures and risk management strategies. There can be no assurance that our current market exposure and/or risk management strategies will not change materially or that any such strategies will be effective in either the short or long term. Investors must be prepared to lose all or substantially all their investment in the shares.
We anticipate that our primary market risks will be related to commodity prices, the credit quality of our counterparties and project companies and market interest rates. We will seek to manage these risks while, at the same time, seeking to provide an opportunity for members to realize attractive returns through ownership of our shares.
Commodity price risk. Investments in renewable energy and energy efficiency projects and businesses expose us to volatility in the market prices of electricity. To stabilize our revenue, we generally expect our projects will have PPAs with local utilities and off-takers that ensure that all or most of electricity generated by each project will be purchased at the contracted price. In the event any electricity is not purchased by the off-taker or the energy produced exceeds the off-taker’s capacity, we generally will sell that excess energy to the local utility or another suitable counterparty, which would ensure revenue is generated for all electricity produced. We may be exposed to the risk that the off-taker will fail to perform under the PPA, with the result that we will have to sell our electricity at the market price, which could be disadvantageous.
In regard to the market price of oil, our investments are little effected by the volatility in this market as most oil consumed in the U.S. today is used for transportation infrastructure and not for the generation of electricity.
Credit risk. Through our investments in our target assets, we expect to be indirectly exposed to credit risk relating to counterparties to the electricity sales agreements (including PPAs) for our projects as well as the businesses in which we invest. If counterparties to the electricity sales agreements for our projects or the businesses in which we invest are unable to make payments to us when due, or at all, our financial condition and results of operations could be materially adversely affected. GCM will seek to mitigate this risk by deploying a comprehensive review and asset selection process and careful ongoing monitoring of acquired assets. In addition, we expect our projects will seek contracts with high credit quality counterparties. Nevertheless, unanticipated credit losses could occur which could adversely impact our operating results.
Changes in market interest rates. With respect to our proposed business operations, general increases in interest rates over time may cause the interest expense associated with our borrowings to increase, and the value of our debt investments to decline. Conversely, general decreases in interest rates over time may cause the interest expense associated with our borrowings to decrease, and the value of our debt investments to increase.
Changes in government incentives. Retrospective changes in the levels of government incentives may have a negative impact on current investments. Prospective changes in the levels of government incentives, including renewable energy credits and investment tax credits, may impact the relative attractiveness of future investments in various renewable energy projects, which could make it difficult for GCM to find suitable investments in the sector.
89
ITEM 8. CONSOLIDATED FINANCIAL STATEMENTS AND SUPPLEMENTARY DATA
INDEX TO CONSOLIDATED FINANCIAL STATEMENTS
F-1

| KPMG LLP | |
| 345 Park Avenue | |
| New York, NY 10154-0102 |
Report of Independent Registered Public Accounting Firm
To the Members and Board of Directors
Greenbacker Renewable Energy Company LLC:
Opinion on the Consolidated Financial Statements
We have audited the accompanying consolidated statements of assets and liabilities of Greenbacker Renewable Energy Company LLC, and Subsidiaries (the Company), including the consolidated schedules of investments, as of December 31, 2019 and 2018, the related consolidated statements of operations, changes in net assets, and cash flows for each of the years in the three-year period ended December 31, 2019, and the related notes (collectively, the consolidated financial statements). In our opinion, the consolidated financial statements present fairly, in all material respects, the financial position of the Company as of December 31, 2019 and 2018, and the results of its operations and its cash flows for each of the years in the three-year period ended December 31, 2019, in conformity with U.S. generally accepted accounting principles.
Basis for Opinion
These consolidated financial statements are the responsibility of the Company’s management. Our responsibility is to express an opinion on these consolidated financial statements based on our audits. We are a public accounting firm registered with the Public Company Accounting Oversight Board (United States) (PCAOB) and are required to be independent with respect to the Company in accordance with the U.S. federal securities laws and the applicable rules and regulations of the Securities and Exchange Commission and the PCAOB.
We conducted our audits in accordance with the standards of the PCAOB. Those standards require that we plan and perform the audit to obtain reasonable assurance about whether the consolidated financial statements are free of material misstatement, whether due to error or fraud. The Company is not required to have, nor were we engaged to perform, an audit of its internal control over financial reporting. As part of our audits, we are required to obtain an understanding of internal control over financial reporting but not for the purpose of expressing an opinion on the effectiveness of the Company’s internal control over financial reporting. Accordingly, we express no such opinion.
Our audits included performing procedures to assess the risks of material misstatement of the consolidated financial statements, whether due to error or fraud, and performing procedures that respond to those risks. Such procedures included examining, on a test basis, evidence regarding the amounts and disclosures in the consolidated financial statements. Our audits also included evaluating the accounting principles used and significant estimates made by management, as well as evaluating the overall presentation of the consolidated financial statements. We believe that our audits provide a reasonable basis for our opinion.
We have served as the Company’s auditor since 2012.
New York, New York
March 13, 2020
KPMG LLP is a Delaware limited liability partnership and the U.S. member
firm of the KPMG network of independent member firms affiliated with
KPMG International Cooperative (“KPMG International”), a Swiss entity.
F-2
GREENBACKER RENEWABLE ENERGY COMPANY LLC AND SUBSIDIARIES
CONSOLIDATED STATEMENTS OF ASSETS AND LIABILITIES
| December 31, 2019 | December 31, 2018 | |||||||
| ASSETS | ||||||||
| Investments in controlled/affiliated portfolios, at fair value (cost of $415,905,982 and $298,314,385, respectively) | $ | 452,072,181 | $ | 307,176,115 | ||||
| Investments in non-controlled/non-affiliated portfolios, at fair value (cost of $23,103,690 and nil, respectively) | 23,103,690 | - | ||||||
| Swap contracts, at fair value | 21,223 | 435,603 | ||||||
| Cash and cash equivalents | 8,636,839 | 39,122,635 | ||||||
| Restricted cash | 429,252 | - | ||||||
| Shareholder receivable | 650,000 | 469,245 | ||||||
| Dividend receivable | 620,846 | 488,000 | ||||||
| Deferred tax assets, net of valuation allowance | 1,313,506 | 6,051,957 | ||||||
| Investment sales receivable | 22,013,491 | - | ||||||
| Other assets | 611,560 | 201,074 | ||||||
| Total assets | $ | 509,472,588 | $ | 353,944,629 | ||||
| LIABILITIES | ||||||||
| Swap contracts, at fair value | $ | 4,899,566 | $ | 311,641 | ||||
| Payable for investments purchased | 7,502,267 | 8,901 | ||||||
| Term note payable, net of financing costs | 68,886,785 | 29,527,046 | ||||||
| Management fee payable | 272,982 | 588,161 | ||||||
| Accounts payable and accrued expenses | 419,240 | 727,175 | ||||||
| Shareholder distributions payable | 1,784,961 | 1,260,754 | ||||||
| Interest payable | 11,933 | 3,507 | ||||||
| Due to advisor | - | 19,181 | ||||||
| Payable for repurchases of common stock | 2,186,780 | 1,249,808 | ||||||
| Deferred sales commission payable | 56,483 | 191,706 | ||||||
| Total liabilities | $ | 86,020,997 | $ | 33,887,880 | ||||
| Commitments and contingencies (See Note 2, Note 5 and Note 9) | ||||||||
| MEMBERS’ EQUITY (NET ASSETS) | ||||||||
| Preferred stock, par value, $.001 per share, 50,000,000 authorized; none issued and outstanding | $ | - | $ | - | ||||
| Common stock, par value, $.001 per share, 350,000,000 authorized; 47,889,610 and 37,003,502 shares issued and outstanding, respectively | 47,890 | 37,004 | ||||||
| Paid-in capital in excess of par value | 416,611,769 | 321,741,819 | ||||||
| Accumulated losses * | (105,876 | ) | (3,519,212 | ) | ||||
| Total common members’ equity | 416,553,783 | 318,259,611 | ||||||
| Special unitholder’s equity | 6,897,808 | 1,797,138 | ||||||
| Total members’ equity (net assets) | 423,451,591 | 320,056,749 | ||||||
| Total liabilities and equity (net assets) | $ | 509,472,588 | $ | 353,944,629 | ||||
| Net assets, Class A (shares outstanding of 17,210,016 and 16,714,738, respectively) | $ | 147,304,141 | $ | 142,791,899 | ||||
| Net assets, Class C (shares outstanding of 2,718,475 and 2,222,478, respectively) | 22,792,345 | 18,546,310 | ||||||
| Net assets, Class I (shares outstanding of 6,693,658 and 6,209,416, respectively) | 57,292,421 | 53,046,260 | ||||||
| Net assets, Class P-A (shares outstanding of 18,109 and 15,478, respectively) | 155,802 | 132,272 | ||||||
| Net assets, Class P-I (shares outstanding of 21,249,352 and 11,841,392, respectively) | 189,009,074 | 103,742,870 | ||||||
| Total common members’ equity | $ | 416,553,783 | $ | 318,259,611 | ||||
* Accumulated deficit, accumulated net realized gain on investments, and accumulated unrealized appreciation (depreciation) on investments, net of deferred taxes, foreign currency translation, and swap contracts are included in accumulated losses.
The accompanying notes are an integral part of these consolidated financial statements.
F-3
GREENBACKER RENEWABLE ENERGY COMPANY LLC AND SUBSIDIARIES
CONSOLIDATED STATEMENTS OF OPERATIONS
| For the year ended December 31, 2019 | For the year ended December 31, 2018 | For the year ended December 31, 2017 | ||||||||||
| Investment income: | ||||||||||||
| Investment income from controlled, affiliated investments: | ||||||||||||
| Dividend income | $ | 17,160,351 | $ | 18,503,814 | $ | 13,125,642 | ||||||
| Interest income | 13,060 | 263,791 | 107,547 | |||||||||
| Total investment income from controlled, affiliated investments | $ | 17,173,411 | $ | 18,767,605 | $ | 13,233,189 | ||||||
| Investment income from non-controlled, non-affiliated investments: | ||||||||||||
| Interest income | 1,589,294 | 624,977 | 106,080 | |||||||||
| Total investment income | $ | 18,762,705 | $ | 19,392,582 | $ | 13,339,269 | ||||||
| Operating expenses: | ||||||||||||
| Management fee expense | 8,461,616 | 5,803,893 | 3,490,942 | |||||||||
| Audit and tax expense | 1,156,874 | 913,509 | 685,570 | |||||||||
| Interest and financing expenses | 2,812,802 | 1,793,834 | 692,265 | |||||||||
| General and administration expenses | 239,202 | 375,159 | 421,673 | |||||||||
| Legal expenses | 351,128 | 139,059 | 183,545 | |||||||||
| Directors fees and expenses | 398,845 | 100,209 | 100,210 | |||||||||
| Insurance expense | 161,610 | 95,780 | 64,411 | |||||||||
| Transfer Agent Expense | 477,198 | 382,943 | - | |||||||||
| Other expenses | 489,627 | 106,881 | 241,611 | |||||||||
| Total expenses | 14,548,902 | 9,711,267 | 5,880,227 | |||||||||
| Net investment income before taxes | 4,213,803 | 9,681,315 | 7,459,042 | |||||||||
| Deferred tax (benefit) expense | (3,188,431 | ) | 1,458,669 | 2,619,076 | ||||||||
| Franchise tax expense | 125,143 | 138,436 | 23,415 | |||||||||
| Net investment income | 7,277,091 | 8,084,210 | 4,816,551 | |||||||||
| Net change in realized and unrealized gain (loss) on investments, foreign currency translation and deferred tax assets: | ||||||||||||
| Net realized gain on investments | 12,915,738 | - | 693,882 | |||||||||
| Net change in unrealized appreciation (depreciation) on: | ||||||||||||
| Investments | 27,296,880 | 2,955,079 | 5,929,033 | |||||||||
| Foreign currency translation | 7,589 | (118,496 | ) | 97,763 | ||||||||
| Swap contracts | (5,002,305 | ) | (32,106 | ) | 65,371 | |||||||
| Change in benefit from deferred taxes on unrealized appreciation (depreciation) on investments | (7,926,882 | ) | 2,986,588 | 963,720 | ||||||||
| Net increase in net assets resulting from operations | 34,568,111 | 13,875,275 | 12,566,320 | |||||||||
| Net decrease in net assets attributed to special unitholder | (5,270,670 | ) | (560,895 | ) | (1,235,657 | ) | ||||||
| Net increase in net assets attributed to common members | $ | 29,297,441 | $ | 13,314,380 | $ | 11,330,663 | ||||||
| Common stock per share information — basic and diluted: | ||||||||||||
| Net increase in net assets attributed to common members | $ | 0.67 | $ | 0.45 | $ | 0.60 | ||||||
| Weighted average common shares outstanding | 43,788,187 | 29,799,735 | 18,922,343 | |||||||||
The accompanying notes are an integral part of these consolidated financial statements.
F-4
GREENBACKER RENEWABLE ENERGY COMPANY LLC AND SUBSIDIARIES
CONSOLIDATED STATEMENTS OF CHANGES IN NET ASSETS
For the Years Ended December 31, 2017, 2018 and 2019
| Common Members | ||||||||||||||||||||||||||||||||||||||||||||
| Shares | Par
Value |
Paid-in
capital in excess of par value |
Accumulated
deficit |
Accumulated
net realized gain on investments |
Accumulated
unrealized appreciation (depreciation) on investments, net of deferred taxes |
Accumulated
unrealized appreciation (depreciation) on foreign currency translation |
Accumulated
unrealized appreciation (depreciation) on swap contracts |
Common
members’ equity |
Special
unitholder |
Total
members’ equity (net assets) |
||||||||||||||||||||||||||||||||||
| Balances December 31, 2016 | 14,921,922 | $ | 14,922 | $ | 128,425,800 | $ | (3,629,220 | ) | $ | 4,578 | $ | 4,699,283 | $ | (187,846 | ) | $ | 90,697 | $ | 129,418,214 | $ | 586 | $ | 129,418,800 | |||||||||||||||||||||
| Proceeds from issuance of common stock, net | 8,251,118 | 8,251 | 72,411,556 | - | - | - | - | - | 72,419,807 | - | 72,419,807 | |||||||||||||||||||||||||||||||||
| Issuance of common stock under distribution reinvestment plan | 533,645 | 534 | 4,747,000 | - | - | - | - | - | 4,747,534 | - | 4,747,534 | |||||||||||||||||||||||||||||||||
| Repurchases of common stock | (517,456 | ) | (518 | ) | (4,147,180 | ) | - | - | - | - | - | (4,147,698 | ) | - | (4,147,698 | ) | ||||||||||||||||||||||||||||
| Offering costs | - | - | (926,386 | ) | - | - | - | - | - | (926,386 | ) | - | (926,386 | ) | ||||||||||||||||||||||||||||||
| Shareholder distributions | - | - | - | (11,403,610 | ) | - | - | - | - | (11,403,610 | ) | - | (11,403,610 | ) | ||||||||||||||||||||||||||||||
| Net investment income (loss) | - | - | - | 4,816,551 | - | - | - | - | 4,816,551 | - | 4,816,551 | |||||||||||||||||||||||||||||||||
| Net realized gain (loss) | - | - | - | - | 693,882 | - | - | - | 693,882 | - | 693,882 | |||||||||||||||||||||||||||||||||
| Net change in unrealized appreciation (depreciation) on investments | - | - | - | - | - | 4,693,376 | - | - | 4,693,376 | 1,222,583 | 5,915,959 | |||||||||||||||||||||||||||||||||
| Net change in unrealized appreciation (depreciation) on foreign currency translation | - | - | - | - | - | - | 97,763 | - | 97,763 | - | 97,763 | |||||||||||||||||||||||||||||||||
| Net change in unrealized appreciation (depreciation) on swap contracts | - | - | - | - | - | - | - | 65,371 | 65,371 | 13,074 | 78,445 | |||||||||||||||||||||||||||||||||
| Change in benefit from deferred taxes on unrealized appreciation (depreciation) on investments | - | - | - | - | - | 963,720 | - | - | 963,720 | - | 963,720 | |||||||||||||||||||||||||||||||||
| Balances at December 31, 2017 | 23,189,229 | $ | 23,189 | $ | 200,510,790 | $ | (10,216,279 | ) | $ | 698,460 | $ | 10,356,379 | $ | (90,083 | ) | $ | 156,068 | $ | 201,438,524 | $ | 1,236,243 | $ | 202,674,767 | |||||||||||||||||||||
| Proceeds from issuance of common stock, net | 13,625,689 | 13,627 | 120,313,445 | - | - | - | - | - | 120,327,072 | - | 120,327,072 | |||||||||||||||||||||||||||||||||
| Issuance of common stock under distribution reinvestment plan | 694,427 | 694 | 6,126,095 | - | - | - | - | - | 6,126,789 | - | 6,126,789 | |||||||||||||||||||||||||||||||||
| Repurchases of common stock | (505,843 | ) | (506 | ) | (4,473,965 | ) | - | - | - | - | - | (4,474,471 | ) | - | (4,474,471 | ) | ||||||||||||||||||||||||||||
| Offering costs | - | - | (734,546 | ) | - | - | - | - | - | (734,546 | ) | - | (734,546 | ) | ||||||||||||||||||||||||||||||
| Shareholder distributions | - | - | - | (17,738,137 | ) | - | - | - | - | (17,738,137 | ) | - | (17,738,137 | ) | ||||||||||||||||||||||||||||||
| Net investment income (loss) | - | - | - | 8,084,210 | - | - | - | - | 8,084,210 | - | 8,084,210 | |||||||||||||||||||||||||||||||||
| Net realized gain (loss) | - | - | - | - | - | - | - | - | - | - | - | |||||||||||||||||||||||||||||||||
| Net change in unrealized appreciation (depreciation) on investments | - | - | - | - | - | 2,394,184 | - | - | 2,394,184 | 560,895 | 2,955,079 | |||||||||||||||||||||||||||||||||
| Net change in unrealized appreciation (depreciation) on foreign currency translation | - | - | - | - | - | - | (118,496 | ) | - | (118,496 | ) | - | (118,496 | ) | ||||||||||||||||||||||||||||||
| Net change in unrealized appreciation (depreciation) on swap contracts | - | - | - | - | - | - | - | (32,106 | ) | (32,106 | ) | - | (32,106 | ) | ||||||||||||||||||||||||||||||
| Change in benefit from deferred taxes on unrealized appreciation (depreciation) on investments | - | - | - | - | - | 2,986,588 | - | - | 2,986,588 | 2,986,588 | ||||||||||||||||||||||||||||||||||
| Balances at December 31, 2018 | 37,003,502 | $ | 37,004 | $ | 321,741,819 | $ | (19,870,206 | ) | $ | 698,460 | $ | 15,737,151 | $ | (208,579 | ) | $ | 123,962 | $ | 318,259,611 | $ | 1,797,138 | $ | 320,056,749 | |||||||||||||||||||||
| Proceeds from issuance of common stock, net | 11,086,672 | 11,087 | 97,330,310 | - | - | - | - | - | 97,341,397 | - | 97,341,397 | |||||||||||||||||||||||||||||||||
| Issuance of common stock under distribution reinvestment plan | 784,496 | 784 | 6,751,893 | - | - | - | - | - | 6,752,677 | - | 6,752,677 | |||||||||||||||||||||||||||||||||
| Repurchases of common stock | (985,060 | ) | (985 | ) | (8,521,405 | ) | - | - | - | - | - | (8,522,390 | ) | - | (8,522,390 | ) | ||||||||||||||||||||||||||||
| Offering costs | - | - | (690,848 | ) | - | - | - | - | - | (690,848 | ) | - | (690,848 | ) | ||||||||||||||||||||||||||||||
| Shareholder distributions | - | - | - | (25,884,105 | ) | - | - | - | - | (25,884,105 | ) | - | (25,884,105 | ) | ||||||||||||||||||||||||||||||
| Distributions to special unitholder | - | - | - | - | - | - | - | - | - | (170,000 | ) | (170,000 | ) | |||||||||||||||||||||||||||||||
| Net investment income (loss) | - | - | - | 7,277,091 | - | - | - | - | 7,277,091 | - | 7,277,091 | |||||||||||||||||||||||||||||||||
| Net realized gain (loss) | - | - | - | - | 11,265,324 | - | - | - | 11,265,324 | 1,650,414 | 12,915,738 | |||||||||||||||||||||||||||||||||
| Net change in unrealized appreciation (depreciation) on investments | - | - | - | - | - | 22,676,163 | - | - | 22,676,163 | 4,620,717 | 27,296,880 | |||||||||||||||||||||||||||||||||
| Net change in unrealized appreciation (depreciation) on foreign currency translation | - | - | - | - | - | - | 7,589 | - | 7,589 | - | 7,589 | |||||||||||||||||||||||||||||||||
| Net change in unrealized appreciation (depreciation) on swap contracts | - | - | - | - | - | - | - | (4,001,844 | ) | (4,001,844 | ) | (1,000,461 | ) | (5,002,305 | ) | |||||||||||||||||||||||||||||
| Change in benefit from deferred taxes on unrealized appreciation (depreciation) on investments | - | - | - | - | - | (7,926,882 | ) | - | - | (7,926,882 | ) | - | (7,926,882 | ) | ||||||||||||||||||||||||||||||
| Balances at December 31, 2019 | 47,889,610 | $ | 47,890 | $ | 416,611,769 | $ | (38,477,220 | ) | $ | 11,963,784 | $ | 30,486,432 | $ | (200,990 | ) | $ | (3,877,882 | ) | $ | 416,553,783 | $ | 6,897,808 | $ | 423,451,591 | ||||||||||||||||||||
The accompanying notes are an integral part of these consolidated financial statements.
F-5
GREENBACKER RENEWABLE ENERGY COMPANY LLC AND SUBSIDIARIES
CONSOLIDATED STATEMENTS OF CASH FLOWS
| For the year ended December 31, 2019 | For the year ended December 31, 2018 | For the year ended December 31, 2017 | ||||||||||
| Operating activities: | ||||||||||||
| Net increase (decrease) in net assets from operations | $ | 34,568,111 | $ | 13,875,275 | $ | 12,566,320 | ||||||
| Adjustments to reconcile net increase in net assets from operations to net cash used in operating activities: | ||||||||||||
| Amortization of deferred financing costs | 226,742 | 222,394 | 164,725 | |||||||||
| Amortization and accretion of premium and discount | - | (88,432 | ) | - | ||||||||
| Purchase of investments | (353,585,860 | ) | (135,052,745 | ) | (117,569,013 | ) | ||||||
| Return of capital from investments | 161,551,945 | 44,566,792 | 30,412 | |||||||||
| Proceeds from principal payments and sales of investments | 64,254,366 | 4,621,231 | 20,996,206 | |||||||||
| Net realized (gain) on investments | (12,915,738 | ) | - | (693,882 | ) | |||||||
| Net change in unrealized (appreciation) on investments | (27,296,880 | ) | (2,955,079 | ) | (5,929,033 | ) | ||||||
| Net change in unrealized (appreciation) depreciation on foreign currency translation | (7,589 | ) | 118,496 | (97,763 | ) | |||||||
| Net change in unrealized (appreciation) depreciation on swap contracts | 5,002,305 | 32,106 | (65,371 | ) | ||||||||
| Deferred tax expense | 4,738,451 | (1,527,919 | ) | 1,655,356 | ||||||||
| (Increase) decrease in other assets: | ||||||||||||
| Receivable for investments sold | (22,013,491 | ) | - | - | ||||||||
| Dividend receivable | (132,846 | ) | (488,000 | ) | - | |||||||
| Other assets | (410,486 | ) | (126,832 | ) | (9,198 | ) | ||||||
| Increase (decrease) in other liabilities: | ||||||||||||
| Payable for investments purchased | 7,493,366 | (15,405,304 | ) | 15,414,205 | ||||||||
| Due to advisor, net | (19,181 | ) | 8,764 | (89,365 | ) | |||||||
| Management fee payable | (315,179 | ) | 530,870 | (175,565 | ) | |||||||
| Accounts payable and accrued expenses | (307,935 | ) | 327,031 | (23,495 | ) | |||||||
| Interest payable | 8,426 | (108,738 | ) | 112,245 | ||||||||
| Net cash used in operating activities | (139,161,473 | ) | (91,450,090 | ) | (73,713,216 | ) | ||||||
| Financing activities: | ||||||||||||
| Borrowings on Credit facility and term note | 55,580,682 | 30,665,460 | 15,800,000 | |||||||||
| Paydowns on Credit facility and term note | (14,255,676 | ) | (13,655,794 | ) | (6,324,760 | ) | ||||||
| Payments of financing costs | (2,192,009 | ) | (615,378 | ) | - | |||||||
| Proceeds from issuance of shares of common stock, net | 97,025,448 | 120,024,951 | 72,672,757 | |||||||||
| Distributions paid | (18,607,250 | ) | (11,061,871 | ) | (6,348,757 | ) | ||||||
| Offering costs | (690,848 | ) | (734,546 | ) | (926,386 | ) | ||||||
| Repurchases of common stock | (7,585,418 | ) | (4,194,111 | ) | (4,034,020 | ) | ||||||
| Distribution from special unitholder | (170,000 | ) | - | - | ||||||||
| Due to dealer manager re: Offering costs | - | - | (36,694 | ) | ||||||||
| Net cash provided by financing activities | 109,104,929 | 120,428,711 | 70,802,140 | |||||||||
| Net increase (decrease) in cash and cash equivalents | (30,056,544 | ) | 28,978,621 | (2,911,076 | ) | |||||||
| Cash, cash equivalents and restricted cash, beginning of period | 39,122,635 | 10,144,014 | 13,055,090 | |||||||||
| Cash, cash equivalents and restricted cash, end of period | $ | 9,066,091 | $ | 39,122,635 | $ | 10,144,014 | ||||||
| Reconciliation of cash, cash equivalents and restricted cash per the Consolidated Statements of Assets and Liabilities | ||||||||||||
| Cash and Cash equivalents | $ | 8,636,839 | $ | 39,122,635 | $ | 10,144,014 | ||||||
| Restricted Cash | 429,252 | - | - | |||||||||
| Total cash, cash equivalents and restricted cash | $ | 9,066,091 | $ | 39,122,635 | $ | 10,144,014 | ||||||
| Supplemental disclosure of cash flow information: | ||||||||||||
| Cash interest paid during the period | $ | 1,360,409 | $ | 1,219,237 | $ | 490,139 | ||||||
| Non cash financing activities | ||||||||||||
| Shareholder receivable from sale of common stock | $ | 650,000 | $ | 469,245 | $ | 225,509 | ||||||
| Purchase of investments | $ | - | $ | 8,091 | $ | 15,414,205 | ||||||
| Investments disposed of/received through in-kind transactions | $ | - | $ | - | $ | 11,420,306 | ||||||
The accompanying notes are an integral part of these consolidated financial statements.
F-6
GREENBACKER RENEWABLE ENERGY COMPANY LLC AND SUBSIDIARIES
CONSOLIDATED SCHEDULES OF INVESTMENTS
December 31, 2019
| Investments in controlled/affiliated portfolios | Interest | Maturity | Shares or Principal Amount | Cost | Fair Value | Percentage
of Net Assets (a) |
||||||||||||||||
| Limited Liability Company Member Interests in the United States- Not readily marketable | ||||||||||||||||||||||
| Biomass | ||||||||||||||||||||||
| Eagle Valley Biomass Portfolio | 100% Ownership | $ | 21,425,600 | $ | 21,425,600 | 5.1 | % | |||||||||||||||
| Total Biomass - 5.1% | $ | 21,425,600 | $ | 21,425,600 | 5.1 | % | ||||||||||||||||
| Commercial Solar | ||||||||||||||||||||||
| Conic Portfolio | Managing member, majority equity owner | $ | 12,077,823 | $ | 17,828,206 | 4.2 | % | |||||||||||||||
| East to West Solar Portfolio | 100% equity ownership or Managing member, majority equity owner | 39,109,190 | 41,214,191 | 9.7 | % | |||||||||||||||||
| Foresight Solar Portfolio | Managing Member, Majority Equity Owner | 13,790,000 | 14,965,339 | 3.5 | % | |||||||||||||||||
| Golden Horizons Solar Portfolio | 100% Ownership | 9,290,000 | 15,132,017 | 3.6 | % | |||||||||||||||||
| Green Maple Portfolio | 100% Ownership | 26,561,596 | 27,268,058 | 6.4 | % | |||||||||||||||||
| Longleaf Solar Portfolio | Managing member, majority equity owner | 22,797,404 | 24,605,536 | 5.8 | % | |||||||||||||||||
| Magnolia Sun Portfolio | 100% Ownership | 10,775,000 | 6,460,457 | 1.5 | % | |||||||||||||||||
| Midway III Solar Portfolio | Managing member, majority equity owner | 10,575,394 | 11,475,652 | 2.7 | % | |||||||||||||||||
| Six States Solar Portfolio | 100% Ownership | 12,655,306 | 12,799,005 | 3.0 | % | |||||||||||||||||
| Sunny Mountain Portfolio | 100% Ownership | 884,578 | 743,768 | 0.2 | % | |||||||||||||||||
| Total Commercial Solar - 40.6% | $ | 158,516,291 | $ | 172,492,229 | 40.6 | % | ||||||||||||||||
| Residential Solar | ||||||||||||||||||||||
| Canadian Northern Lights Portfolio (d) | 100% Ownership | $ | 1,603,136 | $ | 1,611,955 | 0.4 | % | |||||||||||||||
| Greenbacker Residential Solar Portfolio | 100% Ownership or Managing Member, Majority Equity Owner | 28,100,000 | 32,540,979 | 7.7 | % | |||||||||||||||||
| Greenbacker Residential Solar Portfolio II | Managing Member, Majority Equity Owner | 6,400,000 | 13,279,521 | 3.1 | % | |||||||||||||||||
| Total Residential Solar - 11.2% | $ | 36,103,136 | $ | 47,432,455 | 11.2 | % | ||||||||||||||||
| Wind | ||||||||||||||||||||||
| Greenbacker Wind Portfolio - California | 100% Ownership | $ | 9,500,000 | $ | 8,777,056 | 2.1 | % | |||||||||||||||
| Greenbacker Wind Portfolio - HoldCo | 100% Ownership | 25,753,111 | 35,089,021 | 8.3 | % | |||||||||||||||||
| Greenbacker Wind Portfolio - Iowa | (e) | 20,440,000 | 20,440,000 | 4.8 | % | |||||||||||||||||
| Greenbacker Wind Portfolio - Massachusetts | Managing member, majority equity owner | 10,169,079 | 10,902,726 | 2.6 | % | |||||||||||||||||
| Greenbacker Wind Portfolio - Montana | 100% Ownership or Managing Member, Equity Owner | 24,756,684 | 26,451,773 | 6.2 | % | |||||||||||||||||
| Total Wind - 24.0% | $ | 90,618,874 | $ | 101,660,576 | 24.0 | % | ||||||||||||||||
| Pre-Operational Assets | ||||||||||||||||||||||
| Citrine Portfolio | 100% Ownership | $ | 3,411,249 | $ | 3,411,249 | 0.8 | % | |||||||||||||||
| Colorado CES Portfolio | 100% Ownership | 4,517,354 | 4,517,354 | 1.1 | % | |||||||||||||||||
| Electric City Portfolio | 100% Ownership | 4,208,484 | 4,208,484 | 1.0 | % | |||||||||||||||||
| Omni DG Portfolio | 100% Ownership | 17,900,298 | 17,900,298 | 4.2 | % | |||||||||||||||||
| Opal Portfolio | 100% Ownership | 344,949 | 344,949 | 0.1 | % | |||||||||||||||||
| Oregon Sun Portfolio | 100% Ownership | 5,404,787 | 5,404,787 | 1.3 | % | |||||||||||||||||
| Phoenix Solar Portfolio | 100% Ownership | 4,051,138 | 4,051,138 | 1.0 | % | |||||||||||||||||
| SE Solar 2019 Portfolio | 100% Ownership | 5,000,000 | 5,000,000 | 1.2 | % | |||||||||||||||||
| Trillium Portfolio | Managing member, majority equity owner | 24,277,396 | 24,277,396 | 5.7 | % | |||||||||||||||||
| Turquoise Solar Portfolio | 100% Ownership | 26,602,532 | 26,602,532 | 6.3 | % | |||||||||||||||||
| Total Pre-Operational Assets - 22.7% | $ | 95,718,187 | $ | 95,718,187 | 22.7 | % | ||||||||||||||||
| Other Investments | ||||||||||||||||||||||
| Other Portfolios | (c) | $ | 12,656,710 | $ | 12,473,975 | 2.9 | % | |||||||||||||||
| Total Other Investments - 2.9% | $ | 12,656,710 | $ | 12,473,975 | 2.9 | % | ||||||||||||||||
| Energy Efficiency in the United States | ||||||||||||||||||||||
| GREC Energy Efficiency Portfolio | 100% Ownership | $ | 388,044 | $ | 390,019 | 0.1 | % | |||||||||||||||
| Renew AEC One, LLC | 10.25 | %(b) | 2/24/2025 | $ | 551,640 | 479,140 | 479,140 | 0.1 | % | |||||||||||||
| Total Energy Efficiency - 0.2% | $ | 867,184 | $ | 869,159 | 0.2 | % | ||||||||||||||||
| Total Investments in controlled/affiliated Portfolios | $ |
415,905,982 |
$ | 452,072,181 | 106.7 | % | ||||||||||||||||
| Investments in non-controlled/non-affiliated portfolios | ||||||||||||||||||||||
| Secured Loans - Not readily marketable | ||||||||||||||||||||||
| Encore Loan | 10.00 | % | 10/11/2020 | $ | 5,000,680 | $ | 5,000,680 | $ | 5,000,680 | 1.2 | % | |||||||||||
| Hudson Loan | 8.00 | % | 3/31/2020 | 9,481,127 | 9,481,127 | 9,481,127 | 2.2 | % | ||||||||||||||
| New Market Loan | 9.00 | % | 10/3/2020 | 5,000,000 | 5,000,000 | 5,000,000 | 1.2 | % | ||||||||||||||
| SE Solar Loan | 9.00 | % | 2/21/2020 | 1,000,000 | 1,000,000 | 1,000,000 | 0.2 | % | ||||||||||||||
| TUUSSO Loan | 8.00 | % | 6/30/2020 | 2,621,883 | 2,621,883 | 2,621,883 | 0.6 | % | ||||||||||||||
| Total Secured Loans - Not readily marketable - 5.4% | $ | 23,103,690 | $ | 23,103,690 | 5.4 | % | ||||||||||||||||
| Total Investments in non-controlled/non-affiliated portfolios | $ | 23,103,690 | 23,103,690 | 5.4 | % | |||||||||||||||||
| TOTAL INVESTMENTS: 112.1% | $ | 439,009,672 | $ | 475,175,871 | 112.1 | % | ||||||||||||||||
| LIABILITIES IN EXCESS OF OTHER ASSETS OTHER THAN INVESTMENTS: -12.1% | (51,724,280 | ) | -12.1 | % | ||||||||||||||||||
| TOTAL NET ASSETS: 100% | $ | 423,451,591 | 100.0 | % | ||||||||||||||||||
| (a) | Percentages are based on net assets of $423,451,591 as of December 31, 2019. |
| (b) | Per the loan agreement, interest commenced on January 24, 2016. |
| (c) | Includes pre-acquisition and due diligence expenses. |
| (d) | Portfolio is located outside of the United States of America. |
Interest Rate Swaps
| Counterparty | Pay / Receive Floating Rate | Floating Rate Index | Fixed Pay Rate | Payment Frequency | Maturity Date | Notional Amount | Value | Upfront Premiums Paid (Received) | ||||||||||||||||
| Fifth Third Financial Risk Solutions | Receive | 1-MO-USD-LIBOR | 1.110 | % | Monthly | 7/9/2021 | 3,320,556 | $ | 21,223 | $ | - | |||||||||||||
| Fifth Third Financial Risk Solutions | Receive | 1-MO-USD-LIBOR | 2.261 | % | Monthly | 2/29/2032 | 18,981,540 | (611,198 | ) | - | ||||||||||||||
| Fifth Third Financial Risk Solutions | Receive | 1-MO-USD-LIBOR | 2.648 | % | Monthly | 12/31/2038 | 27,662,350 | (1,725,805 | ) | - | ||||||||||||||
| Fifth Third Financial Risk Solutions | Receive | 1-MO-USD-LIBOR | 2.965 | % | Monthly | 12/31/2038 | 3,946,615 | (359,271 | ) | - | ||||||||||||||
| Fifth Third Financial Risk Solutions | Receive | 1-MO-USD-LIBOR | 2.668 | % | Monthly | 12/31/2034 | 37,560,113 | (2,203,292 | ) | - | ||||||||||||||
| $ | (4,878,343 | ) | $ | - | ||||||||||||||||||||
The accompanying notes are an integral part of these consolidated financial statements.
F-7
GREENBACKER RENEWABLE ENERGY COMPANY LLC AND SUBSIDIARIES
CONSOLIDATED SCHEDULES OF INVESTMENTS
December 31, 2018
| Investments in controlled/affiliated portfolios | Interest | Maturity | Shares or Principal Amount | Cost | Fair Value | Percentage of Net Assets (a) | |||||||||||||
| Limited Liability Company Member Interests in the United States- Not readily marketable | |||||||||||||||||||
| Commercial Solar | |||||||||||||||||||
| East to West Solar Portfolio | 100% Ownership | $ | 37,079,887 | $ | 33,665,088 | 10.5 | % | ||||||||||||
| Foresight Solar Portfolio | Managing Member, Majority Equity Owner | 13,650,000 | 14,357,201 | 4.5 | % | ||||||||||||||
| Golden Horizons Solar Portfolio | 100% Ownership | 9,400,000 | 14,445,071 | 4.5 | % | ||||||||||||||
| Green Maple Portfolio | 100% Ownership | 17,582,823 | 16,066,837 | 5.0 | % | ||||||||||||||
| Magnolia Sun Portfolio | 100% Ownership | 10,775,000 | 8,258,786 | 2.6 | % | ||||||||||||||
| Midway III Solar Portfolio | 100% Ownership | 11,552,904 | 13,265,608 | 4.1 | % | ||||||||||||||
| Raleigh Portfolio | Managing Member, Majority Equity Owner | 20,822,198 | 21,358,997 | 6.7 | % | ||||||||||||||
| Six States Solar Portfolio | 100% Ownership | 12,470,306 | 13,440,025 | 4.2 | % | ||||||||||||||
| Sun Farm Portfolio | 100% Ownership | 10,514,960 | 11,606,877 | 3.6 | % | ||||||||||||||
| Sunny Mountain Portfolio | 100% Ownership | 884,578 | 1,107,041 | 0.3 | % | ||||||||||||||
| Total Commercial Solar - 46.0% | $ | 144,732,656 | $ | 147,571,531 | 46.0 | % | |||||||||||||
| Residential Solar | |||||||||||||||||||
| Canadian Northern Lights Portfolio (d) | 100% Ownership | $ | 1,603,136 | $ | 2,081,554 | 0.7 | % | ||||||||||||
| Enfinity Colorado DHA Portfolio | 100% Ownership | 1,400,000 | 1,700,728 | 0.5 | % | ||||||||||||||
| Greenbacker Residential Solar Portfolio | 100% Ownership or Managing Member, Majority Equity Owner | 28,100,000 | 27,372,253 | 8.6 | % | ||||||||||||||
| Greenbacker Residential Solar Portfolio II | Managing Member, Majority Equity Owner | 6,400,000 | 10,763,559 | 3.4 | % | ||||||||||||||
| Total Residential Solar - 13.2% | $ | 37,503,136 | $ | 41,918,094 | 13.2 | % | |||||||||||||
| Wind | |||||||||||||||||||
| Greenbacker Wind Portfolio - California | 100% Ownership or Managing Member, Equity Owner | $ | 9,500,000 | $ | 8,070,745 | 2.5 | % | ||||||||||||
| Greenbacker Wind Portfolio - Idaho | 100% Ownership or Managing Member, Equity Owner | 7,320,000 | 6,385,631 | 2.0 | % | ||||||||||||||
| Greenbacker Wind Portfolio - Montana | 100% Ownership or Managing Member, Equity Owner | 21,709,487 | 21,956,868 | 6.9 | % | ||||||||||||||
| Greenbacker Wind Portfolio - Vermont | 100% Ownership or Managing Member, Equity Owner | 24,917,193 | 28,752,500 | 9.0 | % | ||||||||||||||
| Total Wind - 20.4% | $ | 63,446,680 | $ | 65,165,744 | 20.4 | % | |||||||||||||
| Pre-Operational Assets | |||||||||||||||||||
| Colorado CSG Solar Portfolio | 100% Ownership | $ | 27,333,205 | $ | 27,215,170 | 8.5 | % | ||||||||||||
| Phoenix Solar Portfolio | 100% Ownership | 9,964,515 | 9,964,515 | 3.1 | % | ||||||||||||||
| SE Solar Portfolio | 100% Ownership | 7,178,207 | 7,178,207 | 2.2 | % | ||||||||||||||
| Turquoise Solar Portfolio | 100% Ownership | 5,877,188 | 5,877,188 | 1.8 | % | ||||||||||||||
| Total Pre-Operational Assets - 15.6% | $ | 50,353,115 | $ | 50,235,080 | 15.6 | % | |||||||||||||
| Other Investments | |||||||||||||||||||
| Other Portfolios | (c) | 1,279,273 | 1,263,620 | 0.4 | % | ||||||||||||||
| Total Other Investments - 0.4% | $ | 1,279,273 | $ | 1,263,620 | 0.4 | % | |||||||||||||
| Energy Efficiency in the United States | |||||||||||||||||||
| GREC Energy Efficiency Portfolio | 100% Ownership | $ | 447,885 | $ | 470,406 | 0.1 | % | ||||||||||||
| Renew AEC One, LLC | 10.25%(b) | 2/24/2025 | $ | 551,640 | 551,640 | 551,640 | 0.2 | % | |||||||||||
| Total Energy Efficiency - 0.3% | $ | 999,525 | $ | 1,022,046 | 0.3 | % | |||||||||||||
| INVESTMENTS: 95.9% | $ | 298,314,385 | $ | 307,176,115 | 95.9 | % | |||||||||||||
| ASSETS IN EXCESS OF OTHER LIABILITIES: 4.1% | 12,880,634 | 4.1 | % | ||||||||||||||||
| TOTAL NET ASSETS: 100.0% | $ | 320,056,749 | 100.0 | % | |||||||||||||||
| (a) | Percentages are based on net assets of $320,056,749 as of December 31, 2018. |
| (b) | Per the loan agreement, interest commenced on January 24, 2016. |
| (c) | Includes pre-acquisition and due diligence expenses. |
| (d) | Portfolio is located outside of the United States of America. |
Interest Rate Swaps
| Counterparty | Pay / Receive Floating Rate | Floating Rate Index | Fixed Pay Rate | Payment Frequency | Maturity Date | Notional Amount | Value | Upfront Premiums Paid (Received) | ||||||||||||||||
| Fifth Third Financial Risk Solutions | Receive | 1-MO-USD-LIBOR | 1.110 | % | Monthly | 7/9/2021 | 3,607,222 | $ | 107,431 | $ | - | |||||||||||||
| Fifth Third Financial Risk Solutions | Receive | 1-MO-USD-LIBOR | 2.261 | % | Monthly | 2/29/2032 | 20,668,547 | 328,172 | - | |||||||||||||||
| Fifth Third Financial Risk Solutions | Receive | 1-MO-USD-LIBOR | 2.648 | % | Monthly | 12/31/2038 | 29,624,945 | (190,440 | ) | - | ||||||||||||||
| Fifth Third Financial Risk Solutions | Receive | 1-MO-USD-LIBOR | 2.965 | % | Monthly | 12/31/2038 | 4,180,063 | (121,201 | ) | - | ||||||||||||||
| $ | 123,962 | $ | - | |||||||||||||||||||||
The accompanying notes are an integral part of these consolidated financial statements.
F-8
GREENBACKER RENEWABLE ENERGY COMPANY LLC AND SUBSIDIARIES
NOTES TO CONSOLIDATED FINANCIAL STATEMENTS
December 31, 2019
Note 1. Organization and Operations of the Company
Greenbacker Renewable Energy Company LLC (the “LLC”), a Delaware limited liability company, formed in December 2012, is an externally managed energy company that acquires and manages income-generating renewable energy and energy efficiency projects, and other energy-related businesses, as well as finances the construction and/or operation of these and sustainable development projects and businesses. The LLC conducts substantially all its operations through its wholly-owned subsidiary, Greenbacker Renewable Energy Corporation (“GREC”). GREC is a Maryland corporation formed in November 2011 and the LLC currently holds all the outstanding shares of capital stock of GREC. GREC Entity HoldCo LLC (“GREC HoldCo”), a wholly-owned subsidiary of GREC, was formed in Delaware in June 2016. The use of “we,” “us,” “our” and the “company” refers, collectively, to Greenbacker Renewable Energy Company LLC, Greenbacker Renewable Energy Corporation, and GREC HoldCo. We are externally managed and advised by our advisor, Greenbacker Capital Management LLC (the “advisor” or “GCM”), a renewable energy, energy efficiency and sustainability related project acquisition, consulting and development company that is registered as an investment adviser under the Investment Advisers Act of 1940, as amended (“Advisers Act”). The LLC’s fiscal year end is December 31.
Pursuant to an initial Registration Statement filed in December 2011 (File No. 333-178786-01) and a second Registration Statement filed in February 2017 (File No. 333-211571), the company offered up to $1,000,000,000 in shares of limited liability company interests, or the shares, including up to $200,000,000 of shares pursuant to the company’s Distribution Reinvestment Plan (the “DRP”). As of March 29, 2019, the company terminated its public offering of the shares as well as its privately offered Class P-A shares. While the company publicly offered three classes of shares: Class A, C and I, currently the company is only privately offering Class P-I shares on a continuous basis. The share classes had different selling commissions, dealer manager fees and there is an ongoing distribution fee with respect to Class C shares. The company has adopted the DRP pursuant to which a shareholder owning publicly offered share classes may elect to have the full amount of cash distributions reinvested in additional shares. Following the termination of the company’s public offering of shares, the DRP and the share repurchase plan will continue to be available to existing investors. As of June 4, 2019, pursuant to our Registration Statement on Form S-3 (File No. 333-231960) we are offering a maximum of $10,000,000 in shares of our common stock to our existing stockholders pursuant to the DRP.
Each quarter, our advisor, utilizing the services of an independent valuation firm, when necessary, reviews and approves the net asset value for each class of shares, subject to the oversight of the company’s board of directors. To the extent that the net asset value per share on the most recent valuation date increases or decreases, the company will adjust the offering price of the P-I shares to the then-net asset value per share. Five days after the publishing of each quarter-end valuation, Class A, C and I shares will be offered pursuant to the DRP at a price equal to the net asset value.
As of December 31, 2019, the company has made solar, wind, biomass, and energy efficiency investments in 36 portfolios, 35 domiciled in the United States and one in Canada, as well as six secured loans in the United States (See Note 3). As of December 31, 2018, the company has made solar, wind and energy efficiency investments in 26 portfolios, 25 domiciled in the United States and one in Canada, as well as one energy efficiency secured loan in the United States.
F-9
GREENBACKER RENEWABLE ENERGY COMPANY LLC AND SUBSIDIARIES
NOTES TO CONSOLIDATED FINANCIAL STATEMENTS
December 31, 2019
Note 2. Significant Accounting Policies
Basis of Presentation
The company’s consolidated financial statements are prepared in accordance with U.S. generally accepted accounting principles (“GAAP”), which requires the use of estimates, assumptions and the exercise of subjective judgment as to future uncertainties. Actual results could differ from those estimates, assumptions, and judgments. Significant items subject to such estimates will include determining the fair value of investments, revenue recognition, income tax uncertainties, and other contingencies. The consolidated financial statements of the company include the accounts of the LLC and its consolidated subsidiaries, GREC, GREC HoldCo, and Danforth Shared Services LLC which provides administrative services to the company. All intercompany accounts and transactions have been eliminated.
The company’s consolidated financial statements are prepared using the specialized accounting principles of Accounting Standards Codification Topic 946, Financial Services—Investment Companies (“ASC Topic 946”). In accordance with this specialized accounting guidance, the company recognizes and carries all of its investments at fair value with changes in fair value recognized in earnings. Additionally, the company will not apply the equity method of accounting to its investments. The company carries its liabilities at amounts payable, net of unamortized premiums or discounts. The company does not currently plan to elect to carry its non-investment liabilities at fair value. Net assets are calculated as the carrying amounts of assets, including the fair value of investments, less the carrying amounts of its liabilities.
The financial information associated with the December 31, 2019 consolidated financial statements has been prepared by management and, in the opinion of management, contains all adjustments and eliminations necessary for a fair presentation in accordance with GAAP.
Basis of Consolidation
As provided under Regulation S-X and ASC Topic 946, the company will generally not consolidate its investment in a company other than a wholly-owned investment company or controlled operating company whose business consists of providing services to the company. Accordingly, the company consolidated the accounts of the company’s wholly-owned subsidiaries to meet the aforementioned criteria in its consolidated financial statements.
Cash and Cash Equivalents
Cash consists of demand deposits at a financial institution. Such deposits may be in excess of the Federal Deposit Insurance Corporation insurance limits. The company has not experienced any losses in any such accounts.
The company considers all highly liquid investments purchased with an original maturity of three months or less to be cash equivalents. Short-term investments that are cash equivalents, which are considered level 1 investments, are stated at cost, which approximates fair value.
Restricted Cash
Restricted cash consists of cash accounts or letters of credit that are restricted for use on specific investments. As of December 31,2019, we have one restricted cash account that serves as collateral for a letter of credit related to funding of a specific “to be constructed” investment.
Foreign Currency Translation
The accounting records of the company are maintained in U.S. Dollars. The fair value of investments and other assets and liabilities denominated in non-U.S. currencies are translated into U.S. Dollars using the exchange rate at the end of each reporting period. Amounts related to the purchases and sales of investments, investment income and expenses are translated at the rates of exchange prevailing on the respective dates of such transactions.
Net unrealized currency gains and losses arising from valuing foreign currency denominated assets and liabilities at the current exchange rate are reflected as part of net change in unrealized appreciation (depreciation) on translation of assets and liabilities denominated in foreign currencies in the consolidated statements of operations.
Foreign security and currency translations may involve certain considerations and risks not typically associated with investing in U.S. companies and U.S. government securities. These risks include, but are not limited to, currency fluctuations and revaluations and future adverse political, social and economic developments, which could cause investments in foreign markets to be less liquid and prices more volatile than those of comparable U.S. companies or U.S. government securities.
F-10
GREENBACKER RENEWABLE ENERGY COMPANY LLC AND SUBSIDIARIES
NOTES TO CONSOLIDATED FINANCIAL STATEMENTS
December 31, 2019
Note 2. Significant Accounting Policies (cont.)
Valuation of Investments at Fair Value
Accounting Standards Codification Topic 820, Fair Value Measurement (“ASC Topic 820”) defines fair value, establishes a framework for measuring fair value in accordance with GAAP and expands disclosures about fair value. The company recognizes and accounts for its investments at fair value. The fair value of the investments does not reflect transaction costs that may be incurred upon disposition of the investments.
Fair value is defined as the price that would be received to sell an asset or paid to transfer a liability in an orderly transaction between market participants. Fair value is an exchange price notion under which fair value is the price in an orderly transaction between market participants to sell an asset or transfer a liability in the market in which the reporting entity would transact for the asset or liability.
The advisor has established procedures to estimate the fair value of its investments which the company’s board of directors has reviewed and approved. The company will use observable market data to estimate the fair value of investments to the extent that such market data is available. In the absence of quoted market prices in active markets, or quoted market prices for similar assets in markets that are not active, the company will use the valuation methodologies described below with unobservable data based on the best available information in the circumstances, which incorporates the company’s assumptions about the factors that a market participant would use to value the asset.
For investments for which quoted market prices are not available, which will comprise most of our investment portfolio, fair value will be estimated by using the income or market approach. The income approach assumes that value is created by the expectation of future benefits discounted to a current value and the fair value estimate is the amount an investor would be willing to pay to receive those future benefits. The market approach compares recent comparable transactions to the investment or an offer to purchase an investment based upon a firm bid, a signed term sheet and/or a signed purchase agreement. Adjustments are made to account for the probability of the deal closing and any dissimilarity between the comparable transactions and the investments. Pre-operational assets are held at cost until they are operational. Therefore, the fair value associated with these assets are essentially cost. These valuation methodologies involve a significant degree of judgment on the part of our advisor.
In determining the appropriate fair value of an investment using these approaches, the most significant information and assumptions include, as applicable: available current market data, including relevant and applicable comparable market transactions, applicable market yields and multiples, security covenants, call protection provisions, information rights, the nature and realizable value of any collateral, the investment’s ability to make payments, its earnings and discounted cash flows, the markets in which the project does business, comparisons of financial ratios of peer companies that are public, comparable mergers and acquisitions, the principal market and enterprise values, environmental factors, among other factors.
The estimated fair values will not necessarily represent the amounts that may be ultimately realized due to the occurrence or non-occurrence of future circumstances that cannot be reasonably determined. Because of the inherent uncertainty of the valuation of the investments, the estimate of fair values may differ significantly from the value that would have been used had a broader market for the investments existed.
The authoritative accounting guidance prioritizes the use of market-based inputs over entity-specific inputs and establishes a three-level hierarchy for fair value measurements based upon the transparency of inputs to the valuation. The three levels of valuation hierarchy are defined as follows:
| Level 1: | Unadjusted quoted prices for identical assets or liabilities in active markets. |
| Level 2: | Other significant observable inputs that are sourced either directly or indirectly from publications or pricing services, including dealer or broker markets, for identical or comparable assets or liabilities. Generally, these inputs should be widely accepted and public, non-proprietary and sourced from an independent third party. |
| Level 3: | Inputs derived from a significant amount of unobservable market data and derived primarily through the use of internal valuation methodologies |
F-11
GREENBACKER RENEWABLE ENERGY COMPANY LLC AND SUBSIDIARIES
NOTES TO CONSOLIDATED FINANCIAL STATEMENTS
December 31, 2019
Note 2. Significant Accounting Policies (cont.)
In all cases, the level in the fair value hierarchy within which the fair value measurement in its entirety falls will be determined based on the lowest level of input that is significant to the fair value measurement. Our assessment of the significance of an input to the fair value measurement in its entirety requires judgment and considers factors specific to each investment.
Calculation of Net Asset Value
Net asset value by share class is calculated by subtracting total liabilities for each class from the total carrying amount of all assets for that class, which includes the fair value of investments. Net asset value per share is calculated by dividing net asset value for each class by the total number of outstanding common shares for that class on the reporting date.
Earnings (Loss) per Share
In accordance with the provisions of ASC Topic 260 — Earnings per Share (“ASC Topic 260”), basic earnings per share is computed by dividing earnings available to common members by the weighted average number of shares outstanding during the period. Other potentially dilutive common shares, and the related impact to earnings, are considered when calculating earnings per share on a diluted basis.
The following information sets forth the computation of the weighted average basic and diluted net increase in net assets attributed to common members per share for the years ended December 31, 2019, 2018 and 2017.
| For the year ended December 31, 2019 | For the year ended December 31, 2018 | For the year ended December 31, 2017 | ||||||||||
| Basic and diluted | ||||||||||||
| Net increase in net assets resulting from operations attributed to common members | $ | 29,297,441 | $ | 13,314,380 | $ | 11,330,663 | ||||||
| Weighted average common shares outstanding | 43,788,187 | 29,799,735 | 18,922,343 | |||||||||
| Net increase in net assets resulting from operations attributed to common members per share | $ | 0.67 | $ | 0.45 | $ | 0.60 | ||||||
Revenue Recognition
To the extent the company expects to collect such amounts, interest income is recorded on an accrual basis. If there is reason to doubt an ability to collect such interest, interest receivable on loans and debt securities is not accrued for accounting purposes. Original issue discounts, market discounts or market premiums are accreted or amortized using the effective interest method as interest income. Prepayment premiums on loans and debt securities are recorded as interest income when received. Any application, origination or other fees earned by the company in arranging or issuing debt are amortized over the expected term of the loan.
Loans are placed on non-accrual status when principal and interest are 90 days or more past due, or when there is a reasonable doubt that principal or interest will be collected. Accrued interest is generally reversed when a loan is placed on non-accrual. Interest payments received on non-accrual loans may be recognized as income or applied to principal depending upon management’s judgment regarding collectability. Non-accrual loans are generally restored to accrual status when past due and principal and interest is paid and, in management’s judgment, is likely to remain current.
Dividend income is recorded (1) on the ex-dividend date for publicly issued securities and (2) on the ex-dividend date for private investments. The timing and amount of dividend income is determined on at least a quarterly basis by GREC. This process includes an analysis at the individual project company level based on cash available from operations and working capital needed for the project company operations. Dividend income from our privately held, equity investments are recognized when approved. Dividends received from the company’s project companies, which generally reflect net cash flow from operations, are declared, accrued and paid on a quarterly basis at a minimum.
F-12
GREENBACKER RENEWABLE ENERGY COMPANY LLC AND SUBSIDIARIES
NOTES TO CONSOLIDATED FINANCIAL STATEMENTS
December 31, 2019
Note 2. Significant Accounting Policies (cont.)
Net Realized Gains or Losses and Net Change in Unrealized Appreciation or Depreciation on Investments
Realized gains or losses will be measured as the difference between the net proceeds from the sale, repayment, or disposal of an asset and the adjusted cost basis of the asset, without regard to unrealized appreciation or depreciation previously recognized. Net change in unrealized appreciation or depreciation will reflect the change in investment values during the reporting period, including any reversal of previously recorded unrealized appreciation or depreciation, when gains or losses are realized.
Payment-in-Kind Interest
For loans and debt securities with contractual payment-in-kind interest, if the fair value of the investment indicates that such interest is collectible, any interest will be added to the principal balance of such investments and be recorded as income.
Distribution Policy
Distributions to members, if any, will be authorized and declared by our board of directors quarterly in advance and paid monthly. From time to time, we may also pay interim special distributions in the form of cash or shares, with the approval of our board of directors. Distributions will be made on all classes of shares at the same time. The cash distributions with respect to the Class C shares will be lower than the cash distributions with respect to the company’s other share classes because of the distribution fee associated with the Class C shares, which is allocated specifically to Class C net assets. Amounts distributed to each class are allocated amongst the holders of the shares in such class in proportion to their shares. Distributions declared by our board of directors are recognized as distribution liabilities on the ex-dividend date.
Organization and Offering Costs
Organization and offering costs (“O&O costs”), other than sales commissions and the dealer manager fee, were initially paid by our advisor and/or dealer manager on behalf of the company. These O&O costs included all costs previously paid or to be paid by the company in connection with its formation and the offering of its shares pursuant to now-terminated Registration Statements on Form S-1 (File No. 333-178786-01 and File No. 333-211571, respectively) and a private placement memorandum, including legal, accounting, printing, mailing and filing fees, charges of the company’s escrow holder, transfer agent fees, due diligence expense reimbursements to participating broker-dealers included in detailed and itemized invoices and costs in connection with administrative oversight of the offering and marketing process, and preparing supplemental sales materials, holding educational conferences, and attending retail seminars conducted by broker-dealers.
The company was obligated to reimburse our advisor for O&O costs that it incurred on behalf of the company, in accordance with the advisory agreement, but with respect to the company’s public offerings, only to the extent that the reimbursement would not cause the selling commissions, the dealer manager fee and the other organization and offering expenses borne by the company to exceed 15% of gross offering proceeds as of the date of reimbursement. Total O&O costs related to the terminated Registration Statements amounted to $9.4 million, approximately 3.8% of gross offering proceeds raised pursuant to such Registration Statements.
The costs incurred by our advisor and/or dealer manager are recognized as a liability of the company to the extent that the company is obligated to reimburse our advisor and/or dealer manager, subject to the 15% of gross offering proceeds limitation described above. When recognized by the company, organizational costs are expensed and offering costs, excluding selling commissions and dealer manager fees, are recognized as a reduction of the proceeds from the offering.
F-13
GREENBACKER RENEWABLE ENERGY COMPANY LLC AND SUBSIDIARIES
NOTES TO CONSOLIDATED FINANCIAL STATEMENTS
December 31, 2019
Note 2. Significant Accounting Policies (cont.)
The following table provides information in regard to the status of O&O costs (in 000’s) as of December 31, 2019 and 2018:
| December
31, 2019 | December
31, 2018 | |||||||
| Total O&O Costs Incurred by the Advisor and Dealer Manager | $ | 9,822 | $ | 9,371 | ||||
| Amounts previously reimbursed to the Advisor/Dealer Manager by the company | 9,822 | 9,106 | ||||||
| Amounts payable to Advisor by the company | - | 19 | ||||||
| Amounts of the contingent liability subject to payment by the company only upon adequate gross offering proceeds being raised | - | 246 | ||||||
Financing Costs
Financing costs related to debt liabilities incurred by the company, GREC or any wholly-owned holding company formed specifically to be a credit agreement counterparty are presented on the consolidated statements of assets and liabilities as a direct deduction from the carrying amount of that debt liability. Financing costs are deferred and amortized using the straight-line method over the life of the debt liability.
Capital Gains Incentive Allocation and Distribution
Pursuant to the terms of the LLC’s amended and restated limited liability company agreement, a capital gains incentive fee will be earned by an affiliate of our advisor on realized gains (net of realized and unrealized losses) since inception from the sale of investments from the company’s portfolio during operations prior to a liquidation of the company. While the terms of the advisory agreement neither include nor contemplate the inclusion of unrealized gains in the calculation of the capital gains incentive fee, the company will include unrealized gains in the calculation of the capital gains incentive distribution pursuant to an interpretation of an American Institute for Certified Public Accountants Technical Practice Aid for investment companies. This amount reflects the incentive distribution that would be payable if the company’s entire portfolio was liquidated at its fair value as of the consolidated statements of assets and liabilities date even though the advisor is not entitled to an incentive distribution with respect to unrealized gains unless and until such gains are realized. Thus, on each date that net asset value is calculated, the company calculates for the capital gains incentive distribution by calculating such distribution as if it were due and payable as of the end of such period and reflected as an allocation of equity between common members and the Special Unitholder. As of December 31, 2019, and 2018, a capital gains incentive distribution allocation in the amounts of $6,897,808 and $1,797,138, respectively, was recorded in the consolidated statements of assets and liabilities as Special unitholder’s equity.
Deferred Sales Commissions
The company defers certain costs, principally sales commissions and related compensation, which are paid to the dealer manager and may be reallowed to financial advisors and broker/dealers in the future in connection with the sale of Class C shares sold with a reduced front-end load sales charge. The costs expected to be incurred at the time of the sale of Class C shares are recorded as a liability on the date of sale and are amortized on a straight-line basis over the period beginning at the time of sale and ending on the date which approximates an expected liquidity event for the company. As of December 31, 2019, and December 31, 2018, the company recorded a liability for deferred sales commissions in the amount of $56,483 and $191,706, respectively.
Reclassifications
Certain prior year amounts have been reclassified to conform with current year presentation. These reclassifications had no impact on prior periods’ results.
Derivative Instruments
The company may utilize interest rate swaps to modify interest rate characteristics of existing debt obligations to manage interest rate exposure. These are recorded at fair value either as assets or liabilities in the accompanying consolidated statements of assets and liabilities with changes in the fair value of interest rate swaps during the period recognized as either an unrealized appreciation or depreciation in the accompanying consolidated statements of operations. On the expiration, termination or settlement of a derivatives contract, the company generally records a gain or loss. When there is a master netting agreement with a financial institution, any gain or loss on interest rate swaps are netted for financial statement presentation.
F-14
GREENBACKER RENEWABLE ENERGY COMPANY LLC AND SUBSIDIARIES
NOTES TO CONSOLIDATED FINANCIAL STATEMENTS
December 31, 2019
Note 2. Significant Accounting Policies (cont.)
The fair value of interest rate swap contracts open as of December 31, 2019 is included on the schedule of investments by contract. For the year ended December 31, 2019, the company’s average monthly notional exposure to interest rate swap contracts was $93,920,446.
Consolidated Statements of Assets and Liabilities — Fair Values of Derivatives at December 31, 2019
| Asset Derivatives | Liability Derivatives | |||||||||||
| Risk Exposure | Consolidated Statement of Assets and Liabilities Location | Fair Value | Consolidated Statement of Assets and Liabilities Location | Fair Value | ||||||||
| Swaps | ||||||||||||
| Interest Rate Risk | Swap contracts, at fair value | $ | 21,223 | Swap contracts, at fair value | $ | 4,899,566 | ||||||
| $ | 21,223 | $ | 4,899,566 | |||||||||
Consolidated Statements of Assets and Liabilities — Fair Values of Derivatives at December 31, 2018.
| Asset Derivatives | Liability Derivatives | |||||||||||
| Risk Exposure | Consolidated Statement of Assets and Liabilities Location | Fair Value | Consolidated Statement of Assets and Liabilities Location | Fair Value | ||||||||
| Swaps | ||||||||||||
| Interest Rate Risk | Swap contracts, at fair value | $ | 435,603 | Swap contracts, at fair value | $ | 311,641 | ||||||
| $ | 435,603 | $ | 311,641 | |||||||||
The effect of derivative instruments on the Consolidated Statements of Operations
| Risk Exposure | Change
in net unrealized depreciation on derivative transactions for the year ended December 31, 2019 | Change
in net unrealized depreciation on derivative transactions for the year ended December 31, 2018 | Change
in net unrealized appreciation on derivative transactions for the year ended December 31, 2017 | |||||||||
| Swaps | ||||||||||||
| Interest Rate Risk | $ | (5,002,305 | ) | $ | (32,106 | ) | $ | 65,371 | ||||
| $ | (5,002,305 | ) | $ | (32,106 | ) | $ | 65,371 | |||||
| Risk Exposure | Investment
interest income from non-controlled, non-affiliated investments for the year ended December 31, 2019 | Investment
interest income from non-controlled, non-affiliated investments for the year ended December 31, 2018 | Investment
interest income from non-controlled, non-affiliated investments for the year ended December 31, 2017 | |||||||||
| Swaps | ||||||||||||
| Interest Rate Risk | $ | - | $ | 189,178 | $ | - | ||||||
| $ | - | $ | 189,178 | $ | - | |||||||
| Risk Exposure | Other
expenses for the year ended December 31, 2019 | Other
expenses for the year ended December 31, 2018 | Other
expenses for the year ended December 31, 2017 | |||||||||
| Swaps | ||||||||||||
| Interest Rate Risk | $ | 229,731 | $ | - | $ | 111,831 | ||||||
| $ | 229,731 | $ | - | $ | 111,831 | |||||||
F-15
GREENBACKER RENEWABLE ENERGY COMPANY LLC AND SUBSIDIARIES
NOTES TO CONSOLIDATED FINANCIAL STATEMENTS
December 31, 2019
Note 2. Significant Accounting Policies (cont.)
By using derivative instruments, the company is exposed to the counterparty’s credit risk — the risk that derivative counterparties may not perform in accordance with the contractual provisions offset by the value of any collateral received. The company’s exposure to credit risk associated with counterparty non-performance is limited to collateral posted and the unrealized gains inherent in such transactions that are recognized in the consolidated statement of assets and liabilities. The company minimizes counterparty credit risk through credit monitoring procedures and managing margin and collateral requirements, as appropriate.
Regarding our investment in the Canadian Northern Lights Portfolio, we have foreign currency risk related to our revenue and operating expenses which are denominated in the Canadian Dollars as opposed to the U.S. Dollars.
Income Taxes
The LLC intends to operate so that it will qualify to be treated as a partnership for U.S. federal income tax purposes under the Internal Revenue Code. As such, it will not be subject to any U.S. federal and state income taxes. In any year, it is possible that the LLC will not meet the qualifying income exception and will not qualify to be treated as a partnership. If the LLC does not meet the qualifying income exception, the members would then be treated as stockholders in a corporation and the company would become taxable as a corporation for U.S. federal income tax purposes under the Internal Revenue Code. The LLC would be required to pay income tax at corporate rates on its net taxable income. Distributions to members from the LLC would constitute dividend income taxable to such members, to the extent of the company’s earnings and profits and the payment of the distributions would not be deductible by the LLC.
The LLC plans to conduct substantially all its operations through its wholly-owned subsidiary, GREC, which is a corporation that is subject to U.S. federal, state and local income taxes. Accordingly, most of its operations will be subject to U.S. federal, state and local income taxes.
Income taxes are accounted for under the assets and liabilities method. Deferred tax assets and liabilities are recorded for the estimated future tax consequences attributable to differences between items that are recognized in the consolidated financial statements and tax returns in different years. Deferred tax assets and liabilities are measured using enacted tax rates expected to apply to taxable income in the years in which those temporary differences are expected to be recovered or settled. The effect on deferred tax assets and liabilities of a change in tax rates is recognized in income in the period that includes the enactment date. For income tax benefits to be recognized including uncertain tax benefits, a tax position must be more-likely-than-not to be sustained upon examination by taxing authorities. The amount recognized is measured as the largest amount of the benefit that is more likely than not to be realized upon ultimate settlement. A valuation allowance is established against net deferred tax assets if, based on the weight of available evidence, it is more likely than not that some or all of the net deferred tax assets will not be realized. Changes in recognition or measurement are reflected in the period in which the change in judgment occurs. Interest and penalties associated with income taxes, if any, will be recognized in general and administrative expense.
The company does not consolidate its investments for financial statements, rather it accounts for its investments at fair value under the specialized accounting of ASC Topic 946. The tax attributes of the individual investments will be considered and incorporated in the company’s fair value estimates for those investments. The amounts recognized in the consolidated financial statements for unrealized appreciation and depreciation will result in a difference between the consolidated financial statements and the cost basis of the assets for tax purposes. These differences will be recognized as deferred tax assets and liabilities. Generally, the entities that hold the company’s investments will be included in the consolidated tax return of GREC and the differences between the amounts recognized for financial statement purposes and the tax return will be recognized as additional deferred tax assets and liabilities.
The company follows the authoritative guidance on accounting for uncertainty in income taxes and concluded it has no material uncertain tax positions to be recognized at this time.
The company assessed its tax positions for all open tax years as of December 31, 2019 for all U.S. federal and state tax jurisdictions for the years 2015 through 2019. The results of this assessment are included in the company’s tax provision and deferred tax assets as of December 31, 2019.
Recently Issued Accounting Pronouncements
In August 2018, the FASB issued ASU No. 2018-13, “Fair Value Measurement (Topic 820): Disclosure Framework—Changes to the Disclosure Requirements for Fair Value Measurement”, which modifies the disclosure requirements on fair value measurements. The new guidance is effective for fiscal years, and interim periods within those fiscal years, beginning after December 15, 2019 (fiscal 2020 for the company). Upon the effective date, certain provisions are to be applied prospectively, while others are to be applied retrospectively to all periods presented. An entity is permitted to early adopt any removed or modified disclosures upon issuance of this ASU and delay adoption of the additional disclosures until their effective date. We are currently evaluating the impact of ASU 2018-03 on our consolidated financial statements and disclosures, but do not expect a material impact on our consolidated financial statements and disclosures.
F-16
GREENBACKER RENEWABLE ENERGY COMPANY LLC AND SUBSIDIARIES
NOTES TO CONSOLIDATED FINANCIAL STATEMENTS
December 31, 2019
Note 3. Investments
The composition of the company’s investments as of December 31, 2019, at fair value, were as follows:
| Investments at Cost | Investments at Fair Value | Fair Value Percentage of Total Portfolio | ||||||||||
| Biomass: | ||||||||||||
| Eagle Valley Biomass Portfolio | $ | 21,425,600 | $ | 21,425,600 | 4.5 | % | ||||||
| Subtotal | $ | 21,425,600 | $ | 21,425,600 | 4.5 | % | ||||||
| Commercial Solar: | ||||||||||||
| Conic Portfolio | $ | 12,077,823 | $ | 17,828,206 | 3.8 | % | ||||||
| East to West Solar Portfolio | 39,109,190 | 41,214,191 | 8.7 | |||||||||
| Foresight Solar Portfolio | 13,790,000 | 14,965,339 | 3.1 | |||||||||
| Golden Horizons Solar Portfolio | 9,290,000 | 15,132,017 | 3.2 | |||||||||
| Green Maple Portfolio | 26,561,596 | 27,268,058 | 5.7 | |||||||||
| Longleaf Portfolio | 22,797,404 | 24,605,536 | 5.2 | |||||||||
| Magnolia Sun Portfolio | 10,775,000 | 6,460,457 | 1.4 | |||||||||
| Midway III Solar Portfolio | 10,575,394 | 11,475,652 | 2.4 | |||||||||
| Six States Solar Portfolio | 12,655,306 | 12,799,005 | 2.6 | |||||||||
| Sunny Mountain Portfolio | 884,578 | 743,768 | 0.2 | |||||||||
| Subtotal | $ | 158,516,291 | $ | 172,492,229 | 36.3 | % | ||||||
| Residential Solar: | ||||||||||||
| Canadian Northern Lights Portfolio | $ | 1,603,136 | $ | 1,611,955 | 0.3 | % | ||||||
| Greenbacker Residential Solar Portfolio | 28,100,000 | 32,540,979 | 6.9 | |||||||||
| Greenbacker Residential Solar Portfolio II | 6,400,000 | 13,279,521 | 2.8 | |||||||||
| Subtotal | $ | 36,103,136 | $ | 47,432,455 | 10.0 | % | ||||||
| Wind: | ||||||||||||
| Greenbacker Wind Portfolio – California | $ | 9,500,000 | $ | 8,777,056 | 1.8 | % | ||||||
| Greenbacker Wind Portfolio - HoldCo | 25,753,111 | 35,089,021 | 7.4 | |||||||||
| Greenbacker Wind Portfolio - Iowa | 20,440,000 | 20,440,000 | 4.3 | |||||||||
| Greenbacker Wind Portfolio - Massachusetts | 10,169,079 | 10,902,726 | 2.3 | |||||||||
| Greenbacker Wind Portfolio - Montana | 24,756,684 | 26,451,773 | 5.6 | |||||||||
| Subtotal | $ | 90,618,874 | $ | 101,660,576 | 21.4 | % | ||||||
| Pre-Operational Assets: | ||||||||||||
| Citrine Solar Portfolio | $ | 3,411,249 | $ | 3,411,249 | 0.7 | % | ||||||
| Colorado CES Portfolio | 4,517,354 | 4,517,354 | 1.0 | |||||||||
| Electric City Portfolio | 4,208,484 | 4,208,484 | 0.9 | |||||||||
| Omni Portfolio | 17,900,298 | 17,900,298 | 3.8 | |||||||||
| Opal Portfolio | 344,949 | 344,949 | 0.1 | |||||||||
| Oregon Sun Portfolio | 5,404,787 | 5,404,787 | 1.1 | |||||||||
| Phoenix Solar Portfolio | 4,051,138 | 4,051,138 | 0.8 | |||||||||
| SE Solar Portfolio | 5,000,000 | 5,000,000 | 1.1 | |||||||||
| Trillium Portfolio | 24,277,396 | 24,277,396 | 5.0 | |||||||||
| Turquoise Solar Portfolio | 26,602,532 | 26,602,532 | 5.6 | |||||||||
| Subtotal | $ | 95,718,187 | $ | 95,718,187 | 20.1 | % | ||||||
| Other Investments: | ||||||||||||
| Other Portfolios | $ | 12,656,710 | $ | 12,473,975 | 2.6 | % | ||||||
| Subtotal | $ | 12,656,710 | $ | 12,473,975 | 2.6 | % | ||||||
| Energy Efficiency: | ||||||||||||
| GREC Energy Efficiency Portfolio | $ | 388,044 | $ | 390,019 | 0.1 | % | ||||||
| Renew AEC One, LLC | 479,140 | 479,140 | 0.1 | |||||||||
| Subtotal | $ | 867,184 | $ | 869,159 | 0.2 | % | ||||||
| Secured Loans | ||||||||||||
| Encore Loan | $ | 5,000,680 | $ | 5,000,680 | 1.1 | % | ||||||
| Hudson Loan | 9,481,127 | 9,481,127 | 2.0 | |||||||||
| New Market Loan | 5,000,000 | 5,000,000 | 1.1 | |||||||||
| SE Solar Loan | 1,000,000 | 1,000,000 | 0.2 | |||||||||
| TUUSSO Loan | 2,621,883 | 2,621,883 | 0.5 | |||||||||
| Subtotal | $ | 23,103,690 | $ | 23,103,690 | 4.9 | % | ||||||
| Total | $ | 439,009,672 | $ | 475,175,871 | 100.0 | % | ||||||
F-17
GREENBACKER RENEWABLE ENERGY COMPANY LLC AND SUBSIDIARIES
NOTES TO CONSOLIDATED FINANCIAL STATEMENTS
December 31, 2019
Note 3. Investments (cont.)
The composition of the company’s investments as of December 31, 2018, at fair value, were as follows:
| Investments at Cost | Investments at Fair Value | Fair Value Percentage of Total Portfolio | ||||||||||
| Commercial Solar: | ||||||||||||
| East to West Solar Portfolio | $ | 37,079,887 | $ | 33,665,088 | 10.9 | % | ||||||
| Foresight Solar Portfolio | 13,650,000 | 14,357,201 | 4.7 | |||||||||
| Golden Horizons Solar Portfolio | 9,400,000 | 14,445,071 | 4.7 | |||||||||
| Green Maple Portfolio | 17,582,823 | 16,066,837 | 5.2 | |||||||||
| Magnolia Sun Portfolio | 10,775,000 | 8,258,786 | 2.7 | |||||||||
| Midway III Solar Portfolio | 11,552,904 | 13,265,608 | 4.3 | |||||||||
| Raleigh Portfolio | 20,822,198 | 21,358,997 | 7.0 | |||||||||
| Six States Solar Portfolio | 12,470,306 | 13,440,025 | 4.4 | |||||||||
| Sun Farm Portfolio | 10,514,960 | 11,606,877 | 3.8 | |||||||||
| Sunny Mountain Portfolio | 884,578 | 1,107,041 | 0.4 | |||||||||
| Subtotal | $ | 144,732,656 | $ | 147,571,531 | 48.1 | % | ||||||
| Residential Solar: | ||||||||||||
| Canadian Mountain Portfolio | $ | 1,603,136 | $ | 2,081,554 | 0.6 | % | ||||||
| Enfinity Colorado DHA Portfolio | 1,400,000 | 1,700,728 | 0.6 | |||||||||
| Greenbacker Residential Solar Portfolio | 28,100,000 | 27,372,253 | 8.9 | |||||||||
| Greenbacker Residential Solar Portfolio II | 6,400,000 | 10,763,559 | 3.5 | |||||||||
| Subtotal | $ | 37,503,136 | $ | 41,918,094 | 13.6 | % | ||||||
| Wind: | ||||||||||||
| Greenbacker Wind Portfolio - California | $ | 9,500,000 | $ | 8,070,745 | 2.6 | % | ||||||
| Greenbacker Wind Portfolio - Idaho | 7,320,000 | 6,385,631 | 2.1 | |||||||||
| Greenbacker Wind Portfolio - Montana | 21,709,487 | 21,956,868 | 7.1 | |||||||||
| Greenbacker Wind Portfolio - Vermont | 24,917,193 | 28,752,500 | 9.4 | |||||||||
| Subtotal | $ | 63,446,680 | $ | 65,165,744 | 21.2 | % | ||||||
| Pre-Operational Assets: | ||||||||||||
| Colorado CSG Solar Portfolio | $ | 27,333,205 | $ | 27,215,170 | 8.9 | % | ||||||
| Phoenix Solar Portfolio | 9,964,515 | 9,964,515 | 3.2 | |||||||||
| SE Solar Portfolio | 7,178,207 | 7,178,207 | 2.3 | |||||||||
| Turquoise Solar Portfolio | 5,877,188 | 5,877,188 | 1.9 | |||||||||
| Subtotal | $ | 50,353,115 | $ | 50,235,080 | 16.3 | % | ||||||
| Other Investments: | $ | 1,279,273 | $ | 1,263,620 | 0.4 | % | ||||||
| Energy Efficiency: | ||||||||||||
| GREC Energy Efficiency Portfolio | $ | 447,885 | $ | 470,406 | 0.2 | % | ||||||
| Renew AEC One, LLC | 551,640 | 551,640 | 0.2 | |||||||||
| Subtotal | $ | 999,525 | $ | 1,022,046 | 0.4 | % | ||||||
| Total | $ | 298,314,385 | $ | 307,176,115 | 100.0 | % | ||||||
F-18
GREENBACKER RENEWABLE ENERGY COMPANY LLC AND SUBSIDIARIES
NOTES TO CONSOLIDATED FINANCIAL STATEMENTS
December 31, 2019
Note 3. Investments (cont.)
The counterparty to all the energy efficiency investments held by the company as of December 31, 2019 and December 31, 2018 is a related party (See Note 5).
| Investments at Cost |
Investments at Fair Value |
Fair Value Percentage of Total Portfolio |
||||||||||
| United States: | ||||||||||||
| East Region | $ | 123,146,232 | $ | 130,572,650 | 27.4 | % | ||||||
| Mid-West Region | 49,208,021 | 55,455,982 | 11.7 | % | ||||||||
| Mountain Region | 79,975,330 | 87,711,362 | 18.5 | % | ||||||||
| South Region | 91,932,394 | 93,441,062 | 19.7 | % | ||||||||
| West Region | 92,944,559 | 106,382,860 | 22.4 | % | ||||||||
| Total United States: | $ | 437,406,536 | $ | 473,563,916 | 99.7 | % | ||||||
| Canada: | 1,603,136 | 1,611,955 | 0.3 | % | ||||||||
| Total | $ | 439,009,672 | $ | 475,175,871 | 100.0 | % | ||||||
The composition of the company’s investments as of December 31, 2018 by geographic region, at fair value, were as follows:
| Investments
at Cost | Investments
at Fair Value | Fair
Value Percentage of Total Portfolio | ||||||||||
| United States: | ||||||||||||
| East Region | $ | 65,082,005 | $ | 67,541,264 | 22.0 | % | ||||||
| Mid-West Region | 1,796,801 | 1,846,346 | 0.6 | |||||||||
| Mountain Region | 69,619,383 | 69,553,178 | 22.6 | |||||||||
| South Region | 98,476,770 | 95,332,608 | 31.0 | |||||||||
| West Region | 61,736,290 | 70,821,165 | 23.1 | |||||||||
| Total United States | $ | 296,711,249 | $ | 305,094,561 | 99.3 | % | ||||||
| Canada: | 1,603,136 | 2,081,554 | 0.7 | |||||||||
| Total | $ | 298,314,385 | $ | 307,176,115 | 100.0 | % | ||||||
F-19
GREENBACKER RENEWABLE ENERGY COMPANY LLC AND SUBSIDIARIES
NOTES TO CONSOLIDATED FINANCIAL STATEMENTS
December 31, 2019
Note 3. Investments (cont.)
The composition of the company’s investments as of December 31, 2019 by industry, at fair value, were as follows:
| Investments at Cost | Investments at Fair Value | Fair Value Percentage of Total Portfolio | ||||||||||
| Biomass | $ | 21,425,600 | $ | 21,425,600 | 4.5 | % | ||||||
| Commercial Solar* | 181,619,981 | 195,595,919 | 41.2 | |||||||||
| Residential Solar | 36,103,136 | 47,432,455 | 10.0 | |||||||||
| Wind | 90,618,874 | 101,660,576 | 21.4 | |||||||||
| Pre-Operational Assets | 95,718,187 | 95,718,187 | 20.1 | |||||||||
| Other Investments | 12,656,710 | 12,473,975 | 2.6 | |||||||||
| Energy Efficiency | 867,184 | 869,159 | 0.2 | |||||||||
| Total | $ | 439,009,672 | $ | 475,175,871 | 100.0 | % | ||||||
| * | Includes loans in the amount of $23,103,690. |
The composition of the company’s investments as of December 31, 2018 by industry, at fair value, were as follows:
| Investments
at Cost | Investments
at Fair Value | Fair
Value Percentage of Total Portfolio | ||||||||||
| Commercial Solar | $ | 144,732,656 | $ | 147,571,531 | 48.1 | % | ||||||
| Residential Solar | 37,503,136 | 41,918,094 | 13.6 | |||||||||
| Wind | 63,446,680 | 65,165,744 | 21.2 | |||||||||
| Pre-Operational Assets | 50,353,115 | 50,235,080 | 16.3 | |||||||||
| Other Investments | 1,279,273 | 1,263,620 | 0.4 | |||||||||
| Energy Efficiency | 999,525 | 1,022,046 | 0.4 | |||||||||
| Total | $ | 298,314,385 | $ | 307,176,115 | 100.0 | % | ||||||
Investments held as of December 31, 2019 and 2018 are considered Control Investments, which are defined as investments in companies in which the company owns 25% or more of the voting securities of such company, have greater than 50% representation on such company’s board of directors, or investments in limited liability companies for which the company serves managing member.
F-20
GREENBACKER RENEWABLE ENERGY COMPANY LLC AND SUBSIDIARIES
NOTES TO CONSOLIDATED FINANCIAL STATEMENTS
December 31, 2019
Note 4. Fair Value Measurements — Investments
The following table presents fair value measurements of investments, by major class, as of December 31, 2019 according to the fair value hierarchy:
| Valuation Inputs | ||||||||||||||||
| Level 1 | Level 2 | Level 3 | Fair Value | |||||||||||||
| Limited Liability Company Member Interests | $ | - | $ | - | $ | 449,981,086 | $ | 449,981,086 | ||||||||
| Capital Stock | - | - | 1,611,955 | 1,611,955 | ||||||||||||
| Energy Efficiency Secured Loans | - | - | 479,140 | 479,140 | ||||||||||||
| Secured Loans – Other | - | - | 23,103,690 | 23,103,690 | ||||||||||||
| Total | $ | - | $ | - | $ | 475,175,871 | $ | 475,175,871 | ||||||||
| Other Financial Instruments* | ||||||||||||||||
| Open swap contracts- assets | $ | - | $ | 21,223 | $ | - | $ | 21,223 | ||||||||
| Open swap contracts- liabilities | - | (4,899,566 | ) | - | (4,899,566 | ) | ||||||||||
| Total | $ | - | $ | (4,878,343 | ) | $ | - | $ | (4,878,343 | ) | ||||||
| * | Other financial instruments are derivatives, such as futures, forward currency contracts and swaps. These instruments are reflected at the unrealized appreciation (depreciation) on the instrument. |
The following table presents fair value measurements of investments, by major class, as of December 31, 2018 according to the fair value hierarchy:
| Valuation Inputs | ||||||||||||||||
| Level 1 | Level 2 | Level 3 | Fair Value | |||||||||||||
| Limited Liability Company Member Interests | $ | — | $ | — | $ | 304,542,921 | $ | 304,542,921 | ||||||||
| Capital Stock | — | — | 2,081,554 | 2,081,554 | ||||||||||||
| Energy Efficiency Secured Loans | — | — | 551,640 | 551,640 | ||||||||||||
| Total | $ | — | $ | — | $ | 307,176,115 | $ | 307,176,115 | ||||||||
| Other Financial Instruments* | ||||||||||||||||
| Open swap contracts- assets | $ | — | $ | 435,603 | $ | — | $ | 435,603 | ||||||||
| Open swap contracts- liabilities | $ | — | $ | (311,641 | ) | $ | — | $ | (311,641 | ) | ||||||
| Total | $ | — | $ | 123,962 | $ | — | $ | 123,962 | ||||||||
| * | Other financial instruments are derivatives, such as futures, forward currency contracts and swaps. These instruments are reflected at the unrealized appreciation (depreciation) on the instrument. |
F-21
GREENBACKER RENEWABLE ENERGY COMPANY LLC AND SUBSIDIARIES
NOTES TO CONSOLIDATED FINANCIAL STATEMENTS
December 31, 2019
Note 4. Fair Value Measurements — Investments (cont.)
The following table provides a reconciliation of the beginning and ending balances for investments that use Level 3 inputs for the year ended December 31, 2019:
| Balance as of December 31, 2018 | Net
change in unrealized appreciation on investments | Translation of assets and liabilities denominated in foreign currencies | Purchases | Cost adjustments (1) | Sales and Repayments of investments (2) | Net realized gain on investments | Balance as of December 31, 2019 | |||||||||||||||||||||||||
| Limited Liability Company Member Interests | $ | 304,542,921 | $ | 27,774,068 | $ | - | $ | 314,175,394 | $ | (159,495,169 | ) | $ | (49,931,866 | ) | $ | 12,915,738 | $ | 449,981,086 | ||||||||||||||
| Capital Stock | 2,081,554 | (477,188 | ) | 7,589 | - | - | - | - | 1,611,955 | |||||||||||||||||||||||
| Energy Efficiency - Secured Loans | 551,640 | - | - | - | - | (72,500 | ) | - | 479,140 | |||||||||||||||||||||||
| Secured Loans - Other | - | - | - | 39,410,466 | (2,056,776 | ) | (14,250,000 | ) | - | 23,103,690 | ||||||||||||||||||||||
| Total | $ | 307,176,115 | $ | 27,296,880 | $ | 7,589 | $ | 353,585,860 | $ | (161,551,945 | ) | $ | (64,254,366 | ) | $ | 12,915,738 | $ | 475,175,871 | ||||||||||||||
| (1) | Includes paid-in-kind interest, return of capital and additional investments in existing investments, if any. |
| (2) | Includes principal repayments on loans. |
The total change in unrealized appreciation included in the consolidated statements of operations within net change in unrealized appreciation on investments and foreign currency translation for the year ended December 31, 2019 attributable to Level 3 investments still held at December 31, 2019 was $27,304,469. Reclassifications impacting Level 3 of the fair value hierarchy are reported as transfers in or out of the Level 3 as of the beginning of the period which the reclassifications occur. There were no reclassifications attributable to Level 3 investments during the year ended December 31, 2019. The total net change in unrealized appreciation at fair value for the year ended December 31, 2019 was $22,302,164.
The following table provides a reconciliation of the beginning and ending balances for investments that use Level 3 inputs for the year ended December 31, 2018:
| Balance as of December 31, 2017 | Net change in unrealized appreciation on investments | Translation of assets and liabilities denominated in foreign currencies | Purchases | Cost adjustments (1) | Sales and Repayments of investments (2) | Net realized gain on investments | Balance
as of December 31, 2018 | |||||||||||||||||||||||||
| Limited Liability Company Member Interests | $ | 215,619,476 | $ | 2,848,856 | $ | - | $ | 135,141,381 | $ | (44,566,792 | ) | $ | (4,500,000 | ) | $ | - | $ | 304,542,921 | ||||||||||||||
| Capital Stock | 2,093,827 | 106,223 | (118,496 | ) | - | - | - | - | 2,081,554 | |||||||||||||||||||||||
| Energy Efficiency - Secured Loans | 672,871 | - | - | - | - | (121,231 | ) | - | 551,640 | |||||||||||||||||||||||
| Total | $ | 218,386,174 | $ | 2,955,079 | $ | (118,496 | ) | $ | 135,141,381 | $ | (44,566,792 | ) | $ | (4,621,231 | ) | $ | - | $ | 307,176,115 | |||||||||||||
| (1) | Includes paid-in-kind interest, return of capital and additional investments in existing investments, if any. |
| (2) | Includes principal repayments on loans. |
F-22
GREENBACKER RENEWABLE ENERGY COMPANY LLC AND SUBSIDIARIES
NOTES TO CONSOLIDATED FINANCIAL STATEMENTS
December 31, 2019
Note 4. Fair Value Measurements — Investments (cont.)
The total change in unrealized appreciation included in the consolidated statements of operations within net change in unrealized appreciation on investments and foreign currency translation for the year ended December 31, 2018 attributable to Level 3 investments still held at December 31, 2018 was $2,836,583. Reclassifications impacting Level 3 of the fair value hierarchy are reported as transfers in or out of the Level 3 as of the beginning of the period which the reclassifications occur. There were no reclassifications attributable to Level 3 investments during the year ended December 31, 2018. The total net change in unrealized appreciation at fair value for the year ended 31, 2018 was $2,804,477.
The following table provides a reconciliation of the beginning and ending balances for investments that use Level 3 inputs for the year ended December 31, 2017:
| Balance as of December 31, 2016 | Net change in unrealized appreciation on investments | Translation of assets and liabilities denominated in foreign currencies | Purchases | Cost adjustments (1) | Sales and Repayments of investments (2) | Net realized gain on investments | Balance as of December 31, 2017 | |||||||||||||||||||||||||
| Limited Liability Company Member Interests | $ | 112,536,561 | $ | 5,748,138 | $ | - | $ | 127,069,013 | $ | (30,412 | ) | $ | (30,397,706 | ) | $ | 693,882 | $ | 215,619,476 | ||||||||||||||
| Capital Stock | 1,815,169 | 180,895 | 97,763 | - | - | - | - | 2,093,827 | ||||||||||||||||||||||||
| Energy Efficiency - Secured Loans | 771,371 | - | - | - | - | (98,500 | ) | - | 672,871 | |||||||||||||||||||||||
| Total | $ | 115,123,101 | $ | 5,929,033 | $ | 97,763 | $ | 127,069,013 | $ | (30,412 | ) | $ | (30,496,206 | ) | $ | 693,882 | $ | 218,386,174 | ||||||||||||||
| (1) | Includes purchases of new investments, capitalized deal costs, effects of purchase price adjustments, paid-in-kind interest, return of capital and additional investments in existing investments, if any. |
| (2) | Includes principal repayments on loans. |
The total change in unrealized appreciation included in the consolidated statements of operations within net change in unrealized appreciation on investments and foreign currency translation for the year ended December 31, 2017 attributable to Level 3 investments still held at December 31, 2017 was $6,026,796. Reclassifications impacting Level 3 of the fair value hierarchy are reported as transfers in or out of the Level 3 as of the beginning of the period which the reclassifications occur. There were no reclassifications attributable to Level 3 investments during the year ended December 31, 2017. The total net change in unrealized appreciation at fair value for the year ended 31, 2017 was $6,092,167. |
F-23
GREENBACKER RENEWABLE ENERGY COMPANY LLC AND SUBSIDIARIES
NOTES TO CONSOLIDATED FINANCIAL STATEMENTS
December 31, 2019
Note 4. Fair Value Measurements — Investments (cont.)
As of December 31, 2019, all of the company’s portfolio investments utilized Level 3 inputs. The following table presents the quantitative information about Level 3 fair value measurements of the company’s investments as of December 31, 2019:
| Fair Value | Valuation Techniques | Unobservable Inputs | Rates/Assumptions | |||||||
| Biomass | $ | 21,425,600 | Transaction Cost | Not Applicable | Not Applicable | |||||
| Commercial Solar | $ | 172,492,229 | Income Approach and Market Approach | Discount rate, future kWh Production, and estimated remaining useful life | 7.25% - 9.25%, 0.50% annual degradation in production, 13.5 - 34.3 years | |||||
| Residential Solar | $ | 47,432,455 | Income Approach and Market Approach | Discount rate, future kWh Production, and estimated remaining useful life | 7.25% - 9.25%, 0.50% annual degradation in production, 13.5 - 34.3 years | |||||
| Wind | $ | 101,660,576 | Income Approach | Discount rate, future kWh Production, and estimated remaining useful life | 8.50%, no annual degradation in production, 27.9 - 29.0 years | |||||
| Pre-Operational Assets | $ | 95,718,187 | Transaction Cost | Not Applicable | Not Applicable | |||||
| Other Investments | $ | 12,473,975 | Transaction Cost | Not Applicable | Not Applicable | |||||
| Energy Efficiency | $ | 869,159 | Income and Collateral Based Approach |
Income Based |
10.25% - 20.40% | |||||
| Secured Loans | $ | 23,103,690 | Yield Analysis | Market yields | 8% - 10% | |||||
As of December 31, 2018, all of the company’s portfolio investments utilized Level 3 inputs. The following table presents the quantitative information about Level 3 fair value measurements of the company’s investments as of December 31, 2018:
| Fair Value | Valuation Techniques | Unobservable Inputs | Rates/Assumptions | |||||||
| Commercial Solar | $ | 147,571,531 | Income approach | Discount rate, future kWh Production, and estimated remaining useful life | 7.75% - 8.50%, 0.50% annual degradation in production, 22.2 - 35 years | |||||
| Residential Solar | $ | 41,918,094 | Income approach | Discount rate, future kWh Production, and estimated remaining useful life | 7.25% - 11%, 0.50% annual degradation in production, 12.2 - 33 years | |||||
| Wind | $ | 65,165,744 | Income approach | Discount rate, future kWh Production, and estimated remaining useful life | 8.50%, no annual degradation in production, 24 - 27.7 years | |||||
| Pre-Operational Assets | $ | 50,235,080 | Transaction cost | Not Applicable | Not Applicable | |||||
| Other Investments | $ | 1,263,620 | Transaction cost | Not Applicable | Not Applicable | |||||
| Energy Efficiency | $ | 1,022,046 | Income and collateral based approach | Income Based | 10.25% - 20.40% | |||||
GREC utilizes primarily proprietary discounted cash flow pricing models in the fair value measurement of the company’s investments. Significant unobservable inputs include discount rates and estimates related to the future production of electricity. Significant increases or decreases in discount rates used or actual kilowatt hour production can significantly increase or decrease the fair value measurement
F-24
GREENBACKER RENEWABLE ENERGY COMPANY LLC AND SUBSIDIARIES
NOTES TO CONSOLIDATED FINANCIAL STATEMENTS
December 31, 2019
Note 5. Related Party Agreements and Transactions Agreements
The company has executed advisory and administration agreements with the advisor and Greenbacker Administration, LLC, our administrator, respectively, which entitles the advisor, and certain affiliates of the advisor, to specified fees upon the provision of certain services with regard to the ongoing management of the company as well as reimbursement of O&O costs incurred by the advisor on behalf of the company (as discussed in Note 2) and certain other operating costs incurred by the advisor on behalf of the company. As the company’s continuous public offering was terminated on March 29, 2019, the dealer manager will no longer receive any selling commission or dealer manager fees. However, the dealer manager will continue to receive distribution fess on Class C shares until the maximum amount of commissions and dealer manager fees permitted by applicable regulation is reached.
The term “Special Unitholder” refers to GREC Advisors, LLC, a Delaware limited liability company, which is a subsidiary of our advisor and “special unit”, refers to the special unit of limited liability company interest in GREC. This entitles the Special Unitholder to an incentive allocation and distribution.
The commissions, fees and reimbursement obligations related to our terminated continuous offering were as follows:
| Type of Compensation and Recipient | Determination of Amount | |
| Selling Commissions — Dealer Manager | Up to 7% of gross offering proceeds from the sale of Class A shares, up to 3% of gross offering proceeds from the sale of Class C shares and up to 6% of gross offering proceeds for the sale of Class P-A shares. No selling commission will be paid with respect to Class I and Class P-I shares or for sales pursuant to the dividend reinvestment plan. All its selling commissions were re-allowed to participating broker-dealers. | |
| Dealer Manager Fee — Dealer Manager | Up to 2.75% of gross offering proceeds from the sale of Class A and C shares, and up to 1.75% of gross offering proceeds from the sale of Class I shares. No dealer manager fee will be paid for sales pursuant to the dividend reinvestment plan. The dealer manager re-allowed a portion of its dealer manager fee to selected broker-dealers during the offering. | |
| Distribution Fee — Dealer Manager | With respect to Class C shares only, the company will pay the dealer manager a distribution fee that accrues daily in an amount equal to 1/365th of 0.80% of the amount of the net asset value for the Class C shares for such day on a continuous basis from year to year. The company will stop paying distribution fees at the earlier of 1) a listing of the Class C shares on a national securities exchange, 2) following the completion of this offering, total underwriting compensation in this offering equals 10% of the gross proceeds from the primary offering of Class C shares or 3) Class C shares are no longer outstanding. The dealer manager may re-allow all or a portion of the distribution fee to participating broker-dealers and servicing broker dealers. Commencing as of June 30, 2016, the company estimates the amount of distribution fees expected to be paid and records that liability at the time of sale. | |
| O&O costs — Advisor | The company reimburses the advisor for the O&O costs (other than selling commissions and dealer manager fees) it has incurred on the company’s behalf only to the extent that the reimbursement would not cause the selling commissions, dealer manager fee and the other O&O costs borne by the company to exceed 15.0% of the gross offering proceeds as the amount of proceeds increases. From the commencement of the continuous offering through December 31, 2019, approximately 3.8%, or $9.4 million, was charged against gross offering proceeds for O&O costs. |
The fees and reimbursement obligations related to our ongoing operation of the company are as follows:
| Type of Compensation and Recipient | Determination of Amount | |
| Base Management Fees — Advisor | The base management fee payable to GCM will be calculated at a monthly rate of 0.167% (2.00% annually) of our gross assets (including amounts borrowed). For services rendered under the advisory agreement, the base management fee will be payable monthly in arrears. The base management fee will be calculated based on the average of the values of our gross assets for each day of the prior month. Base management fees for any partial period will be appropriately pro-rated. The base management fee may be deferred or waived, in whole or part, at the election of the advisor. All or any part of the deferred base management fee not taken as to any period shall be deferred without interest and may be taken in any period prior to the occurrence of a liquidity event as the advisor shall determine in its sole discretion. |
F-25
GREENBACKER RENEWABLE ENERGY COMPANY LLC AND SUBSIDIARIES
NOTES TO CONSOLIDATED FINANCIAL STATEMENTS
December 31, 2019
Note 5. Related Party Agreements and Transactions Agreements (cont.)
| Type of Compensation and Recipient | Determination of Amount | |
| Incentive Allocation and Distribution — Special Unitholder | The incentive distribution to which the Special Unitholder is be entitled to will be calculated and payable quarterly in arrears based on the pre-incentive distribution net investment income for the immediately preceding fiscal quarter. For this purpose, pre-incentive distribution net investment income means interest income, dividend and distribution income from equity investments (excluding that portion of distributions that are treated as return of capital) and any other income (including any other fees, such as commitment, origination, structuring, diligence and consulting fees or other fees that we receive, but excluding any fees for providing managerial assistance) accrued during the fiscal quarter, minus the operating expenses for the fiscal quarter (including the base management fee, expenses payable under the administration agreement with the company’s Administrator, and any interest expense and distributions paid on any issued and outstanding indebtedness and preferred units of limited liability company interest, but excluding the incentive distribution). Pre-incentive distribution net investment income does not include any realized capital gains, realized capital losses, unrealized capital appreciation or depreciation or any accrued income taxes and other taxes including, but not limited to, franchise, property, and sales taxes. | |
| Pre-incentive distribution net investment income, expressed as a rate of return on the value of the company’s average adjusted capital at the end of the immediately preceding fiscal quarter, will be compared to a “hurdle rate” of 1.75% per fiscal quarter (7.00% annualized). Adjusted capital shall mean: cumulative gross proceeds before sales and commission and dealer fees, generated from sales of the company’s shares and preferred units of limited liability company interests (including the DRP) reduced for distributions to members of proceeds from non-liquidation dispositions of asset and amount paid for share repurchases pursuant to the Share Repurchase Program. Average adjusted capital shall mean: the average value of the adjusted capital for the two most recently completed fiscal quarters. The Special Unitholder shall receive an incentive distribution with respect to the pre-incentive distribution net investment income in each fiscal quarter as follows: | ||
| ● no incentive distribution in any fiscal quarter in which the pre-incentive distribution net investment income does not exceed the “hurdle rate” of 1.75%; | ||
| ● 100% of the pre-incentive distribution net investment income with respect to that portion of such pre-incentive distribution net investment income, if any, that exceeds the hurdle but is less than 2.1875% in any fiscal quarter (8.75% annualized with a 7% annualized hurdle rate). The company refers to this portion of the pre-incentive distribution net investment income (which exceeds the hurdle but is less than 2.1875%) as the “catch-up.” The “catch-up” is meant to provide the advisor with 20% of the pre-incentive distribution net investment income as if a hurdle did not apply if the net investment income exceeds 2.1875% in any fiscal quarter; and |
F-26
GREENBACKER RENEWABLE ENERGY COMPANY LLC AND SUBSIDIARIES
NOTES TO CONSOLIDATED FINANCIAL STATEMENTS
December 31, 2019
Note 5. Related Party Agreements and Transactions Agreements (cont.)
| Type of Compensation and Recipient | Determination of Amount | |
| ● 20% of the amount of the pre-incentive distribution net investment income, if any, that exceeds 2.1875% in any fiscal quarter (8.75% annualized with a 7% annualized hurdle rate) is payable to the Special Unitholder (once the hurdle is reached and the catch-up is achieved, 20% of all pre-incentive distribution investment income thereafter is allocated to the Special Unitholder). | ||
| Capital Gains Incentive Distribution — Special Unitholder | The capital gains incentive distribution will be determined and payable to the Special Unitholder in arrears as of the end of each fiscal quarter (or upon termination of the advisory agreement, as of the termination date) to the Special Unitholder, and will equal 20.0% of the company’s realized capital gains, if any, on a cumulative basis from inception through the end of each fiscal quarter, computed net of all realized capital losses and unrealized capital depreciation on a cumulative basis, less the aggregate amount of any capital gain incentive distributions. | |
| Liquidation Incentive Distribution — Special Unitholder | The liquidation incentive distribution payable to the Special Unitholder will equal 20.0% of the net proceeds from a liquidation of the company (other than in connection with a listing, as described below) in excess of adjusted capital, as measured immediately prior to liquidation. Adjusted capital shall mean: cumulative gross proceeds generated from sales of shares (including the DRP) reduced for distributions to members of proceeds from non-liquidation dispositions of our assets and amounts paid for share repurchases pursuant to the Share Repurchase Program. In the event of any liquidity event that involves a listing of the company’s shares, or a transaction in which the company’s members receive shares of a company that is listed, on a national securities exchange, the liquidation incentive distribution will equal 20% of the amount, if any, by which the company’s listing value following such liquidity event exceeds the adjusted capital, as calculated immediately prior to such listing (the “listing premium”). Any such listing premium and related liquidation incentive distribution will be determined and payable in arrears 30 days after the commencement of trading following such liquidity event. |
F-27
GREENBACKER RENEWABLE ENERGY COMPANY LLC AND SUBSIDIARIES
NOTES TO CONSOLIDATED FINANCIAL STATEMENTS
December 31, 2019
Note 5. Related Party Agreements and Transactions Agreements (cont.)
For the years ended December 31, 2019, 2018 and 2017, the advisor earned $8,461,616, $5,803,893 and $3,490,942, respectively, in management fees. The Consolidated Statements of Operations also reflect a $5,270,670 incentive allocation for the year ended December 31, 2019 shown as a net increase in net assets attributed to special unitholder. There was a capital gains incentive distribution of $170,000, nil, and $139,692 earned in 2019, 2018 and 2017, respectively. The Consolidated Statements of Operation also reflect a $560,895 and $1,235,657 incentive allocation shown as a net increase in net assets attributed to special unitholder for the years ended December 31, 2018 and December 31, 2017, respectively.
As of December 31, 2019, no amounts were due to the advisor. As of December 31, 2018, due to advisor on the consolidated statements of assets and liabilities in the amount of $19,181 is solely comprised of a payable to the advisor for reimbursable Organization and Offering Costs.
For the years ended December 31, 2019, 2018 and 2017, the company paid $231,892, $833,043 and $827,709, respectively, in dealer manager fees and $594,247, $2,438,486 and $2,444,282, respectively, in selling commissions to the company’s dealer manager, SC Distributors. These fees and commissions were paid in connection with the sales of the company’s shares to investors and, as such, were recorded against the proceeds from the issuance of shares, prior the receipt by the company, and thus are not reflected in the company’s consolidated statements of operations.
For the years ended December 31, 2019, 2018 and 2017, Greenbacker Administration, LLC invoiced the company nil, nil and $115,849, respectively, for expenses, at cost, for services related to asset management, compliance and accounting services related to the company’s investments. Effective on April 1, 2017, these expenses were invoiced directly to the company’s investments.
As of December 31, 2019, and 2018, respectively, the advisor owned 23,601 Class A shares. The affiliate of our advisor redeemed all its shares during the year ended December 31, 2018 and no longer owns shares as of December 31, 2018.
The company entered into secured loans to finance the purchase and installation of energy efficient lighting with LED Funding LLC and Renew AEC One LLC (“AEC Companies”). All of the loans with LED Funding LLC, an AEC Company, converted to an operating lease on the day the energy efficiency upgrades became operational. AEC Companies are considered related parties as the members of these entities own an indirect, non-controlling ownership interest in the company’s advisor. The loans outstanding between the AEC Companies and the company, and the subsequent operating leases, were negotiated at an arm’s length and contain standard terms and conditions that would be included in third party lending agreements including required security and collateral, interest rates based upon risk of the specific loan, and term of the loan. As of December 31, 2019, all loans and operating leases are considered current per their terms.
The company entered into a transaction with Greenbacker Renewable Opportunity Zone Fund LLC (“GROZ”) to sell the Sol Phoenix Solar LLC investment, included within the Phoenix Solar Portfolio, on September 30, 2019 for $16,874,761, which was later amended to total $17,175,554 as of December 31, 2019. GROZ is an affiliate of GREC, as the fund shares the same advisor as GREC. Since GROZ is an affiliate of the company, the determination of the purchase price was based on the fair value of the investment as determined by an independent third-party appraiser and the purchase was determined by a majority of the company board of directors (including a majority of the independent directors) not otherwise interested in the transaction to be fair and reasonable to the company. The transaction resulted in a realized gain of $7,494,464 recorded in the Consolidated Statements of Operations. GROZ paid an initial amount of $1,500,000 at closing with an additional $8,184,393 paid by GROZ as of December 31, 2019. The remaining balance is included in Investment Sales Receivable in the Consolidated Statements of Assets and Liabilities.
On December 10, 2019 the company through its wholly owned subsidiary, Citrine Solar LLC, entered into a second transaction with GROZ to sell the Fremont CO I, LLC asset. The asset was sold for a purchase price of $5,272,475, based upon the fair value of the investment as determined by an independent third-party appraiser. The transaction resulted in a realized gain of $794,475 recorded in the Consolidated Statement of Operations. As of December 31, 2019, the remaining balance of $2,741,476 is included in Investment Sales Receivable in the Consolidated Statements of Assets and Liabilities.
Note 6. Borrowings
On June 20, 2019, the company, through GREC HoldCo, entered into a new credit agreement, the lenders party thereto and Fifth Third Bank, as administrative agent, as sole lead arranger, sole lead bookrunner, and as swap counterparty. The new credit facility (the “New Credit Facility”) consists of a loan of up to the lesser of $110,000,000 or a borrowing base amount based on various solar projects that act as collateral for the credit facility, of which approximately $58,307,080 was drawn down at closing. The $110,000,000 borrowing base has since been reduced to $96,438,316 as a result of our sale of the Raleigh Portfolio and its removal from the facility. The New Credit Facility allows for additional drawdowns through June 20, 2020, at which point the outstanding loans shall convert to an additional term loan and mature on June 20, 2025. As of December 31, 2019, the company has drawn down an additional $13,683,387 increasing the total amount drawn on the credit facility.
The company will use the net proceeds of borrowings under the New Credit Facility for investment in additional alternative energy power generation assets that are anticipated to become Projects and for other general corporate purposes. Loans made under the New Credit Facility bear interest at 1.75% in excess of the three-month LIBOR. Until the New Credit Facility converts to a term loan, quarterly commitment fees on the average daily unused portion of the Credit Facility are payable at a rate per annum of 0.50%.
Borrowings under the New Credit Facility are back-leveraged and secured by all of the assets of GREC HoldCo and the equity interests of each direct and indirect subsidiary of the company. The company, GREC and each direct and indirect subsidiary of the company are guarantors of the company’s obligations under the New Credit Facility. GREC has pledged all the equity interests of the GREC HoldCo as collateral for the New Credit Facility.
F-28
GREENBACKER RENEWABLE ENERGY COMPANY LLC AND SUBSIDIARIES
NOTES TO CONSOLIDATED FINANCIAL STATEMENTS
December 31, 2019
Note 6. Borrowings (cont.)
As of December 31, 2019, the outstanding balance is approximately $72 million. Financing costs of $3.1 million related to the New Credit Facility have been capitalized and are being amortized over the current term of the New Credit Facility.
On January 5, 2018, the company, through GREC HoldCo, entered into a credit agreement by and among the company, the company’s wholly owned subsidiary, GREC, the lenders party thereto and Fifth Third Bank, as administrative agent, as sole lead arranger, sole lead bookrunner, and as swap counterparty. The credit facility (the “Credit Facility”) consisted of a loan of up to the lesser of $60,000,000 or a borrowing base amount based on various solar projects that act as collateral for the credit facility, of which approximately $25.7 million was drawn down at closing. The Credit Facility allowed for additional drawdowns through December 31, 2018 and converted to a term loan with a maturity on January 5, 2024. The New Credit Facility replaced the previous Credit Facility.
Regarding the Credit Facility, the company has entered into five separate interest rate swap agreements. The first swap (“Swap 1”), effective July 29, 2016, has an initial notional amount of $4,300,000 to swap the floating rate interest payments on the original Facility 1 Term Loan for a corresponding fixed payment. The fixed swap rate is 1.11%. The second swap (“Swap 2”), with a trade date of June 15, 2017 and an effective date of June 18, 2018 and an initial notional amount of $20,920,650, was used to swap the floating rate interest payments on an additional principal amount of the Credit Facility, for a corresponding fixed payment. The fixed swap rate is 2.261%. The third swap (“Swap 3”), with a trade date of January 11, 2018 and an effective date of December 31, 2018 and an initial notional amount of $29,624,945 was used to swap the floating rate interest payments on the remaining unhedged portion of the Credit Facility, as well as the estimated additional drawdowns, for a corresponding fixed payment. The fixed swap rate is 2.65%. The fourth swap (“Swap 4”), with a trade date of February 7, 2018 and an effective date of December 31, 2018 and an initial notional amount of $4,180,063 was used to swap the floating rate interest payments on the remaining unhedged portion of the Credit Facility, as well as the estimated additional drawdowns, for a corresponding fixed payment. The fixed swap rate is 2.97%. The fifth swap (“Swap 5”), with a trade date of January 2, 2019 and an effective date of September 30, 2019 and an initial notional amount of $38,203,506 was used to swap the floating rate interest payments on the remaining unhedged portion of the Credit Facility, as well as the estimated additional drawdowns, for a corresponding fixed payment. The fixed swap rate is 2.69%. If an event of default shall occur and be continuing under the New Credit Facility, the commitments under the New Credit Facility may be terminated and the principal amount outstanding under the New Credit Facility, together with all accrued unpaid interest and other amounts owing in respect thereof, may be declared immediately due and payable.
If an event of default shall occur and be continuing under the New Credit Facility, the commitments under the New Credit Facility may be terminated and the principal amount outstanding under the New Credit Facility, together with all accrued unpaid interest and other amounts owing in respect thereof, may be declared immediately due and payable.
The company’s outstanding debt as of December 31, 2019 and December 31, 2018 was as follows:
| December 31, 2019 | December 31, 2018 | |||||||||||||||||||||||||||||||||||||||
| Aggregate Principal Amount Available | Principal Amount Outstanding | Carrying Value | Deferred Financing Costs | Term Note Payable, Net of Financing Costs | Aggregate Principal Amount Available | Principal Amount Outstanding | Carrying Value | Deferred Financing Costs | Term Note Payable, Net of Financing Costs | |||||||||||||||||||||||||||||||
| New Facility | $ | 96,438,316 | $ | 71,990,467 | $ | 71,990,467 | $ | 3,103,681 | $ | 68,886,785 | $ | 60,000,000 | $ | 30,665,460 | $ | 30,665,460 | $ | 1,138,414 | $ | 29,527,046 | ||||||||||||||||||||
| Total | $ | 96,438,316 | $ | 71,990,467 | $ | 71,990,467 | $ | 3,103,681 | $ | 68,886,785 | $ | 60,000,000 | $ | 30,665,460 | $ | 30,665,460 | $ | 1,138,414 | $ | 29,527,046 | ||||||||||||||||||||
F-29
GREENBACKER RENEWABLE ENERGY COMPANY LLC AND SUBSIDIARIES
NOTES TO CONSOLIDATED FINANCIAL STATEMENTS
December 31, 2019
Note 6. Borrowings (cont.)
The following table shows the components of interest expense, commitment fees related to the Credit Facility, amortized deferred financing costs, weighted average stated interest rate and weighted average outstanding debt balance for the credit facility for the year ended December 31, 2019:
| For the year Ended December 31, 2019 | ||||
| Credit Facility commitment fee | $ | 43,087 | ||
| Credit Facility Loan interest | 1,360,409 | |||
| Amortization of deferred financing costs | 226,742 | |||
| Other* | 1,182,564 | |||
| Total | $ | 2,812,802 | ||
| Weighted average interest rate on credit facility | 4.32 | % | ||
| Weighted average outstanding balance of credit facility | $ | 53,753,277 | ||
| * | Primarily includes financing costs of credit facility. |
The following table shows the components of interest expense, commitment fees related to the Credit Facility, amortized deferred financing costs, weighted average stated interest rate and weighted average outstanding debt balance for the credit facility for the year ended December 31, 2018:
| For the year Ended December 31, 2018 | ||||
| Credit Facility commitment fee | $ | 42,615 | ||
| Credit Facility Loan interest | 1,219,237 | |||
| Amortization of deferred financing costs | 222,394 | |||
| Other* | 309,588 | |||
| Total | $ | 1,793,834 | ||
| Weighted average interest rate on credit facility | 4.14 | % | ||
| Weighted average outstanding balance of credit facility | $ | 29,896,416 | ||
| * | Primarily includes financing costs of credit facility. |
The following table shows the components of interest expense, commitment fees related to the Revolving Facility, amortized deferred financing costs, weighted average stated interest rate and weighted average outstanding debt balance for the credit facility for the year ended December 31, 2017:
| For the year Ended December 31, 2017 | ||||
| Revolver interest | $ | 288,620 | ||
| Revolver commitment fee | 81,109 | |||
| Credit Facility Loan interest | 157,811 | |||
| Amortization of deferred financing costs | 164,725 | |||
| Total | 692,265 | |||
| Weighted average interest rate on credit facility. | 4.87 | % | ||
| Weighted average outstanding balance of credit facility | $ | 8,481,848 | ||
The principal payments due on borrowings for each of the next five years ending December 31 and thereafter, are as follows:
| Year ending December 31: | Principal Payments | |||
| 2020 | $ | 4,393,296 | ||
| 2021 | 5,659,278 | |||
| 2022 | 5,549,332 | |||
| 2023 | 5,630,052 | |||
| 2024 | 5,805,094 | |||
| Thereafter | 44,953,415 | |||
| $ | 71,990,467 | |||
F-30
GREENBACKER RENEWABLE ENERGY COMPANY LLC AND SUBSIDIARIES
NOTES TO CONSOLIDATED FINANCIAL STATEMENTS
December 31, 2019
Note 7. Members’ Equity
General
Pursuant to the terms of the LLC Agreement, the LLC may issue up to 400,000,000 shares, of which 350,000,000 shares are designated as Class A, C, I, P-A and P-I shares (collectively, common shares), and 50,000,000 are designated as preferred shares and one special unit. Each class of common shares will have the same voting rights.
The following were the commissions and fees for each common share class in connection with the company’s continuous public offering pursuant to a Registration Statement on Form S-1 (File No. 333-211571) which terminated on March 29, 2019 as well as the private offering of Class P-A.
Class A: Each Class A share were subject to a selling commission of up to 7.00% per share and a dealer manager fee of up to 2.75% per share. No selling commissions or dealer manager fees are paid for sales pursuant to the DRP.
Class C: Each Class C share issued in the primary offering was subject to a selling commission of up to 3.00% per share and a dealer manager fee of up to 2.75% per share. In addition, with respect to Class C shares, the company pays the dealer manager a monthly distribution fee, or “distribution fee”, that accrues daily equal to 1/365th of 0.80% of the amount of the daily net asset value for the Class C shares on a continuous basis from year to year. No selling commissions or dealer manager fees are paid for sales pursuant to the DRP.
Class I: No selling commission or distribution fee will be paid for sales of any Class I shares. Each Class I share was subject to a dealer manager fee of up to 1.75% per share. No selling commissions or dealer manager fees are paid for sales pursuant to the DRP for Class I shares.
Class P-A: Class P-A shares were converted into Class P-I shares during the quarter ended June 30, 2017 and were not offered for sale for the period through April 15, 2018. Effective April 16, 2018, Class P-A shares were again offered with a selling commission of up to 6% and a dealer manager fee of up to 2.50%. The Class P-A shares are no longer offered for sale.
Class P-I shares are currently offered at net asset value through a private placement memorandum.
The following table is a summary of the shares issued and repurchased during the period and outstanding as of December 31, 2019:
| Shares
Outstanding as of December 31, 2018 | Shares Issued During the Period | Shares Repurchased During the Period | Shares
Outstanding as of December 31, 2019 | |||||||||||||
| Class A shares | 16,714,738 | 1,053,857 | (558,579 | ) | 17,210,016 | |||||||||||
| Class C shares | 2,222,478 | 512,926 | (16,929 | ) | 2,718,475 | |||||||||||
| Class I shares | 6,209,416 | 670,113 | (185,871 | ) | 6,693,658 | |||||||||||
| Class P-A shares | 15,478 | 2,631 | - | 18,109 | ||||||||||||
| Class P-I shares | 11,841,392 | 9,631,641 | (223,681 | ) | 21,249,352 | |||||||||||
| Total | 37,003,502 | 11,871,168 | (985,060 | ) | 47,889,610 | |||||||||||
The following table is a summary of the shares issued and repurchased during the period and outstanding as of December 31, 2018:
| Shares Outstanding as of December 31, 2017 | Shares Issued During the Period | Shares Repurchased During the Period | Shares Outstanding as of December 31, 2018 | |||||||||||||
| Class A shares | 13,857,830 | 3,279,887 | (422,979 | ) | 16,714,738 | |||||||||||
| Class C shares | 1,431,999 | 798,080 | (7,601 | ) | 2,222,478 | |||||||||||
| Class I shares | 4,511,832 | 1,757,365 | (59,781 | ) | 6,209,416 | |||||||||||
| Class P-A shares | — | 15,478 | — | 15,478 | ||||||||||||
| Class P-I shares | 3,387,568 | 8,469,305 | (15,481 | ) | 11,841,392 | |||||||||||
| Total | 23,189,229 | 14,320,115 | (505,842 | ) | 37,003,502 | |||||||||||
F-31
GREENBACKER RENEWABLE ENERGY COMPANY LLC AND SUBSIDIARIES
NOTES TO CONSOLIDATED FINANCIAL STATEMENTS
December 31, 2019
Note 7. Members’ Equity (cont.)
The proceeds from shares sold and the value of shares issued through the reinvestment of distributions for each class of shares for the years ended December 31, 2019, 2018, 2017 were as follows:
| Class
A Shares |
Class
C Shares |
Class
I Shares |
Class
P-A Shares |
Class
P-I Shares |
Total | |||||||||||||||||||
| For the year ended December 31, 2019 | ||||||||||||||||||||||||
| Proceeds from Shares Sold | $ | 5,256,053 | $ | 3,651,717 | $ | 3,773,270 | $ | 22,875 | $ | 84,637,482 | $ | 97,341,397 | ||||||||||||
| Proceeds from Shares Issued through Reinvestment of Distributions | $ | 3,944,111 | $ | 733,788 | $ | 2,074,778 | $ | - | $ | - | $ | 6,752,677 | ||||||||||||
| For the year ended December 31, 2018 | ||||||||||||||||||||||||
| Proceeds from Shares Sold | $ | 25,178,267 | $ | 6,378,209 | $ | 13,706,626 | $ | 135,375 | $ | 74,928,595 | $ | 120,327,072 | ||||||||||||
| Proceeds from Shares Issued through Reinvestment of Distributions | $ | 3,815,909 | $ | 487,570 | $ | 1,823,310 | $ | - | $ | - | $ | 6,126,789 | ||||||||||||
| For the year ended December 31, 2017 | ||||||||||||||||||||||||
| Proceeds from Shares Sold | $ | 26,852,433 | $ | 3,102,082 | $ | 15,071,499 | $ | 27,075 | $ | 27,366,718 | $ | 72,419,807 | ||||||||||||
| Proceeds from Shares Issued through Reinvestment of Distributions | $ | 3,127,873 | $ | 363,670 | $ | 1,255,991 | $ | - | $ | - | $ | 4,747,534 | ||||||||||||
As of December 31, 2019, 2018 and 2017, none of the LLC’s preferred shares were issued and outstanding.
The LLC Agreement authorizes the board of directors, without approval of any of the members, to increase the number of shares the company is authorized to issue and to classify and reclassify any authorized but unissued class or series of shares into any other class or series of shares having such designations, preferences, right, power and duties as may be specified by the board of directors. The LLC Agreement also authorizes the board of directors, without approval of any of the members, to issue additional shares of any class or series for the consideration and on the terms and conditions established by the board of directors. In addition, the company may also issue additional limited liability company interests that have designations, preferences, right, powers and duties that are different from, and may be senior to, those applicable to the common shares. The Special Unitholder will hold the special unit in the company. Refer to Note 5 for the terms of the special unit. The proceeds related to the shareholder receivable amount of $650,000 presented on the consolidated statements of assets and liabilities as of December 31, 2019 were subsequently collected on January 2, 2020.
Distribution Reinvestment Plan
The company adopted a DRP through which the company’s Class A, C and I shareholders may elect to purchase additional shares with distributions from the company rather than receiving the cash distributions. The board of directors may reallocate the shares between the public offering and the DRP. Shares issued pursuant to the DRP will have the same voting rights as shares offered pursuant to the public offering. As of June 4, 2019, pursuant to our Registration Statement on Form S-3 (File No. 333-231960) we are offering a maximum of $10,000,000 in shares of our common stock to our existing stockholders pursuant to the DRP. Management plans to increase the size of the offering once the maximum offering amount is reached. During this offering, the purchase price of shares purchased through the DRP will be at a price equal to the then current net offering price per share. No dealer manager fees, selling commissions or other sales charges will be paid with respect to shares purchased pursuant to the DRP except for distribution fees on Class C shares issued under the DRP. At its discretion, the board of directors may amend, suspend, or terminate the DRP. A participant may terminate participation in the DRP by written notice to the plan administrator, received by the plan administrator at least 10 days prior to the distribution payment date.
As of December 31, 2019, the company issued 1,588,435 Class A shares, 220,991 Class C shares, and 678,445 Class I shares for a total of 2,487,871 shares issued under the DRP. As of December 31, 2018, the company issued 1,131,099 Class A shares, 134,021 Class C shares, and 438,254 Class I shares, for a total of 1,703,374 shares issued under the DRP.
F-32
GREENBACKER RENEWABLE ENERGY COMPANY LLC AND SUBSIDIARIES
NOTES TO CONSOLIDATED FINANCIAL STATEMENTS
December 31, 2019
Note 7. Members’ Equity (cont.)
Share Repurchase Program
During 2015, the company commenced a share repurchase program, or “share repurchase program”, pursuant to which quarterly share repurchases will be conducted, on up to approximately 5% of the weighted average number of outstanding shares in any 12-month period, to allow members who hold Class A, C, I, P-A (commencing as of April 16, 2018) or P-I shares (commencing as of October 1, 2017) to sell shares back to the company at a price equal to the then current offering price less the selling commissions and dealer manager fees associated with that class of shares. The company is not obligated to repurchase shares and the board of directors may terminate the share repurchase program at its sole discretion.
The share repurchase program includes numerous restrictions that will limit a shareholder’s ability to sell shares. Unless the board of directors determines otherwise, the company limits the number of shares to be repurchased during any calendar year to the number of shares the company can repurchase with the proceeds received from the sale of shares under the DRP. At the sole discretion of the board of directors, the company may also use cash on hand, cash available from borrowings and cash from liquidation of investments to repurchase shares.
In addition, the company plans to limit repurchases in each fiscal quarter to 1.25% of the weighted average number of shares outstanding in the prior four fiscal quarters. For the year ended December 31, 2019, the company repurchased 558,579 Class A shares, 16,929, Class C shares, 185,871 Class I shares and 223,681 Class P-I shares at a total purchase price of $4,807,693, $142,110, $1,596,905 and $1,975,682, respectively, pursuant to the company’s share repurchase program. For the year ended December 31, 2018, the company repurchased 422,979 Class A shares, 7,601 Class C shares, 59,781 Class I shares and 15,481 Class P-I shares at a total purchase price of $3,743,387, $65,340, $528,898 and $136,845, respectively, pursuant to the company’s share repurchase program. For the year ended December 31, 2017, the company repurchased 368,925 Class A shares, 6,041 Class C shares, 81,315 Class I shares and 10,309 Class P-I shares at a total purchase price of $3,280,566, $53,073, $724,059 and $90,000, respectively, pursuant to the company’s share repurchase program.
We have received an order for our repurchase program from the SEC under Rule 102(a) of Regulation M under the Exchange Act. In addition, our repurchase program is substantially similar to repurchase programs for which the SEC has stated it will not recommend enforcement action under Rule 13e-4 and Regulation 14E under the Exchange Act.
Note 8. Distributions
On the last business day of each month, with the authorization of the company’s board of directors, the company declares distributions on each outstanding Class A, C, I, P-A and P-I share. These distributions are calculated based on shareholders of record for each day in amounts equal to that exhibited in the table below based upon distribution period and class of share.
| Class of Share | ||||||||||||||||||||||
| Distribution Period | A | C | I | P-A | P-I | |||||||||||||||||
| 1-Nov-15 | 31-Jan-16 | $ | 0.00164780 | $ | 0.00164780 | $ | 0.00164780 | — | — | |||||||||||||
| 1-Feb-16 | 30-Apr-16 | $ | 0.00165510 | $ | 0.00165510 | $ | 0.00165510 | — | — | |||||||||||||
| 1-May-16 | 31-Jul-16 | $ | 0.00166170 | $ | 0.00166170 | $ | 0.00166170 | $ | 0.00158260 | $ | 0.00158260 | |||||||||||
| 1-Aug-16 | 31-Oct-16 | $ | 0.00167660 | $ | 0.00167660 | $ | 0.00167660 | $ | 0.00159680 | $ | 0.00159680 | |||||||||||
| 1-Nov-16 | 31-Jan-17 | $ | 0.00168560 | $ | 0.00164020 | $ | 0.00168560 | $ | 0.00160360 | $ | 0.00160360 | |||||||||||
| 1-Feb-17 | 31-Apr-17 | $ | 0.00168070 | $ | 0.00163500 | $ | 0.00168070 | $ | 0.00159520 | $ | 0.00159520 | |||||||||||
| 1-May-17 | 31-Jul-17 | $ | 0.00167100 | $ | 0.00162730 | $ | 0.00167100 | $ | 0.00159520 | $ | 0.00158280 | |||||||||||
| 1-Aug-17 | 31-Oct-17 | $ | 0.00166900 | $ | 0.00162650 | $ | 0.00166900 | — | $ | 0.00159010 | ||||||||||||
| 1-Nov-17 | 31-Jan-18 | $ | 0.00166900 | $ | 0.00162650 | $ | 0.00166900 | — | $ | 0.00158280 | ||||||||||||
| 1-Feb-18 | 30-Apr-18 | $ | 0.00166900 | $ | 0.00162650 | $ | 0.00166900 | — | $ | 0.00158280 | ||||||||||||
| 1-May-18 | 31-Jul-18 | $ | 0.00166900 | $ | 0.00162650 | $ | 0.00166900 | — | $ | 0.00158280 | ||||||||||||
| 1-Aug-18 | 31-Oct-18 | $ | 0.00166900 | $ | 0.00162650 | $ | 0.00166900 | $ | 0.00164790 | $ | 0.00158280 | |||||||||||
| 1-Nov-18 | 31-Jan-19 | $ | 0.00166900 | $ | 0.00162650 | $ | 0.00166900 | $ | 0.00164790 | $ | 0.00158280 | |||||||||||
| 1-Feb-19 | 30-Apr-19 | $ | 0.00166900 | $ | 0.00162650 | $ | 0.00166900 | $ | 0.00164790 | $ | 0.00158280 | |||||||||||
| 1-May-19 | 31-Jul-19 | $ | 0.00166900 | $ | 0.00162650 | $ | 0.00166900 | $ | 0.00164790 | $ | 0.00158280 | |||||||||||
| 1-Aug-19 | 31-Oct-19 | $ | 0.00166900 | $ | 0.00162650 | $ | 0.00166900 | $ | 0.00164790 | $ | 0.00158280 | |||||||||||
| 1-Nov-19 | 31-Dec-19 | $ | 0.00166900 | $ | 0.00162650 | $ | 0.00166900 | $ | 0.00164790 | $ | 0.00158280 | |||||||||||
F-33
GREENBACKER RENEWABLE ENERGY COMPANY LLC AND SUBSIDIARIES
NOTES TO CONSOLIDATED FINANCIAL STATEMENTS
December 31, 2019
Note 8. Distributions (cont.)
The following table reflects the distributions declared during the year ended December 31, 2019:
| Pay Date | Paid in Cash | Values of Shares Issued Under DRP | Total | |||||||||
| February 1, 2019 | $ | 1,317,325 | $ | 583,571 | $ | 1,900,896 | ||||||
| March 1, 2019 | 1,247,614 | 552,615 | 1,800,229 | |||||||||
| April 1, 2019 | 1,452,585 | 611,400 | 2,063,985 | |||||||||
| May 1, 2019 | 1,438,057 | 600,614 | 2,038,671 | |||||||||
| June 3, 2019 | 1,553,801 | 622,584 | 2,176,385 | |||||||||
| July 1, 2019 | 1,764,339 | 383,813 | 2,148,152 | |||||||||
| August 1, 2019 | 1,850,929 | 393,237 | 2,244,166 | |||||||||
| September 2, 2019 | 1,664,451 | 613,333 | 2,277,784 | |||||||||
| October 1, 2019 | 1,647,779 | 589,769 | 2,237,548 | |||||||||
| November 1, 2019 | 1,715,922 | 609,493 | 2,325,415 | |||||||||
| December 2, 2019 | 1,693,670 | 587,119 | 2,280,789 | |||||||||
| January 1, 2020 | 1,784,956 | 605,129 | 2,390,085 | |||||||||
| Total | $ | 19,131,428 | $ | 6,752,677 | $ | 25,884,105 | ||||||
The following table reflects the distributions declared during the year ended December 31, 2018:
| Pay Date | Paid in Cash | Value of Shares Issued under DRP | Total | |||||||||
| February 1, 2018 | $ | 728,738 | $ | 464,821 | $ | 1,193,559 | ||||||
| March 1, 2018 | 682,039 | 428,310 | 1,110,349 | |||||||||
| April 2, 2018 | 790,925 | 474,370 | 1,265,295 | |||||||||
| May 1, 2018 | 792,185 | 475,874 | 1,268,059 | |||||||||
| June 1, 2018 | 883,662 | 507,728 | 1,391,390 | |||||||||
| July 2, 2018 | 927,638 | 502,333 | 1,429,971 | |||||||||
| August 1, 2018 | 1,013,883 | 529,333 | 1,543,216 | |||||||||
| September 4, 2018 | 1,078,310 | 541,479 | 1,619,789 | |||||||||
| October 1, 2018 | 1,097,313 | 529,751 | 1,627,064 | |||||||||
| November 1, 2018 | 1,178,736 | 555,383 | 1,734,119 | |||||||||
| December 3, 2018 | 1,177,142 | 546,446 | 1,723,588 | |||||||||
| January 2, 2019 | 1,260,777 | 570,961 | 1,831,738 | |||||||||
| Total | $ | 11,611,348 | $ | 6,126,789 | $ | 17,738,137 | ||||||
The following table reflects the distributions declared during the year ended December 31, 2017:
| Pay Date | Paid in Cash | Value of Shares Issued under DRP | Total | |||||||||
| February 1, 2017 | $ | 431,686 | $ | 349,842 | $ | 781,528 | ||||||
| March 1, 2017 | 413,270 | 332,761 | 746,031 | |||||||||
| April 3, 2017 | 482,113 | 371,902 | 854,015 | |||||||||
| May 1, 2017 | 486,864 | 370,463 | 857,327 | |||||||||
| June 1, 2017 | 524,909 | 383,585 | 908,494 | |||||||||
| July 3, 2017 | 534,165 | 382,339 | 916,504 | |||||||||
| August 1, 2017 | 572,833 | 406,993 | 979,826 | |||||||||
| September 1, 2017 | 600,962 | 415,864 | 1,016,826 | |||||||||
| October 2, 2017 | 603,869 | 411,848 | 1,015,717 | |||||||||
| November 1, 2017 | 637,604 | 436,753 | 1,074,357 | |||||||||
| December 1, 2017 | 656,495 | 430,860 | 1,087,355 | |||||||||
| January 2, 2018 | 711,306 | 454,324 | 1,165,630 | |||||||||
| Total | $ | 6,656,076 | $ | 4,747,534 | $ | 11,403,610 | ||||||
F-34
GREENBACKER RENEWABLE ENERGY COMPANY LLC AND SUBSIDIARIES
NOTES TO CONSOLIDATED FINANCIAL STATEMENTS
December 31, 2019
Note 8. Distributions (cont.)
All distributions paid for the year ended December 31, 2019 are expected to be reported as a return of capital to members for tax reporting purposes and all distributions paid for the years ended December 31, 2018 and 2017 were reported as a return of capital to members for tax purposes.
Cash distributions paid during the periods presented were funded from the following sources noted below:
| For the year ended December 31, 2019 | For the year ended December 31, 2018 | For the year ended December 31, 2017 | ||||||||||
| Cash from operations | $ | 4,088,660 | $ | 11,611,348 | $ | 6,656,075 | ||||||
| Offering proceeds | 15,042,768 | — | — | |||||||||
| Total cash distributions | $ | 19,131,428 | $ | 11,611,348 | $ | 6,656,075 | ||||||
The company expects to continue to fund distributions from a combination of cash from operations as well as offering proceeds. Due to the company’s change in investment portfolio composition in 2018 to include a greater percentage of pre-operational assets, a significant amount of distributions will continue to be funded from offering proceeds.
Note 9. Income Taxes
The LLC conducts most of its operations through GREC, its taxable wholly-owned subsidiary. The consolidated income tax provision for the years ended December 31, 2019, 2018 and 2017 is comprised of the following:
| Current | Deferred | Total | ||||||||||
| Year ended December 31, 2019: | ||||||||||||
| US federal | $ | - | $ | 3,551,704 | $ | 3,551,704 | ||||||
| State and local | - | (44,946 | ) | (44,946 | ) | |||||||
| Foreign jurisdiction | - | - | - | |||||||||
| Tax (benefit) expense | $ | - | $ | 3,506,758 | $ | 3,506,758 | ||||||
| Change in valuation allowance | - | 1,231,693 | 1,231,693 | |||||||||
| Deferred tax (benefit) expense | - | (3,188,431 | ) | (3,188,431 | ) | |||||||
| Change in benefit from deferred taxes on unrealized depreciation on investments | - | 7,926,882 | 7,926,882 | |||||||||
| Tax (benefit) expense, net | $ | - | $ | 4,738,451 | $ | 4,738,451 | ||||||
| Current | Deferred | Total | ||||||||||
| Year ended December 31, 2018: | ||||||||||||
| US federal | $ | - | $ | (1,218,349 | ) | $ | (1,218,349 | ) | ||||
| State and local | - | (254,810 | ) | (254,810 | ) | |||||||
| Foreign jurisdiction | - | - | - | |||||||||
Tax benefit/(expense) | $ | - | $ | (1,473,159 | ) | $ | (1,473,159 | ) | ||||
| Change in valuation allowance | - | (54,758 | ) | (54,758 | ) | |||||||
| Tax benefit/(expense), net | $ | - | $ | (1,527,917 | ) | $ | (1,527,917 | ) | ||||
| Current | Deferred | Total | ||||||||||
| Year ended December 31, 2017: | ||||||||||||
| US federal | $ | - | $ | 1,289,202 | $ | 1,289,202 | ||||||
| State and local | - | 273,787 | 273,787 | |||||||||
| Foreign jurisdiction | - | - | - | |||||||||
Tax (benefit) expense | $ | - | $ | 1,562,989 | $ | 1,562,989 | ||||||
| Change in valuation allowance | - | 92,366 | 92,366 | |||||||||
| Tax benefit/(expense), net | $ | - | $ | 1,655,355 | $ | 1,655,355 | ||||||
F-35
GREENBACKER RENEWABLE ENERGY COMPANY LLC AND SUBSIDIARIES
NOTES TO CONSOLIDATED FINANCIAL STATEMENTS
December 31, 2019
Note 9. Income Taxes (cont.)
The following table represents the components of the income tax expense and the proportionate ratio of each components as follows:
| 2019 | Percentage | 2018 | Percentage | 2017 | Percentage | |||||||||||||||||||
| Net increase in net assets from operations before tax, based on ASC 946, at the federal income tax rate | $ | 7,125,202 | 150.37 | % | $ | 2,523,711 | (165.17 | )% | $ | 2,793,488 | 168.75 | % | ||||||||||||
| Add: Greenbacker Renewable Energy, LLC’s loss treated as a partnership for U.S. tax purposes, at federal income tax rate | $ | 1,387,056 | 29.27 | % | $ | 283,062 | (18.53 | )% | $ | 337,284 | 20.38 | % | ||||||||||||
| Add: Greenbacker Renewable Energy Corporation’s consolidated book (loss) based on standard GAAP accounting, at federal income tax rate | $ | (4,713,909 | ) | (99.48 | )% | $ | (3,769,926 | ) | 246.74 | % | $ | (2,225,352 | ) | (134.43 | )% | |||||||||
| Federal tax credit | $ | (246,645 | ) | (5.21 | )% | $ | (255,196 | ) | 16.70 | % | $ | - | - | % | ||||||||||
| Increase in income taxes resulting from: | ||||||||||||||||||||||||
| State and local taxes, net of federal benefit | $ | 969,124 | 20.45 | % | $ | (270,036 | ) | 17.67 | % | $ | 261,224 | 15.78 | % | |||||||||||
| Change in state rate | $ | (1,014,070 | ) | (21.40 | )% | $ | 15,226 | (1.00 | )% | $ | 12,562 | 0.76 | % | |||||||||||
| Change in federal rate | $ | - | - | % | $ | - | - | % | $ | 383,783 | 23.18 | % | ||||||||||||
| Change in valuation allowances | $ | 1,231,693 | 26.00 | % | $ | (54,758 | ) | 3.59 | % | $ | 92,366 | 5.58 | % | |||||||||||
| Actual provision for income taxes | $ | 4,738,451 | 100.00 | % | $ | (1,527,917 | ) | 100.00 | % | $ | 1,655,355 | 100.00 | % | |||||||||||
F-36
GREENBACKER RENEWABLE ENERGY COMPANY LLC AND SUBSIDIARIES
NOTES TO CONSOLIDATED FINANCIAL STATEMENTS
December 31, 2019
Note 9. Income Taxes (cont.)
Deferred tax assets have been classified on the accompanying consolidated statements of assets and liabilities as of December 31, 2019 and 2018 as follows:
| 2019 | 2018 | |||||||
| Amortization | 53,558 | 60,181 | ||||||
| Net operating losses | 27,935,648 | 21,289,433 | ||||||
| Federal tax credits | 7,046,772 | 5,756,076 | ||||||
| Unrealized gains | (32,223,751 | ) | (20,786,706 | ) | ||||
| Deferred tax assets | 2,812,227 | $ | 6,318,984 | |||||
| Less: valuation allowance | (1,498,721 | ) | (267,027 | ) | ||||
| Deferred tax assets, net | 1,313,506 | $ | 6,051,957 | |||||
As of December 31, 2019, the company has federal and state income tax net operating loss (“NOL”) and investment tax credit (“ITC”) carryforwards of which will expire on various dates through 2039 as follows:
| Expires Year Ending December 31, | Federal NOL Amount | Federal ITC Amount | State ITC Amount | State NOL Amount | ||||||||||||
| 2020 | $ | — | $ | — | $ | 802,822 | — | |||||||||
| 2021 | $ | — | $ | — | $ | 422,885 | $ | — | ||||||||
| 2022 | $ | — | $ | — | $ | — | $ | 918,368 | ||||||||
| 2023 | $ | — | $ | — | $ | — | $ | 2,454,562 | ||||||||
| 2024 | $ | — | $ | — | $ | — | $ | 2,549,437 | ||||||||
| 2025 | $ | — | $ | — | $ | — | $ | 673,181 | ||||||||
| 2026 | $ | — | $ | — | $ | — | $ | 2,934,175 | ||||||||
| 2027 | $ | — | $ | — | $ | — | $ | 4,162,481 | ||||||||
| 2028 | $ | — | $ | — | $ | — | $ | 10,579,879 | ||||||||
| 2029 | $ | — | $ | — | $ | — | $ | — | ||||||||
| 2030 | $ | — | $ | — | $ | — | $ | 2,751,775 | ||||||||
| 2031 | $ | — | $ | — | $ | — | $ | 5,377,684 | ||||||||
| 2032 | $ | — | $ | — | $ | — | $ | 8,015,544 | ||||||||
| 2033 | $ | — | $ | — | $ | — | $ | 7,163,874 | ||||||||
| 2034 | $ | 161,963 | $ | — | $ | — | $ | 156,188 | ||||||||
| 2035 | $ | 6,693,198 | $ | 3,345,092 | $ | — | $ | 2,718,197 | ||||||||
| 2036 | $ | 15,734,069 | $ | 1,955,780 | $ | — | $ | 5,911,423 | ||||||||
| 2037 | $ | 26,927,165 | $ | — | $ | — | $ | 13,684,243 | ||||||||
| 2038 | $ | 35,706,007 | $ | 273,548 | $ | — | $ | 18,592,693 | ||||||||
| 2039 | $ | 20,866,683 | $ | 246,645 | $ | — | $ | — | ||||||||
| Indefinite | $ | — | $ | — | $ | — | $ | — | ||||||||
As new tax legislation was enacted on December 22, 2017, commonly referred to as the Tax Cuts and Jobs Act (the “Act”), the company recognized the effect of any material changes in the Act in the determination of deferred tax assets and liabilities for the year ending December 31, 2017. The major aspects of the Act which affected the company included 1) the reduction of the corporate tax rate to 21%, effective December 22, 2017, which caused the company to remeasure its deferred tax assets and liabilities to reflect the effects of tax rate change; and 2) a deduction of interest expense up to only 30% of “adjusted taxable income” (as defined in the Act) ) and the ability of post 2017 net operating losses (“NOLs”) to only offset up to 80% of taxable income, with the understanding that any unused NOL can be carried forward indefinitely, which caused the company to modify certain assumptions in regard to utilization of NOL and investment tax credits in determining any potential valuation allowance. While cost recovery was modified to allow companies to expense 100% of investments in depreciable property, the company expects to continue to depreciate renewable energy assets over a five-year life using accelerated methodology.
In assessing the realizability of deferred tax assets, management considers whether it is more likely than not that some portion or all of the deferred tax assets will not be realized. The ultimate realization of deferred tax assets is dependent upon the generation of future taxable income during the periods in which those temporary differences become deductible. Management considers the scheduled reversal of deferred tax assets, projected future taxable income, and tax planning strategies in making this assessment. Based upon projections for future taxable income over the periods in which the deferred tax assets would be deductible, management as of December 31, 2019 has applied a partial valuation allowance of $1,498,721 against the deferred tax asset amounts the company will not be able to fully realize, as compared with $267,027 for the year ended December 31, 2018.
The company follows the authoritative guidance on accounting for uncertainty in income taxes and concluded it has no material uncertain tax positions to be recognized as of December 31, 2019.
The company assessed its tax positions and filings for all open tax years as of December 31, 2019 for all federal and state tax jurisdictions for the years 2014 through 2019. The results of this assessment are included in the company’s tax provision and deferred tax assets as of December 31, 2019.
F-37
GREENBACKER RENEWABLE ENERGY COMPANY LLC AND SUBSIDIARIES
NOTES TO CONSOLIDATED FINANCIAL STATEMENTS
December 31, 2019
Note 10. Commitments and Contingencies
Legal proceedings: The company may become involved in legal proceedings, administrative proceedings, claims and other litigation that arise in the ordinary course of business. Individuals and interest groups may sue to challenge the issuance of a permit for a renewable energy project or seek to enjoin construction of a wind energy project. In addition, we may be subject to legal proceedings or claims contesting the construction or operation of our renewable energy projects. In defending ourselves in these proceedings, we may incur significant expenses in legal fees and other related expenses, regardless of the outcome of such proceedings. Unfavorable outcomes or developments relating to these proceedings, such as judgments for monetary damages, injunctions or denial or revocation of permits, could have a material adverse effect on our business, financial condition and results of operations. In addition, settlement of claims could adversely affect our financial condition and results of operations. As of December 31, 2019, management is not aware of any legal proceedings that might have a significant adverse impact on the company.
Pledge of collateral and unsecured guarantee of loans to subsidiaries: Pursuant to various project loan agreements between the operating entities of the company, subsidiary holding companies and various lenders, the operating entities and the subsidiary holding companies have pledged all solar operating assets as well as the membership interests in various operating subsidiaries as collateral for the term loans with maturity dates ranging from January 2021 through September 2049. Pursuant to a credit agreement between GREC, HoldCo and a financial institution, HoldCo has pledged all solar operating assets as well as all membership interests in operating subsidiaries owned by GREC HoldCo as collateral for the loan.
Investment in to be constructed assets: Pursuant to various engineering, procurement and construction contracts to which 9 entities of the company are individually a party, the entities, and indirectly the company, has committed an outstanding balance of approximately $163.2 million to complete construction of the facilities. Based upon current construction schedules, the expectation is these commitments will be fulfilled in 2020 into 2021. We also have 10 entities of the company that are individually a party, and indirectly the company, and committed an outstanding balance of approximately $180.8 million to membership interest purchase agreements as of December 31, 2019. The company plans to use debt and tax equity financing as well as additional capital raised to fund such commitments.
Investment in operating assets: In September 2019, GREC signed a purchase and sale agreement to acquire an interest in Greenbacker Wind – Iowa, which is comprised of two projects Elk and Hawkeye. Elk is a 42.5 MW operating wind farm located in Delaware County, Iowa, and Hawkeye is a 37.5 MW operating wind farm located in Fayette County, Iowa. Elk and Hawkeye reached their COD in 2011 and 2012, respectively, and originally secured 20 and 25-year busbar PPAs with an investment-grade utility. This acquisition has received regulatory approval and closed subsequent to year-end.
Unsecured guarantee of subsidiary renewable energy credit (“REC”) forward contracts: For the majority of the forward REC contracts currently effective as of December 31, 2019 where a subsidiary of the company is the principal, the company has provided an unsecured guarantee related to the delivery obligations. The amount of the unsecured guaranty related to REC delivery performance obligations is approximately $883,275 as of December 31, 2019.
See Note 1 — Organization and Operations of the Company and Note 5 — Related Party Agreements and Transactions Agreements for an additional discussion of the company’s commitments and contingencies.
F-38
GREENBACKER RENEWABLE ENERGY COMPANY LLC AND SUBSIDIARIES
NOTES TO CONSOLIDATED FINANCIAL STATEMENTS
December 31, 2019
Note 11. Financial Highlights
The following is a schedule of financial highlights of the company attributed to Class A, C, I, P-A and P-I shares for the year ended December 31, 2019.
| For the year ended December 31, 2019 | ||||||||||||||||||||
| Class A Shares | Class C Shares | Class I Shares | Class P-A Shares | Class P-I Shares | ||||||||||||||||
| Per share data attributed to common shares (1): | ||||||||||||||||||||
| Net Asset Value at beginning of period | $ | 8.54 | $ | 8.34 | $ | 8.54 | $ | 8.55 | $ | 8.76 | ||||||||||
| Net investment income (3) | 0.17 | 0.17 | 0.17 | 0.17 | 0.17 | |||||||||||||||
| Net realized and unrealized gain/(loss) on investments, net of incentive allocation to special unitholder | 0.80 | 0.80 | 0.80 | 0.80 | 0.80 | |||||||||||||||
| Change in translation of assets and liabilities denominated in foreign currencies (4) | - | - | - | - | - | |||||||||||||||
| Change in benefit from deferred taxes on unrealized depreciation on investments | (0.18 | ) | (0.18 | ) | (0.18 | ) | (0.18 | ) | (0.18 | ) | ||||||||||
| Net increase in net assets attributed to common stockholders | 0.79 | 0.79 | 0.79 | 0. 79 | 0.79 | |||||||||||||||
| Shareholder distributions: | ||||||||||||||||||||
| Distributions from net investment income | (0.10 | ) | (0.10 | ) | (0.10 | ) | (0.10 | ) | (0.10 | ) | ||||||||||
| Distributions from offering proceeds | (0.51 | ) | (0.50 | ) | (0.51 | ) | (0.51 | ) | (0.48 | ) | ||||||||||
| Offering costs and deferred sales commissions | (0.02 | ) | (0.05 | ) | (0.02 | ) | - | - | ||||||||||||
| Other (2) | (0.14 | ) | (0.10 | ) | (0.13 | ) | (0.13 | ) | (0.07 | ) | ||||||||||
| Net decrease in members’ equity attributed to common shares | (0.77 | ) | (0.75 | ) | (0.76 | ) | (0.74 | ) | (0.65 | ) | ||||||||||
| Net asset value for common shares at end of period | $ | 8.56 | $ | 8.38 | $ | 8.56 | $ | 8.60 | $ | 8.90 | ||||||||||
| Common members’ equity at end of period | $ | 147,304,141 | $ | 22,792,345 | $ | 57,292,421 | $ | 155,802 | $ | 189,009,074 | ||||||||||
| Common shares outstanding at end of period | 17,210,016 | 2,718,475 | 6,693,658 | 18,109 | 21,249,352 | |||||||||||||||
| Ratio/Supplemental data for common shares (annualized): | ||||||||||||||||||||
| Total return attributed to common shares based on net asset value | 8.06 | % | 7.79 | % | 8.05 | % | 7.66 | % | 8.49 | % | ||||||||||
| Ratio of net investment income to average net assets | 1.97 | % | 1.98 | % | 1.95 | % | 1.96 | % | 1.91 | % | ||||||||||
| Ratio of operating expenses to average net assets | 3.94 | % | 3.96 | % | 3.90 | % | 3.92 | % | 3.81 | % | ||||||||||
| Portfolio turnover rate | 14.04 | % | 14.04 | % | 14.04 | % | 14.04 | % | 14.04 | % | ||||||||||
| (1) | The per share data for Class A, C, I, P-A and P-I Shares were derived by using the weighted average shares outstanding during the year ended December 31, 2019, which were 17,270,555, 2,645,713, 6,642,314, 17,841, and 17,211,763, respectively. |
| (2) | Represents the impact of different share amounts used in calculating certain per share data based on weighted average shares outstanding during the period and the impact of shares at a price other than the net asset value. |
| (3) | Does not reflect any incentive fees that may be payable to the Special Unitholder. |
| (4) | Amount is less than $0.01 per share. |
F-39
GREENBACKER RENEWABLE ENERGY COMPANY LLC AND SUBSIDIARIES
NOTES TO CONSOLIDATED FINANCIAL STATEMENTS
December 31, 2019
Note 11. Financial Highlights (cont.)
The following is a schedule of financial highlights of the company attributed to Class A, C, I, P-A and P-I shares for the year ended December 31, 2018.
| For the year ended December 31, 2018 | ||||||||||||||||||||
Class A Shares | Class C Shares | Class I Shares | Class P-A Shares (5) | Class P-I Shares | ||||||||||||||||
| Per share data attributed to common shares (1): | ||||||||||||||||||||
| Net Asset Value at beginning of period | $ | 8.68 | $ | 8.42 | $ | 8.68 | $ | 8.75 | $ | 8.81 | ||||||||||
| Net investment income (3) | 0.28 | 0.28 | 0.28 | 0.07 | 0.28 | |||||||||||||||
| Net realized and unrealized gain/(loss) on investments, net of incentive allocation to special unitholder | 0.12 | 0.12 | 0.12 | (0.05 | ) | 0.12 | ||||||||||||||
| Change in translation of assets and liabilities denominated in foreign currencies (4) | - | - | - | - | - | |||||||||||||||
| Change in benefit from deferred taxes on unrealized depreciation on investments | 0.08 | 0.08 | 0.08 | 0.12 | 0.08 | |||||||||||||||
| Net increase in net assets attributed to common members | 0.48 | 0.48 | 0.48 | 0.14 | 0.48 | |||||||||||||||
| Shareholder distributions: | ||||||||||||||||||||
| Distributions from net investment income | (0.33 | ) | (0.33 | ) | (0.33 | ) | (0.08 | ) | (0.30 | ) | ||||||||||
| Distributions from offering proceeds | (0.28 | ) | (0.26 | ) | (0.28 | ) | (0.14 | ) | (0.28 | ) | ||||||||||
| Offering costs and deferred sales commissions | (0.03 | ) | (0.08 | ) | (0.04 | ) | (0.14 | ) | - | |||||||||||
| Other (2) | 0.02 | 0.11 | 0.03 | 0.02 | 0.05 | |||||||||||||||
| Net decrease in members’ equity attributed to common shares | (0.62 | ) | (0.56 | ) | (0.62 | ) | (0.34 | ) | (0.53 | ) | ||||||||||
| Net asset value for common shares at end of period | $ | 8.54 | $ | 8.34 | $ | 8.54 | $ | 8.55 | $ | 8.76 | ||||||||||
| Common shareholders’ equity at end of period | $ | 142,791,899 | $ | 18,546,310 | $ | 53,046,260 | $ | 132,272 | $ | 103,742,870 | ||||||||||
| Common shares outstanding at end of period | 16,714,738 | 2,222,478 | 6,209,416 | 15,478 | 11,841,392 | |||||||||||||||
| Ratio/Supplemental data for common shares (annualized): | ||||||||||||||||||||
| Total return attributed to common shares based on net asset value | 5.45 | % | 6.19 | % | 5.44 | % | 1.06 | % | 6.16 | % | ||||||||||
| Ratio of net investment income to average net assets | 3.24 | % | 3.26 | % | 3.20 | % | 1.97 | % | 2.86 | % | ||||||||||
| Ratio of operating expenses to average net assets | 3.87 | % | 3.95 | % | 3.86 | % | 3.48 | % | 3.69 | % | ||||||||||
| Portfolio turnover rate | 0.05 | % | 0.05 | % | 0.05 | % | 0.05 | % | 0.05 | % | ||||||||||
| (1) | The per share data for Class A, C, I, P-A and P-I Shares were derived by using the weighted average shares outstanding during the year ended December 31, 2018, which were 15,338,291, 1,803,985, 5,386,556, 11,042, and 7,266,426, respectively. |
| (2) | Represents the impact of different share amounts used in calculating certain per share data based on weighted average shares outstanding during the period and the impact of shares at a price other than the net asset value. |
| (3) | Does not reflect any incentive fees that may be payable to the Special Unitholder. |
| (4) | Amount is less than $0.01 per share. |
| (5) | Class P-A shares were reinstated for sale as of April 16, 2018 and first sold on August 6, 2018. |
F-40
GREENBACKER RENEWABLE ENERGY COMPANY LLC AND SUBSIDIARIES
NOTES TO CONSOLIDATED FINANCIAL STATEMENTS
December 31, 2019
Note 11. Financial Highlights (cont.)
The following is a schedule of financial highlights of the company attributed to Class A, C, I and P-I shares for the year ended December 31, 2017.
| For the year ended December 31, 2017 | ||||||||||||||||
Class A Shares | Class C Shares | Class I Shares | Class P-I Shares | |||||||||||||
| Per share data attributed to common shares (1): | ||||||||||||||||
| Net Asset Value at beginning of period | $ | 8.69 | $ | 8.44 | $ | 8.69 | $ | 8.67 | ||||||||
| Net investment income (3) | 0.25 | 0.25 | 0.25 | 0.25 | ||||||||||||
| Net realized and unrealized gain/(loss) on investments, net of incentive allocation to special unitholder | 0.35 | 0.35 | 0.35 | 0.35 | ||||||||||||
| Change in translation of assets and liabilities denominated in foreign currencies (4) | 0.01 | 0.01 | 0.01 | 0.01 | ||||||||||||
| Change in benefit from deferred taxes on unrealized depreciation on investments | 0.05 | 0.05 | 0.05 | 0.05 | ||||||||||||
| Net increase in net assets attributed to common members | 0.66 | 0.66 | 0.66 | 0.66 | ||||||||||||
| Shareholder distributions: Distributions from net investment income | (0.39 | ) | (0.39 | ) | (0.39 | ) | (0.39 | ) | ||||||||
| Distributions from offering proceeds | (0.22 | ) | (0.22 | ) | (0.21 | ) | (0.19 | ) | ||||||||
| Offering costs and deferred sales commissions. | (0.04 | ) | (0.15 | ) | (0.08 | ) | - | |||||||||
| Other (2) | (0.02 | ) | 0.08 | 0.01 | 0.06 | |||||||||||
| Net decrease in members’ equity attributed to common shares | (0.01 | ) | (0.02 | ) | (0.01 | ) | 0.14 | |||||||||
| Net asset value for common shares at end of period | $ | 8.68 | $ | 8.42 | $ | 8.68 | $ | 8.81 | ||||||||
| Common shareholders’ equity at end of period | $ | 120,344,517 | $ | 12,053,349 | $ | 39,181,769 | $ | 29,858,889 | ||||||||
| Common shares outstanding at end of period | 13,857,830 | 1,431,999 | 4,511,832 | 3,387,568 | ||||||||||||
| Ratio/Supplemental data for common shares (annualized): | ||||||||||||||||
| Total return attributed to common shares based on net asset value | 6.90 | % | 6.77 | % | 6.90 | % | 8.65 | % | ||||||||
| Ratio of net investment income to average net assets | 2.96 | % | 3.04 | % | 2.96 | % | 2.92 | % | ||||||||
| Ratio of operating expenses to average net assets. | 3.64 | % | 3.74 | % | 3.64 | % | 3.59 | % | ||||||||
| Portfolio turnover rate | 19.15 | % | 19.15 | % | 19.15 | % | 19.15 | % | ||||||||
| (1) | The per share data for Class A, C, I and P-I Shares were derived by using the weighted average shares outstanding during the year ended December 31, 2017, which were 12,384,101, 1,194,718, 3,529,998 and 1,792,632, respectively. |
| (2) | Represents the impact of different share amounts used in calculating certain per share data based on weighted average shares outstanding during the period and the impact of shares at a price other than the net asset value. |
| (3) | Does not reflect any incentive fees that may be payable to the Special Unitholder. |
| (4) | Amount is less than $0.01 per share. |
F-41
GREENBACKER RENEWABLE ENERGY COMPANY LLC AND SUBSIDIARIES
NOTES TO CONSOLIDATED FINANCIAL STATEMENTS
December 31, 2019
Note 12. Selected Quarterly Data (Unaudited)
Presented in the following tables is a summary of the unaudited quarterly financial information for the years ended December 31, 2019, 2018, 2017, 2016, and 2015. The company believes that all necessary adjustments, consisting only of normal recurring adjustments, have been included in the amounts stated below to present fairly, and in accordance with GAAP, the selected quarterly information.
| For the quarter ended | ||||||||||||||||
| December 31, 2019 | September 30, 2019 | June 30, 2019 | March 31, 2019 | |||||||||||||
| Total Investment income | $ | 4,640,954 | $ | 6,679,823 | $ | 4,876,003 | $ | 2,565,925 | ||||||||
| Net investment income | $ | 4,587,394 | $ | 2,067,331 | $ | 1,417,709 | $ | (795,343 | ) | |||||||
| Net gain(loss) on investments and foreign currency translation | $ | 5,248,381 | $ | 16,589,939 | $ | 6,098,299 | $ | 7,281,283 | ||||||||
| Change in (benefit) expense from deferred taxes on unrealized appreciation on investments | $ | (3,383,241 | ) | $ | (2,463,723 | ) | $ | (1,482,457 | ) | $ | (597,461 | ) | ||||
| Net increase (decrease) in net assets resulting from operations | $ | 6,452,534 | $ | 16,193,547 | $ | 6,033,551 | $ | 5,888,479 | ||||||||
| Net investment income (loss) per share - basic and diluted | $ | 0.10 | $ | 0.05 | $ | - | $ | (0.02 | ) | |||||||
| Net increase (decrease) in net assets resulting from operations per share - basic and diluted. | $ | 0.15 | $ | 0.36 | $ | 0.10 | $ | 0.15 | ||||||||
| Net asset value per share at period end (Class A) | $ | 8.60 | $ | 8.62 | $ | 8.48 | $ | 8.50 | ||||||||
| Net asset value per share at period end (Class C) | $ | 8.38 | $ | 8.44 | $ | 8.31 | $ | 8.32 | ||||||||
| Net asset value per share at period end (Class I) | $ | 8.60 | $ | 8.62 | $ | 8.48 | $ | 8.50 | ||||||||
| Net asset value per share at period end (Class P-A) | $ | 8.60 | $ | 8.65 | $ | 8.51 | $ | 8.53 | ||||||||
| Net asset value per share at period end (Class P-I) | $ | 8.90 | $ | 8.93 | $ | 8.77 | $ | 8.76 | ||||||||
| For the quarter ended | ||||||||||||||||
| December
31, 2018 | September
30, 2018 | June
30, 2018 | March
31, 2018 | |||||||||||||
| Total Investment income | $ | 4,540,427 | $ | 5,103,336 | $ | 4,984,874 | $ | 4,918,793 | ||||||||
| Net investment income | $ | (434,963 | ) | $ | 1,988,378 | $ | 3,259,425 | $ | 3,271,370 | |||||||
| Net gain (loss) on investments and foreign currency translation | $ | (1,693,642 | ) | $ | (296,054 | ) | $ | 2,341,771 | $ | 2,452,402 | ||||||
| Change in (benefit) expense from deferred taxes on unrealized appreciation on investments | $ | 1,877,386 | $ | 2,275,076 | $ | 73,354 | $ | (1,239,228 | ) | |||||||
| Net increase (decrease) in net assets resulting from operations | $ | (251,219 | ) | $ | 3,967,400 | $ | 5,674,550 | $ | 4,484,544 | |||||||
| Net investment income (loss) per share - basic and diluted | $ | (0.01 | ) | $ | 0.06 | $ | 0.12 | $ | 0.13 | |||||||
| Net increase (decrease) in net assets resulting from operations per share - basic and diluted | $ | (0.01 | ) | $ | 0.12 | $ | 0.21 | $ | 0.19 | |||||||
| Net asset value per share at period end (Class A) | $ | 8.54 | $ | 8.69 | $ | 8.72 | $ | 8.70 | ||||||||
| Net asset value per share at period end (Class C) | $ | 8.34 | $ | 8.48 | $ | 8.50 | $ | 8.45 | ||||||||
| Net asset value per share at period end (Class I) | $ | 8.54 | $ | 8.69 | $ | 8.72 | $ | 8.70 | ||||||||
| Net asset value per share at period end (Class P-A) | $ | 8.55 | $ | 8.71 | $ | — | $ | — | ||||||||
| Net asset value per share at period end (Class P-I) | $ | 8.76 | $ | 8.89 | $ | 8.90 | $ | 8.84 | ||||||||
| For the quarter ended | ||||||||||||||||
December 31, 2017 | September 30, 2017 | June 30, 2017 | March 31, 2017 | |||||||||||||
| Total investment income | $ | 4,416,117 | $ | 3,663,635 | $ | 2,936,470 | $ | 2,366,899 | ||||||||
| Net investment income | $ | 229,297 | $ | 1,149,977 | $ | 1,986,899 | $ | 1,450,378 | ||||||||
| Net gain (loss) on investments and foreign currency translation | $ | 3,738,403 | $ | 1,579,619 | $ | 1,576,272 | $ | (108,245 | ) | |||||||
| Change in benefit (expense) from deferred taxes on unrealized appreciation on investments | $ | 1,198,186 | $ | 680,969 | $ | (653,366 | ) | $ | (262,069 | ) | ||||||
| Net increase in net assets resulting from operations. | $ | 5,165,886 | $ | 3,410,565 | $ | 2,909,805 | $ | 1,080,064 | ||||||||
| Net investment income per share – basic and diluted. | $ | (0.01 | ) | $ | 0.06 | $ | 0.11 | $ | 0.09 | |||||||
| Net increase in net assets resulting from operations per share – basic and diluted. | $ | 0.22 | $ | 0.16 | $ | 0.15 | $ | 0.07 | ||||||||
| Net asset value per share at period end (Class A). | $ | 8.68 | $ | 8.64 | $ | 8.63 | $ | 8.64 | ||||||||
| Net asset value per share at period end (Class C). | $ | 8.42 | $ | 8.42 | $ | 8.41 | $ | 8.40 | ||||||||
| Net asset value per share at period end (Class I) | $ | 8.68 | $ | 8.64 | $ | 8.63 | $ | 8.64 | ||||||||
| Net asset value per share at period end (Class P-I). | $ | 8.81 | $ | 8.75 | $ | 8.73 | $ | 8.69 | ||||||||
F-42
GREENBACKER RENEWABLE ENERGY COMPANY LLC AND SUBSIDIARIES
NOTES TO CONSOLIDATED FINANCIAL STATEMENTS
December 31, 2019
Note 12. Selected Quarterly Data (Unaudited)
| For the quarter ended | ||||||||||||||||
December 31, 2016 | September 30, 2016 | June 30, 2016 | March 31, 2016 | |||||||||||||
| Total investment income | $ | 2,848,655 | $ | 3,085,513 | $ | 1,645,291 | $ | 656,566 | ||||||||
| Net investment income | $ | 1,497,148 | $ | 1,730,438 | $ | 1,519,649 | $ | 23,132 | ||||||||
| Net gain (loss) on investments and foreign currency translation | $ | (1,706,876 | ) | $ | 1,143,849 | $ | (231,426 | ) | $ | (634,047 | ) | |||||
| Change in benefit (expense) from deferred taxes on unrealized appreciation on investments | $ | 671,401 | $ | (8,372 | ) | $ | 1,838,292 | $ | 1,885,335 | |||||||
| Net increase in net assets resulting from operations | $ | 461,673 | $ | 2,865,915 | $ | 3,126,515 | $ | 1,274,420 | ||||||||
| Net investment income per share – basic and diluted | $ | 0.11 | $ | 0.14 | $ | 0.15 | $ | 0.00 | ||||||||
| Net increase in net assets resulting from operations per share – basic and diluted. | $ | 0.03 | $ | 0.24 | $ | 0.30 | $ | 0.16 | ||||||||
| Net asset value per share at period end (Class A) | $ | 8.69 | $ | 8.74 | $ | 8.69 | $ | 8.56 | ||||||||
| Net asset value per share at period end (Class C) | $ | 8.44 | $ | 8.49 | $ | 8.43 | $ | 8.56 | ||||||||
| Net asset value per share at period end (Class I) | $ | 8.69 | $ | 8.74 | $ | 8.69 | $ | 8.56 | ||||||||
| Net asset value per share at period end (Class P-A) | $ | 8.67 | $ | 8.74 | $ | - | $ | - | ||||||||
| Net asset value per share at period end (Class P-I) | $ | 8.67 | $ | 8.74 | $ | - | $ | - | ||||||||
| For the quarter ended | ||||||||||||||||
December 31, 2015 | September 30, 2015 | June 30, 2015 | March 31, 2015 | |||||||||||||
| Total investment income | $ | 421,488 | $ | 740,773 | $ | 633,646 | $ | 58,215 | ||||||||
| Net investment income (loss) | $ | 253,576 | $ | 270,523 | $ | 333,917 | $ | (118,483 | ) | |||||||
| Net gain (loss) on investments and foreign currency translation | $ | 666,498 | $ | 376,473 | $ | (46,396 | ) | $ | 385,490 | |||||||
| Change in benefit from deferred taxes on unrealized appreciation on investments | $ | 127,015 | $ | - | $ | - | $ | - | ||||||||
| Net increase in net assets resulting from operations | $ | 1,047,089 | $ | 646,996 | $ | 287,521 | $ | 267,007 | ||||||||
| Net investment income (loss) per share – basic and diluted | $ | 0.09 | $ | 0.07 | $ | 0.14 | $ | (0.08 | ) | |||||||
| Net increase in net assets resulting from operations per share – basic and diluted | $ | 0.20 | $ | 0.17 | $ | 0.12 | $ | 0.18 | ||||||||
| Net asset value per share at period end | $ | 8.54 | $ | 8.52 | $ | 8.50 | $ | 8.50 | ||||||||
Note 13. Subsequent Events
The company’s management has evaluated subsequent events through the date of issuance of the consolidated financial statements. There have been no subsequent events that occurred during such period that would require disclosure in the consolidated financial statements or would be required to be recognized in the consolidated financial statements as of the year ended December 31, 2019 except as discussed below:
On March 5, 2020, the company signed and closed a transaction to sell the entirety of its investments in the Greenbacker Residential Solar Portfolio and the Greenbacker Residential Solar Portfolio II. The Portfolios were sold to a residential roof top solar aggregator for approximately $45 million to enable the buyer to achieve broad economies of scale across a much larger portfolio of residential solar roof top assets.
F-43
ITEM 9. CHANGES IN AND DISAGREEMENTS WITH ACCOUNTANTS ON ACCOUNTING AND FINANCIAL 81 DISCLOSURE
None.
ITEM 9A. CONTROLS AND PROCEDURES
Disclosure Controls
In accordance with Rules 13a-15(b) and 15d-15(b) of the Securities Exchange Act of 1934, as amended (the “Exchange Act”), we, under the supervision and with the participation of our Chief Executive Officer and Chief Financial Officer, carried out an evaluation of the effectiveness of our disclosure controls and procedures (as defined in Rule 13a-15(e) and Rule 15d-15(e) of the Exchange Act) as of the end of the period covered by this Annual Report on Form 10-K and determined that the disclosure controls and procedures are effective. Our disclosure controls and procedures are designed to provide reasonable assurance that information we are required to disclose in the reports that we file or submit under the Exchange Act are recorded, processed and summarized and reported within the time period specified in the applicable rules and forms.
Management’s Report on Internal Control Over Financial Reporting
Our internal control over financial reporting is a process designed to provide reasonable assurance regarding the reliability of financial reporting and the preparation of financial statements for external purposes in accordance with GAAP. The internal control over financial reporting for the company includes those policies and procedures that (i) pertain to the maintenance of records that, in reasonable detail, accurately and fairly reflect the transactions and dispositions of assets; (ii) provide reasonable assurance that transactions are recorded as necessary to permit preparation of financial statements in accordance with GAAP, and that receipts and expenditures are being made only in accordance with authorizations of our management; and (iii) provide reasonable assurance regarding prevention or timely detection of unauthorized acquisition, use or disposition of assets that could have a material effect on the consolidated financial statements of the company.
Because of its inherent limitations, internal control over financial reporting may not prevent or detect misstatements. All internal control systems, no matter how well designed, have inherent limitations, including the possibility of human error and the circumvention of overriding controls. Accordingly, even effective internal control over financial reporting can provide only reasonable assurance with respect to financial statement preparation. Also, projections of any evaluation of effectiveness to future periods are subject to the risk that controls may become inadequate because of changes in conditions, or that the degree of compliance with the policies or procedures may deteriorate.
Our management assessed the effectiveness of the internal control over financial reporting as of December 31, 2019, based on the framework set forth by the Committee of Sponsoring Organizations of the Treadway Commission (COSO) in its 2013 framework as part of its assessment. Based on that assessment, our management concluded that, as of December 31, 2019, the internal control over financial reporting for the company is effective based on the criteria established in Internal Control-Integrated Framework.
This annual report does not include an attestation report of the company’s independent registered public accounting firm regarding internal control over financial reporting. Our management’s report was not subject to attestation by the company’s independent registered public accounting firm pursuant to the rules of the SEC that permit the company to provide only management’s report in this annual report.
Change in Internal Control Over Financial Reporting
No change occurred in our internal control over financial reporting (as defined in Rule 13a-15(f) and 15d-15(f) of the Exchange Act) during the year ended December 31, 2019 that has materially affected, or is reasonably likely to materially affect, our internal control over financial reporting.
Limitations on the Effectiveness of Controls
Any control system, no matter how well designed and operated, can only provide reasonable (but not absolute) assurance that its objectives will be met. Furthermore, no evaluation of controls can provide absolute assurance that all control issues and instances of fraud, if any, have been detected.
None.
90
ITEM 10. DIRECTORS, EXECUTIVE OFFICERS AND CORPORATE GOVERNANCE
Our business and affairs are overseen by our board of directors, as provided by our LLC Agreement and Delaware law. The board of directors has retained GCM to manage our investment activities, under the direction of our board of directors the quarterly valuation of our assets and our financing arrangements, subject to the board’s supervision. The board of directors currently has an audit committee and a nominating and corporate governance committee and may establish additional committees from time to time as necessary. Each director will serve until the next annual meeting of members and until his or her successor is duly elected. Although the number of directors may be increased or decreased, a decrease will not have the effect of shortening the term of any incumbent director. Any director may resign at any time and may be removed with or without cause by the members upon the affirmative vote of at least a majority of the votes entitled to be cast at a meeting called for the purpose of the proposed removal. The notice of the meeting shall indicate that the purpose, or one of the purposes, of the meeting is to determine if the director shall be removed.
A vacancy created by an increase in the number of directors or the death, resignation, removal, adjudicated incompetence or other incapacity of a director may be filled only by a vote of a majority of the remaining directors. As provided in our LLC Agreement, nominations of individuals to fill the vacancy of a board seat previously filled by an independent director will be made by the remaining independent directors.
Our board of directors consists of five members, a majority of whom are independent directors as such term is defined in NASDAQ Listing Rule 5605(a)(2). We are prohibited from making loans or extending credit, directly or indirectly, to our directors or executive officers under section 402 of the Sarbanes-Oxley Act of 2002.
Our board of directors serve in a fiduciary capacity to us and have a fiduciary duty to our members. This means that each director must perform his or her duties in good faith and in a manner that each director considers to be in our best interest and in the best interests of the members. Our board of directors has a fiduciary responsibility for the safekeeping and use of all of our funds and assets and will not employ or permit another to employ such funds or assets in any manner except for the exclusive benefit of us.
Directors and Executive Officers
The following table sets forth certain information regarding our directors and executive officers. The biographical descriptions for each director include the specific experience, qualifications, attributes and skills that led to the conclusion by our board of directors that such person should serve as a director.
| Name | Age | Position(s) Held with Us | Director/Executive Officer Since | |||
| David Sher | 56 | Director | 2012 | |||
| Charles Wheeler | 59 | Chief Executive Officer, President, and Director | 2012 | |||
| Richard C. Butt | 64 | Chief Financial Officer, Treasurer, and Secretary | 2014 | |||
| Robert Brennan | 58 | Director | 2019 | |||
| Kathleen Cuocolo | 68 | Independent Director | 2013 | |||
| Robert Herriott | 50 | Independent Director | 2013 | |||
| David M. Kastin | 52 | Independent Director | 2013 | |||
| Cynthia Curtis | 60 | Independent Director | 2019 |
David Sher has been a board member since our inception in December 2012. Mr. Sher has served as Chief Executive Officer of GCM and Co-Chief Executive Officer Greenbacker Group LLC since August 2012 (having previously served as a Managing Director of Greenbacker Group LLC since February 2011), as well as a member of GCM’s investment committee. He has also served as Chief Executive Officer and as a director of GREC since November 2011. Prior to joining our company, Mr. Sher was a senior adviser at Prospect Capital Corporation, a mezzanine debt and private equity firm that manages a publicly traded, closed-end, dividend-focused investment company, from June 2009 to January 2011. Prior to joining Prospect Capital, Mr. Sher was a serial entrepreneur founding a number of ventures in the financial services and brokerage industry. In 2002, Mr. Sher was a founder and Managing Director of ESP Technologies, a leading provider of financial software and services to institutional asset managers and hedge funds. In May of 2007, that company was sold to a group of investors. Prior to co-founding ESP, Mr. Sher was a founder and CEO of an online brokerage company, ElephantX dot com Inc. Additionally, in September 1997, he co-founded, developed and managed Lafayette Capital Management LLC, a statistical arbitrage hedge fund. Mr. Sher also spent six years at Bear Stearns where he developed trading ideas and strategies for correspondent clearing customers from 1991 to 1997.
91
Mr. Sher holds a Masters of International Affairs from Columbia University and Bachelor of Arts in Political Science from Rutgers University. Mr. Sher is the brother of Robert Sher.
Mr. Sher was selected to serve as a director because he is our advisor’s Chief Executive Officer and has over 20 years of executive experience in various areas, having previously served as founder and CEO of several companies, including two broker-dealers. He has substantial private equity and investing experience involving originated loan transactions, including serving as a senior adviser at Prospect Capital Corporation, a publicly traded business development company (NASDAQ: PSEC). He also has experience working in the renewable energy sector, including a transaction involving the proposed sale of a 28MW biomass power plant to a private equity firm. David Sher is the brother of Robert Sher, a Managing Director of GCM.
Charles Wheeler has served as our Chief Executive Officer, President, and as a board member since our inception in December 2012. Mr. Wheeler has also served as President of GCM and Co-Chief Executive Officer Greenbacker Group LLC since August 2012 (having previously served as a Managing Director of Greenbacker Group LLC since August 2011), and as President and a director of GREC since November 2011. Mr. Wheeler is a veteran of the investment banking industry having spent 24 years, from 1987 to January 2011, with the Macquarie Group, one of Australia’s leading investment banks. During that time, Mr. Wheeler held several senior positions with the Macquarie Group, including Head of Financial Products for North America from 2007 to January 2009 and Head of Renewables for North America from September 2007 to December 2010. From 1998 to August 2007, Mr. Wheeler was a Director of the Financial Products Group at Macquarie in Australia with responsibility for the development, distribution and ongoing management of a wide variety of retail financial products, including Real Estate Investment Trusts (“REITs”), infrastructure bonds, international investment trusts and diversified domestic investment trusts. Prior to joining Macquarie, Mr. Wheeler was a tax manager with Touche Ross & Co. in Australia (which was merged into KPMG in Australia).
Mr. Wheeler holds a Bachelor of Economics from Sydney University and is a member of the Institute of Chartered Accountants of Australia.
Mr. Wheeler was selected to serve as a director because he is our Chief Executive Officer and has significant knowledge of, and relationships within, the project and structured finance industry and the renewable energy sector due to his numerous positions with the Macquarie Group. Mr. Wheeler also brings his extensive background in project and structured finance to bear on the renewables sector. He has experience working in the solar and wind energy sectors while at Macquarie, including a transaction involving the purchase and subsequent management of a large portfolio of distributed solar assets located in California, the consideration of several proposals to invest equity into solar thermal power plants across the Southwest, the acquisition of a wind developer in Texas, and the evaluation of numerous wind development opportunities across Canada and the United States. Furthermore, during his tenure at Macquarie, Mr. Wheeler participated in several other renewable energy resource transactions, including a proposal to invest equity into a significant unlisted geo-thermal developer based in Nevada.
Richard C Butt has served as our Chief Financial Officer from January 2012 to July 2013 and since April 2014. Mr. Butt has held a variety of senior management positions for global investment and financial institutions. Most recently, from July 2012 to August 2013, he served as President and Chief Executive Officer of P3 Global Management LLC, a firm focused on investing in municipal infrastructure assets. From August 2006 to January 2011, he served as President of Macquarie Capital Investment Management LLC., with offices in New York and Sydney, Australia, responsible for administration, operations, finance, compliance, treasury, marketing, business operations and FX/cash management for portfolios domiciled in North America, Australia, Asia, Europe and the Caribbean. In addition, Mr. Butt served as Chief Financial and Accounting Officer for Macquarie Global Infrastructure Fund, a New York Stock Exchange listed closed end fund (NYSE: MGU). Prior to joining Macquarie, Mr. Butt served as President of Refco Alternative Investments LLC and Refco Fund Holdings LLC, the commodity pool businesses associated with Refco, Inc., from January 2003 to August 2006. In this capacity, Mr. Butt was responsible for the initial development and ongoing operations of numerous public and private commodity pools. During the period from1990 through 2003, he served in various operational and financial capacities with multiple mutual/hedge fund third party administration firms. Earlier in his career, he served as Vice President at Fidelity Investments, where he was responsible for fund accounting and financial reporting for all equity and global mutual funds. Mr. Butt is a Certified Public Accountant (Inactive) previously working at major accounting firms such as PricewaterhouseCoopers LLP, from July 1978 to July 1984, where he was an Audit Manager, and KPMG from December 1994 to October 1996, where he was a Director in their financial services consulting practice. Mr. Butt holds a bachelor’s degree in Management Science from Duke University.
92
Kathleen Cuocolo, an independent director since July 2013, is currently President of Syntax ETF Trust and a Senior Vice President of Syntax LLC, a company that has created a new class of equity indices – Syntax Stratified Indices. She is responsible for overseeing the business and infrastructure development at Syntax of a family of Stratified FundsTM Ms. Cuocolo was formerly Managing Director, Head of Global ETF Accounting and Administration at Bank of New York Mellon from April 2008 until March 2013. Prior to Bank of New York Mellon, she was President of Cuocolo & Associates from January 2004 through March 2008 where she specialized in board governance services. From September 1982 through July 2003, Ms. Cuocolo served as Executive Vice President of State Street Corporation where she was also Head of US Fund Administration Services and the founder of Exchange Traded Fund Services. In addition, Ms. Cuocolo has served as an independent director of Guardian Life Mutual Funds from June 2006 through their acquisition by RS Investments in December 2007, Chairperson of Select Sectors SPDR Trust from August 2000 through October 2007, trustee of SPDR Trust from January 1993 through July 2003, President and Director of The China Fund from September 1999 through July 2003 and President of the State Street Master Funds from January 2000 through July 2003. Ms. Cuocolo was selected to serve as an independent director based upon her extensive experience in financial service administration as well as an investor.
Robert Herriott, an independent director since July 2013, founded RBT Public Affairs Group in January of 2009. Mr. Herriott has worked in public affairs since 1994 serving in various political, legislative, and governmental liaison roles. In his capacity with RBT Public Affairs Group, Mr. Herriott has been involved with legislative and regulatory issues concerning FATCA, the Dodd-Frank Act, and Investment Management Operational Due Diligence, among others including Green Energy Initiatives and Healthcare. Prior to forming RBT Public Affairs Group, Mr. Herriott served from January 2007 to April 2009 as an internal advisor to the Toy Industry Association assisting in the legislative and regulatory reform of the industry, and harmonizing manufacturing standards between the United States, China and the European Union.
Mr. Herriott has testified before legislative bodies regarding pending legislation and spoken throughout the U.S. and internationally on how to interact with government, communication strategy, the U.S. legislative process, and specific industry issues pending before governmental entities. Mr. Herriott continues to advise clients on macro and micro governmental and political risk analysis, as well as reputation management and public affairs campaigns. Mr. Herriot was selected to serve as an independent director based on his extensive experience with legislative and regulatory issues, and with federal government energy initiatives.
David M. Kastin has been an independent director since July 2013. From August 2015 through January 2020, he was Senior Vice President, General Counsel and Corporate Secretary of Vitamin Shoppe, Inc. From August 2007 thought August 2015, Mr. Kastin was Senior Vice President-General Counsel and Corporate Secretary of Town Sports International Holdings, Inc. From March 2007 through July 2007, Mr. Kastin was Senior Associate General Counsel and Corporate Secretary of Sequa Corporation, a diversified manufacturer. From March 2003 through December 2006, Mr. Kastin was in-house counsel at Toys “R” Us, Inc., most recently as Vice President — Deputy General Counsel. From 1996 through 2003, Mr. Kastin was an associate in the corporate and securities departments at several prominent New York law firms, including Bryan Cave LLP. From September 1992 through October 1996, Mr. Kastin was a Staff Attorney in the Northeast Regional Office of the U.S. Securities and Exchange Commission. Mr. Kastin was selected to serve as an independent director based on his extensive experience as a legal and strategic advisor to publicly traded companies.
Cynthia Curtis has been an independent director since May 2019. She is currently Senior Vice President of Sustainability for JLL, a Fortune 200 commercial real estate services company. She is responsible for elevating JLL’s sustainability program, embedding it broadly throughout the business and driving meaningful impact with and through JLL’s clients. Ms. Curtis also collaborates with the Investor Relations team to ensure its investors have a more complete understanding of JLL’s competencies, goals and impacts. She represents the company on the World Green Building Council’s Corporate Advisory Board. Previously, Curtis has worked in the public, private and non-profit sectors, including Ceres, CA Technologies, where she served as Vice President and Chief Sustainability Office, and EMC (now Dell), where she was Senior Director, Services Marketing. She lives in the Boston area, is a member of the New England Women in Energy and the Environment, chairs the Wellesley Village Church Energy Committee, and built one of the region’s first gold LEED-certified residences. Ms. Curtis was selected to serve as an independent director based on her extensive experience in marketing and sustainability.
Robert Brennan has been a director since May 2019. Robert has served as Co-Chair of the board of directors of GREC and as a non-Executive officer of GCM since December 1, 2017. Mr. Brennan was previously a Senior Managing Director and Head of Guggenheim Partners Commercial Real Estate Finance Group where from 2010 to 2017 he built a national commercial mortgage loan origination, servicing and asset management business responsible for nearly $10 billion of loans for client investment portfolios. Additionally, Mr. Brennan was an executive member and founding investor of Pillar Financial, Guggenheim’s GSE licensed lending, mortgage banking, and servicing affiliate which was sold to SunTrust Bank in late 2016. During his 34-year Wall Street career, Mr. Brennan spent the last 26 years focused on real estate in which he played a wide range of roles including trading, origination, structuring and banking, and asset management. Mr. Brennan was involved with a broad array of property and project types ranging from conventional incoming producing to project based transactions. Prior to Guggenheim, he was the Global Head of Credit Suisse’s Real Estate Finance and Securitization Group which was a dominant global leader in the commercial real estate finance industry. Mr. Brennan joined Credit Suisse in November 2000 when it was merged with Donaldson, Lufkin and Jenrette (“DLJ”), where he was a Managing Director and Head of the Commercial Mortgage Group. Mr. Brennan held previous positions at UBS Securities and L.F. Rothschild and started his career in 1983 with E.F. Hutton where he was an Associate in the Investment Banking Division. Mr. Brennan is a graduate of the University of Vermont and holds an M.B.A. from New York University. He is a member of the Board of the Commercial Real Estate Finance Council where he chairs the long-range planning and investment committee. Mr. Brennan is a graduate of the University of Vermont and holds an M.B.A. from New York University. He is a member of the Board of CRE Finance Council.
We operate under the direction of our board of directors, a majority of which are independent of us—Kathleen Cuocolo, Robert Herriott, David M. Kastin, and Cynthia Curtis. Charles Wheeler, who also serves as the President of the company and President and Chief Investment Officer of our advisor, and David Sher, who also serves as Chief Executive Officer of our advisor, are the other members of our board of directors. No member of our board of directors, including Messrs. Sher and Wheeler, has ever served as an officer or director of the dealer manager, or any of their affiliates.
93
Committees of the Board of Directors
The entire board of directors considers all major decisions concerning our business. However, our LLC Agreement provides that our board of directors may establish such committees as our board believes appropriate. Our board of directors will appoint the members of the committee in its discretion, provided a majority of the members of the audit committee of our board of directors must be comprised of independent directors. Our board of directors has established an audit committee and adopted a charter for the audit committee that complies with current U.S. federal and NASDAQ rules relating to corporate governance matters. In addition, our board of directors has established a nominating and corporate governance committee, as described below.
Audit Committee
Our audit committee is composed of Kathleen Cuocolo, Robert Herriott, and David M. Kastin, all of whom are independent directors. The audit committee will assist the board of directors in overseeing:
| ● | our accounting and financial reporting processes; |
| ● | the integrity and audits of our consolidated financial statements; |
| ● | our compliance with legal and regulatory requirements; |
| ● | the qualifications and independence of our independent auditors; and |
| ● | the performance of our internal and independent auditors. |
Kathleen Cuocolo chairs our audit committee and serves as our “audit committee financial expert,” as that term is defined by the SEC.
Nominating and Corporate Governance Committee
Our nominating and corporate governance committee is composed of Charles Wheeler, David Sher and Robert Herriott. Robert Herriott is the sole independent director on the committee. The nominating and corporate governance committee operates pursuant to a charter approved by our board of directors. The charter sets forth the responsibilities of the nominating and corporate governance committee, including making nominations for the appointment or election of independent directors, retirement policies and investment professionals training policies.
Robert Herriott chairs our nominating and corporate governance committee.
ITEM 11. EXECUTIVE COMPENSATION
None of our executive officers will receive any compensation for their service as our executive officers.
ITEM 12. SECURITY OWNERSHIP OF CERTAIN BENEFICIAL OWNERS AND MANAGEMENT AND RELATED MEMBER MATTERS
The following table sets forth, as of the date of this report, information with respect to the beneficial ownership of our shares by:
| ● | each person known to us to beneficially own more than 5% of any class the outstanding shares; |
| ● | each of our directors, director nominees and named executive officers; and |
| ● | all of our directors and executive officers as a group. |
94
We have issued 23,601 Class A shares to our advisor. Beneficial ownership is determined in accordance with the rules of the SEC and includes voting or investment power with respect to the securities. There are no shares subject to options that are currently exercisable or exercisable within 60 days of the offering. Unless otherwise indicated, all shares are owned directly and the indicated person has sole voting and investment power.
| Name and Address1 | Number of Shares Beneficially Owned | Percentage of all Shares Issued and Outstanding | ||||||
| Greenbacker Capital Management LLC2 | 23,601 | 0.05 | % | |||||
| Greenbacker Group LLC | - | - | ||||||
| David Sher | - | - | ||||||
| Charles Wheeler | - | - | ||||||
| Richard C. Butt | - | - | ||||||
| Robert Brennan | 11,429 | 0.02 | % | |||||
| Kathleen Cuocolo | 6,474 | 0.01 | % | |||||
| Cynthia Curtis | 913 | 0.00 | % | |||||
| Robert Herriott | 6,474 | 0.01 | % | |||||
| David M. Kastin | 6,474 | 0.01 | % | |||||
| All officers and directors as a group (8 persons) * | 31,764 | 0.07 | % | |||||
*Percentages may not foot due to rounding.
| 1 | Unless otherwise indicated, the address of each beneficial owner is c/o Greenbacker Capital Management LLC, 11 East 44th Street, Suite 1200, New York, NY 10017. |
| 2 | Greenbacker Capital Management LLC, GCM, is a wholly-owned subsidiary of Greenbacker Group, LLC. The board of directors of Greenbacker Group, LLC has investment power over the Class A shares held by GCM, including the power to dispose, or to direct the disposition, of such shares. Charles Wheeler is a member of the board of directors of Greenbacker Group, LLC. |
ITEM 13. CERTAIN RELATIONSHIPS AND RELATED TRANSACTIONS, AND DIRECTOR INDEPENDENCE
Our board of directors oversees our management. However, we have entered into the advisory agreement with our advisor, GCM, pursuant to which GCM is responsible for managing us on a day-to-day basis and identifying and making investments on our behalf. Prior to February 8, 2019, GCM was a joint venture between Greenbacker Group LLC and Strategic Capital Advisory Services, LLC, or Strategic Capital, an affiliate of our dealer manager, SC Distributors, and certain of our directors and/or officers. Strategic Capital, an affiliate of our dealer manager, SC Distributors, which owned up to 25% interest in our advisor, generally provided to us, on behalf of our advisor, certain non-investment advisory services, including but not limited to formation services related to our company and the structure of our organization, financial and strategic planning advice and analysis, overseeing the development of marketing materials, selecting and negotiating with third party vendors and other administrative and operational services. With GCM becoming a wholly-owned subsidiary of Greenbacker Group LLC as of February 8, 2019, these services, as they may be required, are provided by either GCM or by Greenbacker Group LLC. The non-managing member exercised no control or influence over our investment, asset management or accounting functions or any other aspect of our management or operations. In connection with providing such services from our inception through February 8, 2019, Greenbacker Group LLC paid Strategic Capital an aggregate of $1,250,000 in fees. We have reimbursed such fees in connection with our obligation to reimburse our advisor and its affiliates for certain organization and offering expenses incurred by them on our behalf, subject to the limitation that such reimbursements would not cause the selling commissions, the dealer manager fee and the other organization and offering expenses borne by us to exceed 15% of gross offering proceeds as of the date of reimbursement.
Through each of their ownership interests in Greenbacker Group LLC, Charles Wheeler, our Chief Executive Officer and a member of our board of directors, and David Sher, a member of our board of directors, indirectly own a 11.40% and a 7.24% interest, respectively, in our advisor. In addition, several of our officers and directors, including Messrs. Sher and Wheeler, are officers of our advisor. As a result, the advisory agreement between us and our advisor was negotiated between related parties, and its terms, including fees and other amounts payable, may not be as favorable to us as if they had been negotiated with unaffiliated third parties.
Except for the advancement of funds pursuant to certain indemnification provisions of our LLC Agreement, no loans, credit facilities, credit agreements or otherwise will be made by us to our advisor or any of its affiliates. Our advisor, SC Distributors and their affiliates will receive the compensation described herein.
95
Our advisor’s services under the advisory agreement will not be exclusive, and it may furnish the same or similar services to other entities, including businesses that may directly or indirectly compete with us, so long as its services to us are not impaired by the provision of such services to others, and provided that the advisor notify us prior to being engaged to serve as an adviser to a fund or another company having a similar investment strategy.
With respect to our renewable energy, energy efficiency and sustainability investments, our advisor does not currently target similar investment opportunities for other clients. This may change in the future, however.
We have entered into license agreements with Greenbacker Group LLC, pursuant to which it has agreed to grant us a non-exclusive, royalty-free license to use the name “Greenbacker Renewable Energy Company LLC.” In addition, we have entered into an administration agreement with Greenbacker Administration, pursuant to which the Administrator will provide us with administrative services and will receive the compensation from us for its services. As of the date hereof, Greenbacker Administration has delegated certain of its administrative functions to U.S Bancorp Fund Services, LLC as well as accounting for certain of our investments to independent firm which provides outsourced bookkeeping and accounting services. While Greenbacker Administration performs a majority of asset management, accounting and oversight services for the company’s investments, it is anticipated that Greenbacker Administration will continue to delegate the majority of certain administrative functions for GREC and the LLC.
ITEM 14. PRINCIPAL ACCOUNTANT FEES AND SERVICES
The Audit Committee has appointed KPMG as our independent registered public accounting firm for the fiscal years ending December 31, 2019 and 2018.
Fees Incurred for KPMG LLP
The following table shows the fees invoiced for audit and other services provided by KPMG for fiscal 2019 and 2018.
| 2019 | 2018 | |||||||
| Audit Fees (1) | $ | 795,890 | $ | 725,000 | ||||
| Audit-Related Fees (2) | - | - | ||||||
| Tax Fees (3) | 101,358 | 120,000 | ||||||
| All Other Fees (4) | - | - | ||||||
| Total | $ | 897,248 | $ | 845,000 | ||||
The Audit Committee has approved all of the services and fees listed in the previous table.
The Audit Committee has delegated to the chair of the Audit Committee the authority to pre-approve audit-related and non-audit services not prohibited by law to be performed by our independent registered public accounting firm and associated fees up to a maximum for any one service of $25,000 provided that the chair shall report any decisions to pre-approve services and fees to the full Audit Committee at its next regular meeting.
| (1) | Audit fees represent fees for professional services provided in connection with the audit of our consolidated financial statements and review of our quarterly consolidated financial statements and audit services provided in connection with our quarterly and annual statutory or regulatory filings. |
| (2) | Audit-related fees consisted of all fees associated with statutory and regulatory filings other than our quarterly and annual statutory and regulatory filings, such as fees to issue consents for our filing of prospectuses. |
| (3) | Tax fees consisted of tax compliance fees. |
| (4) | Other fees billed in the reporting periods for products and services provided by the KPMG, included consents for the company’s audited financial statements to be included in various SEC filings. |
KPMG has not provided services and charged fees to our advisor or entities that are controlling, controlled by, or under common control with our advisor.
96
ITEM 15. EXHIBITS, CONSOLIDATED FINANCIAL STATEMENT SCHEDULES
The following exhibits are included, or incorporated by reference, in this Annual Report on Form 10-K for the year ended December 31, 2019 (and are numbered in accordance with Item 601 of Regulation S-K).
| (a) | Documents Filed as Part of this Report |
| (1) | The following consolidated financial statements are set forth in Item 8: |
| ● | Report of Independent Registered Public Accounting Firm |
| ● | Consolidated Statements of Assets and Liabilities as of December 31, 2019 and 2018 |
| ● | Consolidated Statements of Operations for the years ended December 31, 2019, 2018 and 2017 |
| ● | Consolidated Statements of Changes in Net Assets for the years ended December 31, 2019, 2018, 2017 |
| ● | Consolidated Statements of Cash Flows for the years ended December 31, 2019, 2018 and 2018 |
| ● | Consolidated Schedules of Investments as of December 31, 2019 and 2018 |
| ● | Notes to the Consolidated Financial Statements |
| (2) | Financial Statement Schedules have been omitted because they are not applicable or the required information is shown in the Consolidated Financial Statements or Notes thereto in Item 8 of this annual report. |
| (b) | Exhibits |
The following exhibits are filed as part of this report or hereby incorporated by reference to exhibits previously filed with the Securities and Exchange Commission:
97
| * | Filed previously. |
| ** | Filed herewith. |
None
98
Pursuant to the requirements of the Securities Exchange Act of 1934, the registrant has duly caused this report to be signed on its behalf by the undersigned, thereunto duly authorized.
| Date: March 13, 2020 | By | /s/ Charles Wheeler |
| Charles Wheeler | ||
| Chief Executive Officer and Director | ||
| (Principal Executive Officer) | ||
| Greenbacker Renewable Energy Company LLC | ||
| Date: March 13, 2020 | By | /s/ Richard C. Butt |
| Richard C. Butt | ||
| Chief Financial Officer and Principal Accounting Officer | ||
| (Principal Financial and Accounting Officer) Greenbacker Renewable Energy Company LLC |
Pursuant to the requirements of the Securities Exchange Act of 1934, this report has been signed below by the following persons on behalf of the registrant and in the capacities and on the dates indicated.
| Signature | Title | Date | ||
| /s/ Charles Wheeler | Chairman, Chief Executive Officer and Director | March 13, 2020 | ||
| Charles Wheeler | (Principal Executive Officer) | |||
| /s/ Richard C. Butt | Chief Financial Officer and Principal Accounting Officer | March 13, 2020 | ||
| Richard C. Butt | (Principal Financial and Accounting Officer) |
KNOW ALL MEN BY THESE PRESENTS, that each person whose signature appears below constitutes and appoints each of Charles Wheeler and Richard C. Butt, respectively, as his true and lawful attorney-in-fact and agent, with full power of substitution and resubstitution, for him and his name, place and stead, in any and all capacities, to sign any or all amendments to this annual report on Form 10-K, and to file the same, with all exhibits thereto and other documents in connection therewith, with the SEC, granting unto said attorney-in-fact and agent, full power and authority to do and perform each and every act and thing requisite and necessary to be done in and about the premises, as fully to all intents and purposes as he might or could do in person, hereby ratifying and confirming all that said attorney-in-fact and agent or any of his substitutes, may lawfully do or cause to be done by virtue hereof.
| /s/ David Sher | ||||
| David Sher | Director | March 13, 2020 | ||
| /s/ Kathleen Cuocolo | ||||
| Kathleen Cuocolo | Director | March 13, 2020 | ||
| /s/ Robert Herriott | ||||
| Robert Herriott | Director | March 13, 2020 | ||
| /s/ David M. Kastin | ||||
| David M. Kastin | Director | March 13, 2020 | ||
| /s/ Robert Brennan | ||||
| Robert Brennan | Director | March 13, 2020 | ||
| /s/ Cynthia Curtis | ||||
| Cynthia Curtis | Director | March 13, 2020 |
99