Attached files
| file | filename |
|---|---|
| EX-31.1 - EXHIBIT 31.1 - Manning & Napier, Inc. | exhibit311_q419form10-k.htm |
| EX-32.2 - EXHIBIT 32.2 - Manning & Napier, Inc. | exhibit322_q419form10-k.htm |
| EX-32.1 - EXHIBIT 32.1 - Manning & Napier, Inc. | exhibit321_q419form10-k.htm |
| EX-31.2 - EXHIBIT 31.2 - Manning & Napier, Inc. | exhibit312_q419form10-k.htm |
| EX-23.1 - EXHIBIT 23.1 - Manning & Napier, Inc. | exhibit231_q42019form10-k.htm |
| EX-21.1 - EXHIBIT 21.1 - Manning & Napier, Inc. | exhibit211_q42019form10-k.htm |
| EX-10.9 - EXHIBIT 10.9 - Manning & Napier, Inc. | exhibit109_q42019form10-k.htm |
| EX-4.2 - EXHIBIT 4.2 - Manning & Napier, Inc. | exhibit42_q419form10-k.htm |
UNITED STATES
SECURITIES AND EXCHANGE COMMISSION
Washington D.C. 20549
___________________________________
FORM 10-K
x | ANNUAL REPORT PURSUANT TO SECTION 13 OR 15(d) OF THE SECURITIES EXCHANGE ACT OF 1934 |
For the fiscal year ended December 31, 2019
¨ | TRANSITION REPORT PURSUANT TO SECTION 13 OR 15(d) OF THE SECURITIES EXCHANGE ACT OF 1934 |
For the transition period from to
Commission File Number 001-35355
___________________________________
MANNING & NAPIER, INC.
(Exact name of registrant as specified in its charter)
Delaware (State or other jurisdiction of incorporation or organization) | 45-2609100 (I.R.S. Employer Identification No.) | |
290 Woodcliff Drive Fairport, New York | 14450 | |
(Address of principal executive offices) | (Zip code) | |
(585) 325-6880
(Registrant’s telephone number, including area code)
Securities registered pursuant to Section 12(b) of the Act:
Title of each class | Trading Symbol(s) | Name of each exchange in which registered |
Class A common stock, $0.01 par value per share | MN | New York Stock Exchange |
Securities registered pursuant to Section 12(g) of the Act:
None
___________________________________
Indicate by check mark if the registrant is a well-known seasoned issuer, as defined in Rule 405 of the Securities Act. Yes ¨ No x
Indicate by check mark if the registrant is not required to file reports pursuant to Section 13 or 15(d) of the Act. Yes ¨ No x
Indicate by check mark whether the registrant (1) has filed all reports required to be filed by Section 13 or Section 15(d) of the Securities Exchange Act of 1934 during the preceding 12 months (or for such shorter period that the registrant was required to file such reports), and (2) has been subject to such filing requirements for the past 90 days. Yes x No ¨
Indicate by check mark whether the registrant has submitted electronically every Interactive Data File required to be submitted pursuant to Rule 405 of Regulation S-T (§232.405 of this chapter) during the preceding 12 months (or for such shorter period that the registrant was required to submit such files). Yes x No ¨
Indicate by check mark whether the registrant is a large accelerated filer, an accelerated filer, a non-accelerated filer, a smaller reporting company or an emerging growth company. See the definitions of “large accelerated filer,” “accelerated filer,” “smaller reporting company” and "emerging growth company" in Rule 12b-2 of the Exchange Act.
Large accelerated filer | ¨ | Accelerated filer | ¨ | |
Non-accelerated filer | x | Smaller reporting company | x | |
Emerging growth company | ¨ | |||
If an emerging growth company, indicate by check mark if the registrant has elected not to use the extended transition period for complying with any new or revised financial accounting standards provided pursuant to Section 13(a) of the Exchange Act. Yes ¨ No ¨
Indicate by check mark whether the registrant is a shell company (as defined in Rule 12b-2 of the Exchange Act). Yes ¨ No x
The aggregate market value of the registrant's common equity held by non-affiliates of the registrant (assuming for purposes of this computation only that the directors and executive officers may be affiliates) at June 28, 2019, which was the last business day of the registrant’s most recently completed second fiscal quarter, was approximately $25.9 million based on the closing price of $1.75 for one share of Class A common stock, as reported on the New York Stock Exchange on that date.
Indicate the number of shares outstanding of each of the registrant’s classes of common stock, as of the latest practicable date.
Class | Outstanding at March 9, 2020 | |
Class A common stock, $0.01 par value per share | 16,269,857 | |
TABLE OF CONTENTS
Page | ||
Item 1. | ||
Item 1A. | ||
Item 1B. | ||
Item 2. | ||
Item 3. | ||
Item 4. | ||
Item 5. | ||
Item 6. | ||
Item 7. | ||
Item 7A. | ||
Item 8. | ||
Item 9. | ||
Item 9A. | ||
Item 9B. | ||
Item 10. | ||
Item 11. | ||
Item 12. | ||
Item 13. | ||
Item 14. | ||
Item 15. | ||
Item 16. | ||
In this Annual Report on Form 10-K for the fiscal year ended December 31, 2019 (the "Annual Report"), “we,” “our,” “us,” the “Company,” “Manning & Napier” and the “Registrant” refers to Manning & Napier, Inc. and, unless the context otherwise requires, its direct and indirect subsidiaries and predecessors on a consolidated basis.
i
CAUTIONARY NOTE REGARDING FORWARD-LOOKING STATEMENTS
This report contains forward-looking statements within the meaning of section 27A of the Securities Act of 1933, as amended, and Section 21E of the Securities Exchange Act of 1934, as amended (the "Exchange Act"), which reflect the views of Manning & Napier, Inc. ("we," "our," or "us") with respect to, among other things, our future operations and financial performance. Words like "believes," "expects," "may," "estimates," "will," "should," "could," "intends," "likely," "plans," or "anticipates" or the negative thereof or other variations thereon or comparable terminology, are used to identify forward-looking statements, although not all forward-looking statements contain these words. Although we believe that we are basing our expectations and beliefs on reasonable assumptions within the bounds of what we currently know about our business and operations, there can be no assurance that our actual results will not differ materially from what we expect or believe. Some of the factors that could cause our actual results to differ materially from our expectations or beliefs are disclosed in the “Risk Factors” section, as well as other sections of this report which include, without limitation: changes in securities or financial markets or general economic conditions; a decline in the performance of our products; client sales and redemption activity; any loss of an executive officer or key personnel; changes in our business related to strategic acquisitions and other transactions; our ability to successfully deploy new technology platforms and upgrades; and changes of government policy or regulations. All forward-looking statements speak only as of the date on which they are made and we undertake no duty to update or revise any forward-looking statements, whether as a result of new information, future events or otherwise.
ii
PART I
Item 1. Business.
Overview
Manning & Napier, Inc. is an independent registered investment advisor that provides clients with a broad range of financial solutions and investment strategies, including wealth management services. Founded in 1970 and headquartered in Fairport, New York, we serve a diversified client base of high-net-worth individuals and institutions, including 401(k) plans, pension plans, Taft-Hartley plans, endowments and foundations.
Our objective is to create and develop financial solutions to help our clients meet their needs. We believe our differentiation is based on delivering comprehensive solutions, high-touch service, and attractive investment strategies in a custom-tailored, highly integrated manner.
We have built a diverse client base of high-net-worth individuals, small business owners, middle market institutions, larger institutions, defined contribution plans, and unions, as well as clients via investment consultants or other intermediaries. Although our client base is national, we are primarily focused in certain targeted geographic regions. Clients access our solutions and strategies via separately managed accounts, mutual funds, and collective investment trusts.
Our investment strategies are powered by multiple research engines, employing traditional and quantitative approaches, and are offered as both single- and multi-asset class portfolios. While the mechanics of these processes may differ depending on the strategy, all of our strategies work from the underlying belief that active management is the best investment approach for meeting long-term client objectives. All of our strategies fully incorporate active asset allocation processes, and most strategies deliver active security selection as well.
We believe personalized financial advice is necessary to retain existing relationships and attract new clients. Our service teams include internal subject matter experts specific to areas beyond investments, including financial planning, endowment and foundation consulting, qualified plan and pension plan services, and custody and trust advice and administration. We believe these consultative services, combined with competitive long-term investment performance, have allowed us to achieve a high average annual separate account retention rate.
Over the course of our 50-year history, we view our team-based, client-centric approach as imperative to success and distinct within the industry. As of December 31, 2019, we have 32 publicly-available mutual fund share classes rated with four or five stars by Morningstar, and a number of our investment strategies have built value-added track records over multiple decades.
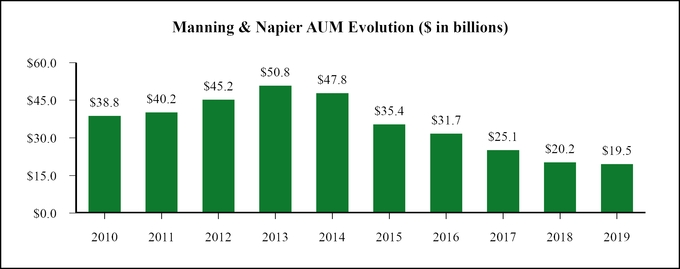
Performance challenges from 2014-2016, along with the trend toward passive investing, especially among institutional investors, have resulted in declines in assets under management ("AUM") in recent years. Our active approach can cause us to be out of favor relative to benchmarks and/or peers over shorter time periods, and these short-term deviations can lead to changes in AUM trends over time. The following chart reflects our AUM as of December 31 for each of the last 10 years:
1
As of December 31, 2019, our investment management offerings include 47 distinct separate account composites and 44 mutual funds and collective investment trusts. We believe we have cultivated a robust menu of actively managed strategies that allow us to address client needs.
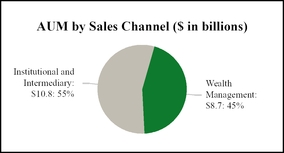
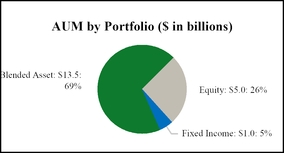
Our AUM as of December 31, 2019 by investment vehicle and portfolio were as follows:
2
The following table summarizes the annualized returns for several of our key investment strategies and relevant benchmarks. Since inception and over long-term periods, we believe our strategies have generated attractive returns on both an absolute and relative basis. We recognize, however, that some key strategies have mixed track records over the past decade. These key strategies are used across separate account, mutual fund and collective investment trust vehicles, and represent approximately 74% of our AUM as of December 31, 2019. This table is provided for illustrative purposes only. The performance reflected in the table below is not necessarily indicative of the future results of our investment strategies.
Key Strategies | AUM as of December 31, 2019 (in millions) | Inception Date | Annualized Returns as of December 31, 2019 (1) | |||||||||||
One Year | Three Year | Five Year | Ten Year | Inception | ||||||||||
Long-Term Growth (30%-80% Equity Exposure) | $ | 5,523.9 | 1/1/1973 | 18.6% | 9.7% | 5.8% | 7.5% | 9.5% | ||||||
Blended Index (3) | 19.5% | 9.3% | 6.9% | 8.0% | 8.8% | |||||||||
Core Non-U.S. Equity | $ | 680.7 | 10/1/1996 | 27.8% | 9.5% | 5.0% | 4.3% | 7.4% | ||||||
Benchmark: ACWIxUS Index | 21.5% | 9.9% | 5.5% | 5.0% | 5.3% | |||||||||
Growth with Reduced Volatility (20%-60% Equity Exposure) | $ | 2,482.0 | 1/1/1973 | 15.3% | 7.8% | 4.7% | 6.2% | 8.7% | ||||||
Blended Index (4) | 16.6% | 7.9% | 5.9% | 7.0% | 8.5% | |||||||||
Equity-Oriented (70%-100% Equity Exposure) | $ | 1,422.0 | 1/1/1993 | 26.6% | 14.2% | 8.1% | 9.3% | 10.0% | ||||||
Blended Benchmark: 65% Russell 3000® / 20% ACWIxUS / 15% Bloomberg Barclays U.S. Aggregate Bond | 25.7% | 12.1% | 9.0% | 10.4% | 8.7% | |||||||||
Equity-Focused Blend (50%-90% Equity Exposure) | $ | 1,009.7 | 4/1/2000 | 22.6% | 11.4% | 6.7% | 8.4% | 7.2% | ||||||
Blended Benchmark: 53% Russell 3000/ 17% ACWIxUS/ 30% Bloomberg Barclays U.S. Aggregate Bond | 22.6% | 10.7% | 8.0% | 9.2% | 5.8% | |||||||||
Core Equity-Unrestricted (90%-100% Equity Exposure) | $ | 559.8 | 1/1/1995 | 31.0% | 16.4% | 9.5% | 10.8% | 11.3% | ||||||
Blended Benchmark: 80% Russell 3000® / 20% ACWIxUS | 29.1% | 13.7% | 10.1% | 11.7% | 9.3% | |||||||||
Core U.S. Equity | $ | 174.3 | 7/1/2000 | 34.2% | 18.2% | 11.2% | 11.7% | 8.4% | ||||||
Benchmark: Russell 3000® Index | 31.0% | 14.6% | 11.2% | 13.4% | 6.5% | |||||||||
Conservative Growth (5%-35% Equity Exposure) | $ | 477.7 | 4/1/1992 | 10.4% | 5.2% | 3.3% | 4.4% | 5.9% | ||||||
Blended Benchmark:15% Russell 3000/ 5% ACWIxUS/ 80% Bloomberg Barclays U.S. Intermediate Aggregate Bond | 10.9% | 5.4% | 4.1% | 4.9% | 6.1% | |||||||||
Aggregate Fixed Income | $ | 167.3 | 1/1/1984 | 8.3% | 3.7% | 2.9% | 3.6% | 7.1% | ||||||
Benchmark: Bloomberg Barclays U.S. Aggregate Bond | 8.7% | 4.0% | 3.1% | 3.8% | 7.0% | |||||||||
Rainier International Small Cap | $ | 824.0 | 3/28/2012 | 24.7% | 0.9% | 9.3% | N/A (2) | 11.6% | ||||||
Benchmark: MSCI ACWIxUS Small Cap Index | 22.4% | 0.1% | 7.0% | N/A (2) | 6.9% | |||||||||
Disciplined Value US (5) | $ | 1,128.4 | 11/1/2003 | 24.3% | 13.6% | 10.9% | N/A (2) | 14.7% | ||||||
Benchmark: Russell 1000 Value | 26.5% | 9.7% | 8.3% | N/A (2) | 14.1% | |||||||||
__________________________
(1) | Key investment strategy returns are presented net of fees. Benchmark returns do not reflect any fees or expenses. |
(2) | Performance not available given the product's inception date. |
(3) | Benchmark shown uses the 55/45 Blended Index from 01/01/1973-12/31/1987 and the 40/15/45 Blended Index from 01/01/1988-12/31/2019. The 55/45 Blended Index is represented by 55% S&P 500 Total Return Index ("S&P 500") and 45% Bloomberg Barclays U.S. Government/Credit Bond Index ("BGCB"). The 40/15/45 Blended Index is 40% Russell 3000 Index ("Russel 3000"), 15% MSCI ACWI ex USA Index ("ACWxUS"), and 45% Bloomberg Barclays U.S. Aggregate Bond Index ("BAB"). |
(4) | Benchmark shown uses the 40/60 Blended Index from 01/01/1973-12/31/1987 and the 30/10/60 Blended Index from 01/01/1988-12/31/2019. The 40/60 Blended Index is represented by 40% S&P 500 and 60% BGCB. The 30/10/60 Blended Index is represented by 30% Russell 3000, 10% ACWxUS, and 60% BAB. |
(5) | Beginning with this Annual Report, we are presenting the performance of Disciplined Value US in place of Disciplined Value Unrestricted. The inception date for Disciplined Value US is January 1, 2013. |
3
Our Strategy
Our mission is to provide financial solutions that enable clients to achieve their long-term goals and objectives. Our success will be measured by the success of our clients. We must effectively execute in delivering investment results, financial advice, and a superior client experience in order to retain business and attract new business.
Our strategy is focused on continuous refinement and improvement in two key areas: investment excellence and a superior client experience. This includes the performance of our investment strategies, the comprehensiveness of our financial advice, and the quality of our client service. These key areas form the foundation of our business and require constant evolution.
In early 2019 upon the appointment of our new Chief Executive Officer, Marc Mayer, we commenced a comprehensive strategic review of our business, which focused on the evolution of our distribution strategy, our suite of investment offerings, and our technology initiatives. During the year we made important changes to our leadership team, implemented key governance and operating committees, revamped our distribution strategies, put in place definitive plans to overhaul and modernize our information technology systems and associated business processes, consolidated numerous offerings and solutions, eliminated sub-scale offerings, and reduced ongoing costs. Also see "Item 7. Management's Discussion and Analysis" in this Form 10-K for discussion on our strategic review.
Investments
We believe that active management, in all of its many forms, is the most appropriate and relevant investment approach to achieving client goals across changing market environments. Whether investing in a country, industry, or individual company, we hold a strong belief that price matters across all of our strategies. We are focused on helping our clients avoid permanent loss of capital over long time horizons, which is different than managing day-to-day volatility.
All of our research engines deploy investment processes that are team-based in nature. By focusing on research teams instead of individuals, we are better able to emphasize repeatable processes instead of star personalities, while helping protect clients from staff turnover. Additionally, our investment processes are designed to allow teams to collaborate and combine top-down, bottom-up, and quantitative research.
We believe our research department of over 50 primarily home-grown investment professionals enhance the consistency of our investment processes. As warranted, we may add to or supplement our research teams with additional investment professionals through corporate development activities. The most recent example of this is the Rainier International Small Cap Team that was added as part of our acquisition of Rainier Investment Management, LLC ("Rainier") in 2016.
Dynamic financial markets and an onerous regulatory environment results in a fast changing industry. We recognize the need for our investment strategies to continuously evolve. We regularly review seeded portfolios to ensure that we are supporting competitive strategies that resonate with clients, while simultaneously closing portfolios that are no longer viable. As of December 31, 2019, we have approximately $9.4 million invested in seed capital with our research teams in new strategy concepts and expect to continue to deploy capital to support innovation in the future.
Client Experience
Our business is based on confidence and trust. We believe we must deliver a client experience that communicates clearly, is collaborative, and is accountable to clients. We view our clients as our partners, and we recognize that successful client-partners lead to a natural expansion of our business.
As of December 31, 2019, we have over 30 client-facing professionals, who are responsible for maintaining existing relationships and cultivating new business. Referrals are also an important source of new business, further highlighting the importance of our comprehensive client service and solutions.
Our client-facing professionals have a deep multi-channel structure, enabling greater focus and expertise on certain types of client relationships. Our Wealth Management group specializes in individuals and middle market relationships using a team-approach organized by region. Our Intermediary and Institutional team covers wider territories and concentrates on distribution to larger institutions and Taft-Hartley relationships, as well as through third party intermediaries. Our Portfolio Strategies Group specializes in consultant relations, as well as providing support for all of our client-facing professionals.
Alongside these professionals, we incorporate consultative services from internal subject-matter experts designed to create holistic solutions specific to individual client needs. Our experts have capabilities ranging from estate, tax and trust review for families, asset/liability modeling for defined benefit pension plans, retirement and health plan design analysis for employers, and donor relations and planned giving services for endowments and foundations.
Our marketing strategy is focused on finding new ways to connect and engage with clients and prospects via targeted content on products, services, and topics that are most relevant to our various audiences. We have dedicated resources creating engaging and relevant content that positions Manning & Napier as a thought leader and a trusted resource. This content strategy focuses on educating investors, and it mirrors the consultative nature of our firm. We disseminate content in various ways, including through print publications, email, webinars, live events, our website, and social media.
4
In order for our investment teams and client-centric personnel to be most effective, we must also have excellence in middle- and back-office functions. These include our technology, operations, facilities, human resources, and compliance functions, each of which play a critical role in forming the foundation of business success.
In particular, our technological strategy is focused on using "software as a service" solutions while retaining in-house capabilities as needed. We believe that by leveraging the robust expertise of external providers, we can improve the nimbleness and efficiency of our organization. This approach provides the most update-to-date technology enabling a superior client experience, improving the employee experience, and streamlining operational processes.
Competition
Historically, we have competed to attract business on the basis of:
• | the breadth of financial solutions we offer clients in an integrated manner; |
• | the investment excellence and long-term track records of our strategies; |
• | the consultative advice we provide addressing clients’ unique challenges and needs; |
• | the quality of the client experience and the duration of our relationships with them; and |
• | the pricing of our solutions compared to competitors. |
Our ability to continue to compete effectively will depend upon our ability to retain our current investment and client-facing professionals and employees, as well as to attract highly qualified new professionals and employees. We compete in all aspects of our business with a large number of investment management firms, commercial banks, broker-dealers, insurance companies and other financial institutions.
Structure
The Company was incorporated in 2011 as a Delaware corporation, and is the sole managing member of Manning & Napier Group, LLC and its subsidiaries (“Manning & Napier Group”), a holding company for the investment management businesses conducted by its operating subsidiaries. The diagram below depicts our organizational structure as of December 31, 2019. 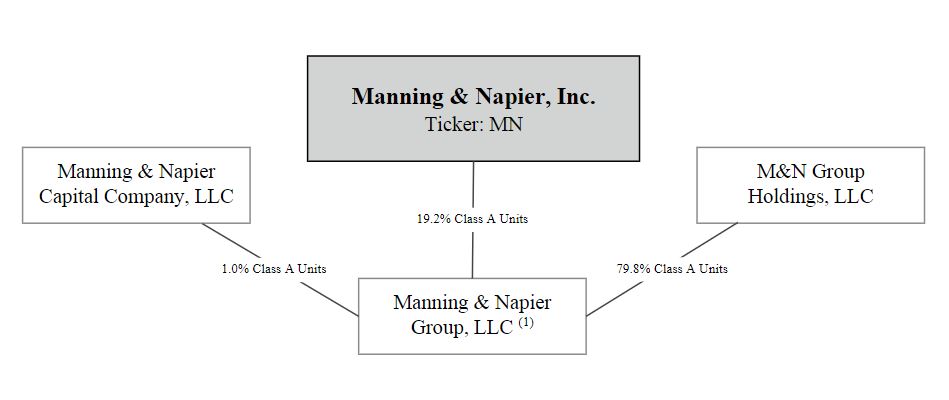
______________________
(1) | The consolidated operating subsidiaries of Manning & Napier Group include Manning & Napier Advisors, LLC ("MNA"), Manning & Napier Investor Services, Inc., Exeter Trust Company and Rainier |
As of December 31, 2019, we had 307 employees, most of whom are based in Fairport, New York. Collectively, William Manning, our co-founder and Chairman of the Board, current employee-owners and former employee owners own approximately 80.8% of Manning & Napier Group and our operating subsidiaries. We believe that our culture of employee ownership aligns our interests with those of our clients and stockholders by delivering strong long-term investment performance and solutions.
5
Regulation
Our business is subject to extensive regulation in the United States at the federal level and, to a lesser extent, the state level and by self-regulatory organizations. We are also subject to regulations outside of the United States. Under certain of these laws and regulations, agencies that regulate investment advisers have broad administrative powers, including the power to limit, restrict or prohibit an investment adviser from carrying on its business in the event that it fails to comply with such laws and regulations. Possible sanctions that may be imposed include the suspension of individual employees, limitations on engaging in certain lines of business for specified periods of time, revocation of investment adviser and other registrations, censures and fines.
SEC Regulation
MNA and Rainier are registered with the U.S. Securities and Exchange Commission, (the "SEC"), as an investment adviser under the U.S. Investment Advisers Act of 1940, as amended, (the "Advisers Act"). Additionally, the Manning & Napier Fund, Inc., (the "Fund"), which is managed by MNA except for the Rainier International Discovery Series, for which Rainier serves as the sub-advisor, is registered under the U.S. Investment Company Act of 1940, (the "1940 Act"). The Advisers Act and the 1940 Act, together with the SEC’s regulations and interpretations thereunder, impose substantive and material restrictions and requirements on the operations of advisers and mutual funds. The SEC is authorized to institute proceedings and impose sanctions for violations of the Advisers Act and the 1940 Act, ranging from fines and censures to termination of an adviser’s registration.
As an investment adviser, we have fiduciary duties to our clients that are broad and apply to our entire relationship with our clients. These duties require us to serve the best interest of our clients and not subordinate the client's interest to our own. The SEC has interpreted these duties to impose standards, requirements and limitations on, among other things:
• | trading for proprietary, personal and client accounts; |
• | allocations of investment opportunities among clients; |
• | use of soft dollars; |
• | execution of transactions; and |
• | recommendations to clients. |
We manage accounts for a majority of our clients on a discretionary basis, which typically affords us the authority to buy and sell securities for each portfolio, select broker-dealers to execute trades and negotiate brokerage commission rates. In connection with designated trade executions, we receive soft dollar credits from broker-dealers, which effectively reduces certain of our expenses. We believe all of our soft dollar arrangements comply with the safe harbor provided by Section 28(e) of the U.S. Securities Exchange Act of 1934, as amended (the "Exchange Act"). Constraints on our ability to use soft dollars as a result of statutory amendments or new regulations would increase our operating expenses and potentially hamper our investment process by limiting or eliminating access to vital research.
As a registered adviser, we are subject to many additional requirements that cover, among other things:
• | disclosure of information about our business to clients; |
• | maintenance of formal policies and procedures; |
• | maintenance of extensive books and records; |
• | restrictions on the types of fees we may charge; |
• | custody of client assets; |
• | client privacy; |
• | advertising; and |
• | solicitation of clients. |
The SEC has authority to inspect any investment adviser and typically inspects a registered adviser periodically to determine whether the adviser is conducting its activities (i) in accordance with applicable laws, (ii) consistent with disclosures made to clients and (iii) with adequate policies, procedures and systems to ensure compliance.
For the year ended December 31, 2019, 20% of our revenues were derived from our advisory services to investment companies registered under the 1940 Act, including 18% derived from our advisory services to the Fund. The 1940 Act imposes significant requirements and limitations on a registered fund, including with respect to its capital structure, investments and transactions. While we exercise broad discretion over the day-to-day management of the business and affairs and investment
6
portfolios of the Fund and the investment portfolios of the funds we sub-advise, our own operations are subject to oversight and management by each fund’s board of directors. Under the 1940 Act, a majority of the directors must not be “interested persons” with respect to us (sometimes referred to as the “independent director” requirement). The responsibilities of the board include, among other things, approving our investment management agreement with the Fund; approving other service providers; determining the method of valuing assets; and monitoring transactions involving affiliates. Our investment management agreements with the Fund may be terminated by the funds on not more than 60 days’ notice, and are subject to annual renewal by the Fund board after their initial term.
The 1940 Act also imposes on the investment adviser to a mutual fund a fiduciary duty with respect to the receipt of the adviser’s investment management fees. That fiduciary duty may be enforced by the SEC through administrative action or litigation by investors in the fund pursuant to a private right of action.
Under the Advisers Act, our investment management agreements may not be assigned without the client’s consent. Under the 1940 Act, investment management agreements with registered funds (such as the mutual funds we manage) terminate automatically upon assignment. The term “assignment” is broadly defined and includes direct assignments as well as assignments that may be deemed to occur upon the transfer, directly or indirectly, of a controlling interest in us.
Manning & Napier Investor Services, Inc. ("MNBD"), our SEC-registered broker-dealer subsidiary is the distributor for the Fund and is subject to SEC rules and regulations, including the Uniform Net Capital Rule, which requires MNBD to maintain a certain level of liquid assets. MNBD complied with its net capital requirements during the year ended December 31, 2019. MNBD will be subject to the full scope of Regulation Best Interest, which will require its associated persons to adhere to a higher standard of care and ensure that security, strategy or account type recommendations are in the customer's best interest at the time of the recommendation.
FINRA Regulation
MNBD is a member of the Financial Industry Regulatory Authority ("FINRA") and as such is subject to the various industry and professional regulations, standards, and reporting requirements established by FINRA.
ERISA-Related Regulation
We are a fiduciary under the Employee Retirement Income Security Act of 1974, as amended ("ERISA"), with respect to assets that we manage for benefit plan clients subject to ERISA. ERISA, regulations promulgated thereunder and applicable provisions of the Internal Revenue Code of 1986, as amended (the "IRC"), impose certain duties on persons who are fiduciaries under ERISA, prohibit certain transactions involving ERISA plan clients and provide monetary penalties for violations of these prohibitions.
The fiduciary duties under ERISA may be enforced by the U.S. Department of Labor by administrative action or litigation and by our benefit plan clients pursuant to a private right of action. The IRS may also assess excise taxes against us if we engage in prohibited transactions on behalf of or with our benefit plan clients.
New Hampshire Banking Regulation
Exeter Trust Company is a state-chartered non-depository trust company subject to the laws of the State of New Hampshire and the regulations promulgated thereunder by the New Hampshire Bank Commissioner.
Non-U.S. Regulation
Our sales and trading practices also subject us to certain foreign regulations. We have claimed an exemption from registration in Canada but are subject to those provincial regulations that apply to our limited operations in select Canadian provinces. Additionally, we invest globally and must adhere to country specific equity ownership reporting requirements in those foreign jurisdictions in which we invest. Our relationship with foreign domiciled clients or our sales and marketing efforts also could subject us to certain foreign regulations. We expect this trend to persist as such regulations increasingly have transnational application.
Employees
As of December 31, 2019, we had 307 employees, 297 of which are full-time, and most of whom are based in Fairport, New York.
Available Information
All annual reports on Form 10-K, quarterly reports on Form 10-Q and current reports on Form 8-K, and amendments to those reports, we file or furnish with the SEC pursuant to Section 13(a) or 15(d) of the Exchange Act are available free of charge from the SEC’s website at http://www.sec.gov/.
7
We also make the documents listed above available without charge through the Investor Relations section of our website at http://ir.manning-napier.com/. Such documents are available as soon as reasonably practicable after the electronic filing of the material with the SEC. The contents of our website are not incorporated by reference into this Annual Report.
Item 1A. Risk Factors.
Risks Related to our Business
Our revenues are dependent on the market value and composition of our AUM, which are subject to significant fluctuations.
We derive the majority of our revenue from investment management fees, typically calculated as a percentage of the market value of our AUM. As a result, our revenues are dependent on the value and composition of our AUM, all of which are subject to fluctuation due to many factors, including:
• | Declines in prices of securities in our portfolios. The prices of the securities held in the portfolios we manage may decline due to any number of factors beyond our control, including, among others, declining stock or commodities markets, changes in interest rates, a general economic downturn, political uncertainty, pandemics or other health crises such as the recent outbreak of novel coronavirus (COVID-19), or acts of terrorism. The U.S. and global financial markets continue to be subject to uncertainty and instability. Such factors could cause an unusual degree of volatility and price declines for securities in the portfolios we manage; |
• | Redemptions and other withdrawals. Our clients generally may withdraw their funds at any time, on very short notice and without any significant penalty. A substantial portion of our revenue is derived from investment advisory agreements that are terminable by clients upon short notice or no notice and investors in the mutual funds we advise can redeem their investments in those funds at any time without prior notice. Also, new clients and portfolios may not have the same client retention characteristics as we have experienced in the past. In a declining stock market, the pace of redemptions could accelerate; |
• | Investment performance. Our ability to deliver strong investment performance depends in large part on our ability to identify appropriate investment opportunities in which to invest client assets. If we are unable to identify sufficient appropriate investment opportunities for existing and new client assets on a timely basis, our investment performance could be adversely affected. The risk that sufficient appropriate investment opportunities may be unavailable is influenced by a number of factors including general market conditions. If our portfolios perform poorly, even over the short-term, as compared with our competitors or applicable third-party benchmarks, or the rankings of mutual funds we manage decline, we may lose existing AUM and have difficulty attracting new assets; and |
• | Competition from passive strategies. There has been an increasing preference for passive investment products, such as index and exchange-traded funds ("ETFs") over active strategies managed by asset managers. If this market preference continues, existing and prospective clients may choose to invest in passive investment products, our growth strategy may be impaired and our AUM may be negatively impacted. |
If any of these factors cause a decline in our AUM, it would result in lower investment management revenues. If our revenues decline without a commensurate reduction in our expenses, our net income will be reduced and our business will be adversely affected.
We derive substantially all of our revenues from contracts and relationships that may be terminated upon short or no notice.
We derive substantially all of our revenues from investment advisory and sub-advisor agreements, all of which are terminable by clients upon short notice or no notice and without any significant penalty.
Our mutual fund and collective investment trust relationships may be terminated or not renewed for any number of reasons. Our investment management agreements with mutual funds, as required by law, are generally terminable by the funds’ board of directors or a vote of the majority of the funds’ outstanding voting securities on not more than 60 days’ written notice. After an initial term, each fund’s investment management agreement must be approved and renewed annually by such fund’s board, including by its independent members. Similarly, our investment management agreements with the collective investment trusts may be terminated at any time by Exeter Trust Company's board of directors, which includes independent members. As of December 31, 2019, mutual fund and collective investment trust relationships represent 30% of our AUM and 31% of our revenue for the year ended December 31, 2019.
The decrease in revenues that could result from the termination of a material client relationship or group of client relationships could have an adverse effect on our business. During the fiscal year ended December 31, 2019, other than our relationship with the Fund, there were no customers that provided over 10 percent of our total revenue.
8
We may not realize the expected benefits from our restructuring plan and other operational improvement initiatives relating
to our strategic review of our business.
We commenced a strategic review of our business upon the appointment of our new Chief Executive, Marc Mayer, in early 2019. Our comprehensive review resulted in changes to our overall distribution strategy, our suite of investment offerings, and our operational platform. The objective of this review was to improve financial results for stockholders and investment results for clients by more clearly prioritizing our strengths, eliminating distractions and sub-scale offerings, and increasing productivity across the firm through improved technology. As a result of this strategic review, we incurred approximately
$11.1 million of strategic restructuring and transaction costs (excluding a $2.9 million gain on the sale of PPI). These charges
consisted of $3.4 million of employee severance costs and $7.7 million of other operating costs, which included approximately $6.3 million of impairment charges stemming from the write-off of existing contracts that we will not be utilizing as we move forward with a new third-party service provider to leverage its platform in an effort to expand our digital capabilities. We will likely incur additional costs in the future as a result of this strategic review. There can be no assurance that the costs of undertaking our operational improvement initiatives will be offset by future earnings that may result from the improvements, and it is possible that we will not realize the expected benefits from our operational improvement initiatives to the extent we anticipate or at all.
Our portfolios may not obtain attractive returns under certain market conditions or at all.
The goal of our investment process is to provide competitive absolute returns over full market cycles. Accordingly, our portfolios may not perform well compared to benchmarks or other investment managers’ strategies during certain periods of time, under certain market conditions, or after specific market shocks. Underperformance may negatively affect our ability to retain clients and attract new clients. We are likely to be most out of favor when the markets are running on positive or negative price momentum and market prices become disconnected from underlying investment fundamentals. During and shortly following such periods of relative under performance, we are likely to see our highest levels of client turnover, even if our absolute returns are positive. Loss of client assets and the failure to attract new clients could adversely affect our revenues and growth.
Difficult market conditions can adversely affect our strategies in many ways, including by negatively impacting their performance and reducing their ability to raise or deploy capital, which could materially reduce our revenues and adversely affect our business, financial condition or results of operations.
Significant disruptions and volatility in the global financial markets and economies could impair the investment performance of our strategies. Although we seek to generate consistent, positive, absolute returns across all market cycles, our strategies have been and may be materially affected by conditions in the global financial markets and economic conditions. The global market and economic climate may become increasingly uncertain due to numerous factors beyond our control, including but not limited to, concerns related to unpredictable global market and economic factors, uncertainty in U.S. federal fiscal, tax, trade or regulatory policy and the fiscal, tax, trade or regulatory policy of foreign governments, rising interest rates, inflation or deflation, the availability of credit, performance of financial markets, terrorism, natural or biological catastrophes, public health emergencies including the current coronavirus outbreak, or political uncertainty.
A general market downturn, a specific market dislocation or deteriorating economic conditions may cause a material reduction in our revenues and adversely affect our business, financial condition or results of operations by causing:
• | A decline in AUM, resulting in lower management fees and incentive income. |
• | An increase in the cost of financial instruments, executing transactions or otherwise doing business. |
• | Lower or negative investment returns, which may reduce AUM and potential incentive income. |
• | Reduced demand for assets held by our funds, which would negatively affect our funds’ ability to realize value from such assets. |
• | Increased investor redemptions or greater demands for enhanced liquidity or other terms, resulting in a reduction in AUM, lower revenues and potential increased difficulty in raising new capital. |
Furthermore, while difficult market and economic conditions and other factors can potentially increase investment opportunities over the long term, such conditions and factors also increase the risk of increased investment losses and additional regulation, which may impair our business model and operations. Our strategies may also be adversely affected by difficult market conditions if we fail to assess the adverse effect of such conditions, which would likely result in significant reductions in the returns of those strategies. Moreover, challenging market conditions may prompt industry-wide reductions in fees. In response to competitive pressures or for any other reason, we may reduce or change our fee structures, which could reduce the amount of fees and income that we may earn relative to AUM.
An investment in our Class A common stock is not an alternative to investing in our strategies, and the returns of our strategies should not be considered as indicative of any returns expected on our Class A common stock, although if our
9
strategies perform poorly, our revenue could be materially adversely impacted, which may in turn impact the returns on our Class A common stock.
The returns on our Class A common stock are not directly linked to the historical or future performance of our investment strategies. Even if our strategies experience positive performance and our AUM increases, holders of our Class A common stock may not experience a corresponding positive return on their Class A common stock.
However, poor performance of our strategies could cause a decline in our revenues, and may therefore have a negative effect on our performance and the returns on our Class A common stock. If we fail to meet the expectations of our clients or otherwise experience poor performance, whether due to difficult economic and financial conditions or otherwise, our ability to retain existing AUM and attract new clients could be materially adversely affected. In turn, the fees that we would earn would be reduced and our business, financial condition or results of operations would suffer, thus negatively impacting the price of our Class A common stock. Furthermore, even if the investment performance of our strategies is positive, our business, financial condition or results of operations and the price of our Class A common stock could be materially adversely affected if we are unable to attract and retain additional AUM consistent with our past experience, industry trends or investor and market expectations.
The loss of key investment and sales professionals, members of our senior management team, or difficulty integrating new executives, could have an adverse effect on our business.
We depend on the skills, expertise and institutional knowledge of our key employees, including qualified investment and sales professionals and members of our senior management team, and our success depends on our ability to retain such key employees. Our investment professionals possess substantial experience in investing and have been primarily responsible for the historically attractive investment performance we have achieved. We particularly depend on our executive officers as well as senior members of our research department. In 2019, we experienced a headcount reduction from 366 to 307 employees as part of our restructuring plan relating to our strategic review of our business. This and any future reductions to headcount may result in the loss of expertise and institutional knowledge and could adversely affect our business.
We have had significant changes in executive leadership and more could occur. Changes to strategic or operating goals, which can occur with the appointment of new executives, can create uncertainty, and may ultimately be unsuccessful. In addition, executive leadership transition periods, including adding new personnel, could be difficult as new executives gain an understanding of our business and strategy. Difficulty integrating new executives, or the loss of key individuals could limit our ability to successfully execute our business strategy and could have an adverse effect on our overall financial condition.
Competition for qualified investment, sales and top level management professionals is intense. Attracting qualified personnel, including top level management, may take time and we may fail to attract and retain qualified personnel including top level management in the future. Our ability to attract and retain our executive officers and other key employees will depend heavily on our business strategy, corporate culture and the amount and structure of compensation. We have historically utilized a compensation structure that uses a combination of cash and equity-based incentives as appropriate. However, our compensation may not be effective to recruit and retain the personnel we need if our overall compensation packages are not competitive in the marketplace. Any cost-reduction initiative or adjustments or reductions to compensation could negatively impact our ability to retain key personnel, as could changes to our management structure, corporate culture and corporate governance arrangements.
We may be required to reduce the fees we charge, or our fees may decline due to changes in our AUM composition, which could have an adverse effect on our profit margins and results of operations.
Our current fee structure may be subject to downward pressure due to a variety of factors, including a trend in recent years toward lower fees in the investment management industry. We may be required to reduce fees with respect to both the separate accounts we manage and the mutual funds and collective trust funds we advise. We may charge lower fees in order to attract future new business, which may result in us having to also reduce our fees with respect to our existing business. During the first quarter of 2019, we completed the effort of restructuring fees for many of our mutual funds and collective trust vehicles. Given the overall pressure on fees that all active managers are facing, we believe that bringing our fund fees to a more competitive level will enhance our ability to attract additional business in the future. The fee restructuring reduced the management fees on our existing business, and may fail to attract additional business sufficient to offset any reduction in related operating expenses. Any further fee reductions on existing or future new business could have an adverse effect on our profit margins and results of operations.
10
Our AUM may be concentrated in certain strategies.
Client purchase and redemption activity may result in AUM concentrations with certain of our investment strategies. As a result, a substantial portion of our operating results may depend upon the performance of these strategies. If we sustain poor investment performance or adverse market conditions, clients may withdraw their investments or terminate their investment management agreements. These conditions would result in a reduction in our revenues from these strategies, which could have an adverse effect on our earnings and financial condition.
Our business is primarily focused in certain targeted geographic regions making us vulnerable to risks associated with having geographically concentrated operations.
Although our client base is national, we are primarily focused in certain targeted geographic regions, including the northeastern and southeastern regions of the United States. Furthermore, our review of our intermediary and institutional distribution strategy resulted in changes to our territory coverage and servicing efforts in order to more effectively service our existing clients with our team, while concentrating on geographies with the greatest chances for growth. This could have the effect of increasing the risks associated with having geographically concentrated operations. Our business, financial condition and results of operations may be susceptible to regional economic downturns and other regional factors.
Several of our portfolios involve investing principally in the securities of non-U.S. companies, which involve foreign currency exchange risk, and tax, political, social and economic uncertainties and risks.
As of December 31, 2019, approximately 23% of our AUM across all of our portfolios was invested in securities of non-U.S. companies. Fluctuations in foreign currency exchange rates could negatively affect the returns of our clients who are invested in these strategies. An increase in the value of the U.S. dollar relative to non-U.S. currencies is likely to result in a decrease in the U.S. dollar value of our AUM, which, in turn, could result in lower revenue since we report our financial results in U.S. dollars.
Investments in non-U.S. issuers may also be affected by tax positions taken in countries or regions in which we are invested as well as political, social and economic uncertainty. Declining tax revenues may cause governments to assert their ability to tax the local gains and/or income of foreign investors (including our clients), which could adversely affect clients’ interests in investing outside their home markets. Many financial markets are not as developed, or as efficient, as the U.S. financial markets, and as a result, those markets may have limited liquidity and higher price volatility and may lack established regulations. Liquidity may also be adversely affected by political or economic events, government policies, social or civil unrest within a particular country, and our ability to dispose of an investment may also be adversely affected if we increase the size of our investments in smaller non-U.S. issuers. Non-U.S. legal and regulatory environments, including financial accounting standards and practices, may also be different, and there may be less publicly available information about such companies. These risks could adversely affect the performance of our strategies that are invested in securities of non-U.S. issuers and may be particularly acute in the emerging or less developed markets in which we invest.
The historical returns of our existing portfolios may not be indicative of their future results or of the portfolios we may develop in the future.
The historical returns of our portfolios and the ratings and rankings we or the mutual funds that we advise have earned in the past should not be considered indicative of the future results of these portfolios or of any other portfolios that we may develop in the future. The investment performance we achieve for our clients varies over time and the variance can be wide. The ratings and rankings we or the mutual funds we advise have earned are typically revised monthly. The historical performance and ratings and rankings included in this report are as of December 31, 2019 and for periods then ended except where otherwise stated. The performance we have achieved and the ratings and rankings earned at subsequent dates and for subsequent periods may be higher or lower and the difference could be material. Our portfolios’ returns have benefited during some periods from investment opportunities and positive economic and market conditions. In other periods, general economic and market conditions have negatively affected our portfolios’ returns. These negative conditions may occur again, and in the future we may not be able to identify and invest in profitable investment opportunities within our current or future portfolios.
Support provided to new products may reduce fee income, increase expenses and expose us to potential loss on invested capital.
We may support the development of new investment products by waiving all or a portion of the fees we receive for managing such products, by subsidizing expenses or by making seed capital investments. Seed investments in new products utilize Company capital that would otherwise be available for general corporate purposes and expose us to capital losses to the extent that realized investment losses are not offset by hedging gains. The risk of loss may be greater for seed capital investments that are not hedged, or if an intended hedge does not perform as expected. Failure to have or devote sufficient capital to support new products could have on adverse impact on our future growth.
11
Assets influenced by third-party intermediaries have a higher risk of redemption and are subject to changes in fee structures, which could reduce our revenues.
Investments in our mutual funds made through third-party intermediaries, as opposed to mutual fund investments resulting from sales by our own representatives can be more easily moved to investments in funds other than ours. Third-party intermediaries are attractive to investors because of the ease of accessibility to a variety of funds, but this causes the investments to be more sensitive to fluctuations in performance, especially in the short-term. If we were unable to retain the assets of our mutual funds held through third-party intermediaries, our AUM would be reduced. As a result, our revenues could decline and our business, results of operations and financial condition could be materially adversely affected.
We may elect to pursue growth in the United States and abroad through acquisitions or joint ventures, which would expose us to risks inherent in assimilating new operations, expanding into new jurisdictions, and making non-controlling minority investments in other entities.
In order to maintain and enhance our competitive position, we may review and pursue acquisition and joint venture opportunities. We cannot assure we will identify and consummate any such transactions on acceptable terms or have sufficient resources to accomplish such a strategy. Any strategic transaction can involve a number of risks, including:
• | additional demands on our staff; |
• | unanticipated problems regarding integration of investor account and investment security recordkeeping, operating facilities and technologies, and new employees; |
• | adverse effects in the event acquired intangible assets or goodwill become impaired; |
• | the existence of liabilities or contingencies not disclosed to or otherwise known by us prior to closing such a transaction; and |
• | dilution to our public stockholders if we issue shares of our Class A common stock, or units of Manning & Napier Group with exchange rights, in connection with future acquisitions. |
A portion of our separate account business, mutual funds, and collective investment trusts are distributed through intermediaries, platforms, and consultants. Changes in key distribution relationships could reduce our revenues and adversely affect our profitability.
Given that a portion of our product offerings are distributed through intermediaries, platforms, and investment consultants, a share of our success is dependent on access to these various distribution systems. These distributors are not contractually required to distribute or consider our products for placement within advisory programs, on platforms’ approved lists, or in active searches conducted by investment consultants. Additionally, these intermediaries typically offer their clients various investment products and services, in addition to and in competition with our products and services. If we are unable to cultivate and build strong relationships within these distribution channels, the sales of our products could lead to a decline in revenues and profitability. Additionally, increasing competition for these distribution channels could cause our distribution costs to rise, which could have an adverse effect on our profitability.
Our efforts to establish new portfolios or new products or services may be unsuccessful and could negatively impact our results of operations and our reputation.
As part of our growth strategy, we may seek to take advantage of opportunities to develop new portfolios consistent with our philosophy of managing portfolios to meet our clients’ objectives and using a team-based investment approach. The initial costs associated with establishing a new portfolio likely will exceed the revenues that the portfolio generates. If any such new portfolio performs poorly or fails to attract sufficient assets to manage, our results of operations could be negatively impacted. Further, a new portfolio’s poor performance may negatively impact our reputation and the reputation of our other portfolios within the investment community. We have developed and may seek from time to time to develop new products and services to take advantage of opportunities involving technology, insurance, participant and plan sponsor education and other products beyond investment management. The development of these products and services could involve investment of financial and management resources and may not be successful in developing client relationships, which could have an adverse effect on our business. The cost to develop these products initially will likely exceed the revenue they generate and additional investment in these products could negatively impact short term financial results. If establishing new portfolios or offering new products or services requires hiring new personnel, to the extent we are unable to recruit and retain sufficient personnel, we may not be successful in further diversifying our portfolios, client assets and business, which could have an adverse effect on our business and future prospects.
Our failure to comply with investment guidelines set by our clients and limitations imposed by applicable law, could result in damage awards against us and a loss of our AUM, either of which could adversely affect our reputation, results of operations or financial condition.
12
When clients retain us to manage assets on their behalf, they generally specify certain guidelines regarding investment allocation that we are required to follow in managing their portfolios. We are also required to invest the mutual funds’ assets in accordance with limitations under the 1940 Act, and applicable provisions of the IRC. Other clients, such as plans subject to ERISA, or non-U.S. funds, require us to invest their assets in accordance with applicable law. Our failure to comply with any of these guidelines and other limitations could result in losses to clients or investors in our products which, depending on the circumstances, could result in our obligation to make clients whole for such losses. If we believed that the circumstances did not justify a reimbursement, or clients believed the reimbursement we offered was insufficient, clients could seek to recover damages from us, withdraw assets from our products or terminate their investment management agreement with us. Any of these events could harm our reputation and adversely affect our business.
A change of control of our company could result in termination of our investment advisory agreements.
Under the 1940 Act, each of the investment advisory agreements for SEC registered mutual funds that our affiliate, MNA, advises automatically terminates in the event of its assignment, as defined under the 1940 Act. If such an assignment were to occur, MNA could continue to act as adviser to any such fund only if that fund’s board of directors and stockholders approved a new investment advisory agreement, except in the case of certain of the funds that we sub-advise for which only board approval would be necessary. Under the Advisers Act each of the investment advisory agreements for the separate accounts we manage may not be assigned without the consent of the client. An assignment may occur under the 1940 Act and the Advisers Act if, among other things, MNA undergoes a change of control. In certain other cases, the investment advisory agreements for the separate accounts we manage require the consent of the client for any assignment. If such an assignment occurs, we cannot be certain that MNA will be able to obtain the necessary approvals from the boards and stockholders of the mutual funds that it advises or the necessary consents from separate account clients.
Operational risks may disrupt our business, result in losses or limit our growth.
We are heavily dependent on the capacity and reliability of the communications, information and technology systems supporting our operations, whether developed, owned and operated by us or by third parties. Operational risks such as trading or operational errors or interruption of our financial, accounting, trading, compliance and other data processing systems, whether caused by fire, natural disaster or pandemic, power or telecommunications failure, act of terrorism or war or otherwise, could result in a disruption of our business, liability to clients, regulatory intervention or reputational damage, and thus adversely affect our business. Some types of operational risks, including, for example, trading errors, may be increased in periods of increased volatility, which can magnify the cost of an error. Although we have back-up systems in place, our back-up procedures and capabilities in the event of a failure or interruption may not be adequate, and the fact that we operate our business out of multiple physical locations may make such failures and interruptions difficult to address on a timely and adequate basis.
We depend on our headquarters in Fairport, New York, where a majority of our employees, administration and technology resources are located, for the continued operation of our business. Any significant disruption to our headquarters could have an adverse effect on our business.
A failure to effectively maintain, enhance and modernize our information technology systems, and effectively develop and deploy new technologies, could adversely affect our business.
Our success depends on our ability to maintain effective information technology systems, to enhance those systems to better support our business in an efficient and cost-effective manner and to develop new technologies and capabilities in pursuit of our long-term strategy. We recently selected InvestCloud to lead our digital transformation, and will utilize InvestCloud's full suite of applications in order to deliver what we believe will be the best possible experience for our clients and partners. The multi-phased conversion will focus on enhancing the digital client experience, streamlining back-office processes, and centralizing performance data and reporting. Additionally, as part of the InvestCloud implementation, we will substantially re-engineer many of our business processes.
Some technology development initiatives are long-term in nature, may negatively impact our financial results as we invest in the initiatives, may cost more than anticipated to complete, or may not be completed. Additionally, our technology initiatives may be more costly or time-consuming than anticipated, may not deliver the expected benefits upon completion, and may need to be replaced or become obsolete more quickly than expected, which could result in accelerated recognition of expenses. If we fail to maintain or enhance our existing information technology systems or if we were to experience failure in developing and implementing new technologies, our relationships, reputation, ability to do business with our clients and our competitive position may be adversely affected. We could also experience other adverse consequences, including additional costs or write-offs of capitalized costs, unfavorable underwriting and reserving decisions, internal control deficiencies, and information security breaches resulting in loss or inappropriate disclosure of data. We have been required to make significant capital expenditures to update our technology infrastructure, and we may incur the costs described above as we deploy this new technology.
13
Failure to implement effective information and cyber security policies, procedures and capabilities, or cybersecurity breaches of software applications and other technologies on which we rely, could disrupt operations and cause financial losses that could result in a decrease in earnings and reputational harm.
We are dependent on the effectiveness of our, and third party software vendors', information and cybersecurity policies, procedures and capabilities to protect our computer and telecommunications systems and the data that reside on or are transmitted through them. As part of our normal operations, we maintain and transmit confidential information about our clients and employees as well as proprietary information relating to our business operations. We maintain a system of internal controls designed to provide reasonable assurance that fraudulent activity, including misappropriation of assets, fraudulent financial reporting and unauthorized access to sensitive or confidential data is either prevented or detected on a timely basis. Nevertheless, all technology systems remain vulnerable to unauthorized access and may be corrupted by cyberattacks, computer viruses or other malicious software code, the nature of which threats are constantly evolving and becoming increasingly sophisticated. Breach or other failure of our technology systems, including those of third parties with which we do business, or failure to timely and effectively identify and respond to any such breach or failure, could result in the loss of valuable information, liability for stolen assets or information, remediation costs to repair damage caused by the incident, additional security costs to mitigate against future incidents, increased insurance premiums, and litigation costs resulting from the incident. Moreover, loss of confidential customer information could harm our reputation, result in the termination of contracts by our existing customers and subject us to liability under laws that protect confidential personal data, resulting in increased costs or loss of revenues. Ultimately, a cyberattack can damage our competitiveness, stock price and long-term stockholder value. Recent well-publicized security breaches at other companies have led to enhanced government and regulatory scrutiny of the measures taken by companies to protect against cyberattacks, and may in the future result in heightened cybersecurity requirements, including additional regulatory expectations for oversight of vendors and service providers.
We depend on third-party service providers for services that are important to our business, and an interruption or cessation of such services by any such service providers could have an adverse effect on our business.
We depend on a number of service providers, including custodial and clearing firms, and vendors of communications and networking products and services. We cannot assure that these providers will be able to continue to provide these services in an efficient manner or that they will be able to adequately expand their services to meet our needs. An interruption or malfunction in or the cessation of an important service by any third-party and our inability to make alternative arrangements in a timely manner, or at all, could have an adverse impact on our business, financial condition and operating results.
Employee misconduct could expose us to significant legal liability and reputational harm.
We operate in an industry in which integrity and the confidence of our clients are of critical importance. Accordingly, if any of our employees engage in illegal or suspicious activities or other misconduct, we could be subject to regulatory sanctions and suffer serious harm to our reputation, financial condition, client relationships and ability to attract new clients. For example, our business often requires that we deal with confidential information. If our employees were to improperly use or disclose this information, even if inadvertently, we could suffer serious harm to our reputation, financial condition and current and future business relationships. It is not always possible to deter employee misconduct, and the precautions we take to detect and prevent this activity may not always be effective. Misconduct by our employees, or even unsubstantiated allegations of misconduct, could result in an adverse effect on our reputation and our business.
Failure to properly address conflicts of interest could harm our reputation, business and results of operations.
We must monitor and address any conflicts between our interests and those of our clients. The SEC and other regulators scrutinize potential conflicts of interest, and we have implemented procedures and controls that we believe are reasonably designed to address these issues. However, appropriately dealing with conflicts of interest is complex, and if we fail, or appear to fail, to deal appropriately with conflicts of interest, we could face reputational damage, litigation or regulatory proceedings or penalties, any of which could adversely affect our reputation, business and results of operations.
If our techniques for managing risk are ineffective, we may be exposed to material unanticipated losses.
In order to manage the significant risks inherent in our business, we must maintain effective policies, procedures and systems that enable us to identify, monitor and control our exposure to operational, legal and reputational risks. Our risk management methods may prove to be ineffective due to their design or implementation, or as a result of the lack of adequate, accurate or timely information or otherwise. If our risk management efforts are ineffective, we could suffer losses that could have an adverse effect on our financial condition or operating results. Additionally, we could be subject to litigation, particularly from our clients, and sanctions or fines from regulators. Our techniques for managing risks in client portfolios may not fully mitigate the risk exposure in all economic or market environments, or against all types of risk, including risks that we might fail to identify or anticipate.
The cost of insuring our business is substantial and may increase.
14
While we carry insurance in amounts and under terms that we believe are appropriate, we cannot guarantee that our insurance will cover all liabilities and losses to which we may be exposed or, if covered, that such liabilities and losses will not exceed the limits of available insurance coverage, or that our insurers will remain solvent and meet their obligations. We cannot guarantee that our insurance policies will continue to be available at current terms and fees.
We believe our insurance costs are reasonable but they could fluctuate significantly from year to year. Certain insurance coverage may not be available or may only be available at prohibitive costs. As we renew our insurance policies, we may be subject to additional costs resulting from rising premiums, the assumption of higher deductibles or co-insurance liability and, to the extent certain of our mutual funds purchase separate director and officer or errors and omissions liability coverage, an increased risk of insurance companies disputing responsibility for joint claims. Higher insurance costs and incurred deductibles, as with any expense, would reduce our net income.
Risks Related to our Industry
We are subject to extensive regulation.
We are subject to extensive regulation for our investment management business and operations, including regulation by the SEC under the 1940 Act and the Advisers Act, by the U.S. Department of Labor under ERISA, and by FINRA. The U.S. mutual funds we advise are registered with and regulated by the SEC as investment companies under the 1940 Act. The Advisers Act imposes numerous obligations on investment advisers including record keeping, advertising and operating requirements, disclosure obligations and prohibitions on fraudulent activities. The 1940 Act imposes similar obligations, as well as additional detailed operational requirements, on registered investment companies, which must be adhered to by their investment advisers. The U.S. mutual funds that we advise and our broker-dealer subsidiary are each subject to the USA PATRIOT Act of 2001, which requires them to know certain information about their clients and to monitor their transactions for suspicious financial activities, including money laundering. The U.S. Office of Foreign Assets Control, ("OFAC"), has issued regulations requiring that we refrain from doing business, or allow our clients to do business through us, in certain countries or with certain organizations or individuals on a list maintained by the U.S. government.
Our failure to comply with applicable laws or regulations could result in fines, censure, suspensions of personnel or other sanctions, including revocation of our registration as an investment adviser. Even if a sanction imposed against us or our personnel is small in monetary amount, the adverse publicity arising from the imposition of sanctions against us by regulators could harm our reputation, result in withdrawal by our clients from our products and impede our ability to retain clients and develop new client relationships, which may reduce our revenues.
We face the risk of significant intervention by regulatory authorities, including extended investigation and surveillance activity, adoption of costly or restrictive new regulations and judicial or administrative proceedings that may result in substantial penalties. Among other things, we could be fined or be prohibited from engaging in some of our business activities. The requirements imposed by our regulators are designed to ensure the integrity of the financial markets and to protect customers and other third parties who deal with us, and are not designed to protect our stockholders. Accordingly, these regulations often serve to limit our activities, including through net capital, customer protection and market conduct requirements.
The regulatory environment in which we and our clients operate is subject to continual change, and regulatory developments designed to increase oversight could adversely affect our business.
The legislative and regulatory environment in which we operate undergoes continuous change and we believe that this trend will intensify, subjecting industry participants to additional, more costly and potentially more punitive regulation. New laws or regulations, or changes in the enforcement of existing laws or regulations, applicable to us and our clients could adversely affect our business. Any or all of the regulators who oversee us could adopt new rules or rule amendments that could substantially impact how we operate and may necessitate significant expenditures in order to adapt and comply.
Our ability to function in an uncertain and ever-changing regulatory environment will depend on our ability to constantly monitor and promptly react to legislative and regulatory changes, which inevitably result in intangible costs and resource drains. The compliance burden resulting from regulatory changes and uncertainty is likely to increase, particularly as regulators grow more technologically advanced and more reliant on data analytics. As a result, we may be forced to divert resources and expenditures to information technology in order to analyze data and risk in the same manner as regulators and to be able to provide regulators with the data output they may expect going forward.
Regulations may accelerate industry trends towards passive or lower cost investment options, centralized due diligence and shrinking platform ability, making access to intermediary decision-makers more challenging. Mutual fund intermediaries may be forced to eliminate or curtail the availability of certain mutual fund share classes, which may hamper our distribution efforts and reduce assets in the mutual fund. Similarly, platform consolidations may prevent our separate account intermediaries from supporting our products, which could result in AUM declines and fewer distribution channels.
15
There have been a number of highly publicized regulatory inquiries that have focused on the investment management industry. These inquiries have resulted in increased scrutiny of the industry and new rules and regulations for mutual funds and investment managers. This regulatory scrutiny may limit our ability to engage in certain activities that might be beneficial to our stockholders. Further, adverse results of regulatory investigations of mutual fund, investment advisory and financial services firms could tarnish the reputation of the financial services industry generally and mutual funds and investment advisers more specifically, causing investors to avoid further fund investments or redeem their account balances. Redemptions would decrease our AUM, which would reduce our advisory revenues and net income.
Further, due to acts of serious fraud in the investment management industry and perceived lapses in regulatory oversight, U.S. and non-U.S. governmental and regulatory authorities may continue to increase regulatory oversight of our business.
The investment management industry is intensely competitive.
The investment management industry is intensely competitive, with competition based on a variety of factors, including investment performance, investment management fee rates, recent trend towards favor for passive investment products, continuity of investment professionals and client relationships, the quality of services provided to clients, corporate positioning and business reputation, continuity of selling arrangements with intermediaries and differentiated products. A number of factors, including the following, serve to increase our competitive risks:
• | some competitors, including those with passive investment products and exchange traded funds, charge lower fees for their investment services than we do; |
• | a number of our competitors have greater financial, technical, marketing and other resources, more comprehensive name recognition and more personnel than we do; |
• | potential competitors have a relatively low cost of entering the investment management industry; |
• | the recent trend toward consolidation in the investment management industry, and the securities business in general, has served to increase the size and strength of a number of our competitors; |
• | some investors may prefer to invest with an investment manager that is not publicly traded based on the perception that a publicly traded asset manager may focus on the manager’s own growth to the detriment of investment performance for clients; |
• | some competitors may invest according to different investment styles or in alternative asset classes that the markets may perceive as more attractive than the portfolios we offer; |
• | some competitors may have more attractive investment returns; |
• | some competitors may operate in a different regulatory environment than we do, which may give them certain competitive advantages in the investment products and portfolio structures that they offer; and |
• | other industry participants, hedge funds and alternative asset managers may seek to recruit our investment professionals. |
If we are unable to compete effectively, our revenues could be reduced and our business could be adversely affected.
Our industry is increasingly becoming subject to rapid changes in technology that may alter historical methods of doing business.
The financial industry continues to be impacted by innovation, technological changes, and changing customer preferences, including the emergence of “FinTech” companies and the deployment of new technologies based on artificial intelligence and machine learning that are becoming increasing competitive with and may disrupt more traditional business models. If we do not effectively anticipate and adapt to these changes it could limit our ability to compete, decrease the value of our products to clients, and adversely affect our business and results of operations.
Our business could also be affected by technological changes in the industries that represent our target markets, including tasks/roles that are currently performed by people being replaced by automation, artificial intelligence, or other advances outside of our control, which could impact national brokerage firm representatives or independent financial advisors, upon which a portion of our revenues are based, and adversely affect our business and results of operations.
The investment management industry faces substantial litigation risks, which could adversely affect our business, financial condition or results of operations or cause significant reputational harm to us.
We depend to a large extent on our network of relationships and on our reputation to attract and retain client assets. If a client is not satisfied with our services, its dissatisfaction may be more damaging to our business than client dissatisfaction would be to other types of businesses. We make investment decisions on behalf of our clients that could result in substantial losses to them. If our clients suffer significant losses, or are otherwise dissatisfied with our services, we could be subject to the
16
risk of legal liabilities or actions alleging negligent misconduct, breach of fiduciary duty, breach of contract, unjust enrichment and/or fraud. These risks are often difficult to assess or quantify and their existence and magnitude often remain unknown for substantial periods of time, even after an action has been commenced. We may incur significant legal expenses in defending against litigation whether or not we engaged in conduct as a result of which we might be subject to legal liability. Substantial legal liability or significant regulatory action against us could adversely affect our business, financial condition or results of operations or cause significant reputational harm to us.
Catastrophic and unpredictable events could have an adverse effect on our business.
A terrorist attack, war, power failure, cyber-attack, natural disaster, pandemic or other catastrophic or unpredictable event could adversely affect our future revenues, expenses and earnings by:
• | decreasing investment valuations in, and returns on, the assets that we manage; |
• | causing disruptions in national or global economies that decrease investor confidence and make investment products generally less attractive; |
• | interrupting our normal business operations; |
• | sustaining employee casualties, including loss of our key members of our senior management team or our investment team; |
• | requiring substantial expenditures and expenses to repair, replace and restore normal business operations; and |
• | reducing investor confidence. |
We have a disaster recovery plan to address certain contingencies, but we cannot be assured that this plan will be sufficient in responding or ameliorating the effects of all disaster scenarios. If our employees or the vendors we rely upon for support in a catastrophic event are unable to respond adequately or in a timely manner, we may lose clients resulting in a decrease in AUM which may have an adverse effect on revenues and net income.
Risks Related to Our Structure
William Manning and our current and former employee owners, beneficially own approximately 81% of Manning & Napier Group as of December 31, 2019, which may give rise to conflicts of interest; failure to properly address these or other conflicts of interests could harm our reputation, business and results of operations.
Our current and former employee owners, including William Manning, directly and through their ownership of M&N Group Holdings ("M&N Group Holdings") and Manning & Napier Capital Company, LLC ("MNCC"), indirectly hold approximately 81% of the ownership interests in Manning & Napier Group as of December 31, 2019 which, as discussed elsewhere, is our sole source of revenue. M&N Group Holdings and MNCC are entities controlled by William Manning, who, through his ownership indirectly owns a total of approximately 78% of the ownership interests in Manning & Napier Group. All of the other owners of interests in M&N Group Holdings and MNCC are current or former management team members of ours. Through William Manning and our current and former employee owners' economic interest, they may receive payments from Manning & Napier under the tax receivable agreement entered into with them at the time of the reorganization transactions and the proceeds they may receive as a result of M&N Group Holdings and MNCC exchanging the interests attributable to them in Manning & Napier Group for cash or, at our election, shares of our Class A common stock and, in the case of exchanges for shares of our Class A common stock, from selling such Class A common stock. As a result, William Manning and our current and former employee owners' economic interests may conflict with the interests of Manning & Napier and its public stockholders.
Further, such owners have the right to cause M&N Group Holdings and MNCC to exchange their indirect interests in Manning & Napier Group for cash or shares of our Class A common stock. If they exercise this right in sufficient amounts, receive shares of our Class A common stock and do not resell such shares, these owners may control us.
The interests of these owners may conflict with our interests and the interests of the holders of our Class A common stock. Decisions of these owners, including William Manning, our Chairman, with respect to Manning & Napier Group, including those relating to the tax receivable agreement, the exchange agreement and the structuring of future transactions, may take into consideration these owners’ tax or other considerations even where no similar benefit would accrue to us or the holders of our Class A common stock.
Our ability to pay regular dividends to our stockholders is subject to the discretion of our board of directors and may be limited by our structure and applicable provisions of Delaware law.
We have historically declared cash dividends on our Class A common stock, however, our board of directors may, in its sole discretion, change the amount or frequency of dividends or discontinue the payment of dividends entirely. Because of our structure, we will be dependent upon the ability of our subsidiaries to generate earnings and cash flows and distribute them to us so that we may pay dividends to our stockholders. We expect to cause Manning & Napier Group to make distributions to its members, including us, in an amount sufficient for us to pay dividends, if any. However, its ability to make such distributions
17
will be subject to its and its subsidiaries’ operating results, cash requirements and financial condition, the applicable laws of the State of Delaware, which may limit the amount of funds available for distribution, and its compliance with covenants and financial ratios related to any indebtedness it may incur in the future. In addition, as described elsewhere, under the terms of its operating agreement, Manning & Napier Group is obligated to make tax distributions to holders of its units, including us. As a consequence of these various limitations and restrictions, we may not be able to make, or may have to reduce or eliminate, the payment of dividends on our Class A common stock. Any change in the level of our dividends or the suspension of the payment thereof could adversely affect the market price of our Class A common stock.
We depend on distributions from Manning & Napier Group to pay taxes and expenses, including payments under the tax receivable agreement, but Manning & Napier Group’s ability to make such distributions will be subject to various limitations and restrictions.
We have no material assets other than our ownership of Class A units of Manning & Napier Group and have no independent means of generating revenue. Manning & Napier Group is treated as a partnership for U.S. federal income tax purposes and, as such, is not subject to U.S. federal income tax. Instead, taxable income is allocated to holders of its units, including us. Accordingly, we incur income taxes on our allocable share of any net taxable income of Manning & Napier Group. Under the terms of its operating agreement, Manning & Napier Group is obligated to make tax distributions to holders of its units, including us. We also incur expenses related to our operations, including expenses under the tax receivable agreement, which we expect to be significant. We intend, as its managing member, to cause Manning & Napier Group to make distributions in an amount sufficient to allow us to pay our taxes and operating expenses, including any payments due under the tax receivable agreement. However, Manning & Napier Group’s ability to make such distributions is subject to various limitations and restrictions including, but not limited to, restrictions on distributions that would violate any contract or agreement to which Manning & Napier Group is then a party or any applicable law or that would have the effect of rendering Manning & Napier Group insolvent. If we do not have sufficient funds to pay tax or other liabilities to fund our operations, we may have to borrow funds, which could adversely affect our liquidity and financial condition and subject us to various restrictions imposed by any such lenders.
Furthermore, by paying cash distributions rather than investing in our business, we might not have sufficient cash to fund operations or new growth initiatives that will support the growth of our business.
We are required to pay holders of units of Manning & Napier Group for certain tax benefits we may claim as a result of the tax basis step up we realize in connection with the future purchases or exchanges of those units for shares of our Class A common stock, and the amounts we may pay could be significant.
Our current and former employee owners indirectly hold a substantial majority of the ownership interests in Manning & Napier Group. Any future purchases or exchanges of their units of Manning & Napier Group for cash or, at our election, shares of our Class A common stock are expected to produce favorable tax attributes for us. When we acquire such units, both the existing basis and the anticipated basis adjustments are likely to increase, for tax purposes, depreciation and amortization deductions allocable to us from Manning & Napier Group and therefore reduce the amount of income tax we would otherwise be required to pay in the future. This increase in tax basis may also decrease gain, or increase loss, on future dispositions of certain capital assets to the extent the increased tax basis is allocated to those capital assets.
We entered into a tax receivable agreement with the other holders of Class A units of Manning & Napier Group, pursuant to which we are required to pay to holders of such Class A units 85% of the applicable cash savings, if any, in U.S. federal, state, local and foreign income tax that we actually realize, or are deemed to realize in certain circumstances, as a result of any step-up in tax basis in Manning & Napier Group’s assets as a result of (i) certain tax attributes of our purchase of such Class A units or exchanges (for shares of Class A common stock) and that are created as a result of the sales or exchanges and payments under the tax receivable agreement and (ii) payments under the tax receivable agreement, including any tax benefits related to imputed interest deemed to be paid by us as a result of such agreement.
We expect that the payments we will be required to make under the tax receivable agreement will be substantial. We have recorded the estimated impacts of the Tax Cuts and Jobs Act on the liability under the tax receivable agreement. Assuming no new material changes in the relevant tax law, the purchase or exchange of Class A units would result in depreciable or amortizable basis and that we earn sufficient taxable income to realize all tax benefits that are subject to the tax receivable agreement, we expect that the reduction in tax payments for us is approximately $20.4 million as of December 31, 2019. Under such scenario, we would be required to pay the holders of such Class A units 85% of such amount, or approximately $17.5 million. The actual amounts may materially differ from these estimated amounts, as potential future reductions in tax payments for us and tax receivable agreement payments by us will be calculated using the market value of our Class A common stock and the prevailing tax rates at the time of purchase or exchange and will be dependent on us generating sufficient future taxable income to realize the benefit. In general, increases in the market value of our shares or in prevailing tax rates will increase the amounts we pay under the tax receivable agreement.
18
The actual increase in tax basis, as well as the amount and timing of any payments under the tax receivable agreement, will vary depending upon a number of factors, including:
• | the timing of exchanges by the holders of units of Manning & Napier Group, the number of units purchased or exchanged, or the price of our Class A common stock, as the case may be, at the time of the purchase or exchange; |
• | the amount and timing of the taxable income we generate in the future and the tax rate then applicable; and |
• | the portion of our payments under the tax receivable agreement constituting imputed interest and whether the purchases or exchanges result in depreciable or amortizable basis. |
There is a possibility that not all of the 85% of the applicable cash savings will be paid to the selling or exchanging holder of Class A units at the time described above. If we determine that all or a portion of such applicable tax savings is in doubt, we will pay to the holders of such Class A units the amount attributable to the portion of the applicable tax savings that we determine is not in doubt and pay the remainder at such time as we determine the actual tax savings or that the amount is no longer in doubt.
Payments under the tax receivable agreement, if any, will be made pro rata among all tax receivable agreement holders entitled to payments on an annual basis to the extent we have sufficient taxable income to utilize the increased depreciation and amortization expense. The availability of sufficient taxable income to utilize the increased depreciation and amortization expense will not be determined until such time as the financial results for the year in question are known and tax estimates prepared. To the extent that we are unable to make payments under the tax receivable agreement for any reason, such payments will be deferred and in some instances, will accrue interest until paid.
In certain cases, payments under the tax receivable agreement to holders of Manning & Napier Group units may be accelerated and/or significantly exceed the actual benefits we realize in respect of the tax attributes subject to the tax receivable agreement.
The tax receivable agreement provides that upon certain mergers, asset sales, other forms of business combinations or other changes of control, or if, at any time, we elect an early termination of the tax receivable agreement, our obligations under the tax receivable agreement with respect to all Class A units of Manning & Napier Group, whether or not such units have been purchased or exchanged before or after such transaction, would be based on certain assumptions, including that we would have sufficient taxable income to fully utilize the deductions arising from the increased tax deductions and tax basis and other benefits related to entering into the tax receivable agreement. As a result, (i) we could be required to make payments under the tax receivable agreement that are greater than or less than the specified percentage of the actual benefits we realize in respect of the tax attributes subject to the tax receivable agreement and (ii) if we elect to terminate the tax receivable agreement early, we would be required to make an immediate payment equal to the present value of the anticipated future tax benefits, which payment may be made significantly in advance of the actual realization of such future benefits. In these situations, our obligations under the tax receivable agreement could have a substantial negative impact on our liquidity and could have the effect of delaying, deferring or preventing certain mergers, asset sales, other forms of business combinations or other changes of control. There can be no assurance that we will be able to finance our obligations under the tax receivable agreement. If we were to elect to terminate the tax receivable agreement immediately as of December 31, 2019, we estimate that we would be required to pay up to approximately $22.8 million in the aggregate, which assumes the exchange of 62,034,200 units of Manning & Napier Group held by those other than us under the tax receivable agreement.
If we were deemed an investment company under the 1940 Act as a result of our ownership of Manning & Napier Group, applicable restrictions could make it impractical for us to continue our business as contemplated and could have an adverse effect on our business.
We do not believe that we are an “investment company” under the 1940 Act. Because we, as the sole managing member of Manning & Napier Group, control the management of and operations of Manning & Napier Group, we believe that our interest in Manning & Napier Group is not an “investment security” as such term is used in the 1940 Act. If we were to cease participation in the management of Manning & Napier Group or not be deemed to control Manning & Napier Group, our interest in Manning & Napier Group could be deemed an “investment security” for purposes of the 1940 Act. A person may be an “investment company” if it owns investment securities having a value exceeding 40% of the value of its total assets (exclusive of U.S. government securities and cash items). Our sole asset is our equity investment in Manning & Napier Group. A determination that such investment is an investment security could cause us to be deemed an investment company under the 1940 Act and to become subject to the registration and other requirements of the 1940 Act. We do not believe that we are an investment company under Section 3(b)(1) of the 1940 Act because we are not primarily engaged in a business that causes us to fall within the definition of “investment company.” The 1940 Act and the rules thereunder contain detailed prescriptions for the organization and operations of investment companies. Among other things, the 1940 Act and the rules thereunder limit or prohibit transactions with affiliates, impose limitations on the issuance of debt and equity securities, prohibit the issuance of stock options, and impose certain governance requirements. We and Manning & Napier Group intend to conduct our operations
19
so that we will not be deemed an investment company. However, if we nevertheless were to be deemed an investment company, restrictions imposed by the 1940 Act, including limitations on our capital structure and our ability to transact with affiliates, could make it impractical for us to continue our business as contemplated and could have an adverse effect on our business, financial condition and results of operations.
Risks Related to Our Class A Common Stock
The market price and trading volume of our Class A common stock may be volatile, which could result in rapid and substantial losses for our stockholders.
The market price of our Class A common stock may be highly volatile and could be subject to wide fluctuations. The trading volume of our Class A common stock may fluctuate and cause significant price variations to occur. If the market price of our Class A common stock declines significantly, investors may be unable to sell shares of Class A common stock at or above their purchase price, if at all. The market price of our Class A common stock may fluctuate or decline significantly in the future. Some of the factors that could negatively affect the price of our Class A common stock, or result in fluctuations in the price or trading volume of our Class A common stock, include:
• | actual or anticipated variations in our quarterly operating results; |
• | failure to meet the market’s earnings expectations; |
• | publication of negative research reports about us or the investment management industry, or the failure of securities analysts to cover our Class A common stock; |
• | a limited float and low average daily trading volume, which may result in illiquidity as investors try to buy and sell and thereby exacerbating positive or negative pressure on our stock; |
• | departures of any members of our senior management team or additions or departures of other key personnel; |
• | adverse market reaction to any indebtedness we may incur or securities we may issue in the future; |
• | changes in market valuations of similar companies; |
• | actual or anticipated poor performance in one or more of the portfolios we offer; |
• | changes or proposed changes in laws or regulations, or differing interpretations thereof, affecting our business, or enforcement of these laws and regulations, or announcements relating to these matters; |
• | adverse publicity about the investment management industry generally, or particular scandals, specifically; |
• | litigation and governmental investigations; |
• | consummation by us or our competitors of significant acquisitions, strategic partnerships or divestitures; |
• | actions by stockholders; |
• | exchange of units of Manning & Napier Group for shares of our Class A common stock or the expectation that such conversions or exchanges may occur; and |
• | general market and economic conditions. |
William Manning and our other owners directly and indirectly own interests in M&N Group Holdings and directly own interests in MNCC, and they will have the right to exchange and cause M&N Group Holdings and MNCC to exchange, as applicable, such interests for cash or an aggregate of 62,034,200 shares of our Class A common stock as of December 31, 2019, pursuant to the terms of an exchange agreement; future sales of such shares in the public market, or the perception that such sales may occur, could lower our stock price.
The market price of our Class A common stock could decline as a result of sales of a large number of shares of our Class A common stock available for sale, or the perception that such sales could occur. These sales, or the possibility that these sales may occur, also may make it more difficult for us to raise additional capital by selling equity securities in the future, at a time and price that we deem appropriate.
We have 15,956,526 shares of Class A common stock outstanding as of December 31, 2019. We have entered into an exchange agreement with M&N Group Holding and MNCC, the other direct holders of all of the units of Manning & Napier Group that are not held by the Company and, subject to certain restrictions, are entitled to exchange such units for an aggregate of up to 62,034,200 shares of our Class A common stock as of December 31, 2019, subject to customary adjustments. The holders of any units of Manning & Napier Group will also become parties to the exchange agreement and, pursuant to the terms of the exchange agreement, we may also purchase or exchange such units for shares of our Class A common stock. We are
20
party to a registration rights agreement pursuant to which the shares of Class A common stock issued upon such exchanges are eligible for resale, subject to certain limitations set forth therein.
We cannot predict the size of future issuances of our Class A common stock or the effect, if any, that future issuances and sales of shares of our Class A common stock may have on the market price of our Class A common stock. Sales or distributions of substantial amounts of our Class A common stock, including shares issued in connection with an acquisition, or the perception that such sales or distributions could occur, may cause the market price of our Class A common stock to decline.
Our Class A common stockholders may experience dilution in the future as a result of the issuance of Class A common stock or units of Manning & Napier Group in connection with future acquisitions and/or equity grants under our 2011 Equity Compensation Plan.
We may issue shares of our Class A common stock or units of Manning & Napier Group in connection with future acquisitions or grants under the Manning & Napier 2011 Equity Compensation Plan (the "Equity Plan"). If we grant exchange rights with respect to the issuance of the units of Manning & Napier Group that allow its holder to exchange such units for shares of our Class A common stock, stockholders will incur dilution in the percentage of the issued and outstanding shares of Class A common stock that are owned at such time.
If we fail to comply with our public company financial reporting and other regulatory obligations, including the Continued Listing Criteria of the New York Stock Exchange, our business and stock price could be adversely affected.
We are subject to the Continued Listing Criteria of the New York Stock Exchange (“NYSE”). In order for our Class A common stock to continue trading on the NYSE, we must maintain certain share prices, numbers of stockholders and corporate governance standards, including obtaining the approval of our stockholders prior to issuing shares in excess of 20% of the voting power outstanding before that issuance. If we are unable to meet any of these standards, our Class A common stock may no longer trade on the NYSE, which would adversely impact the trading market for our shares and liquidity for our stockholders and may adversely impact our business. If our Class A common stock does not maintain an average closing price of $1.00 or more over any consecutive 30 trading-day period, the NYSE may delist our Class A common stock for failure to maintain compliance with the NYSE price criteria listing standards. To regain compliance, we may be forced to take corporate actions, such as a reverse stock split,
Specifically, in the event that our stock price falls below the minimum share price, we may fall out of compliance with the NYSE listing standards and to regain compliance we may be forced to take corporate actions, such as a reverse stock split, to regain compliance, which may adversely impact the trading market for our shares and liquidity. Additionally, if the holders of units of Manning & Napier Group exercise their rights under our exchange agreement with M&N Group Holdings and MNCC, we would be required to issue up to 62,034,200 shares of our Class A common stock to those holders if we were unable to pay them in cash. We believe that prior stockholder approval for such a transaction was obtained at the time of our initial public offering. If the NYSE disagrees with our analysis, the NYSE may seek to discontinue trading of our Class A common stock.
As a public company, we are subject to the reporting requirements of the Exchange Act, have implemented specific corporate governance practices and adhere to a variety of reporting requirements under the Sarbanes-Oxley Act of 2002 and the related rules and regulations of the SEC, as well as the rules of the NYSE.
Our management is required to conduct an annual assessment of the effectiveness of our internal controls over financial reporting and include a report on our internal controls in our annual reports on Form 10-K pursuant to Section 404 of the Sarbanes-Oxley Act of 2002. If our management identifies one or more material weaknesses in our internal control over financial reporting, we will be unable to assert that our internal control over financial reporting is effective. If we are unable to assert that our internal control over financial reporting is effective, market perception of our financial condition and the trading price of our stock may be adversely affected and customer perception of our business may suffer.
Our corporate documents and Delaware law contain provisions that could discourage, delay or prevent a change in control of the Company.
Our amended and restated certificate of incorporation and amended and restated bylaws contain provisions that may make the acquisition of our company more difficult. These provisions:
• | authorize the issuance of undesignated preferred stock, the terms of which may be established and the shares of which may be issued without stockholder approval, and which may include super voting, special approval, dividend, or other rights or preferences superior to the rights of the holders of our Class A common stock; |
• | prohibit stockholder action by written consent and instead require all stockholder actions to be taken at a meeting of our stockholders; |
21
• | provide that the board of directors is expressly authorized to make, alter, or repeal our amended and restated bylaws; and |
• | establish advance notice requirements for nominations for elections to our board of directors or for proposing matters that can be acted upon by stockholders at stockholder meetings. |
These anti-takeover provisions and other provisions under Delaware law could discourage, delay or prevent a transaction involving a change in control of our company, even if doing so would benefit the holders of our Class A common stock.
Any issuance of preferred stock could make it difficult for another company to acquire us or could otherwise adversely affect holders of our Class A common stock, which could depress the price of our Class A common stock.
Our board of directors has the authority to issue preferred stock and to determine the preferences, limitations and relative rights of shares of preferred stock and to fix the number of shares constituting any series and the designation of such series, without any further vote or action by our stockholders. Our preferred stock could be issued with voting, liquidation, dividend and other rights superior to the rights of our Class A common stock. The potential issuance of preferred stock may delay or prevent a change in control of us, discouraging bids for our Class A common stock at a premium over the market price, and adversely affect the market price and the voting and other rights of the holders of our Class A common stock.
If securities or industry analysts do not publish research or publish inaccurate or unfavorable research about our business, our stock price and trading volume could decline.
The trading market for our Class A common stock depends in part on the research and reports that securities or industry analysts publish about us or our business. If one or more of the analysts who covers us downgrades our stock or publishes inaccurate or unfavorable research about our business, our stock price would likely decline. If one or more of these analysts ceases coverage of us or fails to publish reports on us regularly, demand for our stock could decrease, which could cause our stock price and trading volume to decline.
Item 1B. Unresolved Staff Comments.
None.
Item 2. Properties.
We conduct our principal operations through leased offices located in Fairport, New York; St. Petersburg, Florida; Dublin, Ohio; Seattle, Washington; and Portsmouth, New Hampshire. We also lease office space in various other locations throughout the United States. We do not own any facilities. Most of our business operations are based in our corporate headquarters in Fairport.
We believe our properties are in good operating condition and adequately serve our current business operations. We also anticipate suitable additional or alternative space will be available at commercially reasonable terms for future expansion and to replace existing facilities at lease terminations to the extent necessary.
Item 3. Legal Proceedings.
As an investment adviser to a variety of investment products, we are subject to routine reviews and inspections by the SEC and FINRA. From time to time we may also be involved in various legal proceedings arising in the ordinary course of our business. We do not believe that the outcome of any of these reviews, inspections or other legal proceedings will have a material impact on our consolidated financial statements; however, litigation is subject to many uncertainties, and the outcome of individual litigated matters is not predictable with assurance.
Item 4. Mine Safety Disclosures.
Not applicable.
22
PART II
Item 5. | Market for Registrant’s Common Equity, Related Stockholder Matters and Issuer Purchases and Equity Securities. |
Market for the Registrant’s Common Equity
Our Class A common stock is traded on the New York Stock Exchange under the symbol “MN”. There are no outstanding shares of our Class B common stock.
Holders
As of March 9, 2020 there were 26 holders of record of our Class A common stock. A substantial number of holders of our Class A common stock are held in “street name” and thereby held of record by depositories, banks, brokers, and other financial institutions.
Dividends
We have historically paid quarterly cash dividends on our Class A common stock. We have funded such dividends and we believe any future dividends would be funded from our portion of distributions made by Manning & Napier Group, from its available cash generated from operations.
We have no material assets other than our ownership of Class A units of Manning & Napier Group and, accordingly, will depend on distributions from Manning & Napier Group to fund any dividends we may pay. As managing member of Manning & Napier Group, we will determine the timing and amount of any distributions to be paid to its members. We intend to cause Manning & Napier Group to distribute cash to its members, including us, in an amount sufficient to cover dividends, if any, declared by us. If we do cause Manning & Napier Group to make such distributions, M&N Group Holdings, MNCC and any other holders of units of Manning & Napier Group will be entitled to receive equivalent distributions on a pari passu basis.
The declaration and payment of all future dividends, if any, will be at the sole discretion of our board of directors. See “Management’s Discussion and Analysis of Financial Condition and Results of Operations—Liquidity and Capital Resources.”
Item 6. Selected Financial Data.
As a smaller reporting company, we are not required to provide this information.
Item 7. Management’s Discussion and Analysis of Financial Condition and Results of Operations.
Overview
Our Business
Manning & Napier, Inc. is an independent investment management firm that provides our clients with a broad range of financial solutions and investment strategies. Founded in 1970 and headquartered in Fairport, New York, we serve a diversified client base of high-net-worth individuals and institutions, including 401(k) plans, pension plans, Taft-Hartley plans, endowments and foundations. Our investment strategies offer equity, fixed income and a range of blended asset portfolios by employing traditional and quantitative approaches.
Market Developments
Global equity performance was strong in 2019, with the major gains driven by an easing of several key risks that had been acting as an overhang on markets. Growth in U.S. equities was particularly strong, although international markets experienced solid gains as well. Within the U.S., small-cap stocks slightly outperformed large-cap stocks, and stylistically, growth again outperformed value, continuing a multi-year trend.
Regarding fixed income, performance was good for the year as falling interest rates provided a boost to bond market returns, although we expect low starting yields to create a challenging long-term environment for fixed income investors. Going forward, elevated valuations and slow economic growth are likely to challenge long-run returns. Given today’s muted market backdrop, we believe an active investment approach may become an increasingly attractive approach to meeting financial goals and objectives.
Business Review
We commenced a strategic review of our business upon the appointment of our new Chief Executive Officer, Marc Mayer, in early 2019. Our review was comprehensive in nature, and resulted in changes to our overall distribution strategy, our suite of investment offerings, and our operational platform. The objective of this review was to improve financial results for shareholders and investment results for clients by more clearly prioritizing our strengths, eliminating distractions and sub-scale offerings, and increasing productivity across the firm through improved technology.
23
We have enhanced our distribution efforts under the direction of our two new sales heads, with Greg Woodard leading the Wealth Management team and Aaron McGreevy leading the Intermediary and Institutional team. During 2019, the Wealth Management team reviewed our strategy to engage both current clients and prospects on our existing suite of advisory service offerings, as well as to add to our existing team of financial consultants and increase our prospecting efforts. This review of our intermediary and institutional distribution strategy resulted in changes to our territory coverage and servicing efforts in order to more effectively service our existing clients with our small team, while concentrating on geographies with the greatest chances for growth.
The review of our investment offerings was focused on eliminating the distraction of sub-scale and underperforming strategies so that the team could continue to focus on generating competitive returns for clients. During 2019, we closed 3 sub-scale or under performing mutual fund offerings and 11 collective investment trusts.
As part of our review of sub-scale product offerings, during 2019, we sold our wholly-owned subsidiary Perspective Partners, LLC (“PPI”), an employee benefits software and service provider to plan sponsors, administrators, and participants to Manning Partners, LLC, an entity owned by William Manning, the Chairman of our Board of Directors. We received $3.1 million of cash proceeds and recorded a $2.9 million gain on the sale.
Our review also included an evaluation of our operational and technology platforms. We concluded our existing processes were overly complicated, in large part due to our legacy, internally-developed technology platform. In December 2019, we announced a new partnership with industry leader InvestCloud. The InvestCloud partnership, in conjunction with other technology enhancements, is a critical step in our digital transformation. We estimate the implementation of our upgraded technology platform will occur during the second half of 2021.
As a result of this strategic review, we incurred approximately $11.1 million of strategic restructuring and transaction costs, excluding the $2.9 million gain on the sale of PPI noted above. These charges consisted of $3.4 million of employee severance costs and $7.7 million of other operating costs, including $6.3 million of charges stemming from the write-off of existing contracts that we will not be utilizing as we move forward with InvestCloud. We will incur additional costs in 2020 relating to implementing the initiatives from this strategic review.
Our Solutions
We derive substantially all of our revenues from investment management fees earned from providing advisory services to separately managed accounts and to mutual funds and collective investment trusts—including those offered by Manning & Napier Advisors, LLC ("MNA"), the Manning & Napier Fund, Inc.(the "Fund"), Exeter Trust Company, and Rainier Investment Management, LLC ("Rainier").
Our separate accounts are primarily distributed through our wealth management sales channel, where our financial consultants form relationships with high-net-worth individuals, endowments, foundations, and retirement plans. To a lesser extent, we also obtain a portion of our separate account distribution via third parties, either through our intermediary sales channel where national brokerage firm representatives or independent financial advisors select our separate account strategies for their clients, or through our platform/sub-advisor relationships, where unaffiliated registered investment advisors approve our strategies for their product platforms. Our separate account strategies are a primary driver of our blended asset portfolios for high-net-worth, middle market institutional clients and financial intermediaries. In contrast, larger institutions and unaffiliated registered investment advisor platforms are a driver of our separate account equity portfolios.
Our mutual funds and collective investment trusts are distributed through financial intermediaries, including brokers, financial advisors, retirement plan advisors and platform relationships. We also distribute our mutual fund and collective investment trusts through our institutional representatives, particularly within the defined contribution, Taft-Hartley, and institutional marketplace. Our mutual fund and collective investment trust strategies are an important driver of our blended asset class and single asset class portfolios.
Our assets under management ("AUM") were $19.5 billion as of December 31, 2019. The composition of our AUM by vehicle and portfolio is set forth in the table below:
December 31, 2019 | |||||||||||||||
AUM - by investment vehicle and portfolio: | Blended Asset | Equity | Fixed Income | Total | |||||||||||
(in millions) | |||||||||||||||
Separately managed accounts | $ | 9,501.3 | $ | 3,226.8 | $ | 916.7 | $ | 13,644.8 | |||||||
Mutual funds and collective investment trusts | 3,972.0 | 1,762.0 | 101.3 | 5,835.3 | |||||||||||
Total | $ | 13,473.3 | $ | 4,988.8 | $ | 1,018.0 | $ | 19,480.1 | |||||||
24
Assets Under Management
During 2019, we changed our distribution strategy following a business review to better capitalize on our strengths. As part of this change, we have adjusted our sales efforts to more distinctly separate the clients to which we deliver holistic solutions, including high-net-worth families, endowments and foundations, and small and mid-sized business, from our Institutional and Intermediary clients, including third party advisors, platforms and consultants, as well as larger institutions and Taft-Hartley clients. The table below reflects the estimated composition of our assets under management as of December 31, 2019, by sales channel and investment portfolio:
December 31, 2019 | ||||||||||||||||
Blended Asset | Equity | Fixed Income | Total | |||||||||||||
(dollars in millions) | ||||||||||||||||
Total AUM | ||||||||||||||||
Wealth Management | $ | 7,139.6 | $ | 1,291.7 | $ | 285.1 | $ | 8,716.4 | ||||||||
Institutional and Intermediary | $ | 6,333.7 | $ | 3,697.1 | $ | 732.9 | $ | 10,763.7 | ||||||||
Total | $ | 13,473.3 | $ | 4,988.8 | $ | 1,018.0 | $ | 19,480.1 | ||||||||
Percentage of AUM | ||||||||||||||||
Wealth Management | 37 | % | 7 | % | 1 | % | 45 | % | ||||||||
Institutional and Intermediary | 33 | % | 18 | % | 4 | % | 55 | % | ||||||||
Total | 70 | % | 25 | % | 5 | % | 100 | % | ||||||||
Percentage of portfolio by channel | ||||||||||||||||
Wealth Management | 53 | % | 26 | % | 28 | % | 45 | % | ||||||||
Institutional and Intermediary | 47 | % | 74 | % | 72 | % | 55 | % | ||||||||
Total | 100 | % | 100 | % | 100 | % | 100 | % | ||||||||
Percentage of channel by portfolio | ||||||||||||||||
Wealth Management | 82 | % | 15 | % | 3 | % | 100 | % | ||||||||
Institutional and Intermediary | 59 | % | 34 | % | 7 | % | 100 | % | ||||||||
Our wealth management channel represented 45% our total AUM as of December 31, 2019. Blended portfolios are the most significant portion of wealth management assets, representing 82% of wealth management AUM. Equity and fixed income portfolios represent 15% and 3% respectively, of wealth management AUM.
Our institutional and intermediary channel represented 55% of our total AUM as of December 31, 2019. Blended portfolios are also the largest portion of institutional and intermediary assets at 59% of AUM, followed by equity and fixed income portfolios at 34% and 7%, respectively.
As of December 31, 2019, blended portfolios account for 70% of our total AUM at $13.5 billion, consistent with blended portfolio AUM at December 31, 2018. Blended portfolio AUM is similar across both distribution channels, with 53% in wealth management and 47% in institutional and intermediary. Equity portfolios account for 25% of our total AUM, at $5.0 billion, a 9% decrease from December 31, 2018, when equity portfolios were at $5.5 billion. Of equity portfolio AUM, 74% is in the institutional and intermediary channel, and 26% is in the wealth management channel. Fixed income portfolios account for 5% of total AUM at $1.0 billion, a 10% decrease from December 31, 2018, when fixed income assets were $1.1 billion. Consistent with equity portfolio AUM, the majority of fixed income assets come through the institutional and intermediary channel at 72% and 28% of fixed income AUM is in the wealth management channel.
Our separate accounts contributed 55% of our total gross client inflows for the year ended December 31, 2019 and represented 70% of our total AUM as of December 31, 2019.
Our separate account business has historically been driven primarily by our wealth management channel, where financial consultants form a relationship with high-net-worth investors, endowments, foundations, and retirement plans. The wealth management sales channel contributed 67% of the total gross client inflows for our separate account business for the year ended December 31, 2019 and represented 56% of our total separate account AUM as of December 31, 2019. We anticipate this channel to continue to be the largest driver of new separate account business going forward, given their high-net-worth and advisory client-type focus.
25
During the year ended December 31, 2019, blended asset portfolios represented 51% of the separate account gross client inflows from the wealth management sales channel, while equity and fixed income portfolios represented 45% and 4%, respectively. As of December 31, 2019, blended asset and equity portfolios represented 81% and 15%, respectively, of total wealth management separate account AUM, while our fixed income portfolios were 4%. We expect our focus on individuals, endowments, foundations, and retirement plans to continue to drive interest in our separately managed account investment strategies.
We also obtain separate account business from third parties, including financial advisors or unaffiliated registered investment advisor programs or platforms. During the year ended December 31, 2019, 33% of the total gross client inflows for separate accounts came from financial advisor representatives and registered investment advisor platforms. The institutional and intermediary sales channel collectively represented 44% of our separate account AUM as of December 31, 2019.
New separate account business through the institutional and intermediary sales channel flowed into both our blended asset and equity portfolios. During the year ended December 31, 2019, blended asset, equity, and fixed income portfolios represented 45%, 45%, and 10%, respectively, of the separate account gross client inflows from the institutional and intermediary sales channel. As of December 31, 2019, 59% of our total AUM derived from institutions and intermediaries was allocated to blended asset portfolios, with 34% allocated to equity and 7% allocated to fixed income. We expect that equity and fixed income portfolios may see additional interest from intermediaries over time as more advisors structure a multi-strategy portfolio for their clients.
Our annualized separate account retention rate across all channels was 83% during the year ended December 31, 2019, a small decrease from our historical retention rate, which was 86% for the year ended December 31, 2018.
Our mutual funds and collective investment trusts contributed 45% of our total gross client inflows for the year ended December 31, 2019 and represented 30% of our total AUM as of December 31, 2019. As of December 31, 2019, our mutual fund and collective investment trust AUM consisted of 68% from blended asset portfolios, 30% from equity portfolios and 2% from fixed income portfolios, compared to 70%, 28% and 2% for blended asset, equity and fixed income portfolios, respectively, as of December 31, 2018. During the year ended December 31, 2019, 59%, 36% and 5% of mutual fund and collective gross client inflows were attributable to blended assets, equity and fixed income portfolios, respectively.
Our mutual fund and collective investment trust business is driven by both financial intermediaries, as well as through our wealth management channel. Through our intermediary channel, we are focused on promoting our single-asset class and specialized strategies to our wealth and retirement plan advisors, who wish to use our strategies as a component of a larger portfolio. Additionally, our blended asset portfolios are used by advisors seeking a multi-asset class solution for their retail clients.
We also have relationships with consultants and manager research teams at platforms in order to distribute our funds within advisory programs, or through placement on platforms' approved lists of funds. To facilitate our relationships with intermediaries, we currently have approximately 245 dealer relationships. These relationships are important to our retail business as well as our 401(k) life cycle and institutional business.
Through the institutional and intermediary channel, our representatives promote our portfolios to large institutional clients with which we have direct relationships, as well as consultants. Additionally, we have relationships with middle-market and large market defined contribution plan sponsors seeking to use our life cycle mutual funds and collective investment trusts as default options on their investment menu. In the wealth management channel, we may see additional interest in our mutual funds and collective investment trust strategies through both blended and single-asset class portfolios based on the needs of the clients.
Results of Operations
Below is a discussion of our consolidated results of operations for the years ended December 31, 2019 and 2018.
Components of Results of Operations
Overview
Our operating results are heavily influenced by the absolute returns generated by global financial markets. In addition, an important distinguishing factor is the relative performance of our various investment strategies. All of our investment processes are based on the fundamental belief that active management is the best investment approach for helping clients meet long-term goals and objectives. As an active manager, we regularly maintain a high active share across many of our key strategies, and at times, these strategies experience performance that meaningfully deviates from market benchmarks. When performance is strong, this can cause us to experience sizeable inflows in AUM, and when performance is weak, we can experience outflows in AUM.
In addition, other components impacting our operating results include:
26
• | asset-based fee rates and changes in those rates; |
• | the composition of our AUM among various portfolios, vehicles and client types; |
• | changes in our variable costs, including incentive compensation and distribution, servicing and custody expenses, which are affected by our investment performance, level of our AUM and revenue; and |
• | fixed costs, including changes to base compensation, vendor-related costs and investment spending on new products. |
Assets Under Management and Investment Performance
The following tables reflect the indicated components of our AUM for our investment vehicles for the years ended December 31, 2019 and 2018:
Separately managed accounts | Mutual funds and collective investment trusts | Total | Separately managed accounts | Mutual funds and collective investment trusts | Total | ||||||||||||
(in millions) | |||||||||||||||||
As of December 31, 2018 | $ | 13,792.1 | $ | 6,371.5 | $ | 20,163.6 | 68% | 32% | 100% | ||||||||
Gross client inflows (1) | 1,494.0 | 1,235.1 | 2,729.1 | ||||||||||||||
Gross client outflows (1) | (4,244.5 | ) | (2,968.2 | ) | (7,212.7 | ) | |||||||||||
Acquired/(disposed) assets | — | — | — | ||||||||||||||
Market appreciation/(depreciation) & other (2) | 2,603.2 | 1,196.9 | 3,800.1 | ||||||||||||||
As of December 31, 2019 | $ | 13,644.8 | $ | 5,835.3 | $ | 19,480.1 | 70% | 30% | 100% | ||||||||
Average AUM for the period | $ | 14,276.1 | $ | 6,201.1 | $ | 20,477.2 | |||||||||||
As of December 31, 2017 | $ | 16,856.6 | $ | 8,256.6 | $ | 25,113.2 | 67% | 33% | 100% | ||||||||
Gross client inflows (1) | 1,637.0 | 1,965.2 | 3,602.2 | ||||||||||||||
Gross client outflows (1) | (4,078.1 | ) | (3,093.4 | ) | (7,171.5 | ) | |||||||||||
Acquired/(disposed) assets | — | (251.6 | ) | (251.6 | ) | ||||||||||||
Market appreciation/(depreciation) & other (2) | (623.4 | ) | (505.3 | ) | (1,128.7 | ) | |||||||||||
As of December 31, 2018 | $ | 13,792.1 | $ | 6,371.5 | $ | 20,163.6 | 68% | 32% | 100% | ||||||||
Average AUM for the period | $ | 15,596.5 | $ | 7,333.3 | $ | 22,929.8 | |||||||||||
________________________
(1) | Transfers of client assets between portfolios are included in gross client inflows and gross client outflows. |
(2) | Market appreciation/(depreciation) and other includes investment gains/(losses) on assets under management, the impact of changes in foreign exchange rates and net flows from non-sales related activities including net reinvested dividends. |
27
The following tables reflect the indicated components of our AUM for our portfolios for the years ended December 31, 2019 and 2018:
Blended Asset | Equity | Fixed Income | Total | Blended Asset | Equity | Fixed Income | Total | ||||||||||||||||||||
(in millions) | |||||||||||||||||||||||||||
As of December 31, 2018 | $ | 13,532.2 | — | $ | 5,501.9 | — | $ | 1,129.5 | — | $ | 20,163.6 | 67% | 27% | 6% | 100% | ||||||||||||
Gross client inflows (1) | 1,431.4 | 1,105.0 | 192.7 | 2,729.1 | |||||||||||||||||||||||
Gross client outflows (1) | (3,754.4 | ) | (3,071.1 | ) | (387.2 | ) | (7,212.7 | ) | |||||||||||||||||||
Acquired assets/(disposed) assets | — | — | — | — | |||||||||||||||||||||||
Market appreciation/(depreciation) & other (2) | 2,264.1 | 1,453.0 | 83.0 | 3,800.1 | |||||||||||||||||||||||
As of December 31, 2019 | $ | 13,473.3 | $ | 4,988.8 | $ | 1,018.0 | $ | 19,480.1 | 69% | 26% | 5% | 100% | |||||||||||||||
Average AUM for period | $ | 13,577.5 | $ | 5,816.3 | $ | 1,083.4 | $ | 20,477.2 | |||||||||||||||||||
As of December 31, 2017 | $ | 15,666.6 | $ | 8,120.6 | $ | 1,326.0 | $ | 25,113.2 | 69% | 26% | 5% | 100% | |||||||||||||||
Gross client inflows (1) | 1,943.9 | 1,477.4 | 180.9 | 3,602.2 | |||||||||||||||||||||||
Gross client outflows (1) | (3,638.4 | ) | (3,134.4 | ) | (398.7 | ) | (7,171.5 | ) | |||||||||||||||||||
Acquired assets/(disposed) assets | — | (251.6 | ) | — | (251.6 | ) | |||||||||||||||||||||
Market appreciation/(depreciation) & other (2) | (439.9 | ) | (710.1 | ) | 21.3 | (1,128.7 | ) | ||||||||||||||||||||
As of December 31, 2018 | $ | 13,532.2 | $ | 5,501.9 | $ | 1,129.5 | $ | 20,163.6 | 67% | 27 | % | 6% | 100% | ||||||||||||||
Average AUM for period | $ | 14,873.2 | $ | 6,844.4 | $ | 1,212.2 | $ | 22,929.8 | |||||||||||||||||||
________________________
(1) | Transfers of client assets between portfolios are included in gross client inflows and gross client outflows. |
(2) | Market appreciation/(depreciation) and other includes investment gains/(losses) on assets under management, the impact of changes in foreign exchange rates and net flows from non-sales related activities including net reinvested dividends. |
Revenues
Our revenues primarily consist of investment management fees earned from managing our clients’ AUM. We earn our investment management fees as a percentage of our clients’ AUM either as of a specified date or on a daily basis. Our investment management fees can fluctuate based on the average fee rate for our investment management products, which are affected by the composition of our AUM among various portfolios and investment vehicles.
We serve as the investment adviser for the Fund, Exeter Trust Company Collective Investment Trusts and Rainier Multiple Investment Trust. The mutual funds are open-end mutual funds designed to meet the needs of a range of institutional and other investors.The collective investment trusts are for qualified retirement plans, including 401(k) plans. These mutual funds and collective investment trusts comprised $5.8 billion, or 30%, of our AUM as of December 31, 2019. We also serve as the investment advisor to all of our separately managed accounts, managing $13.6 billion, or 70%, of our AUM as of December 31, 2019, including assets managed as a sub-advisor to pooled investment vehicles. For the years ended December 31, 2019 and 2018, our revenue earned from clients located in the United States was 99% and 98%, respectively.
We earn distribution and servicing fees for providing services to our affiliated mutual funds. Revenue is computed and earned daily based on a percentage of AUM.
We earn custodial service fees for administrative and safeguarding services performed by Exeter Trust Company, our New Hampshire-chartered trust company. Fees are calculated as a percentage of the client's market value with additional fees for certain transactions.
During the first quarter of 2019, we completed the effort to restructure fees for many of our mutual fund and collective trust vehicles. The impacts on our overall revenue margins and operating expenses are described below in the discussion of results for the year ended December 31, 2019.
28
Operating Expenses
Our largest operating expenses are employee compensation and related costs, and to a lesser degree, distribution, servicing and custody expenses, discussed further below, with a significant portion of these expenses varying in a direct relationship to our absolute and relative investment management performance, as well as AUM and revenues. We review our operating expenses in relation to the investment market environment and changes in our revenues. However, we are generally willing to make expenditures as necessary, even when faced with declining rates of growth in revenues in order to support our investment products, our client service levels, strategic initiatives and our long-term value.
• | Compensation and related costs. Employee compensation and related costs represent our largest expense, including employee salaries and benefits, incentive compensation to investment and sales professionals, compensation issued under our long-term incentive plan as well as equity compensation. These costs are affected by changes in the employee headcount, the mix of existing job descriptions, competitive factors, the addition of new skill sets and variations in the level of our AUM and revenues. These costs are also impacted by the number of awards granted under our equity plan and the amount of deferred cash awards granted under our long-term incentive plan. Incentive compensation for our research team considers the cumulative impact of both absolute and relative investment performance over historical time periods, with more weight placed on the recent periods. As such, incentive compensation paid to our research team will vary, in part, based on absolute and relative investment performance. |
• | Distribution, servicing and custody expenses. Distribution, servicing and custody expense represent amounts paid to various intermediaries for distribution, shareholder servicing, administrative servicing and custodial services. These expenses generally increase or decrease in line with changes in our mutual fund and collective investment trust AUM or services performed by these intermediaries. During the first quarter of 2019, we completed the effort, begun in 2017, of restructuring fees across our mutual funds. The financial impacts were a reduction in the management fees on existing business, and an offsetting reduction in related distribution, servicing and custody expenses. Given the overall pressure on fees that all active managers are facing, we believe that bringing our fund fees to a more competitive level will enhance our ability to attract additional assets in the future. |
• | Other operating costs. Other operating costs include accounting, legal and other professional service fees, occupancy and facility costs, travel and entertainment expenses, insurance, market data service expenses and all other miscellaneous costs associated with managing the day-to-day operations of our business. |
Non-Operating Income (Loss)
Non-operating income (loss) includes interest expense, interest and dividend income, changes in liability under the tax receivable agreement ("TRA") entered into between Manning & Napier and the other holders of Class A units of Manning & Napier Group, gains (losses) related to investment securities sales and changes in values of those investment securities designated as equity investments, at fair value and gain on sale of business.
We expect the interest and investment components of non-operating income (loss) to fluctuate based on market conditions, the performance of our investments and the overall amount of our investments held by the Company to provide initial cash seeding for product development purposes and short-term investment for cash management opportunities.
Provision for Income Taxes
The Company is comprised of entities that have elected to be treated as either a limited liability company ("LLC") or a “C-Corporation.” As such, the entities functioning as LLC’s are not liable for or able to benefit from U.S. federal or most state and local income taxes on their earnings, and their earnings (losses) will be included in the personal income tax returns of each entity’s unit holders. The entities functioning as C-Corporations are liable for or able to benefit from U.S. federal and state and local income taxes on their earnings and losses, respectively.
Noncontrolling Interests
Manning & Napier, Inc. holds an economic interest of approximately 19.2% in Manning & Napier Group as of December 31, 2019, but as managing member controls all of the business and affairs of Manning & Napier Group. As a result, the Company consolidates the financial results of Manning & Napier Group and records a noncontrolling interest in our consolidated financial statements. Net income attributable to noncontrolling interests on the consolidated statements of operations represents the portion of earnings attributable to the economic interest in Manning & Napier Group held by the noncontrolling interests.
Accounting Policies and Estimates
The consolidated financial statements are prepared in accordance with generally accepted accounting principles in the United States ("GAAP") and the related rules and regulations of the U.S. Securities and Exchange Commission (the "SEC"). The preparation of consolidated financial statements in conformity with GAAP requires management to make estimates or
29
assumptions that affect the reported amounts of assets and liabilities at the date of the financial statements and the reported amounts of revenues and expenses during the periods presented. Accordingly, actual results could differ from these estimates or assumptions and may have a material effect on the consolidated financial statements.
Accounting policies are an integral part of our financial statements. A thorough understanding of these accounting policies is essential when reviewing our reported results of operations and our financial condition. Our management has identified the following significant accounting policies that are critical to understanding our business and prospects for future performance, as these policies affect the reported amounts of revenue and other significant areas that involve management’s judgment and estimates.
These policies and our procedures related to these policies are described in detail below. Please also refer to the notes to our consolidated financial statements included elsewhere in this report for further discussion of our accounting policies.
Revenue Recognition
Investment Management: Investment management fees are computed as a percentage of AUM. Our performance obligation is a series of services that form part of a single performance obligation satisfied over time.
Separately managed accounts are paid in advance, typically for a semi-annual or quarterly period, or in arrears, typically for a monthly or quarterly period. When investment management fees are paid in advance, we defer the revenue as a contract liability and recognize it over the applicable period. When investment management fees are paid in arrears, we estimate revenue and record a contract asset (accrued accounts receivable) based on AUM as of the most recent month end date.
Mutual funds and collective investment trust investment management revenue is calculated and earned daily based on AUM. Revenue is presented net of cash rebates and fees waived pursuant to contractual expense limitations of the funds. We also have agreements with third parties who provide recordkeeping and administrative services for employee benefit plans participating in the collective investment trusts. We are acting as an agent on behalf of the employee benefit plan sponsors, therefore, investment management revenue is recorded net of fees paid to third party service providers.
Distribution and shareholder servicing: We receive distribution and servicing fees for providing services to our affiliated mutual funds. Revenue is computed and earned daily based on a percentage of AUM. The performance obligation is a series of services that form part of a single performance obligation satisfied over time. We have agreements with third parties who provide distribution and administrative services for our mutual funds. The agreements are evaluated to determine whether revenue should be reported gross or net of payments to third-party service providers. We control the services provided and act as a principal in the relationship. Therefore, distribution and shareholder servicing revenue is recorded gross of fees paid to third parties.
Custodial services: Custodial service fees are calculated as a percentage of the client’s market value with additional fees charged for certain transactions. For the safeguarding and administrative services that are subject to a percentage of market value fee, our performance obligation is a series of services that form part of a single performance obligation satisfied over time. Revenue for transactions assigned a stand-alone selling price is recognized in the period which the transaction is executed. Custodial service fees are billed monthly in arrears. We have agreements with third parties who provide safeguarding, record keeping and administrative services for their clients. We control the services provided and act as a principal in the relationship. Therefore, custodial service revenue is recorded gross of fees paid to third parties.
Because the majority of our revenues are earned based on AUM that has been determined using fair value methods and since market appreciation/depreciation has a significant impact on our revenue, we have presented our AUM using the GAAP framework for measuring fair value. A fair value hierarchy is provided that gives the highest priority to unadjusted quoted prices in active markets for identical assets or liabilities (Level 1) and the lowest priority to unobservable inputs (Level 3). The following three-tier fair value hierarchy prioritizes the inputs used in measuring fair value:
• | Level 1—observable inputs such as quoted prices in active markets for identical securities; |
• | Level 2—other significant observable inputs (including but not limited to quoted prices for similar securities, interest rates, prepayment rates, credit risk, etc.); and |
• | Level 3—significant unobservable inputs (including our own assumptions in determining the fair value of investments). |
30
The table below summarizes the approximate amount of AUM for the periods indicated for which fair value is measured based on Level 1, Level 2 and Level 3:
Level 1 | Level 2 | Level 3 | Total | ||||||||||||
(in millions) | |||||||||||||||
December 31, 2019 AUM | $ | 11,147 | $ | 8,333 | $ | — | $ | 19,480 | |||||||
December 31, 2018 AUM | $ | 9,153 | $ | 11,011 | $ | — | $ | 20,164 | |||||||
Substantially all our AUM is valued by independent pricing services based upon observable market prices or inputs, and we believe market risk is the most significant risk underlying valuation of our AUM, as discussed in this Form 10-K under “Item 1A. Risk Factors”.
All other revenue earned by us is recognized on a GAAP accounting basis as earned per the terms of the specific contract.
Consolidation
We assess each legal entity in which we hold a variable interest to determine whether consolidation is appropriate at the onset of the relationship and upon certain reconsideration events. We determine whether we have a controlling financial interest in the entity by evaluating whether the entity is a voting interest entity ("VOE") or a variable interest entity ("VIE") under GAAP. Assessing whether an entity is a VOE or VIE and if it requires consolidation involves judgment and analysis. Factors considered in this assessment include an entity’s purpose and design, a company’s ability to direct the activities of the entity that most significantly impact the entity’s economic performance, and whether a company is obligated to absorb losses or receive benefits that could potentially be significant to the entity. The standard also requires ongoing assessments of whether a company is the primary beneficiary of a VIE. When utilizing the VOE model, controlling financial interest is generally defined as majority ownership of voting interests.
We serve as the investment adviser for the Fund, Exeter Trust Company Collective Investment Trusts (“CIT”) and Rainier Multiple Investment Trust, which are legal entities, the business and affairs of which are managed by their respective boards of directors. As a result, each of these entities is a VOE. We hold, in limited cases, direct investments in a fund (which are made on the same terms as are available to other investors) and consolidate each of these entities where it has a controlling financial interest or a majority voting interest.
We make initial seed investments in sponsored investment portfolios to develop new products and services for our clients. The original seed investment may be held in a separately managed account, comprised solely of our investments, or within a mutual fund, where our investment may represent all or only a portion of the total equity invested in the mutual fund. We evaluate our seed investments on a regular basis and consolidate such mutual funds for which we hold a controlling financial interest. When we no longer hold a financial controlling interest, we deconsolidate the fund and classify the remaining investment as either an equity method investment or as equity investments, at fair value, as applicable.
As of December 31, 2019, Manning & Napier holds an economic interest of approximately 19.2% in Manning & Napier Group, but as managing member controls all of the business and affairs of Manning & Napier Group. As a result, we consolidate the financial results of Manning & Napier Group and record a noncontrolling interest on our consolidated statements of financial condition with respect to the remaining economic interest in Manning & Napier Group held by M&N Group Holdings and MNCC.
Goodwill
Goodwill represents the excess of the cost of our investment in net assets of acquired companies over the fair value of the underlying identifiable net assets at the dates of acquisition. We attribute all goodwill associated with past acquisitions to our single reporting unit. Goodwill is tested for impairment by comparing the fair value of the reporting unit associated with the goodwill to the reporting unit's recorded value. If the fair value of the reporting unit is less than its recorded value an impairment loss will be recorded.
The annual test of goodwill indicated that there were no facts or circumstances occurring in 2019 suggesting possible impairment. The impairment tests included certain underlying key assumptions regarding future overall market trends and our operating performance. If actual future market results and our operating performance vary unfavorably to those included in our financial forecast, we may be subject to impairment charges related to its goodwill.
Income Tax Provision
Management judgment is required in developing our provision for income taxes, including the determination of deferred tax assets and liabilities and any valuation allowance that might be required against deferred tax assets. As of December 31, 2019, we have not recorded a valuation allowance on deferred tax assets. In the event that sufficient taxable income does not result in future years, among other things, a valuation allowance for certain of our deferred tax assets may be required. Because
31
the determination of our annual income tax provision is subject to judgments and estimates, it is likely that the actual results will vary from those recorded in our financial statements. Hence, we recognize additions to and reductions in income tax expense during a reporting period that pertains to prior period provisions as our estimated liabilities are revised and our actual tax returns and tax audits are completed.
We recognize tax benefits from uncertain tax positions only if it is more likely than not that the tax position will be sustained upon examination by the taxing authorities, based on the technical merits of the position. The tax benefits recognized in the financial statements from such positions are then measured based on the largest benefit that has a greater than 50% likelihood of being realized.
Payments Pursuant to the Tax Receivable Agreement
As a result of Manning & Napier's purchase of Class A units of Manning & Napier Group or exchange for Class A common stock of Manning & Napier for Class A units of Manning & Napier Group and Manning & Napier Group's election under Section 754 of the Internal Revenue Code, we expect to benefit from depreciation and amortization deductions from an increase in tax basis of tangible and intangible assets of Manning & Napier Group. Those deductions allocated to us will be taken into account in reporting our taxable income.
In connection with our initial public offering ("IPO"), the TRA was entered into between Manning & Napier and the holders of Manning & Napier Group, pursuant to which Manning & Napier is required to pay to such holders 85% of the applicable cash savings, if any, in U.S. federal, state, local and foreign income tax that Manning & Napier actually realizes, or is deemed to realize in certain circumstances, as a result of (i) certain tax attributes of their units sold to Manning & Napier or exchanged (for shares of Class A common stock) and that are created as a result of the sales or exchanges and payments under the TRA and (ii) tax benefits related to imputed interest.
At December 31, 2019, we have recorded a total liability of $17.5 million, representing the payments due to the selling unit holders under the TRA. Payments are anticipated to be made annually commencing from the date of each event that gives rise to the TRA benefits. The actual amount and timing of any payments may vary from this estimate due to a number of factors, including a material change in the relevant tax law or our failure to earn sufficient taxable income to realize all estimated tax benefits. The expected payment obligation assumes no additional uncertain tax positions that would impact the TRAs.
Recent Accounting Pronouncements
See Note 2 to the Consolidated Financial Statements, "Summary of Significant Accounting Policies - Recent accounting pronouncements," included in Item 8 of Part II of this Form 10-K.
32
Year Ended December 31, 2019 Compared to Year Ended December 31, 2018
Assets Under Management
The following table reflects changes in our AUM for the years ended December 31, 2019 and 2018:
Year Ended December 31, | Period-to-Period | |||||||||||||
2019 | 2018 | $ | % | |||||||||||
(in millions) | ||||||||||||||
Separately managed accounts | ||||||||||||||
Beginning assets under management | $ | 13,792.1 | $ | 16,856.6 | $ | (3,064.5 | ) | (18 | )% | |||||
Gross client inflows (1) | 1,494.0 | 1,637.0 | (143.0 | ) | (9 | )% | ||||||||
Gross client outflows (1) | (4,244.5 | ) | (4,078.1 | ) | (166.4 | ) | (4 | )% | ||||||
Acquired/(disposed) assets | — | — | — | — | % | |||||||||
Market appreciation/(depreciation) & other (2) | 2,603.2 | (623.4 | ) | 3,226.6 | 518 | % | ||||||||
Ending assets under management | $ | 13,644.8 | $ | 13,792.1 | $ | (147.3 | ) | (1 | )% | |||||
Average AUM for period | $ | 14,276.1 | $ | 15,596.5 | $ | (1,320.4 | ) | (8 | )% | |||||
Mutual funds and collective investment trusts | ||||||||||||||
Beginning assets under management | $ | 6,371.5 | $ | 8,256.6 | $ | (1,885.1 | ) | (23 | )% | |||||
Gross client inflows (1) | 1,235.1 | 1,965.2 | (730.1 | ) | (37 | )% | ||||||||
Gross client outflows (1) | (2,968.2 | ) | (3,093.4 | ) | 125.2 | 4 | % | |||||||
Acquired/(disposed) assets | — | (251.6 | ) | 251.6 | 100 | % | ||||||||
Market appreciation/(depreciation) & other (2) | 1,196.9 | (505.3 | ) | 1,702.2 | 337 | % | ||||||||
Ending assets under management | $ | 5,835.3 | $ | 6,371.5 | $ | (536.2 | ) | (8 | )% | |||||
Average AUM for period | $ | 6,201.1 | $ | 7,333.3 | $ | (1,132.2 | ) | (15 | )% | |||||
Total assets under management | ||||||||||||||
Beginning assets under management | $ | 20,163.6 | $ | 25,113.2 | $ | (4,949.6 | ) | (20 | )% | |||||
Gross client inflows (1) | 2,729.1 | 3,602.2 | (873.1 | ) | (24 | )% | ||||||||
Gross client outflows (1) | (7,212.7 | ) | (7,171.5 | ) | (41.2 | ) | (1 | )% | ||||||
Acquired/(disposed) assets | — | (251.6 | ) | 251.6 | 100 | % | ||||||||
Market appreciation/(depreciation) & other (2) | 3,800.1 | (1,128.7 | ) | 4,928.8 | 437 | % | ||||||||
Ending assets under management | $ | 19,480.1 | $ | 20,163.6 | $ | (683.5 | ) | (3 | )% | |||||
Average AUM for period | $ | 20,477.2 | $ | 22,929.8 | $ | (2,452.6 | ) | (11 | )% | |||||
________________________
(1) | Transfers of client assets between portfolios are included in gross client inflows and gross client outflows. |
(2) | Market appreciation/(depreciation) and other includes investment gains/(losses) on AUM, the impact of changes in foreign exchange rates and net flows from non-sales related activities including net reinvested dividends. |
The total AUM decrease of $0.7 billion, or 3%, to $19.5 billion at December 31, 2019 from $20.2 billion at December 31, 2018 was attributable to net client outflows of $4.5 billion, partially offset by $3.8 billion of market appreciation and other changes. Net client outflows consisted of approximately $2.8 billion of net outflows from separate accounts and $1.7 billion from mutual funds and collective investment trusts. By portfolio, the rates of change in AUM from December 31, 2018 to December 31, 2019 consisted of a $0.5 billion, or 9.3% decrease in our equity portfolio, and a $0.1 billion, or 0.4% decrease in our blended asset portfolio.
While many of our key strategies achieved competitive relative returns in 2019, we attribute our 2019 net cash outflows to challenging three and five year annualized returns in many of the strategies included in our blended asset portfolios. We believe that our ability to improve cash flows going forward will depend on our ability to sustain the improved investment performance we achieved over the past year and execute on our strategic initiatives focused on gathering and retaining client assets.
33
The composition of our AUM was 70% in separate accounts and 30% in mutual funds and collective investment trusts as of December 31, 2019, a shift from 68% in separate accounts and 32% in mutual funds and collective investment trusts at December 31, 2018. The composition of our AUM across portfolios at December 31, 2019 was 69% in blended assets, 26% in equity, and 5% in fixed income, compared to 67% in blended assets, 27% in equity, and 6% in fixed income at December 31, 2018.
With regard to our separate accounts, gross client inflows of $1.5 billion were offset by approximately $4.2 billion of gross client outflows during the year ended December 31, 2019. The $1.5 billion of gross client inflows included $0.7 billion into our blended asset portfolios, $0.7 billion into our equity portfolios and $0.1 billion into fixed income. During the year ended December 31, 2019, 67% of our separate account gross client inflows were derived from our wealth management channel with 58% representing contributions from existing wealth management relationships. Across both channels, gross client outflows were split with 43% withdrawals from existing accounts and 57% representing client cancellations. Included within the $4.2 billion of client outflows during the year ended December 31, 2019 was a cancellation of a Sub-Advisory relationship during the fourth quarter of 2019 of approximately $1.0 billion. Our blended asset and equity portfolios experienced net client outflows of approximately $1.8 billion and $2.1 billion, respectively. Our separate account clients redeemed assets at a rate of 31% during the year ended December 31, 2019, compared to a 24% for the year ended December 31, 2018. The annualized separate account retention rate was 83% for the year ended December 31, 2019 a slight decrease from 86% for the year ended December 31, 2018.
Net client outflows of $1.7 billion from our mutual fund and collective investment trusts included gross client inflows of $1.2 billion offset by gross client outflows of $3.0 billion during the year ended December 31, 2019. Gross client inflows into our blended asset life cycle vehicles, including both risk based and target date strategies, represented $0.7 billion, or 59%, of mutual fund and collective trust fund gross client inflows during the year ended December 31, 2019. Gross client outflows were predominantly driven by cancellations and withdrawals from defined contribution and institutional relationships. With regard to gross client outflows, $1.9 billion, or 65%, of mutual fund and collective investment trust gross client outflows were from blended asset mutual fund and collective trust products.
34
The following table sets forth our results of operations and other data for the years ended December 31, 2019 and 2018:
Year Ended December 31, | Period-to-Period | |||||||||||||
2019 | 2018 | $ | % | |||||||||||
(in thousands, except share data) | ||||||||||||||
Revenues | ||||||||||||||
Management Fees | ||||||||||||||
Separately managed accounts | $ | 86,289 | $ | 97,123 | $ | (10,834 | ) | (11 | )% | |||||
Mutual funds and collective investment trusts | 29,344 | 41,462 | (12,118 | ) | (29 | )% | ||||||||
Distribution and shareholder servicing | 10,227 | 12,089 | (1,862 | ) | (15 | )% | ||||||||
Custodial services | 6,864 | 7,591 | (727 | ) | (10 | )% | ||||||||
Other revenue | 3,277 | 3,066 | 211 | 7 | % | |||||||||
Total revenue | 136,001 | 161,331 | (25,330 | ) | (16 | )% | ||||||||
Expenses | ||||||||||||||
Compensation and related costs | 80,967 | 87,408 | (6,441 | ) | (7 | )% | ||||||||
Distribution, servicing and custody expenses | 12,568 | 18,175 | (5,607 | ) | (31 | )% | ||||||||
Other operating costs | 39,758 | 32,366 | 7,392 | 23 | % | |||||||||
Total operating expenses | 133,293 | 137,949 | (4,656 | ) | (3 | )% | ||||||||
Operating income | 2,708 | 23,382 | (20,674 | ) | (88 | )% | ||||||||
Non-operating income (loss) | ||||||||||||||
Non-operating income (loss), net | 7,597 | 2,250 | 5,347 | 238 | % | |||||||||
Income before provision for income taxes | 10,305 | 25,632 | (15,327 | ) | (60 | )% | ||||||||
Provision for income taxes | 448 | 2,647 | (2,199 | ) | (83 | )% | ||||||||
Net income attributable to controlling and noncontrolling interests | 9,857 | 22,985 | (13,128 | ) | (57 | )% | ||||||||
Less: net income attributable to noncontrolling interests | 8,424 | 19,788 | (11,364 | ) | (57 | )% | ||||||||
Net income attributable to Manning & Napier, Inc. | $ | 1,433 | $ | 3,197 | $ | (1,764 | ) | (55 | )% | |||||
Per Share Data | ||||||||||||||
Net income per share available to Class A common stock | ||||||||||||||
Basic | $ | 0.10 | $ | 0.21 | ||||||||||
Diluted | $ | 0.09 | $ | 0.21 | ||||||||||
Weighted average shares of Class A common stock outstanding | ||||||||||||||
Basic | 15,216,707 | 14,623,198 | ||||||||||||
Diluted | 77,973,919 | 14,630,170 | ||||||||||||
Cash dividends declared per share of Class A common stock | $ | 0.08 | $ | 0.26 | ||||||||||
Other financial and operating data | ||||||||||||||
Economic income (1) | $ | 18,529 | $ | 25,632 | $ | (7,103 | ) | (28 | )% | |||||
Economic net income (1) | $ | 13,156 | $ | 17,430 | $ | (4,274 | ) | (25 | )% | |||||
Economic net income per adjusted share (1) | $ | 0.17 | $ | 0.22 | ||||||||||
Weighted average adjusted Class A common stock outstanding (1) | 79,392,456 | 78,916,638 | ||||||||||||
________________________
(1) | See “Management’s Discussion and Analysis of Financial Condition and Results of Operations – Supplemental Non-GAAP Financial Information” for Manning & Napier’s reasons for including these non-GAAP measures in this report and for a reconciliation of non-GAAP financial measures to GAAP measures for the periods indicated. |
35
Revenues
Separately managed account revenue decreased by $10.8 million, or 11%, to $86.3 million for the year ended December 31, 2019 from $97.1 million for the year ended December 31, 2018. This decrease is driven primarily by an 8%, or $1.3 billion decrease in our average separately managed account AUM for the year ended December 31, 2019 compared to the year ended December 31, 2018. On an annualized basis, our average separately managed account fee for the year ended December 31, 2019 remained consistent at 0.60% when compared to the full year 2018. For both periods our separately managed account standard fees ranged from 0.15% to 1.25% depending upon investment objective and account size. As of December 31, 2019, the concentration of investments in our separately managed account assets was 70% blended assets, 24% equity and 6% fixed income, compared to 65% blended assets, 27% equity and 8% fixed income as of December 31, 2018.
Mutual fund and collective investment trust revenue decreased by $12.1 million, or 29%, to $29.3 million for the year ended December 31, 2019 from $41.5 million for the year ended December 31, 2018. This decrease was driven primarily by a 15%, or $1.1 billion, decrease in our average mutual fund and collective investment trust AUM for the year ended December 31, 2019 compared to the year ended December 31, 2018, coupled with the effects of the mutual fund fee restructure completed in the first quarter of 2019. On an annualized basis, our average fee on mutual fund and collective investment trust products decreased to 0.64% for the year ended December 31, 2019 from 0.73% for the full year 2018. This decrease was due primarily to the restructuring of our funds during 2019. For both periods, management fees earned on our mutual fund and collective investment trust management fees ranged from 0.14% to 0.90%, depending on investment strategy. As of December 31, 2019, the concentration of investments in our mutual fund and collective investment trusts was 68% blended assets, 30% equity and 2% fixed income, compared to 70% blended assets, 28% equity and 2% fixed income as of December 31, 2018.
Distribution and shareholder servicing revenue decreased by $1.9 million, or 15%, to $10.2 million for the year ended December 31, 2019 from $12.1 million for the year ended December 31, 2018. This decrease was driven primarily by the reduction in mutual fund and collective trust average AUM of 15% for the same period.
Custodial services revenue decreased by $0.7 million, or 10%, to $6.9 million for the year ended December 31, 2019 from $7.6 million for the year ended December 31, 2018. The decrease primarily relates to decreases in our collective investment trust AUM.
Operating Expenses
Our operating expenses decreased by $4.7 million, or 3%, to $133.3 million for the year ended December 31, 2019 from $137.9 million for the year ended December 31, 2018.
Compensation and related costs decreased by $6.4 million, or 7%, to $81.0 million for the year ended December 31, 2019 from $87.4 million for the year ended December 31, 2018. The decrease was driven by a 16% reduction in our average workforce and lower variable incentive costs as a result of the reduction in AUM and revenue. This decrease was partially offset by an increase of $2.4 million in 2019 from 2018 attributable to the timing and amount of awards granted under our equity and long-term incentive plans. Employee severance costs decreased by $0.7 million to $3.0 million for the year ended December 31, 2019 from $3.7 million for the year ended December 31, 2018. As a percentage of revenue, compensation and related costs for 2019 were 60%, compared to 54% in 2018.
Distribution, servicing and custody expenses decreased by $5.6 million, or 31%, to $12.6 million for the year ended December 31, 2019 from $18.2 million for the year ended December 31, 2018. The decrease in expense was driven by a 15% decrease in mutual funds and collective investment trusts average AUM during the year ended December 31, 2019 as well as the completion of the Advisor's mutual fund fee restructure during the first quarter of 2019. As a percentage of mutual fund and collective investment trust average AUM, distribution, servicing and custody expense was 0.20% for the year ended December 31, 2019, compared to 0.25% for the year ended December 31, 2018.
Other operating costs increased by $7.4 million, or 23%, to $39.8 million for the year ended December 31, 2019 from $32.4 million for the year ended December 31, 2018. The increase during the year ended December 31, 2019 was driven primarily by $6.3 million of expenses recognized during the fourth quarter of 2019 related to our technology upgrade initiatives. During the fourth quarter of 2019, we entered into a contract with a new third-party service provider which will replace an existing license agreement for internal-use software. As a result, we recorded charges of approximately $2.1 million for the impairment of existing internal-use software, $1.0 million for the write-off of associated prepaid license costs, and $3.2 million for future cash obligations under the existing license agreement. The increase in other operating costs over 2018 is also driven by the $2.1 million gain reflected during the year ended December 31, 2018 related to the Company's sale of Rainier U.S. mutual funds, which offset other operating costs in the period. As a percentage of revenue, other operating costs for the year ended December 31, 2019 and 2018 were 29% and 20%, respectively.
36
Non-Operating Income (Loss)
Non-operating income for the year ended December 31, 2019 was $7.6 million, an increase of $5.3 million, from non-operating income of $2.3 million for the year ended December 31, 2018. The following table reflects the components of non-operating income (loss) for the years ended December 31, 2019 and 2018:
Year Ended December 31, | Period-to-Period | |||||||||||||
2019 | 2018 | $ | % | |||||||||||
(in thousands) | ||||||||||||||
Non-operating income (loss) | ||||||||||||||
Interest expense | $ | (26 | ) | $ | (49 | ) | $ | 23 | (47 | )% | ||||
Interest and dividend income (1) | 3,262 | 2,408 | 854 | 35 | % | |||||||||
Change in liability under tax receivable agreement (2) | (199 | ) | 1,341 | (1,540 | ) | (115 | )% | |||||||
Net gains (losses) on investments (3) | 1,677 | (1,450 | ) | 3,127 | (216 | )% | ||||||||
Gain on sale of business (4) | 2,883 | — | 2,883 | * | ||||||||||
Total non-operating income (loss) | $ | 7,597 | $ | 2,250 | $ | 5,347 | 238 | % | ||||||
__________________________
(*) | Variance not calculable. |
(1) | The increase in interest and dividend income for the year ended December 31, 2019 compared to 2018 is attributable to an increase in investments, including U.S. Treasury notes and bills, corporate bonds and other short-term investments to optimize cash management opportunities. |
(2) | The change in the liability under the tax receivable agreement for the respective periods is driven by a change in our effective tax rate during the year ended December 31, 2018 and a corresponding increase or decrease in the payment of the expected tax benefit under the tax receivable agreement. |
(3) | The amount of net gain (loss) on investments held by us, to provide initial cash seeding for product development purposes and to hedge economic exposure to market movements on our deferred compensation plan, will vary depending on the performance and overall amount of our investments. |
(4) | The gain on sale of business during the year ended December 31, 2019 is due to the completion of the sale of PPI on August 30, 2019. |
Provision for Income Taxes
The tax provision decreased by $2.2 million, to $0.4 million for the year ended December 31, 2019 from $2.6 million for the year ended December 31, 2018. The change was primarily driven by a decrease in taxable earnings as compared to the prior year.
Supplemental Non-GAAP Financial Information
To provide investors with greater insight into operating results, promote transparency, facilitate comparison of period-to-period results, and to allow a more comprehensive understanding of information used by management in its financial and operational decision-making, we supplement our consolidated statements of operations presented on a GAAP basis with non-GAAP financial measures of earnings.
Beginning with the release of our operating results for the third quarter of 2019, as supplemental information we began providing a new non-GAAP measure, economic income. Management uses economic income, economic net income and economic net income per adjusted share as financial measures to evaluate the profitability and efficiency of our business as a whole in the ordinary, ongoing and customary course of its operations. Economic income, economic net income and economic net income per adjusted share are not presented in accordance with GAAP.
Economic income, for periods beginning in and subsequent to January 1, 2019, presents a financial measure of the controlling and non-controlling interests of Manning & Napier Group and excludes from income before provision for income taxes strategic restructuring and transaction costs, net. We define strategic restructuring and transaction costs, net, as items related to our ongoing strategic review focused on the evolution of our distribution strategy and technology initiatives. These include severance-related costs, certain consulting and other professional service fees, lease and other contract termination costs, and gain or loss on sale of a business.
Economic net income is a non-GAAP measure of after-tax operating performance for the controlling and non-controlling interests of Manning & Napier Group and equals the Company’s income before provision for income taxes less adjusted
37
income taxes. Adjusted income taxes are estimated assuming the exchange of all outstanding units of Manning & Napier Group into Class A common stock on a one-to-one basis. Therefore, all income of Manning & Napier Group allocated to the units of Manning & Napier Group is treated as if it were allocated to Manning & Napier and represents an estimate of income tax expense at an effective rate of 29.0% and 32.0% for the twelve months ended December 31, 2019 and 2018, respectively, reflecting assumed federal, state and local income taxes.
Economic net income per adjusted share is equal to economic net income divided by the total number of adjusted Class A common shares outstanding. The number of adjusted Class A common shares outstanding for all periods presented is determined by assuming the weighted average exchangeable units of Manning & Napier Group, weighted average unvested restricted stock unit, weighted average unvested restricted stock awards and weighted average vested stock options are converted into the Company’s outstanding Class A common stock as of the respective reporting date, on a one-to-one basis. The Company’s management uses economic net income, among other financial data, to determine the earnings available to distribute as dividends to holders of its Class A common stock and to the holders of the units of Manning & Napier Group.
Investors should consider the non-GAAP financial measures in addition to, and not as a substitute for, financial measures prepared in accordance with GAAP. Additionally, our non-GAAP measures may differ from similar measures used by other companies, even if similar terms are used to identify such measures.
The following table sets forth, for the periods indicated, our other financial and operating data:
Year Ended December 31, | |||||||
2019 | 2018 | ||||||
(in thousands, except share data) | |||||||
Economic income (Non-GAAP) | $ | 18,529 | $ | 25,632 | |||
Economic net income (Non-GAAP) | 13,156 | 17,430 | |||||
Economic net income per adjusted share (Non-GAAP) | $ | 0.17 | $ | 0.22 | |||
Weighted average adjusted Class A common stock outstanding (Non-GAAP) | 79,392,456 | 78,916,638 | |||||
The following table sets forth, for the periods indicated, a reconciliation of non-GAAP financial measures to GAAP measures:
Year Ended December 31, | |||||||
2019 | 2018 | ||||||
(in thousands, except share data) | |||||||
Net income attributable to Manning & Napier, Inc. | $ | 1,433 | $ | 3,197 | |||
Add back: Net income attributable to noncontrolling interests | 8,424 | 19,788 | |||||
Add back: Provision for income taxes | 448 | 2,647 | |||||
Income before provision for income taxes | 10,305 | 25,632 | |||||
Add back: strategic restructuring and transaction costs, net (1) | 8,224 | — | |||||
Economic income (Non-GAAP) | 18,529 | 25,632 | |||||
Adjusted income taxes (Non-GAAP) | 5,373 | 8,202 | |||||
Economic net income (Non-GAAP) | $ | 13,156 | $ | 17,430 | |||
Weighted average shares of Class A common stock outstanding - Basic | 15,216,707 | 14,623,198 | |||||
Assumed vesting, conversion or exchange of: | |||||||
Weighted average Manning & Napier Group units outstanding (noncontrolling interest) | 62,470,304 | 63,489,881 | |||||
Weighted average unvested restricted stock units and stock awards | 1,705,445 | 803,559 | |||||
Weighted average vested stock options | — | — | |||||
Weighted average adjusted shares (Non-GAAP) | 79,392,456 | 78,916,638 | |||||
Economic net income per adjusted share (Non-GAAP) | $ | 0.17 | $ | 0.22 | |||
__________________________
38
(1) Strategic restructuring and transaction costs, net, are included in the following financial statement line items of our Consolidated Statements of Operations:
Year Ended December 31, | |||||||
2019 | 2018 | ||||||
(in thousands) | |||||||
Compensation and related costs | $ | 3,406 | $ | — | |||
Other operating costs | 7,701 | — | |||||
Gain on sale of business | (2,883 | ) | — | ||||
Total strategic restructuring and transaction costs | $ | 8,224 | $ | — | |||
Liquidity and Capital Resources
Historically, our cash and liquidity needs have been met primarily through cash generated by our operations. Our current financial condition is highly liquid, with a significant amount of our assets comprised of cash and cash equivalents, accounts receivable, and investment securities held by us for the purposes of optimizing short-term cash management and providing initial cash seeding for product development purposes.
The following table sets forth certain key financial data relating to our liquidity and capital resources as of December 31, 2019 and 2018:
Year Ended December 31, | |||||||
2019 | 2018 | ||||||
(in thousands) | |||||||
Cash and cash equivalents | $ | 67,088 | $ | 59,586 | |||
Accounts receivable | $ | 10,182 | $ | 11,447 | |||
Investment securities | $ | 90,467 | $ | 91,190 | |||
Amounts payable under tax receivable agreement (1) | $ | 17,521 | $ | 18,023 | |||
Contingent consideration liability (2) | $ | — | $ | — | |||
__________________________
(1) | In light of numerous factors affecting our obligation to make such payments, the timing and amounts of any such actual payments are based on our best estimate as of the end of each period presented, including the ability to realize the expected tax benefits. Actual payments may significantly differ from estimated payments. See “Accounting Policies – Payments under the Tax Receivable Agreement” for more information. |
(2) | Represents the fair value of additional cash payments related to our acquisition of Rainier of up to $32.5 million over the three-year period ending December 31, 2019, contingent upon Rainier's achievement of certain financial targets. |
We have no material assets other than our ownership of Class A units of Manning & Napier Group and, accordingly, will depend on distributions from Manning & Napier Group to pay taxes, operating expenses, and any dividends we may pay. As managing member of Manning & Napier Group, we will determine the timing and amount of any distributions paid to its members. We intend to cause Manning & Napier Group to distribute cash to its members, including us, in an amount sufficient to cover taxes and operating expenses, including dividends, if any, declared by us. If we do cause Manning & Napier Group to make such distributions, M&N Group Holdings, MNCC and any other holders of units of Manning & Napier Group will be entitled to receive equivalent distributions on a pari passu basis.
In determining the sufficiency of liquidity and capital resources to fund our business, we regularly monitor our liquidity position, including among other things, cash, working capital, long-term liabilities, lease commitments and operating company distributions.
On August 30, 2019, the Company sold its wholly-owned subsidiary, PPI, to Manning Partners, LLC, which is wholly-owned by the Chairman of the Company’s Board of Directors. The Company received cash proceeds of $3.1 million, and recorded a $2.9 million gain on the sale. Other than the cash proceeds received, the transaction did not have a material impact to the consolidated statements of financial condition.
The Company is nearing the completion of the 2020 exchange period whereby eligible Class A units of Manning & Napier Group held by M&N Group Holdings and MNCC may be tendered for exchange. In connection with the exchange, the Company has the ability to pay an amount of cash equal to the number of units exchanged multiplied by the value of one share
39
of the Company's Class A common stock less a market discount and expected expenses, or at the Company's election issue shares of Class A common stock on a one-for-one basis.
We believe cash on hand and cash generated from operations will be sufficient over the next twelve months to meet our working capital requirements. Further, we expect that cash on hand, including short-term investments and cash generated by operations will be sufficient to meet our liquidity needs for the foreseeable future.
Cash Flows
The following table sets forth our cash flows for the years ended December 31, 2019 and 2018. Operating activities consist primarily of net income subject to adjustments for changes in operating assets and liabilities, equity-based compensation expense, changes in the liability under the TRA, deferred income tax expense, gain on sale of business and of intangible assets, and depreciation and amortization. Investing activities consist primarily of the purchase and sale of investments for the purpose of providing initial cash seeding for product development purposes and cash management purposes, gain on sale of intangible assets, gain on sale of business and purchases of property and equipment. Financing activities consist primarily of distributions to noncontrolling interests, dividends paid on our Class A common stock, and purchases of Class A units held by the noncontrolling interests of Manning & Napier Group.
Years Ended December 31, | |||||||
2019 | 2018 | ||||||
(in thousands) | |||||||
Net cash provided by operating activities | $ | 14,965 | $ | 22,838 | |||
Net cash provided by (used in) investing activities | 3,177 | (21,508 | ) | ||||
Net cash used in financing activities | (10,640 | ) | (20,006 | ) | |||
Net change in cash flows | $ | 7,502 | $ | (18,676 | ) | ||
Operating Activities
Operating activities provided $15.0 million and $22.8 million of net cash for the years ended December 31, 2019 and 2018, respectively. This overall $7.9 million decrease in net cash provided by operating activities was due to a decrease in net income after adjustment for non-cash items of approximately $13.9 million, which was driven by lower revenues resulting primarily from the decrease in our average AUM. This was partially offset by an overall increase of approximately $6.1 million in operating assets and liabilities.
Investing Activities
Investing activities provided $3.2 million and used $21.5 million of net cash for the years ended December 31, 2019 and 2018, respectively. This change was driven by an increase in cash from investing activities of $24.7 million due to our funding of and timing of activity within our investment securities. During the year ended December 31, 2019, we received approximately $3.0 million, net, from the purchase and sale of certain securities for cash management purposes and received approximately $0.1 million of net proceeds from the redemption of certain seeded portfolios during 2019. During the year ended December 31, 2018, we used $21.6 million, net, from the purchase and sale of certain securities for cash management purposes. In addition, we received proceeds from the sale of intangible assets and businesses of approximately $3.1 million during the year ended December 31, 2019, compared to $2.6 million in the same period of 2018. Our purchases of property and equipment were approximately $2.5 million and $2.0 million during the years ended December 31, 2019 and 2018, respectively.
Financing Activities
Financing activities used $10.6 million and $20.0 million of net cash for the years ended December 31, 2019 and 2018, respectively. This overall $9.4 million decrease in net cash used in 2019 compared to 2018 was primarily the result of a reduction in distributions to noncontrolling interests of $7.2 million and dividends paid on Class A common stock of $3.6 million driven by lower net income. These decreases in cash used were partially offset by a $1.1 million increase in cash used in 2019 for the purchase of Class A units of Manning & Napier Group pursuant to the exchange agreement entered into at the time of our IPO of $3.1 million in 2019 compared to $1.9 million in 2018. This increase was due to a higher number of units exchanged in 2019.
Off Balance Sheet Arrangements
We did not have any off-balance sheet arrangements as of December 31, 2019.
40
Item 7A. Quantitative and Qualitative Disclosures About Market Risk.
As a smaller reporting company, we are not required to provide this information.
Item 8. Financial Statements and Supplementary Data.
Our consolidated financial statements listed in Item 15 are filed as part of this report on pages F-2 through F-32 and are incorporated by reference in this Item 8.
41
Item 9. Changes in and Disagreements with Accountants on Accounting and Financial Disclosure.
None.
Item 9A. Controls and Procedures.
Conclusion Regarding the Effectiveness of Disclosure Controls and Procedures
Our management, including our principal executive officer and principal financial officer, evaluated the effectiveness of our disclosure controls and procedures as of December 31, 2019 pursuant to Rule 13a-15 under the Exchange Act. Based on that evaluation, our principal executive officer and principal financial officer have concluded that, as of December 31, 2019, our disclosure controls and procedures (as defined in Rule 13a-15(e) under the Exchange Act) were effective to ensure that information we are required to disclose in reports that we file or submit under the Exchange Act is recorded, processed, summarized and reported within the time periods specified in SEC rules and forms, and that such information is accumulated and communicated to our management, including our principal executive officer and principal financial officer, as appropriate, to allow timely decisions regarding required disclosures.
Changes in Internal Control Over Financial Reporting
There were no changes in our internal control over financial reporting (as the term is defined in Rules 13a-15(f) and 15d-15(f) under the Exchange Act) during the quarter ended December 31, 2019 that have materially affected, or are reasonably likely to materially affect, our internal control over financial reporting.
Management's Report on Internal Control Over Financial Reporting
Our management is responsible for establishing and maintaining adequate internal control over our financial reporting, as defined in Rule 13a-15(f) under the Exchange Act. Internal control over financial reporting is a process designed to provide reasonable assurance regarding the reliability of our financial reporting and the preparation of financial statements for external purposes in accordance with generally accepted accounting principles. Because of its inherent limitations, internal control over financial reporting may not prevent or detect misstatements. Also, projections of any evaluation of effectiveness to future periods are subject to the risk that controls may become inadequate because of changes in conditions, or that the degree of compliance with the policies or procedures may deteriorate.
Our management, with the participation of our principal executive officer and our principal financial officer, has assessed the effectiveness of our internal control over financial reporting as of December 31, 2019. In making this assessment, management used the criteria set forth by the Committee of Sponsoring Organizations of the Treadway Commission (COSO) in Internal Control - Integrated Framework (2013).
Based on the assessment using those criteria, management concluded that, as of December 31, 2019, our internal control over financial reporting was effective.
Auditor’s Report on Internal Control Over Financial Reporting
This Annual Report does not include an attestation report of our independent registered public accounting firm regarding internal control over financial reporting. Management’s report was not subject to attestation by our independent registered public accounting firm pursuant to the rules of the SEC that permit us to provide only management’s report in this Annual Report.
Item 9B. Other Information.
None.
42
PART III
Item 10. Directors, Executive Officers and Corporate Governance
Directors and Executive Officers
The following table sets forth certain information concerning the current directors and executive officers of the Company. Ages are given as of the date of this Annual Report.
Name | Age | Position(s) | Date of Election | ||||
Marc O. Mayer | 62 | Chief Executive Officer, Director | 2019 | ||||
Paul J. Battaglia | 41 | Chief Financial Officer | 2018 | ||||
Christopher Briley | 49 | Chief Technology Officer, Manning & Napier Advisors | 2019 | ||||
Nicole Kingsley Brunner | 39 | Chief Marketing Officer, Manning & Napier Advisors | 2018 | ||||
Ebrahim Busheri | 54 | Director of Investments, Manning & Napier Advisors | 2015 | ||||
Aaron McGreevy | 45 | Managing Director of Institutional & Intermediary Sales | 2016 | ||||
Sarah C. Turner | 37 | General Counsel & Corporate Secretary | 2018 | ||||
Greg Woodard | 50 | Managing Director, Wealth Management | 2019 | ||||
William Manning | 83 | Chairman | 2011 | ||||
Joel Domino | 60 | Director | 2017 | ||||
Edward George | 73 | Director | 2017 | ||||
Richard S. Goldberg | 67 | Director | 2014 | ||||
Barbara Goodstein | 59 | Director | 2012 | ||||
Robert Kopech | 69 | Director | 2019 | ||||
Kenneth A. Marvald | 57 | Director | 2017 | ||||
Edward J. Pettinella | 68 | Director | 2011 | ||||
Marc O. Mayer has served as our Chief Executive Officer since January 2019. Mr. Mayer has also served as the President of our affiliates Manning & Napier Advisors, LLC ("Manning & Napier Advisors"), Manning & Napier Group, LLC ("Manning & Napier Group"), and Rainier Investment Management, LLC, since January 2019. Prior to joining the Company, Mr. Mayer served as Head of North American Distribution for Schroders in New York, where he was responsible for leading all institutional business initiatives from 2014 to 2018. Prior to Schroders, he served as Chief Executive Officer at GMO LLC, an investment management firm, with over $70 billion in assets under management (“AUM”), from 2009 to 2011. This was preceded by a 20-year tenure at AllianceBernstein, where Mayer rose to the role of Chief Investment Officer of Blend Strategies. In this role, he oversaw $150 billion of AUM in their global asset allocation business. Prior to AllianceBernstein, Mayer was Chief Executive Officer of Sanford C. Bernstein & Co., LLC and also a member of Bernstein’s Board of Directors. Mr. Mayer earned a Bachelor’s degree from Yale University in 1978, and an M.B.A. from Columbia University School of Business in 1983.
Mr. Mayer's qualifications to service on our Board of Directors include his over 30 years of experience in the asset management industry.
Paul J. Battaglia, Jr. has served as our Chief Financial Officer since March 2018. Mr. Battaglia previously served as Manning & Napier’s Vice President of Finance, having joined the Company in 2004. Mr. Battaglia also serves as the President and Chairman of Manning & Napier Fund, Inc. Prior to joining Manning & Napier, Mr. Battaglia served as an Audit Associate at PricewaterhouseCoopers, LLP. Mr. Battaglia earned a B.B.A./M.B.A. in Accounting and Finance from St. Bonaventure University in 2001. He is also a Certified Public Accountant.
Christopher Briley has served as our Chief Technology Officer since March 2019. Prior to joining the Company, Mr. Briley served as Legg Mason's Head of Technology Business Management from February 2016 to January 2018, and its Managing Director and Head of Corporate Application Solutions from January 2018 to March 2019. From February 2013 to January 2016, Mr. Briley served as Senior Director of Global Applications and Architecture at networking services firm Ciena. Mr. Briley earned a Bachelor’s degree in Economics in 1994 from The University of North Carolina at Greensboro, and a Master of Science in Project Management from Penn State University in 2012.
Nicole Kingsley Brunner has served as our Chief Marketing Officer since March 2018. Ms. Brunner has previously served as Manning & Napier’s Director of Marketing Strategy from March 2016 to August 2018, and as our Marketing Manager from May 2002 to March 2016. Ms. Brunner earned a Bachelor’s degree in Public Relations and Marketing Communication from Simmons College in 2002.
43
Ebrahim Busheri, having rejoined the Company in 2011, is a member of the Senior Research Group and was named Director of Investments in March 2015. Previously, Mr. Busheri worked as the Director of Investments at W.P. Stewart and as a Consultant for Heritage Capital. From 1988 to 2001, Mr. Busheri worked at Manning & Napier Advisors in various roles, including as a Director of Research. Mr. Busheri earned a Bachelor’s degree in Accounting & Economics from Muskingum College in 1986 and an M.B.A. in Finance from the University of Rochester in 1988. Mr. Busheri is also a Chartered Financial Analyst.
Aaron McGreevy has served as our Managing Director of Taft-Hartley Services since July 2016. Mr. McGreevy previously served as Manning & Napier’s Director of Taft-Hartley Services, Vice President and Portfolio Strategist, and Senior Risk Management Analyst. Prior to joining Manning & Napier in 2004, Mr. McGreevy served as an Investment Officer at Fifth Third Bank. Mr. McGreevy earned a Bachelor’s degree in Business Administration from the University of Findlay in 2002. Mr. McGreevy is also a Chartered Retirement Plan Specialist and an Accredited Asset Management Specialist.
Sarah C. Turner rejoined the Company in May 2018 to serve as the Company’s General Counsel and Corporate Secretary. Ms. Turner also serves as Chief Legal Officer of Manning & Napier Fund, Inc. Ms. Turner served as Counsel in the Securities and Capital Markets practice group at the law firm Harter Secrest & Emery from October 2017 to April 2018, and prior to that she served as Legal Counsel to the Company since 2010. Prior to joining the Company in 2010, Ms. Turner served as an Associate in the Real Estate practice group at Mayer Brown LLP. Ms. Turner earned a Bachelor’s degree in Political Science from Allegheny College in 2004 and her Juris Doctor from Fordham University School of Law in 2007.
Greg Woodard has served as our Managing Director of Wealth Management at Manning & Napier since 2019. In this role, he is a member of the Wealth Management Leadership Team and is responsible for the management of the Advisor teams which includes developing and executing a comprehensive distribution and client services strategy. From October 2016 to August 2019, Mr. Woodard served as Managing Director in the Company's Portfolio Strategy Group, primarily responsible for maintaining consultant relations and providing field support for our client-facing teams. Prior to joining Manning & Napier in 2005, Greg worked in Institutional Sales & Trading at Bear, Stearns & Co. and held similar roles at JP Morgan Chase and UBS. Greg received his BS in Accounting from Villanova University and his MBA in Finance and International Management from the University of Rochester.
William Manning is our co-founder and has served as the Chairman of our Board of Directors since our initial public offering in 2011. In addition, Mr. Manning served as our Chief Executive Officer from April 2016 through March 2018. Since 2003, Mr. Manning has served as Director of Investment Process at Manning & Napier Advisors and, prior to that, was also the President of Manning & Napier Advisors. In addition, Mr. Manning has previously held officer and director positions with Manning & Napier Fund, Inc. Mr. Manning earned a Bachelor’s degree from Dartmouth College in 1958.
Mr. Manning’s qualifications to serve on our Board of Directors include his operating and leadership experience as an officer and director of Manning & Napier Advisors since it was founded, including in his role as the primary architect of its research and investment process.
Joel Domino joined our Board of Directors in June 2017. Mr. Domino has served as President and Chief Financial Officer of Kent Displays Inc. ("KDI") since 2002. From 1993 to 2002, Mr. Domino served as the Chief Financial Officer of KDI. Mr. Domino started his career in an accounting role at Ball Corporation in 1982. Mr. Domino is the son-in-law of Mr. Manning, the Chairman of our Board of Directors. Mr. Domino holds a B.A. in Accounting from Mount Union College in 1982 and an M.B.A. with a concentration in Strategic Planning from California State University in 1991.
Mr. Domino’s qualifications to serve on our Board of Directors include his 35 years of experience in the management of the financial affairs of both public and private companies.
Edward George joined our Board of Directors in June 2017. Prior to his retirement, Mr. George worked for Manning & Napier Advisors for fourteen years ending in 2000, where he started in sales and went on to become Managing Director. Prior to his employment at Manning & Napier Advisors, Mr. George worked for two consulting firms, AG Becker and Mercer Consulting. Mr. George previously served on the board of Ferrum Junior College. He earned an Associate’s degree from Ferrum Junior College in 1968, and a Bachelor’s degree in Education from Wake Forest University in 1972.
Mr. George’s qualifications to serve on our Board of Directors include his over 20 years of extensive experience in the asset management industry.
Richard S. Goldberg served as our Co-Chief Executive Officer from March 2018 to January 2019, joined our Board of Directors in June 2014, and has served as an advisor to Manning & Napier Advisors since 1998. Mr. Goldberg previously served as managing director and head of the North American Financial Institutions Group at Dresdner Kleinwort Wasserstein (formerly Wasserstein Perella), and vice president in Mergers and Acquisitions at Lazard. Mr. Goldberg is currently a faculty
44
and board member of Columbia University's School of International and Public Affairs since 2005 and 2009, respectively, as well as a Senior Advisor to Needham & Company, LLC from 2009 to 2018. Mr. Goldberg earned a Bachelor's degree from Boston College in 1975 and an M.B.A. from University of Pennsylvania's Wharton Business School in 1978.
Mr. Goldberg's qualifications to serve on our Board of Directors include his more than 30 years of experience in the investment industry.
Barbara Goodstein joined our Board of Directors in November 2012. Ms. Goodstein served as the Chief Executive Officer and President of Tiger 21 Holdings from May 2015 through January 2018, and she served as the Chief Marketing Officer at Vonage from July 2012 through January 2015. Prior to joining Vonage, Ms. Goodstein held senior management positions at AXA Equitable, JP Morgan Chase, and Instinet.com. Ms. Goodstein currently serves on the board of directors of KushCo Holdings Inc. In addition, Ms. Goodstein served as a member of the board of directors of AXA Advisors from 2006 through 2010 and Chase Investor Services Corp. from 2001 through 2005. Ms. Goodstein earned a Bachelor’s degree from Brown University in 1981 and an M.B.A. from Columbia University School of Business in 1983.
Ms. Goodstein’s qualifications to serve on our Board of Directors include her extensive marketing experience in the financial services industry.
Robert Kopech joined our Board of Directors in June 2019. Mr. Kopech acted as Special Advisor to the Chief Risk Officer of The International Monetary Fund from 2014 to 2015. From 2011-2013, Mr. Kopech served as the Vice President and Group Chief Risk Officer at The World Bank Group. Mr. Kopech also served in various roles, including Vice Chairman, Managing Director, and Partner, throughout his tenure at Oliver Wyman from 1995 to 2010. From 1976 to 1995, Mr. Kopech worked in various roles at J.P. Morgan, starting as a lending officer and eventually becoming Senior Risk Manager for all Emerging Markets. Mr. Kopech is currently a faculty and board member of Columbia University's School of International and Public Affairs since 2007 and 1998, respectively. Mr. Kopech earned a Bachelor's degree from Drew University in 1973 and an M.B.A. and M.I.A. from Columbia University in 1976.
Mr. Kopech's qualifications to serve on our Board of Directors include his extensive risk oversight and international investment experience along with his over 40 years of experience in the financial services industry.
Kenneth A. Marvald joined our Board of Directors in April 2017. For the past 24 years, Mr. Marvald has worked at Graywood Companies Inc., a global equity firm consisting of over 50 domestic and international operating companies across various sectors, where he oversees all legal affairs as Vice President & General Counsel. Mr. Marvald also serves on several boards, including The Summers Foundation, Education Success Network, and the Excellus Rochester Regional Advisory Board. Mr. Marvald received a B.A. in Political Science in 1984 from SUNY Binghamton, a J.D. in 1987 from SUNY Buffalo Law School and an LL.M. in 1988 from NYU Law School.
Mr. Marvald's qualifications to serve on our Board of Directors include his over 30 years of experience in financial services law across the corporate finance, real estate, M&A, and tax sectors.
Edward J. Pettinella joined our Board of Directors in November 2011. From January 2004 through October 2015, Mr. Pettinella served as President, CEO and Director of Home Properties, Inc., a real estate investment trust that was traded on the NYSE and acquired, developed and operated apartment communities in the Northeast and Mid-Atlantic markets. Prior to joining Home Properties in 2001, Mr. Pettinella served as President of Charter One Bank of New York and Executive Vice President of Charter One Financial, Inc. In addition, Mr. Pettinella held several management positions for Rochester Community Savings Bank, including Chief Operating Officer, Chief Financial Officer and Chief Investment Officer. Mr. Pettinella serves on the Board of Directors of Life Storage, Inc., a publicly traded real estate investment trust where he is the Chair of the Governance and Nominating Committee. Mr. Pettinella also serves on the Board of Directors of Royal Oak Realty Trust, a private non-traded real estate investment trust. Mr. Pettinella is also a member of the Syracuse University Board of Trustees, where he is the Vice Chair, serves on the Executive Committee and chairs the Audit and Risk Committee. Mr. Pettinella earned a B.S. in Business from SUNY Geneseo in 1973 and an M.B.A. in Finance from Syracuse University in 1976.
Mr. Pettinella’s qualifications to serve on our Board of Directors include his extensive, broad-based financial and leadership experience in the banking and real estate industries, including a multi-billion dollar financial services company.
There are no family relationships among the Company and any of its executive officers or directors other than those described above.
45
Set forth below is a list of the names, ages and positions of other current significant employees as of the date of this Annual Report.
Name | Age | Position(s) | |||
Christian A. Andreach | 47 | Co-Head of Global Equities | |||
Marc D. Tommasi | 56 | Chief Investment Strategist | |||
Biographies of Significant Employees
Christian A. Andreach has served as the Co-Head of Global Equities of Manning & Napier Advisors since 2010 and as a member of its Senior Research Group since 2002. Mr. Andreach joined Manning & Napier Advisors in 1999. Mr. Andreach earned a Bachelor’s degree from St. Bonaventure University in 1995 and an M.B.A. from the University of Rochester in 1997. Mr. Andreach is a Chartered Financial Analyst.
Marc D. Tommasi has served as the Chief Investment Strategist of Manning & Napier Advisors since April 2016, the Co-Head of Global Equities since March 2015, as the Head of Global Investment Strategy of Manning & Napier Advisors from 2010 through 2014, and as a member of the Company's Senior Research Group since 1989. Mr. Tommasi joined Manning & Napier Advisors in 1986. Mr. Tommasi earned a Bachelor’s degree from the University of Rochester in 1986.
Board Committees
Our Board of Directors has established three standing committees: an Audit Committee, a Compensation Committee and a Nominating and Corporate Governance Committee, each consisting solely of independent directors, and our Board of Directors has adopted charters for its committees that comply with the NYSE and SEC rules relating to corporate governance matters. Copies of these committee charters can be found under the "Investor Relations—Governance" section of the Company’s website at www.manning-napier.com and are available to any stockholder upon request in writing to the Company.
Audit Committee. Our Audit Committee oversees a broad range of issues surrounding our accounting and financial reporting processes and audits of our financial statements, including performing the following duties:
• | monitor the integrity of our financial statements, our compliance with legal and regulatory requirements, our independent registered public accounting firm’s qualifications and independence, and the performance of our internal audit function and independent registered public accounting firm; |
• | assume direct responsibility for the appointment, compensation, retention and oversight of the work of any independent registered public accounting firm engaged for the purpose of performing any audit, review or attest services and for dealing directly with any such accounting firm; |
• | provide a medium for consideration of matters relating to any audit issues; and |
• | prepare the audit committee report that the rules require be included in our filings with the SEC. |
As of the date of this Annual Report, Ms. Goodstein and Messrs. Kopech, Marvald and Pettinella serve on the Audit Committee, and Mr. Pettinella serves as its chair. Our Board of Directors has determined that Ms. Goodstein and Messrs. Kopech, Marvald and Pettinella each are financially literate and independent under the NYSE listing standards and under Rule 10A-3 of the Exchange Act, and that Mr. Pettinella is an "audit committee financial expert" within the meaning of the applicable rules of the SEC and the NYSE.
Compensation Committee. Our Compensation Committee reviews and recommends policy relating to compensation and benefits of our officers, directors and employees, including reviewing and approving corporate goals and objectives relevant to the compensation of our Chief Executive Officer and other senior officers, evaluating the performance of these persons in light of those goals and objectives and setting compensation of these persons based on such evaluations. The Compensation Committee will review and evaluate, at least annually, the performance of the Compensation Committee and its members, including compliance of the Compensation Committee with its charter. The Compensation Committee may, in its discretion, delegate its authority to its chair or a subcommittee when it deems appropriate and in the best interests of the Company.
As of the date of this Annual Report, Ms. Goodstein and Messrs. George, Kopech, Marvald and Pettinella serve on the Compensation Committee, and Mr. Kopech serves as its chair. Our Board of Directors has determined that each of the Compensation Committee members is independent under the NYSE listing standards.
Nominating and Corporate Governance Committee. The Nominating and Corporate Governance Committee oversees and assists our Board of Directors in identifying, reviewing and recommending nominees for election as directors, evaluates our Board of Directors and our management succession, develops, reviews and recommends corporate governance guidelines and a
46
corporate code of business conduct and ethics, and generally advises our Board of Directors on corporate governance and related matters.
As of the date of this Annual Report, Ms. Goodstein and Messrs. George, Kopech, Marvald and Pettinella serve on the Nominating and Corporate Governance Committee, and Ms. Goodstein serves as its chair. Our Board of Directors has determined that each of the Nominating and Corporate Governance Committee members is independent under the NYSE listing standards.
Stockholder Nominations
Stockholders may submit candidates for nomination to the Board of Directors in accordance with the procedures set forth in our Amended and Restated Bylaws, which have not changed since the date of our last proxy statement. The Nominating and Corporate Governance Committee will evaluate candidates recommended by stockholders in the same manner as all other candidates.
To date, no stockholder nominations for director have been made nor have any stockholder recommendations for director been received by the Company.
Code of Business Conduct and Ethics
Our Board of Directors has adopted a Code of Business Conduct and Ethics that applies to all of the Company’s directors, officers and employees. The purpose and role of this code is to focus our directors, officers and employees on areas of ethical risk, provide guidance to help them recognize and deal with ethical issues, provide mechanisms to report unethical or unlawful conduct, and help enhance and formalize our culture of integrity, honesty and accountability. We intend to disclose within four business days any amendment to, or waiver of, a provision of our Code of Business Conduct and Ethics that applies to our principal executive officer, principal financial officer, principal accounting officer or controller, or persons performing similar functions and that relates to any element of the Code of Business Conduct and Ethics, by posting that information on the Company's website. Our Code of Business Conduct and Ethics is posted on the Company’s website, www.manning-napier.com, under "Investor Relations—Governance" and is available to any stockholder in writing upon request to the Company.
DELINQUENT SECTION 16(A) REPORTS
Section 16(a) of the Exchange Act requires each director, officer and any individual beneficially owning more than 10% of the Company’s capital stock to file with the SEC reports of security ownership and reports on subsequent changes in ownership.
To the Company’s knowledge, with respect to the fiscal year ended December 31, 2019, the Company's officers, directors and greater than 10% owners timely filed all reports they were required to file under Section 16(a); however, one report covering one transaction in the fiscal year ended December 31, 2018 was filed late by Mr. Busheri during 2019 and one report covering one transaction in the fiscal year ended December 31, 2018 was filed late by Mr. Marvald during 2020.
Item 11. Executive Compensation
Summary Compensation Table
The following tables and related narrative contain information regarding the compensation earned during the fiscal years ended December 31, 2019 and 2018 (if applicable) of our principal executive officer, the individuals acting in that capacity at any time during 2019, each of our two most highly compensated executive officers serving with us at December 31, 2019, other than our principal executive officer, and up to two individuals who would have been our most highly compensated executive officers but for the fact that the individual was not serving as an executive officer at December 31, 2019. We refer to these individuals in this Annual Report as our "named executive officers."
47
Name and Principal Position | Year | Salary ($) | Bonus ($) | Stock Awards ($) (1) | Option Awards ($) (1) | Non-Equity Incentive Plan Compensation (2) | All Other Compensation ($) (9) | Total ($) | ||||||||||||||||
Marc O. Mayer | 2019 | 457,692 | 2,250,000 | 753,750 | 1,461,380 | — | 52,827 | 4,975,649 | ||||||||||||||||
Chief Executive Officer | ||||||||||||||||||||||||
Jeffrey S. Coons | 2019 | 168,718 | (5 | ) | — | — | — | — | 5,506 | 174,224 | ||||||||||||||
Former Co-Chief Executive Officer and Former President (3) | 2018 | 400,000 | — | — | — | 518,364 | 11,155 | 929,519 | ||||||||||||||||
Charles H. Stamey | 2019 | 126,538 | (6 | ) | — | — | — | 42,655 | 9,700 | 178,893 | ||||||||||||||
Former Co-Chief Executive Officer and Former Managing Director of Sales and Distribution and Former Executive Vice President (3) | 2018 | 300,000 | — | 137,816 | — | 1,085,310 | 11,155 | 1,534,281 | ||||||||||||||||
Richard Goldberg | 2019 | 495,000 | (7 | ) | — | 23,025 | (8 | ) | — | — | 14,601 | 532,626 | ||||||||||||
Former Co-Chief Executive Officer, Senior Advisor and Director (3) | 2018 | 748,500 | — | 156,670 | — | — | 10,505 | 915,675 | ||||||||||||||||
Ebrahim Busheri | 2019 | 425,000 | — | 240,340 | — | 1,420,000 | 34,301 | 2,119,641 | ||||||||||||||||
Director of Investments | 2018 | 425,000 | — | 221,375 | — | 1,453,754 | 9,855 | 2,109,984 | ||||||||||||||||
Aaron McGreevy | 2019 | 85,000 | 200,000 | — | — | 333,299 | 14,601 | 632,900 | ||||||||||||||||
Managing Director of Institutional & Intermediary Sales | ||||||||||||||||||||||||
Thomas Anderson | 2019 | 125,000 | — | — | — | 248,220 | 411,464 | 784,684 | ||||||||||||||||
Former Managing Director, Intermediary Distribution (4) | ||||||||||||||||||||||||
(1) | Represents the grant date fair value computed in accordance with the requirements of accounting for stock-based compensation. The amounts reported in this column have been computed in accordance with FASB ASC Topic 718. For a discussion of assumptions used in the 2019 valuations, see Note 14 to the Consolidated Financial Statements, "Equity Based Compensation" which are incorporated by reference in Item 8 of Part II of this Form 10-K. |
(2) | Represents non-equity incentive plan compensation amounts paid as described in "Narrative to the Summary Compensation Table-Non-Equity Incentive Plan Compensation." |
(3) | Upon the appointment of Mr. Mayer as Chief Executive Officer in January 2019, the Office of Chief Executive Officer and the services of Dr. Coons and Messrs. Stamey and Goldberg as Co-Chief Executive Officers were terminated. Dr. Coons was also removed from his role as President at such time. |
(4) | Mr. Anderson resigned from the Company in June 2019. In recognition of his years of service, Mr. Anderson received severance in the amount of $381,710 and a health insurance stipend of $14,907, net of taxes of $5,936, resulting in a gross health insurance stipend payment of $20,843. |
(5) | On January 30, 2019, Dr. Coons was terminated from his position as President of the Company, effective immediately, and was retained by the Company as a consultant through April 30, 2019, and received aggregate cash compensation of $133,333 for such period. |
(6) | On January 30, 2019, Mr. Stamey retired from his position as Executive Vice President, effective immediately. Mr. Stamey remained with the Company in an advisory capacity following his retirement until April 30, 2019, and received aggregate cash compensation of $100,000 for the period. |
(7) | Mr. Goldberg’s compensation did not change for a period of four months after the dissolution of the Office of the Chief Executive Officer. Beginning on June 1, 2019, Mr. Goldberg's monthly compensation changed from $50,000 per month to $35,000 per month. Mr. Goldberg continues to serve as a senior advisor. In addition, Mr. Goldberg continues in his position as a member of the board of directors for no additional compensation. |
(8) | Includes $23,025 which represents the stock award granted to Mr. Goldberg in 2019 for his prorated service as a member of the Board of Directors during fiscal 2018. |
(9) | Represents the aggregate dollar amount of all miscellaneous compensation received by our named executive officers for 2019. The following table summarizes the Company's contributions to the Company's 401(k) and Profit Sharing Plan and contributions to the Health Retirement/Savings Account, and Other Compensation for each of our named executive officers for 2019: |
48
Name | 401(k) Profit Sharing and Matching Contributions | Health Retirement/Savings Account Contribution | Other Compensation | Total - All Other Compensation | |||||||||||||
Marc O. Mayer | $ | — | $ | 1,842 | $ | 50,985 | (10 | ) | $ | 52,827 | |||||||
Jeffrey S. Coons | $ | 4,206 | $ | 1,300 | $ | — | $ | 5,506 | |||||||||
Charles H. Stamey | $ | 8,400 | $ | 1,300 | $ | — | $ | 9,700 | |||||||||
Richard Goldberg | $ | 12,001 | $ | 2,600 | $ | — | $ | 14,601 | |||||||||
Ebrahim Busheri | $ | 12,001 | $ | 1,300 | $ | 21,000 | (11 | ) | $ | 34,301 | |||||||
Aaron McGreevy | $ | 12,001 | $ | 2,600 | $ | — | $ | 14,601 | |||||||||
Thomas Anderson | $ | 7,611 | $ | 1,300 | $ | 402,553 | (12 | ) | $ | 411,464 | |||||||
(10) | Pursuant to his employment agreement, Mr. Mayer is entitled to an annual reimbursement of up to $20,000 per year for travel expenses between New York, New York and Rochester, New York and a reimbursement up to $20,000 of relocation costs incurred in 2019 and $20,000 of legal expenses in connection with his employment agreement. The amounts above include $20,000 for the reimbursement of travel costs, $10,985 for the reimbursement of relocation costs and $20,000 for the reimbursement of legal expenses. |
(11) | Mr. Busheri is a permanent resident of the state of Florida. Based on the job requirements of his role, he is required to travel regularly to the Company's headquarters in Rochester, New York. In lieu of the Company reimbursing Mr. Busheri for individual meals and lodging while in Rochester, the Company contributes to the cost of renting an apartment in Rochester, New York. |
(12) | Mr. Anderson resigned from the Company in June 2019. In recognition of his years of service, Mr. Anderson received severance in the amount of $381,710 and a health insurance stipend of $14,907, net of taxes of $5,936, resulting in a gross health insurance stipend payment of $20,843. |
Dr. Coons and Mr. Stamey beneficially owned shares or other interests in Manning & Napier Group Holdings, LLC ("M&N Group Holdings") during 2019, and received pro-rata cash distributions derived in part from the earnings of M&N Group Holdings in respect of their shares at the same time cash distributions are made on all shares of M&N Group Holdings. These distributions are not included in the compensation totals above.
Narrative to the Summary Compensation Table
Overview. Our compensation programs for our named executive officers are designed to meet the following objectives:
• | support our business strategy; |
• | attract, motivate and retain top-tier professionals within the investment management industry by rewarding past performance and encouraging future contributions to achieve our strategic goals and enhance stockholder value; |
• | link total compensation to individual, team and Company performance on both a short-term and a long-term basis; |
• | align our named executive officers’ interests with those of our stockholders; and |
• | be flexible enough so we can respond to changing economic conditions. |
Our compensation programs for our named executive officers provide opportunities, predominantly contingent upon performance, which we believe have assisted our ability to attract and retain highly qualified professionals. In the past we have used, and we will likely use in the future, a combination of cash compensation programs and equity participation. We periodically evaluate the success of our compensation and equity participation programs in achieving these objectives and we expect that some of our policies and practices may change in order to enable us to better achieve these objectives.
Annual Salary. Our Compensation Committee reviews the annual salaries of our named executive officers. Base salaries are intended to provide our named executive officers with a degree of financial certainty and stability that does not depend on our performance. We consider it a baseline compensation level that delivers some current cash income to these executives. Pursuant to his employment agreement, Mr. Mayer receives an annual base salary of $500,000.
Annual Bonus. Pursuant to his employment agreement, Mr. Mayer received an aggregate $2,250,000 cash bonus in 2019.
Cash incentive compensation is a key part of the overall annual compensation for Mr. McGreevy. The cash bonus Mr. McGreevy earned in 2019 included both discretionary and performance-related metrics. In 2019, the discretionary component of Mr. McGreevy's cash bonus was $200,000 based on the completion of agreed upon individual goals during the year.
Equity Based Compensation. Our 2011 Equity Compensation Plan (the "Equity Plan") permits the grant or issuance of a variety of equity awards of both Manning & Napier, Inc. and of Manning & Napier Group. In determining the equity awards to be granted to our named executive officers, we have taken, and in the future intend to take, into account the following factors:
• | the value of such awards; |
• | the named executive officer’s level of current and potential job responsibility; and |
• | our desire to retain the named executive officer over the long term. |
49
Pursuant to his employment agreement, upon Mr. Mayer's employment and appointment as Chief Executive Officer on January 30, 2019, he was granted under the Equity Plan a total of 375,000 restricted stock units ("RSUs") and options to purchase up to 3,500,000 shares of our Class A common stock at an exercise price of $2.01 per share. The RSUs will convert to shares of our Class A common stock on a one-for-one basis. The RSUs are subject to time vesting, with one-third of such RSUs having vested on each of January 30, 2019 and December 31, 2019, and with one-third of such shares vesting on December 31, 2020. The option to purchase up to 500,000 shares of our Class A common stock is subject to time vesting ("TSOs") and one-third of these TSOs will vest on each of January 1, 2020, 2021, and 2022. The option to purchase up to 3,000,000 shares of our Class A common stock is subject to the achievement of specified performance-vesting criteria ("PSOs") and will vest in installments only if the closing price per share of our Class A common stock as reported on the New York Stock Exchange exceeds a certain threshold for 20 consecutive days prior to the specified date. For additional information on the performance-vesting criteria, see the "Outstanding Equity Awards at Fiscal Year End" table below. The TSOs and PSOs, to the extent not previously exercised, shall terminate at the close of business on the fourth anniversary of the applicable vesting date.
Mr. Busheri received an equity award of 85,227 RSUs issued under the Equity Plan based on fiscal 2018 performance that will convert to shares of our Class A common stock on a one-for-one basis. The RSUs are subject to time vesting. One-third of the RSUs vested on December 31, 2019, and one-third of the RSUs will vest on each of December 31, 2020 and December 31, 2021.
With the exception of the RSUs and TSOs granted to Mr. Mayer, equity granted under the Equity Plan during 2019 is not subject to accelerated vesting upon termination of employment, but may be subject to accelerated vesting upon a change in control, as defined in the Equity Plan. Mr. Mayer's RSUs will vest in full upon his termination due to death or disability or without cause or for good reason, and his TSOs will vest in full upon the closing of a change in control of the Company on or after January 1, 2020 and before January 1, 2023.
Non-Equity Incentive Plan Compensation. Cash incentive compensation is a key part of the overall annual compensation for Messrs. Busheri, McGreevy and Anderson. The 2019 non-equity incentive compensation for Mr. Busheri was based on the investment returns of the Company’s assets under management over the one- and three-year time horizons, representing the time period Mr. Busheri has held the role of Director of Investments. In 2019, Mr. McGreevy’s non-equity incentive compensation was based on the new business and total assets under management for the Company’s Taft-Hartley business. Mr. McGreevy earned incentive compensation rates ranging from 3% - 10% on first year revenues from new Taft-Hartley business, and earned rates ranging from 0.8% - 1.8% on total Taft-Hartley revenues (excluding first year revenues paid at the higher rate). Mr. McGreevy’s non-equity incentive compensation for 2019 was $333,299. Mr. Anderson’s non-equity incentive compensation was based on the business related to the intermediary and platform/sub-advisory channels. Mr. Anderson's non-equity incentive compensation included 0.005% on total assets under management within our intermediary channel, a 0.05% incentive on gross client inflows from our platform/sub-advisory channel, and incentive rates of 30% of first year revenues and 5% on ongoing revenue for accounts that he serviced directly. Mr. Stamey's non-equity incentive compensation included a cash bonus based on the sales and service commissions generated by the Company's sales force in fiscal 2018.
Retirement Benefits. We maintain a contributory defined contribution retirement plan for all employees, and match up to 50% of each employee’s contributions, not to exceed 3% of their total compensation during the year ended December 31, 2019 (other than catch-up contributions by employees age 50 and older) up to an annual limitation as determined by the IRS. In addition, we may make an annual discretionary profit sharing contribution, subject to certain limitations.
Employment Agreements
We entered into an employment agreement with Mr. Mayer on January 30, 2019. In addition to the annual salary, annual bonus, and equity based compensation describe above, Mr. Mayer is eligible for an annual cash performance bonus. In 2020, the amount of Mr. Mayer’s bonus will be based on our pretax operating income, investment performance and achievement of strategic initiatives. The target bonus amount in 2020 is (1) $2.25 million if our operating revenue for 2020 is less than $180 million or (2) $2.5 million if our operating revenue for 2020 is equal to or greater than $180 million. The maximum payout based on 2020 performance is $3.4 million. Mr. Mayer is eligible for the 2020 bonus if he remains employed with the Company through December 31, 2020. In 2021 and subsequent years, the amount of Mr. Mayer’s bonus will be based on the achievement of performance criteria to be determined by the Compensation Committee prior to the start of such year. The target bonus amount in 2021 and subsequent years will be (1) no less than $2.25 million, provided our operating revenue for the preceding year is at least $180 million or (2) an appropriate amount to be determined by Mr. Mayer and the Compensation Committee if our operating revenue for the preceding year is less than $180 million. Mr. Mayer is eligible for the bonus in years after 2020 if he remains employed with the Company through the applicable payment date.
Pursuant to Mr. Mayer's employment agreement, if his employment is terminated due to his death or disability, and subject to certain restrictions, his estate or he will be eligible to receive (1) his base salary, reimbursement of expenses and other benefits to which he would be entitled through the termination date; (2) immediate vesting of any unvested RSUs; and
50
(3) a pro rata portion of the target annual cash bonus in the year his employment is terminated. If Mr. Mayer is terminated without cause or resigns with good reason, he will be eligible to receive the compensation discussed above in addition to an aggregate of $5 million in severance payments paid over the two-year period following the termination or resignation, provided he executes and does not revoke a general release and waiver of all claims. If Mr. Mayer's employment is terminated due to his disability, then for the period of time during which his disability continues, he may continue to participate in certain of the employee benefit plans in which he participated immediately prior to his removal.
In addition, if Mr. Mayer is terminated without cause or resigns for good reason after January 1, 2020 and a change in control occurs within 12 months, the Company will pay Mr. Mayer the cash equivalent of the number of TSOs that would have vested had he remained employed through the date of the change in control multiplied by the excess of the value of a share of our Class A common stock in the change in control transaction over the exercise price of the TSOs.
If Mr. Mayer is terminated for cause or Mr. Mayer resigns without good reason, he will be eligible to receive his base salary, reimbursement of expenses and other benefits to which he would be entitled through the termination date, and he will forfeit his unvested RSUs, TSOs, and PSOs and any unpaid annual cash bonuses.
Pursuant to Mr. Mayer’s employment agreement, during and for a two-year period following termination of employment, (1) Mr. Mayer may not, without the written consent of the Company, directly or indirectly (a) persuade or encourage, or attempt to do so, any customer, client, or affiliate of the Company or an affiliate to cease doing business with the Company or an affiliate or to compete with the Company or an affiliate, or (b) solely with respect to clients or customers for whom the Company or an affiliate is a provider of investment management services with respect to 50% or more of the client’s or customer’s assets under management, do business with such customer, client or affiliate, (2) Mr. Mayer may not compete with the Company in the territories served, or contemplated to be entered by, the Company or its affiliates, and (3) Mr. Mayer may not, without the written consent of the Company, directly or indirectly employ or contract any person who then is or has been an employee of or consultant to the Company or its affiliates within one year prior to such date of termination and with whom Mr. Mayer has material contact. Mr. Mayer must also forever hold in a fiduciary capacity for our benefit all secret and confidential information obtained by him and may not, without the written consent of the Company or as required by law, disclose such information to anyone other than the Company and those designate by the Company.
During 2019, Manning & Napier Advisors was party to employment agreements with each of Dr. Coons and Messrs. Stamey, Busheri, McGreevy and Anderson, which provide for at-will employment for each of them. While these agreements do not provide compensation terms or duration of employment, such agreements include restrictive covenants concerning competition with us and solicitation of our employees and clients. Pursuant to such agreements, for a two-year period following termination of employment, (1) the former employee may not, without the written consent of Manning & Napier Advisors, do business with a person or entity known to such employee to be, or known to have been, a client of Manning & Napier Advisors at the time of such employee’s employment, (2) the former employee may not compete with Manning & Napier Advisors in the territories covered by such person, and (3) with respect to Mr. Busheri, the former employee shall notify Manning & Napier Advisors of all business activities to enable Manning & Napier Advisors to evaluate compliance with (1) and (2). In addition, with respect to Mr. Busheri, for a five-year period following termination of employment, he may not, without the written consent of Manning & Napier Advisors, employ or contract any person who then is or has been an employee of or consultant to Manning & Napier Advisors within two years prior to such date of termination. With respect to Dr. Coons and Messrs. Stamey, McGreevy and Anderson, the former employee may not, without written consent of Manning & Napier Advisors, employ or contract any person who then is or has been an employee of our consultant to Manning & Napier Advisors within five years prior to such date of termination. In addition to these employment agreements, Dr. Coons and Mr. Stamey are each subject to similar non-compete and non-solicitation covenants as part of the shareholder agreements with the Manning and Napier Companies.
Mr. Anderson resigned from the Company in June 2019. In recognition of his years of service, Mr. Anderson received a severance payment in the amount of $381,710 and a health insurance stipend of $14,907, net of taxes of $5,936, resulting in a gross health insurance stipend payment of $20,843.
Determination of Compensation and Role of Directors and Executive Officers in Compensation Decisions
Our Compensation Committee assists our Board of Directors in the discharge of its responsibilities relating to the compensation of our named executive officers. For a discussion of the Compensation Committee’s role and responsibility, see "Corporate Governance-Board Committees-Compensation Committee" included earlier in Item 10 of Part III of this Annual Report. Our Chief Executive Officer also works with the Compensation Committee and the Board of Directors to set the compensation of the named executive officers other than themselves. Our Compensation Committee, with the oversight of the Board of Directors, has the delegated authority for: (1) overseeing our compensation policies and programs and setting the compensation of our Chief Executive Officer and our Chairman in 2019, (2) reviewing our achievements as a company and the achievements of our named executive officers, and (3) providing input and guidance to our Chief Executive Officer in the
51
determination of the specific type and level of compensation of our other named executive officers and the rest of the senior management team.
Role of Independent Compensation Consultant
Our Compensation Committee is responsible for determining the compensation of our named executive officers. During 2019, McLagan provided the Compensation Committee with information about the competitive market for senior management in the investment management and financial services industries and compensation trends in those industries generally. McLagan provides guidance and assistance to the Compensation Committee as it makes its compensation decisions, either directly to the full Compensation Committee or through conversations with the Committee's chairman. McLagan has not provided any services to the Company other than those it provided to the Compensation Committee in its role as independent consultant. We, from time to time, will review our relationship with McLagan and reaffirm its appointment as our independent consultant.
Outstanding Equity Awards at Fiscal Year End
The following table sets forth information with respect to the outstanding equity awards as of December 31, 2019 for our named executive officers:
Option Awards | Stock Awards | |||||||||||||||||||||||
Name | Number of Securities Underlying Unexercised Options (#) Exercisable | Number of Securities Underlying Unexercised Options (#) Unexercisable | Equity Incentive Plan Awards: Number of Securities Underlying Unexercised Unearned Options (#) | Option Exercise Price ($) | Option Expiration Date | Number of Shares or Units of Stock That Have Not Vested (#) | Market Value of Shares or Units of Stock That Have Not Vested ($) (1) | |||||||||||||||||
Marc O. Mayer | — | — | — | N/A | N/A | 125,000 | $ | 217,500 | ||||||||||||||||
— | 166,666 | — | $ | 2.01 | 1/1/2024 | (2 | ) | — | $ | — | ||||||||||||||
— | 166,666 | — | $ | 2.01 | 1/1/2025 | (3 | ) | — | $ | — | ||||||||||||||
— | 166,668 | — | $ | 2.01 | 1/1/2026 | (4 | ) | — | $ | — | ||||||||||||||
— | — | 400,000 | $ | 2.01 | Varies | (5 | ) | — | $ | — | ||||||||||||||
— | — | 289,000 | $ | 2.01 | Varies | (6 | ) | — | $ | — | ||||||||||||||
— | — | 289,000 | $ | 2.01 | Varies | (7 | ) | — | $ | — | ||||||||||||||
— | — | 289,000 | $ | 2.01 | Varies | (8 | ) | — | $ | — | ||||||||||||||
— | — | 289,000 | $ | 2.01 | Varies | (9 | ) | — | $ | — | ||||||||||||||
— | — | 289,000 | $ | 2.01 | Varies | (10 | ) | — | $ | — | ||||||||||||||
— | — | 289,000 | $ | 2.01 | Varies | (11 | ) | — | $ | — | ||||||||||||||
— | — | 289,000 | $ | 2.01 | Varies | (12 | ) | — | $ | — | ||||||||||||||
— | — | 289,000 | $ | 2.01 | Varies | (13 | ) | — | $ | — | ||||||||||||||
— | — | 288,000 | $ | 2.01 | Varies | (14 | ) | — | $ | — | ||||||||||||||
Jeffrey S. Coons | — | — | — | N/A | N/A | — | $ | — | ||||||||||||||||
Charles H. Stamey | — | — | — | N/A | N/A | — | $ | — | ||||||||||||||||
Richard Goldberg | — | — | — | N/A | N/A | — | $ | — | ||||||||||||||||
Ebrahim Busheri | — | — | — | N/A | N/A | 22,916 | (15 | ) | $ | 39,874 | ||||||||||||||
— | — | — | N/A | N/A | 56,818 | (16 | ) | $ | 98,863 | |||||||||||||||
Aaron McGreevy | — | — | — | N/A | N/A | 51,481 | (17 | ) | $ | 89,577 | ||||||||||||||
— | — | — | N/A | N/A | 10,000 | (18 | ) | $ | 17,400 | |||||||||||||||
Thomas Anderson | — | — | — | N/A | N/A | — | $ | — | ||||||||||||||||
(1) | Amount shown is determined by multiplying the closing sales price of our Class A common stock as of December 31, 2019, which was $1.74 per share as reported on the New York Stock Exchange, by the number of shares or units that have not vested. |
52
(2) | These options vested on January 1, 2020. |
(3) | These options vest on January 1, 2021 subject to Mr. Mayer's continued employment through such date. |
(4) | These options vest on January 1, 2022 subject to Mr. Mayer's continued employment through such date. |
(5) | These options vest on the date the closing price per share of our Class A common stock as reported on the New York Stock Exchange exceeds $3.25 for 20 consecutive days, subject to Mr. Mayer's continued employment through such date and provided such date occurs on or prior to December 31, 2021. These options expire on the fourth anniversary of the vesting date. |
(6) | These options vest on the date the closing price per share of our Class A common stock as reported on the New York Stock Exchange exceeds $3.75 for 20 consecutive days, subject to Mr. Mayer's continued employment through such date and provided such date occurs on or prior to December 31, 2021. These options expire on the fourth anniversary of the vesting date. |
(7) | These options vest on the date the closing price per share of our Class A common stock as reported on the New York Stock Exchange exceeds $4.25 for 20 consecutive days, subject to Mr. Mayer's continued employment through such date and provided such date occurs on or prior to December 31, 2022. These options expire on the fourth anniversary of the vesting date. |
(8) | These options vest on the date the closing price per share of our Class A common stock as reported on the New York Stock Exchange exceeds $4.75 for 20 consecutive days, subject to Mr. Mayer's continued employment through such date and provided such date occurs on or prior to December 31, 2022. These options expire on the fourth anniversary of the vesting date. |
(9) | These options vest on the date the closing price per share of our Class A common stock as reported on the New York Stock Exchange exceeds $5.25 for 20 consecutive days, subject to Mr. Mayer's continued employment through such date and provided such date occurs on or prior to December 31, 2023. These options expire on the fourth anniversary of the vesting date. |
(10) | These options vest on the date the closing price per share of our Class A common stock as reported on the New York Stock Exchange exceeds $5.75 for 20 consecutive days, subject to Mr. Mayer's continued employment through such date and provided such date occurs on or prior to December 31, 2023. These options expire on the fourth anniversary of the vesting date. |
(11) | These options vest on the date the closing price per share of our Class A common stock as reported on the New York Stock Exchange exceeds $6.25 for 20 consecutive days, subject to Mr. Mayer's continued employment through such date and provided such date occurs on or prior to December 31, 2024. These options expire on the fourth anniversary of the vesting date. |
(12) | These options vest on the date the closing price per share of our Class A common stock as reported on the New York Stock Exchange exceeds $6.75 for 20 consecutive days, subject to Mr. Mayer's continued employment through such date and provided such date occurs on or prior to December 31, 2024. These options expire on the fourth anniversary of the vesting date. |
(13) | These options vest on the date the closing price per share of our Class A common stock as reported on the New York Stock Exchange exceeds $7.25 for 20 consecutive days, subject to Mr. Mayer's continued employment through such date and provided such date occurs on or prior to December 31, 2025. These options expire on the fourth anniversary of the vesting date. |
(14) | These options vest on the date the closing price per share of our Class A common stock as reported on the New York Stock Exchange exceeds $7.75 for 20 consecutive days, subject to Mr. Mayer's continued employment through such date and provided such date occurs on or prior to December 31, 2025. These options expire on the fourth anniversary of the vesting date. |
(15) | The RSUs will vest on December 31, 2020. |
(16) | The RSUs will vest in two equal installments on each of December 31, 2020 and December 31, 2021. |
(17) | The RSUs will vest in installments of 25,740 and 25,741 on December 3, 2020 and December 3, 2021, respectively. |
(18) | The restricted stock awards will vest in two equal installments on each of April 16, 2020 and April 16, 2021. |
Director Compensation
In fiscal year 2019, except for Mr. Manning, for our non-employee directors included an annual cash retainer of $95,000, an annual cash retainer of $15,000 for the chairs of our Audit Committee and Compensation Committee (prorated for the time period served as director in 2019 by each of Messrs. Rosenberger and Kopech), an annual cash retainer of $5,000 for the chair of our Nominating & Governance Committee, and a $95,000 equity grant in 2019 to reflect their service for fiscal year 2018. The value of the equity grant included in the table below may differ as it represents the grant date fair value computed in accordance with the requirements of accounting for stock-based compensation. In addition, all directors are reimbursed for reasonable out-of-pocket expenses incurred by them in connection with attending Board of Directors, committee and stockholder meetings, or other Company related business, including reasonable out-of-pocket expenses for travel, meals and lodging. We reserve the right to change the manner and amount of compensation to our non-employee directors at any time.
Directors who are also employees of the Company did not receive any compensation for their service as directors while employed by the Company during the year ended December 31, 2019, except that Mr. Manning receives $1 compensation for his service as a director. The Company also makes a contribution to the Health/Retirement/Savings Account and pays for tax compliance services on his behalf.
The following table sets forth information concerning non-employee director compensation during the year ended December 31, 2019. Refer to the "Summary Compensation Table" above for compensation earned by Mr. Goldberg in fiscal 2019.
53
Name | Fees Earned or Paid in Cash ($) | Stock Awards ($) (1) | All other compensation | Total ($) | |||||||||
Joel Domino | 95,000 | 120,062 | — | 215,062 | |||||||||
Edward George | 95,000 | 120,062 | — | 215,062 | |||||||||
Barbara Goodstein | 100,000 | 120,062 | — | 220,062 | |||||||||
Robert Kopech | 60,700 | — | — | 60,700 | |||||||||
William Manning | 1 | — | 30,475 | (2 | ) | 30,476 | |||||||
Kenneth A. Marvald | 95,000 | 120,062 | — | 215,062 | |||||||||
Edward J. Pettinella | 110,000 | 120,062 | — | 230,062 | |||||||||
Geoffrey Rosenberger | 49,600 | 120,062 | — | 169,662 | |||||||||
(1) | Represents the grant date fair value computed in accordance with the requirements of accounting for stock-based compensation. The amounts reported in this column have been computed in accordance with FASB ASC Topic 718. For a discussion of assumptions used in the 2019 valuations, see Note 14 to the Consolidated Financial Statements, "Equity Based Compensation" which are incorporated by reference in Item 8 of Part II of this Form 10-K. |
(2) | In 2019, the Company paid $27,875 of tax compliance services on behalf of Mr. Manning and made a contribution of $2,600 to the Health/Retirement/Savings Account. |
Mr. Manning beneficially owns shares and other interests in M&N Group Holdings and Manning & Napier Capital Company, LLC ("MNCC"), and receives pro-rata distributions derived in part from the earnings of those companies in respect of his shares and other interests at the same time cash distributions are made on all shares or other interests in those companies. These distributions are not included in his compensation total above.
Item 12. Security Ownership of Certain Beneficial Owners and Management and Related Stockholder Matters
Equity Compensation Plan Information
The following table shows information as of December 31, 2019 about shares of our Class A common stock authorized for issuance under the Company's 2011 Equity Compensation Plan (the "Equity Plan").
Plan Category | Number of securities to be issued upon exercise of outstanding options, warrants and rights (#) | Weighted- average exercise price of outstanding options, warrants and rights ($) | Number of securities remaining available for future issuance under equity compensation plans (#) | |||||||
Equity compensation plans approved by security holders | 4,292,901 | (1) | $ | 2.01 | (2) | 6,093,377 | (3) | |||
Equity compensation plans not approved by security holders | 62,034,200 | (4) | $ | — | (5) | — | ||||
Total | 66,327,101 | $ | — | 6,093,377 | ||||||
__________________________
(1) | Represents shares of our Class A common stock issuable upon the vesting of restricted stock units ("RSUs") and the vesting and exercise of stock options granted under the Equity Plan. As of December 31, 2019, the Company had 792,901 outstanding RSUs and 3,500,000 outstanding options to purchase shares of Class A common stock. |
(2) | Represents weighted-average exercise price of outstanding stock options as of December 31, 2019. There is no exercise price associated with the RSUs outstanding at December 31, 2019. |
(3) | Represents equity interests available for future issuance under the Equity Plan as of December 31, 2019. |
(4) | Represents units of Manning & Napier Group which may be exchangeable for shares of our Class A common stock. For a description of material terms, see "Certain Relationships and Related Party Transactions—Related Party Transactions—Exchange Agreement" included in Item 13 of Part III of this Form 10-K. |
(5) | No additional consideration is payable in connection with the exchange of units of Manning & Napier Group for shares of our Class A common stock. |
54
Principal and Management Stockholders
The following table sets forth information regarding the beneficial ownership of our capital stock as of March 9, 2020 with respect to:
• | each person known to us to own beneficially more than 5% of any class of our outstanding shares; |
• | each of our named executive officers; |
• | each of our current directors; and |
• | all of our directors and executive officers as a group. |
The following table does not include shares of Class A common stock that may be issued to M&N Group Holdings and MNCC on behalf of Mr. Manning, as direct and indirect beneficial owner of M&N Group Holdings and direct beneficial owner of MNCC, pursuant to the terms of the exchange agreement with M&N Group Holdings, MNCC, and the other direct holders of units of Manning & Napier Group. The table below does not include any shares of Class A common stock that may be outstanding within 60 days after March 9, 2020 pursuant to the right of holders of Class A units of Manning & Napier Group to exchange those units for shares of Class A common stock because no final binding elections to tender units for exchange have been received by the Company as of March 9, 2020.
The information as to the number of shares beneficially owned by the individuals and entities listed below is derived from reports filed with the SEC by such persons and Company records. In accordance with the rules and regulations of the SEC, beneficial ownership includes voting or investment power with respect to securities and includes the shares issuable pursuant to stock options that are exercisable within 60 days of March 9, 2020. Shares issuable pursuant to stock options are deemed outstanding for computing the percentage of the person holding such options but are not outstanding for computing the percentage of any other person. To our knowledge, except as indicated in the footnotes to this table and pursuant to applicable community property laws, the persons named in the table have sole voting and investment power with respect to all shares of Class A common stock. For more information regarding our principal stockholders and the relationship they have with us, see “Certain Relationships and Related Party Transactions.” Unless otherwise indicated, the address for each stockholder listed below is c/o Manning & Napier, Inc., 290 Woodcliff Drive, Fairport, New York 14450.
Class A common stock (1) | ||||||
Beneficial Owner | Number of Shares Beneficially Owned (#) (2) | Percent of Shares Beneficially Owned (%) (2) | ||||
Executive Officers and Directors | ||||||
Marc Mayer (3) | 453,113 | 2.8 | % | |||
Jeffrey S. Coons | 21,275 | * | ||||
Charles H. Stamey | 48,660 | * | ||||
Richard S. Goldberg | 145,137 | * | ||||
Ebrahim Busheri | 97,840 | * | ||||
Aaron McGreevy | 50,364 | * | ||||
Thomas Anderson | — | — | ||||
William Manning | 13,000 | * | ||||
Joel Domino | 113,378 | * | ||||
Edward George | 111,649 | * | ||||
Barbara Goodstein | 164,411 | 1.0 | % | |||
Robert Kopech | 29,031 | * | ||||
Kenneth A. Marvald | 117,529 | * | ||||
Edward J. Pettinella | 525,881 | 3.2 | % | |||
All executive officers and directors as a group (19 persons) | 1,962,863 | 12.1 | % | |||
5% Stockholders | ||||||
RMB Capital Holdings, LLC (4) | 1,460,120 | 9.0 | % | |||
Renaissance Technologies LLC (5) | 1,218,699 | 7.5 | % | |||
The Vanguard Group (6) | 912,966 | 5.6 | % | |||
55
* | Less than 1%. |
(1) | Each share of our Class A common stock is entitled to one vote per share. |
(2) | As of March 9, 2020, there were 16,269,857 shares of our Class A common stock outstanding. The percentage of beneficial ownership as to any person as of that date is calculated by dividing the number of shares beneficially owned by the person, which includes the number of shares as to which the person has the right to acquire voting or investment power as of or within 60 days of such date, by the sum of the number of shares outstanding as of the date plus the number of shares as to which the person as the right to acquire voting or investment power as of or within 60 days of such date. Consequently, the denominator for calculating beneficial ownership percentages may be different for each beneficial owner. |
(3) | Number of shares beneficially owned includes 166,666 presently exercisable stock options. |
(4) | Information obtained from a Schedule 13G/A filed with the SEC on February 14, 2020 by RMB Capital Holdings, LLC, RMB Capital Management, LLC, RMB Mendon Managers, LLC and Mendon Capital Advisors Corp.,115 S. LaSalle Street, 34th Floor, Chicago, IL 60603. According to the Schedule 13G/A: (i) RMB Capital Holdings, LLC beneficially owns and has shared voting and dispositive power over 1,460,120 shares of our Class A common stock, and sole voting and dispositive power over zero shares of our Class A common stock, (ii) RMB Capital Management, LLC beneficially owns and has shared voting and dispositive power over 1,460,120 shares of our Class A common stock, and sole voting and dispositive power over zero shares of our Class A common stock, (iii) RMB Mendon Managers, LLC beneficially owns and has shared voting and dispositive power over 606,242 shares of our Class A common stock, and sole voting and dispositive power over zero shares of our Class A common stock, and (iv) Mendon Capital Advisors Corp. beneficially owns and has shared voting and dispositive power over 853,878 shares of our Class A common stock, and sole voting and dispositive power over zero shares of our Class A common stock. |
(5) | Information obtained from a Schedule 13G/A filed with the SEC on February 13, 2020 by Renaissance Technologies LLC and Renaissance Technologies Holdings Corporation, 800 Third Avenue, New York, NY 10022. According to the Schedule 13G/A, Renaissance Technologies LLC and Renaissance Technologies Holdings Corporation beneficially own and has sole voting and dispositive power over 1,218,699 shares of our Class A common stock, and shared voting and dispositive power over zero shares of our Class A common stock. |
(6) | Information obtained from a Schedule 13G filed with the SEC on February 11, 2020 by The Vanguard Group, 100 Vanguard Blvd., Malvern, PA 19355. According to the Schedule 13G, The Vanguard Group, beneficially owns 912,966 shares of our Class Stock, has sole dispositive power over 908,704 shares of our Class A common stock, has sole voting and shared dispositive power of 4,262 shares of our Class A common stock, and shared voting power of zero shares of our Class A common stock. |
Item 13. Certain Relationships and Related Transactions, and Director Independence
Director Independence
Our Board of Directors has determined that Ms. Goodstein and Messrs. George, Marvald, Pettinella and Kopech are each considered to be “independent directors” within the meaning of the NYSE’s listing standards and under applicable law. The Company does not have separate criteria for determining independence different from the NYSE listing standards.
Our Board of Directors reviews periodically the relationships that each director has with the Company (either directly or as a partner, stockholder or officer of an organization that has a relationship with the Company). Those directors the Board of Directors affirmatively determines have no material relationship with the Company (either directly or as a partner, stockholder or officer of an organization that has a relationship with the Company) as specified in the listing standards of the NYSE will be considered independent.
CERTAIN RELATIONSHIPS AND RELATED PARTY TRANSACTIONS
Policies and Procedures Regarding Transactions with Related Persons
In November 2011, our Board of Directors adopted a written policy, Transactions with Related Persons Policies and Procedures, pursuant to which, as a general matter, our Audit Committee is required to review and approve or disapprove of the Company entering into certain transactions with related persons. The policy contains descriptions of certain transactions which are pre-approved transactions. The policy only applies to transactions, arrangements and relationships where the aggregate amount involved could reasonably be expected to exceed $120,000 in any calendar year and in which a related person has a direct or indirect interest. A related person is: (1) any of our directors, nominees for director or executive officers, (2) any immediate family member of any of our directors, nominees for director or executive officers, and (3) any person, and his or her immediate family members, or entity, including affiliates, that was a beneficial owner of 5% or more of any of our outstanding equity securities at the time the transaction occurred or existed.
56
The policy provides that if advance approval of a transaction subject to the policy is not obtained, it must be promptly submitted to the Audit Committee for possible ratification, approval, amendment, termination or rescission. In reviewing any transaction, the Audit Committee will take into account, among other factors the Audit Committee deems appropriate, recommendations from senior management, whether the transaction is on terms no less favorable than terms generally available to a third party in similar circumstances and the extent of the related person’s interest in the transaction. Any related person transaction must be conducted at arm's length. Any member of the Audit Committee who is a related person with respect to a transaction under review may not participate in the deliberations or vote on the approval or ratification of the transaction. However, such a director may be counted in determining the presence of a quorum at a meeting of the Audit Committee that considers the transaction.
A copy of our Transactions with Related Persons Policies and Procedures is available on our website, www.manning-napier.com, under "Investor Relations—Governance" and is available to any stockholder in writing upon request to the Company.
Related Party Transactions
The following is a summary of material provisions of various transactions we entered into or that were ongoing with our executive officers, directors or 5% or greater stockholders during the years ended December 31, 2019 and 2018.
Aircraft
From time to time, the Company reimburses Mr. Manning for business travel in connection with the use of a private plane owned by Mr. Manning. The Company owns no direct or indirect interest in such private plane, and the Company has not provided any financing to Mr. Manning for such plane. In the event Mr. Manning, or other executive officers, use Mr. Manning's plane in connection with the business of the Company, the Company reimburses Mr. Manning based upon the amount of flight time per trip, which is a fraction of the total cost of the ownership and maintenance of his plane. The total amount of reimbursement with respect to each particular use of the plane for each of the years ended December 31, 2019 and 2018 was less than $0.1 million.
Transactions with non-controlling members
From time to time, the Company may be asked to provide certain services, including accounting, legal and other administrative functions for the noncontrolling members of Manning & Napier Group. While immaterial, the Company has not received any reimbursement for such services.
The Company manages the personal funds and funds of affiliated entities of certain of the Company's executive officers and directors. Pursuant to the respective investment management agreements, in some instances the Company waives or reduces its regular advisory fees for these accounts. The aggregate value of the fees earned and fees waived was less than $0.1 million for the years ended December 31, 2019 and 2018.
Sale of Subsidiary
On August 30, 2019, the Company, through Manning & Napier Group, completed the sale of all of the equity interests in its wholly-owned subsidiary, Perspective Partners, LLC ("PPI") to Manning Partners, LLC, which is wholly-owned by the Chairman of the Company's Board of Directors. The Company received cash proceeds of $3.1 million upon closing. Subsequent to the close, PPI and the Company have entered into a sublease agreement under which PPI leases office space within the Company's headquarters for annual rent of approximately $0.1 million over the term of the sublease, which expires on January 31, 2028.
Affiliated mutual fund and collective investment trust transactions
The Company earns investment advisory fees, distribution and administrative service fees under agreements with affiliated mutual funds and collective investment trusts. Fees earned for advisory and distribution services provided were approximately $40.5 million and $54.6 million in the years ended December 31, 2019 and 2018, respectively. Fees earned for administrative services provided were approximately $2.2 million for each of the years ended December 31, 2019 and 2018.
The Company incurs certain expenses on behalf of the collective investment trusts and has contractually agreed to limit its fees and reimburse expenses to limit operating expenses incurred by certain affiliated fund series. The aggregate value of fees waived and expenses reimbursed to, or incurred for, affiliated mutual funds and collective investment trusts was approximately $5.5 million and $5.1 million for the years ended December 31, 2019 and 2018, respectively. As of December 31, 2019, the Company has recorded a receivable of approximately $0.2 million for expenses paid on behalf of an affiliated mutual fund. These expenses are reimbursable to the Company under an agreement with the affiliated mutual fund, and are included within other long-term assets on the consolidated statements of financial condition.
Exchange Agreement
57
In November 2011, we entered into an exchange agreement with M&N Group Holdings, MNCC and the other direct holders of units of Manning & Napier Group. Subject to certain restrictions set forth therein, certain of our employee-owners, and M&N Group Holdings and MNCC on behalf of Mr. Manning and our other employee-members that are direct or indirect members of M&N Group Holdings and MNCC, are entitled to exchange such units for an aggregate of up to 62,034,200 shares of our Class A common stock as of March 9, 2020, subject to customary adjustments. In addition, the holders of any units of Manning & Napier Group thereafter issued will also become parties to the exchange agreement and, pursuant to the terms of the exchange agreement, we may also purchase or exchange such units for shares of our Class A common stock. For any units of Manning & Napier Group exchanged, the Company will (1) pay an amount of cash equal to the number of units exchanged multiplied by the value of one share of the Company's Class A common stock less a market discount and expected expense, or, at the Company's election, (2) issue shares of the Company's Class A common stock on a one-for-one basis, subject, in each case, to customary adjustments.
On May 2, 2019 the direct holders of units of Manning & Napier Group exchanged an aggregate of 1,315,521 Class A units of Manning & Napier Group for approximately $3.1 million paid to holders, of which approximately $0.2 million was paid to each of Dr. Coons and Mr. Stamey, our former chief executive officers.
On March 30, 2018 the direct holders of units of Manning & Napier Group exchanged an aggregate of 581,344 Class A units of Manning & Napier Group for approximately $1.9 million paid to holders, none of whom are related persons.
The exchange agreement described above is filed as an exhibit to our 2011 Annual Report on Form 10-K, and the foregoing description is qualified by reference thereto.
Registration Rights Agreement
In November 2011, we entered into a registration rights agreement with the holders of units of Manning & Napier Group, pursuant to which the shares of Class A common stock issued upon exchanges of their units, if any, will be eligible for resale, subject to certain limitations set forth therein.
We have agreed in the registration rights agreement to indemnify the participating holders, solely in their capacity as selling stockholders, against any losses or damages resulting from or relating to any untrue statement, or omission, of any material fact contained in any registration statement, prospectus or any amendments or supplements thereto pursuant to which they may sell the shares of our Class A common stock that they receive upon exchange of their units, except to the extent such liability arose from information furnished by the selling stockholder used in a shelf registration statement, and the participating holders have agreed to indemnify us against all losses caused by their misstatements or omissions of a material fact relating to them. No selling stockholder shall be liable to the Company for an amount in excess of the amount received by such selling stockholder in the offering giving rise to such liability.
We will pay all expenses incident to our performance of, or compliance with, any registration or marketing of securities pursuant to the registration rights agreement. The selling stockholders will pay their respective portions of all underwriting discounts, commissions and transfer taxes relating to the sale of their shares of our Class A common stock pursuant to the registration rights agreement.
The registration rights agreement described above is filed as an exhibit to our 2011 Annual Report on Form 10-K, and the foregoing description is qualified by reference thereto.
Tax Receivable Agreement
In November 2011, we entered into a tax receivable agreement with the other holders of units of Manning & Napier Group, pursuant to which we are required to pay to the holders of such units 85% of the applicable cash savings, if any, in U.S. federal, state, local and foreign income tax that we actually realize, or are deemed to realize in certain circumstances, as a result of any step-up in tax basis in Manning & Napier Group’s assets resulting from (i) certain tax attributes of their units sold to us or exchanged (for shares of Class A common stock) and that are created as a result of the sales or exchanges and payments under the tax receivable agreement and (ii) tax benefits related to imputed interest. Payments pursuant to the tax receivable agreement totaled approximately $0.7 million during the year ended December 31, 2019, of which approximately $0.4 million was paid to Mr. Manning. The remaining approximately $0.3 million was paid to the other holders, none of whom are related persons. Payments pursuant to the tax receivable agreement totaled approximately $2.5 million during the year ended December 31, 2018, of which approximately $1.2 million was paid to Mr. Manning. The remaining approximately $1.3 million was paid to the other holders, none of whom are related persons. Payments pursuant to the tax receivable agreement to Dr. Coons and Messrs. Stamey and Goldberg were less than $120,000 to each individual in each of the years ended December 31, 2019 and 2018.
The tax receivable agreement described above is filed as an exhibit to our 2011 Annual Report on Form 10-K, and the foregoing description is qualified by reference thereto.
58
Item 14. Principal Accounting Fees and Services
Fees Paid to Independent Registered Public Accounting Firm
The following table sets forth the aggregate fees for professional services rendered by the Company’s independent registered public accounting firm, PricewaterhouseCoopers, LLP ("PwC"), in each of the last two years.
Year Ended December 31, | ||||||||
Fee Category | 2019 | 2018 | ||||||
Audit Fees (1) | $ | 1,127,100 | $ | 1,189,164 | ||||
Audit-Related Fees (2) | 2,200 | 2,200 | ||||||
Tax Fees | — | — | ||||||
All Other Fees (3) | 1,077,950 | 2,700 | ||||||
Total Fees (4) | $ | 2,207,250 | $ | 1,194,064 | ||||
(1) | Audit fees consist of fees and expenses for professional services provided in connection with the annual audit of our consolidated financial statements, services that an independent registered public accounting firm would customarily provide in connection with subsidiary audits, and the annual audits of the financial statements of the Exeter Trust Company collective investment trusts. |
(2) | Audit-related fees consist of fees for the performance of audits and attest services not required by statute or regulations. |
(3) | In 2019, as part of the Company's initiative to advance its digital transformation, PwC assisted the Company in its digital capability assessment, including defining its operational model and associated technology platform, and assistance with third-party vendor reviews. Fees, including expenses, in 2019 for this were $1,075,250. In 2019 and 2018, All Other Fees also consist of procurement of an on-line accounting research tool and financial statement disclosure checklist offered by PwC to its clients. |
(4) | PwC also provides audit and tax services to the mutual funds we manage. Fees for these services were approximately $816,800 and $902,618 for audit fees in 2019 and 2018, respectively, and $433,610 and $272,853 for tax services in 2019 and 2018, respectively. The tax services provided consisted primarily of tax compliance and related services for the mutual funds. The fees for these services are not included in this table as they were not provided to us or our consolidated subsidiaries. |
The Audit Committee believes that the foregoing expenditures are compatible with maintaining the independence of the Company’s registered public accounting firm. The Audit Committee will annually review and pre-approve the audit and non-audit services to be provided during the next audit cycle by the independent registered public accounting firm. The Audit Committee may also designate a member of management to monitor the performance of all services provided by the independent registered public accounting firm and report his or her findings to the Audit Committee.
59
PART IV
Item 15. Exhibits and Financial Statement Schedules.
(a) | The following documents are filed as part of this Annual Report on Form 10-K: |
(1) | Financial Statements |
(i) | Consolidated Statements of Financial Condition as of December 31, 2019 and 2018 |
(ii) | Consolidated Statements of Operations for the years ended December 31, 2019 and 2018 |
(iii) | Consolidated Statements of Comprehensive Income for the years ended December 31, 2019 and 2018 |
(iv) | Consolidated Statements of Shareholders’ Equity for the years ended December 31, 2019 and 2018 |
(v) | Consolidated Statements of Cash Flows for the years ended December 31, 2019 and 2018 |
(vi) | Notes to Consolidated Financial Statements |
(2) | Financial Statement Schedules |
There are no Financial Statement Schedules filed as part of this Annual Report on 10-K, as the required information is included in our consolidated financial statements and in the notes thereto.
(b) | Exhibit Index: |
Exhibit No. | Description | |
3.1 | ||
3.2 | ||
4.1 | ||
4.2 | ||
10.1 | ||
10.2 | ||
10.3 | ||
10.4 | ||
10.5 | ||
10.6* | ||
10.7* | ||
60
10.8* | ||
10.9* | ||
10.10* | ||
10.11* | ||
10.12* | ||
10.13 | ||
10.14 | ||
10.15 | ||
10.16* | ||
10.17* | ||
10.18* | ||
10.19* | ||
10.20* | ||
10.21* | ||
10.22 | ||
10.23 | ||
10.24 | ||
61
10.25 | ||
10.26 | ||
10.27 | ||
10.28 | ||
10.29 | ||
10.30 | ||
10.31 | ||
10.32 | ||
10.33 | ||
10.34 | ||
10.35 | ||
10.36 | ||
10.37 | ||
21.1 | ||
23.1 | ||
31.1 | ||
31.2 | ||
32.1 | ||
32.2 | ||
62
101 | Materials from the Manning & Napier, Inc. Annual Report on Form 10-K for the year ended December 31, 2019, formatted in Extensible Business Reporting Language (XBRL); (i) Consolidated Statements of Financial Condition, (ii) Consolidated Statements of Operations, (iii) Consolidated Statements of Comprehensive Income, (iv) Consolidated Statements of Shareholders' Equity, (v) Consolidated Statements of Cash Flows, and (iv) related Notes to Consolidated Financial Statements. | |
__________________________
* Management contract or compensatory plan or arrangement
Item 16. Form 10-K Summary.
None.
63
SIGNATURES
Pursuant to the requirements of Section 13 or 15(d) of the Securities Exchange Act of 1934, the registrant has duly caused this report to be signed on its behalf by the undersigned, thereunto duly authorized.
Dated: March 13, 2020
MANNING & NAPIER, INC. | |||
By: | /s/ Marc Mayer | ||
Name: | Marc Mayer | ||
Title: | Chief Executive Officer (principal executive officer) | ||
Pursuant to the requirements of the Securities Exchange Act of 1934, this report has been signed below by the following persons on behalf of the registrant and in the capacities and on the dates indicated below.
Signature | Capacity | Date | ||
/s/ Marc Mayer | Chief Executive Officer | March 13, 2020 | ||
Marc Mayer | (principal executive officer) | |||
/s/ Paul J. Battaglia | Chief Financial Officer | March 13, 2020 | ||
Paul J. Battaglia | (principal financial and accounting officer) | |||
/s/ William Manning | Chairman of the Board of Directors | March 13, 2020 | ||
William Manning | ||||
/s/ Joel Domino | Director | March 13, 2020 | ||
Joel Domino | ||||
/s/ Edward George | Director | March 13, 2020 | ||
Edward George | ||||
/s/ Richard Goldberg | Director | March 13, 2020 | ||
Richard Goldberg | ||||
/s/ Barbara Goodstein | Director | March 13, 2020 | ||
Barbara Goodstein | ||||
/s/ Robert Kopech | Director | March 13, 2020 | ||
Robert Kopech | ||||
/s/ Kenneth Marvald | Director | March 13, 2020 | ||
Kenneth Marvald | ||||
/s/ Edward J. Pettinella | Director | March 13, 2020 | ||
Edward J. Pettinella | ||||
64
INDEX TO CONSOLIDATED FINANCIAL STATEMENTS
Manning & Napier, Inc. | |
F-1
Report of Independent Registered Public Accounting Firm
To the Board of Directors and Shareholders of Manning & Napier, Inc.
Opinion on the Financial Statements
We have audited the accompanying consolidated statements of financial condition of Manning & Napier, Inc. and its subsidiaries (the “Company”) as of December 31, 2019 and 2018, and the related consolidated statements of operations, of comprehensive income, of shareholders' equity and of cash flows for the years then ended, including the related notes (collectively referred to as the “consolidated financial statements”). In our opinion, the consolidated financial statements present fairly, in all material respects, the financial position of the Company as of December 31, 2019 and 2018, and the results of its operations and its cash flows for the years then ended in conformity with accounting principles generally accepted in the United States of America.
Basis for Opinion
These consolidated financial statements are the responsibility of the Company’s management. Our responsibility is to express an opinion on the Company’s consolidated financial statements based on our audits. We are a public accounting firm registered with the Public Company Accounting Oversight Board (United States) (PCAOB) and are required to be independent with respect to the Company in accordance with the U.S. federal securities laws and the applicable rules and regulations of the Securities and Exchange Commission and the PCAOB.
We conducted our audits of these consolidated financial statements in accordance with the standards of the PCAOB. Those standards require that we plan and perform the audits to obtain reasonable assurance about whether the consolidated financial statements are free of material misstatement, whether due to error or fraud. The Company is not required to have, nor were we engaged to perform, an audit of its internal control over financial reporting. As part of our audits we are required to obtain an understanding of internal control over financial reporting but not for the purpose of expressing an opinion on the effectiveness of the Company's internal control over financial reporting. Accordingly, we express no such opinion.
Our audits included performing procedures to assess the risks of material misstatement of the consolidated financial statements, whether due to error or fraud, and performing procedures that respond to those risks. Such procedures included examining, on a test basis, evidence regarding the amounts and disclosures in the consolidated financial statements. Our audits also included evaluating the accounting principles used and significant estimates made by management, as well as evaluating the overall presentation of the consolidated financial statements. We believe that our audits provide a reasonable basis for our opinion.
/s/ PricewaterhouseCoopers LLP
Rochester, New York
March 13, 2020
We have served as the Company’s auditor since 2007, which includes periods before the Company became subject to SEC reporting requirements.
F-2
Manning & Napier, Inc.
Consolidated Statements of Financial Condition
(In thousands, except share data)
December 31, | |||||||
2019 | 2018 | ||||||
Assets | |||||||
Cash and cash equivalents | $ | 67,088 | $ | 59,586 | |||
Accounts receivable | 10,182 | 11,447 | |||||
Investment securities | 90,467 | 91,190 | |||||
Prepaid expenses and other assets | 5,607 | 5,221 | |||||
Total current assets | 173,344 | 167,444 | |||||
Property and equipment, net | 4,565 | 5,649 | |||||
Operating lease right-of-use assets | 18,795 | — | |||||
Net deferred tax assets, non-current | 20,668 | 20,795 | |||||
Goodwill | 4,829 | 4,829 | |||||
Other long-term assets | 4,010 | 3,842 | |||||
Total assets | $ | 226,211 | $ | 202,559 | |||
Liabilities | |||||||
Accounts payable | $ | 1,614 | $ | 1,845 | |||
Accrued expenses and other liabilities | 26,201 | 25,126 | |||||
Deferred revenue | 10,759 | 9,305 | |||||
Total current liabilities | 38,574 | 36,276 | |||||
Operating lease liabilities, non-current | 18,753 | — | |||||
Other long-term liabilities | 2,017 | 2,691 | |||||
Amounts payable under tax receivable agreement, non-current | 17,246 | 17,349 | |||||
Total liabilities | 76,590 | 56,316 | |||||
Commitments and contingencies (Note 11) | |||||||
Shareholders’ equity | |||||||
Class A common stock, $0.01 par value; 300,000,000 shares authorized, 15,956,526 and 15,310,958 issued and outstanding at December 31, 2019 and December 31, 2018, respectively | $ | 160 | $ | 153 | |||
Additional paid-in capital | 198,516 | 198,604 | |||||
Retained deficit | (38,478 | ) | (38,865 | ) | |||
Accumulated other comprehensive income | (50 | ) | (77 | ) | |||
Total shareholders’ equity | 160,148 | 159,815 | |||||
Noncontrolling interests | (10,527 | ) | (13,572 | ) | |||
Total shareholders’ equity and noncontrolling interests | 149,621 | 146,243 | |||||
Total liabilities, shareholders’ equity and noncontrolling interests | $ | 226,211 | $ | 202,559 | |||
The accompanying notes are an integral part of these consolidated financial statements.
F-3
Manning & Napier, Inc.
Consolidated Statements of Operations
(In thousands, except share data)
Year Ended December 31, | |||||||
2019 | 2018 | ||||||
Revenues | |||||||
Management Fees | |||||||
Separately managed accounts | $ | 86,289 | $ | 97,123 | |||
Mutual funds and collective investment trusts | 29,344 | 41,462 | |||||
Distribution and shareholder servicing | 10,227 | 12,089 | |||||
Custodial services | 6,864 | 7,591 | |||||
Other revenue | 3,277 | 3,066 | |||||
Total revenue | 136,001 | 161,331 | |||||
Expenses | |||||||
Compensation and related costs | 80,967 | 87,408 | |||||
Distribution, servicing and custody expenses | 12,568 | 18,175 | |||||
Other operating costs | 39,758 | 32,366 | |||||
Total operating expenses | 133,293 | 137,949 | |||||
Operating income | 2,708 | 23,382 | |||||
Non-operating income (loss) | |||||||
Interest expense | (26 | ) | (49 | ) | |||
Interest and dividend income | 3,262 | 2,408 | |||||
Change in liability under tax receivable agreement | (199 | ) | 1,341 | ||||
Net gains (losses) on investments | 1,677 | (1,450 | ) | ||||
Gain on sale of business | 2,883 | — | |||||
Total non-operating income (loss) | 7,597 | 2,250 | |||||
Income before provision for income taxes | 10,305 | 25,632 | |||||
Provision for income taxes | 448 | 2,647 | |||||
Net income attributable to controlling and noncontrolling interests | 9,857 | 22,985 | |||||
Less: net income attributable to noncontrolling interests | 8,424 | 19,788 | |||||
Net income attributable to Manning & Napier, Inc. | $ | 1,433 | $ | 3,197 | |||
Net income per share available to Class A common stock | |||||||
Basic | $ | 0.10 | $ | 0.21 | |||
Diluted | $ | 0.09 | $ | 0.21 | |||
Weighted average shares of Class A common stock outstanding | |||||||
Basic | 15,216,707 | 14,623,198 | |||||
Diluted | 77,973,919 | 14,630,170 | |||||
The accompanying notes are an integral part of these consolidated financial statements.
F-4
Manning & Napier, Inc.
Consolidated Statements of Comprehensive Income
(In thousands)
Year Ended December 31, | ||||||||
2019 | 2018 | |||||||
Net income attributable to controlling and noncontrolling interests | $ | 9,857 | $ | 22,985 | ||||
Net unrealized holding gains (losses) on investment securities, net of tax | 142 | 51 | ||||||
Reclassification adjustment for realized (gains) losses on investment securities included in net income | (23 | ) | 42 | |||||
Comprehensive income | 9,976 | 23,078 | ||||||
Less: Comprehensive income attributable to noncontrolling interest | 8,516 | 19,872 | ||||||
Comprehensive income attributable to Manning & Napier, Inc. | $ | 1,460 | $ | 3,206 | ||||
The accompanying notes are an integral part of these consolidated financial statements.
F-5
Manning & Napier, Inc. Consolidated Statements of Shareholders’ Equity (In thousands, except share data) | ||||||||||||||||||||||||||
Common Stock- Class A | Additional Paid-In Capital | Accumulated Other Comprehensive Income (Loss) | Non Controlling Interests | |||||||||||||||||||||||
Shares | Amount | Retained Deficit | Total | |||||||||||||||||||||||
Balance—January 1, 2018 | 15,039,347 | $ | 150 | $ | 198,641 | $ | (38,424 | ) | $ | (86 | ) | $ | (21,921 | ) | $ | 138,360 | ||||||||||
Net income | — | — | — | 3,197 | — | 19,788 | 22,985 | |||||||||||||||||||
Distributions to noncontrolling interests | — | — | — | — | — | (13,089 | ) | (13,089 | ) | |||||||||||||||||
Net changes in unrealized investment securities gains or losses | — | — | — | — | 9 | 42 | 51 | |||||||||||||||||||
Common stock issued under equity compensation plan, net of forfeitures | 271,611 | 3 | (3 | ) | — | — | — | — | ||||||||||||||||||
Equity-based compensation | — | — | 413 | — | — | 1,855 | 2,268 | |||||||||||||||||||
Dividends declared on Class A common stock - $0.26 per share | — | — | — | (3,904 | ) | — | — | (3,904 | ) | |||||||||||||||||
Cumulative effect of change in accounting principle, net of taxes | — | — | — | 266 | — | 1,224 | 1,490 | |||||||||||||||||||
Impact of changes in ownership of Manning & Napier Group, LLC | — | — | (447 | ) | — | — | (1,471 | ) | (1,918 | ) | ||||||||||||||||
Balance—December 31, 2018 | 15,310,958 | $ | 153 | $ | 198,604 | $ | (38,865 | ) | $ | (77 | ) | $ | (13,572 | ) | $ | 146,243 | ||||||||||
Net income | — | — | — | 1,433 | — | 8,424 | 9,857 | |||||||||||||||||||
Distributions to noncontrolling interests | — | — | — | — | — | (5,854 | ) | (5,854 | ) | |||||||||||||||||
Net changes in unrealized investment securities gains or losses | — | — | — | — | 27 | 115 | 142 | |||||||||||||||||||
Common stock issued under equity compensation plan, net of forfeitures | 645,568 | 7 | (7 | ) | — | — | — | — | ||||||||||||||||||
Shares withheld to satisfy tax withholding requirements related to restricted stock units vested | — | — | (66 | ) | — | — | (284 | ) | (350 | ) | ||||||||||||||||
Equity-based compensation | — | — | 696 | — | — | 2,984 | 3,680 | |||||||||||||||||||
Dividends declared on Class A common stock - $0.08 per share | — | — | — | (1,122 | ) | — | — | (1,122 | ) | |||||||||||||||||
Cumulative effect of change in accounting principle, net of taxes (Note 10) | — | — | — | 76 | — | — | 76 | |||||||||||||||||||
Impact of changes in ownership of Manning & Napier Group, LLC (Note 4) | — | — | (711 | ) | — | — | (2,340 | ) | (3,051 | ) | ||||||||||||||||
Balance—December 31, 2019 | 15,956,526 | $ | 160 | $ | 198,516 | $ | (38,478 | ) | $ | (50 | ) | $ | (10,527 | ) | $ | 149,621 | ||||||||||
The accompanying notes are an integral part of these consolidated financial statements.
F-6
Manning & Napier, Inc. Consolidated Statements of Cash Flows (In thousands) | |||||||
Year Ended December 31, | |||||||
2019 | 2018 | ||||||
Cash flows from operating activities: | |||||||
Net income attributable to controlling and noncontrolling interests | $ | 9,857 | $ | 22,985 | |||
Adjustments to reconcile net income to net cash provided by operating activities: | |||||||
Equity-based compensation | 3,680 | 2,268 | |||||
Depreciation and amortization | 3,763 | 1,719 | |||||
Change in amounts payable under tax receivable agreement | 199 | (1,341 | ) | ||||
Gain on sale of intangible assets | (194 | ) | (2,626 | ) | |||
Gain on sale of business | (2,883 | ) | — | ||||
Net (gains) losses on investment securities | (1,677 | ) | 1,450 | ||||
Deferred income taxes | 203 | 2,431 | |||||
(Increase) decrease in operating assets and increase (decrease) in operating liabilities: | |||||||
Accounts receivable | 1,253 | 3,890 | |||||
Prepaid expenses and other assets | (408 | ) | 79 | ||||
Other long-term assets | 2,453 | 15 | |||||
Accounts payable | (231 | ) | 233 | ||||
Accrued expenses and other liabilities | (1,298 | ) | (6,582 | ) | |||
Deferred revenue | 1,455 | (908 | ) | ||||
Other long-term liabilities | (1,207 | ) | (775 | ) | |||
Net cash provided by operating activities | 14,965 | 22,838 | |||||
Cash flows from investing activities: | |||||||
Purchase of property and equipment | (2,461 | ) | (1,950 | ) | |||
Sale of investments | 13,165 | 6,857 | |||||
Purchase of investments | (119,001 | ) | (90,160 | ) | |||
Sale of intangible assets | 194 | 2,626 | |||||
Proceeds from sale of business, net | 2,902 | — | |||||
Proceeds from maturity of investments | 108,378 | 61,119 | |||||
Net cash provided by (used in) investing activities | 3,177 | (21,508 | ) | ||||
Cash flows from financing activities: | |||||||
Distributions to noncontrolling interests | (5,854 | ) | (13,089 | ) | |||
Dividends paid on Class A common stock | (1,244 | ) | (4,878 | ) | |||
Payment of shares withheld to satisfy withholding requirements | (350 | ) | — | ||||
Payment of capital lease obligations | (141 | ) | (121 | ) | |||
Purchase of Class A units of Manning & Napier Group, LLC | (3,051 | ) | (1,918 | ) | |||
Net cash used in financing activities | (10,640 | ) | (20,006 | ) | |||
Net increase (decrease) in cash and cash equivalents | 7,502 | (18,676 | ) | ||||
Cash and cash equivalents: | |||||||
Beginning of period | 59,586 | 78,262 | |||||
End of period | $ | 67,088 | $ | 59,586 | |||
F-7
Manning & Napier, Inc. Consolidated Statements of Cash Flows (In thousands) | |||||||
Year Ended December 31, | |||||||
2019 | 2018 | ||||||
Supplemental disclosures: | |||||||
Cash paid during the period for interest | $ | 26 | $ | 80 | |||
Cash payments during the period for taxes, net of refunds | $ | 238 | $ | (89 | ) | ||
Non-cash investing and financing activities: | |||||||
Capital expenditures in accounts payable and accruals | $ | 247 | $ | 266 | |||
Equipment acquired through capital lease obligation | $ | 175 | $ | 34 | |||
Accrued dividends | $ | 312 | $ | 306 | |||
The accompanying notes are an integral part of these consolidated financial statements.
F-8
Manning & Napier, Inc.
Notes to Consolidated Financial Statements
Note 1—Organization and Nature of the Business
Manning & Napier, Inc. is an independent registered investment advisor that provides clients with a broad range of financial solutions and investment strategies, including wealth management services. Founded in 1970, the Company offers U.S. and non-U.S. equity, fixed income and a range of blended asset portfolios, such as life cycle funds and actively-managed exchange-traded fund ("ETF")-based portfolios. Headquartered in Fairport, New York, the Company serves a diversified client base of high-net-worth individuals and institutions, including 401(k) plans, pension plans, Taft-Hartley plans, endowments and foundations.
The Company was incorporated in 2011 as a Delaware corporation, and is the sole managing member of Manning & Napier Group, LLC and its subsidiaries (“Manning & Napier Group”), a holding company for the investment management businesses conducted by its operating subsidiaries. The diagram below depicts the Company's organization structure as of December 31, 2019.

_____________________
(1) | The consolidated operating subsidiaries of Manning & Napier Group include Manning & Napier Advisors, LLC ("MNA"), Manning & Napier Information Services, LLC, Manning & Napier Investor Services, Inc., Exeter Trust Company and Rainier Investment Management, LLC ("Rainier"). |
Note 2—Summary of Significant Accounting Policies
Basis of Presentation
The accompanying consolidated financial statements were prepared in accordance with accounting principles generally accepted in the United States of America (“U.S. GAAP”) and related rules and regulations of the U.S. Securities and Exchange Commission (the "SEC").
The preparation of financial statements in conformity with U.S. GAAP requires management to make estimates or assumptions that affect the reported amounts and disclosures in the consolidated financial statements. Actual results could differ from these estimates or assumptions.
Gain of Sale of Business
On June 28, 2019, the Company, through Manning & Napier Group, entered into an agreement (the "Agreement") to sell all of the equity interests in its wholly-owned subsidiary, Perspective Partners, LLC ("PPI") to Manning Partners, LLC, which is wholly-owned by the Chairman of the Company's Board of Directors (Note 16). The purchase price is based on historical expenses of PPI from September 1, 2018 until the date of closing, and future revenue payments, as applicable.
F-9
Manning & Napier, Inc.
Notes to Consolidated Financial Statements (Continued)
The sale was completed on August 30, 2019. The Company received cash proceeds of $3.1 million, transferred net assets of $0.2 million and recorded a $2.9 million gain on the sale, which is included as "Gain on sale of business" on its consolidated statements of operations. The Company did not recognize an asset for the contingent consideration as of the closing date. Other than the cash proceeds received, the transaction did not have a material impact to its consolidated statements of financial condition. The sale did not represent a major strategic shift in the Company's business and did not qualify for discontinued operations reporting.
Principles of Consolidation
As of December 31, 2019, Manning & Napier holds an economic interest of approximately 19.2% in Manning & Napier Group, but as managing member controls all of the business and affairs of Manning & Napier Group. As a result, the Company consolidates the financial results of Manning & Napier Group and records a noncontrolling interest on its consolidated statements of financial condition with respect to the remaining economic interest in Manning & Napier Group held by M&N Group Holdings, LLC (“M&N Group Holdings”) and Manning & Napier Capital Company, LLC (“MNCC”).
All material intercompany transactions have been eliminated in consolidation.
In accordance with Accounting Standards Update ("ASU") 2015-02, Consolidation (Topic 810) – Amendments to the Consolidation Analysis, the determination of whether a company is required to consolidate an entity is based on, among other things, an entity’s purpose and design, a company’s ability to direct the activities of the entity that most significantly impact the entity’s economic performance, and whether a company is obligated to absorb losses or receive benefits that could potentially be significant to the entity. The standard also requires ongoing assessments of whether a company is the primary beneficiary of a variable interest entity (“VIE”). When utilizing the voting interest entity (“VOE”) model, controlling financial interest is generally defined as majority ownership of voting interests.
The Company provides seed capital to its investment teams to develop new products and services for its clients. The original seed investment may be held in a separately managed account, comprised solely of the Company's investments or within a mutual fund, where the Company's investments may represent all or only a portion of the total equity invested in the mutual fund. Pursuant to U.S. GAAP, the Company evaluates its investments in mutual funds on a regular basis and consolidates such mutual funds for which it holds a controlling financial interest. When no longer deemed to hold a controlling financial interest, the Company would deconsolidate the fund and classify the remaining investment as either an equity method investment or as trading securities, as applicable.
The Company serves as the investment adviser for Manning & Napier Fund, Inc. series of mutual funds (the “Fund”), Exeter Trust Company Collective Investment Trusts (“CIT”) and Rainier Multiple Investment Trust. The Fund, CIT and Rainier Multiple Investment Trust are legal entities, the business and affairs of which are managed by their respective boards of directors. As a result, each of these entities is a VOE. The Company holds, in limited cases, direct investments in a mutual fund (which are made on the same terms as are available to other investors) and consolidates each of these entities where it has a controlling financial interest or a majority voting interest. The Company's investments in the Fund amounted to approximately $3.2 million and $3.6 million at December 31, 2019 and 2018, respectively. As of December 31, 2019 and 2018, the Company did not have a controlling financial interest in any mutual fund.
Operating Segments
The Company operates in one segment, the investment management industry. The Company primarily provides investment management services to separately managed accounts, mutual funds and collective investment trust funds. Management assesses the financial performance of these vehicles on a combined basis.
Revenue
Investment Management: Investment management fees are computed as a percentage of assets under management ("AUM"). The Company's performance obligation is a series of services that form part of a single performance obligation satisfied over time.
Separately managed accounts are paid in advance, typically for a semi-annual or quarterly period, or in arrears, typically for a monthly or quarterly period. When investment management fees are paid in advance, the Company defers the revenue as a contract liability and recognizes it over the applicable period. When investment management fees are paid in arrears, the Company estimates revenue and records a contract asset (accrued accounts receivable) based on AUM as of the most recent month end date.
Mutual funds and collective investment trust investment management revenue is calculated and earned daily based on AUM. Revenue is presented net of cash rebates and fees waived pursuant to contractual expense limitations of the funds. The Company also has agreements with third parties who provide recordkeeping and administrative services for employee benefit plans participating in the collective investment trusts. The Company is acting as an agent on behalf of the employee benefit plan sponsors, therefore, investment management revenue is recorded net of fees paid to third party service providers.
F-10
Manning & Napier, Inc.
Notes to Consolidated Financial Statements (Continued)
Distribution and shareholder servicing: The Company receives distribution and servicing fees for providing services to its affiliated mutual funds. Revenue is computed and earned daily based on a percentage of AUM. The performance obligation is a series of services that form part of a single performance obligation satisfied over time. The Company has agreements with third parties who provide distribution and administrative services for its mutual funds. The agreements are evaluated to determine whether revenue should be reported gross or net of payments to third-party service providers. The Company controls the services provided and acts as a principal in the relationship. Therefore, distribution and shareholder servicing revenue is recorded gross of fees paid to third parties.
Custodial services: Custodial service fees are calculated as a percentage of the client’s market value with additional fees charged for certain transactions. For the safeguarding and administrative services that are subject to a percentage of market value fee, the Company's performance obligation is a series of services that form part of a single performance obligation satisfied over time. Revenue for transactions assigned a stand-alone selling price is recognized in the period which the transaction is executed. Custodial service fees are billed monthly in arrears. The Company has agreements with third parties who provide safeguarding, recordkeeping and administrative services for their clients. The Company controls the services provided and acts as a principal in the relationship. Therefore, custodial service revenue is recorded gross of fees paid to third parties.
Costs to Obtain a Contract
Incremental first year commissions directly associated with new separate account and collective investment trust contracts are capitalized and amortized on a straight-line basis over the estimated customer contract period of 7 years for separate accounts and 3 years for collective investment trust contracts. Refer to Note 3 for further discussion.
Cash and Cash Equivalents
The Company generally considers all highly liquid investments with original maturities of three months or less to be cash equivalents. Cash and cash equivalents are primarily held in operating accounts at major financial institutions and also in money market securities. Cash equivalents are stated at cost, which approximates market value due to the short-term maturity of these investments. The fair value of cash equivalents have been classified as Level 1 in accordance with the fair value hierarchy.
Investment Securities
Investment securities are classified as either equity investments, trading, equity method investments or available-for-sale and are carried at fair value. Fair value is determined based on quoted market prices in active markets for identical or similar instruments.
Investment securities classified as equity investments, at fair value consist of equity securities and investments in mutual funds for which the Company provides advisory services. Realized and unrealized gains and losses on equity investments, at fair value or trading investments, as applicable, are recorded in net gains (losses) on investments in the consolidated statements of operations. At December 31, 2019 and 2018, equity investments, at fair value consist of investments held by the Company for the purpose of providing initial cash seeding for product development purposes and investments to hedge economic exposure to market movements on its deferred compensation plan.
Investments classified as equity method investments represent seed investments in which the Company owns between 20-50% of the outstanding voting interests in the affiliated fund or when it is determined that the Company is able to exercise significant influence but not control over the investments. If the seed investment results in significant influence, but not control, the investment will be accounted for as an equity method investment. When using the equity method, the Company recognizes its share of the investee's net income or loss for the period which is recorded in net gains (losses) on investments in the consolidated statements of operations.
Investment securities classified as available-for-sale consist of U.S. Treasury notes, corporate bonds and other short-term investments. Unrealized gains and losses on available-for-sale securities are excluded from earnings and are reported, net of deferred income tax, as a separate component of accumulated other comprehensive income in stockholders’ equity until realized. The Company periodically reviews each individual security position that has an unrealized loss, or impairment, to determine if that impairment is other-than-temporary. If impairment is determined to be other-than-temporary, the carrying value of the security will be written down to fair value and the loss will be recognized in earnings. Realized gains and losses on sales of available-for-sale securities are computed on a specific identification basis and are recorded in net gains (losses) on investments in the consolidated statements of operations.
F-11
Manning & Napier, Inc.
Notes to Consolidated Financial Statements (Continued)
Accounts Receivable
Accounts receivable represents the Company's unconditional rights to consideration arising from its performance under separately managed account, mutual fund and collective investment trust, distribution and shareholder servicing and custodial contracts. The Company’s accounts receivable balances do not include any significant allowance for doubtful accounts nor has any significant bad debt expense attributable to accounts receivable been recorded for the years ended December 31, 2019 or 2018. Accounts receivable are stated at cost, which approximates market value due to the short-term collection of balances. The fair value of accounts receivable have been classified as Level 1 in accordance with the fair value hierarchy.
Property and Equipment
Property and equipment are recorded at cost, less accumulated depreciation. Property and equipment are depreciated on a straight-line basis over the applicable life of the asset class. Depreciation is calculated for computer software, office equipment, and furniture and fixtures using useful lives of 3, 5, and 7 years, respectively. Internal and external costs incurred in connection with developing or obtaining software for internal use are capitalized and amortized over the estimated useful lives of the software, which range from three to five years, beginning when the software project is complete and the application is put into production. Leasehold improvements are depreciated over the shorter of the estimated useful life of the asset or the remaining expected lease term. Gains or losses upon sale or other disposition of fixed assets, are included in the consolidated statements of operations.
Goodwill
Goodwill represents the excess cost over the fair value of the identifiable net assets of acquired companies. The Company attributes all goodwill to its single reporting unit. Goodwill is tested for impairment annually during the fourth quarter or more frequently if events or changes in circumstances indicate that the carrying value may not be recoverable. There were no facts or circumstances occurring during 2019 or 2018 suggesting possible impairment.
Intangible Assets
Amortizing identifiable intangible assets generally represent the cost of client relationships and trademarks acquired. In valuing these assets, the Company makes assumptions regarding useful lives and projected growth rates, and significant judgment is required. The Company periodically reviews its identifiable intangible assets for impairment as events or changes in circumstances indicate that the carrying amount of such assets may not be recoverable. If the carrying amounts of those assets exceed their respective fair values, additional impairment tests are performed to measure the amount of the impairment losses, if any.
Non-amortizing intangible assets generally represent the cost of mutual fund management contracts acquired. Non-amortizing intangible assets are tested for impairment in the fourth quarter of each fiscal year, or more frequently if events or circumstances indicate that the carrying value may not be recoverable, by comparing the fair values of the management contracts acquired to their carrying values. The Company establishes fair value for purposes of impairment test using the income approach. If the carrying value of a management contract acquired exceeds its fair value, an impairment loss is recognized equal to that excess.
Leases
The Company determines if an arrangement is a lease at inception. Operating leases are included in operating lease right-of-use ("ROU") assets, accrued expenses and other liabilities and operating lease liabilities, non-current on its consolidated statements of financial condition. Finance leases are included in other long-term assets, accrued expenses and other liabilities, and other long-term liabilities on its consolidated statements of financial condition.
ROU assets represent the Company's right to use an underlying asset for the lease term and lease liabilities represent the Company's obligation to make lease payments arising from the lease. Operating lease ROU assets and lease liabilities are recognized at commencement date based on the present value of lease payments over the lease term. As the Company's leases do not provide an implicit rate, the Company uses its incremental borrowing rate based on the information available at commencement date in determining the present value of lease payments. The incremental borrowing rate, for each identified lease, is the rate of interest that the Company would have to pay to borrow on a collateralized basis over a similar term. The operating lease ROU asset is reduced for any lease incentives. The Company's lease terms may include options to extend or terminate the lease when it is reasonably certain that it will exercise that option. Lease expense for lease payments is recognized on a straight-line basis over the lease term.
The Company has lease agreements with lease and non-lease components, which are combined for all classes of underlying assets.
F-12
Manning & Napier, Inc.
Notes to Consolidated Financial Statements (Continued)
Equity-Based Compensation
The Company measures the cost of employee services received in exchange for an award of equity instruments based on the grant-date fair value of the award. The Company recognizes this cost over the period during which an employee is required to provide service in exchange for the award, and accounts for forfeitures as they occur. See Note 14 for additional information on equity-based compensation.
Deferred Compensation
The Company issues deferred cash awards to certain employees which are linked in value to selected Manning & Napier series of mutual funds under its 2018 Long-Term Incentive Plan. The employees earn a return linked to the appreciation or depreciation based on these series of mutual funds. The Company currently hedges economically the exposure to market movements on its deferred compensation plan by holding investments in the Manning & Napier series of mutual funds on its balance sheet. The Company recognizes as compensation expense the value of the liability to employees, including the appreciation or depreciation of the liability, over the award's vesting period in proportion to the vested amount of the award. The Company immediately recognizes the full value of the related investment, and any subsequent appreciation or depreciation of the investment, in Net gains (losses) on investments in the consolidated statements of operations.
Income Taxes
The Company records a tax provision for the anticipated tax consequences of the reported results of operations. The provision for income taxes is computed using the asset and liability method, under which deferred tax assets and liabilities are recognized for the expected future tax consequences of temporary differences between the financial reporting and tax basis of assets and liabilities, and for operating losses and tax credit carryforwards. Deferred tax assets and liabilities are measured using the currently enacted tax rates that apply to taxable income in effect for the years in which those tax assets are expected to be realized or settled. The Company records a valuation allowance, if necessary, to reduce deferred tax assets to the amount that is believed more likely than not to be realized.
The Company recognizes tax benefits from uncertain tax positions only if it is more likely than not that the tax position will be sustained upon examination by the taxing authorities, based on the technical merits of the position. The tax benefits recognized in the financial statements from such positions are then measured based on the largest benefit that has a greater than 50% likelihood of being realized upon ultimate settlement.
Comprehensive Income (Loss)
Comprehensive income is a measure of income which includes net income (loss) and other comprehensive income (loss). Other comprehensive income (loss) consists of the change in unrealized gains and losses on available-for-sale investments. The changes in the balances of components comprising other comprehensive income (loss) are presented in the accompanying consolidated statements of comprehensive income for the years ended December 31, 2019 and 2018.
Loss Contingencies
The Company accrues for estimated costs, including legal costs related to existing lawsuits, claims and proceedings when it is probable that a liability has been incurred and the costs can be reasonably estimated. Potential loss contingencies and related accruals are reviewed at least quarterly and are adjusted to reflect the impact and status of settlements, rulings, advice of counsel and other information pertinent to a particular matter. Significant differences could exist between the actual cost required to investigate, litigate and/or settle a claim or the ultimate outcome of a suit and management’s estimate. These differences could have a material impact on the Company’s consolidated financial statements. No loss accruals were recorded as of December 31, 2019 and 2018.
Recent Accounting Pronouncements
In February 2016, the Financial Accounting Standards Board ("FASB") issued ASU 2016-02, Leases (Topic 842), which is intended to increase transparency and comparability among organizations by recognizing all lease transactions (with terms in excess of 12 months) on the balance sheet as a lease liability and a right-of-use asset (as defined). In July 2018, the FASB issued ASU 2018-11, Leases - Targeted Improvements, which provides an optional transition method related to implementing the new lease standard. The Company adopted the new standard on its effective date of January 1, 2019. Refer to Note 10 for further discussion regarding the impact of adoption.
In February 2018, the FASB issued ASU No. 2018-02, Income Statement - Reporting Comprehensive Income (Topic 220): Reclassification of Certain Tax Effects from Accumulated Other Comprehensive Income. The ASU requires a reclassification from accumulated other comprehensive income to retained earnings for stranded tax effects resulting from the newly enacted federal corporate income tax rate as a result of the Tax Cuts and Jobs Act. The amount of the reclassification is the difference between the historical corporate income tax rate and the newly enacted 21% corporate income tax rate. The ASU is effective for
F-13
Manning & Napier, Inc.
Notes to Consolidated Financial Statements (Continued)
fiscal years beginning after December 15, 2018, with early adoption permitted. The Company's adoption of ASU 2018-02 on January 1, 2019 did not have a material impact on its consolidated financial statements.
Recent Accounting Pronouncements Not Yet Adopted
In January 2017, the FASB issued ASU 2017-04, Intangibles - Goodwill and Other (Topic 350), Simplifying the Test for Goodwill Impairment, which simplifies the accounting for goodwill impairments by eliminating step two from the goodwill impairment test. The ASU requires goodwill impairments to be measured on the basis of the fair value of the reporting unit relative to the reporting unit's carrying amount rather than on the basis of the implied amount of goodwill relative to the goodwill balance of the reporting unit. The ASU is effective for annual and interim impairment tests for periods beginning after December 15, 2019. Early adoption is allowed for annual and interim impairment tests occurring after January 1, 2017. The Company is evaluating the effect of adopting this new accounting standard.
In August 2018, the FASB issued ASU 2018-15, Intangibles-Goodwill and Other-Internal-Use Software (Subtopic 350-40): Customer's Accounting for Implementation Costs Incurred in a Cloud Computing Arrangement That is a Service Contract. The amendment aligns the requirements for capitalizing implementation costs incurred in a hosting arrangement that is a service contract with the requirements that currently exist in U.S. GAAP for capitalizing implementation costs incurred to develop or obtain internal-use software. Implementation costs would either be capitalized or expensed as incurred depending on the project stage. All costs in the preliminary and post-implementation project stages are expensed as incurred, while certain costs within the application development stage are capitalized. The revised guidance is effective for financial statements issued for fiscal years beginning after December 15, 2019, with early adoption permitted. While the Company continues to assess all of the effects of adoption, it currently believes the adoption of this ASU will not have a material impact on its consolidated statements of operations. Requirements under the standard are generally consistent with the Company's current accounting for cloud computing arrangements, with the primary difference being the classification of certain information in its consolidated financial statements and related disclosures.
Note 3—Revenue, Contract Assets and Contract Liabilities
Disaggregated Revenue
The following table represents the Company’s separately managed account and mutual fund and collective investment trust investment management revenue by investment portfolio during the years ended December 31, 2019 and 2018:
Year ended December 31, 2019 | ||||||||||||
Separately managed accounts | Mutual funds and collective investment trusts | Total | ||||||||||
(in thousands) | ||||||||||||
Blended Asset | $ | 65,949 | $ | 17,731 | $ | 83,680 | ||||||
Equity | 17,992 | 11,597 | 29,589 | |||||||||
Fixed Income | 2,348 | 16 | 2,364 | |||||||||
Total | $ | 86,289 | $ | 29,344 | $ | 115,633 | ||||||
Year ended December 31, 2018 | ||||||||||||
Separately managed accounts | Mutual funds and collective investment trusts | Total | ||||||||||
(in thousands) | ||||||||||||
Blended Asset | $ | 71,730 | $ | 25,421 | $ | 97,151 | ||||||
Equity | 22,804 | 15,987 | 38,791 | |||||||||
Fixed Income | 2,589 | 54 | 2,643 | |||||||||
Total | $ | 97,123 | $ | 41,462 | $ | 138,585 | ||||||
F-14
Manning & Napier, Inc.
Notes to Consolidated Financial Statements (Continued)
Accounts Receivable
Accounts receivable as of December 31, 2019 and December 31, 2018 consisted of the following:
December 31, 2019 | December 31, 2018 | |||||||
(in thousands) | ||||||||
Accounts receivable - third parties | $ | 5,778 | $ | 5,342 | ||||
Accounts receivable - affiliated mutual funds and collective investment trusts | 4,404 | 6,105 | ||||||
Total accounts receivable | $ | 10,182 | $ | 11,447 | ||||
Accounts receivable: Accounts receivable represents the Company's unconditional rights to consideration arising from its performance under separately managed account, mutual fund and collective investment trust, distribution and shareholder servicing, and custodial service contracts. Accounts receivable balances do not include an allowance for doubtful accounts nor has any significant bad debt expense attributable to accounts receivable been recorded during the years ended December 31, 2019 or 2018.
Advisory and Distribution Agreements
The Company earns investment advisory fees, distribution fees and administrative service fees under agreements with affiliated mutual funds and collective investment trusts. Fees earned for advisory and distribution services provided were approximately $40.5 million and $54.6 million during the years ended December 31, 2019 and 2018, respectively, which represents greater than 10% of revenue in each period. The following provides amounts due from affiliated mutual funds and collective investment trusts reported within accounts receivable in the consolidated statement of financial condition as of December 31, 2019 and December 31, 2018:
December 31, 2019 | December 31, 2018 | |||||||
(in thousands) | ||||||||
Affiliated mutual funds | $ | 3,164 | $ | 4,802 | ||||
Affiliated collective investment trusts | 1,240 | 1,303 | ||||||
Accounts receivable - affiliated mutual funds and collective investment trusts | $ | 4,404 | $ | 6,105 | ||||
Contract assets and liabilities
Accrued accounts receivable: Accrued accounts receivable represents the Company's contract asset for revenue that has been recognized in advance of billing separately managed account contracts. Consideration for the period billed in arrears is dependent on the client’s AUM on a future billing date and therefore conditional as of the reporting period end. During the years ended December 31, 2019 and 2018, revenue was increased by less than $0.1 million and decreased by less than $0.1 million for changes in transaction price, respectively. Accrued accounts receivable of $0.3 million and $0.2 million is reported within prepaid expenses and other assets in the consolidated statement of financial condition as of December 31, 2019 and 2018, respectively.
Deferred revenue: Deferred revenue is recorded when consideration is received or unconditionally due in advance of providing services to the Company's customer. Revenue recognized during the years ended December 31, 2019 and 2018 that was included in deferred revenue at the beginning of the period was approximately $8.8 million and $9.9 million, respectively.
Costs to obtain a contract: Incremental first year commissions directly associated with new separate account and collective investment trust contracts are capitalized and amortized straight-line over an estimated customer contract period of 7 years for separate accounts and 3 years for collective investment trust contracts. The total net asset as of December 31, 2019 and 2018 was approximately $1.0 million and $1.2 million, respectively. Amortization expense included in compensation and related costs totaled approximately $0.4 million and $0.5 million during the years ended December 31, 2019 and 2018, respectively. Impairment losses of approximately $0.1 million and $0.3 million was recognized during the years ended December 31, 2019 and 2018, respectively, related to contract acquisition costs for client contracts that canceled during the respective period.
Note 4—Noncontrolling Interests
Manning & Napier holds an economic interest of approximately 19.2% in Manning & Napier Group, but as managing member controls all of the business and affairs of Manning & Napier Group. As a result, the Company consolidates the financial results of Manning & Napier Group and records a noncontrolling interest on its consolidated statement of financial conditions with respect to the remaining approximately 80.8% economic interest in Manning & Napier Group held by M&N Group Holdings and MNCC. Net income attributable to noncontrolling interests on the consolidated statements of operations
F-15
Manning & Napier, Inc.
Notes to Consolidated Financial Statements (Continued)
represents the portion of earnings attributable to the economic interest in Manning & Napier Group held by the noncontrolling interests.
The following provides a reconciliation from “Income before provision for income taxes” to “Net income attributable to Manning & Napier, Inc.”:
Year Ended December 31, | |||||||
2019 | 2018 | ||||||
(in thousands) | |||||||
Income before provision for income taxes | $ | 10,305 | $ | 25,632 | |||
Less: income (loss) before provision for income taxes of Manning & Napier, Inc. (1) | (227 | ) | 1,272 | ||||
Income before provision for income taxes, as adjusted | 10,532 | 24,360 | |||||
Controlling interest percentage (2) | 18.9 | % | 18.2 | % | |||
Net income attributable to controlling interest | 1,992 | 4,432 | |||||
Plus: income (loss) before provision for income taxes of Manning & Napier, Inc. (1) | (227 | ) | 1,272 | ||||
Income before income taxes attributable to Manning & Napier, Inc. | 1,765 | 5,704 | |||||
Less: provision for income taxes of Manning & Napier, Inc. (3) | 332 | 2,507 | |||||
Net income attributable to Manning & Napier, Inc. | $ | 1,433 | $ | 3,197 | |||
__________________________
(1) | Manning & Napier, Inc. incurs certain income or expenses that are only attributable to it and are therefore excluded from the net income attributable to noncontrolling interests. |
(2) | Income before provision for income taxes is allocated to the controlling interest based on the percentage of units of Manning & Napier Group held by Manning & Napier, Inc. The amount represents the Company's weighted ownership of Manning & Napier Group for the respective periods. |
(3) | The consolidated provision for income taxes is equal to the sum of (i) the provision for income taxes for entities other than Manning & Napier, Inc. and (ii) the provision for income taxes of Manning & Napier, Inc. which includes all U.S. federal and state income taxes. The consolidated provision for income taxes totaled approximately $0.4 million and $2.6 million for the years ended December 31, 2019 and 2018, respectively. |
A total of 62,034,200 units of Manning & Napier Group are held by the noncontrolling interests as of December 31, 2019. Pursuant to the terms of the exchange agreement entered into at the time of the Company's initial public offering, such units may be exchangeable for shares of the Company's Class A common stock. For any units exchanged, the Company will (i) pay an amount of cash equal to the number of units exchanged multiplied by the value of one share of the Company's Class A common stock less a market discount and expected expenses, or, at the Company's election, (ii) issue shares of the Company's Class A common stock on a one-for-one basis, subject to customary adjustments. As the Company receives units of Manning & Napier Group that are exchanged, the Company's ownership of Manning & Napier Group will increase.
During the year ended December 31, 2019, M&N Group Holdings and MNCC exchanged a total of 1,315,521 Class A units of Manning & Napier Group for approximately $3.1 million in cash. Subsequent to the exchange, the Class A units were retired. In addition, during the year ended December 31, 2019, Class A common stock was issued under the 2011 Equity Compensation Plan (the "Equity Plan") for which Manning & Napier, Inc. acquired an equivalent number of Class A units of Manning & Napier Group, net of forfeitures of unvested restricted stock awards.
F-16
Manning & Napier, Inc.
Notes to Consolidated Financial Statements (Continued)
The following provides a summary of the transactions that have impacted the Company's equity ownership interest in Manning & Napier Group during the years ended December 31, 2019 and 2018:
Manning & Napier Group Class A Units Held | ||||||||||
Manning & Napier | Noncontrolling Interests | Total | Manning & Napier Ownership % | |||||||
As of January 1, 2018 | 13,873,042 | 63,931,065 | 77,804,107 | 17.8% | ||||||
Class A Units issued | 253,694 | — | 253,694 | 0.3% | ||||||
Class A Units exchanged | — | (581,344 | ) | (581,344 | ) | 0.1% | ||||
As of December 31, 2018 | 14,126,736 | 63,349,721 | 77,476,457 | 18.2% | ||||||
Class A Units issued | 623,485 | — | 623,485 | 0.7% | ||||||
Class A Units exchanged | — | (1,315,521 | ) | (1,315,521 | ) | 0.3% | ||||
As of December 31, 2019 | 14,750,221 | 62,034,200 | 76,784,421 | 19.2% | ||||||
Since the Company continues to have a controlling interest in Manning & Napier Group, the aforementioned changes in ownership of Manning & Napier Group were accounted for as equity transactions under ASC 810, Consolidation. Additional paid-in capital and noncontrolling interests in the Consolidated Statements of Financial Position are adjusted to reallocate the Company's historical equity to reflect the change in ownership of Manning & Napier Group.
During the years ended December 31, 2019 and 2018, the Company made approximately $5.9 million and $13.1 million, respectively, in distributions to noncontrolling interests. None of these distributions were payments pursuant to the tax receivable agreement (Note 15).
Note 5—Investment Securities
The following table represents the Company’s investment securities holdings at December 31, 2019 and December 31, 2018:
December 31, 2019 | |||||||||||||||
Cost | Unrealized Gains | Unrealized Losses | Fair Value | ||||||||||||
(in thousands) | |||||||||||||||
Available-for-sale securities | |||||||||||||||
Fixed income securities | $ | 35,148 | $ | — | $ | (91 | ) | $ | 35,057 | ||||||
U.S. Treasury notes | 33,908 | 193 | — | 34,101 | |||||||||||
Short-term investments | 12,119 | — | — | 12,119 | |||||||||||
81,277 | |||||||||||||||
Equity investments, at fair value | |||||||||||||||
Equity securities | 6,038 | ||||||||||||||
Mutual funds | 3,152 | ||||||||||||||
9,190 | |||||||||||||||
Total investment securities | $ | 90,467 | |||||||||||||
F-17
Manning & Napier, Inc.
Notes to Consolidated Financial Statements (Continued)
December 31, 2018 | |||||||||||||||
Cost | Unrealized Gains | Unrealized Losses | Fair Value | ||||||||||||
(in thousands) | |||||||||||||||
Available-for-sale securities | |||||||||||||||
Fixed income securities | $ | 15,488 | $ | — | $ | (75 | ) | $ | 15,413 | ||||||
U.S. Treasury notes | 21,613 | 36 | — | 21,649 | |||||||||||
Short-term investments | 45,879 | — | — | 45,879 | |||||||||||
82,941 | |||||||||||||||
Equity investments, at fair value | |||||||||||||||
Equity securities | 4,683 | ||||||||||||||
Mutual funds | 3,566 | ||||||||||||||
8,249 | |||||||||||||||
Total investment securities | $ | 91,190 | |||||||||||||
Investment securities are classified as either equity investments, trading, equity method investments or available-for-sale and are carried at fair value. Fair value is determined based on quoted market prices in active markets for identical or similar instruments.
Investment securities classified as equity investments, at fair value consist of equity securities and investments in mutual funds for which the Company provides advisory services. At December 31, 2019 and 2018, equity investments, at fair value consist of investments held by the Company to provide initial cash seeding for product development purposes and investments in mutual funds to hedge economic exposure to market movements on its deferred compensation plan. The Company recognized approximately $1.5 million of net unrealized gains and $1.5 million of net unrealized losses related to investments classified as equity investments, at fair value for the years ended December 31, 2019 and 2018, respectively.
Investment securities classified as available-for-sale consist of U.S. Treasury notes, corporate bonds and other short-term investments to optimize cash management opportunities and for compliance with certain regulatory requirements. As of December 31, 2019 and 2018, approximately $0.6 million of the U.S. Treasury notes is considered restricted. The Company periodically reviews each individual security position that has an unrealized loss, or impairment, to determine if that impairment is other-than-temporary. No other-than-temporary impairment charges have been recognized by the Company during the years ended December 31, 2019 or 2018.
The table below presents realized gains and losses on the sale of all securities for the years ended December 31, 2019 and 2018:
Year ended December 31, | |||||||
2019 | 2018 | ||||||
(in thousands) | |||||||
Gross realized investment gains | $ | 269 | $ | 401 | |||
Gross realized investment losses | (135 | ) | (347 | ) | |||
Net realized gains (losses) | $ | 134 | $ | 54 | |||
Note 6—Fair Value Measurements
Fair value is defined as the price that the Company would receive upon selling an investment in an orderly transaction to an independent buyer in the principal or most advantageous market of the investment. A fair value hierarchy is provided that gives the highest priority to unadjusted quoted prices in active markets for identical assets and liabilities (Level 1) and the lowest priority to unobservable inputs (Level 3).
The following three-tier fair value hierarchy prioritizes the inputs used in measuring fair value:
• | Level 1—observable inputs such as quoted prices in active markets for identical securities; |
• | Level 2—other significant observable inputs (including but not limited to quoted prices for similar securities, interest rates, prepayment rates, credit risk, etc.); and |
• | Level 3—significant unobservable inputs (including the Company’s own assumptions in determining the fair value of investments). |
F-18
Manning & Napier, Inc.
Notes to Consolidated Financial Statements (Continued)
The following provides the hierarchy of inputs used to derive the fair value of the Company’s assets as of December 31, 2019 and 2018:
December 31, 2019 | |||||||||||||||
Level 1 | Level 2 | Level 3 | Totals | ||||||||||||
(in thousands) | |||||||||||||||
Equity securities | $ | 6,038 | $ | — | $ | — | $ | 6,038 | |||||||
Fixed income securities | — | 35,057 | — | 35,057 | |||||||||||
Mutual funds | 3,152 | — | — | 3,152 | |||||||||||
U.S. Treasury notes | — | 34,101 | — | 34,101 | |||||||||||
Short-term investments | — | 12,119 | — | 12,119 | |||||||||||
Total assets at fair value | $ | 9,190 | $ | 81,277 | $ | — | $ | 90,467 | |||||||
Contingent consideration liability | $ | — | $ | — | $ | — | $ | — | |||||||
Total liabilities at fair value | $ | — | $ | — | $ | — | $ | — | |||||||
December 31, 2018 | |||||||||||||||
Level 1 | Level 2 | Level 3 | Totals | ||||||||||||
(in thousands) | |||||||||||||||
Equity securities | $ | 4,683 | $ | — | $ | — | $ | 4,683 | |||||||
Fixed income securities | — | 15,413 | — | 15,413 | |||||||||||
Mutual funds | 3,566 | — | — | 3,566 | |||||||||||
U.S. Treasury notes | — | 21,649 | — | 21,649 | |||||||||||
Short-term investments | 43,914 | 1,965 | — | 45,879 | |||||||||||
Total assets at fair value | $ | 52,163 | $ | 39,027 | $ | — | $ | 91,190 | |||||||
Contingent consideration liability | $ | — | $ | — | $ | — | $ | — | |||||||
Total liabilities at fair value | $ | — | $ | — | $ | — | $ | — | |||||||
Short-term investments consists of certificate of deposits that are stated at cost, which approximate fair value due to the short maturity of the investments and U.S. Treasury bills.
Valuations of investments in fixed income securities and U.S. Treasury notes and bills can generally be obtained through independent pricing services. For most bond types, the pricing service utilizes matrix pricing, which considers one or more of the following factors: yield or price of bonds of comparable quality, coupon, maturity, current cash flows, type and current day trade information, as well as dealer supplied prices. These valuations are categorized as Level 2 in the hierarchy.
Contingent consideration was a component of the Company's purchase price of Rainier in 2016 of additional cash payments of up to $32.5 million over the three-year period ending December 31, 2019, contingent upon Rainier’s achievement of certain financial targets. The fair value of the contingent consideration is calculated on a quarterly basis by forecasting Rainier’s adjusted earnings before interest, taxes and amortization ("EBITA") over the contingency period. There were no changes in contingent consideration liability measured at fair value using significant unobservable inputs (Level 3) for the twelve months ended December 31, 2019.
The Company’s policy is to recognize transfers in and transfers out of the valuation levels as of the beginning of the reporting period. There were no significant transfers between Levels during the year ended December 31, 2019 or 2018.
F-19
Manning & Napier, Inc.
Notes to Consolidated Financial Statements (Continued)
Note 7—Property and Equipment
Property and equipment as of December 31, 2019 and 2018 consisted of the following:
December 31, | |||||||
2019 | 2018 | ||||||
(in thousands) | |||||||
Furniture and fixtures | $ | 1,878 | $ | 2,506 | |||
Office equipment | 4,150 | 4,146 | |||||
Computer software | 4,281 | 4,855 | |||||
Leasehold improvements | 5,679 | 5,469 | |||||
15,988 | 16,976 | ||||||
Less: Accumulated depreciation | (11,423 | ) | (11,327 | ) | |||
Property and equipment, net | $ | 4,565 | $ | 5,649 | |||
Depreciation expense is included in other operating costs and totaled approximately $3.6 million and $1.7 million for the years ended December 31, 2019 and 2018, respectively.
During the year ended December 31, 2019, in connection with initiatives to upgrade its technology platform, the Company recognized charges totaling approximately $3.1 million for the impairment of certain capitalized internal-use software of $2.1 million and for the write-off of associated prepaid license costs of $1.0 million. These charges are reflected within other operating costs in the statements of operations. Subsequent to entering into a new contract with a third-party service provider to leverage its platform in order to expand the Company's digital capabilities, the Company determined that certain previously capitalized internal-use software and associated prepaid license costs did not have significant value in its future technology strategy and would not ultimately be completed or placed into service. The Company also recognized an expense of approximately $3.2 million, representing the present value of approximately $3.4 million of future cash obligations under the previous software license agreement, of which approximately $1.4 million is included in accrued expenses and other liabilities in the consolidated statements of financial condition at December 31, 2019, with the remainder included in other long-term liabilities.
The Company has evaluated its property and equipment for impairment under the current accounting standards and has concluded that no impairment loss has occurred as of December 31, 2019 other than as discussed in the paragraph above. No impairment loss occurred in the year ended December 31, 2018.
Note 8—Goodwill and Intangible Assets
Goodwill
The carrying amount of goodwill was $4.8 million at both December 31, 2019 and 2018, and there was no accumulated impairment. There were no changes in the carrying value of goodwill during the years ended December 31, 2019 and 2018.
The Company completed its goodwill impairment testing in the fourth quarter of 2019 and determined that there were no facts and circumstances occurring during 2019 suggesting possible impairment. No impairment of goodwill was recognized during the years ended December 31, 2019 and 2018.
F-20
Manning & Napier, Inc.
Notes to Consolidated Financial Statements (Continued)
Intangible Assets
The following table reflects the components of intangible assets as of December 31, 2019 and 2018:
December 31, | |||||||
2019 | 2018 | ||||||
(in thousands) | |||||||
Intangible assets subject to amortization: | |||||||
Cost - Separately managed account client relationships | $ | 897 | $ | 897 | |||
Accumulated amortization - Separately managed account client relationships | (897 | ) | (897 | ) | |||
Cost - Trademark | 340 | 340 | |||||
Accumulated amortization - Trademark | (235 | ) | (190 | ) | |||
Intangible assets subject to amortization, net | 105 | 150 | |||||
Indefinite-lived intangible assets: | |||||||
Cost - Mutual fund and collective trust contracts | 2,578 | 2,578 | |||||
Mutual fund and collective trust contracts | 2,578 | 2,578 | |||||
Total intangible assets, net | $ | 2,683 | $ | 2,728 | |||
There were no facts or circumstances occurring during the years ended December 31, 2019 or 2018 suggesting possible impairment.
Amortization expense was less than $0.1 million for each of the years ended December 31, 2019 and 2018. As of December 31, 2019, intangible assets subject to amortization are being amortized over a weighted-average remaining life of 1.2 years. The estimated amortization expense to be recognized over the next 5 years is as follows:
Year Ending December 31, | Estimated Amortization Expense | |||
(in thousands) | ||||
2020 | $ | 45 | ||
2021 | 45 | |||
2022 | 15 | |||
2023 | — | |||
2024 | — | |||
Thereafter | — | |||
Total | $ | 105 | ||
F-21
Note 9—Accrued Expenses and Other Liabilities
Accrued expenses and other liabilities as of December 31, 2019 and 2018 consisted of the following:
December 31, | |||||||
2019 | 2018 | ||||||
(in thousands) | |||||||
Accrued bonuses and sales commissions | $ | 14,825 | $ | 16,121 | |||
Accrued payroll and benefits | 4,415 | 4,087 | |||||
Accrued sub-transfer agent fees | 420 | 1,451 | |||||
Dividends payable on Class A common stock | 312 | 306 | |||||
Amounts payable under tax receivable agreement | 275 | 674 | |||||
Short-term operating lease liabilities | 2,682 | — | |||||
Other accruals and liabilities | 3,272 | 2,487 | |||||
$ | 26,201 | $ | 25,126 | ||||
During the year ended December 31, 2018, the Company commenced a voluntary employee retirement offering (the "offering"), available to employees meeting certain age and length-of-service requirements as well as business function criteria. Employees electing to participate in the offering were subject to approval by the Company, and received enhanced separation benefits. These employees are required to render service until their agreed upon termination date (which varies from person to person) in order to receive the benefits and as such, the liability will be recognized ratably over the applicable service period.
The Company estimates the total employee severance costs under the offering to be approximately $2.6 million, of which approximately $0.3 million was recognized during the year ended December 31, 2019. Also during the year ended December 31, 2019, the Company recognized approximately $2.7 million of severance costs as a result of involuntary workforce reductions. Employee severance costs recognized are included in compensation and related costs in the consolidated statements of operations.
The following table summarizes the changes in accrued employee severance costs recognized by the Company for the year ended December 31, 2019, as included in accrued expenses and other liabilities in the consolidated statements of financial condition:
Twelve months ended December 31, 2019 | ||||
(in thousands) | ||||
Accrued employee severance costs as of December 31, 2018 | $ | 1,642 | ||
Employee severance costs recognized | 2,964 | |||
Payment of employee severance costs | (2,988 | ) | ||
Accrued employee severance costs as of December 31, 2019 | $ | 1,618 | ||
Note 10—Leases
Adoption of ASU 2016-02, Leases (Topic 842)
On January 1, 2019, the Company adopted Topic 842 using the optional transition method. Consequently, financial information and disclosures for the reporting periods beginning after January 1, 2019 are presented under Topic 842, while prior period amounts are not adjusted and continue to be reported in accordance with the Company's historic accounting policies under Topic 840.
Topic 842 provides a number of optional practical expedients as part of the transition from Topic 840. The Company elected the ‘package of practical expedients’, which permits it to not reassess, under Topic 842, its prior conclusions about lease identification, lease classification and initial direct costs.
Topic 842 also provides practical expedients for an entity’s ongoing accounting under Topic 842. The Company elected the short-term lease recognition exemption for all leases that qualify, and elected the practical expedient to combine lease and non-lease components as a single combined lease component for all of its leases.
On adoption, the Company recognized lease liabilities of approximately $23.2 million and right-of-use assets for approximately $20.6 million, based on the present value of the remaining minimum rental payments under Topic 840 for operating leases that existed as of the date of adoption. In addition, the Company wrote-down approximately $2.6 million of
F-22
unamortized deferred lease costs and tenant incentives previously recorded as deferred rent liability in the consolidated statements of financial condition as of December 31, 2018. The Company recognized an increase to opening shareholders' equity and noncontrolling interest of approximately $0.1 million, as of January 1, 2019, related to the deferred tax impacts of adopting Topic 842.
Leases
The Company has operating and finance leases for office space and certain equipment. For these leases, the office space or equipment is an explicitly identified asset within the contract. The Company has determined that it has obtained substantially all of the economic benefits from the use of the underlying asset and directs how and for what purpose the asset is used during the term of the contract.
The Company's leases have remaining lease terms ranging between approximately 1 year and 8 years. The Company's lease term on certain of its multi-year office space leases, including its headquarters, include options for the Company to extend those leases for periods ranging from an additional five to ten years. In addition, the Company has the option to reduce a portion of its square footage at certain times throughout the term of the lease for its headquarters. The Company determined it is not reasonably certain at this time it will exercise the options to extend these leases or will exercise the options to reduce its square footage; therefore, the payment amounts related to these lease term extensions and contraction options have been excluded from determining its right-of-use asset and lease liability.
Certain of the Company's operating leases for office space include variable lease payments, including non-lease components (such as utilities and operating expenses) that vary based on actual expenses and are adjusted on an annual basis. The Company concluded that these variable lease payments are in substance fixed payments and included the estimated variable payments in its determination of right-of-use assets and lease liabilities.
Changes in the lease terms, including renewal options and options to reduce its square footage, incremental borrowing rates, and/or variable lease payments, and the corresponding impact to the right-of-use assets and lease liabilities, are recognized in the period incurred.
Certain of the Company's operating leases have been subleased for which the Company will receive cash totaling approximately $3.9 million over the remaining term of such leases. The lease terms for the three subleased operating leases end in 2021, 2027 and 2028.
The components of lease expense for the year ended December 31, 2019 were as follows:
Year Ended December 31, 2019 | ||||
(in thousands) | ||||
Finance lease expense | ||||
Amortization of right-of-use assets | $ | 124 | ||
Interest on lease liabilities | 11 | |||
Operating lease expense | 3,622 | |||
Short-term lease expense | 13 | |||
Variable lease expense | 319 | |||
Sublease income | (687 | ) | ||
Total lease expense | $ | 3,402 | ||
F-23
Supplemental cash flow information related to leases for the year ended December 31, 2019 were as follows:
Year Ended December 31, 2019 | ||||
(in thousands) | ||||
Cash paid for amounts included in the measurement of lease liabilities: | ||||
Operating cash flows from finance leases | $ | 11 | ||
Finance cash flows from finance leases | $ | 130 | ||
Operating cash flows from operating leases | $ | 3,853 | ||
Right-of-use assets obtained in exchange for new lease obligations: | ||||
Finance leases | $ | 175 | ||
Operating leases | $ | 898 | ||
Supplemental balance sheet information related to leases as of December 31, 2019 was as follows:
_______________________
December 31, 2019 | ||||
Finance Leases | (in thousands, except lease term and discount rate) | |||
Finance lease right-of-use assets (1) | $ | 203 | ||
Accrued expenses and other liabilities | $ | 94 | ||
Other long-term liabilities | 120 | |||
Total finance lease liabilities | $ | 214 | ||
Operating Leases | ||||
Operating lease right-of-use assets | $ | 18,795 | ||
Accrued expenses and other liabilities | $ | 2,682 | ||
Operating lease liabilities, non-current | 18,753 | |||
Total operating lease liabilities | $ | 21,435 | ||
Weighted average remaining lease term | ||||
Finance leases | 2.83 years | |||
Operating leases | 7.43 years | |||
Weighted average discount rate | ||||
Finance leases | 4.69 | % | ||
Operating leases | 5.14 | % | ||
(1) | Amounts included in other long-term assets within the consolidated statements of financial condition. |
F-24
Maturities of lease liabilities were as follows:
Year ending December 31, | Finance Leases | Operating Leases | ||||||
(in thousands) | ||||||||
2020 | $ | 103 | $ | 3,708 | ||||
2021 | 59 | 3,714 | ||||||
2022 | 40 | 3,518 | ||||||
2023 | 27 | 3,134 | ||||||
2024 | — | 3,073 | ||||||
Thereafter | — | 8,670 | ||||||
Total lease payments | 229 | 25,817 | ||||||
Less imputed interest | (15 | ) | (4,382 | ) | ||||
Total lease liabilities | $ | 214 | $ | 21,435 | ||||
The adoption of ASU-2016-02 using the effective date as the date of initial application requires the inclusion of the disclosures for periods prior to adoption, which are included below.
Minimum future rental commitments as of December 31, 2018 for all non-cancelable operating leases were as follows:
Year Ending December 31, | Minimum Payments | |||
(in thousands) | ||||
2019 | $ | 3,748 | ||
2020 | 3,780 | |||
2021 | 3,712 | |||
2022 | 3,668 | |||
2023 | 3,369 | |||
Thereafter | 13,397 | |||
Total undiscounted lease payments | $ | 31,674 | ||
Rent expense was $3.7 million for the year ended December 31, 2018. At December 31, 2018, the Company had approximately $0.2 million of total capital lease obligations.
Note 11—Commitments and Contingencies
The Company may from time to time enter into agreements that contain certain representations and warranties and which provide general indemnifications. The Company may also serve as a guarantor of such obligations. The Company’s maximum exposure under these arrangements is unknown, as this would involve future claims that may be made against the Company that have not yet occurred. The Company expects any risk of liability associated with such guarantees to be remote.
Regulation
As an investment adviser to a variety of investment products, the Company and its affiliated broker-dealer are subject to routine reviews and inspections by the SEC and the Financial Industry Regulatory Authority, Inc.. Additionally, the Company could be subject to non-routine reviews and inspections by the National Futures Association and U.S. Commodity Futures Trading Commission in regards to the Company’s de minimis exposure to commodity interest investments in the mutual funds and collective investment trust vehicles it operates. From time to time the Company may also be subject to claims, be involved in various legal proceedings arising in the ordinary course of its business and other contingencies. The Company does not believe that the outcome of any of these reviews, inspections or other legal proceedings will have a material impact on its consolidated financial statements; however, litigation is subject to many uncertainties, and the outcome of individual litigated matters is difficult to predict. The Company will establish accruals for matters that are probable, can be reasonably estimated, and may take into account any related insurance recoveries to the extent of such recoveries. As of December 31, 2019 and 2018, the Company has not accrued for any such claims, legal proceedings, or other contingencies.
F-25
Manning & Napier, Inc.
Notes to Consolidated Financial Statements (Continued)
Note 12—Shareholders’ Equity and Capital Structure
The authorized capital stock of Manning & Napier consists of 300,000,000 shares of Class A common stock, par value $0.01 per share, and 2,000 shares of Class B common stock, par value $0.01 per share, and are further described below. In addition to the Class A and Class B common stock, the Company has the authority to issue 100,000 shares of preferred stock, par value $0.01 per share.
Class A Common Stock
The holders of the Company’s Class A common stock are entitled to one vote for each share held of record on all matters submitted to a vote of stockholders.
The holders of the Company’s Class A common stock are entitled to receive dividends, if declared by the Company’s board of directors, out of funds legally available therefore, subject to any statutory or contractual restrictions on the payment of dividends.
The holders of the Company’s Class A common stock do not have preemptive, subscription, redemption or conversion rights.
Class B Common Stock
Pursuant to the Company's Amended and Restated Certificate of Incorporation the Company's Class B common stock entitles the holder thereof to a majority of the vote on all matters submitted to a vote of stockholders. The Company's Class B common stock does not entitle the holder thereof to any right to receive dividends or to receive a distribution upon the dissolution, liquidation or sale of all or substantially all of the Company's assets. There are no outstanding shares of our Class B common stock.
Voting
Generally, all matters to be voted on by stockholders must be approved by a majority of the votes entitled to be cast by all shares of Class A common stock.
Shares Eligible for Future Sale
The Company is party to an exchange agreement with M&N Group Holding and MNCC, the other direct holders of all of the units of Manning & Napier Group that are not held by the Company.
As of December 31, 2019, a total of 62,034,200 Class A units of Manning & Napier Group are held by the noncontrolling interests, of which approximately 60 million are held by William Manning. Pursuant to the terms of the exchange agreement entered into at the time of the Company's initial public offering, subject to certain restrictions, these units may be exchangeable on an annual basis for shares of the Company’s Class A common stock.
For any units of Manning & Napier Group exchanged, the Company will (i) pay an amount of cash equal to the number of units exchanged multiplied by the value of one share of the Company’s Class A common stock less a market discount and expected expenses, or, at the Company’s election, (ii) issue shares of the Company’s Class A common stock on a one-for-one basis, subject, in each case, to customary adjustments. As the Company receives units of Manning & Napier Group that are exchanged, the Company’s ownership of Manning & Napier Group will increase. The decision whether to pay cash or issue shares will be made by the independent members of the Company’s board of directors.
Note 13—Earnings per Common Share
Basic earnings per share (“basic EPS”) is computed using the two-class method to determine net income available to Class A common stock. The two-class method includes an earnings allocation formula that determines earnings per share for each participating security according to dividends declared and undistributed earnings for the period. The Company's restricted Class A common shares granted under the 2011 Equity Compensation Plan (the "Equity Plan") have non-forfeitable dividend rights during their vesting period and are therefore considered participating securities under the two-class method. Under the two-class method, the Company's net income available to Class A common stock is reduced by the earnings allocated to the unvested restricted Class A common stock. Basic EPS is calculated by dividing net income available to Class A common stock by the weighted average number of common shares outstanding during the period.
Diluted earnings per share (“diluted EPS”) is computed under the more dilutive of either the treasury method or the two-class method. For the diluted calculation, the weighted average number of common shares outstanding during the period is increased by the assumed conversion into Class A common stock of the unvested equity awards and the exchangeable units of Manning & Napier Group, to the extent that such conversion would dilute earnings per share.
F-26
Manning & Napier, Inc.
Notes to Consolidated Financial Statements (Continued)
The following is a reconciliation of the income and share data used in the basic and diluted earnings per share computations for the years ended December 31, 2019 and 2018 under the two-class method:
Year Ended December 31, | |||||||
2019 | 2018 | ||||||
(in thousands, except share data) | |||||||
Net income attributable to controlling and noncontrolling interests | $ | 9,857 | $ | 22,985 | |||
Less: net income attributable to noncontrolling interests | 8,424 | 19,788 | |||||
Net income attributable to Manning & Napier, Inc. | $ | 1,433 | $ | 3,197 | |||
Less: allocation to participating securities | (102 | ) | 67 | ||||
Net income available to Class A common stock | $ | 1,535 | $ | 3,130 | |||
Weighted average shares of Class A common stock outstanding - basic | 15,216,707 | 14,623,198 | |||||
Dilutive effect from unvested equity awards | 286,908 | 6,972 | |||||
Dilutive effect of exchangeable Class A units | 62,470,304 | — | |||||
Weighted average shares of Class A common stock outstanding - diluted | 77,973,919 | 14,630,170 | |||||
Net income available to Class A common stock per share - basic | $ | 0.10 | $ | 0.21 | |||
Net income available to Class A common stock per share - diluted | $ | 0.09 | $ | 0.21 | |||
For the year ended December 31, 2019, 3,000,000 unvested performance-based stock options were excluded from the calculation of diluted EPS because the associated market condition had not yet been achieved.
For the years ended December 31, 2019 and 2018, there were unvested equity awards of 902,073 and 1,602,337 respectively, excluded from the calculation of diluted earnings per common share because the effect would have been anti-dilutive.
At December 31, 2019 and 2018 there were 62,034,200 and 63,349,721, respectively, Class A units of Manning & Napier Group which for each period, subject to certain restrictions, may be exchangeable for up to an equivalent number of the Company’s Class A common shares. These units were not included in the calculation of diluted earnings per common share for the year ended December 31, 2018 because the effect would have been anti-dilutive.
Note 14—Equity Based Compensation
2011 Equity Compensation Plan
The Equity Plan was adopted by the Company's board of directors and approved by the Company's stockholders prior to the consummation of the IPO. A total of 13,142,813 equity interests are authorized for issuance. The equity interests may be issued in the form of the Company's Class A common stock, restricted stock units, stock options, units of Manning & Napier Group, or certain classes of membership interests in the Company which may convert into units of Manning & Napier Group.
During the year ended December 31, 2019, 4,270,571 equity awards were granted under the Equity Plan, including 770,571 restricted stock awards and 3,500,000 stock option awards.
The following table summarizes activity related to awards of restricted stock and restricted stock units (collectively, "stock awards") under the Equity Plan for the year ended December 31, 2019 :
Restricted Stock Awards | Weighted Average Grant Date Fair Value | ||||||
Stock awards outstanding at January 1, 2019 | 1,602,337 | $ | 5.31 | ||||
Granted | 770,571 | $ | 2.38 | ||||
Vested | (1,145,992 | ) | $ | 4.17 | |||
Forfeited | (189,015 | ) | $ | 5.85 | |||
Stock awards outstanding at December 31, 2019 | 1,037,901 | $ | 4.30 | ||||
The weighted average fair value of Equity Plan stock awards granted during the years ended December 31, 2019 and 2018 was $2.38 and $2.07, respectively, based on the closing sale price of Manning & Napier Inc.'s Class A common stock as reported on the New York Stock Exchange on the date of grant reduced, when applicable, by the present value of the dividends
F-27
Manning & Napier, Inc.
Notes to Consolidated Financial Statements (Continued)
expected to be paid on the underlying shares during the requisite service period. Restricted stock unit awards are not entitled to dividends declared on the underlying shares of Class A common stock until the awards vest.
For the years ended December 31, 2019 and 2018, the Company recorded approximately $3.1 million and $2.3 million, respectively, of compensation expense related to stock awards under the Equity Plan. The aggregate intrinsic value of stock awards that vested during the years ended December 31, 2019 and 2018 was approximately $2.3 million and $1.7 million, respectively. As of December 31, 2019, there was unrecognized compensation expense related to stock awards of approximately $2.7 million, which the Company expects to recognize over a weighted average period of approximately 1.6 years.
In connection with the vesting of stock awards during the year ended December 31, 2019, the Company withheld a total of 197,924 shares of Class A common stock to satisfy approximately $0.4 million of employee income tax withholding requirements. These net share settlements had the effect of shares repurchased and retired by the Company, as they reduced the total number of Class A common shares outstanding.
A summary of activity under the Equity Plan related to stock option awards during the year ended December 31, 2019 is presented below:
Stock Option Awards | Weighted Average Exercise Price | Weighted Average Contractual Term (years) | Aggregate Intrinsic Value (in thousands) | |||||||||||
Outstanding at January 1, 2019 | — | $ | — | |||||||||||
Granted | 3,500,000 | $ | 2.01 | |||||||||||
Vested | — | $ | — | |||||||||||
Forfeited | — | $ | — | |||||||||||
Outstanding at December 31, 2019 | 3,500,000 | $ | 2.01 | 4.1 | $ | — | ||||||||
Exercisable at December 31, 2019 | — | — | $ | — | ||||||||||
For the year ended December 31, 2019, the Company recorded approximately $0.6 million of compensation expense related to stock options under the Equity Plan. As of December 31, 2019, there was unrecognized compensation expense of approximately $0.9 million related to stock options, which the Company expects to recognize over a weighted average period of approximately 1.2 years.
During the year ended December 31, 2019, the Company granted a total of 3,500,000 stock option awards under the Equity Plan, 3,000,000 of which are subject to the achievement of specified performance criteria ("performance options"). The performance options vest in installments, only if the closing price per share of the Company's Class A common stock as reported on the New York Stock Exchange exceeds a certain threshold for 20 consecutive days ("target price") prior to a specified date ("target date"). Target prices range from $3.25 to $7.75. Target dates by which each target price must be achieved range from three to seven years from the grant date. These performance options are considered to have a market condition, the effect of which is reflected in the grant date fair value of the award. As such, as long as the requisite service is rendered for these awards, compensation expense will be recognized regardless of whether the market condition is achieved. The fair value of these performance options was estimated using a Monte Carlo simulation model and the weighted average grant date fair value for the performance options granted was $0.38.
Note 15—Income Taxes
The Company is comprised of entities that have elected to be treated as either a limited liability company ("LLC"), or a “C-Corporation”. As such, the entities functioning as LLCs are not liable for or able to benefit from U.S. federal and most state income taxes on their earnings, and earnings (losses) will be included in the personal income tax returns of each entity’s unit holders. The entities functioning as C-Corporations are liable for or able to benefit from U.S. federal, state and local income taxes on their earnings and losses, respectively.
F-28
Manning & Napier, Inc.
Notes to Consolidated Financial Statements (Continued)
Components of the provision for income taxes consist of the following:
Year Ended December 31, | |||||||
2019 | 2018 | ||||||
(in thousands) | |||||||
Current | |||||||
Federal | $ | 146 | $ | 69 | |||
State and local | 99 | 147 | |||||
Current tax expense | 245 | 216 | |||||
Deferred | |||||||
Federal | 255 | 1,339 | |||||
State and local | (52 | ) | 1,092 | ||||
Deferred tax expense | 203 | 2,431 | |||||
Provision for income tax expense | $ | 448 | $ | 2,647 | |||
The differences between income taxes computed using the U.S. federal income tax rate of 21% for the years ended December 31, 2019 and 2018, and the provision for income taxes for continuing operations are as follows:
Year Ended December 31, | |||||||
2019 | 2018 | ||||||
(in thousands) | |||||||
Amount computed using the statutory rate | $ | 2,164 | $ | 5,383 | |||
Increase (reduction) in taxes resulting from: | |||||||
State and local taxes, including settlements and adjustments, net of federal benefit | 40 | 193 | |||||
Net change in state deferred tax rate | — | 1,316 | |||||
Net adjustment to amounts payable under TRA | (42 | ) | (281 | ) | |||
Benefit from the flow-through entities | (1,659 | ) | (4,067 | ) | |||
Other, net | (55 | ) | 103 | ||||
Provision for income taxes | $ | 448 | $ | 2,647 | |||
The provision for income taxes includes a benefit attributable to the fact that the Company’s operations include a series of flow-through entities which are generally not subject to federal and most state income taxes. Accordingly, a portion of the Company’s earnings are not subject to corporate level taxes. For the year ended December 31, 2018, the Company recognized a $1.3 million provision for the reduction in the Company's effective tax rate.
Deferred Tax Assets and Liabilities
As a result of Manning & Napier's purchase of Class A units of Manning & Napier Group or exchange for Class A common stock of Manning & Napier for Class A units of Manning & Napier Group and Manning & Napier Group's election under Section 754 of the Internal Revenue Code, the Company expects to benefit from depreciation and amortization deductions from an increase in tax basis of tangible and intangible assets of Manning & Napier Group. Those deductions allocated to the Company will be taken into account in reporting the Company's taxable income.
In connection with the IPO, a TRA was entered into between Manning & Napier and the holders of Manning & Napier Group, pursuant to which Manning & Napier is required to pay to such holders 85% of the applicable cash savings, if any, in U.S. federal, state, local and foreign income tax that Manning & Napier actually realizes, or is deemed to realize in certain circumstances, as a result of (i) certain tax attributes of their units sold to Manning & Napier or exchanged (for shares of Class A common stock) and that are created as a result of the sales or exchanges and payments under the TRA and (ii) tax benefits related to imputed interest.
Under the TRA, Manning & Napier generally will retain the benefit of the remaining 15% of the applicable tax savings. There is a possibility that not all of the 85% of the applicable cash savings will be paid to the selling or exchanging holder of Class A units. If it is determined that all or a portion of such applicable tax savings is in doubt, payment to such holders of Class A units will be the amount attributable to the portion of the applicable tax savings that are determined not to be in doubt and the payment of the remainder at such time as it is reasonably determined that the actual tax savings or that the amount is no longer in doubt.
F-29
Manning & Napier, Inc.
Notes to Consolidated Financial Statements (Continued)
At December 31, 2019 and 2018, the Company had recorded a total liability of approximately $17.5 million and $18.0 million, respectively, representing the payments due to the selling unit holders under the TRA. Of these amounts, approximately $0.3 million and $0.7 million were included in accrued expenses and other liabilities at December 31, 2019 and 2018, respectively. Payments are anticipated to be made annually commencing from the date of each event that gives rise to the TRA benefits. The timing of the payments is subject to certain contingencies including the Company having sufficient taxable income to utilize all of the tax benefits defined in the TRA. The Company made payments pursuant to the TRA of approximately $0.7 million and $2.5 million during the years ended December 31, 2019 and 2018, respectively.
Components of net deferred tax assets consist of the following:
December 31, | |||||||
2019 | 2018 | ||||||
(in thousands) | |||||||
Deferred tax assets | |||||||
743(b) basis | $ | 17,480 | $ | 19,399 | |||
Bonus and commissions | 253 | 408 | |||||
Net operating loss carryforwards | 2,980 | 1,229 | |||||
Operating lease liabilities | 936 | — | |||||
Other | 148 | 190 | |||||
Total deferred tax assets | 21,797 | 21,226 | |||||
Deferred tax liabilities | |||||||
Depreciation and amortization | 246 | 366 | |||||
Operating lease right-of-use assets | 821 | — | |||||
Prepaid items | 62 | 65 | |||||
Total deferred tax liabilities | 1,129 | 431 | |||||
Net deferred tax assets | $ | 20,668 | $ | 20,795 | |||
As of December 31, 2019, the Company had approximately $12.1 million net operating losses available to offset future taxable income for federal income tax purposes that may be carried forward indefinitely and approximately $6.1 million for state income tax purposes that will expire through 2039 if not utilized.
The Company has assessed the recoverability of the deferred tax assets and believes it is more likely than not that the assets will be realized. The Company has not recorded a valuation allowance as of December 31, 2019 and 2018.
Accounting for Uncertainty in Income Taxes
A reconciliation of the beginning and ending amount of the Company's liability for income taxes associated with unrecognized tax benefits is as follows:
December 31, | |||||||
2019 | 2018 | ||||||
(in thousands) | |||||||
Balance as of January 1, | $ | 33 | $ | 33 | |||
Increase related to current year tax positions | — | — | |||||
Decrease related to prior year tax positions | (5 | ) | — | ||||
Balance as of December 31, | $ | 28 | $ | 33 | |||
The Company’s policy regarding interest and penalties related to uncertain tax positions is to recognize such items as a component of the provision for income taxes. The Company recorded less than $0.1 million in interest and penalties in the consolidated statements of operations for the years ended December 31, 2019 and 2018.
The Company does not expect that changes in the liability for unrecognized tax benefits during the next twelve months will have a significant impact on the Company's financial position or results of operations.
The Company files income tax returns with Federal, state and local jurisdictions. The Company’s U.S. Federal and state tax matters for the years 2016 through 2018 remain subject to examination by the respective tax authorities.
F-30
Note 16—Related Party Transactions
Sale of Subsidiary
On August 30, 2019, the Company sold the equity interests in PPI to Manning Partners, LLC, which is wholly-owned by the Chairman of the Company’s Board of Directors (Note 2). Subsequent to the close, PPI and the Company have entered into a sublease agreement under which PPI leases office space within the Company's headquarters for annual rent of approximately $0.1 million over the term of the sublease, which expires on January 31, 2028.
Transactions with noncontrolling members
From time to time, the Company may be asked to provide certain services, including accounting, legal and other administrative functions for the noncontrolling members of Manning & Napier Group. While immaterial, the Company has not received any reimbursement for such services.
The Company manages the personal funds and funds of affiliated entities of certain of the Company's executive officers and directors. Pursuant to the respective investment management agreements, in some instances the Company waives or reduces its regular advisory fees for these accounts. The aggregate value of the fees earned and fees waived was less than $0.1 million for the years ended December 31, 2019 and 2018.
Affiliated fund transactions
The Company earns investment advisory fees, distribution fees and administrative service fees under agreements with affiliated mutual funds and collective investment trusts. Fees earned for advisory and distribution services were approximately $40.5 million and $54.6 million in the years ended December 31, 2019 and 2018, respectively. Fees earned for administrative services provided were approximately $2.2 million for each of the years ended December 31, 2019 and 2018. See Note 3 for disclosure of amounts due from affiliated mutual funds and collective investment trusts.
The Company incurs certain expenses on behalf of the collective investment trusts and has contractually agreed to limit its fees and reimburse expenses to limit operating expenses incurred by certain affiliated fund series. The aggregate value of fees waived and expenses reimbursed to, or incurred for, affiliated mutual funds and collective investment trusts was approximately $5.5 million and $5.1 million for the years ended December 31, 2019 and 2018, respectively. As of December 31, 2019, the Company has recorded a receivable of approximately $0.2 million for expenses paid on behalf of an affiliated mutual fund. These expenses are reimbursable to the Company under an agreement with the affiliated mutual fund, and are included within other long-term assets on the consolidated statements of financial condition.
Note 17—Employee Benefit Plan
The Company offers the Manning & Napier Advisors, LLC 401(k) and Profit Sharing Plan (the “MNA Plan”) to all employees who meet the plan criteria.
With respect to the 401(k) portion of the MNA Plan, participants may voluntarily contribute up to 75% of their regular salary subject to annual limitations determined by the IRS. The Company matches an amount equivalent to 50% of a participant’s contribution, not to exceed 3% and 2% of their total compensation during the years ended December 31, 2019 and 2018, respectively. Matching contributions vest to the participants after three years of service. These contributions by the Company amounted to approximately $1.3 million and $1.0 million for the years ended December 31, 2019 and 2018, respectively.
With respect to the profit sharing portion of the MNA Plan, the Company may make annual profit sharing contributions, subject to certain limitations, which vest immediately to individuals who are eligible. These contributions by the Company amounted to approximately $0.5 million for both years ended December 31, 2019 and 2018.
Note 18—Subsequent Events
Distribution and Dividend
On March 3, 2020, the Board of Directors approved a $2.0 million distribution from Manning & Napier Group to Manning & Napier and the noncontrolling interests of Manning & Napier Group. Concurrently, the Board of Directors declared a $0.02 per share dividend to the holders of Class A common stock. The dividend is payable on May 1, 2020 to shareholders of record as of April 1, 2020.
Exchange of Class A units of Manning & Napier Group
The Company is nearing the completion of the 2020 exchange period whereby eligible Class A units of Manning & Napier Group held by M&N Group Holdings and MNCC may be tendered for exchange. In connection with the exchange, the Company has the ability to pay an amount of cash equal to the number of units exchanged multiplied by the value of one share
F-31
Manning & Napier, Inc.
Notes to Consolidated Financial Statements (Continued)
of the Company's Class A common stock less a market discount and expected expenses, or at the Company's election issue shares of Class A common stock on a one-for-one basis.
F-32