Attached files
| file | filename |
|---|---|
| EXCEL - IDEA: XBRL DOCUMENT - Manning & Napier, Inc. | Financial_Report.xls |
| EX-31.1 - EX-31.1 - Manning & Napier, Inc. | d377371dex311.htm |
| EX-32.1 - EX-32.1 - Manning & Napier, Inc. | d377371dex321.htm |
| EX-32.2 - EX-32.2 - Manning & Napier, Inc. | d377371dex322.htm |
| EX-31.2 - EX-31.2 - Manning & Napier, Inc. | d377371dex312.htm |
Table of Contents
UNITED STATES
SECURITIES AND EXCHANGE COMMISSION
Washington, D.C. 20549
FORM 10-Q
(Mark One)
| x | QUARTERLY REPORT PURSUANT TO SECTION 13 OR 15(d) OF THE SECURITIES EXCHANGE ACT OF 1934 |
For the quarterly period ended June 30, 2012
OR
| ¨ | TRANSITION REPORT PURSUANT TO SECTION 13 OR 15(d) OF THE SECURITIES EXCHANGE ACT OF 1934 |
For the transition period from to
Commission file number: 001-35355
MANNING & NAPIER, INC.
(Exact name of registrant as specified in its charter)
| Delaware | 45-2609100 | |
| (State or other jurisdiction of incorporation or organization) |
(I.R.S. Employer Identification No.) | |
| 290 Woodcliff Drive Fairport, New York |
14450 | |
| (Address of principal executive offices) | (Zip Code) | |
Registrant’s telephone number, including area code:
(585) 325-6880
Indicate by check mark whether the registrant (1) has filed all reports required to be filed by Section 13 or 15(d) of the Securities Exchange Act of 1934 during the preceding 12 months (or for such shorter period that the registrant was required to file such reports), and (2) has been subject to such filing requirements for the past 90 days. Yes x No ¨
Indicate by check mark whether the registrant has submitted electronically and posted on its corporate Web site, if any, every Interactive Data File required to be submitted and posted pursuant to Rule 405 of Regulation S-T during the preceding 12 months (or for such shorter period that the registrant was required to submit and post such files). Yes x No ¨
Indicate by check mark whether the registrant is a large accelerated filer, an accelerated filer, a non-accelerated filer, or a smaller reporting company. See the definitions of “large accelerated filer,” “accelerated filer” and “smaller reporting company” in Rule 12b-2 of the Exchange Act:
| Large accelerated filer | ¨ | Accelerated filer | ¨ | |||
| Non-accelerated filer | x (Do not check if a smaller reporting company) | Smaller reporting company | ¨ | |||
Indicate by check mark whether the registrant is a shell company (as defined in Rule 12b-2 of the Exchange Act). Yes ¨ No x
Indicate the number of shares outstanding of each of the registrant’s classes of common stock, as of the latest practicable date.
| Class |
Outstanding at August 8, 2012 | |
| Class A common stock, $0.01 par value per share |
13,583,873 | |
| Class B common stock, $0.01 par value per share |
1,000 |
Table of Contents
| Page | ||||||
| Part I |
Financial Information | |||||
| Item 1. |
||||||
| Combined Consolidated Statements of Financial Condition as of June 30, 2012 and December 31, 2011 |
1 | |||||
| 2 | ||||||
| 3 | ||||||
| Combined Consolidated Statement of Shareholders’ Equity for the six months ended June 30, 2012 |
4 | |||||
| Combined Consolidated Statements of Cash Flows for the six months ended June 30, 2012 and 2011 |
5 | |||||
| Item 2. |
Management’s Discussion and Analysis of Financial Condition and Results of Operations |
13 | ||||
| Item 3. |
30 | |||||
| Item 4. |
31 | |||||
| Part II |
Other Information | |||||
| Item 1. |
31 | |||||
| Item 1A. |
31 | |||||
| Item 2. |
31 | |||||
| Item 6. |
32 | |||||
| In this Quarterly Report on Form 10-Q, “we”, “our”, “us”, the “Company”, “Manning & Napier” and the “Registrant” refers to Manning & Napier, Inc. and, unless the context otherwise requires, its consolidated direct and indirect subsidiaries and predecessors. |
||||||
i
Table of Contents
Combined Consolidated Statements of Financial Condition
As of June 30, 2012 and December 31, 2011
| (in thousands, except share data) | June 30, 2012 |
December 31, 2011 |
||||||
| (unaudited) | ||||||||
| Assets |
||||||||
| Cash and cash equivalents |
$ | 95,127 | $ | 81,208 | ||||
| Accounts receivable |
20,117 | 18,409 | ||||||
| Accounts receivable—Manning & Napier Fund, Inc. |
12,295 | 12,850 | ||||||
| Investment securities, at fair value |
7,931 | 4,642 | ||||||
| Prepaid expenses and other assets |
3,615 | 4,126 | ||||||
|
|
|
|
|
|||||
| Total current assets |
139,085 | 121,235 | ||||||
| Property and equipment, net |
4,747 | 3,812 | ||||||
| Net deferred tax assets, non-current |
52,101 | 53,786 | ||||||
|
|
|
|
|
|||||
| Total non-current assets |
56,848 | 57,598 | ||||||
| Total assets |
$ | 195,933 | $ | 178,833 | ||||
|
|
|
|
|
|||||
| Liabilities |
||||||||
| Accounts payable |
$ | 1,153 | $ | 1,139 | ||||
| Accrued expenses and other liabilities |
33,371 | 30,099 | ||||||
| Deferred revenue |
10,429 | 9,902 | ||||||
|
|
|
|
|
|||||
| Total current liabilities |
44,953 | 41,140 | ||||||
| Amounts payable under tax receivable agreement |
45,924 | 45,885 | ||||||
|
|
|
|
|
|||||
| Total non-current liabilities |
45,924 | 45,885 | ||||||
| Total liabilities |
90,877 | 87,025 | ||||||
| Commitments and contingencies (Note 7) |
||||||||
| Shareholders’ equity |
||||||||
| Class A common stock, $0.01 par value 300,000,000 shares authorized, 13,583,873 issued and outstanding at June 30, 2012 and December 31, 2011 |
$ | 136 | $ | 136 | ||||
| Class B common stock, $0.01 par value; 2,000 shares authorized, 1,000 shares issued and outstanding at June 30, 2012 and December 31, 2011 |
0 | 0 | ||||||
| Additional paid-in capital |
191,966 | 188,133 | ||||||
| Retained deficit |
(30,447 | ) | (27,167 | ) | ||||
| Accumulated other comprehensive income |
1 | 2 | ||||||
|
|
|
|
|
|||||
| Total shareholders’ equity attributable to Manning & Napier Group |
161,656 | 161,104 | ||||||
| Noncontrolling interest (deficit) |
(56,600 | ) | (69,296 | ) | ||||
|
|
|
|
|
|||||
| Total shareholders’ equity and noncontrolling interest (deficit) |
105,056 | 91,808 | ||||||
|
|
|
|
|
|||||
| Total liabilities, shareholders’ equity and noncontrolling interest (deficit) |
$ | 195,933 | $ | 178,833 | ||||
|
|
|
|
|
|||||
The accompanying notes are an integral part of these combined consolidated financial statements.
1
Table of Contents
Combined Consolidated Statements of Operations
Three and Six Months Ended June 30, 2012 and 2011
(Unaudited)
| Three months ended June 30, | Six months ended June 30, | |||||||||||||||
| (in thousands, except share data) | 2012 | 2011 | 2012 | 2011 | ||||||||||||
| Revenues |
||||||||||||||||
| Investment management service revenue |
$ | 81,529 | $ | 85,805 | $ | 166,543 | $ | 163,845 | ||||||||
| Expenses |
||||||||||||||||
| Compensation and related costs |
46,570 | 27,061 | 74,302 | 49,955 | ||||||||||||
| Sub-transfer agent and shareholder service costs |
12,471 | 12,668 | 25,145 | 24,363 | ||||||||||||
| Other operating costs |
9,259 | 9,700 | 17,848 | 15,925 | ||||||||||||
|
|
|
|
|
|
|
|
|
|||||||||
| Total operating expenses |
68,300 | 49,429 | 117,295 | 90,243 | ||||||||||||
|
|
|
|
|
|
|
|
|
|||||||||
| Operating income |
13,229 | 36,376 | 49,248 | 73,602 | ||||||||||||
| Non-operating (loss) income: |
||||||||||||||||
| Interest expense on shares subject to mandatory redemption |
— | (16,095 | ) | — | (29,383 | ) | ||||||||||
| Interest expense |
(8 | ) | (10 | ) | (12 | ) | (19 | ) | ||||||||
| Interest and dividend income |
50 | 14 | 69 | 28 | ||||||||||||
| Net capital losses on investments |
(616 | ) | (159 | ) | (236 | ) | (156 | ) | ||||||||
|
|
|
|
|
|
|
|
|
|||||||||
| Total non-operating loss |
(574 | ) | (16,250 | ) | (179 | ) | (29,530 | ) | ||||||||
|
|
|
|
|
|
|
|
|
|||||||||
| Income before provision for income taxes |
12,655 | 20,126 | 49,069 | 44,072 | ||||||||||||
| Provision for income taxes |
3,199 | 253 | 5,189 | 539 | ||||||||||||
|
|
|
|
|
|
|
|
|
|||||||||
| Net income attributable to controlling and noncontrolling interests |
9,456 | 19,873 | 43,880 | 43,533 | ||||||||||||
| Less: net income attributable to noncontrolling interests |
11,292 | 19,873 | 42,813 | 43,533 | ||||||||||||
|
|
|
|
|
|
|
|
|
|||||||||
| Net (loss) income attributable to Manning & Napier, Inc. |
$ | (1,836 | ) | $ | — | $ | 1,067 | $ | — | |||||||
|
|
|
|
|
|
|
|
|
|||||||||
| Net (loss) income per share available to Class A common stock |
||||||||||||||||
| Basic |
$ | (0.14 | ) | $ | 0.08 | |||||||||||
|
|
|
|
|
|||||||||||||
| Diluted |
$ | (0.14 | ) | $ | 0.08 | |||||||||||
|
|
|
|
|
|||||||||||||
| Weighted average shares of Class A common stock outstanding |
||||||||||||||||
| Basic |
13,583,873 | 13,583,873 | ||||||||||||||
|
|
|
|
|
|||||||||||||
| Diluted |
13,583,873 | 13,583,873 | ||||||||||||||
|
|
|
|
|
|||||||||||||
| Cash dividends declared per share of Class A common stock |
$ | 0.16 | $ | 0.32 | ||||||||||||
|
|
|
|
|
|||||||||||||
The accompanying notes are an integral part of these combined consolidated financial statements.
2
Table of Contents
Combined Consolidated Statements of Comprehensive Income
Three and Six Months Ended June 30, 2012 and 2011
(Unaudited)
| Three months ended June 30, | Six months ended June 30, | |||||||||||||||
| (in thousands) | 2012 | 2011 | 2012 | 2011 | ||||||||||||
| Net income |
$ | 9,456 | $ | 19,873 | $ | 43,880 | $ | 43,533 | ||||||||
| Net unrealized holding (loss) gain on investment securities, net of tax |
(11 | ) | 235 | (1 | ) | 596 | ||||||||||
| Reclassification adjustment for realized losses on marketable securities included in net income |
— | (156 | ) | — | (156 | ) | ||||||||||
|
|
|
|
|
|
|
|
|
|||||||||
| Comprehensive income |
$ | 9,445 | $ | 19,952 | $ | 43,879 | $ | 43,973 | ||||||||
|
|
|
|
|
|
|
|
|
|||||||||
The accompanying notes are an integral part of these combined consolidated financial statements.
3
Table of Contents
Combined Consolidated Statement of Shareholders’ Equity
Six Months Ended June 30, 2012
(Unaudited)
| Common Stock – class A | Common Stock – class B | Additional Paid in |
Retained (Deficit) |
Accumulated Other Comprehensive |
Non Interest |
|||||||||||||||||||||||||||||||
| (in thousands, except share data) | Shares | Amount | Shares | Amount | Capital | Earnings | Income (Loss) | (Deficit) | Total | |||||||||||||||||||||||||||
| Balance—December 31, 2011 |
13,583,873 | $ | 136 | 1,000 | $ | 0 | $ | 188,133 | $ | (27,167 | ) | $ | 2 | $ | (69,296 | ) | $ | 91,808 | ||||||||||||||||||
| Net income |
1,067 | 42,813 | 43,880 | |||||||||||||||||||||||||||||||||
| Distributions |
(54,030 | ) | (54,030 | ) | ||||||||||||||||||||||||||||||||
| Net changes in unrealized investment securities gains or losses |
(1 | ) | (1 | ) | ||||||||||||||||||||||||||||||||
| Equity-based compensation |
3,833 | 23,913 | 27,746 | |||||||||||||||||||||||||||||||||
| Dividends declared on Class A common stock |
(4,347 | ) | (4,347 | ) | ||||||||||||||||||||||||||||||||
|
|
|
|
|
|
|
|
|
|
|
|
|
|
|
|
|
|
|
|||||||||||||||||||
| Balance—June 30, 2012 |
13,583,873 | $ | 136 | 1,000 | $ | 0 | $ | 191,966 | $ | (30,447 | ) | $ | 1 | $ | (56,600 | ) | $ | 105,056 | ||||||||||||||||||
|
|
|
|
|
|
|
|
|
|
|
|
|
|
|
|
|
|
|
|||||||||||||||||||
The accompanying notes are an integral part of these combined consolidated financial statements.
4
Table of Contents
Combined Consolidated Statements of Cash Flows
Six Months Ended June 30, 2012 and 2011
(Unaudited)
| Six months ended June 30, | ||||||||
| (in thousands) | 2012 | 2011 | ||||||
| Cash flows from operating activities: |
||||||||
| Net income |
$ | 43,880 | $ | 43,533 | ||||
| Adjustments to reconcile net income to net cash provided by operating activities: |
||||||||
| Interest expense related to change in mandatory redemption liability |
— | 29,383 | ||||||
| Equity-based compensation |
27,746 | 619 | ||||||
| Depreciation |
839 | 532 | ||||||
| Change in amounts payable under tax receivable agreement |
39 | — | ||||||
| Net loss on investment securities |
236 | 156 | ||||||
| Deferred income taxes |
1,701 | — | ||||||
| (Increase) decrease in operating assets and increase (decrease) in operating liabilities: |
||||||||
| Accounts receivable |
(1,708 | ) | (1,827 | ) | ||||
| Accounts receivable—Manning & Napier Fund, Inc. |
555 | (2,094 | ) | |||||
| Prepaid expenses and other assets |
324 | (443 | ) | |||||
| Accounts payable |
14 | 536 | ||||||
| Accrued expenses and other liabilities |
1,914 | 7,725 | ||||||
| Deferred revenue |
527 | 1,123 | ||||||
|
|
|
|
|
|||||
| Net cash provided by operating activities |
76,067 | 79,243 | ||||||
|
|
|
|
|
|||||
| Cash flows from investing activities: |
||||||||
| Purchases of property and equipment |
(1,774 | ) | (342 | ) | ||||
| Sale of investments |
1,792 | 807 | ||||||
| Purchase of investments |
(5,317 | ) | (927 | ) | ||||
|
|
|
|
|
|||||
| Net cash used in investing activities |
(5,299 | ) | (462 | ) | ||||
|
|
|
|
|
|||||
| Cash flows from financing activities: |
||||||||
| Distributions |
(54,030 | ) | (73,641 | ) | ||||
| Dividends paid |
(2,173 | ) | — | |||||
| Payment of stock purchase note payable |
— | (77 | ) | |||||
| Payment of capital lease obligations |
(48 | ) | (43 | ) | ||||
| Proceeds on issuance of stock |
— | 32 | ||||||
| Capital contributions |
— | 2,478 | ||||||
| Payments of costs directly associated with issuance of Class A common stock |
(598 | ) | — | |||||
|
|
|
|
|
|||||
| Net cash used in financing activities |
(56,849 | ) | (71,251 | ) | ||||
|
|
|
|
|
|||||
| Net increase in cash and cash equivalents |
13,919 | 7,530 | ||||||
| Cash and cash equivalents: |
||||||||
| Beginning of period |
81,208 | 27,543 | ||||||
|
|
|
|
|
|||||
| End of period |
$ | 95,127 | $ | 35,073 | ||||
|
|
|
|
|
|||||
The accompanying notes are an integral part of these combined consolidated financial statements.
5
Table of Contents
Manning & Napier, Inc.
NOTES TO COMBINED CONSOLIDATED FINANCIAL STATEMENTS
(Dollars in thousands except per unit or per share amounts)
Note 1—Organization and Nature of the Business
Manning & Napier, Inc. provides a broad range of investment solutions through separately managed accounts, mutual funds, and collective investment trust funds, as well as a variety of consultative services that complement our investment process. Founded in 1970, we offer equity and fixed income portfolios as well as a range of blended asset portfolios, such as life cycle funds, that use a mix of stocks and bonds. Headquartered in Fairport, New York, we serve a diversified client base of high net worth individuals and institutions, including 401(k) plans, pension plans, Taft-Hartley plans, endowments and foundations.
The Company was incorporated on June 22, 2011 for the purpose of facilitating an initial public offering of 13,583,873 shares of its Class A common stock and to become the sole managing member of Manning & Napier Group, LLC and its subsidiaries (“Manning & Napier Group”), a holding company for the investment management businesses conducted by its operating subsidiaries. Prior to the series of transactions to reorganize our capital structure prior to our initial public offering, which we refer to as the reorganization transactions, and the consummation of our initial public offering, we were a group of privately-held, affiliated companies, which we refer to as the “Manning & Napier Companies”.
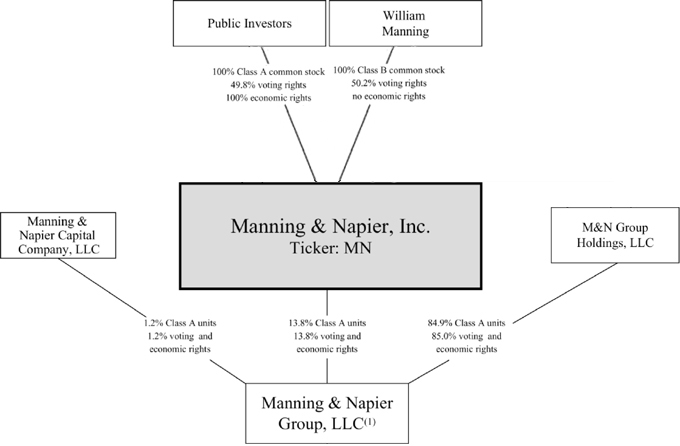
| (1) | Manning & Napier, Inc. is the sole managing member of Manning & Napier Group. The operating subsidiaries of Manning & Napier Group includes Manning & Napier Advisors, LLC, Manning & Napier Advisory Advantage Company, LLC, Exeter Advisors I, LLC, Manning & Napier Alternative Opportunities, LLC, Perspective Partners LLC, Manning & Napier Information Services, LLC, Manning & Napier Investor Services, Inc. and Exeter Trust Company. |
Note 2—Summary of Significant Accounting Policies
Critical Accounting Policies
There have been no significant changes in new accounting pronouncements or in our critical accounting policies and estimates from those that were disclosed in our Annual Report on Form 10-K for the year ended December 31, 2011.
The Company believes that the disclosures herein are adequate so that the information presented is not misleading; however, it is suggested that these financial statements be read in conjunction with the financial statements and the notes thereto in our Annual Report on Form 10-K for the year ended December 31, 2011. The financial data for the interim periods may not necessarily be indicative of results to be expected for the year.
6
Table of Contents
Basis of Presentation
The accompanying unaudited combined consolidated financial statements were prepared in accordance with accounting principles generally accepted in the United States of America (“U.S. GAAP”) and related rules and regulations of the U.S. Securities and Exchange Commission (“SEC”) for interim financial reporting and include all adjustments which are, in the opinion of management, necessary for a fair presentation.
The preparation of financial statements in conformity with U.S. GAAP requires management to make estimates or assumptions that affect the reported amounts and disclosures in the combined consolidated financial statements. Actual results could differ from these estimates or assumptions.
Principles of Consolidation
Manning & Napier is the sole managing member of Manning & Napier Group. Following the Company’s 2011 reorganization transactions and initial public offering, Manning & Napier holds approximately 13.8% economic interest in Manning & Napier Group, but as managing member controls the management of Manning & Napier Group. As a result, the Company consolidates the financial results of Manning & Napier Group and records a noncontrolling interest on its balance sheet with respect to the remaining economic interest in Manning & Napier Group held by Manning & Napier Group Holdings, LLC (“M&N Group Holdings”), Manning & Napier Capital Company, LLC (“MNCC”) and the other members of Manning & Napier Group.
For periods prior to the reorganization, the financial statements include the combined accounts of the Manning & Napier Companies.
All material intercompany transactions have been eliminated in consolidation.
Operating Segments
The Company operates in one segment, the investment management industry. The Company primarily provides investment management services to separately managed accounts, mutual funds and collective investment trust funds. Management assesses the financial performance of these vehicles on a combined basis.
Advisory Agreements
The Company derives significant revenue from its role as advisor to the Manning & Napier Fund, Inc. series of mutual funds (“Fund”) and the Exeter Trust Company (“Exeter” or “ETC”) Collective Investment Trust (“CIT”) investment vehicles.
Investments in the Fund amounted to approximately $0.8 million and $0.7 million at June 30, 2012 and December 31, 2011, respectively.
For the three and six months ended June 30, 2012, fees earned for advisory related services provided to the Fund and CIT investment vehicles totaled approximately $42.0 million and $84.9 million, respectively. For the three and six months ended June 30, 2011, fees earned for advisory related services provided to the Fund and CIT investment vehicles were approximately $43.6 and $82.6 million, respectively. These amounts represent greater than 10% of revenue in each period.
Recent Accounting Pronouncements
In June 2011, the Financial Accounting Standards Board (“FASB”) issued Accounting Standards Update (“ASU”) 2011-05, Comprehensive Income (Topic 220): Presentation of Comprehensive Income. This standard eliminates the current option to report other comprehensive income and its components in the statement of changes in equity. In December 2011, the FASB issued an amendment to this standard which defers the requirement to present components of reclassifications of other comprehensive income on the face of the income statement. These amendments are effective for annual periods beginning after December 15, 2011. The adoption of these amendments on January 1, 2012 did not have a material impact on the Company’s combined consolidated financial statements and related disclosures.
In May 2011, FASB issued ASU 2011-04, Fair Value Measurement (Topic 820): Amendments to Achieve Common Fair Value Measurement and Disclosure Requirements in U.S. GAAP and International Financial Reporting Standards. The amendments in this update change the wording used to describe the requirements in U.S. GAAP for measuring fair value and for disclosing information about fair value measurements. These amendments are effective for annual periods beginning after December 15, 2011. The adoption of these amendments on January 1, 2012 did not have a material impact on the Company’s combined consolidated financial statements and related disclosures.
7
Table of Contents
Note 3—Noncontrolling Interests
Manning & Napier is the sole managing member of Manning & Napier Group. Manning & Napier holds an approximately 13.8% economic interest in Manning & Napier Group, but as managing member controls the management of Manning & Napier Group. As a result, the Company consolidates the financial results of Manning & Napier Group and records a noncontrolling interest on its statement of financial condition with respect to the remaining approximately 86.2% economic interest in Manning & Napier Group held by M&N Group Holdings, MNCC and the other members of Manning & Napier Group. Net income attributable to noncontrolling interest on the statements of operations represents the portion of earnings or loss attributable to the economic interest in Manning & Napier Group held by the noncontrolling members. Subsequent to its initial public offering, the Company has consolidated the results of Manning & Napier Group; therefore, all income for the period prior to the initial public offering is entirely attributable to noncontrolling interest. A reconciliation from “Income before provision for income taxes” to “Net income (loss) attributable to Manning & Napier, Inc.” is detailed as follows:
| Three Months Ended June 30, 2012 |
Six Months Ended June 30, 2012 |
|||||||
| Income before provision for income taxes |
$ | 12,655 | $ | 49,069 | ||||
| Less: loss before provision for income taxes of Manning & Napier, Inc. (a) |
(397 | ) | (763 | ) | ||||
|
|
|
|
|
|||||
| Income before provision for income taxes, as adjusted |
13,052 | 49,832 | ||||||
| Controlling interest percentage (b) |
13.8 | % | 13.8 | % | ||||
|
|
|
|
|
|||||
| Net income attributable to controlling interest |
1,803 | 6,884 | ||||||
| Plus: loss before provision for income taxes of Manning & Napier, Inc. (a) |
397 | 763 | ||||||
|
|
|
|
|
|||||
| Income before income taxes attributable to Manning & Napier |
1,406 | 6,121 | ||||||
| Less: provision for income taxes of Manning & Napier, Inc. (c) |
3,242 | 5,054 | ||||||
|
|
|
|
|
|||||
| Net (loss) income attributable to Manning & Napier, Inc. |
$ | (1,836 | ) | $ | 1,067 | |||
|
|
|
|
|
|||||
| a) | Manning & Napier, Inc. incurs certain expenses that are only attributable to Manning & Napier, Inc. and are therefore excluded from the net income attributable to noncontrolling interests. |
| b) | Income before provision for income taxes is allocated to the controlling interest based on the percentage of units of Manning & Napier Group held by Manning & Napier, Inc. |
| c) | The consolidated provision for income taxes is equal to the sum of (i) the provision for income taxes for entities other than Manning & Napier, Inc. and (ii) the provision for income taxes of Manning & Napier, Inc. which includes all U.S. federal and state income taxes. The consolidated provision for income taxes totaled approximately $3.2 million and $5.2 million for the three and six months ended June 30, 2012. |
During the three and six months ended June 30, 2012, the Company made approximately $27.0 million and $54.0 million in distributions to noncontrolling members, respectively. None of these distributions were payments pursuant to the tax receivable agreement (“TRA”).
As of June 30, 2012 and December 31, 2011, the Company had recorded a liability of $46.2 million, representing the payments due to the selling unit holders under the TRA. During 2012, the Company expects to pay approximately $0.3 million of the total amount. The basis for determining the current portion of the payments under the TRA is the expected amount of payments to be made within the next 12 months. The long-term portion of the payments under the tax receivable agreement is the remainder. We recorded an adjustment of less than $0.1 million to the liability during the six months ended June 30, 2012 to account for changes in enacted tax rates in various states.
Obligations pursuant to the TRA are obligations of Manning & Napier. They do not impact the noncontrolling interest. These obligations are not income tax obligations. Furthermore, the TRA has no impact on the allocation of the provision for income taxes to the Company’s net income.
8
Table of Contents
Note 4—Investment Securities
The following table represents the Company’s investment securities holdings at June 30, 2012 and December 31, 2011:
| At June 30, 2012 | Cost | Unrealized Gains |
Unrealized Losses |
Fair Value |
||||||||||||
| (in thousands) | ||||||||||||||||
| Available-for-sale securities |
||||||||||||||||
| U.S. Treasury Note (0.375%, 9/30/2012) |
$ | 504 | $ | 2 | $ | — | $ | 506 | ||||||||
| U.S. Treasury Note (1.75%, 1/31/2014) |
102 | 1 | — | 103 | ||||||||||||
|
|
|
|
|
|
|
|
|
|||||||||
| 606 | 3 | — | 609 | |||||||||||||
|
|
|
|
|
|
|
|
|
|||||||||
| Trading Securities |
||||||||||||||||
| Equity securities |
|
5,744 | ||||||||||||||
| Short-term securities |
|
800 | ||||||||||||||
| Managed mutual funds |
|
778 | ||||||||||||||
|
|
|
|||||||||||||||
| 7,322 | ||||||||||||||||
|
|
|
|||||||||||||||
| Total investment securities |
$ | 7,931 | ||||||||||||||
|
|
|
|||||||||||||||
| At December 31, 2011 | Cost | Unrealized Gains |
Unrealized Losses |
Fair Value |
||||||||||||
| (in thousands) | ||||||||||||||||
| Available-for-sale securities |
||||||||||||||||
| U.S. Treasury Note (0.375%, 9/30/2012) |
$ | 504 | $ | 2 | $ | — | $ | 506 | ||||||||
| U.S. Treasury Note (1.75%, 1/31/2014) |
102 | 2 | — | 104 | ||||||||||||
|
|
|
|
|
|
|
|
|
|||||||||
| $ | 606 | $ | 4 | — | 610 | |||||||||||
| Trading Securities |
||||||||||||||||
| Equity securities |
|
2,656 | ||||||||||||||
| Short-term securities |
|
636 | ||||||||||||||
| Managed mutual funds |
|
740 | ||||||||||||||
|
|
|
|||||||||||||||
| 4,032 | ||||||||||||||||
|
|
|
|||||||||||||||
| Total investment securities |
$ | 4,642 | ||||||||||||||
|
|
|
|||||||||||||||
Investment securities are classified as either trading or available-for-sale and are carried at fair value. Fair value is determined based on quoted market prices in active markets for identical or similar instruments.
Investment securities classified as trading consist of short-term securities, equity securities, and investments in mutual funds for which the Company provides advisory services. At June 30, 2012 and December 31, 2011, trading securities consist solely of investments held by the Company for the purpose of providing initial cash seeding for product development purposes. The Company recognized $0.5 million and $0.1 million of net unrealized losses related to investments classified as trading for the three and six month periods ended June 30, 2012, respectively. For the three and six month periods ended June 30, 2011 there were no net unrealized gains or losses related to investments classified as trading.
Investment securities classified as available-for-sale consist of U.S. Treasury Notes, which are held by ETC in order to comply with New Hampshire state regulations. As of June 30, 2012 and December 31, 2011, $0.6 million of investment securities is considered restricted. The Company periodically reviews each individual security position that has an unrealized loss, or impairment, to determine if that impairment is other-than-temporary. No other-than-temporary impairment charges have been recognized by the Company during the three and six month periods ended June 30, 2012 and 2011.
Note 5—Fair Value Measurements
In accordance with current accounting standards, fair value is defined as the price that the Company would receive upon selling an investment in an orderly transaction to an independent buyer in the principal or most advantageous market of the investment. A fair value hierarchy is provided that gives the highest priority to unadjusted quoted prices in active markets for identical assets and liabilities (Level 1) and the lowest priority to unobservable inputs (Level 3).
The following three-tier fair value hierarchy prioritizes the inputs used in measuring fair value:
Level 1—observable inputs such as quoted prices in active markets for identical securities;
Level 2—other significant observable inputs (including but not limited to quoted prices for similar securities, interest rates, prepayment rates, credit risk, etc.); and
Level 3—significant unobservable inputs (including the Company’s own assumptions in determining the fair value of investments).
9
Table of Contents
The following provides the hierarchy of inputs used to derive the fair value of the Company’s assets as of June 30, 2012 and December 31, 2011:
| Level 1 | Level 2 | Level 3 | Totals | |||||||||||||
| (in thousands) | ||||||||||||||||
| At June 30, 2012 |
||||||||||||||||
| Equity securities |
$ | 4,243 | $ | 1,501 | $ | — | $ | 5,744 | ||||||||
| Short-term securities |
800 | — | — | 800 | ||||||||||||
| Managed mutual funds |
778 | — | — | 778 | ||||||||||||
| U.S. Treasury Note (0.375%, 9/30/2012) |
— | 506 | — | 506 | ||||||||||||
| U.S. Treasury Note (1.75%, 1/31/2014) |
— | 103 | — | 103 | ||||||||||||
|
|
|
|
|
|
|
|
|
|||||||||
| $ | 5,821 | $ | 2,110 | $ | — | $ | 7,931 | |||||||||
|
|
|
|
|
|
|
|
|
|||||||||
| At December 31, 2011 |
||||||||||||||||
| Equity securities |
$ | 2,656 | $ | — | $ | — | $ | 2,656 | ||||||||
| Short-term securities |
636 | — | — | 636 | ||||||||||||
| Managed mutual funds |
740 | — | — | 740 | ||||||||||||
| U.S. Treasury Note (0.375%, 9/30/2012) |
— | 506 | — | 506 | ||||||||||||
| U.S. Treasury Note (1.75%, 1/31/2014) |
— | 104 | — | 104 | ||||||||||||
|
|
|
|
|
|
|
|
|
|||||||||
| $ | 4,032 | $ | 610 | $ | — | $ | 4,642 | |||||||||
|
|
|
|
|
|
|
|
|
|||||||||
There were no Level 3 securities held by the Company as of June 30, 2012 or December 31, 2011.
The Company’s policy is to recognize transfers in and transfers out of the valuation levels as of the beginning of the reporting period. There were no transfers between Level 1 and Level 2 during the six months ended June 30, 2012.
Note 6—Accrued Expenses and Other Liabilities
Accrued expenses and other liabilities as of June 30, 2012 and December 31, 2011 consisted of the following:
| June 30, 2012 |
December 31, 2011 |
|||||||
| (in thousands) | ||||||||
| Accrued sales commissions |
$ | 6,277 | $ | 5,715 | ||||
| Accrued bonuses |
11,158 | 9,991 | ||||||
| Accrued sub-transfer agent fees |
6,878 | 6,492 | ||||||
| Accrued professional service fees |
1,085 | 3,055 | ||||||
| Dividends payable |
2,173 | — | ||||||
| Other accruals and liabilities |
5,800 | 4,846 | ||||||
|
|
|
|
|
|||||
| $ | 33,371 | $ | 30,099 | |||||
|
|
|
|
|
|||||
Note 7—Commitments and Contingencies
The Company may enter into agreements that contain certain representations and warranties and which provide general indemnifications. The Company may also serve as a guarantor of such obligations. The Company’s maximum exposure under these arrangements is unknown, as this would involve future claims that may be made against the Company that have not yet occurred. The Company expects any risk of liability associated with such guarantees to be remote.
As an investment adviser to a variety of investment products, the Company is subject to routine reviews and inspections by the SEC and the Financial Industry Regulatory Authority, Inc. (“FINRA”). From time to time the Company may also be subject to claims, be involved in various legal proceedings arising in the ordinary course of its business and other contingencies. The Company does not believe that the outcome of any of these reviews, inspections or other legal proceedings will have a material impact on its combined consolidated financial statements; however, litigation is subject to many uncertainties, and the outcome of individual litigated matters is difficult to predict. The Company will establish accruals for matters that are probable, can be reasonably estimated, and may take into account any related insurance recoveries to the extent of such recoveries. Currently, there are no legal proceedings pending or to the Company’s knowledge threatened against it. As of June 30, 2012 and December 31, 2011, the Company has not accrued for any such claims, legal proceedings, or other contingencies.
10
Table of Contents
Note 8—Earnings per Common Share
Basic earnings per share (“basic EPS”) is computed by dividing net income by the weighted average number of shares outstanding for the reporting period. Diluted earnings per share (“diluted EPS”) gives effect during the reporting period to all dilutive potential shares outstanding resulting from employee share-based awards. The following table sets forth the calculation of basic and diluted earnings per share for the three and six months ended June 30, 2012:
| Three months ended June 30, 2012 |
Six months ended June 30, 2012 |
|||||||
| (in thousands, except share data) | ||||||||
| Net income attributable to controlling and noncontrolling interests |
$ | 9,456 | $ | 43,880 | ||||
| Less: net income attributable to noncontrolling interests |
11,292 | 42,813 | ||||||
|
|
|
|
|
|||||
| Net (loss) income attributable to Manning & Napier, Inc |
$ | (1,836 | ) | $ | 1,067 | |||
|
|
|
|
|
|||||
| Net (loss) income available to Class A common stock per basic and diluted share |
$ | (0.14 | ) | $ | 0.08 | |||
|
|
|
|
|
|||||
| Weighted average shares of Class A common stock outstanding |
13,583,873 | 13,583,873 | ||||||
|
|
|
|
|
|||||
The Company’s Class B common stock represent voting interests and do not participate in the earnings of the Company. Accordingly, there is no basic or diluted EPS related to the Company’s Class B common stock.
At June 30, 2012 there were 76,400,000 Class A Units of Manning & Napier Group which, subject to certain restrictions, will be exchangeable for up to 76,400,000 shares of the Company’s Class A common stock. The restrictions set forth in the exchange agreement were in place at the end of the current reporting period. As such, these units were not included in the calculation of diluted earnings per common share for the three and six months ended June 30, 2012.
Note 9—Equity Based Compensation
2011 Equity Compensation Plan
As of June 30, 2012, no interests had been awarded under the 2011 Equity Compensation Plan (the “2011 Plan”). A total of 13,142,813 equity interests are available under the 2011 Plan.
Reorganization-Related Equity Based Compensation
During the three months ended June 30, 2012, the Company commenced recognition of compensation expense for the approximately 4.5 million performance-based awards eligible to vest on December 31, 2012 under the amended vesting terms of ownership interests in connection with the 2011 reorganization transactions. Vesting of these performance-based awards is contingent upon the satisfaction of annual performance criteria specific to each award recipient. The determination of whether an award recipient has met such performance criteria will be made by a vesting committee at the end of the annual service period. In accordance with ASC 718, Stock Compensation, the grant date for these performance-based awards will occur at the end of the service period. Until the grant date, compensation expense will be re-measured at the end of each reporting period, to the extent that service has been rendered in proportion to the total requisite service period. No expense is being recognized for the performance-based awards eligible to vest on December 31, 2013 and 2014 in connection with the 2011 reorganization transactions, as the performance conditions have not yet been defined.
The following table summarizes stock unit activity for the six months ended June 30, 2012 specific to the 2011 reorganization transactions:
| Performance-Based Stock Units |
Weighted Average Fair Value |
|||||||
| Stock unit awards outstanding at January 1, 2012 |
40,480 | $ | 12.00 | |||||
| Granted |
— | $ | — | |||||
| Vested |
— | $ | — | |||||
| Forfeited |
— | $ | — | |||||
|
|
|
|||||||
| Stock unit awards outstanding at June 30, 2012 |
40,480 | $ | 12.00 | |||||
|
|
|
|||||||
11
Table of Contents
| Service-Based Stock Units |
Weighted Average Grant Date Fair Value |
|||||||
| Stock unit awards outstanding at January 1, 2012 |
2,899,917 | $ | 12.00 | |||||
| Granted |
65,740 | $ | 13.45 | |||||
| Vested |
(65,740 | ) | $ | 13.45 | ||||
| Forfeited |
(28,791 | ) | $ | 12.00 | ||||
|
|
|
|||||||
| Stock unit awards outstanding at June 30, 2012 |
2,871,126 | $ | 12.00 | |||||
|
|
|
|||||||
For service-based awards granted during the six months ended June 30, 2012, the weighted average fair value of the awards granted was $13.45, as determined by the closing sale price of Manning & Napier, Inc.’s Class A common stock as reported on the New York Stock Exchange on the date of grant. For performance-based awards with a service inception date during the six months ended June 30, 2012, the weighted average value of the awards at the end of the reporting period was $14.23, as determined by the closing sale price of Manning & Napier, Inc.’s Class A common stock as reported on June 29, 2012.
For the three and six months ended June 30, 2012, the Company recorded approximately $24.0 million and $27.7 million, respectively, of compensation expense related to the amended vesting terms of ownership interests in connection with the 2011 reorganization transactions. For the three and six months ended June 30, 2012, approximately $2.7 million and $6.4 million, respectively, is attributable to the service-based awards. For the same periods, the remaining expense of approximately $21.3 million and $21.4 million, respectively, is attributable to performance based awards. For both the three and six months ending June 30, 2012, $21.2 million of the expense attributable to performance-based awards is related to awards eligible to vest on December 31, 2012 under the amended vesting terms of ownership interests in connection with the 2011 reorganization transactions. As discussed above, this expense is based upon the closing sale price of Manning & Napier Inc.’s Class A common stock as reported on the New York Stock Exchange on June 29, 2012. For the three and six months ended June 30, 2011, the Company recognized approximately $0.3 million and $0.6 million, respectively, of compensation expense related to shares granted.
As of June 30, 2012, there was unrecognized compensation expense related to unvested service-based awards of approximately $27.6 million. The Company expects to recognize this expense over a weighted average period of 1.7 years.
As of June 30, 2012, there was unrecognized compensation expense related to unvested performance-based awards of approximately $170.2 million, which the Company expects to recognize over a weighted average period of 1.6 years. Included in this total is an estimate of $169.8 million of estimated unrecognized compensation expense related to the approximately 13.5 million unvested performance-based awards under the amended vesting terms of ownership interests in connection with the 2011 reorganization transactions. This estimate is based upon the closing sale price of Manning & Napier, Inc.’s Class A common stock as reported on June 29, 2012, and includes performance awards eligible to vest through 2014. The Company expects to recognize this expense over a weighted average period of 1.6 years.
Stock unit awards forfeited during the six-month period ended June 30, 2012 were redistributed amongst the legacy owners, including William Manning. Of the stock units forfeited, 65,740 were granted to William Manning which vested immediately. The remaining units were awarded to the legacy owners and are subject to performance criteria. This award does not result in dilution to the number of outstanding shares of our Class A common stock. The aggregate intrinsic value of stock units that vested during the six months ended June 30, 2012 was approximately $0.9 million.
Note 10—Income Taxes
The Company is comprised of entities that have elected to be treated as either an “S-Corporation”, a limited liability company (LLC), or a “C-Corporation”. As such, the entities functioning as S-Corporations or LLC’s are not liable for or able to benefit from federal and most state income taxes on their earnings, and earnings (losses) will be included in the personal income tax returns of each entity’s shareholders or unit holders. The entities functioning as C-Corporations are liable for or able to benefit from federal and state taxes on their earnings and (losses), respectively.
12
Table of Contents
The Company’s income tax provision and effective tax rate were as follows:
| Three Months Ended June 30, |
Six Months Ended June 30, |
|||||||||||||||
| 2012 | 2011 | 2012 | 2011 | |||||||||||||
| (dollars in thousands) | ||||||||||||||||
| Earnings from continuing operations before income taxes |
$ | 12,655 | $ | 20,126 | $ | 49,069 | $ | 44,072 | ||||||||
| Effective Tax Rate |
25.3 | % | 1.3 | % | 10.6 | % | 1.2 | % | ||||||||
|
|
|
|
|
|
|
|
|
|||||||||
| Provision for income taxes |
3,199 | 253 | 5,189 | 539 | ||||||||||||
| Provision for income taxes @ 35% |
4,429 | 7,044 | 17,174 | 15,425 | ||||||||||||
|
|
|
|
|
|
|
|
|
|||||||||
| Difference between tax at effective vs. statutory rate |
$ | (1,230 | ) | $ | (6,791 | ) | $ | (11,985 | ) | $ | (14,886 | ) | ||||
|
|
|
|
|
|
|
|
|
|||||||||
For the three and six months ended June 30, 2012 and 2011, the difference between the Company’s recorded provision and the provision that would result from applying the U.S. statutory rate of 35% is primarily attributable to the benefit resulting from the fact that a significant portion of the Company’s operations include a series of flow-through entities which are generally not subject to federal and most state income taxes. Accordingly, a portion of the Company’s earnings are not subject to corporate level taxes.
Note 11—Related Party Transactions
Transactions with noncontrolling members
During the six months ended June 30, 2012, the Company loaned approximately $1.0 million to certain noncontrolling members in order for the entities to make required tax payments. The amount was repaid in full as of March 31, 2012.
From time to time, the Company may be asked to provide certain services, including accounting, legal and other administrative functions for the noncontrolling members of Manning & Napier Group. While immaterial, the Company has not received any reimbursement for such services.
Note 12—Subsequent Events
On August 7, 2012, the Board of Directors approved a distribution from Manning & Napier Group to Manning & Napier and the noncontrolling members of Manning & Napier Group. The amount of the distribution to the members of Manning & Napier Group is approximately $31.3 million. Concurrently, the Board of Directors declared a $0.16 per share dividend to the holders of Class A common stock. The dividend is payable on November 1, 2012 to shareholders of record as of October 15, 2012.
Item 2. Management’s Discussion and Analysis of Financial Condition and Results of Operations.
This report contains forward-looking statements within the meaning of section 27A of the Securities Act of 1933 and Section 21E of the Securities Exchange Act of 1934, which reflect our views with respect to, among other things, our operations and financial performance. Words like “believes,” “expects,” “may,” “estimates,” “will,” “should,” “intends,” “plans,” or “anticipates” or the negative thereof or other variations thereon or comparable terminology, are used to identify forward-looking statements, although not all forward-looking statements contain these words. Although we believe that we are basing our expectations and beliefs on reasonable assumptions within the bounds of what we currently know about our business and operations, there can be no assurance that our actual results will not differ materially from what we expect or believe. Some of the factors that could cause our actual results to differ materially from our expectations or beliefs are disclosed in the “Risk Factors” section of our Annual Report on Form 10-K which include, without limitation: changes in securities or financial markets or general economic conditions; a decline in the performance of our products; client sales and redemption activity; and changes of government policy or regulations. All forward-looking statements speak only as of the date on which they are made and we undertake no duty to update or revise any forward-looking statements, whether as a result of new information, future events or otherwise.
Overview
Business
We are an independent investment management firm that provides a broad range of investment solutions through separately managed accounts, mutual funds and collective investment trust funds. Founded in 1970, we offer equity and fixed income portfolios as well as a range of blended asset portfolios, such as life cycle portfolios, that use a mix of stocks and bonds. We serve a diversified client base of high net worth individuals and institutions, including 401(k) plans, pension plans, Taft-Hartley plans, and endowments and foundations. Our operations are based principally in the United States, with our headquarters located in Fairport, New York.
13
Table of Contents
Our Products
We derive substantially all of our revenues from investment management fees earned from providing advisory services to separately managed accounts and mutual funds and collective investment trusts—including those offered by the Manning & Napier Fund, Inc., or the Fund, and Exeter Trust Company.
| • | Our separate accounts are primarily distributed through our Direct Channel, where our representatives form relationships with high net worth individuals, middle market institutions or large institutions that are working with a consultant. To a lesser extent, we also obtain a portion of our separate account distribution via third parties, either through our Intermediary Channel where national brokerage firm representatives or independent financial advisors select our separate account strategies for their clients, or through our Platform/Sub-Advisory Channel, where unaffiliated registered investment advisors approve our strategies for their product platforms. Our separate account products are a primary driver of our blended asset portfolios for high net worth and middle market institutional clients and financial intermediaries. In contrast, larger institutions and unaffiliated registered investment advisor platforms are a driver of our separate account equity portfolios. |
| • | Our mutual funds and collective investment trusts are primarily distributed through financial intermediaries, including brokers, financial advisors, retirement plan advisors and platform relationships. We also obtain a portion of our mutual fund and collective investment trust distribution through our direct sales representatives, in particular within the defined contribution and institutional marketplace. Our mutual fund and collective investment trust products are an important driver of our blended asset class portfolios, in particular with 401(k) plan sponsors, advisors and recordkeepers that select our funds as default options for participants. In addition, financial intermediaries, mutual fund advisory programs and retail platforms are a driver of equity strategies within our mutual fund and collective investment trust fund offerings. |
14
Table of Contents
Our assets under management (“AUM”) was $42.4 billion as of June 30, 2012, as illustrated in the table below.
| As of June 30, 2012 | ||||||||||||||||
| Blended Asset |
Equity | Fixed Income | Total | |||||||||||||
| (in millions) | ||||||||||||||||
| Assets under management – By investment vehicle and portfolio |
||||||||||||||||
| Separately managed accounts |
$ | 11,113.3 | $ | 11,242.0 | $ | 1,195.2 | $ | 23,550.5 | ||||||||
| Mutual funds and collective investment trusts |
8,337.4 | 10,453.9 | 29.7 | 18,821.0 | ||||||||||||
|
|
|
|
|
|
|
|
|
|||||||||
| Total |
$ | 19,450.7 | $ | 21,695.9 | $ | 1,224.9 | $ | 42,371.5 | ||||||||
|
|
|
|
|
|
|
|
|
|||||||||
The composition of our separately managed accounts as of June 30, 2012, by channel and portfolio, is set forth in the table below.
| As of June 30, 2012 | ||||||||||||||||
| Blended Asset |
Equity | Fixed Income | Total | |||||||||||||
| (dollars in millions) | ||||||||||||||||
| Separate account AUM |
||||||||||||||||
| Direct Channel |
$ | 7,878.1 | $ | 8,034.3 | $ | 960.2 | $ | 16,872.6 | ||||||||
| Intermediary Channel |
3,235.2 | 856.8 | 235.0 | 4,327.0 | ||||||||||||
| Platform/Sub-advisor Channel |
— | 2,350.9 | — | 2,350.9 | ||||||||||||
|
|
|
|
|
|
|
|
|
|||||||||
| Total |
$ | 11,113.3 | $ | 11,242.0 | $ | 1,195.2 | $ | 23,550.5 | ||||||||
|
|
|
|
|
|
|
|
|
|||||||||
| Percentage of separate account AUM |
||||||||||||||||
| Direct Channel |
34 | % | 34 | % | 4 | % | 72 | % | ||||||||
| Intermediary Channel |
13 | % | 4 | % | 1 | % | 18 | % | ||||||||
| Platform/Sub-advisor Channel |
0 | % | 10 | % | 0 | % | 10 | % | ||||||||
|
|
|
|
|
|
|
|
|
|||||||||
| Total |
47 | % | 48 | % | 5 | % | 100 | % | ||||||||
|
|
|
|
|
|
|
|
|
|||||||||
| Percentage of portfolio by channel |
||||||||||||||||
| Direct Channel |
71 | % | 71 | % | 80 | % | 72 | % | ||||||||
| Intermediary Channel |
29 | % | 8 | % | 20 | % | 18 | % | ||||||||
| Platform/Sub-advisor Channel |
— | 21 | % | — | 10 | % | ||||||||||
|
|
|
|
|
|
|
|
|
|||||||||
| Total |
100 | % | 100 | % | 100 | % | 100 | % | ||||||||
|
|
|
|
|
|
|
|
|
|||||||||
| Percentage of channel by portfolio |
||||||||||||||||
| Direct Channel |
47 | % | 48 | % | 5 | % | 100 | % | ||||||||
| Intermediary Channel |
75 | % | 20 | % | 5 | % | 100 | % | ||||||||
| Platform/Sub-advisor Channel |
— | 100 | % | — | 100 | % | ||||||||||
Our separate accounts contributed 36% of our total gross client inflows for the six months ended June 30, 2012 and represented 56% of our total AUM as of June 30, 2012.
Our separate account business has historically been driven primarily by our Direct Channel, where sales representatives form a relationship with high net worth investors, middle market institutions, and large institutional clients working in conjunction with a consultant. The Direct Channel contributed 77% of the total gross client inflows for our separate account business for the six months ended June 30, 2012 and represented 72% of our total separate account AUM as of June 30, 2012. We anticipate the Direct Channel to continue to be the largest driver of new separate account business going forward, given the Channel’s high net worth and middle market institutional client-type focus.
During the first six months of 2012, equity and blended asset portfolios represented 68% and 25% of the separate account gross client inflows from the Direct Channel, respectively, while fixed income portfolios accounted for 7%. As of June 30, 2012, equity and blended asset portfolios represented 48% and 47% of total Direct Channel separate account AUM, while our fixed income portfolios were 5%. We expect our focus on individuals and middle market institutions to continue to drive interest in our blended asset class portfolios, where we provide a comprehensive portfolio of stocks and bonds managed to a client’s specific investment objectives. However, relationships with larger institutions have resulted in strong growth in equity portfolios as a percentage of total AUM, which will likely continue given the breadth of our offerings, including domestic, international and global equity portfolios.
15
Table of Contents
To a lesser extent, we also obtain separate account business from third parties, including financial advisors or unaffiliated registered investment advisor programs or platforms. During the first six months of 2012, 16% of the total gross client inflows for separate accounts came from financial advisor representatives (Intermediary Channel), and an additional 7% came from unaffiliated registered investment advisor platforms (Platform/Sub-advisor Channel). The Intermediary and Platform/Sub-advisor Channels represented 28% of our total separate account AUM as of June 30, 2012.
New separate account business through the Intermediary Channel were into both our blended asset and equity portfolios, driven by advisors’ needs to identify either a one-stop solution (blended asset portfolio) or to fill a mandate within a multi-strategy portfolio. During the six months ended June 30, 2012, blended asset and equity portfolios represented 51% and 46% of the separate account gross client inflows from the Intermediary Channel, respectively, while fixed income portfolios represented 3%. As of June 30, 2012, 75% of our separate account AUM derived from financial advisors was allocated to blended asset portfolios, with 20% allocated to equity and 5% allocated to fixed income. We expect that equity and fixed income portfolios may see additional interest from financial advisors over time as more and more advisors structure a multi-strategy portfolio.
In contrast, gross client inflows through the Platform/Sub-advisor Channel are primarily directed to our equity strategies, where we are filling a specific mandate within the investment program or platform product. During the six months ended June 30, 2012, 100% of our separate account gross client inflows from the Platform/Sub-advisory Channel were from equity portfolios, and we expect this will continue going forward. As of June 30, 2012, equity portfolios represented 100% of total Platform/Sub-Advisory Channel separate account AUM.
Despite a difficult market environment, our annualized separate account cancellation rate across all channels was 5.0% during the six months ended June 30, 2012, representing the strong relationship focus that is inherent in our direct sales model, which is the primary driver of our separate account business.
The composition of our mutual funds and collective investment trusts as of June 30, 2012, by portfolio, is set forth in the table below.
| As of June 30, 2012 | ||||||||||||||||
| Blended Asset |
Equity | Fixed Income | Total | |||||||||||||
| (in millions) | ||||||||||||||||
| Mutual funds and collective investment trusts AUM |
$ | 8,337.4 | $ | 10,453.9 | $ | 29.7 | $ | 18,821.0 | ||||||||
Our mutual fund and collective investment trusts contributed 64% to our total gross client inflows for the six months ended June 30, 2012 and represented 44% of our total AUM as of June 30, 2012. As of June 30, 2012, our mutual fund and collective investment trust AUM consisted of 44% from blended asset portfolios and 56% from equity portfolios, compared to 38% and 62% for blended asset and equity portfolios as of June 30, 2011. During the six months ended June 30, 2012, 46% of the gross client inflows were attributable to blended assets, while 53% came in equity portfolios and the remaining 1% came in fixed income portfolios. For the six months ended June 30, 2012, market appreciation for our mutual fund and collective investment trust AUM was 5.0%, including appreciation of 5.4% in our blended assets and 4.7% in our equity portfolios.
Mutual fund and collective investment trust business is driven by financial intermediaries and to a lesser extent, our direct sales representatives. Intermediary distribution of our mutual fund and collective investment trust vehicles is achieved via financial advisors, brokers, retirement plan advisors and approval of our funds on platforms and within mutual fund advisory programs. Through our Intermediary Channel, we are increasingly focused on our blended asset life cycle fund vehicles given our emphasis on advisors that work with retirement plans. In addition, we anticipate greater use of our blended asset portfolios by advisors seeking a multi-asset class solution for their retail clients. In addition, our allocation to equity portfolios within the Intermediary Channel may also increase due to interest from national brokerage firm advisors who wish to utilize our mutual funds as a sleeve within a larger portfolio.
Through our Platform/Sub-advisor Channel, we have relationships with consultants and advisors at platforms. We derive equity portfolio assets in this channel through the selection of our funds within advisory programs where our mutual funds are used within a multi-strategy portfolio, or through placement on platforms’ approved lists of funds. To facilitate our relationships with intermediaries, we currently have more than 275 dealer relationships. The continued increase in financial intermediaries offering our mutual funds and collective investment trusts to clients will afford us the opportunity for continued growth across distribution channels. These relationships are an important component in expanding our retail business as well as our 401(k) life cycle and institutional business.
Our Direct Sales Representatives distribute our equity portfolios, in particular our non-US portfolios, to large institutional clients for which we have direct relationships with the client and often, the client’s consultant. Through the Direct Channel, we also form relationships with middle market and large market defined contribution plan sponsors seeking to use our life cycle mutual funds and collective investment trusts as default options on their investment menu. We expect this channel to be focused on distributing blended asset and equity fund vehicles, particularly as the breadth of our mutual fund and collective investment trust offerings expands.
16
Table of Contents
Results of Operations
Below is a discussion of our consolidated results of operations for the three and six months ended June 30, 2012 and 2011.
Key Components of Results of Operations
Overview. Changes to our operating results over time are largely driven by net new client asset flows and changes to the market value of our AUM.
An important factor influencing inflows and outflows of our AUM is the investment performance of our various investment approaches. Our variety of stock selection strategies, absolute pricing discipline and active asset allocation management approach generally results in specific absolute and relative return characteristics in different market environments. For example, during a fundamental-driven bull market when prices are rising alongside improving fundamentals, we are likely to experience positive absolute returns and competitive relative returns. However, in a more momentum-driven bull market, when prices become disconnected from underlying fundamentals, we are likely to experience positive absolute returns but lagging relative returns. Similarly, during a valuation-driven bear market, when markets experience a period of price correction following a momentum-driven bull market, we are likely to experience negative absolute returns but strong relative returns. However, in a momentum-driven bear market, which is typically characterized by broad price declines in a highly correlated market, we are likely to experience negative absolute returns and lagging relative returns. Essentially, our approach is likely to do well when markets are driven by fundamentals, but lag when markets are driven primarily by momentum.
Other components of our operating results include:
| • | asset-based fee rates and changes in those rates; |
| • | the composition of our AUM among various portfolios, vehicles and client types; and |
| • | the rate of increase in our variable and fixed costs, which is affected by the rate of revenue increases, compensation and year-to-year changes in incentive bonuses, changes to base compensation, vendor-related costs and investment spending on new products, consultative staffing and proprietary and third-party technology development. |
Assets Under Management. The following tables reflect the indicated components of our AUM for our investment vehicles for the three and six months ended June 30, 2012 and 2011.
| AUM – by investment vehicle (for the three months ended June 30, 2012 and 2011) |
Separately managed accounts |
Mutual funds and collective investment trusts |
Total | Separately managed accounts |
Mutual funds and collective investment trusts |
Total | ||||||||||||||||||
| (in millions) | ||||||||||||||||||||||||
| As of March 31, 2012 |
$ | 24,827.7 | $ | 19,904.3 | $ | 44,732.0 | 56 | % | 44 | % | 100 | % | ||||||||||||
| Gross client inflows |
979.2 | 1,443.5 | 2,422.7 | |||||||||||||||||||||
| Gross client outflows |
(1,193.8 | ) | (1,422.4 | ) | (2,616.2 | ) | ||||||||||||||||||
| Market depreciation |
(1,062.6 | ) | (1,104.4 | ) | (2,167.0 | ) | ||||||||||||||||||
|
|
|
|
|
|
|
|||||||||||||||||||
| As of June 30, 2012 |
$ | 23,550.5 | $ | 18,821.0 | $ | 42,371.5 | 56 | % | 44 | % | 100 | % | ||||||||||||
|
|
|
|
|
|
|
|||||||||||||||||||
| Average AUM for three months ended June 30, 2012 |
$ | 23,969.5 | $ | 18,827.0 | $ | 42,796.5 | ||||||||||||||||||
| As of March 31, 2011 |
$ | 24,384.1 | $ | 18,180.0 | $ | 42,564.1 | 57 | % | 43 | % | 100 | % | ||||||||||||
| Gross client inflows |
1,262.8 | 2,385.4 | 3,648.2 | |||||||||||||||||||||
| Gross client outflows |
(961.9 | ) | (958.6 | ) | (1,920.5 | ) | ||||||||||||||||||
| Market appreciation |
225.8 | 105.5 | 331.3 | |||||||||||||||||||||
|
|
|
|
|
|
|
|||||||||||||||||||
| As of June 30, 2011 |
$ | 24,910.8 | $ | 19,712.3 | $ | 44,623.1 | 56 | % | 44 | % | 100 | % | ||||||||||||
|
|
|
|
|
|
|
|||||||||||||||||||
| Average AUM for three months ended June 30, 2011 |
$ | 25,031.5 | $ | 19,195.3 | $ | 44,226.8 | ||||||||||||||||||
17
Table of Contents
| AUM – by investment vehicle (for the six months ended June 30, 2012 and 2011) |
Separately managed accounts |
Mutual funds and collective investment trusts |
Total | Separately managed accounts |
Mutual funds and collective investment trusts |
Total | ||||||||||||||||||
| (in millions) | ||||||||||||||||||||||||
| As of December 31, 2011 |
$ | 22,658.1 | $ | 17,542.0 | $ | 40,200.1 | 56 | % | 44 | % | 100 | % | ||||||||||||
| Gross client inflows |
1,858.4 | 3,296.6 | 5,155.0 | |||||||||||||||||||||
| Gross client outflows |
(2,133.1 | ) | (2,894.6 | ) | (5,027.7 | ) | ||||||||||||||||||
| Market appreciation |
1,167.1 | 877.0 | 2,044.1 | |||||||||||||||||||||
|
|
|
|
|
|
|
|||||||||||||||||||
| As of June 30, 2012 |
$ | 23,550.5 | $ | 18,821.0 | $ | 42,371.5 | 56 | % | 44 | % | 100 | % | ||||||||||||
|
|
|
|
|
|
|
|||||||||||||||||||
| Average AUM for six months ended June 30, 2012 |
$ | 23,848.8 | $ | 18,965.4 | $ | 42,814.2 | ||||||||||||||||||
| As of December 31, 2010 |
$ | 22,935.1 | $ | 15,906.6 | $ | 38,841.7 | 59 | % | 41 | % | 100 | % | ||||||||||||
| Gross client inflows |
2,224.1 | 4,799.2 | 7,023.3 | |||||||||||||||||||||
| Gross client outflows |
(1,459.6 | ) | (1,800.0 | ) | (3,259.6 | ) | ||||||||||||||||||
| Market appreciation |
1,211.2 | 806.5 | 2,017.7 | |||||||||||||||||||||
|
|
|
|
|
|
|
|||||||||||||||||||
| As of June 30, 2011 |
$ | 24,910.8 | $ | 19,712.3 | $ | 44,623.1 | 56 | % | 44 | % | 100 | % | ||||||||||||
|
|
|
|
|
|
|
|||||||||||||||||||
| Average AUM for six months ended June 30, 2011 |
$ | 24,403.0 | $ | 18,188.5 | $ | 42,591.5 | ||||||||||||||||||
Assets Under Management. The following tables reflect the indicated components of our AUM for our portfolios for the three and six months ended June 30, 2012 and 2011.
| AUM – by portfolio (for the three months ended June 30, 2012 and 2011) |
Blended Asset |
Equity | Fixed Income |
Total | Blended Asset |
Equity | Fixed Income |
Total | ||||||||||||||||||||||||
| (in millions) | ||||||||||||||||||||||||||||||||
| As of March 31, 2012 |
$ | 19,658.1 | $ | 23,819.0 | $ | 1,254.9 | $ | 44,732.0 | 44 | % | 53 | % | 3 | % | 100 | % | ||||||||||||||||
| Gross client inflows |
1,015.6 | 1,365.7 | 41.4 | 2,422.7 | ||||||||||||||||||||||||||||
| Gross client outflows |
(894.0 | ) | (1,626.5 | ) | (95.7 | ) | (2,616.2 | ) | ||||||||||||||||||||||||
| Market appreciation/(depreciation) |
(329.0 | ) | (1,862.3 | ) | 24.3 | (2,167.0 | ) | |||||||||||||||||||||||||
|
|
|
|
|
|
|
|
|
|||||||||||||||||||||||||
| As of June 30, 2012 |
$ | 19,450.7 | $ | 21,695.9 | $ | 1,224.9 | $ | 42,371.5 | 46 | % | 51 | % | 3 | % | 100 | % | ||||||||||||||||
|
|
|
|
|
|
|
|
|
|||||||||||||||||||||||||
| Average AUM for three months ended June 30, 2012 |
$ | 19,348.3 | $ | 22,209.2 | $ | 1,239.0 | $ | 42,796.5 | ||||||||||||||||||||||||
| As of March 31, 2011 |
$ | 18,420.4 | $ | 22,871.3 | $ | 1,272.4 | $ | 42,564.1 | 43 | % | 54 | % | 3 | % | 100 | % | ||||||||||||||||
| Gross client inflows |
1,055.3 | 2,546.1 | 46.8 | 3,648.2 | ||||||||||||||||||||||||||||
| Gross client outflows |
(799.4 | ) | (1,038.0 | ) | (83.1 | ) | (1,920.5 | ) | ||||||||||||||||||||||||
| Market appreciation |
115.0 | 194.2 | 22.1 | 331.3 | ||||||||||||||||||||||||||||
|
|
|
|
|
|
|
|
|
|||||||||||||||||||||||||
| As of June 30, 2011 |
$ | 18,791.3 | $ | 24,573.6 | $ | 1,258.2 | $ | 44,623.1 | 42 | % | 55 | % | 3 | % | 100 | % | ||||||||||||||||
|
|
|
|
|
|
|
|
|
|||||||||||||||||||||||||
| Average AUM for three months ended June 30, 2011 |
$ | 18,832.0 | $ | 24,126.8 | $ | 1,268.0 | $ | 44,226.8 | ||||||||||||||||||||||||
| AUM – by portfolio (for the six months ended June 30, 2012 and 2011) |
Blended Asset |
Equity | Fixed Income |
Total | Blended Asset |
Equity | Fixed Income |
Total | ||||||||||||||||||||||||
| (in millions) | ||||||||||||||||||||||||||||||||
| As of December 31, 2011 |
$ | 18,122.5 | $ | 20,812.0 | $ | 1,265.6 | $ | 40,200.1 | 45 | % | 52 | % | 3 | % | 100 | % | ||||||||||||||||
| Gross client inflows |
2,046.9 | 2,979.3 | 128.8 | 5,155.0 | ||||||||||||||||||||||||||||
| Gross client outflows |
(1,714.2 | ) | (3,121.0 | ) | (192.5 | ) | (5,027.7 | ) | ||||||||||||||||||||||||
| Market appreciation |
995.5 | 1,025.6 | 23.0 | 2,044.1 | ||||||||||||||||||||||||||||
|
|
|
|
|
|
|
|
|
|||||||||||||||||||||||||
| As of June 30, 2012 |
$ | 19,450.7 | $ | 21,695.9 | $ | 1,224.9 | $ | 42,371.5 | 46 | % | 51 | % | 3 | % | 100 | % | ||||||||||||||||
|
|
|
|
|
|
|
|
|
|||||||||||||||||||||||||
| Average AUM for six months ended June 30, 2012 |
$ | 19,209.3 | $ | 22,356.4 | $ | 1,248.5 | $ | 42,814.2 | ||||||||||||||||||||||||
| As of December 31, 2010 |
$ | 17,280.5 | $ | 20,256.9 | $ | 1,304.3 | $ | 38,841.7 | 45 | % | 52 | % | 3 | % | 100 | % | ||||||||||||||||
| Gross client inflows |
2,201.5 | 4,748.3 | 73.5 | 7,023.3 | ||||||||||||||||||||||||||||
| Gross client outflows |
(1,473.5 | ) | (1,632.9 | ) | (153.2 | ) | (3,259.6 | ) | ||||||||||||||||||||||||
| Market appreciation |
782.8 | 1,201.3 | 33.6 | 2,017.7 | ||||||||||||||||||||||||||||
|
|
|
|
|
|
|
|
|
|||||||||||||||||||||||||
| As of June 30, 2011 |
$ | 18,791.3 | $ | 24,573.6 | $ | 1,258.2 | $ | 44,623.1 | 42 | % | 55 | % | 3 | % | 100 | % | ||||||||||||||||
|
|
|
|
|
|
|
|
|
|||||||||||||||||||||||||
| Average AUM for six months ended June 30, 2011 |
$ | 18,385.1 | $ | 22,929.0 | $ | 1,277.4 | $ | 42,591.5 | ||||||||||||||||||||||||
18
Table of Contents
Revenue. Our revenues primarily consist of investment management fees earned from managing our clients’ AUM. We earn our investment management fees as a percentage of our clients’ AUM either as of a specified date or on a daily basis. Our investment management fees fluctuate based on the average fee rate for our investment management products, which are affected by the composition of our AUM among various portfolios and investment vehicles. We currently do not have revenues from performance fee based products.
Manning & Napier Advisors, LLC (“MNA”), our subsidiary, serves as the investment advisor to the Fund and Exeter Trust Company. The Fund is currently a family of 34 open-end mutual funds that offer no-load share classes designed to meet the needs of a range of institutional and other investors. Exeter Trust Company is an affiliated New Hampshire-chartered trust company that sponsors a family of collective investment trusts for qualified retirement plans, including 401(k) plans. These mutual funds and collective investment trusts comprised $18.8 billion, or 44%, of our AUM as of June 30, 2012, and investment management fees from these mutual funds and collective investment trusts were $42.0 million, or 52%, of our revenues for the three months ended June 30, 2012, and were $84.9 million, or 51%, of our revenues for the six months ended June 30, 2012.
MNA also serves as the investment advisor to all of our separately managed accounts, managing $23.6 billion, or 56%, of our AUM as of June 30, 2012, including assets managed as a sub-advisor to pooled investment vehicles and assets in client accounts invested in the Fund. Investment management fees from separately managed accounts were $35.2 million, or 43%, of our revenues for the three months ended June 30, 2012, and were $73.2 million, or 44%, of our revenues for the six months ended June 30, 2012.
Operating Expenses. Our largest operating expenses are employee compensation and sub-transfer agent/shareholder service fees, discussed further below, with a significant portion of these expenses varying in a direct relationship to our AUM and revenues. We review our operating expenses in relation to the investment market environment and changes in our revenues. However, we are generally willing to make expenditures as necessary even in the face of declining rates of growth in revenues in order to support our investment products, our client service levels, strategic initiatives and our long-term value.
| • | Compensation and related costs. Employee compensation and related costs represent our largest expense, including employee salaries and benefits, incentive compensation to investment and sales professionals and reorganization-related share-based compensation. These costs are affected by changes in the employee headcount and mix of existing job descriptions, competitive factors and new product and service initiatives requiring the addition of new skill sets and/or expanded or upgraded staffing. |
| • | Sub-transfer agent/shareholder service fees. Sub-transfer agent/shareholder service fees represent amounts paid to various platforms that distribute our mutual fund and collective investment trust products. These expenses increase as the AUM in our mutual fund and collective investment trust products increase. |
| • | Other operating expenses. Other operating expenses include costs for custodial services, professional fees, including accounting and legal fees, occupancy and facility costs, as well as other costs related to travel and entertainment expenses, insurance, market data service expenses and all other miscellaneous costs associated with managing the day-to-day operations of our business. |
Non-Operating Income (Loss). Non-operating income (loss) includes interest expense, interest and dividend income, and gains (losses) related to investment securities sales and changes in values of those designated as trading. Prior to the consummation of the offering, interest expense included charges related to the agreement with William Manning, our Chairman and controlling stockholder. Prior to the Company being publicly traded, we had a mandatory redemption obligation upon the death of William Manning to pay his estate his pro rata share of net revenue for the four quarters immediately preceding his death. Our liability related to this mandatory redemption obligation was calculated each fiscal quarter, and the change in the liability was reflected as non-cash interest expense. Upon the consummation of our initial public offering, such mandatory redemption obligation terminated and we no longer reflect non-cash interest expense or the liability related to such agreement.
Provision for Income Taxes. Historically, we have not had a significant provision for income taxes due to the fact that the combined entity is generally made up of S-Corporations and limited liability companies. However, following the public offering, we reported an increase in the provision for income taxes due to the requirement to include provisions for federal and state income taxes as a result of Manning & Napier’s C-Corporation status.
19
Table of Contents
Critical Accounting Policies and Estimates
There have been no significant changes in our critical accounting policies and estimates from those that were disclosed in our Annual Report on Form 10-K for the year ended December 31, 2011.
This management’s discussion and analysis should be read in conjunction with the Company’s Annual Report on Form 10-K for the year ended December 31, 2011 together with the combined consolidated financial statements and related notes and the other financial information that appear elsewhere in this report.
Revenue Recognition
Because the majority of our revenues are earned based on AUM that has been determined using fair value methods and since market appreciation/depreciation has a significant impact on our revenue, we have presented our AUM using the GAAP framework for measuring fair value. That framework provides a three-level fair value hierarchy that prioritizes the inputs to valuation techniques used to measure fair value. The hierarchy gives the highest priority to unadjusted quoted prices in active markets for identical assets or liabilities (Level 1) and the lowest priority to unobservable inputs based on company assumptions (Level 3). A financial instrument’s categorization within the fair value hierarchy is based upon the lowest level of input that is significant to the instrument’s fair value measurement. The three levels within the fair value hierarchy are described as follows:
Level 1—includes observable inputs such as quoted prices in active markets for identical securities.
Level 2—includes inputs other than quoted prices that are observable for the asset or liability, including quoted prices for similar assets or liabilities in active markets, quoted prices for identical or similar assets or liabilities in markets that are not active, or inputs other than quoted prices that are observable for the asset or liability.
Level 3—includes one or more significant unobservable inputs.
The table below summarizes the approximate amount of AUM for the periods indicated for which fair value is measured based on Level 1, Level 2 and Level 3.
| Level 1 | Level 2 | Level 3 | Total | |||||||||||||
| (in millions) | ||||||||||||||||
| December 31, 2011 AUM |
$ | 21,732 | $ | 18,462 | $ | 6 | $ | 40,200 | ||||||||
| June 30, 2012 AUM |
21,760 | 20,600 | 12 | 42,372 | ||||||||||||
As substantially all our AUM is valued by independent pricing services based upon observable market prices or inputs, we believe market risk is the most significant risk underlying valuation of our AUM, as discussed under “Item 3. Quantitative and Qualitative Disclosure About Market Risk” and “Part II. Item 1A. Risk Factors.”
Recent Accounting Pronouncements
In June 2011, the Financial Accounting Standards Board (“FASB”) issued Accounting Standards Update (“ASU”) 2011-05, Comprehensive Income (Topic 220): Presentation of Comprehensive Income. This standard eliminates the current option to report other comprehensive income and its components in the statement of changes in equity. In December 2011, the FASB issued an amendment to this standard which defers the requirement to present components of reclassifications of other comprehensive income on the face of the income statement. These amendments are effective for annual periods beginning after December 15, 2011. The adoption of these amendments on January 1, 2012, did not have a material impact on our combined consolidated financial statements and related disclosures.
In May 2011, FASB issued ASU 2011-04, Fair Value Measurement (Topic 820): Amendments to Achieve Common Fair Value Measurement and Disclosure Requirements in U.S. GAAP and International Financial Reporting Standards. The amendments in this update change the wording used to describe the requirements in U.S. GAAP for measuring fair value and for disclosing information about fair value measurements. These amendments are effective for annual periods beginning after December 15, 2011. The adoption of these amendments on January 1, 2012, did not have a material impact on our combined consolidated financial statements and related disclosures.
20
Table of Contents
Three Months Ended June 30, 2012 Compared to Three Months Ended June 30, 2011
Assets Under Management
The following table reflects changes in our AUM for the three months ended June 30, 2012 and 2011:
| Three Months Ended June 30, | Period-to-Period | |||||||||||||||
| 2012 | 2011 | $ | % | |||||||||||||
| (in millions) | ||||||||||||||||
| Separately managed accounts |
||||||||||||||||
| Beginning assets under management |
$ | 24,827.7 | $ | 24,384.1 | $ | 443.6 | 2 | % | ||||||||
| Gross client inflows |
979.2 | 1,262.8 | (283.6 | ) | (22 | %) | ||||||||||
| Gross client outflows |
(1,193.8 | ) | (961.9 | ) | (231.9 | ) | 24 | % | ||||||||
| Market appreciation |
(1,062.6 | ) | 225.8 | (1,288.4 | ) | (570 | %) | |||||||||
|
|
|
|
|
|
|
|||||||||||
| Ending assets under management |
$ | 23,550.5 | $ | 24,910.8 | $ | (1,360.3 | ) | (5 | %) | |||||||
|
|
|
|
|
|
|
|||||||||||
| Mutual funds and collective investment trusts |
||||||||||||||||
| Beginning assets under management |
$ | 19,904.3 | $ | 18,180.0 | $ | 1,724.3 | 9 | % | ||||||||
| Gross client inflows |
1,443.5 | 2,385.4 | (941.9 | ) | (39 | %) | ||||||||||
| Gross client outflows |
(1,422.4 | ) | (958.6 | ) | (463.8 | ) | 48 | % | ||||||||
| Market appreciation |
(1,104.4 | ) | 105.5 | (1,209.9 | ) | (1,146 | %) | |||||||||
|
|
|
|
|
|
|
|||||||||||
| Ending assets under management |
$ | 18,821.0 | $ | 19,712.3 | $ | (891.3 | ) | (5 | %) | |||||||
|
|
|
|
|
|
|
|||||||||||
| Total assets under management |
||||||||||||||||
| Beginning assets under management |
$ | 44,732.0 | $ | 42,564.1 | $ | 2,167.9 | 5 | % | ||||||||
| Gross client inflows |
2,422.7 | 3,648.2 | (1,225.5 | ) | (34 | %) | ||||||||||
| Gross client outflows |
(2,616.2 | ) | (1,920.5 | ) | (695.7 | ) | 36 | % | ||||||||
| Market appreciation |
(2,167.0 | ) | 331.3 | (2,498.3 | ) | (754 | %) | |||||||||
|
|
|
|
|
|
|
|||||||||||
| Ending assets under management |
$ | 42,371.5 | $ | 44,623.1 | $ | (2,251.6 | ) | (5 | %) | |||||||
|
|
|
|
|
|
|
|||||||||||
Our total AUM decreased by $2.3 billion, or 5%, to $42.4 billion as of June 30, 2012 from $44.6 billion as of June 30, 2011. Compared to the three months ended June 30, 2011, gross client inflows decreased by $1.2 billion for the three months ended June 30, 2012, while gross client outflows increased by $0.7 billion for the same periods. Additionally, we realized market appreciation of $0.3 billion for the three months ended June 30, 2011 compared to market depreciation of $2.2 billion for the three months ended June 30, 2012.
For the three months ended June 30, 2012, our total AUM decreased by $2.4 billion from $44.7 billion at March 31, 2012 to $42.4 billion. Of the $2.4 billion decrease, 92%, or $2.2 billion, came from investment losses during the period. The remaining 8% of the decrease was driven by net client outflows of $0.2 billion, comprised of $0.2 billion of net client outflows from our separate accounts, primarily caused by withdrawals from existing client accounts, and relatively flat mutual funds and collective investment trusts net client flows. The annualized separate account cancellation rate was 5.7% during the three months ended June 30, 2012.
Market depreciation during the three months ended June 30, 2012 constituted a 4.8% rate of decrease in our total AUM. The investment loss was 4.3% in separately managed accounts and 5.5% in mutual funds and collective investment trusts.
The rates of change in AUM during the three months ended June 30, 2012 were most significant in our equity portfolios, with a decrease of 9%. Our fixed income and blended asset portfolios decreased by 2% and 1%, respectively. The rates of change in AUM were also most significant in our equity portfolios from June 30, 2011 to June 30, 2012, as these portfolios experienced a decrease of 12% over this period. Our fixed income portfolios also decreased, at a rate of 3%, while our blended asset portfolios increased by 4%, over the same period.
As of June 30, 2012, the composition of our AUM was 44% in mutual funds and collective investment trusts and 56% in separate accounts, which was consistent with the composition of our AUM as of March 31, 2012 and June 30, 2011. The composition of our AUM across portfolios at June 30, 2012 was 46% in blended assets, 51% in equity, and 3% in fixed income, compared to 44% in blended assets, 53% in equity, and 3% in fixed income at March 31, 2012, and 42% in blended assets, 55% in equity, and 3% in fixed income at June 30, 2011.
21
Table of Contents
The following table sets forth our results of operations for the three months ended June 30, 2012 and 2011:
| Three Months Ended June 30, | Period-to-Period | |||||||||||||||
| 2012 | 2011 | $ | % | |||||||||||||
| (in thousands, except share and per share data) | ||||||||||||||||
| Statements of operations data: |
||||||||||||||||
| Revenues |
||||||||||||||||
| Investment management services revenue |
$ | 81,529 | $ | 85,805 | $ | (4,276 | ) | (5 | %) | |||||||
| Expenses |
||||||||||||||||
| Compensation and related costs |
46,570 | 27,061 | 19,509 | 72 | % | |||||||||||
| Sub-transfer agent and shareholder service costs |
12,471 | 12,668 | (197 | ) | (2 | %) | ||||||||||
| Other operating costs |
9,259 | 9,700 | (441 | ) | (5 | %) | ||||||||||
|
|
|
|
|
|
|
|||||||||||
| Total operating expenses |
68,300 | 49,429 | 18,871 | 38 | % | |||||||||||
|
|
|
|
|
|
|
|||||||||||
| Operating income |
13,229 | 36,376 | (23,147 | ) | (64 | %) | ||||||||||
|
|
|
|
|
|
|
|||||||||||
| Non-operating loss |
||||||||||||||||
| Interest expense on shares subject to mandatory redemption |
— | (16,095 | ) | 16,095 | (100 | %) | ||||||||||
| Other non-operating loss |
(574 | ) | (155 | ) | (419 | ) | 270 | % | ||||||||
|
|
|
|
|
|
|
|||||||||||
| Total non-operating loss |
(574 | ) | (16,250 | ) | 15,676 | (96 | %) | |||||||||
|
|
|
|
|
|
|
|||||||||||
| Income before provision for income taxes |
12,655 | 20,126 | (7,471 | ) | (37 | %) | ||||||||||
| Provision for income taxes |
3,199 | 253 | 2,946 | 1164 | % | |||||||||||
|
|
|
|
|
|
|
|||||||||||
| Net income attributable to controlling and noncontrolling interests |
9,456 | 19,873 | (10,417 | ) | (52 | %) | ||||||||||
| Less: net income attributable to noncontrolling interests |
11,292 | 19,873 | (8,581 | ) | (43 | %) | ||||||||||
|
|
|
|
|
|
|
|||||||||||
| Net loss attributable to Manning & Napier, Inc. |
$ | (1,836 | ) | $ | — | $ | — | |||||||||
|
|
|
|
|
|
|
|||||||||||
| Per Share Data |
||||||||||||||||
| Net loss available to Class A common stock per basic and diluted share |
$ | (0.14 | ) | |||||||||||||
|
|
|
|||||||||||||||
| Weighted average basic and dilute shares of Class A common stock outstanding |
13,583,873 | |||||||||||||||
|
|
|
|||||||||||||||
| Cash dividends declared per share of Class A common stock |
$ | 0.16 | ||||||||||||||
|
|
|
|||||||||||||||
Revenues
Our investment management services revenue decreased by $4.3 million, or 5%, to $81.5 million for the three months ended June 30, 2012 from $85.8 million for the three months ended June 30, 2011. This decrease was driven primarily by a $1.4 billion, or 3%, decrease in our average AUM to $42.8 billion for the three months ended June 30, 2012 from $44.2 billion for the three months ended June 30, 2011.
Our average separately managed account fee decreased to 59 basis points for the three months ended June 30, 2012 from 61 basis points for the three months ended June 30, 2011. For the three months ended June 30, 2012 and 2011, separately managed account standard fees ranged from 15 basis points to 125 basis points, which was consistent with prior periods. The concentration of investments in our separately managed account assets was 46% blended assets, 51% equity and 3% fixed income as of June 30, 2012, and 42% blended assets, 55% equity and 3% fixed income as of June 30, 2011.
Our average fee on mutual fund and collective investment trust products decreased to 89 basis points for the three months ended June 30, 2012 from 91 basis points for the three months ended June 30, 2011. This decrease was primarily due to a shift in the mix of our AUM from higher fee mutual funds and collective investment trusts to those with lower fees. For the three months ended June 30, 2012, mutual fund and collective investment trust management fees ranged from 34 basis points to 100 basis points, and ranged from 45 basis points to 100 basis points for the three months ended June 30, 2011.
Operating Expenses
Our operating expenses increased by $18.9 million, or 38%, to $68.3 million for the three months ended June 30, 2012 from $49.4 million for the three months ended June 30, 2011.
Compensation and related costs increased by $19.5 million, or 72%, to $46.6 million for the three months ended June 30, 2012 from $27.0 million for the three months ended June 30, 2011. This increase was primarily attributable to a non-cash reorganization-
22
Table of Contents
related share-based compensation charge of $24.0 million. Further, we experienced a 20% increase in headcount to 512 employees as of June 30, 2012 from 428 as of June 30, 2011. When considered as a percentage of revenue, compensation and related costs excluding non-cash reorganization-related share-based compensation charges decreased to 28% for the three months ended June 30, 2012 from 32% for the three months ended June 30, 2011. This decrease in compensation as a percentage of revenue resulted from incentive compensation growing at a slower rate during the three months ended June 30, 2012 than for the three months ended June 30, 2011. Incentive compensation grew at a slower pace due to a decrease in analyst bonuses caused by the impact of market depreciation during the second half of 2011, and the second quarter 2012.
Sub-transfer agent and shareholder service costs decreased by $0.2 million, or 2%, to $12.5 million for the three months ended June 30, 2012 from $12.7 million for the three months ended June 30, 2011. The decrease was generally attributable to a 2% decrease in mutual funds and collective investment trusts average AUM for the three months ended June 30, 2012 compared to June 30, 2011. As a percentage of mutual fund and collective investment trust revenue, sub-transfer agent and shareholder service fees remained consistent at 29% for the three months ended June 30, 2012 and 2011.
Other operating costs decreased by $0.4 million, or 5%, to $9.3 million for the three months ended June 30, 2012 from $9.7 million for the three months ended June 30, 2011. The decrease was primarily attributable to decreases in non-recurring fees related to the initial public offering that were incurred during the three months ended June 30, 2011, partially offset by increases in expenses in 2012 to support public company requirements.
Non-Operating Income (Loss)
Non-operating loss decreased by $15.7 million, or 96%, to a loss of $0.6 million for the three months ended June 30, 2012 from a loss of $16.3 million for the three months ended June 30, 2011. The decrease was primarily due to the elimination of the non-cash interest expense on the shares subject to mandatory redemption. Non-cash interest expense on shares subject to mandatory redemption was eliminated due to the termination of the mandatory redemption obligation upon the consummation of our initial public offering.
Provision for Income Taxes
The Company’s tax provision increased by $2.9 million, or 1,164%, to $3.2 million for the three months ended June 30, 2012 from $0.3 million for the three months ended June 30, 2011. The increase is primarily driven by our reorganization and the C-Corporation taxes resulting from our incorporation during the fourth quarter of 2011. For the three months ended June 30, 2011, the Company operated primarily as a series of flow-through entities which are generally not subject to U.S federal or most state and local income tax.
23
Table of Contents
Six Months Ended June 30, 2012 Compared to Six Months Ended June 30, 2011
Assets Under Management
The following table reflects changes in our AUM for the six months ended June 30, 2012 and 2011:
| Six Months Ended June 30, | Period-to-Period | |||||||||||||||
| 2012 | 2011 | $ | % | |||||||||||||
| (in millions) | ||||||||||||||||
| Separately managed accounts |
||||||||||||||||
| Beginning assets under management |
$ | 22,658.1 | $ | 22,935.1 | $ | (277.0 | ) | (1 | %) | |||||||
| Gross client inflows |
1,858.4 | 2,224.1 | (365.7 | ) | (16 | %) | ||||||||||
| Gross client outflows |
(2,133.1 | ) | (1,459.6 | ) | (673.5 | ) | 46 | % | ||||||||
| Market appreciation |
1,167.1 | 1,211.2 | (44.1 | ) | (4 | %) | ||||||||||
|
|
|
|
|
|
|
|||||||||||
| Ending assets under management |
$ | 23,550.5 | $ | 24,910.8 | $ | (1,360.3 | ) | (5 | %) | |||||||
|
|
|
|
|
|
|
|||||||||||
| Mutual funds and collective investment trusts |
||||||||||||||||
| Beginning assets under management |
$ | 17,542.0 | $ | 15,906.6 | $ | 1,635.4 | 10 | % | ||||||||
| Gross client inflows |
3,296.6 | 4,799.2 | (1,502.6 | ) | (31 | %) | ||||||||||
| Gross client outflows |
(2,894.6 | ) | (1,800.0 | ) | (1,094.6 | ) | 61 | % | ||||||||
| Market appreciation |
877.0 | 806.5 | 70.5 | 9 | % | |||||||||||
|
|
|
|
|
|
|
|||||||||||
| Ending assets under management |
$ | 18,821.0 | $ | 19,712.3 | $ | (891.3 | ) | (5 | %) | |||||||
|
|
|
|
|
|
|
|||||||||||
| Total assets under management |
||||||||||||||||
| Beginning assets under management |
$ | 40,200.1 | $ | 38,841.7 | $ | 1,358.4 | 4 | % | ||||||||
| Gross client inflows |
5,155.0 | 7,023.3 | (1,868.3 | ) | (27 | %) | ||||||||||
| Gross client outflows |
(5,027.7 | ) | (3,259.6 | ) | (1,768.1 | ) | 54 | % | ||||||||
| Market appreciation |
2,044.1 | 2,017.7 | 26.4 | 1 | % | |||||||||||
|
|
|
|
|
|
|
|||||||||||
| Ending assets under management |
$ | 42,371.5 | $ | 44,623.1 | $ | (2,251.6 | ) | (5 | %) | |||||||
|
|
|
|
|
|
|
|||||||||||
Our total AUM decreased by $2.3 billion, or 5%, to $42.4 billion as of June 30, 2012 from $44.6 billion as of June 30, 2011. Compared to the six months ended June 30, 2011, gross client inflows decreased by $1.9 billion for the six months ended June 30, 2012, while gross client outflows increased by $1.8 billion for the same periods. Market appreciation was consistent at $2.0 billion for the six months ended June 30, 2011 and 2012.
For the six months ended June 30, 2012, our total AUM increased by $2.2 billion from $40.2 billion at December 31, 2011 to $42.4 billion at June 30, 2012. Of the $2.2 billion increase, 94%, or $2.1 billion, came from investment gains during the period. The remaining 6% of the increase was driven by net client inflows of $0.1 billion, comprised of $0.4 billion of net client inflows from our mutual funds and collective investment trusts, offset by $0.3 billion of net client outflows from our separate accounts caused by withdrawals from existing client accounts. The annualized separate account cancellation rate was 5.0% during the six months ended June 30, 2012.
Market appreciation during the six months ended June 30, 2012 constituted a 5.1% rate of increase in our total AUM. The investment gain was 5.2% in separately managed accounts and 5.0% in mutual funds and collective investment trusts.
The rates of change in AUM during the six months ended June 30, 2012 were most significant in our blended asset portfolios, with an increase of 7%, while our equity portfolios experienced growth of 4% and our fixed income portfolios decreased 3%. The rates of change in AUM were most significant in our equity portfolios from June 30, 2011 to June 30, 2012, as these portfolios experienced a decrease of 12% over this period. Our fixed income portfolios also decreased, at a rate of 3%, while our blended asset portfolios increased by 4%, over the same period.
As of June 30, 2012, the composition of our AUM was 44% in mutual funds and collective investment trusts and 56% in separate accounts, which was consistent with the composition of our AUM as of December 31, 2011 and June 30, 2011. The composition of our AUM across portfolios at June 30, 2012 was 46% in blended assets, 51% in equity, and 3% in fixed income, compared to 45% in blended assets, 52% in equity, and 3% in fixed income at December 31, 2011, and 42% in blended assets, 55% in equity, and 3% in fixed income at June 30, 2011.
24
Table of Contents
The following table sets forth our results of operations for the six months ended June 30, 2012 and 2011:
| Six Months Ended June 30, | Period-to-Period | |||||||||||||||
| 2012 | 2011 | $ | % | |||||||||||||
| (in thousands, except share and per share data) | ||||||||||||||||
| Statements of operations data: |
||||||||||||||||
| Revenues |
||||||||||||||||
| Investment management services revenue |
$ | 166,543 | $ | 163,845 | $ | 2,698 | 2 | % | ||||||||
| Expenses |
||||||||||||||||
| Compensation and related costs |
74,302 | 49,955 | 24,347 | 49 | % | |||||||||||
| Sub-transfer agent and shareholder service costs |
25,145 | 24,363 | 782 | 3 | % | |||||||||||
| Other operating costs |
17,848 | 15,925 | 1,923 | 12 | % | |||||||||||
|
|
|
|
|
|
|
|||||||||||
| Total operating expenses |
117,295 | 90,243 | 27,052 | 30 | % | |||||||||||
|
|
|
|
|
|
|
|||||||||||
| Operating income |
49,248 | 73,602 | (24,354 | ) | (33 | %) | ||||||||||
|
|
|
|
|
|
|
|||||||||||
| Non-operating loss |
||||||||||||||||
| Interest expense on shares subject to mandatory redemption |
— | (29,383 | ) | 29,383 | (100 | %) | ||||||||||
| Other non-operating loss |
(179 | ) | (147 | ) | (32 | ) | 22 | % | ||||||||
|
|
|
|
|
|
|
|||||||||||
| Total non-operating loss |
(179 | ) | (29,530 | ) | 29,351 | (99 | %) | |||||||||
|
|
|
|
|
|
|
|||||||||||
| Income before provision for income taxes |
49,069 | 44,072 | 4,997 | 11 | % | |||||||||||
| Provision for income taxes |
5,189 | 539 | 4,650 | 863 | % | |||||||||||
|
|
|
|
|
|
|
|||||||||||
| Net income attributable to controlling and noncontrolling interests |
43,880 | 43,533 | 347 | 1 | % | |||||||||||
| Less: net income attributable to noncontrolling interests |
42,813 | 43,533 | (720 | ) | (2 | %) | ||||||||||
|
|
|
|
|
|
|
|||||||||||
| Net income attributable to Manning & Napier, Inc. |
$ | 1,067 | $ | — | $ | — | ||||||||||
|
|
|
|
|
|
|
|||||||||||
| Per Share Data |
||||||||||||||||
| Net income available to Class A common stock per basic and diluted share |
$ | 0.08 | ||||||||||||||
|
|
|
|||||||||||||||
| Weighted average basic and dilute shares of Class A common stock outstanding |
13,583,873 | |||||||||||||||
|
|
|
|||||||||||||||
| Cash dividends declared per share of Class A common stock |
$ | 0.32 | ||||||||||||||
|
|
|
|||||||||||||||
Revenues
Our investment management services revenue increased by $2.7 million, or 2%, to $166.5 million for the six months ended June 30, 2012 from $163.8 million for the six months ended June 30, 2011. This increase was driven primarily by a $0.2 billion, or 1%, increase in our average AUM to $42.8 billion for the six months ended June 30, 2012 from $42.6 billion for the six months ended June 30, 2011.
Our average separately managed account fee increased to 61 basis points for the six months ended June 30, 2012 from 60 basis points for the six months ended June 30, 2011. For the six months ended June 30, 2012 and 2011, separately managed account management fees ranged from 15 basis points to 125 basis points, which was consistent with prior periods. The concentration of investments in our separately managed account assets was 46% blended assets, 51% equity and 3% fixed income as of June 30, 2012, and 42% blended assets, 55% equity and 3% fixed income as of June 30, 2011.
Our average fee on mutual fund and collective investment trust products decreased to 90 basis points for the six months ended June 30, 2012 from 91 basis points for the six months ended June 30, 2011. For the six months ended June 30, 2012, mutual fund and collective investment trust management fees ranged from 34 basis points to 100 basis points, and ranged from 45 basis points to 100 basis points for the six months ended June 30, 2011.
Operating Expenses
Our operating expenses increased by $27.1 million, or 30%, to $117.3 million for the six months ended June 30, 2012 from $90.2 million for the six months ended June 30, 2011.
Compensation and related costs increased by $24.3 million, or 49%, to $74.3 million for the six months ended June 30, 2012 from $50.0 million for the six months ended June 30, 2011. This increase was primarily attributable to a non-cash reorganization-related share-based compensation charge of $27.7 million. Further, we experienced a 20% increase in headcount to 512 employees as
25
Table of Contents
of June 30, 2012 from 428 as of June 30, 2011. When considered as a percentage of revenue, compensation and related costs excluding non-cash reorganization-related share-based compensation charges decreased to 28% for the six months ended June 30, 2012 from 31% for the six months ended June 30, 2011. This decrease in compensation as a percentage of revenue resulted from incentive compensation growing at a slower rate during the six months ended June 30, 2012 than for the six months ended June 30, 2011. Incentive compensation grew at a slower pace due to a decrease in analyst bonuses caused by the impact of market depreciation during the second half of 2011, and the second quarter of 2012.
Sub-transfer agent and shareholder service costs increased by $0.8 million, or 3%, to $25.1 million for the six months ended June 30, 2012 from $24.4 million for the six months ended June 30, 2011. The increase was generally attributable to a 4% increase in mutual funds and collective investment trusts average AUM for the six months ended June 30, 2012 compared to the six months ended June 30, 2011. As a percentage of mutual fund and collective investment trust revenue, sub-transfer agent and shareholder service fees remained consistent at 27% for the six months ended June 30, 2012 and 2011.
Other operating costs increased by $1.9 million, or 12%, to $17.8 million for the six months ended June 30, 2011 from $15.9 million for the six months ended June 30, 2011. The increase was primarily attributable to higher 12b-1 fees resulting from an increase in average mutual fund AUM, and increases in costs to support public company requirements.
Non-Operating Income (Loss)
Non-operating loss decreased by $29.4 million, or 99%, to a loss of $0.2 million for the six months ended June 30, 2012 from a loss of $29.5 million for the six months ended June 30, 2011. The decrease was primarily attributable to the elimination of the non-cash interest expense on the shares subject to mandatory redemption. Non-cash interest expense on shares subject to mandatory redemption was eliminated because the mandatory redemption obligation terminated upon the consummation of our initial public offering in 2011.
Provision for Income Taxes
The Company’s tax provision increased by $4.7 million, or 863%, to $5.2 million for the six months ended June 30, 2012 from $0.5 million for the six months ended June 30, 2011. The increase is primarily driven by our reorganization and the C-Corporation taxes resulting from our incorporation during the fourth quarter of 2011. For the six months ended June 30, 2011, the Company operated primarily as a series of flow-through entities which are generally not subject to U.S federal or most state and local income tax.
Supplemental Non-GAAP Financial Information
To provide investors with greater insight, promote transparency and allow for a more comprehensive understanding of the information used by management in its financial and operational decision-making, we supplement our combined consolidated statements of operations presented on a GAAP basis with non-GAAP financial measures of earnings.
Management uses economic income, economic net income, and economic net income per adjusted share as financial measures to evaluate the profitability and efficiency of its business model. Economic income and economic net income are not presented in accordance with GAAP. Economic income excludes from income before provision for income taxes:
| • | the non-cash interest expense associated with the liability for shares subject to mandatory redemption. Upon consummation of the initial public offering, such mandatory redemption obligation terminated and the Company no longer reflects in its financial statements non-cash interest expense or the liability related to such obligation; and |
| • | the reorganization-related share-based compensation, which results in non-cash compensation expense reported over the vesting period. In addition, upon the consummation of our initial public offering, the vesting terms related to the ownership of our employees were modified, including our named executive officers, other than William Manning. Such individuals were entitled to 15% of their ownership interests upon the consummation of our initial public offering, and 15% of their ownership interests over the subsequent three years. The remaining ownership interests are subject to performance-based vesting over such three-year period. Such new vesting terms will not result in dilution to the number of outstanding shares of the Company’s Class A common stock. As a result of such vesting requirements, the Company will recognize non-cash compensation charges through 2014. Economic net income is a non-GAAP measure of after-tax operating performance and equals the Company’s economic income less adjusted income taxes. Adjusted income taxes are estimated assuming the exchange of all outstanding units of Manning & Napier Group into Class A common stock on a one-to-one basis. Therefore, all income of Manning & Napier Group allocated to the units of Manning & Napier Group is treated as if it were allocated to the Company and represents an estimate of income tax expense at an effective rate of 38.25% on economic income for each respective period, reflecting assumed federal, state and local income taxes. Economic net income per adjusted share is equal to economic net income divided by the total number of adjusted Class A common shares outstanding. The number of adjusted Class A common shares outstanding for all periods presented is determined by assuming that all exchangeable units of Manning & Napier Group are converted into our outstanding |
26
Table of Contents
| Class A common stock as of the respective reporting date, on a one-to-one basis. The Company’s management uses economic net income, among other financial data, to determine the earnings available to distribute as dividends to holders of its Class A common stock and to the holders of the units of Manning & Napier Group. |
Non-GAAP measures are not a substitute for financial measures prepared in accordance with GAAP. Additionally, the Company’s non-GAAP measures may differ from similar measures by other companies, even if similar terms are used to identify such measures.
The following table sets forth our other financial and operating data for the three and six months ended June 30, 2012 and 2011:
| Three Months Ended June 30, |
Period-to-Period | Six Months Ended June 30, |
Period-to-Period | |||||||||||||||||||||||||||||
| (in thousands, except share and per share data) | 2012 | 2011 | $ | % | 2012 | 2011 | $ | % | ||||||||||||||||||||||||
| Other Non-GAAP financial and operating data |
||||||||||||||||||||||||||||||||
| Economic income |
$ | 36,692 | $ | 36,221 | $ | 471 | 1 | % | $ | 76,815 | $ | 73,455 | $ | 3,360 | 5 | % | ||||||||||||||||
|
|
|
|
|
|
|
|
|
|
|
|
|
|||||||||||||||||||||
| Economic net income |
$ | 22,657 | $ | 22,266 | $ | 291 | 1 | % | $ | 47,433 | $ | 45,358 | $ | 2,075 | 5 | % | ||||||||||||||||
|
|
|
|
|
|
|
|
|
|
|
|
|
|||||||||||||||||||||
| Economic net income per adjusted share |
$ | 0.25 | $ | 0.53 | ||||||||||||||||||||||||||||
|
|
|
|
|
|||||||||||||||||||||||||||||
27
Table of Contents
The following table sets forth, for the periods indicated, a reconciliation of non-GAAP financial measures to GAAP measures:
| Three Months Ended | Six Months Ended | |||||||||||||||
| June 30, 2012 | June 30, 2011 | June 30, 2012 | June 30, 2011 | |||||||||||||
| (in thousands, except share and per share data) | ||||||||||||||||
| Reconciliation of non-GAAP financial measures: |
||||||||||||||||
| Net (loss) income attributable to Manning & Napier, Inc. |
$ | (1,836 | ) | $ | — | $ | 1,067 | $ | — | |||||||
| Plus: net income attributable to noncontrolling interests |
11,292 | 19,873 | 42,813 | 43,533 | ||||||||||||
|
|
|
|
|
|
|
|
|
|||||||||
| Net income attributable to controlling and noncontrolling interests |
9,456 | 19,873 | 43,880 | 43,533 | ||||||||||||
| Provision for income taxes |
3,199 | 253 | 5,189 | 539 | ||||||||||||
|
|
|
|
|
|
|
|
|
|||||||||
| Income before provision for income taxes |
12,655 | 20,126 | 49,069 | 44,072 | ||||||||||||
| Interest expense on shares subject to mandatory redemption |
— | 16,095 | — | 29,383 | ||||||||||||
| Reorganization-related share-based compensation |
24,037 | — | 27,746 | — | ||||||||||||
|
|
|
|
|
|
|
|
|
|||||||||
| Economic income |
36,692 | 36,221 | 76,815 | 73,455 | ||||||||||||
| Adjusted income taxes |
14,035 | 13,855 | 29,382 | 28,097 | ||||||||||||
|
|
|
|
|
|
|
|
|
|||||||||
| Economic net income |
$ | 22,657 | $ | 22,366 | $ | 47,433 | $ | 45,358 | ||||||||
|
|
|
|
|
|
|
|
|
|||||||||
| Net (loss) income available to Class A common stock per basic and diluted share |
$ | (0.14 | ) | $ | 0.08 | |||||||||||
| Plus: net income attributable to noncontrolling interests per basic and diluted share |
0.83 | 3.15 | ||||||||||||||
|
|
|
|
|
|||||||||||||
| Net income attributable to controlling and noncontrolling interests per basic and diluted share |
0.69 | 3.23 | ||||||||||||||
| Provision for income taxes per basic and diluted share |
0.24 | 0.38 | ||||||||||||||
|
|
|
|
|
|||||||||||||
| Income before provision for income taxes per basic and diluted share |
0.93 | 3.61 | ||||||||||||||
| Interest Expense on Shares subject to mandatory redemption per basic share |
— | — | ||||||||||||||
| Reorganization-related share-based compensation per basic and diluted share |
1.77 | 2.04 | ||||||||||||||
|
|
|
|
|
|||||||||||||
| Economic income per basic and diluted share |
2.70 | 5.65 | ||||||||||||||
| Adjusted income taxes per basic and diluted share |
1.03 | 2.16 | ||||||||||||||
|
|
|
|
|
|||||||||||||
| Economic net income per basic and diluted share |
1.67 | 3.49 | ||||||||||||||
| Less: Impact of Manning & Napier Group, LLC units converted to publicly traded shares |
(1.42 | ) | (2.96 | ) | ||||||||||||
|
|
|
|
|
|||||||||||||
| Economic net income per adjusted share |
$ | 0.25 | $ | 0.53 | ||||||||||||
|
|
|
|
|
|||||||||||||
| Total basic and diluted shares of Class A common stock outstanding |
13,583,873 | 13,583,873 | ||||||||||||||
| Total exchangeable units of Manning & Napier Group, LLC |
76,400,000 | 76,400,000 | ||||||||||||||
|
|
|
|
|
|||||||||||||
| Total adjusted Class A common stock outstanding |
89,983,873 | 89,983,873 | ||||||||||||||
|
|
|
|
|
|||||||||||||
Liquidity and Capital Resources
Historically, our cash and liquidity needs have been met primarily through cash generated by our operations. Our current financial condition is highly liquid, with a significant amount of our assets comprised of cash and cash equivalents and accounts receivable. The following table sets forth certain key financial data relating to our liquidity and capital resources as of June 30, 2012 and December 31, 2011.
| June 30, | December 31, | |||||||
| 2012 | 2011 | |||||||
| (unaudited) | ||||||||
| (in thousands) | ||||||||
| Cash and cash equivalents |
$ | 95,127 | $ | 81,208 | ||||
| Accounts receivable |
$ | 32,412 | $ | 31,259 | ||||
| Amounts payable under tax receivable agreement (1) |
$ | 46,244 | $ | 46,205 | ||||
28
Table of Contents
| (1) | In light of numerous factors affecting our obligation to make such payments, the timing and amounts of any such actual payments are based on our best estimate as of June 30, 2012 and December 31, 2011, including our ability to realize the expected tax benefits. Actual payments may significantly differ from estimated payments. |
In determining the sufficiency of liquidity and capital resources to fund our business, we regularly monitor our liquidity position, including among other things, cash, working capital, long-term liabilities, lease commitments and operating company distributions. We believe cash generated from operations will be sufficient over the foreseeable future, or twelve months, to meet our working capital requirements. Further, we expect that cash on hand and cash generated by operations will be sufficient to meet our liquidity needs.
Cash Flows
The following table sets forth our cash flows for the six months ended June 30, 2012 and 2011. Operating activities consist primarily of net income subject to adjustments for changes in operating assets and liabilities, equity-based compensation expense, and change in shares liability subject to mandatory redemption, deferred income tax expense and depreciation. Investing activities consist primarily of the purchase and sale of investments, as well as the purchases of property and equipment. Financing activities consist primarily of distributions, dividends paid and contributions.
| Six Months Ended June 30, |
||||||||
| 2012 | 2011 | |||||||
| (unaudited) (in thousands) |
||||||||
| Net cash provided by operating activities |
$ | 76,067 | $ | 79,243 | ||||
| Net cash used in investing activities |
(5,299 | ) | (462 | ) | ||||
| Net cash used in financing activities |
(56,849 | ) | (71,251 | ) | ||||
|
|
|
|
|
|||||
| Net change in cash and cash equivalents |
$ | 13,919 | $ | 7,530 | ||||
|
|
|
|
|
|||||
Six Months Ended June 30, 2012 Compared to Six Months Ended June 30, 2011
Operating Activities
Operating activities provided $76.1 million and $79.2 million of net cash for the six months ended June 30, 2012 and 2011, respectively. This decrease in net cash provided by operating activities was driven primarily by a decrease in operating assets and liabilities, primarily accrued expenses and other current liabilities, of approximately $3.4 million, partially offset by an increase in net income after adjustment for non-cash items of approximately $0.2 million.
Investing Activities
Investing activities used $5.3 million and $0.5 million of net cash for the six months ended June 30, 2012 and 2011, respectively. The increase in net cash used in investing activities was primarily due to an increase in purchases of investments of $4.4 million (driven largely by the seeding of new products) and in property and equipment purchases of $1.4 million, partially offset by increases in sales of investments of $1.0 million for the six months ended June 30, 2012 compared to the six months ended June 30, 2011.
Financing Activities
Financing activities used $56.8 million and $71.3 million of net cash for the six months ended June 30, 2012 and 2011, respectively. The decrease in net cash used in financing activities was primarily the result of a decrease in distributions of $19.6 million for the six months ended June 30, 2012 compared to the six months ended June 30, 2011, partially offset by an increase in dividends paid on our class A common stock during the six months ended June 30, 2012.
Dividends
On March 20, 2012, the Board of Directors declared a $0.16 per share dividend to the holders of Class A common stock. The dividend was paid on May 1, 2012 to shareholders of record as of April 13, 2012.
On May 11, 2012, the Board of Directors declared a $0.16 per share dividend to the holders of Class A common stock. The dividend is payable on August 1, 2012 to shareholders of record as of July 16, 2012.
We currently intend to pay quarterly cash dividends of our Class A common stock. We intend to fund such dividends from our portion of distributions made by Manning & Napier Group, from its available cash generated from operations. William Manning, as the holder of our Class B common stock, will not be entitled to any cash dividends in his capacity as a Class B stockholder, but will, in his capacity as an indirect holder of Class A units of Manning & Napier Group, generally participate on a pro rata basis in distributions by Manning & Napier Group.
29
Table of Contents
The declaration and payment of all future dividends, if any, will be at the sole discretion of our board of directors. In determining the amount of any future dividends, our board of directors will take into account:
| • | the financial results of Manning & Napier Group; |
| • | our available cash, as well as anticipated cash requirements, including any debt servicing; |
| • | our capital requirements and the capital requirements of our subsidiaries, including Manning & Napier Group; |
| • | contractual, legal, tax and regulatory restrictions on, and implications of, the payment of dividends by us to our stockholders or by Manning & Napier Group to us, including the obligation of Manning & Napier Group to make tax distributions to its unitholders, including us; |
| • | general economic and business conditions; and |
| • | any other factors that our board of directors may deem relevant. |
We have no material assets other than our ownership of Class A units of Manning & Napier Group and, accordingly, will depend on distributions from Manning & Napier Group to fund any dividends we may pay. As managing member of Manning & Napier Group, we will determine the timing and amount of any distributions to be paid to its members. We intend to cause Manning & Napier Group to distribute cash to its members, including us, in an amount sufficient to cover dividends, if any, declared by us. If we do cause Manning & Napier Group to make such distributions, M&N Group Holdings, MNCC and any other holders of units of Manning & Napier Group will be entitled to receive equivalent distributions on a pari passu basis.
Contractual Obligations
There have been no material changes in our contractual obligations as set forth in our Annual Report on Form 10-K for the year ended December 31, 2011.
Off Balance Sheet Arrangements
We did not have any off-balance sheet arrangements as of June 30, 2012.
Item 3. Quantitative and Qualitative Disclosures About Market Risk.
Market Risk
Our exposure to market risk is directly related to the role of our operating company as an investment adviser for the mutual funds and separate accounts it manages. Substantially all of our revenues are derived from investment management agreements with these funds and accounts. Under these agreements, the investment management fees we receive are based on the value of our AUM and our fee rates. Accordingly, our revenues and net income may decline as a result of our AUM decreasing due to depreciation of our investment portfolios. In addition, such a decline could cause our clients to withdraw their funds in favor of investments offering higher returns or lower risk, which would cause our revenues to decline further.
The value of our AUM was $42.4 billion as of June 30, 2012. Assuming a 10% increase or decrease in the value of our AUM and the change being proportionally distributed over all our products, the value would increase or decrease by approximately $4.2 billion, which would cause an annualized increase or decrease in revenues of approximately $33.0 million at our current weighted average fee rate of 0.78%.
We have not adopted a corporate-level risk management policy regarding client assets, nor have we attempted to hedge at the corporate level the market risks that would affect the value of our overall AUM and related revenues. Some of these risks (e.g., sector risks and currency risks) are inherent in certain strategies, and clients may invest in particular strategies to gain exposure to these risks.
We also are subject to market risk from a decline in the prices of investment securities that we own. These securities consist primarily of short-term investments, equity securities and investment in mutual funds, including the Fund for which MNA provides advisory services. The value of these investment securities was $7.9 million as of June 30, 2012. Management regularly monitors the value of these investments; however, given their nature and relative size, we have not adopted a specific risk management policy to manage the associated market risk. Assuming a 10% increase or decrease in the values of these investment securities, the fair value would increase or decrease by approximately $0.8 million at June 30, 2012. Due to the nature of our business, we believe that we do not face any material risk from inflation.
30
Table of Contents
Exchange Rate Risk
A substantial portion of the accounts that we advise, or sub-advise, hold investments that are denominated in currencies other than the U.S. dollar. Movements in the rate of exchange between the U.S. dollar and the underlying foreign currency affect the values of assets held in accounts we manage, thereby affecting the amount of revenues we earn. The value of the assets we manage was $42.4 billion as of June 30, 2012. As of June 30, 2012, approximately 29% of our AUM across our investment strategies was invested in securities denominated in currencies other than the U.S. dollar. To the extent our AUM are denominated in currencies other than the U.S. dollar, the value of those AUM would decrease, with an increase in the value of the U.S. dollar, or increase, with a decrease in the value of the U.S. dollar.
We monitor our exposure to exchange rate risk and make decisions on how to manage such risk accordingly; however, we have not adopted a corporate-level risk management policy to manage exchange rate risk. Assuming that 29% of our AUM is invested in securities denominated in currencies other than the U.S. dollar and excluding the impact of any hedging arrangements, a 10% increase or decrease in the value of the U.S. dollar would decrease or increase the fair value of our AUM by approximately $1.2 billion, which would cause an annualized increase or decrease in revenues of approximately $9.6 million at our current weighted average fee rate of 0.78%.
Interest Rate Risk
We typically invest our excess cash balances in money market mutual funds that invest primarily in U.S. Treasury or agency-backed money market instruments. These funds attempt to maintain a stable net asset value but interest rate changes may affect the fair value of such investments and, if significant, could result in a loss of investment principal. Interest rate changes affect the income we earn from our excess cash balances.
Item 4. Controls and Procedures.
We maintain disclosure controls and procedures, as defined in Rule 13a-15(e) of the Exchange Act, that are designed to ensure that information required to be disclosed in our reports filed or submitted under the Securities Exchange Act of 1934 is recorded, processed, summarized and reported within the time periods specified in the SEC’s rules and forms, and that such information is accumulated and communicated to our management, including our chief executive officer and chief financial officer, as appropriate, to allow for timely decisions regarding required disclosure. As of June 30, 2012, we carried out an evaluation, under the supervision and with the participation of management, including our chief executive officer and our chief financial officer, of the effectiveness of the design and operation of our disclosure controls and procedures. Based on this evaluation, our chief executive officer and chief financial officer concluded that our disclosure controls and procedures were effective and were operating at the reasonable assurance level.
In addition, there were no changes in our internal control over financial reporting during the quarter ended June 30, 2012 that materially affected, or are reasonably likely to materially affect, our internal control over financial reporting.
None
There have been no material changes in our risk factors since those published in our Annual Report on Form 10-K for the year ended December 31, 2011.
Item 2. Unregistered Sales of Equity Securities and Use of Proceeds.
None
31
Table of Contents
| Exhibit No. |
Description | |
| 31.1 | Certification of the Company’s Chief Executive Officer pursuant to Exchange Act Rules 13a-14(a)/15d-14(a), as adopted pursuant to Section 302 of the Sarbanes-Oxley Act of 2002 | |
| 31.2 | Certification of the Company’s Chief Financial Officer pursuant to Exchange Act Rules 13a-14(a)/15d-14(a), as adopted pursuant to Section 302 of the Sarbanes-Oxley Act of 2002 | |
| 32.1 | Certification of the Company’s Chief Executive Officer pursuant to 18 U.S.C. Section 1350, as adopted pursuant to Section 906 of the Sarbanes-Oxley Act of 2002 | |
| 32.2 | Certification of the Company’s Chief Financial Officer pursuant to 18 U.S.C. Section 1350, as adopted pursuant to Section 906 of the Sarbanes-Oxley Act of 2002 | |
| 101 | Materials from the Manning & Napier, Inc. Quarterly Report on Form 10-Q for the quarter ended June 30, 2012, formatted in Extensible Business Reporting Language (XBRL): (i) Combined Consolidated Statements of Financial Condition, (ii) Combined Consolidated Statements of Operations, (iii) Combined Consolidated Statements of Comprehensive Income, (iv) Combined Consolidated Statement of Shareholders’ Equity, (v) Combined Consolidated Statements of Cash Flows, and (vi) related Notes to the Unaudited Combined Consolidated Financial Statements. | |
32
Table of Contents
SIGNATURES
Pursuant to the requirements of the Securities Exchange Act of 1934, the registrant has duly caused this report to be signed on its behalf by the undersigned thereunto duly authorized.
| MANNING & NAPIER, INC. | ||||||||||
| Dated: August 13, 2012 | By: |
/s/ PATRICK CUNNINGHAM | ||||||||
| Patrick Cunningham | ||||||||||
| Chief Executive Officer | ||||||||||
| (principal executive officer) | ||||||||||
| /s/ JAMES MIKOLAICHIK | ||||||||||
| James Mikolaichik | ||||||||||
| Chief Financial Officer | ||||||||||
| (principal financial and accounting officer) | ||||||||||
33