Attached files
| file | filename |
|---|---|
| EX-32.2 - EXHIBIT 32.2 - Luther Burbank Corp | a201910-kex322.htm |
| EX-32.1 - EXHIBIT 32.1 - Luther Burbank Corp | a201910-kex321.htm |
| EX-31.2 - EXHIBIT 31.2 - Luther Burbank Corp | a201910-kex312.htm |
| EX-31.1 - EXHIBIT 31.1 - Luther Burbank Corp | a201910-kex311.htm |
| EX-23.1 - EXHIBIT 23.1 - Luther Burbank Corp | a201910-kex231.htm |
| EX-21 - EXHIBIT 21 - Luther Burbank Corp | a201910-kex21.htm |
| EX-4.2 - EXHIBIT 4.2 - Luther Burbank Corp | a201910-kex42.htm |
UNITED STATES
SECURITIES AND EXCHANGE COMMISSION
Washington, D.C. 20549
FORM 10-K
x ANNUAL REPORT PURSUANT TO SECTION 13 OR 15(d) OF THE SECURITIES EXCHANGE ACT OF 1934
For the Year Ended December 31, 2019
OR
☐ TRANSITION REPORT PURSUANT TO SECTION 13 OR 15(d) OF THE SECURITIES EXCHANGE ACT OF 1934
Commission file number 001-38317
Luther Burbank Corporation
(Exact name of registrant as specified in its charter)
California (State or other jurisdiction of incorporation or organization) | 68-0270948 (I.R.S. employer identification number) | |
520 Third St, Fourth Floor, Santa Rosa, California (Address of principal executive offices) | 95401 (Zip Code) | |
Registrant's telephone number, including area code: (844) 446-8201
Securities Registered Pursuant to Section 12(b) of the Act | ||||
Title of Each Class | Trading Symbol | Name of Each Exchange on Which Registered | ||
Common stock, no par value | LBC | The Nasdaq Stock Market LLC | ||
Securities Registered Pursuant to Section 12(g) of the Act:
None
Indicate by check mark if the registrant is a well-known seasoned issuer, as defined in Rule 405 of the Securities Act. YES o NO x
Indicate by check mark if the registrant is not required to file reports pursuant to Section 13 or 15(d) of the Act. YES o NO x
Indicate by check mark whether the registrant (1) has filed all reports required to be filed by Section 13 or 15(d) of the Securities Exchange Act of 1934 during the preceding twelve months (or for such shorter period that the registrant was required to file such reports), and (2) has been subject to such filing requirements for the past 90 days. YES x NO o
Indicate by checkmark whether the registrant has submitted electronically every Interactive Data File required to be submitted pursuant to Rule 405 of Regulation S-T (§232.405 of this chapter) during the preceding 12 months (or for such shorter period that the registrant was required to submit such files). YES x NO o
Indicate by checkmark whether the registrant is a large accelerated filer, an accelerated filer, a non-accelerated filer, or a smaller reporting company. See definitions of "large accelerated filer", "accelerated filer", "smaller reporting company" and "emerging growth company" in Rule 12b-2 of the Exchange Act.
Large accelerated filer | o | Accelerated filer | x | |
Non-accelerated filer | o | Smaller Reporting Company | x | |
Emerging Growth Company | x | |||
If an emerging growth company, indicate by check mark if the registrant has elected not to use the extended transition period for complying with any new or revised financial accounting standards provided pursuant to Section 13(a) of the Exchange Act. o
Indicate by check mark whether the registrant is a shell company (as defined in Rule 12b-2 of the Act): Yes o No x
As of June 30, 2019, the last business day of the Registrant’s most recently completed second fiscal quarter, the aggregate market value of its common stock held by non-affiliates was approximately $164.2 million based on the closing price per share of common stock of $10.89 on June 30, 2019.
As of March 2, 2020, there were 56,157,216 shares of the registrant’s common stock, no par value, outstanding.
DOCUMENTS INCORPORATED BY REFERENCE
Portions of the definitive Proxy Statement to be distributed on behalf of the Board of Directors of Registrant in connection with the Annual Meeting of Shareholders to be held on April 28, 2020 and any adjournment thereof, are incorporated by reference in Part III.
Table of Contents
Page | ||
Part I | ||
Part II | ||
Part III | ||
Part IV | ||
Item 16. | ||
1
CAUTIONARY NOTE REGARDING FORWARD-LOOKING STATEMENTS
All references to ‘‘we,’’ ‘‘our,’’ ‘‘us,’’ ‘‘Luther Burbank Corporation’’ or ‘‘the Company’’ refers to Luther Burbank Corporation, a California corporation, and our consolidated subsidiaries, including Luther Burbank Savings, a California banking corporation, unless the context indicates that we refer only to the parent company, Luther Burbank Corporation. ‘‘Bank’’ or ‘‘LBS’’ refers to Luther Burbank Savings, our banking subsidiary.
This Annual Report on Form 10-K contains a number of forward-looking statements. These forward-looking statements reflect our current views with respect to, among other things, future events and our results of operations, financial condition and financial performance. These statements may be identified by use of words such as "anticipate," "believe," “continue,” "could," "estimate," "expect," “impact,” "intend," "seek," "may," "outlook," "plan," "potential," "predict," "project," "should," "will," "would" and similar terms and phrases, including references to assumptions. Forward-looking statements are not historical facts, and are based on current expectations, estimates and projections about our industry, management’s beliefs and certain assumptions made by management, many of which, by their nature, are inherently uncertain and beyond our control. Accordingly, we caution you that such forward-looking statements are not guarantees of future performance and are subject to risks, assumptions and uncertainties that are difficult to predict. Although we believe that the expectations reflected in these forward-looking statements are reasonable as of the date made, actual results may prove to be materially different from the results expressed or implied by the forward-looking statements.
There are numerous, important factors that could cause our actual results to differ materially from those indicated in forward-looking statements, including, but not limited to, the following:
• | business and economic conditions generally and in the financial services industry, nationally and within our current and future geographic markets; |
• | economic, market operational, liquidity, credit and interest rate risks associated with our business; |
• | the occurrence of significant natural or man-made disasters, including fires, earthquakes and terrorist acts, as well as public health issues and other adverse external events that could harm our business; |
• | our management of risks inherent in our real estate loan portfolio, and the risk of a prolonged downturn in the real estate market, which could impair the value of our collateral and our ability to sell collateral upon any foreclosure; |
• | our ability to achieve organic loan and deposit growth and the composition of such growth; |
• | the fiscal position of the U.S. and the soundness of other financial institutions; |
• | changes in consumer spending and savings habits; |
• | technological changes; |
• | the laws and regulations applicable to our business, and the impact of recent and future legislative and regulatory changes; |
• | changing bank regulatory conditions, policies or programs, whether arising as new legislation or regulatory initiatives, that could lead to restrictions on activities of banks generally, or our subsidiary bank in particular, more restrictive regulatory capital requirements, increased costs, including deposit insurance premiums, regulation or prohibition of certain income producing activities or changes in the secondary market for loans and other products; |
• | increased competition in the financial services industry; |
• | changes in the level of our nonperforming assets and charge-offs; |
• | our involvement from time to time in legal proceedings and examinations and remedial actions by regulators; |
• | the composition of our management team and our ability to attract and retain key personnel; |
• | material weaknesses in our internal control over financial reporting; |
• | systems failures or interruptions involving our information technology and telecommunications systems; |
• | potential exposure to fraud, negligence, computer theft and cyber-crime; |
• | the obligations associated with being a public company; |
• | failure to adequately manage the transition from LIBOR as a reference rate; and |
• | the effect of changes in accounting policies and practices or accounting standards, as may be adopted from time-to-time by bank regulatory agencies, the SEC, the Public Company Accounting Oversight Board, the FASB or other accounting standards setters, including ASU 2016-13 (Topic 326), “Measurement of Credit Losses on Financial Instruments,” commonly referenced as the Current Expected Credit Loss (“CECL”) model, which will change how we estimate credit losses and may increase the required level of our allowance for credit losses after adoption on January 1, 2023. |
2
The foregoing factors should not be construed as exhaustive and should be read together with the other cautionary statements included in this Annual Report. If one or more events related to these or other risks or uncertainties materialize, or if our underlying assumptions prove to be incorrect, actual results may differ materially from what we anticipate. Accordingly, you should not place undue reliance on any such forward-looking statements. Any forward-looking statement speaks only as of the date on which it is made, and we do not undertake any obligation to publicly update or review any forward-looking statement, whether as a result of new information, future developments or otherwise. New factors emerge from time to time, and it is not possible for us to predict which will arise. In addition, we cannot assess the impact of each factor on our business or the extent to which any factor, or combination of factors, may cause actual results to differ materially from those contained in any forward-looking statements.
3
PART I.
Item 1. Business
General
Luther Burbank Corporation is a bank holding company incorporated on May 14, 1991 under the laws of the state of California and is headquartered in Santa Rosa, California. The Company operates primarily through its wholly-owned subsidiary, Luther Burbank Savings, a California banking corporation originally chartered in 1983 in Santa Rosa, California. The Bank conducts its business from its new headquarters in Gardena, CA.
The Company also owns Burbank Financial Inc., a real estate investment company, and Luther Burbank Statutory Trusts I and II, entities created to issue trust preferred securities.
The Company's principal business is attracting deposits from the general public and investing those funds in a variety of loans, including permanent mortgage loans and construction loans secured by residential, multifamily, and commercial real estate. The Company specializes in real estate secured lending in metropolitan areas along the West Coast and has developed expertise in multifamily residential, jumbo nonconforming single family residential and commercial real estate lending.
Implications of Being an Emerging Growth Company
We qualify as an ‘‘emerging growth company’’ under the Jumpstart Our Business Startups Act of 2012 (the "JOBS Act"). An emerging growth company may take advantage of specified reduced reporting requirements and is relieved of other significant requirements that are otherwise generally applicable to other public companies. Among other factors, as an emerging growth company:
• | we may present less than five years of selected financial data; |
• | we are exempt from the requirement to provide an opinion from our auditors on the design and operating effectiveness of our internal control over financial reporting pursuant to the Sarbanes-Oxley Act of 2002, as amended, or the Sarbanes-Oxley Act; |
• | we may choose not to comply with any new requirements adopted by the Public Company Accounting Oversight Board ("PCAOB"); |
• | we are permitted to provide less extensive disclosure regarding our executive compensation arrangements pursuant to the rules applicable to smaller reporting companies, which means we do not have to include a compensation discussion and analysis and other disclosure regarding our executive compensation in this Annual Report; and |
• | we are not required to hold nonbinding advisory votes on executive compensation or golden parachute arrangements. |
We can elect to opt out of the extended transition period for adopting any new or revised accounting standards. We have elected not to opt out of such extended transition period, which means that when a standard is issued or revised and it has different application dates for public or private companies, we may adopt the standard for the private company.
We may take advantage of these provisions for up to five years from the date of our IPO unless we earlier cease to qualify as an emerging growth company. We will cease to qualify as an emerging growth company if we have more than $1.07 billion in annual gross revenues, as that amount may be periodically adjusted by the Securities and Exchange Commission ("SEC"), we become a ‘‘large accelerated filer,’’ including having more than $700.0 million in market value of our common stock held by non-affiliates, or we issue more than $1.0 billion of non-convertible debt in a three-year period.
We expect to take advantage of the reduced reporting and other requirements of the JOBS Act with respect to the periodic reports we will file with the SEC and proxy statements that we use to solicit proxies from our shareholders.
4
Business Strategies
We intend to continue executing our strategic plan by focusing on the following key objectives:
• | Continued organic lending growth in our existing markets. Our primary focus is to grow our client base within our strategic markets and to expand the penetration of our existing multifamily, single family and commercial real estate lending activities within these markets on the West Coast, which have strong job growth, strong economic growth and limited affordable housing. These markets include all major metropolitan markets between Seattle and San Diego. The high cost of living and high barriers to entry make these markets attractive for investments in affordable rental housing for low- and middle-income tenants. Robust job markets, strong single family residential demand, high average housing costs, and concentrations of professional, highly skilled and high income workers, entrepreneurs and other high net worth individuals make our markets ideal for our portfolio single family residential lending activities. |
We believe we have a competitive advantage over larger national financial institutions, which lack our level of personalized service, and over smaller community banks, which lack our product and market expertise. We intend to capture additional market share by deepening our relationships with current customers and supporting our bankers in their pursuit of new customers in our target markets. We will also consider the opportunistic lift-out of key personnel or teams from other financial institutions. We believe that our stable, income producing property focus and our existing customer profile lends itself to expanded lending in our existing markets.
• | Deepen client relationships and grow our deposit base. We provide a high level of customer service to our depositors. Our historical focus for our deposit production activities was exclusively on individual savings deposits from high net worth, primarily self-employed individuals, entrepreneurs and professionals, and we did not emphasize transactional accounts. This strategy has produced a stable customer base. We have expanded our focus in recent years, and invested in personnel, business and compliance processes and technology that enable us to acquire, and efficiently and effectively serve, a wider array of consumer transactional accounts and business deposit accounts while continuing to provide the level of customer service for which we are known to our consumer depositors. We have also increased outreach in high-density, small to medium sized business markets where the Bank already operates. We also provide comprehensive online and mobile banking products to our business and consumer depositors to complement our branch network. |
We believe that our current customer base contains additional untapped cross-selling opportunities. We plan to continue to grow our non-brokered, consumer and business deposits by:
• | cross-selling business deposit relationships to our existing consumer customers who are business operators; |
• | cross-selling business and consumer accounts to our multifamily and single family loan borrowers; |
• | obtaining new individual and business customers, including specialty deposit customers, such as fiduciary service providers,1031 exchange companies, unions, homeowners associations and nonprofits; |
• | increasing our digital market presence including the use of social media; and |
• | continuing to evaluate new branches, via de novo activity and/or acquisition, in key markets on the West Coast. |
We will also continue to cross-sell existing customers, and solicit new ones, for additional lending opportunities in our markets, and to develop niche verticals, where our credit underwriting expertise and efficient operations can yield an attractive risk-adjusted return. Our cross-selling efforts to existing customers will be strategically targeted, based on our in depth analyses of our customers’ overall financial profile, cash flows, financial resources and banking requirements.
5
• | Disciplined credit quality and robust risk management. We are committed to being a high performing organization, and as we continue to grow our loan portfolio, we will do so in a disciplined manner. Risk management is a core competency of our business, demonstrated by the strong credit performance of our portfolio. We have comprehensive policies and procedures for credit underwriting, monitoring our loan portfolio and internal risk management including managing our interest rate risk, compliance risk, reputation risk, legal risk and other risks inherent in our operations. The sound credit practices followed by our bankers allow credit decisions to be made efficiently and consistently. We attribute our success to a strong credit culture, the continuous evaluation of risk and return and the strict separation between business development and credit decision making, coupled with a robust risk management framework. Our focus on credit and risk management has enabled us to grow our balance sheet successfully while maintaining strong asset quality. |
• | Disciplined cost management. We intend to continue to foster a culture of efficiency through hands-on management, prudent expense management, and a small number of large deposit balance branches. With a renewed emphasis on process improvements, we believe that we can support continued growth in assets, customers and our geographic footprint without significant additional investment in our infrastructure or significant expansion of our personnel. We believe that our existing network of branches and loan production offices, as well as non-branch and online customer and deposit development activities, have significant potential to continue to grow loan and deposit balances. We will continue to be highly selective as we explore opportunities for establishing additional strategically located branches in markets which present significant opportunity for multifamily and commercial real estate lending, single family residential lending, and high net worth consumer and business banking relationships. |
Market Area
Our operations are concentrated in demographically desirable and fast growing major metropolitan areas on the West Coast located in the states of California, Washington and Oregon. Including the January 2020 opening of our branch in El Segundo, California, we have ten full service branches in California located in Sonoma, Marin, Santa Clara, and Los Angeles Counties and one full service branch in Washington located in King County. We also operate seven loan production offices located throughout California, as well as a loan production office in Clackamas County, Oregon. We are most active in the following metropolitan areas: Santa Rosa (Sonoma County), Los Angeles, San Francisco, San Jose, San Diego, and Seattle. We are seeking to more deeply penetrate these core markets, and contiguous major metropolitan markets that share key demographic characteristics with our core markets, solidifying our Seattle to San Diego footprint.
Competition
We operate in a highly competitive industry and in highly competitive markets throughout the West Coast. While our commercial real estate and jumbo single family residential focuses require significant expertise to perform efficiently, competition in commercial real estate lending is keen from large banking institutions with national operations, and mid-sized regional banking institutions, while in the single family lending market, we face competition from a wide array of institutions. We compete with other community banks, savings and loan associations, credit unions, mortgage companies, insurance companies, finance companies, as well as other kinds of financial institutions and enterprises, such as securities firms, insurance companies, private lenders and nontraditional competitors such as fintech companies and internet-based lenders, depositories and payment systems. The primary factors driving competition for deposits are customer service, interest rates, fees charged, branch locations and hours, online and mobile banking functionality, the range of products offered and the reputation/public perception of an institution. The primary factors driving competition for our lending products are customer service, range of products offered, price, reputation, and quality of execution. We believe the Bank is a strong competitor in our markets; however, other competitors have advantages over us. Among the advantages that many of these large institutions have over the Bank are their abilities to finance extensive advertising campaigns, maintain extensive branch networks, make larger technology investments and to offer services that we do not offer. The higher capitalization of the larger institutions permits them to provide higher lending limits than we can, although our current lending limit is able to accommodate the credit needs of most of our borrowers. Some of these competitors have other advantages, such as tax exemption in the case of credit unions, and to some extent, lesser regulation in the case of mortgage companies and finance companies.
Our primary multifamily competitor is JPMorgan Chase & Co. Additional competitors include, but are not limited to, Opus Bank, First Foundation, Inc., Homestreet Bank and Umpqua Bank. Our primary single family lending competitors in our markets are MUFG Union Bank, N.A., Fremont Bank, WaFd Bank, various non-bank mortgage lenders, and
6
large national banks. Our primary deposit competitors are local regional banks, community banks, numerous credit unions and large national banks.
Lending Activities
The primary components of our loan portfolio are multifamily and commercial real estate loans and single family residential loans, primarily jumbo loans which do not meet the requirements for conforming loans.
• | Multifamily and Commercial Real Estate Lending. |
Our commercial real estate loans consist primarily of first mortgage loans made for the purpose of purchase, refinance or build-out of tenant improvements on investor owned multifamily residential (five or more units) properties. We also provide loans for the purchase, refinance or improvement of office, retail and light industrial properties.
Our underwriting guidelines for multifamily and other commercial real estate loans require a thorough analysis of the financial performance, cash flows, loan to value and debt service coverage ratios, as well as the physical characteristics, of the property being financed and which will stand as collateral for the loan, as well as the financial condition and global cash flows of the borrower and any guarantor or other secondary source of repayment. We also closely review the experience of the borrower and its principals in the ownership, successful management and financing of multifamily residential rental properties or other rental commercial real estate, as well as their reputation for quality business practices and financial responsibility.
The location of the property is a primary factor in the Bank’s multifamily lending. We focus on markets with a high barrier to entry for new development, where there is a limited supply of new housing and where there is a high variance between the cost to rent and the cost to own. Our core lending areas are currently defined as:
• | Alameda, Contra Costa, Los Angeles, Marin, Napa, Orange, San Diego, San Francisco, San Mateo, Santa Barbara, Santa Clara, Sonoma and Ventura counties in California; |
• | Clark, King, Kitsap, Pierce and Snohomish counties in Washington; and |
• | Clackamas, Multnomah, and Washington counties in Oregon. |
Our extended core lending areas are currently defined as:
• | El Dorado, Monterey, Placer, Riverside, Sacramento, San Bernardino, San Luis Obispo, Santa Cruz and Solano counties in California; |
• | Spokane and Thurston counties in Washington; and |
• | Lane and Marion counties in Oregon. |
We may re-evaluate and revise the definitions of our core and extended core areas from time to time. Non-core markets include all markets in California, Oregon or Washington not categorized as core or extended core.
We make multifamily loans on a recourse or nonrecourse basis. We may require borrowers to provide personal guarantees in a variety of circumstances, including where a borrower lacks sufficient property ownership and management experience, or where specific loan characteristics do not meet our stringent underwriting criteria, including but not limited to loans with higher loan to value ratios or lower debt service coverage ratios. Loans on other commercial real estate are generally made on a comparable basis.
Our multifamily loans typically have a 30-year term, while our nonresidential commercial property loans have a 30-year amortization period, and are typically due in ten years. For commercial real estate, we offer adjustable rate loans based on Treasury indices, with an adjustable rate, 5-year hybrid product being our most common multifamily loan product type. Historically, our multifamily adjustable rate loans were originated primarily using the LIBOR index; however, use of this index was discontinued during 2019. We seek to have interest rates on all of our commercial loans adjust or reprice no later than seven years after origination, and quarterly or semi-annually thereafter, but our ability to obtain this term is subject to the effects of market competition, customer preferences and other factors beyond our control.
7
Our multifamily loans and other commercial real estate loans are primarily originated on a retail basis, through the marketing efforts of our bankers and loan production offices, and to a lesser extent, are originated on a wholesale basis, through a network of brokers. We intend to maintain a balance of both retail and wholesale loan originations, while tailoring our approach to the characteristics of each particular market. While our multifamily and other commercial real estate loans are generally held in portfolio, we may at times sell pools of loans as a means of managing our loan product concentrations, liquidity position, capital levels and/or interest rate risk.
• | Single Family Residential Lending. |
Our single family residential lending provides loans for the purchase or refinance of 1-4 family residential properties. The financed properties may be owner-occupied, or investor owned, and may be a primary residence, a second home or vacation property, or an investment property.
We currently originate substantially all of our single family residential loans through a network of wholesale brokers. We monitor and regularly review our broker relationships for regulatory compliance, integrity, competence, level of activity and profitability. The primary products offered are 3, 5, and 7-year variable rate hybrid loans, as well as the Grow and Daisy loan products described below.
The markets in which we make single family residential loans have historically been the same core and extended core markets in which we make multifamily residential and commercial real estate loans. These areas have been characterized by robust job markets, strong single family residential demand, high average housing cost, and concentrations of professional, highly skilled and high income workers, entrepreneurs and other high net worth individuals. These characteristics have provided a strong market for our jumbo mortgage products. In late 2019, we refocused our single family residential originations in our core lending areas. Our loans are underwritten to our financial parameters of loan to value and debt to income ratios. Our underwriting includes a thorough analysis of the borrower’s ability to repay the loan, based on reviews of information regarding the borrower’s income, cash flow and wealth. This analysis enables us to provide loans to professionals, business owners and entrepreneurs who may not have a constant, readily documentable earnings stream, but substantial assets, income and wealth. Our platform and niche lending offerings are designed to meet the needs of the high demand, low supply residential real estate market in high cost market areas, and are focused on delivering consistent certainty of execution. Our single family residential loans are generally held in portfolio, although we reserve the right to sell any loan at any time.
• | Grow and Daisy. |
We also offer innovative mortgage products, including a portfolio 30-year fixed rate first mortgage and a forgivable second mortgage, to low- and moderate-income borrowers designed to make home ownership possible and affordable even in our high cost markets. Our ‘‘Grow’’ program is designed as a conventional, community lending mortgage, up to the conforming loan amount, that offers underwriting flexibility to low- and moderate-income borrowers and borrowers purchasing properties located in a low- or moderate- income communities. Loans in this program are 30-year fixed rate mortgages made on owner-occupied single family (one and two unit) properties, including condominiums. Pricing on this product is competitive at market rate.
In conjunction with the Grow program, we also offer a down payment and closing cost assistance product, called ‘‘Daisy.’’ Under the Daisy program, eligible borrowers may take advantage of our second lien loan that provides up to two percent of the purchase price with an additional one percent for non-recurring closing costs to assist first time homebuyers when utilizing Grow, our first lien program. The loan has a term of 36 months with no payment required during the term of the Daisy loan. Daisy loans are not recorded as assets, but are instead expensed upon origination given their fully forgivable nature.
Loans under the Grow and Daisy programs help meet compelling needs in our communities, but may be associated with higher loan to value and combined loan to value ratios when compared to standard portfolio products.
8
Investment Activities
Our investment securities portfolio is primarily maintained as an on-balance sheet contingent source of liquidity. It provides additional interest income and has limited interest rate risk and credit risk. Other than certain securities purchased for CRA purposes, we generally classify all of our investment securities as available-for-sale. Our investment policy authorizes investment primarily in U.S. Treasury securities, U.S. Agency mortgage and loan backed securities and certain CRA qualifying investments. For purposes of our investment policy, U.S. Agencies are the Small Business Administration ("SBA"), the National Credit Union Administration ("NCUA"), the Government National Mortgage Association ("GNMA"), Freddie Mac, the Federal National Mortgage Association ("Fannie Mae") and the Federal Farm Credit Banks Funding Corporation. Securities issued by the SBA, NCUA and GNMA are backed by the full faith and credit of the federal government.
Funding Activities
Deposits.
We offer a wide array of deposit products for individuals and businesses, including interest and noninterest-bearing transaction accounts, certificates of deposit ("CD") and money market accounts. We provide a high level of customer service to our depositors. As a means of supplementing our strategically limited branch network, we offer our customers unlimited free access to ATM machines worldwide. Our strategy has produced a stable customer and depositor base. We have invested in personnel, business and compliance processes and technology that enable us to acquire, and efficiently and effectively serve, a wide array of business deposit accounts, while continuing to provide the level of customer service for which we are known.
Our deposits are currently acquired primarily through our branch network on a retail basis from high net worth individuals, professionals and their businesses, who value our financial strength, stability, high level of service and competitive interest rates. We have expanded our focus to leverage our relationships and serve business and individuals with a broader array of deposit and cash management products. We intend to increase our digital marketing presence to attract deposits within a wider geographic band surrounding our existing branch locations.
We currently offer a comprehensive range of business deposit products and services to assist with the banking needs of our business customers, from a basic reserve account (savings and CD products) to integrated operating accounts with cash management capacity. Our online banking platform allows a customer to view balances, initiate payments, pay bills and set up custom alerts/statements. Online wires, ACH and remote capture are additional account features available to qualified businesses. Our debit cards allow access to cash nationwide as a result of our membership in major ATM networks. We also provide online and mobile banking products to our consumer depositors, to complement our branch network.
We plan to continue to grow our deposits by cross-selling business deposit relationships to our existing consumer customers who are business owners, and consumer and business accounts to our multifamily and single family loan borrowers and by obtaining new individual and business customers, including specialty deposit customers, such as fiduciary services providers, 1031 exchange companies, unions and nonprofits. Our cross-selling efforts to existing customers will be strategically targeted, based on our in depth analyses of our customers’ overall financial situation, global cash flows, financial resources and banking requirements. Although, our cross-selling efforts remain in their early stages, we believe there is additional capacity to expand deposit and lending relationships on this basis.
We supplement customer deposits with wholesale, or brokered, deposits where necessary to fund loan demand prior to raising additional customer deposits, or where desirable from a cost or liability maturity standpoint. Our current policy limits the use of wholesale deposits in accordance with our risk appetite level as determined by our board of directors.
Borrowings.
We supplement the funding provided by our deposit accounts with other borrowings at the Bank level from the Federal Home Loan Bank of San Francisco ("FHLB") to enable us to fund loans and to meet liquidity needs. We also maintain a line of credit at the Federal Reserve Bank of San Francisco ("FRB") Discount Window, which is generally not used but provides an additional source of funding, if necessary. The use of FHLB borrowings can vary significantly from period to period, as the ability to originate loans frequently outpaces the ability to obtain core deposits at acceptable rates and in comparable amounts.
9
Risk Management
We believe that effective risk management is of primary importance. Risk management refers to the activities by which we identify, measure, monitor, evaluate and manage the risks we face in the course of our banking activities. These include liquidity, interest rate, credit, operational, compliance, regulatory, strategic, financial and reputational risk exposures. Our board of directors and management team have created a risk-conscious culture that is focused on quality growth, which starts with capable and experienced risk management teams and infrastructure capable of addressing the evolving risks we face, as well as the changing regulatory and compliance landscape. Our risk management approach employs comprehensive policies and processes to establish robust governance and emphasizes personal ownership and accountability for risk with all our employees. We believe a disciplined and conservative underwriting approach has been the key to our strong asset quality.
Our board of directors sets the tone at the top of our organization, adopting and overseeing the implementation of our Bank’s risk management framework, which establishes our overall risk appetite and risk management strategy. The board of directors approves our Risk Appetite Statement, which includes risk policies, procedures, limits, targets and reporting structured to guide decisions regarding the appropriate balance between risk and return considerations in our business. Our board of directors receives periodic reporting on the risks and control environment effectiveness and monitors risk levels in relation to the approved risk appetite. The Audit & Risk Committee of our board of directors provides oversight of all enterprise risk management. The Executive Committee of management is charged with identifying, managing and controlling key risks that threaten our ability to achieve our strategic initiatives and goals.
Credit risk is the risk that borrowers or counterparties will be unable or unwilling to repay their obligations in accordance with the underlying contractual terms and the risk that credit assets will suffer significant deterioration in market value. We manage and control credit risk in our loan portfolio by adhering to well-defined underwriting criteria and account administration standards established by management and approved by the board of directors. Written credit policies document underwriting standards, approval levels, exposure limits and other limits or standards deemed necessary and prudent. Portfolio diversification at the obligor, product and geographic levels is actively managed to mitigate concentration risk. In addition, credit risk management includes an independent credit review process that assesses compliance with commercial real estate and consumer credit policies, risk rating standards and other critical credit information. In addition to implementing risk management practices that are based upon established and sound lending practices, we adhere to sound credit principles. We understand and evaluate our customers’ borrowing needs and capacity to repay, in conjunction with their character and history. The Bank’s Credit Council, which includes our President and Chief Executive Officer, our Chief Credit Officer, Chief Financial Officer and Chief Risk Officer, is responsible for ensuring that the Bank has an effective credit risk management program and credit risk rating system, adheres to our board’s Risk Appetite Statement, and maintains an adequate allowance for loan losses. Our management and board of directors place significant focus on maintaining a healthy risk profile and ensuring sustainable growth. Our risk appetite seeks to balance the risks necessary to achieve our strategic goals while ensuring that our risks are appropriately managed and remain within our defined limits.
Our management of interest rate and liquidity risk is overseen by our Asset and Liability Council, which is chaired by our Chief Financial Officer, based on a risk management infrastructure approved by our board of directors that outlines reporting and measurement requirements. In particular, this infrastructure reviews financial performance, trends, and significant variances to budget; reviews and recommends for board approval risk limits and tolerances; reviews ongoing monitoring and reporting regarding our performance with respect to these areas of risk, including compliance with board-approved risk limits and stress-testing; reviews and recommends to the Executive Committee for approval any changes to theories, mathematics, methodologies, assumptions, and data output for models used to measure these risks; ensures annual back-testing and independent validation of models at a frequency commensurate with risk level; reviews all hedging strategies and recommends changes as appropriate; reviews and recommends our contingency funding plan; recommends to the Executive Committee proposed wholesale borrowing limits to be submitted to the board of directors or its designated committee; recommends to the Executive Committee the proposed terms of any unanticipated long-term borrowing arrangement prior to debt issuance; develops recommended capital requirements; and acts as a second line of defense in reviewing information and reports submitted to the council for the purpose of identifying, investigating, and assuring remediation, to its satisfaction, of errors or irregularities, if any.
10
Internet Access to Company Documents
The Company provides access to its SEC filings through its web site at www.lutherburbanksavings.com. After accessing the web site, the filings are available upon selecting "About Us/Investor Relations/Financials/SEC Filings." Reports available include the annual report on Form 10-K, quarterly reports on Form 10-Q, current reports on Form 8-K, and all amendments to those reports as soon as reasonably practicable after the reports are electronically filed with or furnished to the SEC. Further, the SEC maintains an internet site that contains reports, proxy and information statements, and other information regarding issuers that file electronically with the SEC at http://www.sec.gov. All website addresses given in this document are for information only and are not intended to be an active link or to incorporate any website information into this document.
Luther Burbank Corporation Foundation
In 2017, we established the Luther Burbank Corporation Foundation ("Foundation") which was granted 501(c)(3) status by the Internal Revenue Service ("IRS"). The Foundation is an all-volunteer organization primarily funded by the Company, as well as from our directors, business partners and a corporate giving program that matches employee donations. The Foundation focuses its activities in our communities on the three priority areas of (1) social and human services; (2) community development; and (3) education.
Employees
As of December 31, 2019, we had 277 full-time equivalent employees.
11
Item 1A. Risk Factors
We are subject to numerous risks, and the material risks and uncertainties that management believes affect us are described below. Any of these risks, if they are realized, could materially adversely affect our business, financial condition, and results of operations, and consequently, the value of our common stock. Additional risks and uncertainties not currently known to us or that we currently believe to be immaterial may also materially and adversely affect us. As a result, the trading price of our common stock could decline and you could lose all or part of your investment.
Some statements in these risk factors constitute forward-looking statements that involve risks and uncertainties. Please refer to the section entitled "Cautionary Note Regarding Forward-Looking Statements."
Risks Related to Our Business
Our business and operations may be materially adversely affected by weak economic conditions.
Our business and operations, which primarily consist of banking activities, including lending money to customers in the form of real estate secured loans and borrowing money from customers in the form of deposits, are sensitive to general business and economic conditions in the U.S. generally, and on the West Coast in particular, which may differ from economic conditions in the U.S. as a whole. If economic conditions in the U.S. or any of our markets weaken, our growth and profitability from our operations could be constrained. In addition, foreign economic and political conditions could affect the stability of global financial markets, which could hinder economic growth. Our business is also significantly affected by monetary and related policies of the U.S. federal government and its agencies. Changes in any of these policies are influenced by macroeconomic conditions and other factors that are beyond our control. Adverse economic conditions caused by inflation, recession, acts of terrorism, outbreak of hostilities or other international or domestic occurrences, pandemic disease, unemployment, changes in securities markets, declines in the housing market, a tightening credit environment or other factors, and government policy responses to such conditions, could have a material adverse effect on our business, financial condition and results of operations.
We are subject to interest rate risk, which could adversely affect our profitability.
Our profitability, like that of most financial institutions, depends to a large extent on our net interest income, which is the difference between our interest income on interest-earning assets, such as loans and investment securities, and our interest expense on interest-bearing liabilities, such as deposits and borrowings.
Interest rates are highly sensitive to many factors that are beyond our control, including general economic conditions and policies of various governmental and regulatory agencies and, in particular, the Board of Governors of the Federal Reserve System, or the Federal Reserve. Changes in monetary policy, including changes in interest rates, could influence not only the interest we receive on loans and securities and the interest we pay on deposits and borrowings, but such changes could affect our ability to originate loans and obtain deposits, the fair value of our financial assets and liabilities, and the average duration of our assets. If the interest rates paid on deposits and other borrowings increase at a faster rate than the interest rates received on loans and other investments, our net interest income, and therefore earnings, could be adversely affected. Earnings could also be adversely affected if the interest rates received on loans and other investments fall more quickly than the interest rates paid on deposits and other borrowings. Any substantial, unexpected or prolonged change in market interest rates could have a material adverse impact on our business, financial condition and results of operations.
Our interest sensitivity profile was liability sensitive as of December 31, 2019. When short-term interest rates rise, the rate of interest we pay on our interest-bearing liabilities, such as deposits, may rise more quickly than the rate of interest that we receive on our interest-earning assets, such as loans, which may cause our net interest income to decrease. Additionally, a shrinking yield premium between short-term and long-term market interest rates, a pattern typically indicative of investors' waning expectations of future growth and inflation, commonly referred to as a flattening of the yield curve, as well as an inverted yield curve, where long-term debt instruments have a lower yield than short-term debt instruments of the same credit quality, typically reduce our profit margin since we borrow at shorter terms than the terms at which we lend and invest.
In addition, an increase in interest rates could also have a negative impact on our results of operations by reducing the ability of borrowers to repay their current loan obligations. These circumstances could not only result in increased loan defaults, foreclosures and charge-offs, but also reduce collateral values and necessitate further increases to the allowance for loan losses, which could have a material adverse effect on our business, financial condition and results of operations.
12
We are subject to credit risk, which could adversely impact our profitability.
Our business depends on our ability to successfully measure and manage credit risk. As a lender, we are exposed to the risk that the principal of, or interest on, a loan will not be paid timely or at all or that the value of any collateral supporting a loan will be insufficient to cover our outstanding exposure. In addition, we are exposed to risks with respect to the period of time over which the loan may be repaid, risks relating to loan underwriting, risks resulting from changes in economic and industry conditions, and risks inherent in dealing with individual loans and borrowers. The creditworthiness of a borrower is affected by many factors including local market conditions and general economic conditions. If the overall economic climate in the U.S., generally, or in our market areas specifically, experiences material disruption, our borrowers may experience difficulties in repaying their loans, the collateral we hold may decrease in value or become illiquid, and the level of nonperforming loans, charge-offs and delinquencies could rise and require significant additional provisions for loan losses. Additional factors related to the credit quality of multifamily residential and other commercial real estate loans include the quality of management of the business and tenant vacancy rates.
Our risk management practices, such as monitoring the concentration of our loans within specific markets and product types and our credit approval, review and administrative practices, may not adequately reduce credit risk, and our credit administration personnel, policies and procedures may not adequately adapt to changes in economic or any other conditions affecting customers and the quality of the loan portfolio. Many of our loans are made to small businesses that are less able to withstand competitive, economic and financial pressures than larger borrowers. Consequently, we may have significant exposure if any of these borrowers becomes unable to pay their loan obligations as a result of economic or market conditions, or personal circumstances, such as divorce, unemployment or death. A failure to effectively measure and limit the credit risk associated with our loan portfolio may result in loan defaults, foreclosures and additional charge-offs, and may necessitate that we significantly increase our allowance for loan losses, each of which could adversely affect our net income. As a result, our inability to successfully manage credit risk could have a material adverse effect on our business, financial condition and results of operations.
Our multifamily residential and commercial real estate loan portfolios may carry significant credit risk.
Our loan portfolio consists primarily of multifamily residential and, to a lesser extent, other commercial real estate loans, which are secured by industrial, office and retail properties. As of December 31, 2019, our multifamily residential loans totaled $4.0 billion, or 64.1% of our loan portfolio, and our other commercial real estate loans totaled $202.5 million, or 3.3% of our loan portfolio. Nonperforming multifamily residential loans were $541 thousand at December 31, 2019. There were no nonperforming other commercial real estate loans at December 31, 2019. Multifamily residential and commercial real estate loans may carry significant credit risk because they typically involve large loan balances concentrated with a single borrower or groups of related borrowers. The payment on these loans that are secured by income producing properties are typically dependent on the successful operation of the related real estate property and may subject us to risks from adverse conditions in the real estate market or the general economy. Investment in these properties by our customers is influenced by prices and return on investment, as well as changes to applicable laws regarding, among other things, rent control, personal and corporate tax reform, pass-through rules, immigration and fiscal and economic policy. The collateral securing these loans typically cannot be liquidated as easily as single family residential real estate, which may lead to longer holding periods.
If these properties become less attractive investments, demand for our loans would decrease. In addition, unexpected deterioration in the credit quality of our multifamily residential or commercial real estate loan portfolios could require us to increase our provision for loan losses, which would reduce our profitability and could materially adversely affect our business, financial condition and results of operations.
Our business and operations are concentrated in California and Washington, and we are more sensitive than our more geographically diversified competitors to adverse changes in the local economy.
Unlike many of our larger competitors that maintain significant operations located outside our market areas, substantially all of our customers are individuals and businesses located and doing business in the states of California and Washington. As of December 31, 2019, approximately 87% of the loans in our portfolio measured by dollar amount were secured by collateral located in California and 11% of the loans in our portfolio measured by dollar amount were secured by collateral located in Washington. In addition, 61% of our real estate loans measured by dollar amount, were secured by collateral located in southern California counties. Therefore, our success will depend upon the general economic conditions in these areas, which we cannot predict with certainty. As a result, our operations and profitability may be more adversely affected by a local economic downturn than those of large, more geographically diverse competitors. A downturn in the local economy could make it more difficult for our borrowers to repay their loans and
13
may lead to loan losses that are not offset by operations in other markets; it may also reduce the ability of depositors to make or maintain deposits with us. For these reasons, any regional or local economic downturn could have a material adverse effect on our business, financial condition and results of operations.
Our ability to conduct our business could be disrupted by natural or man-made disasters.
A significant number of our offices, and a significant portion of the real estate securing loans we make, and our borrowers' business operations in general, are located in California. California has had and will continue to have major earthquakes in areas where a significant portion of the collateral and assets of our borrowers are concentrated. California is also prone to fires, mudslides, floods and other natural disasters. Additionally, acts of terrorism, war, civil unrest, violence, or other man-made disasters could also cause disruptions to our business or to the economy as a whole. The occurrence of natural or man-made disasters could destroy, or cause a decline in the value of, mortgaged properties or other assets that serve as our collateral and increase the risk of delinquencies, defaults, foreclosures and losses on our loans, damage our banking facilities and offices, negatively impact regional economic conditions, result in a decline in loan demand and loan originations, result in drawdowns of deposits by customers impacted by disasters and negatively impact the implementation of our growth strategy. We have implemented a disaster recovery and business continuity plan that allows us to move critical functions to a backup data center in the event of a catastrophe. Although this program is tested periodically, we cannot guarantee its effectiveness in any disaster scenario. Regardless of the effectiveness of our disaster recovery and business continuity plan, the occurrence of any natural or man-made disaster could have a material adverse effect on our business, financial condition and results of operations.
We operate in a highly competitive market and face increasing competition from a variety of traditional and new financial services providers, which could adversely impact our profitability.
The banking markets in which we operate are highly competitive and our future growth and success will depend on our ability to compete effectively in these markets. We compete for deposits, loans, and other financial services in our markets with commercial and community banks, credit unions, savings and loan associations, mortgage banking firms and online mortgage lenders, including large national financial institutions that operate in our market area. Many of these competitors are larger than us, have significantly more resources and greater brand recognition than we do, and may be able to attract customers more effectively than we can. Increased competition could require us to increase the rates we pay on deposits or lower the rates that we offer on loans, which could reduce our profitability. Our failure to compete effectively in our market could restrain our growth or cause us to lose market share, which could have a material adverse effect on our business, financial condition and results of operations.
We may not be able to retain or grow our core deposit base, which could adversely impact our funding costs.
Like many financial institutions, we rely on customer deposits as our primary source of funding for our lending activities, and we continue to seek customer deposits to maintain this funding base. Our future growth will largely depend on our ability to retain and grow our deposit base. As of December 31, 2019, we had $5.2 billion in deposits and a loan to deposit ratio of 119%, which is higher than the level maintained by many other banks. As of the same date, using deposit account related information such as tax identification numbers, account vesting and account size, we estimated that $1.3 billion of our deposits exceeded the insurance limits established by the Federal Deposit Insurance Corporation ("FDIC"). None of our deposits are governmental deposits secured by collateral. Although we have historically maintained a high deposit customer retention rate, these deposits are subject to potentially dramatic fluctuations in availability or price due to certain factors outside of our control, such as increasing competitive pressures for deposits, changes in interest rates and returns on other investment classes, customer perceptions of our financial health and general reputation, or a loss of confidence by customers in us or the banking sector generally, which could result in significant outflows of deposits within short periods of time or significant changes in pricing necessary to maintain current customer deposits or attract additional deposits. Additionally, any such loss of funds could result in lower loan originations, which could have a material adverse effect on our business, financial condition and results of operations.
Our reputation is critical to our business, and damage to it could have a material adverse effect on us.
A key differentiating factor for our business is the strong reputation we are building in our markets. Maintaining a positive reputation is critical to attracting and retaining customers and employees. Adverse perceptions of us could make it more difficult for us to execute on our strategy. Harm to our reputation can arise from many sources, including actual or perceived employee misconduct, errors or misconduct by our third party vendors or other counterparties, litigation or regulatory actions, our failure to meet our high customer service and quality standards and compliance
14
failures. Negative publicity about us, whether or not accurate, may damage our reputation, which could have a material adverse effect on our business, financial condition and results of operations.
Our allowance for loan losses may be inadequate to absorb probable incurred losses inherent in the loan portfolio, which could have a material adverse effect on our business, financial condition and results of operations.
We periodically review our allowance for loan losses for adequacy considering historical loss experience, volume and types of loans, trends in classification, volume and trends in delinquencies and non-accrual loans, economic conditions and other pertinent information. The determination of the appropriate level of the allowance for loan losses is inherently highly subjective and requires us to make significant estimates of and assumptions regarding current credit risk and future trends, all of which may change materially. Although we endeavor to maintain our allowance for loan losses at a level adequate to absorb any probable incurred losses inherent in the loan portfolio, these estimates of loan losses are necessarily subjective and their accuracy depends on the outcome of future events. Inaccurate management assumptions, continuing deterioration of economic conditions affecting borrowers, new information regarding existing loans, identification of additional problem loans and other factors, both within and outside of our control, may require us to increase our allowance for loan losses. In addition, our regulators, as an integral part of their examination process, periodically review our loan portfolio and the adequacy of our allowance for loan losses and may require adjustments based upon judgments that are different than those of management. Differences between our actual experience and assumptions and the effectiveness of our models could adversely affect our business, financial condition and results of operations.
We are dependent on our management team and key employees, and if we are not able to retain them, our business operations could be materially adversely affected.
Our success depends, in large part, on our management team and key employees. Our management team has significant industry experience, although a number of members of our senior management team have only been with us for a few years or less. In addition, our loan origination activities are conducted by a small number of individuals. Failure to attract and retain a qualified management team and qualified key employees could have a material adverse effect on our business, financial condition and results of operations.
We may not be able to maintain growth, earnings or profitability consistent with our strategic plan.
There can be no assurance that we will remain profitable in future periods, or, if profitable, that our overall earnings will remain consistent with our prior results of operations, or increase in the future. Sustainable growth requires that we manage our risks by following prudent loan underwriting standards, balancing loan and deposit growth without materially increasing interest rate risk or compressing our net interest margin, maintaining more than adequate capital at all times, scaling technology platforms, hiring and retaining qualified employees, and successfully implementing our strategic initiatives. Our failure to maintain a sustainable rate of growth or adequately manage the factors that have contributed to that growth could have a material adverse effect on our earnings and profitability and, therefore on our business, financial condition and results of operations.
Regulatory requirements affecting our loans secured by commercial real estate could limit our ability to leverage our capital and adversely affect our growth and profitability.
The federal banking agencies have issued guidance for institutions that are deemed to have concentrations in commercial real estate ("CRE") lending. Pursuant to the supervisory criteria contained in the guidance for identifying institutions with a potential CRE concentration risk, institutions which have (i) total reported loans for construction, land development, and other land which represent 100% or more of an institution's total risk-based capital; or (ii) total CRE loans representing 300% or more of the institution's total risk-based capital and the outstanding balance of the institution's CRE loan portfolio has increased 50% or more during the prior 36 months are identified as having potential CRE concentration risk. Institutions which are deemed to have concentrations in CRE lending are expected to employ heightened levels of risk management with respect to their CRE portfolios, and may be required to hold higher levels of capital. We have a concentration in CRE loans, and multifamily residential real estate loans in particular, and we have experienced significant growth in our CRE portfolio in recent years. As of December 31, 2019, CRE loans represent 594% of the Company's total risk-based capital. Multifamily residential real estate loans, the vast majority of which are 50% risk weighted for regulatory capital purposes, were 562% of the Company's total risk-based capital. Management has extensive experience in CRE lending, and has implemented and continues to maintain heightened portfolio monitoring and reporting, and strong underwriting criteria with respect to its CRE portfolio. Nevertheless, we could be
15
required to maintain higher levels of capital as a result of our CRE concentration, which could limit our growth, require us to obtain additional capital, and have a material adverse effect on our business, financial condition and results of operations.
Lack of seasoning of our loan portfolio could increase risk of credit defaults in the future.
As a result of our organic growth over the past several years, as of December 31, 2019, approximately $5.4 billion, or 86.5%, of the loans in our loan portfolio were originated since January 1, 2016, of which 9.8% were from in-house refinancings. In general, loans do not begin to show signs of credit deterioration or default until they have been outstanding for some period of time, a process referred to as "seasoning." As a result, a portfolio of older loans will usually behave more predictably than a newer portfolio. Although a significant portion of our multifamily portfolio is refinancings of prior loans on the same property, a large portion of our loan portfolio is relatively new, and therefore, the current level of delinquencies and defaults may not represent the level that may prevail as the portfolio becomes more seasoned and may not serve as a reliable basis for predicting the health and nature of our loan portfolio, including net charge-offs and the ratio of nonperforming assets in the future. Our limited experience with these loans does not provide us with a significant history pattern with which to judge future collectability or performance. However, we believe that our stringent credit underwriting process, our ongoing credit review processes, and our history of successful management of our loan portfolio, mitigate these risks. Nevertheless, if delinquencies and defaults increase, we may be required to increase our provision for loan losses, which could have a material adverse effect on our business, financial condition and results of operations.
Our loan portfolio possesses increased risk due to our level of adjustable rate loans.
A substantial majority of the real estate secured loans in our portfolio are adjustable rate loans. Any rise in prevailing market interest rates may result in increased periodic payments for borrowers who have adjustable rate mortgage loans, increasing the possibility of defaults that may adversely affect our profitability.
Our single family residential loan portfolio possesses increased risk due to our level of interest only loans and other non-conforming loans.
Many of the residential mortgage loans we have originated consist of SFR loans that do not conform to Fannie Mae or Freddie Mac underwriting guidelines as a result of loan terms, loan size or other exceptions from agency underwriting guidelines. Additionally, many of our loans do not meet the qualified mortgage definition established by the Consumer Financial Protection Bureau, and therefore, contain additional regulatory and legal risks. In addition, the secondary market demand for nonconforming mortgage loans is generally limited, and consequently, we may experience difficulties selling the non-conforming loans in our portfolio should we decide to do so.
With respect to interest only loans, a borrower's monthly payment is subject to change when the loan converts to fully-amortizing status. Since the borrower's monthly payment may increase by a substantial amount, even without an increase in prevailing market interest rates, the borrower might not be able to afford the increased monthly payment. Our SFR interest only loans at December 31, 2019, totaled $505.2 million, or 25.3% of our total SFR loan portfolio, as compared to $515.3 million, or 23.1%, at December 31, 2018.
We are exposed to higher credit risk due to relationship exposure with a number of large borrowers.
As of December 31, 2019, we had 23 borrowing relationships in excess of $20 million which accounted for approximately 8.8% of our loan portfolio. While we are not overly dependent on any one of these relationships and while none of these relationships have had any material credit quality issues in the past, a deterioration of any of these credit relationships could require us to increase our allowance for loan losses or result in significant losses to us, which could have a material adverse effect on our business, financial condition and results of operations.
Liquidity risk could impair our ability to fund operations and meet our obligations as they become due and failure to maintain sufficient liquidity could materially adversely affect our growth, business, profitability and financial condition.
Liquidity is essential to our business. Liquidity risk is the potential that we will be unable to meet our obligations as they become due because of an inability to liquidate assets or obtain adequate funding at a reasonable cost, in a timely manner and without adverse conditions or consequences. We require sufficient liquidity to fund asset growth, meet customer loan requests, customer deposit maturities and withdrawals, payments on our debt obligations as they come
16
due and other cash commitments under both normal operating conditions and other unpredictable circumstances, including events causing industry or general financial market stress. Liquidity risk can increase due to a number of factors, including an over-reliance on a particular source of funding or market-wide phenomena such as market dislocation and major disasters. Factors that could detrimentally impact access to liquidity sources include, but are not limited to, a decrease in the level of our deposit activity as a result of a downturn in the markets in which our loans are concentrated, adverse regulatory actions against us, or changes in the liquidity needs of our depositors. Market conditions or other events could also negatively affect the level or cost of funding, affecting our ongoing ability to accommodate liability maturities and deposit withdrawals, meet contractual obligations, and fund asset growth and new business transactions at a reasonable cost, in a timely manner, and without adverse consequences. Our inability to raise funds through deposits, borrowings, the sale of loans, and other sources could have a substantial negative effect on our business, and could result in the closure of the Bank. Our access to funding sources in amounts adequate to finance our activities or on acceptable terms could be impaired by factors that affect our organization specifically or the financial services industry or economy in general. Any substantial, unexpected, and/or prolonged change in the level or cost of liquidity could impair our ability to fund operations and meet our obligations as they become due and could have a material adverse effect on our business, financial condition and results of operations.
We rely on customer deposits, advances from the FHLB and brokered deposits to fund our operations. Although we have historically been able to replace maturing deposits and advances, if desired, including throughout the recent recession, we may not be able to replace such funds in the future if our financial condition, the financial condition of the FHLB or market conditions change. FHLB borrowings and other current sources of liquidity may not be available or, if available, sufficient to provide adequate funding for operations.
Limits on our ability to use brokered deposits as part of our funding strategy may adversely affect our ability to grow.
A "brokered deposit" is any deposit that is obtained from or through the mediation or assistance of a deposit broker. These deposit brokers attract deposits from individuals and companies throughout the country and internationally whose deposit decisions are based almost exclusively on obtaining the highest interest rates. Recently enacted regulation excludes reciprocal deposits of up to the lesser of $5 billion or 20% of an institution’s deposits from the definition of brokered deposits, where the institution is "well-capitalized" and has a regulatory examination composite rating of 1 or 2. We have used brokered deposits in the past, and we intend to continue to use brokered deposits as one of our funding sources to support future growth. As of December 31, 2019, brokered deposits, represented 7.9% of our total deposits. Currently, these wholesale deposits have a modestly lower deposit cost as compared to our retail deposits. However, there are risks associated with using brokered deposits. In order to continue to maintain our level of brokered deposits, we may be forced to pay higher interest rates than those contemplated by our asset-liability pricing strategy. In addition, banks that become less than "well-capitalized" under applicable regulatory capital requirements may be restricted or prohibited in their ability to accept or renew brokered deposits. If this funding source becomes more difficult to access, we will have to seek alternative funding sources in order to continue to fund our growth. This may include increasing our reliance on FHLB borrowings, attempting to attract additional non-brokered deposits, and selling loans. There can be no assurance that brokered deposits will be available, or if available, sufficient to support our continued growth. The unavailability of a sufficient volume of brokered deposits could have a material adverse effect on our business, financial condition and results of operations.
New lines of business, products, product enhancements or services may subject us to additional risk.
From time to time, we may implement new lines of business or offer new products and product enhancements as well as new services within our existing lines of business. There are substantial risks and uncertainties associated with these efforts. In developing, implementing or marketing new lines of business, products, product enhancements or services, we may invest significant time and resources. We may underestimate the appropriate level of resources or expertise necessary to make new lines of business or products successful or to realize their expected benefits. We may not achieve the milestones set in initial timetables for the development and introduction of new lines of business, products, product enhancements or services, and price and profitability targets may not prove feasible. External factors, such as compliance with regulations, competitive alternatives and shifting market preferences, may also impact the ultimate implementation of a new line of business or offerings of new products, product enhancements or services. Any new line of business, product, product enhancement or service could have a significant impact on the effectiveness of our system of internal controls. We may also decide to discontinue businesses or products, due to lack of customer acceptance or unprofitability. Failure to successfully manage these risks in the development and implementation of new lines of business or offerings of new products, product enhancements or services could have a material adverse effect on our business, financial condition and results of operations.
17
We intend to provide banking services to customers in the cannabis industry and the strict enforcement of federal laws regarding cannabis would likely result in our inability to continue this line of business and we could have legal action taken against us by the federal government.
We have launched a pilot program to provide deposit services to a limited group of California-licensed cannabis related businesses ("CRBs"). The pilot program will be open only to up to 12 California-licensed retailers, commonly referred to as dispensaries, engaged in the sale of medical cannabis. We will not be providing any extensions of credit under this program. Though medical and adult-use cannabis is legal in the state of California, its manufacture, distribution, possession, and use are prohibited under the federal Controlled Substances Act ("CSA"). Violations of the CSA are punishable by imprisonment and fines.
Although there have been several examples of proposed federal legislation that would resolve the conflict between state and federal laws with respect to cannabis, no such legislation has passed. In 2019, the House of Representatives passed the Secure and Fair Enforcement Act of 2019 which would have created legal protections for depository institutions that chose to provide banking services to legitimate cannabis-related businesses, among other things. The legislation was not taken up by the Senate.
In 2013, the U.S. Department of Justice ("DOJ") issued a memo ("Cole Memo") that outlined the DOJ's enforcement priorities with regard to cannabis and instructed federal prosecutors to focus prosecutorial efforts on eight priorities detailed in the memo. In 2018, the DOJ rescinded the Cole Memo and no subsequent guidance has been issued by the DOJ.
Since 2014, the U.S. Congress has enacted an omnibus spending bill that includes a provision prohibiting the DOJ and the U.S. Drug Enforcement Administration from using funds appropriated by that bill to prevent states from implementing their medical-use cannabis laws. This provision must be renewed annually and the current provision expires on September 30, 2020. The U.S. Court of Appeals for the Ninth Circuit held in USA v. McIntosh that this provision prohibits the DOJ from spending funds from relevant appropriation acts to prosecute individuals who engage in conduct permitted by state medical-use cannabis laws and who strictly comply with such laws. However, any change in the federal government's enforcement position could cause us to immediately terminate our cannabis banking pilot program.
The U.S. Department of the Treasury's Financial Crimes Enforcement Network ("FinCEN") published guidelines in 2014 in conjunction with the issuance of the Cole Memo for financial institutions servicing state legal cannabis businesses. The FinCEN guidance discusses federal regulators' expectations regarding BSA compliance when a financial institution provides banking services to a CRB. Any adverse change to the FinCEN guidance or the interpretation of the guidance by federal regulators could cause us to immediately terminate our cannabis banking pilot program.
Any change in the enforcement priorities of the DOJ, FinCEN, or our federal banking regulators or our failure to comply with the FinCEN guidance could result in legal or administrative action being taken against us, and such action could have a material adverse effect on our business, financial condition and results of operations.
Operational risks are inherent in our business.
Operational risks and losses can result from internal and external fraud; gaps or weaknesses in our risk management or internal control procedures; errors by employees or third-parties; failure to document transactions properly or to obtain proper authorization; failure to comply with applicable regulatory requirements; failures in the models we utilize and rely on; equipment failures, including those caused by electrical, telecommunications or other essential utility outages; business continuity and data security system failures, including those caused by computer viruses, cyberattacks, unforeseen problems encountered while implementing major new computer systems, upgrades to existing systems or inadequate access to data or poor response capabilities in light of such business continuity or data security system failures; or the inadequacy or failure of systems and controls, including those of our suppliers or counterparties. Although we have implemented risk controls and loss mitigation actions, and substantial resources are devoted to developing efficient procedures, identifying and rectifying weaknesses in existing procedures and training staff, there is no assurance that such actions will be effective in controlling all of the operational risks faced by us. Failure of our risk controls and/or loss mitigation actions could have a material adverse effect on our business, financial condition and results of operations.
18
We depend on the accuracy and completeness of information provided by customers and counterparties.
In deciding whether to extend credit or enter into other transactions with customers and counterparties, we may rely on information furnished by or on behalf of customers and counterparties, including financial information. We may also rely on representations of customers and counterparties as to the accuracy and completeness of that information. In deciding whether to extend credit, we may rely upon customers' representations that their financial statements present fairly, in all material respects, the financial condition, results of operations and cash flows of the customer. We also may rely on customer representations and certifications, or other audit or accountants' reports, with respect to the business and financial condition of our customers. Our financial condition, results of operations, financial reporting and reputation could be negatively affected if we rely on materially misleading, false, inaccurate or fraudulent information.
We depend on information technology and telecommunications systems of third parties, and any systems failures or interruptions could adversely affect our operations and financial condition.
Our business depends on the successful and uninterrupted functioning of our information technology and telecommunications systems. We outsource many of our major systems, such as data processing, deposit processing, loan origination, email and anti-money laundering monitoring systems. Of particular significance is our long term contract for core data processing services with Fiserv. The failure of these systems, or the termination of a third party software license or service agreement on which any of these systems is based, could interrupt our operations, and we could experience difficulty in implementing replacement solutions. In many cases our operations rely heavily on secured processing, storage and transmission of information and the monitoring of a large number of transactions on a minute-by-minute basis, and even a short interruption in service could have significant consequences. Because our information technology and telecommunications systems interface with and depend on third party systems, we could experience service denials if demand for such services exceeds capacity or such third party systems fail or experience interruptions. If significant, sustained or repeated, a system failure or service denial could compromise our ability to operate effectively, damage our reputation, result in a loss of customer business, and subject us to additional regulatory scrutiny and possible financial liability, any of which could have a material adverse effect on our business, financial condition and results of operations. In addition, failure of third parties to comply with applicable laws and regulations, or fraud or misconduct on the part of employees of any of these third parties could disrupt our operations or adversely affect our reputation.
We are subject to cybersecurity risks and security breaches and may incur increasing costs in an effort to minimize those risks and to respond to cyber incidents, and we may experience harm to our reputation and liability exposure from security breaches.
Our business involves the storage and transmission of customers' proprietary information, and security breaches could expose us to a risk of loss or misuse of this information, litigation and potential liability. While we have incurred no material cyber-attacks or security breaches to date, a number of other financial services and other companies have disclosed cyber-attacks and security breaches, some of which have involved intentional attacks. Attacks may be targeted at us, our customers, or both. Although we devote significant resources to maintain, regularly update and backup our systems and processes that are designed to protect the security of our computer systems, software, networks and other technology assets and the confidentiality, integrity and availability of information belonging to us or our customers, our security measures may not be effective against all potential cyber-attacks or security breaches. Despite our efforts to ensure the integrity of our systems, it is possible that we may not be able to anticipate or to implement effective preventive measures against all security breaches of these types, especially because the techniques used change frequently or are not recognized until launched, and because cyber-attacks can originate from a wide variety of sources, including persons who are involved with organized crime or associated with external service providers or who may be linked to terrorist organizations or hostile foreign governments. These risks may increase in the future as we continue to increase our internet-based product offerings and expand our internal usage of web-based products and applications. If an actual or perceived security breach occurs, customer perception of the effectiveness of our security measures could be harmed and could result in the loss of customers.
A successful penetration or circumvention of the security of our systems, including those of third party providers or other financial institutions, or the failure to meet regulatory requirements for security of our systems, could cause serious negative consequences, including significant disruption of our operations, misappropriation of our confidential information or that of our customers, or damage to our computers or systems or those of our customers or counterparties, significant increases in compliance costs (such as repairing systems or adding new personnel or protection technologies), and could result in violations of applicable privacy and other laws, financial loss to us or to our customers,
19
loss of confidence in our security measures, customer dissatisfaction, significant litigation and regulatory exposure, and harm to our reputation, all of which could have a material adverse effect on our business, financial condition and results of operations.
Failure to keep up with the rapid technological changes in the financial services industry could have a material adverse effect on our competitive position and profitability.
The financial services industry is undergoing rapid technological changes, with frequent introductions of new technology-driven products and services. The effective use of technology increases efficiency and enables financial institutions to better serve customers and reduce costs. Our future success will depend, in part, upon our ability to address the needs of our customers by using technology to provide products and services that will satisfy customer demands for convenience, as well as to create additional efficiencies in our operations. Many of our competitors have substantially greater resources to invest in technological improvements than we have. We may not be able to implement new technology-driven products and services effectively or be successful in marketing these products and services to our customers. Failure to successfully keep pace with technological change affecting the financial services industry could harm our ability to compete effectively and could have a material adverse effect on our business, financial condition or results of operations. As these technologies are improved in the future, we may be required to make significant capital expenditures in order to remain competitive, which may increase our overall expenses and have a material adverse effect on our business, financial condition and results of operations.
Our risk management framework may not be effective in mitigating risks and/or losses to us.
Our risk management framework is comprised of various processes, systems and strategies, and is designed to manage the types of risk to which we are subject, including, among others, credit, market, liquidity, operational, interest rate and compliance. Our framework also includes financial or other modeling methodologies that involve management assumptions and judgment. Our risk management framework may not be effective under all circumstances. Our risk management framework may not adequately mitigate any risk or loss to us. If our risk management framework is not effective, we could suffer unexpected losses and our business, financial condition, results of operations or growth prospects could be materially and adversely affected. We may also be subject to potentially adverse regulatory consequences.
We may be adversely affected by the soundness of other financial institutions.
Our ability to engage in routine funding transactions could be adversely affected by the actions and commercial soundness of other financial institutions. Financial services companies are interrelated as a result of trading, clearing, counterparty, and other relationships. As a result, defaults by, or even rumors or questions about, one or more financial services companies, or the financial services industry generally, could lead to market-wide liquidity problems and losses or defaults by us or other institutions. These losses could have a material adverse effect on our business, financial condition and results of operations.
We are dependent on the use of data and modeling in both our management's decision making generally and in meeting regulatory expectations in particular.
The use of statistical and quantitative models and other quantitatively-based analyses is endemic to bank decision making and regulatory compliance processes, and the employment of such analyses is becoming increasingly widespread in our operations. Liquidity stress testing, interest rate sensitivity analysis, allowance for loan loss measurement, loan portfolio stress testing and the identification of possible violations of anti-money laundering regulations are examples of areas in which we are dependent on models and the data that underlies them. While these quantitative techniques and approaches improve our decision making, they also create the possibility that faulty data or flawed quantitative approaches could yield adverse outcomes or regulatory scrutiny. Secondarily, because of the complexity inherent in these approaches, misunderstanding or misuse of their outputs could similarly result in suboptimal decision making, which could have a material adverse effect on our business, financial condition and results of operations.
20
If we fail to design, implement and maintain effective internal control over financial reporting or remediate any future material weakness in our internal control over financial reporting, we may be unable to accurately report our financial results or prevent fraud, which could have a material adverse effect on us.
Our internal control over financial reporting is designed to provide reasonable assurance regarding the reliability of the financial reporting and the preparation of financial statements for external purposes in accordance with Generally Accepted Accounting Principles ("GAAP"). Effective internal control over financial reporting is necessary for us to provide reliable reports and prevent fraud.
Under Section 404 of the Sarbanes-Oxley Act of 2002 (the “Sarbanes-Oxley Act”), management is required to annually assess and report on the effectiveness of our internal control over financial reporting and, when we cease to be an emerging growth company under the JOBS Act, include an attestation report by the Company’s independent auditors addressing the effectiveness of our internal control over financial reporting. Our management may conclude that our internal control over financial reporting is not effective due to the failure to cure any identified material weakness or otherwise. Moreover, even if management concludes that our internal control over financial reporting is effective, our independent registered public accounting firm may conclude that our internal control over financial reporting is not effective. In the course of their review, our independent registered public accounting firm may not be satisfied with the internal control over financial reporting or the level at which the controls are documented, designed, operated or reviewed, or it may interpret the relevant requirements differently from the Company. In addition, during the course of the evaluation, documentation and testing of our internal control over financial reporting, we may identify deficiencies that we may not be able to remediate in time to meet the deadline imposed by the SEC for compliance with the requirements of the Sarbanes-Oxley Act. Any such deficiencies may also subject us to adverse regulatory consequences. If we fail to achieve and maintain the adequacy of internal control over financial reporting, as these standards are modified, supplemented or amended from time to time, we may be unable to report our financial information on a timely basis, may not be able to conclude on an ongoing basis that we have effective internal control over financial reporting in accordance with the Sarbanes-Oxley Act, and may suffer adverse regulatory consequences or violate NASDAQ's listing standards. There could also be a negative reaction in the financial markets due to a loss of investor confidence in the reliability of our financial statements.
We believe that a control system, no matter how well designed and managed, can provide only reasonable, not absolute, assurance that the objectives of the control system are met. Because of the inherent limitations in all control systems, no evaluation of controls can provide absolute assurance that all control issues and instances of fraud, if any, within a company have been detected. We may not be able to identify all significant deficiencies and/or material weaknesses in our internal control in the future, and our failure to maintain effective internal control over financial reporting in accordance with the Sarbanes-Oxley Act could have a material adverse effect on our business, financial condition and results of operations.
We may need to raise additional capital in the future, and we may not be able to do so.
Access to sufficient capital is critical in order to enable us to implement our business plan, support our business, expand our operations, and meet applicable capital requirements. The inability to have sufficient capital, whether internally generated through earnings or raised in the capital markets, could adversely impact our ability to support and to grow our operations. If we grow our operations faster than we generate capital internally, we will need to access the capital markets. We may not be able to raise additional capital in the form of additional debt or equity. Our ability to raise additional capital, if needed, will depend on, among other things, conditions in the capital markets at that time, our financial condition and our results of operations. Economic conditions and/or a loss of confidence in financial institutions may increase our cost of capital and limit access to some sources of capital. Such capital may not be available on acceptable terms, or at all. Any occurrence that may limit our access to the capital markets, or disruption in capital markets, may adversely affect our capital costs and our ability to raise capital. Further, if we need to raise capital in the future, we may have to do so when many other financial institutions are also seeking to raise capital and would then have to compete with those institutions for investors. An inability to raise additional capital on acceptable terms when needed could have a material adverse impact on our business, financial condition and results of operations.
Litigation and regulatory actions, including possible enforcement actions, could subject us to significant fines, penalties, judgments or other requirements resulting in increased expenses or restrictions on our business activities.
In the normal course of business, from time to time, we have in the past and may in the future be named as a defendant in various legal actions, arising in connection with our current and/or prior business activities. Legal actions could
21
include claims for substantial compensatory or punitive damages or claims for indeterminate amounts of damages. We may also, from time to time, be the subject of subpoenas, requests for information, reviews, investigations and proceedings (both formal and informal) by governmental agencies regarding our current and/or prior business activities. Any such legal or regulatory actions may subject us to substantial compensatory or punitive damages, significant fines, penalties, obligations to change our business practices or other requirements resulting in increased expenses, diminished income and damage to our reputation. Our involvement in any such matters, whether tangential or otherwise and even if the matters are ultimately determined in our favor, could also cause significant harm to our reputation and divert management attention from the operation of our business. Further, any settlement, consent order or adverse judgment in connection with any formal or informal proceeding or investigation by government agencies may result in litigation, investigations or proceedings as other litigants and government agencies begin independent reviews of the same activities. As a result, the outcome of legal and regulatory actions could have a material adverse effect on our business, financial condition and results of operations.
We are subject to an extensive body of accounting rules and best practices. Periodic changes to such rules may change the treatment and recognition of critical financial line items and affect our profitability.
The nature of our business makes us sensitive to the large body of accounting rules in the U.S. From time to time, the governing bodies that oversee changes to accounting rules and reporting requirements may release new guidance for the preparation of our financial statements. These changes can materially impact how we record and report our financial condition and results of operations. In some instances, we could be required to apply a new or revised standard retroactively, resulting in the restatement of prior period financial statements. Changes which have been approved for future implementation, or which are currently proposed or expected to be proposed or adopted include requirements that we: (i) calculate the allowance for loan losses on the basis of the current expected loan losses over the lifetime of our loans, which is expected to be applicable to us beginning in 2023; and (ii) record the value of and liabilities relating to operating leases on our balance sheet, which is expected to be applicable beginning on January 1, 2021. These changes could adversely affect our capital, regulatory capital ratios, ability to make larger loans, earnings and performance metrics. We are evaluating the impact the Current Expected Credit Loss ("CECL") accounting model will have on our financial results, but expect to recognize a one-time cumulative-effect adjustment to the allowance for loan losses and retained earnings as of the beginning of the first reporting period in which the new standard is effective. We cannot yet determine the magnitude of any such one-time cumulative adjustment or of the overall impact of the new standard on our financial condition or results of operations. Any such changes could have a material adverse effect on our business, financial condition and results of operations.
The fair value of our investment securities can fluctuate due to factors outside of our control.
Factors beyond our control can significantly influence the fair value of securities in our portfolio and can cause potential adverse changes to the fair value of these securities. These factors include, but are not limited to, rating agency actions in respect of the securities, defaults by the issuer or with respect to the underlying securities, and changes in market interest rates and instability in the capital markets. Any of these factors, among others, could cause other than temporary impairments ("OTTI"), and realized and/or unrealized losses in future periods and declines in other comprehensive income, which could materially and adversely affect our business, financial condition or results of operations. The process for determining whether impairment of a security is OTTI usually requires complex, subjective judgments about the future financial performance and liquidity of the issuer, any collateral underlying the security and our intent and ability to hold the security for a sufficient period of time to allow for any anticipated recovery in fair value, in order to assess the probability of receiving all contractual principal and interest payments on the security. Our failure to correctly and timely assess any impairments or losses with respect to our securities could have a material adverse effect on our business, financial condition or results of operations.
Many of our loans are priced based on variable interest rates tied to the London Interbank Offered Rate ("LIBOR"). We are subject to risks that LIBOR may no longer be available as a result of the United Kingdom’s Financial Conduct Authority ceasing to require the submission of LIBOR quotes in 2021.
The expected discontinuation of LIBOR quotes in 2021 creates substantial risks to the banking industry, including us. Generally all of our loans provide for an alternative index to be selected by us as a substitute index from among the most widely followed financial indexes should LIBOR become unavailable. However, uncertainty as to the establishment of, as well as the future performance of, an alternative index could adversely affect our asset-liability management and could lead to more asset and liability mismatches and interest rate risk, or may have other consequences which cannot be predicted. The cessation of LIBOR could also cause confusion that could disrupt the capital and credit
22
markets as a result. Additionally, there may be borrower resistance to the establishment of an alternative index, which could result in potential litigation or defaults.
The Federal Reserve has sponsored the Alternative Reference Rates Committee ("ARRC"), which serves as a forum to coordinate and track planning as market participants currently using LIBOR consider (a) transitioning to alternative reference rates where it is deemed appropriate and (b) addressing risks in legacy contracts language given the possibility that LIBOR might stop. On April 3, 2018, the Federal Reserve began publishing three new reference rates, including the Secured Overnight Financing Rate ("SOFR"). ARRC has recommended SOFR as the alternative to LIBOR, and published fallback interest rate consultations for public comment and a Paced Transition Plan to SOFR use. The viability of SOFR as an alternative index is unclear. The Financial Stability Board has taken an interest in LIBOR and possible replacement indices as a matter of risk management. The International Organization of Securities Commissions ("IOSCO"), has been active in this area and is expected to call on market participants to have backup options if a reference rate, such as LIBOR, ceases publication. The International Swap Dealers Association has published guidance on interest rate bench marks and alternatives in July and August 2018. As of December 31, 2019, we had $1.8 billion of loans, $426.2 million of investments, $61.9 million of junior subordinated deferrable interest debentures and $15.9 million of other assets that were indexed to LIBOR and that have stated maturity dates after December 31, 2021. We are currently evaluating replacement indices for our loan portfolio and anticipate substituting these instruments with SOFR or another comparable index. Replacement indices for all other assets and liabilities noted herein will be determined by third parties and, to date, such replacement indices have not been announced. It cannot be predicted whether SOFR or another index or indices will become a market standard that replaces LIBOR, and if so, the effects on our customers, or our future results of operations or financial condition.
We may pursue strategic acquisitions in the future, and we may not be able to overcome risks associated with such transactions.
We may explore opportunities to invest in, or to acquire, other financial institutions and businesses that we believe would complement our existing business. Our investment or acquisition activities could be material to our business and involve a number of risks including the following:
• | investing time and incurring expense associated with identifying and evaluating potential investments or acquisitions and negotiating potential transactions, resulting in our attention being diverted from the operation of our existing business; |
• | the lack of history among our management team in working together on acquisitions and related integration activities; |
• | the time, expense and difficulty of integrating the operations and personnel of the combined businesses; |
• | unexpected asset quality problems with acquired companies; |
• | inaccurate estimates and judgments used to evaluate credit, operations, management and market risks with respect to the target institution or assets; |
• | risks of impairment to goodwill or other than temporary impairment of investment securities; |
• | potential exposure to unknown or contingent liabilities of banks and businesses we acquire; |
• | an inability to realize expected synergies or returns on investment; |
• | potential disruption of our ongoing banking business; and |
• | loss of key employees or key customers following our investment or acquisition. |
We may not be successful in overcoming these risks or other problems encountered in connection with potential investments or acquisitions. Our inability to overcome these risks could have an adverse effect on our ability to implement our business strategy and enhance shareholder value, which, in turn, could have a material adverse effect on our business, financial condition or results of operations. Additionally, if we record goodwill in connection with any acquisition, our financial condition and results of operation may be adversely affected if that goodwill is subsequently determined to be impaired, which would require us to take an impairment charge.
Risks Related to Our Industry
Our industry is highly regulated, and the regulatory framework, together with any future legislative or regulatory changes, may have a materially adverse effect on our operations.
The banking industry is highly regulated and supervised under both federal and state laws and regulations that are intended primarily for the protection of depositors, customers, the public, the banking system as a whole or the FDIC Deposit Insurance Fund, not for the protection of our shareholders and creditors. Compliance with these laws and regulations can be difficult and costly, and changes to laws and regulations can impose additional compliance costs.
23
The Dodd-Frank Wall Street Reform and Consumer Protection Act ("Dodd-Frank Act"), which imposes significant regulatory and compliance changes on financial institutions, is an example of this type of federal regulation. The laws and regulations applicable to us govern a variety of matters, including permissible types, amounts and terms of loans and investments we may make, the maximum interest rate that may be charged, the amount of reserves we must hold against deposits we take, the types of deposits we may accept and the rates we may pay on such deposits, maintenance of adequate capital and liquidity, changes in control of us and our Bank, transactions between us and our Bank, handling of nonpublic information, restrictions on dividends and establishment of new offices. We must obtain approval from our regulators before engaging in certain activities, and there is risk that such approvals may not be granted, either in a timely manner or at all. These requirements may constrain our operations, and the adoption of new laws and changes to or repeal of existing laws may have a further impact on our business, financial condition and results of operations. Also, the burden imposed by those federal and state regulations may place banks in general, including our Bank in particular, at a competitive disadvantage compared to their non-bank competitors. Our failure to comply with any applicable laws or regulations, or regulatory policies and interpretations of such laws and regulations, could result in sanctions by regulatory agencies, civil money penalties or damage to our reputation, all of which could have a material adverse effect on our business, financial condition and results of operations.
Bank holding companies and financial institutions are extensively regulated and currently face an uncertain regulatory environment. Applicable laws, regulations, interpretations, enforcement policies and accounting principles have been subject to significant changes in recent years, and may be subject to significant future changes. Future changes may have a material adverse effect on our business, financial condition and results of operations.
Federal and state regulatory agencies may adopt changes to their regulations or change the manner in which existing regulations are applied. We cannot predict the substance or effect of pending or future legislation or regulation or the application of laws and regulations to us. Compliance with current and potential regulation, as well as regulatory scrutiny, may significantly increase our costs, impede the efficiency of our internal business processes, require us to increase our regulatory capital, and limit our ability to pursue business opportunities in an efficient manner by requiring us to expend significant time, effort and resources to ensure compliance and respond to any regulatory inquiries or investigations.
In addition, regulators may elect to alter standards or the interpretation of the standards used to measure regulatory compliance or to determine the adequacy of liquidity, risk management or other operational practices for financial service companies in a manner that impacts our ability to implement our strategy and could affect us in substantial and unpredictable ways, and could have a material adverse effect on our business, financial condition and results of operations. Furthermore, the regulatory agencies have extremely broad discretion in their interpretation of laws and regulations and their assessment of the quality of our loan portfolio, securities portfolio and other assets. If any regulatory agency's assessment of the quality of our assets, operations, lending practices, investment practices, capital structure or other aspects of our business differs from our assessment, we may be required to take additional charges or undertake, or refrain from taking, actions that could have a material adverse effect on our business, financial condition and results of operations.
Federal and state regulators periodically examine our business and may require us to remediate adverse examination findings or may take enforcement action against us.
We are subject to examination by the Federal Reserve, and our Bank is subject to regulation and supervision by the FDIC and the California Department of Business Oversight Division of Financial Institutions ("DBO"). If, as a result of an examination, these agencies were to determine that our financial condition, capital resources, asset quality, earnings prospects, management, liquidity or other aspects of any of our operations had become unsatisfactory, or that we were in violation of any law or regulation, they may take a number of different remedial actions as they deem appropriate. These actions include the power to enjoin "unsafe or unsound" practices, to require affirmative action to correct any conditions resulting from any violation of law or regulation or unsafe or unsound practice, to issue an administrative order that can be judicially enforced, to direct an increase in our capital, to direct the sale of subsidiaries or other assets, to limit dividends and distributions, to restrict our growth, to assess civil money penalties against us or our officers or directors, to remove officers and directors and, if it is concluded that such conditions cannot be corrected or there is imminent risk of loss to depositors, to terminate our deposit insurance and place our Bank into receivership or conservatorship. Any regulatory enforcement action against us could have a material adverse effect on our business, financial condition and results of operations.
24
We may be required to act as a source of financial and managerial strength for our Bank in times of stress.
Under federal law and long-standing Federal Reserve policy, we, as a bank holding company, are required to act as a source of financial and managerial strength to our Bank and to commit resources to support our Bank if necessary. We may be required to commit additional resources to our Bank at times when we may not be in a financial position to provide such resources or when it may not be in our, or our shareholders' or creditors', best interests to do so. A requirement to provide such support is more likely during times of financial stress for us and our Bank, which may make any capital we are required to raise to provide such support more expensive than it might otherwise be. In addition, any capital loans we make to our Bank are subordinate in right of repayment to deposit and other liabilities of our Bank.
Regulatory initiatives regarding bank capital requirements may require heightened capital.
Regulatory capital rules adopted in July 2013, which implement the Basel III regulatory capital reforms, include a common equity Tier 1 capital requirement and establish criteria that instruments must meet to be considered common equity Tier 1 capital, additional Tier 1 capital or Tier 2 capital. These enhancements were intended to both improve the quality and increase the quantity of capital required to be held by banking organizations, and to better equip the U.S. banking system to deal with adverse economic conditions. The capital rules require bank holding companies and banks to maintain a common equity Tier 1 capital ratio of 4.5%, a minimum total Tier 1 risk based capital ratio of 6%, a minimum total risk based capital ratio of 8%, and a minimum leverage ratio of 4%. Bank holding companies and banks are also required to hold a capital conservation buffer of common equity Tier 1 capital of 2.5% to avoid limitations on capital distributions and discretionary executive compensation payments. The revised capital rules also require banks to maintain a common equity Tier 1 capital ratio of 6.5% or greater, a Tier 1 capital ratio of 8% or greater, a total capital ratio of 10% or greater and a leverage ratio of 5% or greater to be deemed "well-capitalized" for purposes of certain rules and prompt corrective action requirements. The Federal Reserve may also set higher capital requirements for holding companies whose circumstances warrant it. Our regulatory capital ratios currently are in excess of the levels established for "well-capitalized" institutions. Future regulatory change could impose higher capital standards. Failure to maintain capital to meet current or future regulatory requirements could have a significant material adverse effect on our business, financial condition and results of operations.
We face a risk of noncompliance and enforcement action with the Bank Secrecy Act and other anti-money laundering statutes and regulations.
The Bank Secrecy Act of 1970, the Uniting and Strengthening America by Providing Appropriate Tools to Intercept and Obstruct Terrorism Act of 2001 ("Patriot Act"), and other laws and regulations require financial institutions, among other duties, to institute and maintain an effective anti-money laundering program and to file reports such as suspicious activity reports and currency transaction reports. We are required to comply with these and other anti-money laundering requirements. Our federal and state banking regulators, FinCEN, and other government agencies are authorized to impose significant civil money penalties for violations of anti-money laundering requirements. We are also subject to increased scrutiny of compliance with the regulations issued and enforced by the Office of Foreign Assets Control ("OFAC"). If our program is deemed deficient, we could be subject to liability, including fines, civil money penalties and other regulatory actions, which may include restrictions on our business operations and our ability to pay dividends, restrictions on mergers and acquisitions activity, restrictions on expansion, and restrictions on entering new business lines. Failure to maintain and implement adequate programs to combat money laundering and terrorist financing could also have significant reputational consequences for us. Any of these circumstances could have a material adverse effect on our business, financial condition or results of operations.
We are subject to numerous "fair and responsible banking" laws designed to protect consumers, and failure to comply with these laws could lead to a wide variety of sanctions.
The Community Reinvestment Act, the Equal Credit Opportunity Act, the Fair Housing Act and other fair lending laws and regulations, including state laws and regulations, prohibit discriminatory lending practices by financial institutions. The Federal Trade Commission Act and the Dodd-Frank Act prohibit unfair, deceptive, or abusive acts or practices by financial institutions. The DOJ, federal banking agencies, and other federal and state agencies are responsible for enforcing these fair and responsible banking laws and regulations. A challenge to an institution's compliance with fair and responsible banking laws and regulations could result in a wide variety of sanctions, including damages and civil money penalties, injunctive relief, restrictions on mergers and acquisitions activity, restrictions on expansion, and restrictions on entering new business lines. Private parties may also have the ability to challenge an institution's
25
performance under fair lending laws in private class action litigation. Such actions could have a material adverse effect on our reputation, business, financial condition and results of operations.
We are subject to laws regarding the privacy, information security and protection of personal information and any violation of these laws or another incident involving personal, confidential, or proprietary information of individuals could damage our reputation and otherwise adversely affect our business.
Our business requires the collection and retention of large volumes of customer data, including personally identifiable information ("PII"), in various information systems that we maintain and in those maintained by third party service providers. We also maintain important internal company data such as PII about our employees and information relating to our operations. We are subject to complex and evolving laws and regulations governing the privacy and protection of PII of individuals (including customers, employees, and other third parties), including, but not limited to, the Gramm-Leach-Bliley Act ("GLB Act"), and the California Consumer Protection Act ("CCPA") which took effect on January 1, 2020. Ensuring that our collection, use, transfer and storage of PII complies with all applicable laws and regulations can increase our costs. Furthermore, we may not be able to ensure that customers and other third parties have appropriate controls in place to protect the confidentiality of the information that they exchange with us, particularly where such information is transmitted by electronic means. If personal, confidential or proprietary information of customers or others were to be mishandled or misused (in situations where, for example, such information was erroneously provided to parties who are not permitted to have the information, or where such information was intercepted or otherwise compromised by third parties), we could be exposed to litigation or regulatory sanctions under privacy and data protection laws and regulations. Concerns regarding the effectiveness of our measures to safeguard PII, or even the perception that such measures are inadequate, could cause us to lose customers or potential customers and thereby reduce our revenues. Any failure, or perceived failure to comply with applicable privacy or data protection laws and regulations may subject us to inquiries, examinations and investigations that could result in requirements to modify or cease certain operations or practices or in significant liabilities, fines or penalties, and could damage our reputation and otherwise adversely affect our operations, financial condition and results of operations.
Our use of third party vendors and our other ongoing third party business relationships are subject to regulatory requirements and attention.
We regularly use third party vendors in our business and we rely on some of these vendors for critical functions including, but not limited to, our core processing function and mortgage broker relationships. Third party relationships are subject to increasingly demanding regulatory requirements and attention by bank regulators. As a result, if our regulators conclude that we have not exercised adequate oversight and control over our third party vendors or that such vendors have not performed adequately, we could be subject to administrative penalties or fines as well as requirements for consumer remediation, any of which could have a material adverse effect on our business, financial condition and results of operations. Additionally, our use of loan brokers to originate a portion of our multifamily residential loans and substantially all of our single family residential loans, exposes us to risk of loss or liability in the event that such brokers misrepresent the borrower's financial condition or other information included in the loan package, or if the broker engages in violations of law in connection with the loan.
Risks Related to an Investment in Our Common Stock
Our stock price may be volatile, and you could lose part or all of your investment as a result.
Stock price volatility may negatively impact the price at which our common stock may be sold, and may also negatively impact the timing of any sale. Our stock price may fluctuate widely in response to a variety of factors including the risk factors described herein and, among other things:
• | actual or anticipated variations in quarterly operating results, financial condition or credit quality; |
• | changes in business or economic conditions; |
• | recommendations or research reports about us or the financial services industry in general published by securities analysts; |
• | the failure of securities analysts to continue to cover us; |
• | changes in financial estimates or publication of research reports and recommendations by financial analysts or actions taken by rating agencies with respect to us or other financial institutions; |
• | reports in the press or investment community generally or relating to our reputation or the financial services industry, whether or not those reports are based on accurate, complete or transparent data; |
• | news reports relating to trends, concerns and other issues in the financial services industry; |
• | reports related to the impact of natural or man-made disasters in our markets; |
26
• | perceptions in the marketplace regarding us and/or our competitors; |
• | significant acquisitions or business combinations, strategic partnerships, joint ventures or capital commitments by or involving us or our competitors; |
• | additional investments from third parties; |
• | additions or departures of key personnel; |
• | future sales or issuance of additional shares of stock; |
• | actions of one or more investors in selling our common stock short; |
• | fluctuations in the stock price and operating results of our competitors; |
• | changes or proposed changes in laws or regulations, or differing interpretations thereof affecting our business, or enforcement of these laws or regulations; |
• | new technology used, or services offered, by competitors; or, |
• | geopolitical conditions such as acts or threats of terrorism, pandemics or military conflicts. |
The market price of our stock could be negatively affected by sales of substantial amounts of our common stock in the public markets.
Sales of a substantial number of shares of our common stock in the public market, or the perception that large sales could occur, could cause the market price of our common stock to decline or limit our future ability to raise capital through an offering of equity securities.
As of December 31, 2019, there were 55,999,754 shares of our common stock issued and outstanding, including 717,999 shares of restricted stock that had yet to vest. Of our issued and outstanding shares of common stock, all of these shares will be freely transferable, except for any shares held by our "affiliates," as that term is defined in Rule 144 under the Securities Act of 1933, as amended (the "Securities Act"). Trusts established for the benefit of the Chairman of our board of directors, Victor S. Trione, our former director and Secretary, Mark Trione and his wife, and each of the adult children of Messrs. Trione, collectively referred to as the Trione Family Trusts, currently control 71.5% of our common stock. This stock can be resold into the public markets in accordance with the requirements of Rule 144. Sales of substantial amounts of our common stock, or the perception that such sales could occur, may result in a decline in the price of our common stock and may impede our ability to raise capital through the issuance of additional common stock or other equity securities.
Trading in our common stock has been moderate. As a result, shareholders may not be able to quickly and easily sell their common stock, particularly in large quantities.
Although our common stock is listed for trading on NASDAQ and a number of brokers offer to make a market in our common stock on a regular basis, trading volume to date has been moderate, averaging 31,000 shares per trading day from January 2, 2020 through February 28, 2020. There can be no assurance that a more active and liquid market for our common stock will develop or can be maintained. As a result, shareholders may find it difficult to sell a significant number of shares of our common stock at the prevailing market price.
There are substantial regulatory limitations on changes of control of bank holding companies that may discourage investors from purchasing shares of our common stock.
With limited exceptions, federal regulations prohibit a person or company or a group of persons deemed to be "acting in concert" from, directly or indirectly, acquiring more than 10% (5% if the acquirer is a bank holding company) of any class of our voting stock or obtaining the ability to control in any manner the election of a majority of the directors or otherwise direct the management or policies of our company without prior notice or application to, and the approval of, the Federal Reserve. Companies investing in banks and bank holding companies receive additional review and may be required to become bank holding companies, subject to regulatory supervision. Accordingly, prospective investors must be aware of and comply with these requirements, if applicable, in connection with any purchase of shares of our common stock. These provisions could discourage third parties from seeking to acquire significant interests in us or in attempting to acquire control of us, which, in turn, could adversely affect the market price of our common stock.
27
We may not pay dividends on our common stock in the future.
Holders of our common stock are entitled to receive only such dividends as our board of directors may declare out of funds legally available for such payments. Our board of directors may, in its sole discretion, change the amount or frequency of dividends or discontinue the payment of dividends entirely. In addition, we are a bank holding company, and our ability to declare and pay dividends is dependent on federal regulatory considerations, including the guidelines of the Federal Reserve regarding capital adequacy and dividends. It is the policy of the Federal Reserve that bank holding companies should generally pay dividends on common stock only out of earnings, and only if prospective earnings retention is consistent with the organization's expected future needs, asset quality and financial condition.
We are controlled by trusts established for the benefit of members of the Trione family, whose interests in our business may be different from yours.
As of December 31, 2019, the Trione Family Trusts control 71.5% of our common stock and if they vote in the same manner, are able to determine the outcome of all matters put to a shareholder vote, including the election of directors, the approval of mergers, material acquisitions and dispositions and other extraordinary transactions, and amendments to our articles of incorporation, bylaws and other corporate governance documents. So long as the Trione Family Trusts continue to own a majority of our common stock, they will have the ability, if they vote in the same manner, to prevent any transaction that requires shareholder approval regardless of whether others believe the transaction is in our best interests. In any of these matters, the interests of the Trione Family Trusts may differ from or conflict with the interests of our other shareholders. Moreover, this concentration of stock ownership may also adversely affect the trading price of our common stock, if investors perceive disadvantages in owning stock of a company with a controlling group.
We are a "controlled company" within the meaning of the rules of NASDAQ and, as a result, qualify for, and may rely on, exemptions from certain corporate governance requirements. As a result, you will not have the same protections afforded to shareholders of companies that are subject to such requirements.
We are a "controlled company" within the meaning of the corporate governance standards of NASDAQ. Under these rules, a company of which more than 50% of the voting power is held by an individual, group or another company is a "controlled company" and may elect not to comply with certain corporate governance requirements, including the requirements that a majority of the board of directors consist of independent directors and to have board-level compensation and nominating and corporate governance committees consisting entirely of independent directors.
We do not intend to rely on these exemptions, but we may, in the future, take advantage of some of these exemptions for as long as we continue to qualify as a "controlled company." Accordingly, our shareholders may not have the same protections afforded to shareholders of companies that are subject to all of the corporate governance requirements of NASDAQ.
We may issue additional equity securities, or engage in other transactions, which could affect the priority of our common stock, which may adversely affect the market price of our common stock.
Our board of directors may determine from time to time that we need to raise additional capital by issuing additional shares of our common stock or other securities. We are not restricted from issuing additional shares of common stock, including securities that are convertible into or exchangeable for, or that represent the right to receive, common stock. Because our decision to issue securities in any future offering will depend on market conditions and other factors beyond our control, we cannot predict or estimate the amount, timing or nature of any future offerings, or the prices at which such offerings may be effected. Such offerings could be dilutive to common shareholders. We may also issue shares of preferred stock that will provide new investors with rights, preferences and privileges that are senior to, and that adversely affect, our then current common shareholders. Additionally, if we raise additional capital by making additional offerings of debt or preferred equity securities, upon liquidation, holders of our debt securities and shares of preferred stock, and lenders with respect to other borrowings, will receive distributions of our available assets prior to the holders of our common stock. Additional equity offerings may dilute the holdings of our existing shareholders or reduce the market price of our common stock, or both. Holders of our common stock are not entitled to preemptive rights or other protections against dilution.
28
Future equity issuances could result in dilution, which could cause our common stock price to decline and future sales of our common stock could depress the market price of our common stock.
Our charter permits us to issue up to an aggregate of 100 million shares of common stock. As of December 31, 2019, 55,999,754 shares of our common stock were issued and outstanding. An additional 2,332,775 shares have been reserved for future issuance pursuant to the Luther Burbank Corporation Omnibus Equity and Incentive Compensation Plan. Our charter permits us to issue up to an aggregate of 5 million shares of preferred stock. A future issuance of any new shares of our common stock would, and equity-related securities could, cause further dilution in the value of our outstanding shares of common stock.
Our corporate governance documents, and corporate and banking laws applicable to us, could make a takeover more difficult and adversely affect the market price of our common stock.
Certain provisions of our articles of incorporation and bylaws, and corporate and federal banking laws, could delay, defer, or prevent a third party from acquiring control of our organization or conducting a proxy contest, even if those events were perceived by many of our shareholders as beneficial to their interests. These provisions and regulations applicable to us:
• | enable our board of directors to issue additional shares of authorized, but unissued capital stock; |
• | enable our board of directors to issue "blank check" preferred stock with such designations, rights and preferences as may be determined from time to time by the board; |
• | do not provide for cumulative voting rights; |
• | enable our board of directors to amend our bylaws without stockholder approval; |
• | limit the right of shareholders to call a special meeting; |
• | require advance notice for director nominations and other stockholder proposals; and |
• | require prior regulatory application and approval of any transaction involving control of our organization. |
These provisions may discourage potential acquisition proposals and could delay or prevent a change in control, including under circumstances in which our shareholders might otherwise receive a premium over the market price of our shares. In addition, as of the date hereof, the Trione Family Trusts will own shares sufficient for the majority vote over all matters requiring a stockholder vote, which may delay, deter or prevent acts that would be favored by our other shareholders.
Item 1B. Unresolved Staff Comments
None.
Item 2. Properties
Our corporate headquarters is located at 520 Third Street, Santa Rosa, California. In addition to our corporate headquarters, the Bank operates ten full service branches in California located in Sonoma, Marin, Santa Clara, and Los Angeles Counties and one full service branch in Washington located in King County. This includes a California full service branch that opened in January 2020. We also operate seven loan production offices located throughout California, as well as a loan production office in Clackamas County, Oregon. Other than our main branch in Santa Rosa, California, which we own, we lease all of our other offices. For additional information regarding properties of the Company see Note 6. "Premises and Equipment" in the Notes to the Consolidated Financial Statements in Item 8. "Financial Statements and Supplementary Data".
Item 3. Legal Proceedings
From time to time, we are party to legal actions that are routine and incidental to our business. Given the nature, scope and complexity of the extensive legal and regulatory landscape applicable to our business, we, like all banking organizations, are subject to heightened regulatory compliance and legal risk. However, based on available information, management does not expect the ultimate disposition of any or a combination of these actions to have a material adverse effect on our business, financial condition and results of operations.
Item 4. Mine Safety Disclosures
Not applicable.
29
PART II.
Item 5. Market for the Registrant's Common Equity, Related Stockholder Matters and Issuer Purchases of Equity Securities
Market Information and Holders of Record
Our common stock is listed on the NASDAQ Global Select Stock Market under the trading symbol "LBC". As of March 2, 2020, we had approximately 2,441 record holders. On March 2, 2020 our stock closed at $10.70.
Stock Performance Graph
The performance graph and table below compares the cumulative total stockholder return on the common stock of the Company with the cumulative total return on the equity securities included in (i) the Russell 2000 Index, which measures the performance of the smallest 2,000 members by market cap of the Russell Index and (ii) the SNL U.S. Bank and Thrift Index, which reflects the performance of U.S. companies that do business as regional banks or thrifts.
The graph assumes an initial $100 investment on December 8, 2017, the date that the stock of the Company began trading on the NASDAQ Global Select Stock Market through December 31, 2019, the final trading day of 2019. Data for the Russell 2000 and the SNL U.S. Bank and Thrift Index assume reinvestment of dividends. Returns are shown on a total return basis. The performance graph represents past performance and should not be considered to be an indication of future performance. This graph is not deemed filed with the SEC.
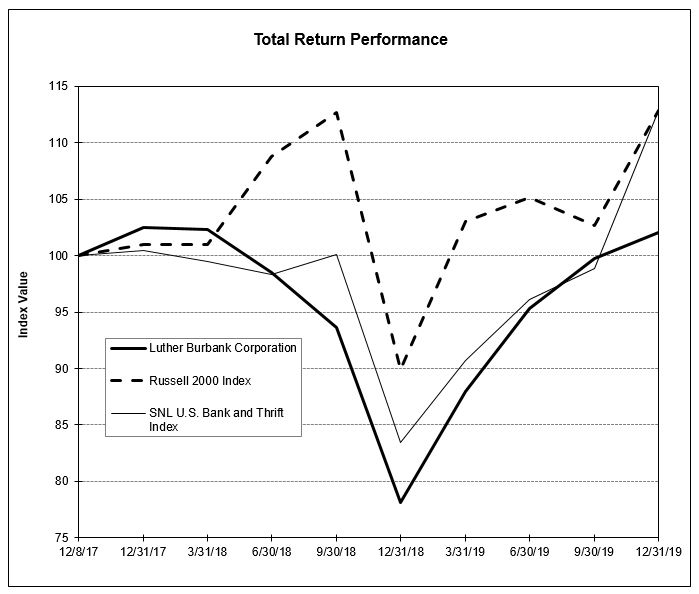
30
Period Ended | ||||||||||||||||||||
Index | 12/8/17 | 12/31/17 | 3/31/18 | 6/30/18 | 9/30/18 | 12/31/18 | 3/31/19 | 6/30/19 | 9/30/19 | 12/31/19 | ||||||||||
Luther Burbank Corporation | 100.00 | 102.47 | 102.33 | 98.48 | 93.63 | 78.09 | 87.95 | 95.36 | 99.76 | 102.03 | ||||||||||
Russell 2000 Index | 100.00 | 101.03 | 100.95 | 108.78 | 112.67 | 89.91 | 103.02 | 105.18 | 102.65 | 112.85 | ||||||||||
SNL U.S. Bank and Thrift Index | 100.00 | 100.50 | 99.52 | 98.30 | 100.08 | 83.49 | 90.69 | 96.13 | 98.84 | 112.83 | ||||||||||
Source: S&P Global Market Intelligence | ||||||||||||||||||||
Dividend Policy
Prior to our initial public offering in December 2017, we were an S-Corporation for U.S. federal income tax purposes. As an S-Corporation, we historically made distributions to our shareholders to provide them with funds to pay U.S. federal income tax on their taxable income that was “passed through” to them, as well as additional amounts for returns on capital. Following our initial public offering, our board of directors declared a cash dividend to our shareholders that existed prior to the offering in the amount of $40.0 million, which was intended to be non-taxable to them and represented a significant portion of our S-Corporation earnings that had been, or would be, taxed to our shareholders, but not distributed to them. The Company also declared cash dividends to our shareholders that existed prior to the offering in the amount of $7.1 million on December 1, 2017 and $5.2 million on March 21, 2018 to fund the payment of 2017 taxes that were ‘‘passed through’’ to them by virtue of our status as an S-Corporation. Purchasers of our common stock in the initial public offering were not entitled to receive any portion of these distributions.
Following our initial public offering and our conversion to a C-Corporation, our dividend policy and practice changed. We no longer pay distributions to our shareholders to pay U.S. federal income taxes on their pro rata portion of our taxable income.
Holders of our common stock are only entitled to receive dividends when, and if, declared by our board of directors out of funds legally available for dividends.
Any future determination relating to our dividend policy will be made by our board of directors and will depend on a number of factors, including general and economic conditions, industry standards, our financial condition and operating results, our available cash and current and anticipated cash needs, capital requirements, our ability to service debt obligations senior to our common stock, banking regulations, contractual, legal, tax and regulatory restrictions, and limitations on the payment of dividends by us to our shareholders or by the Bank to us, and such other factors as our board of directors may deem relevant.
Because we are a bank holding company and do not engage directly in business activities of a material nature, our ability to pay any dividends on our common stock depends, in large part, upon our receipt of dividends from our Bank, which is also subject to numerous limitations on the payment of dividends under federal and state banking laws, regulations and policies.
Subject to the discretion of our board of directors, commencing in the second quarter of 2018, the Company established a regular quarterly cash dividend on our common stock of $0.0575 per share. Although we currently intend to pay dividends according to our dividend policy, there can be no assurance that we will pay any dividend to holders of our stock, or as to the amount of any such dividends. Our board of directors, in its sole discretion, can change the amount or frequency of this dividend or discontinue the payment of dividends entirely at any time.
The following table shows the dividends that have been declared on our common stock with respect to the periods indicated below. The per share amounts are presented to the nearest cent.
31
(dollars in thousands except per share data) | Amount per share | Total cash dividend | |||||
Quarter ended March 31, 2018 | $ | 0.11 | $ | 6,061 | |||
Quarter ended June 30, 2018 | 0.06 | 3,303 | |||||
Quarter ended September 30, 2018 | 0.06 | 3,300 | |||||
Quarter ended December 31, 2018 | 0.06 | 3,301 | |||||
Quarter ended March 31, 2019 | 0.06 | 3,294 | |||||
Quarter ended June 30, 2019 | 0.06 | 3,267 | |||||
Quarter ended September 30, 2019 | 0.06 | 3,234 | |||||
Quarter ended December 31, 2019 | 0.06 | 3,237 | |||||
Dividend Limitations. California law places limits on the amount of dividends the Bank may pay to the Company without prior approval. Prior regulatory approval is required to pay dividends which exceed the lesser of the Bank’s retained earnings or the Bank’s retained net income for the prior three fiscal years. State and federal bank regulatory agencies also have authority to prohibit a bank from paying dividends if such payment is deemed to be an unsafe or unsound practice, and the Federal Reserve has the same authority over bank holding companies. We would not be able to pay a dividend in excess of our retained earnings, or where our liabilities would exceed our assets.
The Federal Reserve has established requirements with respect to the maintenance of appropriate levels of capital by registered bank holding companies. Compliance with such standards, as presently in effect, or as they may be amended from time to time, could possibly limit the amount of dividends that we may pay in the future. The Federal Reserve has issued guidance on the payment of cash dividends by bank holding companies. In the statement, the Federal Reserve expressed its view that a holding company experiencing earnings weaknesses should not pay cash dividends exceeding its net income, or which could only be funded in ways that weaken the holding company’s financial health, such as by borrowing. Under Federal Reserve guidance, as a general matter, the board of directors of a holding company should inform the Federal Reserve and should eliminate, defer, or significantly reduce the dividends if: (i) the holding company’s net income available to shareholders for the past four quarters, net of dividends previously paid during that period, is not sufficient to fully fund the dividends; (ii) the holding company’s prospective rate of earnings retention is not consistent with its capital needs and overall current and prospective financial condition; or (iii) the holding company will not meet, or is in danger of not meeting, its minimum regulatory capital adequacy ratios. As a depository institution, the deposits of which are insured by the FDIC, the Bank may not pay dividends or distribute any of its capital assets while it remains in default on any assessment due the FDIC. The Bank currently is not in default under any of its obligations to the FDIC.
Purchases of Equity Securities
The table below summarizes the Company's monthly repurchases of equity securities during the quarter ended December 31, 2019 (dollars in thousands, except per share data):
Period | Total Number of Shares Purchased | Average Price Paid Per Share | Total Number of Shares Purchased as Part of Publicly Announced Plans or Programs (1) | Approximate Dollar Value of Shares that May Yet be Purchased Under the Plans or Program (1) | ||||||||||
October 1-31, 2019 | — | $ | — | — | $ | 4,714 | ||||||||
November 1-30, 2019 | — | — | — | 4,714 | ||||||||||
December 1-31, 2019 | — | — | — | 4,714 | ||||||||||
Total | — | $ | — | — | $ | 4,714 | ||||||||
(1) In August 2018, the Company's Board of Directors authorized the purchase of up to $15.0 million of the Company's common stock from August 17, 2018 through December 31, 2019 (the "Repurchase Program"), which was announced by press release and Current Report on Form 8-K on August 16, 2018 and August 17, 2018, respectively. Under the Repurchase Program, the Company may acquire its common stock in the open market or in privately negotiated transactions, including 10b5-1 plans. The Repurchase Program may be modified, suspended or terminated by the Board of Directors at any time without notice. In December 2018, the Company adopted a systematic stock repurchase plan in accordance with, and as part of, the Repurchase Program. The plan was effective from December 17, 2018
32
until two days following the Company's release of its 2018 year-end financial results and was announced by press release and Current Report on Form 8-K on December 14, 2018. In January 2019, the Company adopted a systematic stock repurchase plan in accordance with, and as part of, the Repurchase Program. The plan was effective from January 31, 2019 until December 31, 2019 and was announced by Current Report on Form 8-K on February 1, 2019. These plans were adopted under the guidelines specified by Rule 10b5-1 and under Rule 10b-18 under the Securities Exchange Act of 1934, as amended, and the Company's Insider Trading Policy. On October 23, 2019, the plan was extended from December 31, 2019 to December 31, 2020 and was announced by Current Report on Form 8-K on October 23, 2019.
Shares Eligible for Sale Pursuant to Rule 144
An aggregate of 40 million shares of common stock held by the Trione Family Trusts, which were issued in private transactions, are eligible for sale in accordance with Rule 144 under the Securities Act.
33
Item 6. Selected Financial Data
The following table sets forth the Company’s selected historical consolidated financial data for the years and as of the dates indicated. You should read this information together with Item 7. “Management’s Discussion and Analysis of Financial Condition and Results of Operations” and the Company’s audited consolidated financial statements and the related notes included elsewhere in this Annual Report on Form 10-K. The selected historical consolidated financial data as of and for the years ended December 31, 2019 and 2018 are derived from our audited consolidated financial statements, which are included elsewhere in this Annual Report on Form 10-K. The selected historical consolidated financial data as of and for the years ended December 31, 2017, 2016 and 2015 (except as otherwise noted below) are derived from our audited consolidated financial statements not included in this Annual Report on Form 10-K. The Company’s historical results for any prior period are not necessarily indicative of future performance.
(Dollars in thousands, except per share data) | As of or For the Years Ended December 31, | |||||||||||||||||||
2019 | 2018 | 2017 | 2016 | 2015 | ||||||||||||||||
Statements of Income and Financial Condition Data | ||||||||||||||||||||
Net income | $ | 48,861 | $ | 45,060 | $ | 69,384 | $ | 52,121 | $ | 35,392 | ||||||||||
Pre-tax, pre-provision net earnings (1) | $ | 70,714 | $ | 66,531 | $ | 61,859 | $ | 41,237 | $ | 29,498 | ||||||||||
Total assets | $ | 7,045,828 | $ | 6,937,212 | $ | 5,704,380 | $ | 5,063,585 | $ | 4,361,779 | ||||||||||
Per Common Share (2) | ||||||||||||||||||||
Diluted earnings per share | $ | 0.87 | $ | 0.79 | $ | 1.62 | $ | 1.24 | $ | 0.84 | ||||||||||
Book value per share | $ | 10.97 | $ | 10.31 | $ | 9.74 | $ | 9.63 | $ | 8.84 | ||||||||||
Tangible book value per share (1) | $ | 10.91 | $ | 10.25 | $ | 9.68 | $ | 9.55 | $ | 8.76 | ||||||||||
Actual/Pro Forma Net Income and Per Common Share Data (1) | ||||||||||||||||||||
Actual/pro forma net income | $ | 48,861 | $ | 45,060 | $ | 37,834 | $ | 31,285 | $ | 21,251 | ||||||||||
Actual/pro forma diluted earnings per share (2) | $ | 0.87 | $ | 0.79 | $ | 0.88 | $ | 0.74 | $ | 0.51 | ||||||||||
Selected Ratios | ||||||||||||||||||||
Return on average: | ||||||||||||||||||||
Assets | 0.69 | % | 0.70 | % | 1.26 | % | 1.11 | % | 0.88 | % | ||||||||||
Stockholders' equity | 8.15 | % | 7.96 | % | 16.30 | % | 13.35 | % | 9.85 | % | ||||||||||
Dividend payout ratio | 26.67 | % | 35.43 | % | 97.72 | % | 32.23 | % | 33.34 | % | ||||||||||
Net interest margin | 1.84 | % | 1.98 | % | 2.05 | % | 2.04 | % | 2.11 | % | ||||||||||
Efficiency ratio (1) | 46.86 | % | 48.51 | % | 47.76 | % | 59.76 | % | 67.88 | % | ||||||||||
Noninterest expense to average assets | 0.88 | % | 0.98 | % | 1.03 | % | 1.31 | % | 1.54 | % | ||||||||||
Loan to deposit ratio | 119.03 | % | 122.59 | % | 127.59 | % | 133.17 | % | 123.52 | % | ||||||||||
Actual/Pro Forma Selected Ratios (1) | ||||||||||||||||||||
Actual/pro forma return on average assets | 0.69 | % | 0.70 | % | 0.69 | % | 0.67 | % | 0.53 | % | ||||||||||
Actual/pro forma return on average stockholders' equity | 8.15 | % | 7.96 | % | 8.89 | % | 8.02 | % | 5.91 | % | ||||||||||
Credit Quality Ratios | ||||||||||||||||||||
Allowance for loan losses to loans | 0.58 | % | 0.56 | % | 0.60 | % | 0.75 | % | 1.18 | % | ||||||||||
Allowance for loan losses to nonperforming loans | 568.47 | % | 1,705.47 | % | 437.91 | % | 1,251.80 | % | 708.75 | % | ||||||||||
Nonperforming assets to total assets | 0.09 | % | 0.03 | % | 0.12 | % | 0.05 | % | 0.15 | % | ||||||||||
Net recoveries to average loans | 0.01 | % | 0.01 | % | 0.01 | % | 0.01 | % | 0.00 | % | ||||||||||
Capital Ratios | ||||||||||||||||||||
Tier 1 leverage ratio | 9.47 | % | 9.42 | % | 11.26 | % | 9.47 | % | 10.22 | % | ||||||||||
Total risk-based capital ratio | 17.97 | % | 17.20 | % | 18.78 | % | 18.58 | % | 20.26 | % | ||||||||||
(1) Considered a non-GAAP financial measure. See Item 7. Management's Discussion and Analysis of Financial Condition and Results of Operations - ‘‘Non-GAAP Financial Measures’’ for a reconciliation of our non-GAAP measures to the most directly comparable GAAP financial measure. Tangible book value is defined as total assets less goodwill and total liabilities. Efficiency ratio is defined as the ratio of noninterest expense to net interest income plus noninterest income. Pre-tax, pre-provision net earnings is defined as net income before taxes and provision for loan losses. For periods prior to January 1, 2018, we calculate our pro forma net income, return on average assets and return on average stockholders' equity by adding back our franchise S-Corporation tax to net income, and using a combined C-Corporation effective tax rate for federal and California income taxes of 42.0%. This calculation reflects only the change in our status as an S-Corporation and does not give effect to any other transaction. Beginning January 1, 2018, our pro forma provision for tax expense is our actual C-Corporation provision. | ||||||||||||||||||||
(2) Earnings per common share, basic and diluted, book value per common share and actual/pro forma diluted earnings per share have been adjusted retroactively to reflect a 200-for-1 stock split effective April 27, 2017. | ||||||||||||||||||||
34
Item 7. Management's Discussion and Analysis of Financial Condition and Results of Operations
The following discussion and analysis is based on and should be read in conjunction with Item 6. "Selected Financial Data" and our consolidated financial statements and the accompanying notes thereto contained elsewhere in this Annual Report on Form 10-K. However, because we conduct all of our material business operations through our bank subsidiary, Luther Burbank Savings, the discussion and analysis relates to activities primarily conducted by the Bank.
The following discussion and analysis is intended to facilitate the understanding and assessment of significant changes and trends in our business that accounted for the changes in our results of operations for the year ended December 31, 2019, as compared to our results of operations for the year ended December 31, 2018, and our financial condition at December 31, 2019 as compared to our financial condition at December 31, 2018.
In addition to historical information, this discussion and analysis contains forward-looking statements that are subject to certain risks and uncertainties and are based on certain assumptions that we believe are reasonable but may prove to be inaccurate. Certain risks, uncertainties and other factors, including those set forth in the “Cautionary Note Regarding Forward-Looking Statements” and “Risk Factors” sections of this Annual Report, may cause actual results to differ materially from those projected results discussed in the forward-looking statements appearing in this discussion and analysis. Please read these sections carefully. We assume no obligation to update any of these forward-looking statements.
Overview
We are a bank holding company headquartered in Santa Rosa, California, and the parent company of Luther Burbank Savings, a California-chartered commercial bank headquartered in Gardena, California with $7.0 billion in assets at December 31, 2019. Our principal business is providing high-value, relationship-based banking products and services to our customers, which include real estate investors, professionals, entrepreneurs, depositors and commercial businesses. We generate most of our revenue from interest on loans and investments. Our primary source of funding for our loans is retail deposits and we place secondary reliance on wholesale funding, primarily borrowings from the FHLB and brokered deposits. Our largest expenses are interest on deposits and borrowings along with salaries and related employee benefits. Our principal lending products are real estate secured loans, consisting primarily of multifamily residential properties and jumbo single family residential properties on the West Coast.
Critical Accounting Policies and Estimates
Our consolidated financial statements are prepared in accordance with accounting principles generally accepted in the United States and with general practices within the financial services industry. Application of these principles requires management to make complex and subjective estimates and assumptions that affect the amounts reported in the financial statements and accompanying notes. We base our estimates on historical experience and on various other assumptions that we believe to be reasonable under current circumstances. These assumptions form the basis for our judgments about the carrying values of assets and liabilities that are not readily available from independent, objective sources. We evaluate our estimates on an ongoing basis. Use of alternative assumptions may have resulted in significantly different estimates. Actual results may differ from these estimates.
Our most significant accounting policies are described in Note 1 to our Financial Statements for the year ended December 31, 2019. We have identified the following accounting policies and estimates that, due to the difficult, subjective or complex judgments and assumptions inherent in those policies and estimates and the potential sensitivity of our financial statements to those judgments and assumptions, are critical to an understanding of our financial condition and results of operations. We believe that the judgments, estimates and assumptions used in the preparation of our financial statements are reasonable and appropriate.
Pursuant to the JOBS Act, as an emerging growth company, we can elect to opt out of the extended transition period for adopting any new or revised accounting standards. We have elected not to opt out of such extended transition period, which means that when a standard is issued or revised and it has different application dates for public or private companies, we may adopt the standard for the private company.
We have elected to take advantage of the scaled disclosures and other relief under the JOBS Act, and we may take advantage of some or all of the reduced regulatory and reporting requirements that will be available to us under the JOBS Act, so long as we qualify as an emerging growth company.
35
Allowance for Loan Losses
The allowance for loan losses is provided for probable incurred credit losses inherent in the loan portfolio at the statement of financial condition date. The allowance is increased by a provision charged to expense and reduced by loan principal charge-offs, net of recoveries. Where management determines that the allowance for loan losses is more than adequate to absorb the probable incurred credit losses in the portfolio, the allowance is reduced by recapturing provisions and a credit is made to the expense account. The allowance is based on management’s assessment of various factors including, but not limited to, the nature of the loan portfolio, previous loss experience, known and inherent risks in the portfolio, the estimated value of underlying collateral, information that may affect a borrower’s ability to repay, current economic conditions and the results of our ongoing reviews of the portfolio. In addition, various regulatory agencies, as an integral part of their examination process, periodically review the Bank’s allowance. Such agencies may require the Bank to recognize additions to the allowance based on judgments different from those of management.
While we use available information, including independent appraisals for collateral, to estimate the extent of probable incurred loan losses within the loan portfolio, inherent uncertainties in the estimation process make it reasonably possible that ultimate losses may vary significantly from our original estimates. Generally, loans are partially or fully charged off when it is determined that the unpaid principal balance exceeds the current fair value of the collateral with no other likely source of repayment.
Fair Value Measurement
We use estimates of fair value in applying various accounting standards for our consolidated financial statements. Fair value is defined as the exit price at which an asset may be sold or a liability may be transferred in an orderly transaction between willing and able market participants. When available, fair value is measured by looking at observable market prices for identical assets and liabilities in an active market. When these are not available, other inputs are used to model fair value such as prices of similar instruments, yield curves, prepayment speeds and credit spreads. Depending on the availability of observable inputs and prices, different valuation models could produce materially different fair value estimates. The values presented may not represent future fair values and may not be realizable.
Changes in the fair value of debt securities available for sale and derivatives designated as effective cash flow hedges are recorded in our consolidated statements of financial condition and comprehensive income (loss) while changes in the fair value of equity securities, loans held for sale or other derivatives are recorded in the consolidated statements of financial condition and in the consolidated statements of income.
Investment Securities Impairment
We assess, on a quarterly basis, whether there have been any events or economic circumstances to indicate that a security in which we have an unrealized loss is impaired on an other than temporary basis. In any instance, we would consider many factors, including the severity and duration of the impairment, the portion of any unrealized loss attributable to a decline in the credit quality of an issuer, our intent and ability to hold the security for a period of time sufficient for a recovery in value, recent events specific to the issuer or industry, and, for debt securities, external credit ratings and recent downgrades. Securities with respect to which there is an unrealized loss that is deemed to be other than temporary are written down to fair value.
Non-GAAP Financial Measures
Some of the financial measures discussed in Item 6. Selected Financial Data are ‘‘non-GAAP financial measures.’’ In accordance with SEC rules, we classify a financial measure as being a non-GAAP financial measure if that financial measure excludes or includes amounts, or is subject to adjustments that have the effect of excluding or including amounts, that are included or excluded, as the case may be, in the most directly comparable measure calculated and presented in accordance with GAAP as in effect from time to time in the United States in our consolidated statements financial condition, income or cash flows.
Pre-tax, pre-provision net earnings is defined as net income before taxes and provision for (reversal of) loan losses. We believe the most directly comparable GAAP financial measure is income before taxes. Disclosure of this measure enables you to compare our operations to those of other banking companies before consideration of taxes and provision
36
expense, which some investors may consider to be a more appropriate comparison given our S-Corporation status in prior years and recaptures from the allowance for loan losses. Prior to January 1, 2018, we calculate our pro forma net income, return on average assets, return on average equity and per share amounts by adding back our franchise S-Corporation tax to net income, and using a combined C-Corporation effective tax rate for federal and California income taxes of 42.0%. This calculation reflects only the change in our status as an S-Corporation and does not give effect to any other transaction. Beginning January 1, 2018, our pro forma income tax expense is our actual C-Corporation tax provision. Tangible book value is defined as total assets less goodwill and total liabilities. Efficiency ratio is defined as noninterest expenses divided by operating revenue, which is equal to net interest income plus noninterest income. We believe that these non-GAAP financial measures provide useful information to management and investors that is supplementary to our consolidated statements of financial condition, income and cash flows computed in accordance with GAAP. However, we acknowledge that our non-GAAP financial measures have a number of limitations. As such, you should not view these disclosures as a substitute for results determined in accordance with GAAP, and they are not necessarily comparable to non-GAAP financial measures that other banking companies use. Other banking companies may use names similar to those we use for the non-GAAP financial measures we disclose, but may calculate them differently. You should understand how we and other companies each calculate their non-GAAP financial measures when making comparisons.
37
The following reconciliation table provides a more detailed analysis of these non-GAAP financial measures:
(Dollars in thousands except per share data) | As of or For the Years Ended December 31, | |||||||||||||||||||
2019 | 2018 | 2017 | 2016 | 2015 | ||||||||||||||||
Pre-tax, Pre-provision Net Earnings | ||||||||||||||||||||
Income before provision for income taxes | $ | 69,464 | $ | 62,931 | $ | 65,231 | $ | 53,940 | $ | 36,639 | ||||||||||
Plus: Provision for (reversal of) loan losses | 1,250 | 3,600 | (3,372 | ) | (12,703 | ) | (7,141 | ) | ||||||||||||
Pre-tax, pre-provision net earnings | $ | 70,714 | $ | 66,531 | $ | 61,859 | $ | 41,237 | $ | 29,498 | ||||||||||
Efficiency Ratio | ||||||||||||||||||||
Noninterest expense (numerator) | $ | 62,368 | $ | 62,687 | $ | 56,544 | $ | 61,242 | $ | 62,339 | ||||||||||
Net interest income | 128,407 | 125,087 | 110,895 | 94,594 | 84,879 | |||||||||||||||
Noninterest income | 4,675 | 4,131 | 7,508 | 7,885 | 6,958 | |||||||||||||||
Operating revenue (denominator) | $ | 133,082 | $ | 129,218 | $ | 118,403 | $ | 102,479 | $ | 91,837 | ||||||||||
Efficiency ratio | 46.86 | % | 48.51 | % | 47.76 | % | 59.76 | % | 67.88 | % | ||||||||||
Actual/Pro Forma Net Income | ||||||||||||||||||||
Income before provision for income taxes | $ | 69,464 | $ | 62,931 | $ | 65,231 | $ | 53,940 | $ | 36,639 | ||||||||||
Actual/pro forma provision for income taxes | 20,603 | 17,871 | 27,397 | 22,655 | 15,388 | |||||||||||||||
Actual/pro forma net income (numerator) | $ | 48,861 | $ | 45,060 | $ | 37,834 | $ | 31,285 | $ | 21,251 | ||||||||||
Actual/Pro Forma Diluted Earnings Per Share | ||||||||||||||||||||
Weighted average common shares outstanding - diluted (denominator) (1) | 56,219,892 | 56,825,402 | 42,957,936 | 42,000,000 | 42,000,000 | |||||||||||||||
Actual/pro forma diluted earnings per share | $ | 0.87 | $ | 0.79 | $ | 0.88 | $ | 0.74 | $ | 0.51 | ||||||||||
Actual/Pro Forma Return on Average Assets | ||||||||||||||||||||
Actual/pro forma net income (numerator) | $ | 48,861 | $ | 45,060 | $ | 37,834 | $ | 31,285 | $ | 21,251 | ||||||||||
Average assets (denominator) | $ | 7,066,547 | $ | 6,405,931 | $ | 5,485,832 | $ | 4,676,676 | $ | 4,040,381 | ||||||||||
Actual/pro forma return on average assets | 0.69 | % | 0.70 | % | 0.69 | % | 0.67 | % | 0.53 | % | ||||||||||
Actual/Pro Forma Return on Average Stockholders' Equity | ||||||||||||||||||||
Actual/pro forma net income (numerator) | $ | 48,861 | $ | 45,060 | $ | 37,834 | $ | 31,285 | $ | 21,251 | ||||||||||
Average stockholders' equity (denominator) | $ | 599,574 | $ | 566,275 | $ | 425,698 | $ | 390,318 | $ | 359,359 | ||||||||||
Actual/pro forma return on average stockholders' equity | 8.15 | % | 7.96 | % | 8.89 | % | 8.02 | % | 5.91 | % | ||||||||||
Tangible Book Value Per Share | ||||||||||||||||||||
Total assets | $ | 7,045,828 | $ | 6,937,212 | $ | 5,704,380 | $ | 5,063,585 | $ | 4,361,779 | ||||||||||
Less: Goodwill | (3,297 | ) | (3,297 | ) | (3,297 | ) | (3,297 | ) | (3,297 | ) | ||||||||||
Tangible assets | 7,042,531 | 6,933,915 | 5,701,083 | 5,060,288 | 4,358,482 | |||||||||||||||
Less: Total liabilities | (6,431,364 | ) | (6,356,067 | ) | (5,154,635 | ) | (4,659,210 | ) | (3,990,480 | ) | ||||||||||
Tangible stockholders' equity (numerator) | $ | 611,167 | $ | 577,848 | $ | 546,448 | $ | 401,078 | $ | 368,002 | ||||||||||
Period end shares outstanding (denominator) | 55,999,754 | 56,379,066 | 56,422,662 | 42,000,000 | 42,000,000 | |||||||||||||||
Tangible book value per share | $ | 10.91 | $ | 10.25 | $ | 9.68 | $ | 9.55 | $ | 8.76 | ||||||||||
(1) Weighted average common shares outstanding - diluted has been adjusted retroactively to reflect a 200-for-1 stock split effective April 27, 2017. | ||||||||||||||||||||
Key Factors Affecting Our Business
Interest Rates
Net interest income is the largest contributor to our net income and is the difference between the interest and fees earned on interest-earning assets and the interest expense incurred in connection with interest-bearing liabilities. Net interest income is primarily a function of the average balances and yields of these interest-earning assets and interest-
38
bearing liabilities. These factors are influenced by internal considerations such as product mix and risk appetite, as well as external influences such as economic conditions, competition for loans and deposits and market interest rates.
The cost of our deposits and short-term wholesale borrowings is primarily based on short-term interest rates, which are largely driven by the Federal Reserve’s actions and market competition. The yields generated by our loans and securities are typically affected by short-term and long-term interest rates, which are driven by market competition and market rates often impacted by the Federal Reserve’s actions. The level of net interest income is influenced by movements in such interest rates and the pace at which such movements occur.
Based on our liability sensitivity as discussed in Item 7A. ‘‘Quantitative and Qualitative Disclosures About Market Risk’’, significant increases in interest rates and/or a flatter yield curve could have an adverse impact on our net interest income. Conversely, significant decreases in interest rates, particularly at the short end, and/or a steepened yield curve would be expected to benefit our net interest income.
Operating Efficiency
We have invested significantly in our infrastructure, including our management, lending teams, technology systems and risk management practices. As a result, our ratio of noninterest expenses to average assets has improved during the past several years. As we have begun to leverage these investments, our efficiency has generally improved.
Credit Quality
We have well established loan policies and underwriting practices that have resulted in very low levels of charge-offs and nonperforming assets. We strive to originate quality loans that will maintain the credit quality of our loan portfolio. However, credit trends in the markets in which we operate are largely impacted by economic conditions beyond our control and can adversely impact our financial condition and results of operations.
Competition
The industry and businesses in which we operate are highly competitive. We may see increased competition in different areas including interest rates, underwriting standards and product offerings and structure. While we seek to maintain an appropriate return on our investments, we may experience continued pressure on our net interest margin as we operate in this competitive environment.
Economic Conditions
Our business and financial performance are affected by economic conditions generally in the United States and more directly in the markets of California, Washington and Oregon where we operate. The significant economic factors that are most relevant to our business and our financial performance include, but are not limited to, real estate values, interest rates and unemployment rates.
Factors Affecting Comparability of Financial Results
S-Corporation Status
We terminated our status as a “Subchapter S” corporation as of December 1, 2017, in connection with our IPO. Prior to this date, we elected to be taxed for U.S. federal income tax purposes as an S-Corporation. As a result, our earnings were not subject to, and we did not pay, U.S. federal income tax, and we were not required to make any provision or recognize any liability for U.S. federal income tax in our financial statements. While we were not subject to and did not pay U.S. federal income tax, we were subject to, and paid, California S-Corporation income tax at a rate of 3.50%.
Upon the termination of our status as an S-Corporation on December 1, 2017, we commenced paying U.S. federal income tax and a higher California income tax on our taxable earnings and our financial statements reflect a provision for both U.S. federal income tax and California income tax. As a result of this change, the net income and earnings per share data presented in our historical financial statements and the other financial information set forth in this Annual Report, which unless otherwise specified, do not include any provision for U.S. federal income tax, will not be comparable with our net income and earnings per share in periods after we commenced being taxed as a C-Corporation. As a C-Corporation, our net income is calculated by including a provision for U.S. federal income tax, currently at 21.00%,
39
and a California income tax rate, currently at 10.84%.
As an S-Corporation, we made quarterly cash distributions to our shareholders in amounts estimated by us to be sufficient for them to pay estimated individual U.S. federal and California income tax liabilities resulting from our taxable income that was ‘‘passed through’’ to them. However, these distributions were not consistent, as sometimes the distributions were less than or in excess of the shareholders' estimated U.S. federal and California income tax liabilities resulting from their ownership of our stock. In addition, these estimates were based on individual income tax rates, which may differ from the rates imposed on the income of C-Corporations. Subsequent to the termination of our S-Corporation status on December 1, 2017, other than our obligations under the tax sharing agreement with prior S-Corporation shareholders, no further income will be ‘‘passed through’’ to shareholders for any estimated tax liabilities.
Deferred tax assets and liabilities are recognized for the tax consequences attributable to differences between the financial statement carrying amounts of our existing assets and liabilities and their respective tax bases. Deferred tax assets and liabilities are measured using tax rates expected to apply to taxable income in the years in which those temporary differences are expected to be recovered or settled.
Multifamily Securitization Transaction
During 2017, we entered into a trust sale memorandum of understanding with Freddie Mac, pursuant to which we agreed to sell a portfolio of multifamily loans to a real estate mortgage investment conduit ("REMIC"), that holds the loans in trust and issued securities that are fully guaranteed by Freddie Mac and privately offered and sold to investors. On September 27, 2017, we closed this securitization transaction. We did not purchase any of the securities for our portfolio.
The primary purpose of this multifamily securitization transaction was to enable us to redeploy capital and funding to support higher-yielding assets while also reducing our reliance on wholesale funding, improving liquidity measures and reducing our concentration of multifamily loans.
The size of the multifamily loan portfolio sold to the REMIC was $626.1 million, consisting of one class of post-reset, variable rate 3, 5, and 7-year hybrid loans in an aggregate principal amount of approximately $91.6 million, and two classes of pre-reset, variable rate 3, 5 and 7-year hybrid loans in an aggregate principal amount of approximately $534.5 million. 74.3% of the loan portfolio consisted of loans for multifamily properties located in California, while the remaining 25.7% of the loan portfolio consisted of loans for multifamily properties located in Washington. We retained sub-servicing obligations on the loan portfolio. The gross proceeds of this sale to us was approximately $637.6 million. We used the proceeds of this sale to pay down short-term FHLB borrowings. These borrowings had no prepayment penalties associated with them. The following table summarizes the loans that were sold in this securitization.
(Dollars in thousands) | Number of Mortgage Loans (1) | Principal Balance (1) | Percentage of Mortgage Pool Balance | Weighted Average Mortgage Rate (1) | Loan to Value Ratio (1) | Debt Service Coverage Ratio (1) | |||||||
Loan Type | |||||||||||||
Post-Reset Hybrid Loans | 65 | $ | 91,552 | 14.6 | % | 3.66 | % | 53.2 | % | 1.88 | |||
Pre-Reset Hybrid Loans (2) | 237 | 415,628 | 66.4 | % | 3.39 | % | 54.2 | % | 1.67 | ||||
Pre-Reset Hybrid Loans (3) | 70 | 118,880 | 19.0 | % | 3.51 | % | 46.5 | % | 1.70 | ||||
Total | 372 | $ | 626,060 | 100.0 | % | 3.45 | % | 52.6 | % | 1.71 | |||
(1) | Represents number of loans, balance, weighted average rate and ratios at the security cut-off date of September 1, 2017. |
(2) | Loans had 1 to 40 months until their first rate reset at the security cut-off date of September 1, 2017. |
(3) | Loans had 41 or more months until their first rate reset at the security cut-off date of September 1, 2017. |
In connection with the securitization, we entered into a reimbursement agreement with Freddie Mac, pursuant to which we are obligated to reimburse Freddie Mac for the first losses in the underlying loan portfolio not to exceed 10% of the unpaid principal amount of the loans comprising the securitization pool at settlement, or approximately $62.6 million. Our reimbursement obligation is supported by a FHLB letter of credit. Our reimbursement obligation will terminate on the later of (i) the date on which Freddie Mac has no further liability (accrued or contingent) under its guarantee for these securities or (ii) the date on which we shall pay to Freddie Mac our full reimbursement obligation. As of December 31, 2019, the aggregate remaining loan balance in the securitization loans was $355.2 million. No disbursements have been made in connection with the reimbursement obligation.
40
Public Company Costs
As a result of our initial public offering completed in December 2017, we are incurring additional costs associated with operating as a public company. These costs include additional personnel, legal, consulting, regulatory, insurance, accounting, investor relations and other expenses that we did not incur as a private company.
The Sarbanes-Oxley Act, as well as rules adopted by the SEC and national securities exchanges, requires public companies to implement specified corporate governance practices that were inapplicable to us as a private company. These additional rules and regulations increased our legal, regulatory and financial compliance costs and will make some activities more time-consuming and costly.
Results of Operations - Years ended December 31, 2019 and 2018
Overview
For the year ended December 31, 2019 our net income was $48.9 million as compared to $45.1 million for the year ended December 31, 2018. The increase of $3.8 million, or 8.4%, was primarily attributable to an increase of $3.3 million in net interest income, a $2.4 million decrease in the provision for loan losses and an increase of $544 thousand in noninterest income, partially offset by an increase of $2.7 million in the provision for income taxes as compared to the prior year. Pre-tax, pre-provision net earnings increased by $4.2 million, or 6.3%, for the year ended December 31, 2019 as compared to the prior year.
Net Interest Income
Net interest income increased by $3.3 million, or 2.7%, to $128.4 million for the year ended December 31, 2019 from $125.1 million for the prior year primarily related to growth in the average balance and yield of our loan portfolio of $577.9 million and 26 basis points, respectively. The improvement in net interest income was further enhanced by growth in the average balance and yield of our investment portfolio, which increased by $76.7 million and 21 basis points, respectively. These increases were partially offset by growth in the average balance and cost of our interest-bearing deposits of $646.0 million and 50 basis points, respectively, and, to a lesser extent, an increase in the cost of FHLB advances of 18 basis points, compared to the prior year. Net interest margin for the year ended December 31, 2019 was 1.84%, compared to 1.98% for the prior year. The decline in net interest margin primarily relates to our rising cost of funds, which had generally outpaced the increases in yield on our interest-earning assets during the majority of this year, due to short-term rate increases at the end of 2018 and the flattening of the yield curve, which inverted for a period during 2019.
Average balance sheet, interest and yield/rate analysis. The following table presents average balance sheet information, interest income, interest expense and the corresponding average yield earned and rates paid for the years ended December 31, 2019, 2018 and 2017. The average balances are daily averages.
41
For the Years Ended December 31, | ||||||||||||||||||||||||||||||||
2019 | 2018 | 2017 | ||||||||||||||||||||||||||||||
(Dollars in thousands) | Average Balance | Interest Inc/Exp | Yield/Rate | Average Balance | Interest Inc/Exp | Yield/Rate | Average Balance | Interest Inc/Exp | Yield/Rate | |||||||||||||||||||||||
Interest-Earning Assets | ||||||||||||||||||||||||||||||||
Multifamily residential | $ | 3,870,897 | $ | 162,328 | 4.19 | % | $ | 3,321,691 | $ | 127,950 | 3.85 | % | $ | 2,897,794 | $ | 101,708 | 3.51 | % | ||||||||||||||
Single family residential | 2,139,517 | 76,766 | 3.59 | % | 2,149,154 | 75,906 | 3.53 | % | 1,828,668 | 59,498 | 3.25 | % | ||||||||||||||||||||
Commercial real estate | 196,903 | 9,353 | 4.75 | % | 147,494 | 6,935 | 4.70 | % | 78,032 | 3,678 | 4.71 | % | ||||||||||||||||||||
Construction, land and NM | 15,907 | 1,083 | 6.81 | % | 27,013 | 1,044 | 3.86 | % | 45,400 | 1,689 | 3.72 | % | ||||||||||||||||||||
Total Loans (1) | 6,223,224 | 249,530 | 4.01 | % | 5,645,352 | 211,835 | 3.75 | % | 4,849,894 | 166,573 | 3.43 | % | ||||||||||||||||||||
Investment securities | 661,574 | 15,461 | 2.34 | % | 584,898 | 12,430 | 2.13 | % | 477,792 | 6,739 | 1.41 | % | ||||||||||||||||||||
Cash and cash equivalents | 105,042 | 2,151 | 2.05 | % | 98,524 | 1,792 | 1.82 | % | 87,780 | 925 | 1.05 | % | ||||||||||||||||||||
Total interest-earning assets | 6,989,840 | 267,142 | 3.82 | % | 6,328,774 | 226,057 | 3.57 | % | 5,415,466 | 174,237 | 3.22 | % | ||||||||||||||||||||
Noninterest-earning assets (2) | 76,707 | 77,157 | 70,366 | |||||||||||||||||||||||||||||
Total assets | $ | 7,066,547 | $ | 6,405,931 | $ | 5,485,832 | ||||||||||||||||||||||||||
Interest-Bearing Liabilities | ||||||||||||||||||||||||||||||||
Transaction accounts | $ | 210,743 | 2,686 | 1.26 | % | $ | 176,725 | 1,541 | 0.86 | % | $ | 196,127 | 1,553 | 0.78 | % | |||||||||||||||||
Money market demand accounts | 1,402,608 | 18,181 | 1.28 | % | 1,464,952 | 14,954 | 1.01 | % | 1,495,794 | 12,099 | 0.80 | % | ||||||||||||||||||||
Time deposits | 3,538,223 | 84,225 | 2.35 | % | 2,863,852 | 52,617 | 1.81 | % | 1,972,747 | 25,161 | 1.26 | % | ||||||||||||||||||||
Total deposits | 5,151,574 | 105,092 | 2.01 | % | 4,505,529 | 69,112 | 1.51 | % | 3,664,668 | 38,813 | 1.04 | % | ||||||||||||||||||||
FHLB advances | 1,056,557 | 24,896 | 2.36 | % | 1,069,216 | 23,285 | 2.18 | % | 1,160,555 | 16,555 | 1.43 | % | ||||||||||||||||||||
Junior subordinated debentures | 61,857 | 2,447 | 3.96 | % | 61,857 | 2,266 | 3.66 | % | 61,857 | 1,665 | 2.69 | % | ||||||||||||||||||||
Senior debt | 94,350 | 6,300 | 6.68 | % | 94,223 | 6,307 | 6.69 | % | 94,090 | 6,309 | 6.71 | % | ||||||||||||||||||||
Total interest-bearing liabilities | 6,364,338 | 138,735 | 2.16 | % | 5,730,825 | 100,970 | 1.74 | % | 4,981,170 | 63,342 | 1.26 | % | ||||||||||||||||||||
Noninterest-bearing deposit accounts | 41,821 | 51,152 | 22,556 | |||||||||||||||||||||||||||||
Noninterest-bearing liabilities | 60,814 | 57,679 | 56,408 | |||||||||||||||||||||||||||||
Total liabilities | 6,466,973 | 5,839,656 | 5,060,134 | |||||||||||||||||||||||||||||
Total stockholders' equity | 599,574 | 566,275 | 425,698 | |||||||||||||||||||||||||||||
Total liabilities and stockholders' equity | $ | 7,066,547 | $ | 6,405,931 | $ | 5,485,832 | ||||||||||||||||||||||||||
Net interest spread (3) | 1.66 | % | 1.83 | % | 1.96 | % | ||||||||||||||||||||||||||
Net interest income/margin (4) | $ | 128,407 | 1.84 | % | $ | 125,087 | 1.98 | % | $ | 110,895 | 2.05 | % | ||||||||||||||||||||
(1) | Non-accrual loans and loans held for sale are included in total loan balances. No adjustment has been made for these loans in the calculation of yields. Interest income on loans includes amortization of deferred loan costs, net of deferred loan fees. Net deferred loan cost amortization totaled $14.6 million, $10.2 million and $9.3 million for the years ended December 31, 2019, 2018 and 2017, respectively. |
(2) | Noninterest-earning assets includes the allowance for loan losses. |
(3) | Net interest spread is the average yield on total interest-earning assets minus the average rate on total interest-bearing liabilities. |
(4) | Net interest margin is net interest income divided by total interest-earning assets. |
Interest rates and operating interest differential. Increases and decreases in interest income and interest expense result from changes in average balances (volume) of interest-earning assets and interest-bearing liabilities, as well as changes in average interest rates. The following table shows the effect that these factors had on the interest earned from our interest-earning assets and interest incurred on our interest-bearing liabilities during the periods indicated. The effect of changes in volume is determined by multiplying the change in volume by the prior period’s average rate. The effect of rate changes is calculated by multiplying the change in average rate by the prior period’s volume. The change in interest due to both rate and volume has been allocated to rate and volume changes in proportion to the relationship of the absolute dollar amounts of the changes in each.
42
For the Years Ended December 31, 2019 vs 2018 | |||||||||||
Variance Due To | |||||||||||
(Dollars in thousands) | Volume | Yield/Rate | Total | ||||||||
Interest-Earning Assets | |||||||||||
Multifamily residential | $ | 22,409 | $ | 11,969 | $ | 34,378 | |||||
Single family residential | (359 | ) | 1,219 | 860 | |||||||
Commercial real estate | 2,343 | 75 | 2,418 | ||||||||
Construction, land and NM | (544 | ) | 583 | 39 | |||||||
Total Loans | 23,849 | 13,846 | 37,695 | ||||||||
Investment securities | 1,730 | 1,301 | 3,031 | ||||||||
Cash and cash equivalents | 123 | 236 | 359 | ||||||||
Total interest-earning assets | 25,702 | 15,383 | 41,085 | ||||||||
Interest-Bearing Liabilities | |||||||||||
Transaction accounts | 335 | 810 | 1,145 | ||||||||
Money market demand accounts | (643 | ) | 3,870 | 3,227 | |||||||
Time deposits | 13,943 | 17,665 | 31,608 | ||||||||
Total deposits | 13,635 | 22,345 | 35,980 | ||||||||
FHLB advances | (281 | ) | 1,892 | 1,611 | |||||||
Junior subordinated debentures | — | 181 | 181 | ||||||||
Senior debt | 5 | (12 | ) | (7 | ) | ||||||
Total interest-bearing liabilities | 13,359 | 24,406 | 37,765 | ||||||||
Net Interest Income | $ | 12,343 | $ | (9,023 | ) | $ | 3,320 | ||||
For the Years Ended December 31, 2018 vs 2017 | |||||||||||
Variance Due To | |||||||||||
(Dollars in thousands) | Volume | Yield/Rate | Total | ||||||||
Interest-Earning Assets | |||||||||||
Multifamily residential | $ | 15,788 | $ | 10,454 | $ | 26,242 | |||||
Single family residential | 11,001 | 5,407 | 16,408 | ||||||||
Commercial real estate | 3,265 | (8 | ) | 3,257 | |||||||
Construction, land and NM | (707 | ) | 62 | (645 | ) | ||||||
Total Loans | 29,347 | 15,915 | 45,262 | ||||||||
Investment securities | 1,736 | 3,955 | 5,691 | ||||||||
Cash and cash equivalents | 124 | 743 | 867 | ||||||||
Total interest-earning assets | 31,207 | 20,613 | 51,820 | ||||||||
Interest-Bearing Liabilities | |||||||||||
Transaction accounts | (160 | ) | 148 | (12 | ) | ||||||
Money market demand accounts | (250 | ) | 3,105 | 2,855 | |||||||
Time deposits | 13,963 | 13,493 | 27,456 | ||||||||
Total deposits | 13,553 | 16,746 | 30,299 | ||||||||
FHLB advances | (1,393 | ) | 8,123 | 6,730 | |||||||
Junior subordinated debentures | — | 601 | 601 | ||||||||
Senior debt | 12 | (14 | ) | (2 | ) | ||||||
Total interest-bearing liabilities | 12,172 | 25,456 | 37,628 | ||||||||
Net Interest Income | $ | 19,035 | $ | (4,843 | ) | $ | 14,192 | ||||
Total interest income increased by $41.1 million, or 18.2%, for the year ended December 31, 2019 as compared to the prior year. The increase was primarily due to a $37.7 million increase in interest income earned on loans resulting from growth in the average daily balance of loans, which increased by $577.9 million, or 10.2%, as compared to the
43
prior year, as well as a 26 basis point increase in our loan yield. The increase in the average balance of loans during the current year was primarily attributable to substantial loan growth during the year ended December 31, 2018, which significantly impacted the average balance of our loans outstanding during 2019 relative to the prior year. The 26 basis point increase in yield compared to the prior year was primarily a result of the rate on new loan originations generally exceeding the rate on loan payoffs since early 2017 through mid 2019, as well as $2.1 million in swap income earned during the year ended December 31, 2019. Additionally, interest income on investments increased by $3.0 million due to an increase in the average daily balance and yield on investment securities of $76.7 million and 21 basis points, respectively.
During the year ended December 31, 2018, total loans increased by $1.1 billion compared to an increase of $100.3 million during the year ended December 31, 2019. The volume of new loans originated totaled $1.6 billion and $2.0 billion for the years ended December 31, 2019 and 2018, respectively. The decreased originations were primarily due to a slowing in demand for hybrid real estate loans, as a result of a flattening in the yield curve, which inverted for a portion of 2019. The weighted average rate on new loans for the year ended December 31, 2019 was 4.35% as compared to 4.63% for the prior year. The decline in the average coupon for the current year originations compared to the prior year was due to the current year decline in five-year or longer term market interest rates, as well as competitive pricing pressures. Loan payoffs and paydowns totaled $1.4 billion and $956.6 million for the years ended December 31, 2019 and 2018, respectively. The weighted average rate on loan payoffs during the year ended December 31, 2019 was 4.27% as compared to 4.05% for the prior year.
Total interest expense increased $37.8 million to $138.7 million for the year ended December 31, 2019 from $101.0 million for the prior year. Interest expense on deposits increased $36.0 million to $105.1 million for the year ended December 31, 2019 from $69.1 million for the prior year. This increase was due to the cost of interest-bearing deposits increasing 50 basis points, as well as average daily deposit balances increasing by $646.0 million, or 14.3%, from period to period. The increase in the cost of our deposits was primarily related to repricing in our time deposit portfolio, which had been impacted by rising short-term interest rates in the prior year and competitive pricing pressures. Interest expense on advances from the FHLB increased by $1.6 million during the year ended December 31, 2019 as compared to the prior year. This increase was primarily attributable to a 18 basis point increase in the cost of those advances as compared to the prior year. The increase in the cost of FHLB advances was primarily caused by the change in the average cost and balance of our short-term FHLB borrowings, which fluctuated from 1.76% and $221.1 million, respectively, during the year ended December 31, 2018, to 2.52% and $51.8 million, respectively, during the year ended December 31, 2019. We use both deposits and FHLB advances to fund net loan growth. We also use FHLB advances, with or without embedded interest rate caps, as a hedge of interest rate risk, as we can strategically control the duration of those funds. A discussion of instruments used to mitigate interest rate risk can be found under Part II - Item 7A. ‘‘Quantitative and Qualitative Disclosures About Market Risk.’’
Provision for Loan Losses
Provision for loan losses totaled $1.3 million for the year ended December 31, 2019 as compared to loan loss provisions of $3.6 million for the year ended December 31, 2018. The lower loan loss provisions were primarily due to slower loan growth as compared to the prior year. During the years ended December 31, 2019 and 2018, we recorded loan recoveries of $437 thousand and $402 thousand, respectively. We recorded no loan charge-offs during those same years. This was due in large part to minimal balances of problem loans, as well as strong collateral support of our credits attributed to our lower loan to value ratios and a healthy real estate market. Our allowance for loan losses as a percentage of total loans was 0.58% at December 31, 2019 as compared to 0.56% at December 31, 2018.
Nonperforming loans as a percentage of total loans increased to 0.10% at December 31, 2019 from 0.03% at December 31, 2018, and 53% and 61% of nonperforming loans, by balance, were current and paying as agreed at December 31, 2019 and 2018, respectively. The increase in nonperforming loans was primarily due to several single family residential loans being placed on nonaccrual status during the year ended December 31, 2019. At December 31, 2019, our classified loans as a percentage of total loans increased 7 basis points, to 0.19% from 0.12%, as compared to the prior year. Despite the increases in nonperforming and classified loans, the provisions for loan losses declined compared to the previous year due primarily to slower loan growth during the year ended December 31, 2019, as discussed above.
44
Noninterest Income
Noninterest income increased by $544 thousand to $4.7 million for the year ended December 31, 2019 from $4.1 million for the year ended December 31, 2018.
The following table presents the major components of our noninterest income:
For the Years Ended December 31, | ||||||||||||||
(Dollars in thousands) | 2019 | 2018 | $ Increase (Decrease) | % Increase (Decrease) | ||||||||||
Noninterest Income | ||||||||||||||
Gain on sale of loans | $ | 607 | $ | 140 | $ | 467 | 333.6 | % | ||||||
FHLB dividends | 2,163 | 2,735 | (572 | ) | (20.9 | )% | ||||||||
Fee income | 674 | 764 | (90 | ) | (11.8 | )% | ||||||||
Other | 1,231 | 492 | 739 | 150.2 | % | |||||||||
Total noninterest income | $ | 4,675 | $ | 4,131 | $ | 544 | 13.2 | % | ||||||
The increase in noninterest income for the year ended December 31, 2019 compared to the year ended December 31, 2018 was primarily attributable to an increase in gains on sale of loans of $467 thousand, a non-recurring equipment recovery of $384 thousand recognized during the current year and an increase in the fair value of equity securities of $344 thousand, partially offset by a $484 thousand special FHLB dividend received during the prior year.
Noninterest Expense
Noninterest expense decreased $319 thousand, or 0.5%, to $62.4 million for the year ended December 31, 2019 from $62.7 million for 2018.
The following table presents the components of our noninterest expense for the years ended December 31, 2019 and 2018:
For the Years Ended December 31, | ||||||||||||||
(Dollars in thousands) | 2019 | 2018 | $ Increase (Decrease) | % Increase (Decrease) | ||||||||||
Noninterest Expense | ||||||||||||||
Compensation and related benefits | $ | 37,228 | $ | 38,860 | $ | (1,632 | ) | (4.2 | )% | |||||
Deposit insurance premium | 545 | 1,892 | (1,347 | ) | (71.2 | )% | ||||||||
Professional and regulatory fees | 1,984 | 2,037 | (53 | ) | (2.6 | )% | ||||||||
Occupancy | 5,688 | 5,349 | 339 | 6.3 | % | |||||||||
Depreciation and amortization | 2,618 | 2,813 | (195 | ) | (6.9 | )% | ||||||||
Data processing | 3,738 | 3,315 | 423 | 12.8 | % | |||||||||
Marketing | 5,053 | 3,497 | 1,556 | 44.5 | % | |||||||||
Other expenses | 5,514 | 4,924 | 590 | 12.0 | % | |||||||||
Total noninterest expense | $ | 62,368 | $ | 62,687 | $ | (319 | ) | (0.5 | )% | |||||
The decrease in noninterest expense during the year ended December 31, 2019 as compared to the prior year was primarily attributed to a $2.3 million decline in compensation and consulting costs incurred last year in connection with the CEO transition plan and a $1.3 million decline in federal deposit insurance premium assessments due to the full utilization of our Small Bank Assessment Credit during the current year. These items were partially offset by an increase of $1.6 million in marketing expenses incurred due to costs associated with deposit gathering efforts and a $1.1 million write-off of unamortized leasehold improvements related to the current year relocation of our San Rafael branch and Manhattan Beach office space recognized in Other expenses above.
45
Income Tax Expense
For the year ended December 31, 2019, we recorded income tax expense of $20.6 million as compared to income tax expense of $17.9 million for the prior year with effective tax rates of 29.7% and 28.4%, respectively. The variance in effective rates was primarily due to the vesting and settlement of stock awards and non-deductible executive compensation recorded during the year ended December 31, 2019, as well as tax benefits recognized during the previous year related to true-ups in connection with the filing our 2017 tax returns.
Financial Condition - As of December 31, 2019 and 2018
Total assets at December 31, 2019 were $7.0 billion, an increase of $108.6 million, or 1.6%, from December 31, 2018. The increase was primarily due to a $100.3 million, or 1.6%, increase in loans held for investment. Absent loan sales of $68.3 million during the current year, loan growth would have been $168.6 million, or 2.8%. Total liabilities increased from the prior year by $75.3 million, or 1.2%, to $6.4 billion at December 31, 2019. The increase in total liabilities was primarily attributable to growth in our deposits of $233.7 million, or 4.7%, partially offset by a decrease in FHLB advances of $164.4 million, or 14.4%, compared to December 31, 2018.
Loan Portfolio Composition
Our loan portfolio is our largest class of earning assets and typically provides higher yields than other types of earning assets. Associated with the higher yields is an inherent amount of credit risk which we attempt to mitigate with strong underwriting. As of December 31, 2019 and 2018, our total loans held for investment were $6.2 billion and $6.1 billion, respectively. The following table presents the balance and associated percentage of each major product type within our portfolio as of the dates indicated.
As of December 31, | |||||||||||||||||||||||||||||||||||
2019 | 2018 | 2017 | 2016 | 2015 | |||||||||||||||||||||||||||||||
(Dollars in thousands) | Amount | % of total | Amount | % of total | Amount | % of total | Amount | % of total | Amount | % of total | |||||||||||||||||||||||||
Real estate loans held for investment | |||||||||||||||||||||||||||||||||||
Multifamily residential | $ | 3,962,929 | 64.1 | % | $ | 3,650,967 | 60.1 | % | $ | 2,887,438 | 57.7 | % | $ | 2,600,262 | 59.0 | % | $ | 2,295,697 | 60.1 | % | |||||||||||||||
Single family residential | 1,993,484 | 32.3 | % | 2,231,802 | 36.7 | % | 1,957,546 | 39.2 | % | 1,711,818 | 38.9 | % | 1,449,993 | 37.9 | % | ||||||||||||||||||||
Commercial real estate | 202,452 | 3.3 | % | 183,559 | 3.0 | % | 112,492 | 2.3 | % | 59,611 | 1.4 | % | 55,217 | 1.4 | % | ||||||||||||||||||||
Construction and land | 20,565 | 0.3 | % | 12,656 | 0.2 | % | 41,165 | 0.8 | % | 29,465 | 0.7 | % | 21,421 | 0.6 | % | ||||||||||||||||||||
Non-mortgage | 100 | — | % | 100 | — | % | 50 | — | % | 50 | — | % | — | — | % | ||||||||||||||||||||
Total loans held-for-investment before deferred items | 6,179,530 | 100.0 | % | 6,079,084 | 100.0 | % | 4,998,691 | 100.0 | % | 4,401,206 | 100.0 | % | 3,822,328 | 100.0 | % | ||||||||||||||||||||
Deferred loan costs, net | 51,447 | 51,546 | 42,856 | 38,560 | 33,175 | ||||||||||||||||||||||||||||||
Total loans held for investment | $ | 6,230,977 | $ | 6,130,630 | $ | 5,041,547 | $ | 4,439,766 | $ | 3,855,503 | |||||||||||||||||||||||||
Real estate loans held for sale | |||||||||||||||||||||||||||||||||||
Single family residential | $ | — | — | % | $ | — | — | % | $ | — | — | % | $ | 34,330 | 100.0 | % | $ | 17,952 | 100.0 | % | |||||||||||||||
Deferred loan costs, net | — | — | — | 680 | 267 | ||||||||||||||||||||||||||||||
Fair value adjustment - (loss) gain | — | — | — | (36 | ) | (133 | ) | ||||||||||||||||||||||||||||
Total loans held for sale | $ | — | $ | — | $ | — | $ | 34,974 | $ | 18,086 | |||||||||||||||||||||||||
The relative composition of the portfolio has not changed significantly over the past few years. Our primary focus remains multifamily real estate lending, which constitutes 64% and 60% of our portfolio at December 31, 2019 and 2018, respectively. Single family residential lending is our secondary lending emphasis and represents 32% and 37% of our portfolio at December 31, 2019 and 2018, respectively. Single family residential loans have decreased slightly from the prior year due to elevated prepayments attributable to customers refinancing their hybrid-ARM loans to take advantage of lower long-term interest rates.
We recognize that these two loan products represent concentrations within our balance sheet. Multifamily loan balances as a percentage of risk-based capital were 562.3% and 540.0% as of December 31, 2019 and 2018, respectively. Our single family loans as a percentage of risk-based capital were 285.2% and 332.8% as of the same dates. Additionally, our loans are geographically concentrated with borrowers and collateral properties on the West Coast. At December 31,
46
2019, 61%, 26% and 11% of our real estate loans were collateralized by properties in southern California counties, northern California counties and Washington, respectively, compared to 59%, 28% and 12%, respectively, at December 31, 2018.
Our lending strategy has been to focus on products and markets where we have significant expertise. Given our concentrations, we have established strong risk management practices including risk-based lending standards, self-established product and geographical limits, annual evaluations of income property loans and semi-annual stress testing. We expect to continue modestly growing our loan portfolio.
We have a small portfolio of construction loans with commitments (funded and unfunded) totaling $39.4 million and $20.3 million at December 31, 2019 and 2018, respectively. Our construction lending typically focuses on single family residential projects with completed values of $5.0 million or less and multifamily projects with loan commitments of $15.0 million or less. We plan to continue to modestly grow this portfolio within our core markets.
The following table presents the activity in our loan portfolio for the periods shown:
For the Years Ended December 31, | |||||||||||||||||||
(Dollars in thousands) | 2019 | 2018 | 2017 | 2016 | 2015 | ||||||||||||||
Loan Inflows: | |||||||||||||||||||
Multifamily residential | $ | 891,116 | $ | 1,119,617 | $ | 1,302,896 | $ | 1,050,006 | $ | 815,250 | |||||||||
Single family residential | 591,177 | 828,907 | 726,485 | 782,585 | 641,632 | ||||||||||||||
Commercial real estate | 38,088 | 84,808 | 63,893 | 32,021 | 5,760 | ||||||||||||||
Construction and land | 33,618 | 14,505 | 29,010 | 41,091 | 35,884 | ||||||||||||||
Non-mortgage | — | 50 | — | 50 | — | ||||||||||||||
Mortgage banking originations | — | — | 18,041 | 167,814 | 133,125 | ||||||||||||||
Purchases | 10,052 | — | — | — | — | ||||||||||||||
Total loans originated | 1,564,051 | 2,047,887 | 2,140,325 | 2,073,567 | 1,631,651 | ||||||||||||||
Loan Outflows: | |||||||||||||||||||
Loan principal reductions and payoffs | (1,376,413 | ) | (956,578 | ) | (909,387 | ) | (977,339 | ) | (1,009,407 | ) | |||||||||
Portfolio loan sales | (68,325 | ) | (19,603 | ) | (652,705 | ) | (315,918 | ) | (98,692 | ) | |||||||||
Mortgage banking loan sales | — | — | (25,187 | ) | (176,678 | ) | (120,004 | ) | |||||||||||
Other (1) | (18,966 | ) | 17,377 | 10,109 | (8,376 | ) | (13,386 | ) | |||||||||||
Total loan outflows | (1,463,704 | ) | (958,804 | ) | (1,577,170 | ) | (1,478,311 | ) | (1,241,489 | ) | |||||||||
Net increase in total loan portfolio | $ | 100,347 | $ | 1,089,083 | $ | 563,155 | $ | 595,256 | $ | 390,162 | |||||||||
(1) Other changes in loan balances primarily represent the net change in disbursements on unfunded commitments, deferred loans costs, fair value adjustments and to the extent applicable, may include foreclosures, charge-offs and negative amortization. | |||||||||||||||||||
Our loan portfolio increased by $100.3 million during 2019 as compared to a $1.1 billion increase during the prior year. The decline in the growth of our loan portfolio was primarily due to a decrease of $493.9 million in new loan volume and an increase of $419.8 million in loan principal reductions and payoffs. Total loan origination volume declined during 2019 largely due to borrowers foregoing hybrid loans to take advantage of lower long-term interest rates. Loan origination volumes were further impacted by a more disciplined approach to our loan pricing and a tightening of our credit standards compared to previous years. In addition, we have seen the return of a healthy non-qualified mortgage securitization market creating greater competition for single family residential loans. Loan curtailments increased duing the current year as compared to 2018 primarily as a result of refinancing activity. During 2019, long-term Treasury rates, which are correlated to lending rates, declined significantly allowing borrowers the opportunity to lock in less expensive borrowing costs. Loan prepayment speeds were 18.87% and 14.26% during the years ended December 31, 2019 and 2018, respectively. During the year ended December 31, 2019, portfolio loan sales primarily consisted of CRA qualified single family residential mortgages with elevated loan-to-values. These strategic sales reduced both our interest rate risk and credit risk. During 2017, we closed a securitization transaction resulting in the sale of $626.1 million of multifamily loans. The primary purpose of this transaction was to enable us to redeploy capital and funding to support higher-yielding assets while also reducing our reliance on wholesale funding, improving liquidity measures
47
and reducing our concentration of multifamily loans. Portfolio loan sales in 2016 and 2015 were primarily targeted to reducing loan concentrations and generally consisted of multifamily residential loans. Mortgage banking loans sales primarily consisted of single family residential loans and were sold through our retail mortgage banking division, which was closed during the first quarter of 2017.
Multifamily residential loans. We provide multifamily residential loans for the purchase or refinance of apartment buildings of five units or more, with the financed properties serving as collateral for the loan. Our multifamily lending is built around three core principles: market selection, deal selection and sponsor selection. We focus on markets with a high barrier to entry for new development, where there is a limited supply of new housing and where there is a high variance between the cost to rent and the cost to own. We typically lend on stabilized and seasoned assets and focus on older, smaller properties with rents at or below market levels, catering to low and middle income renters. Our customers are generally experienced real estate professionals who desire regular income/cash flow streams and are focused on building wealth steadily over time. We have instituted strong lending policies to mitigate credit and concentration risk. At December 31, 2019, our multifamily real estate portfolio had an average loan balance of $1.6 million, an average unit count of 15.2 units, a weighted average loan to value of 56.9% and a weighted average debt service coverage ratio of 1.49, as compared to an average loan balance of $1.6 million, an average unit count of 15.9 units, a weighted average loan to value of 57.1% and a weighted average debt service coverage ratio of 1.53 at December 31, 2018.
Single family residential loans. We provide permanent financing on single family residential properties primarily located in our market areas, which are both owner-occupied and investor owned. We conduct this business primarily through a network of third party mortgage brokers with the intention of retaining these loans in our portfolio. The majority of our originations are for purchase transactions, but we also provide refinancings. Our underwriting criteria focuses on debt ratios, credit scores, liquidity of the borrower and the borrower’s cash reserves. At December 31, 2019, our single family residential real estate portfolio had an average loan balance of $905 thousand, a weighted average loan to value of 64.6% and a weighted average credit score at origination/refreshed of 750. At December 31, 2018, our single family residential real estate portfolio had an average loan balance of $889 thousand, a weighted average loan to value of 65.2% and a weighted average credit score at origination/refreshed of 751.
Commercial real estate loans. While not a large part of our portfolio during any period presented, we also lend on nonresidential commercial real estate. Our commercial real estate loans are generally used to finance the purchase of established multi-tenant industrial, office and retail sites. At December 31, 2019, our commercial real estate portfolio had an average loan balance of $2.1 million, a weighted average loan to value of 55.9% and a weighted average debt service coverage ratio of 1.57, as compared to an average loan balance of $2.1 million, a weighted average loan to value of 57.0% and a weighted average debt service coverage ratio of 1.55 at December 31, 2018. We intend to continue to emphasize this product through marketing and cross-selling efforts; however, we do not anticipate that the composition of our loan portfolio will materially change as a result of these efforts.
Other. Other categories of loans included in our portfolio include construction loans and non-mortgage loans. Construction loans currently consist primarily of single family construction projects. The non-mortgage loans in our portfolio were provided in support of community investment efforts.
48
The following table sets forth the contractual maturity distribution of our loan portfolio:
(Dollars in thousands) | Due in 1 year or less | Due after 1 year through 5 years | Due after 5 years | Total | ||||||||||
As of December 31, 2019: | ||||||||||||||
Loans | ||||||||||||||
Real estate mortgage loans: | ||||||||||||||
Multifamily residential | $ | — | $ | 1,498 | $ | 3,961,431 | $ | 3,962,929 | ||||||
Single family residential | 1,445 | 1,403 | 1,990,636 | 1,993,484 | ||||||||||
Commercial real estate | 58 | 1,640 | 200,754 | 202,452 | ||||||||||
Construction and land | 15,884 | 4,681 | — | 20,565 | ||||||||||
Non-mortgage | — | — | 100 | 100 | ||||||||||
Total loans | $ | 17,387 | $ | 9,222 | $ | 6,152,921 | $ | 6,179,530 | ||||||
Fixed interest rates | $ | — | $ | 352 | $ | 29,828 | $ | 30,180 | ||||||
Floating or adjustable rates | 17,387 | 8,870 | 6,123,093 | 6,149,350 | ||||||||||
Total loans | $ | 17,387 | $ | 9,222 | $ | 6,152,921 | $ | 6,179,530 | ||||||
As of December 31, 2018: | ||||||||||||||
Loans | ||||||||||||||
Real estate mortgage loans: | ||||||||||||||
Multifamily residential | $ | 31 | $ | 1,387 | $ | 3,649,549 | $ | 3,650,967 | ||||||
Single family residential | 1,434 | 1,029 | 2,229,339 | 2,231,802 | ||||||||||
Commercial real estate | 893 | 553 | 182,113 | 183,559 | ||||||||||
Construction and land | 5,932 | 2,585 | 4,139 | 12,656 | ||||||||||
Non-mortgage | — | — | 100 | 100 | ||||||||||
Total loans | $ | 8,290 | $ | 5,554 | $ | 6,065,240 | $ | 6,079,084 | ||||||
Fixed interest rates | $ | — | $ | 458 | $ | 59,736 | $ | 60,194 | ||||||
Floating or adjustable rates | 8,290 | 5,096 | 6,005,504 | 6,018,890 | ||||||||||
Total loans | $ | 8,290 | $ | 5,554 | $ | 6,065,240 | $ | 6,079,084 | ||||||
Our fixed interest rate loans are primarily secured by single family residential properties in conjunction with our efforts to provide affordable housing to low-to-moderate income individuals. Our floating/adjustable rate loans are largely hybrid interest rate programs that provide an initial fixed term of 3 to 10 years and then convert to quarterly or semi-annual adjustments thereafter. As of December 31, 2019 and 2018, $3.9 billion and $3.6 billion, respectively, of our floating/adjustable rate loans were at their floor rates. The weighted average minimum interest rate on these loans was 4.14% and 4.05% at December 31, 2019 and 2018, respectively. Hybrid adjustable rate loans still within their initial fixed term totaled $5.5 billion and $5.4 billion at December 31, 2019 and 2018, respectively. These loans had a weighted average term to first repricing date of 3.42 years and 3.79 years at December 31, 2019 and 2018, respectively.
Asset Quality
Our primary objective is to maintain a high level of asset quality in our loan portfolio. We believe our underwriting practices and policies, established by experienced professionals, appropriately govern the risk profile for our loan portfolio. These policies are continually evaluated and updated as necessary. All loans are assessed and assigned a risk classification at origination based on underlying characteristics of the transaction such as collateral type, collateral cash flow, collateral coverage and borrower strength. We believe that we have a comprehensive methodology to proactively monitor our credit quality after origination. Particular emphasis is placed on our commercial portfolio where risk assessments are re-evaluated as a result of reviewing commercial property operating statements and borrower financials on at least an annual basis. Single family residential loans are subject to an annual credit score refresh. On an ongoing basis, we also monitor payment performance, delinquencies, and tax and property insurance compliance.
49
We believe our practices facilitate the early detection and remediation of problems within our loan portfolio. Assigned risk ratings, as well as the evaluation of other credit metrics, are an integral part of management assessing the adequacy of our allowance for loan losses. We periodically employ the use of an outside independent consulting firm to evaluate our underwriting and risk assessment process. Like other financial institutions, we are subject to the risk that our loan portfolio will be exposed to increasing pressures from deteriorating borrower credit due to general economic conditions.
Nonperforming assets. Our nonperforming assets consist of nonperforming loans and foreclosed real estate, if any. It is our policy to place a loan on non-accrual status in the event that the borrower is 90 days or more delinquent, unless the loan is well secured and in the process of collection, or earlier if the timely collection of contractual payments appears doubtful. Cash payments subsequently received on non-accrual loans are recognized as income only where the future collection of the remaining principal is considered by management to be probable. Loans are restored to accrual status only when the loan is less than 90 days delinquent and not in foreclosure, and the borrower has demonstrated the ability to make future payments of principal and interest.
Troubled debt restructures. Loans for which the terms have been modified resulting in a concession, and for which the borrower is experiencing financial difficulties, are considered troubled debt restructurings ("TDRs"). Concessions could include reductions of interest rates, extension of the maturity date at a rate lower than current market rate for a new loan with similar risk, reduction of accrued interest, principal forgiveness, forbearance, or other material modifications. The assessment of whether a borrower is experiencing or will likely experience financial difficulty and whether a concession has been granted is highly subjective in nature, and management’s judgment is required when determining whether a modification is classified as a TDR.
The following table provides details of our nonperforming and restructured assets as of the dates presented and certain other related information:
As of December 31, | |||||||||||||||||||||
(Dollars in thousands) | 2019 | 2018 | 2017 | 2016 | 2015 | ||||||||||||||||
Non-accrual loans | |||||||||||||||||||||
Multifamily residential portfolio | $ | 541 | $ | 564 | $ | 2,250 | $ | 1,054 | $ | 1,155 | |||||||||||
Single family residential portfolio | 5,792 | 1,448 | 4,016 | 421 | 1,330 | ||||||||||||||||
Commercial real estate | — | — | 656 | 1,185 | 3,936 | ||||||||||||||||
Construction and land | — | — | — | — | — | ||||||||||||||||
Non-mortgage | — | — | — | — | — | ||||||||||||||||
Total non-accrual loans | 6,333 | 2,012 | 6,922 | 2,660 | 6,421 | ||||||||||||||||
Real estate owned | — | — | — | — | — | ||||||||||||||||
Total nonperforming assets | $ | 6,333 | $ | 2,012 | $ | 6,922 | $ | 2,660 | $ | 6,421 | |||||||||||
Performing troubled debt restructurings | $ | 1,305 | $ | 4,434 | $ | 4,857 | $ | 6,352 | $ | 10,178 | |||||||||||
Allowance for loan losses to period end nonperforming loans | 568.47 | % | 1705.47 | % | 437.91 | % | 1251.80 | % | 708.75 | % | |||||||||||
Nonperforming loans to period end loans | 0.10 | % | 0.03 | % | 0.14 | % | 0.06 | % | 0.17 | % | |||||||||||
Nonperforming assets to total assets | 0.09 | % | 0.03 | % | 0.12 | % | 0.05 | % | 0.15 | % | |||||||||||
Nonperforming loans plus performing TDRs to total loans | 0.12 | % | 0.11 | % | 0.23 | % | 0.20 | % | 0.43 | % | |||||||||||
When assessing whether a loan should be placed on non-accrual status because contractual payments appear doubtful, consideration is given to information we collect from third parties and our borrowers to substantiate their future ability to repay principal and interest due on their loans as contractually agreed.
For the year ended December 31, 2019, $102 thousand in interest income was recognized on non-accrual loans subsequent to their classification as non-accrual. For the year ended December 31, 2018, no interest income was recognized on non-accrual loans. For the years ended December 31, 2019 and 2018, the Company recorded $162 thousand and $196 thousand, respectively, of interest income related to performing TDR loans. Gross interest income that would have been recorded on non-accrual loans had they been current in accordance with their original terms was $302 thousand and $230 thousand for the years ended December 31, 2019 and 2018, respectively.
50
Potential Problem Loans. We utilize a risk grading system for our loans to aid us in evaluating the overall credit quality of our real estate loan portfolio and assessing the adequacy of our allowance for loan losses. All loans are categorized into a risk category at the time of origination. Multifamily and commercial credits are re-evaluated at least annually for proper classification in conjunction with our review of property and borrower financial information while all loans are re-evaluated for proper risk grading as new information such as payment patterns, collateral condition and other relevant information comes to our attention. We use the following industry accepted definitions for risk ratings.
• | Pass: Assets are performing according to contract and have no existing or known weaknesses deserving of management’s close attention. The basic underwriting criteria used to approve the loan is still valid and all payments have essentially been made as planned. |
• | Watch: Assets are expected to have an event occurring in the next 90 to 120 days that will lead to a change in risk rating with the change being either favorable or unfavorable. These assets require heightened monitoring of the event by management. |
• | Special mention: Assets have potential weaknesses that deserve management’s close attention. If left uncorrected, these potential weaknesses may result in deterioration of the repayment prospects for the asset or in our credit position at some future date. Special mention assets are not adversely classified and do not expose us to sufficient risk to warrant adverse classification. |
• | Substandard: Assets are inadequately protected by the current net worth and/or paying capacity of the obligor or by the collateral pledged. These assets have well-defined weaknesses: the primary source of repayment is gone or severely impaired (i.e., bankruptcy or loss of employment) and/or there has been a deterioration in collateral value. In addition, there is the distinct possibility that we will sustain some loss, either directly or indirectly (i.e., the cost of monitoring), if the deficiencies are not corrected. Deterioration in collateral value alone does not mandate that an asset be adversely classified if such factor does not indicate that the primary source of repayment is in jeopardy. |
• | Doubtful: Assets have the weaknesses of those classified substandard with the added characteristic that the weaknesses make collection or liquidation in full highly questionable and improbable based on current facts, conditions and values. |
• | Loss: Assets are considered uncollectible and of such little value that its continuance as an asset, without establishment of a specific valuation allowance or charge-off, is not warranted. This classification does not necessarily mean that an asset has absolutely no recovery or salvage value; but rather, it is not practical or desirable to defer writing off a basically worthless asset (or portion thereof) even though partial recovery may be achieved in the future. |
51
The banking industry defines loans graded Special Mention or higher risk as ‘‘criticized’’ and loans graded Substandard or greater risk as ‘‘classified’’ loans. The following table shows our level of criticized and classified loans as of the periods indicated:
(Dollars in thousands) | Special Mention | Substandard | Doubtful | Loss | Total Criticized | Total Classified | ||||||||||||
As of December 31, 2019: | ||||||||||||||||||
Multifamily residential | $ | 19,708 | $ | 1,700 | $ | — | $ | — | $ | 21,408 | $ | 1,700 | ||||||
Single family residential | 13,635 | 8,808 | 1,600 | — | 24,043 | 10,408 | ||||||||||||
Commercial real estate | — | — | — | — | — | — | ||||||||||||
Construction and land | — | — | — | — | — | — | ||||||||||||
Non-mortgage | — | — | — | — | — | — | ||||||||||||
Total | $ | 33,343 | $ | 10,508 | $ | 1,600 | $ | — | $ | 45,451 | $ | 12,108 | ||||||
Classified loans to period end loans | 0.20 | % | ||||||||||||||||
As of December 31, 2018: | ||||||||||||||||||
Multifamily residential | $ | 2,631 | $ | 1,937 | $ | — | $ | — | $ | 4,568 | $ | 1,937 | ||||||
Single family residential | 380 | 5,532 | — | — | 5,912 | 5,532 | ||||||||||||
Commercial real estate | 1,489 | — | — | — | 1,489 | — | ||||||||||||
Construction and land | 2,537 | — | — | — | 2,537 | — | ||||||||||||
Non-mortgage | — | — | — | — | — | — | ||||||||||||
Total | $ | 7,037 | $ | 7,469 | $ | — | $ | — | $ | 14,506 | $ | 7,469 | ||||||
Classified loans to period end loans | 0.12 | % | ||||||||||||||||
As of December 31, 2017: | ||||||||||||||||||
Multifamily residential | $ | 6,621 | $ | 7,799 | $ | — | $ | — | $ | 14,420 | $ | 7,799 | ||||||
Single family residential | 9,106 | 4,276 | — | — | 13,382 | 4,276 | ||||||||||||
Commercial real estate | — | 1,638 | — | — | 1,638 | 1,638 | ||||||||||||
Construction and land | — | — | — | — | — | — | ||||||||||||
Non-mortgage | — | — | — | — | — | — | ||||||||||||
Total | $ | 15,727 | $ | 13,713 | $ | — | $ | — | $ | 29,440 | $ | 13,713 | ||||||
Classified loans to period end loans | 0.27 | % | ||||||||||||||||
As of December 31, 2016: | ||||||||||||||||||
Multifamily residential | $ | 4,698 | $ | 11,120 | $ | — | $ | — | $ | 15,818 | $ | 11,120 | ||||||
Single family residential | 420 | 5,871 | — | — | 6,291 | 5,871 | ||||||||||||
Commercial real estate | — | 4,324 | — | — | 4,324 | 4,324 | ||||||||||||
Construction and land | — | — | — | — | — | — | ||||||||||||
Non-mortgage | — | — | — | — | — | — | ||||||||||||
Total | $ | 5,118 | $ | 21,315 | $ | — | $ | — | $ | 26,433 | $ | 21,315 | ||||||
Classified loans to period end loans | 0.48 | % | ||||||||||||||||
As of December 31, 2015: | ||||||||||||||||||
Multifamily residential | $ | 33,299 | $ | 16,777 | $ | — | $ | — | $ | 50,076 | $ | 16,777 | ||||||
Single family residential | 4,500 | 5,561 | — | — | 10,061 | 5,561 | ||||||||||||
Commercial real estate | 6,697 | 7,597 | — | — | 14,294 | 7,597 | ||||||||||||
Construction and land | — | — | — | — | — | — | ||||||||||||
Non-mortgage | — | — | — | — | — | — | ||||||||||||
Total | $ | 44,496 | $ | 29,935 | $ | — | $ | — | $ | 74,431 | $ | 29,935 | ||||||
Classified loans to period end loans | 0.78 | % | ||||||||||||||||
Potential problem loans represent loans that are currently performing but as to which there is information known to us about possible credit problems that may result in disclosure of such loans as nonperforming at some time in the future. We define ‘‘potential problem loans’’ as loans with a risk rating of ‘‘Substandard’’, ‘‘Doubtful’’ or ‘‘Loss’’ that are not included in the amounts of non-accrual or restructured loans. As we cannot predict all circumstances that may cause our borrowers to default, there can be no assurance that these loans will not be placed on non-accrual status or become
52
restructured. At December 31, 2019 and 2018, we have identified potential problem loans totaling $5.8 million and $5.4 million, respectively, that were all classified as ‘‘Substandard’’.
Allowance for loan losses. Our allowance for loan losses is maintained at a level management believes is adequate to account for probable incurred credit losses in the loan portfolio as of the reporting date. We determine the allowance based on a quarterly evaluation of risk. That evaluation gives consideration to the nature of the loan portfolio, historical loss experience, known and inherent risks in the portfolio, the estimated value of any underlying collateral, adverse situations that may affect a borrower’s ability to repay, current economic and environmental conditions and risk assessments assigned to each loan as a result of our ongoing reviews of the loan portfolio. This process involves a considerable degree of judgment and subjectivity. In addition, various regulatory agencies, as an integral part of their examination process, periodically review the Bank’s allowance. Such agencies may require the Bank to recognize additions to the allowance based on judgments different from those of management.
Our allowance is established through charges to the provision for loan losses. Loans, or portions of loans, deemed to be uncollectible are charged against the allowance. Recoveries of previously charged-off amounts are credited to our allowance for loan losses. The allowance is decreased by the reversal of prior provisions when the total allowance balance is deemed excessive for the risks inherent in the portfolio. The allowance for loan losses balance is neither indicative of the specific amounts of future charge-offs that may occur, nor is it an indicator of any future loss trends. While the entire allowance is available to absorb losses from any and all loans, the following tables represent management’s allocation of our allowance for loan losses by loan category, and the percentage of loans in each category to total loans, for the periods indicated:
As of December 31, | ||||||||||||||||||||||||||||||||||
2019 | 2018 | 2017 | 2016 | 2015 | ||||||||||||||||||||||||||||||
(Dollars in thousands) | Allowance for Loan Losses | % of Loans in Each Category | Allowance for Loan Losses | % of Loans in Each Category | Allowance for Loan Losses | % of Loans in Each Category | Allowance for Loan Losses | % of Loans in Each Category | Allowance for Loan Losses | % of Loans in Each Category | ||||||||||||||||||||||||
Multifamily residential | $ | 23,372 | 64.1 | % | $ | 21,326 | 60.1 | % | $ | 18,588 | 57.7 | % | $ | 18,478 | 59.0 | % | $ | 29,683 | 60.1 | % | ||||||||||||||
Single family residential | 10,076 | 32.3 | % | 10,125 | 36.7 | % | 9,044 | 39.2 | % | 11,559 | 38.9 | % | 13,261 | 37.9 | % | |||||||||||||||||||
Commercial real estate | 2,341 | 3.3 | % | 2,441 | 3.0 | % | 1,734 | 2.3 | % | 1,823 | 1.4 | % | 2,320 | 1.4 | % | |||||||||||||||||||
Construction and land | 192 | 0.3 | % | 402 | 0.2 | % | 936 | 0.8 | % | 1,428 | 0.7 | % | 245 | 0.6 | % | |||||||||||||||||||
Non-mortgage | 20 | — | % | 20 | — | % | 10 | — | % | 10 | — | % | — | — | % | |||||||||||||||||||
Total | $ | 36,001 | 100.0 | % | $ | 34,314 | 100.0 | % | $ | 30,312 | 100.0 | % | $ | 33,298 | 100.0 | % | $ | 45,509 | 100.0 | % | ||||||||||||||
53
The following table provides information on the activity within the allowance for loan losses as of and for the periods indicated:
Years Ended December 31, | |||||||||||||||||||||
(Dollars in thousands) | 2019 | 2018 | 2017 | 2016 | 2015 | ||||||||||||||||
Allowance for loan losses at beginning of period | $ | 34,314 | $ | 30,312 | $ | 33,298 | $ | 45,509 | $ | 52,508 | |||||||||||
Charge-offs: | |||||||||||||||||||||
Single family residential | — | — | (5 | ) | — | (1 | ) | ||||||||||||||
Commercial real estate | — | — | — | (90 | ) | (150 | ) | ||||||||||||||
Total charge-offs | — | — | (5 | ) | (90 | ) | (151 | ) | |||||||||||||
Recoveries: | |||||||||||||||||||||
Single family residential | 12 | 12 | 12 | 12 | 23 | ||||||||||||||||
Commercial real estate | — | 90 | — | — | 150 | ||||||||||||||||
Construction and land | 425 | 300 | 379 | 570 | 120 | ||||||||||||||||
Total recoveries | 437 | 402 | 391 | 582 | 293 | ||||||||||||||||
Net recoveries | 437 | 402 | 386 | 492 | 142 | ||||||||||||||||
Provision for (reversal of) loan losses | 1,250 | 3,600 | (3,372 | ) | (12,703 | ) | (7,141 | ) | |||||||||||||
Allowance for loan losses at period end | $ | 36,001 | $ | 34,314 | $ | 30,312 | $ | 33,298 | $ | 45,509 | |||||||||||
Allowance for loan losses to period end loans held-for-investment | 0.58 | % | 0.56 | % | 0.60 | % | 0.75 | % | 1.18 | % | |||||||||||
Annualized net recoveries to average loans | 0.01 | % | 0.01 | % | 0.01 | % | 0.01 | % | 0.00 | % | |||||||||||
Investment Portfolio
Our investment portfolio is generally comprised of government agency securities which are high-quality liquid investments under Basel III. The portfolio is primarily maintained to serve as a contingent, on-balance sheet source of liquidity and as such, is kept unencumbered. We manage our investment portfolio according to written investment policies approved by our board of directors. Our investment strategy aims to maximize earnings while maintaining liquidity in securities with minimal credit risk and interest rate risk which is reflective in the yields obtained on those securities. Most of our securities are classified as available for sale, although we occasionally purchase long-term fixed rate mortgage backed securities or municipal securities for community reinvestment purposes and classify those as held to maturity. In addition, we have equity securities which consist of investments in the CRA Qualified Investment Fund.
54
The following table presents the book value of our investment portfolio as of the dates indicated:
As of | As of | |||||||||||||
December 31, 2019 | December 31, 2018 | |||||||||||||
(Dollars in thousands) | Book Value | % of Total | Book Value | % of Total | ||||||||||
Available for sale debt securities (at fair value): | ||||||||||||||
Government and Government Sponsored Entities: | ||||||||||||||
Residential mortgage backed securities ('MBS") and collateralized mortgage obligations ("CMOs") | $ | 145,192 | 22.44 | % | $ | 192,113 | 30.41 | % | ||||||
Commercial MBS and CMOs | 356,169 | 55.05 | % | 292,951 | 46.37 | % | ||||||||
Agency bonds | 123,713 | 19.12 | % | 122,488 | 19.39 | % | ||||||||
U.S. Treasury | — | — | % | 976 | 0.15 | % | ||||||||
Total available for sale debt securities | 625,074 | 96.61 | % | 608,528 | 96.32 | % | ||||||||
Held to maturity (at amortized cost): | ||||||||||||||
Government Sponsored Entities: | ||||||||||||||
Residential MBS | 10,087 | 1.56 | % | 11,593 | 1.83 | % | ||||||||
Other investments | 83 | 0.01 | % | 267 | 0.04 | % | ||||||||
Total held to maturity debt securities | 10,170 | 1.57 | % | 11,860 | 1.87 | % | ||||||||
Equity securities (at fair value) | 11,782 | 1.82 | % | 11,438 | 1.81 | % | ||||||||
Total investment securities | $ | 647,026 | 100.00 | % | $ | 631,826 | 100.00 | % | ||||||
The following table presents the book value of our investment portfolio by their stated maturities, as well as the weighted average yields for each maturity range at December 31, 2019:
Due in one year or less | Due after one year through five years | Due after five years through ten years | Due after ten years | Equity securities | Total | ||||||||||||||||||||||||||||||
(Dollars in thousands) | Book Value | Weighted average yield | Book Value | Weighted average yield | Book Value | Weighted average yield | Book Value | Weighted average yield | Book Value | Weighted average yield | Book Value | Weighted average yield | |||||||||||||||||||||||
Available for sale: | |||||||||||||||||||||||||||||||||||
Government and Government Sponsored Entities: | |||||||||||||||||||||||||||||||||||
Residential MBS and CMOs | $ | 927 | 2.16 | % | $ | 28 | 2.97 | % | $ | 650 | 2.29 | % | $ | 143,587 | 2.71 | % | $ | — | — | % | $ | 145,192 | 2.70 | % | |||||||||||
Commercial MBS and CMOs | — | — | % | — | — | % | 86,342 | 2.22 | % | 269,827 | 2.71 | % | — | — | % | 356,169 | 2.59 | % | |||||||||||||||||
Agency bonds | 29,986 | 1.46 | % | 77,106 | 1.57 | % | 4,104 | 2.50 | % | 12,517 | 2.50 | % | — | — | % | 123,713 | 1.67 | % | |||||||||||||||||
Held to maturity: | |||||||||||||||||||||||||||||||||||
Government Sponsored Entities: | |||||||||||||||||||||||||||||||||||
Residential MBS | — | — | % | — | — | % | — | % | 10,087 | 3.47 | % | — | — | % | 10,087 | 3.47 | % | ||||||||||||||||||
Other investments | — | — | % | — | — | % | 83 | 3.88 | % | — | — | % | — | — | % | 83 | 3.88 | % | |||||||||||||||||
Equity Securities | — | — | % | — | — | % | — | — | % | — | — | % | 11,782 | 2.29 | % | 11,782 | 2.29 | % | |||||||||||||||||
Total | $ | 30,913 | 1.48 | % | $ | 77,134 | 1.57 | % | $ | 91,179 | 2.23 | % | $ | 436,018 | 2.72 | % | $ | 11,782 | 2.29 | % | $ | 647,026 | 2.45 | % | |||||||||||
55
The following table presents the fair value of our securities as of the dates indicated:
(Dollars in thousands) | Amortized Cost | Gross Unrealized Gains | Gross Unrealized Losses | Fair Value | |||||||||||
As of December 31, 2019 | |||||||||||||||
Available for sale (at fair value): | |||||||||||||||
Government and Government Sponsored Entities: | |||||||||||||||
Residential MBS and CMOs | $ | 145,333 | $ | 340 | $ | (481 | ) | $ | 145,192 | ||||||
Commercial MBS and CMOs | 353,727 | 3,267 | (825 | ) | 356,169 | ||||||||||
Agency bonds | 123,977 | 59 | (323 | ) | 123,713 | ||||||||||
Total available for sale | 623,037 | 3,666 | (1,629 | ) | 625,074 | ||||||||||
Held to maturity (at amortized cost): | |||||||||||||||
Government Sponsored Entities: | |||||||||||||||
Residential MBS | 10,087 | 205 | (26 | ) | 10,266 | ||||||||||
Other investments | 83 | — | — | 83 | |||||||||||
Total held to maturity | 10,170 | 205 | (26 | ) | 10,349 | ||||||||||
Equity securities (at fair value) | 11,782 | — | — | 11,782 | |||||||||||
Total investment securities | $ | 644,989 | $ | 3,871 | $ | (1,655 | ) | $ | 647,205 | ||||||
As of December 31, 2018 | |||||||||||||||
Available for sale (at fair value): | |||||||||||||||
Government and Government Sponsored Entities: | |||||||||||||||
Residential MBS and CMOs | $ | 194,297 | $ | 339 | $ | (2,523 | ) | $ | 192,113 | ||||||
Commercial MBS and CMOs | 294,276 | 979 | (2,304 | ) | 292,951 | ||||||||||
Agency bonds | 125,329 | 7 | (2,848 | ) | 122,488 | ||||||||||
U.S. Treasury | 1,008 | — | (32 | ) | 976 | ||||||||||
Total available for sale | 614,910 | 1,325 | (7,707 | ) | 608,528 | ||||||||||
Held to maturity (at amortized cost): | |||||||||||||||
Government Sponsored Entities: | |||||||||||||||
Residential MBS | 11,593 | 27 | (262 | ) | 11,358 | ||||||||||
Other investments | 267 | — | — | 267 | |||||||||||
Total held to maturity | 11,860 | 27 | (262 | ) | 11,625 | ||||||||||
Equity securities (at fair value) | 12,000 | — | (562 | ) | 11,438 | ||||||||||
Total investment securities | $ | 638,770 | $ | 1,352 | $ | (8,531 | ) | $ | 631,591 | ||||||
The unrealized losses on securities are attributed to interest rate changes rather than the marketability of the securities or the issuer’s ability to honor redemption of the obligations, as the securities with losses are primarily obligations of or guaranteed by agencies sponsored by the U.S. government. We have adequate liquidity with the ability and intent to hold these securities to maturity resulting in full recovery of the indicated impairment. Accordingly, none of the unrealized losses on these securities have been determined to be other than temporary.
At December 31, 2019, there was no issuer, other than U.S. government agencies, where the aggregate book value or market value of such issuer’s securities held by the Company exceeded 10% of our stockholders’ equity. At December 31, 2019 and 2018, the average estimated remaining life of our available for sale investment portfolio was 5.25 and 5.30 years, respectively.
Liabilities
Total liabilities increased $75.3 million, or 1.2%, and were $6.4 billion at both December 31, 2019 and 2018. The increase in total liabilities was primarily attributable to growth in our deposits of $233.7 million, or 4.7%, partially offset by a decrease in FHLB advances of $164.4 million, or 14.4%, compared to December 31, 2018.
56
Deposits
Representing 81.4% of our total liabilities as of December 31, 2019, deposits are our primary source of funding for our business operations. We have historically maintained and grown our deposit customer base in various rate environments based on our strong customer relationships, evidenced in part by increased deposits over recent years, as well as our reputation as a safe, sound, secure, "well-capitalized" institution and our commitment to excellent customer service. We are focused on growing our deposits by deepening our relationships with our existing loan and deposit customers and looking to expand our traditional product footprint with newer emphasis placed on specialty/business affiliations and transactional deposits. When competitively priced and/or for asset liability management purposes, we will supplement our deposits with wholesale deposits from deposit brokers.
Total deposits increased by $233.7 million, or 4.7%, to $5.2 billion at December 31, 2019 from $5.0 billion at December 31, 2018. Retail deposits increased $285.2 million, while wholesale deposits decreased $51.5 million. We intentionally permitted wholesale deposits to decline during the current year as we removed excess liquidity from our balance sheet. Time deposits represent 67.4% and 65.9% of total deposits at December 31, 2019 and 2018, respectively. We consider approximately 72% of our retail deposits at December 31, 2019 to be core deposits based on our internal methodology, which gives consideration to the tenure of customer relationships, product penetration and the relative cost of the deposit accounts.
Our loan to deposit ratio was 119% and 123% at December 31, 2019 and 2018, respectively. It is common for us to operate with a loan to deposit ratio exceeding those commonly seen at other banks. Our higher than average ratio is attributed to our use of FHLB borrowings to supplement loan growth, as well as our preference to maintain a large proportion of our assets in real estate loans which generally provide a better yield than high-quality liquid investments.
The following table summarizes our deposit composition by average deposits and average rates paid for the periods indicated:
December 31, 2019 | December 31, 2018 | ||||||||||||||||||
(Dollars in thousands) | Average Amount | Weighted average rate paid | Percent of total deposits | Average Amount | Weighted average rate paid | Percent of total deposits | |||||||||||||
Noninterest-bearing deposit accounts | $ | 41,821 | — | % | 0.8 | % | $ | 51,152 | — | % | 1.1 | % | |||||||
Interest-bearing transaction accounts | 210,743 | 1.26 | % | 4.1 | % | 176,725 | 0.86 | % | 3.9 | % | |||||||||
Money market demand accounts | 1,402,608 | 1.28 | % | 27.0 | % | 1,464,952 | 1.01 | % | 32.1 | % | |||||||||
Time deposits | 3,538,223 | 2.35 | % | 68.1 | % | 2,863,852 | 1.81 | % | 62.9 | % | |||||||||
Total | $ | 5,193,395 | 2.00 | % | 100.0 | % | $ | 4,556,681 | 1.51 | % | 100.0 | % | |||||||
The following table sets forth the maturity of time deposits as of December 31, 2019:
(Dollars in thousands, except for column headings) | Under $100,000 | $100,000 and greater | ||||||
Remaining maturity: | ||||||||
Three months or less | $ | 552,557 | $ | 691,217 | ||||
Over three through six months | 173,290 | 984,998 | ||||||
Over six through twelve months | 106,710 | 583,988 | ||||||
Over twelve months | 69,019 | 364,909 | ||||||
Total | $ | 901,576 | $ | 2,625,112 | ||||
Percent of total deposits | 17.22 | % | 50.15 | % | ||||
The Company had time deposits that met or exceeded the FDIC Insurance limit of $250 thousand of $1.4 billion and $1.2 billion at December 31, 2019 and 2018, respectively. At the same dates, the Company had $416.0 million and $467.5 million, respectively, of brokered deposits.
FHLB Advances and Other Borrowings
In addition to deposits, we utilize collateralized FHLB borrowings to fund our loan growth. FHLB advances can, at times, have attractive rates and we have commonly used them to strategically extend the duration of our liabilities as
57
part of our interest rate risk management. Total FHLB advances decreased $164.4 million, or 14.4%, to $978.7 million at December 31, 2019 compared to $1.1 billion at December 31, 2018. At both December 31, 2019 and 2018, the Bank had FHLB letters of credit outstanding totaling $62.6 million related to a reimbursement obligation to Freddie Mac in connection with the Bank's multifamily securitization transaction. Refer above to "Factors Affecting Comparability of Financial Results - Multifamily Securitization Transaction" for additional information regarding the securitization.
Historically, we have utilized other instruments such as trust preferred securities and senior debt at the bank holding company level as a source of capital for our Bank to support asset growth. We have established two trusts (the "Trusts") of which we own all the common securities, that have issued trust preferred securities ("Trust Securities"), to investors in private placement transactions. The proceeds of the securities qualify as Tier 1 capital under the final Dodd Frank regulations for community banks with total assets less than $15 billion. In accordance with GAAP, the Trusts are not consolidated in our consolidated statements of financial condition but rather the common securities are included in our other assets and the junior subordinated debentures ("Notes") issued to the Trusts are shown as a liability. The following table is a summary of our outstanding Trust Securities and related Notes as of the dates indicated (dollars in thousands):
December 31, 2019 | December 31, 2018 | Date | Maturity | Rate Index | ||||||||||||||||
Issuer | Amount | Rate | Amount | Rate | Issued | Date | (Quarterly Reset) | |||||||||||||
Luther Burbank Statutory Trust I | $ | 41,238 | 3.27 | % | $ | 41,238 | 4.17 | % | 3/1/2006 | 6/15/2036 | 3 month LIBOR + 1.38% | |||||||||
Luther Burbank Statutory Trust II | $ | 20,619 | 3.51 | % | $ | 20,619 | 4.41 | % | 3/1/2007 | 6/15/2037 | 3 month LIBOR + 1.62% | |||||||||
We have the right to defer payment of interest on the Notes at any time or from time to time for a period not exceeding five years provided that no extension period may extend beyond the stated maturity of the relevant Note. During any such extension period, distributions on the Trust Securities will also be deferred, and our ability to pay dividends on our common stock will be restricted.
We have entered into contractual arrangements which, taken collectively, fully and unconditionally guarantee payment of: (i) accrued and unpaid distributions required to be paid on the Trust Securities; (ii) the redemption price with respect to any Trust Securities called for redemption by the Trusts; and (iii) payments due upon a voluntary or involuntary dissolution, winding up or liquidation of the Trusts. The Trust Securities are mandatorily redeemable upon maturity of the Notes, or upon earlier redemption as provided in the indenture. We have the right to redeem the Notes purchased by the Trusts, in whole or in part, on or after the redemption date. As specified in the indenture, if the Notes are redeemed prior to maturity, the redemption price will be the principal amount and any accrued but unpaid interest.
In 2014, we issued senior debt totaling $95.0 million to qualified institutional investors. These senior notes are unsecured, carry a fixed interest coupon of 6.5%, pay interest only on a quarterly basis and mature on September 30, 2024. The senior debt is redeemable at any time prior to August 31, 2024, at a redemption price equal to the greater of (i) 100% of the principal amount, or (ii) the sum of the present values of the remaining scheduled payments of principal and interest thereon discounted to the redemption date on a semi-annual basis at the calculated rate for a U. S. Treasury security having a comparable remaining maturity plus 30 basis points, plus in each case accrued and unpaid interest. On or after September 1, 2024, the senior debt may be redeemed at 100% of the principal amount plus accrued and unpaid interest.
58
The following table presents information regarding our FHLB advances and other borrowings as of and for the periods indicated:
As of and for the Years Ended December 31, | ||||||||
(Dollars in thousands) | 2019 | 2018 | ||||||
FHLB advances | ||||||||
Average amount outstanding during the period | $ | 1,056,557 | $ | 1,069,216 | ||||
Maximum amount outstanding at any month-end during the period | 1,186,827 | 1,366,851 | ||||||
Balance outstanding at end of period | 978,702 | 1,143,132 | ||||||
Weighted average maturity (in years) | 2.3 | 2.2 | ||||||
Weighted average interest rate at end of period | 2.30 | % | 2.37 | % | ||||
Weighted average interest rate during the period | 2.36 | % | 2.18 | % | ||||
Junior subordinated deferrable interest debentures | ||||||||
Balance outstanding at end of period | $ | 61,857 | $ | 61,857 | ||||
Weighted average maturity (in years) | 17.0 | 18.1 | ||||||
Weighted average interest rate at end of period | 3.35 | % | 4.25 | % | ||||
Weighted average interest rate during the period | 3.96 | % | 3.66 | % | ||||
Senior unsecured term notes | ||||||||
Balance outstanding at end of period | $ | 94,416 | $ | 94,293 | ||||
Weighted average maturity (in years) | 4.8 | 5.8 | ||||||
Weighted average interest rate at end of period | 6.68 | % | 6.69 | % | ||||
Weighted average interest rate during the period | 6.68 | % | 6.69 | % | ||||
Our level of FHLB advances can fluctuate on a daily basis depending on our funding needs and the availability of other sources of funds to satisfy those needs. Short-term advances allow us flexibility in funding our daily liquidity needs.
The following table sets forth the amount of short-term borrowings outstanding, comprised entirely of FHLB advances, as well as the weighted average interest rate thereon, as of the dates indicated:
As of and for the Years Ended December 31, | ||||||||
(Dollars in thousands) | 2019 | 2018 | ||||||
Outstanding at period end | $ | 1,500 | $ | 166,000 | ||||
Average amount outstanding | 51,800 | 221,135 | ||||||
Maximum amount outstanding at any month end | 209,700 | 495,700 | ||||||
Weighted average interest rate: | ||||||||
During period | 2.52 | % | 1.76 | % | ||||
End of period | 1.66 | % | 2.57 | % | ||||
Stockholders’ Equity
Stockholders’ equity totaled $614.5 million and $581.1 million at December 31, 2019 and 2018, respectively. The $33.3 million, or 5.7%, increase in stockholders' equity is primarily related to net income of $48.9 million and increases in unrealized gains, net of taxes, of $6.1 million, less dividends paid of $13.1 million and stock repurchases of $8.8 million during the year ended December 31, 2019.
During the year ended December 31, 2019, the Company repurchased 870,701 shares, in connection with its stock repurchase program at an average price of $10.10 per share and a total cost of $8.8 million.
59
Off-Balance Sheet Arrangements
In the normal course of business, we enter into various transactions that are not included in our consolidated statements of financial condition in accordance with GAAP. These transactions include commitments to extend credit in the ordinary course of business including commitments to fund new loans and undisbursed construction funds, as well as certain guarantees and derivative transactions.
Loan commitments represent contractual cash requirements to a borrower although, a portion of these commitments to extend credit may expire without being drawn upon. Therefore, the total commitment amounts, shown below, do not necessarily represent future cash obligations. The following is a summary of our off-balance sheet commitments outstanding as of the dates presented.
December 31, | ||||||||
(Dollars in thousands) | 2019 | 2018 | ||||||
Commitments to fund loans held for investment | $ | 103,227 | $ | 70,858 | ||||
In connection with our Freddie Mac multifamily loan securitization in 2017, we entered into a reimbursement agreement pursuant to which we may be required to reimburse Freddie Mac for the first losses in the underlying loan portfolio, not to exceed 10% of the unpaid principal amount at settlement, or approximately $62.6 million. A $62.6 million letter of credit with the FHLB is pledged as collateral in connection with this reimbursement agreement. We have recorded a reserve for estimated losses with respect to the reimbursement obligation of $1.0 million and $1.4 million as of December 31, 2019 and 2018, respectively, which is included in other liabilities and accrued expenses on the consolidated statements of financial condition. Please refer above to "Factors Affecting Comparability of Financial Results - Multifamily Securitization Transaction" for additional information regarding the securitization.
During the year ended December 31, 2019, we entered into two, two-year swap agreements with an aggregate notional amount of $1.0 billion to hedge the interest rate risk related to certain hybrid multifamily loans which are currently in their fixed rate period. The swaps involve the payment of a fixed rate amount to a counterparty in exchange for the Company receiving a variable rate payment over the life of the swaps without the exchange of the underlying notional amounts.
We guarantee the distributions and payments for redemption or liquidation of the Trust Securities issued by the Trusts to the extent of funds held by the Trusts. Although this guarantee is not separately recorded, the obligation underlying the guarantee is fully reflected on our consolidated statements of financial condition as junior subordinated debentures held by the Trusts. The junior subordinated debentures currently qualify as Tier 1 capital under the Federal Reserve capital adequacy guidelines. With the exception of our obligations in connection with its Trust Securities and the items detailed above, we have no other off-balance sheet arrangements that have or are reasonably likely to have a current or future effect on our financial condition, changes in financial condition, revenues or expenses, results of operations, liquidity, capital expenditures, or capital resources, that is material to investors.
Contractual Obligations
The following table presents, as of December 31, 2019, our significant contractual obligations to third parties on debt and lease agreements and service obligations. For more information about our contractual obligations, see Part II, Item 8. "Financial Statements and Supplementary Data", Note 19. ‘‘Commitments and Contingencies,’’ in the notes to our consolidated financial statements.
60
Payments Due by Period | |||||||||||||||||||
Less than 1 Year | 1 to 3 Years | 3 to 5 Years | More than 5 Years | ||||||||||||||||
(Dollars in thousands) | Total | ||||||||||||||||||
Contractual Cash Obligations | |||||||||||||||||||
Time deposits (1) | $ | 3,526,688 | $ | 3,092,760 | $ | 429,041 | $ | 4,887 | $ | — | |||||||||
FHLB advances (1) | 978,702 | 51,500 | 525,700 | 400,750 | 752 | ||||||||||||||
Senior debt (1) | 95,000 | — | — | 95,000 | — | ||||||||||||||
Junior subordinated debentures (1) | 61,857 | — | — | — | 61,857 | ||||||||||||||
Operating leases | 18,495 | 4,442 | 7,911 | 3,531 | 2,611 | ||||||||||||||
Significant contract (2) | 2,461 | 1,802 | 659 | — | — | ||||||||||||||
Total | $ | 4,683,203 | $ | 3,150,504 | $ | 963,311 | $ | 504,168 | $ | 65,220 | |||||||||
(1) Amounts exclude interest | |||||||||||||||||||
(2) We have one significant, long-term contract for core processing services which expires May 9, 2021. The actual obligation is unknown and dependent on certain factors including volume and activities. For purposes of this disclosure, future obligations are estimated using our current year-to-date average monthly expense extrapolated over the remaining life of the contract. | |||||||||||||||||||
We believe that we will be able to meet our contractual obligations as they come due. Adequate cash levels are expected through profitability, repayments from loans and securities, deposit gathering activity, access to borrowing sources and periodic loan sales.
Liquidity Management and Capital Adequacy Liquidity Management
Liquidity refers to our capacity to meet our cash obligations at a reasonable cost. Our cash obligations require us to have cash flow that is adequate to fund loan growth and maintain on-balance sheet liquidity while meeting present and future obligations of deposit withdrawals, borrowing maturities and other contractual cash obligations. In managing our cash flows, management regularly confronts situations that can give rise to increased liquidity risk. These include funding mismatches, market constraints in accessing sources of funds and the ability to convert assets into cash. Changes in economic conditions or exposure to credit, market, operational, legal and reputational risks also could affect the Bank’s liquidity risk profile and are considered in the assessment of liquidity management.
We continually monitor our liquidity position to ensure that our assets and liabilities are managed in a manner to meet all reasonably foreseeable short-term, long-term and strategic liquidity demands. Management has established a comprehensive management process for identifying, measuring, monitoring and controlling liquidity risk. Because of its critical importance to the viability of the Bank, liquidity risk management is fully integrated into our risk management processes. Critical elements of our liquidity risk management include: effective corporate governance consisting of oversight by the board of directors and active involvement by management; appropriate strategies, policies, procedures, and limits used to manage and mitigate liquidity risk; comprehensive liquidity risk measurement and monitoring systems including stress tests that are commensurate with the complexity of our business activities; active management of intraday liquidity and collateral; an appropriately diverse mix of existing and potential future funding sources; adequate levels of highly liquid marketable securities free of legal, regulatory, or operational impediments, that can be used to meet liquidity needs in stressful situations; comprehensive contingency funding plans that sufficiently address potential adverse liquidity events and emergency cash flow requirements; and internal controls and internal audit processes sufficient to determine the adequacy of the Bank’s liquidity risk management process.
Our liquidity position is supported by management of our liquid assets and liabilities and access to alternative sources of funds. Our liquidity requirements are met primarily through our deposits, FHLB advances and the principal and interest payments we receive on loans and investment securities. Cash on hand, cash at third party banks, investments available for sale and maturing or prepaying balances in our investment and loan portfolios are our most liquid assets. Other sources of liquidity that are routinely available to us include funds from retail and wholesale deposits, advances from the FHLB and proceeds from the sale of loans. Less commonly used sources of funding include borrowings from the FRB discount window, draws on established federal funds lines from unaffiliated commercial banks and the issuance of debt or equity securities. We believe we have ample liquidity resources to fund future growth and meet other cash needs as necessary.
Our total deposits at December 31, 2019 and 2018 were $5.2 billion and $5.0 billion, respectively. Based on the values of loans pledged as collateral and our $978.7 million of FHLB advances outstanding, we had $878.2 million of additional
61
borrowing capacity with the FHLB at December 31, 2019. Based on the values of loans pledged as collateral, we had $181.4 million of borrowing capacity with the FRB at December 31, 2019. There were no outstanding advances with the FRB at December 31, 2019. In addition to the liquidity provided by the FHLB and FRB described above, we have established federal funds lines of credit with unaffiliated banks totaling $50.0 million at December 31, 2019, none of which was advanced at that date. In the ordinary course of business, we maintain correspondent bank accounts with unaffiliated banks which are used for normal business activity including ordering cash for our branch network, the purchase of investment securities and the receipt of principal and interest on those investments. Cash balances at correspondent banks, including amounts at the FRB, totaled $88.6 million at December 31, 2019.
The Company is a corporation separate and apart from our Bank and, therefore, must provide for its own liquidity, including liquidity required to meet its debt service requirements on its senior notes and junior subordinated debentures. The Company’s main source of cash flow is dividends declared and paid to it by the Bank. There are statutory and regulatory limitations that affect the ability of our Bank to pay dividends to the Company. We believe that these limitations will not impact our ability to meet our ongoing short-term cash obligations. For contingency purposes, the Company typically maintains a minimum level of cash to fund one year’s projected operating cash flow needs.
Capital Adequacy
We are subject to various regulatory capital requirements administered by federal and state banking regulators. Our capital management consists of providing equity to support our current operations and future growth. Failure to meet minimum regulatory capital requirements may result in mandatory and possible additional discretionary actions by regulators that, if undertaken, could have a direct material effect on our financial statements. Under capital adequacy guidelines and the regulatory framework for prompt corrective action, we must meet specific capital guidelines that involve quantitative measures of our assets, liabilities and off-balance sheet items as calculated under regulatory accounting policies. As of December 31, 2019 and 2018, we were in compliance with all applicable regulatory capital requirements, including the capital conservation buffer, and the Bank qualified as ‘‘well-capitalized’’ for purposes of the FDIC’s prompt corrective action regulations. At December 31, 2019, the capital conservation buffer was 2.5%.
The vast majority of our multifamily residential loans and single family residential loans are eligible for 50% risk-weighting for purposes of calculating our regulatory capital levels. To the extent that we increase our levels of commercial real estate lending collateralized by real estate other than multifamily residential properties, which loans would generally be 100% risk weighted, we would expect that our risk-based capital ratios would decline. Our leverage ratio is not impacted by the composition of our assets.
The following table presents our regulatory capital ratios as of the dates presented, as well as the regulatory capital ratios that are required by FDIC regulations to maintain ‘‘well-capitalized’’ status:
62
Minimum Required | |||||||||||||||||||||||
Actual | For Capital Adequacy Purposes | Plus Capital Conservation Buffer | For Well- Capitalized Institution | ||||||||||||||||||||
(Dollars in thousands) | Amount | Ratio | Amount | Ratio | Amount | Ratio | Amount | Ratio | |||||||||||||||
Luther Burbank Corporation | |||||||||||||||||||||||
As of December 31, 2019 | |||||||||||||||||||||||
Tier 1 Leverage Ratio | $ | 671,580 | 9.47 | % | $ | 283,631 | 4.00 | % | N/A | N/A | N/A | N/A | |||||||||||
Common Equity Tier 1 Risk-Based Ratio | 609,723 | 15.46 | % | 177,523 | 4.50 | % | $ | 276,147 | 7.00 | % | N/A | N/A | |||||||||||
Tier 1 Risk-Based Capital Ratio | 671,580 | 17.02 | % | 236,697 | 6.00 | % | 335,321 | 8.50 | % | N/A | N/A | ||||||||||||
Total Risk-Based Capital Ratio | 708,847 | 17.97 | % | 315,596 | 8.00 | % | 414,220 | 10.50 | % | N/A | N/A | ||||||||||||
As of December 31, 2018 | |||||||||||||||||||||||
Tier 1 Leverage Ratio | $ | 644,344 | 9.42 | % | $ | 273,544 | 4.00 | % | N/A | N/A | N/A | N/A | |||||||||||
Common Equity Tier 1 Risk-Based Ratio | 582,487 | 14.74 | % | 177,873 | 4.50 | % | $ | 251,986 | 6.38 | % | N/A | N/A | |||||||||||
Tier 1 Risk-Based Capital Ratio | 644,344 | 16.30 | % | 237,164 | 6.00 | % | 311,277 | 7.88 | % | N/A | N/A | ||||||||||||
Total Risk-Based Capital Ratio | 679,841 | 17.20 | % | 316,218 | 8.00 | % | 390,332 | 9.88 | % | N/A | N/A | ||||||||||||
Luther Burbank Savings | |||||||||||||||||||||||
As of December 31, 2019 | |||||||||||||||||||||||
Tier 1 Leverage Ratio | $ | 748,916 | 10.57 | % | $ | 283,542 | 4.00 | % | N/A | N/A | $ | 354,428 | 5.00 | % | |||||||||
Common Equity Tier 1 Risk-Based Ratio | 748,916 | 18.99 | % | 177,437 | 4.50 | % | $ | 276,012 | 7.00 | % | 256,297 | 6.50 | % | ||||||||||
Tier 1 Risk-Based Capital Ratio | 748,916 | 18.99 | % | 236,582 | 6.00 | % | 335,158 | 8.50 | % | 315,443 | 8.00 | % | |||||||||||
Total Risk-Based Capital Ratio | 786,183 | 19.94 | % | 315,443 | 8.00 | % | 414,019 | 10.50 | % | 394,303 | 10.00 | % | |||||||||||
As of December 31, 2018 | |||||||||||||||||||||||
Tier 1 Leverage Ratio | $ | 728,414 | 10.65 | % | $ | 273,469 | 4.00 | % | N/A | N/A | $ | 341,836 | 5.00 | % | |||||||||
Common Equity Tier 1 Risk-Based Ratio | 728,414 | 18.43 | % | 177,820 | 4.50 | % | $ | 251,912 | 6.38 | % | 256,851 | 6.50 | % | ||||||||||
Tier 1 Risk-Based Capital Ratio | 728,414 | 18.43 | % | 237,094 | 6.00 | % | 311,185 | 7.88 | % | 316,125 | 8.00 | % | |||||||||||
Total Risk-Based Capital Ratio | 763,911 | 19.33 | % | 316,125 | 8.00 | % | 390,217 | 9.88 | % | 395,156 | 10.00 | % | |||||||||||
Impact of Inflation and Changing Prices
Our consolidated financial statements and related notes have been prepared in accordance with GAAP, which require the measurement of financial position and operating results in terms of historical dollars, without considering the changes in the relative purchasing power of money over time due to inflation. The impact of inflation is reflected in the increased cost of operations. Unlike most industrial companies, nearly all of our assets and liabilities are monetary in nature. As a result, interest rates have a greater impact on our performance than do the effects of general levels of inflation. Interest rates do not necessarily move in the same direction or to the same extent as the price of goods or services.
Item 7A. Quantitative and Qualitative Disclosures About Market Risk
Market risk represents the exposure to unanticipated changes in net interest earnings or loss due to changes in the market value of assets and liabilities as a result of fluctuations in interest rates. As a financial institution, our primary market risk is interest rate risk. Interest rate risk is the risk to earnings and value arising from volatility in market interest rates. Interest rate risk arises from timing differences in the repricings and maturities of interest-earning assets and interest-bearing liabilities (reprice risk), changes in the expected maturities of assets and liabilities arising from embedded options, such as borrowers’ ability to prepay loans at any time and depositors’ ability to redeem certificates of deposit before maturity (option risk), changes in the shape of the yield curve where interest rates increase or decrease in a nonparallel fashion (yield curve risk), and changes in spread relationships between different yield curves, such as U.S. Treasuries and LIBOR (basis risk).
We manage market risk though our Asset Liability Council ("ALCO") which is comprised of senior management who are responsible for ensuring that board approved strategies, policy limits, and procedures for managing interest rate risk are appropriately executed within the designated lines of authority and responsibility. The ALCO meets monthly to review, among other things, the composition of our assets and liabilities, the sensitivity of our assets and liabilities to interest rate changes, our actual and forecasted liquidity position, investment activity and our interest rate hedging
63
transactions. The ALCO reports regularly to our board of directors. Our board reviews all policies impacting asset and liability management and establishes risk tolerance limits for business operations on at least an annual basis.
Interest rate risk management is an active process that encompasses monitoring loan and deposit flows complemented by investment and funding activities. Effective management of interest rate risk begins with understanding the dynamic characteristics of assets and liabilities and determining the appropriate interest rate risk posture given business forecasts, management objectives, market expectations, and policy constraints. In recognition of this, we actively manage our assets and liabilities to maximize our net interest income and return on equity, while managing our risk exposure and maintaining adequate liquidity and capital positions.
Given the nature of our loan and deposit activities, we are liability sensitive to volatility in interest rates. A liability sensitive position refers to a balance sheet position in which an increase in short-term interest rates is expected to generate lower net interest income, as rates paid on our interest-bearing liabilities would reprice upward more quickly than rates earned on our interest-earning assets, thus compressing our net interest margin. Conversely, an asset sensitive position refers to a balance sheet position in which an increase in short-term interest rates is expected to generate higher net interest income, as rates earned on our interest-earning assets would reprice upward more quickly than rates paid on our interest-bearing liabilities, thus expanding net interest margin.
We use two primary modeling techniques to assess our exposure to interest rates that simulate the earnings and valuation effects of variations in interest rates: Net Interest Income at Risk ("NII at Risk") and the Economic Value of Equity ("EVE"). These models require that we use numerous assumptions, including asset and liability pricing and repricing, future growth, prepayment rates, non-maturity deposit sensitivity and decay rates. These assumptions are inherently uncertain and, as a result, the models cannot precisely predict the fluctuations in market interest rates or precisely measure the impact of future changes in interest rates. Actual results will differ from the model’s simulated results due to timing, magnitude and frequency of interest rate changes, as well as changes in market conditions and the application and timing of various management strategies.
Stress testing the balance sheet and net interest income using instantaneous parallel shock movements in the yield curve of -200 to 400 basis points is a regulatory and banking industry practice. However, these stress tests may not represent a realistic forecast of future interest rate movements in the yield curve.
Instantaneous parallel interest rate shock modeling is not a predictor of actual future performance of earnings. It is a financial metric used to manage interest rate risk, implement hedging transactions if the metric rises above policy limits for interest rate risk, and track the movement of the bank’s interest rate risk position over a historical time frame for comparison purposes.
Our earnings are a function of collecting both a credit risk premium on our loans and an interest rate risk premium on our balance sheet position. The purpose of these premiums being to diversify our earnings position with both credit risk and interest rate risk, which tend to be negatively correlated historically for the Bank. During weak economic times, such as the financial crisis of 2007-2008, our loan losses are higher than normal, but the Federal Reserve will generally reduce short-term interest rates in an attempt to stimulate the economy and add liquidity. As a result, our interest rate spread will generally increase during those periods. During strong economic times, when the Federal Reserve raises short-term interest rates to dampen economic activity, the Bank’s interest rate spread decreases. These periods have historically been indicative of inflation and real property value increases. As such, the decrease in net interest income is typically somewhat offset by declining loan losses in our loan portfolio. There is no guarantee, however, that the past countercyclical nature of our loan losses and our net interest spread declines will continue in the future.
On a quarterly basis, we measure and report NII at Risk to isolate the change in income related solely to interest-earning assets and interest-bearing liabilities. The following table illustrates the results of our NII at Risk analysis to determine the extent to which our net interest income over the following 12 months would change if prevailing interest rates increased or decreased by the specified amounts at December 31, 2019. It models instantaneous parallel shifts in market interest rates, implied by the forward yield curve over the next one year period.
64
Interest Rate Risk to Earnings (NII) | |||||
December 31, 2019 | |||||
(Dollars in millions) | |||||
Change in Interest Rates (basis points) | $ Change NII | % Change NII | |||
+400 BP | $ | (19.1 | ) | (13.3 | )% |
+300 BP | (11.9 | ) | (8.3 | )% | |
+200 BP | (6.2 | ) | (4.3 | )% | |
+100 BP | (2.5 | ) | (1.7 | )% | |
-100 BP | 1.6 | 1.1 | % | ||
-200 BP | 1.5 | 1.0 | % | ||
The NII at Risk reported at December 31, 2019 reflects that our earnings are in a liability sensitive position in which an increase in interest rates is expected to generate lower net interest income. All NII stress tests measures were within our board established limits. During the year ended December 31, 2019, our NII at Risk declined due to the current interest rate environment, as well as our interest rate swaps and the extension in the duration of our FHLB borrowings.
EVE measures the period end market value of assets minus the market value of liabilities and the change in this value as rates change. The EVE results included in the table below reflect the analysis reviewed monthly by management. It models instantaneous parallel shifts in market interest rates, implied by the forward yield curve. The EVE model calculates the market value of capital by taking the present value of all asset cash flows less the present value of all liability cash flows.
Interest Rate Risk to Capital (EVE) | |||||
December 31, 2019 | |||||
(Dollars in millions) | |||||
Change in Interest Rates (basis points) | $ Change EVE | % Change EVE | |||
+400 BP | $ | (182.1 | ) | (25.9 | )% |
+300 BP | (108.8 | ) | (15.5 | )% | |
+200 BP | (55.4 | ) | (7.9 | )% | |
+100 BP | (21.0 | ) | (3.0 | )% | |
-100 BP | 28.0 | 4.0 | % | ||
-200 BP | 55.9 | 8.0 | % | ||
The EVE at Risk reported at December 31, 2019 reflects that our market value of capital is in a liability sensitive position in which an increase in interest rates is expected to generate lower market values of capital. All EVE stress tests measures were within our board established limits. During the year ended December 31, 2019, our EVE at Risk declined due to the current interest rate environment, as well as our interest rate swaps and the extension in the duration of our FHLB borrowings.
Certain shortcomings are inherent in the NII and EVE analyses presented above. Both the NII and EVE simulations include assumptions regarding balances, asset prepayment speeds, deposit repricing and runoff and interest rate relationships among balances that we believe to be reasonable for the various interest rate environments. Differences in actual occurrences from these assumptions, as well as nonparallel changes in the yield curve, may change our market risk exposure. Simulated results are not intended to be used as a forecast of the actual effect of changes in market interest rates on our results, but rather as a means to better plan and execute appropriate interest rate risk strategies.
Hedge Positions
In managing our market risk, our board of directors has authorized the ALCO to utilize interest rate caps and swaps to mitigate on-balance sheet interest rate risk in accordance with regulations and our internal policy. We use or expect to use interest rate caps and swaps as macro hedges against inherent rate sensitivity in our loan portfolio, other interest-earning assets and our interest-bearing liabilities. Positions for hedging purposes are undertaken as mitigation to exposure primarily from mismatches between assets and liabilities.
65
We typically utilize FHLB advances with embedded interest rate caps to hedge our liability sensitive interest rate risk position. The interest rate caps embedded in FHLB advances do not qualify as derivative contracts. The cost of these contracts is inseparable from the cost of the advances and, as such, is included in interest expense in our consolidated statements of income. In addition, during 2019, we entered into two, two-year interest rate swaps with a total notional amount of $1.0 billion to hedge the interest rate risk related to certain hybrid multifamily loans which are currently in their fixed rate period. The swaps are designated as fair value hedges and involve the payment of a fixed rate amount to a counterparty in exchange for the Company receiving a variable rate payment over the life of the swaps without the exchange of the underlying notional amount. The gain or loss on these derivatives, as well as the offsetting loss or gain on the hedged items attributable to the hedged risk are recognized in interest income for loans in our consolidated statements of income. During the year ended December 31, 2019, the Company recognized interest income of $2.1 million in connection with the swaps.
The following table summarizes FHLB borrowings with embedded caps and the derivative instruments utilized by us as interest rate risk hedge positions as of December 31, 2019:
(Dollars in thousands) | Fair Value | ||||||||||||||
Hedging Instrument | Hedge Accounting Type | Months to Maturity | Notional | Other Assets | Other Liabilities | ||||||||||
FHLB fixed rate advance | With embedded cap | 2 | $ | 50,000 | $ | — | $ | — | |||||||
FHLB fixed rate advance | With embedded cap | 14 | 100,000 | — | — | ||||||||||
FHLB fixed rate advance | With embedded cap | 14 | 50,000 | — | — | ||||||||||
Interest rate swap | Fair value hedge | 18 | 500,000 | — | 748 | ||||||||||
Interest rate swap | Fair value hedge | 20 | 500,000 | 1,243 | — | ||||||||||
$ | 1,200,000 | $ | 1,243 | $ | 748 | ||||||||||
Counterparty Credit Risk
Derivative contracts involve the risk of dealing with institutional derivative counterparties and their ability to meet contractual terms. Our policies require that counterparties must be approved by our ALCO. Additionally, contracts are in place to ensure that minimum transfer amounts and collateral requirements are established.
66
Item 8. Financial Statements and Supplementary Data
Table of Contents
Page | |
Consolidated Financial Statements: | |
67
Report of Independent Registered Public Accounting Firm
Shareholders and the Board of Directors of Luther Burbank Corporation and Subsidiaries
Santa Rosa, California
Opinion on the Financial Statements
We have audited the accompanying consolidated statements of financial condition of Luther Burbank Corporation and Subsidiaries (the "Company") as of December 31, 2019 and 2018, the related consolidated statements of income, comprehensive income, changes in stockholders’ equity, and cash flows for the years then ended, and the related notes (collectively referred to as the "financial statements"). In our opinion, the financial statements present fairly, in all material respects, the financial position of the Company as of December 31, 2019 and 2018, and the results of its operations and its cash flows for the years then ended, in conformity with accounting principles generally accepted in the United States of America.
Basis for Opinion
These financial statements are the responsibility of the Company's management. Our responsibility is to express an opinion on the Company's financial statements based on our audits. We are a public accounting firm registered with the Public Company Accounting Oversight Board (United States) ("PCAOB") and are required to be independent with respect to the Company in accordance with the U.S. federal securities laws and the applicable rules and regulations of the Securities and Exchange Commission and the PCAOB.
We conducted our audits in accordance with the standards of the PCAOB. Those standards require that we plan and perform the audit to obtain reasonable assurance about whether the financial statements are free of material misstatement, whether due to error or fraud. Our audits included performing procedures to assess the risks of material misstatement of the financial statements, whether due to error or fraud, and performing procedures that respond to those risks. Such procedures included examining, on a test basis, evidence regarding the amounts and disclosures in the financial statements. Our audits also included evaluating the accounting principles used and significant estimates made by management, as well as evaluating the overall presentation of the financial statements. We believe that our audits provide a reasonable basis for our opinion.
/s/ Crowe LLP
Sacramento, California
March 11, 2020
We have served as the Company's auditor since 2011.
68
LUTHER BURBANK CORPORATION
CONSOLIDATED STATEMENTS OF FINANCIAL CONDITION
(Dollar amounts in thousands)
December 31, 2019 | December 31, 2018 | ||||||
ASSETS | |||||||
Cash and cash equivalents | $ | 88,565 | $ | 91,697 | |||
Available for sale debt securities, at fair value | 625,074 | 608,528 | |||||
Held to maturity debt securities, at amortized cost (fair value of $10,349 and $11,625 at December 31, 2019 and 2018, respectively) | 10,170 | 11,860 | |||||
Equity securities, at fair value | 11,782 | 11,438 | |||||
Loans receivable, net of allowance for loan losses of $36,001 and $34,314 at December 31, 2019 and 2018, respectively | 6,194,976 | 6,096,316 | |||||
Accrued interest receivable | 20,814 | 20,220 | |||||
Federal Home Loan Bank ("FHLB") stock, at cost | 30,342 | 31,823 | |||||
Premises and equipment, net | 19,504 | 20,981 | |||||
Goodwill | 3,297 | 3,297 | |||||
Prepaid expenses and other assets | 41,304 | 41,052 | |||||
Total assets | $ | 7,045,828 | $ | 6,937,212 | |||
LIABILITIES AND STOCKHOLDERS' EQUITY | |||||||
Liabilities: | |||||||
Deposits | $ | 5,234,717 | $ | 5,001,040 | |||
FHLB advances | 978,702 | 1,143,132 | |||||
Junior subordinated deferrable interest debentures | 61,857 | 61,857 | |||||
Senior debt | |||||||
$95,000 face amount, 6.5% interest rate, due September 30, 2024 (less debt issuance costs of $584 and $707 at December 31, 2019 and 2018, respectively) | 94,416 | 94,293 | |||||
Accrued interest payable | 2,901 | 4,307 | |||||
Other liabilities and accrued expenses | 58,771 | 51,438 | |||||
Total liabilities | 6,431,364 | 6,356,067 | |||||
Commitments and contingencies (Note 19) | |||||||
Stockholders' equity: | |||||||
Preferred stock, no par value; 5,000,000 shares authorized; none issued and outstanding at December 31, 2019 and 2018 | — | — | |||||
Common stock, no par value; 100,000,000 shares authorized; 55,999,754 and 56,379,066 shares issued and outstanding at December 31, 2019 and 2018, respectively | 447,784 | 456,378 | |||||
Retained earnings | 165,236 | 129,806 | |||||
Accumulated other comprehensive income (loss), net of taxes | 1,444 | (5,039 | ) | ||||
Total stockholders' equity | 614,464 | 581,145 | |||||
Total liabilities and stockholders' equity | $ | 7,045,828 | $ | 6,937,212 | |||
See accompanying notes to consolidated financial statements
69
LUTHER BURBANK CORPORATION
CONSOLIDATED STATEMENTS OF INCOME
(Dollar amounts in thousands, except per share data)
For the Years Ended December 31, | ||||||||
2019 | 2018 | |||||||
Interest and fee income: | ||||||||
Loans | $ | 249,530 | $ | 211,835 | ||||
Investment securities | 15,461 | 12,430 | ||||||
Cash and cash equivalents | 2,151 | 1,792 | ||||||
Total interest and fee income | 267,142 | 226,057 | ||||||
Interest expense: | ||||||||
Deposits | 105,092 | 69,112 | ||||||
FHLB advances | 24,896 | 23,285 | ||||||
Junior subordinated deferrable interest debentures | 2,447 | 2,266 | ||||||
Senior debt | 6,300 | 6,307 | ||||||
Total interest expense | 138,735 | 100,970 | ||||||
Net interest income before provision for loan losses | 128,407 | 125,087 | ||||||
Provision for loan losses | 1,250 | 3,600 | ||||||
Net interest income after provision for loan losses | 127,157 | 121,487 | ||||||
Noninterest income: | ||||||||
Gain on sale of loans | 607 | 140 | ||||||
FHLB dividends | 2,163 | 2,735 | ||||||
Other income | 1,905 | 1,256 | ||||||
Total noninterest income | 4,675 | 4,131 | ||||||
Noninterest expense: | ||||||||
Compensation and related benefits | 37,228 | 38,860 | ||||||
Deposit insurance premium | 545 | 1,892 | ||||||
Professional and regulatory fees | 1,984 | 2,037 | ||||||
Occupancy | 5,688 | 5,349 | ||||||
Depreciation and amortization | 2,618 | 2,813 | ||||||
Data processing | 3,738 | 3,315 | ||||||
Marketing | 5,053 | 3,497 | ||||||
Other expenses | 5,514 | 4,924 | ||||||
Total noninterest expense | 62,368 | 62,687 | ||||||
Income before provision for income taxes | 69,464 | 62,931 | ||||||
Provision for income taxes | 20,603 | 17,871 | ||||||
Net income | $ | 48,861 | $ | 45,060 | ||||
Basic earnings per common share | $ | 0.87 | $ | 0.80 | ||||
Diluted earnings per common share | $ | 0.87 | $ | 0.79 | ||||
Dividends per common share | $ | 0.23 | $ | 0.28 | ||||
See accompanying notes to consolidated financial statements
70
LUTHER BURBANK CORPORATION
CONSOLIDATED STATEMENTS OF COMPREHENSIVE INCOME
(Dollar amounts in thousands)
For the Years Ended December 31, | ||||||||
2019 | 2018 | |||||||
Net income | $ | 48,861 | $ | 45,060 | ||||
Other comprehensive income (loss): | ||||||||
Unrealized gain (loss) on available for sale debt securities: | ||||||||
Unrealized holding gain (loss) arising during the period | 8,419 | (336 | ) | |||||
Tax effect | (2,439 | ) | 86 | |||||
Net of tax | 5,980 | (250 | ) | |||||
Unrealized gain on cash flow hedge: | ||||||||
Unrealized holding gain arising during the period | 147 | 649 | ||||||
Tax effect | (43 | ) | (187 | ) | ||||
Net of tax | 104 | 462 | ||||||
Total other comprehensive income | 6,084 | 212 | ||||||
Comprehensive income | $ | 54,945 | $ | 45,272 | ||||
See accompanying notes to consolidated financial statements
71
LUTHER BURBANK CORPORATION
CONSOLIDATED STATEMENTS OF CHANGES IN STOCKHOLDERS' EQUITY
(Dollar amounts in thousands, except per share data)
Accumulated Other Comprehensive (Loss) Income (Net of Taxes) | Total Stockholders' Equity | |||||||||||||||||||||
Common Stock | Retained Earnings | Available for Sale Securities | Cash Flow Hedge | |||||||||||||||||||
Shares | Amount | |||||||||||||||||||||
Balance, December 31, 2017 | 56,422,662 | $ | 454,287 | $ | 102,459 | $ | (6,214 | ) | $ | (787 | ) | $ | 549,745 | |||||||||
Comprehensive income: | ||||||||||||||||||||||
Net income | — | — | 45,060 | — | — | 45,060 | ||||||||||||||||
Other comprehensive (loss) income | — | — | — | (250 | ) | 462 | 212 | |||||||||||||||
Reclassification of prior year tax benefit related to re-measuring deferred taxes on items recorded to other comprehensive income | — | — | (1,750 | ) | 1,529 | 221 | — | |||||||||||||||
Issuance of restricted stock awards | 131,140 | — | — | — | — | — | ||||||||||||||||
Settled restricted stock units | 99,533 | — | — | — | — | — | ||||||||||||||||
Shares withheld to pay taxes on stock based compensation | (77,568 | ) | (769 | ) | — | — | — | (769 | ) | |||||||||||||
Restricted stock forfeitures | (23,401 | ) | (42 | ) | 2 | — | — | (40 | ) | |||||||||||||
Stock based compensation expense | — | 4,397 | — | — | — | 4,397 | ||||||||||||||||
Shares repurchased | (173,300 | ) | (1,495 | ) | — | — | — | (1,495 | ) | |||||||||||||
Cash dividends ($0.28 per share) | — | — | (15,965 | ) | — | — | (15,965 | ) | ||||||||||||||
Balance, December 31, 2018 | 56,379,066 | 456,378 | 129,806 | (4,935 | ) | (104 | ) | 581,145 | ||||||||||||||
Comprehensive income: | ||||||||||||||||||||||
Net income | — | — | 48,861 | — | — | 48,861 | ||||||||||||||||
Other comprehensive income | — | — | — | 5,980 | 104 | 6,084 | ||||||||||||||||
Cumulative effect of change in accounting principal (1) | — | — | (399 | ) | 399 | — | — | |||||||||||||||
Issuance of restricted stock awards | 321,784 | — | — | — | — | — | ||||||||||||||||
Settled restricted stock units | 499,707 | — | — | — | — | — | ||||||||||||||||
Shares withheld to pay taxes on stock based compensation | (257,503 | ) | (2,796 | ) | — | — | — | (2,796 | ) | |||||||||||||
Restricted stock forfeitures | (72,599 | ) | (222 | ) | 18 | — | — | (204 | ) | |||||||||||||
Stock based compensation expense | — | 3,215 | — | — | — | 3,215 | ||||||||||||||||
Shares repurchased | (870,701 | ) | (8,791 | ) | — | — | — | (8,791 | ) | |||||||||||||
Cash dividends ($0.23 per share) | — | — | (13,050 | ) | — | — | (13,050 | ) | ||||||||||||||
Balance, December 31, 2019 | 55,999,754 | $ | 447,784 | $ | 165,236 | $ | 1,444 | $ | — | $ | 614,464 | |||||||||||
(1) Represents the impact of adopting Accounting Standards Update ("ASU") 2016-01. See Note 1 to the consolidated financial statements for further information. | ||||||||||||||||||||||
See accompanying notes to consolidated financial statements
72
LUTHER BURBANK CORPORATION
CONSOLIDATED STATEMENTS OF CASH FLOWS
(Dollar amounts in thousands)
For the Years Ended December 31, | |||||||
2019 | 2018 | ||||||
Cash flows from operating activities: | |||||||
Net income | $ | 48,861 | $ | 45,060 | |||
Adjustments to reconcile net income to net cash provided by operating activities: | |||||||
Depreciation and amortization | 2,618 | 2,813 | |||||
Provision for loan losses | 1,250 | 3,600 | |||||
Amortization of deferred loan costs, net | 14,556 | 10,218 | |||||
Amortization of premiums on investment securities, net | 1,582 | 1,870 | |||||
Loss on disposition of leasehold improvements | 1,120 | — | |||||
Gain on sale of loans | (607 | ) | (140 | ) | |||
Stock based compensation expense, net of forfeitures | 2,993 | 4,355 | |||||
Provision (benefit) for deferred income tax | 1,059 | (1,868 | ) | ||||
Change in fair value of mortgage servicing rights | 961 | 931 | |||||
Change in fair value of equity securities | (344 | ) | — | ||||
Other items, net | 122 | 86 | |||||
Effect of changes in: | |||||||
Accrued interest receivable | (594 | ) | (5,319 | ) | |||
Accrued interest payable | (1,406 | ) | 2,526 | ||||
Prepaid expenses and other assets | (2,876 | ) | (272 | ) | |||
Other liabilities and accrued expenses | 5,712 | (4,900 | ) | ||||
Net cash provided by operating activities | 75,007 | 58,960 | |||||
Cash flows from investing activities: | |||||||
Proceeds from maturities and paydowns of available for sale debt securities | 88,454 | 77,785 | |||||
Proceeds from maturities and paydowns of held to maturity debt securities | 1,629 | 415 | |||||
Purchases of available for sale debt securities | (99,102 | ) | (196,648 | ) | |||
Purchases of held to maturity debt securities | — | (5,375 | ) | ||||
Proceeds from sales of available for sale debt securities | 1,000 | — | |||||
Net increase in loans receivable | (172,725 | ) | (1,118,502 | ) | |||
Proceeds from loans held for sale previously classified as portfolio loans | 68,809 | 19,604 | |||||
Purchase of loan | (10,052 | ) | — | ||||
Redemption (purchase) of FHLB stock, net | 1,481 | (4,090 | ) | ||||
Purchase of premises and equipment | (2,261 | ) | (1,477 | ) | |||
Net cash used in investing activities | (122,767 | ) | (1,228,288 | ) | |||
Cash flows from financing activities: | |||||||
Net increase in customer deposits | 233,677 | 1,049,802 | |||||
Proceeds from long-term FHLB advances | 375,100 | 575,000 | |||||
Repayment of long-term FHLB advances | (375,030 | ) | (175,528 | ) | |||
Net change in short-term FHLB advances | (164,500 | ) | (245,600 | ) | |||
Shares withheld for taxes on vested restricted stock | (2,796 | ) | (769 | ) | |||
Shares repurchased | (8,791 | ) | (1,495 | ) | |||
Cash paid for dividends | (13,032 | ) | (15,963 | ) | |||
Net cash provided by financing activities | 44,628 | 1,185,447 | |||||
(Decrease) increase in cash and cash equivalents | (3,132 | ) | 16,119 | ||||
Cash and cash equivalents, beginning of period | 91,697 | 75,578 | |||||
Cash and cash equivalents, end of period | $ | 88,565 | $ | 91,697 | |||
Supplemental disclosure of cash flow information: | |||||||
Cash paid during the period for: | |||||||
Interest | $ | 140,141 | $ | 98,444 | |||
Income taxes | $ | 18,032 | $ | 21,565 | |||
Non-cash investing activity: | |||||||
Loans transferred to held for sale | $ | 68,325 | $ | 19,603 | |||
See accompanying notes to consolidated financial statements
73
LUTHER BURBANK CORPORATION
NOTES TO CONSOLIDATED FINANCIAL STATEMENTS
1. | SUMMARY OF SIGNIFICANT ACCOUNTING POLICIES |
Organization
Luther Burbank Corporation (the ‘‘Company’’), a California corporation headquartered in Santa Rosa, is the bank holding company for its wholly-owned subsidiary, Luther Burbank Savings (the "Bank"), and its wholly-owned subsidiary, Burbank Investor Services. The Company also owns Burbank Financial Inc., a real estate investment company, and all the common interests in Luther Burbank Statutory Trusts I and II, entities created to issue trust preferred securities.
In December 2019, the Bank commenced conducting its business from its new headquarters in Gardena, CA. Prior to that, the Bank conducted its business from offices in Manhattan Beach, CA. It has nine full service branches in California located in Sonoma, Marin, Santa Clara, and Los Angeles Counties and one full service branch in Washington located in King County. Additionally, there are seven loan production offices located throughout California, as well as a loan production office in Clackamas County, Oregon.
Basis of Presentation
The consolidated financial statements have been prepared in conformity with U.S. generally accepted accounting standards and prevailing practices within the banking industry and include the accounts of the Company and its wholly-owned subsidiaries. The Company currently has two unconsolidated subsidiaries in the form of wholly-owned statutory business trusts, which were formed to issue junior subordinated deferrable interest debentures. See Note 9, “Junior Subordinated Deferrable Interest Debentures,” for additional information regarding these trusts. All intercompany accounts and transactions have been eliminated.
In preparing financial statements in conformity with generally accepted accounting principles ("GAAP"), management makes estimates and assumptions that affect the reported amounts of assets and liabilities and the disclosure of contingent assets and liabilities at the date of the financial statements and the reported amounts of revenues and expenses during the reporting period. Actual results could differ from those estimates and assumptions.
Cash and Cash Equivalents
Cash and cash equivalents include cash and deposits with other financial institutions with maturities of less than three months. Net cash flows are reported for customer loan and deposit transactions, and interest-bearing deposits in other financial institutions.
Restricted Cash Balances
Federal Reserve Bank regulations require the Company to maintain reserve balances on deposit with the Federal Reserve Bank. The amount of reserves required at the Federal Reserve Bank at December 31, 2019 and 2018 were $19.1 million and $18.6 million, respectively.
Investment Securities
The Company classifies its investment securities into three categories, available for sale, held to maturity and equity, at the time of purchase. Securities available for sale are carried at fair value, with unrealized holding gains and losses reported in other comprehensive income (loss), net of applicable taxes. Investment securities held to maturity are measured at amortized cost, based on the Company’s positive intent and ability to hold such securities to maturity. Equity securities are carried at fair value, with unrealized holding gains and losses reported in other noninterest income.
74
Interest income includes amortization/accretion of purchase premiums/discounts. Premiums and discounts are amortized, or accreted, over the life of the related investment security as an adjustment to interest income using a method that approximates the interest method. Gains and losses on sales are recorded on the trade date and determined using the specific identification method.
An investment security is impaired when its carrying value is greater than its fair value. Investment securities that are impaired are evaluated on at least a quarterly basis and more frequently when economic or market conditions warrant such an evaluation to determine whether such a decline in their fair value is other than temporary. Management utilizes criteria such as the magnitude and duration of the decline and the intent and ability of the Company to retain its investment in the securities for a period of time sufficient to allow for an anticipated recovery in fair value, in addition to the reasons underlying the decline, to determine whether the loss in value is other than temporary. The term ‘‘other than temporary’’ is not intended to indicate that the decline is permanent, but indicates that the prospect for a near-term recovery of value is not necessarily favorable, or that there is a lack of evidence to support a realizable value equal to or greater than the carrying value of the investment. Once a decline in value is determined to be other than temporary, and management does not intend to sell the security or it is more likely than not that the Company will not be required to sell the security before recovery, only the portion of the impairment loss representing credit exposure is recognized as a charge to earnings, with the balance recognized as a charge to other comprehensive (loss) income. If management intends to sell the security or it is more likely than not that the Company will be required to sell the security before recovering its forecasted cost, the entire impairment loss is recognized as a charge to earnings.
Loans Receivable
Loans that management has the intent and ability to hold for the foreseeable future or until maturity or payoff are reported at their outstanding unpaid principal balances, net of purchase premiums and discounts, deferred loan origination fees and costs, and the allowance for loan losses. Interest income is accrued on the unpaid principal balance. Premiums or discounts to acquire loans are amortized over the life of the loan using a method that approximates the interest method. The Company charges fees for originating loans. These fees, net of certain related direct loan origination costs, are deferred. The net deferred fees or costs on loans held for investment are recognized as an adjustment of the loan’s yield over the contractual life of the loan using the interest method. The Company ceases to amortize deferred fees or costs on loans for which the accrual of interest has been discontinued. Other loan fees and charges representing service costs are reported in income when collected or earned.
Loans Held for Sale
Mortgage loans held for sale are sold with servicing rights released or retained. Realized gains and losses on sales of mortgage loans are accounted for under the specific identification method and based on the difference between the selling price and the carrying value of the related loan sold. The carrying value of mortgage loans sold servicing retained is reduced by the amount allocated to the servicing right.
Concentration of Credit Risk
The majority of our customers are individuals and businesses located and doing business in the state of California, with approximately half our customers located in Los Angeles County and Orange County. The Company's exposure to credit risk is significantly affected by changes in the economy of California, and specifically, Los Angeles and Orange Counties.
75
Allowance for Loan Losses
The allowance for loan losses represents the estimated probable incurred credit losses in the Company’s loan portfolio. Loan losses are charged against the allowance when management believes the uncollectibility of a loan balance is confirmed. Subsequent recoveries, if any, are credited to the allowance. Management estimates the allowance balance required using past loan loss experience, the nature and volume of the portfolio, information about specific borrower circumstances, estimated collateral values, economic conditions, and other factors. Allocations of the allowance may be made for specific loans, but the entire allowance is available for any loan that, in management’s judgment, should be charged off. The Company performs periodic and systematic detailed reviews of its loan portfolio to assess the overall collectability of its loans. The Company’s methodology for assessing the appropriateness of the allowance consists of the combined total of two key components.
The first component covers loans that are impaired. All loans are evaluated for impairment on a recurring basis. A loan is considered impaired when, based on current information and events, it is probable that the Company will be unable to collect all amounts due, including principal and interest, according to the contractual terms of the loan agreement.
Factors considered by management in determining impairment include payment status, collateral value, and the probability of collecting scheduled principal and interest payments when due. Loans that experience insignificant payment delays and payment shortfalls generally are not classified as impaired. Management determines the significance of payment delays and payment shortfalls on case-by-case basis, taking into consideration all of the circumstances surrounding the loan and the borrower, including the length of the delay, the reasons for the delay, the borrower’s prior payment record, and the amount of the shortfall in relation to the principal and interest owed.
Loans that are reported as troubled debt restructures (“TDRs”) are considered impaired. A restructuring of a debt constitutes a TDR if the Company, for economic or legal reasons related to the debtor’s financial difficulties, grants a concession to the debtor that it would not otherwise consider. Restructured workout loans typically present an elevated level of credit risk as the borrowers are not able to perform according to the original contractual terms.
Impaired loans and TDRs that are solely dependent on the operation or liquidation of collateral for repayment are measured for impairment at the fair value of the collateral less estimated costs to sell. Impaired loans, including TDRs, that are not considered collateral dependent, are measured based on the present value of loan payments expected to be received discounted at the loans’ original effective contractual interest rate. If the recorded investment in the impaired loans exceeds the value of funds to be received, an allowance is established as a component of the total allowance for loan losses unless the loans are solely dependent on the collateral for repayment, in which case the amount that exceeds the fair value of the collateral is charged off.
The second element of the allowance covers probable incurred losses inherent in performing loans that have yet to be specifically identified for impairment. This component of the allowance is estimated by applying reserve factors based on average historical loss experience for the previous nine to ten years to various loan stratifications based on factors affecting the perceived level of risk including the type of collateral, loan program, and credit classification. The resulting loss amount is adjusted for qualitative factors to be reflective of risks or trends affecting the loan portfolio including economic conditions, the real estate market, volumes, delinquencies, and credit concentrations. The Company has identified the following loan portfolio segments based on collateral type:
76
Multifamily residential and commercial real estate loans - These loans typically involve greater principal amounts than other types of loans, and repayment depends upon income generated, or expected to be generated, by the property securing the loan in amounts sufficient to cover operating expenses and debt service, which may be adversely affected by changes in the economy or local market conditions. Multifamily residential and commercial real estate loans also expose a lender to significant credit risk because the collateral securing these loans typically cannot be sold as easily as single family residential real estate. In addition, some commercial real estate loans are not fully amortizing and contain large balloon payments upon maturity. Such balloon payments may require the borrower to either sell or refinance the underlying property in order to comply with the terms of the loan agreement, which may increase the risk of default or non-payment.
Single family residential real estate loans - The degree of risk in single family residential real estate lending depends primarily on the loan amount in relation to collateral value, the interest rate, and the borrower’s ability to repay in an orderly fashion. These loans generally possess a lower inherent risk of loss than other real estate portfolio segments. Economic trends determined by unemployment rates and other key economic indicators are closely correlated to the credit quality of these loans. Weak economic trends indicate that the borrowers’ capacity to repay their obligations may be deteriorating.
Construction and land loans - This type of lending generally possess a higher inherent risk of loss than other real estate portfolio segments. A major risk arises from the necessity to complete projects within specified costs and time lines. Trends in the construction industry significantly impact the credit quality of these loans, as demand drives construction activity. In addition, trends in real estate values significantly impact the credit quality of these loans, as property values determine the economic viability of construction projects.
Non-mortgage loans - These loans are not a part of our normal business activity, but rather are made on an exception basis typically in conjunction with our efforts to support CRA activities. The loans carry a high inherent risk of loss as they generally have no secondary source of repayment or any collateral support.
The total allowance is increased by the provision for loan losses, which is charged against the current period operating results, and decreased by the amount of loan charge-offs, net of recoveries. Losses incurred upon the initial acquisition of real estate owned through foreclosure are charged to the allowance for loan losses.
Accrued Interest Receivable on Loans
Interest receivable is only accrued if deemed collectible. It is the Company’s policy to place a loan on non-accrual status in the event that the borrower is 90 days or more delinquent (unless the loan is well secured and in the process of collection), or earlier if the timely collection of contractual payments appears doubtful. At the time a loan is placed on non-accrual, accrued interest is reversed out of interest income. Cash payments subsequently received on non-accrual loans are recognized as income only where the future collection of the remaining principal is considered by management to be probable. Loans are restored to accrual status only when the loan is less than 90 days delinquent and not in foreclosure, and the borrower has demonstrated the ability to make future payments of principal and interest.
Servicing Rights
When mortgage loans are sold with servicing retained, servicing rights are initially recorded at fair value. Fair value is based on a valuation model that calculates the present value of estimated future net servicing income.
Under the fair value measurement method, the Company measures servicing rights at fair value at each reporting date and reports changes in the fair value of servicing assets in earnings in the period in which the changes occur, and such changes are included with other income on the consolidated statements of income. The fair values of servicing rights are calculated using model assumptions including factors such as prepayment rates, market rates and other model cash flow assumptions. Absent other changes, an increase (decrease) to the estimated life of serviced loans would generally increase (decrease) the fair value of servicing rights. The fair value of servicing rights are subject to significant fluctuation as a result of changes in estimates and when actual factors such as prepayment speeds, default rates, and losses differ from model assumptions.
77
Servicing fee income, which is reported on the consolidated statements of income as a component of other income, is recorded for fees earned for servicing loans. The fees are typically based on a contractual percentage of the outstanding principal and are recorded as income when earned. Fair value adjustments are netted against loan servicing fee income.
Transfers of Financial Assets
Transfers of financial assets are accounted for as sales, when control over the assets has been relinquished. Control over transferred assets is deemed to be surrendered when the assets have been isolated from the Company, the transferee obtains the right (free of conditions that constrain it from taking advantage of that right) to pledge or exchange the transferred assets, and the Company does not maintain effective control over the transferred assets through an agreement to repurchase them before their maturity.
Real Estate Owned ("REO")
Real estate acquired as a result of loan foreclosure or a deed in lieu of foreclosure is initially recorded at fair value less costs to sell when acquired, establishing a new cost basis. Physical possession of a residential real estate property collateralizing a consumer mortgage loan occurs when legal title is obtained upon completion of foreclosure or when the borrower conveys all interest in the property to satisfy the loan through completion of a deed in lieu of foreclosure or through a similar legal agreement. Fair value is typically based on a real estate appraisal. REO is subsequently accounted for at the lower of cost or fair value less estimated costs to sell. If fair value declines subsequent to foreclosure, a valuation allowance is recorded through expense. Costs after acquisition related to the development of REO are capitalized while operating costs are charged to expense. Gains or losses realized and expenses incurred in connection with the disposition of foreclosed real estate are charged to noninterest income.
Premises and Equipment
Premises and equipment are stated at cost, less accumulated depreciation and amortization. Land is carried at cost. The Company’s policy is to depreciate buildings, furniture and equipment on the straight-line basis over the estimated useful lives of the various assets and to amortize leasehold improvements over the shorter of the asset life or lease term as follows:
Leasehold improvements Lesser of term of lease or life of improvement
Furniture and equipment 2 to 7 years
Building 39 years
The Company evaluates the recoverability of long-lived assets on an ongoing basis. When assets are sold or otherwise disposed of, the cost and related accumulated depreciation or amortization are removed from the accounts, and any resulting gain or loss is recognized in income for the period. The cost of maintenance and repairs is charged to expense as incurred.
Federal Home Loan Bank Stock
As a member of the Federal Home Loan Bank of San Francisco ("FHLB"), the Bank is required to own capital stock in an amount specified by the level of FHLB borrowings and other factors, and may invest in additional amounts. FHLB stock is carried at cost, classified as a restricted security and periodically evaluated for impairment based on the ultimate recovery of par value. Cash dividends are reported as noninterest income on an accrual basis. At December 31, 2019 and 2018, the Bank owned 303,422 and 318,231 shares of $100 par value FHLB stock, respectively.
78
Goodwill
Goodwill arises from business combinations and is generally determined as the excess of the fair value of the consideration transferred over the fair value of the net assets acquired and liabilities assumed as of the acquisition date. Goodwill determined to have an indefinite useful life is not amortized, but tested for impairment at least annually or more frequently if events and circumstances exist that indicate that a goodwill impairment test should be performed. If the carrying amount of the goodwill exceeds its fair value, an impairment loss is recognized in the amount of the excess and the carrying value of the goodwill is reduced accordingly. Goodwill is the only intangible asset with an indefinite life on the balance sheet. Based on an evaluation performed as of December 31, 2019, management determined that the implied fair value of goodwill exceeded its carrying value and no impairment was recognized.
Bank-Owned Life Insurance (“BOLI”)
Bank-owned life insurance is initially recorded at cost. Subsequently, BOLI is carried at the amount that can be realized under the insurance contract at the balance sheet date, which is the cash surrender value adjusted for other charges or amounts due that are probable at settlement. Increases in contract value are recorded as noninterest income and insurance proceeds received are recorded as a reduction of the contract value.
Reserve for Loan Commitments
The Company maintains a reserve within other liabilities associated with commitments to fund undisbursed loan commitments on outstanding loans. This reserve is determined based upon the historical loss experience of similar loans held by the Company at each period end. Any changes in this reserve amount are recognized through earnings as a component of noninterest expense.
Marketing
Marketing costs are expensed as incurred.
Derivatives
At the inception of a derivative contract, the Company designates the derivative as one of three types based on the Company’s intentions and belief as to likely effectiveness as a hedge. These three types are (1) a hedge of the fair value of a recognized asset or liability or of an unrecognized firm commitment (‘‘fair value hedge’’), (2) a hedge of a forecasted transaction or the variability of cash flows to be received or paid related to a recognized asset or liability (‘‘cash flow hedge’’), or (3) an instrument with no hedging designation (‘‘stand-alone derivative’’). For a fair value hedge, the gain or loss on the derivative, as well as the offsetting loss or gain on the hedged item, are recognized in earnings as fair values change. For a cash flow hedge, the gain or loss on the derivative is reported in other comprehensive income and is reclassified into earnings in the same periods during which the hedged transaction affects earnings. For both types of hedges, changes in the fair value of derivatives that are not highly effective in hedging the changes in fair value or expected cash flows of the hedged item are recognized immediately in current earnings. Changes in the fair value of derivatives that do not qualify for hedge accounting are reported in earnings, as noninterest income.
Net cash settlements on derivatives that qualify for hedge accounting are recorded in interest income or interest expense, based on the item being hedged. Net cash settlements on derivatives that do not qualify for hedge accounting are reported in noninterest income. Cash flows on hedges are classified in the cash flow statement the same as the cash flows of the items being hedged.
The Company formally documents the relationship between derivatives and hedged items, as well as the risk-management objective and the strategy for undertaking hedge transactions at the inception of the hedging relationship. This documentation includes linking fair value or cash flow hedges to specific assets and liabilities on the balance sheet or to specific firm commitments or forecasted transactions. The Company also formally assesses, both at the hedge’s inception and on an ongoing basis, whether the derivative instruments that are used are highly effective in offsetting changes in fair values or cash flows of the hedged items. The Company discontinues hedge accounting when it determines that the derivative is no longer effective in offsetting changes in the fair value or cash flows of the hedged item, the derivative is settled or terminates, a hedged
79
forecasted transaction is no longer probable, a hedged firm commitment is no longer firm, or treatment of the derivative as a hedge is no longer appropriate or intended.
When hedge accounting is discontinued, subsequent changes in fair value of the derivative are recorded as noninterest income. When a fair value hedge is discontinued, the hedged asset or liability is no longer adjusted for changes in fair value and the existing basis adjustment is amortized or accreted over the remaining life of the asset or liability. When a cash flow hedge is discontinued but the hedged cash flows or forecasted transactions are still expected to occur, gains or losses that were accumulated in other comprehensive income are amortized into earnings over the same periods which the hedged transactions will affect earnings.
Fair Value of Financial Instruments
Fair values of financial instruments are estimated using relevant market information and other assumptions, as more fully disclosed in a separate note. Fair value estimates involve uncertainties and matters of judgment regarding interest rates, credit risk, prepayments, and other factors, especially in the absence of broad markets for particular items. Changes in assumptions or in market conditions could significantly affect these estimates.
Income Taxes
Income tax expense is the total of the current year income tax due and the change in deferred tax assets and liabilities. Deferred tax assets and liabilities are recognized for the tax consequences of temporary differences between the reported amount of assets and liabilities and their tax bases. Deferred tax assets and liabilities are adjusted for the effects of changes in tax laws and rates on the date of enactment.
The Company uses a comprehensive model for recognizing, measuring, presenting, and disclosing in the financial statements tax positions taken or expected to be taken on a tax return. A tax position is recognized as a benefit only if it is ‘‘more likely than not’’ that the tax position would be sustained in a tax examination, with a tax examination being presumed to occur. The amount recognized is the largest amount of tax benefit that is greater than 50% likely of being realized on examination. For tax positions not meeting the ‘‘more likely than not’’ test, no tax benefit is recorded.
The Company recognizes interest accrued and penalties related to unrecognized tax benefits in tax expense. During the years ended December 31, 2019 and 2018, the Company recognized no interest and penalties.
Share-Based Compensation
The Company has issued awards of equity instruments, such as restricted stock awards (“RSAs”) and restricted stock units (“RSUs”), to employees and certain nonemployee directors. Compensation expense related to restricted stock is based on the fair value of the underlying stock on the award date and is amortized over the service period, defined as the vesting period, using the straight-line method. The vesting period is generally three years. Compensation expense is reduced for actual forfeitures as they occur. Unvested RSAs and RSUs participate with common stock in any dividends declared, but are paid only on the shares which ultimately vest. Such dividends are accrued and charged to compensation expense over the service period.
Comprehensive Income
Comprehensive income (loss) includes net income and other comprehensive income (loss). The only items of other comprehensive income (loss) for the Company are unrealized gains and losses on investment securities classified as available for sale, net of tax, and unrealized gains and losses on cash flow hedges, net of tax. Reclassification adjustments resulting from gains or losses on investment securities available for sale or cash flow hedges that have been realized and included in net income of the current period that also had been included in other comprehensive income as unrealized holding gains or losses in the period in which they arose have been excluded from comprehensive income (loss) of the current period to avoid double counting.
80
Earnings Per Share ("EPS")
Basic earnings per common share represents the amount of earnings for the period available to each share of common stock outstanding during the reporting period. Basic EPS is computed based upon net income divided by the weighted average number of common shares outstanding during the year. In determining the weighted average number of shares outstanding, vested restricted stock units are included. Diluted EPS represents the amount of earnings for the period available to each share of common stock outstanding including common stock that would have been outstanding assuming the issuance of common shares for all dilutive potential common shares outstanding during each reporting period. Diluted EPS is computed based upon net income divided by the weighted average number of common shares outstanding during each period, adjusted for the effect of dilutive potential common shares, such as restricted stock awards and units, calculated using the treasury stock method.
(Dollars in thousands, except per share amounts) | Years Ended December 31, | ||||||||
2019 | 2018 | ||||||||
Net income | $ | 48,861 | $ | 45,060 | |||||
Weighted average basic common shares outstanding | 55,974,230 | 56,196,648 | |||||||
Add: Dilutive effects of assumed vesting of restricted stock | 245,662 | 628,754 | |||||||
Weighted average diluted common shares outstanding | 56,219,892 | 56,825,402 | |||||||
Income per common share: | |||||||||
Basic EPS | $ | 0.87 | $ | 0.80 | |||||
Diluted EPS | $ | 0.87 | $ | 0.79 | |||||
Anti-dilutive shares not included in calculation of diluted earnings per share | 7,850 | — | |||||||
Related Party Transactions
In the normal course of business, the Company may accept deposits from officers and directors, as well as companies and individuals affiliated with officers and directors of the Company. As of December 31, 2019 and 2018, there were $18.5 million and $17.0 million, respectively, of such deposits. The Company does not permit loans to officers and directors or companies and individuals affiliated with officers and directors of the Company, with the exception of overdraft protection in limited circumstances. As of December 31, 2019 and 2018, there were no such overdraft loans outstanding.
Business Segments
While the chief decision-makers monitor the revenue streams of the various products and services, operations are managed and financial performance is evaluated on a Company-wide basis. Discrete financial information is not available other than on a Company-wide basis. Accordingly, all of the financial service operations are considered by management to be aggregated in one reportable operating segment.
Reclassifications
Certain prior balances in the consolidated financial statements have been reclassified to conform to current year presentation. These reclassifications had no effect on prior year net income or stockholders’ equity.
Adoption of New Financial Accounting Standards
FASB ASU 2014-09
In May 2014, the Financial Accounting Standards Board ("FASB") issued "Revenue from Contracts with Customers (Topic 606)" ("ASU 2014-09") implementing a common revenue standard that clarifies the principles for recognizing revenue. The core principle of ASU 2014-09 is that an entity should recognize revenue to depict the transfer of promised goods or services to customers in an amount that reflects the consideration to which the entity expects to be entitled in exchange for those goods or services. ASU 2014-09
81
establishes a five-step model which entities must follow to recognize revenue and removes inconsistencies and weaknesses in existing guidance. The guidance does not apply to revenue associated with financial instruments, including loans and investment securities that are accounted for under other GAAP, which comprises a significant portion of our revenue stream. The Company has no material sources of revenue that were impacted by this standard. The impact of the new standard was mainly limited to the timing of revenue recognition with regard to the Company's service charges on deposits accounts and gains or losses on the sale of other real estate owned. ASU 2014-09 was effective for the Company on January 1, 2019 and did not have a material effect on the Company's operating results or financial condition.
FASB ASU 2016-01
In January 2016, the FASB issued ASU 2016-01 which provided guidance to enhance the reporting model for financial instruments to provide users of financial statements with more decision-useful information. This update contains several provisions, including but not limited to (1) requiring equity investments, with certain exceptions, to be measured at fair value with changes in fair value recognized in net income; (2) simplifying the impairment assessment of equity investments without readily determinable fair values by requiring a qualitative assessment to identify impairment; (3) eliminating the requirement to disclose the method(s) and significant assumptions used to estimate fair value; and (4) requiring separate presentation of financial assets and liabilities by measurement category and form of financial asset on the balance sheet or the accompanying notes to the financial statements. The update also changes certain financial statement disclosure requirements, including requiring disclosures of the fair value of financial instruments be made on the basis of exit price. The update was effective for public business entities ("PBEs") for fiscal years beginning after December 15, 2017, including interim periods within those fiscal years. As an emerging growth company, the Company was permitted to adopt this guidance on January 1, 2019 and, as a result, reclassified $399 thousand of unrealized losses on equity securities from other comprehensive income to retained earnings, net of tax. Additionally, $11.4 million of equity securities were reclassified from available for sale securities to equity securities. Subsequent changes in the unrealized gain or loss on equity securities are recorded through other noninterest income. No adjustments related to 2018 were recorded in the Company's consolidated statements of income. See Note 2 to the consolidated financial statements for further discussion.
FASB ASU 2016-02
In February 2016, the FASB amended existing guidance that requires lessees recognize the following for all leases (with the exception of short-term leases) at the commencement date (1) a lease liability, which is the lessee’s obligation to make lease payments arising from a lease, measured on a discounted basis; and (2) a right-of-use asset, which is an asset that represents the lessee’s right to use, or control the use of, a specified asset for the lease term. Under the new guidance, lessor accounting is largely unchanged. Certain targeted improvements were made to align, where necessary, lessor accounting with the lessee accounting model and Topic 606, Revenue from Contracts with Customers. These amendments are effective for PBEs for annual periods and interim periods within those annual periods beginning after December 15, 2018. As an emerging growth company, the Company expects to adopt this guidance on December 31, 2021 assuming the Company remains an emerging growth company through such date. Upon adoption of this guidance, the Company will recognize a liability for its obligations under its operating leases and a corresponding right-of-use asset for its right to use leased properties over the lease term. The Company has analyzed its population of operating leases subject to this guidance and the adoption of this standard is not expected to have a material effect on the Company’s operating results or financial condition.
FASB ASU 2016-13
In June 2016, FASB issued guidance to replace the incurred loss model with an expected loss model, which is referred to as the current expected credit loss ("CECL") model. The CECL model is applicable to the measurement of credit losses on financial assets measured at amortized cost, including loan receivables, held to maturity debt securities, and reinsurance receivables. It also applies to off-balance sheet credit exposures not accounted for as insurance (loan commitments, standby letters of credit, financial guarantees, and other similar instruments) and net investments in leases recognized by a lessor. The transition will be applied as follows:
- | For debt securities with other than temporary impairment ("OTTI"), the guidance will be applied prospectively. |
82
- | Existing purchased credit impaired ("PCI") assets will be grandfathered and classified as purchased credit deteriorated ("PCD") assets at the date of adoption. The assets will be grossed up for the allowance for expected credit losses for all PCD assets at the date of adoption and will continue to recognize the noncredit discount in interest income based on the yield of such assets as of the adoption date. Subsequent changes in expected credit losses will be recorded through the allowance. |
- | For all other assets within the scope of CECL, a cumulative-effect adjustment will be recognized in retained earnings as of the beginning of the first reporting period in which the guidance is effective. |
These amendments are effective for PBEs that are Securities and Exchange Commission (“SEC”) filers for
annual periods and interim periods within those annual periods beginning after December 15, 2019. As an emerging growth company, the Company expects to adopt this guidance on January 1, 2023 assuming the Company remains an emerging growth company through such date. We expect to recognize a one-time cumulative effect adjustment to the allowance for loan losses as of the beginning of the first reporting period in which the new standard is effective. The adoption of this standard is still being evaluated by the Company as to whether or not it will have a material effect on the Company’s operating results or financial condition.
FASB ASU 2016-15
In August 2016, the FASB issued guidance related to classification of certain cash receipts and cash payments. The update addresses eight specific cash flow issues with the objective of reducing the existing diversity in practice. For PBEs, the guidance is effective for fiscal years beginning after December 15, 2017, including interim periods within those fiscal years. Early adoption is permitted and must be applied using a retrospective transitional method to each period presented. As an emerging growth company, the Company adopted this guidance on December 31, 2019. The adoption of this standard did not have a material effect on the Company’s operating results or financial condition.
FASB ASU 2017-08
In March 2017, the FASB issued guidance related to Premium Amortization on Purchased Callable Debt Securities. The ASU shortens the amortization period for certain callable debt securities purchased at a premium by requiring that the premium be amortized to the earliest call date. Under current GAAP, entities generally amortize the premium as an adjustment of yield over the contractual life of the instrument. The amendments in this update affects all entities that hold investments in callable debt securities that have an amortized cost basis in excess of the amount that is repayable by the issuer at the earliest call date (that is, at a premium). The amendments do not require an accounting change for securities held at a discount; the discount continues to be amortized to maturity. The amendments are effective for PBEs for annual periods beginning after December 15, 2018, and interim periods thereafter. As an emerging growth company, the Company expects to adopt this guidance on December 31, 2020 assuming the Company remains an emerging growth company through such date. The adoption of this standard is not expected to have a material effect on the Company’s operating results or financial condition.
FASB ASU 2017-12
In August 2017, the FASB issued ASU 2017-12, “Derivatives and Hedging (Topic 815): Targeted Improvements to Accounting for Hedging Activities”, which changes the recognition and presentation requirements of hedge accounting including eliminating the requirement to separately measure and report hedge ineffectiveness and presenting all items that affect earnings in the same income statement line item as the hedged item. The ASU also provides new alternatives for applying hedge accounting to additional hedging strategies; measuring the hedged item in fair value hedges of interest rate risk; reducing the cost and complexity of applying hedge accounting by easing the requirements for effectiveness testing, hedge documentation and application of the critical terms match method; and reducing the risk of material error correction if a company applies the shortcut method inappropriately. ASU 2017-12 was effective for PBEs for fiscal years beginning after December 15, 2018, with early adoption, including adoption in an interim period, permitted. As an emerging growth company, the Company had the option to adopt this guidance on December 31, 2020, but instead elected to early adopt effective April 1, 2019. The guidance did not have a material impact on the Company’s operating results or financial condition on the date of adoption; however, during the year ended December 31, 2019, the Company entered into two fair value hedges to hedge certain fixed rate loans held for investment. The hedges are expected to be highly effective in offsetting changes in the fair value of the hedged loans. The related hedging
83
relationship is designated as a fair value hedge under the “last-of-layer” method, a new approach provided by ASU 2017-12. Gains and losses on the derivative instruments designated as fair value hedges, as well as changes in the fair value of the hedged items, are recorded in interest income for loans, net in the consolidated statements of income. See Note 13 to the consolidated financial statements for further discussion.
FASB ASU 2018-13
In August 2018, the FASB issued guidance that eliminates, adds and modifies certain disclosure requirements for fair value measurements as part of its disclosure framework project. Entities will no longer be required to disclose the amount of and reasons for transfers between Level 1 and Level 2 of the fair value hierarchy, but public companies will be required to disclose the range and weighted average terms used to develop significant unobservable inputs for Level 3 fair value measurements. The guidance also modifies certain disclosure requirements for nonpublic entities to make them less burdensome. The guidance is effective for all entities for fiscal years beginning after December 15, 2019 and for interim periods within those fiscal years, but entities are permitted to early adopt either the entire standard or only the provisions that eliminate or modify the requirements. The adoption of this standard is not expected to have a material impact on the Company’s operating results or financial condition.
2. | INVESTMENT SECURITIES |
Available for Sale
The following table summarizes the amortized cost and the estimated fair value of available for sale debt securities as of the dates indicated:
(Dollars in thousands) | Amortized Cost | Gross Unrealized Gains | Gross Unrealized Losses | Estimated Fair Value | |||||||||||
At December 31, 2019: | |||||||||||||||
Government and Government Sponsored Entities: | |||||||||||||||
Residential mortgage backed securities ('MBS") and collateralized mortgage obligations ("CMOs") | $ | 145,333 | $ | 340 | $ | (481 | ) | $ | 145,192 | ||||||
Commercial MBS and CMOs | 353,727 | 3,267 | (825 | ) | 356,169 | ||||||||||
Agency bonds | 123,977 | 59 | (323 | ) | 123,713 | ||||||||||
Total available for sale debt securities | $ | 623,037 | $ | 3,666 | $ | (1,629 | ) | $ | 625,074 | ||||||
At December 31, 2018: | |||||||||||||||
Government and Government Sponsored Entities: | |||||||||||||||
Residential MBS and CMOs | $ | 194,297 | $ | 339 | $ | (2,523 | ) | $ | 192,113 | ||||||
Commercial MBS and CMOs | 294,276 | 979 | (2,304 | ) | 292,951 | ||||||||||
Agency bonds | 125,329 | 7 | (2,848 | ) | 122,488 | ||||||||||
U.S. Treasury | 1,008 | — | (32 | ) | 976 | ||||||||||
Total available for sale debt securities | $ | 614,910 | $ | 1,325 | $ | (7,707 | ) | $ | 608,528 | ||||||
Net unrealized gains (losses) on available for sale investment securities are recorded as accumulated other comprehensive income (loss) within stockholders’ equity and totaled $1.4 million and $(4.4) million, net of $(593) thousand and $2.0 million in tax (liabilities) assets at December 31, 2019 and 2018, respectively. During the year ended December 31, 2019, the Company sold its U.S. Treasury security at its amortized cost. There were no sales or transfers of available for sale investment securities and no realized gains or losses on these securities for the year ended December 31, 2018.
84
The following tables summarize the gross unrealized losses and fair value of available for sale debt securities, aggregated by investment category and length of time that individual securities have been in a continuous unrealized loss position:
December 31, 2019 | |||||||||||||||||||||||
Less than 12 Months | 12 Months or More | Total | |||||||||||||||||||||
(Dollars in thousands) | Fair Value | Unrealized Losses | Fair Value | Unrealized Losses | Fair Value | Unrealized Losses | |||||||||||||||||
Government and Government Sponsored Entities: | |||||||||||||||||||||||
Residential MBS and CMOs | $ | 43,623 | $ | (181 | ) | $ | 54,870 | $ | (300 | ) | $ | 98,493 | $ | (481 | ) | ||||||||
Commercial MBS and CMOs | 95,950 | (339 | ) | 57,219 | (486 | ) | 153,169 | (825 | ) | ||||||||||||||
Agency bonds | 29,471 | (86 | ) | 87,405 | (237 | ) | 116,876 | (323 | ) | ||||||||||||||
Total available for sale debt securities | $ | 169,044 | $ | (606 | ) | $ | 199,494 | $ | (1,023 | ) | $ | 368,538 | $ | (1,629 | ) | ||||||||
At December 31, 2019, the Company held 76 residential MBS and CMOs of which 45 were in a loss position and 25 had been in a loss position for twelve months or more. The Company held 42 commercial MBS and CMOs of which 19 were in a loss position and 8 had been in a loss position for twelve months or more. The Company held 15 agency bonds of which 12 were in a loss position and 9 had been in a loss position for twelve months or more.
December 31, 2018 | |||||||||||||||||||||||
Less than 12 Months | 12 Months or More | Total | |||||||||||||||||||||
(Dollars in thousands) | Fair Value | Unrealized Losses | Fair Value | Unrealized Losses | Fair Value | Unrealized Losses | |||||||||||||||||
Government and Government Sponsored Entities: | |||||||||||||||||||||||
Residential MBS and CMOs | $ | 31,728 | $ | (304 | ) | $ | 102,503 | $ | (2,219 | ) | $ | 134,231 | $ | (2,523 | ) | ||||||||
Commercial MBS and CMOs | 58,725 | (432 | ) | 114,159 | (1,872 | ) | 172,884 | (2,304 | ) | ||||||||||||||
Agency bonds | 4,906 | (18 | ) | 114,575 | (2,830 | ) | 119,481 | (2,848 | ) | ||||||||||||||
U.S. Treasury | — | — | 976 | (32 | ) | 976 | (32 | ) | |||||||||||||||
Total available for sale debt securities | $ | 95,359 | $ | (754 | ) | $ | 332,213 | $ | (6,953 | ) | $ | 427,572 | $ | (7,707 | ) | ||||||||
At December 31, 2018, the Company held 82 residential MBS and CMOs of which 45 were in a loss position and 40 had been in a loss position for twelve months or more. The Company held 34 commercial MBS and CMOs of which 23 were in a loss position and 16 had been in a loss position for twelve months or more. The Company held 14 agency bonds of which 13 were in a loss position and 12 had been in a loss position for twelve months or more. The Company held 1 U.S. Treasury note at December 31, 2018. This note was in a loss position for greater than 12 months.
The unrealized losses on the Company’s investments were caused by interest rate changes. In addition, the contractual cash flows of these investments are guaranteed by the U.S. government or agencies sponsored by the U.S. government. Accordingly, it is expected that the securities will not be settled at a price less than amortized cost. Because the decline in market value is attributable to changes in interest rates but not credit quality, and because the Company has the ability and intent to hold those investments until a recovery of fair value, which may be maturity, the Company does not consider these investments to be other-than-temporarily impaired at December 31, 2019 and 2018.
As of December 31, 2019 and 2018, there were no holdings of securities of any one issuer in an amount greater than 10% of stockholders' equity, other than the U.S. government and its agencies.
85
Held to Maturity
The following table summarizes the amortized cost and estimated fair value of held to maturity investment securities as of the dates indicated:
(Dollars in thousands) | Amortized Cost | Gross Unrecognized Gains | Gross Unrecognized Losses | Estimated Fair Value | |||||||||||
As of December 31, 2019: | |||||||||||||||
Government Sponsored Entities: | |||||||||||||||
Residential MBS | $ | 10,087 | $ | 205 | $ | (26 | ) | $ | 10,266 | ||||||
Other investments | 83 | — | — | 83 | |||||||||||
Total held to maturity investment securities | $ | 10,170 | $ | 205 | $ | (26 | ) | $ | 10,349 | ||||||
As of December 31, 2018: | |||||||||||||||
Government Sponsored Entities: | |||||||||||||||
Residential MBS | $ | 11,593 | $ | 27 | $ | (262 | ) | $ | 11,358 | ||||||
Other investments | 267 | — | — | 267 | |||||||||||
Total held to maturity investment securities | $ | 11,860 | $ | 27 | $ | (262 | ) | $ | 11,625 | ||||||
The following table summarizes the gross unrecognized losses and fair value of held to maturity investment securities, aggregated by investment category and length of time that individual securities have been in a continuous unrecognized loss position:
Less than 12 Months | 12 Months or More | Total | |||||||||||||||||||||
(Dollars in thousands) | Fair Value | Unrecognized Losses | Fair Value | Unrecognized Losses | Fair Value | Unrecognized Losses | |||||||||||||||||
As of December 31, 2019: | |||||||||||||||||||||||
Government Sponsored Entities: | |||||||||||||||||||||||
Residential MBS | $ | — | $ | — | $ | 2,253 | $ | (26 | ) | $ | 2,253 | $ | (26 | ) | |||||||||
As of December 31, 2018: | |||||||||||||||||||||||
Government Sponsored Entities: | |||||||||||||||||||||||
Residential MBS | $ | 6,481 | $ | (111 | ) | $ | 3,739 | $ | (151 | ) | $ | 10,220 | $ | (262 | ) | ||||||||
At December 31, 2019, the Company had 7 held to maturity residential MBS of which 2 were in a loss position and had been in a loss position for twelve months or more. At December 31, 2018, the Company had 7 held to maturity residential MBS of which 6 were in a loss position and 3 had been in a loss position for twelve months or more.
The unrecognized losses on the Company’s held to maturity investments were caused by interest rate changes. In addition, the contractual cash flows of these investments are guaranteed by agencies sponsored by the U.S. government. Accordingly, it is expected that the securities will not be settled at a price less than amortized cost. Because the decline in market value is attributable to changes in interest rates but not credit quality, and because the Company has the ability and intent to hold those investments until maturity, the Company does not consider these investments to be other-than-temporarily impaired at December 31, 2019 and 2018.
86
The following table summarizes the scheduled maturities of available for sale and held to maturity investment securities as of December 31, 2019:
December 31, 2019 | |||||||
(Dollars in thousands) | Amortized Cost | Fair Value | |||||
Available for sale debt securities | |||||||
Less than one year | $ | 30,000 | $ | 29,986 | |||
One to five years | 77,405 | 77,106 | |||||
Five to ten years | 4,101 | 4,104 | |||||
Beyond ten years | 12,471 | 12,517 | |||||
MBS and CMOs | 499,060 | 501,361 | |||||
Total available for sale debt securities | $ | 623,037 | $ | 625,074 | |||
Held to maturity investments securities | |||||||
Beyond ten years | $ | 83 | $ | 83 | |||
MBS | 10,087 | 10,266 | |||||
Total held to maturity debt securities | $ | 10,170 | $ | 10,349 | |||
The amortized cost and fair value of debt securities are shown by contractual maturity. Expected maturities may differ from contractual maturities if borrowers have the right to call or prepay obligations with or without call or prepayment penalties. As such, mortgage backed securities and collateralized mortgage obligations are not included in the maturity categories above and instead are shown separately. No securities were pledged as of December 31, 2019 and 2018.
Equity Securities
Equity securities consist of investments in the CRA Qualified Investment Fund. At December 31, 2019 and 2018, the fair value of equity securities totaled $11.8 million and $11.4 million, respectively. Prior to January 1, 2019, equity securities were included with available for sale investment securities and stated at fair value with unrealized gains and losses reported in other comprehensive income. As of January 1, 2019, $399 thousand of unrealized losses on equity securities were reclassified from other comprehensive income to retained earnings. Subsequent changes in fair value are recognized in other noninterest income and totaled $344 thousand during the year ended December 31, 2019. There were no sales of equity securities during the year ended December 31, 2019.
3. | LOANS |
Loans consist of the following:
(Dollars in thousands) | December 31, 2019 | December 31, 2018 | |||||
Permanent mortgages on: | |||||||
Multifamily residential | $ | 3,985,981 | $ | 3,671,069 | |||
Single family residential | 2,021,320 | 2,262,811 | |||||
Commercial real estate | 203,134 | 184,039 | |||||
Construction and land loans | 20,442 | 12,611 | |||||
Non-Mortgage (‘‘NM’’) loans | 100 | 100 | |||||
Total | 6,230,977 | 6,130,630 | |||||
Allowance for loan losses | (36,001 | ) | (34,314 | ) | |||
Loans held for investment, net | $ | 6,194,976 | $ | 6,096,316 | |||
Certain loans have been pledged to secure borrowing arrangements (see Note 8).
87
The following table summarizes activity in and the allocation of the allowance for loan losses by portfolio segment and by impairment methodology:
(Dollars in thousands) | Multifamily Residential | Single Family Residential | Commercial Real Estate | Land, Construction and NM | Total | ||||||||||||||
For the Year Ended December 31, 2019: | |||||||||||||||||||
Allowance for loan losses: | |||||||||||||||||||
Beginning balance allocated to portfolio segments | $ | 21,326 | $ | 10,125 | $ | 2,441 | $ | 422 | $ | 34,314 | |||||||||
Provision for (reversal of) loan losses | 2,046 | (61 | ) | (100 | ) | (635 | ) | 1,250 | |||||||||||
Charge-offs | — | — | — | — | — | ||||||||||||||
Recoveries | — | 12 | — | 425 | 437 | ||||||||||||||
Ending balance allocated to portfolio segments | $ | 23,372 | $ | 10,076 | $ | 2,341 | $ | 212 | $ | 36,001 | |||||||||
Ending allowance balance allocated to: | |||||||||||||||||||
Loans individually evaluated for impairment | $ | — | $ | 815 | $ | — | $ | — | $ | 815 | |||||||||
Loans collectively evaluated for impairment | 23,372 | 9,261 | 2,341 | 212 | 35,186 | ||||||||||||||
Ending balance | $ | 23,372 | $ | 10,076 | $ | 2,341 | $ | 212 | $ | 36,001 | |||||||||
Loans: | |||||||||||||||||||
Ending balance: individually evaluated for impairment | $ | 541 | $ | 7,097 | $ | — | $ | — | $ | 7,638 | |||||||||
Ending balance: collectively evaluated for impairment | 3,985,440 | 2,014,223 | 203,134 | 20,542 | 6,223,339 | ||||||||||||||
Ending balance | $ | 3,985,981 | $ | 2,021,320 | $ | 203,134 | $ | 20,542 | $ | 6,230,977 | |||||||||
For the Year Ended December 31, 2018: | |||||||||||||||||||
Allowance for loan losses: | |||||||||||||||||||
Beginning balance allocated to portfolio segments | $ | 18,588 | $ | 9,044 | $ | 1,734 | $ | 946 | $ | 30,312 | |||||||||
Provision for (reversal of) loan losses | 2,738 | 1,069 | 617 | (824 | ) | 3,600 | |||||||||||||
Charge-offs | — | — | — | — | — | ||||||||||||||
Recoveries | — | 12 | 90 | 300 | 402 | ||||||||||||||
Ending balance allocated to portfolio segments | $ | 21,326 | $ | 10,125 | $ | 2,441 | $ | 422 | $ | 34,314 | |||||||||
Ending allowance balance allocated to: | |||||||||||||||||||
Loans individually evaluated for impairment | $ | — | $ | 25 | $ | — | $ | — | $ | 25 | |||||||||
Loans collectively evaluated for impairment | 21,326 | 10,100 | 2,441 | 422 | 34,289 | ||||||||||||||
Ending balance | $ | 21,326 | $ | 10,125 | $ | 2,441 | $ | 422 | $ | 34,314 | |||||||||
Loans: | |||||||||||||||||||
Ending balance: individually evaluated for impairment | $ | 564 | $ | 5,881 | $ | — | $ | — | $ | 6,445 | |||||||||
Ending balance: collectively evaluated for impairment | 3,670,505 | 2,256,930 | 184,039 | 12,711 | 6,124,185 | ||||||||||||||
Ending balance | $ | 3,671,069 | $ | 2,262,811 | $ | 184,039 | $ | 12,711 | $ | 6,130,630 | |||||||||
88
The Company assigns a risk rating to all loans and periodically performs detailed reviews of all such loans to identify credit risks and to assess the overall collectability of the portfolio. During these internal reviews, management monitors and analyzes the financial condition of borrowers and guarantors, as well as the financial performance and other characteristics of loan collateral. These credit quality indicators are used to assign a risk rating to each individual loan. The risk ratings can be grouped into six major categories, defined as follows:
Pass assets are those which are performing according to contract and have no existing or known weaknesses deserving of management’s close attention. The basic underwriting criteria used to approve the loans are still valid, and all payments have essentially been made as planned.
Watch assets are expected to have an event occurring in the next 90 to 120 days that will lead to a change in risk rating with the change being either favorable or unfavorable. These assets require heightened monitoring of the event by management.
Special mention assets have potential weaknesses that deserve management’s close attention. If left uncorrected, these potential weaknesses may result in deterioration of the repayment prospects for the asset or in the Company’s credit position at some future date. Special mention assets are not adversely classified and do not expose the Company to sufficient risk to warrant adverse classification.
Substandard assets are inadequately protected by the current net worth and/or paying capacity of the obligor or by the collateral pledged. These assets have well-defined weaknesses: the primary source of repayment is gone or severely impaired (i.e., bankruptcy or loss of employment) and/or there has been a deterioration in collateral value. In addition, there is the distinct possibility that the Company will sustain some loss, either directly or indirectly (i.e., the cost of monitoring), if the deficiencies are not corrected. A deterioration in collateral value alone does not mandate that an asset be adversely classified if such factor does not indicate that the primary source of repayment is in jeopardy.
Doubtful assets have the weaknesses of those classified substandard with the added characteristic that the weaknesses make collection or liquidation in full highly questionable and improbable based on current facts, conditions and values.
Loss assets are considered uncollectible and of such little value that their continuance as assets, without establishment of a specific valuation allowance or charge-off, is not warranted. This classification does not necessarily mean that an asset has absolutely no recovery or salvage value; but rather, it is not practical or desirable to defer writing off a basically worthless asset (or portion thereof) even though partial recovery may be affected in the future.
89
The following table summarizes the loan portfolio allocated by management’s internal risk ratings at December 31, 2019 and 2018:
(Dollars in thousands) | Multifamily Residential | Single Family Residential | Commercial Real Estate | Land, Construction and NM | Total | ||||||||||||||
As of December 31, 2019: | |||||||||||||||||||
Grade: | |||||||||||||||||||
Pass | $ | 3,917,264 | $ | 1,980,845 | $ | 200,371 | $ | 20,542 | $ | 6,119,022 | |||||||||
Watch | 47,309 | 16,432 | 2,763 | — | 66,504 | ||||||||||||||
Special mention | 19,708 | 13,635 | — | — | 33,343 | ||||||||||||||
Substandard | 1,700 | 8,808 | — | — | 10,508 | ||||||||||||||
Doubtful | — | 1,600 | — | — | 1,600 | ||||||||||||||
Total | $ | 3,985,981 | $ | 2,021,320 | $ | 203,134 | $ | 20,542 | $ | 6,230,977 | |||||||||
As of December 31, 2018: | |||||||||||||||||||
Grade: | |||||||||||||||||||
Pass | $ | 3,601,279 | $ | 2,236,394 | $ | 180,655 | $ | 10,174 | $ | 6,028,502 | |||||||||
Watch | 65,222 | 20,505 | 1,895 | — | 87,622 | ||||||||||||||
Special mention | 2,631 | 380 | 1,489 | 2,537 | 7,037 | ||||||||||||||
Substandard | 1,937 | 5,532 | — | — | 7,469 | ||||||||||||||
Total | $ | 3,671,069 | $ | 2,262,811 | $ | 184,039 | $ | 12,711 | $ | 6,130,630 | |||||||||
The following table summarizes an aging analysis of the loan portfolio by the time past due at December 31, 2019 and 2018:
(Dollars in thousands) | 30 Days | 60 Days | 90+ Days | Non-accrual | Current | Total | |||||||||||||||||
As of December 31, 2019: | |||||||||||||||||||||||
Loans: | |||||||||||||||||||||||
Multifamily residential | $ | 1,411 | $ | — | $ | — | $ | 541 | $ | 3,984,029 | $ | 3,985,981 | |||||||||||
Single family residential | 4,037 | 690 | — | 5,792 | 2,010,801 | 2,021,320 | |||||||||||||||||
Commercial real estate | — | — | — | — | 203,134 | 203,134 | |||||||||||||||||
Land, construction and NM | — | — | — | — | 20,542 | 20,542 | |||||||||||||||||
Total | $ | 5,448 | $ | 690 | $ | — | $ | 6,333 | $ | 6,218,506 | $ | 6,230,977 | |||||||||||
As of December 31, 2018: | |||||||||||||||||||||||
Loans: | |||||||||||||||||||||||
Multifamily residential | $ | — | $ | — | $ | — | $ | 564 | $ | 3,670,505 | $ | 3,671,069 | |||||||||||
Single family residential | 362 | 2,212 | — | 1,448 | 2,258,789 | 2,262,811 | |||||||||||||||||
Commercial real estate | — | — | — | — | 184,039 | 184,039 | |||||||||||||||||
Land, construction and NM | — | — | — | — | 12,711 | 12,711 | |||||||||||||||||
Total | $ | 362 | $ | 2,212 | $ | — | $ | 2,012 | $ | 6,126,044 | $ | 6,130,630 | |||||||||||
90
The following table summarizes information related to impaired loans:
(Dollars in thousands) | Recorded Investment | Unpaid Principal Balance | Related Allowance | Average Recorded Investment | Interest Income | Cash Basis Interest | |||||||||||||||||
As of December 31, 2019 | |||||||||||||||||||||||
With no related allowance recorded: | |||||||||||||||||||||||
Multifamily residential | $ | 541 | $ | 618 | $ | — | $ | 3,078 | $ | 30 | $ | 30 | |||||||||||
Single family residential | 4,588 | 4,915 | — | 5,713 | 186 | 72 | |||||||||||||||||
Commercial real estate | — | — | — | — | — | — | |||||||||||||||||
Land, construction and NM | — | — | — | — | — | — | |||||||||||||||||
5,129 | 5,533 | — | 8,791 | 216 | 102 | ||||||||||||||||||
With an allowance recorded: | |||||||||||||||||||||||
Multifamily residential | — | — | — | — | — | — | |||||||||||||||||
Single family residential | 2,509 | 2,484 | 815 | 1,214 | 48 | — | |||||||||||||||||
Commercial real estate | — | — | — | — | — | — | |||||||||||||||||
Land, construction and NM | — | — | — | — | — | — | |||||||||||||||||
2,509 | 2,484 | 815 | 1,214 | 48 | — | ||||||||||||||||||
Total: | |||||||||||||||||||||||
Multifamily residential | 541 | 618 | — | 3,078 | 30 | 30 | |||||||||||||||||
Single family residential | 7,097 | 7,399 | 815 | 6,927 | 234 | 72 | |||||||||||||||||
Commercial real estate | — | — | — | — | — | — | |||||||||||||||||
Land, construction and NM | — | — | — | — | — | — | |||||||||||||||||
$ | 7,638 | $ | 8,017 | $ | 815 | $ | 10,005 | $ | 264 | $ | 102 | ||||||||||||
As of December 31, 2018 | |||||||||||||||||||||||
With no related allowance recorded: | |||||||||||||||||||||||
Multifamily residential | $ | 564 | $ | 635 | $ | — | $ | 1,299 | $ | — | $ | — | |||||||||||
Single family residential | 4,945 | 5,333 | — | 6,848 | 151 | — | |||||||||||||||||
Commercial real estate | — | — | — | 284 | — | — | |||||||||||||||||
Land, construction and NM | — | — | — | — | — | — | |||||||||||||||||
5,509 | 5,968 | — | 8,431 | 151 | — | ||||||||||||||||||
With an allowance recorded: | |||||||||||||||||||||||
Multifamily residential | — | — | — | — | — | — | |||||||||||||||||
Single family residential | 936 | 933 | 25 | 1,184 | 45 | — | |||||||||||||||||
Commercial real estate | — | — | — | — | — | — | |||||||||||||||||
Land, construction and NM | — | — | — | — | — | — | |||||||||||||||||
936 | 933 | 25 | 1,184 | 45 | — | ||||||||||||||||||
Total: | |||||||||||||||||||||||
Multifamily residential | 564 | 635 | — | 1,299 | — | — | |||||||||||||||||
Single family residential | 5,881 | 6,266 | 25 | 8,032 | 196 | — | |||||||||||||||||
Commercial real estate | — | — | — | 284 | — | — | |||||||||||||||||
Land, construction and NM | — | — | — | — | — | — | |||||||||||||||||
$ | 6,445 | $ | 6,901 | $ | 25 | $ | 9,615 | $ | 196 | $ | — | ||||||||||||
The following table summarizes the recorded investment related to troubled debt restructurings at December 31, 2019 and 2018:
December 31, | |||||||
(Dollars in thousands) | 2019 | 2018 | |||||
Troubled debt restructurings: | |||||||
Single family residential | $ | 1,305 | $ | 4,434 | |||
91
The Company has allocated $25 thousand of its allowance for loan losses for loans modified in troubled debt restructurings at both December 31, 2019 and 2018. The Company does not have commitments to lend additional funds to borrowers with loans whose terms have been modified in troubled debt restructurings. There were no new troubled debt restructurings during the years ended December 31, 2019 or 2018.
The Company had no troubled debt restructurings with a subsequent payment default within twelve months following the modification during the years ended December 31, 2019 and 2018. A loan is considered to be in payment default once it is 90 days contractually past due under the modified terms.
4. | NONPERFORMING ASSETS |
Nonperforming assets include nonperforming loans plus REO. The Company’s nonperforming assets at December 31, 2019 and 2018 are indicated below:
December 31, | |||||||
(Dollars in thousands) | 2019 | 2018 | |||||
Non-accrual loans: | |||||||
Multifamily residential | $ | 541 | $ | 564 | |||
Single family residential | 5,792 | 1,448 | |||||
Commercial real estate | — | — | |||||
Total non-accrual loans | 6,333 | 2,012 | |||||
Real estate owned | — | — | |||||
Total nonperforming assets | $ | 6,333 | $ | 2,012 | |||
Contractual interest not accrued during the year | $ | 302 | $ | 230 | |||
Interest income is subsequently recognized on a cash basis as long as the remaining unpaid principal amount of a non-accrual loan is deemed to be fully collectible. If there’s doubt regarding the collectability of the loan, then any interest payments received are applied to principal. Interest income was recognized on a cash basis on seven non-accrual loans during the year ended December 31, 2019 totaling $102 thousand. No interest income was recognized on non-accrual loans during the year ended December 31, 2018. Contractual interest not accrued on nonperforming loans during the years ended December 31, 2019 and 2018 totaled $302 thousand and $230 thousand, respectively.
5. | MORTGAGE SERVICING RIGHTS |
Servicing loans for others generally consists of collecting mortgage payments, maintaining escrow accounts, disbursing payments to investors, and conducting foreclosure proceedings. Loan servicing income is recorded on the accrual basis and includes servicing fees from investors and certain charges collected from borrowers. Mortgage loans serviced for others are not reported as assets. The principal balances of these loans are as follows:
December 31, | |||||||
(Dollars in thousands) | 2019 | 2018 | |||||
Mortgage loans serviced for: | |||||||
Federal Home Loan Mortgage Corporation ("Freddie Mac") | $ | 379,339 | $ | 497,950 | |||
Other financial institutions | 134,140 | 139,558 | |||||
Total mortgage loans serviced for others | $ | 513,479 | $ | 637,508 | |||
Custodial account balances maintained in connection with serviced loans totaled $8.0 million and $10.1 million at December 31, 2019 and 2018, respectively.
The Company measures servicing rights at fair value at each reporting date and reports changes in the fair value of servicing assets in earnings in the period in which the changes occur. Fair value is based on a valuation model that calculates the present value of estimated future net servicing income. Activities for mortgage servicing rights are as follows:
92
Years Ended December 31, | |||||||
(Dollars in thousands) | 2019 | 2018 | |||||
Beginning balance | $ | 3,463 | $ | 4,255 | |||
Additions | 155 | 139 | |||||
Disposals | — | — | |||||
Change in fair value due to changes in assumptions | — | — | |||||
Other changes in fair value | (961 | ) | (931 | ) | |||
Ending balance | $ | 2,657 | $ | 3,463 | |||
Fair value as of December 31, 2019 was determined using a discount rate of 10%, prepayment speeds ranging from 6.0% to 58.7%, depending on the stratification of the specific right, and a weighted average default rate of 5%. The weighed average prepayment speed at December 31, 2019 was 22.8%. Fair value as of December 31, 2018 was determined using a discount rate of 10%, prepayment speeds ranging from 6.0% to 70.4%, depending on the stratification of the specific right, and a weighted average default rate of 5%. The weighed average prepayment speed at December 31, 2018 was 23.3%.
6. | PREMISES AND EQUIPMENT |
Premises and equipment consist of the following:
December 31, | |||||||
(Dollars in thousands) | 2019 | 2018 | |||||
Leasehold improvements | $ | 14,515 | $ | 16,404 | |||
Furniture and equipment | 11,751 | 11,318 | |||||
Building | 6,174 | 6,174 | |||||
Land | 2,429 | 2,429 | |||||
Total | 34,869 | 36,325 | |||||
Less: accumulated depreciation | (15,365 | ) | (15,344 | ) | |||
Premises and equipment, net | $ | 19,504 | $ | 20,981 | |||
Depreciation and amortization expense for the years ended December 31, 2019 and 2018 totaled $2.6 million and $2.8 million, respectively.
7. | DEPOSITS |
A summary of deposits at December 31, 2019 and 2018 is as follows:
December 31, | |||||||
(Dollars in thousands) | 2019 | 2018 | |||||
Time deposits | $ | 3,526,688 | $ | 3,297,433 | |||
Money market savings | 1,330,585 | 1,335,246 | |||||
Interest-bearing demand | 222,509 | 179,272 | |||||
Money market checking | 111,338 | 123,119 | |||||
Noninterest-bearing demand | 43,597 | 65,970 | |||||
Total | $ | 5,234,717 | $ | 5,001,040 | |||
The Company had time deposits with a denomination of $100 thousand or more totaling $2.6 billion and $2.4 billion at December 31, 2019 and 2018, respectively.
The Company had time deposits that met or exceeded the FDIC Insurance limit of $250 thousand of $1.4 billion and $1.2 billion at December 31, 2019 and 2018, respectively.
The Company utilizes brokered deposits as an additional source of funding. The Company had brokered deposits of $416.0 million and $467.5 million at December 31, 2019 and 2018, respectively.
93
Maturities of the Company’s time deposits at December 31, 2019 are summarized as follows (dollars in thousands):
Year Ending December 31, | |||
2020 | $ | 3,092,760 | |
2021 | 370,247 | ||
2022 | 53,783 | ||
2023 | 5,011 | ||
2024 | 4,887 | ||
Thereafter | — | ||
$ | 3,526,688 | ||
8. | FEDERAL HOME LOAN BANK AND FEDERAL RESERVE BANK ADVANCES |
The Bank may borrow from the FHLB, on either a short-term or long-term basis, up to 40% of its assets provided that adequate collateral has been pledged. As of December 31, 2019 and 2018, the Bank had pledged various mortgage loans totaling approximately $2.2 billion and $2.1 billion, respectively, as well as the FHLB stock held by the Bank to secure these borrowing arrangements.
The Bank has access to the Loan and Discount Window of the Federal Reserve Bank of San Francisco ("FRB"). Advances under this window are subject to the Bank providing qualifying collateral. Various mortgage loans totaling approximately $447.4 million and $406.6 million as of December 31, 2019 and 2018, respectively, secure this borrowing arrangement. There were no borrowings outstanding with the FRB as of December 31, 2019 and 2018.
The following table discloses the Bank’s outstanding advances from the FHLB:
As of December 31, 2019 | ||||||||||||||||||
Outstanding Balances | Minimum Interest Rate | Maximum Interest Rate | Weighted Average Rate | |||||||||||||||
(Dollars in thousands) | December 31, 2019 | December 31, 2018 | Maturity Dates | |||||||||||||||
Fixed rate short-term | $ | 1,500 | $ | 166,000 | 1.66 | % | 1.66 | % | 1.66 | % | January 2020 | |||||||
Fixed rate long-term | 977,202 | 877,132 | 1.55 | % | 7.69 | % | 2.31 | % | February 2020 to August 2032 | |||||||||
Variable rate long-term | — | 100,000 | — | % | — | % | — | % | N/A | |||||||||
$ | 978,702 | $ | 1,143,132 | |||||||||||||||
The Bank's available borrowing capacity based on pledged loans to the FRB and the FHLB totaled $1.1 billion and $681.5 million at December 31, 2019 and 2018, respectively. As of December 31, 2019 and 2018, the Bank pledged as collateral a $62.6 million FHLB letter of credit to Freddie Mac related to our multifamily securitization reimbursement obligation.
Short-term borrowings are borrowings with original maturities of 90 days or less. During the year ended December 31, 2019, there was a maximum amount of short-term borrowings outstanding of $209.8 million and an average amount outstanding of $51.8 million with a weighted average interest rate of 2.52%.
94
The following table summarizes principal payments on FHLB advances required over the next five years as of December 31, 2019 (dollars in thousands):
Year Ending December 31, | |||
2020 | $ | 51,500 | |
2021 | 450,700 | ||
2022 | 75,000 | ||
2023 | 400,750 | ||
2024 | — | ||
Thereafter | 752 | ||
Total | $ | 978,702 | |
9. | JUNIOR SUBORDINATED DEFERRABLE INTEREST DEBENTURES |
The Company formed two wholly-owned trust companies (the ‘‘Trusts’’) which issued guaranteed preferred beneficial interests (the "Trust Securities") in the Company’s junior subordinated deferrable interest debentures (the "Notes"). The Company is not considered the primary beneficiary of the Trusts and therefore, the Trusts are not consolidated in the Company’s financial statements, but rather the junior subordinated debentures are shown as a liability. The Company’s investment in the common securities of the Trusts, totaling $1.9 million, is included in other assets on the consolidated statements of financial condition. The sole asset of the Trusts are the Notes that they hold.
The Trusts have invested the proceeds of such Trust Securities in the Notes. Each of the Notes has an interest rate equal to the corresponding Trust Securities distribution rate. The Company has the right to defer payment of interest on the Notes at any time or from time to time for a period not exceeding five years provided that no extension period may extend beyond the stated maturity of the relevant Notes. During any such extension period, distributions on the Trust Securities will also be deferred, and the Company’s ability to pay dividends on its common stock will be restricted.
The Company has entered into contractual arrangements which, taken collectively, fully and unconditionally guarantee payment of: (i) accrued and unpaid distributions required to be paid on the Trust Securities; (ii) the redemption price with respect to any Trust Securities called for redemption by the Trusts; and (iii) payments due upon a voluntary or involuntary dissolution, winding up or liquidation of the Trusts. The Trust Securities are mandatorily redeemable upon maturity of the Notes, or upon earlier redemption as provided in the indenture. The Company has the right to redeem the Notes purchased by the Trusts, in whole or in part, on or after the redemption date. As specified in the indenture, if the Notes are redeemed prior to maturity, the redemption price will be the principal amount and any accrued but unpaid interest.
The following table is a summary of the outstanding Trust Securities and Notes at December 31, 2019 and 2018 (dollars in thousands):
December 31, 2019 | December 31, 2018 | Date | Maturity | Rate Index | ||||||||||||||||
Issuer | Amount | Rate | Amount | Rate | Issued | Date | (Quarterly Reset) | |||||||||||||
Luther Burbank Statutory Trust I | $ | 41,238 | 3.27 | % | $ | 41,238 | 4.17 | % | 3/1/2006 | 6/15/2036 | 3 month LIBOR + 1.38% | |||||||||
Luther Burbank Statutory Trust II | $ | 20,619 | 3.51 | % | $ | 20,619 | 4.41 | % | 3/1/2007 | 6/15/2037 | 3 month LIBOR + 1.62% | |||||||||
10. | SENIOR DEBT |
In September 2014, the Company issued $95.0 million in senior unsecured term notes to qualified institutional investors. The following table summarizes information on these notes as of December 31, 2019 and 2018:
December 31, 2019 | December 31, 2018 | ||||||||||||||||||||
(Dollars in thousands) | Principal | Unamortized Debt Issuance Costs | Principal | Unamortized Debt Issuance Costs | Maturity Date | Fixed Interest Rate | |||||||||||||||
Senior Unsecured Term Notes | $ | 95,000 | $ | 584 | $ | 95,000 | $ | 707 | 9/30/2024 | 6.50 | % | ||||||||||
95
11. | INCOME TAXES |
The provision for income taxes for the years ended December 31, 2019 and 2018 consists of the following:
Years Ended December 31, | |||||||
(Dollars in thousands) | 2019 | 2018 | |||||
Federal: | |||||||
Current | $ | 12,581 | $ | 13,345 | |||
Deferred | 625 | (1,666 | ) | ||||
Total federal tax provision | 13,206 | 11,679 | |||||
State: | |||||||
Current | 6,963 | 6,394 | |||||
Deferred | 434 | (202 | ) | ||||
Total state tax provision | 7,397 | 6,192 | |||||
Total income tax provision | $ | 20,603 | $ | 17,871 | |||
The provision for income taxes for the years ended December 31, 2019 and 2018 differs from the statutory federal rate of 21% due to the following:
Years Ended December 31, | |||||||
(Dollars in thousands) | 2019 | 2018 | |||||
Statutory U.S. federal income tax | $ | 14,587 | $ | 13,216 | |||
Increase (decrease) resulting from: | |||||||
State taxes, net of federal benefit | 5,868 | 4,749 | |||||
Other | 148 | (94 | ) | ||||
Provision for income taxes | $ | 20,603 | $ | 17,871 | |||
96
Deferred tax assets (liabilities) included in other assets in the accompanying consolidated statements of financial condition consist of the following:
December 31, | |||||||
(Dollars in thousands) | 2019 | 2018 | |||||
Deferred tax assets: | |||||||
Allowance for loan losses | $ | 10,843 | $ | 10,387 | |||
Deferred compensation | 7,201 | 9,219 | |||||
Unrealized loss on securities | — | 2,052 | |||||
State tax deduction | 1,389 | 1,371 | |||||
Other | 772 | 817 | |||||
Total deferred tax assets | 20,205 | 23,846 | |||||
Deferred tax liabilities: | |||||||
Loan fee income | (11,061 | ) | (10,643 | ) | |||
Unrealized gain on securities | (593 | ) | — | ||||
Federal Home Loan Bank stock dividend income deferred for tax purposes | (1,316 | ) | (1,463 | ) | |||
Section 481(a) adjustment related to conversion from cash basis to accrual basis taxpayer in December 2017 | (604 | ) | (1,201 | ) | |||
Federal depreciation | (605 | ) | (789 | ) | |||
Other | (471 | ) | (491 | ) | |||
Total deferred tax liabilities | (14,650 | ) | (14,587 | ) | |||
Net deferred tax assets | $ | 5,555 | $ | 9,259 | |||
In assessing the Company’s ability to realize deferred tax assets, management considers whether it is more likely than not that some portion or all of the deferred tax assets will not be realized. The ultimate realization of deferred tax assets is dependent upon the generation of future taxable income during the periods in which those temporary differences become deductible. Management considers projected future taxable income and tax planning strategies in making this assessment. Based upon the level of historical taxable income and projections for future taxable income over the periods in which the deferred tax assets are deductible, management believes it is more likely than not that the Company will realize all benefits related to these deductible differences as of December 31, 2019 and 2018.
There were no unrecognized tax benefits for the years ended December 31, 2019 and 2018.
Until July 1, 1996, the Bank was allowed a special bad debt deduction based on a percentage of federal taxable income or on specified experience formulas in arriving at federal taxable income. For reserves established in taxable years beginning prior to December 31, 1987, a deferred tax liability was not required to be accrued but has been included as a restriction on retained earnings because such amounts may require the recognition of a tax liability if, in the future, (1) the Bank’s retained earnings represented by these reserves is used for purposes other than to absorb losses from bad debts, including dividends or distributions in liquidation or (2) there is a change in the federal tax law. The cumulative amount of these untaxed reserves was approximately $3.1 million at December 31, 2019 and 2018. Retained earnings at December 31, 2019 included approximately $0.9 million representing the tax effect of such cumulative bad debt deductions for which no deferred income taxes have been provided. In the event that these reserves are subject to realization, the tax on these reserves will be assessed and paid at the entity level. Management has determined that this portion of retained earnings will not be used in a manner that will create an income tax liability.
The Company is subject to U.S. federal income tax as well as various other state income taxes. The Company is no longer subject to examination by taxing authorities for years before 2015 for California tax filings and 2016 for federal and most other state tax filings.
97
12. | REGULATORY MATTERS |
The Company is a registered bank holding company and is subject to regulation, examination, and supervision by the FRB. The Bank is subject to regulation, examination, and supervision by the FDIC and the DBO.
The final rules implementing the Basel Committee on Banking Supervision's capital guidelines for U.S. banks (the “Basel III Capital Rules”) became effective for the Holding Company and Bank on January 1, 2015, with full compliance with all of the requirements being phased in over a multi-year schedule, and fully phased in by January 1, 2019. The Basel III Capital Rules provide for the following minimum capital to risk-weighted assets ratios as of January 1, 2015: a) 4.5% based upon common equity tier 1 capital ("CET1"); b) 6.0% based upon tier 1 capital; and c) 8.0% based upon total regulatory capital. A minimum leverage ratio (tier 1 capital as a percentage of average consolidated assets) of 4.0% is also required under the Basel III Capital Rules.
The Basel III Capital Rules require institutions to retain a capital conservation buffer, composed entirely of CET1, of 2.5% above these required minimum capital ratio levels. Banking organizations that fail to maintain the minimum 2.5% capital conservation buffer could face restrictions on capital distributions or discretionary bonus payments to executive officers. Restrictions would begin phasing in where the banking organization’s capital conservation buffer was below 2.5% at the beginning of a quarter, and distributions and discretionary bonus payments would be completely prohibited if no capital conservation buffer exists. The implementation of the capital conservation buffer began on January 1, 2016 at 0.625% and increased by 0.625% each subsequent January 1, until it reached 2.5% on January 1, 2019. The capital conservation buffer was 2.5% and 1.875% at December 31, 2019 and 2018, respectively.
The Bank is also governed by numerous federal and state laws and regulations, including the FDIC Improvement Act of 1991, which established five categories of capital adequacy ranging from “well-capitalized” to critically undercapitalized (although these items are not utilized to represent overall financial condition). The FDIC utilizes these categories of capital adequacy to determine various matters, including, but not limited to, prompt corrective action and deposit insurance premium assessment levels. Capital levels and adequacy classifications may also be subject to qualitative judgments by the Bank’s regulators regarding, among other factors, the components of capital and risk weighting. If adequately capitalized, regulatory approval is required to accept brokered deposits. If undercapitalized, capital distributions and asset growth are limited, and capital restoration plans are required.
As of December 31, 2019 and 2018, the Company and the Bank met all capital adequacy requirements to which they are subject. Also, as of December 31, 2019 and 2018, the Bank satisfied all criteria necessary to be categorized as “well-capitalized” under the regulatory framework for prompt corrective action. There have been no conditions or events since December 31, 2019 that management believes have changed its “well-capitalized” categorization.
98
The Company’s and Bank’s actual capital amounts and ratios are presented as follows:
Minimum Required | |||||||||||||||||||||||
Actual | For Capital Adequacy Purposes | Plus Capital Conservation Buffer | For Well- Capitalized Institution | ||||||||||||||||||||
(Dollars in thousands) | Amount | Ratio | Amount | Ratio | Amount | Ratio | Amount | Ratio | |||||||||||||||
Luther Burbank Corporation | |||||||||||||||||||||||
As of December 31, 2019 | |||||||||||||||||||||||
Tier 1 Leverage Ratio | $ | 671,580 | 9.47 | % | $ | 283,631 | 4.00 | % | N/A | N/A | N/A | N/A | |||||||||||
Common Equity Tier 1 Risk-Based Ratio | 609,723 | 15.46 | % | 177,523 | 4.50 | % | $ | 276,147 | 7.00 | % | N/A | N/A | |||||||||||
Tier 1 Risk-Based Capital Ratio | 671,580 | 17.02 | % | 236,697 | 6.00 | % | 335,321 | 8.50 | % | N/A | N/A | ||||||||||||
Total Risk-Based Capital Ratio | 708,847 | 17.97 | % | 315,596 | 8.00 | % | 414,220 | 10.50 | % | N/A | N/A | ||||||||||||
As of December 31, 2018 | |||||||||||||||||||||||
Tier 1 Leverage Ratio | $ | 644,344 | 9.42 | % | $ | 273,544 | 4.00 | % | N/A | N/A | N/A | N/A | |||||||||||
Common Equity Tier 1 Risk-Based Ratio | 582,487 | 14.74 | % | 177,873 | 4.50 | % | $ | 251,986 | 6.38 | % | N/A | N/A | |||||||||||
Tier 1 Risk-Based Capital Ratio | 644,344 | 16.30 | % | 237,164 | 6.00 | % | 311,277 | 7.88 | % | N/A | N/A | ||||||||||||
Total Risk-Based Capital Ratio | 679,841 | 17.20 | % | 316,218 | 8.00 | % | 390,332 | 9.88 | % | N/A | N/A | ||||||||||||
Luther Burbank Savings | |||||||||||||||||||||||
As of December 31, 2019 | |||||||||||||||||||||||
Tier 1 Leverage Ratio | $ | 748,916 | 10.57 | % | $ | 283,542 | 4.00 | % | N/A | N/A | $ | 354,428 | 5.00 | % | |||||||||
Common Equity Tier 1 Risk-Based Ratio | 748,916 | 18.99 | % | 177,437 | 4.50 | % | $ | 276,012 | 7.00 | % | 256,297 | 6.50 | % | ||||||||||
Tier 1 Risk-Based Capital Ratio | 748,916 | 18.99 | % | 236,582 | 6.00 | % | 335,158 | 8.50 | % | 315,443 | 8.00 | % | |||||||||||
Total Risk-Based Capital Ratio | 786,183 | 19.94 | % | 315,443 | 8.00 | % | 414,019 | 10.50 | % | 394,303 | 10.00 | % | |||||||||||
As of December 31, 2018 | |||||||||||||||||||||||
Tier 1 Leverage Ratio | $ | 728,414 | 10.65 | % | $ | 273,469 | 4.00 | % | N/A | N/A | $ | 341,836 | 5.00 | % | |||||||||
Common Equity Tier 1 Risk-Based Ratio | 728,414 | 18.43 | % | 177,820 | 4.50 | % | $ | 251,912 | 6.38 | % | 256,851 | 6.50 | % | ||||||||||
Tier 1 Risk-Based Capital Ratio | 728,414 | 18.43 | % | 237,094 | 6.00 | % | 311,185 | 7.88 | % | 316,125 | 8.00 | % | |||||||||||
Total Risk-Based Capital Ratio | 763,911 | 19.33 | % | 316,125 | 8.00 | % | 390,217 | 9.88 | % | 395,156 | 10.00 | % | |||||||||||
Dividends
In the ordinary course of business, the Company is dependent upon dividends from the Bank to provide funds for the payment of dividends to shareholders and to provide for other cash requirements. Banking regulations may limit the amount of dividends that may be paid. Approval by regulatory authorities is required if the effect of dividends declared would cause the regulatory capital of the Bank to fall below specified minimum levels. Approval is also required if dividends declared exceed the net profits for that year combined with the retained net profits for the preceding two years.
The Company has paid cash dividends of $13.0 million and $16.0 million during the years ended December 31, 2019 and 2018. Payment of stock or cash dividends in the future will depend upon the Company's earnings and financial condition, and other factors deemed relevant by the Company’s Board of Directors, as well as the Company’s legal ability to pay dividends. Accordingly, no assurance can be given that any dividends will be declared in the future.
13. | DERIVATIVES AND HEDGING ACTIVITIES |
The Company utilizes interest rate swap and cap agreements as part of its asset liability management strategy to help manage its interest rate risk position. The notional amount of the interest rate swaps and caps do not represent amounts exchanged by the parties. The amount exchanged is determined by reference to the notional amount and the other terms of the individual interest rate cap or swap agreements.
99
Fair Value Hedges of Interest Rate Risk
During the year ended December 31, 2019, the Company entered into two, two-year interest rate swaps with a total notional amount of $1.0 billion to hedge the interest rate risk related to certain hybrid multifamily loans which are currently in their fixed rate period. The swaps are designated as fair value hedges and involve the payment of a fixed rate amount to a counterparty in exchange for the Company receiving a variable rate payment over the life of the swaps without the exchange of the underlying notional amount. The gain or loss on these derivatives, as well as the offsetting loss or gain on the hedged items attributable to the hedged risk are recognized in interest income for loans.
For the year ended December 31, 2019, the fixed rate amounts related to the net settlement of the interest rate swaps was less than the the floating rate amounts recognized. As such, interest income for loans was increased by $2.1 million for the year ended December 31, 2019. The Company did not have any derivative financial instruments that were designated as fair value hedges as of or for the year ended December 31, 2018.
The following table presents the effect of the Company’s interest rate swaps on the consolidated statements of income for the year ended December 31, 2019:
(Dollars in thousands) | |||
Derivative - interest rate swap: | |||
Interest income | $ | 2,047 | |
Hedged items - loans: | |||
Interest income | 5 | ||
Net effect on interest income | $ | 2,052 | |
The following table presents the fair value of the Company’s interest rate swaps, as well as its classification on the consolidated statement of financial condition as of December 31, 2019:
Fair Values of Derivative Instruments | ||||||||||||
Asset Derivatives | Liability Derivatives | |||||||||||
(Dollars in thousands) | Notional Amount | Balance Sheet Location | Fair Value | Balance Sheet Location | Fair Value | |||||||
Derivatives designated as hedging instruments: | ||||||||||||
Interest Rate Swaps | $ | 1,000,000 | Prepaid Expenses and Other Assets | $ | 1,243 | Other Liabilities and Accrued Expenses | $ | 748 | ||||
As of December 31, 2019, the following amounts were recorded in the consolidated statement of financial condition related to cumulative basis adjustments for its fair value hedges.
Line Item in the Consolidated Statement of Financial Condition in Which the Hedged Items are Included | Carrying Amount of the Hedged Assets | Cumulative Amount of Fair Value Hedging Adjustment Included in the Carrying Amount of the Hedged Assets | ||||||
(Dollars in thousands) | ||||||||
Loans receivable, net (1) | $ | 999,595 | $ | (405 | ) | |||
(1) These amounts include the amortized cost basis of closed portfolio loans used to designate hedging relationships in which the hedged items are the last layer expected to be remaining at the end of the hedging relationship. At December 31, 2019, the amortized cost basis of the closed portfolio loans used in these hedging relationships was $2.5 billion; the cumulative basis adjustments associated with these hedging relationships were $(405) thousand and the amount of the designated hedged items were $1.0 billion.
As of December 31, 2019, the Company posted $2.8 million in cash collateral in connection with its interest rate swaps.
100
Interest Rate Caps Designated as Cash Flow Hedges
No interest rate caps were outstanding as of December 31, 2019. An interest rate cap with a notional amount totaling $50.0 million as of December 31, 2018, was designated as a cash flow hedge of certain FHLB advances and was determined to be fully effective during all periods presented. As such, no amount of ineffectiveness has been included in net income. Therefore, the aggregate fair value of the cap is recorded in other assets (liabilities) with changes in fair value recorded in other comprehensive income (loss). The amount included in accumulated other comprehensive income (loss) would be reclassified to current earnings should the hedge no longer be considered effective.
Summary information about the interest rate cap designated as a cash flow hedge at December 31, 2018 is as follows:
(Dollars in thousands) | |||
Notional amounts | $ | 50,000 | |
Weighted average rate on FHLB advances | 2.58 | % | |
Weighted average cap rate | 2.80 | % | |
Weighted average original maturity | 5.0 years | ||
Weighted average remaining maturity | 0.3 years | ||
Unrealized losses | $ | (147 | ) |
The Company recognized $147 thousand and $650 thousand of cap premium amortization on cash flow hedges in the consolidated statements of income for the years ended December 31, 2019 and 2018, respectively.
14. | EMPLOYEE BENEFIT PLANS |
Salary Continuation Arrangements
The Company has entered into individual salary continuation agreements with certain key executives and directors. These agreements are accounted for as deferred compensation arrangements and are unsecured and unfunded. Benefits under these agreements are fixed for each executive and director and are payable over a specific period following their retirement or at an earlier date such as termination without cause, the sale of the Company, or death. Participants vest in these agreements based on their years of service subsequent to being covered under these agreements.
The accrued obligation of $14.4 million and $14.8 million as of December 31, 2019 and 2018, respectively, is included in other liabilities and accrued expenses in the accompanying consolidated statements of financial condition. The Company recognized compensation expense of $792 thousand and $571 thousand related to these agreements for the years ended December 31, 2019 and 2018, respectively.
The Company has purchased insurance on the lives of the participants to help offset the cost of the benefits accrued under these agreements and provide death benefits to fund obligations in the event an employee dies prior to retirement. The cash surrender value of such policies was $18.0 million and $17.9 million at December 31, 2019 and 2018, respectively, and is reflected in prepaid expenses and other assets in the accompanying consolidated statements of financial condition. Earnings on these life insurance policies were $164 thousand and $181 thousand for the years ended December 31, 2019 and 2018, respectively.
401(k) Plan
The Company maintains a 401(k) Savings Plan for substantially all employees age 18 or older who have completed at least six months of service. Employees may contribute up to the maximum statutory allowable contribution which was $19,000 and $18,500 for 2019 and 2018, respectively. The Company matches 100% of employee salary contribution deferrals up to 3% of pay, plus 50% of employee salary contribution deferrals from 3% to 5% of pay for each payroll period. Company contributions for the years ended December 31, 2019 and 2018 were $1.0 million and $925 thousand, respectively.
101
Other Awards
In connection with a stock appreciation rights plan that was terminated on December 31, 2010, the Company has a liability for undistributed participant awards. The awards earn interest at the Company’s 12-month jumbo certificate of deposit account rate until distributed. The interest rate may adjust monthly and equaled 1.00% and 1.10% at December 31, 2019 and 2018, respectively. At December 31, 2019 and 2018, the liability for undistributed amounts totaled approximately $588 thousand and $937 thousand, respectively, and is included in other liabilities and accrued expenses in the consolidated statements of financial condition. Interest expense recorded on deferred cash payments for the years ended December 31, 2019 and 2018 totaled $8 thousand and $11 thousand, respectively. All undistributed awards will be fully paid by March 2021.
Phantom Stock Plan
On January 1, 2011, the Company established the Luther Burbank Corporation Phantom Stock Plan ("Plan") under which the Company awards phantom stock ("PS") to certain key executives and nonemployee directors. Each PS award entitles the holder to receive an amount in cash equal to the future value of each award. As defined in the Plan, the award value for unvested employee and nonemployee director awards is equal to the book value of the Company plus discretionary dividends of the Company paid since December 31, 2010, divided by the total number of common shares outstanding. Once fully vested, awards that were deferred earn interest at the Company’s 12-month jumbo certificate of deposit account rate until distributed. The interest rate may adjust monthly and equaled 1.00% and 1.10% at December 31, 2019 and 2018, respectively.
Awards issued prior to January 1, 2014 vest over a period established by the Board of Directors which is set at 80% at the end of four years of service and 100% at the end of five years of service. Beginning January 1, 2014, awards issued to Directors of the Company vest 100% after one year while management awards continue to vest at 80% at the end of four years of service and 100% at the end of five years of service. Each award will be settled on the five years anniversary of the award date or at such later date that may have been elected by the participant.
The Company recognizes the share-based compensation liability as that portion of the value of the award that corresponds to the percentage of requisite service rendered at the reporting date. Because the fair market value will be re-measured at each reporting date through the date of vesting or settlement, compensation cost recognized during each year of the vesting periods will vary based on changes in the book value and total discretionary dividends of the Company.
On December 7, 2017, in connection with the Company’s IPO, all unvested phantom stock awards held by employees and all vested and unvested phantom stock awards held by nonemployee directors were converted to restricted stock units on a per share basis. This conversion was accounted for as a modification of share based compensation wherein compensation was changed from a liability based plan to an equity based plan. In conjunction with this modification, the Company transferred $6.4 million of its existing PS liability to common stock.
At December 31, 2019 and 2018, the PS share-based liability totaled approximately $776 thousand and $2.2 million, respectively, and is included in other liabilities and accrued expenses in the consolidated statements of financial condition. Share-based compensation expense recognized for the years ended December 31, 2019 and 2018 totaled approximately $15 thousand and $41 thousand, respectively.
The following table shows phantom stock award activity and the balance of share equivalents outstanding as of the periods indicated:
Years Ended December 31, | ||||||
2019 | 2018 | |||||
Beginning balance – awards outstanding | 215,362 | 237,400 | ||||
Share equivalents exercised | (145,154 | ) | (22,038 | ) | ||
Ending balance – awards outstanding | 70,208 | 215,362 | ||||
At December 31, 2019 and 2018, 70,208 and 215,362 share equivalents issued and outstanding under the PS plan were vested, respectively. The Company does not intend to issue any additional awards under the phantom stock plan.
102
15. | STOCK BASED COMPENSATION |
The Company’s stock based compensation consists of restricted stock awards ("RSAs") and restricted stock units ("RSUs") granted under the Luther Burbank Corporation Omnibus Equity and Incentive Compensation Plan ("Omnibus Plan"). In connection with its IPO in December 2017, the Company granted RSAs and RSUs to employees and nonemployee directors which all vest ratably over three years. At the same time, the Company granted RSUs in exchange for unvested phantom stock awards held by employees and all vested and unvested phantom stock awards held by nonemployee directors on a per share basis. The RSUs were subjected to the same vesting schedule and deferral elections that existed for the original phantom stock awards.
Awards granted subsequent to the IPO vest ratably over one year for nonemployee directors and ratably over three to four years for employees.
All RSAs and RSUs were granted at the fair value of the common stock at the time of the award. The RSAs and RSUs are considered fixed awards as the number of shares and fair value are known at the date of grant and the fair value at the grant date is amortized over the vesting and/or service period.
Non-cash stock compensation expense recognized for RSAs and RSUs for the years ended December 31, 2019 and 2018 totaled $3.0 million and $4.4 million, respectively. The fair value of RSAs and RSUs that vested during the years ended December 31, 2019 and 2018 was $7.0 million and $3.8 million, respectively.
As of December 31, 2019 and 2018, there was $3.5 million and $4.3 million, respectively, of unrecognized compensation expense related to 582,940 and 985,869 unvested shares of RSAs and RSUs, respectively, which amounts are expected to be recognized over a weighted average period of 1.61 years and 1.91 years, respectively. As of December 31, 2019 and 2018, 135,059 and 169,490 shares, respectively, of RSUs were vested and remain unsettled per the original deferral elections.
The following table summarizes share information about restricted stock awards and restricted stock units:
Years Ended December 31, | |||||||||||||||
2019 | 2018 | ||||||||||||||
Number of Shares | Weighted Average Grant Date Fair Value | Number of Shares | Weighted Average Grant Date Fair Value | ||||||||||||
Beginning of the period balance | 1,155,359 | $ | 10.97 | 1,319,700 | $ | 10.75 | |||||||||
Shares granted | 321,784 | 9.80 | 131,140 | 12.77 | |||||||||||
Shares settled | (672,504 | ) | 10.92 | (272,080 | ) | 10.75 | |||||||||
Shares forfeited | (86,640 | ) | 10.67 | (23,401 | ) | 10.75 | |||||||||
End of the period balance | 717,999 | $ | 10.53 | 1,155,359 | $ | 10.97 | |||||||||
Under its Omnibus Plan, the Company reserved 3,360,000 shares of common stock for new awards. At December 31, 2019 and 2018, there were 2,332,775 and 2,581,960 shares, respectively, of common stock reserved and available for grant through restricted stock or other awards under the Omnibus Plan. During the year ended December 31, 2019, there were 14,041 shares of forfeited RSU awards that were initially issued to replace unvested phantom stock awards under the Luther Burbank Corporation Phantom Stock Plan. These awards were excluded from the shares reserved and available for grant under the Omnibus Plan.
16. | FAIR VALUE MEASUREMENTS |
Fair Value Measurements
Fair Value Hierarchy
The Company groups its assets and liabilities measured at fair value in three levels, based on the markets in which the assets and liabilities are traded and the reliability of the assumptions used to determine fair value. Valuations within these levels are based upon:
103
Level 1 - Quoted market prices for identical instruments traded in active exchange markets.
Level 2 - Quoted prices for similar instruments in active markets, quoted prices for identical or similar instruments in markets that are not active, and model-based valuation techniques for which all significant assumptions are observable or can be corroborated by observable market data.
Level 3 - Model-based techniques that use at least one significant assumption not observable in the market. These unobservable assumptions reflect the Company’s estimates of assumptions that market participants would use on pricing the asset or liability. Valuation techniques include management judgment and estimation which may be significant.
Because broadly traded markets do not exist for most of the Company’s financial instruments, the fair value calculations attempt to incorporate the effect of current market conditions at a specific time. These determinations are subjective in nature, involve uncertainties and matters of significant judgment and do not include tax ramifications; therefore, the results cannot be determined with precision, substantiated by comparison to independent markets and may not be realized in an actual sale or immediate settlement of the instruments. There may be inherent weaknesses in any calculation technique, and changes in the underlying assumptions used, including discount rates and estimates of future cash flows, could significantly affect the results. For all of these reasons, the aggregation of the fair value calculations presented herein do not represent, and should not be construed to represent, the underlying value of the Company.
Management monitors the availability of observable market data to assess the appropriate classification of assets and liabilities within the fair value hierarchy. Changes in economic conditions or model-based valuation techniques may require the transfer of financial instruments from one fair value level to another. In such instances, the transfer is reported at the beginning of the reporting period. Management evaluates the significance of transfers between levels based upon the nature of the financial instrument and size of the transfer relative to total assets, total liabilities, or total earnings.
The following methods and assumptions were used to estimate the fair value of financial instruments:
For cash and cash equivalents, accrued interest receivable and payable, demand deposits and short-term borrowings, the carrying amount is estimated to be fair value. The fair value of accrued interest receivable/payable balances are determined using inputs and fair value measurements commensurate with the asset or liability from which the accrued interest is generated.
Fair values for available for sale and held to maturity debt securities, which include primarily debt securities issued by U.S. government sponsored agencies, are based on quoted market prices for similar securities.
Fair values for equity securities, which consist of investments in the CRA Qualified Investment Fund, are based on quoted market prices.
Loans are valued using the exit price notion. The fair value is estimated using market quotes for similar assets or the present value of future cash flows, discounted using a market rate for similar products and giving consideration to estimated prepayment risk and credit risk. The fair value of loans is determined utilizing estimates resulting in a Level 3 classification.
Impaired loans are measured for impairment based on the present value of expected future cash flows discounted at the loans' effective interest rate, except that as a practical expedient, the Company may measure impairment based on a loan’s observable market price, or the fair value of the collateral (net of estimated costs to sell) if the loan is collateral dependent. The fair value of impaired loans is determined utilizing estimates resulting in a Level 3 classification.
It was not practicable to determine the fair value of FHLB stock due to restrictions placed on its transferability.
The fair value of servicing rights is determined using a valuation model that utilizes interest rate, prepayment speed, and default rate assumptions that market participants would use in estimating future net servicing income and that can be validated against available market data.
The fair values of derivatives are based on valuation models using observable market data as of the measurement date.
Fair values for fixed-rate time deposits are estimated using discounted cash flow analyses using interest
104
rates offered at each reporting date by the Company for time deposits with similar remaining maturities. For deposits with no contractual maturity, the fair value is assumed to equal the carrying value.
The fair value of FHLB advances is estimated based on discounting the future cash flows using the market rate currently offered for similar terms.
The fair value of subordinated debentures is based on an indication of value provided by a third-party broker.
For senior debt, the fair value is based on an indication of value provided by a third-party broker.
Fair Value of Financial Instruments
The carrying and estimated fair values of the Company’s financial instruments are as follows:
Fair Level Measurements Using | |||||||||||||||||||
(Dollars in thousands) | Carrying Amount | Fair Value | Level 1 | Level 2 | Level 3 | ||||||||||||||
As of December 31, 2019: | |||||||||||||||||||
Financial assets: | |||||||||||||||||||
Cash and cash equivalents | $ | 88,565 | $ | 88,565 | $ | 88,565 | $ | — | $ | — | |||||||||
Debt securities: | |||||||||||||||||||
Available for sale | 625,074 | 625,074 | — | 625,074 | — | ||||||||||||||
Held to maturity | 10,170 | 10,349 | — | 10,349 | — | ||||||||||||||
Equity securities | 11,782 | 11,782 | — | 11,782 | — | ||||||||||||||
Loans receivable, net | 6,194,976 | 6,346,496 | — | — | 6,346,496 | ||||||||||||||
Accrued interest receivable | 20,814 | 20,814 | 26 | 1,685 | 19,103 | ||||||||||||||
FHLB stock | 30,342 | N/A | N/A | N/A | N/A | ||||||||||||||
Interest rate swap | 1,243 | 1,243 | — | 1,243 | — | ||||||||||||||
Financial liabilities: | |||||||||||||||||||
Deposits | $ | 5,234,717 | $ | 5,253,511 | $ | 1,558,029 | $ | 3,695,482 | $ | — | |||||||||
FHLB advances | 978,702 | 996,860 | — | 996,860 | — | ||||||||||||||
Junior subordinated deferrable interest debentures | 61,857 | 59,272 | — | 59,272 | — | ||||||||||||||
Senior debt | 94,416 | 99,806 | — | 99,806 | — | ||||||||||||||
Accrued interest payable | 2,901 | 2,901 | — | 2,901 | — | ||||||||||||||
Interest rate swap | 748 | 748 | — | 748 | — | ||||||||||||||
As of December 31, 2018: | |||||||||||||||||||
Financial assets: | |||||||||||||||||||
Cash and cash equivalents | $ | 91,697 | $ | 91,697 | $ | 91,697 | $ | — | $ | — | |||||||||
Debt securities: | |||||||||||||||||||
Available for sale | 608,528 | 608,528 | 976 | 607,552 | — | ||||||||||||||
Held to maturity | 11,860 | 11,625 | — | 11,625 | — | ||||||||||||||
Equity securities | 11,438 | 11,438 | — | 11,438 | — | ||||||||||||||
Loans receivable, net | 6,096,316 | 6,092,885 | — | — | 6,092,885 | ||||||||||||||
Accrued interest receivable | 20,220 | 20,220 | 62 | 1,739 | 18,419 | ||||||||||||||
FHLB stock | 31,823 | N/A | N/A | N/A | N/A | ||||||||||||||
Financial liabilities: | |||||||||||||||||||
Deposits | $ | 5,001,040 | $ | 4,957,054 | $ | 1,703,607 | $ | 3,253,447 | $ | — | |||||||||
FHLB advances | 1,143,132 | 1,144,326 | — | 1,144,326 | — | ||||||||||||||
Junior subordinated deferrable interest debentures | 61,857 | 56,596 | — | 56,596 | — | ||||||||||||||
Senior debt | 94,293 | 99,673 | — | 99,673 | — | ||||||||||||||
Accrued interest payable | 4,307 | 4,307 | — | 4,307 | — | ||||||||||||||
105
These estimates do not reflect any premium or discount that could result from offering the Company’s entire holdings of a particular financial instrument for sale at one time, nor do they attempt to estimate the value of anticipated future business related to the instruments. In addition, the tax ramifications related to the realization of unrealized gains and losses can have a significant effect on fair value estimates and have not been considered in any of these estimates.
Assets and Liabilities Recorded at Fair Value
The following table presents information about the Company’s assets and liabilities measured at fair value on a recurring and nonrecurring basis as of December 31, 2019 and 2018.
Recurring Basis
The Company is required or permitted to record the following assets and liabilities at fair value on a recurring basis (dollars in thousands):
Description | Fair Value | Level 1 | Level 2 | Level 3 | |||||||||||
As of December 31, 2019: | |||||||||||||||
Financial Assets: | |||||||||||||||
Available for sale debt securities: | |||||||||||||||
Government and Government Sponsored Entities: | |||||||||||||||
Residential MBS and CMOs | $ | 145,192 | $ | — | $ | 145,192 | $ | — | |||||||
Commercial MBS and CMOs | 356,169 | — | 356,169 | — | |||||||||||
Agency bonds | 123,713 | — | 123,713 | — | |||||||||||
Total available for sale debt securities | $ | 625,074 | — | $ | 625,074 | — | |||||||||
Equity securities | $ | 11,782 | $ | — | $ | 11,782 | $ | — | |||||||
Mortgage servicing rights | $ | 2,657 | $ | — | $ | — | $ | 2,657 | |||||||
Interest rate swap | $ | 1,243 | $ | — | $ | 1,243 | $ | — | |||||||
Financial Liabilities: | |||||||||||||||
Interest rate swap | $ | 748 | $ | — | $ | 748 | $ | — | |||||||
As of December 31, 2018: | |||||||||||||||
Financial Assets: | |||||||||||||||
Available for sale debt securities: | |||||||||||||||
Government and Government Sponsored Entities: | |||||||||||||||
Residential MBS and CMOs | $ | 192,113 | $ | — | $ | 192,113 | $ | — | |||||||
Commercial MBS and CMOs | 292,951 | — | 292,951 | — | |||||||||||
Agency bonds | 122,488 | — | 122,488 | — | |||||||||||
U.S. Treasury | 976 | 976 | — | — | |||||||||||
Total available for sale debt securities | $ | 608,528 | $ | 976 | $ | 607,552 | $ | — | |||||||
Equity securities | $ | 11,438 | $ | — | $ | 11,438 | $ | — | |||||||
Mortgage servicing rights | $ | 3,463 | $ | — | $ | — | $ | 3,463 | |||||||
There were no transfers between Level 1 and Level 2 during 2019 and 2018.
106
Non-recurring Basis
The Company may be required, from time to time, to measure certain assets and liabilities at fair value on a non-recurring basis. These include assets that are measured at the lower of cost or market value that were recognized at fair value which was below cost at the reporting date (dollars in thousands):
Description | Fair Value | Level 1 | Level 2 | Level 3 | |||||||||||
As of December 31, 2019: | |||||||||||||||
Impaired loans: | |||||||||||||||
Single family residential | $ | 790 | $ | — | $ | — | $ | 790 | |||||||
At December 31, 2019, an impaired loan of $1.6 million was adjusted to a fair value of $790 thousand by recording an allowance for loan losses of $790 thousand. As of December 31, 2018, there were no assets or liabilities measured at fair value on a non-recurring basis. The fair value of impaired, collateral dependent loans is estimated at the fair value of the underlying collateral, less estimated selling costs. These loans are categorized as Level 3 due to ongoing real estate market conditions which may require the use of unobservable inputs and assumptions in fair value measurements.
The Company held no real estate owned at December 31, 2019 and 2018.
17. | VARIABLE INTEREST ENTITIES ("VIE") |
The Company is involved with VIEs through its loan securitization activities. The Company evaluated its association with VIEs for consolidation purposes. Specifically, a VIE is to be consolidated by its primary beneficiary, the entity that has both the power to direct the activities that most significantly impact the VIE and a variable interest that could potentially be significant to the VIE. A variable interest is a contractual, ownership or other interest whose value fluctuates with the changes in the value of the VIE's assets and liabilities. The assessment includes an evaluation of the Company's continuing involvement with the VIE and the nature and significance of its variable interests.
Multifamily loan securitization
With respect to the securitization transaction with Freddie Mac which settled September 27, 2017, the Company's variable interests reside with a reimbursement agreement entered into with Freddie Mac that obligates the Bank to reimburse Freddie Mac for any defaulted contractual principal and interest payments identified after the ultimate resolution of the defaulted loans. Such reimbursement obligations are not to exceed 10% of the original principal amount of the loans comprising the securitization pool. As part of the securitization transaction, the Bank released all servicing obligations and rights to Freddie Mac who was designated as the Master Servicer. As Master Servicer, Freddie Mac appointed the Bank with sub-servicing obligations, which include obligations to collect and remit payments of principal and interest, manage payments of taxes and insurance, and otherwise administer the underlying loans. The servicing of defaulted loans and foreclosed loans was assigned to a separate third party entity, independent of the Bank and Freddie Mac. Freddie Mac, in its capacity as Master Servicer, can terminate the Bank in its role as sub-servicer and direct such responsibilities accordingly. In evaluating the variable interests and continuing involvement in the VIE, the Company determined that it does not have the power to make significant decisions or direct the activities that most significantly impact the economic performance of the VIE's assets and liabilities. As sub-servicer of the loans, the Bank does not have the authority to make significant decisions that influence the value of the VIE's net assets and therefore, is not the primary beneficiary of the VIE. Therefore, the Company determined that the VIE associated with the multifamily securitization should not be included in the consolidated financial statements of the Bank.
The Company believes its maximum exposure to loss as a result of involvement with the VIE associated with the securitization under the reimbursement agreement executed with Freddie Mac is 10% of the original principal amount of the loans comprising the securitization pool, or $62.6 million. The reserve for estimated losses with respect to the reimbursement obligation totaled $1.0 million and $1.4 million as of December 31, 2019 and 2018, respectively, based upon an analysis of quantitative and qualitative data over the underlying loans included in the securitization pool. No disbursements have been made in connection with the reimbursement obligation.
107
18. | LOAN SALE AND SECURITIZATION ACTIVITIES |
The Company sells originated and acquired loans as part of its business operations and overall management of liquidity, assets and liabilities, and financial performance. The transfer of loans is executed in securitization or sale transactions. With respect to sale transactions, the Company's continuing involvement may or may not include ongoing servicing responsibilities and general representations and warranties. With respect to securitization sales, the Company executed its first and only transaction on September 27, 2017 with Freddie Mac. The transaction involved the sale of $626 million in originated multifamily loans through a Freddie Mac sponsored transaction. The Company's continuing involvement includes sub-servicing responsibilities, general representations and warranties, and a limited reimbursement obligation.
As sub-servicer for Freddie Mac, the Bank is required to maintain a minimum net worth in accordance with GAAP of not less than $2.0 million. If Luther Burbank Savings’ capital were to fall below this threshold, Freddie Mac would have the authority to terminate and assume the Bank’s sub-servicing duties. At December 31, 2019, the Bank’s net worth was $753.7 million which equates to its Tier 1 capital of $748.9 million plus goodwill of $3.3 million and accumulated other comprehensive income related to net unrealized gains on available for sale securities of $1.4 million.
General representations and warranties associated with loan sales and securitization sales require the Bank to uphold various assertions that pertain to the underlying loans at the time of the transaction, including, but not limited to, compliance with relevant laws and regulations, absence of fraud, enforcement of liens, no environmental damages, and maintenance of relevant environmental insurance. Such representations and warranties are limited to those that do not meet the quality represented at the transaction date and do not pertain to a decline in value or future payment defaults. In circumstances where the Bank breaches its representations and warranties, the Bank would generally be required to cure such instances through a repurchase or substitution of the subject loan(s).
With respect to the securitization transaction, the Bank also has continuing involvement through a reimbursement agreement executed with Freddie Mac. To the extent the ultimate resolution of defaulted loans results in contractual principal and interest payments that are deficient, the Bank is obligated to reimburse Freddie Mac for such amounts, not to exceed 10% of the original principal amount of the loans comprising the securitization pool at the closing date of September 27, 2017.
The following table provides cash flows associated with the Company's loan sale activities:
Years Ended December 31, | |||||||
(Dollars in thousands) | 2019 | 2018 | |||||
Proceeds from loan sales | $ | 68,809 | $ | 19,604 | |||
Servicing fees | 1,284 | 1,536 | |||||
The following table provides information about the loans transferred through sales or securitization and not recorded on the consolidated statements of financial condition, for which the Company's continuing involvement includes sub-servicing or servicing responsibilities and/or reimbursement obligations:
(Dollars in thousands) | Single Family Residential | Multifamily Residential | |||||
As of December 31, 2019: | |||||||
Principal balance of loans | $ | 24,146 | $ | 489,333 | |||
Loans 90+ days past due | — | — | |||||
Charge-offs, net | — | — | |||||
As of December 31, 2018: | |||||||
Principal balance of loans | 26,200 | 611,308 | |||||
Loans 90+ days past due | — | — | |||||
Charge-offs, net | — | — | |||||
108
19. | COMMITMENTS AND CONTINGENCIES |
Financial Instruments With Off-Balance Sheet Risk
The Company is a party to financial instruments with off-balance sheet risk in the normal course of business to meet the financing needs of its customers. These financial instruments represent commitments to originate fixed and variable rate loans and loans in process, and involve, to varying degrees, credit risk and interest risk in excess of the amount recognized in the Company’s consolidated statements of financial condition. The Company’s exposure to credit loss in the event of nonperformance by the other party for commitments to extend credit and lines of credit is represented by the contractual amount of those instruments. The Company uses the same credit policies in making commitments to originate loans as it does for on-balance sheet instruments. As it relates to interest risk, the Company's exposure is generally limited to increases in interest rates that may result during the short period of time between the commitment and funding of fixed rate credit facilities and adjustable rate credit facilities with initial fixed rate periods. The limited timing risk associated with these credit facilities are considered within the Company's asset liability management process.
Commitments to fund loans are agreements to lend to a customer as long as there is no violation of any condition established in the contract. Commitments generally have expiration dates or other termination clauses. In addition, external market forces may impact the probability of commitments being exercised; therefore, total commitments outstanding do not necessarily represent future cash requirements.
At December 31, 2019 and 2018, the Company had outstanding commitments of approximately $103.2 million and $70.9 million, respectively, for loans. Unfunded loan commitment reserves totaled $89 thousand and $52 thousand at December 31, 2019 and 2018, respectively.
Operating Leases
The Company leases various office premises under long-term operating lease agreements. These leases expire between 2020 and 2029, with certain leases containing either three, five or ten year renewal options. At December 31, 2019, minimum commitments under these non-cancellable leases before considering renewal options are as follows (dollars in thousands):
Years ending December 31, | |||
2020 | $ | 4,442 | |
2021 | 4,419 | ||
2022 | 3,492 | ||
2023 | 2,253 | ||
2024 | 1,278 | ||
Thereafter | 2,611 | ||
Total | $ | 18,495 | |
Rent expense under operating leases was $5.4 million and $5.3 million for the years ended December 31, 2019 and 2018, respectively. Sublease income earned was $730 thousand and $788 thousand for the years ended December 31, 2019 and 2018, respectively.
Contingencies
At present, there are no pending or threatened proceedings against the Company which, if determined adversely, would have a material effect on the Company’s business, financial position, results of operations, cash flows or stock price. In the ordinary course of operations, the Company may be party to various legal proceedings.
Correspondent Banking Agreements
The Company maintains funds on deposit with other federally insured financial institutions under correspondent banking agreements. At December 31, 2019 and 2018, the Company had $25.7 million and $736 thousand, respectively, in uninsured cash balances. The Company periodically monitors the financial condition of these correspondent banks.
109
20. | UNAUDITED QUARTERLY FINANCIAL INFORMATION |
The following table summarizes the unaudited condensed consolidated results of operations for each of the quarters during the fiscal years ended December 31, 2019 and 2018:
(Dollars in thousands, except per share data) | For the Three Months Ended | ||||||||||||||
March 31 | June 30 | September 30 | December 31 | ||||||||||||
2019 | |||||||||||||||
Net interest income | $ | 32,092 | $ | 30,568 | $ | 32,585 | $ | 33,162 | |||||||
Provision for (recapture of) loan losses | 300 | 450 | (500 | ) | 1,000 | ||||||||||
Net interest income after provision for loan losses | 31,792 | 30,118 | 33,085 | 32,162 | |||||||||||
Noninterest income | 1,380 | 1,488 | 993 | 814 | |||||||||||
Noninterest expense | 16,249 | 14,709 | 16,069 | 15,341 | |||||||||||
Income before income taxes | 16,923 | 16,897 | 18,009 | 17,635 | |||||||||||
Income tax expense | 4,913 | 5,239 | 5,273 | 5,178 | |||||||||||
Net income | $ | 12,010 | $ | 11,658 | $ | 12,736 | $ | 12,457 | |||||||
EPS (1): | |||||||||||||||
Basic | $ | 0.21 | $ | 0.21 | $ | 0.23 | $ | 0.22 | |||||||
Diluted | $ | 0.21 | $ | 0.21 | $ | 0.23 | $ | 0.22 | |||||||
2018 | |||||||||||||||
Net interest income | $ | 30,465 | $ | 31,159 | $ | 31,712 | $ | 31,751 | |||||||
Provision for loan losses | 1,500 | 1,300 | 650 | 150 | |||||||||||
Net interest income after provision for loan losses | 28,965 | 29,859 | 31,062 | 31,601 | |||||||||||
Noninterest income | 1,025 | 817 | 1,043 | 1,246 | |||||||||||
Noninterest expense | 14,713 | 14,922 | 15,090 | 17,962 | |||||||||||
Income before income taxes | 15,277 | 15,754 | 17,015 | 14,885 | |||||||||||
Income tax expense | 4,175 | 4,528 | 4,886 | 4,282 | |||||||||||
Net income | $ | 11,102 | $ | 11,226 | $ | 12,129 | $ | 10,603 | |||||||
EPS (1): | |||||||||||||||
Basic | $ | 0.20 | $ | 0.20 | $ | 0.22 | $ | 0.19 | |||||||
Diluted | $ | 0.20 | $ | 0.20 | $ | 0.21 | $ | 0.19 | |||||||
(1) The quarterly EPS amounts, when added, may not coincide with the full fiscal year EPS reported on the Consolidated Statements of Income due to differences in the computed weighted average shares outstanding as well as rounding differences. | |||||||||||||||
110
21. | PARENT COMPANY ONLY FINANCIAL INFORMATION |
Summary parent company only financial information for the years ended December 31, 2019 and 2018 is as follows (dollars in thousands):
CONDENSED STATEMENTS OF FINANCIAL CONDITION
December 31, | |||||||
2019 | 2018 | ||||||
ASSETS | |||||||
Cash and cash equivalents | $ | 15,170 | $ | 9,224 | |||
Investment in Bank | 753,658 | 727,073 | |||||
Investment in Burbank Financial, Inc. | 276 | 249 | |||||
Investment in Luther Burbank Statutory Trusts 1 & 2 | 1,857 | 1,857 | |||||
Receivable from Bank | 21 | 21 | |||||
Other assets | 7 | 6 | |||||
Total assets | $ | 770,989 | $ | 738,430 | |||
LIABILITIES AND STOCKHOLDERS' EQUITY | |||||||
Junior subordinated deferrable interest debentures | $ | 61,857 | $ | 61,857 | |||
Other borrowings | 94,416 | 94,293 | |||||
Interest payable on junior subordinated deferrable interest debentures | 92 | 109 | |||||
Other liabilities and accrued expenses | 160 | 1,026 | |||||
Stockholders' equity | 614,464 | 581,145 | |||||
Total liabilities and stockholders' equity | $ | 770,989 | $ | 738,430 | |||
CONDENSED STATEMENTS OF INCOME AND COMPREHESIVE INCOME
Years Ended December 31, | |||||||
2019 | 2018 | ||||||
Net interest expense | $ | (8,671 | ) | $ | (8,505 | ) | |
Dividend income from Bank | 34,700 | 6,800 | |||||
Other operating expense | (315 | ) | (451 | ) | |||
Income (loss) before income tax benefit and undistributed net income of subsidiaries | 25,714 | (2,156 | ) | ||||
Income tax benefit | 2,619 | 2,362 | |||||
Income before undistributed net income of subsidiaries | 28,333 | 206 | |||||
Equity in undistributed net income of subsidiaries | 20,528 | 44,854 | |||||
Net income (1) | $ | 48,861 | $ | 45,060 | |||
Comprehensive income | $ | 48,861 | $ | 45,060 | |||
(1) The group files a single tax return and the subsidiaries are treated, for federal and California tax purposes, as divisions of a single corporation. The Company’s share of income tax expense is based on the amount which would be payable or receivable if separate returns were filed. Accordingly, the Company’s equity in the net income of its subsidiaries, including the Bank, are excluded from the computation of income taxes for financial statement purposes. For the years ended December 31, 2019 and 2018, the Company provided tax at the rates of 21% and 10.84% for federal and California taxes, respectively.
111
CONDENSED STATEMENTS OF CASH FLOWS
Years Ended December 31, | |||||||
2019 | 2018 | ||||||
Cash flows from operating activities: | |||||||
Net income | $ | 48,861 | $ | 45,060 | |||
Adjustments to reconcile net income to net cash provided by operating activities: | |||||||
Equity in undistributed net income of subsidiaries | (20,528 | ) | (44,854 | ) | |||
Change in receivable from Bank | — | 6,969 | |||||
Stock based compensation | 2,993 | 4,355 | |||||
Net change in other assets and liabilities | (761 | ) | 4,309 | ||||
Net cash provided by operating activities | 30,565 | 15,839 | |||||
Cash flows from financing activities: | |||||||
Cash paid for dividends | (13,032 | ) | (15,963 | ) | |||
Shares withheld for taxes on vested restricted stock | (2,796 | ) | (769 | ) | |||
Shares repurchased | (8,791 | ) | (1,495 | ) | |||
Net cash used in financing activities | (24,619 | ) | (18,227 | ) | |||
Increase (decrease) in cash and cash equivalents | 5,946 | (2,388 | ) | ||||
Cash and cash equivalents, beginning of year | 9,224 | 11,612 | |||||
Cash and cash equivalents, end of year | $ | 15,170 | $ | 9,224 | |||
112
Item 9. Changes in and Disagreements with Accountants on Accounting and Financial Disclosure
None.
Item 9A. Controls and Procedures
As of the end of the period covered by this Annual Report on Form 10-K, the Company carried out an evaluation, under the supervision and with the participation of its management, including its Chief Executive Officer and Chief Financial Officer, of the effectiveness of the design and operation of its disclosure controls and procedures. In designing and evaluating the disclosure controls and procedures, management recognizes that any controls and procedures, no matter how well designed and operated, can provide only reasonable assurance of achieving the desired control objectives, and management was required to apply judgment in evaluating its controls and procedures. Based on this evaluation, the Company’s Chief Executive Officer and Chief Financial Officer concluded that the Company’s disclosure controls and procedures (as defined in Rules 13a-15(e) and 15d-15(e) under the Exchange Act) were effective as of the end of the period covered by this report. See Exhibits 31 and 32 for the Certification statements issued by the Company’s Chief Executive Officer and Chief Financial Officer, respectively.
Changes in Internal Control over Financial Reporting - There were no changes in the Company’s internal control over financial reporting (as such term is defined in Rules 13a-15(f) and 15d-15(f) under the Exchange Act) during the quarter ended December 31, 2019, that have materially affected, or are reasonably likely to materially affect, the Company’s internal control over financial reporting.
Report on Management’s Assessment of Internal Controls over Financial Reporting - Management of the Company is responsible for establishing and maintaining adequate internal control over financial reporting (as defined in Rules 13a-15(e) and 15d-15(e) under the Exchange Act). Our internal control system is a process designed to provide reasonable assurance regarding the preparation and fair presentation of published financial statements in accordance with GAAP. All internal control systems, no matter how well designed, have inherent limitations and can only provide reasonable assurance with respect to financial reporting.
As of December 31, 2019, management assessed the effectiveness of the Company’s internal control over financial reporting based on the criteria for effective internal control over financial reporting established in “Internal Control-Integrated Framework,” issued by the Committee of Sponsoring Organizations of the Treadway Commission in 2013. Based on this assessment, management determined that the Company maintained effective internal control over financial reporting as of December 31, 2019.
Crowe LLP, the independent registered public accounting firm, audited the consolidated financial statements of the Company included in this Annual Report on Form 10-K. Their report is included in Part II, Item 8, under the heading “Report of Independent Registered Public Accounting Firm.” Pursuant to SEC rules applicable to emerging growth companies, this Annual Report on Form 10-K does not include an audit report on internal control over financial reporting from the Company's independent registered public accounting firm.
Item 9B. Other Information
None.
113
PART III.
Item 10. Directors, Executive Officers and Corporate Governance
The information required by this Item will be presented in, and is incorporated herein by reference to, Luther Burbank Corporation's Definitive Proxy Statement for the 2020 Annual Meeting of Shareholders which will be filed with the SEC within 120 days of December 31, 2019.
Item 11. Executive Compensation
The information required by this Item will be presented in, and is incorporated herein by reference to, Luther Burbank Corporation's Definitive Proxy Statement for the 2020 Annual Meeting of Shareholders which will be filed with the SEC within 120 days of December 31, 2019.
Item 12. Security Ownership of Certain Beneficial Owners and Management and Related Stockholder Matters
Securities Authorized for Issuance Under Equity Compensation Plans
The following table sets forth information regarding outstanding options and other rights to purchase or acquire common stock granted under the Company's compensation plans as of December 31, 2019:
Equity Compensation Plan Information
Plan category | Number of securities to be issued upon exercise of outstanding options, warrants and rights | Weighted average exercise price of outstanding options, warrants and rights | Number of securities remaining available for future issuance under equity compensation plans excluding securities reflected in column (a) | ||||||
(a) | (b) | (c) | |||||||
Equity compensation plans approved by security holders (1) | N/A | N/A | 2,332,775 | ||||||
Equity compensation plans not approved by security holders | — | — | — | ||||||
Total | — | — | 2,332,775 | ||||||
(1) | Consists of the Company's Omnibus Equity and Incentive Compensation Plan. For additional information, see Notes 14 and 15 to the Consolidated Financial Statements. |
The remainder of the information required by this Item will be presented in, and is incorporated herein by reference to, Luther Burbank Corporation's Definitive Proxy Statement for the 2020 Annual Meeting of Shareholders which will be filed with the SEC within 120 days of December 31, 2019.
Item 13. Certain Relationships and Related Transactions, and Director Independence
The information required by this Item will be presented in, and is incorporated herein by reference to, Luther Burbank Corporation's Definitive Proxy Statement for the 2020 Annual Meeting of Shareholders which will be filed with the SEC within 120 days of December 31, 2019.
Item 14. Principal Accountant Fees and Services
The information required by this Item will be presented in, and is incorporated herein by reference to, Luther Burbank Corporation's Definitive Proxy Statement for the 2020 Annual Meeting of Shareholders which will be filed with the SEC within 120 days of December 31, 2019.
114
PART IV.
Item 15. Exhibits, Financial Statement Schedules.
(a)(1) Financial Statements
The following consolidated financial statements of Luther Burbank Corporation and our subsidiaries and related reports of our independent public accounting firm are incorporated by reference from Part II, Item 8. Financial Statements and Supplementary Data of the Report.
Report of Independent Registered Public Accounting Firm - Crowe LLP
Consolidated Financial Statements
Consolidated Statements of Financial Condition as of December 31, 2019 and 2018
Consolidated Statements of Income for the years ended December 31, 2019 and 2018
Consolidated Statements of Comprehensive Income for the years ended December 31, 2019 and 2018
Consolidated Statements of Shareholders' Equity for the years ended December 31, 2019 and 2018
Consolidated Statements of Cash Flows for the years ended December 31, 2019 and 2018
Notes to Consolidated Financial Statements
(2) Financial Statement Schedules
No financial statement schedules are provided because the information called for is not applicable or not required or the required information is shown either in the Consolidated Financial Statements or the Notes thereto.
(3) Exhibits
Incorporated by Reference | ||||||||||||
Exhibit Number | Description | Filed Herewith | Form | File No. | Exhibit | Filing Date | ||||||
3.1 | S-1 | 333-221455 | 3.1 | 11/9/2017 | ||||||||
3.2 | S-1 | 333-221455 | 3.2 | 11/9/2017 | ||||||||
4.1 | S-1 | 333-221455 | 4.1 | 11/9/2017 | ||||||||
Pursuant to Item 601(b) (4) (iii) (A) of Regulation S-K, copies of instruments defining the rights of holders of long-term debt and preferred securities are not filed. The Company agrees to furnish a copy thereof to the SEC upon request. | ||||||||||||
4.2 | X | |||||||||||
10.1 | S-1 | 333-221455 | 10.2 | 11/9/2017 | ||||||||
10.2 | S-1 | 333-221455 | 10.3 | 11/9/2017 | ||||||||
10.3 | S-1 | 333-221455 | 10.4 | 11/9/2017 | ||||||||
10.4 | S-1 | 333-221455 | 10.5 | 11/9/2017 | ||||||||
10.5 | S-1 | 333-221455 | 10.6 | 11/9/2017 | ||||||||
115
Incorporated by Reference | ||||||||||||
Exhibit Number | Description | Filed Herewith | Form | File No. | Exhibit | Filing Date | ||||||
10.6 | S-1 | 333-221455 | 10.7 | 11/9/2017 | ||||||||
10.7 | S-1 | 333-221455 | 10.8 | 11/9/2017 | ||||||||
10.8 | S-1 | 333-221455 | 10.9 | 11/9/2017 | ||||||||
10.9 | S-1 | 333-221455 | 10.10 | 11/9/2017 | ||||||||
10.10 | S-1 | 333-221455 | 10.11 | 11/9/2017 | ||||||||
10.11 | S-1 | 333-221455 | 10.12 | 11/9/2017 | ||||||||
10.12 | S-1 | 333-221455 | 10.13 | 11/9/2017 | ||||||||
10.13 | S-1 | 333-221455 | 10.14 | 11/9/2017 | ||||||||
10.14 | S-1 | 333-221455 | 10.15 | 11/9/2017 | ||||||||
10.15 | 10-K | 001-38317 | 10.17 | 3/16/2018 | ||||||||
10.16 | S-1 | 333-221455 | 10.19 | 11/9/2017 | ||||||||
10.17 | S-1 | 333-221455 | 10.21 | 11/9/2017 | ||||||||
10.18 | 8-K | 001-38317 | 10.1 | 12/6/2018 | ||||||||
10.19 | 8-K | 001-38317 | 10.2 | 12/6/2018 | ||||||||
10.22 | 8-K | 001-38317 | 10.3 | 12/6/2018 | ||||||||
10.23 | 8-K | 001-38317 | 10.4 | 12/6/2018 | ||||||||
10.24 | 8-K | 001-38317 | 10.5 | 12/6/2018 | ||||||||
21 | X | |||||||||||
23.1 | X | |||||||||||
31.1 | X | |||||||||||
31.2 | X | |||||||||||
32.1 | X | |||||||||||
32.2 | X | |||||||||||
116
Incorporated by Reference | ||||||||||||
Exhibit Number | Description | Filed Herewith | Form | File No. | Exhibit | Filing Date | ||||||
101 | Pursuant to Rule 405 of Regulation S-T, the following financial information from the Company’s Annual Report on Form 10-K for the period ended December 31, 2019 is formatted in XBRL (Extensible Business Reporting Language) interactive data files: (i) the Consolidated Statements of Financial Condition, (ii) the Consolidated Statements of Income, (iii) the Consolidated Statements of Comprehensive Income, (iv) the Consolidated Statements of Changes in Stockholders' Equity, (v) the Consolidated Statements of Cash Flows, and (vi) the Notes to Consolidated Financial Statements. | X | ||||||||||
(1) Not filed in accordance with the provision of Item 601(b)(4)(v) of Regulation S-K. The Company agrees to provide a copy of these documents to the Commission upon request. | ||||||||||||
Item 16. Form 10-K Summary
Not Applicable.
117
SIGNATURES
Pursuant to the requirements of Section 13 or 15(d) of the Securities Exchange Act of 1934, the registrant has duly caused this report to be signed on its behalf by the undersigned, thereunto duly authorized.
LUTHER BURBANK CORPORATION | ||
DATED: March 11, 2020 | By: /s/ Simone Lagomarsino | |
Simone Lagomarsino | ||
President and Chief Executive Officer | ||
POWER OF ATTORNEY
We, the undersigned directors and officers of Luther Burbank Corporation (the “Company”) hereby severally constitute and appoint Simone Lagomarsino and Laura Tarantino as our true and lawful attorneys and agents, each acting alone and with full power of substitution and re-substitution, to do any and all things in our names in the capacities indicated below which said Simone Lagomarsino or Laura Tarantino may deem necessary or advisable to enable the Company to comply with the Securities Exchange Act of 1934, and any rules, regulations and requirements of the Securities and Exchange Commission, in connection with the report on Form 10-K, or amendment thereto, including specifically, but not limited to, power and authority to sign for us in our names in the capacities indicated below the report on Form 10-K, or amendment thereto; and we hereby approve, ratify and confirm all that said Simone Lagomarsino or Laura Tarantino shall do or cause to be done by virtue thereof.
Pursuant to the requirements of the Securities Exchange Act of 1934, this report on Form 10-K, has been signed by the following persons in the capacities and on the dates indicated.
Signature Position Date
/s/ SIMONE LAGOMARSINO President and Chief Executive Officer, March 11, 2020
Simone Lagomarsino Director (Principal Executive Officer)
/s/ LAURA TARANTINO Executive Vice President and Chief Financial March 11, 2020
Laura Tarantino Officer (Principal Financial & Accounting Officer)
/s/ VICTOR S. TRIONE Chairman March 11, 2020
Victor S. Trione
/s/ JOHN C. ERICKSON Director March 11, 2020
John C. Erickson
/s/ JACK KROUSKUP Director March 11, 2020
Jack Krouskup
/s/ ANITA GENTLE NEWCOMB Director March 11, 2020
Anita Gentle Newcomb
/s/ BRADLEY M. SHUSTER Director March 11, 2020
Bradley M. Shuster
/s/ THOMAS C. WAJNERT Director March 11, 2020
Thomas C. Wajnert
118