Attached files
| file | filename |
|---|---|
| EX-99.1 - EXHIBIT 99.1 - SILVERBOW RESOURCES, INC. | a201910k-exhibit991.htm |
| EX-32 - EXHIBIT 32 - SILVERBOW RESOURCES, INC. | a201910k-exhibit32.htm |
| EX-31.2 - EXHIBIT 31.2 - SILVERBOW RESOURCES, INC. | a201910k-exhibit312.htm |
| EX-31.1 - EXHIBIT 31.1 - SILVERBOW RESOURCES, INC. | a201910k-exhibit311.htm |
| EX-23.2 - EXHIBIT 23.2 - SILVERBOW RESOURCES, INC. | a201910k-exhibit232.htm |
| EX-23.1 - EXHIBIT 23.1 - SILVERBOW RESOURCES, INC. | a201910k-exhibit231.htm |
| EX-21 - EXHIBIT 21 - SILVERBOW RESOURCES, INC. | a201910k-exhibit21.htm |
| EX-4.5 - EXHIBIT 4.5 - SILVERBOW RESOURCES, INC. | a201910k-exhibit45.htm |
UNITED STATES
SECURITIES AND EXCHANGE COMMISSION
Washington, D.C. 20549
FORM 10-K
Annual Report Pursuant to Section 13 or 15(d) of the Securities Exchange Act of 1934
For the Fiscal Year Ended December 31, 2019

Commission File Number 1-8754
SILVERBOW RESOURCES, INC.
(Exact Name of Registrant as Specified in Its Charter)
Delaware (State of Incorporation) | 20-3940661 (I.R.S. Employer Identification No.) |
575 North Dairy Ashford, Suite 1200 Houston, Texas 77079 (281) 874-2700 (Address and telephone number of principal executive offices) Securities registered pursuant to Section 12(b) of the Act: | |
Title of Class | Trading Symbol(s) | Exchanges on Which Registered: |
Common Stock, par value $0.01 per share | SBOW | New York Stock Exchange |
Securities registered pursuant to Section 12(g) of the Act: None
Indicate by check mark if the registrant is a well-known seasoned issuer, as defined in Rule 405 of the Securities Act.
Yes | o | No | þ |
Indicate by check mark if the registrant is not required to file reports pursuant to Section 13 or Section 15(d) of the Securities Exchange Act of 1934.
Yes | o | No | þ |
Indicate by check mark whether the registrant (1) has filed all reports required to be filed by Section 13 or 15(d) of the Securities Exchange Act of 1934 during the preceding 12 months (or for such shorter period that the registrant was required to file such reports), and (2) has been subject to such filing requirements for the past 90 days.
Yes | þ | No | o |
Indicate by check mark whether the registrant has submitted electronically every Interactive Data File required to be submitted pursuant to Rule 405 of Regulation S-T (§232.405 of this chapter) during the preceding 12 months (or for such shorter period that the registrant was required to submit and post such files).
Yes | þ | No | o |
1
Indicate by check mark whether the registrant is a large accelerated filer, an accelerated filer, a non-accelerated filer, a smaller reporting company or an emerging growth company. See definition of “large accelerated filer,” “accelerated filer,” “smaller reporting company,” and “emerging growth company” in Rule 12b-2 of the Exchange Act.
Large accelerated filer | o | Accelerated filer | þ | Non-accelerated filer | o | Smaller reporting company | þ | |||
Emerging Growth Company | o | |||||||||
If an emerging growth company, indicate by check mark if the registrant has elected not to use the extended transition period for complying with any new or revised financial accounting standards provided pursuant to Section 13(a) of the Exchange Act. | ||||||||||
o | ||||||||||
Indicate by check mark whether the registrant is a shell company (as defined in Rule 12b-2 of the Exchange Act).
Yes | o | No | þ |
The aggregate public float of common equity held by non-affiliates computed by reference to the price at which the common equity was last sold as quoted on the New York Stock Exchange as of June 28, 2019, the last business day of June 2019, was approximately $52,690,067.
The number of shares of common stock outstanding as of January 31, 2020 was 11,807,084.
Documents incorporated by reference: Portions of the registrant’s definitive proxy statement for its 2020 annual meeting of stockholders, to be filed within 120 days after the registrant’s fiscal year end, are incorporated by reference into Part III of this Annual Report on Form 10-K.
2
Form 10-K
SilverBow Resources, Inc. and Subsidiaries
10-K Part and Item No.
Part I | Page | |
Items 1 & 2 | Business and Properties | |
Item 1A. | Risk Factors | |
Item 1B. | Unresolved Staff Comments | |
Item 3. | Legal Proceedings | |
Item 4. | Mine Safety Disclosures | |
Part II | ||
Item 5. | Market for Registrant's Common Equity, Related Stockholder Matters and Issuer Purchases of Equity Securities | |
Item 6. | Selected Financial Data | |
Item 7. | Management's Discussion and Analysis of Financial Condition and Results of Operations | |
Item 7A. | Quantitative and Qualitative Disclosures About Market Risk | |
Item 8. | Financial Statements and Supplementary Data | |
Item 9. | Changes in and Disagreements with Accountants on Accounting and Financial Disclosure | |
Item 9A. | Controls and Procedures | |
Item 9B. | Other Information | |
Part III | ||
Item 10. | Directors, Executive Officers and Corporate Governance | |
Item 11. | Executive Compensation | |
Item 12. | Security Ownership of Certain Beneficial Owners and Management and Related Stockholders Matters | |
Item 13. | Certain Relationships and Related Transactions, and Director Independence | |
Item 14. | Principal Accounting Fees and Services | |
Part IV | ||
Item 15. | Exhibits and Financial Statement Schedules | |
Item 16. | 10-K Summary | |
3
Items 1 and 2. Business and Properties
As used in this Annual Report on Form 10-K, unless the context otherwise requires or indicates, references to “SilverBow Resources,” “the Company,” “we,” “our,” “ours” and “us” refer to SilverBow Resources, Inc. See pages 30 and 31 for explanations of abbreviations and terms used herein.
Overview
SilverBow Resources is a growth-oriented independent oil and gas company headquartered in Houston, Texas. The Company, originally founded in 1979, was organized as a Delaware corporation in 2016. The Company's strategy is focused on acquiring and developing assets in the Eagle Ford Shale located in South Texas where the Company has assembled approximately 118,000 net acres across five operating areas. The Company's acreage position in each of its operating areas is highly contiguous and designed for optimal and efficient horizontal well development. The Company has built a balanced portfolio of properties with a significant base of current production and reserves coupled with low-risk development drilling opportunities and meaningful upside from newer operating areas.
The Company produced an average of 234 MMcfe per day during the fourth quarter of 2019 and had proved reserves of 1,420 Bcfe (82% natural gas) with a PV-10 of $976 million as of December 31, 2019. PV-10 Value is a non-GAAP measure; see the section titled “Oil and Natural Gas Reserves” of this Form 10-K for a reconciliation of this non-GAAP measure to the Standardized Measure of discounted future net cash flows, the most directly comparable GAAP measure.
Being a committed and long-term operator in South Texas, the Company possesses a significant understanding of the reservoir characteristics, geology, landowners and competitive landscape in the region. The Company leverages this in-depth knowledge to continue to assemble high quality drilling inventory while continuously enhancing its operations to maximize returns on capital invested.
Business Strategies
• | Leverage technical expertise to efficiently develop our extensive drilling inventory of high rate of return Eagle Ford Shale drilling locations. As of December 31, 2019, our technical team has an average of approximately 23 years of experience which we believe gives us a technical advantage when developing and organically expanding our asset base. We leverage this advantage in our existing asset base to create highly efficient drilling and completion operations. Focusing solely on the Eagle Ford play allows us to use our operating, technical and regional expertise to interpret geological and operating trends, enhance production rates and maximize well recovery. We are focused on enhancing asset value through utilizing cost-effective technology to locate the highest quality intervals to drill and complete oil and gas wells. We continue to optimize our drilling techniques, shorten our drill times and steer our laterals to target high quality intervals in the Eagle Ford. We have also enhanced fracture stimulation designs optimizing fluid and proppant usage and fracture stage spacing. These factors have further enhanced the return profile of our drilling and completion operations. Our 2020 capital budget range of $175 to $195 million provides for drilling 26 gross (25 net) horizontal wells which will be funded primarily from operating cash flow. |
• | Grow and maintain balanced inventory mix of both gas and liquids-rich locations. We believe that oil, natural gas and natural gas liquids prices have the potential to exhibit volatile and unpredictable fluctuations in price. Further, the timing and duration of such fluctuations are difficult to predict. As a result, the Company is focused on continuing to expand its liquids-rich inventory through technical advancements on existing acreage, organic leasing and bolt-on acquisitions. This strategy of diversification allows us to pursue our most economic hydrocarbon locations that in turn generate the most compelling returns, with the ability to shift our focus to locations with different hydrocarbon mixes based on prevailing prices. Given the state of the commodity price environment, the Company allocated approximately 63% of its 2019 drilling and completion budget toward liquids development. Of the 581 gross undrilled horizontal locations at year-end 2019, 233 locations are liquids-weighted and 348 locations are gas-weighted. The Company’s balanced commodity mix provides opportunity to allocate capital towards the highest rate of return locations as dictated by prices. |
• | Operate our properties as a low-cost producer. We believe our concentrated acreage position in the Eagle Ford and our experience as an operator of essentially all of our properties enables us to apply drilling and completion techniques and economies of scale that improve returns. Operating control allows us to manage pace of development, timing, and associated annual capital expenditures. Furthermore, we are able to achieve lower operating costs through concentrated infrastructure and field operations. In addition, our concentrated acreage positions allow the Company to drill multiple wells from a single pad while optimizing lateral lengths. Pad drilling reduces facilities costs and consolidates surface level operations. Our |
4
operational control is critical to our being able to transfer successful drilling and completion techniques and cost cutting initiatives from one field to another. Finally, we will continue to leverage our proximity to end-user markets of natural gas which gives us the ability to lower transportation costs relative to other basins and enhance returns to our shareholders.
• | Continue to pursue strategic opportunities to further expand our core position in the Eagle Ford. We continue to take advantage of opportunities to expand our core positions through leasing and acquisitions. We plan to strategically target certain areas of the Eagle Ford where our technical experience and successful drilling results can be replicated and expanded. We believe our extensive basin-wide experience gives us a competitive advantage in locating both strategic acquisitions and ground-floor leasing opportunities to expand our core acreage position in the future. |
• | Maintain our financial flexibility and liquidity profile. We are committed to preserving our financial flexibility and are focused on continued growth in a disciplined manner. We have historically funded our capital program by using a combination of internally generated cash flows and funds available on our Credit Facility. As of December 31, 2019, the Company had approximately $121.0 million in available borrowing capacity under our Credit Facility, which we believe, along with our projected operating cash flow, provides us with liquidity to execute our 2020 development plan and opportunistically acquire or lease additional acreage. Our Credit Facility and Second Lien, maturing in April 2022 and December 2024, respectively, are our only stated debt maturities. |
• | Manage risk exposure. We utilize a disciplined hedging program to limit our exposure to volatility in commodity prices and achieve a more predictable level of cash flows to support current and future capital expenditure plans. Our multi-year price risk management program also includes hedges to limit our basis differential to Henry Hub pricing. We take a systematic approach to hedging and periodically add hedges to our portfolio in an effort to protect the rates of returns on our drilling program. As of February 25, 2020, we had approximately 56% of total production volumes hedged for full year 2020 using the midpoint of production guidance of 215 - 228 MMcfe/d. |
Our Competitive Strengths
• | Extensive inventory of drilling locations with high degree of operational control. We have developed a significant inventory of future drilling locations. As of December 31, 2019, we had approximately 118,000 net acres in the Eagle Ford and roughly 581 gross horizontal drilling locations. Approximately 59% of our estimated proved reserves at December 31, 2019 were undeveloped. We operate essentially all of our proved reserves and have an average working interest of approximately 86% across our identified locations. These factors provide us with a high level of control over our operations, allowing us to manage our development drilling schedule, utilize pad drilling where applicable, and implement leading edge modern completion techniques. We plan to continue to deliver production, reserve and cash flow growth by developing our extensive inventory of low-risk drilling locations in a disciplined manner. |
• | Balanced portfolio mix of proved producing assets and low-risk development with significant upside from liquids-rich areas. Our average daily production for full year 2019 was 231 MMcfe/d and our proved developed reserves as of December 31, 2019 were 579 Bcfe. Our portfolio of properties and our 2020 capital plan couples this strong base of production and reserves with low risk drilling while increasing our exposure to liquids opportunities. In 2019, we brought online 11 net wells in our La Salle Condensate area and seven net wells in our McMullen Oil area and were pleased with the initial performance. Based on these results, we plan to drill and complete four net wells in our La Salle Condensate area and 21 net wells in our McMullen Oil area in 2020, which will increase our oil and natural gas liquids production from 24% at year-end 2019 to approximately 35% by year-end 2020. Furthermore, we are continuing to delineate our newest acreage position in Dimmit County. We have identified a total of 126 drilling locations in this area prospective for lower and upper Eagle Ford and plan to drill and complete two net wells in 2020. We believe that our balanced portfolio and development approach allow us to deliver low-risk production and proved reserve growth and expose our shareholders to significant upside and organic inventory expansion. |
• | Proximity to Demand Centers. Our assets are positioned in one of the most economically advantaged natural gas and oil regions of North America. Our proximity to the Gulf Coast affords us much lower commodity basis differentials and meaningfully higher price realizations when compared to other domestic basins. For instance, in 2019 our average natural gas basis differentials to NYMEX were positive $0.02/Mcf versus $1.62/Mcf discount for the Permian Basin index into the El Paso pipeline. Additionally, our assets are in close proximity to the largest and highest growth natural gas and NGL demand centers, including increasing LNG exports, natural gas exports to Mexico and industrial, petrochemical, and power demand in the Gulf Coast markets. |
• | Experienced and proven technical team. As of December 31, 2019, we employed 19 oil and gas technical professionals, including geophysicists, geologists, drilling, completion, production and reservoir engineers, and other oil and gas professionals who collectively have an average of approximately 23 years of experience in their technical fields. Our senior |
5
technical team has come from a number of large and successful organizations. Our technical team is focused on utilizing modern completion techniques to increase our estimated ultimate recovery and maximize our per-well returns. Our enhanced completion designs include tighter fracture stage spacing as well as optimized proppant loadings and intensity. Additionally, we rely on advanced technologies to better define geologic risk and enhance the results of our drilling efforts. We are a leader in drilling some of the best natural gas wells in the play. We continually apply our extensive in-house experience and current technologies to benefit our drilling and production operations.
• | Proven low cost operator with blocky and contiguous acreage. Our core acreage positions are blocky and contiguous in nature which allows us to continue to lower per unit costs through drilling longer laterals, utilizing pad drilling, consolidating in-field infrastructure, and efficiently sourcing materials through our procurement strategies. We believe the nature of our positions and our operational improvements and efficiencies will allow us to continue to successfully mitigate service cost inflation. Additionally, we continually seek to optimize our production operations with the objective of reducing our operating costs through efficient well management. Finally, our significant operational control, as well as our manageable leasehold drilling obligations, provide us the flexibility to control our costs as we transition to a development mode across our portfolio. |
• | Strong balance sheet and liquidity profile. As of December 31, 2019, the Company had approximately $121.0 million in available borrowing capacity under our Credit Facility, which we believe, along with our operating cash flow, provides us with a sufficient amount of liquidity to execute our 2020 development plan and opportunistically acquire or lease additional acreage even with modest changes in the commodity environment. Our Credit Facility and Second Lien, maturing in April 2022 and December 2024, respectively, are our only stated debt maturities. As of December 31, 2019, we had $279.0 million drawn on our $400.0 million borrowing base under the Credit Facility. |
Property Overview
The Company's operations are focused in five fields located in the Eagle Ford Shale trend of South Texas. The following table sets forth information regarding its Eagle Ford fields in 2019:
Fields | Net Acreage | 2019 Production (Mcfe/d) | Gas as % of 2019 Production | 2019 Net Wells Drilled | 2019 Net Wells Completed | ||||||||||
Artesia | 12,402 | 53,680 | 43 | % | 11 | 11 | |||||||||
AWP | 36,435 | 40,101 | 45 | % | 6 | 7 | |||||||||
Fasken | 8,393 | 104,674 | 100 | % | 7 | 9 | |||||||||
Oro Grande | 27,085 | 20,167 | 100 | % | 1 | 1 | |||||||||
Uno Mas | 17,047 | 10,193 | 96 | % | — | — | |||||||||
Other | 16,338 | 2,202 | 35 | % | 2 | 2 | |||||||||
Total | 117,700 | 231,017 | 76 | % | 27 | 30 | |||||||||
6
The following table sets forth information regarding the Company's 2019 year-end proved reserves of 1,420.4 Bcfe and production of 84.3 Bcfe by area:
Fields | Proved Developed Reserves (Bcfe) | Proved Undeveloped Reserves (Bcfe) | Total Proved Reserves (Bcfe) | % of Total Proved Reserves | Oil and NGLs as % of Proved Reserves | Total Production (Bcfe) | ||||||||||||
Artesia | 108.9 | 123.7 | 232.6 | 16.4 | % | 54.0 | % | 19.6 | ||||||||||
AWP | 80.4 | 202.4 | 282.8 | 19.9 | % | 47.3 | % | 14.6 | ||||||||||
Fasken | 338.8 | 424.1 | 762.9 | 53.7 | % | — | % | 38.2 | ||||||||||
Oro Grande | 33.6 | 91.1 | 124.7 | 8.8 | % | — | % | 7.4 | ||||||||||
Uno Mas | 13.6 | — | 13.6 | 1.0 | % | 3.7 | % | 3.7 | ||||||||||
Other | 3.8 | — | 3.8 | 0.2 | % | 57.3 | % | 0.8 | ||||||||||
Total | 579.1 | 841.3 | 1,420.4 | 100.0 | % | 18.5 | % | 84.3 | ||||||||||
Oil and Natural Gas Reserves
The following tables present information regarding proved oil and natural gas reserves attributable to the Company's interests in proved properties as of December 31, 2019, 2018 and 2017. The information set forth in the tables regarding reserves is based on proved reserves reports prepared in accordance with SEC rules. H.J. Gruy and Associates, Inc. (“Gruy”), independent petroleum engineers, prepared the Company's proved reserves report as of December 31, 2019, 2018 and 2017.
The reserves estimation process involves members of the reserves and evaluation department who report to the Chief Reservoir Engineer. The staff includes engineers whose duty is to prepare estimates of reserves in accordance with the Securities and Exchange Commission's rules, regulations and guidelines. This team worked closely with Gruy to ensure the accuracy and completeness of the data utilized for the preparation of the 2019, 2018 and 2017 reserve reports. All information from the Company's secure engineering database as well as geographic maps, well logs, production tests and other pertinent data were provided to Gruy.
The Chief Reservoir Engineer supervises this process with multiple levels of review and reconciliation of reserve estimates to ensure they conform to SEC guidelines. Reserves data are also reported to and reviewed by senior management quarterly. The Board of Directors (the “Board”) reviews the reserve data periodically and the independent Board members meet with Gruy in executive sessions at least annually.
The technical person at Gruy primarily responsible for overseeing preparation of the 2019, 2018 and 2017 reserves report and the audits of prior year reports is a Licensed Professional Engineer, holds a degree in petroleum engineering, is past Chairman of the Gulf Coast Section of the Society of Petroleum Engineers, is past President of the Society of Petroleum Evaluation Engineers, and has over 30 years of experience in preparing reserves reports and overseeing reserves audits.
The Company's Chief Reservoir Engineer, the primary technical person responsible for overseeing the preparation of its 2019, 2018 and 2017 reserve estimates, holds a bachelor's degree in geology, is a member of the Society of Petroleum Engineers and the Society of Professional Well Log Analysts, and has over 25 years of experience in petrophysical analysis, reservoir engineering, and reserves estimation.
Estimates of future net revenues from the Company's proved reserves, Standardized Measure and PV-10 (PV-10 is a non-GAAP measure defined below), as of December 31, 2019, 2018 and 2017 are made in accordance with SEC criteria, which is based on the preceding 12-months' average adjusted price after differentials based on closing prices on the first business day of each month (excluding the effects of hedging) and are held constant for that year's reserves calculation throughout the life of the properties, except where such guidelines permit alternate treatment, including, in the case of natural gas contracts, the use of fixed and determinable contractual price escalations. The Company has interests in certain tracts that are estimated to have additional hydrocarbon reserves that cannot be classified as proved and are not reflected in the following tables.
The following prices were used to estimate the Company's SEC proved reserve volumes, year-end Standardized Measure and PV-10. The 12-month 2019 average adjusted prices after differentials were $2.62 per Mcf of natural gas, $58.37 per barrel of oil, and $16.83 per barrel of NGL, compared to $3.04 per Mcf of natural gas, $66.96 per barrel of oil, and $26.63 per barrel of NGL for 2018 and $2.95 per Mcf of natural gas, $50.38 per barrel of oil, and $20.32 per barrel of NGL for 2017.
7
As noted above, PV-10 Value is a non-GAAP measure. The most directly comparable GAAP measure to the PV-10 Value is the Standardized Measure. The Company believes the PV-10 Value is a useful supplemental disclosure to the Standardized Measure because the PV-10 Value is a widely used measure within the industry and is commonly used by securities analysts, banks and credit rating agencies to evaluate the value of proved reserves on a comparative basis across companies or specific properties without regard to the owner's income tax position. The Company uses the PV-10 Value for comparison against its debt balances, to evaluate properties that are bought and sold and to assess the potential return on investment in its oil and gas properties. PV-10 Value is not a measure of financial or operating performance under GAAP, nor should it be considered in isolation or as a substitute for any GAAP measure. The Company's PV-10 Value and the Standardized Measure do not purport to represent the fair value of the Company's proved oil and natural gas reserves.
The following table provides a reconciliation between the Standardized Measure (the most directly comparable financial measure calculated in accordance with U.S. GAAP) and PV-10 Value of the Company's proved reserves:
As of December 31, | |||||||||||
(in millions) | 2019 | 2018 | 2017 | ||||||||
PV-10 Value | $ | 976 | $ | 1,128 | $ | 805 | |||||
Less: Future income taxes (discounted at 10%) | 108 | 134 | 73 | ||||||||
Standardized Measure of Discounted Future Net Cash Flows | $ | 868 | $ | 994 | $ | 732 | |||||
The following tables set forth estimates of future net revenues presented on the basis of unescalated prices and costs in accordance with criteria prescribed by the SEC and presented on a Standardized Measure and PV-10 basis as of December 31, 2019 and 2018. Operating costs, development costs, asset retirement obligation costs, and certain production-related taxes were deducted in arriving at the estimated future net revenues.
8
At December 31, 2019, the Company had estimated proved reserves of 1,420 Bcfe with a Standardized Measure of $868 million and PV-10 Value of $975.9 million. This is an increase of approximately 75 Bcfe from the Company's year-end 2018 proved reserves quantities primarily due to drilling and an expanded development plan. The Company's total proved reserves at December 31, 2019 were approximately 7% crude oil, 82% natural gas, and 11% NGLs, while 41% of its total proved reserves were developed. Essentially all of the Company's proved reserves are located in Texas. The following amounts shown in MMcfe below are based on an oil and natural gas liquids conversion factor of 1 Bbl to 6 Mcf:
Estimated Proved Natural Gas, Oil and NGL Reserves | As of December 31, | |||||||||||
2019 | 2018 | 2017 | ||||||||||
Natural gas reserves (MMcf): | ||||||||||||
Proved developed | 478,005 | 466,129 | 377,506 | |||||||||
Proved undeveloped (1) | 680,347 | 630,279 | 465,230 | |||||||||
Total | 1,158,352 | 1,096,408 | 842,736 | |||||||||
Oil reserves (MBbl): | ||||||||||||
Proved developed | 6,476 | 5,507 | 5,027 | |||||||||
Proved undeveloped (1) | 10,592 | 7,271 | 2,133 | |||||||||
Total | 17,068 | 12,779 | 7,160 | |||||||||
NGL reserves (MBbl): | ||||||||||||
Proved developed | 10,377 | 9,287 | 8,431 | |||||||||
Proved undeveloped (1) | 16,236 | 19,427 | 14,690 | |||||||||
Total | 26,614 | 28,714 | 23,121 | |||||||||
Total Estimated Reserves (MMcfe) (1)(2) | 1,420,439 | 1,345,362 | 1,024,422 | |||||||||
Standardized Measure of Discounted Future Net Cash Flows (in millions) (3) | $ | 868 | $ | 994 | $ | 732 | ||||||
PV-10 by reserve category | ||||||||||||
Proved developed | $ | 635 | $ | 681 | $ | 470 | ||||||
Proved undeveloped | 341 | 447 | 335 | |||||||||
Total PV-10 Value (3) | $ | 976 | $ | 1,128 | $ | 805 | ||||||
(1) The increases in 2019 and 2018 were primarily attributable to extensions added based on drilling results and leasing of adjacent acreage.
(2) The reserve volumes exclude natural gas consumed in operations.
(3) The Standardized Measure and PV-10 Values as of December 31, 2019, 2018 and 2017 are net of $1.7 million, $3.7 million and $7.1 million of plugging and abandonment costs, respectively.
Proved reserves are estimates of hydrocarbons to be recovered in the future. Reserves estimation is a subjective process of estimating the sizes of underground accumulations of oil and natural gas that cannot be measured in an exact way. The accuracy of any reserves estimate is a function of the quality of available data and of engineering and geological interpretation and judgment. Reserves reports of other engineers might differ from the reports contained herein. Results of drilling, testing, and production subsequent to the date of the estimate may justify revision of such estimates. Future prices received for the sale of oil and natural gas may be different from those used in preparing these reports. The amounts and timing of future operating and development costs may also differ from those used. Accordingly, reserves estimates are often different from the quantities of oil and natural gas that are ultimately recovered. There can be no assurance that these estimates are accurate predictions of the present value of future net cash flows from oil and natural gas reserves.
9
Proved Undeveloped Reserves
The following table sets forth the aging of the Company's proved undeveloped reserves as of December 31, 2019:
Year Added | Volume (Bcfe) | % of PUD Volumes | % of PV-10 | |||||
2019 | 363.8 | 43 | % | 49 | % | |||
2018 | 223.0 | 27 | % | 25 | % | |||
2017 | 176.8 | 21 | % | 19 | % | |||
2016 (1) | 77.8 | 9 | % | 7 | % | |||
2015 | 0.0 | — | % | — | % | |||
Total | 841.3 | 100 | % | 100 | % | |||
(1) The Company did not carry proved undeveloped reserves forward through bankruptcy except for locations that were converted to developed reserves early in 2016; therefore all proved undeveloped reserves as of December 31, 2016 were 2016 additions.
During 2019, the Company's proved undeveloped reserves increased by approximately 50.8 Bcfe primarily due to additions of undeveloped reserves in the Company's Fasken field, partially offset by undeveloped reserves that were converted to proved developed reserves during 2019. The Company also incurred approximately $109.5 million in capital expenditures during the year which resulted in the conversion of 94.0 Bcfe of its December 31, 2018 proved undeveloped reserves to proved developed reserves, primarily in our Artesia and AWP fields.
The PV-10 Value from the Company's proved undeveloped reserves was $341 million at December 31, 2019, which was approximately 35% of its total PV-10 Value of $975.9 million.
Sensitivity of Reserves to Pricing
As of December 31, 2019, a 5% increase in natural gas pricing would increase the Company's total estimated proved reserves by approximately 2.4 Bcfe and would increase the PV-10 Value by approximately $62.6 million. Similarly, a 5% decrease in natural gas pricing would decrease the Company's total estimated proved reserves by approximately 10.3 Bcfe and would decrease the PV-10 Value by approximately $62.2 million.
As of December 31, 2019, a 5% increase in oil and NGL pricing would increase the Company's total estimated proved reserves by approximately 0.8 Bcfe, and would increase the PV-10 Value by approximately $35.2 million. Similarly, a 5% decrease in oil and NGL pricing would decrease the Company's total estimated proved reserves by approximately 0.9 Bcfe and would decrease the PV-10 Value by approximately $34.9 million.
10
Oil and Gas Wells
The following table sets forth the total gross and net wells in which the Company owned an interest at the following dates:
Oil Wells | Gas Wells | Total Wells(1) | ||||||
December 31, 2019 | ||||||||
Gross (1) | 95 | 246 | 341 | |||||
Net | 93.0 | 198.8 | 291.8 | |||||
December 31, 2018 | ||||||||
Gross (1) | 78 | 223 | 301 | |||||
Net | 76.1 | 178.1 | 254.1 | |||||
December 31, 2017 | ||||||||
Gross (1) | 166 | 543 | 709 | |||||
Net | 161.7 | 500 | 661.7 | |||||
(1) | Excludes 4, 5, and 8 service wells in 2019, 2018 and 2017, respectively. |
Oil and Gas Acreage
The following table sets forth the developed and undeveloped leasehold acreage held by the Company at December 31, 2019:
Developed | Undeveloped | ||||||||||
Gross | Net | Gross | Net | ||||||||
Texas | 41,300 | 37,398 | 89,121 | 80,302 | |||||||
Louisiana | 5,084 | 4,775 | 4,920 | 4,478 | |||||||
Wyoming | — | — | 3,013 | 1,442 | |||||||
Total | 46,384 | 42,173 | 97,054 | 86,222 | |||||||
As of December 31, 2019, the Company's net undeveloped acreage subject to expiration over the next three years, if not renewed, is approximately 25% in 2020, 6% in 2021 and 18% in 2022. In most cases, acreage scheduled to expire can be held through drilling operations or the Company can exercise extension options. The exploration potential of all undeveloped acreage is fully evaluated before expiration. In each fiscal year where undeveloped acreage is subject to expiration, our intent is to reduce the expirations through either development or extensions, if we believe it is commercially advantageous to do so.
11
Drilling and Other Exploratory and Development Activities
The following table sets forth the results of the Company's drilling and completion activities during the years ended December 31, 2019, 2018 and 2017:
Gross Wells | Net Wells | |||||||||||||||||||
Year | Type of Well | Total | Producing | Dry | Total | Producing | Dry | |||||||||||||
2019 | Exploratory | — | — | — | — | — | — | |||||||||||||
Development | 30 | 30 | — | 27.7 | 27.7 | — | ||||||||||||||
2018 | Exploratory | — | — | — | — | — | — | |||||||||||||
Development | 37 | 37 | — | 32.7 | 32.7 | — | ||||||||||||||
2017 | Exploratory | — | — | — | — | — | — | |||||||||||||
Development | 27 | 27 | — | 22.0 | 22.0 | — | ||||||||||||||
Recent Activities
As of December 31, 2019, we were in the process of drilling three wells in our Artesia field where we have a 97% working interest. These wells were completed in the first quarter of 2020.
Operations
The Company generally seeks to be the operator of the wells in which it has a significant economic interest. As operator, the Company designs and manages the development of a well and supervises operation and maintenance activities on a day-to-day basis. The Company does not own drilling rigs or other oil field services equipment used for drilling or maintaining wells on properties it operates. Independent contractors supervised by the Company provide this equipment and personnel. The Company employs drilling, production, and reservoir engineers, geologists, and other specialists who work to improve production rates, increase reserves, and lower the cost of operating the Company's oil and natural gas properties.
Operations on the Company's oil and natural gas properties are customarily accounted for in accordance with Council of Petroleum Accountants Societies' guidelines. The Company charges a monthly per-well supervision fee to the wells it operates including its wells in which it owns up to a 100% working interest. Supervision fees vary widely depending on the geographic location and depth of the well and whether the well produces oil or natural gas. The fees for these activities in 2019 totaled $4.9 million and ranged from $125 to $1,605 per well per month.
12
Marketing of Production
The Company typically sells its oil and natural gas production at market prices near the wellhead or at a central point after gathering and/or processing. The Company usually sells its natural gas in the spot market on a monthly basis, while it sells its oil at prevailing market prices. The Company does not refine any oil it produces. For the years ended December 31, 2019 and 2018, parties which accounted for approximately 10% or more of the Company's total oil and gas receipts were as follows:
Purchasers greater than 10% | Year Ended December 31, 2019 | Year Ended December 31, 2018 | |||
Kinder Morgan | 31 | % | 37 | % | |
Plains Marketing | 14 | % | * | ||
Twin Eagle | 13 | % | * | ||
Shell Trading | 11 | % | * | ||
*Oil and gas receipts less than 10%
The Company has gas processing and gathering agreements with Southcross Energy for a majority of the Company's natural gas production in the AWP area. Oil production is transported to market by truck and sold at prevailing market prices.
The Company has a gas gathering agreement with Howard Energy Partners providing for the transportation of the Company's Eagle Ford production on the pipeline from Fasken to Kinder Morgan Texas Pipeline or Eagle Ford Midstream, where it is sold at prices tied to monthly and daily natural gas price indices. At Fasken, the Company also has a connection with the Navarro gathering system into which it may deliver natural gas from time to time.
The Company has agreements with Eagle Ford Gathering LLC that provides for the gathering and processing for almost all of its natural gas production in the Artesia area. Natural gas in the area can also be delivered to the Targa (formerly Atlas) system for processing and transportation to downstream markets. In the Artesia area, the Company's oil production is sold at prevailing market prices and transported to market by truck.
The prices in the tables below do not include the effects of hedging. Quarterly prices are detailed under “Results of Operations – Revenues” in “Management's Discussion and Analysis of Financial Condition and Results of Operations” in this Form 10-K.
The following table summarizes sales volumes, sales prices, and production cost information for the Company's net oil, NGL and natural gas production for the years ended December 31, 2019 and 2018:
Year Ended December 31, | ||||||||||||
All Fields | 2019 | 2018 | 2017 | |||||||||
Net Sales Volume: | ||||||||||||
Oil (MBbls) | 1,605 | 688 | 685 | |||||||||
Natural gas liquids (MBbls) | 1,717 | 1,123 | 1,046 | |||||||||
Natural gas (MMcf) | 64,388 | 56,665 | 45,751 | |||||||||
Total (MMcfe) | 84,320 | 67,530 | 56,135 | |||||||||
Average Sales Price: | ||||||||||||
Oil (Per Bbl) | $ | 57.84 | $ | 65.93 | $ | 50.98 | ||||||
Natural gas liquids (Per Bbl) | $ | 14.70 | $ | 25.51 | $ | 21.61 | ||||||
Natural gas (Per Mcf) | $ | 2.65 | $ | 3.23 | $ | 3.03 | ||||||
Total (Per Mcfe) | $ | 3.42 | $ | 3.81 | $ | 3.49 | ||||||
Average Production Cost (Per Mcfe sold) (1) | $ | 0.57 | $ | 0.61 | $ | 0.74 | ||||||
(1) Average production cost includes lease operating costs, transportation and gas processing costs but excludes severance and ad valorem taxes.
13
The following table provides a summary of the Company's sales volumes, average sales prices, and average production costs for its fields with proved reserves greater than 15% of total proved reserves. These fields account for approximately 81% of the Company's proved reserves based on total MMcfe as of December 31, 2019:
Year Ended December 31, | ||||||||||||
Fasken | 2019 | 2018 | 2017 | |||||||||
Net Sales Volume: | ||||||||||||
Natural gas liquids (MBbls) | 2 | 2 | 2 | |||||||||
Natural gas (MMcf) (1) | 38,195 | 35,963 | 33,757 | |||||||||
Total (MMcfe) | 38,206 | 35,976 | 33,769 | |||||||||
Average Sales Price: | ||||||||||||
Natural gas liquids (Per Bbl) | $ | 14.13 | $ | 24.96 | $ | 18.13 | ||||||
Natural gas (Per Mcf) | $ | 2.65 | $ | 3.21 | $ | 3.02 | ||||||
Total (Per Mcfe) | $ | 2.65 | $ | 3.21 | $ | 3.02 | ||||||
Average Production Cost (Per Mcfe sold) (2) | $ | 0.60 | $ | 0.60 | $ | 0.59 | ||||||
(1) Excludes natural gas consumed in operations.
(2) Average production cost includes lease operating costs, transportation and gas processing costs but excludes severance and ad valorem taxes.
Year Ended December 31, | ||||||||||||
AWP | 2019 | 2018 | 2017 | |||||||||
Net Sales Volume: | ||||||||||||
Oil (MBbls) | 846 | 347 | 427 | |||||||||
Natural gas liquids (MBbls) | 491 | 480 | 598 | |||||||||
Natural gas (MMcf) (1) | 6,613 | 5,510 | 6,857 | |||||||||
Total (MMcfe) | 14,637 | 10,470 | 13,004 | |||||||||
Average Sales Price: | ||||||||||||
Oil (Per Bbl) | $ | 58.66 | $ | 65.64 | $ | 50.40 | ||||||
Natural gas liquids (Per Bbl) | $ | 14.89 | $ | 25.84 | $ | 20.87 | ||||||
Natural gas (Per Mcf) | $ | 2.59 | $ | 3.20 | $ | 3.09 | ||||||
Total (Per Mcfe) | $ | 5.06 | $ | 5.04 | $ | 4.25 | ||||||
Average Production Cost (Per Mcfe sold) (2) | $ | 0.75 | $ | 0.88 | $ | 1.25 | ||||||
(1) Excludes natural gas consumed in operations.
(2) Average production cost includes lease operating costs, transportation and gas processing costs but excludes severance and ad valorem taxes.
14
Year Ended December 31, | ||||||||||||
Artesia | 2019 | 2018 | 2017 | |||||||||
Net Sales Volume: | ||||||||||||
Oil (MBbls) | 698 | 336 | 249 | |||||||||
Natural gas liquids (MBbls) | 1,173 | 622 | 443 | |||||||||
Natural gas (MMcf) (1) | 8,366 | 4,763 | 3,239 | |||||||||
Total (MMcfe) | 19,593 | 10,514 | 7,393 | |||||||||
Average Sales Price: | ||||||||||||
Oil (Per Bbl) | $ | 57.14 | $ | 66.29 | $ | 52.78 | ||||||
Natural gas liquids (Per Bbl) | $ | 14.69 | $ | 25.54 | $ | 22.67 | ||||||
Natural gas (Per Mcf) | $ | 2.59 | $ | 3.27 | $ | 3.08 | ||||||
Total (Per Mcfe) | $ | 4.02 | $ | 5.11 | $ | 4.49 | ||||||
Average Production Cost (Per Mcfe sold) (2) | $ | 0.36 | $ | 0.50 | $ | 0.62 | ||||||
(1) Excludes natural gas consumed in operations.
(2) Average production cost includes lease operating costs, transportation and gas processing costs but excludes severance and ad valorem taxes.
Risk Management
The Company's operations are subject to all of the risks normally incident to the exploration for and the production of oil and natural gas, including blowouts, pipe failure, casing collapse, fires, and adverse weather conditions, each of which could result in severe damage to or destruction of oil and natural gas wells, production facilities or other property, or individual injuries. The oil and natural gas exploration business is also subject to environmental hazards, such as oil and produced water spills, natural gas leaks, and ruptures and discharges of toxic substances or gases that could expose the Company to substantial liability due to pollution and other environmental damage. The Company maintains comprehensive insurance coverage, including general liability insurance, operators extra expense insurance, and property damage insurance. The Company's standing Insurable Risk Advisory Team, which includes individuals from operations, drilling, facilities, legal, health safety and environmental and finance departments, meets regularly to evaluate risks, review property values, review and monitor claims, review market conditions and assist with the selection of coverages. The Company believes that its insurance is adequate and customary for companies of a similar size engaged in comparable operations, but if a significant accident or other event occurs that is uninsured or not fully covered by insurance, it could adversely affect the Company. Refer to “Item 1A. Risk Factors” of this Form 10-K for more details and for discussion of other risks.
Commodity Risk
The oil and gas industry is affected by the volatility of commodity prices. Realized commodity prices received for such production are primarily driven by the prevailing worldwide price for crude oil and spot prices applicable to natural gas. The Company has derivative instruments in place to protect a significant portion of its production against declines in oil and natural gas prices through the fourth quarter of 2021. For additional discussion related to the Company's price-risk policy, refer to Note 5 of the consolidated financial statements in this Form 10-K.
Competition
The Company operates in a highly competitive environment, competing with major integrated and independent energy companies for desirable oil and natural gas properties, as well as for equipment, labor, and materials required to develop and operate such properties. Many of these competitors have financial and technological resources substantially greater than the Company's. The market for oil and natural gas properties is highly competitive and the Company may lack technological information or expertise available to other bidders. The Company may incur higher costs or be unable to acquire and develop desirable properties at costs the Company considers reasonable because of this competition. The Company's ability to replace and expand its reserve base depends on its continued ability to attract and retain quality personnel and identify and acquire suitable producing properties and prospects for future drilling and acquisition.
15
Environmental and Occupational Health and Safety Matters
The Company's business operations are subject to numerous federal, state and local environmental and occupational health and safety laws and regulations. Numerous governmental entities, including the U.S. Environmental Protection Agency (“EPA”), the U.S. Occupational Safety and Health Administration (“OSHA”) and analogous state agencies, have the power to enforce compliance with these laws and regulations and the permits issued under them, often requiring difficult and costly actions. These laws and regulations may, among other things (i) require the acquisition of permits to conduct drilling and other regulated activities; (ii) restrict the types, quantities and concentration of various substances that can be released into the environment or injected into formations in connection with oil and natural gas drilling and production activities; (iii) limit or prohibit drilling activities on certain lands lying within wilderness, wetlands and other protected areas; (iv) require remedial measures to mitigate pollution from former and ongoing operations, such as requirements to close pits and plug abandoned wells; (v) impose specific safety and health criteria addressing worker protection; and (vi) impose substantial liabilities for pollution resulting from drilling and completion activities.
The more significant of these existing environmental and occupational health and safety laws and regulations include the following U.S. laws and regulations, as amended from time to time:
• | the Clean Air Act (“CAA”), which restricts the emission of air pollutants from many sources, imposes various pre-construction, operational, monitoring, and reporting requirements and has been relied upon by the EPA as authority for adopting climate change regulatory initiatives relating to greenhouse gas (“GHG”) emissions; |
• | the Federal Water Pollution Control Act, also known as the federal Clean Water Act, which regulates discharges of pollutants to state and federal waters and establishes the extent to which waterways are subject to federal jurisdiction and rulemaking as protected waters of the United States; |
• | the Comprehensive Environmental Response, Compensation and Liability Act of 1980, which imposes liability on generators, transporters, and arrangers of hazardous substances at sites where hazardous substance releases have occurred or are threatening to occur; |
• | the Resource Conservation and Recovery Act (“RCRA”), which governs the generation, treatment, storage, transport, and disposal of solid wastes, including hazardous wastes; |
• | the Oil Pollution Act of 1990, which subjects owners and operators of vessels, onshore facilities, and pipelines, as well as lessees or permittees of areas in which offshore facilities are located, to liability for removal costs and damages arising from an oil spill in waters of the United States; |
• | the Safe Drinking Water Act (“SDWA”), which ensures the quality of the nation’s public drinking water through adoption of drinking water standards and controlling the injection of waste fluids into below-ground formations that may adversely affect drinking water sources; |
• | the Emergency Planning and Community Right-to-Know Act, which requires facilities to implement a safety hazard communication program and disseminate information to employees, local emergency planning committees, and response departments on toxic chemical uses and inventories; |
• | the Occupational Safety and Health Act, which establishes workplace standards for the protection of the health and safety of employees, including the implementation of hazard communications programs designed to inform employees about hazardous substances in the workplace, potential harmful effects of these substances, and appropriate control measures; |
• | the Endangered Species Act (“ESA”), which restricts activities that may affect federally identified endangered and threatened species or their habitats through the implementation of operating restrictions or a temporary, seasonal, or permanent ban in affected areas; and |
• | the National Environmental Policy Act, which requires federal agencies to evaluate major agency actions having the potential to impact the environment and that may require the preparation of environmental assessments and more detailed environmental impact statements that may be made available for public review and comment. |
Additionally, there exist regional, state and local jurisdictions in the United States where the Company’s operations are conducted that also have, or are developing or considering developing, similar environmental and occupational health and safety laws and regulations governing many of these same types of activities. While the legal requirements imposed in state and local jurisdictions may be similar in form to federal laws and regulations, in some cases the actual implementation of these requirements may impose additional, or more stringent, conditions or controls that can significantly restrict, delay or cancel the permitting, development or expansion of the Company’s operations or substantially increase the cost of doing business. Additionally, the Company’s operations may require state-law based permits in addition to federal permits, requiring state agencies to consider a range of issues, many the same as federal agencies, including, among other things, a project's impact on wildlife and their habitats, historic and archaeological sites, aesthetics, agricultural operations, and scenic areas. These operations also are subject to a variety of local environmental and regulatory requirements, including land use, zoning, building, and transportation requirements.
16
Moreover, whether at the federal, tribal, regional, state and local levels, environmental and occupational health and safety laws and regulations may arise in the future to address potential environmental concerns such as air emissions, water discharges and disposals or other releases to surface and below-ground soils and groundwater or to address perceived health or safety-related concerns such as oil and natural gas development in close proximity to specific occupied structures and/or certain environmentally sensitive or recreational areas. Any such future developments are expected to have a considerable impact on the Company’s business and results of operations.
Failure to comply with these laws and regulations may result in the assessment of sanctions, including administrative, civil, and criminal penalties; the imposition of investigatory, remedial, and corrective action obligations or the incurrence of capital expenditures; the occurrence of restrictions, delays or cancellations in the permitting, development or expansion of projects; and the issuance of injunctions restricting, delaying or prohibiting some or all of the Company's activities in a particular area. Additionally, multiple environmental laws provide for citizen suits, which allow environmental organizations to act in place of the government and sue operators for alleged violations of environmental law. See Risk Factors under Part I, Item 1A of this Form 10‑K for further discussion on hydraulic fracturing, ozone standards, induced seismicity, climate change, and other environmental protection-related subjects. The ultimate financial impact arising from environmental laws and regulations is neither clearly known nor determinable as existing standards are subject to change and new standards continue to evolve.
Over time, the trend in environmental regulation is to place more restrictions on activities that may affect the environment and, thus, any new laws and regulations, amendment of existing laws and regulations, reinterpretation of legal requirements or increased governmental enforcement that result in more stringent and costly pollution control equipment, the occurrence of restrictions, delays or cancellations in the permitting or performance of projects, or waste handling, storage, transport, disposal or remediation requirements could have a material adverse effect on the Company’s financial condition and results of operations. The Company has incurred and will continue to incur operating and capital expenditures, some of which may be material, to comply with environmental and occupational health and safety laws and regulations. Historically, the Company's environmental compliance costs have not had a material adverse effect on its results of operations; however, there can be no assurance that such costs will not be material in the future or that such future compliance will not have a material adverse effect on its business and operational results.
Employees
As of December 31, 2019, the Company employed 86 people; all were full-time employees. None of the Company's employees were represented by a union and relations with employees are considered to be good.
Facilities
At December 31, 2019, the Company occupied approximately 34,275 square feet of office space at 575 N. Dairy Ashford Road, Houston, Texas. For discussion regarding the term and obligations of this sub-lease refer to Note 6 of the consolidated financial statements in this Form 10-K.
Available Information
The Company's annual reports on Form 10-K, quarterly reports on Form 10-Q, current reports on Form 8-K, amendments to those reports, and changes in and stock ownership of its directors and executive officers, together with other documents filed with the Securities and Exchange Commission under the Securities Exchange Act of 1934, as amended (the “Exchange Act”), can be accessed free of charge on the Company's web site at www.sbow.com as soon as reasonably practicable after the Company electronically files these reports with the SEC. The SEC maintains an internet site that contains reports, proxy and information statements, and other information regarding issuers that file electronically with the SEC, which can be accessed at http://www.sec.gov. All exhibits and supplemental schedules to our reports are available free of charge through the SEC web site. In addition, the Company has adopted a Code of Ethics for Senior Financial Officers and the Principal Executive Officers (“Code of Ethics”). The Company has posted this Code of Ethics on its website, where it also intends to post any waivers from or amendments to this Code of Ethics.
17
Item 1A. Risk Factors
Risks Related to the Business:
Oil and natural gas prices are volatile, and a substantial or extended decline in oil and natural gas prices would adversely affect our financial results, reduce liquidity and impede our growth.
Oil and natural gas prices historically have been volatile and are likely to continue to be volatile in the future. Prices for oil and natural gas fluctuate widely in response to relatively minor changes in the supply and demand for oil and natural gas, market uncertainty and a variety of additional factors beyond our control, such as:
• | domestic and foreign supplies of oil and natural gas; |
• | price and quantity of foreign imports of oil and natural gas; |
• | actions of the Organization of Petroleum Exporting Countries and other state-controlled oil companies relating to oil and natural gas price and production controls; |
• | level of consumer product demand, including as a result of competition from alternative energy sources; |
• | level of global oil and natural gas exploration and production activity; |
• | domestic and foreign governmental regulations; |
• | stockholder activism or activities by non-governmental organizations to limit certain sources of funding for the energy sector or restrict the exploration, development and production of oil and natural gas; |
• | level of global oil and natural gas inventories; |
• | political conditions in or affecting other oil-producing and natural gas-producing countries, including the current conflicts in the Middle East and conditions in South America, Africa and Russia; |
• | weather conditions; |
• | technological advances affecting oil and natural gas production and consumption; |
• | overall U.S. and global economic conditions; and |
• | price and availability of alternative fuels. |
Our financial condition, revenues, profitability and the carrying value of our properties depend upon the prevailing prices and demand for oil and natural gas. Any sustained periods of low prices for oil and natural gas are likely to materially and adversely affect our financial position and reduce our liquidity. This would impact the quantities of oil and natural gas reserves that we can economically produce, our cash flow available for capital expenditures and continued development of our operations, making it increasingly difficult to operate our business. On February 28, 2020, the Henry Hub NYMEX price for natural gas reached a price of $1.68 per Mcf. Additionally, any extended period of low commodity prices would impact our ability to access funds through the capital markets, if they are available at all.
Insufficient capital could lead to declines in our cash flow or in our oil and natural gas reserves, or a loss of properties.
The oil and natural gas industry is capital intensive. Our 2020 capital expenditure budget, including expenditures for leasehold acquisitions, drilling and infrastructure and fulfillment of abandonment obligations, is expected to be in the range of $175 million and $195 million. We had approximately $261.7 million of capital expenditures in 2019. Cash flow from operations is a principal source of our financing of our future capital expenditures. Insufficient cash flow from operations and inability to access capital could lead to the loss of leases that require us to drill new wells in order to maintain the lease. Lower liquidity and other capital constraints may make it difficult to drill those wells prior to the lease expiration dates, which could result in our losing reserves and production.
Our Debt Facilities, as defined below, contain operating and financial restrictions that may restrict our business and financing activities.
Our Credit Facility and Second Lien (collectively “Debt Facilities”) contain a number of restrictive covenants that impose significant operating and financial restrictions on us, including restrictions on our ability to, among other things:
• | sell assets, including equity interests in our subsidiaries; |
• | redeem our debt; |
• | make investments; |
• | incur or guarantee additional indebtedness; |
• | create or incur certain liens; |
• | make certain acquisitions and investments; |
18
• | redeem or prepay other debt; |
• | enter into agreements that restrict distributions or other payments from our restricted subsidiaries to us; |
• | consolidate, divide, merge or transfer all or substantially all of our assets; |
• | engage in transactions with affiliates; |
• | create unrestricted subsidiaries; |
• | enter into swap agreements beyond certain maximum thresholds; |
• | enter into sale and leaseback transactions; and |
• | engage in certain business activities. |
As a result of these covenants, we are limited in the manner in which we conduct our business, and we may be unable to engage in favorable business activities or finance future operations or capital needs.
Our ability to comply with some of the covenants and restrictions contained in our Debt Facilities may be affected by events beyond our control. If market or other economic conditions deteriorate or if oil and natural gas prices decline further from their current level for an extended period of time, our ability to comply with these covenants may be impaired. A failure to comply with the covenants, ratios or tests in our Debt Facilities or any future indebtedness could result in an event of default under our Debt Facilities or our future indebtedness, which, if not cured or waived, could have a material adverse effect on our business, financial condition and results of operations.
If an event of default under either of our Debt Facilities occurs and remains uncured, the lenders or holders under the applicable Credit Facility:
• | would not be required to lend any additional amounts to us; |
• | could elect to declare all borrowings or notes outstanding, together with accrued and unpaid interest and fees, to be due and payable; |
• | may have the ability to require us to apply all of our available cash to repay these borrowings or notes; or |
• | may prevent us from making debt service payments under our other agreements. |
The borrowing base under our Credit Facility is redetermined at least semi-annually, based in part on assumptions of the administrative agent with respect to, among other things, crude oil and natural gas prices. A negative adjustment to the borrowing base could occur if crude oil and natural gas prices used by the lenders are significantly lower than those used in the last redetermination, including as result of a decline in commodity prices or an expectation that reduced prices will continue. For example, our borrowing base was decreased from $410 million to $400 million as part of our regularly scheduled redetermination in October 2019. The next redetermination of our borrowing base in scheduled to occur in spring 2020. In addition, the portion of our borrowing base made available to us for borrowing is subject to the terms and covenants of our Credit Facility, including compliance with the ratios and other financial covenants of such facility. In the event that the amount outstanding under our Credit Facility exceeds the redetermined borrowing base, we could be forced to repay a portion of our borrowings.
In addition, our obligations under the Debt Facilities are collateralized by perfected first and second priority liens and security interests on substantially all of our assets, including mortgage liens on oil and natural gas properties having at least 85% of the PV-9 (determined using commodity price assumptions by the administrative agent of the Credit Facility) of the borrowing base properties (with respect to the Credit Facility) or the oil and gas properties constituting proved reserves as set forth in the most recent reserve report (with respect to the Second Lien), and if we are unable to repay our indebtedness under the Debt Facilities, (including any amount of borrowings in excess of the borrowing base resulting from a redetermination of our Credit Facility), the lenders could seek to foreclose on our assets.
Most of our undeveloped leasehold acreage is subject to leases that will expire over the next several years unless production is established on units containing the acreage.
We own leasehold interests in areas not currently held by production. Unless production in paying quantities is established or we exercise an extension option on units containing certain of these leases during their terms, the leases will expire. If our leases expire, we will lose our right to develop the related properties. We have leases on 22,328 net acres that could potentially expire during fiscal year 2020, representing approximately 25% of our net undeveloped acreage.
Our drilling plans for areas not currently held by production are subject to change based upon various factors. Many of these factors are beyond our control, including drilling results, oil and natural gas prices, the availability and cost of capital, drilling and production costs, availability of drilling services and equipment, gathering system and pipeline transportation constraints and
19
regulatory approvals. On our acreage that we do not operate, we have less control over the timing of drilling; therefore, there is additional risk of expirations occurring in those sections.
We have written down the carrying values on our oil and natural gas properties in the past and could incur additional write-downs in the future.
The SEC accounting rules require that on a quarterly basis we review the carrying value of our oil and natural gas properties for possible write-down or impairment (the "ceiling test"). Any capital costs in excess of the ceiling amount must be permanently written down. If oil and natural gas prices remain low for an extended period of time, we could be required to record additional non-cash write-downs of our oil and gas properties. Refer to Note 1 of the consolidated financial statements in this Form 10-K for further discussion of the ceiling test calculation.
Estimates of proved reserves are uncertain, and revenues from production may vary significantly from expectations.
The quantities and values of our proved reserves included in our year-end 2019 estimates of proved reserves are only estimates and subject to numerous uncertainties. The accuracy of any reserves estimate is a function of the quality of available data and of engineering and geological interpretation. These estimates depend on assumptions regarding quantities and production rates of recoverable oil and natural gas reserves, future prices for oil and natural gas, timing and amounts of development expenditures and operating expenses, all of which will vary from those assumed in our estimates. If the variances in these assumptions are significant, many of which are based upon extrinsic events we cannot control, they could significantly affect these estimates and could result in the actual amounts of oil and natural gas ultimately recovered and future net cash flows being materially different from the estimates in our reserves reports. These estimates may not accurately predict the present value of future net cash flows from our oil and natural gas reserves.
A worldwide financial downturn or negative credit market conditions may have lasting effects on our liquidity, business and financial condition that we cannot control or predict.
Global economic conditions may adversely affect the financial viability of and increase the credit risk associated with our purchasers, suppliers, insurers, and commodity derivative counterparties to perform under the terms of contracts or financial arrangements we have with them. Although we have heightened our level of scrutiny of our contractual counterparties, our assessment of the risk of non-performance by various parties is subject to sudden swings in the financial and credit markets. This same crisis may adversely impact insurers and their ability to pay current and future insurance claims that we may have.
Our future access to capital could be limited due to tightening credit markets that could affect our ability to fund our future capital projects. In addition, long-term restriction upon or freezing of the capital markets and legislation related to financial and banking reform may affect short-term or long-term liquidity.
Our oil and natural gas exploration and production business involves high risks and we may suffer uninsured losses, which may be subject to substantial liability claims.
Losses and liabilities arising from uninsured and underinsured events could materially and adversely affect our business, financial condition or results of operations. Our oil and natural gas exploration and production activities are subject to all of the operating risks associated with drilling for and producing oil and natural gas, including the possibility of:
• | hurricanes, tropical storms or other natural disasters; |
• | environmental hazards, such as natural gas leaks, oil and produced water spills, pipeline or tank ruptures, encountering naturally occurring radioactive materials, blowouts, explosions and unauthorized discharges of brine, well stimulation and completion fluids, toxic gases or other pollutants into the surface and subsurface environment; |
• | abnormally pressured formations; |
• | mechanical difficulties, such as stuck oil field drilling and service tools and casing collapse; |
• | fires and explosions; and |
• | personal injuries and death. |
Any of these risks could adversely affect our ability to conduct operations or result in substantial losses to the Company due to injury or loss of life, damage to or destruction of wells, production facilities, other property or natural resources, clean-up responsibilities, regulatory investigations and penalties and suspension of operations. Although the Company currently maintains insurance coverage that it considers reasonable and that is similar to that maintained by comparable companies in the oil and natural gas industry, it is not fully insured against certain of these risks, such as business interruption, either because such insurance is not available or because of the high premium costs and deductibles associated with obtaining and carrying such insurance.
20
Further, we may also elect not to obtain insurance if we believe that the cost of available insurance is excessive relative to the risks presented. In addition, pollution and environmental risks generally are not fully insurable. If a significant accident or other event occurs and is not fully covered by insurance, it could adversely affect our financial condition.
Drilling wells is speculative and capital intensive.
Developing and exploring properties for oil and natural gas requires significant capital expenditures and involves a high degree of financial risk, including the risk that no commercially productive oil or natural gas reservoirs will be encountered. The budgeted costs of drilling, completing, and operating wells are often exceeded and can increase significantly when drilling costs rise. Drilling may be unsuccessful for many reasons, including title problems, weather, cost overruns, equipment shortages, and mechanical difficulties. Moreover, the successful drilling or completion of an oil or natural gas well does not ensure a profit on investment. Exploratory wells bear a much greater risk of loss than development wells.
Pollution and property contamination arising from the Company’s operations and the nearby operations of other oil and natural gas operators could expose the Company to significant costs and liabilities.
The performance of the Company’s operations may result in significant environmental costs and liabilities as a result of handling of petroleum hydrocarbons and wastes, because of air emissions and wastewater or other fluid discharges related to operations, and due to historical industry operations and waste disposal practices. Spills or other unauthorized releases of regulated substances by or resulting from the Company’s operations, or the nearby operations of other oil and natural gas operators, could expose the Company to material losses, expenditures and liabilities under environmental laws and regulations. Certain of the properties upon which the Company conducts operations were acquired from third parties, whose actions with respect to the management and disposal or release of hydrocarbons, hazardous substances or wastes at or from such properties were not under the Company’s control. Moreover, certain of these laws may impose strict liability, which means that in some situations the Company could be exposed to liability as a result of the Company’s conduct that was lawful at the time it occurred or the conduct of, or conditions caused by, prior operators or other third parties. Neighboring landowners and other third parties may file claims against the Company for personal injury or property damage allegedly caused by the release of pollutants into the environment. New laws and regulations, amendment of existing laws and regulations, reinterpretation of legal requirements or increased governmental enforcement relating to environmental requirements may occur, resulting in the occurrence of restrictions, delays or cancellations in the permitting or performance of new or expanded projects, or more stringent or costly well drilling, construction, completion or water management activities or waste handling, storage, transport, disposal or cleanup requirements. Any of these developments could require the Company to make significant expenditures to attain and maintain compliance and may otherwise have a material adverse effect on the oil and natural gas exploration and production industry in general in addition to the Company’s own results of operations, competitive position or financial condition. The Company may not be able to recover some or any of its costs with respect to such developments from insurance.
Government regulation of the Company’s activities could adversely affect the Company and its operations.
The oil and natural gas business is subject to extensive governmental regulation under which, among other things, rates of production from oil and natural gas wells may be regulated. Governmental regulation also may affect the market for the Company’s production and operations. Costs of compliance with governmental regulation are significant, and the cost of compliance with new and emerging laws and regulations and the incurrence of associated liabilities could adversely affect the results of the Company. We cannot predict the timing or impact of new or changed laws, regulations, or permit requirements or changes in the ways that such laws, regulations, or permit requirements are enforced, interpreted or administered. For example, various governmental agencies, including the EPA and analogous state agencies, the federal Bureau of Land Management (“BLM”), and the Federal Energy Regulatory Commission can enact or change, begin to force compliance with, or otherwise modify their enforcement, interpretation or administration of, certain regulations that could adversely affect the Company.
The Company’s operations are subject to environmental and worker safety and health laws and regulations that may expose the Company to significant costs and liabilities and could delay the pace or restrict the scope of the Company’s operations.
The Company’s oil and natural gas exploration, production and development operations are subject to stringent federal, state and local laws and regulations governing worker safety and health, the release or disposal of materials into the environment or otherwise relating to environmental protection. Numerous governmental entities, including the EPA, OSHA and analogous state agencies, have the power to enforce compliance with these laws and regulations, which may require the Company to take actions resulting in costly capital and operating expenditures at its wells and properties. These laws and regulations may restrict or affect the Company’s business in many ways, including applying specific health and safety criteria addressing worker protection, requiring the acquisition of a permit before drilling or other regulated activities commence, restricting the types, quantities and concentration of substances that can be released into the environment, limiting or prohibiting construction or drilling activities on certain lands
21
lying within wilderness, wetlands and other protected areas, and imposing substantial liabilities for pollution resulting from the Company’s operations. Failure to comply with these laws and regulations may result in the assessment of sanctions, including administrative, civil and criminal penalties, the imposition of investigative, remedial or corrective action obligations, the occurrence of restrictions, delays or cancellations in the permitting, development or expansion of projects, and the issuance of orders enjoining performance of some or all of the Company’s operations in a particular area. We could be exposed to liabilities for cleanup costs, natural resource damages, and other damages under these laws and regulations, with certain of these legal requirements imposing strict liability for such damages and costs, even though the conduct in pursuing the Company’s operations was lawful at the time it occurred or the conduct resulting in such damage and costs were caused by prior operators or other third-parties
Over time, environmental laws and regulations in the United States protecting the environment generally have become more stringent and are expected to continue to do so in the future. If existing environmental regulatory requirements or enforcement policies change or new regulatory or enforcement initiatives are developed and implemented in the future, the Company may be required to make significant, unanticipated capital and operating expenditures with respect to its continued operations. Examples of recent environmental regulations include the following:
• | Ground-Level Ozone Standards. In 2015, the EPA issued a final rule under the CAA, lowering the National Ambient Air Quality Standard (“NAAQS”) for ground-level ozone from 75 parts per billion to 70 parts per billion under both the primary and secondary standards to provide requisite protection of public health and welfare, respectively. Since that time, the EPA has issued area designations with respect to ground-level ozone and final requirements that apply to state, local, and tribal air agencies for implementing the 2015 NAAQS for ground-level ozone. State implementation of the revised NAAQS could, among other things, require installation of new emission controls on some of the Company’s equipment, result in longer permitting timelines, and significantly increase the Company's capital expenditures and operating costs arising from the program’s operations. |
• | EPA Review of Drilling Waste Classification. Drilling, fluids, produced water and most of the other wastes associated with the exploration, development and production of oil or natural gas, if properly handled, are currently exempt from regulation as hazardous waste under the RCRA and instead, are regulated under RCRA’s less stringent non-hazardous waste provisions. However, it is possible that certain oil and natural gas drilling and production wastes now classified as non-hazardous could be classified as hazardous wastes in the future. For example, in response to a federal consent decree issued in 2016, the EPA was required during 2019 to determine whether certain Subtitle D criteria regulations required revision in a manner that could result in oil and natural gas wastes being regulated as RCRA hazardous wastes. In April 2019, the EPA made a determination that such revision of the regulations was unnecessary. Any future loss of the RCRA exclusion for drilling fluids, produced waters and related wastes could result in an increase in the Company’s costs to manage and dispose of generated wastes, which could have a material adverse effect on the industry as well as on the Company’s business. |
• | Federal Jurisdiction over Waters of the United States. In 2015, the EPA and U.S. Army Corps of Engineers (“Corps”) under the Obama Administration released a final rule outlining federal jurisdictional reach under the Clean Water Act, over waters of the United States, including wetlands. In 2017, the EPA and the Corps under the Trump Administration agreed to reconsider the 2015 rule and, thereafter, on October 22, 2019, the agencies published a final rule made effective on December 23, 2019, rescinding the 2015 rule. On January 23, 2020, the two agencies issued a final rule redefining the Clean Water Act’s jurisdiction over waters of the United States, which redefinition is narrower than found in the 2015 rule. Upon being published in the Federal Register and the passage of 60 days thereafter, the January 23, 2020 final rule will become effective, at which point the United States will be covered under a single regulatory scheme as it relates to federal jurisdictional reach over waters of the United States. However, there remains the expectation that the January 23, 2020 final rule also will be legally challenged in federal district court. To the extent that any challenge to the January 23, 2020 final rule is successful and the 2015 rule or a revised rule expands the scope of the Clean Water Act’s jurisdiction in areas where the Company conducts operations, the Company could incur increased costs and restrictions, delays or cancellations in permitting or projects, which developments could expose it to significant costs and liabilities. |
Additionally, the federal Occupational Safety and Health Act and analogous state occupational safety and health laws require the program manager to organize information about materials, some of which may be hazardous or toxic, that are used, released or produced in the Company’s operations. Moreover, the OSHA hazard communication standard, the EPA community right-to-know regulations under Title III of the federal Superfund Amendment and Reauthorization Act and comparable state statutes require that information be maintained concerning hazardous materials used or produced in the Company’s operations and that this information be provided to employees, state and local government authorities and citizens.
Compliance of the Company with these regulations or other laws, regulations and regulatory initiatives, or any other new environmental and occupational health and safety legal requirements could, among other things, require the Company to install
22
new or modified emission controls on equipment or processes, incur longer permitting timelines, and incur significantly increased capital or operating expenditures, which costs may be significant. Moreover, any failure of the Company’s operations to comply with applicable environmental laws and regulations may result in governmental authorities taking actions against the Company that could adversely impact its operations and financial condition.
The ESA and other restrictions intended to protect certain species of wildlife govern our oil and natural gas operations, which constraints could have an adverse impact on our ability to expand some of our existing operations or limit our ability to explore for and develop new oil and natural gas wells.
The ESA and comparable state laws and other regulatory initiatives restrict activities that may affect endangered or threatened species or their habitats. Similar protections are offered to migrating birds under the federal Migratory Bird Treaty Act. Some of the Company’s operations may be located in or near areas that are designated as habitat for endangered or threatened species and, in these areas, the Company may be obligated to develop and implement plans to avoid potential adverse effects to protected species and their habitats, and the Company may be prohibited from conducting operations in certain locations or during certain seasons, such as breeding and nesting seasons, when its operations could have an adverse effect on the species. It is also possible that a federal or state agency could order a complete halt to the Company’s drilling activities in certain locations if it is determined that such activities may have a serious adverse effect on a protected species. Moreover, the U.S. Fish and Wildlife Service, may make determinations on the listing of species as endangered or threatened under the ESA pursuant to specific timelines. The identification or designation of previously unprotected species as threatened or endangered or the redesignation of lesser protected species in areas where underlying property operations are conducted could cause the Company to incur increased costs arising from species protection measures, time delays or limitations or cancellations on its exploration and production activities, which costs, delays, limitations or cancellations could have an adverse impact on the Company’s ability to develop and produce reserves. If the Company were to have a portion of its leases designated as critical or suitable habitat, it could adversely impact the value of its leases.
Enactment of executive, legislative or regulatory proposals under consideration could negatively affect our business.
Numerous executive, legislative and regulatory proposals affecting the oil and natural gas industry have been introduced, are anticipated to be introduced, or are otherwise under consideration, by the President, Congress, state legislatures and various federal and state agencies. Among these proposals are: (1) proposed legislation (none of which has passed) to repeal various tax deductions available to oil and natural gas producers as discussed in more detail below and (2) the Pipeline Safety, Regulatory Certainty, and Job Creation Act enacted in 2011, which increases penalties, grants new authority to impose damage prevention and incident notification requirements, and directs the Pipeline and Hazardous Materials Safety Administration to prescribe minimum safety standards for CO2 pipelines.
The foregoing described proposals, including other applicable proposals, could affect our operations and the costs thereof. The trend toward stricter standards, increased oversight and regulation and more extensive permit requirements, along with any future laws and regulations, could result in increased costs or additional operating restrictions which could have an effect on the Company, its operations, the demand for oil and natural gas, or the prices at which it can be sold. However, until such legislation or regulations are enacted or adopted into law and thereafter implemented, it is not possible to gauge their impact on our future operations or our results of operations and financial condition.
Federal, state and local legislative and regulatory initiatives relating to hydraulic fracturing could result in increased costs and additional operating restrictions or delays in the completion of oil and natural gas wells and adversely affect the Company’s production.
Hydraulic fracturing is an important and common practice that is used to stimulate production of gas and/or oil from dense subsurface rock formations. The hydraulic fracturing process involves the injection of water, sand or other proppant and chemical additives under pressure into targeted subsurface formations to fracture the surrounding rock and stimulate production. The Company uses hydraulic fracturing techniques in certain of its operations. Hydraulic fracturing typically is regulated by state oil and gas commissions or similar state agencies, but several federal agencies have conducted studies or asserted regulatory authority over certain aspects of the process. For example, in late 2016, the EPA released its final report on the potential impacts of hydraulic fracturing on drinking water resources, concluding that “water cycle” activities associated with hydraulic fracturing may impact drinking water resources under some circumstances. Additionally, the EPA has asserted regulatory authority pursuant to the SDWA Underground Injection Control (“UIC”) program over hydraulic fracturing activities involving the use of diesel and issued guidance covering such activities as well as published an Advance Notice of Proposed Rulemaking regarding Toxic Substances Control Act reporting of the chemical substances and mixtures used in hydraulic fracturing. The EPA also issued final regulations in 2012 and in 2016 under the CAA that govern performance standards, including standards for the capture of methane and volatile organic compound (“VOC”) air emissions released during oil and natural gas hydraulic fracturing. However, in September 2019, EPA
23
proposed an amendment to the existing standards that would remove the methane-specific requirements that currently apply in favor of relying on the emission limits for VOCs. Moreover, the EPA has published an effluent limit guideline final rule prohibiting the discharge of wastewater from onshore unconventional oil and natural gas extraction facilities to publicly owned wastewater treatment plants. Also, the BLM published a final rule in 2015 that established new or more stringent standards relating to hydraulic fracturing on federal and American Indian lands but the BLM rescinded the 2015 rule in late 2017; however, litigation challenging the BLM’s decision to rescind the 2015 rule remains pending in federal district court.
From time to time, legislation has been considered, but not adopted, in the U.S. Congress to provide for federal regulation of hydraulic fracturing and to require disclosure of the chemicals used in the hydraulic fracturing process. However, concern over the threat of climate change has resulted in the making of pledges by certain candidates seeking the office of the President of the United States in 2020 to ban hydraulic fracturing of oil and natural gas wells. Additionally, a bill was introduced in the Senate on January 28, 2020 that, if enacted as proposed, would ban hydraulic fracturing nationwide by 2025.
In addition, certain states, including Texas where we conduct operations, have adopted, and other states are considering adopting legal requirements that could impose new or more stringent permitting, public disclosure, or well construction requirements on hydraulic fracturing activities. States could elect to place certain prohibitions on hydraulic fracturing, following the approach taken by the States of Maryland, New York and Vermont. Local governments also may seek to adopt ordinances within their jurisdictions regulating the time, place and manner of drilling activities in general or hydraulic fracturing activities in particular. If new or more stringent federal, state, or local laws, regulations, presidential executive orders or other legal restrictions relating to the hydraulic fracturing process are adopted in areas where the Company operates, the Company could incur potentially significant added costs to comply with such requirements, experience restrictions, delays or cancellation in the pursuit of exploration, development or production activities, and perhaps even be precluded from drilling wells.
Increased regulation and attention given to the hydraulic fracturing process could lead to greater opposition to, and litigation concerning, oil and natural gas production activities using hydraulic fracturing techniques. Additional legislation or regulation could also lead to added restrictions, delays or cancellations with respect to our operations or increased operating costs in our production of oil and natural gas. The adoption of any federal, state or local laws or the implementation of regulations restricting or banning some or all of hydraulic fracturing could result in delays, eliminate certain drilling and injection activities and prohibit or make more difficult or costly the performance of hydraulic fracturing. These developments could adversely affect demand for our production and have a material adverse effect on our business or results of operations.
Our ability to produce crude oil and natural gas economically and in commercial quantities could be impaired if we are unable to acquire adequate supplies of water for our drilling operations or are unable to dispose of or recycle the water we use economically and in an environmentally safe manner.
Our operations include the need of water for use in oil and natural gas exploration and production activities. The Company’s access to water may be limited due to reasons such as prolonged drought, private third party competition for water in localized areas, or the Company’s inability to acquire or maintain water sourcing permits or other rights. In addition, some state and local governmental authorities have begun to monitor or restrict the use of water subject to their jurisdiction for hydraulic fracturing to ensure adequate local water supply. Any such decrease in the availability of water could adversely affect the Company’s business and financial condition and operations. Moreover, any inability by the Company to locate or contractually acquire and sustain the receipt of sufficient amounts of water could adversely impact the Company’s exploration and production operations and have a corresponding adverse effect on the Company’s business and financial condition.
Federal or state legislative and regulatory initiatives related to induced seismicity could result in operating restrictions or delays that could adversely affect the Company’s production of oil and natural gas.
Operations associated with our production and development activities generate drilling muds, produced waters and other waste streams, some of which may be disposed of by means of injection into underground wells situated in non-producing subsurface formations. These disposal wells are regulated pursuant to the UIC program established under the SDWA and analogous state laws. The UIC program requires permits from the EPA or an analogous state agency for construction and operation of such disposal wells, establishes minimum standards for disposal well operations, and restricts the types and quantities of fluids that may be disposed. While these permits are issued pursuant to existing laws and regulations, these legal requirements are subject to change based on concerns of the public or governmental authorities regarding such disposal activities. One such concern relates to seismic events near underground disposal wells used for the disposal by injection of produced water or certain other oilfield fluids resulting from oil and natural gas activities. Developing research suggests that the link between seismic activity and produced water disposal may vary by region, and that only a very small fraction of the tens of thousands of injection wells have been suspected to be, or may have been, the likely cause of induced seismicity. In 2016, the United States Geological Survey identified Texas, where the Company conducts operations, as one of six states with more significant rates of induced seismicity. Since that time, the United
24
States Geological Survey indicates that this rate has decreased in Texas, although concern continues to exist over earthquakes arising from induced seismic activities.
In response to concerns regarding induced seismicity, regulators in some states have imposed, or are considering imposing, additional requirements in the permitting of produced water disposal wells or otherwise to assess any relationship between seismicity and the use of such wells. For example, Oklahoma has issued rules for produced water disposal wells that imposed certain permitting and operating restrictions and reporting requirements on disposal wells in proximity to faults and also, from time to time, is developing and implementing plans directing certain wells where seismic incidents have occurred to restrict or suspend disposal well operations. In Texas, the Railroad Commission of Texas has adopted similar rules for the permitting of produced water disposal wells. Another consequence of seismic events may be lawsuits alleging that disposal well operations have caused damage to neighboring properties or otherwise violated state and federal rules regulating waste disposal. These developments could result in additional regulation and restrictions on the use of injection wells in connection with Company activities to dispose of produced water and certain other oilfield fluids. Increased regulation and attention given to induced seismicity also could lead to greater opposition, including litigation, to oil and natural gas activities utilizing injection wells for waste disposal. Any one or more of these developments may result in the Company having to limit disposal well volumes, disposal rates or locations, or require third party disposal well operators the Company may engage to dispose of produced water generated by Company activities to shut down disposal wells, which development could adversely affect the Company’s production or result in the Company incurring increased costs and delays with respect to Company operations.
The Company’s operations are subject to a number of risks arising out of the threat of climate change that could result in increased operating costs, limit the areas in which oil and natural gas production may occur, and reduced demand for the oil and natural gas the Company produces
Climate change continues to attract considerable public, governmental and scientific attention. As a result, numerous proposals have been made and are likely to continue to be made at the international, national, regional and state levels of government to monitor and limit emissions of GHGs as well as to restrict or eliminate such future emissions. As a result, our operations as well as the operations of our oil and natural gas exploration and production customers are subject to a series of regulatory, political, litigation, and financial risks associated with the production and processing of fossil fuels and emission of GHGs.
At the federal level, no comprehensive climate change legislation has been implemented to date. However, the EPA has determined that emissions of GHGs present an endangerment to public health and the environment and has adopted regulations under existing provisions of the CAA that, among other things, establish Prevention of Significant Deterioration construction and Title V operating permit reviews for GHG emissions from certain large stationary sources, require the monitoring and annual reporting of GHG emissions from certain petroleum and natural gas system sources, implement CAA emission standards directing the reduction of methane from certain new, modified, or reconstructed facilities in the oil and natural gas sector, and together with the U.S. Department of Transportation, implement GHG emissions limits on vehicles manufactured for operation in the United States. Additionally, various states and groups of states have adopted or are considering adopting legislation, regulations or other regulatory initiatives that are focused on such areas as GHG cap and trade programs, carbon taxes, reporting and tracking programs, and restriction of emissions. At the international level, there exists the United Nations-sponsored “Paris Agreement,” which is a non-binding agreement for nations to limit their GHG emissions through individually-determined reduction goals every five years after 2020, although the United States has announced its withdrawal from such agreement, effective November 4, 2020.
Governmental, scientific, and public concern over the threat of climate change arising from GHG emissions has resulted in increasing political risks in the United States, in the form of pledges made by certain candidates seeking the office of the President of the United States in 2020, including proposals to ban hydraulic fracturing of oil and natural gas wells and ban new leases for production of minerals on federal properties, including onshore lands and offshore waters. Other actions with respect to oil and natural gas production activities that could be pursued may include more restrictive requirements for the establishment of pipeline infrastructure or the permitting of liquified natural gas export facilities, as well as the rescission of the United States’ withdrawal from the Paris Agreement in November 2020. Litigation risks are also increasing, as a number of cities, local governments, and other plaintiffs have sought to bring suit against the largest oil and natural gas exploration and production companies in state or federal court, alleging, among other things, that such companies created public nuisances by producing fuels that contributed to global warming effects, such as rising sea levels, and therefore are responsible for roadway and infrastructure damages as a result, or alleging that the companies have been aware of the adverse effects of climate change for some time but defrauded their investors by failing to adequately disclose those impacts.
There are also increasing financial risks for fossil fuel producers, as stockholders and bondholders currently invested in fossil fuel energy companies concerned about the potential effects of climate change may elect in the future to shift some or all of their investments into non-fossil fuel energy related investments. Institutional investors who provide capital to fossil fuel energy companies also have become more attentive to sustainability issues, and some of them may elect not to provide funding for fossil
25
fuel energy companies. Additionally, the lending and investment practices of institutional lenders have been the subject of intensive lobbying efforts in recent years, oftentimes public in nature, by environmental activists, proponents of the international Paris Agreement, and foreign citizenry concerned about climate change not to provide funding for fossil fuel producers. Limitation of investments in and financings for fossil fuel energy could restrict the availability of capital, resulting in the restriction, delay, or cancellation of development and production activities.
The adoption and implementation of any international, federal or state laws or regulations that impose more stringent standards for GHG emissions from the oil and natural gas sector or otherwise restrict the areas in which this sector may produce oil and natural gas or generate GHG emissions could require the Company to incur increased operating costs or costs of compliance and thereby reduce demand for the oil and natural gas produced by the Company. Additionally, political, litigation, and financial risks may result in the Company restricting or cancelling development or production activities, incurring liability for infrastructure damages as a result of climate changes, or impairing its ability to continue to operate in an economic manner, which also could reduce demand for or lower the value of, the oil and natural gas the Company produces. One or more of these developments could have a material adverse effect on the Company’s business, financial condition and results of operations.
Finally, it should be noted that increasing concentrations of GHGs in the Earth’s atmosphere may produce climate changes that have significant physical effects, such as increased frequency and severity of storms, floods and other climatic events. If any such effects were to occur, they could have an adverse effect on the Company’s operations. At this time, the Company has not developed a comprehensive plan to address the legal, economic, social, or physical impacts of climate change on the Company’s operations.
Changes to the U.S. federal tax laws could adversely affect our financial position, results of operations and cash flows.
Legislation enacted in Public Law No. 115-97, commonly referred to as the Tax Cuts and Jobs Act, made significant changes to U.S. tax laws. The Tax Cuts and Jobs Act (i) eliminated the deduction for certain domestic production activities, (ii) imposed new limitations on the utilization of net operating losses, (iii) eliminated the exception under Section 162(m) for qualified performance-based compensation and (iv) provided for more general changes to the taxation of corporations, including changes to cost recovery rules and to the deductibility of interest expense, which may impact the taxation of oil and natural gas companies. While past legislative proposals have included changes to certain key U.S. federal income tax provisions currently available to oil and natural gas companies, including (i) the repeal of the percentage depletion allowance for oil and gas properties, (ii) the elimination of current deductions for intangible drilling and development costs, and (iii) an extension of the amortization period for certain geological and geophysical expenditures, these specific changes are not included in the Tax Cuts and Jobs Act (the “TCJA”). No accurate prediction can be made as to whether any such legislative changes will be proposed or enacted in the future or, if enacted, what the specific provisions or the effective date of any such legislation would be. This legislation or any future similar changes in U.S. federal income tax laws could eliminate or postpone certain tax deductions that currently are available with respect to natural gas and oil exploration and production.
Our ability to deduct interest expense incurred in our business may be limited.
In general, we are entitled to a deduction for interest paid or accrued on indebtedness properly allocable to our trade or business during our taxable year. However, under the Tax Cuts and Jobs Act, for taxable years beginning after December 31, 2017, our deduction for “business interest” is limited to the sum of our business interest income and 30% of our “adjusted taxable income.” For the purposes of this limitation, our adjusted taxable income is computed without regard to any business interest expense or business interest income, and in the case of taxable years beginning before January 1, 2022, any deduction allowable for depreciation, amortization, or depletion to the extent such depreciation, amortization, or depletion is not capitalized into cost of goods sold with respect to inventory.
Our ability to deduct compensation paid to certain employees may be limited.
Section 162(m) of the Code limits our ability to deduct certain compensation paid to covered employees (i.e., individuals currently serving or who have previously served, at any point after December 31, 2016, as the Chief Executive Officer, Chief Financial Officer and the three other highest compensated officers of the Company). Previously, Section 162(m) provided an exception for certain qualified performance-based compensation; however, the Tax Cuts and Jobs Act eliminates this exception (other than for compensation provided under certain grandfathered arrangements), and as a result, our ability to deduct certain amounts paid to our covered employees may be limited.
Legal proceedings could result in liability affecting our results of operations.
26
Most oil and natural gas companies, such as us, are involved in various legal proceedings, such as title, royalty, environmental or contractual disputes, in the ordinary course of business. We defend ourselves vigorously in all such matters, if appropriate.
Because we maintain a portfolio of assets in the various areas in which we operate, the complexity and types of legal proceedings with which we may become involved may vary, and we could incur significant legal and support expenses in different jurisdictions. If we are not able to successfully defend ourselves, there could be a delay or even halt in our exploration, development or production activities or other business plans, resulting in a reduction in reserves, loss of production and reduced cash flows. Legal proceedings could result in a substantial liability. In addition, legal proceedings distract management and other personnel from their primary responsibilities.
A cyber incident could result in information theft, data corruption, operational disruption, and/or financial loss.
Our business has become increasingly dependent on digital technologies to conduct day-to-day operations, including certain of our exploration, development and production activities. We depend on digital technology to estimate quantities of oil and natural gas reserves, process and record financial and operating data, analyze seismic and drilling information and in many other activities related to our business. Our technologies, systems and networks may become the target of cyber attacks or information security breaches that could result in the disruption of our business operations, damage to our properties and/or injuries. For example, unauthorized access to our seismic data, reserves information or other proprietary information could lead to data corruption, communication interruption, or other operational disruptions in our drilling or production operations.
To date we are not aware of any material losses relating to cyber attacks, however there can be no assurance that we will not suffer such losses in the future. As cyber threats continue to evolve, we may be required to expend significant additional resources to continue to modify or enhance our protective measures or to investigate and remediate any cyber vulnerabilities.
There may be circumstances in which the interests of our significant stockholders could be in conflict with the interests of our other stockholders.
Funds associated with Strategic Value Partners LLC (“SVP”) and DW Partners, LP (“DW”) currently own approximately 37.9% and 15.7%, respectively, of our outstanding common stock. SVP currently has a right to nominate two of our directors under our director nominating agreement described below. DW, together with other former noteholders who received our common stock pursuant to our plan of reorganization, collectively hold the current right to nominate two additional directors. Our current board is limited to seven directors under the terms of the director nomination agreement. Circumstances may arise in which these stockholders may have an interest in pursuing or preventing acquisitions, divestitures or other transactions, including the issuance of additional shares or debt, that, in their judgment, could enhance their investment in us or another company in which they invest. Such transactions might adversely affect us or other holders of our common stock. Furthermore, we have entered into a director nomination agreement with each of SVP, DW and other former holders of our senior notes that provides for certain continuing nomination rights subject to conditions on share ownership. In addition, our significant concentration of share ownership may adversely affect the trading price of our common shares because investors may perceive disadvantages in owning shares in companies with significant stockholders.
We identified a material weakness in our internal control over financial reporting during 2019 and may identify additional material weaknesses in the future or otherwise fail to maintain an effective system of internal controls, which may result in material misstatements of our financial statements or cause us to fail to meet our periodic reporting obligations.
We are required to comply with certain provisions of Section 404 of the Sarbanes-Oxley Act of 2002 (“Sarbanes-Oxley Act”). Section 404 requires that we document and test our internal control over financial reporting and issue management’s assessment of our internal control over financial reporting. In connection with the preparation of our financial statements for the three months ended June 30, 2019, we identified and disclosed a material weakness related to the design and operation of the controls over our income tax accounting process related to the review and analysis of the allocation of intra-period adjustments to deferred income tax expense resulting from significant, unusual and infrequent transactions. To remediate the material weakness, we redesigned and expanded our management review controls and enhanced the precision of review around the key income tax areas relating to the allocation of intra-period adjustments to deferred income tax expense. Based on testing performed by management, the implemented controls are operating effectively and the material weakness has been remediated as of December 31, 2019.
Effective internal controls are necessary for us to provide reliable financial reports and prevent fraud. If we fail to comply with the requirements of Section 404 of the Sarbanes-Oxley Act, the accuracy and timeliness of the filing of our annual and quarterly reports may be materially adversely affected and could cause investors to lose confidence in our reported financial information, which could have a negative effect on the trading price of our stock. In addition, a material weakness in the effectiveness of our internal control over financial reporting could result in an increased chance of fraud and the loss of customers, reduce our
27
ability to obtain financing and require additional expenditures to comply with these requirements, each of which could have a material adverse effect on our business, results of operations and financial condition.
We do not expect to pay dividends in the near future.
We do not anticipate that cash dividends or other distributions will be paid with respect to our common stock in the foreseeable future. In addition, restrictive covenants in certain debt instruments to which we are, or may be, a party, may limit our ability to pay dividends or for us to receive dividends from our operating companies, any of which may negatively impact the trading price of our common stock.
A small number of institutional investors controls a significant percentage of our voting power and possess negative control or veto rights with respect to certain proposed Company transactions.
A small group of institutional investors, who are parties to our director nomination agreement currently, beneficially own a majority of our issued and outstanding common stock. Consequently, such investors are able to strongly influence all matters that require approval by our stockholders, including the election and removal of directors, changes to our organizational documents and approval of acquisition offers and other significant corporate transactions. This concentration of ownership limits our other stockholders’ ability to influence corporate matters. In addition, the institutional holders that are parties to the director nomination agreement possess negative control or veto rights under the Company’s First Amended and Restated Certificate of Incorporation (“Charter”)with respect to certain transactions the Company may propose to undertake for so long as such parties collectively hold 50% or more of the Company’s issued and outstanding shares of common stock. Such parties are entitled to notice of certain proposed transactions which may be vetoed if such parties who collectively hold at least 50% of the issued and outstanding shares of common stock object to such action. These veto rights of the parties to the director nomination agreement apply to the following transactions:
• | the sale or other disposition of assets of the Company or any of its subsidiaries, in any single transaction or series of related transactions, with a fair market value in the aggregate in excess of $75 million, other than certain intercompany ordinary course transactions; |
• | any sale, recapitalization, liquidation, dissolution, winding up, bankruptcy event, reorganization, consolidation, or merger of the Company or any of its subsidiaries; |
• | issuing or repurchasing any shares of our common stock or other equity securities (or securities convertible into or exercisable for equity securities) in an amount that is in the aggregate in excess of $5 million, other than pursuant to employee benefit and incentive plans (including certain repurchases of capital stock to satisfy withholding or similar taxes in connection with any exercise of equity rights) and the issuance of shares of common stock upon exercise of our outstanding warrants; |
• | incurring any indebtedness for borrowed money (including through capital leases, the issuance of debt securities or the guarantee of indebtedness of another person or entity), in any single transaction or series of related transactions, that is in the aggregate in excess of $75 million other than indebtedness incurred to refinance indebtedness issued for less than $75 million, intercompany indebtedness, and certain other obligations incurred in the ordinary course of business; |
• | entering into any proposed transaction or series of related transactions involving a Change of Control of the Company (for purposes of this provision, “Change of Control” shall mean any transaction resulting in any person or group (as such terms are defined in Sections 13(d) and 14(d) of the Exchange Act) acquiring “beneficial ownership” (as defined in Rules 13d-3 and 13d-5 under the Exchange Act) of more than 50% of the total outstanding equity interests of the Company (measured by voting power rather than number of shares)); |
• | entering into or consummating any material acquisition of businesses, companies or assets (whether through sales or leases) or joint ventures, in any single transaction or series of related transactions, in the aggregate in excess of $75 million; |
• | increasing or decreasing the size of the Board; |
• | amending the Charter or the First Amended and Restated Bylaws of the Company (“Bylaws”); or |
• | entering into any arrangements or transactions with affiliates of the Company. |
Certain provisions of our Charter and our Bylaws may make it difficult for stockholders to change the composition of our Board and may discourage, delay or prevent a merger or acquisition that some stockholders may consider beneficial.
Certain provisions of our Charter and our Bylaws and our existing director nomination agreement may have the effect of delaying or preventing changes in control if our Board determines that such changes in control are not in the best interests of the Company and our stockholders. The provisions in our Charter and Bylaws and our existing director nomination agreement include, among other things, those that:
28
• | provide for a classified board of directors; |
• | authorize our Board to issue preferred stock and to determine the price and other terms, including preferences and voting rights, of those shares without stockholder approval; |
• | establish advance notice procedures for nominating directors or presenting matters at stockholder meetings; |
• | provide SVP and certain other institutional stockholders the right to nominate up to four of our directors; |
• | limit the persons who may call special meetings of stockholders; and |
• | provide veto rights to certain stockholders as detailed in our Charter, including any transaction that may constitute a change of control, as defined in the Charter. |
While these provisions have the effect of encouraging persons seeking to acquire control of the Company to negotiate with our Board, they could enable the Board to hinder or frustrate a transaction that some, or a majority, of the stockholders may believe to be in their best interests and, in that case, may prevent or discourage attempts to remove and replace incumbent directors. These provisions may frustrate or prevent any attempts by our stockholders to replace or remove our current management by making it more difficult for stockholders to replace members of our Board, which is responsible for appointing the members of our management. Furthermore, we have entered into a director nomination agreement with each of SVP, DW and other former holders of our senior notes that provides for certain continuing nomination rights subject to conditions on share ownership.
Our Charter designates the Court of Chancery of the State of Delaware as the sole and exclusive forum for certain types of actions and proceedings that may be initiated by our stockholders, which could limit our stockholders’ ability to obtain a favorable judicial forum for disputes with us or our directors, officers, employees or agents.
Our Charter provides that, unless we consent in writing to the selection of an alternative forum, the Court of Chancery of the State of Delaware will, to the fullest extent permitted by applicable law, be the sole and exclusive forum for (i) any derivative action or proceeding brought on our behalf, (ii) any action asserting a claim of breach of a fiduciary duty owed by any of our directors, officers, employees or agents to us or our stockholders, (iii) any action asserting a claim arising pursuant to any provision of the Delaware General Corporation Law, our Charter or our Bylaws, or (iv) any action asserting a claim against us or any director or officer or other employee of ours governed by the internal affairs doctrine, in each such case subject to such Court of Chancery having personal jurisdiction over the indispensable parties named as defendants therein.
The exclusive forum provision would not apply to suits brought to enforce any liability or duty created by the Securities Act of 1933, as amended (the “Securities Act”), or the Exchange Act or any other claim for which the federal courts have exclusive jurisdiction. To the extent that any such claims may be based upon federal law claims, Section 27 of the Exchange Act creates exclusive federal jurisdiction over all suits brought to enforce any duty or liability created by the Exchange Act or the rules and regulations thereunder. Furthermore, Section 22 of the Securities Act creates concurrent jurisdiction for federal and state courts over all suits brought to enforce any duty or liability created by the Securities Act or the rules and regulations thereunder.
The enforceability of similar choice of forum provisions in other companies’ certificates of incorporation or similar governing documents has been challenged in legal proceedings, and it is possible that a court could find the choice of forum provisions contained in our Charter to be inapplicable or unenforceable, including with respect to claims arising under the U.S. federal securities laws.
Any person or entity purchasing or otherwise holding any interest in shares of our capital stock will be deemed to have notice of, and consented to, the provisions of our Charter described in the preceding sentence. This choice of forum provision may limit a stockholder’s ability to bring a claim in a judicial forum that it finds favorable for disputes with us or our directors, officers, employees or agents, which may discourage such lawsuits against us and such persons. Alternatively, if a court were to find these provisions of our Charter inapplicable to, or unenforceable in respect of, one or more of the specified types of actions or proceedings, we may incur additional costs associated with resolving such matters in other jurisdictions, which could adversely affect our business, financial condition or results of operations.
29
Item 1B. Unresolved Staff Comments
None.
Glossary of Abbreviations and Terms
The following abbreviations and terms have the indicated meanings when used in this report:
ASC - Accounting Standards Codification.
Bbl - Barrel or barrels of oil.
Bcf - Billion cubic feet of natural gas.
Bcfe - Billion cubic feet of natural gas equivalent (see Mcfe).
Boe - Barrels of oil equivalent.
Completion - Preparation of a well bore and installation of permanent equipment for production of oil, natural gas or NGLs or, in the case of a dry well, reporting to the appropriate authority that the well has been abandoned.
Condensate - Liquid hydrocarbons that are found in natural gas wells and condense when brought to the well surface. Condensate is used synonymously with oil.
Differential - An adjustment to the price of oil or natural gas from an established spot market price to reflect differences in the quality and/or location of oil or natural gas.
Developed Oil and Gas Reserves - Oil and natural gas reserves of any category that can be expected to be recovered through existing wells with existing equipment and operating methods.
Development Well - A well drilled within the proved area of an oil or natural gas reservoir to the depth of a stratigraphic horizon known to be productive.
Dry Well - An exploratory or development well that is not a producing well.
Effective Date - The Company's date of emergence from bankruptcy April 22, 2016.
Exploratory Well - A well drilled to find a new field or to find a new reservoir in a field previously found to be productive of oil or natural gas in another reservoir.
FASB - The Financial Accounting Standards Board.
Field - An area consisting of a single reservoir or multiple reservoirs all grouped on, or related to, the same individual geological structural feature or stratigraphic condition. The field name refers to the surface area, although it may refer to both the surface and the underground productive formations.
Gross Acre - An acre in which a working interest is owned. The number of gross acres is the total number of acres in which a working interest is owned.
Gross Well - A well in which a working interest is owned. The number of gross wells is the total number of wells in which a working interest is owned.
MBbl - Thousand barrels of oil.
MBoe - Thousand barrels of oil equivalent.
Mcf - Thousand cubic feet of natural gas.
Mcfe - Thousand cubic feet of natural gas equivalent, which is determined using the ratio of one barrel of oil, condensate, or natural gas liquids to 6 Mcf of natural gas.
MMBbl - Million barrels of oil.
MMBtu - Million British thermal units, which is a heating equivalent measure for natural gas and is an alternate measure of natural gas reserves, as opposed to Mcf, which is strictly a measure of natural gas volumes. Typically, prices quoted for natural gas are designated as price per MMBtu, the same basis on which natural gas is contracted for sale.
MMcf - Million cubic feet of natural gas.
MMcfe - Million cubic feet of natural gas equivalent (see Mcfe).
Net Acre - A net acre is deemed to exist when the sum of fractional working interests owned in gross acres equals one. The number of net acres is the sum of fractional working interests owned in gross acres expressed as whole numbers and fractions thereof.
Net Well - A net well is deemed to exist when the sum of fractional working interests owned in gross wells equals one. The number of net wells is the sum of fractional working interests owned in gross wells expressed as whole numbers and fractions thereof.
NGL - Natural gas liquid.
NYMEX - The New York Mercantile Exchange.
Producing Well - An exploratory or development well found to be capable of producing either oil or natural gas in sufficient quantities to justify completion as an oil or natural gas well.
Proved Oil and Gas Reserves - Those quantities of oil and gas, which, by analysis of geoscience and engineering data, can be estimated with reasonable certainty to be economically producible from a given date forward, from known reservoirs, and under existing economic conditions, operating methods, and government regulations. For reserves calculations economic conditions include prices based on either the preceding 12-months' average price based on closing prices on the first day of each month, or prices defined by existing contractual arrangements.
30
Proved Undeveloped (PUD) Locations - A location containing proved undeveloped reserves.
PV-10 Value - The estimated future net revenues to be generated from the production of proved reserves discounted to present value using an annual discount rate of 10%. These amounts are calculated net of estimated production costs and future development costs, using prices based on either the preceding 12-months' average price based on closing prices on the first day of each month, or prices defined by existing contractual arrangements, without escalation and without giving effect to non-property related expenses, such as general and administrative expenses, debt service, future income tax expense, or depreciation, depletion, and amortization. PV-10 Value is a non-GAAP measure and its use is explained under “Item 1& 2. Business and Properties - Oil and Natural Gas Reserves” above in this Form 10-K.
Reserves - Estimated remaining quantities of oil and natural gas and related substances anticipated to be economically producible, as of a given date, by application of development projects to known accumulations.
Reservoir - A porous and permeable underground formation containing a natural accumulation of producible oil and/or natural gas that is confined by impermeable rock or water barriers and is individual and separate from other reservoirs.
Spot Market Price - The cash market price without reduction for expected quality, transportation and demand adjustments.
Standardized Measure - The present value, discounted at 10% per year, of estimated future net revenues from the production of proved reserves, computed by applying sales prices and deducting the estimated future costs to be incurred in developing, producing and abandoning the proved reserves (computed based on current costs and assuming continuation of existing economic conditions). Future income taxes are calculated by applying the statutory federal and state income tax rate to pre-tax future net cash flows, net of the tax basis of the properties involved and utilization of available tax carryforwards related to oil and natural gas operations. Sales prices were prepared using average hydrocarbon prices equal to the unweighted arithmetic average of hydrocarbon prices on the first day of each month within the 12-month period preceding the reporting date (except for consideration of price changes to the extent provided by contractual arrangements).
Undeveloped Oil and Gas Reserves - Oil and natural gas reserves of any category that are expected to be recovered from new wells on undrilled acreage or from existing wells where a relatively major expenditure is required for recompletion.
WTI - West Texas Intermediate.
Item 3. Legal Proceedings
In the ordinary course of business, we are party to various legal actions, which arise primarily from our activities as operator of oil and natural gas wells. In our opinion, the outcome of any such currently pending legal actions will not have a material adverse effect on our financial position or results of operations.
Item 4. Mine Safety Disclosures
Not Applicable.
31
PART II
Item 5. Market for Registrant's Common Equity, Related Stockholder Matters and Issuer Purchases of Equity Securities
Common Stock
Our common stock is traded on the New York Stock Exchange under the symbol “SBOW”. Since inception, no cash dividends have been declared on our common stock. Cash dividends are restricted under the terms of our credit agreements, and we presently intend to continue a policy of using retained earnings for expansion of our business.
We had approximately 97 stockholders of record as of December 31, 2019.
Stock Repurchase
The following table summarizes repurchases of our common stock during the fourth quarter of 2019, all of which were shares withheld from employees to satisfy tax obligations arising upon the vesting of restricted shares:
Period | Total Number of Shares Purchased | Average Price Paid Per Share | Total Number of Shares Purchased as Part of Publicly Announced Plans or Programs | Approximate Dollar Value of Shares that May Yet Be Purchased Under the Plans or Programs (in thousands) | |||||||||
October 1 - 31, 2019 | — | $ | — | — | $--- | ||||||||
November 1- 30, 2019 | 7,118 | $ | 12.55 | — | — | ||||||||
December 1 - 31, 2019 | — | $ | — | — | — | ||||||||
Total | 7,118 | $ | 12.55 | — | $--- | ||||||||
Equity Compensation Plan Information
For information regarding the number of shares of our common stock that are available for issuance under all of our existing equity compensation plans as of December 31, 2019 see Note 7 of the consolidated financial statements included in this Form 10-K.
32
Share Performance Graph
The following graph compares the cumulative total return to our stockholders on our common stock beginning October 4, 2016 through December 31, 2019, relative to the cumulative returns of the Standard and Poor's 500 Index (“S&P 500”) and the Standard and Poor's 500 Oil & Gas Exploration & Production Index (“S&P O&G E&P”) for the same period. The comparison was prepared based upon the assumption that $100 was invested on October 4, 2016 in each of the following: the common stock of SilverBow Resources, the S&P 500 and the S&P O&G E&P.
The graph begins on October 4, 2016, the date that our common stock began trading on the OTCQX market following our emergence from bankruptcy under the ticker “SWTF.” We successfully reorganized and emerged from bankruptcy on April 22, 2016; however, our former common stock was canceled as part of the reorganization and the new common stock that was issued upon our emergence was not trading on an exchange or platform until October 4, 2016. On May 5, 2017, through amendments to its Charter and Bylaws, the Company rebranded and changed its name from Swift Energy Company to SilverBow Resources, Inc. Additionally, the Company’s common stock began trading on the New York Stock Exchange under the ticker symbol “SBOW” on May 5, 2017.
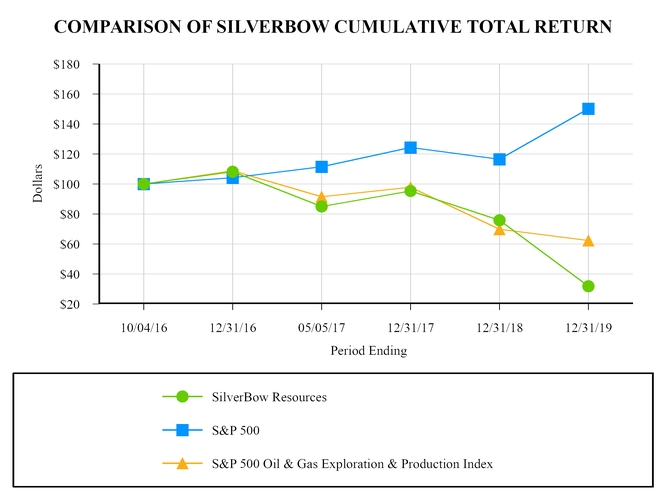
The performance graph above is being furnished solely to accompany this Report pursuant to Item 201(e) of Regulation S-K, is not being filed for purposes of Section 18 of the Exchange Act and is not to be incorporated by reference into any filing of the Company, whether made before or after the date hereof, regardless of any general incorporation language in such filing.
33
Item 6. Selected Financial Data
Not required.
34
Item 7. Management’s Discussion and Analysis of Financial Condition and Results of Operations
You should read the following discussion and analysis in conjunction with the Company's financial information and its audited consolidated financial statements and accompanying notes for the years ended December 31, 2019 and 2018 included in this Form 10-K. The following information contains forward-looking statements; see “Forward-Looking Statements” on page 45 of this report.
Company Overview
SilverBow Resources is a growth-oriented independent oil and gas company headquartered in Houston, Texas. The Company's strategy is focused on acquiring and developing assets in the Eagle Ford Shale located in South Texas where it has assembled approximately 118,000 net acres across five operating areas. The Company's acreage position in each of its operating areas is highly contiguous and designed for optimal and efficient horizontal well development. The Company has built a balanced portfolio of properties with a significant base of current production and reserves coupled with low-risk development drilling opportunities and meaningful upside from newer operating areas.
The Company produced an average 234 MMcfe per day during the fourth quarter of 2019 and as of December 31, 2019 had proved reserves of 1,420 Bcfe (82% natural gas) with a PV-10 of $976 million. PV-10 Value is a non-GAAP measure, see the section titled “Oil and Natural Gas Reserves” of this Form 10-K for a reconciliation of this non-GAAP measure to the Standardized Measure of discounted future net cash flows, the most directly comparable GAAP measure.
Being a committed and long-term operator in South Texas, the Company possesses a significant understanding of the reservoir characteristics, geology, landowners and competitive landscape in the region. The Company leverages this in-depth knowledge to continue to assemble high quality drilling inventory while continuously enhancing its operations to maximize returns on capital invested.
Operational Results
The Company continues to optimize completion techniques in order to enhance well performance across its portfolio. The following table and discussion highlights the Company's drilling and completion schedule for 2019:
Fields | Net Acreage | 2019 Production (Mcfe/d) | Gas as % of 2019 Production | 2019 Net Wells Drilled | 2019 Net Wells Completed | ||||||||||
Artesia | 12,402 | 53,680 | 43 | % | 11 | 11 | |||||||||
AWP | 36,435 | 40,101 | 45 | % | 6 | 7 | |||||||||
Fasken | 8,393 | 104,674 | 100 | % | 7 | 9 | |||||||||
Oro Grande | 27,085 | 20,167 | 100 | % | 1 | 1 | |||||||||
Uno Mas | 17,047 | 10,193 | 96 | % | — | — | |||||||||
Other (1) | 16,338 | 2,202 | 35 | % | 2 | 2 | |||||||||
Total | 117,700 | 231,017 | 76 | % | 27 | 30 | |||||||||
(1) Other includes non-core properties.
During the fourth quarter of 2019, the Company brought six net wells online. For the full year, the Company drilled 27 net wells and completed 30 net wells. The Company's drilling and completion activity was focused primarily on its liquids-rich areas, namely McMullen Oil and La Salle Condensate, as well as the completion of the first two wells on SilverBow's new acreage block in Dimmit County.
In the McMullen Oil area, the Company brought seven net wells online in 2019. Two of the longest laterals in the Company's history were brought online during the second quarter and are continuing to perform well. Utilizing that experience, SilverBow drilled two additional 10,300 foot laterals in 21 days, further emphasizing the drilling team's focus on executional performance. Those wells were brought online in late January 2020 and are performing within expectations.
In the La Salle Condensate area, the Company brought 11 net wells online in 2019. These wells were identified in an under-exploited area of the Company's position as part of its pivot to liquids development. The wells continue to perform well and are achieving much higher per well recoveries than historical wells in the area.
35
In Dimmit County, SilverBow added approximately 16,000 net acres at favorable entry costs during 2019. The Company brought two net wells online which have performed in line with expectations. The team is focused on early delineation and geoscience work to identify optimal targeting and large-scale development planning.
With the strong performance and liquids development focus in the near term, the Company expects to remain active in the McMullen Oil area with some added development plans for the La Salle Condensate area. The Company has also planned additional delineation drilling in Dimmit County.
In the Webb County Gas area, the Company brought 11 net wells online in 2019. Five of the net wells were brought online early in the year, and no further activity was expected until the Company opportunistically closed on the La Mesa farm-in. This allowed the development of a six-well pad with each well’s lateral extending to 10,000 feet. As a direct result of the new project planning processes, the Company was able to close the La Mesa farm-in and turn six wells to sales in just six months, achieving a peak rate of 100 MMcf/d in December. SilverBow utilized two completion spreads for the La Mesa project to most efficiently complete and bring online the six-well pad. The two crews were able to complete 18 stages per day on average, and at peak efficiency the crews reached a maximum of 28 stages per day, while placing 147 million pounds of proppant.
In the Southern Eagle Ford Gas area, the Company brought three wells online. The team was able to reduce the average per well cost from $12 million to $8 million, a 33% decrease from the prior year, displaying the Company's commitment to operational excellence.
2019 marked a year of execution and performance as the Company implemented a number of planning and operational processes which resulted in higher operational efficiencies and lower cycle times. The Company drilled 32% more lateral footage per day while lowering the per lateral foot costs by 24% as compared to 2018 performance. On the completion side, improved well site management doubled the number of stages per day completed as compared to 2018, while reducing costs by 26%. The improved well site management processes further lowered the time from rig release to first stage pumped by six days, accelerating time to first sales. When combined, the average time from spud to first sales was reduced significantly from 71 days in 2018 to 43 days in 2019. SilverBow's continued success in reducing costs is a direct result of its operational and supply teams working with vendors to negotiate the best prices and logistical considerations for the materials used in its operations.
2019 cost reduction initiatives: The Company continues to focus on cost reduction measures. These initiatives include the use of regional sand in completions, improved utilization of existing facilities, elimination of redundant equipment, and replacement of rental equipment with company-owned equipment. As previously mentioned, the Company continues to improve its process for drilling, completing and equipping wells. The Company's procurement team takes a process-oriented approach to reducing the total delivered costs of purchased services by examining costs at their most granular level. Services are routinely sourced directly from the suppliers. The Company's lease operating expenses were $0.25 per Mcfe for the year ended December 31, 2019 as compared to $0.26 per Mcfe for the same period in 2018.
The Company's cash general and administrative costs were $18.7 million (a non-GAAP financial measure calculated as $24.9 million in net general and administrative costs less $6.1 million of share based compensation) for the year ended December 31, 2019, or $0.22 per Mcfe, compared to $16.6 million (a non-GAAP financial measure calculated as $22.6 million in net general and administrative costs less $6.0 million of share based compensation), or $0.25 per Mcfe, for the same period in 2018.
We have continued to maintain a safe working environment while implementing these cost-reduction efforts. Our corporate total recordable incident rate was 0.23 incidents per 2.6 million work hours in 2019.
Liquidity and Capital Resources
The Company's primary use of cash has been to fund capital expenditures to develop its oil and gas properties. As of December 31, 2019, the Company’s liquidity consisted of approximately $1.4 million of cash-on-hand and $121.0 million in available borrowings on the Company's Credit Facility's $400.0 million borrowing base. Management believes the Company has sufficient liquidity to meet its obligations through the first quarter of 2021 and execute its long-term development plans. See Note 4 to the Company's consolidated financial statements for more information on its Debt Facilities.
36
Summary of 2019 Financial Results
• | Revenues and net income (loss): The Company's oil and gas revenues were $288.6 million and $257.3 million for the years ended December 31, 2019 and 2018, respectively. Revenues were higher due to overall increased production, partially offset by lower commodity pricing. The Company had net income of $114.7 million and $74.6 million for the years ended December 31, 2019 and 2018, respectively. The increase was primarily due to increased production, a gain on commodity derivative contracts and a benefit recorded for income tax expense for reversal of a valuation allowance for the Company's deferred tax assets. |
• | Capital expenditures: The Company's capital expenditures on an accrual basis were $261.7 million and $308.3 million for the years ended December 31, 2019 and 2018, respectively. The expenditures for the year ended December 31, 2019, were primarily driven by continued legacy development and Southern Eagle Ford gas window delineation, while expenditures for the year ended December 31, 2018 were primarily driven by development activity in our Southern Eagle Ford fields. These expenditures were funded by cash flows from operations and borrowings under our Credit Facility. |
• | Working capital: The Company had a working capital deficit of $27.8 million at December 31, 2019. |
• | Cash Flows: For the year ended December 31, 2019, the Company generated cash from operating activities of $203.2 million, of which $4.9 million was attributable to changes in working capital. Cash used for property additions was $282.7 million. This excluded $21.6 million attributable to a net decrease of capital related payables and accrued costs. Additionally, $5.1 million was paid during the year for property sale obligations related to the sale of our former Bay De Chene field. The Company’s net borrowings under its revolving Credit Facility were $84.0 million for the year ended December 31, 2019. |
For the year ended December 31, 2018, the Company generated cash from operating activities of $121.6 million, of which $23.7 million was attributable to changes in working capital. Cash used for property additions was $266.5 million. This included $45.3 million attributable to a net increase of capital related to payables and accrued costs. Additionally, $8.7 million was paid during the year for property sale obligations related to the sale of our former Bay De Chene field.
37
Contractual Commitments and Obligations
Our contractual commitments for the next five years and thereafter are shown below as of December 31, 2019 (in thousands):
2020 | 2021 | 2022 | 2023 | 2024 | Thereafter | Total | |||||||||||||||
Non-cancelable operating leases | $ | 7,032 | $ | 2,436 | $ | 118 | $ | 60 | $ | 38 | $ | 326 | $ | 10,009 | |||||||
Gas transportation and processing (1) | 8,811 | 5,383 | 3,868 | 2,626 | 1,614 | 1,088 | 23,391 | ||||||||||||||
Interest cost (2) | 32,503 | 32,606 | 23,999 | 20,342 | 19,623 | — | 129,075 | ||||||||||||||
Long-term debt | — | — | 279,000 | — | 200,000 | — | 479,000 | ||||||||||||||
Other contractual commitments (3) | 2,988 | — | — | — | — | — | 2,988 | ||||||||||||||
Total | $ | 51,334 | $ | 40,425 | $ | 306,985 | $ | 23,028 | $ | 221,276 | $ | 1,413 | $ | 644,463 | |||||||
(1) Amounts shown represent fees for the minimum delivery obligations. Any amount of transportation utilized in excess of the minimum will reduce future year obligations.
(2) Interest on our Credit Facility is estimated using the weighted average interest rate of 4.5% for the quarter ended December 31, 2019, while interest on our Second Lien is estimated using LIBOR plus 7.5%. See Note 4 of these consolidated financial statements in this Form 10-K for more information. Actual interest rate is variable over the term of the facility.
(3) Amount shown primarily for obligation under Bay De Chene sales contract.
Off-Balance Sheet Arrangements
As of December 31, 2019, we had no off-balance sheet arrangements requiring disclosure pursuant to article 303(a) of Regulation S-K.
Proved Oil and Gas Reserves
During 2019, our reserves increased by approximately 75.1 Bcfe due to increases in our natural gas reserves primarily from our Fasken field. As of December 31, 2019, 41% of our total proved reserves were proved developed, compared with 41% at year-end 2018 and 45% at year-end 2017.
At December 31, 2019, our proved reserves were 1,420.4 Bcfe with a Standardized Measure of $868 million, which is a decrease of approximately $125 million, or 13%, from the prior year-end levels. In 2019, our proved natural gas reserves increased 61.9 Bcf, or 6%, while our proved oil reserves increased 4.3 MMBbl, or 34%, and our NGL reserves decreased 2.1 MMBbl, or 7%, for a total equivalent increase of 75.1 Bcfe, or 6%.
We have added proved reserves primarily through our drilling activities, including 434.8 Bcfe added in 2019. We obtained reasonable certainty regarding these reserve additions by applying the same methodologies that have been used historically in this area.
We use the preceding 12-month's average price based on closing prices on the first business day of each month, adjusted for price differentials, in calculating our average prices used in the Standardized Measure calculation. Our average natural gas price used in the Standardized Measure calculation for 2019 was $2.62 per Mcf. This average price decreased from the average price of $3.04 per Mcf used for 2018. Our average oil price used in the calculation for 2019 was $58.37 per Bbl. This average price decreased from the average price of $66.96 per Bbl used in the calculation for 2018. Our average NGL price used in the calculation for 2019 was $16.83 per Bbl. This average price decreased from the average price of $26.63 per Bbl used in the calculation for 2018.
38
Results of Operations
Revenues — Years Ended December 31, 2019 and 2018
2019 - Our oil and gas sales in 2019 increased by 12% compared to revenues in 2018, primarily due to overall increased production. Average oil prices we received were 12% lower than those received during 2018, while natural gas prices were 18% lower and NGL prices were 42% lower.
Crude oil production was 12% and 6% of our production volumes for the years ended December 31, 2019 and 2018, respectively, while crude oil sales revenues were 32% and 18% of oil and gas sales revenue for the years ended December 31, 2019 and 2018, respectively.
Natural gas production was 76% and 84% of our production volumes for the years ended December 31, 2019 and 2018, respectively, while natural gas sales revenues were 59% and 71% of oil and gas sales for the years ended December 31, 2019 and 2018, respectively.
NGL production was 12% and 10% of our production volumes for the years ended December 31, 2019 and 2018, respectively, while NGL sales were 9% and 11% of oil and gas sales for the years ended December 31, 2019 and 2018, respectively.
The following tables provide information regarding the changes in the sources of our oil and gas sales and volumes for the years ended December 31, 2019 and 2018:
Fields | Oil and Gas Sales (In Millions) | Net Oil and Gas Production Volumes (MMcfe) | ||||||||||||
2019 | 2018 | 2019 | 2018 | |||||||||||
Artesia | $ | 78.8 | $ | 53.8 | 19,593 | 10,514 | ||||||||
AWP | 74.1 | 52.8 | 14,637 | 10,470 | ||||||||||
Fasken | 101.3 | 115.3 | 38,206 | 35,976 | ||||||||||
Other (1) | 34.4 | 35.4 | 11,884 | 10,570 | ||||||||||
Total | $ | 288.6 | $ | 257.3 | 84,320 | 67,530 | ||||||||
(1) Includes our Oro Grande and Uno Mas fields.
Our sales volume increase from 2018 to 2019 was primarily due to increased production as a result of drilling and completion activity.
In 2019, our $31.3 million, or 12% increase in oil, NGL, and natural gas sales resulted from:
• | Volume variances that had a $100.6 million favorable impact on sales, with a $60.4 million increase due to the 0.9 million Bbl increase in oil production volumes, a $25.0 million increase due to the 7.7 Bcf increase in natural gas production volumes and a $15.2 million increase due to the 0.6 million Bbl increase in NGL production volumes. |
• | Price variances that had a $69.2 million unfavorable impact on sales, with a decrease of $37.7 million due to the 18% decrease in natural gas prices received, a decrease of $13.0 million due to the 12% decrease in oil prices received and a decrease of $18.6 million due to the 42% decrease in NGL prices received. |
39
The following table provides additional information regarding our oil and gas sales, by commodity type, as well as the effects of our hedging activities for derivative contracts held to settlement for the years ended December 31, 2019 and 2018 (in thousands, except per-dollar amounts:
Year Ended December 31, 2019 | Year Ended December 31, 2018 | ||||||
Production volumes: | |||||||
Oil (MBbl) (1) | 1,605 | 688 | |||||
Natural gas (MMcf) | 64,388 | 56,665 | |||||
Natural gas liquids (MBbl) (1) | 1,717 | 1,123 | |||||
Total (MMcfe) | 84,320 | 67,530 | |||||
Oil, natural gas and natural gas liquids sales: | |||||||
Oil | $ | 92,833 | $ | 45,375 | |||
Natural gas | 170,558 | 183,272 | |||||
Natural gas liquids | 25,241 | 28,639 | |||||
Total | $ | 288,631 | $ | 257,286 | |||
Average realized price: | |||||||
Oil (per Bbl) | $ | 57.84 | $ | 65.93 | |||
Natural gas (per Mcf) | 2.65 | 3.23 | |||||
Natural gas liquids (per Bbl) | 14.70 | 25.51 | |||||
Average per Mcfe | $ | 3.42 | $ | 3.81 | |||
Price impact of cash-settled derivatives: | |||||||
Oil (per Bbl) | $ | 1.19 | $ | (10.40 | ) | ||
Natural gas (per Mcf) | 0.26 | (0.18 | ) | ||||
Natural gas liquids (per Bbl) | 3.62 | (1.65 | ) | ||||
Average per Mcfe | $ | 0.29 | $ | (0.28 | ) | ||
Average realized price including impact of cash-settled derivatives: | |||||||
Oil (per Bbl) | $ | 59.03 | $ | 55.53 | |||
Natural gas (per Mcf) | 2.91 | 3.06 | |||||
Natural gas liquids (per Bbl) | 18.32 | 23.87 | |||||
Average per Mcfe | $ | 3.72 | $ | 3.53 | |||
(1) Oil and natural gas liquids are converted at the rate of one barrel to six Mcfe.
For the years ended December 31, 2019 and 2018 we recorded net gains (losses) of $24.2 million and ($9.8) million, respectively, related to our derivative activities. The change was driven primarily by changes in commodity pricing. This activity is recorded in “Net gain (loss) on commodity derivatives” on the accompanying consolidated statements of operations.
40
Costs and Expenses
The following table provides additional information regarding our expenses for the years ended December 31, 2019 and 2018:
Costs and Expenses | Year Ended December 31, 2019 | Year Ended December 31, 2018 | ||||
General and administrative, net | $ | 24,851 | $ | 22,570 | ||
Depreciation, depletion, and amortization | 95,915 | 68,035 | ||||
Accretion of asset retirement obligation | 329 | 419 | ||||
Lease operating cost | 20,763 | 17,643 | ||||
Workovers | 628 | — | ||||
Transportation and gas processing | 26,968 | 23,848 | ||||
Severance and other taxes | 13,874 | 11,394 | ||||
Interest expense, net | $ | 36,561 | $ | 27,666 | ||
2019 - Our costs and expenses during 2019 versus 2018 were as follows:
General and Administrative Expenses, Net. These expenses on a per Mcfe basis were $0.29 and $0.33 for the years ended December 31, 2019 and 2018, respectively. The decrease per Mcfe was due to higher production while the increase in costs was primarily due to higher salaries and burdens and higher computer operations expenses. Included in general and administrative expenses is $6.1 million and $6.0 million in share based compensation for the years ended December 31, 2019 and 2018, respectively.
Depreciation, Depletion and Amortization (“DD&A”). These expenses on a per Mcfe basis were $1.14 and $1.01 for the years ended December 31, 2019 and 2018, respectively. The increase in the rate per unit is primarily due to a higher depletable base relative to reserves. The higher depletion expense is due to a higher production and a higher per unit rate.
Lease Operating Cost. These expenses on a per Mcfe basis were $0.25 and $0.26 for the years ended December 31, 2019 and 2018, respectively. The decrease per Mcfe was primarily due to higher production. The increase in costs was primarily driven by an increase in the number of operated wells and handling of higher production volumes compared to the prior year.
Transportation and gas processing. These expenses all related to natural gas and NGL sales. These expenses on a per Mcfe basis were $0.32 and $0.35 for the years ended December 31, 2019 and 2018, respectively.
Severance and Other Taxes. These expenses on a per Mcfe basis were $0.16 and $0.17 for the years ended December 31, 2019 and 2018, respectively. Severance and other taxes, as a percentage of oil and gas sales, were approximately 4.8% and 4.4% for the years ended December 31, 2019 and 2018, respectively.
Interest. Our gross interest cost was $36.8 million and $28.6 million for the years ended December 31, 2019 and 2018, respectively, of which $0.2 million and $0.9 million was capitalized, respectively. The increase in gross interest from 2018 was primarily due to increased borrowings on our Credit Facility.
Income Taxes. There was no expense for federal income taxes for the year ended December 31, 2018 as tax expense that would have been recognized at the statutory rate for 2018 was predominately offset by a reduction in the valuation allowance carried forward from 2017. State income tax of $0.9 million was recognized for the year ended December 31, 2018. In prior periods, management had determined that it was not more likely than not that the Company would realize future cash benefits from its remaining federal carryover items and other deferred tax assets and, accordingly, had taken a full valuation allowance to offset its net deferred tax assets in excess of deferred tax liabilities. . During the second quarter of 2019, the Company was able to complete several operational initiatives that resulted in increased production, lower development costs and expanded inventory of development prospects. The results of these initiatives led management to determine, after weighing both positive and negative evidence, that the Company will more likely than not be able to realize the benefits of its deferred tax assets. Accordingly, the Company released the valuation allowance, resulting in a net deferred tax benefit of $21.6 million for the year ended December 31, 2019. State income tax of $1.1 million was recognized for the year ended December 31, 2019
41
Non-GAAP Financial Measures
Adjusted EBITDA
We present adjusted EBITDA attributable to common stockholders (“Adjusted EBITDA”) in addition to our reported net income (loss) in accordance with U.S. GAAP. Adjusted EBITDA is a non-GAAP financial measure that is used as a supplemental financial measure by our management and by external users of our financial statements, such as investors, commercial banks and others, to assess our operating performance as compared to that of other companies in our industry, without regard to financing methods, capital structure or historical costs basis. It is also used to assess our ability to incur and service debt and fund capital expenditures. We define Adjusted EBITDA as net income (loss):
Plus/(Less):
• | Depreciation, depletion, amortization; |
• | Accretion of asset retirement obligations; |
• | Interest expense; |
• | Impairment of oil and natural gas properties; |
• | Net losses (gains) on commodity derivative contracts; |
• | Amounts collected (paid) for commodity derivative contracts held to settlement; |
• | Income tax expense or (benefit); and |
• | Share-based compensation expense. |
Our Adjusted EBITDA should not be considered an alternative to net income (loss), operating income (loss), cash flows provided by (used in) operating activities or any other measure of financial performance or liquidity presented in accordance with U.S. GAAP. Our Adjusted EBITDA may not be comparable to similarly titled measures of other companies because all companies may not calculate Adjusted EBITDA in the same manner.
The following tables present reconciliations of our net income (loss) (the most directly comparable financial measure calculated in accordance with U.S. GAAP) to Adjusted EBITDA for the periods indicated (in thousands):
Year Ended December 31, 2019 | Year Ended December 31, 2018 | |||||
Net Income (Loss) | $ | 114,656 | $ | 74,615 | ||
Plus: | ||||||
Depreciation, depletion and amortization | 95,915 | 68,035 | ||||
Accretion of asset retirement obligations | 329 | 419 | ||||
Interest expense | 36,561 | 27,666 | ||||
Derivative (gain)/loss | (24,242 | ) | 9,777 | |||
Derivative cash settlements collected/(paid) (1) | 24,808 | (19,060 | ) | |||
Income tax expense/(benefit) | (21,582 | ) | 928 | |||
Share-based compensation expense | 6,148 | 5,980 | ||||
Adjusted EBITDA | $ | 232,593 | $ | 168,360 | ||
Adjusted EBITDA Margin (2) | 74 | % | 71 | % | ||
(1) This includes accruals for settled contracts covering commodity deliveries during the period where the actual cash settlements occur outside of the period. | ||||||
(2) Adjusted EBITDA Margin equals Adjusted EBITDA divided by the sum of Oil and Gas Sales and Derivative Cash Settlements Collected or Paid. | ||||||
42
Calculation of Return on Capital Employed (“ROCE”)
We define ROCE as (A) Adjusted EBITDA, excluding DD&A expense, divided by (B) the average of Capital Employed - Beginning of Year (Total Debt plus Shareholders Equity) and Capital Employed - Year-End. We believe ROCE presents a comparable metric across multiple business sectors and sizes and is a meaningful measure because it quantifies how well we generate Adjusted EBITDA relative to the capital we have employed in our business and illustrates the profitability of a business or project taking into account the capital employed. We use ROCE to assist in capital resource allocation decisions and in evaluating business performance. Although ROCE is commonly used as a measure of capital efficiency, definitions of ROCE differ, and our computation of ROCE may not be comparable to other similarly titled measures of other companies.
Calculation of Return on Capital Employed
The following table provides the calculation of ROCE for the following periods (in thousands):
Year Ended December 31, 2019 | Year Ended December 31, 2018 | |||||
Net Income (Loss) | $ | 114,656 | $ | 74,615 | ||
Plus: | ||||||
Depreciation, depletion and amortization | 95,915 | 68,035 | ||||
Accretion of asset retirement obligations | 329 | 419 | ||||
Interest expense | 36,561 | 27,666 | ||||
Derivative (gain)/loss | (24,242 | ) | 9,777 | |||
Derivative cash settlements collected/(paid) (1) | 24,808 | (19,060 | ) | |||
Income tax expense/(benefit) | (21,582 | ) | 928 | |||
Share-based compensation expense | 6,148 | 5,980 | ||||
Adjusted EBITDA | $ | 232,593 | $ | 168,360 | ||
Less: Depreciation, depletion and amortization | (95,915 | ) | (68,035 | ) | ||
Adjusted EBIT (A) | $ | 136,678 | $ | 100,325 | ||
Total Debt | $ | 395,000 | $ | 273,000 | ||
Shareholders Equity | 274,827 | 193,458 | ||||
Capital Employed - Beginning of Year | $ | 669,827 | $ | 466,458 | ||
Total Debt | $ | 479,000 | $ | 395,000 | ||
Shareholders Equity | 395,707 | 274,827 | ||||
Capital Employed - Year-End | $ | 874,707 | $ | 669,827 | ||
Average Capital Employed (B) (2) | $ | 772,267 | $ | 568,143 | ||
Return on Capital Employed (ROCE) (A / B) | 18 | % | 18 | % | ||
(1) This includes accruals for settled contracts covering commodity deliveries during the period where the actual cash settlements occur outside of the period. | ||||||
(2) B = Average of Beginning of Year and Year-End Capital Employed | ||||||
43
Critical Accounting Policies and New Accounting Pronouncements
Property and Equipment. We follow the “full-cost” method of accounting for oil and natural gas property and equipment costs. Under this method of accounting, all productive and nonproductive costs incurred in the exploration, development, and acquisition of oil and natural gas reserves are capitalized including internal costs incurred that are directly related to these activities and which are not related to production, general corporate overhead, or similar activities. Future development costs are estimated on a property-by-property basis based on current economic conditions and are amortized to expense as our capitalized oil and natural gas property costs are amortized. We compute the provision for DD&A of oil and natural gas properties using the unit-of-production method.
The costs of unproved properties not being amortized are assessed quarterly, on a property-by-property basis, to determine whether such properties have been impaired. In determining whether such costs should be impaired, we evaluate current drilling results, lease expiration dates, current oil and gas industry conditions, international economic conditions, capital availability, and available geological and geophysical information. As these factors may change from period to period, our evaluation of these factors will change. Any impairment assessed is added to the cost of proved properties being amortized.
The calculation of the provision for DD&A requires us to use estimates related to quantities of proved oil and natural gas reserves and estimates of the impairment of unproved properties. The estimation process for both reserves and the impairment of unproved properties is subjective, and results may change over time based on current information and industry conditions. We believe our estimates and assumptions are reasonable; however, such estimates and assumptions are subject to a number of risks and uncertainties that may cause actual results to differ materially from such estimates.
Full-Cost Ceiling Test. At the end of each quarterly reporting period, the unamortized cost of oil and natural gas properties (including natural gas processing facilities, capitalized asset retirement obligations and deferred income taxes, and excluding the recognized asset retirement obligation liability) is limited to the sum of the estimated future net revenues from proved properties (excluding cash outflows from recognized asset retirement obligations, including future development and abandonment costs of wells to be drilled, using the preceding 12-months’ average price based on closing prices on the first day of each month, adjusted for price differentials, discounted at 10%, and the lower of cost or fair value of unproved properties) adjusted for related income tax effects.
We believe our estimates and assumptions are reasonable; however, such estimates and assumptions are subject to a number of risks and uncertainties that may cause actual results to differ materially from such estimates.
If future capital expenditures outpace future discounted net cash flows in our reserve calculations, if we have significant declines in our oil and natural gas reserves volumes (which also reduces our estimate of discounted future net cash flows from proved oil and natural gas reserves) or if oil or natural gas prices remain depressed or continue to decline, it is possible that non-cash write-downs of our oil and natural gas properties will occur in the future. We cannot control and cannot predict what future prices for oil and natural gas will be, thus we cannot estimate the amount or timing of any potential future non-cash write-down of our oil and natural gas properties due to decreases in oil or natural gas prices.
New Accounting Pronouncements. In February 2016, the FASB issued ASU 2016-02, which requires lessees to record most leases on the balance sheet. Under the new guidance, lease classification as either a finance lease or an operating lease will determine how lease-related revenue and expense are recognized. The guidance is effective for fiscal years beginning after December 15, 2018, including interim periods within those fiscal years. The Company adopted this guidance on January 1, 2019. See Note 1 to our consolidated financial statements for more information.
44
Forward-Looking Statements
This report includes forward-looking statements intended to qualify for the safe harbors from liability established by the Private Securities Litigation Reform Act of 1995, Section 27A of the Securities Act and Section 21E of the Exchange Act. These forward-looking statements are subject to a number of risks and uncertainties, many of which are beyond our control. All statements, other than statements of historical fact included in this report, regarding our strategy, future operations, financial position, estimated production levels, expected oil and natural gas pricing, estimated oil and natural gas reserves or the present value thereof, reserve increases, capital expenditures, budget, projected costs, prospects, plans and objectives of management are forward-looking statements. When used in this report, the words “could,” “believe,” “anticipate,” “intend,” “estimate,” “budgeted,” “expect,” “may,” “continue,” “predict,” “potential,” “project” and similar expressions are intended to identify forward-looking statements, although not all forward-looking statements contain such identifying words.
Important factors that could cause actual results to differ materially from our expectations include, but are not limited to, the following risks and uncertainties:
• | volatility in natural gas, oil and NGL prices; |
• | future cash flows and their adequacy to maintain our ongoing operations; |
• | liquidity, including our ability to satisfy our short- or long-term liquidity needs; |
• | our borrowing capacity, future covenant compliance, cash flows and liquidity; |
• | operating results; |
• | asset disposition efforts or the timing or outcome thereof; |
• | ongoing and prospective joint ventures, their structure and substance, and the likelihood of their finalization or the timing thereof; |
• | the amount, nature and timing of capital expenditures, including future development costs; |
• | timing, cost and amount of future production of oil and natural gas; |
• | availability of drilling and production equipment or availability of oil field labor; |
• | availability, cost and terms of capital; |
• | drilling of wells; |
• | availability and cost for transportation of oil and natural gas; |
• | costs of exploiting and developing our properties and conducting other operations; |
• | competition in the oil and natural gas industry; |
• | general economic conditions; |
• | opportunities to monetize assets; |
• | effectiveness of our risk management activities; |
• | environmental liabilities; |
• | counterparty credit risk; |
• | governmental regulation and taxation of the oil and natural gas industry; |
• | impact of governmental tariffs on cost of materials; |
• | developments in world oil markets and in oil and natural gas-producing countries; |
• | uncertainty regarding our future operating results; and |
•other risks and uncertainties described in Item 1A. “Risk Factors,” in this annual report on Form 10-K for the year ended December 31, 2019.
All forward-looking statements speak only as of the date they are made. You should not place undue reliance on these forward-looking statements. Although we believe that our plans, intentions and expectations reflected in or suggested by the forward-looking statements we make in this report are reasonable, we can give no assurance that these plans, intentions or expectations will be achieved. We disclose important factors that could cause our actual results to differ materially from our expectations under "Risk Factors" in Item 1A of this annual report on Form 10-K for the year ended December 31, 2019. These cautionary statements qualify all forward-looking statements attributable to us or persons acting on our behalf.
All subsequent written and oral forward-looking statements attributable to us or to persons acting on our behalf are expressly qualified in their entirety by the foregoing. We undertake no obligation to publicly release the results of any revisions to any such
45
forward-looking statements that may be made to reflect events or circumstances after the date of this report or to reflect the occurrence of unanticipated events.
46
Item 7A. Quantitative and Qualitative Disclosures About Market Risk
Commodity Risk. Our major market risk exposure is the commodity pricing applicable to our oil and natural gas production. Realized commodity prices received for such production are primarily driven by the prevailing worldwide price for crude oil and spot prices applicable to natural gas. This commodity pricing volatility has continued with unpredictable price swings in recent periods.
Our price-risk management policy permits the utilization of agreements and financial instruments (such as futures, forward contracts, swaps and options contracts) to mitigate price risk associated with fluctuations in oil and natural gas prices. We do not utilize these agreements and financial instruments for trading and only enter into derivative agreements with banks in our Credit Facility. For additional discussion related to our price-risk management policy, refer to Note 5 of the consolidated financial statements in this Form 10-K.
Customer Credit Risk. We are exposed to the risk of financial non-performance by customers. Our ability to collect on sales to our customers is dependent on the liquidity of our customer base. Continued volatility in both credit and commodity markets may reduce the liquidity of our customer base. To manage customer credit risk, we monitor credit ratings of customers and from certain customers we also obtain letters of credit, parent company guarantees if applicable, and other collateral as considered necessary to reduce risk of loss. Due to availability of other purchasers, we do not believe the loss of any single oil or natural gas customer would have a material adverse effect on our results of operations.
Concentration of Sales Risk. For the year ended December 31, 2019, approximately 31%, 14%, 13% and 11% of our oil and gas receipts were accounted for by Kinder Morgan, Inc. (“Kinder Morgan”), Plains Marketing, LP (“Plains Marketing”), Twin Eagle Resource Management LLC (“Twin Eagle”) and Shell Trading (US) Company (“Shell Trading”). There were no other purchasers who individually accounted for 10% or more of our oil and gas receipts. We expect to continue these relationships in the future. We believe that the risk of these unsecured receivables is mitigated by the size, reputation and nature of the businesses and the availability of other purchasers in the areas where we operate.
Interest Rate Risk. At December 31, 2019, we had a combined $479.0 million drawn under our Credit Facility and our Second Lien Notes, which bear a floating rate of interest depending on the level of the borrowing base and the borrowing base loans outstanding and therefore is susceptible to interest rate fluctuations. These variable interest rate borrowings are impacted by changes in short-term interest rates. A hypothetical one-percentage point increase in interest rates on our borrowings outstanding under our Credit Facility and Second Lien Notes at December 31, 2019 would increase our annual interest expense by $4.8 million.
47
Item 8. Financial Statements and Supplementary Data | Page | |
Management's Report on Internal Control Over Financial Reporting | ||
Report of Independent Registered Public Accounting Firm on Internal Control Over Financial Reporting | ||
Report of Independent Registered Public Accounting Firm on Consolidated Financial Statements | ||
Consolidated Balance Sheets | ||
Consolidated Statements of Operations | ||
Consolidated Statements of Stockholders' Equity (Deficit) | ||
Consolidated Statements of Cash Flows | ||
Notes to Consolidated Financial Statements | ||
Supplementary Information | ||
48
Management's Report on Internal Control Over Financial Reporting
Management of SilverBow Resources, Inc. is responsible for establishing and maintaining adequate internal control over financial reporting as defined in Rules 13a-15(f) and 15d-15(f) under the Exchange Act. The Company's internal control over financial reporting is a process designed by, or under the supervision of, the Company's Chief Executive Officer and Chief Financial Officer to provide reasonable assurance regarding the reliability of financial reporting and the preparation of the Company's financial statements for external purposes in accordance with U. S. generally accepted accounting principles.
Management of the Company assessed the effectiveness of the Company's internal control over financial reporting as of December 31, 2019. In making this assessment, management used the criteria set forth by the Committee of Sponsoring Organizations of the Treadway Commission (the COSO criteria) (2013 framework) in Internal Control-Integrated Framework. Based on our assessment and those criteria, management determined that the Company maintained effective internal control over financial reporting as of December 31, 2019.
Because of its inherent limitations, internal control over financial reporting may not prevent or detect misstatements. Therefore, even those systems determined to be effective can provide only reasonable assurance of achieving their control objectives. Also, projections of any evaluation of effectiveness to future periods are subject to the risk that controls may become inadequate because of changes in conditions, or that the degree of compliance with the policies or procedures may deteriorate.
BDO USA, LLP, the independent registered public accounting firm that audited the 2019 consolidated financial statements of the Company included in this Annual Report on Form 10-K, has issued an attestation report on the Company's internal control over financial reporting as of December 31, 2019, based on their audit.
49
Report of Independent Registered Public Accounting Firm
Stockholders and Board of Directors
SilverBow Resources, Inc.
Houston, Texas
Opinion on Internal Control over Financial Reporting
We have audited SilverBow Resources, Inc.’s (the “Company’s”) internal control over financial reporting as of December 31, 2019, based on criteria established in Internal Control - Integrated Framework (2013) issued by the Committee of Sponsoring Organizations of the Treadway Commission (the “COSO criteria”). In our opinion, the Company maintained, in all material respects, effective internal control over financial reporting as of December 31, 2019, based on the COSO criteria.
We also have audited, in accordance with the standards of the Public Company Accounting Oversight Board (United States) (“PCAOB”), the consolidated balance sheets of the Company as of December 31, 2019 and 2018, the related consolidated statements of operations, stockholders’ equity, and cash flows for the years then ended, and the related notes, and our report dated March 5, 2020 expressed an unqualified opinion thereon.
Basis for Opinion
The Company’s management is responsible for maintaining effective internal control over financial reporting and for its assessment of the effectiveness of internal control over financial reporting, included in the accompanying Management’s Report on Internal Control over Financial Reporting. Our responsibility is to express an opinion on the Company’s internal control over financial reporting based on our audit. We are a public accounting firm registered with the PCAOB and are required to be independent with respect to the Company in accordance with U.S. federal securities laws and the applicable rules and regulations of the Securities and Exchange Commission and the PCAOB.
We conducted our audit of internal control over financial reporting in accordance with the standards of the PCAOB. Those standards require that we plan and perform the audit to obtain reasonable assurance about whether effective internal control over financial reporting was maintained in all material respects. Our audit included obtaining an understanding of internal control over financial reporting, assessing the risk that a material weakness exists, and testing and evaluating the design and operating effectiveness of internal control based on the assessed risk. Our audit also included performing such other procedures as we considered necessary in the circumstances. We believe that our audit provides a reasonable basis for our opinion.
Definition and Limitations of Internal Control over Financial Reporting
A company’s internal control over financial reporting is a process designed to provide reasonable assurance regarding the reliability of financial reporting and the preparation of financial statements for external purposes in accordance with generally accepted accounting principles. A company’s internal control over financial reporting includes those policies and procedures that (1) pertain to the maintenance of records that, in reasonable detail, accurately and fairly reflect the transactions and dispositions of the assets of the company; (2) provide reasonable assurance that transactions are recorded as necessary to permit preparation of financial statements in accordance with generally accepted accounting principles, and that receipts and expenditures of the company are being made only in accordance with authorizations of management and directors of the company; and (3) provide reasonable assurance regarding prevention or timely detection of unauthorized acquisition, use, or disposition of the company’s assets that could have a material effect on the financial statements.
Because of its inherent limitations, internal control over financial reporting may not prevent or detect misstatements. Also, projections of any evaluation of effectiveness to future periods are subject to the risk that controls may become inadequate because of changes in conditions, or that the degree of compliance with the policies or procedures may deteriorate.
/s/ BDO USA, LLP
Houston, Texas
March 5, 2020
50
Report of Independent Registered Public Accounting Firm
Stockholders and Board of Directors
SilverBow Resources, Inc.
Houston, Texas
Opinion on the Consolidated Financial Statements
We have audited the accompanying consolidated balance sheets of SilverBow Resources, Inc. (the “Company”) as of December 31, 2019 and 2018, the related consolidated statements of operations, stockholders’ equity, and cash flows for the years then ended, and the related notes (collectively referred to as the “consolidated financial statements”). In our opinion, the consolidated financial statements present fairly, in all material respects, the financial position of the Company as of December 31, 2019 and 2018, and the results of its operations and its cash flows for the years then ended, in conformity with accounting principles generally accepted in the United States of America.
We also have audited, in accordance with the standards of the Public Company Accounting Oversight Board (United States) (“PCAOB”), the Company's internal control over financial reporting as of December 31, 2019, based on criteria established in Internal Control - Integrated Framework (2013) issued by the Committee of Sponsoring Organizations of the Treadway Commission (“COSO”) and our report dated March 5, 2020 expressed an unqualified opinion thereon.
Change in Accounting Principle
As discussed in Notes 1 and 8 to the consolidated financial statements, the Company changed its method of accounting for Leases in 2019 due to the adoption of Accounting Standards Codification Topic 842 - Leases on January 1, 2019.
Basis for Opinion
These consolidated financial statements are the responsibility of the Company’s management. Our responsibility is to express an opinion on the Company’s consolidated financial statements based on our audits. We are a public accounting firm registered with the PCAOB and are required to be independent with respect to the Company in accordance with the U.S. federal securities laws and the applicable rules and regulations of the Securities and Exchange Commission and the PCAOB.
We conducted our audits in accordance with the standards of the PCAOB. Those standards require that we plan and perform the audits to obtain reasonable assurance about whether the consolidated financial statements are free of material misstatement, whether due to error or fraud.
Our audits included performing procedures to assess the risks of material misstatement of the consolidated financial statements, whether due to error or fraud, and performing procedures that respond to those risks. Such procedures included examining, on a test basis, evidence regarding the amounts and disclosures in the consolidated financial statements. Our audits also included evaluating the accounting principles used and significant estimates made by management, as well as evaluating the overall presentation of the consolidated financial statements. We believe that our audits provide a reasonable basis for our opinion.
/s/ BDO USA, LLP
We have served as the Company's auditor since 2016.
Houston, Texas
March 5, 2020
51
Consolidated Balance Sheets
SilverBow Resources, Inc. (in thousands, except share amounts)
December 31, 2019 | December 31, 2018 | ||||||
ASSETS | |||||||
Current Assets: | |||||||
Cash and cash equivalents | $ | 1,358 | $ | 2,465 | |||
Accounts receivable, net | 36,996 | 46,472 | |||||
Fair value of commodity derivatives | 12,833 | 15,261 | |||||
Other current assets | 2,121 | 2,126 | |||||
Total Current Assets | 53,308 | 66,324 | |||||
Property and Equipment: | |||||||
Property and Equipment, Full-Cost Method, including $41,201 and $56,715 of unproved property costs not being amortized | 1,247,717 | 986,100 | |||||
Less – Accumulated depreciation, depletion, amortization and impairment | (380,728 | ) | (284,804 | ) | |||
Property and Equipment, Net | 866,989 | 701,296 | |||||
Right of Use Assets | 9,374 | — | |||||
Fair value of long-term commodity derivatives | 3,854 | 4,333 | |||||
Deferred Tax Asset | 22,669 | — | |||||
Other Long-Term Assets | 3,622 | 5,567 | |||||
Total Assets | $ | 959,816 | $ | 777,520 | |||
LIABILITIES AND STOCKHOLDERS’ EQUITY | |||||||
Current Liabilities: | |||||||
Accounts payable and accrued liabilities | $ | 39,343 | $ | 48,921 | |||
Fair value of commodity derivatives | 6,644 | 2,824 | |||||
Accrued capital costs | 17,889 | 38,073 | |||||
Accrued interest | 1,397 | 1,513 | |||||
Current Lease Liability | 6,707 | — | |||||
Undistributed oil and gas revenues | 9,166 | 14,681 | |||||
Total Current Liabilities | 81,146 | 106,012 | |||||
Long-term debt | 472,900 | 387,988 | |||||
Non-Current Lease liability | 2,813 | — | |||||
Deferred tax liabilities, net | 1,582 | 1,014 | |||||
Asset retirement obligations | 4,055 | 3,956 | |||||
Fair value of long-term commodity derivatives | 1,613 | 3,723 | |||||
Commitments and Contingencies (Note 6) | |||||||
Stockholders' Equity: | |||||||
Preferred stock, $.01 par value, 10,000,000 shares authorized, none issued | — | — | |||||
Common stock, $.01 par value, 40,000,000 shares authorized, 11,895,032 and 11,757,972 shares issued and 11,806,679 and 11,692,101 shares outstanding | 119 | 118 | |||||
Additional paid-in capital | 292,916 | 286,281 | |||||
Treasury stock held, at cost, 88,353 and 65,871 shares | (2,282 | ) | (1,870 | ) | |||
Retained earnings (Accumulated deficit) | 104,954 | (9,702 | ) | ||||
Total Stockholders’ Equity | 395,707 | 274,827 | |||||
Total Liabilities and Stockholders’ Equity | $ | 959,816 | $ | 777,520 | |||
See accompanying Notes to Consolidated Financial Statements. | |||||||
52
Consolidated Statements of Operations
SilverBow Resources, Inc. (in thousands, except per-share amounts)
Year Ended December 31, 2019 | Year Ended December 31, 2018 | ||||||
Revenues: | |||||||
Oil and gas sales | $ | 288,631 | $ | 257,286 | |||
Operating Expenses: | |||||||
General and administrative, net | 24,851 | 22,570 | |||||
Depreciation, depletion, and amortization | 95,915 | 68,035 | |||||
Accretion of asset retirement obligations | 329 | 419 | |||||
Lease operating expense | 20,763 | 17,643 | |||||
Workovers | 628 | — | |||||
Transportation and gas processing | 26,968 | 23,848 | |||||
Severance and other taxes | 13,874 | 11,394 | |||||
Total Operating Expenses | 183,328 | 143,909 | |||||
Operating Income (Loss) | 105,303 | 113,377 | |||||
Non-Operating Income (Expense) | |||||||
Net gain (loss) on commodity derivatives | 24,242 | (9,777 | ) | ||||
Interest expense, net | (36,561 | ) | (27,666 | ) | |||
Other income (expense), net | 90 | (391 | ) | ||||
Income (Loss) Before Income Taxes | 93,074 | 75,543 | |||||
Provision (Benefit) for Income Taxes | (21,582 | ) | 928 | ||||
Net Income (Loss) | $ | 114,656 | $ | 74,615 | |||
Per Share Amounts: | |||||||
Basic: Net Income (Loss) | $ | 9.76 | $ | 6.40 | |||
Diluted: Net Income (Loss) | $ | 9.74 | $ | 6.34 | |||
Weighted Average Shares Outstanding - Basic | 11,753 | 11,655 | |||||
Weighted Average Shares Outstanding - Diluted | 11,778 | 11,764 | |||||
See accompanying Notes to Consolidated Financial Statements. | |||||||
53
Consolidated Statements of Stockholders’ Equity (Deficit)
SilverBow Resources, Inc. (in thousands, except share amounts)
Common Stock | Additional Paid-in Capital | Treasury Stock | Retained Earnings (Accumulated Deficit) | Total | |||||||||||||||
Balance, December 31, 2017 | $ | 116 | $ | 279,111 | $ | (1,452 | ) | $ | (84,317 | ) | $ | 193,458 | |||||||
Shares issued from option exercise (29,199 shares) | 1 | 708 | — | — | 709 | ||||||||||||||
Purchase of treasury shares (15,107 shares) | — | — | (418 | ) | — | (418 | ) | ||||||||||||
Issuance of restricted stock (107,388 shares) | 1 | (1 | ) | — | — | — | |||||||||||||
Share-based compensation | — | 6,463 | — | — | 6,463 | ||||||||||||||
Net Income | — | — | — | 74,615 | 74,615 | ||||||||||||||
Balance, December 31, 2018 | $ | 118 | $ | 286,281 | $ | (1,870 | ) | $ | (9,702 | ) | $ | 274,827 | |||||||
Purchase of treasury shares (22,482 shares) | — | — | (412 | ) | — | (412 | ) | ||||||||||||
Issuance of restricted stock (137,060 shares) | 1 | (1 | ) | — | — | — | |||||||||||||
Share-based compensation | — | 6,636 | — | — | 6,636 | ||||||||||||||
Net Income | — | — | — | 114,656 | 114,656 | ||||||||||||||
Balance, December 31, 2019 | $ | 119 | $ | 292,916 | $ | (2,282 | ) | $ | 104,954 | $ | 395,707 | ||||||||
See accompanying Notes to Consolidated Financial Statements. | |||||||||||||||||||
54
Consolidated Statements of Cash Flows
SilverBow Resources, Inc. (in thousands)
Year Ended December 31, 2019 | Year Ended December 31, 2018 | ||||||
Cash Flows from Operating Activities: | |||||||
Net income (loss) | $ | 114,656 | $ | 74,615 | |||
Adjustments to reconcile net income (loss) to net cash provided by (used in) operating activities- | |||||||
Depreciation, depletion, and amortization | 95,915 | 68,035 | |||||
Accretion of asset retirement obligations | 329 | 419 | |||||
Deferred income tax benefit | (22,101 | ) | 1,014 | ||||
Share-based compensation expense | 6,148 | 5,980 | |||||
(Gain) Loss on derivatives, net | (24,242 | ) | 9,777 | ||||
Cash settlements (paid) received on derivatives | 24,631 | (19,677 | ) | ||||
Settlements of asset retirement obligations | (83 | ) | (187 | ) | |||
Write-down of debt issuance cost | 82 | — | |||||
Other | 2,930 | 5,293 | |||||
Change in operating assets and liabilities- | |||||||
(Increase) decrease in accounts receivable and other assets | 11,605 | (20,470 | ) | ||||
Increase (decrease) in accounts payable and accrued liabilities | (7,100 | ) | (2,686 | ) | |||
Increase (decrease) in income taxes payable | 519 | 53 | |||||
Increase (decrease) in accrued interest | (116 | ) | (593 | ) | |||
Net Cash Provided by (Used in) Operating Activities | 203,173 | 121,573 | |||||
Cash Flows from Investing Activities: | |||||||
Additions to property and equipment | (282,660 | ) | (266,532 | ) | |||
Acquisition of producing properties | — | (1,002 | ) | ||||
Proceeds from (adjustments to) the sale of property and equipment | (96 | ) | 27,673 | ||||
Payments on property sale obligations | (5,112 | ) | (8,740 | ) | |||
Transfer of company funds in restricted cash | — | (222 | ) | ||||
Net Cash Provided by (Used in) Investing Activities | (287,868 | ) | (248,823 | ) | |||
Cash Flows from Financing Activities: | |||||||
Proceeds from bank borrowings | 381,000 | 306,800 | |||||
Payments of bank borrowings | (297,000 | ) | (184,800 | ) | |||
Net proceeds from issuances of common stock | — | 709 | |||||
Purchase of treasury shares | (412 | ) | (418 | ) | |||
Payments of debt issuance costs | — | (602 | ) | ||||
Net Cash Provided by (Used in) Financing Activities | 83,588 | 121,689 | |||||
Net Increase (Decrease) in Cash and Cash Equivalents and Restricted Cash | (1,107 | ) | (5,561 | ) | |||
Cash, Cash Equivalents and Restricted Cash at Beginning of Year | 2,465 | 8,026 | |||||
Cash, Cash Equivalents and Restricted Cash at End of Year | $ | 1,358 | $ | 2,465 | |||
Supplemental Disclosures of Cash Flows Information: | |||||||
Cash paid during period for interest, net of amounts capitalized | $ | 34,408 | $ | 24,794 | |||
Changes in capital accounts payable and capital accruals | $ | (21,584 | ) | $ | 45,349 | ||
Changes in other long-term liabilities for capital expenditures | $ | — | $ | (5,000 | ) | ||
55
Notes to Consolidated Financial Statements
SilverBow Resources, Inc. and Subsidiaries
1. Summary of Significant Accounting Policies
Principles of Consolidation. The accompanying consolidated financial statements include the accounts of SilverBow and its wholly owned subsidiaries, which are engaged in the exploration, development, acquisition, and operation of oil and gas properties, with a focus on oil and natural gas reserves in the Eagle Ford trend in Texas. Our undivided interests in oil and gas properties are accounted for using the proportionate consolidation method, whereby our proportionate share of the assets, liabilities, revenues, and expenses are included in the appropriate classifications in the accompanying consolidated financial statements. Intercompany balances and transactions have been eliminated in preparing the accompanying consolidated financial statements.
Use of Estimates. The preparation of financial statements in conformity with accounting principles generally accepted in the United States (“GAAP”) requires us to make estimates and assumptions that affect the reported amounts of certain assets and liabilities and the reported amounts of certain revenues and expenses during each reporting period. Such estimates and assumptions are subject to a number of risks and uncertainties that may cause actual results to differ materially from such estimates. Significant estimates and assumptions underlying these financial statements include:
• | the estimated quantities of proved oil and natural gas reserves used to compute depletion of oil and natural gas properties, the related present value of estimated future net cash flows therefrom, and the Ceiling Test impairment calculation, |
• | estimates related to the collectability of accounts receivable and the credit worthiness of our customers, |
• | estimates of the counterparty bank risk related to letters of credit that our customers may have issued on our behalf, |
• | estimates of future costs to develop and produce reserves, |
• | accruals related to oil and gas sales, capital expenditures and lease operating expenses, |
• | estimates in the calculation of share-based compensation expense, |
• | estimates of our ownership in properties prior to final division of interest determination, |
• | the estimated future cost and timing of asset retirement obligations, |
• | estimates made in our income tax calculations, |
• | estimates in the calculation of the fair value of commodity derivative assets and liabilities, |
• | estimates in the assessment of current litigation claims against the Company, |
• | estimates in amounts due with respect to open state regulatory audits, and |
• | estimates on future lease obligations. |
While we are not currently aware of any material revisions to any of our estimates, there will likely be future revisions to our estimates resulting from matters such as new accounting pronouncements, changes in ownership interests, payouts, joint venture audits, reallocations by purchasers or pipelines, or other corrections and adjustments common in the oil and gas industry, many of which relate to prior periods. These types of adjustments cannot be currently estimated and are expected to be recorded in the period during which the adjustments are known.
We are subject to legal proceedings, claims, liabilities and environmental matters that arise in the ordinary course of business. We accrue for losses when such losses are considered probable and the amounts can be reasonably estimated.
Property and Equipment. We follow the “full-cost” method of accounting for oil and natural gas property and equipment costs. Under this method of accounting, all productive and nonproductive costs incurred in the exploration, development, and acquisition of oil and natural gas reserves are capitalized. Such costs may be incurred both prior to and after the acquisition of a property and include lease acquisitions, geological and geophysical services, drilling, completion, and equipment. Internal costs incurred that are directly identified with exploration, development, and acquisition activities undertaken by us for our own account, and which are not related to production, general corporate overhead, or similar activities, are also capitalized. For the years ended December 31, 2019 and 2018, such internal costs when capitalized totaled $5.3 million and $4.5 million, respectively. Interest costs are also capitalized to unproved oil and natural gas properties (refer to Note 4 of these Notes to Consolidated Financial Statements for further discussion on capitalized interest costs).
The “Property and Equipment” balances on the accompanying consolidated balance sheets are summarized for presentation purposes. The following is a detailed breakout of our “Property and Equipment” balances (in thousands):
56
December 31, 2019 | December 31, 2018 | |||||
Property and Equipment | ||||||
Proved oil and gas properties | $ | 1,201,296 | $ | 925,865 | ||
Unproved oil and gas properties | 41,201 | 56,715 | ||||
Furniture, fixtures, and other equipment | 5,220 | 3,520 | ||||
Less – Accumulated depreciation, depletion, amortization & impairment | (380,728 | ) | (284,804 | ) | ||
Property and Equipment, Net | $ | 866,989 | $ | 701,296 | ||
No gains or losses are recognized upon the sale or disposition of oil and natural gas properties, except in transactions involving a significant amount of reserves or where the proceeds from the sale of oil and natural gas properties would significantly alter the relationship between capitalized costs and proved reserves of oil and natural gas attributable to a cost center. Internal costs associated with selling properties are expensed as incurred.
We compute the provision for depreciation, depletion and amortization (“DD&A”) of oil and natural gas properties using the unit-of-production method. Under this method, we compute the provision by multiplying the total unamortized costs of oil and gas properties—including future development costs, gas processing facilities, and both capitalized asset retirement obligations and undiscounted abandonment costs of wells to be drilled, net of salvage values, but excluding costs of unproved properties—by an overall rate determined by dividing the physical units of oil and natural gas produced (which excludes natural gas consumed in operations) during the period by the total estimated units of proved oil and natural gas reserves (which excludes natural gas consumed in operations) at the beginning of the period. Future development costs are estimated on a property-by-property basis based on current economic conditions. The period over which we will amortize these properties is dependent on our production from these properties in future years. Furniture, fixtures, and other equipment are recorded at cost and are depreciated by the straight-line method at rates based on the estimated useful lives of the property, which range between two and 20 years. Repairs and maintenance are charged to expense as incurred.
Geological and geophysical (“G&G”) costs incurred on developed properties are recorded in “Proved oil and gas properties” and therefore subject to amortization. G&G costs incurred that are associated with unproved properties are capitalized in “Unproved oil and gas properties” and evaluated as part of the total capitalized costs associated with a prospect. The cost of unproved properties not being amortized is assessed quarterly, on a property-by-property basis, to determine whether such properties have been impaired. In determining whether such costs should be impaired, we evaluate current drilling results, lease expiration dates, current oil and gas industry conditions, economic conditions, capital availability, and available geological and geophysical information. Any impairment assessed is added to the cost of proved properties being amortized.
Full-Cost Ceiling Test. At the end of each quarterly reporting period, the unamortized cost of oil and natural gas properties (including natural gas processing facilities, capitalized asset retirement obligations, net of related salvage values and deferred income taxes) is limited to the sum of the estimated future net revenues from proved properties (excluding cash outflows from recognized asset retirement obligations, including future development and abandonment costs of wells to be drilled, using the preceding 12-months’ average price based on closing prices on the first day of each month, adjusted for price differentials, discounted at 10%, and the lower of cost or fair value of unproved properties) adjusted for related income tax effects (“Ceiling Test”).
The quarterly calculations of the Ceiling Test and provision for DD&A are based on estimates of proved reserves. There are numerous uncertainties inherent in estimating quantities of proved reserves and in projecting the future rates of production, timing, and plan of development. The accuracy of any reserves estimate is a function of the quality of available data and of engineering and geological interpretation and judgment. Results of drilling, testing, and production subsequent to the date of the estimate may justify revision of such estimates. Accordingly, reserves estimates are often different from the quantities of oil and natural gas that are ultimately recovered. There were no ceiling test write-downs for the years ended December 31, 2019 and 2018.
If future capital expenditures outpace future discounted net cash flows in our reserve calculations, if we have significant declines in our oil and natural gas reserves volumes (which also reduces our estimate of discounted future net cash flows from proved oil and natural gas reserves) or if oil or natural gas prices remain depressed or continue to decline, it is possible that non-cash write-downs of our oil and natural gas properties will occur in the future. We cannot control and cannot predict what future prices for oil and natural gas will be; therefore we cannot estimate the amount of any potential future non-cash write-down of our oil and natural gas properties due to decreases in oil or natural gas prices.
57
Revenue Recognition. Our reported oil and gas sales are comprised of revenues from oil, natural gas and natural gas liquids (“NGLs”) sales. Revenues from each product stream are recognized at the point when control of the product is transferred to the customer and collectability is reasonably assured. Prices for our products are either negotiated on a monthly basis or tied to market indices. The Company has determined that these contracts represent performance obligations which are satisfied when control of the commodity transfers to the customer, typically through the delivery of the specified commodity to a designated delivery point. Natural gas revenues are recognized based on the actual volume of natural gas sold to the purchasers.
The following table provides information regarding our oil and gas sales, by product, reported on the Statements of Operations for years ended December 31, 2019 and 2018 (in thousands):
Year Ended December 31, 2019 | Year Ended December 31, 2018 | |||||||
Oil, natural gas and NGLs sales: | ||||||||
Oil | $ | 92,833 | $ | 45,375 | ||||
Natural gas | 170,472 | 183,288 | ||||||
NGLs | 25,241 | 28,639 | ||||||
Other | 86 | (16 | ) | |||||
Total | $ | 288,631 | $ | 257,286 | ||||
Accounts Receivable, Net. We assess the collectability of accounts receivable, and based on our judgment, we accrue a reserve when we believe a receivable may not be collected. At both December 31, 2019 and 2018, we had an allowance for doubtful accounts of less than $0.1 million. The allowance for doubtful accounts has been deducted from the total “Accounts receivable, net” balance on the accompanying consolidated balance sheets.
At December 31, 2019, our “Accounts receivable, net” balance included $24.6 million for oil and gas sales, $3.7 million due from joint interest owners, $5.4 million for severance tax credit receivables and $3.3 million for other receivables. At December 31, 2018, our “Accounts receivable, net” balance included $36.9 million for oil and gas sales, $5.6 million for joint interest owners, $2.4 million for severance tax credit receivables and $1.6 million for other receivables.
Supervision Fees. Consistent with industry practice, we charge a supervision fee to the wells we operate including our wells in which we own up to a 100% working interest. Supervision fees are recorded as a reduction to “General and administrative, net”, on the accompanying consolidated statements of operations. The amount of supervision fees charged for each of the years ended December 31, 2019 and 2018 did not exceed our actual costs incurred. The total amount of supervision fees charged to the wells we operated was $4.9 million and $4.6 million for the years ended December 31, 2019 and 2018, respectively.
Income Taxes. Deferred taxes are determined based on the estimated future tax effects of differences between the financial statement and tax basis of assets and liabilities, given the provisions of the enacted tax laws.
Tax positions are evaluated for recognition using a more-likely-than-not threshold, and those tax positions requiring recognition are measured as the largest amount of tax benefit with a greater than 50% likelihood of being realized upon ultimate settlement with a taxing authority that has full knowledge of all relevant information. Our policy is to record interest and penalties relating to uncertain tax positions in income tax expense. At December 31, 2019, we did not have any accrued liability for uncertain tax positions and do not anticipate recognition of any significant liabilities for uncertain tax positions during the next 12 months.
The Company was in a net deferred tax asset position, prior to valuation allowance considerations, at both December 31, 2019 and 2018. Prior to the quarter ended June 30, 2019, management had determined that it was not more likely than not that the Company would realize future cash benefits from its remaining federal carryover items and other deferred tax assets and, accordingly, had maintained a full valuation allowance to offset its net deferred tax assets in excess of deferred tax liabilities. During the quarter ended June 30, 2019, the Company completed several operational initiatives that resulted in increased production, lower development costs and an expanded inventory of development prospects. The successful results attributable to these initiatives led to management's determination, after weighing both positive and negative evidence, that the Company will more likely than not be able to realize the benefits of its deferred tax assets. Accordingly, the Company released the valuation allowance, resulting in a net deferred income tax benefit of $21.6 million, which is net of $1.1 million of state income tax expense, for the year ended December 31, 2019. The Company recognized $1.1 million of state income tax expense for the year ended December 31, 2018.
58
Accounts Payable and Accrued Liabilities. The “Accounts payable and accrued liabilities” balances on the accompanying consolidated balance sheets are summarized below (in thousands):
December 31, 2019 | December 31, 2018 | |||||
Trade accounts payable | $ | 26,121 | $ | 32,683 | ||
Accrued operating expenses | 3,873 | 3,549 | ||||
Accrued compensation costs | 4,601 | 4,785 | ||||
Asset retirement obligations – current portion | 392 | 302 | ||||
Accrued non-income based taxes | 1,413 | 3,583 | ||||
Accrued corporate and legal fees | 109 | 534 | ||||
Other payables | 2,834 | 3,485 | ||||
Total accounts payable and accrued liabilities | $ | 39,343 | $ | 48,921 | ||
Cash and Cash Equivalents. We consider all highly liquid instruments with an initial maturity of three months or less to be cash equivalents. These amounts do not include cash balances that are contractually restricted.
Credit Risk Due to Certain Concentrations. We extend credit, primarily in the form of uncollateralized oil and gas sales and joint interest owners' receivables, to various companies in the oil and gas industry, which results in a concentration of credit risk. The concentration of credit risk may be affected by changes in economic or other conditions within our industry and may accordingly impact our overall credit risk. However, we believe that the risk of these unsecured receivables is mitigated by the size, reputation, and nature of the companies to which we extend credit. From certain customers we also obtain letters of credit or parent company guarantees, if applicable, to reduce risk of loss.
For the years ended December 31, 2019 and 2018, parties that accounted for 10% or more of our total oil and gas receipts were as follows:
Purchasers greater than 10% | Year Ended December 31, 2019 | Year Ended December 31, 2018 | |||
Kinder Morgan | 31 | % | 37 | % | |
Plains Marketing | 14 | % | * | ||
Twin Eagle | 13 | % | * | ||
Shell Trading | 11 | % | * | ||
*Oil and gas receipts less than 10%
Treasury Stock. Our treasury stock repurchases are reported at cost and are included in “Treasury stock held, at cost” on the accompanying consolidated balance sheets. For the years ended December 31, 2019 and 2018, we purchased 22,482 and 15,107 treasury shares to satisfy withholding tax obligations arising upon the vesting of restricted shares.
New Accounting Pronouncements. In February 2016, the Financial Accounting Standards Board (the “FASB”) issued Accounting Standards Update (“ASU”) 2016-02, Leases (Topic 842), which requires lessees to record most leases on the balance sheet. Under the new guidance, lease classification as either a finance lease or an operating lease will determine how lease-related revenue and expense are recognized. The guidance was effective for fiscal years beginning after December 15, 2018, including interim periods within those fiscal years. The Company adopted this standard on January 1, 2019 using the modified retrospective transition approach with an effective date of January 1, 2019. The Company has elected the package of practical expedients that allows an entity to carry forward historical accounting treatment relating to lease identification and classification for existing leases upon adoption and the practical expedient related to land easements that allows an entity to carry forward historical accounting treatment for land easements on existing agreements upon adoption. The Company has made an accounting policy election to keep leases with an initial term of 12 months or less off the Consolidated Balance Sheet. We have elected not to account for lease and non-lease components separately.
As a result of the adoption, the Company's 2019 opening balance for right-of-use assets and lease liabilities was $2.2 million, attributable to operating leases with no impact to retained earnings as of January 1, 2019. See Note 8 for more information.
59
2. Earnings Per Share
Basic earnings per share (“Basic EPS”) has been computed using the weighted average number of common shares outstanding during each period. Diluted earnings per share ("Diluted EPS") assumes, as of the beginning of the period, exercise of stock options and restricted stock grants using the treasury stock method. Diluted EPS also assumes conversion of performance-based restricted stock units to common shares based on the number of shares (if any) that would be issuable, according to predetermined performance and market goals, if the end of the reporting period was the end of the performance period.
The following is a reconciliation of the numerators and denominators used in the calculation of Basic EPS and Diluted EPS for the periods indicated below (in thousands, except per share amounts):
Year Ended December 31, 2019 | Year Ended December 31, 2018 | ||||||||||||||||||||
Net Income (Loss) | Shares | Per Share Amount | Net Income (Loss) | Shares | Per Share Amount | ||||||||||||||||
Basic EPS: | |||||||||||||||||||||
Net Income (Loss) and Share Amounts | $ | 114,656 | 11,753 | $ | 9.76 | $ | 74,615 | 11,655 | $ | 6.40 | |||||||||||
Dilutive Securities: | |||||||||||||||||||||
Restricted Stock Unit Awards | 25 | 94 | |||||||||||||||||||
Stock Option Awards | — | 15 | |||||||||||||||||||
Diluted EPS: | |||||||||||||||||||||
Net Income (Loss) and Assumed Share Conversions | $ | 114,656 | 11,778 | $ | 9.74 | $ | 74,615 | 11,764 | $ | 6.34 | |||||||||||
Approximately 0.5 million and 0.6 million stock options to purchase shares were not included in the computation of Diluted EPS for the years ended December 31, 2019 and 2018 respectively, because these stock options were antidilutive.
Less than 0.3 million and less than 0.1 million shares of restricted stock units that could be converted to common shares were not included in the computation of Diluted EPS for the years ended December 31, 2019 and 2018, respectively, because they were antidilutive.
Less than 0.1 million performance-based restricted stock units were not included in the computation of Diluted EPS for each of the years ended December 31, 2019 and 2018 because they were antidilutive.
Approximately 2.1 million and 4.3 million warrants to purchase common stock were not included in the computation of Diluted EPS for the years ended December 31, 2019 and 2018, respectively, because these warrants were antidilutive.
3. Provision (Benefit) for Income Taxes
Income (Loss) before taxes is as follows (in thousands):
Year Ended December 31, 2019 | Year Ended December 31, 2018 | ||||||
Income (Loss) Before Income Taxes | $ | 93,074 | $ | 75,543 | |||
The following is an analysis of the consolidated income tax provision (benefit) (in thousands):
Year Ended December 31, 2019 | Year Ended December 31, 2018 | ||||||
Current | $ | 519 | $ | (86 | ) | ||
Deferred | (22,101 | ) | 1,014 | ||||
Total | $ | (21,582 | ) | $ | 928 | ||
60
Reconciliations of income taxes computed using the U.S. Federal statutory rates of (21%) to the effective income tax rates are as follows (in thousands):
Year Ended December 31, 2019 | Year Ended December 31, 2018 | ||||
Federal Statutory Rate | 21.0 | % | 21.0 | % | |
State tax provisions (benefits), net of federal benefits | 1.0 | % | 1.2 | % | |
Executive compensation limitation | 0.3 | % | 0.3 | % | |
Other, net | 0.1 | % | 0.2 | % | |
Valuation allowance adjustments | (45.5 | )% | (21.4 | )% | |
Effective rate | (23.0 | )% | 1.2 | % | |
The tax effects of temporary differences representing the net deferred tax asset (liability) at December 31, 2019 and 2018 were as follows (in thousands):
Year Ended December 31, 2019 | Year Ended December 31, 2018 | ||||||
Deferred tax assets: | |||||||
Federal net operating loss (“NOL”) carryovers | $ | 67,610 | $ | 71,736 | |||
Other carryover items | 552 | 583 | |||||
Asset retirement obligations | 960 | 920 | |||||
Share-based compensation | 1,210 | 906 | |||||
Lease liability | 1,999 | — | |||||
Other | 874 | 956 | |||||
Valuation allowance | — | (42,335 | ) | ||||
Total deferred tax assets | $ | 73,205 | $ | 32,766 | |||
Deferred tax liabilities: | |||||||
Oil and gas exploration and development costs | $ | (48,329 | ) | $ | (30,935 | ) | |
Derivative contracts | (1,820 | ) | (2,817 | ) | |||
Leased assets | (1,968 | ) | — | ||||
Other | (1 | ) | (28 | ) | |||
Total deferred tax liabilities | (52,118 | ) | (33,780 | ) | |||
Net deferred tax asset (liabilities) | $ | 21,087 | $ | (1,014 | ) | ||
State net deferred tax liabilities | $ | (1,582 | ) | $ | (1,014 | ) | |
Federal net deferred tax assets | 22,669 | — | |||||
Net deferred tax asset (liabilities) | $ | 21,087 | $ | (1,014 | ) | ||
The Company was in a net deferred tax asset position, at both December 31, 2019 and 2018. Prior to the quarter ended June 30, 2019, management had determined that it was not more likely than not that the Company would realize future cash benefits from its remaining federal carryover items and other deferred tax assets and, accordingly, had maintained a full valuation allowance to offset its net deferred tax assets in excess of deferred tax liabilities. During the quarter ended June 30, 2019, the Company completed several operational initiatives that resulted in increased production, lower development costs and an expanded inventory of development prospects. The successful results attributable to these initiatives led to management's determination, after weighing both positive and negative evidence, that the Company will more likely than not be able to realize the benefits of its deferred tax assets. Accordingly, the Company released the valuation allowance, resulting in a net deferred tax benefit of $21.6 million for the year ended December 31, 2019.
The Company’s valuation allowance balance was $0 million and $42 million at December 31, 2019 and 2018, respectively. The Company recorded a net deferred tax liability for state income tax purposes at December 31, 2019 and 2018.
61
The Company’s NOL carryforward asset is attributable to Federal tax losses of $93 million generated from 2014 through 2015, $156 million generated in 2017, $67 million generated for 2018, and a $0.4 million tax loss for 2019. The losses generated between 2014 and 2015 are subject to an annual utilization limit under Sec. 382. These losses will expire between 2034 and 2035 if not utilized. The 2017 loss will expire in 2037 if not utilized. The 2018 and 2019 losses will not expire under the current tax code, but their usage will be limited to 80% of taxable income.
As of December 31, 2019, the Company does not have any accrued liability for uncertain tax positions. We do not believe the total of unrecognized tax positions will significantly increase during the next 12 months.
The Company's policy is to record interest and penalties related to potential underpayment of any unrecognized tax benefits as a component of income tax expense. The Company has not incurred any interest or penalties associated with unrecognized tax benefits.
Our U.S. federal and state income tax returns from 2016 forward are subject to examination. For years prior to 2016 our U.S. federal returns are subject to examination to the extent of our net operating loss (NOL) carryforwards. There are no material unresolved items related to periods previously audited by the taxing authorities.
4. Long-Term Debt
The Company's long-term debt consisted of the following (in thousands):
December 31, 2019 | December 31, 2018 | ||||||
Credit Facility Borrowings (1) | $ | 279,000 | $ | 195,000 | |||
Second Lien Notes due 2024 | 200,000 | 200,000 | |||||
479,000 | 395,000 | ||||||
Unamortized discount on Second Lien Notes due 2024 | (1,550 | ) | (1,782 | ) | |||
Unamortized debt issuance cost on Second Lien Notes due 2024 | (4,550 | ) | (5,230 | ) | |||
Total Long-Term Debt | $ | 472,900 | $ | 387,988 | |||
(1) Unamortized debt issuance costs on our Credit Facility borrowings are included in “Other Long-Term Assets” in our consolidated balance sheet. As of December 31, 2019 and 2018, we had $3.1 million and $4.5 million, respectively, in unamortized debt issuance costs on our Credit Facility borrowings.
Revolving Credit Facility. Amounts outstanding under our Credit Facility (defined below) were $279.0 million and $195.0 million as of December 31, 2019 and 2018, respectively. On April 19, 2017 the Company entered into a First Amended and Restated Senior Secured Revolving Credit Agreement among the Company as borrower, JPMorgan Chase Bank, National Association as administrative agent, and certain lenders party thereto, as amended from time to time including the Fourth Amendment , effective November 6, 2018, to the First Amended and Restated Senior Secured Credit Agreement (as so amended, the “Credit Agreement” and such facility, the “Credit Facility”). Additionally, on October 17, 2019, as part of our regularly scheduled borrowing base redetermination, the borrowing base was decreased from $410 million to $400 million.
The Credit Facility matures April 19, 2022 and provides for a maximum credit amount of $600 million and a current borrowing base of $400 million. The borrowing base is regularly redetermined on or about May and November of each calendar year and is subject to additional adjustments from time to time, including for asset sales, elimination or reduction of hedge positions and incurrence of other debt. Additionally, each of the Company and the administrative agent may request an unscheduled redetermination of the borrowing base between scheduled redeterminations. The amount of the borrowing base is determined by the lenders in their discretion in accordance with their oil and gas lending criteria at the time of the relevant redetermination. The Company may also request the issuance of letters of credit under the Credit Agreement in an aggregate amount up to $25 million, which reduces the amount of available borrowings under the borrowing base in the amount of such issued and outstanding letters of credit.
Interest under the Credit Facility accrues at the Company’s option either at an Alternative Base Rate plus the applicable margin (“ABR Loans”) or the LIBOR Rate plus the applicable margin (“Eurodollar Loans”). Since November 6, 2018, the applicable margin ranged from 1.00% to 2.00% for ABR Loans and 2.00% to 3.00% for Eurodollar Loans. The Alternate Base Rate and LIBOR Rate are defined, and the applicable margins are set forth, in the Credit Agreement. Undrawn amounts under the Credit
62
Facility are subject to a 0.50% commitment fee. To the extent that a payment default exists and is continuing, all amounts outstanding under the Credit Facility will bear interest at 2.00% per annum above the rate and margin otherwise applicable thereto.
The obligations under the Credit Agreement are secured, subject to certain exceptions, by a first priority lien on substantially all assets of the Company and certain of its subsidiaries, including a first priority lien on properties attributed with at least 85% of estimated proved reserves of the Company and its subsidiaries.
The Credit Agreement contains the following financial covenants:
• | a ratio of total debt to earnings before interest, tax, depreciation and amortization ("EBITDA"), as defined in the Credit Agreement, for the most recently completed four fiscal quarters, not to exceed 4.0 to 1.0 as of the last day of each fiscal quarter; and |
• | a current ratio, as defined in the Credit Agreement, which includes in the numerator available borrowings undrawn under the borrowing base, of not less than 1.0 to 1.0 as of the last day of each fiscal quarter. |
As of December 31, 2019, the Company was in compliance with all financial covenants under the Credit Agreement. Maintaining or increasing our borrowing base under our Credit Facility is dependent on many factors, including commodities pricing, our hedge positions and our ability to drill wells to replace produced reserves.
Additionally, the Credit Agreement contains certain representations, warranties and covenants, including but not limited to, limitations on incurring debt and liens, limitations on making certain restricted payments, limitations on investments, limitations on asset sales and hedge unwinds, limitations on transactions with affiliates and limitations on modifying organizational documents and material contracts. The Credit Agreement contains customary events of default. If an event of default occurs and is continuing, the lenders may declare all amounts outstanding under the Credit Facility to be immediately due and payable.
Total interest expense on the Credit Facility, which includes commitment fees and amortization of debt issuance costs, was $15.7 million and $8.0 million for the years ended December 31, 2019 and 2018, respectively. The amount of commitment fee amortization included in interest expense, net was $0.7 million and $1.1 million for the years ended December 31, 2019 and 2018, respectively.
We capitalized interest on our unproved properties in the amount $0.2 million and $0.9 million for the years ended December 31, 2019 and 2018, respectively.
Senior Secured Second Lien Notes. On December 15, 2017, the Company entered into a Note Purchase Agreement for Senior Secured Second Lien Notes (as amended, the “Note Purchase Agreement”, such second lien facility, the “Second Lien” and such notes, the “Second Lien Notes”) among the Company as issuer, U.S. Bank National Association as agent and collateral agent and certain holders that are a party thereto, and issued notes in an initial principal amount of $200.0 million, with a $2.0 million discount, for net proceeds of $198.0 million. The Company has the ability, subject to the satisfaction of certain conditions (including compliance with the Asset Coverage Ratio described below and the agreement of the holders to purchase such additional notes), to issue additional notes in a principal amount not to exceed $100.0 million. The Second Lien matures on December 15, 2024.
Interest on the Second Lien is payable quarterly and accrues at LIBOR plus 7.5%; provided that if LIBOR ceases to be available, the Second Lien provides for a mechanism to use ABR (an alternate base rate) plus 6.5% as the applicable interest rate. The definitions of LIBOR and ABR are set forth in the Second Lien. To the extent that a payment, insolvency or, at the holders’ election, another default exists and is continuing, all amounts outstanding under the Second Lien will bear interest at 2.0% per annum above the rate and margin otherwise applicable thereto. Additionally, to the extent the Company were to default on the Second Lien, this would potentially trigger a cross-default under our Credit Facility.
The Company has the right, to the extent permitted under the Credit Facility and subject to the terms and conditions of the Second Lien, to optionally prepay the notes, subject to the following repayment fees: during years one and two, a customary “make-whole” amount (which is equal to the present value of the remaining interest payments through the 24-month anniversary of the issuance of the Second Lien, discounted at a rate equal to the U.S. Treasury rate plus 50 basis points) plus 2.0% of the principal amount of the notes repaid; during year three, 2.0% of the principal amount of the Second Lien being prepaid; during year four, 1.0% of the principal amount of the Second Lien being prepaid; and thereafter, no premium. Additionally, the Second Lien contains customary mandatory prepayment obligations upon asset sales (including hedge terminations), casualty events and
63
incurrences of certain debt, subject to, in certain circumstances, reinvestment periods. Management believes the probability of mandatory prepayment due to default is remote.
The obligations under the Second Lien are secured, subject to certain exceptions and other permitted liens (including the liens created under the Credit Facility), by a perfected security interest, second in priority to the liens securing our Credit Facility, and mortgage lien on substantially all assets of the Company and certain of its subsidiaries, including a mortgage lien on oil and gas properties attributed with at least 85% of estimated PV-9 of proved reserves of the Company and its subsidiaries and 85% of the book value attributed to the PV-9 of the non-proved oil and gas properties of the Company. PV-9 is determined using commodity price assumptions by the administrative agent of the Credit Facility.
The Second Lien contains an Asset Coverage Ratio, which is only tested (i) as a condition to issuance of additional notes and (ii) in connection with certain asset sales in order to determine whether the proceeds of such asset sale must be applied as a prepayment of the notes and includes in the numerator the PV-10 (defined below), based on forward strip pricing, plus the swap mark-to-market value of the commodity derivative contracts of the Company and its restricted subsidiaries and in the denominator the total net indebtedness of the Company and its restricted subsidiaries, of not less than 1.25 to 1.0 as of each date of determination (the “Asset Coverage Ratio”). PV-10 Value is the estimated future net revenues to be generated from the production of proved reserves discounted to present value using an annual discount rate of 10%.
The Second Lien also contains a financial covenant measuring the ratio of total net debt to EBITDA, as defined in the Note Purchase Agreement, for the most recently completed four fiscal quarters, not to exceed 4.5 to 1.0 as of the last day of each fiscal quarter. As of December 31, 2019, the Company was in compliance with all financial covenants under the Second Lien.
The Second Lien contains certain customary representations, warranties and covenants, including but not limited to, limitations on incurring debt and liens, limitations on making certain restricted payments, limitations on investments, limitations on asset sales and hedge unwinds, limitations on transactions with affiliates and limitations on modifying organizational documents and material contracts. The Second Lien contains customary events of default. If an event of default occurs and is continuing, the lenders may declare all amounts outstanding under the Second Lien to be immediately due and payable.
As of December 31, 2019, net amounts recorded for the Second Lien Notes were $193.9 million, net of unamortized debt discount and debt issuance costs. Interest expense on the Second Lien totaled $21.1 million and $20.5 million for the years ended December 31, 2019 and 2018, respectively.
Debt Issuance Costs. Our policy is to capitalize upfront commitment fees and other direct expenses associated with our line of credit arrangement and then amortize such costs ratably over the term of the arrangement, regardless of whether there are any outstanding borrowings.
5. Price-Risk Management Activities
Derivatives are recorded on the balance sheet at fair value with changes in fair value recognized in earnings. The changes in the fair value of our derivatives are recognized in “Gain (loss) on commodity derivatives, net” on the accompanying consolidated statements of operations. We have a price-risk management policy to use derivative instruments to protect against declines in oil and natural gas prices, primarily through the purchase of commodity price swaps and collars as well as basis swaps.
During the years ended December 31, 2019 and 2018, the Company recorded gains of $24.2 million and losses of $9.8 million, respectively, relating to our derivative activities. The Company received net cash payments of $24.6 million and made net cash payments of $19.7 million for settled derivative contracts during the years ended December 31, 2019 and 2018, respectively.
At December 31, 2019 and 2018, we had $2.9 million and $0.7 million, respectively, in receivables for settled derivatives which were included on the accompanying consolidated balance sheet in “Accounts receivable, net” and were subsequently collected in January 2020 and 2019, respectively. At December 31, 2019 and 2018, we also had $0.2 million and $2.2 million, respectively, in payables for settled derivatives which were included on the accompanying consolidated balance sheet in “Accounts payable and accrued liabilities” and were subsequently paid in January 2020 and 2019, respectively.
The fair values of our swap contracts are computed using observable market data whereas our collar contracts are valued using a Black-Scholes pricing model and are periodically verified against quotes from brokers. At December 31, 2019 there was $12.8 million and $3.9 million in current unsettled derivative assets and long-term unsettled derivative assets, respectively, and $6.6 million and $1.6 million in current unsettled derivative liabilities and long-term unsettled derivative liabilities, respectively. At December 31, 2018, the Company had $15.3 million and $4.3 million in current unsettled derivative assets and long-term
64
unsettled derivative assets, respectively, and $2.8 million and $3.7 million in current unsettled derivative liabilities and long-term unsettled derivative liabilities, respectively.
The Company uses an International Swap and Derivatives Association master agreement for our derivative contracts. This is an industry-standardized contract containing the general conditions of our derivative transactions including provisions relating to netting derivative settlement payments under certain circumstances (such as default). For reporting purposes, the Company has elected to not offset the asset and liability fair value amounts of its derivatives on the accompanying balance sheets. Under the right of set-off, there was an $8.4 million net fair value asset at December 31, 2019 and $13.0 million net fair value asset at December 31, 2018. For further discussion related to the fair value of the Company's derivatives, refer to Note 10 of these Notes to Consolidated Financial Statements.
The following tables summarize the weighted average prices as well as future production volumes for our future derivative contracts in place as of December 31, 2019.
Oil Derivative Swaps (NYMEX WTI Settlements) | Total Volumes (Bbls) | Weighted Average Price | ||||
2020 Contracts | ||||||
1Q20 | 361,597 | $ | 56.61 | |||
2Q20 | 452,569 | $ | 56.41 | |||
3Q20 | 500,279 | $ | 55.92 | |||
4Q20 | 421,621 | $ | 54.61 | |||
2021 Contracts | ||||||
1Q21 | 328,603 | $ | 53.11 | |||
2Q21 | 320,033 | $ | 53.46 | |||
3Q21 | 313,848 | $ | 52.38 | |||
4Q21 | 230,000 | $ | 53.22 | |||
Natural Gas Derivative Swaps (NYMEX Henry Hub Settlements) | Total Volumes (MMBtu) | Weighted Average Price | Weighted Average Collar Floor Price | Weighted Average Collar Call Price | ||||||||||
2020 Contracts | ||||||||||||||
1Q20 | 9,920,000 | $ | 2.73 | |||||||||||
2Q20 | 7,328,000 | $ | 2.63 | |||||||||||
3Q20 | 7,265,000 | $ | 2.63 | |||||||||||
4Q20 | 7,042,000 | $ | 2.63 | |||||||||||
2021 Contracts | ||||||||||||||
1Q21 | 148,078 | $ | 2.70 | |||||||||||
2Q21 | 442,255 | $ | 2.30 | |||||||||||
Collar Contracts | ||||||||||||||
1Q21 | 4,354,800 | $ | 2.50 | $ | 3.52 | |||||||||
2Q21 | 3,791,000 | $ | 2.20 | $ | 2.75 | |||||||||
3Q21 | 4,007,175 | $ | 2.00 | $ | 2.70 | |||||||||
4Q21 | 3,726,000 | $ | 2.25 | $ | 2.75 | |||||||||
65
Natural Gas Basis Derivative Swaps (East Texas Houston Ship Channel vs. NYMEX Settlements) | Total Volumes (MMBtu) | Weighted Average Price | ||||
2020 Contracts | ||||||
1Q20 | 11,739,000 | $ | (0.03 | ) | ||
2Q20 | 11,739,000 | $ | (0.04 | ) | ||
3Q20 | 11,868,000 | $ | (0.03 | ) | ||
4Q20 | 11,868,000 | $ | (0.04 | ) | ||
2021 Contracts | ||||||
1Q21 | 7,200,000 | $ | (0.003 | ) | ||
2Q21 | 7,280,000 | $ | (0.003 | ) | ||
3Q21 | 7,360,000 | $ | (0.003 | ) | ||
4Q21 | 7,360,000 | $ | (0.003 | ) | ||
Oil Basis Derivative Swaps (Argus Cushing (WTI) and LLS Settlements) | Total Volumes (Bbls) | Weighted Average Price | ||||
2020 Contracts (Calendar Monthly Roll Differential Swaps) | ||||||
1Q20 | 182,000 | $ | 0.49 | |||
2Q20 | 182,000 | $ | 0.49 | |||
3Q20 | 184,000 | $ | 0.49 | |||
4Q20 | 184,000 | $ | 0.49 | |||
6. Commitments and Contingencies
Our minimum annual obligations under non-cancelable operating lease commitments are $7.0 million for 2020, $2.4 million for 2021, $0.1 million for 2022 and approximately $10.0 million in the aggregate.
We have gas transportation and processing minimum obligations amounting to $8.8 million for 2020, $5.4 million for 2021, $3.9 million for 2022, $2.6 million for 2023, $1.6 million for 2024 and $23.4 million in the aggregate.
In the ordinary course of business, we are party to various legal actions, which arise primarily from our activities as operator of oil and natural gas wells. In management's opinion, the outcome of any such currently pending legal actions will not have a material adverse effect on our financial position or results of operations.
7. Share-Based Compensation
Share-Based Compensation Plans
In 2016, the Company adopted the 2016 Equity Incentive Plan (as amended from time to time, the “2016 Plan”). The Company also adopted the Inducement Plan (as amended from time to time, the “Inducement Plan,” and, together with the 2016 Plan, the “Plans”) on December 15, 2016. The Company does not estimate the forfeiture rate during the initial calculation of compensation cost but rather has elected to account for forfeitures in compensation cost when they occur.
The Company computes a deferred tax benefit for restricted stock awards (“RSUs”), performance-based stock units (“PSUs”) and stock options designed to generate future tax deductions by applying its effective tax rate to the expense recorded. For restricted stock units, the Company's actual tax deduction is based on the value of the units at the time of vesting.
The expense for awards issued to both employees and non-employees, which was recorded in “General and administrative, net” in the accompanying consolidated statements of operations was $6.1 million and $6.0 million for the years ended December 31, 2019 and 2018 respectively. Capitalized share-based compensation was $0.5 million for both of the years ended December 31, 2019 and 2018, respectively.
We view stock option awards and restricted stock unit awards with graded vesting as single awards with an expected life equal to the average expected life of component awards, and we amortize the awards on a straight-line basis over the life of the awards.
66
For the year ended December 31, 2018, no incremental tax benefit was recognized for shares that vested due to the offsetting valuation allowance.
Our shares available for future grant under the Plans were 1,066,770 at December 31, 2019.
On April 2, 2019, our Board of Directors authorized a one-time grant of market-based awards (both RSUs and PSUs) in exchange for the cancellation of special equity awards (both RSUs and stock options) made to our named executive officers on August 9, 2018 (the “Equity Award Exchange”). As required under the terms of the 2016 Plan, this Equity Award Exchange was subject to shareholder approval. Pursuant to the Equity Award Exchange our executives were given the opportunity to exchange out-of-the-money or “underwater” stock options that were granted in August 2018 and certain RSUs also granted in August 2018 to receive a new equity award that consists of 50% time-based RSUs and 50% PSUs, granted under the 2016 Plan. The incremental compensation cost associated with the Equity Award Exchange was determined to be $1.2 million. This incremental cost was measured as the excess of the fair value of each new equity award, measured as of the date the new equity awards were granted, over the fair value of the stock options and RSUs surrendered in exchange for the new equity awards, measured immediately prior to the cancellation. This incremental compensation cost is being recognized ratably over the vesting period or performance period, as applicable, of the new equity awards.
Stock Option Awards
The compensation cost related to these awards is based on the grant date fair value and is expensed over the vesting period (generally one to five years). We use the Black-Scholes-Merton option pricing model to estimate the fair value of stock option awards.
At December 31, 2019, we had $1.2 million in unrecognized compensation cost related to stock option awards. The following table represents stock option award activity for the year ended December 31, 2019:
Shares | Wtd. Avg. Exer. Price | |||||
Options outstanding, beginning of period | 644,575 | $ | 28.28 | |||
Options forfeited | (40,795 | ) | $ | 27.00 | ||
Options canceled in Equity Award Exchange | (201,406 | ) | $ | 31.14 | ||
Options expired | (71,557 | ) | $ | 23.81 | ||
Options outstanding, end of period | 330,817 | $ | 27.66 | |||
Options exercisable, end of period | 166,824 | $ | 28.94 | |||
Our outstanding stock option awards at December 31, 2019 had no measurable aggregate intrinsic value. At December 31, 2019 the weighted-average remaining contract life of stock option awards outstanding was 5.5 years and exercisable was 3.7 years. The stock option awards exercisable as of December 31, 2019 had no intrinsic value.
Restricted Stock Units
The Plans allow for the issuance of restricted stock unit awards that generally may not be sold or otherwise transferred until certain restrictions have lapsed. The compensation cost related to these awards is based on the grant date fair value and is typically expensed over the requisite service period (generally one to five years).
As of December 31, 2019, we had unrecognized compensation expense of $4.3 million related to our restricted stock units which is expected to be recognized over a weighted-average period of 1.9 years.
The following table provides information regarding restricted stock unit activity for the year ended December 31, 2019:
67
Shares | Wtd. Avg. Grant Price | |||||
Restricted units outstanding, beginning of period | 340,678 | $ | 27.64 | |||
Restricted stock units granted | 115,957 | $ | 20.13 | |||
Restricted stock units granted under Equity Award Exchange | 99,500 | $ | 16.70 | |||
Restricted stock canceled under Equity Award Exchange | (24,622 | ) | $ | 31.14 | ||
Restricted stock units forfeited | (59,842 | ) | $ | 24.13 | ||
Restricted stock units vested | (128,988 | ) | $ | 27.54 | ||
Restricted stock units outstanding, end of period | 342,683 | $ | 22.10 | |||
Performance-Based Stock Units
On February 20, 2018, the Company granted 30,700 performance share units for which the number of shares earned is based on the total shareholder return (“TSR”) of the Company's common stock relative to the TSR of its selected peers during the performance period from January 1, 2018 to December 31, 2020. The awards contain market conditions which allow a payout ranging between 0% payout and 200% of the target payout. The fair value as of the date of valuation was $41.66 per unit or 150.61% of the stock price. The compensation expense for these awards is based on the per unit grant date valuation using a Monte-Carlo simulation multiplied by the target payout level. The payout level is calculated based on actual stock price performance achieved during the performance period. The awards have a cliff-vesting period of three years.
On May 21, 2019, the Company granted an additional 99,500 performance-based stock units (as part of the Equity Award Exchange discussed above) for which the number of shares earned is based on the TSR of the Company's common stock relative to the TSR of its selected peers during the performance period from January 1, 2019 to December 31, 2021. The awards contain market conditions which allow a payout ranging between 0% payout and 200% of the target payout. The fair value as of the grant date was $18.86 per unit or 112.9% of stock price. The awards have a cliff-vesting period of three three years.
As of December 31, 2019, we had unrecognized compensation expense of $2.3 million related to our performance-based stock units based on the assumption of 100.0% target payout. The remaining weighted-average performance period is 1.9 years. No shares vested during the year ended December 31, 2019.
Employee Savings Plan
We have a savings plan under Section 401(k) of the Internal Revenue Code. The Company contributed on behalf of eligible employees an amount up to 100% of the first 6% of compensation based on the contributions made by the eligible employees in 2019 and 2018. The Company's plan contributions of $0.6 million for both the years ended December 31, 2019 and 2018, respectively, were paid in cash during each pay period. These amounts were recorded as “General and administrative, net” on the accompanying consolidated statements of operations.
8. Leases
SilverBow Resources has contractual agreements for its corporate office lease, vehicle fleet, drilling rigs, compressors, treating equipment, and for surface use rights. For leases with a primary term of more than 12 months, a right-of-use (“ROU”) asset and the corresponding lease liability is recorded. The Company determines at inception if an arrangement is an operating or financing lease. As of January 1, 2019 all of the Company’s leases were operating leases.
The initial asset and liability balances are recorded at the present value of the payment obligations over the lease term. If lease terms include options to extend the lease and it is reasonably certain that the Company will exercise that option, the lease term used for capitalization includes the expected renewal periods. Most leases do not provide an implicit interest rate. Unless the lease contract contains an implicit interest rate, the Company uses its incremental borrowing rate at the time of lease inception to compute the fair value of the lease payments. The ROU asset balance and current and non-current lease liabilities are reported separately on the accompanying 2019 Consolidated Balance Sheet. Certain leases have payment terms that vary based on the usage of the underlying assets. Variable lease payments are not included in ROU assets and lease liabilities. Leases with an initial term of 12 months or less are not recorded on the balance sheet. The Company recognizes lease expense on a straight-line basis over the lease term.
68
Lease costs represent the straight-line lease expense of ROU assets and short-term leases. The components of lease cost are classified as follows (in thousands):
Year Ended December 31, 2019 | |||
Lease Costs Included in the Asset Additions in the Condensed Consolidated Balance Sheets | |||
Property, plant and equipment acquisitions - short-term leases | $ | 10,573 | |
Property, plant and equipment acquisitions - operating leases | 41 | ||
Total lease costs in property, plant and equipment additions | $ | 10,614 | |
Year Ended December 31, 2019 | |||
Lease Costs Included in the Condensed Consolidated Statements of Operations | |||
Lease operating costs - short-term leases | $ | 2,071 | |
Lease operating costs - operating leases | 3,945 | ||
General and administrative, net - operating leases | 681 | ||
Total lease cost expensed | $ | 6,697 | |
The lease term and the discount rate related to the Company's leases are as follows:
As of December 31, 2019 | ||
Weighted-average remaining lease term (in years) | 1.8 | |
Weighted-average discount rate | 5.0 | % |
As of December 31, 2019, the Company's future undiscounted cash payment obligation for its operating lease liabilities are as follows (in thousands):
December 31, 2019 | |||
2020 | $ | 7,032 | |
2021 | 2,436 | ||
2022 | 118 | ||
2023 | 60 | ||
2024 | 38 | ||
Thereafter | 325 | ||
Total undiscounted lease payments | $ | 10,009 | |
Present value adjustment | (489 | ) | |
Net operating lease liabilities | $ | 9,520 | |
Supplemental cash flow information related to leases was as follows (in thousands):
Year Ended December 31, 2019 | |||
Cash paid for amounts included in the measurement of lease liabilities | |||
Operating cash flows from operating leases | $ | 4,609 | |
Investing cash flows from operating leases | $ | 41 | |
Rental and lease expense was $5.4 million and $4.4 million for the years ended December 31, 2019 and 2018, respectively. The rental and lease expense primarily relates to compressor rentals and the lease of our office space in Houston, Texas. During 2016 the Company entered into a four-year sub-lease agreement for office space in Houston, Texas. The operating lease commenced
69
on January 1, 2017. Additionally, on August 31, 2017 we amended the sub-lease agreement for additional office space. As of December 31, 2019, the minimum contractual obligations were approximately $0.9 million in the aggregate.
Future minimum rental commitments under non-cancelable leases under the previous lease accounting standard Topic 840, are presented below (in thousands):
December 31, 2018 | |||
2019 | $ | 4,470 | |
2020 | 838 | ||
2021 | 332 | ||
Thereafter | — | ||
Total undiscounted lease payments | $ | 5,640 | |
9. Acquisitions and Dispositions
Effective December 22, 2017, the Company closed a purchase and sale contract to sell the Company's wellbores and facilities in Bay De Chene and recorded a $16.3 million obligation related to the funding of certain plugging and abandonment costs. Of the $16.3 million original obligation, $5.1 million and $8.7 million was paid during the years ended December 31, 2019 and 2018, respectively. The remaining obligation under this contract is $2.3 million and is carried in the accompanying consolidated balance sheet as a current liability in “Accounts payable and accrued liabilities” as of December 31, 2019.
On March 1, 2018, the Company closed the sale of certain wells in its AWP Olmos field for proceeds, net of selling expenses, of $27.0 million, with an effective date of January 1, 2018. The buyer assumed approximately $6.3 million in asset retirement obligations. No gain or loss was recorded on the sale of this property.
There were no material acquisitions or dispositions of developed properties during the year ended December 31, 2019.
10. Fair Value Measurements
Fair Value on a Recurring Basis. Our financial instruments consist of cash and cash equivalents, accounts receivable, accounts payable, derivatives, the Credit Facility and the Second Lien. The carrying amounts of cash and cash equivalents, accounts receivable, and accounts payable approximate fair value due to the highly liquid or short-term nature of these instruments.
The fair values of our derivative contracts are computed using observable market data whereas our derivative collar contracts are valued using a Black-Scholes pricing model and are periodically verified against quotes from brokers. These are considered Level 2 valuations (defined below).
The carrying value of our Credit Facility and Second Lien approximates fair value because the respective borrowing rates do not materially differ from market rates for similar borrowings. These are considered Level 3 valuations (defined below).
The fair value hierarchy has three levels based on the reliability of the inputs used to determine the fair value (in millions):
Level 1 – Uses quoted prices in active markets for identical, unrestricted assets or liabilities. Instruments in this category have comparable fair values for identical instruments in active markets.
Level 2 – Uses quoted prices for similar assets or liabilities in active markets or observable inputs for assets or liabilities in non-active markets. Instruments in this category are periodically verified against quotes from brokers and include our commodity derivatives that we value using commonly accepted industry-standard models which contain inputs such as contract prices, risk-free rates, volatility measurements and other observable market data that are obtained from independent third-party sources.
Level 3 – Uses unobservable inputs for assets or liabilities that are in non-active markets.
The following table presents our assets and liabilities that are measured on a recurring basis as of December 31, 2019 and 2018, and are categorized using the fair value hierarchy. For additional discussion related to the fair value of the Company's derivatives, refer to Note 5 of these Notes to Consolidated Financial Statements.
70
Fair Value Measurements at | |||||||||||||||
(in millions) | Total | Quoted Prices in Active markets for Identical Assets (Level 1) | Significant Other Observable Inputs (Level 2) | Significant Unobservable Inputs (Level 3) | |||||||||||
December 31, 2019 | |||||||||||||||
Assets | |||||||||||||||
Natural Gas Derivatives | $ | 11.7 | $ | — | $ | 11.7 | $ | — | |||||||
Natural Gas Basis Derivatives | $ | 3.4 | $ | — | $ | 3.4 | $ | — | |||||||
Oil Derivatives | $ | 1.6 | $ | — | $ | 1.6 | $ | — | |||||||
Liabilities | |||||||||||||||
Natural Gas Derivatives | $ | 0.2 | $ | — | $ | 0.2 | $ | — | |||||||
Natural Gas Basis Derivatives | $ | 0.9 | $ | — | $ | 0.9 | $ | — | |||||||
Oil Derivatives | $ | 7.0 | $ | — | $ | 7.0 | $ | — | |||||||
Oil Basis Derivatives | $ | 0.1 | $ | — | $ | 0.1 | $ | — | |||||||
December 31, 2018 | |||||||||||||||
Assets | |||||||||||||||
Natural Gas Derivatives | $ | 7.5 | $ | — | $ | 7.5 | $ | — | |||||||
Natural Gas Basis Derivatives | $ | 0.4 | $ | — | $ | 0.4 | $ | — | |||||||
Oil Derivatives | $ | 6.9 | $ | — | $ | 6.9 | $ | — | |||||||
NGL Derivatives | $ | 4.7 | $ | — | $ | 4.7 | $ | — | |||||||
Liabilities | |||||||||||||||
Natural Gas Derivatives | $ | 1.0 | $ | — | $ | 1.0 | $ | — | |||||||
Natural Gas Basis Derivatives | $ | 5.3 | $ | — | $ | 5.3 | $ | — | |||||||
NGL Derivatives | $ | 0.2 | $ | — | $ | 0.2 | $ | — | |||||||
Our current and long-term unsettled derivative assets and liabilities in the table above are measured at gross fair value and are shown on the accompanying condensed consolidated balance sheets in “Fair value of commodity derivatives” and “Fair value of long-term commodity derivatives,” respectively.
11. Asset Retirement Obligations
Liabilities for legal obligations associated with the retirement obligations of tangible long-lived assets are initially recorded at fair value in the period in which they are incurred. When a liability is initially recorded, the carrying amount of the related asset is increased. The liability is discounted from the expected date of abandonment. Over time, accretion of the liability is recognized each period, and the capitalized cost is amortized on a unit-of-production basis as part of depreciation, depletion, and amortization expense for our oil and gas properties. Upon settlement of the liability, the Company either settles the obligation for its recorded amount or incurs a gain or loss upon settlement which is included in the “Property and Equipment” balance on our accompanying consolidated balance sheets.
71
The following provides a roll-forward of our asset retirement obligations (in thousands):
Asset Retirement Obligations as of December 31, 2017 | $ | 10,787 | |
Accretion expense | 419 | ||
Liabilities incurred for new wells and facilities construction | 93 | ||
Reductions due to sold wells and facilities | (6,298 | ) | |
Reductions due to plugged wells and facilities | (180 | ) | |
Revisions in estimates | (562 | ) | |
Asset Retirement Obligations as of December 31, 2018 | $ | 4,259 | |
Accretion expense | 329 | ||
Liabilities incurred for new wells and facilities construction | 250 | ||
Reductions due to sold wells and facilities | — | ||
Reductions due to plugged wells and facilities | (82 | ) | |
Revisions in estimates | (309 | ) | |
Asset Retirement Obligations as of December 31, 2019 | $ | 4,447 | |
At December 31, 2019 and 2018, approximately $0.4 million and $0.3 million, respectively, of our asset retirement obligations were classified as current liabilities in “Accounts payable and accrued liabilities” on the accompanying consolidated balance sheets. The 2018 reductions due to sold wells and facilities are primarily attributable to the disposition of our assets from our AWP Olmos field.
72
Supplementary Information (unaudited)
SilverBow Resources, Inc. and Subsidiaries
Oil and Gas Operations
Capitalized Costs. The following table presents our aggregate capitalized costs relating to oil and natural gas producing activities and the related depreciation, depletion, and amortization (in thousands):
Total | |||
December 31, 2019 | |||
Proved oil and gas properties | $ | 1,201,296 | |
Unproved oil and gas properties | 41,201 | ||
Total | 1,242,497 | ||
Accumulated depreciation, depletion, amortization and impairment | (377,861 | ) | |
Net capitalized costs | $ | 864,636 | |
December 31, 2018 | |||
Proved oil and gas properties | $ | 925,865 | |
Unproved oil and gas properties | 56,715 | ||
Total | 982,580 | ||
Accumulated depreciation, depletion, amortization and impairment | (282,663 | ) | |
Net capitalized costs | $ | 699,917 | |
There were $41.2 million and $56.7 million of unproved property costs at December 31, 2019 and 2018, respectively, excluded from the amortizable base. We evaluate the majority of these unproved costs within a two- to four-year time frame.
Capitalized asset retirement obligations have been included in the Proved oil and gas properties as of December 31, 2019 and 2018.
Costs Incurred. The following table sets forth costs incurred related to our oil and natural gas operations (in thousands) for the periods indicated:
Year Ended December 31, 2019 | Year Ended December 31, 2018 | ||||||
Lease acquisitions and prospect costs | $ | 22,798 | $ | 22,681 | |||
Exploration | — | — | |||||
Development (1) (3) | 236,223 | 284,525 | |||||
Acquisition of property | 940 | 1,096 | |||||
Total acquisition, exploration, and development (2) | $ | 259,961 | $ | 308,302 | |||
(1) Facility construction costs and capital costs have been included in development costs, and totaled $18.9 million and $16.4 million for the years ended December 31, 2019 and 2018, respectively.
(2) Includes capitalized general and administrative costs directly associated with the acquisition, exploration, and development efforts of approximately $5.3 million and $4.5 million for the years ended December 31, 2019 and 2018, respectively. In addition, the total includes $0.2 million and $0.9 million for the years ended December 31, 2019 and 2018, respectively, of capitalized interest on unproved properties.
(3) Includes asset retirement obligations incurred, including revisions, of approximately ($0.1) million and ($0.6) million for the years ended December 31, 2019 and 2018, respectively. Does not include accrued payments associated with our Bay De Chene sale for the years ended December 31, 2019 and 2018.
73
Supplementary Reserves Information. The following information presents estimates of our proved oil and natural gas reserves. Reserves were prepared in accordance with SEC rules by Gruy as of December 31, 2019, 2018 and 2017. Proved reserves, as of December 31, 2019, 2018 and 2017, were based upon the preceding 12-months' average price based on closing prices on the first business day of each month, or prices defined by existing contractual arrangements which are held constant, for that year's reserves calculation. The 12-month 2019 average adjusted prices after differentials used in our calculations were $2.62 per Mcf of natural gas, $58.37 per barrel of oil, and $16.83 per barrel of NGL compared to $3.04 per Mcf of natural gas, $66.96 per barrel of oil, and $26.63 per barrel of NGL for the 12-month average 2018 prices and $2.95 per Mcf of natural gas, $50.38 per barrel of oil, and $20.32 per barrel of NGL for 2017.
Estimates of Proved Reserves | Total | Natural Gas | Oil | NGL | |||||||
(Mcfe) | (Mcf) | (Bbls) | (Bbls) | ||||||||
Proved reserves as of December 31, 2017 | 1,024,421,384 | 842,735,076 | 7,159,695 | 23,121,356 | |||||||
Extensions, discoveries, and other additions (3) | 450,353,613 | 357,778,652 | 6,690,818 | 8,738,342 | |||||||
Revisions of previous estimates (1) | (34,442,827 | ) | (31,025,348 | ) | 149,332 | (718,912 | ) | ||||
Purchases of minerals in place | 427,200 | 427,200 | — | — | |||||||
Sales of minerals in place (4) | (27,866,979 | ) | (16,842,753 | ) | (532,809 | ) | (1,304,562 | ) | |||
Production | (67,530,138 | ) | (56,665,272 | ) | (688,221 | ) | (1,122,590 | ) | |||
Proved reserves as of December 31, 2018 | 1,345,362,253 | 1,096,407,555 | 12,778,815 | 28,713,634 | |||||||
Extensions, discoveries, and other additions (3) | 434,834,382 | 346,973,742 | 6,891,900 | 7,751,540 | |||||||
Revisions of previous estimates (1) | (275,773,843 | ) | (220,640,925 | ) | (1,054,261 | ) | (8,134,558 | ) | |||
Purchases of minerals in place | 336,498 | — | 56,083 | — | |||||||
Production | (84,320,479 | ) | (64,388,294 | ) | (1,604,931 | ) | (1,717,100 | ) | |||
Proved reserves as of December 31, 2019 | 1,420,438,811 | 1,158,352,078 | 17,067,606 | 26,613,516 | |||||||
Proved developed reserves (2) | |||||||||||
December 31, 2017 | 458,252,677 | 377,504,768 | 5,026,398 | 8,431,587 | |||||||
December 31, 2018 | 554,896,291 | 466,128,862 | 5,507,442 | 9,287,129 | |||||||
December 31, 2019 | 579,122,401 | 478,005,141 | 6,475,646 | 10,377,231 | |||||||
Proved undeveloped reserves | |||||||||||
December 31, 2017 | 566,168,707 | 465,230,305 | 2,133,297 | 14,689,769 | |||||||
December 31, 2018 | 790,465,963 | 630,278,693 | 7,271,373 | 19,426,505 | |||||||
December 31, 2019 | 841,316,410 | 680,346,937 | 10,591,960 | 16,236,285 | |||||||
(1) Revisions of previous estimates are related to upward or downward variations based on current engineering information for production rates, volumetrics, reservoir pressure and commodity pricing. The downward revisions for 2018 and 2019 were primarily attributable to the reclassification of PUDs to unproved due to changes in the Company's five-year development plans.
(2) At December 31, 2019, 2018 and 2017, 41%, 41% and 45% of our reserves were proved developed, respectively.
(3) We have added proved reserves through our drilling activities. The 2019 and 2018 additions were primarily due to additions from drilling results and leasing of adjacent acreage.
(4) Includes the disposition of our AWP Olmos field wells in South Texas in 2018. See Note 9 of the consolidated financial statements for more information.
74
Standardized Measure of Discounted Future Net Cash Flows. The Standardized Measure of discounted future net cash flows relating to proved oil and natural gas reserves is as follows (in thousands):
As of December 31, | |||||||
2019 | 2018 | ||||||
Future gross revenues | $ | 4,481,152 | $ | 4,950,917 | |||
Future production costs | (1,340,278 | ) | (1,366,404 | ) | |||
Future development costs (1) | (865,434 | ) | (866,436 | ) | |||
Future net cash flows before income taxes | 2,275,440 | 2,718,077 | |||||
Future income taxes | (283,327 | ) | (431,513 | ) | |||
Future net cash flows after income taxes | 1,992,113 | 2,286,564 | |||||
Discount at 10% per annum | (1,123,849 | ) | (1,292,835 | ) | |||
Standardized Measure of discounted future net cash flows relating to proved oil and natural gas reserves | $ | 868,264 | $ | 993,729 | |||
(1) These amounts include future costs related to plugging and abandoning the Company's wells.
The Standardized Measure of discounted future net cash flows from production of proved reserves as of December 31, 2019 and 2018, were developed as follows:
1. Estimates were made of quantities of proved reserves and the future periods during which they are expected to be produced based on year-end economic conditions.
2. The estimated future gross revenues of proved reserves were based on the preceding 12-months' average price based on closing prices on the first day of each month, or prices defined by existing contractual arrangements.
3. The future gross revenues were reduced by estimated future costs to develop and to produce the proved reserves, including asset retirement obligation costs, based on year-end cost estimates and the estimated effect of future income taxes.
4. Future income taxes were computed by applying the statutory tax rate to future net cash flows reduced by the tax basis of the properties, the estimated permanent differences applicable to future oil and natural gas producing activities and tax carry forwards.
The Standardized Measure of discounted future net cash flows is not intended to present the fair market value of our oil and natural gas reserves. An estimate of fair value would also take into account, among other things, the recovery of reserves in excess of proved reserves, anticipated future changes in prices and costs, an allowance for return on investment, and the risks inherent in reserves estimates.
75
The following are the principal sources of changes in the Standardized Measure of discounted future net cash flows (in thousands) for the years ended December 31, 2019, 2018 and 2017:
2019 | 2018 | ||||||
Beginning balance | $ | 993,729 | $ | 731,527 | |||
Revisions to reserves proved in prior years: | |||||||
Net changes in prices, net of production costs | (254,543 | ) | 182,718 | ||||
Net changes in future development costs | 41,083 | (4,264 | ) | ||||
Net changes due to revisions in quantity estimates | (151,725 | ) | (38,067 | ) | |||
Accretion of discount | 112,751 | 106,129 | |||||
Other | (71,243 | ) | 80,573 | ||||
Total revisions | (323,677 | ) | 327,089 | ||||
New field discoveries and extensions, net of future production and development costs | 260,853 | 182,030 | |||||
Purchase of reserves | 805 | 472 | |||||
Sales of minerals in place | — | (39,598 | ) | ||||
Sales of oil and gas produced, net of production costs | (226,397 | ) | (204,403 | ) | |||
Previously estimated development costs incurred | 136,778 | 57,332 | |||||
Net change in income taxes | 26,173 | (60,720 | ) | ||||
Net change in Standardized Measure of discounted future net cash flows | (125,465 | ) | 262,202 | ||||
Ending balance | $ | 868,264 | $ | 993,729 | |||
Selected Quarterly Financial Data (Unaudited). The following table presents summarized quarterly financial information for the years ended December 31, 2019 and 2018 (in thousands, except per share data):
Oil and Gas Sales | Net Income (Loss) Before Taxes | Net Income (Loss) | Basic EPS | Diluted EPS | |||||||||||||||
2018 | |||||||||||||||||||
First | $ | 52,752 | $ | 8,466 | $ | 8,466 | $ | 0.73 | $ | 0.72 | |||||||||
Second | 51,347 | 2,647 | 2,319 | 0.20 | 0.20 | ||||||||||||||
Third | 65,034 | 7,300 | 7,080 | 0.61 | 0.60 | ||||||||||||||
Fourth | 88,153 | 57,130 | 56,750 | 4.85 | 4.82 | ||||||||||||||
Total | $ | 257,286 | $ | 75,543 | $ | 74,615 | $ | 6.40 | $ | 6.34 | |||||||||
2019 | |||||||||||||||||||
First | 72,064 | 16,285 | 16,053 | $ | 1.37 | $ | 1.36 | ||||||||||||
Second | 74,703 | 43,969 | 64,704 | 5.51 | 5.49 | ||||||||||||||
Third | 72,014 | 28,690 | 27,651 | 2.35 | 2.35 | ||||||||||||||
Fourth | 69,850 | 4,130 | 6,248 | 0.53 | 0.53 | ||||||||||||||
Total | $ | 288,631 | $ | 93,074 | $ | 114,656 | $ | 9.76 | $ | 9.74 | |||||||||
The sum of the individual quarterly net income (loss) per common share amounts may not agree with year-to-date net income (loss) per common share as each quarterly computation is based on the weighted average number of common shares outstanding during that period. In addition, certain potentially dilutive securities were not included in certain of the quarterly computations of diluted net income per common share amounts because to do so would have been antidilutive.
76
Item 9. Changes in and Disagreements with Accountants on Accounting and Financial Disclosure
None.
Item 9A. Controls and Procedures
We maintain disclosure controls and procedures, as defined in Rules 13a-15(e) and 15d-15(e) of the Exchange Act, consisting of controls and other procedures designed to give reasonable assurance that information we are required to disclose in the reports we file or submit under the Exchange Act is recorded, processed, summarized and reported within the time periods specified in the Securities and Exchange Commission's rules and forms and that such information is accumulated and communicated to management, including our chief executive officer and our chief financial officer, to allow timely decisions regarding such required disclosure.
As of the end of the period covered by this Form 10-K, the Company’s management carried out an evaluation, under the supervision and with the participation of the Chief Executive Officer and the Chief Financial Officer, of the effectiveness of the design and operation of the Company’s disclosure controls and procedures (as defined in Rule 13a-15(e) of the Exchange Act). Based upon that evaluation, our Chief Executive Officer and Chief Financial Officer concluded that our disclosure controls and procedures were effective as of the last day of the period covered by this report at the reasonable assurance level.
Changes in Internal Control Over Financial Reporting
In connection with the preparation of our financial statements for the three months ended June 30, 2019, we identified and disclosed a material weakness related to the design and operation of the controls over our income tax accounting process related to the review and analysis of the allocation of intra-period adjustments to deferred income tax expense resulting from significant, unusual and infrequent transactions. To remediate the material weakness, we redesigned and expanded our management review controls and enhanced the precision of review around the key income tax areas relating to the allocation of intra-period adjustments to deferred income tax expense. Based on testing performed by management, we believe the implemented controls are operating effectively and the material weakness has been remediated as of December 31, 2019. There were no other changes in our internal control over financial reporting during the fourth quarter of 2019 that materially affected, or are reasonably likely to materially affect, our internal control over financial reporting. See management's report on internal control over financial reporting at Item 8 in this Form 10-K.
77
Item 9B. Other Information
None.
78
PART III
Item 10. Directors, Executive Officers and Corporate Governance.
The information required under Item 10 which will be set forth in our definitive proxy statement to be filed within 120 days after the close of the fiscal year-end in connection with our May 19, 2020 annual shareholders' meeting is incorporated herein by reference.
Item 11. Executive Compensation.
The information required under Item 11 which will be set forth in our definitive proxy statement to be filed within 120 days after the close of the fiscal year-end in connection with our May 19, 2020 annual shareholders' meeting is incorporated herein by reference.
Item 12. Security Ownership of Certain Beneficial Owners and Management and Related Stockholder Matters.
The information required under Item 12 which will be set forth in our definitive proxy statement to be filed within 120 days after the close of the fiscal year-end in connection with our May 19, 2020 annual shareholders' meeting is incorporated herein by reference.
Item 13. Certain Relationships and Related Transactions, and Director Independence.
The information required under Item 13 which will be set forth in our definitive proxy statement to be filed within 120 days after the close of the fiscal year-end in connection with our May 19, 2020 annual shareholders' meeting is incorporated herein by reference.
Item 14. Principal Accounting Fees and Services.
The information required under Item 14 which will be set forth in our definitive proxy statement to be filed within 120 days after the close of the fiscal year-end in connection with our May 19, 2020 annual shareholders' meeting is incorporated herein by reference.
79
PART IV
Item 15. Exhibits and Financial Statement Schedules.
1. The following consolidated financial statements of SilverBow Resources, Inc. together with the report thereon of BDO USA, LLP dated March 5, 2020, and the data contained therein are included in Item 8 hereof:
Management's Report on Internal Control Over Financial Reporting | |
Report of Independent Registered Public Accounting Firm on Internal Control Over Financial Reporting | |
Report of Independent Registered Public Accounting Firm | |
Consolidated Balance Sheets | |
Consolidated Statements of Operations | |
Consolidated Statements of Stockholders' Equity (Deficit) | |
Consolidated Statements of Cash Flows | |
Notes to Consolidated Financial Statements | |
Item 16. 10-K Summary.
None.
2. Financial Statement Schedules
None.
3. Exhibits
3.1 | |
3.2 | |
4.1 | |
4.2 | |
4.3 | |
4.4 | |
4.5* | |
10.1 | |
10.2 | |
80
10.3 | |
10.4 | |
10.5 | |
10.6 | |
10.7 | |
10.8 | |
10.9 | |
10.10 | |
10.11+ | |
10.12+ | |
10.13+ | |
10.14+ | |
10.15+ | |
10.16+ | |
10.17+ | |
10.18+ | |
10.19+ | |
10.20+ | |
81
10.21+ | |
10.22+ | |
10.23+ | |
10.24+ | |
10.25+ | |
10.26+ | |
10.27+ | |
10.28+ | |
10.29+ | |
10.30+ | |
10.31+ | |
10.32+ | |
10.33+ | |
10.34+ | |
10.35+ | |
10.36+ | |
10.37+ | |
21 * | |
23.1 * | |
23.2 * | |
31.1 * | |
31.2* | |
82
32** | |
99.1* | |
101.INS* | XBRL Instance Document |
101.SCH* | XBRL Schema Document |
101.CAL* | XBRL Calculation Linkbase Document |
101.LAB* | XBRL Label Linkbase Document |
101.PRE* | XBRL Presentation Linkbase Document |
101.DEF* | XBRL Definition Linkbase Document |
* Filed herewith.
** Furnished herewith.
+ Management contract or compensatory plan or arrangement.
83
SIGNATURES
Pursuant to the requirements of Section 13 or 15(d) of the Securities Exchange Act of 1934, the Registrant, SilverBow Resources, Inc., has duly caused this report to be signed on its behalf by the undersigned, thereunto duly authorized, on March 5, 2020.
SILVERBOW RESOURCES, INC. | |
By: /s/ Sean C. Woolverton | |
Sean C. Woolverton | |
Chief Executive Officer | |
84
Pursuant to the requirements of the Securities Exchange Act of 1934, this report has been signed below by the following persons on behalf of the Registrant, SilverBow Resources, Inc., and in the capacities and on the dates indicated:
Signatures | Title | Date |
/s/ Sean C. Woolverton | Chief Executive Officer | March 5, 2020 |
Sean C. Woolverton | ||
Executive Vice President, | ||
/s/ Christopher M. Abundis | Chief Financial Officer, | March 5, 2020 |
Christopher M. Abundis | General Counsel and Secretary | |
/s/ Gary G. Buchta | Controller | March 5, 2020 |
Gary G. Buchta | ||
Chairman of the Board | ||
/s/ Marcus C. Rowland | Director | March 5, 2020 |
Marcus C. Rowland | ||
/s/ Michael Duginski | Director | March 5, 2020 |
Michael Duginski | ||
/s/ Gabriel L. Ellisor | Director | March 5, 2020 |
Gabriel L. Ellisor | ||
/s/ David Geenberg | Director | March 5, 2020 |
David Geenberg | ||
/s/ Christoph O. Majeske | Director | March 5, 2020 |
Christoph O. Majeske | ||
/s/ Charles W. Wampler | Director | March 5, 2020 |
Charles W. Wampler | ||
85