Attached files
| file | filename |
|---|---|
| EX-31.1 - EXHIBIT 31.1 - SILVERBOW RESOURCES, INC. | a201510k-exhibit311.htm |
| EX-12 - EXHIBIT 12 - SILVERBOW RESOURCES, INC. | a201510k-exhibit12.htm |
| EX-99.1 - EXHIBIT 99.1 - SILVERBOW RESOURCES, INC. | a201510k-exhibit991.htm |
| EX-23.1 - EXHIBIT 23.1 - SILVERBOW RESOURCES, INC. | a201510k-exhibit231.htm |
| EX-23.2 - EXHIBIT 23.2 - SILVERBOW RESOURCES, INC. | a201510k-exhibit232.htm |
| EX-32 - EXHIBIT 32 - SILVERBOW RESOURCES, INC. | a201510k-exhibit32.htm |
| EX-31.2 - EXHIBIT 31.2 - SILVERBOW RESOURCES, INC. | a201510k-exhibit312.htm |
| EX-21 - EXHIBIT 21 - SILVERBOW RESOURCES, INC. | a201510k-exhibit21.htm |
UNITED STATES
SECURITIES AND EXCHANGE COMMISSION
Washington, D.C. 20549
FORM 10-K
Annual Report Pursuant to Section 13 or 15(d) of the Securities Exchange Act of 1934
For the Fiscal Year Ended December 31, 2015
Commission File Number 1-8754
SWIFT ENERGY COMPANY
(Exact Name of Registrant as Specified in Its Charter)
Texas (State of Incorporation) | 20-3940661 (I.R.S. Employer Identification No.) |
17001 Northchase Drive, Suite 100 Houston, Texas 77060 (281) 874-2700 (Address and telephone number of principal executive offices) Securities registered pursuant to Section 12(b) of the Act: | |
Title of Class | Exchanges on Which Registered: |
Common Stock, par value $.01 per share | Not Applicable |
Securities registered pursuant to Section 12(g) of the Act: None
Indicate by check mark if the registrant is a well-known seasoned issuer, as defined in Rule 405 of the Securities Act.
Yes | o | No | þ |
Indicate by check mark if the registrant is not required to file reports pursuant to Section 13 or Section 15(d) of the Securities Exchange Act of 1934.
Yes | o | No | þ |
Indicate by check mark whether the registrant (1) has filed all reports required to be filed by Section 13 or 15(d) of the Securities Exchange Act of 1934 during the preceding 12 months, and (2) has been subject to such filing requirements for the past 90 days.
Yes | þ | No | o |
Indicate by check mark if disclosure of delinquent filers pursuant to Item 405 of Regulation S-K is not contained herein, and will not be contained, to the best of Registrant's knowledge, in definitive proxy or information statements incorporated by reference in Part III of this Form 10-K or any amendment to this Form 10-K.
o |
1
Indicate by check mark whether the registrant is a large accelerated filer, an accelerated filer, or a non-accelerated filer. See definition of “accelerated filer and large accelerated filer” in Rule 12b-2 of the Exchange Act.
Large accelerated filer | o | Accelerated filer | þ | Non-accelerated filer | o | Smaller reporting company | o | |||
Indicate by check mark whether the registrant is a shell company (as defined in Rule 12b-2 of the Exchange Act).
Yes | o | No | þ |
The aggregate market value of the voting and non-voting common equity held by non-affiliates computed by reference to the price at which the common equity was last sold on the New York Stock Exchange as of June 30, 2015, the last business day of June 2015, was approximately $87,818,801.
The number of shares of common stock outstanding as of February 29, 2016 was 44,747,966.
2
Form 10-K
Swift Energy Company and Subsidiaries
10-K Part and Item No.
Part I | Page | |
Items 1 & 2 | Business and Properties | |
Item 1A. | Risk Factors | |
Item 1B. | Unresolved Staff Comments | |
Item 3. | Legal Proceedings | |
Item 4. | Mine Safety Disclosures | |
Part II | ||
Item 5. | Market for Registrant's Common Equity, Related Stockholder Matters and Issuer Purchases of Equity Securities | |
Item 6. | Selected Financial Data | |
Item 7. | Management's Discussion and Analysis of Financial Condition and Results of Operations | |
Item 7A. | Quantitative and Qualitative Disclosures About Market Risk | |
Item 8. | Financial Statements and Supplementary Data | |
Item 9. | Changes in and Disagreements with Accountants on Accounting and Financial Disclosure | |
Item 9A. | Controls and Procedures | |
Item 9B. | Other Information | |
Part III | ||
Item 10. | Directors, Executive Officers and Corporate Governance | |
Item 11. | Executive Compensation | |
Item 12. | Security Ownership of Certain Beneficial Owners and Management and Related Stockholders Matters | |
Item 13. | Certain Relationships and Related Transactions, and Director Independence | |
Item 14. | Principal Accountant Fees and Services | |
Part IV | ||
Item 15. | Exhibits and Financial Statement Schedules | |
3
Items 1 and 2. Business and Properties
As used in this Annual Report on Form 10-K, unless the context otherwise requires or indicates, references to “Swift Energy,” “the Company,” “we,” “our,” “ours” and “us” refer to Swift Energy Company. See pages 24 and 25 for explanations of abbreviations and terms used herein.
Overview
Swift Energy Company, a Texas corporation founded in 1979, is an independent oil and gas company engaged in developing, exploring, acquiring, and operating oil and gas properties. Our primary focus is on the Eagle Ford trend of South Texas and, to a lesser extent, the onshore and inland waters of Louisiana. We operate approximately 97% of the properties that we own and we have implemented leading edge technologies to maximize the discovery, development and production of our potential reserve base in the Eagle Ford and other areas where we operate. As a result of the significant resource potential from our properties in the Eagle Ford, we plan to invest a significant portion from our total 2016 planned capital expenditures in this area.
At December 31, 2015, we had estimated proved reserves of 70.3 MMBoe with a PV-10 Value of $374.0 million (PV-10 Value is a non-GAAP measure, see the section titled “Oil and Natural Gas Reserves” of this Form 10-K for a reconciliation of this non-GAAP measure to the standardized measure of discounted future net cash flows, the closest GAAP measure). This is a decrease of approximately 124 MMBoe from year-end 2014 proved reserves quantities due to the impact of lower commodity prices and uncertainties, due in part to our bankruptcy filing, surrounding the availability of the financing that would be necessary to develop our proved undeveloped reserves. Our total proved reserves at December 31, 2015 were approximately 14% crude oil, 74% natural gas, and 12% NGLs while 80% of our total proved reserves were developed. Approximately 90% of our proved reserves are located in Texas with the remainder in Louisiana.
Bankruptcy Proceedings under Chapter 11
On December 31, 2015, the Company and eight of its subsidiaries (the “Chapter 11 Subsidiaries”) filed voluntary petitions seeking relief under Chapter 11 of Title 11 of the United States Bankruptcy Code in the United States Bankruptcy Court for the District of Delaware (In re Swift Energy Company, et al, Case No. 15-12670). The Company and the Chapter 11 Subsidiaries are currently operating our business as debtors in possession in accordance with the applicable provisions of the Bankruptcy Code. The Bankruptcy Court has granted all motions filed by the Company and the Chapter 11 Subsidiaries that were designed primarily to minimize the impact of the Chapter 11 proceedings on the Company’s operations, customers and employees. As a result the Company is not only able to conduct normal business activities and pay all associated obligations for the period following its bankruptcy filing, it is also authorized to pay and has paid (subject to caps applicable to payments of certain pre-petition obligations), pre-petition employee wages and benefits, pre-petition amounts owed to certain lienholders and critical vendors, pre-petition amounts owed to pipeline owners that transport the Company’s production, and funds belonging to third parties, including royalty holders and partners. During the pendency of the Chapter 11 case, all transactions outside the ordinary course of our business require the prior approval of the Bankruptcy Court. As a result of the automatic stay, which became effective upon the commencement of the Chapter 11 case, most judicial or administrative actions against the Company and efforts by creditors to collect on or otherwise exercise rights or remedies with respect to pre-petition claims are stayed.
On February 5, 2016, the Company and the Chapter 11 Subsidiaries filed with the Bankruptcy Court a joint plan of reorganization (the “Plan”), which is supported by an ad hoc committee of the Company’s noteholders. The Plan is subject to confirmation by the Bankruptcy Court. If the Plan is ultimately approved by the Bankruptcy Court, the Company and the Chapter 11 Subsidiaries would exit bankruptcy pursuant to the terms of the Plan. Under the Plan, the holders of the Company’s senior notes and certain other unsecured creditors, together with the lenders under the debtor-in-possession credit agreement, are to receive 96% of the new common stock to be issued upon emergence of the Company from bankruptcy, with the remaining 4% to be issued to the Company’s then-current equity holders. Claims of other creditors would be paid in full in cash, reinstated or otherwise treated in a manner acceptable to the creditors.
The Bankruptcy Court has approved the Company’s disclosure statement with respect to the Plan, and the Company is in the process of soliciting votes with respect to the Plan. A confirmation hearing on the Plan is scheduled on March 30, 2016 in the Bankruptcy Court.
For a further description of these matters, see Note 1A to our Consolidated Financial Statements.
As a consequence of depressed oil prices and our limited liquidity (See “2016 Liquidity and Capital Resources” in Management’s Discussion and Analysis in this Form 10-K report), as disclosed in our Bankruptcy Court filings, the Company’s current $78.0 million capital budget for 2016 is significantly reduced from 2015 levels, and includes $66 million for completion
4
costs for 12 previously drilled but not completed wells, drilling and completion of 4 wells, drilling but not completion of 8 additional wells, and recompletion of 8 wells. The budget also includes $12.0 million for anticipated regulatory, corporate and other capital costs.
For the duration of our Chapter 11 proceedings, our operations and our ability to develop and execute our business plan are subject to the risks and uncertainties associated with the Chapter 11 proceedings as described in Item 1A, “Risk Factors.” As a result of these risks and uncertainties, the number of our outstanding shares and our stockholders, assets, liabilities, officers and/or directors could be significantly different following the outcome of the Chapter 11 proceedings, and the description of our operations, properties and capital plans included in this Annual Report may not accurately reflect our operations, properties and capital plans following the Chapter 11 process.
Pending Sale of Interests in South Bearhead Creek and Burr Ferry Louisiana Fields to Texegy LLC
On December 31, 2015 the Company entered into a purchase and sale agreement with Texegy LLC (Texegy) to sell a full participating 75% working interest of Swift Energy’s position in the South Bearhead Creek Field and Burr Ferry Field located in Allen, Avoyelles, Vernon, Sabine and Beauregard Parishes in central Louisiana. The Bankruptcy Court approved the sale on February 2, 2016. To date, Swift Energy has received two equal cash deposits aggregating $4.9 million from Texegy, the second of which was made upon Bankruptcy Court approval of the sale on February 2, 2016. The purchase agreement provides for Texegy to pay Swift Energy approximately $49.0 million in cash consideration, which is subject to closing adjustments and adjustments for interim operations between January 1, 2016 and the closing date. Upon closing, which the purchase and sale agreement provides will occur on or prior to March 15, 2016 unless a later date is agreed to by both parties, Swift will retain approximately $13.0 million of the closing proceeds (subject to the same adjustments), with the balance to be paid to the Company’s first-lien secured lenders under the Company’s credit facility. The properties being sold represent approximately 5% of the Company's total proved reserves as of December 31, 2015.
In addition to paying for its share of costs, Texegy has agreed to carry a portion of the Company’s field development costs, which are limited to the Company’s 25% share of all costs for the drilling of two wells to casing point in the South Bearhead Creek Field. On the closing date, Swift Energy and Texegy plan to enter into a joint development agreement and a joint operating agreement (together, the “JV Agreements”) to continue operation and development of the Properties, with a Texegy affiliate serving as the operator of the Properties that will conduct all drilling, completion and production operations. Under the JV Agreements, future development plans for the field will be mutually agreed upon by the Company and Texegy.
Business Strategy
Our business strategy is primarily focused on exploiting our unconventional reserves from the Eagle Ford and, to a lesser extent, exploiting our more conventional reserves in Louisiana.
• | Develop our Eagle Ford shale resource play. We have a long successful history operating oil and gas wells and finding reserves in South Texas. We first acquired producing Olmos properties in our AWP field in 1989. This area has remained a cornerstone of our operations since we first began drilling here in 1994. While the combination of proven drilling and completion technologies have allowed us to exploit the Eagle Ford shale, we have applied the same methods to further develop the “mature” Olmos sand, substantially increasing our Olmos production. The application of horizontal drilling and multi-stage hydraulic fracturing technology has resulted in increases in production and decreases in completion and operating costs in our South Texas Olmos and Eagle Ford operations. During 2015, we drilled 24 horizontal Eagle Ford wells. Focusing on the Eagle Ford play allows us to use our operating, technical and regional expertise to interpret geological and operating trends, enhance production rates and maximize well recovery. We are focused on enhancing the value of our assets through operating improvements that utilize cost-effective technology to locate the highest quality intervals to drill and complete oil and gas wells. For instance, we are using proprietary 3D seismic techniques to identify a narrow high quality interval of the lower Eagle Ford within which to steer our laterals, resulting in marked improvement in our recent well results. Our 2016 plans include completing 12 previously drilled (but not completed) wells and drilling (but not completing) an additional 8 new wells. |
• | Operate our properties as a low-cost producer. We believe our concentrated acreage position in the Eagle Ford and our experience as an operator of virtually all of our properties enables us to apply drilling and completion techniques and economies of scale that improve the returns that we are able to achieve. Operating control allows us to better manage timing and risk as well as the cost of infrastructure, drilling and ongoing operations. We generally drill multiple wells from a single pad, which reduces facilities costs and surface impact. Our operational control is critical to us being able to transfer successful drilling and completion techniques from one field to another. |
5
• | Emerge from bankruptcy: Our current schedule is to emerge from bankruptcy within 110 days of our December 31, 2015 Chapter 11 filing. We expect that we will exit bankruptcy with an improved balance sheet and additional liquidity. This should allow us to access capital necessary to maintain, and in some cases, improve our asset base. |
• | Experienced technical team. We employ 43 oil and gas technical professionals, including geophysicists, petrophysicists, geologists, petroleum engineers and production and reservoir engineers, who have an average of approximately 21 years of experience in their technical fields and have been employed by us for an average of approximately eight years. In addition, we engage experienced and qualified consultants to perform various comprehensive seismic acquisitions, processing, reprocessing, interpretation, and other related services. We continually apply our extensive in-house experience and current technologies to benefit our drilling and production operations. |
Operating Areas
Our operations are primarily focused in three core areas identified as South Texas, Southeast Louisiana and Central Louisiana. The following table sets forth information regarding our 2015 year-end proved reserves of 70.3 MMBoe and production of 11.7 MMBoe by area:
Core Areas & Fields | Developed Reserves (MMBoe) | Undeveloped Reserves (MMBoe) | Total Proved Reserves (MMBoe) | % of Total Proved Reserves | Oil and NGLs as % of Reserves | Total Production (MBoe) | ||||||||||||
Artesia Wells | 3.8 | — | 3.8 | 5.4 | % | 52.1 | % | 1,113 | ||||||||||
AWP | 16.5 | 5.2 | 21.8 | 31.0 | % | 45.2 | % | 3,881 | ||||||||||
Fasken | 27.9 | 8.7 | 36.6 | 52.1 | % | — | % | 4,841 | ||||||||||
Other South Texas | 0.9 | — | 0.9 | 1.2 | % | 52.4 | % | 209 | ||||||||||
Total South Texas | 49.2 | 13.9 | 63.1 | 89.8 | % | 10,044 | ||||||||||||
Southeast Louisiana | 3.5 | — | 3.5 | 5.0 | % | 97.6 | % | 1,061 | ||||||||||
Central Louisiana | 3.6 | — | 3.6 | 5.1 | % | 73.3 | % | 583 | ||||||||||
Other | 0.1 | — | 0.1 | 0.1 | % | 4.0 | % | 39 | ||||||||||
Total | 56.3 | 13.9 | 70.3 | 100.0 | % | 26.1 | % | 11,727 | ||||||||||
6
South Texas
AWP. During 2015, the Company drilled 5 wells in AWP targeting the Eagle Ford formation. All wells in this field were drilled and are operated by Swift Energy. Our proved reserves in this formation are 54% natural gas, 26% NGLs, and 20% oil on a Boe basis. As of December 31, 2015 we had 4 wells drilled that were waiting on completion. These wells were subsequently completed in February of 2016.
In the Olmos formation, the wells are operated and owned by Swift Energy and our reserves in this formation are approximately 58% natural gas, 28% NGLs, and 14% oil on a Boe basis.
Artesia Wells. Our December 31, 2015 proved reserves in this formation are 48% natural gas, 37% NGLs, and 15% oil on a Boe basis.
Fasken. During 2015, the Company drilled 19 wells in Fasken targeting the Eagle Ford formation. All wells in this field were drilled and are operated by Swift Energy. Our reserves in this Eagle Ford formation are 100% natural gas. At December 31, 2015, we had drilled 8 proved undeveloped locations that are expected to be completed in the first and second quarters of 2016.
On July 15, 2014, we closed a transaction with Saka Energi to fully develop 8,300 acres of natural gas Eagle Ford shale properties in our Fasken field. Saka Energi purchased a 36% full participating interest in the properties. Refer to Note 9 of the consolidated financial statements in this Form 10-K for further discussion of this transaction.
Southeast Louisiana
Lake Washington. Since its discovery in the 1930's, the field has produced over 300 million Boe from multiple stacked Miocene sand layers radiating outward from a central salt dome which are heavily faulted, thereby creating a large number of potential hydrocarbon traps. Approximately 98% of our proved reserves in this field consisted of oil and NGLs which are gathered to several platforms located in water depths from 2 to 12 feet, with drilling and workover operations performed with rigs on barges.
In 2015 we did not drill any wells in Lake Washington, but we did perform numerous production enhancement operations including sliding sleeve changes, gas lift modifications and well stimulations.
Central Louisiana
Burr Ferry. This field is predominately located in Vernon Parish, Louisiana. The reserves are approximately 62% oil and NGLs.
South Bearhead Creek. This field is located in Beauregard Parish, Louisiana and is a large east-west trending anticline closure. Wells drilled in this field are completed in a multiple set of separate sands in the Wilcox formation.
On December 31, 2015, the Company entered into a purchase and sale agreement with Texegy LLC to sell to Texegy 75% of Swift Energy’s position in the South Bearhead Creek and Burr Ferry Fields. Refer to Note 9 of the consolidated financial statements in this Form 10-K for further discussion of this transaction.
Oil and Natural Gas Reserves
The following tables present information regarding proved reserves of oil and natural gas attributable to our interests in producing properties as of December 31, 2015, 2014 and 2013. The information set forth in the tables regarding reserves is based on proved reserves reports we have prepared in accordance with SEC rules. Our Chief Reservoir Engineer, the primary technical person responsible for overseeing the preparation of our 2015 reserves estimates, holds a bachelor's degree in geology, is a member of the Society of Petroleum Engineers and the Society of Professional Well Log Analysts, and has over 25 years of experience in petrophysical analysis, reservoir engineering, and reserves estimation. H.J. Gruy and Associates, Inc., Houston, Texas, independent petroleum engineers, has audited 99% of our proved reserves for the year ended December 31, 2015 and 97% of our proved reserves for the years ended December 31, 2014 and 2013. The audit by H.J. Gruy and Associates, Inc. conformed to the meaning of the term “reserves audit” as presented in Regulation S-K, Item 1202. The technical person at H.J. Gruy and Associates, Inc. primarily responsible for overseeing the audit, is a Licensed Professional Engineer, holds a degree in petroleum engineering, is past Chairman of the Gulf Coast Section of the Society of Petroleum Engineers, is past President of the Society of Petroleum Evaluation Engineers and has over 30 years of experience overseeing reserves audits. Based on their
7
audit, it is the judgment of H.J. Gruy and Associates, Inc. that Swift Energy used appropriate engineering, geologic, and evaluation principles and methods that are consistent with practices generally accepted in the petroleum industry.
The reserves estimation process involves members of the reserves and evaluation department who report to the Chief Reservoir Engineer as well as engineers whose duty is to prepare estimates of reserves in accordance with the Commission's rules, regulations and guidelines, and who are part of multi-disciplinary teams responsible for each of the Company's major core asset areas. The multi-disciplinary teams consist of experienced reservoir engineers, geologists and other oil and gas professionals. A majority of our asset team reservoir engineers involved in the reserves estimation process have over 10 years of reservoir engineering experience. The Chief Reservoir Engineer supervises this process with multiple levels of review and reconciliation of reserves estimates to ensure they conform to SEC guidelines. Reserves data is also reported to and reviewed by senior management and the Board of Directors on a periodic basis. At year-end, a reserves audit is performed by the third-party engineering firm, H.J. Gruy and Associates, Inc., to ensure the integrity and reasonableness of our reserves estimates. In addition, our independent Board members meet with H.J. Gruy and Associates, Inc. in executive session at least annually to review the annual reserves audit report and the overall reserves audit process.
A reserves audit and a financial audit are separate activities with unique and different processes and results. As currently defined by the U.S. Securities and Exchange Commission within Regulation S-K, Item 1202, a reserves audit is the process of reviewing certain of the pertinent facts interpreted and assumptions underlying a reserves estimate prepared by another party and the rendering of an opinion about the appropriateness of the methodologies employed, the adequacy and quality of the data relied upon, the depth and thoroughness of the reserves estimation process, the classification of reserves appropriate to the relevant definitions used, and the reasonableness of the estimated reserves quantities. A financial audit includes examining, on a test basis, evidence supporting the amounts and disclosures in the financial statements. A financial audit also includes assessing the accounting principles used and significant estimates made by management, as well as evaluating the overall financial statement presentation.
Estimates of future net revenues from our proved reserves and their PV-10 Value (a non-GAAP measure defined below), for the years ended December 31, 2015, 2014 and 2013 are made based on the preceding 12-months' average adjusted price after differentials based on closing prices on the first business day of each month, excluding the effects of hedging and are held constant, for that year's reserves calculation, throughout the life of the properties, except where such guidelines permit alternate treatment, including, in the case of natural gas contracts, the use of fixed and determinable contractual price escalations. We have interests in certain tracts that are estimated to have additional hydrocarbon reserves that cannot be classified as proved and are not reflected in the following tables.
The following prices are used to estimate our year-end PV-10 Value. The 12-month 2015 average adjusted prices after differentials for operations were $2.61 per Mcf of natural gas, $49.58 per barrel of oil, and $14.64 per barrel of NGL, compared to $4.32 per Mcf of natural gas, $93.64 per barrel of oil, and $33.00 per barrel of NGL for 2014 and $3.41 per Mcf of natural gas, $104.38 per barrel of oil, and $31.68 per barrel of NGL for 2013.
8
The following tables set forth estimates of future net revenues presented on the basis of unescalated prices and costs in accordance with criteria prescribed by the SEC and their PV-10 Value as of December 31, 2015, 2014 and 2013. Operating costs, development costs, asset retirement obligation costs, and certain production-related taxes were deducted in arriving at the estimated future net revenues. No provision was made for income taxes. The estimates of future net revenues and their present value differ in this respect from the standardized measure of discounted future net cash flows set forth in supplemental information to our consolidated financial statements (the "Standardized Measure"), which is calculated after provision for future income taxes.
At December 31, 2015, we had estimated proved reserves of 70.3 MMBoe with a PV-10 Value of $374 million. This is a decrease of approximately 124 MMBoe from year-end 2014 proved reserves due to the impact of lower commodity prices and uncertainties, due in part to our bankruptcy filing, surrounding the availability of the financing that would be necessary to develop our proved undeveloped reserves. Our total proved reserves at December 31, 2015 were approximately 14% crude oil, 74% natural gas, and 12% NGLs, while 80% of our total proved reserves were developed. Approximately 90% of our proved reserves are located in Texas with the remainder in Louisiana. The following amounts shown in MBoe below are based on a natural gas conversion factor of 6 Mcf to 1 Boe:
Estimated Proved Natural Gas, Oil and NGL Reserves | As of December 31, | |||||||||||
2015 | 2014 | 2013 | ||||||||||
Natural gas reserves (MMcf): | ||||||||||||
Proved developed | 238,356 | 232,807 | 197,816 | |||||||||
Proved undeveloped (3) | 73,332 | 453,940 | 617,309 | |||||||||
Total | 311,688 | 686,747 | 815,125 | |||||||||
Oil reserves (MBbl): | ||||||||||||
Proved developed | 10,109 | 14,989 | 16,884 | |||||||||
Proved undeveloped (3) | — | 34,717 | 36,110 | |||||||||
Total | 10,109 | 49,706 | 52,994 | |||||||||
NGL reserves (MBbl): | ||||||||||||
Proved developed | 6,500 | 12,495 | 13,059 | |||||||||
Proved undeveloped (3) | 1,716 | 17,168 | 17,320 | |||||||||
Total | 8,216 | 29,663 | 30,379 | |||||||||
Total Estimated Reserves (MBoe) (1)(3) | 70,273 | 193,826 | 219,227 | |||||||||
Estimated Discounted Present Value of Proved Reserves (in millions) | ||||||||||||
Proved developed | $ | 321 | $ | 954 | $ | 1,028 | ||||||
Proved undeveloped | 53 | 990 | 1,397 | |||||||||
PV-10 Value (2) | $ | 374 | $ | 1,944 | $ | 2,425 | ||||||
(1) The 2015 and 2014 reserve volumes exclude natural gas consumed in operations. For additional discussion of this methodology refer to the Supplementary Reserves Information of this Form 10-K.
(2) The PV-10 Values as of December 31, 2015, 2014 and 2013 are net of $57.8 million, $85.5 million, and $87.0 million of asset retirement obligation liabilities, respectively.
(3) The decrease in 2015 reserves volumes is due to the impact of lower commodity prices and uncertainties, due in part to our bankruptcy filing, surrounding the availability of the financing that would be necessary to develop our proved undeveloped reserves.
.
Proved reserves are estimates of hydrocarbons to be recovered in the future. Reserves estimation is a subjective process of estimating the sizes of underground accumulations of oil and natural gas that cannot be measured in an exact way. The accuracy of any reserves estimate is a function of the quality of available data and of engineering and geological interpretation and judgment. Reserves reports of other engineers might differ from the reports contained herein. Results of drilling, testing, and production subsequent to the date of the estimate may justify revision of such estimates. Future prices received for the sale of oil and natural gas may be different from those used in preparing these reports. The amounts and timing of future operating and development costs may also differ from those used. Accordingly, reserves estimates are often different from the quantities of oil and natural gas that are ultimately recovered. There can be no assurance that these estimates are accurate predictions of the present value of future net cash flows from oil and natural gas reserves.
PV-10 Value is a non-GAAP measure. The closest GAAP measure to the PV-10 Value is the Standardized Measure. We believe the PV-10 Value is a useful supplemental disclosure to the Standardized Measure because the PV-10 Value is a widely used measure within the industry and is commonly used by securities analysts, banks and credit rating agencies to evaluate the
9
value of proved reserves on a comparative basis across companies or specific properties. We use the PV-10 Value in our ceiling test computations, for comparison against our debt balances, to evaluate properties that are bought and sold and to assess the potential return on investment in our oil and gas properties. PV-10 Value is not a measure of financial or operating performance under GAAP, nor should it be considered in isolation or as a substitute for the Standardized Measure. Our PV-10 Value and the Standardized Measure do not purport to represent the fair value of our oil and natural gas reserves.
10
The following table provides a reconciliation between the PV-10 Value and the Standardized Measure.
As of December 31, | |||||||||||
(in millions) | 2015 | 2014 | 2013 | ||||||||
PV-10 Value | $ | 374 | $ | 1,944 | $ | 2,425 | |||||
Future income taxes (discounted at 10%) | — | (292 | ) | (423 | ) | ||||||
Standardized Measure of Discounted Future Net Cash Flows relating to oil and natural gas reserves | $ | 374 | $ | 1,652 | $ | 2,002 | |||||
Proved Undeveloped Reserves
The following table sets forth the aging of our proved undeveloped reserves as of December 31, 2015:
Year Added | Volume (MMBoe) | % of PUD Volumes | |||
2015 | 0.0 | — | % | ||
2014 | 5.2 | 38 | % | ||
2013 | 8.7 | 62 | % | ||
2012 | 0.0 | — | % | ||
2011 | 0.0 | — | % | ||
Total | 13.9 | 100 | % | ||
During 2015, our proved undeveloped reserves decreased by approximately 114 MMBoe due to the impact of lower commodity prices and uncertainties , due in part to our bankruptcy filing, surrounding the availability of the financing that would be necessary to develop our proved undeveloped reserves, as disclosed in Note 1A of the consolidated financial statements in this Form 10-K. We also incurred approximately $47 million in capital expenditures during the year which resulted in the conversion of 15 MMBoe of our December 31, 2014 proved undeveloped reserves to proved developed reserves, primarily in the Fasken field.
The PV-10 Value from our proved undeveloped reserves was $53.0 million at December 31, 2015, which was approximately 14% of our total PV-10 Value of $374.0 million. The PV-10 Value of our proved undeveloped reserves, by year of booking was 26% in 2014 and 74% in 2013.
Sensitivity of Reserves to Pricing
As of December 31, 2015, a 5% increase in oil and NGL pricing would increase our total estimated proved reserves of 70.3 MMBoe by approximately 0.7 MMBoe, and would increase the PV-10 Value of $374.0 million by approximately $18 million. Similarly, a 5% decrease in oil and NGL pricing would decrease our total estimated proved reserves by approximately 0.8 MMBoe and would decrease the PV-10 Value by approximately $18 million.
As of December 31, 2015, a 5% increase in natural gas pricing would increase our total estimated proved reserves by approximately 1.0 MMBoe and would increase the PV-10 Value by approximately $22 million. Similarly, a 5% decrease in natural gas pricing would decrease our total estimated proved reserves by approximately 1.1 MMBoe and would decrease the PV-10 Value by approximately $21 million.
11
Oil and Gas Wells
The following table sets forth the total gross and net wells in which we owned an interest at the following dates:
Oil Wells | Gas Wells | Total Wells(1) | ||||||
December 31, 2015 | ||||||||
Gross | 327 | 729 | 1,056 | |||||
Net | 308.9 | 682.7 | 991.6 | |||||
December 31, 2014 | ||||||||
Gross | 348 | 717 | 1,065 | |||||
Net | 330.3 | 673.9 | 1,004.2 | |||||
December 31, 2013 | ||||||||
Gross | 345 | 719 | 1,064 | |||||
Net | 325.1 | 701.2 | 1,026.3 | |||||
(1) | Excludes 48, 49 and 60 service wells in 2015, 2014 and 2013. |
Oil and Gas Acreage
The following table sets forth the developed and undeveloped leasehold acreage held by us at December 31, 2015:
Developed | Undeveloped | ||||||||||
Gross | Net | Gross | Net | ||||||||
Colorado | — | — | 47,713 | 42,509 | |||||||
Louisiana (1) | 116,909 | 103,574 | 79,104 | 66,002 | |||||||
Texas (2) | 68,518 | 64,147 | 38,360 | 35,466 | |||||||
Wyoming | — | — | 3,092 | 1,521 | |||||||
Total | 185,427 | 167,721 | 168,269 | 145,498 | |||||||
(1) | The Company holds the fee mineral (royalty) interest in a portion of the acreage located in Central Louisiana. The above table includes acreage where Swift Energy is the fee mineral owner as well as a working interest owner. This acreage included in the above table totals 66,073 gross and net undeveloped acres and 20,174 gross and net developed acres. The Company also owns fee mineral interest in approximately 16,295 acres that are currently unleased and not included in the table above. Swift owns a total of 86,247 mineral acres. |
(2) | In South Texas a substantial portion of our Eagle Ford and Olmos acreage overlaps. In most cases the Eagle Ford and Olmos rights are contracted under separate lease agreements. For the purposes of the above table, a surface acre where we have leased both the Eagle Ford and Olmos rights is counted as a single acre. Acreage which is developed in any formation is counted in the developed acreage above, even though there may also be undeveloped acreage in other formations. In the Eagle Ford, we have 36,994 gross and 30,270 net developed acres and 47,308 gross and 39,310 net undeveloped acres. A large portion of our undeveloped Eagle Ford acreage underlies developed Olmos acreage. In the Olmos, we have 50,276 gross and 46,877 net developed acres and 26,169 gross and 22,801 net undeveloped acres. |
As of December 31, 2015, Swift Energy's net undeveloped acreage subject to expiration over the next three years, if not renewed, is approximately 14% in 2016, 26% in 2017 and 14% in 2018. In most cases, acreage scheduled to expire can be held through drilling operations or we can exercise extension options. As of February 29, 2016, 2,643 net undeveloped acres have expired during the current year. The exploration potential of all undeveloped acreage is fully evaluated before expiration. In each fiscal year where undeveloped acreage is subject to expiration our intent is to reduce the expirations through either development or extensions, if we believe it is commercially advantageous to do so. Due to the bankruptcy proceedings and depressed commodity prices, it is possible that we may not have the ability to do so.
12
Drilling and Other Exploratory and Development Activities
The following table sets forth the results of our drilling activities during the years ended December 31, 2015, 2014 and 2013:
Gross Wells | Net Wells | |||||||||||||||||||
Year | Type of Well | Total | Producing | Dry | Total | Producing | Dry | |||||||||||||
2015 | Exploratory | — | — | — | — | — | — | |||||||||||||
Development | 24 | 24 | — | 17.1 | 17.1 | — | ||||||||||||||
2014 | Exploratory | — | — | — | — | — | — | |||||||||||||
Development | 36 | 36 | — | 31.5 | 31.5 | — | ||||||||||||||
2013 | Exploratory | 1 | — | 1 | 1.0 | — | 1.0 | |||||||||||||
Development | 47 | 46 | 1 | 45.0 | 44.0 | 1.0 | ||||||||||||||
Present Activities
As of December 31, 2015, we were in the process of drilling one development well in our Fasken field which has a 64% working interest. In the first quarter of 2016, we have begun the process of conducting completion operations for 12 wells (approximately 9 net wells) drilled during the third and fourth quarters of 2015.
We are also currently developing and implementing a number of operational cost reduction initiatives, including a plan to reconfigure the production gathering system in the Lake Washington field to consolidate production into one platform. We are also planning to temporarily shut in a number of our wells with marginal production. Implementation of these initiatives, in addition to other initiatives being planned, is expected to result in significant operating expense reductions.
Operations
We generally seek to be the operator of the wells in which we have a significant economic interest. As operator, we design and manage the development of a well and supervise operation and maintenance activities on a day-to-day basis. We do not own drilling rigs or other oil field services equipment used for drilling or maintaining wells on properties we operate. Independent contractors supervised by us provide this equipment and personnel. We employ drilling, production, and reservoir engineers, geologists, and other specialists who work to improve production rates, increase reserves, and lower the cost of operating our oil and natural gas properties.
Operations on our oil and natural gas properties are customarily conducted in accordance with COPAS guidelines. We charge a monthly per-well supervision fee to the wells we operate including our wells in which we own up to a 100% working interest. Supervision fees vary widely depending on the geographic location and depth of the well and whether the well produces oil or natural gas. The fees for these activities in 2015 totaled $9.2 million and ranged from $250 to $2,029 per well per month.
Marketing of Production
We typically sell our oil and natural gas production at market prices near the wellhead or at a central point after gathering and/or processing. We usually sell our natural gas in the spot market on a monthly basis, while we sell our oil at prevailing market prices. We do not refine any oil we produce. For the years ended December 31, 2015, 2014 and 2013, Shell Oil Company and affiliates accounted for 16%, 21% and 33% of our total oil and gas gross receipts, respectively. Kinder Morgan, Plains Marketing and Howard Energy accounting for approximately 27%, 18% and 13% of our total oil and gas gross receipts in 2015, respectively. Kinder Morgan and Plains Marketing accounted for approximately 20% and 11% of our total oil and gas gross receipts in 2014, while BP America accounted for approximately 21% of our total oil and gas gross receipts in 2013. Credit losses in each of the last three years were immaterial.
We have gas processing and gathering agreements with Southcross Energy for a majority of our natural gas production in the AWP area. Other gas production in the AWP area is processed or transported under arrangements with DCP Midstream and Enterprise. Oil production is transported to market by truck and sold at prevailing market prices.
13
We have a gathering agreement with Howard Energy providing for the transportation of our Eagle Ford production on the pipeline from Fasken to Kinder Morgan Texas Pipeline or Eagle Ford Midstream, where it is sold at prices tied to monthly and daily natural gas price indices. At Fasken, we also have a connection with the Navarro gathering system into which we may deliver natural gas from time to time.
We have an agreement with Eagle Ford Gathering LLC that provides for the gathering and processing for almost all of our natural gas production in the Artesia Wells area. Natural gas in the area can also be delivered to the Targa (formerly Atlas) system for processing and transportation to downstream markets. In the Artesia Wells area, our oil production is sold at prevailing market prices and transported to market by truck.
Oil production from the Lake Washington field is either delivered into ExxonMobil's crude oil pipeline system or transported on barges for sales to various purchasers at prevailing market prices. Historically, our natural gas production from this field is either consumed on the lease or is delivered to High Point Gas Transmission (successor to El Paso's Southern Natural Gas Company) pipeline system and the processing of natural gas occurs at the Toca Plant.
Oil production from the Burr Ferry and South Bearhead Creek fields is sold to various purchasers at prevailing market prices. Our natural gas production from the Burr Ferry field is processed under long term gas processing contracts with Energy Transfer (successor in interest to Eagle Rock Operating, LLC.) South Bearhead Creek natural gas production is sold into the interstate market on Trunkline Gas Company's pipeline at prevailing market prices.
The prices in the tables below do not include the effects of hedging. Quarterly prices and hedge adjusted pricing are detailed under “Results of Operations – Revenues” in “Management's Discussion and Analysis of Financial Condition and Results of Operations” in this Form 10-K.
The following table summarizes sales volumes, sales prices, and production cost information for our net oil, NGL and natural gas production for the years ended December 31, 2015, 2014 and 2013.
Year Ended December 31, | ||||||||||||
All Fields | 2015 | 2014 | 2013 | |||||||||
Net Sales Volume: | ||||||||||||
Oil (MBbls) | 2,406 | 3,511 | 3,926 | |||||||||
Natural Gas Liquids (MBbls) | 1,433 | 1,812 | 2,320 | |||||||||
Natural gas (MMcf) (1) | 43,839 | 38,499 | 29,672 | |||||||||
Total (MBoe) | 11,146 | 11,740 | 11,191 | |||||||||
Average Sales Price: | ||||||||||||
Oil (Per Bbl) | $ | 47.11 | $ | 92.74 | $ | 103.42 | ||||||
Natural Gas Liquids (Per Bbl) | $ | 14.54 | $ | 31.83 | $ | 31.39 | ||||||
Natural gas (Per Mcf) | $ | 2.56 | $ | 4.27 | $ | 3.70 | ||||||
Total (Per Boe) | $ | 22.09 | $ | 46.66 | $ | 52.29 | ||||||
Average Production Cost (Per Boe sold) (2) | $ | 8.25 | $ | 9.74 | $ | 11.08 | ||||||
(1) Excludes natural gas consumed in operations that is included in reported production volumes of 3,487 MMcf in 2015, 3,884 MMcf in 2014 and 3,325 MMcf in 2013.
(2) Average production cost includes transportation and gas processing costs but excludes severance and ad valorem taxes.
14
The following table provides a summary of our sales volumes, average sales prices, and average production costs for our fields with proved reserves greater than 15% of total proved reserves. These fields account for approximately 83% of the Company's proved reserves based on total Boe as of December 31, 2015:
Year Ended December 31, | ||||||||||||
Fasken | 2015 | 2014 | 2013 | |||||||||
Net Sales Volume: | ||||||||||||
Oil (MBbls) | — | — | — | |||||||||
Natural Gas Liquids (MBbls) | 2 | 3 | 3 | |||||||||
Natural gas (MMcf) (1) | 28,598 | 20,738 | 8,457 | |||||||||
Total (MBoe) | 4,769 | 3,459 | 1,413 | |||||||||
Average Sales Price: | ||||||||||||
Oil (Per Bbl) | $ | — | $ | — | $ | — | ||||||
Natural Gas Liquids (Per Bbl) | $ | 16.66 | $ | 32.44 | $ | 35.59 | ||||||
Natural gas (Per Mcf) | $ | 2.52 | $ | 4.20 | $ | 3.57 | ||||||
Total (Per Boe) | $ | 15.12 | $ | 25.22 | $ | 21.46 | ||||||
Average Production Cost (Per Boe sold) (2) | $ | 3.20 | $ | 3.77 | $ | 4.34 | ||||||
(1) Excludes natural gas consumed in operations that is included in reported production volumes of 434 MMcf in 2015, 636 MMcf in 2014 and 360 MMcf in 2013.
(2) Average production cost includes transportation and gas processing costs but excludes severance and ad valorem taxes.
Year Ended December 31, | ||||||||||||
AWP | 2015 | 2014 | 2013 | |||||||||
Net Sales Volume: | ||||||||||||
Oil (MBbls) | 1,047 | 1,655 | 1,421 | |||||||||
Natural Gas Liquids (MBbls) | 843 | 968 | 1,068 | |||||||||
Natural gas (MMcf) (1) | 10,372 | 10,753 | 10,359 | |||||||||
Total (MBoe) (3) | 3,618 | 4,415 | 4,216 | |||||||||
Average Sales Price: | ||||||||||||
Oil (Per Bbl) | $ | 45.37 | $ | 89.86 | $ | 100.42 | ||||||
Natural Gas Liquids (Per Bbl) | $ | 14.79 | $ | 30.72 | $ | 30.72 | ||||||
Natural gas (Per Mcf) | $ | 2.62 | $ | 4.31 | $ | 3.72 | ||||||
Total (Per Boe) | $ | 24.07 | $ | 50.91 | $ | 50.78 | ||||||
Average Production Cost (Per Boe sold) (2) | $ | 8.64 | $ | 8.98 | $ | 10.50 | ||||||
(1) Excludes natural gas consumed in operations that is included in reported production volumes of 1,574 MMcf in 2015, 1,327 MMcf in 2014 and 1,097 MMcf in 2013.
(2) Average production cost includes transportation and gas processing costs but excludes severance and ad valorem taxes.
(3) AWP Eagle Ford sales accounted for approximately 69%, 67% and 48% of total BOE sales in 2015, 2014 and 2013, respectively.
Risk Management
Our operations are subject to all of the risks normally incident to the exploration for and the production of oil and natural gas, including blowouts, cratering, pipe failure, casing collapse, fires, and adverse weather conditions, each of which could result in severe damage to or destruction of oil and natural gas wells, production facilities or other property, or individual injuries. The oil and natural gas exploration business is also subject to environmental hazards, such as oil spills, natural gas leaks, and ruptures and discharges of toxic substances or gases that could expose us to substantial liability due to pollution and other environmental damage. We maintain comprehensive insurance coverage, including general liability insurance, operators extra expense insurance, and property damage insurance. Our standing Insurable Risk Advisory Team, which includes individuals from operations, drilling,
15
facilities, legal, HSE and finance meets regularly to evaluate risks, review property values, review and monitor claims, review market conditions and assist with the selection of coverages. We believe that our insurance is adequate and customary for companies of a similar size engaged in comparable operations, but if a significant accident or other event occurs that is uninsured or not fully covered by insurance, it could adversely affect us. Refer to “Item 1A. Risk Factors” of this Form 10-K for more details and for discussion of other risks.
Commodity Risk
The oil and gas industry is affected by the volatility of commodity prices. Realized commodity prices received for such production are primarily driven by the prevailing worldwide price for crude oil and spot prices applicable to natural gas. From time to time in the past, to a limited extent we have used derivative instruments to protect against declines in oil and natural gas prices. There were no unsettled derivative assets and no unsettled derivative liabilities at December 31, 2015 as all outstanding hedge agreements had settled as of year-end. For additional discussion related to our price-risk policy, refer to Note 5 of the consolidated financial statements in this Form 10-K.
Competition
We operate in a highly competitive environment, competing with major integrated and independent energy companies for desirable oil and natural gas properties, as well as for equipment, labor, and materials required to develop and operate such properties. Many of these competitors have financial and technological resources substantially greater than ours. The market for oil and natural gas properties is highly competitive and we may lack technological information or expertise available to other bidders. We may incur higher costs or be unable to acquire and develop desirable properties at costs we consider reasonable because of this competition. Our ability to replace and expand our reserves base depends on our continued ability to attract and retain quality personnel and identify and acquire suitable producing properties and prospects for future drilling and acquisition.
Employees
As of December 31, 2015, the Company employed 228 people. None of our employees were represented by a union and relations with employees are considered to be good.
Facilities
At December 31, 2015, we occupied approximately 119,000 square feet of office space at 17001 Northchase Drive, Houston, Texas. For discussion regarding the term and obligations of this lease refer to Note 6 of the consolidated financial statements in this Form 10-K.
Available Information
Our annual reports on Form 10-K, quarterly reports on Form 10-Q, current reports on Form 8-K, amendments to those reports, changes in and stock ownership of our directors and executive officers, together with other documents filed with the Securities and Exchange Commission under the Securities Exchange Act can be accessed free of charge on our web site at www.swiftenergy.com as soon as reasonably practicable after we electronically file these reports with the SEC. All exhibits and supplemental schedules to these reports are available free of charge through the SEC web site at www.sec.gov. In addition, we have adopted a Code of Ethics for Senior Financial Officers and the Principal Executive Officers. We have posted this Code of Ethics on our website, where we also intend to post any waivers from or amendments to this Code of Ethics.
16
Item 1A. Risk Factors
Risks Related to Bankruptcy:
We are subject to risks and uncertainties associated with our Chapter 11 proceedings.
On December 31, 2015, the Company along with eight of its subsidiaries, including Swift Energy International, Inc., Swift Energy Group, Inc., Swift Energy USA, Inc., Swift Energy Alaska, Inc., Swift Energy Operating, LLC, GASRS LLC, SWENCO-Western, LLC and Swift Energy Exploration Services, Inc., filed voluntary petitions seeking relief under Chapter 11 of the United States Bankruptcy Code. The Chapter 11 bankruptcy proceedings do not include our international subsidiaries, which are 100% owned by our domestic subsidiary Swift Energy International, Inc.
Our operations and ability to develop and execute our business plan, our financial condition, our liquidity and our continuation as a going concern, are subject to the risks and uncertainties associated with our bankruptcy. These risks include the following:
• | our ability to prosecute, confirm and consummate a plan of reorganization with respect to the Chapter 11 proceedings; |
• | the high costs of bankruptcy proceedings and related fees; |
• | our ability to obtain sufficient financing to allow us to emerge from bankruptcy and execute our business plan post-emergence; |
• | our ability to maintain our relationships with our suppliers, service providers, customers, employees, and other third parties; |
• | our ability to maintain contracts that are critical to our operations; |
• | our ability to execute our business plan in the current depressed commodity price environment; |
• | our ability to attract, motivate and retain key employees; |
• | the ability of third parties to seek and obtain court approval to terminate contracts and other agreements with us; |
• | the ability of third parties to seek and obtain court approval to convert the Chapter 11 proceedings to a Chapter 7 proceeding; and |
• | the actions and decisions of our creditors and other third parties who have interests in our Chapter 11 proceedings that may be inconsistent with our plans. |
Delays in our Chapter 11 proceedings increase the risks of our being unable to reorganize our business and emerge from bankruptcy and increase our costs associated with the bankruptcy process.
These risks and uncertainties could affect our business and operations in various ways. For example, negative events or publicity associated with our Chapter 11 proceedings could adversely affect our relationships with our suppliers, service providers, customers, employees, and other third parties, which in turn could adversely affect our operations and financial condition. Also, pursuant to the Bankruptcy Code, we need the prior approval of the Bankruptcy Court for transactions outside the ordinary course of business, which may limit our ability to respond timely to certain events or take advantage of certain opportunities. We also need Bankruptcy Court confirmation of the Plan. Because of the risks and uncertainties associated with our Chapter 11 proceedings, we cannot accurately predict or quantify the ultimate impact that events that occur during our Chapter 11 proceedings will have on our business, financial condition and results of operations, and there is no certainty as to our ability to continue as a going concern.
We may not be able to obtain confirmation of a Chapter 11 plan of reorganization.
To emerge successfully from Bankruptcy Court protection as a viable entity, we must meet certain statutory requirements with respect to adequacy of disclosure with respect to a Chapter 11 plan of reorganization, solicit and obtain the requisite acceptances of such a reorganization plan and fulfill other statutory conditions for confirmation of such a plan. Although the Bankruptcy Court has approved a disclosure statement with respect to the Plan and solicitation of the Plan has commenced, solicitation is not complete and other requirements and statutory conditions necessary for confirmation of the Plan have not yet been satisfied. While a confirmation hearing on the Plan has been scheduled on March 30, 2016, it is possible that hearing could be delayed. It is also possible that the Bankruptcy Court will not confirm the Plan.
Creditors may not vote in favor of our Plan, and certain parties in interest may file objections to the Plan in an effort to persuade the Bankruptcy Court that we have not satisfied the confirmation requirements under section 1129 of the Bankruptcy Code. Even if no objections are filed and the requisite acceptances of our Plan are received from creditors entitled to vote on the Plan, the Bankruptcy Court, which can exercise substantial discretion, may not confirm the Plan. The precise requirements and evidentiary showing for confirming a plan, notwithstanding its rejection by one or more impaired classes of claims or equity interests, depends
17
upon a number of factors including, without limitation, the status and seniority of the claims or equity interests in the rejecting class (i.e., secured claims or unsecured claims, subordinated or senior claims, preferred or common stock).
If the Plan is not confirmed by the Bankruptcy Court, it is unclear whether we would be able to reorganize our business and what, if anything, holders of claims against us would ultimately receive with respect to their claims.
Even if a Chapter 11 Plan of Reorganization is consummated, we may not be able to achieve our stated goals and continue as a going concern.
Even if the Plan or another Chapter 11 plan of reorganization is consummated, we will continue to face a number of risks, including further deterioration in commodity prices or other changes in economic conditions, changes in our industry, changes in demand for our oil and gas and increasing expenses. Accordingly, we cannot guarantee that the Plan or any other Chapter 11 plan of reorganization will achieve our stated goals.
Furthermore, even if our debts are reduced or discharged through the Plan, we may need to raise additional funds through public or private debt or equity financing or other various means to fund our business after the completion of our Chapter 11 proceedings. Our access to additional financing is, and for the foreseeable future will likely continue to be, extremely limited, if it is available at all. Therefore, adequate funds may not be available when needed or may not be available on favorable terms, if they are available at all.
Our ability to continue as a going concern is dependent upon our ability to raise additional capital. As a result, we cannot give any assurance of our ability to continue as a going concern, even if the Plan is confirmed.
We have substantial liquidity needs and may not be able to obtain sufficient liquidity to confirm a plan of reorganization and exit bankruptcy.
Although we have lowered our capital budget and reduced the scale of our operations significantly, our business remains capital intensive. In addition to the cash requirements necessary to fund ongoing operations, we have incurred significant professional fees and other costs in connection with our Chapter 11 proceedings and expect that we will continue to incur significant professional fees and costs throughout our Chapter 11 proceedings. While we entered into a Debtor-in-Possession (DIP) Credit Agreement in connection with the Chapter 11 filings, which provides for a multi-draw term loan in an aggregate amount of up to $75.0 million, as of the date hereof, we have not received a commitment for any additional interim financing or exit financing. Furthermore, our ability to access $45.0 million of the funds available under the DIP Credit Agreement is contingent on our ability to successfully amend and restate or refinance our current $330.0 million revolving credit facility and secure exit financing. Even if we are able to amend and restate or refinance our current revolving credit facility, we do not anticipate any additional liquidity we receive from such an amendment and restatement or refinancing to be substantial.
We do not believe that our borrowings under the DIP Credit Agreement, our cash on hand and our cash flow from operations will be sufficient to continue to fund our operations for any significant period of time. There are no assurances that our current liquidity is sufficient to allow us to satisfy our obligations related to the Chapter 11 proceedings, allow us to proceed with the confirmation of a Chapter 11 plan of reorganization and allow us to emerge from bankruptcy. We can provide no assurance that we will be able to secure additional interim financing or exit financing sufficient to meet our liquidity needs or, if sufficient funds are available, offered to us on acceptable terms.
In certain instances, a Chapter 11 case may be converted to a case under Chapter 7 of the Bankruptcy Code.
Upon a showing of cause, the Bankruptcy Court may convert our Chapter 11 case to a case under Chapter 7 of the Bankruptcy Code. In such event, a Chapter 7 trustee would be appointed or elected to liquidate our assets for distribution in accordance with the priorities established by the Bankruptcy Code. We believe that liquidation under Chapter 7 would result in significantly smaller distributions being made to our creditors than those provided for in our Plan because of (i) the likelihood that the assets would have to be sold or otherwise disposed of in a distressed fashion over a short period of time rather than in a controlled manner and as a going concern, (ii) additional administrative expenses involved in the appointment of a Chapter 7 trustee, and (iii) additional expenses and claims, some of which would be entitled to priority, that would be generated during the liquidation and from the rejection of leases and other executory contracts in connection with a cessation of operations.
We believe it is highly likely that the shares of our existing common stock will be canceled in our Chapter 11 proceedings.
18
The Plan provides, among other things, that upon our emergence from bankruptcy, our existing common stock will be canceled and the holders of our existing common stock will receive four percent of the our post-emergence common stock plus warrants. If the Plan confirmed by the Bankruptcy Court, the existing shareholders’ post-emergence shares of common stock and warrants may be subject to further dilution due to subsequent capital raising activities. Additionally, the Plan may not be confirmed by the Bankruptcy Court, in which case, the chance that the existing shareholders will receive little or no distribution in our Chapter 11 proceedings would increase. Accordingly, any trading in shares of our common stock during the pendency of the Chapter 11 proceedings is highly speculative.
We may be subject to claims that will not be discharged in our Chapter 11 proceedings, which could have a material adverse effect on our financial condition and results of operations.
The Bankruptcy Code provides that the confirmation of a Chapter 11 plan of reorganization discharges a debtor from substantially all debts arising prior to confirmation. With few exceptions, all claims that arose prior to confirmation of the plan of reorganization (i) would be subject to compromise and/or treatment under the plan of reorganization and (ii) would be discharged in accordance with the Bankruptcy Code and the terms of the plan of reorganization. Any claims not ultimately discharged through a Chapter 11 plan of reorganization could be asserted against the reorganized entities and may have an adverse effect on our financial condition and results of operations on a post-reorganization basis.
Our financial results may be volatile and may not reflect historical trends.
During the Chapter 11 proceedings, we expect our financial results to continue to be volatile as asset impairments, asset dispositions, restructuring activities and expenses, contract terminations and rejections, and claims assessments may significantly impact our consolidated financial statements. As a result, our historical financial performance is likely not indicative of our financial performance after the date of the bankruptcy filing.
In addition, if we emerge from Chapter 11, the amounts reported in subsequent consolidated financial statements may materially change relative to historical consolidated financial statements, including as a result of revisions to our operating plans pursuant to a plan of reorganization. We also may be required to adopt fresh start accounting, in which case our assets and liabilities will be recorded at fair value as of the fresh start reporting date, which may differ materially from the recorded values of assets and liabilities on our consolidated balance sheets. Our financial results after the application of fresh start accounting also may be different from historical trends.
Transfers of our equity, or issuances of equity in connection with our Chapter 11 proceedings, may impair our ability to utilize our federal income tax net operating loss carryforwards and depreciation, depletion and amortization deductions in future years.
Under federal income tax law, a corporation is generally permitted to deduct from taxable income net operating losses carried forward from prior years. We have net operating loss carryforwards of approximately $822 million as of December 31, 2015. Our ability to utilize our net operating loss carryforwards to offset future taxable income and to reduce federal income tax liability is subject to certain requirements and restrictions. If we experience an “ownership change,” as defined in section 382 of the Internal Revenue Code, then our ability to use our net operating loss carryforwards and amortizable tax basis in our properties may be substantially limited, which could have a negative impact on our financial position and results of operations. Generally, there is an “ownership change” if one or more stockholders owning 5% or more of a corporation’s common stock have aggregate increases in their ownership of such stock of more than 50 percentage points over the prior three-year period. Following the implementation a plan of reorganization, it is possible that an “ownership change” may be deemed to occur. Under section 382 of the Internal Revenue Code, absent an applicable exception, if a corporation undergoes an “ownership change,” the amount of its net operating losses that may be utilized to offset future taxable income generally is subject to an annual limitation. Further, future deductions for depreciation, depletion and amortization could be limited if the fair value of our assets is determined to be less than the tax basis.
Risks Related to the Business:
Commodity prices have dropped substantially and rapidly since September 2014. Oil and natural gas prices are highly volatile. Continued low prices or their further downward movement could threaten our ability to emerge from bankruptcy and implement our business plan.
Our future revenues, net income, cash flow, and the value of our oil and natural gas properties depend primarily upon the prices we receive for our oil and natural gas production. Our borrowing capacity and ability to obtain additional capital is also
19
dependent on oil and natural gas prices. Oil and natural gas prices have dropped precipitously over the past year and have fallen to their lowest level in 13 years.
Continued low price levels or further decreases in price levels for oil and natural gas could negatively affect us in several ways, including:
• | impair our ability to obtain funds to operate our business and implement our business plan; |
• | our cash flow would be reduced, decreasing funds available for capital, operating and administrative expenditures; |
• | a substantial number of reserves would no longer be economic to produce, leading to both lower cash flow and lower proved reserves; and |
• | require further future write-downs of our oil and gas properties. |
Insufficient capital could lead to declines in our cash flow or in our oil and natural gas reserves, or a loss of properties.
The oil and natural gas industry is capital intensive. Although our 2015 total capital expenditures, including expenditures for leasehold acquisitions, drilling and infrastructure, were approximately $104 million, our 2016 capital expenditure budget has been reduced to $78.0 million. Cash flow from operations is a principal source of our financing of our future capital expenditures. Insufficient cash flow from operations and inability to access capital could lead to losing leases that require us to drill new wells in order to maintain the lease. Lower liquidity and other capital constraints may make it difficult to drill those wells prior to the lease expiration dates, which could result in our losing reserves and production.
If low commodity prices continue for an extended period, our liquidity would be significantly reduced.
While we anticipate substantially all of our $906 million of long-term unsecured indebtedness will be discharged upon confirmation of our Plan, we will continue to have substantial capital needs upon emergence from bankruptcy, including in connection with our existing secured indebtedness and the continued development of our operations. As a result, we will need additional capital in the future to fund our operations and implement our business plan. An extended period of low commodity prices would substantially reduce our cash flows and would likely reduce liquidity to a level that would make it increasingly difficult to operate our business.
We have written down the carrying values on our oil and gas properties in 2013, 2014 and 2015 and expect to incur additional write-downs in the future.
The SEC accounting rules require that on a quarterly basis we review the carrying value of our oil and natural gas properties for possible write-down or impairment (the "ceiling test"). Any capital costs in excess of the ceiling amount must be permanently written down. For the years ended December 31, 2015, 2014 and 2013, we reported non-cash write-downs on a before-tax basis of, $1.6 billion ($1.5 billion after-tax), $445.4 million ($287.3 million after-tax) and $46.9 million ($30.0 million after-tax) respectively, on our oil and gas properties. If oil and natural gas prices remain at their current low levels or decline further from the prices used in calculating the fourth quarter of 2015 ceiling test, we anticipate that we will be required to record additional non-cash write-downs of oil and gas properties in the first quarter of 2016. Refer to Note 1 of the consolidated financial statements in this Form 10-K for further discussion of the ceiling test calculation.
Estimates of proved reserves are uncertain, and revenues from production may vary significantly from expectations.
The quantities and values of our proved reserves included in our 2015 estimates of proved reserves are only estimates and subject to numerous uncertainties. The accuracy of any reserves estimate is a function of the quality of available data and of engineering and geological interpretation. These estimates depend on assumptions regarding quantities and production rates of recoverable oil and natural gas reserves, future prices for oil and natural gas, timing and amounts of development expenditures and operating expenses, all of which will vary from those assumed in our estimates. If the variances in these assumptions are significant, many of which are based upon extrinsic events we cannot control, they could significantly affect these estimates and could result in the actual amounts of oil and natural gas ultimately recovered and future net cash flows being materially different from the estimates in our reserves reports. These estimates may not accurately predict the present value of future net cash flows from our oil and natural gas reserves.
Federal legislation and state legislative and regulatory initiatives relating to hydraulic fracturing could result in increased costs and additional operating restrictions or delays.
Hydraulic fracturing using fluids other than diesel is currently exempt from regulation under the federal Safe Drinking Water Act, but opponents of hydraulic fracturing have called for further study of the technique's environmental effects and, in some
20
cases, a moratorium on the use of the technique. Various committees of Congress have been investigating hydraulic fracturing practices and several proposals have been submitted to Congress that, if implemented, would subject all hydraulic fracturing to regulation under the Safe Drinking Water Act. Several states have adopted or are otherwise considering legislation to regulate hydraulic fracturing practices, including restrictions on its use in environmentally sensitive areas. Some municipalities have significantly limited or prohibited drilling activities, or are considering doing so.
Although it is not possible at this time to predict the requirements of any additional federal or state legislation or regulation regarding hydraulic fracturing, any new federal or state, or local restrictions on hydraulic fracturing that may be imposed in areas in which we conduct business could significantly increase our operating, capital and compliance costs as well as delay or halt our ability to develop oil and gas reserves.
Our ability to produce crude oil and natural gas economically and in commercial quantities could be impaired if we are unable to acquire adequate supplies of water for our drilling operations or are unable to dispose of or recycle the water we use economically and in an environmentally safe manner.
Drilling activities require the use of fresh water. In certain areas, there may be insufficient aquifer capacity to provide a local source of water for drilling activities, and water must be obtained from other sources and transported to the drilling site. Our inability to secure sufficient amounts of water, or to dispose of or recycle the water used in our operations, could adversely impact our operations in certain areas.
Moreover, compliance with environmental regulations and permit requirements governing the withdrawal, storage and use of surface water or groundwater necessary for hydraulic fracturing of wells may increase our operating costs and cause delays, interruptions or termination of our operations, the extent of which cannot be predicted, all of which could have an adverse effect on our operations and financial condition.
Our Southeast Louisiana core area can be affected by hurricane activity in the Gulf of Mexico, resulting in pipeline outages or damage to production facilities, causing production delays and/or significant repair costs.
Approximately 5% of our 2015 reserves, 9% of our 2015 production and 18% of our 2015 revenues were located in our Southeast Louisiana core area. Increased hurricane activity over the past ten years has resulted in production curtailments and physical damage to our Gulf Coast operations. For example, a significant percentage of our production was shut down by Hurricanes Gustav and Ike in 2008, and by Hurricane Isaac in 2012. Since we do not carry business interruption insurance (loss of production), if hurricanes damage the Gulf Coast region where we have a significant percentage of our operations, our cash flow would suffer. This decrease in cash flow, depending on the extent of the decrease, could reduce the funds we would have available for capital expenditures and reduce our ability to borrow money or raise additional capital.
A worldwide financial downturn or negative credit market conditions may have lasting effects on our liquidity, business and financial condition that we cannot control or predict.
Global economic conditions may adversely affect the financial viability of and increase the credit risk associated with our purchasers, suppliers, insurers, and commodity derivative counterparties to perform under the terms of contracts or financial arrangements we have with them. Although we have heightened our level of scrutiny of our contractual counterparties, our assessment of the risk of non-performance by various parties is subject to sudden swings in the financial and credit markets. This same crisis may adversely impact insurers and their ability to pay current and future insurance claims that we may have.
Our future access to capital could be limited due to tightening credit markets that could affect our ability to fund our future capital projects. In addition, long-term restriction upon or freezing of the capital markets and legislation related to financial and banking reform may affect short-term or long-term liquidity.
Our oil and natural gas exploration and production business involves high risks and we may suffer uninsured losses.
These risks include blowouts, explosions, adverse weather effects and pollution and other environmental damage, any of which could result in substantial losses to the Company due to injury or loss of life, damage to or destruction of wells, production facilities or other property, clean-up responsibilities, regulatory investigations and penalties and suspension of operations. Although the Company currently maintains insurance coverage that it considers reasonable and that is similar to that maintained by comparable companies in the oil and gas industry, it is not fully insured against certain of these risks, such as business interruption, either because such insurance is not available or because of the high premium costs and deductibles associated with obtaining and carrying such insurance.
21
Drilling wells is speculative and capital intensive.
Developing and exploring properties for oil and natural gas requires significant capital expenditures and involves a high degree of financial risk, including the risk that no commercially productive oil or natural gas reservoirs will be encountered. The budgeted costs of drilling, completing, and operating wells are often exceeded and can increase significantly when drilling costs rise. Drilling may be unsuccessful for many reasons, including title problems, weather, cost overruns, equipment shortages, and mechanical difficulties. Moreover, the successful drilling or completion of an oil or natural gas well does not ensure a profit on investment. Exploratory wells bear a much greater risk of loss than development wells.
We may incur substantial losses and be subject to substantial liability claims as a result of our oil and natural gas operations.
We are not insured against all risks. Losses and liabilities arising from uninsured and underinsured events could materially and adversely affect our business, financial condition, or results of operations. Our oil and natural gas exploration and production activities are subject to all of the operating risks associated with drilling for and producing oil and natural gas, including the possibility of:
• | hurricanes, tropical storms or other natural disasters; |
• | environmental hazards, such as uncontrollable flows of oil, natural gas, brine, well fluids, toxic gas, or other pollution into the environment, including groundwater and shoreline contaminates |
• | abnormally pressured formations; |
• | mechanical difficulties, such as stuck oil field drilling and service tools and casing collapse; |
• | fires and explosions; and |
• | personal injuries and death. |
Any of these risks could adversely affect our ability to conduct operations or result in substantial losses. We may elect not to obtain insurance if we believe that the cost of available insurance is excessive relative to the risks presented. In addition, pollution and environmental risks generally are not fully insurable. If a significant accident or other event occurs and is not fully covered by insurance, it could adversely affect our financial condition.
Governmental laws and regulations relating to environmental protection are costly and stringent.
Our exploration, production, and marketing operations are subject to complex and stringent federal, state, and local laws and regulations governing, among other things, the discharge of substances into the environment or otherwise relating to the protection of human health and the environment, including the protection of endangered species. These laws, regulations and related public policy considerations affect the costs, manner, and feasibility of our operations and require us to make significant expenditures in order to comply. Failure to comply with these laws and regulations may result in the assessment of administrative, civil, and criminal penalties, the imposition of investigatory and remedial obligations, and the issuance of injunctions that could limit or prohibit our operations. In addition, some of these laws and regulations may impose joint and several, strict liability for contamination resulting from spills, discharges, and releases of substances, including petroleum hydrocarbons and other wastes, without regard to fault or the legality of the original conduct. Under such laws and regulations, we could be required to remove or remediate previously disposed substances and property contamination, including wastes disposed or released by prior owners or operators. Changes in, or additions to, environmental laws and regulations occur frequently, and any changes or additions that result in more stringent and costly waste handling, storage, transport, disposal, cleanup or other environmental protection requirements could have a material adverse effect on our operations and financial position.
Enactment of executive, legislative or regulatory proposals under consideration could negatively affect our business.
Numerous executive, legislative and regulatory proposals affecting the oil and gas industry have been introduced, are anticipated to be introduced, or are otherwise under consideration, by the President, Congress, state legislatures and various federal and state agencies. Among these proposals are: (1) climate change/carbon tax legislation introduced in Congress, and EPA regulations to reduce greenhouse gas emissions; (2) Presidential proposals, along with legislation introduced in Congress (none of which have passed), to impose new fees or taxes on, or repeal various tax deductions available to, oil and gas producers, such as the current tax deductions for intangible drilling and development costs and qualified tertiary injectant expenses, which deductions, if eliminated, could raise the cost of energy production, reduce energy investment and affect the economics of oil and gas exploration and production activities; (3) legislation previously considered by Congress (but not adopted) that would subject the process of hydraulic fracturing to federal regulation under the Safe Drinking Water Act, and new, proposed or anticipated Department of Interior and EPA regulations to impose new and more stringent regulatory requirements on hydraulic fracturing activities, particularly those performed on federal lands, and to require disclosure of the chemicals used in the fracturing process; and (4) the Pipeline Safety, Regulatory Certainty, and Job Creation Act enacted in 2011, which increases penalties, grants new
22
authority to impose damage prevention and incident notification requirements, and directs the PHMSA to prescribe minimum safety standards for CO2 pipelines.
Any of the foregoing described proposals, including other applicable proposals, could affect our operations and the costs thereof. The trend toward stricter standards, increased oversight and regulation and more extensive permit requirements, along with any future laws and regulations, could result in increased costs or additional operating restrictions which could have an effect on demand for oil and natural gas or prices at which it can be sold. However, until such legislation or regulations are enacted or adopted into law and thereafter implemented, it is not possible to gauge their impact on our future operations or our results of operations and financial condition.
Certain federal income tax deductions currently available with respect to natural gas and oil exploration and development may be eliminated, and additional state taxes on natural gas extraction may be imposed, as a result of future legislation.
In recent years, legislation has been proposed that would, if enacted into law, make significant changes to U.S. federal income tax laws, including the elimination of certain U.S. federal income tax benefits and deductions currently available to oil and gas companies. Such changes include, but are not limited to, (i) the repeal of the percentage depletion allowance for oil and gas properties, (ii) the increase of the amortization period of geological and geophysical expenses, (iii) the elimination of current deductions for intangible drilling and development costs and qualified tertiary injectant expenses; and (iv) the elimination of the deduction for certain U.S. production activities. It is currently unclear whether any such proposals will be enacted or what form they might possibly take or impact they may have; however, the passage of such legislation or any other similar change in U.S. federal income tax law could eliminate, reduce or postpone certain tax deductions that are currently available to us, and any such change could negatively affect our financial condition and results of operations.
Legal proceedings could result in liability affecting our results of operations.
Most oil and gas companies, such as us, are involved in various legal proceedings, such as title, royalty, or contractual disputes, in the ordinary course of business. We defend ourselves vigorously in all such matters.
Because we maintain a portfolio of assets in the various areas in which we operate, the complexity and types of legal proceedings with which we may become involved may vary, and we could incur significant legal and support expenses in different jurisdictions. If we are not able to successfully defend ourselves, there could be a delay or even halt in our exploration, development or production activities or other business plans, resulting in a reduction in reserves, loss of production and reduced cash flows. Legal proceedings could result in a substantial liability. In addition, legal proceedings distract management and other personnel from their primary responsibilities.
A cyber incident could result in information theft, data corruption, operational disruption, and/or financial loss.
Our business has become increasingly dependent on digital technologies to conduct day-to-day operations, including certain of our exploration, development and production activities. We depend on digital technology to estimate quantities of oil and gas reserves, process and record financial and operating data, analyze seismic and drilling information and in many other activities related to our business. Our technologies, systems and networks may become the target of cyber-attacks or information security breaches that could result in the disruption of our business operations, damage to our properties and/or injuries. For example, unauthorized access to our seismic data, reserves information or other proprietary information could lead to data corruption, communication interruption, or other operational disruptions in our drilling or production operations.
To date we are not aware of any material losses relating to cyber-attacks, however there can be no assurance that we will not suffer such losses in the future. As cyber threats continue to evolve, we may be required to expend significant additional resources to continue to modify or enhance our protective measures or to investigate and remediate any cyber vulnerabilities.
23
Item 1B. Unresolved Staff Comments
None.
Glossary of Abbreviations and Terms
The following abbreviations and terms have the indicated meanings when used in this report:
ASC - Accounting Standards Codification.
Bankruptcy Code - Refers to title 11 of the United States Code.
Bankruptcy Court - Refers to the United States Bankruptcy Court for the District of Delaware.
Bar Date - Refers to the deadline, set by the Bankruptcy Court, by which certain creditors must file proofs of claims in order to receive any distribution under the Plan.
Bbl - Barrel or barrels of oil.
Bcf - Billion cubic feet of natural gas.
Bcfe - Billion cubic feet of natural gas equivalent (see Mcfe).
Boe - Barrels of oil equivalent.
Chapter 11 - Means chapter 11 of the Bankruptcy Code.
Condensate - Liquid hydrocarbons that are found in natural gas wells and condense when brought to the well surface. Condensate is used synonymously with oil.
Developed Oil and Gas Reserves - Oil and natural gas reserves of any category that can be expected to be recovered through existing wells with existing equipment and operating methods.
Development Well - A well drilled within the proved area of an oil or natural gas reservoir to the depth of a stratigraphic horizon known to be productive.
Discovery Cost - With respect to proved reserves, a three-year average (unless otherwise indicated) calculated by dividing total incurred exploration and development costs (exclusive of future development costs) by net reserves added during the period through extensions, discoveries, and other additions.
Dry Well - An exploratory or development well that is not a producing well.
Exploratory Well - A well drilled to find a new field or to find a new reservoir in a field previously found to be productive of oil or natural gas in another reservoir.
FASB - The Financial Accounting Standards Board.
Gross Acre - An acre in which a working interest is owned. The number of gross acres is the total number of acres in which a working interest is owned.
Gross Well - A well in which a working interest is owned. The number of gross wells is the total number of wells in which a working interest is owned.
MBbl - Thousand barrels of oil.
MBoe - Thousand barrels of oil equivalent.
Mcf - Thousand cubic feet of natural gas.
Mcfe - Thousand cubic feet of natural gas equivalent, which is determined using the ratio of one barrel of oil, condensate, or natural gas liquids to 6 Mcf of natural gas.
MMBbl - Million barrels of oil.
MMBoe - Million barrels of oil equivalent.
MMBtu - Million British thermal units, which is a heating equivalent measure for natural gas and is an alternate measure of natural gas reserves, as opposed to Mcf, which is strictly a measure of natural gas volumes. Typically, prices quoted for natural gas are designated as price per MMBtu, the same basis on which natural gas is contracted for sale.
MMcf - Million cubic feet of natural gas.
MMcfe - Million cubic feet of natural gas equivalent (see Mcfe).
Net Acre - A net acre is deemed to exist when the sum of fractional working interests owned in gross acres equals one. The number of net acres is the sum of fractional working interests owned in gross acres expressed as whole numbers and fractions thereof.
Net Well - A net well is deemed to exist when the sum of fractional working interests owned in gross wells equals one. The number of net wells is the sum of fractional working interests owned in gross wells expressed as whole numbers and fractions thereof.
NGL - Natural gas liquid.
OTC Pink - means OTC Pink, a centralized electronic quotation service for over-the-counter securities, operated by OTC Market Group Inc.
Petition Date - The date on which the Company and the Chapter 11 Subsidiaries filed for bankruptcy protection (December 31, 2015).
Producing Well - An exploratory or development well found to be capable of producing either oil or natural gas in sufficient quantities to justify completion as an oil or natural gas well.
24
Proved Oil and Gas Reserves - Those quantities of oil and gas, which, by analysis of geoscience and engineering data, can be estimated with reasonable certainty to be economically producible from a given date forward, from known reservoirs, and under existing economic conditions, operating methods, and government regulations. For reserves calculations economic conditions include prices based on either the preceding 12-months' average price based on closing prices on the first day of each month, or prices defined by existing contractual arrangements.
Proved Undeveloped (PUD) Locations - A location containing proved undeveloped reserves.
PV-10 Value - The estimated future net revenues to be generated from the production of proved reserves discounted to present value using an annual discount rate of 10%. These amounts are calculated net of estimated production costs and future development costs, using prices based on either the preceding 12-months' average price based on closing prices on the first day of each month, or prices defined by existing contractual arrangements, without escalation and without giving effect to non-property related expenses, such as general and administrative expenses, debt service, future income tax expense, or depreciation, depletion, and amortization. PV-10 Value is a non-GAAP measure and its use is explained under “Item 2. Properties - Oil and Natural Gas Reserves” above in this Form 10-K.
Standardized Measure - The present value, discounted at 10% per year, of estimated future net revenues from the production of proved reserves, computed by applying sales prices and deducting the estimated future costs to be incurred in developing, producing and abandoning the proved reserves (computed based on current costs and assuming continuation of existing economic conditions). Future income taxes are calculated by applying the statutory federal and state income tax rate to pre-tax future net cash flows, net of the tax basis of the properties involved and utilization of available tax carryforwards related to oil and natural gas operations. Sales prices were prepared using average hydrocarbon prices equal to the unweighted arithmetic average of hydrocarbon prices on the first day of each month within the 12-month period preceding the reporting date (except for consideration of price changes to the extent provided by contractual arrangements).
Undeveloped Oil and Gas Reserves - Oil and natural gas reserves of any category that are expected to be recovered from new wells on undrilled acreage or from existing wells where a relatively major expenditure is required for recompletion.
Item 3. Legal Proceedings
In the ordinary course of business, we are party to various legal actions, which arise primarily from our activities as operator of oil and natural gas wells. Most of our pending legal proceedings have been stayed by virtue of our voluntary petitions filed on December 31, 2015 seeking relief under Chapter 11 of the Bankruptcy Code. In our opinion, the outcome of any such currently pending legal actions will not have a material adverse effect on our financial position or results of operations.
Item 4. Mine Safety Disclosures
None.
25
PART II
Item 5. Market for Registrant's Common Equity, Related Stockholder Matters and Issuer Purchases of Equity Securities
Common Stock, 2015 and 2014
Our common stock, which was traded on the New York Stock Exchange under the symbol “SFY" prior to being delisted on December 18, 2015, is currently traded on the OTC Pink marketplace under the symbol "SFYWQ". The high and low quarterly closing sale prices for the common stock on the New York Stock Exchange for 2015 and 2014 were as follows:
2015 | 2014 | ||||||||
First Quarter | Second Quarter | Third Quarter | Fourth Quarter | First Quarter | Second Quarter | Third Quarter | Fourth Quarter | ||
Low | $2.01 | $2.00 | $0.36 | $0.16 | $9.62 | $10.26 | $9.60 | $2.63 | |
High | $3.86 | $3.26 | $1.89 | $0.72 | $13.70 | $13.01 | $12.86 | $9.21 | |
The high and low closing sale prices for the common stock on the OTC Pink marketplace for the period from December 18, 2015 through December 31, 2015 were $0.16 and $0.06, respectively. Further, the high and low closing sale prices for the common stock on the OTC Pink marketplace for the Period from January 1, 2016 through February 29, 2016 were $0.15 and $0.06, respectively.
Since inception, no cash dividends have been declared on our common stock. Cash dividends are restricted under the terms of our credit agreements, as discussed in Note 4 of the consolidated financial statements in this Form 10-K.
We had approximately 156 stockholders of record as of December 31, 2015.
Stock Repurchase Table
The following table summarizes repurchases of our common stock during the fourth quarter of 2015, all of which were shares withheld from employees to satisfy tax obligations arising upon the vesting of restricted shares:
Period | Total Number of Shares Purchased | Average Price Paid Per Share | Total Number of Shares Purchased as Part of Publicly Announced Plans or Programs | Approximate Dollar Value of Shares that May Yet Be Purchased Under the Plans or Programs (in thousands) | |||||||||
October 1 - 31, 2015 | 1,259 | $ | 0.70 | — | $--- | ||||||||
November 1- 30, 2015 | 990 | $ | 0.40 | — | — | ||||||||
December 1 - 31, 2015 | 14,869 | $ | 0.24 | — | — | ||||||||
Total | 17,118 | $ | 0.28 | — | $--- | ||||||||
Equity Compensation Plan Information
For information regarding the number of shares of our common stock that are available for issuance under all of our existing equity compensation plans as of December 31, 2015 see Note 7 of these consolidated financial statements of this Form 10-K.
26
Share Performance Graph
The following Share Performance Graph shall not be deemed to be “soliciting material” or to be “filed” with the Securities and Exchange Commission, nor shall such information be incorporated by reference into any future filings under the Securities Act of 1933 or Securities Exchange Act of 1934, each as amended, except to the extent that the Company specifically incorporates it by reference into such filing.
The graph below presents a comparison of the annual change in the cumulative total return on our common stock over the period from December 31, 2010 to December 31, 2015, with the cumulative total return of the Dow Jones U.S. Exploration & Production Index and the S&P 500 Index, over the same period. The graph assumes an investment of $100 (with reinvestment of all dividends) was invested on December 31, 2010, in our common stock at the closing market price at the beginning of this period and in each of the other indexes.
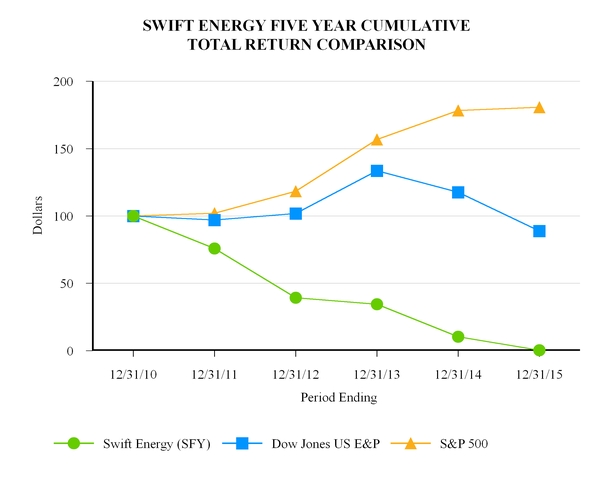
27
Item 6. Selected Financial Data
(annual data in thousands except share & well amounts) | 2015 | 2014 | 2013 | 2012 | 2011 | ||||||||||
Total Revenues from Continuing Operations | $ | 244,721 | $ | 549,456 | $ | 584,401 | $ | 561,486 | $ | 597,809 | |||||
Income (Loss) from Continuing Operations, Before Income Taxes | $ | (1,734,514 | ) | $ | (433,470 | ) | $ | 198 | $ | 37,773 | $ | 131,125 | |||
Income (Loss) from Continuing Operations | $ | (1,653,971 | ) | $ | (283,427 | ) | $ | (2,442 | ) | $ | 21,701 | $ | 82,071 | ||
Net Cash Provided by Operating Activities - Continuing Operations | $ | 42,274 | $ | 306,371 | $ | 311,447 | $ | 314,606 | $ | 373,058 | |||||
Per Share and Share Data | |||||||||||||||
Weighted Average Shares Outstanding | 44,463 | 43,795 | 43,331 | 42,840 | 42,394 | ||||||||||
Earnings per Share--Basic | $ | (37.20 | ) | $ | (6.47 | ) | $ | (0.06 | ) | $ | 0.51 | $ | 1.94 | ||
Earnings per Share--Diluted | $ | (37.20 | ) | $ | (6.47 | ) | $ | (0.06 | ) | $ | 0.50 | $ | 1.91 | ||
Shares Outstanding at Year-End | 44,592 | 43,918 | 43,402 | 42,930 | 42,485 | ||||||||||
Book Value per Share at Year-End | $ | (19.12 | ) | $ | 18.09 | $ | 24.55 | $ | 24.52 | $ | 23.80 | ||||
Market Price | |||||||||||||||
High | $ | 3.86 | $ | 13.70 | $ | 17.10 | $ | 35.00 | $ | 47.32 | |||||
Low | $ | 0.06 | $ | 2.63 | $ | 10.99 | $ | 14.28 | $ | 21.81 | |||||
Year-End Close | $ | 0.09 | $ | 4.05 | $ | 13.50 | $ | 15.39 | $ | 29.72 | |||||
Assets | |||||||||||||||
Current Assets | $ | 61,847 | $ | 64,669 | $ | 92,489 | $ | 87,005 | $ | 334,594 | |||||
Property & Equipment, Net of Accumulated | |||||||||||||||
Depreciation, Depletion, and Amortization | $ | 457,903 | $ | 2,095,037 | $ | 2,588,817 | $ | 2,367,954 | $ | 1,892,866 | |||||
Total Assets | $ | 524,998 | $ | 2,173,347 | $ | 2,698,505 | $ | 2,473,463 | $ | 2,244,012 | |||||
Liabilities | |||||||||||||||
Current Liabilities (1) | $ | 333,053 | $ | 148,919 | $ | 176,033 | $ | 179,412 | $ | 216,605 | |||||
Long-Term Debt (1) | $ | — | $ | 1,074,534 | $ | 1,142,368 | $ | 916,934 | $ | 719,775 | |||||
Total Liabilities | $ | 1,377,722 | $ | 1,378,969 | $ | 1,633,155 | $ | 1,420,680 | $ | 1,232,661 | |||||
Stockholders' Equity | $ | (852,724 | ) | $ | 794,378 | $ | 1,065,350 | $ | 1,052,783 | $ | 1,011,351 | ||||
Producing Wells | |||||||||||||||
Swift Operated | 1,030 | 1,040 | 1,039 | 1,069 | 1,025 | ||||||||||
Outside Operated | 26 | 25 | 25 | 50 | 46 | ||||||||||
Total Producing Wells | 1,056 | 1,065 | 1,064 | 1,119 | 1,071 | ||||||||||
Wells Drilled (Gross) | 24 | 36 | 48 | 71 | 44 | ||||||||||
Proved Reserves | |||||||||||||||
Natural Gas (Bcf) (2) | 311.7 | 686.7 | 815.1 | 597.6 | 616.8 | ||||||||||
Oil Reserves (MBoe) (2) | 10.1 | 49.7 | 53.0 | 43.3 | 30.9 | ||||||||||
NGL Reserves (MBoe) (2) | 8.2 | 29.7 | 30.4 | 49.2 | 25.8 | ||||||||||
Total Proved Reserves (MMBoe equivalent) (3) | 70.3 | 193.8 | 219.2 | 192.1 | 159.6 | ||||||||||
Production (MMBoe equivalent) | 11.7 | 12.4 | 11.7 | 11.7 | 10.5 | ||||||||||
Average Sales Price (3) | |||||||||||||||
Natural Gas (per Mcf produced) | $ | 2.37 | $ | 3.88 | $ | 3.32 | $ | 2.42 | $ | 3.70 | |||||
Natural Gas Liquids (per barrel) | $ | 14.54 | $ | 31.83 | $ | 31.39 | $ | 35.07 | $ | 52.13 | |||||
Oil (per barrel) | $ | 47.11 | $ | 92.74 | $ | 103.42 | $ | 106.17 | $ | 107.00 | |||||
Boe Equivalent | $ | 21.00 | $ | 44.22 | $ | 50.11 | $ | 47.37 | $ | 57.22 | |||||
(1) Reduction in Long-Term Debt is due to reclassifications of (a) the Company's Senior Notes to Liabilities Subject to Compromise and (2) borrowings under the credit facility to Current Liabilities in 2015, both as a result of the bankruptcy filing.
(2) Reserves decreased during 2015 due to the impact of lower commodity prices and uncertainties, due in part to our bankruptcy filing, surrounding the availability of the financing that would be necessary to develop our proved undeveloped reserves. See Note 1A in this Form 10-K for more information.
(3) These prices do not include the effects of our hedging activities which were recorded in “Price-risk management and other, net” on the accompanying statements of operations. The hedge adjusted prices are detailed in the “Management's Discussion and Analysis of Financial Condition and Results of Operations” section of this Form 10-K.
28
Item 7. Management’s Discussion and Analysis of Financial Condition and Results of Operations
You should read the following discussion and analysis in conjunction with our financial information and our audited consolidated financial statements and accompanying Notes for the years ended December 31, 2015, 2014 and 2013 included with this report. The following information contains forward-looking statements; see “Forward-Looking Statements” on page 41 of this report.
Company Overview
We are an independent oil and natural gas company formed in 1979 engaged in the exploration, development, acquisition and operation of oil and natural gas properties, with a focus on our reserves and production from our South Texas properties as well as onshore and inland waters of Louisiana. We hold a large acreage position in Texas prospective for Eagle Ford shale and Olmos tight sands development. Natural gas production accounted for 67% of our 2015 production and 46% of our oil and gas sales, while oil accounted for 21% of our 2015 production and 46% of our oil and gas sales. Combined production of both oil and natural gas constituted 88% of our 2015 production and 92% of our oil and gas sales.
Bankruptcy Proceedings under Chapter 11
Chapter 11 Proceedings. On December 31, 2015, the Company and eight of its subsidiaries (the “Chapter 11 Subsidiaries”) filed voluntary petitions seeking relief under Chapter 11 of Title 11 of the United States Bankruptcy Code in the United States Bankruptcy Court for the District of Delaware (In re Swift Energy Company, et al, Case No. 15-12670).
Debtor-In-Possession. The Company and the Chapter 11 Subsidiaries are currently operating our business as debtors in possession in accordance with the applicable provisions of the Bankruptcy Code. The Bankruptcy Court has granted all motions filed by the Company and the Chapter 11 Subsidiaries that were designed primarily to minimize the impact of the Chapter 11 proceedings on the Company’s operations, customers and employees. As a result, the Company is not only able to conduct normal business activities and pay all associated obligations for the period following its bankruptcy filing, but it is also authorized to pay and has paid (subject to caps applicable to payments of certain pre-petition obligations) pre-petition employee wages and benefits, pre-petition amounts owed to certain lienholders and critical vendors, pre-petition amounts owed to pipeline owners that transport the Company’s production, and funds belonging to third parties, including royalty holders and partners. During the pendency of the Chapter 11 case, all transactions outside the ordinary course of our business require the prior approval of the Bankruptcy Court.
Automatic Stay. Subject to certain specific exceptions under the Bankruptcy Code, the Chapter 11 filings automatically stayed most judicial or administrative actions against the Company and efforts by creditors to collect on or otherwise exercise rights or remedies with respect to pre-petition claims.
Restructuring Support Agreement. Immediately prior to the Chapter 11 filings, a majority of the holders of the Company’s senior notes agreed, pursuant to a restructuring support agreement (the “RSA”), to support a plan under which all of the Company’s senior notes are converted to equity. Under the RSA, holders of the senior notes, certain unsecured creditors, and lenders under the DIP Credit Agreement (see below “Debtor-in-Possession Financing”) are to receive ninety-six percent (96%) of the reorganized company's common stock in exchange for the senior notes, and the existing equity holders are entitled to receive the remaining four percent (4%) of the reorganized company's common stock on a fully diluted basis, subject only to dilution as a result of a proposed new management incentive program. Existing equity holders are also entitled to receive warrants for up to 30% of the reorganized company's equity. Under the RSA, Dean Swick, Managing Director at Alvarez & Marsal North America, LLC, has been appointed to act as Chief Restructuring Officer during the reorganization process.
The RSA includes an agreed timeline for the Chapter 11 proceedings that, if met, would result in the Company emerging from bankruptcy within 110 days of the Chapter 11 filings.
Plan of Reorganization. On February 5, 2016, the Company and the Chapter 11 Subsidiaries filed with the Bankruptcy Court a joint plan of reorganization (the “Plan”), which is supported by an ad hoc committee of the Company’s noteholders, and a related disclosure statement. The Plan is subject to approval by the Bankruptcy Court. The Bankruptcy Court has approved the Company’s disclosure statement with respect to the Plan, and the Company is in the process of soliciting votes with respect to the Plan. A confirmation hearing on the Plan is scheduled on March 30, 2016 in the Bankruptcy Court.
If the Plan is ultimately approved by the Bankruptcy Court, the Company and the Chapter 11 Subsidiaries would exit bankruptcy pursuant to the terms of the Plan. Under the Plan, the claims against and interests in the Company and the Chapter 11 Subsidiaries are grouped into classes based, in part, on their respective priority. The Plan provides that, upon emergence from bankruptcy:
29
• | the approximately $906 million of indebtedness outstanding on account of the Company’s senior notes and certain other unsecured claims will be exchanged for 88.5% of the post-emergence Company’s common stock; |
• | the lenders under the DIP Credit Agreement (as more fully described below under “Debtor-In-Possession Financing”) will receive a backstop fee consisting of 7.5% of the post-emergence Company’s common stock; |
• | the Company’s current common stock will be canceled and the current shareholders will be entitled to receive the remaining 4% of the post-emergence Company’s common stock and certain warrants; and |
• | claims of other creditors will be paid in full in cash, reinstated or otherwise treated in a manner acceptable to the creditors. |
The Plan also provides that the post-emergence Company’s new board of directors will be made up of seven directors consisting of the Chief Executive Officer of the post-emergence Company, two directors appointed by Strategic Value Partners LLC, a current holder of the Company’s senior notes, two directors appointed by other current holders of the Company’s senior notes, and two independent directors (one of whom will be the new Chairman of the Board).
The Plan is subject to acceptance by certain holders of claims against the Company and the Chapter 11 Subsidiaries and confirmation by the Bankruptcy Court. The Plan is deemed accepted by a class of claims entitled to vote if at least one-half in number and two-thirds in dollar amount of claims actually voting in the class has voted to accept the Plan.
Under certain circumstances set forth in the Bankruptcy Code, the Bankruptcy Court may confirm a plan even if such plan has not been accepted by all impaired classes of claims and equity interests. In particular, a plan may be compelled on a rejecting class if the proponent of the plan demonstrates that (1) no class junior to the rejecting class is receiving or retaining property under the plan and (2) no class of claims or interests senior to the rejecting class is being paid more than in full.
Executory Contracts. Subject to certain exceptions, under the Bankruptcy Code, the Company and the Chapter 11 Subsidiaries may assume, assign, or reject certain executory contracts and unexpired leases subject to the approval of the Bankruptcy Court and certain other conditions. The rejection of an executory contract or unexpired lease is generally treated as a pre-petition breach of such executory contract or unexpired lease and, subject to certain exceptions, relieves the Company and the Chapter 11 Subsidiaries of performing their future obligations under such executory contract or unexpired lease but may give rise to a pre-petition general unsecured claim for damages caused by such deemed breach.
Chapter 11 Filing Impact on Creditors and Stockholders. Under the priority requirements established by the Bankruptcy Code, unless creditors agree otherwise, pre-petition liabilities to creditors and post-petition liabilities must be satisfied in full before the holders of our existing common stock are entitled to receive any distribution or retain any property under a plan of reorganization. The ultimate recovery to creditors and/or stockholders, if any, will not be determined until confirmation and implementation of a plan or plans of reorganization. The outcome of the Chapter 11 case remains uncertain at this time and, as a result, we cannot accurately estimate the amounts or value of distributions that creditors and stockholders may receive. It is possible that stockholders will receive no distribution on account of their interests.
Debtor-In-Possession Financing. Pursuant to the RSA, certain holders of the Company’s senior notes agreed to provide the Company and the Chapter 11 Subsidiaries a debtor in possession facility (the “DIP Facility”) pursuant to the terms of a Debtor-in-Possession (“DIP”) Credit Agreement. The DIP Facility has been approved by the Bankruptcy Court. The DIP Credit Agreement provides for a multi-draw term loan in the aggregate amount of up to $75 million, of which the Company has $30 million currently available. The remaining $45 million under the DIP Facility will become available to the Company upon the satisfaction of certain contingencies, including our ability to amend and restate or refinance the indebtedness under the Company’s current first lien credit facility and to obtain exit financing. Pursuant to the Plan, the DIP Facility will be either paid in full in cash or, at the option of the lenders under the DIP Credit Agreement, converted, in full or in part, into the post-emergence Company’s common stock, which common stock will only come from the 88.5% of the common stock to be distributed to the current holders of the senior notes and certain unsecured creditors. For more information refer to Note 4 of these consolidated financial statements.
Financial Statement Classification of Liabilities Subject to Compromise. Our financial statements include amounts classified as Liabilities Subject to Compromise (refer to Note 1A of the consolidated financial statements in this Form 10-K for more information), which represent liabilities that we anticipate will be allowed as claims in our bankruptcy case. These amounts include amounts related to the anticipated rejection of various executory contracts and unexpired leases. Additional amounts may be included in Liabilities Subject to Compromise in future periods if additional executory contracts and unexpired leases are rejected. Conversely, to the extent that such executory contracts or unexpired leases are not rejected and are instead assumed, certain liabilities characterized as subject to compromise may be converted to post-petition liabilities. Because the nature of many of the potential claims has not been determined at this time, the magnitude of such claims is not reasonably estimable at this time. Such claims may be material.
30
Reorganization Expenses. The Company and the Chapter 11 Subsidiaries have incurred and will continue to incur significant costs associated with the reorganization, principally professional fees. The amount of these costs, which are being expensed as incurred, are expected to significantly affect our results of operations. In accordance with ASC 852, we have recorded certain costs associated with the bankruptcy proceedings as Reorganization Items within our Consolidated Statement of Operations. For additional information, see “Reorganization Items” below.
Risks Associated with Chapter 11 Proceedings. For the duration of our Chapter 11 proceedings, our operations and our ability to develop and execute our business plan are subject to the risks and uncertainties associated with the Chapter 11 process as described in Item 1A, “Risk Factors.” Because of these risks and uncertainties, the description of our operations, properties and capital plans included in this Form 10-K may not accurately reflect our operations, properties and capital plans following the Chapter 11 process.
Significant Developments during 2015
• | Significant decline in crude oil and natural gas prices: Oil prices throughout 2015 were significantly lower than 2014 prices, with our average oil prices received falling from approximately $72 per barrel during the fourth quarter of 2014 to approximately $40 per barrel in the fourth quarter of 2015 (approximately a 44% lower). Natural gas prices were also lower during the same period, with our average natural gas prices received falling from $3.58 per Mcf during the fourth quarter of 2014 to $2.05 per Mcf in the fourth quarter of 2015 (approximately 43% lower). |
• | 2015 changes in reserve quantities and value: Our 64%, or 124 MMBoe, decrease in proved reserves quantities from 2014 to 2015 was principally due to the impact of lower commodity prices and uncertainties, due in part to our bankruptcy filing, surrounding the availability of the financing that would be necessary to develop our proved undeveloped reserves, as disclosed in Note 1A of the consolidated financial statements in this Form 10-K. The 81% decrease in our PV-10 Value from 2014 and 2015 reflected not only these quantity decreases, but also the impact of lower commodity prices during 2015. |
• | 2015 revenues and net loss: Our 2015 revenues decreased 55% or $304.7 million, when compared to 2014, primarily due to the impact of lower commodity prices and lower oil production volumes, partially offset by higher natural gas production. Revenues decreased due to lower overall commodity pricing as oil prices were 49% lower in 2015, when compared to 2014, natural gas prices were 39% lower in 2015, when compared to 2014, and NGL prices were 54% lower in 2015, when compared to 2014. Revenues also decreased due to lower oil production in our AWP and Lake Washington fields and lower NGL production in our Artesia and AWP fields, partially offset by increased natural gas production volumes from our Fasken field. Our net loss of $1.7 billion for 2015 is primarily due to the $1.6 billion non-cash write-down of our oil and gas properties. |
• | Net cash provided by operating activities: Our net cash provided by operating activities during 2015 was $42.3 million, representing a $264.1 million or 86% decrease, compared to $306.4 million generated during 2014, primarily due to the impacts of lower commodity prices and lower oil and NGL production, partially offset by higher natural gas production and reduced operating and administrative costs excluding non-recurring costs as discussed in the "Cost reduction initiatives" section below. |
• | Capital expenditures: Recent lower oil and natural gas prices have significantly reduced operating cash flows and, as a result, we significantly reduced our capital spending in 2015 compared to 2014 levels. Our capital expenditures on a cash flow basis were $139.7 million during 2015, compared to $386.3 million during 2014. The expenditures were devoted to developmental drilling and completion activity in our South Texas core region as we drilled 5 wells in our AWP Eagle Ford field and 19 wells in our Fasken field during the year. These expenditures were funded by $42.3 million of cash provided by operating activities along with borrowings under our credit facility. |
• | Cost reduction initiatives: We have taken significant actions to reduce our future capital, operating and overhead costs. During 2015 we reduced drilling and completion costs and terminated one of our drilling contracts. In conjunction with the reduction in our capital spending plans for 2015, we continued to negotiate with all of our primary suppliers and service companies to reduce our capital and operating cost structures. These initiatives helped us recognize a meaningful reduction of costs during 2015, with our lease operating expenses, excluding workover costs, decreasing from $88.6 million during 2014 to $68.7 million in 2015. By focusing operations in our high quality Fasken and AWP areas we will continue to reduce our development costs by taking advantage of existing infrastructure and experienced operating personnel. During 2015, the Company also implemented various administrative cost savings efforts including a significant headcount reduction and the signing of a new lease agreement for reduced corporate office space. Excluding non-recurring costs incurred during 2015 of approximately $7.2 million for professional and legal fees related to our restructuring efforts and $2.8 million related to the initial |
31
implementation of these cost reduction initiatives, our net general and administrative costs decreased by approximately $7.0 million, or 18%, during 2015.
• | NYSE notice of delisting due to non-compliance with continued listing standards. Trading in the Company’s common stock on the NYSE was suspended intra-day on December 18, 2015, and the common stock was subsequently delisted. The common stock of the Company is currently trading on the OTC Pink marketplace under the symbol “SFYWQ.” The Company can provide no assurance that its common stock will continue to trade on this market, whether broker-dealers will continue to provide public quotes of the Company’s common stock on this market, whether the trading volume of the Company’s common stock will be sufficient to provide for an efficient trading market or whether quotes for the Company’s common stock may be blocked by OTC Markets Group in the future. |
• | Section 382 Rights Agreement. On November 15, 2015, the Company entered into a Section 382 Rights Agreement (the “Rights Agreement”) with American Stock Transfer & Trust Company, LLC, as rights agent. The Rights Agreement was adopted in an effort to prevent potential significant limitations under Section 382 of the Internal Revenue Code of 1986, as amended (the "Code"), on the Company’s ability to utilize its current net operating loss carryforwards (NOLs) to reduce its future tax liabilities. If the Company experiences an "ownership change," as defined in Section 382 of the Code, among 5% shareholders, the Company's ability to fully utilize its NOLs on an annual basis could be substantially limited, which could accordingly significantly impair the value of those tax benefits. The Rights Agreement works by imposing a significant penalty upon any person or group that acquires 4.99% or more of the Company’s common stock or any other class or series of the stock of the Company without the approval of the board of directors of the Company. Subject to certain exceptions set forth in the Rights Agreement, shareholders (i) who currently own 4.99% or more of any class of the Company’s stock, (ii) who inadvertently acquires 4.99% or more of any class of the Company’s stock, or (iii) whose percentage ownership of any class of the Company’s stock increases to 4.99% or more as a result of the Company’s acquisition of the Company’s stock, will not trigger the rights unless they acquire additional shares of such class of the Company’s stock. For more information, see the Company’s Form 8-K filed on November 23, 2015. |
Summary of Operational Achievements during 2015
• | Increasing capacity in the Eagle Ford: During 2015 the Company secured an additional 30 MMcf per day of firm pipeline capacity out of the Fasken area. The Company now has total firm capacity of 190 MMcf per day to support continued development of the Eagle Ford in its Webb County acreage. During the third quarter of 2015, the Company also drilled and completed its first upper Eagle Ford well in Fasken. |
• | Reductions in per well costs: We have seen improved performance this year in our initial production (IP) rates for Eagle Ford wells and have also seen our 2015 average per well drilling costs decreasing, with the average per well drilling cost for our Fasken wells decreasing to $2.4 million during the fourth quarter 2015 from $3.1 million during 2014. We have also experienced efficiency gains in our hydraulic fracturing activities (including the testing of a new enhanced completion design during the third quarter of 2015). We have lowered the overall frac cost per stage while performing more frac stages per well, using additional proppant in each stimulated stage and achieved better overall results as measured by rates of return and net present value. We did not perform any completions during the fourth quarter of 2015, however our third quarter 2015 average completion costs were $3.4 million whereas the average completion costs during 2014 were $4.6 million. |
• | Reductions in operating costs: In addition to the cost reduction initiatives summarized above, during 2016 we are implementing a number of operational cost reduction initiatives, including a reconfiguration of the production gathering system in the Lake Washington field to consolidate production into one platform, and also to temporarily shut in many of our wells with marginal production. Implementation of both of these initiatives is expected to result in significant operating expense reductions. |
32
2016 Liquidity and Capital Resources
Historically, our primary sources of liquidity have been cash flows from operations, borrowings under our credit facility and issuances of senior notes. Our primary use of cash flow has been to fund capital expenditures used to develop our oil and gas properties. Our liquidity was severely constrained in 2015, principally due to the deep and precipitous fall of both natural gas and crude oil prices from levels in mid-2014.
As of February 29, 2016, the Company’s liquidity consists of approximately $22 million of cash-on-hand, plus $30 million of availability under the debtor-in-possession financing provided by certain of the Company’s senior note holders. As summarized in the "Overview" section above, the DIP Credit Agreement, approved by the Bankruptcy Court on February 2, 2016, provides for a multi-draw term loan in the aggregate amount of up to $75 million, subject to satisfaction of certain conditions set forth in the DIP Credit Agreement as detailed in Note 4 of the consolidated financial statements in this Form 10-K. The Company anticipates supplementing these amounts, with approximately $13 million of the total proceeds of approximately $49 million, upon closing of the pending Texegy sale of interests in our South Bearhead Creek and Burr Ferry fields. The purchase agreement provides that closing must take place on or prior to March 15, 2016 unless a later date is agreed to mutually. Additionally the Company is seeking incremental borrowing capacity of up to $35 million as part of a renewal, replacement or refinancing of our first-lien secured credit facility, which is currently being negotiated to be put in place as part of the Company’s emergence from bankruptcy. The timing, terms and incremental borrowing amounts of any such replacement financing cannot be predicted at this time and there is no assurance that we will be able to successfully negotiate such financing.
As a consequence, as disclosed in our Bankruptcy Court filings, the Company’s current $78.0 million capital budget for 2016 is significantly reduced from 2015 levels, and includes $66 million for completion costs for 12 previously drilled but not completed wells, drilling and completion of 4 wells, drilling but not completion of 8 additional wells, and recompletion of 8 wells. The budget also includes $12.0 million for anticipated regulatory, corporate and other capital costs. During 2016 we intend to focus on drilling activity in our dry gas Fasken area in Webb County and our South AWP area in McMullen County. A portion of our capital expenditure program is discretionary and may be further deferred, if necessary. Our 2016 capital budget and level of operations may be impacted by a variety of factors related to our bankruptcy proceedings, including borrowing availability under our DIP credit agreement, funds received from our disposition of assets in our South Bearhead Creek and Burr Ferry fields, and our ability to obtain (and the amount of) additional financing or exit financing.
Effective November 2, 2015, we executed an amendment to our credit facility, lowering our borrowing base and commitment amount from $375.0 million to $330.0 million. As of December 31, 2015, we had approximately $324.9 million in outstanding borrowings under our credit facility (excluding $5.1 million in letters of credit). Our first-lien secured credit facility is fully drawn, and we have no availability for further borrowings under the facility. In 2016, we are paying interest under that facility on a current basis. Upon a closing of the sale of central Louisiana properties to Texegy discussed above, our outstanding borrowings under the credit facility would be reduced by approximately $35 million through use of proceeds from the sale.
33
Contractual Commitments and Obligations
Our contractual commitments for the next five years and thereafter are shown below as of December 31, 2015 prior to filing our bankruptcy petition (in thousands). The amounts of our contractual commitments will likely be significantly different than those shown below following our emergence from bankruptcy. If we obtain the required acceptances and our plan of reorganization is confirmed, our senior notes will be exchanged for equity, some of our contractual obligations will be paid in full or reinstated, and some of our contractual obligations may be amended or rejected. For more information, see "Bankruptcy Proceedings under Chapter 11".
2016 | 2017 | 2018 | 2019 | 2020 | Thereafter | Total | |||||||||||||||
Non-cancelable operating leases (1) | $ | 4,140 | $ | 3,288 | $ | 3,688 | $ | 3,872 | $ | 5,481 | $ | 3,613 | $ | 24,083 | |||||||
Asset retirement obligation (2) | 7,165 | 2,430 | 2,403 | 781 | 60 | 50,715 | 63,555 | ||||||||||||||
Drilling, Completion and Geoscience Contracts | 1,005 | — | — | — | — | — | 1,005 | ||||||||||||||
Gas transportation and Processing (3) | 14,523 | 17,750 | 17,225 | 16,856 | 14,336 | — | 80,689 | ||||||||||||||
7-1/8% senior notes due 2017 | — | 250,000 | — | — | — | 250,000 | |||||||||||||||
8-7/8% senior notes due 2020 | — | — | — | — | 225,000 | — | 225,000 | ||||||||||||||
7-7/8% senior notes due 2022 | — | — | — | — | — | 400,000 | 400,000 | ||||||||||||||
Interest Cost (4) | 78,188 | 60,375 | 51,469 | 51,469 | 41,484 | 47,250 | 330,234 | ||||||||||||||
Credit facility (5) | — | 324,900 | — | — | — | — | 324,900 | ||||||||||||||
Total | $ | 105,020 | $ | 658,742 | $ | 74,785 | $ | 72,977 | $ | 286,362 | $ | 501,579 | $ | 1,699,466 | |||||||
(1) We signed a new lease commencing on March 1, 2015. For additional discussion regarding the terms and obligations of this lease refer to Note 6 of the consolidated financial statements in this Form 10-K.
(2) Amounts shown by year are the net present value at December 31, 2015.
(3) Amounts shown represent fees for the minimum delivery obligations. Any amount of transportation utilized in excess of the minimum will reduce future year obligations.
(4) Amounts shown for 2016 include missed interest payment related to the 2017 Senior Notes originally payable in December 2015 for $8.9 million.
(5) The maturity shown is the credit facility’s original expiration date of November 2017, and does not reflect any acceleration due to filing of our Chapter 11 proceedings. If not for the automatic stay, which came into effect upon the filing of the bankruptcy cases, the credit facility would be due and payable currently. These amounts exclude $5.1 million standby letters of credit outstanding under this facility.
As of December 31, 2015, we had no off-balance sheet arrangements requiring disclosure pursuant to article 303(a) of Regulation S-K.
Proved Oil and Gas Reserves
During 2015, our reserves decreased by approximately 124 MMBoe due to the impact of lower commodity prices and uncertainties, due in part to our bankruptcy filing, surrounding the availability of the financing that would be necessary to develop our proved undeveloped reserves, as disclosed in Note 1A of the consolidated financial statements in this Form 10-K. As a result of this reduction, 80% of our total proved reserves as of December 31, 2015 were proved developed, compared with 34% at year-end 2014 and 29% at year-end 2013.
At December 31, 2015, our proved reserves were 70.3 MMBoe with a PV-10 Value of $374.0 million (PV-10 Value is a non-GAAP measure, see the section titled “Oil and Natural Gas Reserves” in our Property section for a reconciliation of this non-GAAP measure to the closest GAAP measure), a decrease in the PV-10 Value of approximately $1.6 billion, or 81%, from the prior year-end levels. In 2015, our proved natural gas reserves decreased 375.1 Bcf, or 55%, while our proved oil reserves decreased 39.6 MMBbl, or 80%, and our NGL reserves decreased 21.4 MMBbl, or 72%, for a total equivalent decrease of 124 MMBoe, or 64%.
In prior years we have added proved reserves primarily through our drilling activities, including 18.2 MMBoe added in 2014 and 76.3 MMBoe added in 2013. We obtained reasonable certainty regarding these reserves additions by applying the same methodologies that have been used historically in this area. We also sold approximately 30.9 MMBoe of reserves during 2014 in conjunction with our Fasken joint venture with Saka, as noted in Note 9 of our consolidated financial statements in this Form 10-K.
We use the preceding 12-months' average price based on closing prices on the first business day of each month, adjusted for price differentials, in calculating our average prices used in the PV-10 Value calculation. Our average natural gas price used in the PV-10 Value calculation for 2015 was $2.61 per Mcf. This average price decreased from the average price of $4.32 per Mcf used
34
in the PV-10 calculation for 2014. Our average oil price used in the PV-10 Value calculation for 2015 was $49.58 per Bbl. This average price decreased from the average price of $93.64 per Bbl used in the PV-10 calculation for 2014.
35
Results of Operations
Revenues — Years Ended December 31, 2015, 2014 and 2013
2015 - Our revenues in 2015 decreased by 55% compared to revenues in 2014, primarily due to the impact of overall lower commodity prices and lower oil and NGL volumes, partially offset by higher natural gas production. Average oil prices we received were 49% lower than those received during 2014, while natural gas prices were 39% lower, and NGL prices were 54% lower.
2014 - Our revenues in 2014 decreased by 6% compared to revenues in 2013, due to the impact of lower oil prices and production volumes, partially offset by higher natural gas production volumes and pricing. Average oil prices we received were 10% lower than those received during 2013, while natural gas prices were 17% higher, and NGL prices were 1% higher.
Crude oil production was 21%, 28% and 33% of our production volumes while crude oil sales were 46%, 59% and 69% of oil and gas sales for the years ended December 31, 2015, 2014 and 2013, respectively. Natural gas production was 67%, 57% and 47% of our production volumes while natural gas sales were 46%, 30% and 19% of oil and gas sales for the years ended December 31, 2015, 2014 and 2013, respectively. The remaining production in each year was from NGLs.
The following table provides information regarding the changes in the sources of our oil and gas sales and volumes for the years ended December 31, 2015, 2014 and 2013:
Core Areas | Oil and Gas Sales (In Millions) | Net Oil and Gas Production Volumes (MBoe) | |||||||||||||||||||
2015 | 2014 | 2013 | 2015 | 2014 | 2013 | ||||||||||||||||
Artesia Wells | $ | 19.3 | $ | 62.2 | $ | 106.3 | 1,113 | 1,786 | 2,850 | ||||||||||||
AWP | 87.1 | 224.8 | 214.1 | 3,881 | 4,636 | 4,399 | |||||||||||||||
Fasken | 72.1 | 87.2 | 30.3 | 4,841 | 3,565 | 1,473 | |||||||||||||||
Other South Texas | 3.6 | 8.2 | 9.5 | 209 | 252 | 287 | |||||||||||||||
Total South Texas | $ | 182.0 | $ | 382.4 | $ | 360.2 | 10,044 | 10,239 | 9,009 | ||||||||||||
Southeast Louisiana | 45.4 | 124.2 | 168.0 | 1,061 | 1,459 | 1,797 | |||||||||||||||
Central Louisiana | 17.7 | 39.5 | 54.9 | 583 | 656 | 897 | |||||||||||||||
Other | 1.1 | 1.7 | 2.1 | 39 | 33 | 43 | |||||||||||||||
Total | $ | 246.3 | $ | 547.8 | $ | 585.2 | 11,727 | 12,387 | 11,746 | ||||||||||||
Our production decrease from 2014 to 2015 was primarily due to decreased oil production from our AWP and Lake Washington fields and decreased NGL production from our Artesia and AWP fields, partially offset by increased natural gas production at our Fasken field.
In 2015, our $301.5 million, or 55% decrease in oil, NGL, and natural gas sales resulted from:
• | Price variances that had a $206.2 million unfavorable impact on sales, with a decrease of $109.8 million due to the 49% decrease in oil prices received, a decrease of $71.6 million attributable to the 39% decrease in natural gas prices and a decrease of $24.8 million due to the 54% decrease in NGL prices. |
• | Volume variances that had a $95.4 million unfavorable impact on sales, with a $102.5 million decrease attributable to the 1.1 million Bbl decrease in oil production volumes and a $12.1 million decrease due to the 0.4 million Bbl decrease in NGL production volumes, partially offset by a $19.2 million increase due to the 4.9 Bcf increase in natural gas production volumes. |
In 2014, our $37.4 million, or 6% increase in oil, NGL, and natural gas sales resulted from:
• | Price variances that had a $9.7 million unfavorable impact on sales, with a decrease of $35.4 million due to the 10% decrease in oil prices received, partially offset by an increase of $24.9 million attributable to the 18% increase in natural gas prices and an increase of $0.8 million due to the 1% increase in NGL prices. |
36
• | Volume variances that had a $27.7 million unfavorable impact on sales, with a $42.7 million decrease attributable to the 0.4 million Bbl decrease in oil production volumes and a $15.9 million decrease due to the 0.5 million Bbl decrease in NGL production volumes, partially offset by a $30.9 million increase due to the 9.4 Bcf increase in natural gas production volumes. |
The following table provides additional information regarding our oil and gas sales, excluding any effects of our hedging activities, by quarter, for the years ended December 31, 2015, 2014 and 2013:
Production Volume | Average Price | ||||||||||||
Oil | NGL | Gas | Combined | Oil | NGL | Gas | |||||||
(MBbl) | (MBbl) | (Bcf) | (MBoe) | (Bbl) | (Bbl) | (Mcf) | |||||||
2013 | |||||||||||||
First Quarter | 988 | 557 | 7.6 | 2,819 | $108.45 | $29.90 | $2.96 | ||||||
Second Quarter | 911 | 549 | 7.9 | 2,778 | $103.15 | $29.74 | $3.86 | ||||||
Third Quarter | 1,004 | 600 | 8.7 | 3,057 | $108.17 | $31.67 | $3.15 | ||||||
Fourth Quarter | 1,023 | 615 | 8.7 | 3,092 | $94.14 | $33.93 | $3.32 | ||||||
Total | 3,926 | 2,320 | 32.9 | 11,746 | $103.42 | $31.39 | $3.32 | ||||||
2014 | |||||||||||||
First Quarter | 931 | 478 | 9.2 | 2,944 | $99.38 | $36.27 | $4.20 | ||||||
Second Quarter | 890 | 434 | 12.7 | 3,449 | $101.67 | $33.93 | $4.16 | ||||||
Third Quarter | 870 | 482 | 9.9 | 2,994 | $96.12 | $33.39 | $3.55 | ||||||
Fourth Quarter | 820 | 418 | 10.6 | 3,000 | $71.94 | $22.74 | $3.58 | ||||||
Total | 3,511 | 1,812 | 42.4 | 12,387 | $92.74 | $31.83 | $3.88 | ||||||
2015 | |||||||||||||
First Quarter | 685 | 426 | 11.7 | 3,064 | $45.10 | $16.09 | $2.53 | ||||||
Second Quarter | 628 | 366 | 11.3 | 2,875 | $56.65 | $15.18 | $2.40 | ||||||
Third Quarter | 581 | 344 | 11.6 | 2,865 | $45.24 | $12.94 | $2.51 | ||||||
Fourth Quarter | 511 | 297 | 12.7 | 2,923 | $40.22 | $13.38 | $2.05 | ||||||
Total | 2,405 | 1,433 | 47.3 | 11,727 | $47.11 | $14.54 | $2.37 | ||||||
For the years ended December 31, 2015, 2014 and 2013, we recorded net gains (losses) of $0.2 million, $1.3 million and ($0.9) million, respectively, related to our derivative activities. This activity is recorded in “Price-risk management and other, net” on the accompanying consolidated statements of operations. Had these amounts been recognized in the oil and gas sales account, our average oil price would have been $47.11, $92.52 and $102.93 for the years ended December 31, 2015, 2014 and 2013, respectively, and our average natural gas price would have been $2.37, $3.93 and $3.35 for the years ended December 31, 2015, 2014 and 2013, respectively.
Costs and Expenses
2015 - Our expenses in 2015 decreased $126.9 million when compared to those in 2014 (excluding the 2015 and 2014 ceiling test write-downs and 2015 reorganization items resulting from the Company's bankruptcy proceedings), for the reasons noted below. During 2015, we saw a decrease in the cost of services and supplies due to the decline in commodity prices.
Lease Operating Cost. These expenses decreased $23.0 million, or 25%, compared to the level of such expenses for the year ended December 31, 2014, primarily due to lower labor costs, maintenance costs, salt water disposal costs and lower supervision fees (i.e. overhead rates) charged to LOE. Our lease operating costs per Boe produced were $5.99 and $7.52 for the years ended December 31, 2015 and 2014, respectively.
Transportation and gas processing. These expenses increased $0.6 million, or 3%, compared to the level of such expenses for the year ended December 31, 2014. Our transportation and gas processing costs per Boe produced were $1.85 and $1.71 for the years ended December 31, 2015 and 2014, respectively.
Depreciation, Depletion and Amortization (“DD&A”). These expenses decreased $90.1 million, or 34%, from those during the year ended December 31, 2014, due to decreased production and a lower depletable base. Our DD&A rate per Boe of production was $15.14 and $21.60 for the years ended December 31, 2015 and 2014, respectively.
General and Administrative Expenses, Net. These expenses increased $3.0 million or 8%, compared to the level of such expenses for the year ended December 31, 2014, due to higher legal and professional fees and lower capitalized costs, partially
37
offset by lower salaries and burdens, lower temporary labor and lower stock compensation . For the years ended December 31, 2015 and 2014, our capitalized general and administrative costs totaled $12.7 million and $26.3 million, respectively. Our net general and administrative expenses per Boe produced were $3.63 and $3.20 for the years ended December 31, 2015 and 2014, respectively. The supervision fees recorded as a reduction to general and administrative expenses were $9.2 million and $12.7 million for the years ended December 31, 2015 and 2014, respectively.
Severance and Other Taxes. These expenses decreased $19.9 million, or 54%, from the year ended December 31, 2014. Severance and other taxes, as a percentage of oil and gas sales, were approximately 6.9% and 6.8% for the years ended December 31, 2015 and 2014, respectively.
Interest. Our gross interest cost for the year ended December 31, 2015 was $80.8 million, of which $4.9 million was capitalized. Our gross interest cost for the year ended December 31, 2014 was $78.2 million, of which $5.0 million was capitalized. The increase in interest came from increased credit facility borrowings during 2015.
Write-down of oil and gas properties. Due to the effects of pricing, timing of projects, changes in our reserves product mix, and our bankruptcy filing as discussed in Note 1A, in 2015 and 2014 we reported non-cash write-downs on a before-tax basis of $1.6 billion ($1.5 billion after tax) and $445.4 million ($287.3 million after tax), respectively, for our oil and natural gas properties.
Reorganization Items. Incurred $6.6 million expense for the year ended December 31, 2015 due to the write-off of debt issuance costs, premiums and discounts associated with our senior notes as a result of our bankruptcy filing.
Income Taxes. Our effective income tax rate was 4.6% for the year ended December 31, 2015. For the year ended December 31, 2014 the rate was 34.6% due to valuation allowances offsetting tax benefits of recorded losses.
2014 - Our expenses for the year ended December 31, 2014 increased $398.7 million, or 68%, compared to the prior year levels, for the reasons noted below. Our expenses in 2014 increased $0.3 million when compared to those in 2013 (excluding the 2014 and 2013 ceiling test write-downs). During 2014, we saw some tightening in the availability of services and supplies including some upward pressure on service costs.
Lease Operating Cost. These expenses decreased $6.5 million, or 7%, compared to the level of such expenses for the year ended December 31, 2013, primarily due to lower salt water disposal, labor and maintenance costs, partially offset by higher utilities costs. Our lease operating costs per Boe produced were $7.52 and $8.49 for the years ended December 31, 2014 and 2013, respectively.
Transportation and gas processing. These expenses were comparable to the level of such expenses for the year ended December 31, 2013. Our transportation and gas processing costs per Boe produced were $1.71 and $1.79 for the years ended December 31, 2014 and 2013, respectively.
Depreciation, Depletion and Amortization (“DD&A”). These expenses increased $14.8 million, or 6%, from those during the year ended December 31, 2013, due to increased production and a higher depletable base. Our DD&A rate per Boe of production was $21.60 and $21.52 for the years ended December 31, 2014 and 2013, respectively.
General and Administrative Expenses, Net. These expenses decreased $5.8 million or 13%, compared to the level of such expenses for the year ended December 31, 2013, due to lower stock compensation, a lower benefit accrual and lower salaries, partially offset by higher legal fees and lower capitalized costs. For the years ended December 31, 2014 and 2013, our capitalized general and administrative costs totaled $26.3 million and $31.8 million, respectively. Our net general and administrative expenses per Boe produced were $3.20 and $3.87 for the years ended December 31, 2014 and 2013, respectively. The supervision fees recorded as a reduction to general and administrative expenses were $12.7 million and $11.6 million for the years ended December 31, 2014 and 2013, respectively.
Severance and Other Taxes. These expenses decreased $5.7 million, or 13%, from the year ended December 31, 2013. Severance and other taxes, as a percentage of oil and gas sales, were approximately 6.8% and 7.3% for the years ended December 31, 2014 and 2013, respectively. The change in rate was primarily driven by higher production in South Texas which carried a lower severance tax rate than in Louisiana.
Interest. Our gross interest cost for the year ended December 31, 2014 was $78.2 million, of which $5.0 million was capitalized. Our gross interest cost for the year ended December 31, 2013 was $76.6 million, of which $7.2 million was capitalized. The increase in interest came from increased credit facility borrowings during 2014.
38
Write-down of oil and gas properties. Due to the effects of pricing, timing of projects and changes in our reserves product mix, in 2014 and 2013 we reported non-cash write-downs on a before-tax basis of $445.4 million ($287.3 million after tax) and $46.9 million ($30.0 million after tax), respectively, for our oil and natural gas properties.
Income Taxes. Our effective income tax rate was 34.6% for the year ended December 31, 2014. For the year ended December 31, 2013 the rate was over 100% due to the proportional effect of non-deductible expenses compared to pre-tax book income that was close to break-even.
Critical Accounting Policies and New Accounting Pronouncements
Bankruptcy Proceedings. We have applied ASC 852 “Reorganizations” in preparing our consolidated yearly financial statements. ASC 852 requires that the financial statements, for periods subsequent to the Chapter 11 filing, distinguish transactions and events that are directly associated with the reorganization from the ongoing operations of the business. Accordingly, certain revenues, expenses, realized gains and losses and provisions for losses that are realized or incurred in the bankruptcy proceedings are recorded in Reorganization items, in the accompanying Consolidated Statements of Operations. In addition, pre-petition obligations that may be impacted by the bankruptcy reorganization process have been classified on our consolidated balance sheets at December 31, 2015 in "Liabilities Subject to Compromise". These liabilities are reported at the amounts we anticipate will be allowed by the Bankruptcy Court, even if they may be settled for lesser amounts. See Note 1A in this Form 10-K for more information regarding Liabilities Subject to Compromise and Reorganization items.
Property and Equipment. We follow the “full-cost” method of accounting for oil and natural gas property and equipment costs. Under this method of accounting, all productive and nonproductive costs incurred in the exploration, development, and acquisition of oil and natural gas reserves are capitalized including internal costs incurred that are directly related to these activities and which are not related to production, general corporate overhead, or similar activities. Future development costs are estimated on a property-by-property basis based on current economic conditions and are amortized to expense as our capitalized oil and natural gas property costs are amortized. We compute the provision for depreciation, depletion, and amortization (“DD&A”) of oil and natural gas properties using the unit-of-production method.
The costs of unproved properties not being amortized are assessed quarterly, on a property-by-property basis, to determine whether such properties have been impaired. In determining whether such costs should be impaired, we evaluate current drilling results, lease expiration dates, current oil and gas industry conditions, international economic conditions, capital availability, and available geological and geophysical information. As these factors may change from period to period, our evaluation of these factors will change. Any impairment assessed is added to the cost of proved properties being amortized.
The calculation of the provision for DD&A requires us to use estimates related to quantities of proved oil and natural gas reserves and estimates of unproved properties. The estimation process for both reserves and the impairment of unproved properties is subjective, and results may change over time based on current information and industry conditions. We believe our estimates and assumptions are reasonable; however, such estimates and assumptions are subject to a number of risks and uncertainties that may cause actual results to differ materially from such estimates.
Full-Cost Ceiling Test. At the end of each quarterly reporting period, the unamortized cost of oil and natural gas properties (including natural gas processing facilities, capitalized asset retirement obligations and deferred income taxes, and excluding the recognized asset retirement obligation liability) is limited to the sum of the estimated future net revenues from proved properties (excluding cash outflows from recognized asset retirement obligations, including future development and abandonment costs of wells to be drilled, using the preceding 12-months’ average price based on closing prices on the first day of each month, adjusted for price differentials, discounted at 10%, and the lower of cost or fair value of unproved properties) adjusted for related income tax effects ("Ceiling Test").
Principally due to the effects of pricing, and also due to the timing of projects, changes in our reserves product mix, and the effect of our bankruptcy filing as discussed in Note 1A, in 2015 and 2014 we reported non-cash write-downs on a before-tax basis of $1.6 billion ($1.5 billion after tax) and $445.4 million ($287.3 million after tax), respectively, on our oil and natural gas properties.
We believe our estimates and assumptions are reasonable; however, such estimates and assumptions are subject to a number of risks and uncertainties that may cause actual results to differ materially from such estimates.
If oil and natural gas prices remain low or decline from the prices used in the Ceiling Test, it is likely that additional non-cash write-downs of oil and gas properties will occur in the future. If future capital expenditures out pace future discounted net cash flows in our reserve calculations or if we have significant declines in our oil and natural gas reserves volumes, which also reduces our estimate of discounted future net cash flows from proved oil and natural gas reserves, non-cash write-downs of our oil and
39
natural gas properties would occur in the future. We cannot control and cannot predict what future prices for oil and natural gas will be, thus we cannot estimate the amount or timing of any potential future non-cash write-down of our oil and natural gas properties if a decrease in oil and/or natural gas prices were to occur. However, due to current trends in commodity pricing it is likely that we will record additional ceiling test write-downs in future periods.
New Accounting Pronouncements. In May 2014, the FASB issued ASU 2014-09 which provides a single, comprehensive revenue recognition model for all contracts with customers across various industries. The guidance is effective for annual and interim reporting periods beginning after December 15, 2016. We have not completed our review of these new requirements to determine the impact of this guidance on our financial statements.
In April 2015, the FASB issued ASU 2015-03, providing guidance on the presentation of debt issuance costs. The guidance requires debt issuance costs related to our debt to be presented on the balance sheet as a reduction of the carrying amount of the debt liability. This guidance is effective for fiscal years beginning after December 15, 2015 and for interim periods within those fiscal years, with early adoption permitted and retrospective application required. This guidance, which we plan to adopt beginning with the first quarter of 2016, is not expected to have a material impact on our financial statements.
In July 2015, the FASB issued ASU 2015-11, which changes the measurement principle for inventory from the lower of cost or market to “lower of cost and net realizable value.” The standard simplifies the current guidance under which an entity must measure inventory at the lower of cost or market (market in this context is defined as one of three different measures, one of which is net realizable value). Net realizable value is defined as the “estimated selling price in the ordinary course of business, less reasonably predictable costs of completion, disposal and transportation.” The guidance is effective for fiscal years beginning after December 15, 2016, including interim periods thereafter, and must be applied prospectively after the date of adoption. We are currently reviewing the new requirement to determine the impact of this guidance on our financial statements.
In November 15, the FASB issued ASU 2015-17, which requires companies to classify all deferred tax assets and liabilities as non-current on the balance sheet instead of separating deferred taxes into current and non-current amounts. The guidance is effective for fiscal years beginning after December 15, 2016, including interim periods thereafter, with early adoption permitted and either with prospective or retrospective application permitted. We do not expect this new guidance to have a material impact on our financial statements.
40
Forward-Looking Statements
This report includes forward-looking statements intended to qualify for the safe harbors from liability established by the Private Securities Litigation Reform Act of 1995, Section 27A of the Securities Act of 1933, as amended, and Section 21E of the Securities Exchange Act of 1934, as amended. These forward-looking statements are subject to a number of risks and uncertainties, many of which are beyond our control. All statements, other than statements of historical fact included in this report, regarding our strategy, future operations, financial position, estimated production levels, reserve increases, capital expenditures, projected costs, prospects, plans and objectives of management are forward-looking statements. When used in this report, the words "could," "believe," "anticipate," "intend," "estimate," “budgeted”, "expect," "may," continue," "predict," "potential," "project" and similar expressions are intended to identify forward-looking statements, although not all forward-looking statements contain such identifying words.
Forward-looking statements may include statements about our:
• expectations regarding the outcome of our bankruptcy proceedings, including our ability to confirm our plan of
reorganization and emerge from bankruptcy;
• future cash flows and their adequacy to fund the costs of our bankruptcy proceedings and our ongoing operations;
• our plan of reorganization filed in connection with our bankruptcy proceedings;
• oil and natural gas pricing expectations;
• liquidity, including our ability to satisfy our short- or long-term liquidity needs;
• business strategy, including our business strategy post-emergence from bankruptcy;
• estimated oil and natural gas reserves or the present value thereof;
• our borrowing capacity, future covenant compliance, cash flows and liquidity;
• financial strategy, budget, projections and operating results;
• asset disposition efforts or the timing or outcome thereof;
• prospective joint ventures, their structure and substance, and the likelihood of their finalization or the timing thereof;
• the amount, nature and timing of capital expenditures, including future development costs;
• timing, cost and amount of future production of oil and natural gas;
• availability of drilling and production equipment or availability of oil field labor;
• availability, cost and terms of capital;
• drilling of wells;
• availability and cost for transportation of oil and natural gas;
• costs of exploiting and developing our properties and conducting other operations;
• competition in the oil and natural gas industry;
• general economic conditions;
• opportunities to monetize assets;
• effectiveness of our risk management activities;
• environmental liabilities;
• counterparty credit risk;
• governmental regulation and taxation of the oil and natural gas industry;
• developments in world oil markets and in oil and natural gas-producing countries;
• uncertainty regarding our future operating results; and
• plans, objectives, expectations and intentions contained in this report that are not historical.
All forward-looking statements speak only as of the date they are made. You should not place undue reliance on these forward-looking statements. Although we believe that our plans, intentions and expectations reflected in or suggested by the forward-looking statements we make in this report are reasonable, we can give no assurance that these plans, intentions or expectations will be achieved. We disclose important factors that could cause our actual results to differ materially from our expectations under "Risk factors" in Item 1A of our annual report on Form 10-K for the year ended December 31, 2015. These cautionary statements qualify all forward-looking statements attributable to us or persons acting on our behalf.
41
All subsequent written and oral forward-looking statements attributable to us or to persons acting on our behalf are expressly qualified in their entirety by the foregoing. We undertake no obligation to publicly release the results of any revisions to any such forward-looking statements that may be made to reflect events or circumstances after the date of this report or to reflect the occurrence of unanticipated events.
42
Item 7A. Quantitative and Qualitative Disclosures About Market Risk
Commodity Risk. Our major market risk exposure is the commodity pricing applicable to our oil and natural gas production. Realized commodity prices received for such production are primarily driven by the prevailing worldwide price for crude oil and spot prices applicable to natural gas. This commodity pricing volatility has continued with unpredictable price swings in recent periods.
Our price-risk management policy permits the utilization of agreements and financial instruments (such as futures, forward contracts, swaps and options contracts) to mitigate price risk associated with fluctuations in oil and natural gas prices. We do not utilize these agreements and financial instruments for trading and only enter into derivative agreements with banks in our credit facility. For additional discussion related to our price-risk management policy, refer to Note 5 of the consolidated financial statements in this Form 10-K.
Income Tax Carryforwards. As of December 31, 2015, the Company has net deferred tax carryforward assets of $287.7 million for federal net operating losses, $2.1 million for federal alternative minimum tax credits and $18.4 million for deferred state tax net operating loss carryforwards. In management's judgment it is more likely than not that the company will not be able to utilize these carryforward assets to reduce future taxes. Accordingly these carryovers are all fully reserved by a valuation allowance.
Customer Credit Risk. We are exposed to the risk of financial non-performance by customers. Our ability to collect on sales to our customers is dependent on the liquidity of our customer base. Continued volatility in both credit and commodity markets may reduce the liquidity of our customer base. To manage customer credit risk, we monitor credit ratings of customers and from certain customers we also obtain letters of credit, parent company guarantees if applicable, and other collateral as considered necessary to reduce risk of loss. Due to availability of other purchasers, we do not believe the loss of any single oil or natural gas customer would have a material adverse effect on our results of operations.
Concentration of Sales Risk. Over the last several years, a large portion of our oil and gas sales have been to Shell Oil Corporation and affiliates and we expect to continue this relationship in the future. For the years ended December 31, 2015, 2014 and 2013, Shell Oil Company and affiliates accounted for 16%, 21% and 33% of our total oil and gas gross receipts, respectively. We believe that the risk of these unsecured receivables is mitigated by the short-term sales agreements we have in place as well as the size, reputation and nature of their business.
Interest Rate Risk. Our senior notes due in 2017, 2020 and 2022 have fixed interest rates, so consequently we are not exposed to cash flow risk from market interest rate changes on these notes. At December 31, 2015, we had $324.9 million drawn under our credit facility, which bears a floating rate of interest and therefore is susceptible to interest rate fluctuations. The result of a 10% fluctuation in the bank’s base rate would constitute 35 basis points and would not have a material adverse effect on our future cash flows.
43
Item 8. Financial Statements and Supplementary Data | Page | |
Management's Report on Internal Control Over Financial Reporting | ||
Report of Independent Registered Public Accounting Firm on Internal Control Over Financial Reporting | ||
Report of Independent Registered Public Accounting Firm on Consolidated Financial Statements | ||
Consolidated Balance Sheets | ||
Consolidated Statements of Operations | ||
Consolidated Statements of Stockholders' Equity | ||
Consolidated Statements of Cash Flows | ||
Notes to Consolidated Financial Statements | ||
Supplementary Information | ||
44
Management's Report on Internal Control Over Financial Reporting
Management of Swift Energy Company is responsible for establishing and maintaining adequate internal control over financial reporting as defined in Rules 13a-15(f) and 15d-15(f) under the Securities Exchange Act of 1934. The Company's internal control over financial reporting is a process designed by, or under the supervision of, the Company's Chief Executive Officer and Chief Financial Officer to provide reasonable assurance regarding the reliability of financial reporting and the preparation of the Company's financial statements for external purposes in accordance with U. S. generally accepted accounting principles.
Management of the Company assessed the effectiveness of the Company's internal control over financial reporting as of December 31, 2015. In making this assessment, management used the criteria set forth by the Committee of Sponsoring Organizations of the Treadway Commission (the COSO criteria) (2013 framework) in Internal Control-Integrated Framework. Based on our assessment and those criteria, management determined that the Company maintained effective internal control over financial reporting as of December 31, 2015.
Because of its inherent limitations, internal control over financial reporting may not prevent or detect misstatements. Therefore, even those systems determined to be effective can provide only reasonable assurance of achieving their control objectives. Also, projections of any evaluation of effectiveness to future periods are subject to the risk that controls may become inadequate because of changes in conditions, or that the degree of compliance with the policies or procedures may deteriorate.
Ernst & Young LLP, the independent registered public accounting firm that audited the consolidated financial statements of the Company included in this Annual Report on Form 10-K, has issued an attestation report on the Company's internal control over financial reporting as of December 31, 2015, based on their audit. The Public Company Accounting Oversight Board (United States) standards require that they plan and perform the audit to obtain reasonable assurance about whether effective internal control over financial reporting was maintained in all material respects. Their audit included obtaining an understanding of internal control over financial reporting, assessing the risk that a material weakness exists, testing and evaluating the design and operating effectiveness of internal control based on the assessed risk, and performing such other procedures as they considered necessary in the circumstances.
45
Report of Independent Registered Public Accounting Firm
The Board of Directors and Stockholders of Swift Energy Company
We have audited Swift Energy Company and subsidiaries’ (debtor-in-possession) (the “Company”) internal control over financial reporting as of December 31, 2015, based on criteria established in Internal Control-Integrated Framework issued by the Committee of Sponsoring Organizations of the Treadway Commission (2013 framework) (the COSO criteria). Swift Energy Company and subsidiaries’ (debtor-in-possession) management is responsible for maintaining effective internal control over financial reporting, and for its assessment of the effectiveness of internal control over financial reporting included in the accompanying Management’s Report on Internal Control Over Financial Reporting. Our responsibility is to express an opinion on the Company’s internal control over financial reporting based on our audit.
We conducted our audit in accordance with the standards of the Public Company Accounting Oversight Board (United States). Those standards require that we plan and perform the audit to obtain reasonable assurance about whether effective internal control over financial reporting was maintained in all material respects. Our audit included obtaining an understanding of internal control over financial reporting, assessing the risk that a material weakness exists, testing and evaluating the design and operating effectiveness of internal control based on the assessed risk, and performing such other procedures as we considered necessary in the circumstances. We believe that our audit provides a reasonable basis for our opinion.
A company’s internal control over financial reporting is a process designed to provide reasonable assurance regarding the reliability of financial reporting and the preparation of financial statements for external purposes in accordance with generally accepted accounting principles. A company’s internal control over financial reporting includes those policies and procedures that (1) pertain to the maintenance of records that, in reasonable detail, accurately and fairly reflect the transactions and dispositions of the assets of the company; (2) provide reasonable assurance that transactions are recorded as necessary to permit preparation of financial statements in accordance with generally accepted accounting principles, and that receipts and expenditures of the company are being made only in accordance with authorizations of management and directors of the company; and (3) provide reasonable assurance regarding prevention or timely detection of unauthorized acquisition, use, or disposition of the company’s assets that could have a material effect on the financial statements.
Because of its inherent limitations, internal control over financial reporting may not prevent or detect misstatements. Also, projections of any evaluation of effectiveness to future periods are subject to the risk that controls may become inadequate because of changes in conditions, or that the degree of compliance with the policies or procedures may deteriorate.
In our opinion, Swift Energy Company and subsidiaries (debtor-in-possession) maintained, in all material respects, effective internal control over financial reporting as of December 31, 2015, based on the COSO criteria.
We also have audited, in accordance with the standards of the Public Company Accounting Oversight Board (United States), the consolidated balance sheets of Swift Energy Company and subsidiaries (debtor-in-possession) as of December 31, 2015 and 2014, and the related consolidated statements of operations, stockholders’ equity and cash flows for each of the three years in the period ended December 31, 2015 of Swift Energy Company and subsidiaries (debtor-in-possession) and our report dated March 4, 2016 expressed an unqualified opinion that included an explanatory paragraph regarding the Company’s ability to continue as a going concern.
/s/ ERNST & YOUNG LLP
Houston, Texas
March 4, 2016
46
Report of Independent Registered Public Accounting Firm
The Board of Directors and Stockholders of Swift Energy Company
We have audited the accompanying consolidated balance sheets of Swift Energy Company and subsidiaries (debtor-in-possession) (the "Company”) as of December 31, 2015 and 2014, and the related consolidated statements of operations, stockholders' equity and cash flows for each of the three years in the period ended December 31, 2015. These financial statements are the responsibility of the Company's management. Our responsibility is to express an opinion on these financial statements based on our audits.
We conducted our audits in accordance with the standards of the Public Company Accounting Oversight Board (United States). Those standards require that we plan and perform the audit to obtain reasonable assurance about whether the financial statements are free of material misstatement. An audit includes examining, on a test basis, evidence supporting the amounts and disclosures in the financial statements. An audit also includes assessing the accounting principles used and significant estimates made by management, as well as evaluating the overall financial statement presentation. We believe that our audits provide a reasonable basis for our opinion.
In our opinion, the financial statements referred to above present fairly, in all material respects, the consolidated financial position of Swift Energy Company and subsidiaries (debtor-in-possession) at December 31, 2015 and 2014, and the consolidated results of their operations and their cash flows for each of the three years in the period ended December 31, 2015, in conformity with U.S. generally accepted accounting principles.
The accompanying consolidated financial statements have been prepared assuming that the Company will continue as a going concern. As discussed in Note 1A to the financial statements, Swift Energy Company (debtor-in-possession) filed for relief under Chapter 11 of Title 11 of the United States Bankruptcy Code on December 31, 2015. This condition raises substantial doubt about the Company’s ability to continue as a going concern. Management’s plans in regard to these matters also are described in Note 1A. The 2015 consolidated financial statements do not include any adjustments to reflect the possible future effects on the recoverability and classification of assets or the amounts and classification of liabilities that may result from the outcome of this uncertainty.
We also have audited, in accordance with the standards of the Public Company Accounting Oversight Board (United States), Swift Energy Company and subsidiaries’ (debtor-in-possession) internal control over financial reporting as of December 31, 2015, based on criteria established in Internal Control-Integrated Framework issued by the Committee of Sponsoring Organizations of the Treadway Commission (2013 framework) and our report dated March 4, 2016 expressed an unqualified opinion thereon.
/s/ ERNST & YOUNG LLP
Houston, Texas
March 4, 2016
47
Consolidated Balance Sheets
Swift Energy Company and Subsidiaries (Debtor-in-Possession) (in thousands, except share amounts)
December 31, 2015 | December 31, 2014 | ||||||
ASSETS | |||||||
Current Assets: | |||||||
Cash and cash equivalents | $ | 29,460 | $ | 406 | |||
Accounts receivable | 21,704 | 48,451 | |||||
Deferred tax asset | — | 6,243 | |||||
Other current assets | 10,683 | 9,569 | |||||
Total Current Assets | 61,847 | 64,669 | |||||
Property and Equipment: | |||||||
Property and Equipment, including $18,839 and $64,903 of unproved property costs not being amortized, respectively | 6,035,757 | 5,934,155 | |||||
Less – Accumulated depreciation, depletion, and amortization | (5,577,854 | ) | (3,839,118 | ) | |||
Property and Equipment, Net | 457,903 | 2,095,037 | |||||
Other Long-Term Assets | 5,248 | 13,641 | |||||
Total Assets | $ | 524,998 | $ | 2,173,347 | |||
LIABILITIES AND STOCKHOLDERS’ EQUITY | |||||||
Current Liabilities: | |||||||
Accounts payable and accrued liabilities | 7,663 | 68,244 | |||||
Accrued capital costs | — | 41,461 | |||||
Accrued interest | 490 | 21,389 | |||||
Undistributed oil and gas revenues | — | 17,825 | |||||
Current portion of long-term debt | 324,900 | — | |||||
Total Current Liabilities | 333,053 | 148,919 | |||||
Long-term debt | — | 1,074,534 | |||||
Deferred tax liabilities | — | 86,376 | |||||
Asset retirement obligations | 56,390 | 62,122 | |||||
Other long-term liabilities | 3,891 | 7,018 | |||||
Liabilities subject to compromise | 984,388 | — | |||||
Commitments and Contingencies | — | — | |||||
Stockholders' Equity: | |||||||
Preferred stock, $.01 par value, 5,000,000 shares authorized, none outstanding | — | — | |||||
Common stock, $.01 par value, 150,000,000 shares authorized, 44,771,258 and 44,379,463 shares issued, and 44,591,863 and 43,918,029 shares outstanding, respectively | 448 | 444 | |||||
Additional paid-in capital | 776,358 | 771,972 | |||||
Treasury stock held, at cost, 179,395 and 461,434 shares, respectively | (2,491 | ) | (9,855 | ) | |||
Retained earnings (Accumulated deficit) | (1,627,039 | ) | 31,817 | ||||
Total Stockholders’ Equity (Deficit) | (852,724 | ) | 794,378 | ||||
Total Liabilities and Stockholders’ Equity | $ | 524,998 | $ | 2,173,347 | |||
See accompanying Notes to Consolidated Financial Statements. | |||||||
48
Consolidated Statements of Operations
Swift Energy Company and Subsidiaries (Debtor-in-Possession) (in thousands, except per-share amounts)
Year Ended December 31, | |||||||||||
2015 | 2014 | 2013 | |||||||||
Revenues: | |||||||||||
Oil and gas sales | $ | 246,270 | $ | 547,790 | $ | 585,229 | |||||
Price-risk management and other, net | (1,549 | ) | 1,666 | (828 | ) | ||||||
Total Revenues | 244,721 | 549,456 | 584,401 | ||||||||
Costs and Expenses: | |||||||||||
General and administrative, net | 42,611 | 39,629 | 45,423 | ||||||||
Depreciation, depletion, and amortization | 177,512 | 267,590 | 252,769 | ||||||||
Accretion of asset retirement obligation | 5,572 | 5,712 | 6,181 | ||||||||
Lease operating cost | 70,188 | 93,214 | 99,731 | ||||||||
Transportation and gas processing | 21,741 | 21,140 | 21,044 | ||||||||
Severance and other taxes | 17,090 | 37,038 | 42,725 | ||||||||
Interest expense, net | 75,870 | 73,207 | 69,382 | ||||||||
Write-down of oil and gas properties | 1,562,086 | 445,396 | 46,948 | ||||||||
Reorganization items | 6,565 | — | — | ||||||||
Total Costs and Expenses | 1,979,235 | 982,926 | 584,203 | ||||||||
Income (Loss) Before Income Taxes | (1,734,514 | ) | (433,470 | ) | 198 | ||||||
Provision (Benefit) for Income Taxes | (80,543 | ) | (150,043 | ) | 2,640 | ||||||
Net Income (Loss) | $ | (1,653,971 | ) | $ | (283,427 | ) | $ | (2,442 | ) | ||
Per Share Amounts- | |||||||||||
Basic: Net Income (Loss) | $ | (37.20 | ) | $ | (6.47 | ) | $ | (0.06 | ) | ||
Diluted: Net Income (Loss) | $ | (37.20 | ) | $ | (6.47 | ) | $ | (0.06 | ) | ||
Weighted Average Shares Outstanding - Basic | 44,463 | 43,795 | 43,331 | ||||||||
Weighted Average Shares Outstanding - Diluted | 44,463 | 43,795 | 43,331 | ||||||||
See accompanying Notes to Consolidated Financial Statements. | |||||||||||
49
Consolidated Statements of Stockholders’ Equity
Swift Energy Company and Subsidiaries (Debtor-in-Possession) (in thousands, except share amounts)
Common Stock | Additional Paid-in Capital | Treasury Stock | Retained Earnings (Deficit) | Total | |||||||||||||||
Balance, December 31, 2012 | $ | 435 | $ | 748,517 | $ | (13,855 | ) | $ | 317,686 | $ | 1,052,783 | ||||||||
Stock issued for benefit plans (104,890 shares) | — | (1,171 | ) | 2,793 | — | 1,622 | |||||||||||||
Shares issued from option exercises (1,125 shares) | — | 4 | — | — | 4 | ||||||||||||||
Purchase of treasury shares (98,020 shares) | — | — | (1,513 | ) | — | (1,513 | ) | ||||||||||||
Tax deficiency from share-based compensation | — | (1,607 | ) | — | — | (1,607 | ) | ||||||||||||
Employee stock purchase plan (72,273 shares) | 1 | 945 | — | — | 946 | ||||||||||||||
Issuance of restricted stock (391,581 shares) | 3 | (3 | ) | — | — | — | |||||||||||||
Amortization of share-based compensation | — | 15,557 | — | — | 15,557 | ||||||||||||||
Net Income (Loss) | — | — | — | (2,442 | ) | (2,442 | ) | ||||||||||||
Balance, December 31, 2013 | $ | 439 | $ | 762,242 | $ | (12,575 | ) | $ | 315,244 | $ | 1,065,350 | ||||||||
Stock issued for benefit plans (154,665 shares) | — | (1,876 | ) | 3,785 | — | 1,909 | |||||||||||||
Purchase of treasury shares (102,673 shares) | — | — | (1,065 | ) | — | (1,065 | ) | ||||||||||||
Employee stock purchase plan (71,825 shares) | 1 | 823 | — | — | 824 | ||||||||||||||
Issuance of restricted stock (392,292 shares) | 4 | (4 | ) | — | — | — | |||||||||||||
Amortization of share-based compensation | — | 10,787 | — | — | 10,787 | ||||||||||||||
Net Income (Loss) | — | — | — | (283,427 | ) | (283,427 | ) | ||||||||||||
Balance, December 31, 2014 | $ | 444 | $ | 771,972 | $ | (9,855 | ) | $ | 31,817 | $ | 794,378 | ||||||||
Stock issued for benefit plans (352,476 shares) | — | (1,714 | ) | 7,518 | (4,885 | ) | 919 | ||||||||||||
Purchase of treasury shares (70,437 shares) | — | — | (154 | ) | — | (154 | ) | ||||||||||||
Employee stock purchase plan (87,629 shares) | 1 | 301 | — | — | 302 | ||||||||||||||
Issuance of restricted stock (304,166 shares) | 3 | (3 | ) | — | — | — | |||||||||||||
Amortization of share-based compensation | — | 5,802 | — | — | 5,802 | ||||||||||||||
Net Income (Loss) | — | — | — | (1,653,971 | ) | (1,653,971 | ) | ||||||||||||
Balance, December 31, 2015 | $ | 448 | $ | 776,358 | $ | (2,491 | ) | $ | (1,627,039 | ) | $ | (852,724 | ) | ||||||
See accompanying Notes to Consolidated Financial Statements. | |||||||||||||||||||
50
Consolidated Statements of Cash Flows
Swift Energy Company and Subsidiaries (Debtor-in-Possession) (in thousands)
Year Ended December 31, | |||||||||||
2015 | 2014 | 2013 | |||||||||
Cash Flows from Operating Activities: | |||||||||||
Net income (loss) | $ | (1,653,971 | ) | $ | (283,427 | ) | $ | (2,442 | ) | ||
Adjustments to reconcile net income (loss) to net cash provided by operating activities- | |||||||||||
Write-down of oil and gas properties | 1,562,086 | 445,396 | 46,948 | ||||||||
Depreciation, depletion, and amortization | 177,512 | 267,590 | 252,769 | ||||||||
Accretion of asset retirement obligation | 5,572 | 5,712 | 6,181 | ||||||||
Deferred income taxes | (80,133 | ) | (150,357 | ) | 2,647 | ||||||
Share-based compensation expense | 4,435 | 7,309 | 10,099 | ||||||||
Reorganization items (non-cash) | 6,565 | — | — | ||||||||
Other | (831 | ) | (8,910 | ) | (5,443 | ) | |||||
Change in assets and liabilities- | |||||||||||
(Increase) decrease in accounts receivable | 26,747 | 21,411 | (1,894 | ) | |||||||
Increase (decrease) in accounts payable and accrued liabilities | (15,003 | ) | 1,505 | 2,607 | |||||||
Increase (decrease) in income taxes payable | (435 | ) | 314 | (224 | ) | ||||||
Increase (decrease) in accrued interest | 9,730 | (172 | ) | 199 | |||||||
Net Cash Provided by Operating Activities | 42,274 | 306,371 | 311,447 | ||||||||
Cash Flows from Investing Activities: | |||||||||||
Additions to property and equipment | (139,688 | ) | (386,336 | ) | (540,368 | ) | |||||
Proceeds from the sale of property and equipment | 1,164 | 145,035 | 6,991 | ||||||||
Funds withdrawn from restricted cash account | — | 25,994 | — | ||||||||
Funds deposited into restricted cash account | — | (25,994 | ) | — | |||||||
Net Cash Used in Investing Activities | (138,524 | ) | (241,301 | ) | (533,377 | ) | |||||
Cash Flows from Financing Activities: | |||||||||||
Proceeds from bank borrowings | 281,100 | 487,400 | 622,500 | ||||||||
Payments of bank borrowings | (153,500 | ) | (555,100 | ) | (396,900 | ) | |||||
Net proceeds from issuances of common stock | 302 | 824 | 950 | ||||||||
Purchase of treasury shares | (154 | ) | (1,065 | ) | (1,513 | ) | |||||
Payments of debt issuance costs | (2,444 | ) | — | — | |||||||
Net Cash Provided by (Used in) Financing Activities | 125,304 | (67,941 | ) | 225,037 | |||||||
Net Increase (Decrease) in Cash and Cash Equivalents | 29,054 | (2,871 | ) | 3,107 | |||||||
Cash and Cash Equivalents at Beginning of Period | 406 | 3,277 | 170 | ||||||||
Cash and Cash Equivalents at End of Period | $ | 29,460 | $ | 406 | $ | 3,277 | |||||
Supplemental Disclosures of Cash Flows Information: | |||||||||||
Cash paid during period for interest, net of amounts capitalized | $ | 63,132 | $ | 70,933 | $ | 67,070 | |||||
Cash paid during period for income taxes | $ | 450 | $ | 150 | $ | 217 | |||||
See accompanying Notes to Consolidated Financial Statements. | |||||||||||
51
Notes to Consolidated Financial Statements
Swift Energy Company and Subsidiaries
1A. Chapter 11 Proceedings
On December 31, 2015, the Company and eight of its subsidiaries including Swift Energy International, Inc., Swift Energy Group, Inc., Swift Energy USA, Inc., Swift Energy Alaska, Inc., Swift Energy Operating, LLC, GASRS LLC, SWENCO-Western, LLC and Swift Energy Exploration Services, Inc. (the “Chapter 11 Subsidiaries”) filed voluntary petitions seeking relief under Chapter 11 of Title 11 of the United States Bankruptcy Code in the United States Bankruptcy Court for the district of Delaware (In re Swift Energy Company, et al, Case No. 15-12670). The Chapter 11 bankruptcy proceedings do not include our international subsidiaries, which are 100% owned by our domestic subsidiary Swift Energy International, Inc.
Debtor-In-Possession. The Company and the Chapter 11 Subsidiaries are currently operating our business as debtors in possession in accordance with the applicable provisions of the Bankruptcy Code. The Bankruptcy Court has granted all motions filed by the Company and the Chapter 11 Subsidiaries that were designed primarily to minimize the impact of the Chapter 11 proceedings on the Company’s operations, customers and employees. As a result, the Company is not only able to conduct normal business activities and pay all associated obligations for the period following its bankruptcy filing, it is also authorized to pay and has paid (subject to caps applicable to payments of certain pre-petition obligations) pre-petition employee wages and benefits, pre-petition amounts owed to certain lienholders and critical vendors, pre-petition amounts owed to pipeline owners that transport the Company's production, and funds belonging to third parties, including royalty holders and partners. During the pendency of the Chapter 11 case, all transactions outside the ordinary course of our business require the prior approval of the Bankruptcy Court.
Automatic Stay. Subject to certain specific exceptions under the Bankruptcy Code, the Chapter 11 filings automatically stayed most judicial or administrative actions against the Company and efforts by creditors to collect on or otherwise exercise rights or remedies with respect to pre-petition claims. As a result, for example, most creditor actions to obtain possession of property from the Company or any of the Chapter 11 Subsidiaries, or to create, perfect or enforce any lien against the property of the Company or any of the Chapter 11 Subsidiaries, or to collect on or otherwise exercise rights or remedies with respect to a pre-petition claim are stayed.
Restructuring Support Agreement. Immediately prior to the Chapter 11 filings, a majority of the holders of the Company’s senior notes agreed, pursuant to a restructuring support agreement (the “RSA”), to support a plan under which all of the Company’s senior notes are converted to equity. Under the RSA, holders of the senior notes, and certain unsecured creditors and lenders under the DIP Credit Agreement (see below “Debtor-in-Possession Financing”) are to receive ninety-six percent (96%) of the reorganized company's common stock in exchange for the senior notes, and the existing equity holders are entitled to receive the remaining four percent (4%) of the reorganized company's common stock on a fully diluted basis, subject only to dilution as a result of a proposed new management incentive program. Existing equity holders are also entitled to receive warrants for up to 30% of the reorganized company's equity. Under the RSA, Dean Swick, Managing Director at Alvarez & Marsal North America, LLC, has been appointed to act as Chief Restructuring Officer during the reorganization process.
The RSA includes an agreed timeline for the Chapter 11 proceedings that, if met, would result in the Company emerging from bankruptcy within 110 days of the date the Chapter 11 cases were filed.
Plan of Reorganization. On February 5, 2016, the Company and the Chapter 11 Subsidiaries filed with the Bankruptcy Court a joint plan of reorganization (the “Plan”), which is supported by an ad hoc committee of the Company’s noteholders, and a related disclosure statement. The Plan is subject to approval by the Bankruptcy Court. The Bankruptcy Court has approved the Company’s disclosure statement with respect to the Plan, and the Company is in the process of soliciting votes with respect to the Plan. A confirmation hearing on the Plan is scheduled on March 30, 2016 in the Bankruptcy Court.
If the Plan is ultimately approved by the Bankruptcy Court, the Company and the Chapter 11 Subsidiaries would exit bankruptcy pursuant to the terms of the Plan. Under the Plan, the claims against and interests in the Company and the Chapter 11 Subsidiaries are grouped into classes based, in part, on their respective priority. The Plan provides that, upon emergence from bankruptcy:
• | the approximately $906 million of indebtedness outstanding on account of the Company’s senior notes and certain other unsecured claims will be exchanged for 88.5% of the post-emergence Company’s common stock; |
• | the lenders under the DIP Credit Agreement (as more fully described below under “Debtor-In-Possession Financing”) will receive a backstop fee consisting of 7.5% of the post-emergence Company’s common stock; |
• | the Company’s current common stock will be canceled and the current shareholders will be entitled to receive the remaining 4% of the post-emergence Company’s common stock and certain warrants; and |
• | claims of other creditors will be paid in full in cash, reinstated or otherwise treated in a manner acceptable to the creditors. |
52
The Plan also provides that the post-emergence Company’s new board of directors will be made up of seven directors consisting of the Chief Executive Officer of the post-emergence Company, two directors appointed by Strategic Value Partners LLC, a current holder of the Company’s senior notes, two directors appointed by other current holders of the Company’s senior notes, and two independent directors (one of whom will be the new Chairman of the Board).
The Plan is subject to acceptance by certain holders of claims against the Company and the Chapter 11 Subsidiaries and confirmation by the Bankruptcy Court. The Plan is deemed accepted by a class of claims entitled to vote if at least one-half in number and two-thirds in dollar amount of claims actually voting in the class has voted to accept the Plan.
Under certain circumstances set forth in the Bankruptcy Code, the Bankruptcy Court may confirm a plan even if such plan has not been accepted by all impaired classes of claims and equity interests. In particular, a plan may be compelled on a rejecting class if the proponent of the plan demonstrates that (1) no class junior to the rejecting class is receiving or retaining property under the plan and (2) no class of claims or interests senior to the rejecting class is being paid more than in full.
Executory Contracts. Subject to certain exceptions, under the Bankruptcy Code, the Company and the Chapter 11 Subsidiaries may assume, assign, or reject certain executory contracts and unexpired leases subject to the approval of the Bankruptcy Court and certain other conditions. The rejection of an executory contract or unexpired lease is generally treated as a pre-petition breach of such executory contract or unexpired lease and, subject to certain exceptions, relieves the Company and the Chapter 11 Subsidiaries of performing their future obligations under such executory contract or unexpired lease but may give rise to a pre-petition general unsecured claim for damages caused by such deemed breach. Counterparties to rejected contracts or leases may assert claims against the Company or any of the Chapter 11 Subsidiaries, as applicable, for such damages. The assumption of an executory contract or unexpired lease generally requires the Company and the Chapter 11 Subsidiaries to cure existing monetary defaults under such executory contract or unexpired lease and provide adequate assurance of future performance. Any description of the treatment of an executory contract or unexpired lease with the Company or any of the Chapter 11 Subsidiaries, including any description of the obligations under any such executory contract or unexpired lease of the Company or any of the Chapter 11 Subsidiaries, is qualified by and subject to any rights we have with respect to executory contacts and unexpired leases under the Bankruptcy Code.
Potential Claims. The Company and the Chapter 11 Subsidiaries have filed with the Bankruptcy Court Schedules and Statements setting forth, among other things, the assets and liabilities of the Company and each of the Chapter 11 Subsidiaries, subject to the assumptions filed in connection therewith. The Schedules and Statements may be subject to further amendment or modification after filing. Certain holders of pre-petition claims are required to file proofs of claim by the Bar Date.
Differences between amounts scheduled by the Company and the Chapter 11 Subsidiaries and claims by creditors will be investigated and resolved in connection with the claims resolution process. In light of the expected number of creditors, the claims resolution process may take considerable time to complete and will likely continue after our emergence from bankruptcy. Accordingly, the ultimate number and amount of allowed claims is not presently known, nor can the ultimate recovery with respect to allowed claims be presently ascertained.
Chapter 11 Filing Impact on Creditors and Stockholders. Under the priority requirements established by the Bankruptcy Code, unless creditors agree otherwise, pre-petition liabilities to creditors and post-petition liabilities must be satisfied in full before the holders of our existing common stock are entitled to receive any distribution or retain any property under a plan of reorganization. The ultimate recovery to creditors and/or stockholders, if any, will not be determined until confirmation and implementation of a plan or plans of reorganization. The outcome of the Chapter 11 case remains uncertain at this time and, as a result, we cannot accurately estimate the amounts or value of distributions that creditors and stockholders may receive. It is possible that stockholders will receive no distribution on account of their interests.
Debtor-In-Possession Financing. In connection with the pre-petition negotiations of the RSA, certain holders of the Company’s senior notes agreed to provide the Company and the Chapter 11 Subsidiaries a debtor in possession facility (the “DIP Facility”) pursuant to the terms of a Debtor-in-Possession (“DIP”) Credit Agreement. The DIP Facility has been approved by the Bankruptcy Court. The DIP Credit Agreement provides for a multi-draw term loan in the aggregate amount of up to $75.0 million, of which the Company has $30.0 million currently available. The remaining $45 million under the DIP Facility will become available to the Company, upon the satisfaction of certain contingencies, including our ability to amend and restate or refinance the indebtedness under the Company’s current first lien credit facility and obtain exit financing. Pursuant to the Plan, the DIP Facility will be either paid in full in cash or, at the option of the lenders under the DIP Credit Agreement, converted, in full or in part, into the post-emergence Company’s common stock, which common stock will only come from the 88.5% of the common stock to be distributed to the current holders of the senior notes and certain unsecured creditors. For more information refer to Note 4 of these consolidated financial statements.
53
Creditors Committee. On January 14, 2016, the United States Trustee for the District of Delaware appointed pursuant to section 1102 of the Bankruptcy Code, the Official Committee of Unsecured Creditors (the "Creditors' Committee"). There can be no assurance that the Creditors' Committee and its legal representatives will support the Company’s and the Chapter 11 Subsidiaries’ positions on matters presented to the Bankruptcy Court, including the Plan. Disagreements between the Company and the Chapter 11 Subsidiaries and the Creditors' Committee could protract the Chapter 11 proceedings and delay the Company’s and the Chapter 11 Subsidiaries’ emergence from the Chapter 11 proceedings.
Financial Statement Classification of Liabilities Subject to Compromise. Our financial statements include amounts classified as Liabilities Subject to Compromise (see “Liabilities Subject to Compromise” below), which represent liabilities that we anticipate will be allowed as claims in our bankruptcy case. These amounts include amounts related to the anticipated rejection of various executory contracts and unexpired leases. Additional amounts may be included in Liabilities Subject to Compromise in future periods if additional executory contracts and unexpired leases are rejected. Conversely, to the extent that such executory contracts or unexpired leases are not rejected and are instead assumed, certain liabilities characterized as subject to compromise may be converted to post-petition liabilities. Because the uncertain nature of many of the potential claims has not been determined at this time, the magnitude of such claims is not reasonably estimable at this time. Such claims may be material.
Reorganization Expenses. The Company and the Chapter 11 Subsidiaries have incurred and will continue to incur significant costs associated with the reorganization, principally professional fees. The amount of these costs, which are being expensed as incurred, are expected to significantly affect our results of operations. In accordance with ASC 852, we have recorded certain costs associated with the bankruptcy proceedings as Reorganization Items within our Consolidated Statement of Operations. For additional information, see “Reorganization Items” below.
Restrictions on Trading of Our Equity Securities to Protect Our Use of Net Operating Losses. The Bankruptcy Court has issued a final order pursuant to Sections 105(a), 362(a)(3) and 541 of the Bankruptcy Code enabling the Company and the Chapter 11 Subsidiaries to avoid limitations on the use of their tax net operating loss carryforwards and certain other tax attributes by imposing certain notice procedures and transfer restrictions on the trading of our equity securities. In general, the order applies to any person that, directly or indirectly, beneficially owns (or would beneficially own as a result of a proposed transfer) at least 4.99% of our outstanding equity securities (a “Substantial Stockholder”), and requires that each Substantial Stockholder files with the Bankruptcy Court and serves us with notice of such status. Under the order, prior to any proposed acquisition or disposition of equity securities that would result in an increase or decrease in the amount of our equity securities owned by a Substantial Stockholder, or that would result in a person or entity becoming a Substantial Stockholder, such person is required to file with the Bankruptcy Court and notify the Company of such acquisition or disposition. We have the right to seek an injunction from the Bankruptcy Court to prevent certain acquisitions or sales of our common stock if the acquisition or sale would pose a material risk of adversely affecting our ability to utilize such tax attributes.
Risks Associated with Chapter 11 Proceedings. For the duration of our Chapter 11 proceedings, our operations and our ability to develop and execute our business plan are subject to the risks and uncertainties associated with the Chapter 11 process as described in Item 1A, “Risk Factors”. Because of these risks and uncertainties, the description of our operations, properties and capital plans may not accurately reflect our operations, properties and capital plans following the Chapter 11 process.
Liabilities Subject to Compromise. Liabilities Subject to Compromise refers to pre-petition obligations that may be impacted by the Chapter 11 reorganization process. The amounts represent our current estimate of known or potential obligations to be resolved in connection with our Chapter 11 proceedings.
Differences between liabilities we have estimated and the claims filed, or to be filed, will be investigated and resolved in connection with the claims resolution process. We will continue to evaluate these liabilities throughout the Chapter 11 process and adjust amounts as necessary. Such adjustments may be material.
54
The following table summarizes the components of liabilities subject to compromise included on our Consolidated Balance Sheet as of December 31, 2015 (in thousands):
December 31, 2015 | ||
Accounts payable and accrued liabilities | 55,587 | |
Accrued capital costs | 7,225 | |
Undistributed oil and gas revenues | 11,989 | |
Senior notes and accrued interest | 905,629 | |
Other long-term liabilities | 3,958 | |
Liabilities Subject to Compromise | 984,388 | |
Reorganization Items. The Debtors have incurred and will continue to incur significant costs associated with the reorganization. The amount of these costs, which are being expensed as incurred, are expected to significantly affect our results of operations.
The following table summarizes the components included in Reorganization items in our Consolidated Statements of Operations for the year ended December 31, 2015 (in thousands):
December 31, 2015 | ||
Non-cash expense for write-off of debt issuance costs on senior notes | 8,662 | |
Non-cash expense for write-off of debt discount on senior notes due 2020 | 1,864 | |
Non-cash gain for write-off of debt premium on senior notes due 2022 | (3,961 | ) |
Reorganization Items | 6,565 | |
A non-cash charge to write-off all of the unamortized debt issuance costs and associated discounts and premiums related to the Company's Senior Notes due 2017, Senior Notes due 2020 and Senior Notes due 2022 is included in "Reorganization Items" as these debt instruments are expected to be impacted by the bankruptcy reorganization process.
1. Summary of Significant Accounting Policies
Basis of Presentation. The consolidated financial statements included herein have been prepared by Swift Energy Company (“Swift Energy,” the “Company,” or “we”) assuming the Company will continue as a going concern, and reflect necessary adjustments, all of which were of a recurring nature unless otherwise disclosed herein, and are in the opinion of our management necessary for a fair presentation. Given risks involved with respect to our Chapter 11 proceedings, there is no assurance that we will emerge from bankruptcy proceedings as a going concern, and the realization of assets and satisfaction of liabilities, without substantial adjustments and/or changes in ownership, are also subject to uncertainty. Certain information and note disclosures normally included in financial statements prepared in accordance with accounting principles generally accepted in the United States have been omitted pursuant to the rules and regulations of the Securities and Exchange Commission. We believe that the disclosures presented are adequate to allow the information presented not to be misleading.
We have applied ASC 852 “Reorganizations” in preparing our consolidated interim financial statements. ASC 852 requires that the financial statements, for periods subsequent to the Chapter 11 filing, distinguish transactions and events that are directly associated with the reorganization from the ongoing operations of the business. Accordingly, certain revenues, expenses, realized gains and losses and provisions for losses that are realized or incurred in the bankruptcy proceedings are recorded in Reorganization items, in the accompanying Consolidated Statements of Operations. In addition, pre-petition obligations that may be impacted by the bankruptcy reorganization process have been classified on our consolidated balance sheets at December 31, 2015 in "Liabilities Subject to Compromise". These liabilities are reported at the amounts we anticipate will be allowed by the Bankruptcy Court, even if they may be settled for lesser amounts. See Note 1A for more information regarding Reorganization items.
While operating as debtors in possession under Chapter 11 of the Bankruptcy Code, the Debtors may sell or otherwise dispose of or liquidate assets or settle liabilities in amounts other than those reflected in our consolidated financial statements, subject to the approval of the Bankruptcy Court or otherwise as permitted in the ordinary course of business. Further, a plan of reorganization could materially change the amounts and classifications in our historical consolidated financial statements.
55
Principles of Consolidation. The accompanying consolidated financial statements include the accounts of Swift Energy and its wholly owned subsidiaries, which are engaged in the exploration, development, acquisition, and operation of oil and gas properties, with a focus on inland waters and onshore oil and natural gas reserves in Louisiana and Texas. Our undivided interests in oil and gas properties are accounted for using the proportionate consolidation method, whereby our proportionate share of each entity’s assets, liabilities, revenues, and expenses are included in the appropriate classifications in the accompanying consolidated financial statements. Intercompany balances and transactions have been eliminated in preparing the accompanying consolidated financial statements.
Subsequent Events. We have evaluated subsequent events of our consolidated financial statements. In February of 2016 the Bankruptcy Court approved a purchase and sale agreement with Texegy to sell a portion of the Company's acreage position in the South Bearhead Creek and Burr Ferry fields. The agreement provides that closing must take place on or prior to March 15, 2016 or a later date agreed to by both parties. For additional discussion regarding the terms of this agreement refer to Note 9 of these consolidated financial statements. Additionally, in 2016 the bankruptcy proceedings have progressed as discussed in Note 1A. There were no other material subsequent events requiring additional disclosure in these financial statements.
Use of Estimates. The preparation of financial statements in conformity with accounting principles generally accepted in the United States (“GAAP”) requires us to make estimates and assumptions that affect the reported amounts of certain assets and liabilities and the reported amounts of certain revenues and expenses during each reporting period. We believe our estimates and assumptions are reasonable; however, such estimates and assumptions are subject to a number of risks and uncertainties that may cause actual results to differ materially from such estimates. Significant estimates and assumptions underlying these financial statements include:
• | the estimated quantities of proved oil and natural gas reserves used to compute depletion of oil and natural gas properties, the related present value of estimated future net cash flows there-from, and the ceiling test impairment calculation, |
• | estimates related to the collectability of accounts receivable and the credit worthiness of our customers, |
• | estimates of the counterparty bank risk related to letters of credit that our customers may have issued on our behalf, |
• | estimates of future costs to develop and produce reserves, |
• | accruals related to oil and gas sales, capital expenditures and lease operating expenses, |
• | estimates of insurance recoveries related to property damage, and the solvency of insurance providers, |
• | estimates in the calculation of share-based compensation expense, |
• | estimates of our ownership in properties prior to final division of interest determination, |
• | the estimated future cost and timing of asset retirement obligations, |
• | estimates made in our income tax calculations, |
• | estimates of the liabilities subject to compromise versus not subject to compromise |
• | estimates in the calculation of the fair value of hedging assets and liabilities, and |
• | estimates in the assessment of current litigation claims against the Company. |
While we are not aware of any material revisions to any of our estimates, there will likely be future revisions to our estimates resulting from matters such as new accounting pronouncements, changes in ownership interests, payouts, joint venture audits, re-allocations by purchasers or pipelines, or other corrections and adjustments common in the oil and gas industry, many of which require retroactive application. These types of adjustments cannot be currently estimated and will be recorded in the period during which the adjustments occur.
We are subject to legal proceedings, claims, liabilities and environmental matters that arise in the ordinary course of business. We accrue for losses when such losses are considered probable and the amounts can be reasonably estimated.
Property and Equipment. We follow the “full-cost” method of accounting for oil and natural gas property and equipment costs. Under this method of accounting, all productive and nonproductive costs incurred in the exploration, development, and acquisition of oil and natural gas reserves are capitalized. Such costs may be incurred both prior to and after the acquisition of a property and include lease acquisitions, geological and geophysical services, drilling, completion, and equipment. Internal costs incurred that are directly identified with exploration, development, and acquisition activities undertaken by us for our own account, and which are not related to production, general corporate overhead, or similar activities, are also capitalized. For the years ended December 31, 2015, 2014 and 2013, such internal costs capitalized totaled $12.7 million, $26.3 million and $31.8 million,
56
respectively. Interest costs are also capitalized to unproved oil and natural gas properties (refer to Note 4 of these consolidated financial statements for further discussion on capitalized interest costs).
The “Property and Equipment” balances on the accompanying consolidated balance sheets are summarized for presentation purposes. The following is a detailed breakout of our “Property and Equipment” balances.
(in thousands) | December 31, 2015 | December 31, 2014 | |||||
Property and Equipment | |||||||
Proved oil and gas properties | $ | 5,972,666 | $ | 5,826,995 | |||
Unproved oil and gas properties | 18,839 | 64,903 | |||||
Furniture, fixtures, and other equipment | 44,252 | 42,257 | |||||
Less – Accumulated depreciation, depletion, and amortization | (5,577,854 | ) | (3,839,118 | ) | |||
Property and Equipment, Net | $ | 457,903 | $ | 2,095,037 | |||
No gains or losses are recognized upon the sale or disposition of oil and natural gas properties, except in transactions involving a significant amount of reserves or where the proceeds from the sale of oil and natural gas properties would significantly alter the relationship between capitalized costs and proved reserves of oil and natural gas attributable to a cost center. Internal costs associated with selling properties are expensed as incurred.
Future development costs are estimated on a property-by-property basis based on current economic conditions and are amortized to expense as our capitalized oil and gas property costs are amortized.
We compute the provision for depreciation, depletion, and amortization (“DD&A”) of oil and natural gas properties using the unit-of-production method. Under this method, we compute the provision by multiplying the total unamortized costs of oil and gas properties—including future development costs, gas processing facilities, and both capitalized asset retirement obligations and undiscounted abandonment costs of wells to be drilled, net of salvage values, but excluding costs of unproved properties—by an overall rate determined by dividing the physical units of oil and natural gas produced (which excludes natural gas consumed in operations) during the period by the total estimated units of proved oil and natural gas reserves (which excludes natural gas consumed in operations) at the beginning of the period. This calculation is done on a country-by-country basis and the period over which we will amortize these properties is dependent on our production from these properties in future years. Furniture, fixtures, and other equipment are recorded at cost and are depreciated by the straight-line method at rates based on the estimated useful lives of the property, which range between two and 20 years. Repairs and maintenance are charged to expense as incurred.
Geological and geophysical (“G&G”) costs incurred on developed properties are recorded in “Proved properties” and therefore subject to amortization. G&G costs incurred that are directly associated with specific unproved properties are capitalized in “Unproved properties” and evaluated as part of the total capitalized costs associated with a prospect. The cost of unproved properties not being amortized is assessed quarterly, on a property-by-property basis, to determine whether such properties have been impaired. In determining whether such costs should be impaired, we evaluate current drilling results, lease expiration dates, current oil and gas industry conditions, international economic conditions, capital availability, and available geological and geophysical information. Any impairment assessed is added to the cost of proved properties being amortized. Due to the bankruptcy proceedings the Company adjusted all unevaluated properties to fair market value.
Full-Cost Ceiling Test. At the end of each quarterly reporting period, the unamortized cost of oil and natural gas properties (including natural gas processing facilities, capitalized asset retirement obligations, net of related salvage values and deferred income taxes, and excluding the recognized asset retirement obligation liability) is limited to the sum of the estimated future net revenues from proved properties (excluding cash outflows from recognized asset retirement obligations, including future development and abandonment costs of wells to be drilled, using the preceding 12-months’ average price based on closing prices on the first day of each month, adjusted for price differentials, discounted at 10%, and the lower of cost or fair value of unproved properties) adjusted for related income tax effects (“Ceiling Test”).
The calculations of the Ceiling Test and provision for DD&A are based on estimates of proved reserves. There are numerous uncertainties inherent in estimating quantities of proved reserves and in projecting the future rates of production, timing, and plan of development. The accuracy of any reserves estimate is a function of the quality of available data and of engineering and geological interpretation and judgment. Results of drilling, testing, and production subsequent to the date of the estimate may justify revision
57
of such estimates. Accordingly, reserves estimates are often different from the quantities of oil and natural gas that are ultimately recovered.
Principally due to the effects of pricing, and also due to the timing of projects and changes in our reserves product mix, in 2015 and 2014 we reported a non-cash impairment write-down on a before-tax basis, of $1.6 billion and $445.4 million, respectively, on our oil and natural gas properties. The bankruptcy filing also directly contributed to the 2015 write-down as we were required to exclude most of our proved undeveloped reserves due to the uncertainties surrounding the availability of the financing that would be available to develop our proved undeveloped reserves.
If future capital expenditures out pace future discounted net cash flows in our reserve calculations, if we have significant declines in our oil and natural gas reserves volumes (which also reduces our estimate of discounted future net cash flows from proved oil and natural gas reserves) if oil or natural gas prices decline, or remain at levels prevalent in the current period, it is likely that non-cash write-downs of our oil and natural gas properties will occur in the future. We cannot control and cannot predict what future prices for oil and natural gas will be, thus we cannot estimate the amount or timing of any potential future non-cash write-down of our oil and natural gas properties due to decreases in oil or natural gas prices. However, due to current trends in commodity pricing it is likely that we will record additional ceiling test write-downs in future periods.
Revenue Recognition. Oil and gas revenues are recognized when production is sold to a purchaser at a fixed or determinable price, when delivery has occurred and title has transferred, and if collectability of the revenue is probable. Swift Energy uses the entitlement method of accounting in which we recognize our ownership interest in production as revenue. If our sales exceed our ownership share of production, the natural gas balancing payables are reported in “Accounts payable and accrued liabilities” on the accompanying consolidated balance sheets. Natural gas balancing receivables are reported in “Other current assets” on the accompanying consolidated balance sheets when our ownership share of production exceeds sales. As of December 31, 2015 and 2014, we did not have any material natural gas imbalances.
Accounts Receivable. We assess the collectability of accounts receivable, and based on our judgment, we accrue a reserve when we believe a receivable may not be collected. At December 31, 2015 and 2014, we had an allowance for doubtful accounts of approximately $0.1 million, respectively. The allowance for doubtful accounts has been deducted from the total “Accounts receivable” balance on the accompanying consolidated balance sheets.
At December 31, 2015, our “Accounts receivable” balance included $14.9 million for oil and gas sales, $4.9 million for joint interest owners, $1.2 million for severance tax credit receivables and $0.7 million for other receivables. At December 31, 2014, our “Accounts receivable” balance included $34.8 million for oil and gas sales, $8.4 million for joint interest owners, $3.1 million for severance tax credit receivables and $2.2 million for other receivables.
Supervision Fees. Consistent with industry practice, we charge a supervision fee to the wells we operate including our wells in which we own up to a 100% working interest. Supervision fees are recorded as a reduction to “General and administrative, net”, on the accompanying consolidated statements of operations. Our supervision fees are allocated to each well based on general and administrative costs incurred for well maintenance and support. The amount of supervision fees charged for the years ended December 31, 2015, 2014 and 2013, respectively, did not exceed our actual costs incurred. The total amount of supervision fees charged to the wells we operated was $9.2 million, $12.7 million and $11.6 million for the years ended December 31, 2015, 2014 and 2013, respectively.
Other Current Assets. Included in "Other current assets" on the accompanying consolidated balance sheets are inventories which consist primarily of tubulars and other equipment and supplies that we expect to place in service in production operations. Our inventories are recorded at cost (weighted average method) and totaled $0.6 million and $3.1 million at December 31, 2015 and 2014, respectively. During the year ended December 31, 2015, we recorded a charge of $2.0 million, related to inventory obsolescence in "Price-risk management and other, net" on the accompanying condensed statement of operations.
Also included in "Other current assets" on the accompanying consolidated balance sheets are prepaid expenses totaling $4.4 million and $3.9 million at December 31, 2015 and 2014, respectively. These prepaid amounts cover well insurance, drilling contracts and various other prepaid expenses. We also recorded $2.4 million in "Other current assets" related to a deposit received from Texegy as part of the purchase and sale agreement. This amount is restricted until the transaction closes which is expected to occur during the first quarter 2016. Finally, as a result of the Company's bankruptcy proceedings, we reclassified $3.3 million in debt issuance costs related to our revolving credit facility as of December 31, 2015 from "Other Long-Term Assets" to "Other current assets".
58
Income Taxes. Under guidance contained in FASB ASC 740-10, deferred taxes are determined based on the estimated future tax effects of differences between the financial statement and tax basis of assets and liabilities, given the provisions of the enacted tax laws.
We follow the recognition and disclosure provisions under guidance contained in FASB ASC 740-10-25. Under this guidance, tax positions are evaluated for recognition using a more-likely-than-not threshold, and those tax positions requiring recognition are measured as the largest amount of tax benefit that is greater than fifty percent likely of being realized upon ultimate settlement with a taxing authority that has full knowledge of all relevant information. Our policy is to record interest and penalties relating to uncertain tax positions in income tax expense. At December 31, 2015, we did not have any accrued liability for uncertain tax positions and do not anticipate recognition of any significant liabilities for uncertain tax positions during the next 12 months.
Our U.S. Federal income tax returns for 2007 forward, our Louisiana income tax returns from 2000 forward and our Texas franchise tax returns after 2010 remain subject to examination by the taxing authorities. There are no material unresolved items related to periods previously audited by these taxing authorities. No other jurisdiction returns are significant to our financial position.
For the year ended December 31, 2015, the tax benefit for the book loss was mostly offset with an increase in our valuation allowance against our deferred tax assets.
Accounts Payable and Accrued Liabilities. The “Accounts payable and accrued liabilities” balances on the accompanying consolidated balance sheets are summarized below (in thousands):
December 31, 2015 | December 31, 2014 | ||||||
Trade accounts payable (1)(2) | $ | — | $ | 31,153 | |||
Accrued operating expenses (2) | — | 10,784 | |||||
Accrued payroll costs (2) | — | 8,100 | |||||
Asset retirement obligations – current portion | 7,165 | 10,709 | |||||
Accrued taxes (2) | — | 2,957 | |||||
Other payables (2)(3) | 498 | 4,541 | |||||
Total Accounts payable and accrued liabilities | $ | 7,663 | $ | 68,244 | |||
(1) Included in “trade accounts payable” are liabilities of approximately $13.7 million at December 31, 2014 for outstanding checks.
(2) Classified as Liabilities Subject to Compromise as of December 31, 2015.
(3) Total balance at December 31, 2015 was $5.3 million of which $4.8 million was classified as Liabilities Subject to Compromise with the remaining portion classified as "Other payables".
Cash and Cash Equivalents. We consider all highly liquid instruments with an initial maturity of three months or less to be cash equivalents.
Credit Risk Due to Certain Concentrations. We extend credit, primarily in the form of uncollateralized oil and gas sales and joint interest owners' receivables, to various companies in the oil and gas industry, which results in a concentration of credit risk. The concentration of credit risk may be affected by changes in economic or other conditions within our industry and may accordingly impact our overall credit risk. However, we believe that the risk of these unsecured receivables is mitigated by the size, reputation, and nature of the companies to which we extend credit. From certain customers we also obtain letters of credit or parent company guarantees, if applicable, to reduce risk of loss. For the years ended December 31, 2015, 2014 and 2013, Shell Oil Company and affiliates accounted for 16%, 21% and 33% of our total oil and gas gross receipts, respectively. Kinder Morgan, Plains Marketing and Howard Energy accounted for approximately 27% and 18% and 13% of our total oil and gas gross receipts in 2015, respectively. Kinder Morgan and Plains Marketing accounted for approximately 20% and 11% of our total oil and gas gross receipts in 2014, while BP America accounted for approximately 21% of our total oil and gas gross receipts in 2013.
Short-Term Restricted Cash (Saka Energi Transaction). On July 15, 2014, we closed our transaction with PT Saka Energi Indonesia ("Saka Energi") to fully develop 8,300 acres of Fasken area Eagle Ford shale properties owned by Swift Energy in Webb County, Texas. Swift Energy sold a 36% full participating interest in the Fasken properties to Saka Energi. Subject to the terms of the transaction, Swift Energy and Saka Energi were required to deposit cash on a monthly basis into a separate Swift Energy-owned bank account to fund their respective portions of the on-going Fasken development program for the following month.
59
During the third quarter of 2014, cash deposited in the account was contractually restricted for use in the Fasken development program and therefore was recorded as restricted cash until the Company had performed the related development activities. The cash changes from the account during the third quarter of 2014 relating to Saka Energi’s contributions were shown in the operating activities section of the accompanying consolidated statements of cash flows. The cash changes from the account during the third quarter of 2014 relating to Swift Energy’s contributions were reported in the investing activities section on the accompanying consolidated statements of cash flows.
Long-term Restricted Cash. Long-term restricted cash includes amounts held in escrow accounts to satisfy plugging and abandonment obligations. As of December 31, 2015 and 2014, these assets were approximately $1.0 million. These amounts are restricted as to their current use, and will be released when we have satisfied all plugging and abandonment obligations in certain fields. These restricted cash balances are reported in “Other Long-Term Assets” on the accompanying consolidated balance sheets.
Treasury Stock. Our treasury stock repurchases are reported at cost and are included “Treasury stock held, at cost" on the accompanying consolidated balance sheets. When the Company reissues treasury stock the gains are recorded in "Additional paid-in capital" ("APIC") on the accompanying consolidated balance sheets, while the losses are recorded to APIC to the extent that previous net gains on the reissuance of treasury stock are available to offset the losses. If the loss is larger than the previous gains available then the loss is recorded to "Retained earnings (Accumulated deficit)" on the accompanying consolidated balance sheets. For the year ended December 31, 2015, the Company recorded losses of $4.9 million to "Retained earnings (Accumulated deficit)" as a result of treasury stock transactions.
New Accounting Pronouncements In May 2014, the FASB issued ASU 2014-09, providing a comprehensive revenue recognition standard for contracts with customers that supersedes current revenue recognition guidance. The guidance requires entities to recognize revenue using the following five-step model: identify the contract with a customer, identify the performance obligations in the contract, determine the transaction price, allocate the transaction price to the performance obligations in the contract, and recognize revenue as the entity satisfies each performance obligation. Adoption of this standard could result in retrospective application, either in the form of recasting all prior periods presented or a cumulative adjustment to equity in the period of adoption. The guidance is effective for annual and interim reporting periods beginning after December 15, 2017. We have not completed our review of these new requirements to determine the impact of the guidance on our financial statements.
In April 2015, the FASB issued ASU 2015-03, providing guidance on the presentation of debt issuance costs. The guidance requires debt issuance costs to be presented on the balance sheet as a reduction of the carrying amount of the related debt liability. This guidance is effective for fiscal years beginning after December 15, 2015 and for interim periods within those fiscal years, with early adoption permitted and retrospective application required. This guidance, which we plan to adopt beginning with the first quarter of 2016, is not expected to have a material impact on our financial statements.
In July 2015, the FASB issued ASU 2015-11, which changes the measurement principle for inventory from the lower of cost or market to “lower of cost and net realizable value.” The standard simplifies the current guidance under which an entity must measure inventory at the lower of cost or market (market in this context is defined as one of three different measures, one of which is net realizable value). Net realizable value is defined as the “estimated selling price in the ordinary course of business, less reasonably predictable costs of completion, disposal and transportation.” The guidance is effective for fiscal years beginning after December 15, 2016, including interim periods thereafter, and must be applied prospectively after the date of adoption. We have not completed our review of this new requirement to determine the impact of this guidance on our financial statements.
In November 15, the FASB issued ASU 2015-17, which requires companies to classify all deferred tax assets and liabilities as non-current on the balance sheet instead of separating deferred taxes into current and non-current amounts. The guidance is effective for fiscal years beginning after December 15, 2016, including interim periods thereafter, with early adoption permitted and either with prospective or retrospective application permitted. We do not expect this new guidance to have a material impact on our financial statements.
2. Earnings Per Share
The Company computes earnings per share in accordance with FASB ASC 260-10. Basic earnings per share (“Basic EPS”) has been computed using the weighted average number of common shares outstanding during each period. Diluted earnings per share ("Diluted EPS") assumes, as of the beginning of the period, exercise of stock options and restricted stock grants using the treasury stock method. Diluted EPS also assumes conversion of performance-based restricted stock units to common shares based on the number of shares (if any) that would be issuable, according to predetermined performance and market goals, if the end of the reporting period was the end of the performance period. As we recognized a net loss for the years ended December 31, 2015,
60
2014 and 2013, the unvested share-based payments and stock options were not recognized in diluted earnings per share (“Diluted EPS”) calculations as they would be antidilutive.
The following is a reconciliation of the numerators and denominators used in the calculation of Basic and Diluted EPS for the years ended December 31, 2015, 2014 and 2013 (in thousands, except per share amounts):
2015 | 2014 | 2013 | ||||||||||||||||||||||||||||||
Net Income (Loss) | Shares | Per Share Amount | Net Income (Loss) | Shares | Per Share Amount | Net Income (Loss) | Shares | Per Share Amount | ||||||||||||||||||||||||
Basic EPS: | ||||||||||||||||||||||||||||||||
Net Income (Loss) and Share Amounts | $ | (1,653,971 | ) | 44,463 | $ | (37.20 | ) | $ | (283,427 | ) | 43,795 | $ | (6.47 | ) | $ | (2,442 | ) | 43,331 | $ | (0.06 | ) | |||||||||||
Dilutive Securities: | ||||||||||||||||||||||||||||||||
Stock Options | — | — | — | |||||||||||||||||||||||||||||
Restricted Stock Awards | — | — | — | |||||||||||||||||||||||||||||
Diluted EPS: | ||||||||||||||||||||||||||||||||
Net Income (Loss) and Assumed Share Conversions | $ | (1,653,971 | ) | 44,463 | $ | (37.20 | ) | $ | (283,427 | ) | 43,795 | $ | (6.47 | ) | $ | (2,442 | ) | 43,331 | $ | (0.06 | ) | |||||||||||
All of the 1.3 million, 1.4 million and 1.6 million stock options to purchase shares were not included in the computation of Diluted EPS for the years ended December 31, 2015, 2014 and 2013, respectively, as they were antidilutive.
Approximately 0.5 million restricted stock awards for the years ended December 31, 2015 and 2014, respectively, and 0.3 million restricted stock awards for the year ended December 31, 2013 were not included in the computation of Diluted EPS, as they would be antidilutive given the net loss.
Approximately 0.6 million, 0.4 million and 0.3 million shares related to performance-based restricted stock units that could be converted to common shares based on predetermined performance and market goals were not included in the computation of Diluted EPS for years ended December 31, 2015, 2014 and 2013, respectively, primarily because the performance and market conditions had not been met, assuming the end of the reporting period was the end of the performance period.
3. Provision (Benefit) for Income Taxes
Income (Loss) before taxes is as follows (in thousands):
Year Ended December 31, | |||||||||||
2015 | 2014 | 2013 | |||||||||
Income (Loss) Before Income Taxes | $ | (1,734,514 | ) | $ | (433,470 | ) | $ | 198 | |||
The following is an analysis of the consolidated income tax provision (benefit) (in thousands):
Year Ended December 31, | |||||||||||
2015 | 2014 | 2013 | |||||||||
Current | $ | (410 | ) | $ | 314 | $ | (12 | ) | |||
Deferred | (80,133 | ) | (150,357 | ) | 2,652 | ||||||
Total | $ | (80,543 | ) | $ | (150,043 | ) | $ | 2,640 | |||
61
Reconciliations of income taxes computed using the U.S. Federal statutory rate (35%) to the effective income tax rates are as follows (in thousands):
Year Ended December 31, | |||||||||||
2015 | 2014 | 2013 | |||||||||
Income taxes (benefit) computed at U.S. statutory rate | $ | (607,080 | ) | $ | (151,714 | ) | $ | 69 | |||
State tax provisions (benefits), net of federal benefits | (18,064 | ) | (5,935 | ) | (184 | ) | |||||
Non-deductible equity compensation | 252 | 666 | 1,127 | ||||||||
Stock-based compensation tax shortfall | 1,703 | 2,409 | 558 | ||||||||
Valuation allowances | 542,289 | 4,635 | 385 | ||||||||
Expiration of carryover items | 333 | 288 | 400 | ||||||||
Other, net | 24 | (392 | ) | 285 | |||||||
Provision (benefit) for income taxes | $ | (80,543 | ) | $ | (150,043 | ) | $ | 2,640 | |||
Effective rate | 4.6 | % | 34.6 | % | 1,333.4 | % | |||||
The Company’s operations are concentrated in Texas and Louisiana. The Company’s state tax provision varies in proportion to the overall statutory rate due to differences in deductions allowed for U.S. Federal and state income taxes.
During 2015, write-downs of oil and gas properties reduced the Company’s book value to less than its Federal and state income tax basis. We believe it is more likely than not that the Company will be unable to utilize loss carryovers and amortizable tax basis in excess of the book carrying value of its properties. Accordingly, the Company increased its valuation allowance by $542 million which reduced the carrying value of the Company’s deferred tax assets to zero. The 2014 net deferred tax liability was reversed in 2015 and is reflected in the 2015 Statement of Operations as the deferred tax benefit. The 2014 tax benefit was primarily attributable to a reduction in the Company’s deferred tax liability resulting from a book write-down in oil and gas properties.
62
The tax effects of temporary differences representing the net deferred tax asset (liability) at December 31, 2015 and 2014 were as follows (in thousands):
Year Ended December 31, | |||||||
2015 | 2014 | ||||||
Deferred tax assets: | |||||||
Federal net operating loss (“NOL”) carryovers | $ | 287,720 | $ | 141,896 | |||
NOLs for excess stock-based compensation | (9,571 | ) | (9,606 | ) | |||
Oil and gas exploration and development costs | 214,413 | — | |||||
State NOL carryovers | 18,384 | 15,525 | |||||
Alternative minimum tax credits | 2,092 | 2,092 | |||||
Other Carryover Items | 1,215 | 1,294 | |||||
Asset Retirement Obligations | 22,884 | 26,388 | |||||
Unrealized share-based compensation | 9,953 | 9,471 | |||||
Valuation allowance | (553,283 | ) | (11,327 | ) | |||
Other | 6,193 | 4,056 | |||||
Total deferred tax assets | $ | — | $ | 179,789 | |||
Deferred tax liabilities: | |||||||
Oil and gas exploration and development costs | $ | — | $ | (258,326 | ) | ||
Other | — | (1,596 | ) | ||||
Total deferred tax liabilities | $ | — | $ | (259,922 | ) | ||
Net deferred tax liabilities | $ | — | $ | (80,133 | ) | ||
Net current deferred tax assets | — | 6,243 | |||||
Net non-current deferred tax liabilities | $ | — | $ | (86,376 | ) | ||
The federal NOL carryovers totaling $822.1 million will expire between 2027 and 2035 if not utilized in earlier periods. Deferred tax benefits for excess stock-based compensation deductions represent stock-based compensation that have generated tax deductions that have not resulted in a cash tax benefit because the Company has NOL carryovers. The Company will recognize the federal NOL net deferred tax assets associated with excess stock-based compensation tax deductions only if all other components of the NOL carryover tax assets are fully utilized prospectively. If and when the excess stock-based compensation related NOL carryover tax assets are realized, the benefit will be credited directly to equity. The state NOL carryovers are for Louisiana. The Louisiana loss carryovers are scheduled to expire between 2016 and 2030.
All of the Company's deferred tax assets as of December 31, 2015 are fully reserved by the valuation allowance. The valuation allowances at the end of 2014 was primarily attributable to the Louisiana NOL carryovers.
U.S. Federal income tax returns for 2007 forward, Louisiana income tax returns from 2000 forward, and Texas franchise tax returns after 2010 remain open to possible examination by the taxing authorities. There are no material unresolved items related to periods previously audited by these taxing authorities. No other jurisdiction returns are significant to our financial position.
As of December 31, 2015, we do not have any accrued liability for uncertain tax positions. We do not believe the total of unrecognized tax positions will significantly increase or decrease during the next 12 months.
As a result of the Company’s bankruptcy and planned reorganization, the ultimate realization of our net operating losses (“NOL”) and tax basis is uncertain. Our tax attributes may be reduced and / or subject to annual utilization limits depending on several factors including ownership changes and other factors. A significant portion of our NOL may be offset by tax gains or cancellation of debt.
63
4. Debt
Bankruptcy Filing. On December 31, 2015, the Company and eight of its subsidiaries filed voluntary petitions seeking relief under Chapter 11 of Title 11 of the United States Bankruptcy Code. The Chapter 11 filing constituted an event of default with respect to our existing debt obligations. As a result of the Chapter 11 filing, the Company's pre-petition unsecured senior notes and secured debt under the revolving credit facility became immediately due and payable, but any efforts to enforce such payment obligations are automatically stayed as a result of the Chapter 11 filing. If the bankruptcy plan of reorganization is approved, the senior notes (along with certain unsecured claims) will be exchanged for 88.5% of the common stock of the reorganized entity upon emergence from the bankruptcy proceedings. Additional information regarding the bankruptcy proceedings is included in Note 1A of the consolidated financial statements.
Our debt balances as of December 31, 2015 and 2014, were as follows (in thousands):
December 31, 2015 | December 31, 2014 | ||||||
7.125% senior notes due in 2017 (1) | $ | — | $ | 250,000 | |||
8.875% senior notes due in 2020 (1) | — | 222,775 | |||||
7.875% senior notes due in 2022 (1) | — | 404,459 | |||||
Bank Borrowings | 324,900 | 197,300 | |||||
Total Debt | $ | 324,900 | $ | 1,074,534 | |||
Less: Current portion of long-term debt (2) | (324,900 | ) | — | ||||
Long-Term Debt | $ | — | $ | 1,074,534 | |||
(1) Classified as Liabilities Subject to Compromise as of December 31, 2015 | |||||||
(2) As a result of our Chapter 11 filing, we have classified our credit facility borrowings as current at December 31, 2015. | |||||||
Reclassification of Senior Notes Liabilities. Senior Notes due in 2017 of $250.0 million, Senior Notes due in 2020 of $225.0 million and Senior Notes due in 2022 of $400.0 million are included in Liabilities Subject to Compromise in the consolidated balance sheet as of December 31, 2015. Additionally, a non-cash charge to write-off all of the unamortized debt issuance costs and associated discounts and premiums related to the Company's senior notes is included in "Reorganization Items" in the Consolidated Statement of Operations as of December 31, 2015. Debt issuance costs of $0.8 million on the senior notes due in 2017, $2.6 million on the senior notes due in 2020 and $5.3 million on the senior notes due in 2022 were also written-off as of December 31, 2015. A loss of $1.9 million was recognized on the extinguishment of the 2020 senior note unamortized discount, while a gain of $4.0 million was recognized on the extinguishment of the 2022 unamortized senior note premium.
Reclassification of Revolving Credit Facility Liabilities. Amounts outstanding under our revolving credit facility due in 2017 of $324.9 million were reclassified as a current liability in the Consolidated Balance Sheet dated December 31, 2015 due to cross-default provisions as a result of the bankruptcy filings. The associated remaining unamortized debt issuance costs of $3.3 million on the credit facility were reclassified to Other Current Assets in the Company's Consolidated Balance Sheet as of December 31, 2015.
Debtor-In-Possession Financing. As part of the Chapter 11 filings, the Bankruptcy Court has entered a final order authorizing the Company and the Chapter 11 Subsidiaries to obtain debtor-in-possession financing on the terms and conditions set forth in the Debtor-In-Possession (DIP) Credit Agreement, subject to the terms of the order.
As of February 29, 2016, the Company has $30.0 million available under the DIP Facility. The remaining $45.0 million under the DIP Facility will become available to the Company upon the Company’s satisfaction of certain contingencies, including the amendment and restatement or refinancing of the indebtedness under the Existing First Lien Credit Agreement and the securing of exit financing. The proceeds of the DIP Facility may be used to, among other things, pay certain costs, fees and expenses related to the Chapter 11 cases, pay authorized pre-petition claims, and pay amounts due in connection with the DIP Credit Agreement, including on account of certain “adequate protection” obligations. The proceeds may also be used to fund working capital needs and for other general corporate purposes in all cases subject to the terms of the DIP Credit Agreement, and applicable orders of the Court.
The maturity date of the DIP Facility is expected to be the earliest to occur of six months from the effective date of a plan of reorganization or liquidation in the Chapter 11 cases, the consummation of a sale of all or substantially all of the assets of the Company and its subsidiaries pursuant to Section 363 of the Bankruptcy Code, or the date of termination of the DIP Lenders’ commitment amounts pursuant to an event of default under the DIP Credit Agreement. Interest will accrue at a rate per year equal
64
to LIBOR plus 12.0% for Eurodollar Rate Loans or the alternative base rate plus 11.0%. We have paid the DIP Lenders a total of $0.9 million during the first two months of 2016 as a commitment fee, and if the remaining $45.0 million under the DIP Facility becomes available we will be required to pay an additional commitment fee of 3.0% of the $45.0 million made available to the Company on that date. We are also required to pay to each Backstop Lender (as defined in the DIP Credit Agreement) a non-refundable backstop fee of 7.5% on the pro rata share of such Backstop Lender’s share of the loan commitments, payable in the form of common stock issued by the Company or its successor upon its emergence from the Chapter 11 cases, or, if the Restructuring Support Agreement is terminated, in cash when the principal amounts outstanding under the DIP Facility come due. An original issue discount of 5% will be paid by the Company at the time of any drawdowns against the DIP facility, resulting in net proceeds to the Company of 95% of the gross drawdown amount.
The DIP Facility is secured by security interests in substantially all of the Company’s assets, which are (1) second priority to the existing pre-petition liens of the lenders and JPMorgan Chase Bank, N.A., as administrative agent with respect to the collateral (generally required to be at least 95% of our oil and gas properties) set forth in the Second Amended and Restated Credit Agreement, dated as of September 21, 2010 (the “Existing First Lien Credit Agreement”), and (2) first priority with respect to all other property of the Company. These security interests are subject to certain carve-outs (such as Bankruptcy Court costs and professional fees), and permitted liens under the DIP Credit Agreement. The DIP Facility is subject to customary covenants, prepayment events, events of default and other provisions.
Bank Borrowings. Effective November 2, 2015, our syndicate of 11 banks executed an amendment to our credit facility agreement lowering our borrowing base and commitment amount from $375.0 million to $330.0 million.
At December 31, 2015 and 2014, we had $324.9 million and $197.3 million in outstanding borrowings under our credit facility, respectively. As of December 31, 2015, the interest rate on our credit facility is either (a) the lead bank’s prime rate plus an applicable margin or (b) the Eurodollar rate plus an applicable margin. However with respect to (a), if the lead bank’s prime rate is not higher than each of the federal funds rate plus 0.5%, and the adjusted London Interbank Offered Rate (“LIBOR”) plus 1%, the greatest of these three rates will then apply. The applicable margins vary depending on the level of outstanding debt with escalating rates of 100 to 200 basis points above the Alternative Base Rate and escalating rates of 200 to 300 basis points for Eurodollar rate loans. During 2015, the lead bank’s prime rate fluctuated between 3.25% and 3.5% while the commitment fee associated with the credit facility fluctuated between 0.38% and 0.50%. Since the filing of the petition in Bankruptcy Court, we have been paying interest on our credit facility in the normal course.
Interest expense on the credit facility, including commitment fees and amortization of debt issuance costs, totaled $9.4 million, $7.5 million and $6.0 million for the years ended December 31, 2015, 2014 and 2013, respectively. The amount of commitment fees included in interest expense, net was $0.5 million, $0.8 million and $1.1 million for the years ended December 31, 2015, 2014 and 2013, respectively.
Additionally, we have capitalized interest on our unproved properties in the amount of $4.9 million, $5.0 million and $7.2 million for the years ended December 31, 2015, 2014 and 2013, respectively.
Due to the bankruptcy proceedings, most acts to exercise remedies under our credit facility, including those related to defaults of various financial covenants and ratios, were stayed as of December 31, 2015 and continue to be stayed. No further funds are available to us under the credit facility. The terms of our credit facility include, among other restrictions, a limitation on the level of cash dividends (not to exceed $15.0 million in any fiscal year), a remaining aggregate limitation on purchases of our stock of $50.0 million, and limitations on incurring other debt.
At December 31, 2015, our bank credit agreement contained financial covenants detailing certain minimum financial ratios that must be maintained. The first was an adjusted working capital ratio of adjusted current assets to current liabilities (as defined in the Credit Agreement) of not less than 0.5 for each of the quarters up to and ending on December 31, 2016, returning to a ratio of not less than 1.0 to 1.0 at any time thereafter. The second ratio was also an interest coverage ratio, calculated on a trailing twelve month basis of EBITDAX to interest expense (as defined in the Credit Agreement), of not less than 1.15 to 1.0 for the quarters ending on December 31, 2015 through June 30, 2016, 1.3 to 1.0 for the quarters ending September 30, 2016 through December 31, 2016, and 2.0 to 1.0 any time thereafter. The third ratio was the senior secured leverage ratio (as defined in the Credit Agreement), requiring that the ratio of senior secured liabilities on the last day of the quarter to EBITDAX, calculated on a trailing twelve month basis, not be greater than 3.5 to 1.0 for the quarters ending December 31, 2015 through June 30, 2016, 3.0 to 1.0 for the quarters ending September 30, 2016 through December 31, 2016, and 2.5 to 1.0 any time thereafter.
Since inception, no cash dividends had been declared on our common stock. The terms of the credit facility also required us to secure at least 95% of our oil and natural gas properties. Under the terms of the credit facility, the commitment amount can be
65
less than or equal to the total amount of the borrowing base with unanimous consent of the bank group as it might change from time to time.
Senior Notes Due In 2022. These notes consist of $400.0 million of 7.875% senior notes that were set to mature on March 1, 2022. On November 30, 2011, we issued $250.0 million of these senior notes at a discount of $2.1 million or 99.156% of par, which equates to an effective yield to maturity of 8%. On October 3, 2012, we issued an additional $150.0 million of these senior notes at 105% of par, which equates to a yield to worst of 6.993%. The notes are senior unsecured obligations that rank equally with all of our existing and future senior unsecured indebtedness, are effectively subordinated to all our existing and future secured indebtedness to the extent of the value of the collateral securing such indebtedness, including borrowing under our bank credit facility, and will rank senior to any future subordinated indebtedness of Swift Energy. Interest on these notes was payable semi-annually on March 1 and September 1 and commenced on March 1, 2012. The filing of the petition for bankruptcy protection constitutes an “event of default” under the indenture governing these senior notes.
Senior Notes Due In 2020. These notes consist of $225.0 million of 8.875% senior notes issued at 98.389% of par, which equates to an effective yield to maturity of 9.125%. The notes were issued on November 25, 2009 with an original discount of $3.6 million and were set to mature on January 15, 2020. The notes are senior unsecured obligations that rank equally with all of our existing and future senior unsecured indebtedness, are effectively subordinated to all our existing and future secured indebtedness to the extent of the value of the collateral securing such indebtedness, including borrowing under our bank credit facility, and will rank senior to any future subordinated indebtedness of Swift Energy. Interest on these notes was payable semi-annually on January 15 and July 15 and commenced on January 15, 2010. The filing of the petition for bankruptcy protection constitutes an “event of default” under the indenture governing these senior notes.
Senior Notes Due In 2017. These notes consist of $250.0 million of 7.125% senior notes due in 2017, which were issued on June 1, 2007 at 100% of the principal amount and will mature on June 1, 2017. The notes are senior unsecured obligations that rank equally with all of our existing and future senior unsecured indebtedness, are effectively subordinated to all our existing and future secured indebtedness to the extent of the value of the collateral securing such indebtedness, including borrowing under our bank credit facility, and will rank senior to any future subordinated indebtedness of Swift Energy. Interest on these notes was payable semi-annually on June 1 and December 1, and commenced on December 1, 2007. Prior to the Chapter 11 filing, the Company elected not to make the $8.9 million semi-annual interest payment due December 1, 2015, on its outstanding $250.0 million principal amount of 7.125% Senior Notes due 2017. The filing of the petition for bankruptcy protection constitutes an “event of default” under the indenture governing these senior notes.
Debt Issuance Costs. Legal fees, accounting fees, underwriting fees, printing costs, and other direct expenses associated with extensions of our senior notes were originally capitalized and then amortized on an effective interest basis over the life of each of the respective senior note offerings.
Interest Expense on Senior Notes. Interest expense on the senior notes, including amortization of debt issuance costs, debt discount and debt premium, totaled $70.8 million for the year ended December 31, 2015, $70.7 million for the year ended December 31, 2014, and $70.6 million for the year ended December 31, 2013.
5. Price-Risk Management Activities
The Company follows FASB ASC 815-10, which requires that changes in the derivative’s fair value are recognized in earnings. The changes in the fair value of our derivatives are recognized in "Price-risk management and other, net” on the accompanying consolidated statements of operations. We have a price-risk management policy to use derivative instruments to protect against declines in oil and natural gas prices, mainly through the purchase of price swaps, floors, calls, collars and participating collars.
For the years ended December 31, 2015, 2014 and 2013, we recognized net gains (losses) of $0.2 million, $1.3 million and ($0.9) million, respectively, relating to our derivative activities. The effects of our derivatives are included in the "Other" section of our Cash Flows from Operating Activities on the accompanying consolidated statements of cash flows.
The fair values of our derivatives are computed using commonly accepted industry-standard models and are periodically verified against quotes from brokers. There were no unsettled derivative assets and no unsettled derivative liabilities at December 31, 2015 as all outstanding hedge agreements had settled as of year-end.
The Company uses an International Swap and Derivatives Association "ISDA" master agreement for all derivative contracts. This is an industry standardized contract containing the general conditions of our derivative transactions including provisions relating to netting derivative settlement payments under certain circumstances (such as default). For reporting purposes, the
66
Company does not offset the asset and liability fair value amounts of its derivatives on the accompanying balance sheets. As all hedge agreements had settled as of year-end, under the right of set-off, there was no net fair value at December 31, 2015. For further discussion related to the fair value of the Company's derivatives, refer to Note 10 of these consolidated financial statements.
6. Commitments and Contingencies
Rental and lease expenses were $16.8 million, $21.0 million and $20.5 million for the years ended December 31, 2015, 2014 and 2013, respectively. The rental and lease expenses primarily relate to compressor rentals during the year and the lease of our office space in Houston, Texas. During 2015 the Company entered into a new eleven year lease agreement for office space in Houston, Texas. The operating lease commenced on March 1, 2015 and may be terminated after seven years. The operating lease may be subject to reinstatement, renegotiation or amendment, or rejection in connection with our Chapter 11 proceedings. As of December 31, 2015, the minimum contractual obligations were approximately $23 million in the aggregate. Our policy is to amortize the total payments under the lease agreement on a straight-line basis over the term of the lease. Any reinstatement, renegotiation, amendment or rejection of this agreement in the bankruptcy proceedings could have a material impact on the timing and magnitude of amounts recognized within our financial statements in future periods.
Our minimum annual obligations under non-cancelable operating lease commitments were $4.1 million for 2016, $3.3 million for 2017, $3.7 million for 2018, $3.9 million for 2019, $5.5 million for 2020 and approximately $24.1 million in the aggregate. The minimum annual obligations under non-cancelable operating lease commitments primarily relate to office space for the Houston office.
Our employment agreement liabilities for certain named executive officers are recorded in "Liabilities subject to compromise" on the balance sheet at December 31, 2015, and are recorded in "Other long-term liabilities" on the balance sheet at December 31, 2014.
Our remaining gas transportation and processing minimum obligations were $14.5 million for 2016, $17.7 million for 2017, $17.2 million for 2018, $16.9 million for 2019, $14.3 million for 2020 and $80.7 million in the aggregate.
In the ordinary course of business, we are party to various legal actions, which arise primarily from our activities as operator of oil and natural gas wells. Most of our pending legal proceedings have been stayed by virtue of our voluntary petition filed on December 31, 2015 seeking relief under Chapter 11 of the Bankruptcy Code. In management's opinion, the outcome of any such currently pending legal actions will not have a material adverse effect on our financial position or results of operations.
7. Share-Based Compensation
Bankruptcy Proceedings
The Plan of Reorganization, as discussed in Note 1A, provides that the Company’s current common stock will be cancelled and that new common stock will be issued upon emergence from bankruptcy. If the Plan is confirmed by the Bankruptcy Court, the Company's currently existing share-based awards will also be canceled upon the Company's emergence from bankruptcy. Cancellation of these share-based awards will result in the recognition of expense, on the date of cancellation, to record any previously unamortized expense related to the canceled awards.
Share-Based Compensation Plans
We have multiple share-based compensation plans with outstanding awards including the 2005 Stock Compensation Plan, most recently amended by our Board of Directors in May 2013, which was approved by shareholders at the 2005 annual meeting of shareholders; the 2001 Omnibus Stock Compensation Plan, which was adopted by our Board of Directors in February 2001 and was approved by shareholders at the 2001 annual meeting of shareholders; the 1990 Non-Qualified Stock Option Plan solely for our independent directors. No further grants will be made under the 2001 Omnibus Stock Compensation Plan or the 1990 Non-Qualified Stock Option Plan, both of which were replaced by the 2005 Stock Compensation Plan, and no awards remain outstanding under these plans as of December 31, 2015. In addition, we have an employee stock purchase plan and also had an employee stock ownership plan prior to its termination during 2015. We follow guidance contained in FASB ASC 718 to account for share-based compensation.
Under the 2005 plan, stock option awards and other equity based awards may be granted to employees, directors, and consultants, with directors only eligible to receive restricted awards. Under the 2001 plan, stock option awards and other equity based awards were granted to employees. Under the 1990 non-qualified plan, non-employee members of our Board of Directors were automatically granted stock option awards to purchase shares of common stock on a formula basis. All three plans provide
67
that the exercise prices for stock option awards equal 100% of the fair value of the common stock on the date of grant. Restricted stock grants become vested over a three year period, and stock option awards become exercisable in various terms ranging from one year to five years. Stock option awards granted typically expire ten years after the date of grant or earlier in the event of the optionee's separation from employment. At the time the stock option awards are exercised, the cash received is credited to common stock and additional paid-in capital. The 2005 plan allows for the use of a “stock swap” in lieu of a cash exercise for stock option awards, under certain circumstances. The delivery of Swift Energy common stock, held by the optionee for a minimum of six months, which are considered mature shares, with a fair market value equal to the required purchase price of the shares to which the exercise relates, constitutes a valid “stock swap.” Stock option awards issued under a “stock swap” also previously included a reload feature that was discontinued during 2012. There were no mature shares that were delivered in “stock swap” transactions during 2015 or 2014 while there were 10,752 such shared delivered for the year ended December 31, 2013.
The employee stock purchase plan, which began in 1993, provides eligible employees the opportunity to acquire shares of Swift Energy common stock at a discount through payroll deductions. To date, employees have been allowed to authorize payroll deductions of up to 10% of their base salary, within IRS limitations and plan rules, during the plan year by making an election to participate prior to the start of a plan year. The purchase price for stock acquired under the plan is 85% of the lower of the closing price of our common stock at the beginning or end of the plan year. Under this plan for the last three years, we have issued 87,629 shares at a price of $3.44 in 2015, 71,825 shares at a price of $11.47 in 2014 and 72,273 shares at a price of $13.08 in 2013. There were no contributions for the year ended December 31, 2015 while contributions for the years ended December 31, 2014 and 2013 were all made in common stock. As of December 31, 2015, 318,027 shares remained available for issuance under this plan.
We receive a tax deduction for certain stock option exercises during the period the stock option awards are exercised, generally for the excess of the market value on the exercise date over the exercise price of the stock option awards. We receive an additional tax deduction when restricted stock awards vest at a higher value than the value used to recognize compensation expense at the date of grant. We are required to report excess tax benefits from the award of equity instruments as financing cash flows. We recognized an excess tax shortfall for the years ended December 31, 2015 and 2014, as referenced in Note 3 of these consolidated financial statements. We did not recognize any material excess tax benefit or shortfall in earnings for the year ended December 31, 2013.
There were no stock option exercises for the years ended December 31, 2015 and 2014. Net cash proceeds from the exercise of stock option awards were not material for the year ended December 31, 2013. There was no income tax benefit from stock option exercises for the year ended December 31, 2013.
Share-based compensation expense for awards issued to both employees and non-employees, which was recorded in “General and administrative, net” in the accompanying consolidated statements of operations, was $4.1 million, $6.7 million and $9.3 million for the years ended December 31, 2015, 2014 and 2013, respectively. Share-based compensation recorded in lease operating cost was $0.2 million for the years ended December 31, 2015 and 2014, respectively and $0.3 million for the year ended December 31, 2013. We also capitalized $1.4 million, $3.5 million and $5.5 million of share-based compensation for the years ended December 31, 2015, 2014 and 2013, respectively. We view stock option awards and restricted stock awards with graded vesting as single awards with an expected life equal to the average expected life of component awards, and we amortize the awards on a straight-line basis over the life of the awards.
Our shares available for future grant under our Share-Based Compensation plans were 1,253,306 at December 31, 2015. Each stock option award granted reduces the aforementioned total by 1.0 share, while each restricted stock award and restricted stock unit granted reduces the shares available for future grant by 1.44 shares.
Stock Option Awards
During the years ended December 31, 2015, 2014 and 2013, we did not grant any stock option awards. The expected term for grants issued considers all relevant factors including historical and expected future employee exercise behavior. We have analyzed historical volatility and, based on an analysis of all relevant factors, we have used a 5.5 year look-back period to estimate expected volatility of our stock option awards.
68
At December 31, 2015, we had no unrecognized compensation cost related to stock option awards. The following table represents stock option award activity for the year ended December 31, 2015:
2015 | ||||||
Shares | Wtd. Avg. Exer. Price | |||||
Options outstanding, beginning of period | 1,332,190 | $ | 34.02 | |||
Options granted | — | $ | — | |||
Options canceled | (1,800 | ) | $ | 34.15 | ||
Options exercised | — | $ | — | |||
Options outstanding, end of period | 1,330,390 | $ | 34.02 | |||
Options exercisable, end of period | 1,330,390 | $ | 34.02 | |||
Our outstanding and exercisable stock option awards at December 31, 2015 had no aggregate intrinsic value since all outstanding stock option awards were out of the money. At December 31, 2015 the weighted average remaining contract life of stock option awards outstanding and exercisable was 3.8 years. The total intrinsic value of stock option awards exercised for the years ended December 31, 2015, 2014 and 2013 was not material.
The following table summarizes information about stock option awards outstanding at December 31, 2015:
Options Outstanding | Options Exercisable | |||||||||||||||
Range of Exercise Prices | Number Outstanding at 12/31/15 | Wtd. Avg. Remaining Contractual Life | Wtd. Avg. Exercise Price | Number Exercisable at 12/31/15 | Wtd. Avg. Exercise Price | |||||||||||
$8.00 to $24.99 | 380,080 | 3.6 | $ | 19.91 | 380,080 | $ | 19.91 | |||||||||
$25.00 to $45.00 | 950,310 | 3.8 | $ | 39.67 | 950,310 | $ | 39.67 | |||||||||
$8.00 to $45.00 | 1,330,390 | 3.7 | $ | 34.02 | 1,330,390 | $ | 34.02 | |||||||||
Restricted Stock Awards
For the years ended December 31, 2015, 2014 and 2013, the Company issued 609,238 shares, 747,400 shares and 869,430 shares, respectively, of restricted stock to employees, consultants, and directors. These shares vest over three years and remain subject to forfeiture if vesting conditions are not met. The ultimate treatment of these grants will be determined by the Bankruptcy Court, which may include forfeiture of all unvested awards to certain members of management of the Company and the Board of Directors. The weighted average fair values of these shares when issued, for the years ended December 31, 2015, 2014 and 2013 were $2.64, $11.55 and $14.86 per share, respectively.
The compensation expense for these awards was determined based on the closing market price of our stock at the date of grant applied to the total number of shares that were anticipated to fully vest. As of December 31, 2015, we had unrecognized compensation expense of $3.6 million related to restricted stock awards which is expected to be recognized over a weighted-average period of 1.2 years. The grant date fair values of shares vested for the years ended December 31, 2015, 2014 and 2013 were $6.1 million, $11.8 million and $12.8 million, respectively.
The following table represents restricted stock award activity for the year ended December 31, 2015:
2015 | ||||||
Shares | Wtd. Avg. Grant Price | |||||
Restricted shares outstanding, beginning of period | 1,414,012 | $ | 14.81 | |||
Restricted shares granted | 609,238 | $ | 2.64 | |||
Restricted shares canceled | (232,482 | ) | $ | 13.65 | ||
Restricted shares vested | (303,692 | ) | $ | 20.04 | ||
Restricted shares outstanding, end of period | 1,487,076 | $ | 8.94 | |||
69
Performance-Based Restricted Stock Units
For the years ended December 31, 2015, 2014 and 2013, the Company granted 216,450, 185,250 and 189,700 performance-based restricted stock units, respectively. These units contained predetermined market and performance conditions set by our compensation committee with a performance period of 3 years and a cliff vesting period of 3.1 years. Further, the ultimate treatment of these grants will be determined by the Bankruptcy Court, which may include forfeiture of all unvested awards to certain members of management. The Target payout is 100% of the units granted while the conditions of the grants allow for a payout ranging between no payout and 200% of target.
The compensation expense for the market condition is based on the per unit grant date valuation using a Monte-Carlo simulation. The performance condition is remeasured quarterly and compensation expense is recorded based on the closing market price of our stock per unit on the grant date multiplied by the expected payout level. The payout level for the 2015 awards is calculated based on actual stock price performance achieved during the performance period while the payout level for the 2014 and 2013 awards is calculated based on actual performance achieved during the performance period compared to a defined peer group.
As of December 31, 2015, we had unrecognized compensation expense of $0.9 million related to our restricted stock units which is expected to be recognized over a weighted-average period of 1.5 years. No shares vested during the years ended December 31, 2015, 2014 and 2013. The weighted average grant date fair value for the restricted stock units granted during the years ended December 31, 2015, 2014 and 2013 was $1.98, $11.68 and $15.01 per unit, respectively.
The following table represents restricted stock unit activity for the year ended December 31, 2015:
Shares | Wtd. Avg. Grant Price | |||||
Restricted stock units outstanding, beginning of period | 374,950 | $ | 13.36 | |||
Restricted stock units granted | 216,450 | $ | 1.98 | |||
Restricted stock units canceled | — | $ | — | |||
Restricted stock units vested | — | $ | — | |||
Restricted stock units outstanding, end of period | 591,400 | $ | 9.20 | |||
Cash-Settled Restricted Stock Units (Liability Awards)
During the year ended 2015, the Company granted 147,812 units of cash-settled restricted stock units. The grants have a cliff vesting period of approximately 1.0 year while the compensation expense and corresponding liability are remeasured quarterly over the corresponding service period. The vesting of these grants, the timing of which is currently uncertain due to the bankruptcy proceedings, originally required a cash payout based on the fair value of the stock price on the date of the next Annual Shareholder Meeting in May of 2016. The ultimate treatment of these grants will be determined by the Bankruptcy Court, which may include forfeiture of all unvested awards.
Employee Stock Ownership Plan
The company established the Employee Stock Ownership Plan (“ESOP”), effective January 1, 1996. All employees over the age of 21 with one year of service were participants. This plan had a three-year cliff vesting requirement. The ESOP was designed to enable our employees to accumulate stock ownership. While employees did not contribute to the plan, contributions made by the Company provided participants with an allocation of stock within the plan. The plan could also acquire Swift Energy common stock, purchased at fair market value. The ESOP could borrow money from Swift Energy to buy Swift Energy common stock. ESOP payouts were paid in a lump sum or installments, and the participants generally had the choice of receiving cash or stock. In 2015, with the approval of the Board of Directors, the Company began winding down the ESOP and on October 25, 2015, the Board of Directors approved the termination of the ESOP. Distributions were made to all participants with a balance based on each participant’s election, and as of December 31, 2015, there were no remaining participants in the ESOP. The Company is in the process of completing the remaining administrative steps necessary to formally terminate the ESOP. Accordingly, no contributions were made by Swift Energy for the years ended December 31, 2015 and 2014. Our contribution to the ESOP plan totaled $0.2 million for the year ended year ended December 31, 2013, and was all made in common stock, from treasury shares which totaled 14,815, and was recorded as “General and administrative, net” on the accompanying consolidated statements of operations.
70
Employee Savings Plan
We have a savings plan under Section 401(k) of the Internal Revenue Code. In 2013 this plan was updated so that eligible employees may make voluntary contributions into the 401(k) savings plan with Swift Energy contributing on behalf of the eligible employee an amount up to 100% of the first 6% of compensation based on the contributions made by the eligible employees. The 2015 plan contributions of $0.7 million are expected to be paid in cash during the first quarter of 2016. Our contributions to the 401(k) savings plan were $1.9 million for the year ended December 31, 2014 and were $1.8 million for the year ended December 31, 2013. These amounts were recorded as “General and administrative, net” on the accompanying consolidated statements of operations. The 2014 plan contributions were made with a combination of $0.9 million of cash and 352,476 shares of common stock, from treasury shares, while the 2013 plan contributions were made in common stock, from treasury shares. The shares of common stock contributed to the 401(k) savings plan totaled 139,850 for the year ended December 31, 2013.
8. Related-Party Transactions
We receive research, technical writing, publishing, and website-related services from Tec-Com Inc., a corporation located in Knoxville, Tennessee and controlled and majority owned by the aunt of the Company's Chairman of the Board and Chief Executive Officer. We paid Tec-Com, for services pursuant to the terms of the contract, approximately $0.5 million in 2015 and $0.6 million in 2014 and 2013. The contract will be terminated on March 31, 2016.
As a matter of corporate governance policy and practice, related party transactions are annually presented and considered by the Corporate Governance Committee of our Board of Directors in accordance with the Committee's charter.
9. Acquisitions and Dispositions
On July 15, 2014, we closed our transaction with Saka Energi to fully develop 8,300 acres of Fasken area Eagle Ford shale properties owned by Swift Energy in Webb County, Texas, with an effective date of January 1, 2014. Swift Energy sold a 36% full participating interest in the Fasken properties to Saka Energi for $175 million in total cash consideration, with $125 million paid at closing (subject to adjustments for the interim period between the effective date and the closing date) and $50 million in cash to be paid by Saka Energi over time to carry a portion of Swift Energy's field development costs incurred after the effective date. As of December 31, 2015, approximately $5.5 million remained of Saka Energi's original $50 million carry obligation. At closing, the Company received approximately $147 million in proceeds, including a $12.5 million deposit received during the prior quarter which was held in an escrow account until the closing date, as well as adjustments for the interim period between the effective date and the closing date. The proceeds initially were used to reduce our outstanding borrowings on our credit facility which were partially offset by additional borrowings against the credit facility during the second half of the year to fund development expenditures. No gain or loss was recognized for the transaction as the proceeds were applied to the full cost pool.
On December 31, 2015, the Company, entered into a purchase and sale agreement with Texegy LLC (Texegy) to sell a full participating 75% working interest of Swift Energy’s position in the South Bearhead Creek Field and Burr Ferry Field located in Allen, Avoyelles, Vernon, Sabine and Beauregard Parishes in central Louisiana. The Bankruptcy Court approved the sale on February 2, 2016. To date, Swift has received two cash deposits aggregating $4.9 million from Texegy, the second of which was made upon Bankruptcy Court approval of the sale on February 2, 2016. The purchase agreement provides for Texegy to pay Swift Energy approximately $49.0 million in cash consideration, which is subject to closing adjustments and adjustments for interim operations between January 1, 2016 and the closing date. Upon closing, which the purchase and sale agreement provides will occur on or prior to March 15, 2016 unless a later date is agreed to by both parties, Swift will retain approximately $13.0 million of the closing proceeds (subject to the same adjustments), with the balance to be paid to the Company’s first-lien secured lenders under the Company’s credit facility. The properties being sold represent approximately 5% of the company's total reserves as of December 31, 2015.
In addition to paying for its share of costs, Texegy has agreed to carry a portion of the Company’s field development costs, which are limited to the Company's 25% share of all costs for the drilling of two wells to casing point in the South Bearhead Creek Field. On the closing date, Swift Energy and Texegy plan to enter into a joint development agreement and a joint operating agreement (together, the “JV Agreements”) to continue operation and development of the Properties with a Texegy affiliate serving as the operator of the Properties, that will conduct all drilling, completion and production operations. Under the JV Agreements, future development plans for the field will be mutually agreed upon by the Company and Texegy.
71
10. Fair Value Measurements
FASB ASC 820-10 defines fair value, establishes guidelines for measuring fair value and expands disclosure about fair value measurements. It does not create or modify any current GAAP requirements to apply fair value accounting. However, it provides a single definition for fair value that is to be applied consistently for all prior accounting pronouncements.
Our financial instruments consist of cash and cash equivalents, restricted cash, accounts receivable, accounts payable, bank borrowings, and senior notes. The carrying amounts of cash and cash equivalents, restricted cash, accounts receivable, and accounts payable approximate fair value due to the highly liquid or short-term nature of these instruments.
Based upon quoted market prices as of December 31, 2015, 2014 and 2013, the fair value and carrying value of our senior notes was as follows (in millions):
Subject to Compromise | Not Subject to Compromise | Not Subject to Compromise | |||||||||||||||||||||
December 31, 2015 | December 31, 2014 | December 31, 2013 | |||||||||||||||||||||
Fair Value | Carrying Value (1) | Fair Value | Carrying Value | Fair Value | Carrying Value | ||||||||||||||||||
7.125% senior notes due in 2017 | $ | 23.0 | $ | 250.0 | $ | 153.0 | $ | 250.0 | $ | 256.7 | $ | 250.0 | |||||||||||
8.875% senior notes due in 2020 | $ | 21.4 | $ | 225.0 | $ | 133.1 | $ | 222.8 | $ | 239.1 | $ | 222.4 | |||||||||||
7.875% senior notes due in 2022 | $ | 34.5 | $ | 400.0 | $ | 198.0 | $ | 404.5 | $ | 409.0 | $ | 404.9 | |||||||||||
(1) Includes write-off of discount associated with the 2020 notes and premium associated with the 2022 notes due to the Company's bankruptcy proceedings. | |||||||||||||||||||||||
Our senior notes due in 2017, 2020 and 2022 are stated at carrying value on our financial statements for the year ended December 31, 2015 and are stated net of any discount or premium for the years ended December 31, 2014 and 2013. If we recorded these notes at fair value they would be Level 1 in our fair value hierarchy as they are traded in an active market with quoted prices for identical instruments.
As of December 31, 2015 all of the Company's hedging agreements had settled. The following table presents our assets and liabilities that are measured at fair value as of December 31, 2014, and are categorized using the fair value hierarchy. For additional discussion related to the fair value of the Company's derivatives, refer to Note 5 of these consolidated financial statements. The fair value hierarchy has three levels based on the reliability of the inputs used to determine the fair value (in millions):
Fair Value Measurements at | |||||||||||||||
Total | Quoted Prices in Active markets for Identical Assets (Level 1) | Significant Other Observable Inputs (Level 2) | Significant Unobservable Inputs (Level 3) | ||||||||||||
December 31, 2014 | |||||||||||||||
Assets | |||||||||||||||
Natural Gas Derivatives | $ | 2.4 | $ | — | $ | 2.4 | $ | — | |||||||
Natural Gas Basis Derivatives | $ | 0.1 | $ | — | $ | 0.1 | $ | — | |||||||
Liabilities | |||||||||||||||
Natural Gas Derivatives | $ | 0.1 | $ | — | $ | 0.1 | $ | — | |||||||
Our derivative assets and liabilities in the table above are measured at gross fair value and are shown on the accompanying consolidated balance sheets in “Other current assets” and "Accounts payable and accrued liabilities", respectively.
Level 1 – Uses quoted prices in active markets for identical, unrestricted assets or liabilities. Instruments in this category have comparable fair values for identical instruments in active markets.
Level 2 – Uses quoted prices for similar assets or liabilities in active markets or observable inputs for assets or liabilities in non-active markets. Instruments in this category are periodically verified against quotes from brokers and include our commodity derivatives that we value using commonly accepted industry-standard models which contain inputs such as contract prices, risk-free rates, volatility measurements and other observable market data that are obtained from independent third-party sources.
72
Level 3 – Uses unobservable inputs for assets or liabilities that are in non-active markets. We do not have any assets or liabilities in this category.
11. Asset Retirement Obligations
We record these obligations in accordance with the guidance contained in FASB ASC 410-20. This guidance requires entities to record the fair value of a liability for legal obligations associated with the retirement obligations of tangible long-lived assets in the period in which it is incurred. When the liability is initially recorded, the carrying amount of the related long-lived asset is increased. The liability is discounted from the expected date of abandonment. Over time, accretion of the liability is recognized each period, and the capitalized cost is depreciated on a unit-of-production basis as part of depreciation, depletion, and amortization expense for our oil and gas properties. Upon settlement of the liability, the Company either settles the obligation for its recorded amount or incurs a gain or loss upon settlement which is included in the “Property and Equipment” balance on our accompanying consolidated balance sheets. This guidance requires us to record a liability for the fair value of our dismantlement and abandonment costs, excluding salvage values.
The following provides a roll-forward of our asset retirement obligations (in thousands):
Asset Retirement Obligations as of December 31, 2013 | $ | 79,084 | |
Accretion expense | 5,712 | ||
Liabilities incurred for new wells and facilities construction | 469 | ||
Reductions due to sold and abandoned wells and facilities | (8,253 | ) | |
Revisions in estimates | (4,181 | ) | |
Asset Retirement Obligations as of December 31, 2014 | $ | 72,831 | |
Accretion expense | 5,572 | ||
Liabilities incurred for new wells and facilities construction | 151 | ||
Reductions due to sold and abandoned wells and facilities | (4,576 | ) | |
Revisions in estimates | (10,423 | ) | |
Asset Retirement Obligations as of December 31, 2015 | $ | 63,555 | |
At December 31, 2015 and 2014, approximately $7.2 million and $10.7 million, respectively, of our asset retirement obligation was classified as a current liability in “Accounts payable and accrued liabilities” on the accompanying consolidated balance sheets. The decrease in 2015 is primarily attributable to revaluation changes due to changes in service costs driven by market conditions, which led to a decrease in the estimated plugging and abandonment costs for many our wells and facilities.
12. Consolidating Financial Information
Swift Energy Company (the parent) is the issuer and Swift Energy Operating, LLC (a wholly owned indirect subsidiary of Swift Energy Company) is the sole guarantor of our senior notes due in 2017, 2020 and 2022. Swift Energy Company does not have any independent assets or operations. The guarantees on our senior notes due in 2017, 2020 and 2022 are full and unconditional. All subsidiaries of Swift Energy Company, other than Swift Energy Operating, LLC, are minor.
The Chapter 11 bankruptcy proceedings, as discussed in Note 1A of the consolidated financial statements, include all of our domestic subsidiaries but do not include our international subsidiaries, which are 100% owned by our domestic subsidiary Swift Energy International, Inc. These international subsidiaries primarily consist of our New Zealand subsidiaries, which liquidated their assets in 2007 and 2008. These subsidiaries have had no activity since 2008, except for the recognition of gains in 2011 upon the settlement of legal claims related to the 2007 and 2008 divestitures, and have no debt obligations. We do not have any material intercompany balances between our entities in bankruptcy proceedings and our entities not in bankruptcy proceedings. Intercompany balances for our entities in bankruptcy proceedings, which have been eliminated within our consolidated balance sheets, include payables due from Swift Energy Operating, LLC to Swift Energy Company (the parent) in the amount of $416.4 million and to Swift Energy International, Inc. in the amount of $85.4 million, and receivables due to Swift Energy Operating, LLC from Swift Energy Alaska, Inc. in the amount of approximately $6.1 million and from Swift Energy Exploration Services, Inc. in the amount of $0.1 million.
73
Supplementary Information
Swift Energy Company and Subsidiaries
Oil and Gas Operations (Unaudited)
Capitalized Costs. The following table presents our aggregate capitalized costs relating to oil and natural gas producing activities and the related depreciation, depletion, and amortization (in thousands):
Total | |||
December 31, 2015 | |||
Proved oil and gas properties | $ | 5,972,666 | |
Unproved oil and gas properties | 18,839 | ||
5,991,505 | |||
Accumulated depreciation, depletion, and amortization | (5,540,952 | ) | |
Net capitalized costs | $ | 450,553 | |
December 31, 2014 | |||
Proved oil and gas properties | $ | 5,826,995 | |
Unproved oil and gas properties | 64,903 | ||
5,891,898 | |||
Accumulated depreciation, depletion, and amortization | (3,803,080 | ) | |
Net capitalized costs | $ | 2,088,818 | |
There were $18.8 million of unproved property costs at December 31, 2015, excluded from the amortizable base. Of this amount, $10.3 million was incurred in 2015, $1.4 million was incurred in 2014, $2.5 million was incurred in 2013 and $4.6 million was incurred in prior years. We evaluate the majority of these unproved costs within a two to four year time frame.
Capitalized asset retirement obligations have been included in the Proved oil and gas properties as of December 31, 2015 and 2014.
Costs Incurred. The following table sets forth costs incurred related to our oil and natural gas operations (in thousands):
Year Ended December 31, | |||||||||||
2015 | 2014 | 2013 | |||||||||
Lease acquisitions and prospect costs | $ | 28,571 | $ | 44,162 | $ | 46,555 | |||||
Exploration | — | — | 5,279 | ||||||||
Development (1) (3) | 74,948 | 327,878 | 492,098 | ||||||||
Total acquisition, exploration, and development (2) | $ | 103,519 | $ | 372,040 | $ | 543,932 | |||||
(1) Facility construction costs and capital costs have been included in development costs, and totaled $5.5 million, $47.0 million and $67.0 million for the years ended December 31, 2015, 2014 and 2013, respectively.
(2) Includes capitalized general and administrative costs directly associated with the acquisition, exploration, and development efforts of approximately $12.7 million, $26.3 million and $31.8 million for the years ended December 31, 2015, 2014 and 2013, respectively. In addition, the total includes $4.9 million, $5.0 million and $7.2 million for the years ended December 31, 2015, 2014 and 2013, respectively, of capitalized interest on unproved properties.
(3) Includes asset retirement obligations incurred, including revisions, of approximately ($10.3 million), ($3.7 million) and $2.3 million for the years ended December 31, 2015, 2014 and 2013, respectively.
74
Supplementary Reserves Information. The following information presents estimates of our proved oil and natural gas reserves. Reserves were determined by us, and our reserves were audited by H. J. Gruy and Associates, Inc. (“Gruy”), independent petroleum consultants. Gruy has audited 99% of our proved reserves as of December 31, 2015 and 97% of our proved reserves as of December 31, 2014 and 2013. The decrease in reserves in 2015 were due to lower commodity prices and uncertainties, due in part to our bankruptcy filing, surrounding the availability of the financing that would be necessary to develop our proved undeveloped reserves, as disclosed in Note 1A of the consolidated financial statements.
Estimates of Proved Reserves | Total | Natural Gas | Oil | NGL | |||||||
(Boe) | (Mcf) | (Bbls) | (Bbls) | ||||||||
Proved reserves as of December 31, 2013 | 219,227,067 | 815,124,860 | 52,994,495 | 30,378,429 | |||||||
Revisions of previous estimates (1) (6) | (338,266 | ) | 35,340,785 | (3,042,459 | ) | (3,185,937 | ) | ||||
Purchases of minerals in place | — | — | — | — | |||||||
Sales of minerals in place (4) | (30,879,608 | ) | (185,248,104 | ) | — | (4,924 | ) | ||||
Extensions, discoveries, and other additions (3) | 18,204,680 | 63,912,343 | 3,265,519 | 4,287,104 | |||||||
Production (5) | (12,387,440 | ) | (42,382,798 | ) | (3,511,297 | ) | (1,812,345 | ) | |||
Proved reserves as of December 31, 2014 (6) | 193,826,433 | 686,747,086 | 49,706,258 | 29,662,327 | |||||||
Revisions of previous estimates (1) (6) | (112,895,177 | ) | (334,147,002 | ) | (37,191,224 | ) | (20,012,785 | ) | |||
Purchases of minerals in place | — | — | — | — | |||||||
Sales of minerals in place | — | — | — | — | |||||||
Extensions, discoveries, and other additions (3) | 487,939 | 2,927,633 | — | — | |||||||
Production (6) | (11,146,185 | ) | (43,839,319 | ) | (2,406,201 | ) | (1,433,431 | ) | |||
Proved reserves as of December 31, 2015 (6) | 70,273,010 | 311,688,398 | 10,108,833 | 8,216,111 | |||||||
Proved developed reserves (2): | |||||||||||
December 31, 2013 | 62,912,871 | 197,815,575 | 16,884,760 | 13,058,849 | |||||||
December 31, 2014 | 66,285,034 | 232,806,911 | 14,989,353 | 12,494,529 | |||||||
December 31, 2015 | 56,334,309 | 238,355,707 | 10,108,833 | 6,499,524 | |||||||
Proved undeveloped reserves (7) | |||||||||||
December 31, 2013 | 156,314,196 | 617,309,285 | 36,109,735 | 17,319,580 | |||||||
December 31, 2014 | 127,541,399 | 453,940,175 | 34,716,905 | 17,167,798 | |||||||
December 31, 2015 | 13,938,701 | 73,332,691 | — | 1,716,587 | |||||||
(1) Revisions of previous estimates are related to upward or downward variations based on current engineering information for production rates, volumetrics, reservoir pressure and commodity pricing. The decrease in reserves in 2015 were due to lower commodity prices and uncertainties, due in part to our bankruptcy filing, surrounding the availability of the financing that would be necessary to develop our proved undeveloped reserves, as disclosed in Note 1A of the consolidated financial statements. The overall slight decrease in reserves due to revisions in 2014 were driven by generally offsetting performance-based adjustments in various fields and included downward revisions in the Central Louisiana area and upwards revisions in the Fasken area. Proved reserves, as of December 31, 2015, 2014 and 2013, were based upon the preceding 12-months' average price based on closing prices on the first business day of each month, or prices defined by existing contractual arrangements are held constant, for that year's reserves calculation. The 12-month 2015 average adjusted prices after differentials used in our calculations were $2.61 per Mcf of natural gas, $49.58 per barrel of oil, and $14.64 per barrel of NGL compared to $4.32 per Mcf of natural gas, $93.64 per barrel of oil, and $33.00 per barrel of NGL for the 12-month average 2014 prices and $3.41 per Mcf of natural gas, $104.38 per barrel of oil, and $31.68 per barrel of NGL for the 12-month average 2013 prices.
(2) At December 31, 2015, 2014 and 2013, 80%, 34% and 29% of our reserves were proved developed, respectively.
(3) We have added proved reserves primarily through our drilling activities, including 0.5 MMBoe added in 2015 and 18.2 MMBoe added in 2014. The 2015 proved reserves additions were all in the Fasken Eagle Ford area. The 2014 proved reserves additions consisted primarily of additions in the AWP Eagle Ford area.
(4) Includes the disposition of a portion of the Fasken properties in July of 2014. See Note 1 (Saka Energi Transaction) for more information.
(5) Production volumes include 3,884 MMcf of natural gas consumed in operations during 2014. See Note 6 below for further information.
(6) The Company's reserves volumes have historically included gas consumed in operations. Effective in our December 31, 2014 reserves volumes, we have excluded natural gas volumes expected to be consumed in future operations from our reserves volumes. The effect of this change is included in the table above under Revision of previous estimates during 2014, and all amounts shown during 2015 exclude these natural gas volumes. This change does not impact our cash flow or PV10 projections as the prices are adjusted accordingly.
(7) The decrease in proved undeveloped reserves during 2015 were due to lower commodity prices and uncertainties, due in part to our bankruptcy filing, surrounding the availability of the financing that would be necessary to develop our proved undeveloped reserves, as disclosed in Note 1A of the consolidated financial statements.
75
Standardized Measure of Discounted Future Net Cash Flows. The standardized measure of discounted future net cash flows relating to proved oil and natural gas reserves is as follows (in thousands):
Year Ended December 31, | |||||||||||
2015 | 2014 | 2013 | |||||||||
Future gross revenues | $ | 1,434,931 | $ | 8,597,119 | $ | 9,276,386 | |||||
Future production costs | (688,427 | ) | (2,447,318 | ) | (2,373,832 | ) | |||||
Future development costs (1) | (280,252 | ) | (2,256,328 | ) | (2,335,339 | ) | |||||
Future net cash flows before income taxes | 466,252 | 3,893,473 | 4,567,215 | ||||||||
Future income taxes | (297 | ) | (773,688 | ) | (1,001,588 | ) | |||||
Future net cash flows after income taxes | 465,955 | 3,119,785 | 3,565,627 | ||||||||
Discount at 10% per annum | (92,190 | ) | (1,468,111 | ) | (1,563,846 | ) | |||||
Standardized measure of discounted future net cash flows relating to proved oil and natural gas reserves | $ | 373,765 | $ | 1,651,674 | $ | 2,001,781 | |||||
(1) These amounts include future costs related to asset retirement obligations.
The standardized measure of discounted future net cash flows from production of proved reserves for the year ended December 31, 2015, was developed as follows:
1. Estimates were made of quantities of proved reserves and the future periods during which they are expected to be produced based on year-end economic conditions.
2. The estimated future gross revenues of proved reserves were based on the preceding 12-months' average price based on closing prices on the first day of each month, or prices defined by existing contractual arrangements.
3. The future gross revenues were reduced by estimated future costs to develop and to produce the proved reserves, including asset retirement obligation costs, based on year-end cost estimates and the estimated effect of future income taxes.
4. Future income taxes were computed by applying the statutory tax rate to future net cash flows reduced by the tax basis of the properties, the estimated permanent differences applicable to future oil and natural gas producing activities and tax carry forwards.
The standardized measure of discounted future net cash flows is not intended to present the fair market value of our oil and natural gas reserves. An estimate of fair value would also take into account, among other things, the recovery of reserves in excess of proved reserves, anticipated future changes in prices and costs, an allowance for return on investment, and the risks inherent in reserves estimates.
The following are the principal sources of changes in the standardized measure of discounted future net cash flows (in thousands) for the years ended December 31, 2015, 2014 and 2013:
2015 | 2014 | 2013 | |||||||||
Beginning balance | $ | 1,651,674 | $ | 2,001,781 | $ | 1,871,701 | |||||
Revisions to reserves proved in prior years | |||||||||||
Net changes in prices, net of production costs | (2,018,065 | ) | (208,597 | ) | 428,680 | ||||||
Net changes in future development costs | 817,324 | (19,651 | ) | 15,213 | |||||||
Net changes due to revisions in quantity estimates | (599,342 | ) | (5,762 | ) | (736,754 | ) | |||||
Accretion of discount | 194,326 | 242,464 | 228,406 | ||||||||
Other | 119,483 | (236,996 | ) | (136,615 | ) | ||||||
Total revisions | (1,486,274 | ) | (228,542 | ) | (201,070 | ) | |||||
New field discoveries and extensions, net of future production and development costs | 3,025 | 38,301 | 503,604 | ||||||||
Purchases of minerals in place | — | — | — | ||||||||
Sales of minerals in place | — | (128,939 | ) | 6,724 | |||||||
Sales of oil and gas produced, net of production costs | (137,251 | ) | (396,399 | ) | (422,691 | ) | |||||
Previously estimated development costs incurred | 51,149 | 234,184 | 254,022 | ||||||||
Net change in income taxes | 291,442 | 131,288 | (10,509 | ) | |||||||
Net change in standardized measure of discounted future net cash flows | (1,277,909 | ) | (350,107 | ) | 130,080 | ||||||
Ending balance | $ | 373,765 | $ | 1,651,674 | $ | 2,001,781 | |||||
76
Selected Quarterly Financial Data (Unaudited). The following table presents summarized quarterly financial information for the years ended December 31, 2015 and 2014 (in thousands, except per share data):
Revenues | Net Income (Loss) Before Taxes | Net Income (Loss) | Basic EPS | Diluted EPS | |||||||||||||||
2015 | |||||||||||||||||||
First | $ | 68,337 | $ | (556,568 | ) | $ | (477,077 | ) | $ | (10.79 | ) | $ | (10.79 | ) | |||||
Second | 66,169 | (293,509 | ) | (292,867 | ) | (6.58 | ) | (6.58 | ) | ||||||||||
Third | 60,116 | (354,588 | ) | (354,588 | ) | (7.96 | ) | (7.96 | ) | ||||||||||
Fourth (1) | 50,099 | (529,849 | ) | (529,439 | ) | (11.88 | ) | (11.88 | ) | ||||||||||
Total | $ | 244,721 | $ | (1,734,514 | ) | $ | (1,653,971 | ) | $ | (37.20 | ) | $ | (37.20 | ) | |||||
2014 | |||||||||||||||||||
First | $ | 144,180 | $ | 11,707 | $ | 5,442 | $ | 0.12 | $ | 0.12 | |||||||||
Second | 155,994 | 11,761 | 6,827 | 0.16 | 0.15 | ||||||||||||||
Third | 138,794 | 5,475 | 2,474 | 0.06 | 0.06 | ||||||||||||||
Fourth (1) | 110,488 | (462,413 | ) | (298,170 | ) | (6.80 | ) | (6.80 | ) | ||||||||||
Total | $ | 549,456 | $ | (433,470 | ) | $ | (283,427 | ) | $ | (6.47 | ) | $ | (6.47 | ) | |||||
(1) Due to the effects of pricing, timing of projects and changes in our reserves product mix (and the bankruptcy filing during the fourth quarter of 2015), in the fourth quarter of 2015 and 2014 we reported non-cash write-downs on a before and after-tax basis of $477.5 million and $445.4 million ($287.3 million after tax), respectively, on our oil and natural gas properties.
The sum of the individual quarterly net income (loss) per common share amounts may not agree with year-to-date net income (loss) per common share as each quarterly computation is based on the weighted average number of common shares outstanding during that period. In addition, certain potentially dilutive securities were not included in certain of the quarterly computations of diluted net income per common share because to do so would have been antidilutive.
77
Item 9. Changes in and Disagreements with Accountants on Accounting and Financial Disclosure
None.
Item 9A. Controls and Procedures
We maintain disclosure controls and procedures, as defined in Rules 13a-15(e) and 15d-15(e) of the Securities Exchange Act of 1934, consisting of controls and other procedures designed to give reasonable assurance that information we are required to disclose in the reports we file or submit under the Securities Exchange Act of 1934 is recorded, processed, summarized and reported within the time periods specified in the Securities and Exchange Commission's rules and forms and that such information is accumulated and communicated to management, including our chief executive officer and our chief financial officer, to allow timely decisions regarding such required disclosure. The Company’s chief executive officer and chief financial officer have evaluated such disclosure controls and procedures as of the end of the period covered by this annual report on Form 10-K and have determined that such disclosure controls and procedures are effective.
Internal Control Over Financial Reporting
There was no change in our internal control over financial reporting during 2015 that has materially affected, or is reasonably likely to materially affect, our internal control over financial reporting.
Item 9B. Other Information
None.
78
PART III
Item 10. Directors, Executive Officers and Corporate Governance.
Identification of Directors
The biographies of each member of our Board of Directors below contain information regarding the person’s service as a director of Swift Energy, business experience, director positions with other companies held currently or at any time during the last five years, information regarding involvement in certain legal or administrative proceedings, if applicable, and the experiences, qualifications, attributes or skills that were considered by the Corporate Governance Committee and the Board in determining that the person should serve as a director for the Company. All directors and Executive Officers of the Company were serving in their respective positions when the Company filed a voluntary petition for relief under Chapter 11 of the Bankruptcy Code on December 31, 2015.
Class I Directors
Clyde W. Smith, Jr., 66, has served as a director of Swift Energy since 1984. Since January 2002, Mr. Smith has served as President of Ascentron, Inc., an electronics manufacturing services company. From May 1998 until January 2002, Mr. Smith served as General Manager of D.W. Manufacturing, Inc., d/b/a Millennium Technology Services, an electronics manufacturer acquired by Ascentron, Inc., in January 2002. Mr. Smith is a Certified Public Accountant and holds the degree of Bachelor of Business Administration in Management. His qualifications to serve on the Board include his extensive experience as an executive and wealth of accounting knowledge.
Terry E. Swift, 60, has served as a director of Swift Energy since May 2000 and as Chairman of the Board since June 1, 2006. He has been Chief Executive Officer of the Company since May 2001 and President since February 2015, having previously served as President of the Company from November 1997 to November 2004. He also served as Chief Operating Officer from 1991 to February 2000 and as Executive Vice President from 1991 to 1997. Mr. Swift served in other progressive positions of responsibility since joining the Company in 1981. He holds the degrees of Bachelor of Science in Chemical Engineering and Master of Business Administration. He is the son of the late A. Earl Swift, founder of Swift Energy, and the nephew of Virgil N. Swift, Director Emeritus. His qualifications to serve as a Board member include over thirty years of service with the Company and his decades of technical oil and gas industry experience.
Charles J. Swindells, 73, has served as a director of Swift Energy since February 2006. Ambassador Swindells is currently a Senior Advisor to Bessemer Trust. Ambassador Swindells served as a Senior Advisor of Evercore Wealth Management, a unit of Evercore Partners, from June 2009 until December 31, 2010. He served as Vice Chairman, Western Region of U.S. Trust, Bank of America Private Wealth Management from 1993 until 2001, and again from 2005 until his retirement in January 2009. He also is a director on the board of The Greenbrier Companies, Inc., an international supplier of transportation equipment and services to the railroad industry. Ambassador Swindells served as United States Ambassador to New Zealand and Samoa from 2001 to 2005, and he served as Chairman of the Board of a non-profit board of trustees for Lewis & Clark College in Portland, Oregon, from 1998 until 2001. He holds the degree of Bachelor of Science in Political Science. Ambassador Swindells is qualified to serve on the Board as his several years of service as an ambassador of the United States, along with his business experience, have enabled him to bring to the Board a unique mix of political, legislative and international knowledge and experience.
Class II Directors
Greg Matiuk, 70, has served as a director of Swift Energy since September 2003. After 36 years of service, Mr. Matiuk retired from ChevronTexaco Corporation in May 2003, having served as Executive Vice President, Administrative and Corporate Services since 2001. From 1998 until 2001, he was Vice President, Human Resources and Quality and, from 1996 to 1998, he served as Vice President of Strategic Planning and Quality. Mr. Matiuk began his career at Chevron Corporation in 1967 as a production and reservoir engineer, and while with Chevron Corporation he also held the positions of Vice President of Chevron USA’s Western Operations with responsibility for all onshore and off-shore operations in California, General Manager of Chevron’s production operations in the United Kingdom, and Manager of Production and Drilling for all of Chevron’s operations in Western Australia. He holds the degrees of Bachelor of Science in Geological Engineering and Executive Master of Business Administration. Mr. Matiuk was inducted into the Academy of Geological Engineering and Sciences of Michigan Technological University in 2001 in recognition of his professional excellence and service. He was chosen as a Board member due to his more than four decades of experience in various facets of the energy industry.
Ronald L. Saxton, 61, has served as a director of Swift Energy since February 2015. Mr. Saxton is an attorney and former business executive and is currently a shareholder at the law firm Schwabe, Williamson & Wyatt, in Portland, Oregon, a role he assumed January 1, 2015. Previously, Mr. Saxton served as Executive Vice President, Chief Administrative Officer and as a member of the board of directors of JELD-WEN, Inc., a global door and window manufacturer, for more than seven years. Prior to his roles at JELD-WEN, Mr. Saxton practiced law for almost 30 years, co-founding the law firm Ater Wynne, where he
79
served as Chairman for eleven years, and represented a variety of manufacturers, utility and energy companies in their finance, regulatory, contracting, and environmental matters. Mr. Saxton’s qualifications to serve on the Board include his vast legal experience in corporate and regulatory matters and his extensive public policy and political experience.
Class III Directors
William A. Bruckmann III, 64, has served as a director of Swift Energy since February 2015. Mr. Bruckmann is a former Managing Director at Chase Securities, Inc., with more than 25 years of banking experience, starting with Manufacturers Hanover Trust Company, where he became a senior officer in 1985. He later served as a Managing Director and sector head of Manufacturers Hanover’s gas pipeline and midstream energy practices through the acquisition of Manufacturers Hanover by Chemical Bank and the acquisition of Chemical Bank by Chase Bank. Mr. Bruckmann previously served as a member of the board of directors of MarkWest Energy Partners, L.P., from June 2014 until February 2016, and he also served on the board of Duncan Energy Partners L.P. from 2007 until September 2011, where he was Chairman of the Audit and Conflicts Committee. He also served as a director of Williams Energy Partners L.P. from May 2001 to June 2003. Mr. Bruckmann was chosen as a Board member because of his extensive energy banking knowledge and directorship experience.
Deanna L. Cannon, 55, has served as a director of Swift Energy since May 2004 and as the Chair of the Audit Committee since May 2010. Ms. Cannon is President of Cannon & Company CPAs PLC, a privately held consulting firm, and also currently serves as a director of Northern Michigan Angels, LLC, an angel investment group. She served as a shareholder and director of Corporate Finance Associates of Northern Michigan, an investment banking firm, from February 2005 to June 2010. She served Miller Exploration Company as Chief Financial Officer and Secretary from November 2001 to December 2003, as Vice President-Finance and Secretary from June 1999 to November 2001 and as a director of one of its wholly owned subsidiaries from May 2001 to December 2003. Miller Exploration Company was a publicly held independent oil and gas exploration and production company that was acquired by Edge Petroleum Corporation in December 2003. Previously, Ms. Cannon was employed in public accounting for 16 years. Ms. Cannon holds a Bachelor of Science degree in Accounting and is a Certified Public Accountant. We believe Ms. Cannon’s qualifications to serve on the Board include her wealth of accounting and financial knowledge, as well as her public company and industry-specific experience.
Douglas J. Lanier, 66, has served as a director of Swift Energy since May 2005 and currently serves as Lead Director at each executive session of the independent directors. Mr. Lanier retired in 2004 as Vice President of ChevronTexaco Exploration & Production Company, Gulf of Mexico Business Unit. He began his career with Gulf Oil Company in 1972 and served in various positions until 1989, when Mr. Lanier was appointed Assistant General Manager-Production for Chevron USA Central Region in Houston. He served in subsequent appointments until he joined Chevron Petroleum Technology Company as President in 1997. In October 2000, he was appointed Vice President of the Gulf of Mexico Shelf Strategic Business Unit. Mr. Lanier holds the degree of Bachelor of Science in Petroleum Engineering and is a member of the Society of Petroleum Engineers. Mr. Lanier was inducted into the University of Tulsa College of Engineering Hall of Fame in 2003. We believe Mr. Lanier is qualified to serve on the Board as he is an industry veteran with decades of experience in the energy industry.
Identification of Executive Officers
Robert J. Banks, 61, was appointed Executive Vice President and Chief Operating Officer in February 2008. From 2006 to 2008, he served as Vice President International Operations and Strategic Ventures. Mr. Banks has also served as Vice President International Operations of the Company’s subsidiary, Swift Energy International, since he joined the Company in 2004. Mr. Banks has 39 years of experience in both U.S. and international exploration and production activities. His responsibilities have included exploration, development, exploitation and acquisition projects. Prior to joining Swift Energy, Mr. Banks held executive-level positions at Vanco Energy Company, Mosbacher Energy Company, and Kuwait Foreign Petroleum Company, and senior-level positions at Santa Fe International Corporation. His direct project responsibilities have included exploration and production operations in 13 different countries in North America, Africa, Asia, Europe and the Pacific Rim. Mr. Banks holds the degree of Bachelor of Science.
Alton D. Heckaman, Jr., 58, was appointed Executive Vice President of Swift Energy in November 2004 and Chief Financial Officer in August 2000. He serves as the Company’s principal financial officer and principal accounting officer under SEC guidelines. Mr. Heckaman previously served as Senior Vice President-Finance from August 2000 until November 2004 and served in other progressive positions of responsibility since joining the Company in 1982. He is a Certified Public Accountant and holds the degrees of Bachelor of Business Administration in Accounting and Master of Business Administration.
Steven L. Tomberlin, 58, was appointed Senior Vice President—Asset Management in April 2015. Mr. Tomberlin previously served as Senior Vice President—Resource Development and Engineering from February 2012 until April 2015, Vice President—Resource Development and Engineering from December 2009 to February 2012, and as Director of Reservoir
80
Management and Technology from 2008 (when he joined the Company) to 2009. Prior to joining the Company, Mr. Tomberlin held key positions with BP Production America as Director-Decommissioning from February 2008 to October 2008 and as Manager-Operations Technical Group from January 2005 to January 2008. He has over thirty years of experience in the oil and gas industry in the areas of exploration and development of properties in the Mid-Continent, Gulf Coast onshore and Gulf of Mexico regions. Mr. Tomberlin holds the degree of Bachelor of Science in Chemical Engineering.
Dean E. Swick, 63, was engaged by the Company through his employer, Alvarez and Marsal North America, LLC (“A&M”), to be Chief Restructuring Officer of the Company on December 31, 2015, in conjunction with the Company’s Chapter 11 Bankruptcy filing. Mr. Swick joined A&M in July 2002 and has served as a Managing Director of the A&M Houston office since it opened in July of 2002. Prior to joining A&M, Mr. Swick was a partner in a Big Five accounting firm and led that firm's restructuring practice in the Southwest as well as the North American energy investment banking practice. Prior to that, Mr. Swick spent fifteen years in the banking and investment banking industry, including eleven years in the Global Petroleum Corporate Finance Group of The Chase Manhattan Bank, now known as JP Morgan Chase. Mr. Swick has extensive experience in all aspects of the reorganization process including: (a) the development and negotiation of complex capital structure solutions; (b) developing and evaluating strategic business plans, implementing liquidity conservation and monitoring strategies; and (c) advising on numerous in-court and out-of-court proceedings. Additionally, Mr. Swick advised debtors and creditors, and served in financial advisory and interim management roles, including as chief restructuring officer. Some of his recent advisory engagements, including in the energy space are: Alpha Coal, GSE Environmental, Hercules Offshore, Parallel Energy, Samson Energy and Seahawk Drilling. Further, in the last 12 months, Mr. Swick has led engagements involving approximately $2.5 billion of funded debt. All told, Mr. Swick has more than 38 years' experience with in-court and out-of-court restructurings and energy transactions.
Director Emeritus
Mr. Virgil Swift served as a director from 1981 until the 2005 annual meeting of shareholders, at which time he was given the honorary title of Director Emeritus. As this is an honorary distinction, no compensation is paid to Mr. V. Swift as Director Emeritus. The Board concluded that the service of Mr. V. Swift, due to his extensive experience with Swift Energy and the oil and gas industry, was an invaluable asset to the Company, and thus a consulting agreement was entered into with him. As such, Mr. V. Swift regularly attends Board and committee meetings. Pursuant to such agreement, Mr. V. Swift also provides advisory services to key employees, officers and directors, and as otherwise requested by the Chairman of the Board, Chief Executive Officer and President. Mr. V. Swift received compensation of $73,192 during 2015 pursuant to his consulting agreement. During the first quarter of 2016, the parties agreed to terminate the consulting agreement effective March 31, 2016.
Retired President and Director
Mr. Bruce H. Vincent, 67, retired as President of Swift Energy effective February 15, 2015, and resigned as a member of the Board of Directors as of that same date, after serving the Company for 25 years. Mr. Vincent served as a director of Swift Energy from May 2005 and as President of the Company from November 2004 until his retirement. He previously served in a variety of strategic roles for the Company, including Secretary of the Company from February 2008 until August 2012 and from August 2000 until May 2005, as Executive Vice President—Corporate Development from August 2000 to November 2004, and as Senior Vice President—Funds Management from 1990 (when he joined the Company) to 2000. Mr. Vincent is a recent Immediate Past Chairman of the Independent Petroleum Association of America and holds the degrees of Bachelor of Arts and Master of Business Administration.
In connection with his retirement, Mr. Vincent and the Company entered into a retirement agreement which is discussed further in the “Potential Payments Upon Termination or Change in Control” table. As Mr. Vincent served the Company as President during 2015, he is a Named Executive Officer as discussed in this Form 10-K.
Section 16(a) Beneficial Ownership Reporting Compliance
Section 16(a) of the Exchange Act requires the Company’s directors, executive officers, and persons who own more than 10% of the Company’s common stock to file reports with the SEC regarding their ownership of, and transactions in, the Company’s common stock. SEC regulations require Swift Energy to identify anyone who filed a required report late during the most recent fiscal year. Based on a review of the Forms 3 and 4 filed during the 2015 fiscal year and written certifications provided to the Company, the Company believes that all of these reporting persons timely complied with their filing requirements during 2015 except for one Form 4 filing by Mr. Saxton which was late by one business day due to an administrative error.
Code of Ethics
The Company also requires that officers, directors, employees and certain consultants of the Company provide an annual reaffirmation of the Company’s Code of Ethics and Business Conduct. A copy of the Code of Ethics and Business
81
Conduct is redistributed in connection with this requirement, and each person is asked to reaffirm and re-acknowledge that they have reviewed and refreshed their knowledge of the provisions of the Code of Ethics and Business Conduct and will comply with such code. They also reaffirm their understanding that their continued service to the Company is dependent upon compliance with the Company’s Code of Ethics and Business Conduct. In addition, all officers, directors, employees and certain consultants are required to annually recertify their understanding of, and adherence to, the Company’s Insider Trading Policy. A copy of the Insider Trading Policy is also redistributed in connection with this requirement.
Each of the Audit, Compensation, Corporate Governance and Finance Committees has a charter. Each such charter is reviewed annually by the applicable committee, and all of the charters are reviewed by the Corporate Governance Committee. The committee charters, the Board-adopted Principles for Corporate Governance and the Code of Ethics and Business Conduct are applicable to all employees and directors, and to certain consultants, and are posted on the Company’s website at www.swiftenergy.com. The committee charters, Principles for Corporate Governance and Code of Ethics and Business Conduct are also available in print, without charge, to any shareholder who requests a copy. Requests should be directed to the Company’s Investor Relations Department at 17001 Northchase Drive, Suite 100, Houston, Texas 77060; by telephone at (281) 874-2700 or (800) 777-2412; or by email to info@swiftenergy.com.
In addition, the Code of Ethics for Senior Financial Officers and Principal Executive Officer, as adopted by the Board, is posted on Swift Energy’s website, where the Company also intends to post any waivers from or amendments to this code.
Affirmative Determinations Regarding Independent Directors and Financial Experts
The Board has determined that each of the following directors is an “independent director” as such term is defined in Section 303A of the Listed Company Manual of the New York Stock Exchange, Inc. (“NYSE”): William A. Bruckmann III, Deanna L. Cannon, Douglas J. Lanier, Greg Matiuk, Ronald L. Saxton, Clyde W. Smith, Jr., and Charles J. Swindells. Seven of our eight directors are independent as of the 2015 Annual Meeting. These independent directors represent a majority of the Company’s Board of Directors. Mr. T. Swift is not an independent director because he also serves as an officer of the Company.
The Board has also determined that each member of the Audit, Compensation and Corporate Governance Committees of the Board meets the independence requirements applicable to those committees prescribed by the NYSE and the SEC. Further, the Board has determined that Deanna L. Cannon, Audit Committee Chair, and Messrs. William A. Bruckmann III and Clyde W. Smith, Jr., also members of the Audit Committee, are each an “audit committee financial expert,” as such term is defined in Item 407(d) of Regulation S-K promulgated by the SEC.
The Board reviewed the applicable standards for Board member and Board committee independence and the criteria applied to determine “audit committee financial expert” status, as well as the answers to annual questionnaires completed by each of the independent directors. On the basis of this review, the Board made its independence and “audit committee financial expert” determinations.
Audit Committee
The Audit Committee assists the Board in fulfilling its responsibilities with respect to oversight in monitoring: (i) the integrity of the financial statements of the Company; (ii) Swift Energy’s compliance with legal and regulatory requirements; (iii) the independent auditor’s selection, qualifications and independence; and (iv) the performance of Swift Energy’s internal audit function and independent auditor. The committee is required to be comprised of three or more non-employee directors, each of whom is determined by the Board to be “independent” under the rules promulgated by the SEC under the Securities Exchange Act of 1934 (the “Exchange Act”) and meets the financial literacy and experience requirements under the rules or listing standards established by the NYSE, all as may be amended. In addition, at least one member of the committee must satisfy the definition of “audit committee financial expert” as such term may be defined from time to time under the rules promulgated by the SEC. The Board has determined that Ms. Cannon and Messrs. Bruckmann and Smith qualify as audit committee financial experts and that each member of the Audit Committee is independent as defined in the NYSE Listed Company Manual and the rules of the SEC, and each meets the financial literacy and experience requirements established by the NYSE. A report of the Audit Committee appears later in this Form 10-K. Ms. Cannon (Committee Chair) and Messrs. Bruckmann, Smith and Swindells are members of the Audit Committee.
Compensation Committee
The Compensation Committee holds the responsibilities of the Board relating to compensation of the Company’s executive officers. This includes evaluating the compensation of the executive officers of the Company and its affiliates and their performance relative to their compensation to assure that such executive officers are compensated effectively in a manner consistent with the strategy of Swift Energy, competitive practices, and the requirements of the appropriate regulatory bodies. In addition, this committee evaluates and makes recommendations to the Board regarding the compensation of the directors. The Compensation Committee also evaluates and approves any amendment, some which may require shareholder approval, to
82
the Company’s existing equity-related plans and approves the adoption of any new equity-related plans, subject to shareholder and Board approval. The Compensation Committee is required to be comprised of at least three directors who are non-employee directors and determined by the Board to be independent under SEC rules and the NYSE’s listing standards. The Board has determined that all Compensation Committee members are independent as defined by the NYSE listing standards or rules of the SEC and NYSE. The report of the Compensation Committee is included below. Messrs. Smith (Committee Chair), Lanier, Matiuk, Saxton and Swindells are members of the Compensation Committee.
Aon Hewitt has been engaged by the Compensation Committee since the fourth quarter of 2012 to serve as its independent compensation consultant. Aon Hewitt reports directly to our Compensation Committee and has provided expert advice on the design and implementation of the Company’s compensation policies and programs. To the best of the Company’s knowledge, there are no conflicts between Aon Hewitt and any member of the Board. Aon Hewitt was also engaged, through an independent selection process of management, as the Company’s health and welfare benefits broker beginning April 2014; the fees paid to Aon Hewitt as the Company’s health and welfare benefits broker do not currently meet the threshold required for disclosure.
Compensation Committee Interlocks and Insider Participation
During 2015, the Compensation Committee of the Board consisted of Messrs. Smith, Lanier, Matiuk, Saxton and Swindells, all of whom are independent directors. Mr. Saxton joined the Company’s Compensation Committee in February 2015 when he became a director. To the Company’s knowledge, there are no compensation committee interlocks involving members of the Compensation Committee or other directors of the Company.
Corporate Governance Committee
The Corporate Governance Committee identifies individuals qualified to become directors, nominates candidates for directorships and also recommends to the Board for membership of each of the Board’s committees. This committee may consider nominees recommended by shareholders upon written request by a shareholder in accordance with the procedures for submitting shareholder proposals. The Corporate Governance Committee develops, monitors and recommends to the Board corporate governance principles and practices applicable to Swift Energy. The committee also assists management of the Company in identifying, screening and recommending to the Board individuals qualified to become executive officers of the Company. In addition, this committee administers the Company’s Conflict of Interest Policy. The Corporate Governance Committee is required to be comprised of at least three directors who are non-employee directors and determined by the Board to be independent under the NYSE listing standards and the rules of the SEC. Messrs. Matiuk (Committee Chair), Bruckmann, Saxton, Swindells and Ms. Cannon are members of the Corporate Governance Committee and, as determined by the Board, all are independent as defined in the NYSE listing standards and rules of the SEC.
Finance Committee
The Finance Committee was formally created in August 2015 after acting as an ad hoc committee starting in February 2015. The Finance Committee provides assistance to the Board in overseeing the financial strategy and condition of the Company, along with the financial resources available to and used by the Company. The Committee provides advice to senior management, including the Company’s chief financial officer and chief executive officer and the Board concerning matters within its scope of responsibility. The Committee does not have oversight responsibility with respect to the Company’s financial reporting, which is the responsibility of the Audit Committee of the Board. Messrs. Bruckmann (Chair), Saxton, Smith, Swift and Ms. Cannon are members of the Finance Committee.
Executive Committee
The Executive Committee is authorized to act for the Board at times when it is not convenient for the full Board to act as an assembled board, except where full Board action is required by applicable law. Any action taken by the Executive Committee is required to be reported at the next full Board meeting. Messrs. T. Swift (Committee Chair), Matiuk and Lanier are members of the Executive Committee. Mr. Vincent was a member of the Executive Committee up until his retirement on February 15, 2015.
Board Leadership Structure; Role in Risk Oversight
Under Swift Energy’s Bylaws, the Board of Directors may appoint the same person to serve as the Chairman of the Board and the Company’s Chief Executive Officer. The Board believes that the Chief Executive Officer bears the primary responsibility for managing the day-to-day business of Swift Energy and is the most informed about the Company’s overall strategic direction, which makes him the best person at this time to lead the Company’s Board of Directors as Chairman and to ensure that key strategic business and governance issues are considered by the Board. This combined role promotes decisive leadership and clear accountability.
83
Mr. Terry Swift has served as Chairman of the Board since June 1, 2006, and as a director of the Company since May 2000, as the Chief Executive Officer of Swift Energy since May 2001, and as President since February 2015, having previously served as President of the Company from November 1997 to November 2004. The Board believes that having Mr. T. Swift fill the role of both Chairman and CEO remains the best leadership structure for Swift Energy at this time.
Mr. T. Swift is joined in leadership of the Board by our Lead Director, Mr. Douglas Lanier, who is a non-management director. Mr. Lanier has significant Board experience, decades of oil and gas executive experience, and the experience of serving on two Board committees for Swift Energy, including the Executive Committee. As such, Mr. Lanier is a qualified advisor to Mr. T. Swift and makes himself available for consultation at all times. We also have other checks and balances for our Board structure:
• | our Audit, Compensation and Corporate Governance committees are all completely independent, as required; |
• | seven of our eight Board members are independent; |
• | our independent Corporate Governance Committee has responsibility for Board and management succession planning and related recommendations to the full Board; |
• | led by the Corporate Governance Committee, a Board assessment is conducted annually, assessing the entire Board (not just the current class of nominees) and its committees; |
• | following most meetings of the Board, the Lead Director presides over an executive session of the independent members of the Board; and |
• | any shareholder may communicate with the Lead Director as appropriate on sensitive issues about management or corporate governance. |
The full Board is responsible for general oversight of enterprise risk concerns inherent in our business. At each Board meeting, the Board receives reports from members of our senior management that help the Board assess the risks we face in the conduct of our business. Members of our senior technical staff frequently make presentations to the Board about current and planned exploration and development activities that may subject us to operational and financial risks. In addition, the Audit Committee reviews the effectiveness of our internal controls over financial reporting, which are designed to address risks specific to financial reporting, with our internal auditors and independent accountants at least annually. Through the Company’s independent Audit, Compensation, and Corporate Governance committees, Swift Energy has established processes for the effective oversight of critical issues, such as integrity of our financial statements, corporate governance, executive compensation, and selection of directors and director nominees.
Nominations for Directors under the Plan of Reorganization
There have been no material changes to the Company’s procedures to nominate candidates for the Board of Directors. However, the plan of reorganization filed by the Company with the Bankruptcy Court on February 5, 2016 (the “Plan”), if approved and confirmed by the Bankruptcy Court, provides that upon emergence from bankruptcy, the term of each of the current members of the Board will expire, and the post-emergence Company’s new board of directors (the “New Swift Board”) will be made up of seven directors consisting of (a) the Chief Executive Officer of the post-emergence Company, (b) two directors appointed by Strategic Value Partners, LLC, a current holder of the Company’s senior notes, (c) two directors appointed by other current holders of the Company’s senior notes, and (d) two independent directors initially nominated by certain current holders of the Company’s senior notes, and then nominated by the nominating and governance committee of the New Swift Board once formed. The Plan also provides that the Chief Executive Officer of the post-emergence Company will be consulted and participate in the independent director selection process and with the selection of the non-executive chairman.
84
Item 11. Executive Compensation.
Bankruptcy Filing
As noted throughout this Form 10-K, on December 31, 2015, the Company filed a voluntary petition for relief under Chapter 11 of the Bankruptcy Code in a United States Bankruptcy Court for the District of Delaware (the “Bankruptcy Court”). Under the Bankruptcy Code, the Company is prohibited from paying certain compensation, including, but not limited to, incentive compensation to Named Executive Officers and members of the Board of Directors during the bankruptcy proceedings without Bankruptcy Court approval. This CD&A reflects compensation decisions made by the Compensation Committee both prior to and after the Company’s filing for Chapter 11. The Company has remained in compliance at all times with the Bankruptcy Code and applicable Bankruptcy Court orders.
Compensation of Directors
In accordance with its charter, the Compensation Committee periodically evaluates the compensation of non-employee directors for service on the Board and on Board committees. In consultation with an independent compensation consultant, the Compensation Committee recommends annual retainer and meeting fees for non-employee directors and fees for service on Board committees, sets the terms and awards of any stock-based compensation and submits these recommendations to the Board of Directors for approval subject to shareholder approval, if required. Directors who are also employees of the Company receive no additional compensation for service as directors. The following table shows compensation for non-employee directors for 2015:
Annual Board Retainer | $ | 55,500 | ||
Annual Meeting Fee Payment | $ | 12,500 | (1) | |
Annual Committee Retainer | $ | 5,000 | (2) | |
Committee Premiums: | ||||
Audit Committee Chair | $ | 15,000 | (3) | |
Compensation Committee Chair | $ | 10,000 | (4) | |
Corporate Governance Committee Chair | $ | 8,000 | (4) | |
Finance Committee Chair | $ | 10,000 | (5) | |
Finance Committee Member | $ | 10,000 | (5) | |
Executive Committee Member | $ | 8,000 | ||
Lead Director Premium | $ | 8,000 | ||
Annual Restricted Award Grant Date Value | $ | 140,000 | (6) | |
(1) | Annual meeting fee paid for a minimum of five meetings. | |
(2) | Annual fee for serving on one or more committees. | |
(3) | Annual fee for a minimum of four meetings. | |
(4) | Annual fee for a minimum of two meetings. | |
(5) | The Finance Committee Chair Premium and the Finance Committee Member Premium are one-time payments following Compensation Committee approval of such fees. | |
(6) | Number of restricted shares to be determined, based on the closing stock price on the day after the 2015 Annual Meeting. Restrictions on restricted shares lapse as to one-third of such shares each year beginning on the first anniversary of the grant date and, subject to a 1-year service requirement; restrictions on all shares lapse when a director ceases to be a member of the Board. Unvested shares currently outstanding are subject to the provisions of the Bankruptcy Code and Bankruptcy Court approval. | |
The following table sets forth certain summary information regarding compensation paid or accrued by the Company to or on behalf of the Company’s non-employee directors for the fiscal year ended December 31, 2015:
85
Name(a) | Fees Earned or Paid in Cash ($) (b) | Stock Awards ($)(1) (c) | Option Awards ($)(1) (d) | Non-Equity Incentive Plan Compen- sation ($) (e) | Change in Pension Value and Nonqualified Deferred Compen- sation Earnings ($) (f) | All Other Compen- sation ($)(2) (g) | Total ($) (h) | |||||||||||||||||||||
William A. Bruckmann, III(3) | $ | 83,550 | $ | 149,315 | $ | — | $ | — | $ | — | $ | — | $ | 232,865 | ||||||||||||||
Deanna L. Cannon(3) | $ | 98,000 | $ | 140,003 | $ | — | $ | — | $ | — | $ | 362 | $ | 238,365 | ||||||||||||||
Douglas J. Lanier(3) | $ | 89,000 | $ | 140,003 | $ | — | $ | — | $ | — | $ | — | $ | 229,003 | ||||||||||||||
Greg Matiuk(3) | $ | 89,000 | $ | 140,003 | $ | — | $ | — | $ | — | $ | — | $ | 229,003 | ||||||||||||||
Ronald L. Saxton(3) | $ | 73,550 | $ | 149,315 | $ | — | $ | — | $ | — | $ | 778 | $ | 223,643 | ||||||||||||||
Clyde W. Smith, Jr.(3) | $ | 93,000 | $ | 140,003 | $ | — | $ | — | $ | — | $ | 1,015 | $ | 234,018 | ||||||||||||||
Charles J. Swindells(3) | $ | 73,000 | $ | 140,003 | $ | — | $ | — | $ | — | $ | — | $ | 213,003 | ||||||||||||||
(1) | The amounts in columns (c) and (d) reflect the aggregate grant date fair value computed in accordance with FASB ASC Topic 718 for awards granted during that year. Assumptions used in the calculation of these amounts are included in Note 6 to Consolidated Financial Statements in the Company’s audited financial statements for the fiscal year ended December 31, 2015, which are included in this Annual Report on Form 10-K for the year ended December 31, 2015. This includes both Restricted Stock Awards and cash-settled Restricted Stock Units. | |
(2) | No perquisites are included in this column as to any independent director, as the aggregate perquisites for any director during 2015 did not exceed $10,000. The amounts included for Ms. Cannon and Messrs. Saxton and Smith represent gross-up reimbursement payments for spousal travel. | |
(3) | At December 31, 2015, the aggregate number of stock options, restricted stock awards and cash-settled restricted stock units outstanding (including 2015 and awards from prior years) include: | |
Name | Stock Options | Restricted Stock Awards | Cash-Settled Restricted Stock Units | ||||||
William A. Bruckmann, III | — | 44,368 | 21,116 | ||||||
Deanna L. Cannon | — | 53,958 | 21,116 | ||||||
Douglas J. Lanier | — | 53,958 | 21,116 | ||||||
Greg Matiuk | — | 53,958 | 21,116 | ||||||
Ronald L. Saxton | — | 44,368 | 21,116 | ||||||
Clyde W. Smith, Jr. | — | 53,958 | 21,116 | ||||||
Charles J. Swindells | — | 53,958 | 21,116 | ||||||
EXECUTIVE COMPENSATION
Compensation Discussion and Analysis (“CD&A”)
Named Executive Officers
Our Named Executive Officers (“NEOs”) are: Terry Swift, Chief Executive Officer and President (CEO); Alton Heckaman, Executive Vice President and Chief Financial Officer (EVP & CFO); Robert Banks, Executive Vice President and Chief Operating Officer (EVP & COO); Steven Tomberlin, Senior Vice President—Asset Management (SVP-AM); and Bruce Vincent, Retired President (effective February 15, 2015), who although not an officer or employee as of date of this Form 10-K, for purposes of this disclosure is included as an NEO under applicable SEC regulations.
Executive Summary
Pay-for-Performance Philosophy
Our executive compensation program is designed to reward our officers, including our NEOs, for creating long-term value for Swift Energy’s shareholders. This approach allows us to incentivize our executives for delivering value to shareholders while reducing or eliminating certain compensation if we do not achieve our performance goals. Although we are not a large oil and gas company, we compete for identical talent against all companies in the oil and gas industry, especially in Houston, Texas, and, therefore, a primary objective of our compensation program is to attract, retain and challenge executive talent.
86
Executive Compensation Elements
Our compensation program is comprised of elements common in our industry and each individual element serves an important purpose toward the total compensation package. The primary elements of our 2015 executive compensation remain similar to those in previous years and include base salary, annual incentive cash bonus and long-term equity incentives, a substantial portion of which are performance-based equity awards.
Component | Type of Payment/Benefit | Purpose | ||
Base Salary | Fixed cash payment to NEO, generally eligible for annual increase | Attract and retain talent; designed to be competitive with those of comparable companies | ||
Annual Incentive Cash Bonus | Annual cash payments based on performance | Pay for performance tied to success in achieving annual goals and objectives | ||
Long-term Equity Incentives | 3-year cliff Performance RSUs and time-vested restricted stock awards | Align NEO compensation with that of our long-term shareholders; Performance RSUs vest at levels corresponding to the achievement of the following metrics | ||
Independent Compensation Consultant and Use of Benchmarking and Marketplace Data
Aon Hewitt, a global professional services firm (“Aon Hewitt” or our “independent compensation consultant”), has served as the independent executive compensation consultant reporting directly to our Compensation Committee since 2012. Aon Hewitt has provided the Compensation Committee with benchmarking and marketplace data on executive compensation design and position-specific data on each element. All of the data provided to the Compensation Committee by Aon Hewitt is for companies in the same industry and relatively comparable to Swift Energy. The ultimate executive compensation program design and compensation decisions regarding our NEOs lie in the hands of our Compensation Committee; however, the consultation, peer and position-specific current and historic benchmarking data, and the assessment of our annual cash bonus and long-term incentive design provided by Aon Hewitt, are important elements in the Compensation Committee’s overall executive compensation decisions. The work of Aon Hewitt has raised no conflicts of interest under the Company’s Conflict of Interest Policy.
During 2015, the market data provided by Aon Hewitt was not used in any formulaic or statistical manner to determine our NEOs’ compensation program or actual pay decisions. Rather, this data was used as a critical point of reference for 2015 pay decisions and helped our Compensation Committee identify and evaluate pay trends in our industry and determine whether they are appropriate to implement at Swift Energy. Specifically, for 2015 executive compensation, Aon Hewitt provided consultation and current marketplace data that assisted the Compensation Committee in: (1) establishing the initial design of the 2015 executive compensation program and (2) setting 2015 incentive target levels, including minimum and maximum levels where applicable.
Advisory Vote to Approve Executive Compensation
In addition to taking Aon Hewitt’s advice and research into consideration in formulating our executive pay decisions for 2015, the Compensation Committee also took into account our advisory shareholder say on pay results. Our independent Compensation Committee believes that the approximately 91% votes cast for approval at the May 2015 annual meeting of shareholders demonstrates shareholder support of Swift Energy’s approach to executive compensation, which as further detailed in this CD&A is purposed to incentivize our NEOs for Company performance and is on par with peer compensation programs.
87
Industry Peer Group
The companies chosen in February 2015 by the Compensation Committee for purposes of setting 2015 compensation represent companies in the exploration and production sector of the energy industry and/or companies that compete in the Company’s core areas of operation for both business opportunities and talent. The Company’s 2015 peer group selected was as follows:
Carrizo Oil & Gas Comstock Resources Diamondback Energy Energy XXI (Bermuda) Halcon Resources Laredo Petroleum Magnum Hunter Resources | Matador Resources Parsley Energy, Inc. PDC Energy Penn Virginia Petroquest Energy Quicksilver Resources | Rex Energy Rosetta Resources RSP Permian Sanchez Energy Stone Energy W&T Offshore |
The peer group has changed from time to time due to business combinations, asset sales and other types of transactions that cause peer companies to no longer exist or to no longer be comparable. The Compensation Committee, in consultation with Aon Hewitt, has approved all revisions to our peer group.
2015 Executive Compensation Components
The primary elements of our executive compensation are base salary, annual incentive cash bonus and long-term equity incentives. Except for certain life insurance benefits, all other retirement, health and welfare benefits received by our NEOs are also generally available to all Swift Energy employees.
For each primary component, Aon Hewitt provided, and our Compensation Committee reviewed, historical and current marketplace data both when setting target compensation levels, including minimum and maximum opportunity levels where applicable, and when approving actual payment levels.
Base Salary
Base Salary provides our NEOs with a base level of income and considers an individual’s responsibility, performance assessment and career experience. We have historically set base salaries for our officers to align with the 75th percentile of the competitive market to attract and retain the best talent, and base salary adjustments are made from time to time as a result of our review of market data. During 2015, Aon Hewitt prepared an executive compensation study for our Compensation Committee that reported 2015 base salaries for our NEOs were at or near the third quartile of our proxy peer group for comparable positions; however, the study also showed that our NEOs’ 2015 base salaries were at or near the median when compared to a larger group of companies that participated in several industry surveys. We believe our NEOs’ base salaries are reasonable in comparison to that of our peers. As illustrated below, NEO salaries have not increased since February 2013.
The following schedule shows the lack of increases in base salaries for our NEOs along with the actual base salaries for our NEOs for 2013, 2014 and 2015:
Named Executive Officer | 2014 and 2015 Percentage of Salary Increase | 2013, 2014 and 2015 Salary | ||||
Terry E. Swift, CEO and President | 0% | $ | 685,450 | |||
Bruce H. Vincent, Retired President | 0% | $ | 536,560 | |||
Alton D. Heckaman, Jr., EVP & CFO | 0% | $ | 462,090 | |||
Robert J. Banks, EVP & COO | 0% | $ | 461,540 | |||
Steven L. Tomberlin, SVP - AM | 0% | $ | 342,000 | |||
No salary increases were approved for 2015, primarily due to the Company’s salary freeze associated with the significant decline in oil and gas prices. This salary freeze remains in effect. As already cited, Mr. Vincent retired from the Company effective February 15, 2015; therefore salary amounts shown for him are only applicable through such retirement date.
Annual Incentive Cash Bonus
For 2015, the annual target cash bonus is stated as a percentage of base salary. The target award levels were set, in part, based on discussions with our independent compensation consultant regarding industry trends and competitive
88
compensation data for similar executive positions of our peers. The following table displays for each NEO: (1) target bonus opportunity for 2015 as a percentage of base salary, (2) target bonus in cash for 2015 and (3) the fact that the Compensation Committee approved that eligible NEOs not receive bonuses for 2015:
Named Executive Officer | 2015 Target as Percentage of Base Salary | 2015 Annual Target Bonus | Approved 2015 Annual Cash Bonus | |||||||
Terry E. Swift, CEO and President | 100% | $ | 685,450 | $ | — | |||||
Bruce H. Vincent, Retired President(1) | 90% | $ | 482,904 | N/A | ||||||
Alton D. Heckaman, Jr., EVP & CFO | 90% | $ | 415,881 | $ | — | |||||
Robert J. Banks, EVP & COO | 90% | $ | 415,386 | $ | — | |||||
Steven L. Tomberlin, SVP-AM | 60% | $ | 205,200 | $ | — | |||||
(1) | Mr. Vincent retired during February 2015 and, therefore, was not eligible for the Annual Incentive Cash Bonus Program. | |
In the recent years prior to 2015, the Compensation Committee, in consultation with Aon Hewitt, set specific near term financial and operating metrics, such as shareholder return, production and reserves growth and costs reduction initiatives, that were tied formulaically to each NEO’s annual cash bonus. For 2015, the Compensation Committee, in consultation with Aon Hewitt, determined not to tie specific metrics to the annual cash bonus of NEOs and, as noted in the table above, no bonuses were paid to NEOs for 2015. The Compensation Committee did not set specific metrics for the 2015 annual cash bonus of NEOs due to the effect that the unprecedented decrease in commodity prices beginning in 2014 had on the Company’s ability to set annual metrics similar to those set in prior years. In the ordinary course, the Company began preparing financial and operating metrics for the 2015 annual incentive bonus during the third and fourth quarter of 2014, which is about the same time it began the annual budget process for the following year. As commodity prices continued to trend downward rapidly, efforts to prepare financial and operating metrics for 2015 quickly became irrelevant. As metrics were updated, prices dropped further and the metrics became impractical. As such, for 2015, the Compensation Committee decided that for the 2015 annual cash bonus program a formulaic process tied to metrics would not be used and that rather they would utilize a discretionary approach to determining the appropriate level of annual cash incentive with a primary focus on the NEO’s leadership of the Company during the distressed commodity price environment and the Company’s ability to improve its balance sheet and liquidity position.
Pursuant to the Bankruptcy Code and Bankruptcy Court orders, NEOs are not permitted to receive incentive compensation without further approval of the Bankruptcy Court.
Long-Term Equity Incentives
To set the target level amount of long-term equity incentives, our Compensation Committee utilized position-specific marketplace data provided by our independent compensation consultant, Aon Hewitt. The following summarizes the 2015 long-term incentive targets, as a percentage of each NEO’s base salary, as approved by our Compensation Committee in consultation with Aon Hewitt, which are the same target levels used in 2014:
Named Executive Officer | Approved 2015 Long-Term Incentive Target As a Percentage of Base Salary | |
Terry E. Swift, CEO and President | 300% | |
Bruce H. Vincent, Retired President (1) | N/A | |
Alton D. Heckaman, Jr., EVP & CFO | 180% | |
Robert J. Banks, EVP & COO | 180% | |
Steven L. Tomberlin, SVP - AM | 150% | |
(1) | Mr. Vincent retired during February 2015 and, therefore, was not eligible for the long-term incentive plan. | |
The basis for equally allocating the mix of long-term equity awards for NEOs (other than the CEO) between Performance RSUs and restricted stock awards was to divide the equity incentives among time-vested and performance-based awards to incentivize the officers to achieve short-term and long-term success and to provide a retention incentive for our
89
officers. The CEO’s allocation is weighted more heavily to Performance RSUs to reflect the higher level of responsibility he holds. Eligible NEOs received long-term equity awards that were 50% restricted stock awards and 50% Performance RSUs, except the CEO awards are 30% restricted stock awards and 70% Performance RSUs.
The Performance RSUs are intended to link executive pay to achievement of Swift Energy’s long-term mission and business goals. In past years, the Compensation Committee primarily focused on the metric 3-year TSR. For 2015, due to the increased volatility in energy stock during the significant commodity price decrease, the Compensation Committee set the 3-year performance goal to be based on absolute stock price. The following table reflects the vesting criteria for the Performance RSUs:
Performance Level | Performance Criteria (% Stock Price Increase) | Stock Price(1) | % of Target Shares Vesting | |||
Below Threshold | <100% | < $5.22 | 0% | |||
Threshold | 100% | $5.22 | 50% | |||
Target | 250% | $9.14 | 100% | |||
Challenge | 500% | $15.66 | 200% | |||
(1) | The stock price used to determine the number of Performance RSUs granted to an NEO was $2.61, which is the average closing price of the Company's stock for the first 15 trading days of 2015. | |
Based on industry marketplace data provided by our independent compensation consultant, 2015 time-based restricted stock awards were granted with 3-year cliff vesting, which requires service for the full three years prior to vest. Further details of these long-term equity incentive awards are disclosed in the Summary Compensation Table and Grants of Plan-Based Awards Table.
Pursuant to the Bankruptcy Code, equity awards granted will not vest to the NEOs during bankruptcy proceedings. The ultimate treatment of unvested equity awards has not been determined, but such determination could include forfeiture of all unvested Performance RSUs and restricted stock awards.
Other Compensation Related Policies
Prohibition on Hedging Swift Energy Securities
• | Our Insider Trading Policy, adopted in November 2006 by the Board of Directors, is applicable to all Board members, officers, and employees and prohibits short sales of Swift Energy securities or any hedging or monetization transaction, such as zero-cost collars or forward sale contracts. |
• | In addition, the Insider Trading Policy prohibits transactions in publicly traded options, such as puts, calls and other derivative securities, involving Swift Energy securities. |
Clawback Provision
The Performance RSUs awarded to our NEOs as part of the 2013, 2014 and 2015 executive compensation program contain a “clawback” provision related to any misconduct, malfeasance or gross negligence by the individual that contributes to any inaccuracy of the Company’s financial results or the results of the performance metrics tied to the awards. The Company does not have any other “clawback” policy with respect to the 2015 compensation elements which would allow the Company to recoup paid compensation from designated individuals in the event of a financial restatement.
Compensation Policies and Practices as They Relate to Risk Management
In accordance with the requirements of Regulation S-K, Item 402(s), to the extent that risks may arise from the Company’s compensation policies and practices that are reasonably likely to have a material adverse effect on the Company, we are required to discuss those policies and practices for compensating the employees of the Company (including employees that are not NEOs) as they relate to the Company’s risk management practices and the possibility of incentivizing risk-taking. We have determined that the compensation policies and practices established with respect to the Company’s employees are not reasonably likely to have a material adverse effect on the Company and, therefore, no such disclosure is necessary.
Compensation Committee Report
The Compensation Committee reviewed and discussed the above Compensation Discussion and Analysis with management. Based upon this review, the related discussions and other matters deemed relevant and appropriate by the
90
Compensation Committee, the Compensation Committee has recommended to the Board of Directors that the Compensation Discussion and Analysis be included in this Form 10-K.
COMPENSATION COMMITTEE Clyde W. Smith, Jr. (Chair) Douglas J. Lanier Greg Matiuk Ronald L. Saxton Charles J. Swindells |
91
Summary Compensation Table
The following table sets forth certain summary information regarding compensation paid or accrued by the Company to or on behalf of the Company’s Chief Executive Officer, Chief Financial Officer, and each of the three most highly compensated executive officers of the Company other than the CEO and CFO, who were serving as an executive officer at the end of the last fiscal year, for the fiscal years ended December 31, 2013, December 31, 2014, and December 31, 2015. These five individuals are referred to throughout this Form 10-K as “Named Executive Officers” or “NEOs.”
Name and Principal Position (a) | Year (b) | Salary ($) (c) | Bonus ($) (d) | Stock Awards ($)(1)(2) (e) | Option Awards ($)(1) (f) | Non-Equity Incentive Plan Compen- sation ($)(3) (g) | Change in Pension and Non- qualified Deferred Compen- sation Earnings ($) (h) | All Other Compen- sation ($)(4) (i) | Total ($) (j) | |||||||||||||||||||||||||
Terry E. Swift Chairman of the Board, Chief Executive Officer and President | 2015 | $ | 685,450 | $ | — | $ | 274,014 | $ | — | $ | — | $ | — | $ | 9,113 | $ | 968,577 | |||||||||||||||||
2014 | $ | 685,450 | $ | — | $ | 1,406,704 | $ | — | $ | — | $ | — | $ | 16,494 | $ | 2,108,648 | ||||||||||||||||||
2013 | $ | 685,450 | $ | — | $ | 1,861,273 | $ | — | $ | — | $ | — | $ | 30,979 | $ | 2,577,702 | ||||||||||||||||||
Alton D. Heckaman, Jr. Executive Vice President and Chief Financial Officer | 2015 | $ | 462,090 | $ | — | $ | 125,247 | $ | — | $ | — | $ | — | $ | 7,950 | $ | 595,287 | |||||||||||||||||
2014 | $ | 462,090 | $ | — | $ | 597,476 | $ | — | $ | — | $ | — | $ | 15,600 | $ | 1,075,166 | ||||||||||||||||||
2013 | $ | 462,090 | $ | — | $ | 758,828 | $ | — | $ | — | $ | — | $ | 24,803 | $ | 1,245,721 | ||||||||||||||||||
Bruce H. Vincent Retired President | 2015 | $ | 89,427 | $ | — | $ | — | $ | — | $ | — | $ | — | $ | 1,120,909 | $ | 1,210,336 | |||||||||||||||||
2014 | $ | 536,560 | $ | — | $ | 923,808 | $ | — | $ | — | $ | — | $ | 15,916 | $ | 1,476,284 | ||||||||||||||||||
2013 | $ | 536,560 | $ | — | $ | 1,173,288 | $ | — | $ | — | $ | — | $ | 31,657 | $ | 1,741,505 | ||||||||||||||||||
Robert J. Banks Executive Vice President and Chief Operating Officer | 2015 | $ | 461,540 | $ | — | $ | 125,247 | $ | — | $ | — | $ | — | $ | 22,345 | $ | 609,132 | |||||||||||||||||
2014 | $ | 461,540 | $ | — | $ | 597,476 | $ | — | $ | 40,000 | $ | — | $ | 31,361 | $ | 1,130,377 | ||||||||||||||||||
2013 | $ | 461,540 | $ | — | $ | 758,828 | $ | — | $ | — | $ | — | $ | 33,498 | $ | 1,253,866 | ||||||||||||||||||
Steve L. Tomberlin Senior Vice President— Asset Management | 2015 | $ | 342,000 | $ | — | $ | 77,462 | $ | — | $ | — | $ | — | $ | 10,906 | $ | 430,368 | |||||||||||||||||
2014 | $ | 342,000 | $ | — | $ | 369,523 | $ | — | $ | 40,000 | $ | — | $ | 18,438 | $ | 769,961 | ||||||||||||||||||
2013 | $ | 342,000 | $ | — | $ | 469,315 | $ | — | $ | — | $ | — | $ | 19,410 | $ | 830,725 | ||||||||||||||||||
(1) | The amounts in columns (e) and (f) reflect the aggregate grant date fair value computed in accordance with FASB ASC Topic 718 for awards granted during that year. Assumptions used in the calculation of these amounts are included in Note 6 to Consolidated Financial Statements in the Company’s audited financial statements for the fiscal years ended December 31, 2013, December 31, 2014, and December 31, 2015, included in the Company’s Annual Report on Forms 10-K for the years ended December 31, 2013, December 31, 2014, and December 31, 2015, respectively. | |
(2) | Column (e) is comprised of both time-based restricted stock and Performance RSUs. The values of the respective components for each of 2013, 2014 and 2015 are as follows: | |
2013 | 2014 | 2015 | |||||||||||||||||||||||
Time-Based Restricted Stock Awards ($) | Performance RSUs ($)^ | Time-Based Restricted Stock Awards ($) | Performance RSUs ($)^ | Time-Based Restricted Stock Awards ($) | Performance RSUs ($)^ | ||||||||||||||||||||
Terry E. Swift | $ | 570,843 | $ | 1,290,430 | $ | 454,608 | $ | 952,096 | $ | 112,545 | $ | 161,469 | |||||||||||||
Alton D. Heckaman, Jr. | $ | 385,203 | $ | 373,625 | $ | 306,768 | $ | 290,708 | $ | 75,945 | $ | 49,302 | |||||||||||||
Bruce H. Vincent | $ | 595,595 | $ | 577,693 | $ | 474,320 | $ | 449,488 | $ | — | $ | — | |||||||||||||
Robert J. Banks | $ | 385,203 | $ | 373,625 | $ | 306,768 | $ | 290,708 | $ | 75,945 | $ | 49,302 | |||||||||||||
Steven L. Tomberlin | $ | 238,238 | $ | 231,077 | $ | 189,728 | $ | 179,795 | $ | 46,970 | $ | 30,492 | |||||||||||||
^ | The disclosed amounts with respect to the Performance RSUs are calculated based on the expected probable (target) outcome grant date fair value computed in accordance with FASB ASC Topic 718. The threshold and maximum amounts, respectively, for each NEO’s awards are: Mr. Swift - 2013 - $645,215, $2,580,860 - 2014 - $476,048, $1,904,192 - 2015 - $80,735, $322,938; Mr. Heckaman - 2013 - $186,813, $747,250 - 2014 - $145,354, $581,416 - 2015 - $24,651, $98,604; Mr. Vincent - 2013 - $288,847, $1,555,386 - 2014 - $224,744, $898,976 - 2015 - $0, $0; Mr. Banks - 2013 - $186,813, $747,250 - 2014 - $145,354, $581,416 - 2015 - $24,651, $98,604; and Mr. Tomberlin - 2013 - $115,539, $462,154 - 2014 - $89,898, $359,590 - 2015 - $15,246, $60,984. | ||||||||||||||||||||||||
(3) | Amounts in column (g) for 2013, 2014 and 2015 include amounts earned during 2013, 2014 and 2015, but paid in 2014, 2015 and 2016, respectively. |
(4) | Includes all other compensation items (column (i)) for each of 2013, 2014, and 2015 in addition to that reported in columns (c) through (h): |
92
Swift | Heckaman | Vincent | Banks | Tomberlin | ||||||||||||||||||
Vacation Buyback | 2015 | $ | — | $ | — | $ | 27,085 | $ | — | $ | — | |||||||||||
2014 | $ | — | $ | — | $ | — | $ | — | $ | — | ||||||||||||
2013 | $ | — | $ | — | $ | — | $ | — | $ | — | ||||||||||||
Savings Plan Contributions* | 2015 | $ | 7,950 | $ | 7,950 | $ | 3,495 | $ | 7,950 | $ | 7,950 | |||||||||||
2014 | $ | 15,600 | $ | 15,600 | $ | 15,600 | $ | 15,600 | $ | 15,600 | ||||||||||||
2013 | $ | 15,300 | $ | 15,300 | $ | 15,300 | $ | 15,300 | $ | 15,300 | ||||||||||||
Life Insurance Premiums** | 2015 | $ | — | $ | — | $ | 14,603 | $ | 14,395 | $ | 2,956 | |||||||||||
2014 | $ | — | $ | — | $ | — | $ | 14,395 | $ | 2,838 | ||||||||||||
2013 | $ | 12,243 | $ | 7,570 | $ | 14,603 | $ | 14,395 | $ | 2,838 | ||||||||||||
Tax Reimbursements*** | 2015 | $ | 1,163 | $ | — | $ | — | $ | — | $ | — | |||||||||||
2014 | $ | 894 | $ | — | $ | 316 | $ | 1,366 | $ | — | ||||||||||||
2013 | $ | 2,164 | $ | 661 | $ | 482 | $ | 2,531 | $ | — | ||||||||||||
Contributions to Employee Stock Ownership Plan Account**** | 2015 | $ | — | $ | — | $ | — | $ | — | $ | — | |||||||||||
2014 | $ | — | $ | — | $ | — | $ | — | $ | — | ||||||||||||
2013 | $ | 1,272 | $ | 1,272 | $ | 1,272 | $ | 1,272 | $ | 1,272 | ||||||||||||
Perquisites***** | 2015 | $ | — | $ | — | $ | 38,747 | $ | — | $ | — | |||||||||||
2014 | $ | — | $ | — | $ | — | $ | — | $ | — | ||||||||||||
2013 | $ | — | $ | — | $ | — | $ | — | $ | — | ||||||||||||
Severance Payments | 2015 | $ | — | $ | — | $ | 1,036,744 | $ | — | $ | — | |||||||||||
2014 | $ | — | $ | — | $ | — | $ | — | $ | — | ||||||||||||
2013 | $ | — | $ | — | $ | — | $ | — | $ | — | ||||||||||||
* | Company contributions to the Named Executive Officer’s Swift Energy Company Employee Savings Plan account (For 2013, 100% in Company common stock; for 2014, 50% in Company common stock; for 2015, 0% in Company common stock). | |
** | Insurance premiums paid by the Company with respect to life insurance for the benefit of the Named Executive Officer. | |
*** | Amounts paid by the Company to reimburse the Named Executive Officer for the amount taxed on certain taxable benefits. | |
**** | Company contributions (100% in Company common stock) to the Named Executive Officer’s Swift Energy Company Employee Stock Ownership Plan account. | |
***** | Perquisites are quantified only where the aggregate perquisites for the Named Executive Officer exceeded $10,000 during 2015. No NEO had perquisites greater than $10,000 during either 2013 or 2014. Perquisites for Mr. Vincent in 2015 include the following amounts: reserved parking - $47, estate planning - $37,500, and club dues - $1,200. | |
Grants of Plan-Based Awards
The following table sets forth certain information with respect to the equity awards granted during the year ended December 31, 2015, to each Named Executive Officer listed in the Summary Compensation Table:
Name (a) | Grant Date (b) | Estimated Future Payouts Under Non-Equity Incentive Plan Awards | Estimated Future Payouts Under Equity Incentive Plan Awards(1) | All Other Stock Awards: Number of Shares of Stock or Units (#)(1) (i) | All Other Option Awards: Number of Securities Under- lying Options (#) (j) | Exercise or Base Price of Option Awards ($/Sh) (k) | Grant Date Fair Value of Stock and Option Awards (l) | |||||||||||||||||||||||||||||||||
Threshold ($) (c) | Target ($) (d) | Maximum ($) (e) | Threshold ($) (c) | Target ($) (d) | Maximum ($) (e) | |||||||||||||||||||||||||||||||||||
Terry E. Swift | 02/17/2015 | $ | — | $ | — | $ | — | $ | 40,775 | $ | 81,550 | $ | 163,100 | — | — | $ | — | $ | 1.98 | |||||||||||||||||||||
02/17/2015 | $ | — | $ | — | $ | — | $ | — | $ | — | $ | — | 36,900 | (2) | — | $ | — | $ | 3.05 | |||||||||||||||||||||
Alton D. Heckaman, Jr. | 02/17/2015 | $ | — | $ | — | $ | — | $ | 12,450 | $ | 24,900 | $ | 49,800 | — | — | $ | — | $ | 1.98 | |||||||||||||||||||||
02/17/2015 | $ | — | $ | — | $ | — | $ | — | $ | — | $ | — | 24,900 | (2) | — | $ | — | $ | 3.05 | |||||||||||||||||||||
Bruce H. Vincent(3) | $ | — | $ | — | $ | — | $ | — | $ | — | $ | — | — | — | $ | — | $ | — | ||||||||||||||||||||||
Robert J. Banks | 02/17/2015 | $ | — | $ | — | $ | — | $ | 12,450 | $ | 24,900 | $ | 49,800 | — | — | $ | — | $ | 1.98 | |||||||||||||||||||||
02/17/2015 | $ | — | $ | — | $ | — | $ | — | $ | — | $ | — | 24,900 | (2) | — | $ | — | $ | 3.05 | |||||||||||||||||||||
Steven L. Tomberlin | 02/17/2015 | $ | — | $ | — | $ | — | $ | 7,700 | $ | 15,400 | $ | 30,800 | — | — | $ | — | $ | 1.98 | |||||||||||||||||||||
02/17/2015 | $ | — | $ | — | $ | — | $ | — | $ | — | $ | — | 15,400 | (2) | — | $ | — | $ | 3.05 | |||||||||||||||||||||
(1) | Awards are granted under the 2005 Plan and, therefore, maximum future payouts may be limited by the terms of such plan. | |
(2) | Amount shown reflects number of restricted shares granted to the Named Executive Officer during 2015 pursuant to the 2005 Plan. Restrictions on restricted shares lapse as to all of such shares on the third anniversary of the grant date. | |
(3) | Mr. Vincent retired from the Company, effective February 15, 2015. Accordingly, no equity awards were granted to Mr. Vincent during 2015. | |
93
Outstanding Equity Awards at December 31, 2015
The following table includes certain information about stock options and restricted stock outstanding at December 31, 2015, for each Named Executive Officer listed in the Summary Compensation Table:
Option Awards | Stock Awards | |||||||||||||||||||||||||||||
Name and Grant Date (a) | Number of Securities Underlying Unexercised Options (#) Exercisable (b) | Number of Securities Underlying Unexercised Options (#) Unexercisable (c) | Equity Incentive Plan Awards: Number of Securities Underlying Unexercised Unearned Options (#) (d) | Option Exercise Price ($) (e) | Option Expiration Date (f) | Number of Shares or Units of Stock That Have Not Vested (#)(1) (g) | Market Value of Shares or Units of Stock That Have Not Vested ($)(2) (h) | Equity Incentive Plan Awards: Number of Unearned Shares, Units or Other Rights That Have Not Vested (#) (i) | Equity Incentive Plan Awards: Market or Payout Value of Unearned Shares, Units or Other Rights That Have Not Vested ($)(3) (j) | |||||||||||||||||||||
Terry E. Swift Stock Options | ||||||||||||||||||||||||||||||
02/07/2006 | 25,400 | — | — | $ | 44.24 | 02/08/2016 | — | — | — | — | ||||||||||||||||||||
02/06/2007 | 34,100 | — | — | $ | 43.48 | 02/06/2017 | — | — | — | — | ||||||||||||||||||||
02/11/2008 | 37,800 | — | — | $ | 43.21 | 02/11/2018 | — | — | — | — | ||||||||||||||||||||
02/10/2009 | 27,902 | — | — | $ | 14.66 | 02/10/2019 | — | — | — | — | ||||||||||||||||||||
02/08/2010 | 43,334 | — | — | $ | 24.52 | 02/08/2020 | — | — | — | — | ||||||||||||||||||||
02/09/2011 | 66,000 | — | — | $ | 42.61 | 02/09/2021 | — | — | — | — | ||||||||||||||||||||
03/21/2011 | 19,555 | — | — | $ | 41.83 | 02/10/2019 | — | — | — | — | ||||||||||||||||||||
03/21/2011 | 12,700 | — | — | $ | 41.83 | 02/08/2020 | — | — | — | — | ||||||||||||||||||||
02/13/2012 | 75,000 | — | — | $ | 32.63 | 02/13/2022 | — | — | — | — | ||||||||||||||||||||
Restricted Stock | ||||||||||||||||||||||||||||||
02/12/2013 | — | — | — | — | — | 36,900 | (5) | $ | 3,321 | 43,000 | (4) | $ | 3,870 | |||||||||||||||||
02/17/2014 | — | — | — | — | — | 36,900 | (5) | $ | 3,321 | 40,775 | (4) | $ | 3,670 | |||||||||||||||||
02/17/2015 | — | — | — | — | — | 36,900 | (5) | $ | 3,321 | 40,775 | $ | 3,670 | ||||||||||||||||||
Alton D. Heckaman, Jr. Stock Options | ||||||||||||||||||||||||||||||
02/07/2006 | 11,100 | — | — | $ | 44.24 | 02/08/2016 | — | — | — | — | ||||||||||||||||||||
02/06/2007 | 14,300 | — | — | $ | 43.48 | 02/06/2017 | — | — | — | — | ||||||||||||||||||||
02/11/2008 | 17,100 | — | — | $ | 43.21 | 02/11/2018 | — | — | — | — | ||||||||||||||||||||
02/10/2009 | 19,867 | — | — | $ | 14.66 | 02/10/2019 | — | — | — | — | ||||||||||||||||||||
02/08/2010 | 28,300 | — | — | $ | 24.52 | 02/08/2020 | — | — | — | — | ||||||||||||||||||||
12/03/2010 | 3,626 | — | — | $ | 40.15 | 02/01/2019 | — | — | — | — | ||||||||||||||||||||
02/09/2011 | 25,500 | — | — | $ | 42.61 | 02/09/2021 | — | — | — | — | ||||||||||||||||||||
02/13/2012 | 34,400 | — | — | $ | 32.63 | 02/13/2022 | — | — | — | — | ||||||||||||||||||||
Restricted Stock | ||||||||||||||||||||||||||||||
02/12/2013 | — | — | — | — | — | 24,900 | (5) | $ | 2,241 | 12,450 | (4) | $ | 1,121 | |||||||||||||||||
02/17/2014 | — | — | — | — | — | 24,900 | (5) | $ | 2,241 | 12,450 | (4) | $ | 1,121 | |||||||||||||||||
02/17/2015 | — | — | — | — | — | 24,900 | (5) | $ | 2,241 | 12,450 | $ | 1,121 | ||||||||||||||||||
Bruce H. Vincent(5) Stock Options | ||||||||||||||||||||||||||||||
02/07/2006 | 16,700 | — | — | $ | 44.24 | 02/08/2016 | — | — | — | — | ||||||||||||||||||||
02/06/2007 | 21,100 | — | — | $ | 43.48 | 02/06/2017 | — | — | — | — | ||||||||||||||||||||
02/11/2008 | 25,600 | — | — | $ | 43.21 | 02/11/2018 | — | — | — | — | ||||||||||||||||||||
02/10/2009 | 52,400 | — | — | $ | 14.66 | 02/10/2019 | — | — | — | — | ||||||||||||||||||||
02/08/2010 | 41,000 | — | — | $ | 24.52 | 02/08/2020 | — | — | — | — | ||||||||||||||||||||
02/09/2011 | 47,500 | — | — | $ | 42.61 | 02/09/2021 | — | — | — | — | ||||||||||||||||||||
02/13/2012 | 63,000 | — | — | $ | 32.63 | 02/13/2022 | — | — | — | — | ||||||||||||||||||||
Restricted Stock | ||||||||||||||||||||||||||||||
02/12/2013 | — | — | — | — | — | — | — | 19,250 | (4) | $ | 1,733 | |||||||||||||||||||
02/17/2014 | — | — | — | — | — | — | — | 19,250 | (4) | $ | 1,733 | |||||||||||||||||||
Robert J. Banks Stock Options | ||||||||||||||||||||||||||||||
02/07/2006 | 4,500 | — | — | $ | 44.24 | 02/08/2016 | — | — | — | — | ||||||||||||||||||||
02/06/2007 | 11,500 | — | — | $ | 43.48 | 02/06/2017 | — | — | — | — | ||||||||||||||||||||
02/11/2008 | 13,700 | — | — | $ | 43.21 | 02/11/2018 | — | — | — | — | ||||||||||||||||||||
02/10/2009 | 25,000 | — | — | $ | 14.66 | 02/10/2019 | — | — | — | — | ||||||||||||||||||||
02/08/2010 | 28,300 | — | — | $ | 24.52 | 02/08/2020 | — | — | — | — | ||||||||||||||||||||
02/09/2011 | 29,000 | — | — | $ | 42.61 | 02/09/2021 | — | — | — | — | ||||||||||||||||||||
02/13/2012 | 38,400 | — | — | $ | 32.63 | 02/13/2022 | — | — | — | — | ||||||||||||||||||||
94
Option Awards | Stock Awards | |||||||||||||||||||||||||||||
Name and Grant Date (a) | Number of Securities Underlying Unexercised Options (#) Exercisable (b) | Number of Securities Underlying Unexercised Options (#) Unexercisable (c) | Equity Incentive Plan Awards: Number of Securities Underlying Unexercised Unearned Options (#) (d) | Option Exercise Price ($) (e) | Option Expiration Date (f) | Number of Shares or Units of Stock That Have Not Vested (#)(1) (g) | Market Value of Shares or Units of Stock That Have Not Vested ($)(2) (h) | Equity Incentive Plan Awards: Number of Unearned Shares, Units or Other Rights That Have Not Vested (#) (i) | Equity Incentive Plan Awards: Market or Payout Value of Unearned Shares, Units or Other Rights That Have Not Vested ($)(3) (j) | |||||||||||||||||||||
Restricted Stock | ||||||||||||||||||||||||||||||
02/12/2013 | — | — | — | — | — | 24,900 | (5) | $ | 2,241 | 12,450 | (4) | $ | 1,121 | |||||||||||||||||
02/17/2014 | — | — | — | — | — | 24,900 | (5) | $ | 2,241 | 12,450 | (4) | $ | 1,121 | |||||||||||||||||
02/17/2015 | — | — | — | — | — | 24,900 | (5) | $ | 2,241 | 12,450 | $ | 1,121 | ||||||||||||||||||
Steven L. Tomberlin Stock Options | ||||||||||||||||||||||||||||||
02/08/2010 | 14,200 | — | — | $ | 24.52 | 02/08/2020 | — | — | — | — | ||||||||||||||||||||
02/09/2011 | 11,300 | — | — | $ | 42.61 | 02/09/2021 | — | — | — | — | ||||||||||||||||||||
02/13/2012 | 17,300 | — | — | $ | 32.63 | 02/13/2022 | — | — | — | — | ||||||||||||||||||||
Restricted Stock | ||||||||||||||||||||||||||||||
02/12/2013 | — | — | — | — | — | 15,400 | (5) | $ | 1,386 | 7,700 | (4) | $ | 693 | |||||||||||||||||
02/17/2014 | — | — | — | — | — | 15,400 | (5) | $ | 1,386 | 7,700 | (4) | $ | 693 | |||||||||||||||||
02/17/2015 | — | — | — | — | — | 15,400 | (5) | $ | 1,386 | 7,700 | $ | 693 | ||||||||||||||||||
(1) | Restrictions on these restricted shares lapse as to all of such shares on the third anniversary of the grant date. | |
(2) | Amount reflects the aggregate market value of unvested restricted shares at December 31, 2015, which equals the number of unvested restricted shares in column (g) multiplied by the closing price of the Company’s common stock at December 31, 2015 ($.09). | |
(3) | Amount reflects the aggregate market value of unvested equity incentive plan awards at December 31, 2015, which equals the number of unvested equity incentive plan awards in column (g) multiplied by the closing price of the Company’s common stock at December 31, 2015 ($.09). | |
(4) | The Performance RSUs are weighted 75% toward achievement of a certain 3-year TSR and 25% toward achievement of a certain 3-year ROCE. The disclosed amounts are based on achieving threshold performance goals. | |
(5) | Under applicable SEC rules, the table above reflects outstanding awards as of December 31, 2015. The Potential Payments Upon Termination or Change of Control table has further information on the specific treatment of Mr. Vincent’s equity awards which took place upon his retirement. | |
Option Exercises and Stock Vested
The following table includes information regarding stock options exercised and restricted stock vested for the Named Executive Officers listed in the Summary Compensation Table during the fiscal year ended December 31, 2015:
Option Awards | Stock Awards | |||||||||||||
Name (a) | Number of Shares Acquired on Exercise (#) (b) | Value Realized on Exercise ($) (c) | Number of Shares Acquired on Vesting (#) (d) | Value Realized on Vesting ($)(1) (e) | ||||||||||
Terry E. Swift | — | $ | — | 17,367 | $ | 50,538 | ||||||||
Alton D. Heckaman, Jr. | — | $ | — | 7,967 | $ | 23,184 | ||||||||
Bruce H. Vincent | — | $ | — | 91,567 | $ | 266,460 | ||||||||
Robert J. Banks | — | $ | — | 8,900 | $ | 25,899 | ||||||||
Steven L. Tomberlin | — | $ | — | 4,000 | $ | 11,640 | ||||||||
(1) | Amount reflects value realized by multiplying the number of shares of restricted stock vesting by the market value on the vesting date. | |
Potential Payments Upon Termination or Change in Control
The table below and the discussion that follows reflect the amount of compensation payable to each Named Executive Officer upon termination from the Company under several scenarios assuming such termination was effective December 31, 2015. The actual amounts to be paid out can only be determined at the time of such executive’s separation from the Company, which was the case with Mr. Vincent (see footnote 4 of the table below).
Each currently employed Named Executive Officer other than Mr. Tomberlin has an employment agreement. These employment agreements automatically extend for one year on each anniversary of the agreement. However, each officer with
95
an employment agreement serves at the pleasure of the Board as the agreements allow for termination at any time with sixty days’ written notice. The Swift Energy Company Change of Control Severance Plan (the “Change of Control Severance Plan”) adopted in November 2008, was terminated effective December 18, 2015.
Equity Acceleration | ||||||||||||||||||||||||
Cash Payments | Benefit Cost(1) | Stock Options(2) | Restricted Stock(2) | Restricted Stock Units | Total | |||||||||||||||||||
Terry E. Swift | ||||||||||||||||||||||||
Death | $ | 2,056,350 | $ | 18,225 | $ | — | $ | 9,963 | $ | 22,419 | $ | 2,106,957 | ||||||||||||
Disability | $ | 2,056,350 | $ | 61,883 | $ | — | $ | 9,963 | $ | 22,419 | $ | 2,150,615 | ||||||||||||
Change of Control | $ | — | $ | 16,320 | $ | — | $ | 9,963 | $ | 22,419 | $ | 48,702 | ||||||||||||
Senior Officer Tenure(3) | $ | 1,370,900 | $ | 43,658 | $ | — | $ | 9,963 | $ | — | (5) | $ | 1,424,521 | |||||||||||
Termination by Employee Without Good Reason | $ | 685,450 | $ | 25,433 | $ | — | $ | — | $ | — | $ | 710,883 | ||||||||||||
Termination by Employee for Good Reason or by the Company Without Cause | $ | 2,056,350 | $ | 61,883 | $ | — | $ | 9,963 | $ | — | (5) | $ | 2,128,196 | |||||||||||
Alton D. Heckaman, Jr. | ||||||||||||||||||||||||
Death | $ | 1,386,270 | $ | 18,225 | $ | — | $ | 6,723 | $ | 6,723 | $ | 1,417,941 | ||||||||||||
Disability | $ | 1,386,270 | $ | 55,655 | $ | — | $ | 6,723 | $ | 6,723 | $ | 1,455,371 | ||||||||||||
Change of Control | $ | — | $ | 10,092 | $ | — | $ | 6,723 | $ | 6,723 | $ | 23,538 | ||||||||||||
Senior Officer Tenure(3) | $ | 924,180 | $ | 37,430 | $ | — | $ | 6,723 | $ | — | (5) | $ | 968,333 | |||||||||||
Termination by Employee Without Good Reason | $ | 462,090 | $ | 19,205 | $ | — | $ | — | $ | — | $ | 481,295 | ||||||||||||
Termination by Employee for Good Reason or by the Company Without Cause | $ | 1,386,270 | $ | 55,655 | $ | — | $ | 6,723 | $ | — | (5) | $ | 1,448,648 | |||||||||||
Bruce H. Vincent—Senior Officer Tenure(4) | ||||||||||||||||||||||||
Robert J. Banks | ||||||||||||||||||||||||
Death | $ | 1,253,850 | $ | 23,819 | $ | — | $ | 6,723 | $ | 6,723 | $ | 1,291,115 | ||||||||||||
Disability | $ | 1,253,850 | $ | 62,038 | $ | — | $ | 6,723 | $ | 6,723 | $ | 1,329,334 | ||||||||||||
Change of Control | $ | — | $ | 14,400 | $ | — | $ | 6,723 | $ | 6,723 | $ | 27,846 | ||||||||||||
Senior Officer Tenure(3) | $ | 752,310 | $ | 38,219 | $ | — | $ | 6,723 | $ | — | (5) | $ | 797,252 | |||||||||||
Termination by Employee Without Good Reason | $ | — | $ | — | $ | — | $ | — | $ | — | $ | — | ||||||||||||
Termination by Employee for Good Reason or by the Company Without Cause | $ | 1,253,850 | $ | 62,038 | $ | — | $ | 6,723 | $ | — | (5) | $ | 1,322,611 | |||||||||||
Steven L. Tomberlin | ||||||||||||||||||||||||
Death | $ | — | $ | — | $ | — | (6) | $ | — | (6) | $ | 4,158 | $ | 4,158 | ||||||||||
Disability | $ | — | $ | — | $ | — | (6)` | $ | — | (6) | $ | 4,158 | $ | 4,158 | ||||||||||
Change of Control | $ | — | $ | — | $ | — | $ | — | $ | 4,158 | $ | 4,158 | ||||||||||||
Senior Officer Tenure(7) | $ | — | $ | — | $ | — | $ | — | $ | — | $ | — | ||||||||||||
Termination by Employee Without Good Reason(7) | $ | — | $ | — | $ | — | $ | — | $ | — | $ | — | ||||||||||||
Termination by Employee for Good Reason or by the Company Without Cause | $ | — | (7) | $ | — | (7) | $ | — | (7) | $ | — | (7) | $ | — | (5) | $ | — | |||||||
(1) | Includes payment of insurance continuation as provided in employment agreement. | |
(2) | Includes value of option spread and full-value awards upon accelerated vesting of equity grants at $.09 per share (closing price on December 31, 2015). | |
(3) | Termination by employee upon achieving “Senior Officer Tenure,” which requires that the 1-year anniversary of the Named Executive Officer’s employment agreement has occurred, the Named Executive Officer has reached the age of 55 years or older, and the Named Executive Officer has been employed by the Company for a minimum of ten years. The Named Executive Officer must meet the conditions for Senior Officer Tenure and provide at least six months’ written notice to the Company of his intention to terminate his employment. | |
(4) | Mr. Vincent retired from the Company effective February 15, 2015, and entered into a retirement agreement (which principally reflects the terms of Mr. Vincent’s employment agreement dated November 4, 2008, a form of which has been in place since November 1995). Pursuant to this retirement agreement, Mr. Vincent is receiving the following summarized benefits and consideration: (i) receive $3,363,969.64 over a period ending November 15, 2017; (ii) retain, under their original terms, all equity awards granted during his tenure at the Company; and (iii) continue to be eligible to participate in the Company’s health insurance plans through April 2018 and the Company’s life insurance program through April 2017. The retirement agreement executed with Mr. Vincent also contains the customary confidentiality, non-competition, and non-solicitation covenants, along with mutual releases and non-disparagement covenants. For more information on Mr. Vincent’s retirement benefits, please refer to our previous disclosure in our Form 8-K filed with the SEC on January 14, 2015, and/or find a full copy of Mr. Vincent’s retirement agreement as Exhibit 10.21 to the Company’s Form 10-K for the year ended December 31, 2014. | |
(5) | Pursuant to the terms of the award agreement, the Performance RSUs would be paid on a pro rata basis based on length of service. Performance will be measured at the end of the original 3-year performance period. As such, it is impossible to determine the payout at December 31, 2015, but the value of such awards, based on achieving target performance at $.09 per share (the closing price on December 31, 2015), if the performance period ended on December 31, 2015, would be: Mr. Swift - $22,419; Mr. Heckaman - $6,723; Mr. Banks - $6,723; and Mr. Tomberlin - $4,158. | |
(6) | The provisions of the 2005 Plan apply to Mr. Tomberlin who does not have an employment agreement. | |
(7) | These provisions do not apply to Mr. Tomberlin who does not have an employment agreement. | |
Computation of Payments
Under the employment agreements (except for Mr. Tomberlin who does not have an employment agreement) executed November 4, 2008, the Performance RSU agreements and the Company’s compensation plans, in the event of termination of employment of a Named Executive Officer, that Named Executive Officer would receive the payments, accelerations and benefits described below. All of our employment agreements and compensation arrangements have been prepared to comply with Section 409A of the Internal Revenue Code, principally by deferring amounts payable upon termination, as applicable, for
96
at least six months. The formulations of payments below are as of December 31, 2015. The details of Mr. Vincent’s retirement agreement, effective February 15, 2015, are included in footnote 4 above. In each scenario, “Annual Compensation” is the Named Executive Officer’s annual base salary, plus the highest of his annual cash bonuses paid in the prior 36 months:
• | Death |
Messrs. T. Swift and Heckaman
• | Cash Payment of 3 x Annual Compensation |
• | Acceleration of vesting of restricted stock |
• | Acceleration of vesting and exercisability of all stock options |
• | Acceleration of vesting of Performance RSUs at the target level |
• | Health Insurance for dependents for 12 months |
Mr. Banks
• | Cash Payment of 2.5 x Annual Compensation |
• | Acceleration of vesting of restricted stock |
• | Acceleration of vesting and exercisability of all stock options |
• | Acceleration of vesting of Performance RSUs at the target level |
• | Health Insurance for dependents for 12 months |
Mr. Tomberlin
• | Acceleration of vesting of Performance RSUs at the target level |
• | Disability |
Messrs. T. Swift and Heckaman
• | Cash Payment of 3 x Annual Compensation |
• | Acceleration of vesting of restricted stock |
• | Acceleration of vesting and exercisability of all stock options |
• | Acceleration of vesting of Performance RSUs at the target level |
• | Health Insurance for 30 months |
• | Life Insurance for 12 months |
Mr. Banks
• | Cash Payment of 2.5 x Annual Compensation |
• | Acceleration of vesting of restricted stock |
• | Acceleration of vesting and exercisability of all stock options |
• | Acceleration of vesting of Performance RSUs at the target level |
• | Health Insurance for 24 months |
• | Life Insurance for 12 months |
Mr. Tomberlin
• | Acceleration of vesting of Performance RSUs at the target level |
• | By Employee for Good Reason or by Company Without Cause |
Messrs. T. Swift and Heckaman
• | Cash Payment of 3 x Annual Compensation |
• | Acceleration of vesting of restricted stock |
• | Acceleration of vesting and exercisability of all stock options |
• | Performance RSUs prorated as to length of service provided during the performance period and payment levels not determinable and/or payable until performance period ends |
• | Health Insurance for 30 months |
• | Life Insurance for 12 months |
Mr. Banks
• | Cash Payment of 2.5 x Annual Compensation |
• | Acceleration of vesting of restricted stock |
• | Acceleration of vesting and exercisability of all stock options |
97
• | Performance RSUs prorated as to length of service provided during the performance period and payment levels not determinable and/or payable until performance period ends |
• | Health Insurance for 24 months |
• | Life Insurance for 12 months |
Mr. Tomberlin
• | Performance RSUs prorated as to length of service provided during the performance period and payment levels not determinable and/or payable until performance period ends |
• | Change of Control |
Messrs. T. Swift, Heckaman and Banks
• | Acceleration of vesting of restricted stock |
• | Acceleration of vesting and exercisability of all stock options |
• | Acceleration of vesting of Performance RSUs at the target level |
• | Life Insurance for 12 months |
Mr. Tomberlin
• | Acceleration of vesting of Performance RSUs at the target level |
• | Termination by Employee Upon 60 Days’ Notice Without Good Reason |
Messrs. T. Swift and Heckaman
• | Cash Payment of 1 x Annual Compensation |
• | Acceleration of vesting of stock options (exercisability dates remain the same) |
• | Health Insurance for 6 months |
• | Life Insurance for 12 months |
• | Termination by Employee Upon Achieving Senior Officer Tenure, which requires reaching the age of 55, being employed by the Company for at least ten years and providing six months’ advance notice |
Messrs. T. Swift and Heckaman
• | Cash Payment of 2 x Annual Compensation |
• | Acceleration of vesting of stock options (exercisability dates remain the same) |
• | Acceleration of vesting of restricted stock, subject to meeting certain service requirements |
• | Performance RSUs prorated as to length of service provided during the performance period and payment levels not determinable and/or payable until performance period ends |
• | Health Insurance for 18 months |
• | Life Insurance for 12 months |
Mr. Banks
• | Cash Payment of 1.5 x Annual Compensation |
• | Acceleration of vesting of stock options (exercisability dates remain the same) |
• | Acceleration of vesting of restricted stock, subject to meeting certain service requirements |
• | Performance RSUs prorated as to length of service provided during the performance period and payment levels not determinable and/or payable until performance period ends |
• | Health Insurance for 12 months |
• | Life Insurance for 12 months |
Conditions and Covenants
Each Named Executive Officer must also observe a noncompete provision in his employment agreement (except for Mr. Tomberlin who does not have an employment agreement). Based on the terms of the employment agreements, the covenant not to compete provision would be effective for a maximum of three years following the termination of a Named Executive Officer.
A Named Executive Officer will not receive compensation under his employment agreement if the Company terminates the Named Executive Officer for Cause. Cause is generally defined in the employment agreement as commission of
98
fraud against the Company, willful refusal, without proper legal cause, to faithfully and diligently perform the Named Executive Officer’s duties as directed, or breach of the confidentiality provision of the employment agreement.
99
Item 12. Security Ownership of Certain Beneficial Owners and Management and Related Stockholder Matters.
Security Ownership of Certain Beneficial Owners
The following table sets forth information concerning the shareholdings of each person who, to the Company’s knowledge, beneficially owned more than five percent of the Company’s outstanding common stock as of February 28, 2015:
Name and Address of Beneficial Owner | Amount and Nature of Beneficial Ownership (# of shares) | Percent of Class | ||
FMR LLC 245 Summer Street Boston, Massachusetts 02210 | 6,188,700 | (1) | 13.89% | |
(1) | Based on a Schedule 13G dated February 12, 2016, FMR LLC is a parent holding company in accordance with SEC Rule 13d-1(b)(1)(ii)(G) and, as of December 31, 2015, holds sole voting power as to 156,400 shares and sole dispositive power as to all 6,188,700 shares. | |
Security Ownership of Management
The following table sets forth information concerning the shareholdings of the members of the Board, the Named Executive Officers as defined previously in this Form 10-K, and all executive officers and directors as a group, as of February 12, 2016:
Name of Beneficial Owner | Position | Amount and Nature of Beneficial Ownership(1) (# of shares) | Percent of Class | ||||
Terry E. Swift | Chairman of the Board, Chief Executive Officer and President | 803,101 | 1.8% | ||||
William A. Bruckmann III | Director | 45,434 | (2) | ||||
Deanna L. Cannon | Director | 91,994 | (2) | ||||
Douglas J. Lanier | Director | 118,884 | (2) | ||||
Greg Matiuk | Director | 111,884 | (2) | ||||
Ronald L. Saxton | Director | 89,434 | (2) | ||||
Clyde W. Smith, Jr. | Director | 152,205 | (3) | (2) | |||
Charles J. Swindells | Director | 99,494 | (2) | ||||
Bruce H. Vincent | Retired Director and President | 534,581 | 1.2% | ||||
Alton D. Heckaman, Jr. | Executive Vice President and Chief Financial Officer | 373,180 | (2) | ||||
Robert J. Banks | Executive Vice President and Chief Operating Officer | 287,669 | (2) | ||||
Steven L. Tomberlin | Senior Vice President—Asset Management | 256,760 | (2) | ||||
All executive officers and directors as a group (12 persons) | 2,964,620 | 6.5% | |||||
(1) | Unless otherwise indicated below, the persons named have sole voting and investment power, or joint voting and investment power with their respective spouses, over the number of shares of the common stock of the Company shown as being beneficially owned by them, less the shares set forth in this footnote. None of the shares beneficially owned by our executive officers and directors are pledged as security. The amounts include shares acquirable within 60 days of February 12, 2016, by vesting of restricted stock awards or exercise of options granted under the Company’s stock plans. No individual in the table was entitled to receive shares from restricted stock awards within 60 days of February 12, 2016, and the following were entitled to shares through the exercise of stock options during the same period: Mr. Swift - 316,391, Mr. Vincent - 267,300, Mr. Heckaman - 143,093, Mr. Banks - 145,900, Mr. Tomberlin - 42,800, and all executive officers and directors as a group - 915,484. | |
(2) | Less than one percent. | |
(3) | Mr. Smith disclaims beneficial ownership as to 1,000 shares held in a Roth IRA for the benefit of Mr. Smith’s son. | |
Equity Compensation Plan Information
The following table provides information as of December 31, 2015, regarding shares outstanding and available for issuance under the Company’s existing stock compensation and employee stock purchase plans:
100
(a) | (b) | (c) | |||||||||
Plan Category | Number of Securities to Be Issued Upon Exercise of Outstanding Options, Warrants and Rights | Weighted-Average Exercise Price of Outstanding Options, Warrants And Rights | Number of Securities Remaining Available for Future Issuance Under Equity Compensation Plans (excluding securities reflected in column (a)) | ||||||||
Equity compensation plans approved by security holders | 1,330,390 | $ | 34.02 | 2,125,308 | (1) | ||||||
Equity compensation plans not approved by security holders | — | $ | — | — | |||||||
Total | 1,330,390 | $ | 34.02 | 2,125,308 | |||||||
(1) | Includes 318,027 shares remaining available for issuance under the Swift Energy Company Employee Stock Purchase Plan and 1,807,281 under the 2005 Plan. | |
101
Item 13. Certain Relationships and Related Transactions, and Director Independence.
We receive research, technical writing, publishing, and website-related services from Tec-Com Inc., a corporation located in Knoxville, Tennessee and controlled and majority owned by the aunt of the Company's Chairman of the Board and Chief Executive Officer. We paid Tec-Com, for services pursuant to the terms of the contract, approximately $0.5 million in 2015, and approximately $0.6 million in 2014. The contract will be terminated on March 31, 2016.
Other than the Company’s Conflict of Interest Policy, the Company has not adopted a formal related-party transaction policy. As a matter of corporate governance policy and practice, all related-party transactions are presented to and considered by the Corporate Governance Committee of the Company’s Board of Directors. Further, all related party transactions are reviewed as part of a questionnaire pursuant to Auditing Standard 18.
102
Item 14. Principal Accounting Fees and Services.
AUDIT COMMITTEE DISCLOSURE
Preapproval Policies and Procedures
The charter of the Audit Committee provides that the Audit Committee shall approve, in its sole discretion, any professional services to be provided by the Company’s independent auditor, including audit services and significant non-audit services (significant being defined for these purposes as non-audit services for which fees in the aggregate equal 5% or more of the base annual audit fee paid by the Company to its independent auditor), before such services are rendered, and consider the possible effect of the performance of such latter services on the independence of the auditor. The Audit Committee may delegate preapproval authority to a member of the Audit Committee. The decisions of any Audit Committee member to whom preapproval authority is delegated must be presented to the full Audit Committee at its next scheduled meeting. All of the services described below for 2015 and 2014 were preapproved by the Audit Committee before Ernst & Young LLP was engaged to render the services.
Services Fees Paid to Independent Public Accounting Firm
Ernst & Young LLP, certified public accountants, began serving as the Company’s independent auditor in 2002. The Audit Committee, with ratification of the shareholders, engaged Ernst & Young LLP to perform an annual audit of the Company’s financial statements for the fiscal year ended December 31, 2015.
The following table presents fees and expenses billed by Ernst & Young LLP for its audit of the Company’s annual consolidated financial statements and for its review of the financial statements included in the Company’s Quarterly Reports on Form 10-Q for 2015 and 2014, and for its audit of internal control over financial reporting for 2015 and 2014, and for other services provided by Ernst & Young LLP.
2015 | 2014 | |||||||
Audit Fees | $ | 1,489,474 | $ | 2,121,843 | ||||
Audit-Related Fees | $ | — | $ | — | ||||
Tax Fees | $ | 123,037 | $ | 121,999 | ||||
All Other Fees | $ | — | $ | — | ||||
Totals | $ | 1,612,511 | $ | 2,243,842 | ||||
The audit fees for 2015 and 2014 were for professional services rendered in connection with the audits of our consolidated financial statements and reviews of our quarterly consolidated financial statements within such years. These fees also include the issuance of comfort letters, consents and assistance with review of various documents filed with the SEC in 2015 and 2014. The tax services provided in 2015 and 2014 generally consisted of compliance, tax advice and tax planning services.
Report of the Audit Committee
In connection with the financial statements for the fiscal year ended December 31, 2015, the Audit Committee has:
• | reviewed and discussed the audited financial statements with management; |
• | discussed with Ernst & Young LLP, the Company’s independent registered public accounting firm (the “Auditor”), the matters required to be discussed by the Statement on Auditing Standards (“SAS”) No. 61 (codification of SAS AU § 380) as adopted by the Public Accounting Oversight Board in Rule 3200T, as amended; and |
• | obtained the written disclosures and the letter from the Auditor in accordance with the applicable requirements of the Public Company Accounting Oversight Board regarding the Auditor’s communications with the Audit Committee concerning independence, and has discussed with the Auditor the Auditor’s independence. |
Based on the reviews and discussion referred to above, we recommended to the Board of Directors that the Company’s audited financial statements be included in the Annual Report on Form 10-K for the year ended December 31, 2015, filed with the Securities and Exchange Commission.
103
AUDIT COMMITTEE |
Deanna L. Cannon (Chair) |
William A. Bruckmann III |
Clyde W. Smith, Jr. |
Charles J. Swindells |
104
PART IV
Item 15. Exhibits and Financial Statement Schedules.
1. The following consolidated financial statements of Swift Energy Company together with the report thereon of Ernst & Young LLP dated March 4, 2016, and the data contained therein are included in Item 8 hereof:
Management's Report on Internal Control Over Financial Reporting | |
Report of Independent Registered Public Accounting Firm on Internal Control Over Financial Reporting | |
Report of Independent Registered Public Accounting Firm | |
Consolidated Balance Sheets | |
Consolidated Statements of Operations | |
Consolidated Statements of Stockholders' Equity | |
Consolidated Statements of Cash Flows | |
Notes to Consolidated Financial Statements | |
2. Financial Statement Schedules
None.
105
3. Exhibits
3.1 | Restated Certificate of Formation of Swift Energy Company (incorporated by reference as Exhibit 3.1 to Swift Energy Company's Quarterly Report on Form 10-Q for the quarterly period ended September 30, 2009 filed November 3, 2009, File No. 1-08754). |
3.2 | Amendment No. 1 to the Company's Restated Certificate of Formation (incorporated by reference as Exhibit 3.1 to Swift Energy Company's Form 8-K filed May16, 2011, File No. 1-08754). |
3.3 | Fourth Amended and Restated Bylaws of Swift Energy Company, effective July 30, 2013 (incorporated by reference as Exhibit 3.1 to Swift Energy Company's Quarterly Report on Form 10-Q filed August 1, 2013, File No. 1-08754). |
3.4 | Certificate of Designation of Series A Junior Participating Preferred Stock of Swift Energy Company (incorporated by reference as Exhibit 3.4 to Swift Energy Company's Form 8-K filed December 29, 2005, File No. 1-08754). |
3.5 | Amended and Restated Certificate of Designation of Series A Junior Participating Preferred Stock of Swift Energy Company (incorporated by reference as Exhibit 3.1 to Swift Energy Company's Form 8-K filed November 23, 2015, File No. 1-08754). |
4.1 | Indenture dated as of May 16, 2007 between Swift Energy Company and Wells Fargo Bank, National Association, as former trustee, (and Wilmington Trust, National Association as successor trustee) (incorporated by reference as Exhibit 4.1 to Swift Energy Company's Registration Statement on Form S-3 filed May 17, 2007, File No. 333-143034). |
4.2 | First Supplemental Indenture dated as of June 1, 2007, between Swift Energy Company, Swift Energy Operating, LLC and Wells Fargo Bank, National Association, as former trustee, (and Wilmington Trust, National Association as successor trustee), relating to the 7-1/8% Senior Notes due 2017 (incorporated by reference as Exhibit 4.1 to Swift Energy Company's Form 8-K filed June 7, 2007, File No. 1-08754). |
4.3 | Indenture dated as of May 19, 2009, between Swift Energy Company and Wells Fargo Bank, National Association, as former trustee, (and Wilmington Trust, National Association as successor trustee) (incorporated by reference as Exhibit 4.1 to Swift Energy Company's Registration Statement on Form S-3 filed May 19, 2009, and amended June 17 and June 26, 2009, File No. 333-159341). |
4.4 | First Supplemental Indenture dated as of November 25, 2009, between Swift Energy Company, Swift Energy Operating, LLC, and Wells Fargo Bank, National Association, as former trustee, (and Wilmington Trust, National Association as successor trustee) including the form of 8 7/8% Senior Notes (incorporated by reference as Exhibit 4.1 to Swift Energy Company's Form 8-K filed December 2, 2009, File No. 1-08754). |
4.5 | Second Supplemental Indenture dated as of November 30, 2011, among Swift Energy Company, Swift Energy Operating, LLC, and Wells Fargo Bank, National Association, as former trustee, (and Wilmington Trust, National Association as successor trustee), relating to the 7-7/8% Senior Notes due 2022 of Swift Energy Company (incorporated by reference as Exhibit 4.1 to Swift Energy Company's Form 8-K filed December 5, 2011, File No. 1-08754). |
4.6 | Registration Rights Agreement, dated October 18, 2012, by and among Swift Energy Company, Swift Energy Operating, LLC and J.P. Morgan Securities LLC, as representatives of the initial purchasers (incorporated by reference as Exhibit 4.3 to Swift Energy Company's Form 8-K filed October 24, 2012, File No. 1-08754). |
4.7 | Swift Energy Company Section 382 Rights Agreement dated November 19, 2015 (incorporated by reference as Exhibit 4.1 to Swift Energy Company's Form 8-K filed November 23, 2015, File No. 1-08754). |
10.1+ | 2001 Omnibus Stock Compensation Plan, as of January 1, 2001 (incorporated by reference as Exhibit 4.3 to the Swift Energy Company's Registration Statement on Form S-8 filed August 10, 2001, File No. 333-67242). |
10.2+ | Second Amended and Restated Swift Energy Company 2005 Stock Compensation Plan dated February 12, 2013 (incorporated by reference as Exhibit 10.1 to Swift Energy Company's Form 8-K filed May 24, 2013, File No. 1-08754). |
10.3+ | Amendment No. 1 to the Second Amended and Restated Swift Energy Company 2005 Stock Compensation Plan dated May 20, 2014 (incorporated by reference as Exhibit 10.1 to Swift Energy Company's Form 8-K filed May 27, 2014, File No. 1-08754). |
10.4+ | Amendment No. 2 to the Second Amended and Restated Swift Energy Company 2005 Stock Compensation Plan dated May 20, 2015 (incorporated by reference as Exhibit 10.1 to Swift Energy Company's Form 8-K filed May 20, 2015, File No. 1-08754). |
10.5+ | Forms of agreements for grant of incentive stock options and forms of agreement for grant of restricted stock under Swift Energy Company 2005 Stock Compensation Plan (incorporated by reference as Exhibit 10.19 to Swift Energy Company's annual Report on form 10-K for the fiscal year ended December 31, 2005 filed March 2, 2006, file No. 1-08754). |
106
10.6 | Form of Indemnity Agreement for Swift Energy Company officers (incorporated by reference as Exhibit 10.9 to Swift Energy Company's Annual Report on Form 10-K for the fiscal year ended December 31, 2006 filed March 1, 2007, File No. 1-08754). |
10.7+ | Form of Indemnity Agreement for Swift Energy Company directors (incorporated by reference as Exhibit 10.10 to Swift Energy Company's Annual Report on Form 10-K for the fiscal year ended December 31, 2006 filed February 28, 2007, File No. 1-08754). |
10.8+ | Consulting Agreement between Swift Energy Company and Virgil N. Swift effective as of July 1, 2006 (incorporated by reference as Exhibit 10.1 to Swift Energy Company's Quarterly Report on Form 10-Q for the quarterly period ended March 31, 2006 filed May 5, 2006, File No. 1-08754). |
10.9 | Second Amended and Restated Credit Agreement as of September 21, 2010, among Swift Energy Company, Swift Energy Operating, LLC and JPMorgan Chase Bank, N.A. as Administrative Agent, BNP Paribas and Wells Fargo Bank, N.A. as Co-Syndication Agents, Bank of Scotland PLC and Societe Generale, as Co-Documentation Agents, and the Lenders party thereto (incorporated by reference as Exhibit 10.01 to the Swift Energy Company's Form 8-K filed September 27, 2010, File No. 1-08754). |
10.10 | First Amendment and Consent to Second Amended and Restated Credit Agreement dated May 12, 2011, among Swift Energy Company, Swift Energy Operating, LLC, JPMorgan Chase Bank, N.A., as Administrative Agent, and the lenders party thereto (incorporated by reference as Exhibit 10.1 to Swift Energy Company's Form 8-K filed May 17, 2011, File No. 1-08754). |
10.11 | Second Amendment to Second Amended and Restated Credit Agreement effective as of October 2, 2012, among Swift Energy Company, Swift Energy Operating, LLC and JPMorgan Chase Bank, N.A. as Administrative Agent, and the Lenders party thereto (incorporated by reference as Exhibit 10.1 to the Swift Energy Company's Form 8-K filed October 3, 2012, File No 1-08754). |
10.12 | Third Amendment to Second Amended and Restated Credit Agreement effective as of October 3, 2012, among Swift Energy Company, Swift Energy Operating, LLC, JPMorgan Chase Bank, N.A., as Administrative Agent, and the lenders party thereto (incorporated by reference as Exhibit 10.1 to Swift Energy Company's Form 8-K filed November 5, 2012, File No. 1-08754). |
10.13 | Fourth Amendment and Consent to Second Amended and Restated Credit Agreement effective as of April 30, 2014, among Swift Energy Company, Swift Energy Operating, LLC, JPMorgan Chase Bank, N.A., as Administrative Agent, and the lenders party thereto (incorporated by reference as Exhibit 10.2 to Swift Energy Company's Quarterly Report on Form 10-Q for the quarterly period ended September 30, 2014, File No. 1-08754). |
10.14 | Fifth Amendment and Consent to Second Amended and Restated Credit Agreement effective as of May 1, 2015, among Swift Energy Company, Swift Energy Operating, LLC, JPMorgan Chase Bank, N.A., as Administrative Agent, and the lenders party thereto (incorporated by reference as Exhibit 10.1 to Swift Energy Company's Quarterly Report on Form 10-Q for the quarterly period ended March 31, 2015, file No. 1-08754). |
10.15 | Sixth Amendment and Consent to Second Amended and Restated Credit Agreement effective as of November 2, 2015, among Swift Energy Company, Swift Energy Operating, LLC, JPMorgan Chase Bank, N.A., as Administrative Agent, and the lenders party thereto (incorporated by reference as Exhibit 10.1 to Swift Energy Company's Quarterly Report on Form 10-Q for the quarterly period ended September 30, 2015, file No. 1-08754). |
10.16+ | Swift Energy Company Change of Control Severance Plan dated November 4, 2008 (incorporated by reference as Exhibit 10.2 to Swift Energy Company's Quarterly Report on Form 10-Q for the quarterly period ended September 30, 2008 filed November 6, 2008). |
10.17+ | Second Amended and Restated Executive Employment Agreement between Swift Energy Company and Terry E. Swift dated November 4, 2008 (incorporated by reference as Exhibit 10.3 to Swift Energy Company's Quarterly Report on Form 10-Q for the quarterly period ended September 30, 2008 filed November 6, 2008, File No. 1-08754). |
10.18+ | Second Amended and Restated Executive Employment Agreement between Swift Energy Company and Alton D. Heckaman dated November 4, 2008 (incorporated by reference as Exhibit 10.5 to Swift Energy Company's Quarterly Report on Form 10-Q for the quarterly period ended September 30, 2008 filed November 6, 2008, File No. 1-08754). |
10.19+ | Executive Employment Agreement between Swift Energy Company and Robert J. Banks dated November 4, 2008 (incorporated by reference as Exhibit 10.6 to Swift Energy Company's Quarterly Report on Form 10-Q for the quarterly period ended September 30, 2008 filed November 6, 2008, File No. 1-08754). |
10.20+ | Amended and Restated Executive Employment Agreement between Swift Energy Company and James P. Mitchell dated November 4, 2008 (incorporated by reference as Exhibit 10.8 to Swift Energy Company's Quarterly Report on Form 10-Q for the quarterly period ended September 30, 2008 filed November 6, 2008, File No. 1-08754). |
107
10.21 | Purchase Agreement, dated October 3, 2012 among Swift Energy Company, Swift Energy Operating, LLC and J.P. Morgan Securities LLC, as representatives of the several initial purchasers (incorporated by reference as Exhibit 10.1 to Swift Energy Company's Form 8-K filed October 5, 2012, File No. 1-08745). |
10.22+ | Form of Performance Restricted Stock Unit Award under the Second Amended and Restated Swift Energy 2005 Stock Compensation Plan (incorporated by reference as Exhibit 10.1 to Swift Energy Company's Quarterly Report on Form 10-Q for the quarterly period ended March 31, 2013 filed May 2, 2013, File No. 1-08754). |
10.23+ | Retirement and Release Agreement between Swift Energy Company and Bruce H. Vincent dated January 8, 2015, but effective February 15, 2015 (incorporated by reference as Exhibit 10.21 to Swift Energy Company's Annual Report on form 10-K for the fiscal year ended December 31, 2014 filed March 2, 2015, File No. 1-08754). |
12 * | Swift Energy Company Ratio of Earnings to Fixed Charges. |
21 * | List of Subsidiaries of Swift Energy Company. |
23.1 * | Consent of H.J. Gruy and Associates, Inc. |
23.2 * | Consent of Ernst & Young LLP as to incorporation by reference regarding Forms S-3, S-4 and S-8 Registration Statements. |
31.1 * | Certification of Chief Executive Officer pursuant to Section 302 of the Sarbanes-Oxley Act of 2002. |
31.2* | Certification of Chief Financial Officer pursuant to Section 302 of the Sarbanes-Oxley Act of 2002. |
32* | Certification of Chief Executive Officer and Chief Financial Officer pursuant to Section 906 of the Sarbanes-Oxley Act of 2002. |
99.1* | The reserves audit letter of H.J. Gruy and Associates, Inc. dated February 2, 2016. |
101.INS* | XBRL Instance Document |
101.SCH* | XBRL Schema Document |
101.CAL* | XBRL Calculation Linkbase Document |
101.LAB* | XBRL Label Linkbase Document |
101.PRE* | XBRL Presentation Linkbase Document |
101.DEF* | XBRL Definition Linkbase Document |
* Filed herewith.
+ Management contract or compensatory plan or arrangement.
108
SIGNATURES
Pursuant to the requirements of Section 13 or 15(d) of the Securities Exchange Act of 1934, the Registrant, Swift Energy Company, has duly caused this report to be signed on its behalf by the undersigned, thereunto duly authorized.
SWIFT ENERGY COMPANY | |
By: /s/ Terry E. Swift | |
Terry E. Swift | |
Chairman of the Board | |
Pursuant to the requirements of the Securities Exchange Act of 1934, this report has been signed below by the following persons on behalf of the Registrant, Swift Energy Company, and in the capacities and on the dates indicated:
Signatures | Title | Date |
Chairman of the Board | ||
/s/ Terry E. Swift | Chief Executive Officer | March 4, 2016 |
Terry E. Swift | President | |
Executive Vice President | ||
/s/ Alton D. Heckaman, Jr. | Chief Financial Officer | March 4, 2016 |
Alton D. Heckaman, Jr. | Principal Accounting Officer | |
/s/ Deanna L. Cannon | Director | March 4, 2016 |
Deanna L. Cannon | ||
/s/ Douglas J. Lanier | Director | March 4, 2016 |
Douglas J. Lanier | ||
/s/Greg Matiuk | Director | March 4, 2016 |
Greg Matiuk | ||
/s/ Clyde W. Smith, Jr. | Director | March 4, 2016 |
Clyde W. Smith, Jr. | ||
/s/ Charles J. Swindells | Director | March 4, 2016 |
Charles J. Swindells | ||
/s/ Ronald L. Saxton | Director | March 4, 2016 |
Ronald L. Saxton | ||
/s/ William A. Bruckmann III | Director | March 4, 2016 |
William A. Bruckmann III | ||
109