Attached files
| file | filename |
|---|---|
| EX-18.1 - EXHIBIT 18.1 - TimkenSteel Corp | tmstexhibit18112312019.htm |
| EX-32.1 - EXHIBIT 32.1 - TimkenSteel Corp | tmstexhibit32112312019.htm |
| EX-31.2 - EXHIBIT 31.2 - TimkenSteel Corp | tmstexhibit31212312019.htm |
| EX-31.1 - EXHIBIT 31.1 - TimkenSteel Corp | tmstexhibit31112312019.htm |
| EX-24.1 - EXHIBIT 24.1 - TimkenSteel Corp | tmstexhibit24112312019.htm |
| EX-23.1 - EXHIBIT 23.1 - TimkenSteel Corp | tmstexhibit23112312019.htm |
| EX-21.1 - EXHIBIT 21.1 - TimkenSteel Corp | tmstexhibit21112312019.htm |
| EX-4.3 - EXHIBIT 4.3 - TimkenSteel Corp | tmstexhibit4112312019.htm |
UNITED STATES
SECURITIES AND EXCHANGE COMMISSION
WASHINGTON, D.C. 20549
FORM 10-K |
ý | ANNUAL REPORT PURSUANT TO SECTION 13 OR 15(d) OF THE SECURITIES EXCHANGE ACT OF 1934 |
For the fiscal year ended December 31, 2019 OR
o | TRANSITION REPORT PURSUANT TO SECTION 13 OR 15(d) OF THE SECURITIES EXCHANGE ACT OF 1934 |
For the transition period from to
Commission file number: 1-36313

TIMKENSTEEL CORPORATION (Exact name of registrant as specified in its charter) |
Ohio | 46-4024951 | |
(State or other jurisdiction of incorporation or organization) | (I.R.S. Employer Identification No.) | |
1835 Dueber Avenue SW, Canton, OH | 44706 | |
(Address of principal executive offices) | (Zip Code) | |
330.471.7000 (Registrant’s telephone number, including area code)
Securities registered pursuant to Section 12(b) of the Securities Exchange Act of 1934: | ||
Title of each class | Trading symbol | Name of exchange in which registered |
Common shares | TMST | New York Stock Exchange |
Securities registered pursuant to Section 12(g) of the Act: None
Indicate by check mark if the registrant is a well-known seasoned issuer, as defined in Rule 405 of the Securities Act. Yes ¨ No ý
Indicate by check mark if the registrant is not required to file reports pursuant to Section 13 or Section 15(d) of the Exchange Act.
Yes ¨ No ý
Indicate by check mark whether the registrant (1) has filed all reports required to be filed by Section 13 or 15(d) of the Securities Exchange Act of 1934 during the preceding 12 months (or for such shorter period that the registrant was required to file such reports), and (2) has been subject to such filing requirements for the past 90 days. Yes ý No ¨
Indicate by check mark whether the registrant has submitted electronically every Interactive Data File required to be submitted pursuant to Rule 405 of Regulation S-T (§232.405 of this Chapter) during the preceding 12 months (or for such shorter period that the registrant was required to submit such files). Yes ý No ¨
Indicate by check mark whether the registrant is a large accelerated filer, an accelerated filer, a non-accelerated filer or a smaller reporting company. See the definitions of “large accelerated filer,” “accelerated filer” and “smaller reporting company” in Rule 12b-2 of the Exchange Act.
Large accelerated filer | o | Accelerated filer | ý | |||
Non-accelerated filer | o | Smaller reporting company | o | |||
Emerging growth company | o | |||||
If an emerging growth company, indicate by check mark if the registrant has elected not to use the extended transition period for complying with any new or revised financial reporting accounting standards provided pursuant to Section 13(a) of the Exchange Act. ¨
Indicate by check mark whether the registrant is a shell company (as defined in Rule 12b-2 of the Exchange Act). Yes ¨ No ý
As of June 30, 2019, the aggregate market value of the registrant’s common stock held by non-affiliates was $337,525,844 based on the closing sale price as reported on the New York Stock Exchange for that date.
Indicate the number of shares outstanding of each of the issuer’s classes of common stock, as of the latest practicable date.
Class | Outstanding at February 15, 2020 | |
Common Shares, without par value | 44,821,588 | |
DOCUMENTS INCORPORATED BY REFERENCE
Document | Parts Into Which Incorporated | |
Proxy Statement for the 2020 Annual Meeting of Shareholders | Part III | |
TimkenSteel Corporation
Table of Contents
PAGE | ||
PART I. | ||
PART II. | ||
2
PART I.
ITEM 1. BUSINESS
Overview
TimkenSteel Corporation (we, us, our, the Company or TimkenSteel) was incorporated in Ohio on October 24, 2013, and became an independent, publicly traded company as the result of a spinoff from The Timken Company (Timken) on June 30, 2014. In the spinoff, Timken transferred to us all of the assets and generally all of the liabilities related to Timken’s steel business.
We manufacture alloy steel, as well as carbon and micro-alloy steel, with an annual melt capacity of approximately 2 million tons and shipment capacity of 1.5 million tons. Our portfolio includes special bar quality (SBQ) bars, seamless mechanical tubing (tubes), value-added solutions such as precision steel components, and billets. In addition, we supply machining and thermal treatment services, and we manage raw material recycling programs, which are used as a feeder system for our melt operations. Our products and services are used in a diverse range of demanding applications in the following market sectors: automotive; oil and gas; industrial equipment; mining; construction; rail; defense; heavy truck; agriculture; power generation; and oil country tubular goods (OCTG).
SBQ steel is made to restrictive chemical compositions and high internal purity levels and is used in critical mechanical applications. We make these products from nearly 100% recycled steel, using our expertise in raw materials to create custom steel products. We focus on creating tailored products and services for our customers’ most demanding applications. Our engineers are experts in both materials and applications, so we can work closely with each customer to deliver flexible solutions related to our products as well as to their applications and supply chains.
The SBQ bar, tube, and billet production processes take place at our Canton, Ohio manufacturing location. This location accounts for all of the SBQ bars, seamless mechanical tubes and billets we produce and includes three manufacturing facilities: the Faircrest, Harrison and Gambrinus facilities. Our value-added solutions production processes take place at three downstream manufacturing facilities: TimkenSteel Material Services (Houston, Texas), Tryon Peak (Columbus, North Carolina), and St. Clair (Eaton, Ohio). Many of the production processes are integrated, and the manufacturing facilities produce products that are sold in all of our market sectors. As a result, investments in our facilities and resource allocation decisions affecting our operations are designed to benefit the overall business, not any specific aspect of the business.
In the fourth quarter of 2019, our Board of Directors approved a plan to close our TimkenSteel Material Services facility during the first quarter of 2020. See “Note 6 - Disposition of Non-Core Assets” in the Notes to the Consolidated Financial Statements for additional information.
Operating Segments
We conduct our business activities and report financial results as one business segment. The presentation of financial results as one reportable segment is consistent with the way we operate our business and is consistent with the manner in which the Chief Operating Decision Maker (CODM) evaluates performance and makes resource and operating decisions for the business as described above. Furthermore, the Company notes that monitoring financial results as one reportable segment helps the CODM manage costs on a consolidated basis, consistent with the integrated nature of our operations.
Industry Segments and Geographical Financial Information
Information required by this Item is incorporated herein by reference to “Note 3 - Segment Information” in the Notes to the Consolidated Financial Statements.
Strengths and Strategy
Our customers depend on us to be the leader in solving their industries’ constantly evolving challenges. Our team, including engineers and experienced manufacturing professionals in both materials and applications, works closely with customers to deliver flexible solutions related to our products as well as our customers’ applications and supply chains.
The TimkenSteel business model delivers these tailored solutions based on the following foundation:
• | Deep and experienced management and technical team. |
• | Close and trusted working relationship with customers across diverse end markets. |
• | Leadership position in niche markets with differentiated products. |
3
• | Track record of innovation rooted in a deep technical knowledge of steel materials, manufacturing processes and a focus on end-user applications. Our research and development efforts focus on creating solutions for our customers’ toughest challenges. |
Major Customers
We sell products and services that are used in a range of demanding applications around the world. We have over 400 diverse customers in the following market sectors: automotive; oil and gas; industrial equipment; mining; construction; rail; defense; heavy truck; agriculture; power generation; and OCTG.
Products
We believe we produce some of the cleanest, highest performing alloy air-melted steels in the world for our customers’ most demanding applications. We leverage our technical knowledge, development expertise and production and engineering capabilities across all of our products and end-markets to deliver high-performance products to our customers.
SBQ Steel Bar, Seamless Mechanical Steel Tubes, and Billets. Our focus is on alloy steel, although in total we manufacture more than 700 grades of high-performance carbon, micro-alloy and alloy steel, sold as ingots, bars, tubes and billets. These products are custom-made in a variety of chemistries, lengths and finishes. Our metallurgical expertise and what we believe to be unique operational capabilities drive high-value solutions for industrial, energy and mobile customers. Our specialty steels are featured in a wide variety of end products including: gears; hubs; axles; crankshafts and connecting rods; oil country drill pipe; bits and collars; bearing races and rolling elements; bushings; fuel injectors; wind energy shafts; anti-friction bearings; and other demanding applications where mechanical power transmission is critical to the end customer.
Value-added Precision Products and Services. In addition to our customized steels, we also custom-make precision components that provide us with the opportunity to further expand our market for bar and tube products and capture additional sales. These products provide customers, especially those in the automotive industry, with ready-to-finish components that simplify vendor management, streamline supply chains and often cost less than other alternatives. We also customize products and services for the industrial and energy market sectors.
Sales and Distribution
Our sales force is made up largely of engineers that are backed by a team of metallurgists and other technical experts. While most of our products are sold directly to original equipment (OE) manufacturers, a portion of our sales are made through authorized distributors and steel service centers, representing approximately 19% of net sales during 2019. The majority of our customers are served through individually negotiated price agreements.
Competition
The steel industry, both domestically and globally, is highly competitive and is expected to remain so. Maintaining high standards of product quality and reliability, while keeping production costs competitive, is essential to our ability to compete with domestic and foreign manufacturers of alloy steel and mechanical components. For bar products less than 6-inch in diameter, principal competitors include foreign-owned domestic producers Gerdau Special Steel North America (a unit of Brazilian steelmaker Gerdau, S.A) and Republic Steel (a unit of Mexican steel producer ICH). For bar products up to 9-inch in diameter, domestic producers Steel Dynamics, Inc. and Nucor Corporation (in some cases up to 10-inch) are our principal competitors. For very large bars from 10 to 16 inches in diameter, offshore producers as well as specialty forging companies in North America such as Scot Forge and Finkl Steel - Sorel are the primary competitors. For seamless mechanical tubing, offshore producers such as Tenaris, S.A., Vallourec, S.A. and TMK Group are our primary competitors as well as the foreign-owned domestic producer ArcelorMittal Tubular Products (a unit of Luxembourg-based ArcelorMittal, S.A.). We also provide unique value-added steel products and supply chain solutions to our customers in the automotive, industrial and energy sectors. Competitors within the value-added market sector include both integrated and non-integrated component producers.
Backlog
The backlog of orders for our operations is estimated to have been approximately 198,000 and 314,000 tons at December 31, 2019 and 2018, respectively.
Virtually our entire backlog at December 31, 2019 is scheduled for delivery in the succeeding 12 months. Actual shipments depend upon customers’ production schedules and may not be a meaningful indicator of future sales. Accordingly, we do not believe our backlog data, or comparisons thereof as of different dates, reliably indicate future sales or shipments.
4
Raw Materials
The principal raw materials that we use to manufacture steel are recycled scrap metal, chrome, nickel, molybdenum oxide, vanadium and other alloy materials. Raw materials comprise a significant portion of the steelmaking cost structure and are subject to price and availability changes due to global demand fluctuations and local supply limitations. Proper selection and management of raw materials can have a significant impact on procurement cost, flexibility to supply changes, steelmaking energy costs and mill productivity. In addition to accessing scrap and alloys through the open market, we have established a scrap return supply chain with many of our customers. This part of our business leverages our knowledge of the raw material supply industry and an extensive network of relationships that result in steady, reliable supply from our raw material sources. We previously operated a scrap processing facility as an additional source of raw materials; however, during the fourth quarter of 2019 we marketed and subsequently entered into an agreement to dispose of the assets associated with the operation. The disposal was completed in January 2020. See “Note 6 - Disposition of Non-Core Assets” in the Notes to the Consolidated Financial Statements for additional information.
Research and Development
Our engineers analyze customer application challenges and develop solutions to address the customers’ needs. With a century of experience in materials science and steelmaking, we leverage our technical know-how to improve the performance of our customers’ products and supply chains.
This expertise extends to advanced process technology in which material conversion, finishing, gaging and assembly enables high quality production of our products. With resources dedicated to studying, developing and implementing new manufacturing processes and technologies, we are able to support our customers’ requirements.
Our research and development expense for the years ended December 31, 2019, 2018 and 2017 were $4.1 million, $8.1 million and $8.0 million, respectively.
Environmental Matters
We consider compliance with environmental regulations and environmental sustainability a key strategic focus area and integral to our responsibility as a good corporate citizen. All of our domestic steel making and processing operations and our water treatment plant have obtained and maintain ISO 14001 certification.
We believe we have established appropriate reserves to cover our environmental expenses. We have a well-established environmental compliance audit program that measures performance against applicable laws as well as against internal standards that have been established for all facilities. It is difficult to assess the possible effect of compliance with future requirements that differ from existing ones both domestically and internationally. As previously reported, we are unsure of the future financial impact to us from the U.S. Environmental Protection Agency’s (EPA) rule changes related to the Clean Air Act (CAA), Clean Water Act (CWA), waste and other environmental rules and regulations.
We and certain of our subsidiaries located in the U.S. have been identified as potentially responsible parties under the Toxic Substances Control Act (TSCA), Resource Conservation and Recovery Act (RCRA), CAA and CWA, as well as other laws. In general, certain cost allocations for investigation and remediation have been asserted by us against other entities, which are believed to be financially solvent and are expected to substantially fulfill their proportionate share of any obligations.
From time to time, we may be a party to lawsuits, claims or other proceedings related to environmental matters and/or receive notices of potential violations of environmental laws and regulations from the EPA and similar state or local authorities. As of December 31, 2019 and 2018, we recorded reserves for such environmental matters of $1.2 million and $0.8 million, respectively. Accruals related to such environmental matters represent management’s best estimate of the fees and costs associated with these matters. Although it is not possible to predict with certainty the outcome of such matters, management believes the ultimate disposition of these matters should not have a material adverse effect on our consolidated financial position, results of operations or cash flows.
Legal Proceedings
We are involved in various claims and legal actions arising in the ordinary course of business. In the opinion of our management, the ultimate disposition of these matters will not have a material adverse effect on our consolidated financial position, results of operations or cash flows.
5
Canton, Ohio U.S. EPA Notice of Violation
The EPA issued two related Notices of Violation (NOV) to TimkenSteel on August 5, 2014 and November 2, 2015. The EPA alleges violations under the CAA based on purported violations of permitted emission limits and engineering requirements at TimkenSteel’s Faircrest and Harrison facilities in Canton, Ohio. TimkenSteel disputes many of EPA’s allegations but is working cooperatively with the EPA and the U.S. Department of Justice to resolve the government’s claims. Negotiations to resolve the NOVs are ongoing, but it is not anticipated that the ultimate resolution of the NOVs will have a material adverse effect on our consolidated financial position, results of operations or cash flows. For additional information, please refer to “Note 18 - Contingencies” in the Notes to the Consolidated Financial Statements.
Patents, Trademarks and Licenses
While we own a number of U.S. and foreign patents, trademarks, licenses and copyrights, none are material to our products and production processes.
Employment
At December 31, 2019, we had approximately 2,500 employees, with about 58% of our employees covered under one of two collective bargaining agreements that expire in September 2021 and December 2022. The collective bargaining agreement that expires in September 2021 covers approximately 57% of our employees. The collective bargaining agreement expiring in December 2022 related to the scrap processing facility that was disposed of in January 2020.
Available Information
We use our Investor Relations website at http://investors.timkensteel.com, as a channel for routine distribution of important information, including news releases, analyst presentations and financial information. We post filings (including our annual, quarterly and current reports on Forms 10-K, 10-Q and 8-K, respectively; our proxy statements; and any amendments to those reports or statements) as soon as reasonably practicable after they are electronically filed with, or furnished to, the Securities and Exchange Commission (SEC). All such postings and filings are available on our website free of charge. In addition, our website allows investors and other interested persons to sign up to automatically receive e-mail alerts when we post news releases and financial information on our website. The SEC also maintains a website, www.sec.gov, which contains reports, proxy and information statements and other information regarding issuers that file electronically with the SEC. The content on any website referred to in this Annual Report on Form 10-K is not incorporated by reference into this Annual Report unless expressly noted.
6
ITEM 1A. RISK FACTORS
The following are certain risk factors that could affect our business, financial condition and results of operations. The risks that are highlighted below are not the only ones we face. You should carefully consider each of the following risks and all of the other information contained in this Annual Report on Form 10-K. Some of these risks relate principally to our business and the industry in which we operate, while others relate principally to our debt, the securities markets in general, ownership of our common shares and our spinoff from The Timken Company. If any of the following risks actually occur, our business, financial condition or results of operations could be negatively affected.
Risks Relating to Our Industry and Our Business
Competition in the steel industry, together with potential global overcapacity, could result in significant pricing pressure for our products.
Competition within the steel industry, both domestically and worldwide, is intense and is expected to remain so. The steel industry has historically been characterized by periods of excess global capacity and supply. Excess global capacity and supply has negatively affected and could continue to negatively affect domestic steel prices, which could adversely impact our results of operations and financial condition. High levels of steel imports into the U.S. could exacerbate a decrease in domestic steel prices.
In an effort to protect the domestic steel industry, the United States government implemented tariffs, duties and quotas for certain steel products imported from a number of countries into the United States. If these tariffs, duties and quotas expire or are repealed, it could result in substantial imports of foreign steel and create pressure on United States steel prices and the overall industry. This could have a material adverse effect on our operations.
Any change in the operation of our raw material surcharge mechanisms, a raw material market index or the availability or cost of raw materials and energy resources could materially affect our revenues, earnings, and cash flows.
We require substantial amounts of raw materials, including scrap metal and alloys, electricity and natural gas, to operate our business. Many of our customer agreements contain surcharge pricing provisions that are designed to enable us to recover raw material cost increases. The surcharges are generally tied to a market index for that specific raw material. Historically, many raw material market indices have reflected significant fluctuations. Any change in a raw material market index could materially affect our revenues. Any change in the relationship between the market indices and our underlying costs could materially affect our earnings.
We rely on third parties to supply certain raw materials that are critical to the manufacture of our products. Purchase prices and availability of these critical raw materials are subject to volatility. At any given time we may be unable to obtain an adequate supply of these critical raw materials on a timely basis, on acceptable price and other terms, or at all. If suppliers increase the price of critical raw materials, we may not have alternative sources of supply. In addition, to the extent we have quoted prices to customers and accepted customer orders or entered into agreements for products prior to purchasing necessary raw materials, we may be unable to raise the price of products to cover all or part of the increased cost of the raw materials.
The cost and availability of electricity and natural gas are also subject to volatile market conditions.
Steel producers like us consume large amounts of energy. We rely on third parties for the supply of energy resources we consume in our steelmaking activities. The prices for and availability of electricity, natural gas, oil and other energy resources are also subject to volatile market conditions, often affected by weather conditions as well as political and economic factors beyond our control. Any increase in the prices for electricity, natural gas, oil and other energy resources could materially affect our costs and therefore our earnings and cash flows.
As a large consumer of electricity and gas, we must have dependable delivery in order to operate. Accordingly, we are at risk in the event of an energy disruption. Prolonged black-outs or brown-outs or disruptions caused by natural disasters or governmental action would substantially disrupt our production.
Moreover, many of our finished steel products are delivered by truck. Unforeseen fluctuations in the price of fuel would also have a negative impact on our costs or on the costs of many of our customers.
In addition, changes in certain environmental laws and regulations, including those that may impose output limitations or higher costs associated with climate change or greenhouse gas emissions, could substantially increase the cost of manufacturing and raw materials, such as energy, to us and other U.S. steel producers.
7
Our operating results depend in part on continued successful research, development and marketing of new and/or improved products and services, and there can be no assurance that we will continue to successfully introduce new products and services.
The success of new and improved products and services depends on their initial and continued acceptance by our customers. Our business is affected, to varying degrees, by technological change and corresponding shifts in customer demand, which could result in unpredictable product transitions or shortened life cycles. We may experience difficulties or delays in the research, development, production, or marketing of new products and services that may prevent us from recouping or realizing a return on the investments required to bring new products and services to market.
New technologies in the steel industry may: (a) improve cost competitiveness; (b) increase production capabilities; or (c) improve operational efficiency compared to our current production methods. However, we may not have sufficient capital to invest in such technologies or to make certain capital improvements, and may, from time to time, incur cost over-runs and difficulties adapting and fully integrating these technologies or capital improvements into our existing operations. We may also encounter control or production restrictions, or not realize the cost benefit from such capital-intensive technology adaptations or capital improvements to our current production processes.
Our business is capital-intensive, and if there are downturns in the industries we serve, we may be forced to significantly curtail or suspend operations with respect to those industries, which could result in our recording asset impairment charges or taking other measures that may adversely affect our results of operations and profitability.
Our business operations are capital-intensive. If there are downturns in the industries we serve, we may be forced to significantly curtail or suspend our operations with respect to those industries, including laying-off employees, recording asset impairment charges and other measures. In addition, we may not realize the benefits or expected returns from announced plans, programs, initiatives and capital investments. Any of these events could adversely affect our results of operations and profitability.
We are dependent on our key customers.
As a result of our dependence on our key customers, we could experience a material adverse effect on our business, financial condition and results of operations if any of the following, among other things, were to occur: (a) a loss of any key customer, or a material amount of business from such key customer; (b) the insolvency or bankruptcy of any key customer; (c) a declining market in which customers reduce orders; or (d) a strike or work stoppage at a key customer facility, which could affect both its suppliers and customers. For the year ended December 31, 2019, sales to our 10 largest customers accounted for approximately 42% of our net sales. Additionally, customers continue to demand stronger and lighter products, among other adaptations to traditional products. We may not be successful in meeting these technological challenges and there may be increased liability exposure connected with the supply of additional products and services.
Weakness in global economic conditions or in any of the industries or geographic regions in which we or our customers operate, as well as the cyclical nature of our customers’ businesses generally or sustained uncertainty in financial markets, could adversely impact our revenues and profitability by reducing demand and margins.
Our results of operations may be materially affected by conditions in the global economy generally and in global capital markets. There has been volatility in the capital markets and in the end markets and geographic regions in which we or our customers operate, which has negatively affected our revenues. Many of the markets in which our customers participate are also cyclical in nature and experience significant fluctuations in demand for our steel products based on economic conditions, consumer demand, raw material and energy costs, and government actions, and many of these factors are beyond our control.
A decline in consumer and business confidence and spending, together with severe reductions in the availability and increased cost of credit, as well as volatility in the capital and credit markets, could adversely affect the business and economic environment in which we operate and the profitability of our business. We also are exposed to risks associated with the creditworthiness of our suppliers and customers. If the availability of credit to fund or support the continuation and expansion of our customers’ business operations is curtailed or if the cost of that credit is increased, the resulting inability of our customers or of their customers to either access credit or absorb the increased cost of that credit could adversely affect our business by reducing our sales or by increasing our exposure to losses from uncollectible customer accounts. These conditions and a disruption of the credit markets could also result in financial instability of some of our suppliers and customers. The consequences of such adverse effects could include the interruption of production at the facilities of our customers, the reduction, delay or cancellation of customer orders, delays or interruptions of the supply of raw materials or other inputs we purchase, and bankruptcy of customers, suppliers or other creditors. Any of these events could adversely affect our profitability, cash flow and financial condition.
8
Our capital resources may not be adequate to provide for all of our cash requirements, and we are exposed to risks associated with financial, credit, capital and banking markets.
In the ordinary course of business, we will seek to access competitive financial, credit, capital and/or banking markets. Currently, we believe we have adequate capital available to meet our reasonably anticipated business needs based on our historic financial performance, as well as our expected financial position. However, if we need to obtain additional financing in the future, to the extent our access to competitive financial, credit, capital and/or banking markets was to be impaired, our operations, financial results and cash flows could be adversely impacted.
We have significant retiree health care and pension plan costs, which may negatively affect our results of operations and cash flows.
We maintain retiree health care and defined benefit pension plans covering many of our domestic employees and former employees upon their retirement. These benefit plans have significant liabilities that are not fully funded, which will require additional cash funding in future years. Minimum contributions to domestic qualified pension plans are regulated under the Employee Retirement Income Security Act of 1974 (ERISA) and the Pension Protection Act of 2006 (PPA).
The level of cash funding for our defined benefit pension plans in future years depends upon various factors, including voluntary contributions that we may make, future pension plan asset performance, actual interest rates, union negotiated benefit changes, future government regulations, and other factors, many of which are not within our control. In addition, assets held by the trusts for our pension plan and our trust for retiree health care and life insurance benefits are subject to the risks, uncertainties and variability of the financial markets. See “Note 15 - Retirement and Postretirement Plans” in the Notes to the Consolidated Financial Statements for a discussion of assumptions and further information associated with these benefit plans.
Product liability, warranty and product quality claims could adversely affect our operating results.
We produce high-performance carbon and alloy steel, sold as ingots, bars, tubes and billets in a variety of chemistries, lengths and finishes designed for our customers’ demanding applications. Failure of the materials that are included in our customers’ applications could give rise to product liability or warranty claims. There can be no assurance that our insurance coverage will be adequate or continue to be available on terms acceptable to us. If we fail to meet a customer’s specifications for its products, we may be subject to product quality costs and claims. A successful warranty or product liability claim against us could have a material adverse effect on our earnings.
We may incur restructuring and impairment charges that could materially affect our profitability.
Changes in business or economic conditions, or our business strategy, may result in actions that require us to incur restructuring and impairment charges in the future, which could have a material adverse effect on our earnings. For additional information on current restructuring and impairment charges, refer to “Note 5 - Restructuring Charges” and “Note 6 - Disposition of Non-Core Assets” in the Notes to Consolidated Financial Statements.
If our internal controls are found to be ineffective, our financial results or our stock price may be adversely affected.
Our most recent evaluation resulted in our conclusion that, as of December 31, 2019, our internal control over financial reporting was effective. We believe that we currently have adequate internal control procedures in place for future periods. However, if our internal control over financial reporting is found to be ineffective, investors may lose confidence in the reliability of our financial statements, which may adversely affect our stock price.
We are subject to extensive environmental, health and safety laws and regulations, which impose substantial costs and limitations on our operations, and environmental, health and safety compliance and liabilities may be more costly than we expect.
We are subject to extensive federal, state, and local environmental, health and safety laws and regulations concerning matters such as worker health and safety, air emissions, wastewater discharges, hazardous material and solid and hazardous waste use, generation, handling, treatment and disposal and the investigation and remediation of contamination. We are subject to the risk of substantial liability and limitations on our operations due to such laws and regulations. The risks of substantial costs and liabilities related to compliance with these laws and regulations, which tend to become more stringent over time, are an inherent part of our business, and future conditions may develop, arise or be discovered that create substantial environmental compliance or remediation or other liabilities and costs.
Compliance with environmental, health and safety legislation and regulatory requirements may prove to be more limiting and costly than we anticipate. To date, we have committed significant expenditures in our efforts to achieve and maintain compliance
9
with these requirements, and we expect that we will continue to make significant expenditures related to such compliance in the future. From time to time, we may be subject to legal proceedings brought by private parties or governmental authorities with respect to environmental matters, including matters involving alleged contamination, property damage or personal injury. New laws and regulations, including those that may relate to emissions of greenhouse gases, stricter enforcement of existing laws and regulations, the discovery of previously unknown contamination or the imposition of new clean-up requirements, could require us to incur costs or become the basis for new or increased liabilities that could have a material adverse effect on our business, financial condition or results of operations.
From both a medium- and long-term perspective, we are likely to see an increase in costs relating to our assets that emit relatively significant amounts of greenhouse gases as a result of new and existing legal and regulatory initiatives. These initiatives will be either voluntary or mandatory and may impact our operations directly or through our suppliers or customers. Until the timing, scope and extent of any future legal and regulatory initiatives become known, we cannot predict the effect on our business, financial condition or results of operations.
Unexpected equipment failures or other disruptions of our operations may increase our costs and reduce our sales and earnings due to production curtailments or shutdowns.
Interruptions in production capabilities would likely increase our production costs and reduce sales and earnings for the affected period. In addition to equipment failures, our facilities and information technology systems are also subject to the risk of catastrophic loss due to unanticipated events such as fires, explosions or violent weather conditions. Our manufacturing processes are dependent upon critical pieces of equipment for which there may be only limited or no production alternatives, such as furnaces, continuous casters and rolling equipment, as well as electrical equipment, such as transformers, and this equipment may, on occasion, be out of service as a result of unanticipated failures. In the future, we may experience material plant shutdowns or periods of reduced production as a result of these types of equipment failures, which could cause us to lose or prevent us from taking advantage of various business opportunities or prevent us from responding to competitive pressures.
A significant portion of our manufacturing facilities are located in Stark County, Ohio, which increases the risk of a significant disruption to our business as a result of unforeseeable developments in this geographic area.
It is possible that we could experience prolonged periods of reduced production due to unforeseen catastrophic events occurring in or around our manufacturing facilities in Stark County, Ohio. As a result, we may be unable to shift manufacturing capabilities to alternate locations, accept materials from suppliers, meet customer shipment deadlines or address other significant issues, any of which could have a material adverse effect on our business, financial condition or results of operations.
We may be subject to risks relating to our information technology systems and cybersecurity.
We rely on information technology systems to process, transmit and store electronic information and manage and operate our business. We face the challenge of supporting our older systems and implementing upgrades when necessary. Additionally, a breach in security could expose us and our customers and suppliers to risks of misuse of confidential information, manipulation and destruction of data, production downtimes and operations disruptions, which in turn could adversely affect our reputation, competitive position, business or results of operations. While we have taken reasonable steps to protect the Company from cybersecurity risks and security breaches (including enhancing our firewall, workstation, email security and network monitoring and alerting capabilities, and training employees around phishing, malware and other cybersecurity risks), and we have policies and procedures to prevent or limit the impact of systems failures, interruptions, and security breaches, there can be no assurance that such events will not occur or that they will be adequately addressed if they do. Although we rely on commonly used security and processing systems to provide the security and authentication necessary to effect the secure transmission of data, these precautions may not protect our systems from all potential compromises or breaches of security.
Work stoppages or similar difficulties could significantly disrupt our operations, reduce our revenues and materially affect our earnings.
A work stoppage at one or more of our facilities could have a material adverse effect on our business, financial condition and results of operations. As of December 31, 2019, approximately 58% of our employees were covered under two collective bargaining agreements. The agreement that expires in September 2021 covers approximately 57% of our employees. The collective bargaining agreement expiring in December 2022 related to the scrap processing facility that was divested in January 2020. Any failure to negotiate and conclude new collective bargaining agreements with the unions when the existing agreements expire could cause work interruptions or stoppages. Also, if one or more of our customers were to experience a work stoppage, that customer may halt or limit purchases of our products, which could have a material adverse effect on our business, financial condition and results of operations.
10
We are subject to a wide variety of domestic and foreign laws and regulations that could adversely affect our results of operations, cash flow or financial condition.
We are subject to a wide variety of domestic and foreign laws and regulations, and legal compliance risks, including securities laws, tax laws, employment and pension-related laws, competition laws, U.S. and foreign export and trading laws, privacy laws and laws governing improper business practices. We are affected by new laws and regulations, and changes to existing laws and regulations, including interpretations by courts and regulators. With respect to tax laws, with the finalization of specific actions (Actions) contained within the Organization for Economic Development and Cooperation’s (OECD) Base Erosion and Profit study, many OECD countries have acknowledged their intent to implement the Actions and update their local tax regulations. The extent, if any, to which countries in which we operate adopt and implement the Actions could affect our effective tax rate and our future results from non-U.S. operations.
Compliance with the laws and regulations described above or with other applicable foreign, federal, state, and local laws and regulations currently in effect or that may be adopted in the future could materially adversely affect our competitive position, operating results, financial condition and liquidity.
If we are unable to attract and retain key personnel, our business could be materially adversely affected.
Our business substantially depends on the continued service of key members of our management. The loss of the services of a significant number of members of our management could have a material adverse effect on our business. Modern steel-making uses specialized techniques and advanced equipment that requires experienced engineers and skilled laborers. Our future success will depend on our ability to attract and retain such highly skilled personnel, as well as finance, marketing and senior management professionals. Competition for these employees is intense, and we could experience difficulty from time to time in hiring and retaining the personnel necessary to support our business. If we do not succeed in retaining our current employees and attracting new high-quality employees, our business could be materially adversely affected.
We may not realize the improved operating results that we anticipate from past and future acquisitions and we may experience difficulties in integrating acquired businesses.
We may seek to grow, in part, through strategic acquisitions and joint ventures, which are intended to complement or expand our businesses. These acquisitions could involve challenges and risks. In the event that we do not successfully integrate these acquisitions into our existing operations so as to realize the expected return on our investment, our results of operations, cash flows or financial condition could be adversely affected.
We may not be able to execute successfully on our business strategies or achieve the intended results
Our business strategy includes driving organizational changes to reduce costs and enhance profitable and sustainable growth. We have taken company-wide actions including the restructuring of the business support functions and the evaluation of non-core assets. If we are unsuccessful in executing on our business strategies, it could negatively impact profitability and liquidity, requiring us to alter our strategy.
Our ability to use our net operating loss, interest, and credit carryforwards to offset future taxable income may be subject to certain limitations.
As of December 31, 2019, we have loss carryforwards totaling $370.1 million (of which $314.9 million relates to the U.S. and $55.2 million relates to various non-U.S. jurisdictions), having various expiration dates, as well as certain credit carryforwards. The majority of the non-U.S. loss carryforwards represent local country net operating losses for entities treated as branches of TimkenSteel under U.S. tax law. As of December 31, 2019, TimkenSteel had a gross deferred tax asset for disallowed business interest in the U.S. of $25.2 million, which carries forward indefinitely. Operating losses generated in the U.S. resulted in a decrease in the carrying value of our U.S. deferred tax liability to the point of a net U.S. deferred tax asset at December 31, 2016. At that time, we assessed, based upon operating performance in the U.S. and industry conditions that it was more likely than not we would not realize a portion of our U.S. deferred tax assets. The Company recorded a valuation allowance in 2016 and remained in a valuation allowance position in 2019. Going forward, the need to maintain valuation allowances against deferred tax assets in the U.S. and other affected countries will cause variability in our effective tax rate. We will maintain a valuation allowance against our deferred tax assets in the U.S. and applicable foreign countries until sufficient positive evidence exists to eliminate them. Our ability to utilize our net operating loss, interest, and credit carryforwards is dependent upon our ability to generate taxable income in future periods and may be limited due to restrictions imposed on utilization of net operating loss, interest, and credit carryforwards under federal and state laws upon a change in ownership. Refer to “Note 8 - Income Tax Provision” in the Notes to the Consolidated Financial Statements for more information.
11
Section 382 and Section 383 of the Internal Revenue Code of 1986, as amended (the Code), provide an annual limitation on our ability to utilize our U.S. net operating loss and credit carryforwards against future U.S. taxable income in the event of a change in ownership, as defined in the Code, which could result from one or more transactions involving our shares, including transactions that are outside of our control, as well as the issuance of shares upon conversion of our 6.00% Convertible Senior Notes due 2021 (Convertible Notes). Accordingly, such transactions could adversely impact our ability to offset future tax liabilities and, therefore, adversely affect our financial condition, net income and cash flow. Refer to “Note 14 - Financing Arrangements” in the Notes to the Consolidated Financial Statements for more information.
Risks related to our debt
Our substantial debt could adversely affect our financial health and we may not be able to generate sufficient cash to service our debt.
We have substantial debt and, as a result, we have significant debt service obligations. As of December 31, 2019, we had outstanding debt of approximately $168.6 million. Our debt may:
• | make it more difficult for us to satisfy our financial obligations under our indebtedness and our contractual and commercial commitments and increase the risk that we may default on our debt obligations; |
• | require us to use a substantial portion of our cash flow from operations to pay interest and principal on our debt, which would reduce the funds available for working capital, capital expenditures and other general corporate purposes; |
• | limit our ability to obtain additional financing for working capital, capital expenditures, acquisitions and other investments, or general corporate purposes, which may limit the ability to execute our business strategy and affect the market price of our common shares; |
• | heighten our vulnerability to downturns in our business, our industry or in the general economy and restrict us from exploiting business opportunities or making acquisitions; |
• | place us at a competitive disadvantage compared to those of our competitors that may have less debt; |
• | limit management’s discretion in operating our business; |
• | limit our flexibility in planning for, or reacting to, changes in our business, the industry in which we operate or the general economy; and |
• | result in higher interest expense if interest rates increase and we have outstanding floating rate borrowings. |
If our cash flows and capital resources are insufficient to fund our debt service obligations, we may be forced to reduce or delay investments and capital expenditures, or to sell assets, seek additional capital or restructure or refinance our debt. These alternative measures may not be successful and may not permit us to meet our scheduled debt service obligations. If our operating results and available cash are insufficient to meet our debt service obligations, we could face substantial liquidity problems and might be required to dispose of material assets or operations to meet our debt service and other obligations. We may not be able to consummate those dispositions or to obtain the proceeds that we could realize from them, and these proceeds may not be adequate to meet any debt service obligations then due. Further, we may need to refinance all or a portion of our debt on or before maturity, and we cannot assure you that we will be able to refinance any of our debt on commercially reasonable terms or at all.
Restrictive covenants in the agreements governing our other indebtedness may restrict our ability to operate our business, which may affect the market price of our common shares.
On October 15, 2019, the Company, as borrower, and certain domestic subsidiaries of the Company, as subsidiary guarantors, entered into a Third Amended and Restated Credit Agreement (the Amended Credit Agreement), with JP Morgan Chase Bank, N.A., as administrative agent (the Administrative Agent), Bank of America, N.A., as syndication agent, and the other lenders party thereto (collectively, the Lenders), which further amended and restated the Company’s existing Credit Agreement dated as of January 26, 2018.
A breach of any of our covenants in the agreements governing our indebtedness could result in a default, which could allow the lenders to declare all amounts outstanding under the applicable debt immediately due and payable and which may affect the market price of our common shares. We may also be prevented from taking advantage of business opportunities that arise because of the limitations imposed on us by the restrictive covenants under our indebtedness. Refer to “Note 14 - Financing Arrangements” in the Notes to the Consolidated Financial Statements for more detail on the Amended Credit Agreement.
12
The conditional conversion feature of the Convertible Notes, if triggered, may adversely affect our financial condition and operating results.
In the event the conditional conversion feature of the Convertible Notes (refer to “Note 14 - Financing Arrangements” in the Notes to the Consolidated Financial Statements) is triggered, holders of Convertible Notes will be entitled to convert the Convertible Notes at any time during specified periods at their option. If one or more holders elect to convert their Convertible Notes, unless we elect to satisfy our conversion obligation by delivering solely our common shares (other than paying cash in lieu of delivering any fractional share), we would be required to settle a portion or all of our conversion obligation through the payment of cash, which could adversely affect our liquidity. In addition, under certain circumstances, we could be required under applicable accounting rules to reclassify all or a portion of the outstanding principal of the Convertible Notes as a current rather than long-term liability, which would result in a material reduction of our net working capital.
Risks related to our common shares
The price of our common shares may fluctuate significantly.
The market price of our common shares may fluctuate significantly in response to many factors, including:
• | actual or anticipated changes in operating results or business prospects; |
• | changes in financial estimates by securities analysts; |
• | an inability to meet or exceed securities analysts’ estimates or expectations; |
• | conditions or trends in our industry or sector; |
• | the performance of other companies in our industry or sector and related market valuations; |
• | announcements by us or our competitors of significant acquisitions, strategic partnerships, divestitures, joint ventures or other strategic initiatives; |
• | general financial, economic or political instability; |
• | hedging or arbitrage trading activity in our common shares; |
• | changes in interest rates; |
• | capital commitments; |
• | additions or departures of key personnel; and |
• | future sales of our common shares or securities convertible into, or exchangeable or exercisable for, our common shares. |
Many of the factors listed above are beyond our control. These factors may cause the market price of our common shares to decline, regardless of our financial condition, results of operations, business or prospects.
Provisions in our corporate documents and Ohio law could have the effect of delaying, deferring or preventing a change in control of us, even if that change may be considered beneficial by some of our shareholders, which could reduce the market price of our common shares.
The existence of some provisions of our articles of incorporation and regulations and Ohio law could have the effect of delaying, deferring or preventing a change in control of us that a shareholder may consider favorable. These provisions include:
• | providing that our board of directors fixes the number of members of the board; |
• | providing for the division of our board of directors into three classes with staggered terms; |
• | establishing advance notice requirements for nominations of candidates for election to our board of directors or for proposing matters that can be acted on by shareholders at shareholder meetings; and |
• | authorizing the issuance of “blank check” preferred shares, which could be issued by our board of directors to increase the number of outstanding securities of ours with voting rights and thwart a takeover attempt. |
13
As an Ohio corporation, we are subject to Chapter 1704 of the Ohio Revised Code. Chapter 1704 prohibits certain corporations from engaging in a “Chapter 1704 transaction” (described below) with an “interested shareholder” for a period of three years after the date of the transaction in which the person became an interested shareholder, unless, among other things, prior to the interested shareholder’s share acquisition date, the directors of the corporation have approved the transaction or the purchase of shares on the share acquisition date.
After the three-year moratorium period, the corporation may not consummate a Chapter 1704 transaction unless, among other things, it is approved by the affirmative vote of the holders of at least two-thirds of the voting power in the election of directors and the holders of a majority of the voting shares, excluding all shares beneficially owned by an interested shareholder or an affiliate or associate of an interested shareholder, or the shareholders receive certain minimum consideration for their shares. A Chapter 1704 transaction includes certain mergers, sales of assets, consolidations, combinations and majority share acquisitions involving an interested shareholder. An interested shareholder is defined to include, with limited exceptions, any person who, together with affiliates and associates, is the beneficial owner of a sufficient number of shares of the corporation to entitle the person, directly or indirectly, alone or with others, to exercise or direct the exercise of 10% or more of the voting power in the election of directors after taking into account all of the person’s beneficially owned shares that are not then outstanding.
We are also subject to Section 1701.831 of the Ohio Revised Code, which requires the prior authorization of the shareholders of certain corporations in order for any person to acquire, either directly or indirectly, shares of that corporation that would entitle the acquiring person to exercise or direct the exercise of 20% or more of the voting power of that corporation in the election of directors or to exceed specified other percentages of voting power. The acquiring person may complete the proposed acquisition only if the acquisition is approved by the affirmative vote of the holders of at least a majority of the voting power of all shares entitled to vote in the election of directors represented at the meeting, excluding the voting power of all “interested shares.” Interested shares include any shares held by the acquiring person and those held by officers and directors of the corporation.
We believe these provisions protect our shareholders from coercive or otherwise unfair takeover tactics by requiring potential acquirors to negotiate with our board of directors and by providing our board of directors with more time to assess any acquisition proposal, and are not intended to make our Company immune from takeovers. However, these provisions apply even if the offer may be considered beneficial by some shareholders and could delay, defer or prevent an acquisition that our board of directors determines is not in the best interests of our Company and our shareholders, which under certain circumstances could reduce the market price of our common shares.
We may issue preferred shares with terms that could dilute the voting power or reduce the value of our common shares.
Our articles of incorporation authorize us to issue, without the approval of our shareholders, one or more classes or series of preferred shares having such designation, powers, preferences and relative, participating, optional and other special rights, including preferences over our common shares respecting dividends and distributions, as our board of directors generally may determine. The terms of one or more classes or series of preferred shares could dilute the voting power or reduce the value of our common shares. For example, we could grant holders of preferred shares the right to elect some number of our directors in all events or on the happening of specified events or the right to veto specified transactions. Similarly, the repurchase or redemption rights or liquidation preferences we could assign to holders of preferred shares could affect the residual value of the common shares.
14
Risks Relating to the Spinoff
We remain subject to continuing contingent liabilities of The Timken Company following the spinoff.
There are several significant areas where the liabilities of The Timken Company may yet become our obligations. The separation and distribution agreement and employee matters agreement generally provide that we are responsible for substantially all liabilities that relate to our steel business activities, whether incurred prior to or after the spinoff, as well as those liabilities of The Timken Company specifically assumed by us. In addition, under the Internal Revenue Code (Code) and the related rules and regulations, each corporation that was a member of The Timken Company consolidated tax reporting group during any taxable period or portion of any taxable period ending on or before the completion of the spinoff is jointly and severally liable for the federal income tax liability of the entire The Timken Company consolidated tax reporting group for that taxable period. In connection with the spinoff, we entered into a tax sharing agreement with The Timken Company that allocated the responsibility for prior period taxes of The Timken Company consolidated tax reporting group between us and The Timken Company. However, if The Timken Company is unable to pay any prior period taxes for which it is responsible, we could be required to pay the entire amount of such taxes. Other provisions of federal law establish similar liability for other matters, including laws governing tax-qualified pension plans as well as other contingent liabilities.
Potential liabilities associated with certain assumed obligations under the tax sharing agreement cannot be precisely quantified at this time.
Under the tax sharing agreement with The Timken Company, we are responsible generally for all taxes paid after the spinoff attributable to us or any of our subsidiaries, whether accruing before, on or after the spinoff. We also have agreed to be responsible for, and to indemnify The Timken Company with respect to, all taxes arising as a result of the spinoff (or certain internal restructuring transactions) failing to qualify as transactions under Sections 368(a) and 355 of the Code for U.S. federal income tax purposes (which could result, for example, from a merger or other transaction involving an acquisition of our shares) to the extent such tax liability arises as a result of any breach of any representation, warranty, covenant or other obligation by us or certain affiliates made in connection with the issuance of the tax opinion relating to the spinoff or in the tax sharing agreement. As described above, such tax liability would be calculated as though The Timken Company (or its affiliate) had sold its common shares of our Company in a taxable sale for their fair market value, and The Timken Company (or its affiliate) would recognize taxable gain in an amount equal to the excess of the fair market value of such shares over its tax basis in such shares. That tax liability could have a material adverse effect on our Company. As of December 31, 2019, there are no known or recorded liabilities associated with the spinoff.
ITEM 1B. UNRESOLVED STAFF COMMENTS
None.
ITEM 2. PROPERTIES
We are headquartered in Canton, Ohio, at a facility we own in fee. We have facilities in three countries: U.S., China and Mexico. We lease sales offices in these countries.
We have manufacturing facilities at multiple locations in the U.S. These manufacturing facilities are located in Akron, Canton and Eaton, Ohio; Houston, Texas; and Columbus, North Carolina. In addition to these manufacturing facilities, we own or lease warehouses and distribution facilities in the U.S., Mexico and China. The aggregate floor area of these facilities is 3.8 million square feet, of which approximately 290,000 square feet is leased and the rest is owned in fee. The buildings occupied by us are principally made of brick, steel, reinforced concrete and concrete block construction.
Our facilities vary in age and condition, and each of them has an active maintenance program to ensure a safe operating environment and to keep the facilities in good condition. We believe our facilities are in satisfactory operating condition and are suitable and adequate to conduct our business and support future growth.
Please refer to Management’s Discussion and Analysis of Financial Condition and Results of Operations for further discussion of our melt capacity utilization.
15
ITEM 3. LEGAL PROCEEDINGS
We are involved in various claims and legal actions arising in the ordinary course of business. In the opinion of our management, the ultimate disposition of these matters will not have a material adverse effect on our consolidated financial position, results of operations or cash flows.
Canton, Ohio U.S. EPA Notice of Violation
The U.S. Environmental Protection Agency (EPA) issued two related Notices of Violation (NOV) to TimkenSteel on August 5, 2014 and November 2, 2015. The EPA alleges violations under the Clean Air Act based on purported violations of permitted emission limits and engineering requirements at TimkenSteel’s Faircrest and Harrison facilities in Canton, Ohio. TimkenSteel disputes many of EPA’s allegations but is working cooperatively with EPA and the U.S. Department of Justice to resolve the government’s claims. Negotiations to resolve the NOVs are ongoing, but it is not anticipated that the ultimate resolution of the NOVs will have a material adverse effect on our consolidated financial position, results of operations or cash flows.
ITEM 4A. EXECUTIVE OFFICERS OF THE REGISTRANT
The executive officers of our Company as of February 25, 2020, are as follows:
Name | Age | Current Position | |
Terry L. Dunlap | 60 | Interim Chief Executive Officer and President | |
Kristopher R. Westbrooks | 41 | Executive Vice President and Chief Financial Officer | |
Frank A. DiPiero | 63 | Executive Vice President, General Counsel and Secretary | |
Thomas D. Moline | 57 | Executive Vice President, Commercial Operations | |
William P. Bryan | 60 | Executive Vice President, Manufacturing, Supply Chain and Information Technology | |
Terry L. Dunlap is the interim Chief Executive Officer and President. Mr. Dunlap’s experience covers many aspects of the metals industry, including sales, marketing, manufacturing, supply chain, logistics, procurement and information technology. Mr. Dunlap has been the principal at Sweetwater LLC, a consulting and investing business with a focus on manufacturing and technology, since 2015. Prior to founding Sweetwater LLC, Mr. Dunlap spent 31 years with Allegheny Technologies Inc., a diversified specialty metals producer, serving in various positions, most recently as executive vice president of ATI’s flat-rolled products group from 2011 until his retirement in December 2014. He earned his bachelor’s degree in Marketing from Indiana University of Pennsylvania.
Kristopher R. Westbrooks is Executive Vice President and Chief Financial Officer. Previously, Mr. Westbrooks served from April 2015 until August 2018 as Vice President, Corporate Controller and Chief Accounting Officer at A. Schulman, Inc., a global supplier of high-performance plastic compounds, composites and powders. From 2011 until his appointment as Chief Accounting Officer in 2015, Mr. Westbrooks held various finance roles of increasing responsibility at A. Schulman, Inc. He earned his bachelor’s of science degree in business and master’s degree in accountancy from Miami University in Ohio and is a certified public accountant.
Frank A. DiPiero is Executive Vice President, General Counsel and Secretary. Mr. DiPiero joined The Timken Company in 2014. Previously, Mr. DiPiero was Associate General Counsel, UTC Aerospace Systems of United Technologies Corporation, a provider of technology products and services to the global aerospace and building systems industries; Vice President, Corporate Secretary and Segment Counsel, Electronic Systems of Goodrich Corporation; and Segment Counsel, Actuation and Landing Systems of Goodrich Corporation. Mr. DiPiero earned his bachelor’s degree from Youngstown State University and J.D. from The University of Toledo College of Law.
Thomas D. Moline is Executive Vice President of Commercial Operations. Prior to assuming his current role in 2017, Mr. Moline served as Executive Vice President of Manufacturing, where he led steel plant operations. Since joining The Timken Company in 1984, Mr. Moline held a variety of leadership positions, including as an engineer on the team that built the Faircrest facility. He earned his bachelor’s degree in manufacturing engineering from Miami University in Ohio.
William P. Bryan is Executive Vice President of Manufacturing, Supply Chain and Information Technology. In 2017, Mr. Bryan assumed responsibility for manufacturing operations in addition to his then existing role as Executive Vice President, Supply Chain and Information Technology. Since joining The Timken Company in 1977, Mr. Bryan served in various positions related to supply chain, economics and information technology in both the U.S. and Europe. He holds bachelor's and master's degrees in
16
business administration from Kent State University. Mr. Bryan also completed the Executive Development for Global Excellence (EDGE) program at the University of Virginia's Darden School of Business.
17
PART II.
ITEM 5. MARKET FOR REGISTRANT’S COMMON EQUITY, RELATED STOCKHOLDER MATTERS AND ISSUER PURCHASES OF EQUITY SECURITIES
Quarterly Common Stock Prices and Cash Dividends Per Share:
Our common shares are traded on the New York Stock Exchange (NYSE) under the symbol “TMST.” The estimated number of record holders of our common shares at December 31, 2019 was 3,559.
Our Amended Credit Agreement places certain limitations on the payment of cash dividends. Please refer to “Note 14 - Financing Arrangements” in the Notes to the Consolidated Financial Statements and the Results of Operations for additional discussion.
Issuer Purchases of Common Shares:
Our Amended Credit Agreement places certain limitations on our ability to purchase our common shares. Please refer to Management’s Discussion and Analysis of Financial Condition and Results of Operations for additional discussion.
Securities Authorized for Issuance Under Equity Compensation Plans:
The following table sets forth certain information as of December 31, 2019, regarding the only equity compensation plan maintained by us on that date, the TimkenSteel Corporation Amended and Restated 2014 Equity and Incentive Compensation Plan (the Equity Plan).
(a) | (b) | (c) | ||||||||
Plan Category | Number of securities to be issued upon exercise of outstanding options, warrants and rights (1) | Weighted-average exercise price of outstanding options, warrants and rights (2) | Number of securities remaining available for future issuance under equity reflected in column (a) (3) compensation plans (excluding securities) | |||||||
Equity compensation plans approved by security holders(4) | 3,850,330 | $20.64 | 2,430,868 | |||||||
Equity compensation plans not approved by security holders | — | — | — | |||||||
Total | 3,850,330 | $20.64 | 2,430,868 | |||||||
(1) The amount shown in column (a) includes the following: nonqualified stock options - 2,641,570; deferred shares - 181,759; performance-based restricted stock units - 105,273; and time-based restricted stock units - 921,728 (which includes 658,642 cliff-vested restricted stock units).
(2) The weighted average exercise price in column (b) includes nonqualified stock options only.
(3) The amount shown in column (c) represents common shares remaining available under the Equity Plan, under which the Compensation Committee is authorized to make awards of option rights, appreciation rights, restricted shares, restricted stock units, deferred shares, performance shares, performance units and cash incentive awards. Awards may be credited with dividend equivalents payable in the form of common shares. Under the Equity Plan, for any award that is not an option right or a stock appreciation right, 2.46 common shares for awards granted before April 28, 2016 and 2.50 common shares for awards granted on or after April 28, 2016, are subtracted from the maximum number of common shares available under the plan for every common share issued under the award. For awards of option rights and stock appreciation rights, however, only one common share is subtracted from the maximum number of common shares available under the plan for every common share granted.
(4) The Company also maintains the Director Deferred Compensation Plan pursuant to which non-employee Directors may defer receipt of common shares authorized for issuance under the Equity Plan. The table does not include separate information about this plan because it merely provides for the deferral, rather than the issuance, of common shares.
18
Performance Graph:
The following graph compares the cumulative total return of our common shares with the cumulative total return of the Standard & Poor’s (S&P) MidCap 400 Index and S&P Steel Group Index, assuming $100 was invested and that cash dividends were reinvested for the period from July 1, 2014 through December 31, 2019.
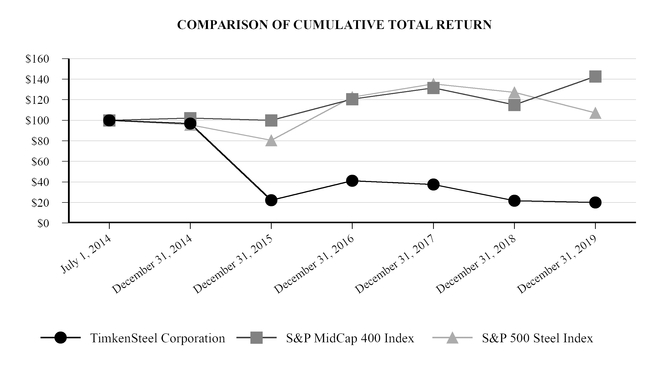
Date | TimkenSteel Corporation | S&P MidCap 400 Index | S&P 500 Steel Index | ||||||||
July 1, 2014 | $100.00 | $100.00 | $100.00 | ||||||||
December 31, 2014 | $96.71 | $102.11 | $95.49 | ||||||||
December 31, 2015 | $22.29 | $99.89 | $80.49 | ||||||||
December 31, 2016 | $41.18 | $120.61 | $122.43 | ||||||||
December 31, 2017 | $37.59 | $131.51 | $135.49 | ||||||||
December 31, 2018 | $21.63 | $115.08 | $127.04 | ||||||||
December 31, 2019 | $19.95 | $142.75 | $107.22 | ||||||||
This performance graph shall not be deemed to be “soliciting material” or to be “filed” with the SEC or subject to Regulation 14A or 14C, or to the liabilities of Section 18 of the Exchange Act.
19
ITEM 6. SELECTED FINANCIAL DATA
Year Ended December 31, | |||||||||||||||||||
(dollars and shares in millions, except per share data) | 2019 | 2018 (3) | 2017 (3) | 2016 (3) | 2015(3) | ||||||||||||||
Statement of Operations Data: | |||||||||||||||||||
Net sales | $1,208.8 | $1,610.6 | $1,329.2 | $869.5 | $1,106.2 | ||||||||||||||
Net (loss) income | (110.0 | ) | (10.0 | ) | (31.3 | ) | (105.5 | ) | (45.0 | ) | |||||||||
Earnings (loss) per share(1): | |||||||||||||||||||
Basic | ($2.46 | ) | ($0.22 | ) | ($0.70 | ) | ($2.39 | ) | ($1.01 | ) | |||||||||
Diluted | ($2.46 | ) | ($0.22 | ) | ($0.70 | ) | ($2.39 | ) | ($1.01 | ) | |||||||||
Cash dividends declared per share | $— | $— | $— | $— | $0.42 | ||||||||||||||
Weighted average shares outstanding, diluted | 44.8 | 44.6 | 44.4 | 44.2 | 44.5 | ||||||||||||||
Balance Sheet Data: | |||||||||||||||||||
Total assets | $1,085.2 | $1,275.3 | $1,212.6 | $1,069.9 | $1,142.5 | ||||||||||||||
Long-term debt | 168.6 | 189.1 | 165.3 | 136.6 | 200.2 | ||||||||||||||
Total shareholders’ equity | 563.1 | 612.9 | 616.7 | 597.4 | 682.0 | ||||||||||||||
Other Data: | |||||||||||||||||||
Book value per share(2) | $12.57 | $13.74 | $13.89 | $13.52 | $15.33 | ||||||||||||||
(1) See “Note 9 - Earnings (Loss) Per Share” in the Notes to the Consolidated Financial Statements for additional information.
(2) Book value per share is calculated by dividing total shareholders’ equity (as of the period end) by the weighted average shares outstanding, diluted.
(3) The table reflects the change in accounting principle from the last-in, first-out method to the first-in, first-out method of accounting for inventory for 2018 and 2017. The years 2016 and 2015 have not been adjusted to reflect the change and therefore are not comparable. See “Note 1 - Basis of Presentation” in the Notes to the Consolidated Financial Statements for additional information.
20
ITEM 7. MANAGEMENT’S DISCUSSION AND ANALYSIS OF FINANCIAL CONDITION AND RESULTS OF OPERATIONS
(dollars in millions, except per share data)
Business Overview
We manufacture alloy steel, as well as carbon and micro-alloy steel, with an annual melt capacity of approximately 2 million tons and shipment capacity of 1.5 million tons. Our portfolio includes special bar quality (SBQ) bars, seamless mechanical tubing (tubes), value-added solutions such as precision steel components, and billets. In addition, we supply machining and thermal treatment services and manage raw material recycling programs, which are used as a feeder system for our melt operations. Our products and services are used in a diverse range of demanding applications in the following market sectors: automotive; oil and gas; industrial equipment; mining; construction; rail; defense; heavy truck; agriculture; power generation; and OCTG.
SBQ steel is made to restrictive chemical compositions and high internal purity levels and is used in critical mechanical applications. We make these products from nearly all recycled steel, using our expertise in raw materials to create custom steel products. We focus on creating tailored products and services for our customers’ most demanding applications. Our engineers are experts in both materials and applications, so we can work closely with each customer to deliver flexible solutions related to our products as well as to their applications and supply chains.
The SBQ bar, tube, and billet production processes take place at our Canton, Ohio manufacturing location. This location accounts for all of the SBQ bars, seamless mechanical tubes and billets we produce and includes three manufacturing facilities: the Faircrest, Harrison, and Gambrinus facilities. Our value-added solutions production processes take place at three downstream manufacturing facilities: TimkenSteel Material Services (Houston, Texas), Tryon Peak (Columbus, North Carolina), and St. Clair (Eaton, Ohio). Many of the production processes are integrated, and the manufacturing facilities produce products that are sold in all of our market sectors. As a result, investments in our facilities and resource allocation decisions affecting our operations are designed to benefit the overall business, not any specific aspect of the business.
In the fourth quarter of 2019, our Board of Directors approved a plan to close our TimkenSteel Material Services facility during the first quarter of 2020. See “Note 6 - Disposition of Non-Core Assets” in the Notes to the Consolidated Financial Statements for additional information.
We conduct our business activities and report financial results as one business segment. The presentation of financial results as one reportable segment is consistent with the way we operate our business and is consistent with the manner in which the CODM evaluates performance and makes resource and operating decisions for the business as described above. Furthermore, the Company notes that monitoring financial results as one reportable segment helps the CODM manage costs on a consolidated basis, consistent with the integrated nature of our operations.
Markets We Serve
We sell products and services that are used in a diverse range of demanding applications around the world. No one customer accounted for 10% or more of net sales in 2019.
Key indicators for our market include the U.S. light vehicle production Seasonally Adjusted Annual Rate, oil and gas rig count activity and U.S. footage drilled, and industrial production for agriculture and construction markets, distribution, and mining and oil field machinery products. In addition, we closely monitor the Purchasing Managers’ Index, which is a leading indicator for our overall business.
Impact of Raw Material Prices
In the ordinary course of business, we are exposed to the volatility of the costs of our raw materials. Whenever possible, we manage our exposure to commodity risks primarily through the use of supplier pricing agreements that enable us to establish the purchase prices for certain inputs that are used in our manufacturing process. We utilize a raw material surcharge mechanism when pricing products to our customers, which is designed to mitigate the impact of increases or decreases in raw material costs, although generally with a lag effect. This timing effect can result in raw material spread whereby costs can be over- or under-recovered in certain periods. While the surcharge generally protects gross profit, it has the effect of diluting gross margin as a percent of sales.
Results of Operations
During the fourth quarter of 2019, TimkenSteel elected to change its method for valuing its inventories that previously used the last-in, first-out (LIFO) method to the first-in, first-out (FIFO) method. Total inventories accounted for under the LIFO
21
method represented approximately 70% of the Company's total inventories prior to this change in method. The Company believes that the FIFO method is preferable as it improves comparability with our peers, more closely resembles the physical flow of our inventory, and aligns with how the Company internally manages the business. The effects of the change in accounting principle have been retrospectively applied to all periods presented in Item 7. Refer to “Note 1 - Basis of Presentation” in the Notes to the Consolidated Financial Statements.
Net Sales
The charts below present net sales and shipments for the years ended December 31, 2019, 2018 and 2017.
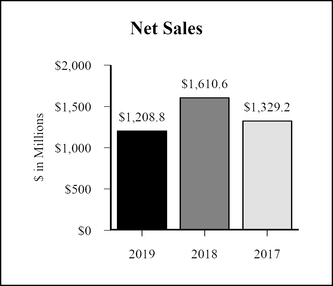
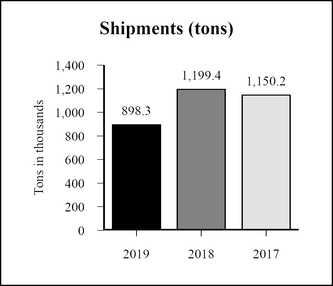
Net sales for the year ended December 31, 2019 were $1,208.8 million, a decrease of $401.8 million, or 24.9%, compared to the year ended December 31, 2018. The decrease was due to a reduction in volume of 301 thousand ship tons, resulting in a decrease in net sales of $311.9 million and lower raw material surcharge revenue of $151.9 million. The primary driver in the decrease in volume was lower customer demand across all key end markets. We also experienced a loss in sales of approximately $10 million due to a strike at one of our automotive customers. The decrease in surcharges was primarily due to lower volumes and decreasing scrap prices throughout 2019. These decreases were partially offset by favorable price/mix of $60.9 million, as the Company realized the benefit of previous price increases and lower billet product shipments. Excluding surcharges, net sales decreased $249.9 million, or 20.7%.
Net sales for the year ended December 31, 2018 were $1,610.6 million, an increase of $281.4 million or 21.2% compared to the year ended December 31, 2017. Excluding surcharges, net sales increased $167.4 million, or 16.1%. The increase was due to favorable price/mix of $107.0 million and higher volumes of $61.0 million, as we focused efforts to sell our higher margin products. This resulted in net sales per ton increasing 16.2% from 2017. For the year ended December 31, 2018, ship tons increased by 49 thousand tons, or 4.3%, compared to the year ended December 31, 2017, due primarily to higher demand in industrial and energy end markets, partially offset by a reduction in billet shipments.
22
Gross Profit
The chart below presents the drivers of the gross profit variance from the year ended December 31, 2019 to December 31, 2018.
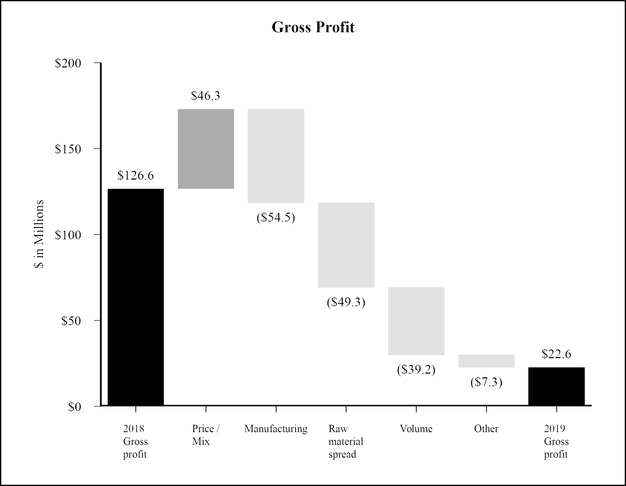
Gross profit for the year ended December 31, 2019 decreased $104.0 million, or 82.1%, compared with the year ended December 31, 2018. The decrease was driven primarily by unfavorable manufacturing costs, raw material spread, lower volumes and a facility phase down. Higher manufacturing costs as a percentage of sales in 2019 were primarily driven by a decline in melt utilization to 50% from 74% in 2018, resulting in unfavorable fixed-cost leverage. Raw material spread was a headwind due to a decline in the No.1 Busheling scrap index and lower volumes during the year ended December 31, 2019 compared with the year end December 31, 2018. Volume was a decrease for the year ended December 31, 2019 primarily due to weaker demand across all end markets, compared with December 31, 2018. The other category includes the non-cash accounting implications of the Company’s announced closure of its Houston, Texas facility during the fourth quarter of 2019, as a result of which we recorded a $4.8 million charge to write-down inventory and $2.8 million of accelerated depreciation. The facility was subsequently closed in the first quarter of 2020. These decreases were partially offset by improved price/mix. Price/mix was favorable due to increased pricing in 2019 compared with 2018, and a reduction in billet shipments.
23
The chart below presents the drivers of the gross profit variance from the year ended December 31, 2018 to December 31, 2017.
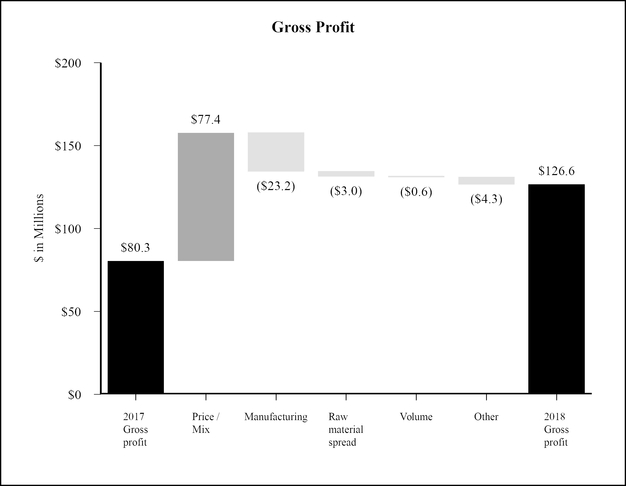
Gross profit for the year ended December 31, 2018 increased $46.3 million, or 57.7%, compared to the year ended December 31, 2017. The increase was driven primarily by favorable price/mix due to higher demand in our end markets, and our focus on selling higher margin products. The favorable price/mix was partially offset by increased manufacturing costs. Higher manufacturing costs in 2018 were driven primarily by consumables inflation and higher maintenance costs, partially offset by improved fixed-cost leverage and the benefit of continuous improvement activities. The favorable impact of higher volume was more than offset by an increase in freight expense. Melt utilization for the year ended December 31, 2018 was 74% compared to 73% as of year ended December 31, 2017.
24
Selling, General and Administrative Expenses
The charts below present selling, general and administrative (SG&A) expense for the years ended December 31, 2019, 2018 and 2017.
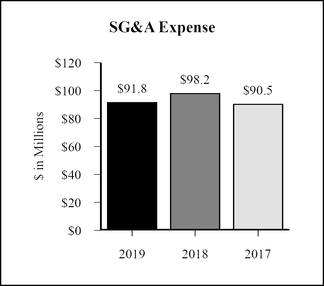
SG&A expense for the year ended December 31, 2019 decreased by $6.4 million, or 6.5%, compared with the year ended December 31, 2018. The decline in 2019 is primarily the result of the Company’s profitability improvement plans that targeted, among other areas, a reduction in salaried employees, as well as lower professional services fees and post-retirement benefit costs. These reductions were partially offset by executive severance of $5.6 million. Additionally, variable compensation decreased in 2019.
SG&A expense for the year ended December 31, 2018 increased $7.7 million, or 8.5%, compared to the year ended December 31, 2017. The increase was due primarily to an increase in variable compensation of $1.5 million and executive severance of $1.7 million.
Restructuring Charges
During 2019, TimkenSteel made organizational changes to enhance profitable and sustainable growth. These company-wide actions included the restructuring of its business support functions, the reduction of management layers throughout the organization, the announced closure of the TimkenSteel Material Services (TMS) facility in Houston, Texas (See “Note 6 - Disposition of Non-Core Assets”), and other actions to further improve the Company’s overall cost structure. Through these restructuring efforts, the Company eliminated approximately 15% of its salaried workforce, or approximately 150 salaried positions. As a result of the headcount reduction, TimkenSteel recognized restructuring charges of $8.6 million, consisting of severance and employee-related benefits. The Company expects to realize annual savings of approximately $18 million beginning in 2020 as a result of these actions. Refer to “Note 5 - Restructuring Charges” in the Notes to the Consolidated Financial Statements for additional information. There were no restructuring charges during the years ended December 31, 2018 and 2017.
Interest Expense
Interest expense for the year ended December 31, 2019 was $15.7 million, a decrease of $1.4 million, compared with the year ended December 31, 2018. The decrease in interest expense was primarily due to a reduction in outstanding borrowings under the credit facility and a lower borrowing cost following the October 2019 credit agreement refinancing. Interest expense for the year ended December 31, 2018 was $17.1 million, an increase of $2.3 million from 2017. The increase was primarily due to higher average outstanding revolver debt and the write-off of deferred financing costs of $0.7 million associated with amending the previous credit agreement and redeeming the revenue refunding bonds. Refer to “Note 14 - Financing Arrangements “ in the Notes to the Consolidated Financial Statements for additional information.
25
Other Income (Expense), net
Year Ended December 31, | |||||||||||
2019 | 2018 | $ Change | |||||||||
Pension and postretirement non-service benefit income | $17.5 | $25.2 | ($7.7 | ) | |||||||
Loss from remeasurement of benefit plans | (40.6 | ) | (43.5 | ) | 2.9 | ||||||
Foreign currency exchange gain (loss) | — | (0.2 | ) | 0.2 | |||||||
Miscellaneous income (expense) | (0.2 | ) | (0.1 | ) | (0.1 | ) | |||||
Total other income (expense), net | ($23.3 | ) | ($18.6 | ) | ($4.7 | ) | |||||
Year Ended December 31, | |||||||||||
2018 | 2017 | $ Change | |||||||||
Pension and postretirement non-service benefit income | $25.2 | $17.5 | $7.7 | ||||||||
Loss from remeasurement of benefit plans | (43.5 | ) | (21.8 | ) | (21.7 | ) | |||||
Foreign currency exchange gain (loss) | (0.2 | ) | 0.3 | (0.5 | ) | ||||||
Miscellaneous income (expense) | (0.1 | ) | (0.1 | ) | — | ||||||
Total other income (expense), net | ($18.6 | ) | ($4.1 | ) | ($14.5 | ) | |||||
Non-service benefit income is derived from our pension and other postretirement plans. In the years ended December 31, 2019, 2018 and 2017, expected return on assets exceeded the interest cost component resulting in income, which more than offset the annual benefit plan remeasurement loss. For more details on the remeasurement, refer to “Note 15 - Retirement and Postretirement Plans” in the Notes to Consolidated Financial Statements.
Provision for Income Taxes
Year Ended December 31, | |||||||||||
2019 | 2018 | $ Change | |||||||||
Provision (benefit) for income taxes | ($16.1 | ) | $1.8 | ($17.9 | ) | ||||||
Effective tax rate | 12.8 | % | (5.9 | )% | NM | ||||||
Year Ended December 31, | |||||||||||
2018 | 2017 | $ Change | |||||||||
Provision (benefit) for income taxes | $1.8 | $1.5 | $0.3 | ||||||||
Effective tax rate | (5.9 | )% | (3.7 | )% | NM | ||||||
The majority of the Company’s tax expense is derived from foreign operations. The Company remains in a full valuation for the U.S. jurisdiction for the years ended December 31, 2019, 2018 and 2017. For the year ended December 31, 2019, the Company recorded an intraperiod tax allocation adjustment between continuing operations and other categories of comprehensive income. In periods in which the Company has a pre-tax loss from continuing operations and pre-tax income in other categories of comprehensive income, the Company must consider that income in determining the amount of tax benefit that results from a loss in continuing operations and that will be allocated to continuing operations. As a result of the intraperiod tax allocation for the year ended December 31, 2019, income tax expense of $16.7 million was recorded within other comprehensive income and a corresponding benefit was recorded to continuing operations.
26
NON-GAAP FINANCIAL MEASURES
The table below presents net sales by end market sector, adjusted to exclude raw material surcharges, which represents a financial measure that has not been determined in accordance with accounting principles generally accepted in the United States (U.S. GAAP). We believe presenting net sales by end market sector adjusted to exclude raw material surcharges provides additional insight into key drivers of net sales such as base price and product mix.
Net Sales adjusted to exclude surcharges | ||||||||||||||||
(dollars in millions, tons in thousands) | ||||||||||||||||
2019 | ||||||||||||||||
Mobile | Industrial | Energy | Other | Total | ||||||||||||
Tons | 397.6 | 348.2 | 90.6 | 61.9 | 898.3 | |||||||||||
Net Sales | $479.3 | $486.3 | $166.4 | $76.8 | $1,208.8 | |||||||||||
Less: Surcharges | 104.1 | 99.9 | 32.8 | 16.7 | 253.5 | |||||||||||
Base Sales | $375.2 | $386.4 | $133.6 | $60.1 | $955.3 | |||||||||||
Net Sales / Ton | $1,205 | $1,397 | $1,837 | $1,241 | $1,346 | |||||||||||
Base Sales / Ton | $944 | $1,110 | $1,475 | $971 | $1,063 | |||||||||||
2018 | ||||||||||||||||
Mobile | Industrial | Energy | Other | Total | ||||||||||||
Tons | 428.3 | 462.7 | 152.8 | 155.6 | 1,199.4 | |||||||||||
Net Sales | $553.9 | $637.5 | $265.6 | $153.6 | $1,610.6 | |||||||||||
Less: Surcharges | 134.4 | 161.5 | 61.2 | 48.3 | 405.4 | |||||||||||
Base Sales | $419.5 | $476.0 | $204.4 | $105.3 | $1,205.2 | |||||||||||
Net Sales / Ton | $1,293 | $1,378 | $1,738 | $987 | $1,343 | |||||||||||
Base Sales / Ton | $979 | $1,029 | $1,338 | $677 | $1,005 | |||||||||||
2017 | ||||||||||||||||
Mobile | Industrial | Energy | Other | Total | ||||||||||||
Tons | 428.1 | 413.4 | 97.0 | 211.7 | 1,150.2 | |||||||||||
Net Sales | $528.6 | $486.4 | $141.7 | $172.5 | $1,329.2 | |||||||||||
Less: Surcharges | 105.1 | 106.6 | 23.5 | 56.1 | 291.3 | |||||||||||
Base Sales | $423.5 | $379.8 | $118.2 | $116.4 | $1,037.9 | |||||||||||
Net Sales / Ton | $1,235 | $1,177 | $1,461 | $815 | $1,156 | |||||||||||
Base Sales / Ton | $989 | $919 | $1,219 | $550 | $902 | |||||||||||
27
LIQUIDITY AND CAPITAL RESOURCES
Credit Agreement
On January 26, 2018, the Company, as borrower, and certain domestic subsidiaries, as subsidiary guarantors, entered into the Second Amended and Restated Credit Agreement (Credit Agreement), with JP Morgan Chase Bank, N.A., as administrative agent, Bank of America, N.A., as syndication agent, and the other lenders party thereto, which amended and restated the Company’s credit agreement dated as of February 26, 2016.
Amended Credit Agreement
On October 15, 2019, the Company, entered into a Third Amended and Restated Credit Agreement (the Amended Credit Agreement), with JP Morgan Chase Bank, N.A. which further amends and restates the Company’s Second Amended and Restated Credit Agreement dated as of January 26, 2018.
The Amended Credit Agreement increased capacity to $400 million compared to $300 million in the previous facility and extended the maturity date to October 15, 2024. Furthermore, the Amended Credit Agreement included an enhanced asset base with reappraised fixed assets and investment grade foreign accounts receivable collateral in the borrowing base, improved interest rate spread pricing of 50 basis points, and reduced the unused commitment fee to a fixed 25 basis points from the previous 37.5 to 50 basis point range.
Refer to “Note 14 - Financing Arrangements” in the Notes of the Consolidated Financial Statements for additional information.
Convertible Notes
In May 2016, we issued $75.0 million aggregate principal amount of Convertible Notes, plus an additional $11.3 million principal amount to cover over-allotments. The Convertible Notes bear cash interest at a rate of 6.0% per year, payable semiannually on June 1 and December 1, beginning on December 1, 2016. The Convertible Notes will mature on June 1, 2021, unless earlier repurchased or converted. The net proceeds received from the offering were $83.2 million, after deducting the initial underwriters’ discount and fees and paying the offering expenses. We used the net proceeds to repay a portion of the amounts outstanding under our credit agreement.
Revenue Refunding Bonds
On January 23, 2018, we redeemed in full $12.2 million of Ohio Water Development Revenue Refunding Bonds (originally due on November 1, 2025), $9.5 million of Ohio Air Quality Development Revenue Refunding Bonds (originally due on November 1, 2025), and $8.5 million of Ohio Pollution Control Revenue Refunding Bonds (originally due on June 1, 2033).
Additional Liquidity Considerations
The following represents a summary of key liquidity measures under the credit agreement in effect as of December 31, 2019 and December 31, 2018:
December 31, 2019 | December 31, 2018 | |||||
Cash and cash equivalents | $27.1 | $21.6 | ||||
Credit Agreement: | ||||||
Maximum availability | $400.0 | $300.0 | ||||
Suppressed availability(1) | (103.0 | ) | — | |||
Availability | 297.0 | 300.0 | ||||
Credit facility amount borrowed | (90.0 | ) | (115.0 | ) | ||
Letter of credit obligations | (3.8 | ) | (2.6 | ) | ||
Availability not borrowed | 203.2 | 182.4 | ||||
Total liquidity | $230.3 | $204.0 | ||||
(1) As of December 31, 2019, Timkensteel had less than $400 million in collateral assets to borrow against.
28
Our principal sources of liquidity are cash and cash equivalents, cash flows from operations and available borrowing capacity under our credit agreement. As of December 31, 2019, taking into account our view of automotive, industrial, and energy market demands for our products, our 2020 operating and long-range plan, we believe that our cash balance as of December 31, 2019, projected cash generated from operations, and borrowings available under the Amended Credit Agreement, will be sufficient to satisfy our working capital needs, capital expenditures and other liquidity requirements associated with our operations, including servicing our debt obligations, for at least the next twelve months and through the maturity date of our Amended Credit Agreement.
To the extent our liquidity needs prove to be greater than expected or cash generated from operations is less than anticipated, and cash on hand or credit availability is insufficient, we would seek additional financing to provide additional liquidity. We regularly evaluate our potential access to the equity and debt capital markets as sources of liquidity and we believe additional financing would likely be available if necessary, although we can make no assurance as to the form or terms of any such financing. We would also consider additional cost reductions and restructuring, changes in working capital management and further reductions of capital expenditures. Regardless, we will continue to evaluate additional financing or may seek to refinance outstanding borrowings under the Amended Credit Agreement to provide us with additional flexibility and liquidity. Any additional financing beyond that incurred to refinance existing debt would increase our overall debt and could increase interest expense.
For additional details regarding the Credit Agreement, the Amended Credit Agreement and the Convertible Notes, please refer to “Note 14 - Financing Arrangements” in the Notes to the Consolidated Financial Statements, and for our discussion regarding risk factors related to our business and our debt, see Risk Factors in this Annual Report on Form 10-K.
Cash Flows
The following table reflects the major categories of cash flows for the years ended December 31, 2019 and 2018. For additional details, please refer to the Consolidated Statements of Cash Flows included in Item 8 - Financial Statements and Supplemental Data of this Annual Report.
Year Ended December 31, | |||||||||||
2019 | 2018 | 2017 | |||||||||
Net cash provided (used) by operating activities | $70.3 | $18.5 | $8.1 | ||||||||
Net cash provided (used) by investing activities | (38.0 | ) | (39.0 | ) | (33.0 | ) | |||||
Net cash provided (used) by financing activities | (26.8 | ) | 17.6 | 23.8 | |||||||
Increase (Decrease) in Cash and Cash Equivalents | $5.5 | ($2.9 | ) | ($1.1 | ) | ||||||
Operating activities
Net cash provided by operating activities for the year ended December 31, 2019 was $70.3 million compared with net cash provided of $18.5 million for the same period 2018. The increase in cash provided by operating activities of $51.8 million was primarily due to an increase in cash provided from working capital, partially offset by a net loss of $110.0 million and lower accrued liabilities, primarily due to lower variable compensation.
The improvement in cash used for working capital between periods was due to inventories and accounts receivable, partially offset by accounts payable. The increase in cash provided for inventory was driven by the impact of declining scrap prices combined with a lower quantity of inventory on hand during the year ended December 31, 2019 as compared to the opposite trend during the same period in the prior year. The increase in cash provided by accounts receivable was primarily due to declining sales for the year ended December 31, 2019, which resulted in collections exceeding billings, as compared to increasing sales in the same period in the prior year. Accounts payable offset these increases due to lower production and declining scrap prices. Refer to the Consolidated Statements of Cash Flows in the Consolidated Financial Statements for additional information.
Net cash provided by operating activities for the years ended December 31, 2018 and 2017 was $18.5 million and $8.1 million, respectively. The improvement in net cash provided by operating activities was primarily due to an increase in gross profit partially offset by benefit payments for our domestic pension plans and an increased use of cash for working capital to support customer demand.
Investing activities
Net cash used by investing activities for the years ended December 31, 2019, 2018 and 2017 was $38.0 million, $39.0 million, and $33.0 million, respectively. In 2019, we focused our capital investment spend on enhancing our value-added components capabilities as well as ongoing investments to support our steel manufacturing operation.
29
Net cash used by investing activities for the years ended December 31, 2018 and 2017 was $39.0 million and $33.0 million, respectively. Cash used for investing activities primarily relates to capital investments in our manufacturing facilities. Capital spending in 2018 increased $7.0 million from 2017 due to an increase in strategic spending on our capital investments.
Our business requires capital investments to maintain our plants and equipment to remain competitive and ensure we can implement strategic initiatives. Our construction in progress balance of approximately $31 million as of December 31, 2019 includes: (a) approximately $16 million relating to growth initiatives (new product offerings and new capabilities) and continuous improvement projects; and (b) approximately $15 million relating primarily to routine capital costs to maintain the reliability, integrity and safety of our manufacturing equipment and facilities. In the next one to three years, we expect to spend approximately $17 million to complete existing ongoing projects (made up of approximately $11 million relating to additional growth initiatives and approximately $6 million related to continuous improvement).
Financing activities
Net cash used by financing activities for the year ended December 31, 2019 was $26.8 million compared to net cash provided by financing activities of $17.6 million for the year ended December 31, 2018. The change was mainly due to net repayments of debt of $25.0 million during the year ended December 31, 2019 as compared to net borrowings of $19.8 million during the year ended December 31, 2018. With the additional cash generated by operating activities in 2019, we focused on paying down our credit facility.
Net cash provided by financing activities for the year ended December 31, 2018 was approximately $17.6 million compared to $23.8 million for the year ended December 31, 2017. The change was mainly due to lower net borrowings on the Credit Agreement during the year ended December 31, 2018 compared to the prior year.
Contractual Obligations
The following table summarizes our contractual obligations as of December 31, 2019:
Contractual Obligations | Total | Less than 1 Year | 1-3 Years | 3-5 Years | More than 5 Years | |||||||||||||||
Convertible notes and other long-term debt | $176.3 | $— | $86.3 | $90.0 | $— | |||||||||||||||
Interest payments | 24.9 | 8.2 | 13.4 | 3.3 | — | — | ||||||||||||||
Operating leases | 15.4 | 6.8 | 6.8 | 1.8 | — | |||||||||||||||
Purchase commitments | 143.0 | 33.6 | 28.7 | 27.4 | 53.3 | |||||||||||||||
Retirement benefits | 171.1 | 3.2 | 24.8 | 67.7 | 75.4 | |||||||||||||||
Total | $530.7 | $51.8 | $160.0 | $190.2 | $128.7 | |||||||||||||||
The caption Convertible notes and other long-term debt includes the outstanding Convertible Notes principal balance of $86.3 million and the Amended Credit Agreement of $90 million. Interest payments include interest on the Convertible Notes and estimated interest payments on variable rate debt computed using the assumption that the outstanding balance interest rate at December 31, 2019 is in effect for the remaining term of the variable rate debt. Actual interest could vary. See Item 7A - Quantitative and Qualitative Disclosures about Market Risk of this Annual Report on Form 10-K for further discussion.
Purchase commitments are defined as agreements to purchase goods or services that are enforceable and legally binding. Included in purchase commitments are certain obligations related to capital commitments, service agreements and energy consumed in our production process. These purchase commitments do not represent our entire anticipated purchases in the future but represent only those items for which we are presently contractually obligated. The majority of our products and services are purchased as needed, with no advance commitment. We do not have any off-balance sheet arrangements with unconsolidated entities or other persons.
Retirement benefits are paid from plan assets and our operating cash flow. The table above includes payments to meet minimum funding requirements of our defined benefit pension plans, estimated benefit payments for our unfunded supplemental executive retirement pension, and postretirement plans. The retirement benefit funding requirements included in the table above are estimated required contributions and are significantly affected by asset returns and several other variables. These amounts are subject to change year to year. These amounts are based on Company estimates and current funding laws, actual future payments may be different. Refer to “Note 15 - Retirement and Postretirement Plans” in the Notes to the Consolidated Financial Statements for further information related to the total pension and other postretirement benefit plans and expected benefit payments.
30
CRITICAL ACCOUNTING POLICIES AND ESTIMATES
Our financial statements are prepared in accordance with U.S. GAAP. The preparation of these financial statements requires management to make estimates and assumptions that affect the reported amounts of assets and liabilities at the date of the financial statements and the reported amounts of revenues and expenses during the periods presented. We review our critical accounting policies throughout the year.
New Accounting Guidance
See “Note 2 - Significant Accounting Policies” in the Notes to the Consolidated Financial Statements.
Revenue Recognition
We recognize revenue from contracts at a point in time when we have satisfied our performance obligation and the customer obtains control of the goods, at the amount that reflects the consideration we expect to receive for those goods. We receive and acknowledge purchase orders from our customers, which define the quantity, pricing, payment and other applicable terms and conditions. In some cases, we receive a blanket purchase order from our customer, which includes pricing, payment and other terms and conditions, with quantities defined at the time the customer issues periodic releases from the blanket purchase order. Certain contracts contain variable consideration, which primarily consists of rebates that are accounted for in net sales and accrued based on the estimated probability of the requirements being met.
Inventory
During the fourth quarter of 2019, we elected to change our method for valuing our inventories that previously used the last-in, first-out (LIFO) method to the first-in, first-out (FIFO) method. Total inventories accounted for under the LIFO method represented approximately 70% of the Company's total inventories prior to this change in method. We believe that the FIFO method is preferable as it improves comparability with our peers, more closely resembles the physical flow of our inventory, and aligns with how we internally manage the business.
The effects of the change in accounting principle from LIFO to FIFO have been retrospectively applied to all periods presented. As a result of the retrospective application of the change in accounting principle, certain financial statement line items in the Company’s consolidated balance sheets as of December 31, 2019 and 2018 and consolidated statements of operations and consolidated statements of cash flows for 2019, 2018, and 2017 were adjusted as necessary. Refer to “Note 1 - Basis of Presentation” in the Notes to the Consolidated Financial Statements for further information.
Long-lived Assets
Long-lived assets (including tangible assets and intangible assets subject to amortization) are reviewed for impairment when events or changes in circumstances have occurred indicating the carrying value of the assets may not be recoverable.
We test recoverability of long-lived assets at the lowest level for which there are identifiable cash flows that are independent from the cash flows of other assets. Assets and asset groups held and used are measured for recoverability by comparing the carrying amount of the asset or asset group to the sum of future undiscounted net cash flows expected to be generated by the asset or asset group.
Assumptions and estimates about future values and remaining useful lives of our long-lived assets are complex and subjective. They can be affected by a variety of factors, including external factors such as industry and economic trends and internal factors such as changes in our business strategy and our internal forecasts.
If an asset or asset group is considered to be impaired, the impairment loss that would be recognized is the amount by which the carrying amount of the assets exceeds the fair value of the assets. To determine fair value, we use internal cash flow estimates discounted at an appropriate interest rate, third party appraisals as appropriate, and/or market prices of similar assets, when available.
As the result of the discontinued use of certain assets, we recorded impairment charges and loss on sale or disposal of assets of $9.3 million, $0.9 million and $0.7 million for the years ended December 31, 2019, 2018 and 2017, respectively.
31
Income Taxes
We are subject to income taxes in the U.S. and numerous non-U.S. jurisdictions, and we account for income taxes in accordance with Financial Accounting Standards Board Accounting Standard Codification Topic 740, “Income Taxes” (ASC 740). Deferred tax assets and liabilities are recorded for the future tax consequences attributable to differences between financial statement carrying amounts of existing assets and liabilities and their respective tax bases, as well as net operating loss and tax credit carryforwards. Deferred tax assets and liabilities are measured using enacted tax rates expected to apply to taxable income in the years in which temporary differences are expected to be recovered or settled. We record valuation allowances against deferred tax assets by tax jurisdiction when it is more likely than not that such assets will not be realized. In determining the need for a valuation allowance, the historical and projected financial performance of the entity recording the net deferred tax asset is considered along with any other pertinent information. Net deferred tax assets relate primarily to net operating losses and pension and other postretirement benefit obligations in the U.S., which we believe are more likely than not to result in future tax benefits. As of December 31, 2019, we have recorded a valuation allowance on our net deferred tax assets in the U.S., as we do not believe it is more likely than not that a portion of our U.S. deferred tax assets will be realized.
In the ordinary course of our business, there are many transactions and calculations regarding which the ultimate income tax determination is uncertain. We are regularly under audit by tax authorities. Accruals for uncertain tax positions are provided for in accordance with the requirements of ASC 740. We record interest and penalties related to uncertain tax positions as a component of income tax expense.
During the year ended December 31, 2018, the Company made the accounting policy election to treat taxes related to Global Intangible Low-Taxed Income as a current period expense when incurred.
Benefit Plans
We recognize an overfunded status or underfunded status (i.e., the difference between the fair value of plan assets and the benefit obligations) as either an asset or a liability for our defined benefit pension and other postretirement benefit plans on the Consolidated Balance Sheets. We recognize actuarial gains and losses immediately through net periodic benefit cost in the Consolidated Statements of Operations upon the annual remeasurement at December 31, or on an interim basis as triggering events warrant remeasurement. In addition, we use fair value to account for the value of plan assets.
As of December 31, 2019 our projected benefit obligations related to our pension and other postretirement benefit plans were $1,311.4 million and $126.2 million, respectively, and the underfunded status of our pension and other postretirement benefit obligations were $156.0 million and $43.9 million, respectively. These benefit obligations were valued using a weighted average discount rate of 3.42% for pension benefit plans and other postretirement benefit plans. The determination of the discount rate is generally based on an index created from a hypothetical bond portfolio consisting of high-quality fixed income securities with durations that match the timing of expected benefit payments. Changes in the selected discount rate could have a material impact on our projected benefit obligations and the unfunded status of our pension and other postretirement benefit plans.
For the year ended December 31, 2019, net periodic pension benefit cost was $35.9 million, and net periodic other postretirement benefit cost was $5.7 million. In 2019, net periodic pension and other postretirement benefit costs were calculated using a variety of assumptions, including a weighted average discount rate of 4.30% and 4.34%/3.94% (The discount rate for the postretirement plans was adjusted after the second quarter 2019 amendment. To calculate benefit costs, the discount rate of 4.34% was used for January to April and the discount rate of 3.94% was used for May to December), respectively, and an expected return on plan assets of 6.41% and 5.00%, respectively. The expected return on plan assets is determined based on several factors, including adjusted historical returns, historical risk premiums for various asset classes and target asset allocations within the portfolio. Adjustments made to the historical returns are based on recent return experience in the equity and fixed income markets and the belief that deviations from historical returns are likely over the relevant investment horizon.
The net periodic benefit cost and benefit obligation are affected by applicable year-end assumptions. Sensitivities to these assumptions may be asymmetric and are specific to the time periods noted. The impact of changing multiple factors simultaneously cannot be calculated by combining the individual sensitivities. The sensitivity to changes in discount rate assumptions may not be linear. A sensitivity analysis of the projected incremental effect of a 0.25% increase (decrease), holding all other assumptions constant, is as follows:
32
Hypothetical Rate | |||||||
Increase (decrease) | |||||||
0.25% | (0.25)% | ||||||
Discount Rate | |||||||
Net periodic benefit cost, prior to annual remeasurement gains or losses | $1.0 | $1.1 | |||||
Benefit obligation | ($39.5 | ) | $41.5 | ||||
Return on plan assets | |||||||
Net periodic benefit cost, prior to annual remeasurement gains or losses | ($2.7 | ) | $2.7 | ||||
Aggregate net periodic pension and other postretirement benefit income for 2020 is forecasted to be $1.3 million and $4.3 million, respectively. This estimate is based on a weighted average discount rate of 3.42% for the pension benefit plans and other postretirement benefit plans, as well as an expected return on assets of 5.80% for the pension benefit plans and 4.50% for the other postretirement benefit plans. Actual cost also is dependent on various other factors related to the employees covered by these plans. Adjustments to our actuarial assumptions could have a material adverse impact on our operating results.
Please refer to “Note 15 - Retirement and Postretirement Plans” in the Notes to the Consolidated Financial Statements for further information related to our pension and other postretirement benefit plans.
Other Loss Reserves
We have a number of loss exposures that are incurred in the ordinary course of business, such as environmental claims, product liability claims, product warranty claims, litigation and accounts receivable reserves. Establishing loss reserves for these matters requires management’s estimate and judgment with regard to risk exposure and ultimate liability or realization. These loss reserves are reviewed periodically and adjustments are made to reflect the most recent facts and circumstances. These other loss reserves have an immaterial impact on the Consolidated Financial Statements.
33
FORWARD-LOOKING STATEMENTS
Certain statements set forth in this Annual Report on Form 10-K (including our forecasts, beliefs and expectations) that are not historical in nature are “forward-looking” statements within the meaning of the Private Securities Litigation Reform Act of 1995. In particular, Management’s Discussion and Analysis of Financial Condition and Results of Operations contains numerous forward-looking statements. Forward-looking statements generally will be accompanied by words such as “anticipate,” “believe,” “could,” “estimate,” “expect,” “forecast,” “outlook,” “intend,” “may,” “plan,” “possible,” “potential,” “predict,” “project,” “seek,” “should,” “target,” “will,” “would,” or other similar words, phrases or expressions that convey the uncertainty of future events or outcomes. You are cautioned not to place undue reliance on forward-looking statements, which speak only as of the date of this Form 10-K. We caution readers that actual results may differ materially from those expressed or implied in forward-looking statements made by or on behalf of us due to a variety of factors, such as:
• | deterioration in world economic conditions, or in economic conditions in any of the geographic regions in which we conduct business, including additional adverse effects from global economic slowdown, terrorism or hostilities. This includes: political risks associated with the potential instability of governments and legal systems in countries in which we or our customers conduct business, and changes in currency valuations; |
• | the effects of fluctuations in customer demand on sales, product mix and prices in the industries in which we operate. This includes: our ability to respond to rapid changes in customer demand; the effects of customer bankruptcies or liquidations; the impact of changes in industrial business cycles; and whether conditions of fair trade exist in the U.S. markets; |
• | competitive factors, including changes in market penetration; increasing price competition by existing or new foreign and domestic competitors; the introduction of new products by existing and new competitors; and new technology that may impact the way our products are sold or distributed; |
• | changes in operating costs, including the effect of changes in our manufacturing processes; changes in costs associated with varying levels of operations and manufacturing capacity; availability of raw materials and energy; our ability to mitigate the impact of fluctuations in raw materials and energy costs and the effectiveness of our surcharge mechanism; changes in the expected costs associated with product warranty claims; changes resulting from inventory management, cost reduction initiatives and different levels of customer demands; the effects of unplanned work stoppages; and changes in the cost of labor and benefits; |
• | the success of our operating plans, announced programs, initiatives and capital investments; and our ability to maintain appropriate relations with unions that represent our associates in certain locations in order to avoid disruptions of business; |
• | unanticipated litigation, claims or assessments, including claims or problems related to intellectual property, product liability or warranty, and environmental issues and taxes, among other matters; |
• | the availability of financing and interest rates, which affect our cost of funds and/or ability to raise capital; our pension obligations and investment performance; and/or customer demand and the ability of customers to obtain financing to purchase our products or equipment that contain our products; and the amount of any dividend declared by our Board of Directors on our common shares; |
• | The overall impact of the pension and postretirement mark-to-market accounting; and |
• | Those items identified under the caption Risk Factors in this Annual Report on Form 10-K. |
You are cautioned that it is not possible to predict or identify all of the risks, uncertainties and other factors that may affect future results, and that the above list should not be considered to be a complete list. Except as required by the federal securities laws, we undertake no obligation to publicly update or revise any forward-looking statement, whether as a result of new information, future events or otherwise.
34
ITEM 7A. QUANTITATIVE AND QUALITATIVE DISCLOSURES ABOUT MARKET RISK
Interest Rate Risk
Our borrowings include both fixed and variable-rate debt. The variable debt consists principally of borrowings under our credit agreement. We are exposed to the risk of rising interest rates to the extent we fund our operations with these variable-rate borrowings. As of December 31, 2019, we have $168.6 million of aggregate debt outstanding, of which $90.0 million consists of debt with variable interest rates. Based on the amount of debt with variable-rate interest outstanding, a 1% rise in interest rates would result in an increase in interest expense of $0.9 million annually.
Foreign Currency Exchange Rate Risk
Fluctuations in the value of the U.S. dollar compared to foreign currencies may impact our earnings. Geographically, our sales are primarily made to customers in the United States. Currency fluctuations could impact us to the extent they impact the currency or the price of raw materials in foreign countries in which our competitors operate or have significant sales.
Commodity Price Risk
In the ordinary course of business, we are exposed to market risk with respect to commodity price fluctuations, primarily related to our purchases of raw materials and energy, principally scrap steel, other ferrous and non-ferrous metals, alloys, natural gas and electricity. Whenever possible, we manage our exposure to commodity risks primarily through the use of supplier pricing agreements that enable us to establish the purchase prices for certain inputs that are used in our manufacturing business. We utilize a raw material surcharge as a component of pricing steel to pass through the cost increases of scrap, alloys and other raw materials, as well as natural gas. From time to time, we may use financial instruments to hedge a portion of our exposure to price risk related to commodities. In periods of stable demand for our products, the surcharge mechanism has worked effectively to reduce the normal time lag in passing through higher raw material costs so that we can maintain our gross margins. When demand and cost of raw materials are lower, the surcharge impacts sales prices to a lesser extent.
35
ITEM 8. FINANCIAL STATEMENTS AND SUPPLEMENTARY DATA
INDEX TO CONSOLIDATED FINANCIAL STATEMENTS
PAGE | |
36
Report of Independent Registered Public Accounting Firm
To the Shareholders and the Board of Directors of TimkenSteel Corporation
Opinion on the Financial Statements
We have audited the accompanying consolidated balance sheets of TimkenSteel Corporation (the Company) as of December 31, 2019 and 2018, and the related consolidated statements of operations, comprehensive income (loss), shareholders' equity and cash flows for each of the three years in the period ended December 31, 2019, and the related notes and the financial statement schedule included at Item 15a (collectively referred to as the “consolidated financial statements”). In our opinion, the consolidated financial statements present fairly, in all material respects, the consolidated financial position of the Company at December 31, 2019 and 2018, and the consolidated results of its operations and its cash flows for each of the three years in the period ended December 31, 2019, in conformity with U.S. generally accepted accounting principles.
We also have audited, in accordance with the standards of the Public Company Accounting Oversight Board (United States) (PCAOB), the Company's internal control over financial reporting as of December 31, 2019, based on criteria established in Internal Control-Integrated Framework issued by the Committee of Sponsoring Organizations of the Treadway Commission (2013 framework), and our report dated February 25, 2020, expressed an unqualified opinion thereon.
Changes in Accounting Principles
As discussed in Note 1 to the consolidated financial statements, the Company elected to change its method of accounting for certain inventories to the first-in, first-out (“FIFO”) method during the year ended December 31, 2019.
Basis for Opinion
These financial statements are the responsibility of the Company's management. Our responsibility is to express an opinion on the Company’s financial statements based on our audits. We are a public accounting firm registered with the PCAOB and are required to be independent with respect to the Company in accordance with the U.S. federal securities laws and the applicable rules and regulations of the Securities and Exchange Commission and the PCAOB.
We conducted our audits in accordance with the standards of the PCAOB. Those standards require that we plan and perform the audit to obtain reasonable assurance about whether the financial statements are free of material misstatement, whether due to error or fraud. Our audits included performing procedures to assess the risks of material misstatement of the financial statements, whether due to error or fraud, and performing procedures that respond to those risks. Such procedures included examining, on a test basis, evidence regarding the amounts and disclosures in the financial statements. Our audits also included evaluating the accounting principles used and significant estimates made by management, as well as evaluating the overall presentation of the financial statements. We believe that our audits provide a reasonable basis for our opinion.
/s/ Ernst & Young LLP
We have served as the Company’s auditors since 2012.
Cleveland, Ohio
February 25, 2020
37
Report of Independent Registered Public Accounting Firm
To the Shareholders and the Board of Directors of TimkenSteel Corporation
Opinion on Internal Control over Financial Reporting
We have audited TimkenSteel Corporation’s internal control over financial reporting as of December 31, 2019, based on criteria established in Internal Control-Integrated Framework issued by the Committee of Sponsoring Organizations of the Treadway Commission (2013 framework) (the COSO criteria). In our opinion, TimkenSteel Corporation (the Company) maintained, in all material respects, effective internal control over financial reporting as of December 31, 2019, based on the COSO criteria.
We also have audited, in accordance with the standards of the Public Company Accounting Oversight Board (United States) (PCAOB), the consolidated balance sheets of the Company as of December 31, 2019 and 2018, and the related consolidated statements of operations, comprehensive income (loss), shareholders' equity and cash flows for each of the three years in the period ended December 31, 2019, and the related notes and the financial statement schedule included at Item 15a and our report dated February 25, 2020 expressed an unqualified opinion thereon.
Basis for Opinion
The Company’s management is responsible for maintaining effective internal control over financial reporting and for its assessment of the effectiveness of internal control over financial reporting included in the accompanying Report of Management on Internal Control over Financial Reporting. Our responsibility is to express an opinion on the Company’s internal control over financial reporting based on our audit. We are a public accounting firm registered with the PCAOB and are required to be independent with respect to the Company in accordance with the U.S. federal securities laws and the applicable rules and regulations of the Securities and Exchange Commission and the PCAOB.
We conducted our audit in accordance with the standards of the PCAOB. Those standards require that we plan and perform the audit to obtain reasonable assurance about whether effective internal control over financial reporting was maintained in all material respects.
Our audit included obtaining an understanding of internal control over financial reporting, assessing the risk that a material weakness exists, testing and evaluating the design and operating effectiveness of internal control based on the assessed risk, and performing such other procedures as we considered necessary in the circumstances. We believe that our audit provides a reasonable basis for our opinion.
Definition and Limitations of Internal Control Over Financial Reporting
A company’s internal control over financial reporting is a process designed to provide reasonable assurance regarding the reliability of financial reporting and the preparation of financial statements for external purposes in accordance with generally accepted accounting principles. A company’s internal control over financial reporting includes those policies and procedures that (1) pertain to the maintenance of records that, in reasonable detail, accurately and fairly reflect the transactions and dispositions of the assets of the company; (2) provide reasonable assurance that transactions are recorded as necessary to permit preparation of financial statements in accordance with generally accepted accounting principles, and that receipts and expenditures of the company are being made only in accordance with authorizations of management and directors of the company; and (3) provide reasonable assurance regarding prevention or timely detection of unauthorized acquisition, use, or disposition of the company’s assets that could have a material effect on the financial statements.
Because of its inherent limitations, internal control over financial reporting may not prevent or detect misstatements. Also, projections of any evaluation of effectiveness to future periods are subject to the risk that controls may become inadequate because of changes in conditions, or that the degree of compliance with the policies or procedures may deteriorate.
/s/ Ernst & Young LLP
Cleveland, Ohio
February 25, 2020
38
TimkenSteel Corporation
Consolidated Statements of Operations
Year Ended December 31, | |||||||||||
2019 | 2018 ADJUSTED | 2017 ADJUSTED | |||||||||
(Dollars in millions, except per share data) | |||||||||||
Net sales | $1,208.8 | $1,610.6 | $1,329.2 | ||||||||
Cost of products sold | 1,186.2 | 1,484.0 | 1,248.9 | ||||||||
Gross Profit | 22.6 | 126.6 | 80.3 | ||||||||
Selling, general and administrative expenses | 91.8 | 98.2 | 90.5 | ||||||||
Restructuring charges | 8.6 | — | — | ||||||||
Impairment charges and loss on sale or disposal of assets | 9.3 | 0.9 | 0.7 | ||||||||
Interest expense | 15.7 | 17.1 | 14.8 | ||||||||
Other income (expense), net | (23.3 | ) | (18.6 | ) | (4.1 | ) | |||||
Income (Loss) Before Income Taxes | (126.1 | ) | (8.2 | ) | (29.8 | ) | |||||
Provision (benefit) for income taxes | (16.1 | ) | 1.8 | 1.5 | |||||||
Net Income (Loss) | ($110.0 | ) | ($10.0 | ) | ($31.3 | ) | |||||
Per Share Data: | |||||||||||
Basic earnings (loss) per share | ($2.46 | ) | ($0.22 | ) | ($0.70 | ) | |||||
Diluted earnings (loss) per share | ($2.46 | ) | ($0.22 | ) | ($0.70 | ) | |||||
See accompanying Notes to the Consolidated Financial Statements.
39
TimkenSteel Corporation
Consolidated Statements of Comprehensive Income (Loss)
Year Ended December 31, | |||||||||||
2019 | 2018 ADJUSTED | 2017 ADJUSTED | |||||||||
(Dollars in millions) | |||||||||||
Net income (loss) | ($110.0 | ) | ($10.0 | ) | ($31.3 | ) | |||||
Other comprehensive income (loss), net of tax of $16.7 million in 2019: | |||||||||||
Foreign currency translation adjustments | 0.5 | (1.4 | ) | 1.1 | |||||||
Pension and postretirement liability adjustments | 53.1 | 0.1 | 0.7 | ||||||||
Other comprehensive income (loss), net of tax | 53.6 | (1.3 | ) | 1.8 | |||||||
Comprehensive Income (Loss), net of tax | ($56.4 | ) | ($11.3 | ) | ($29.5 | ) | |||||
See accompanying Notes to the Consolidated Financial Statements.
40
TimkenSteel Corporation
Consolidated Balance Sheets
December 31, | |||||||
2019 | 2018 ADJUSTED | ||||||
(Dollars in millions) | |||||||
ASSETS | |||||||
Current Assets | |||||||
Cash and cash equivalents | $27.1 | $21.6 | |||||
Accounts receivable, net of allowances (2019 - $1.5 million; 2018 - $1.7 million) | 77.5 | 163.4 | |||||
Inventories, net | 281.9 | 374.5 | |||||
Deferred charges and prepaid expenses | 3.3 | 3.5 | |||||
Assets held for sale | 4.1 | — | |||||
Other current assets | 7.8 | 6.1 | |||||
Total Current Assets | 401.7 | 569.1 | |||||
Property, plant and equipment, net | 626.4 | 674.4 | |||||
Operating lease right-of-use assets | 14.3 | — | |||||
Pension assets | 25.2 | 10.5 | |||||
Intangible assets, net | 14.3 | 17.8 | |||||
Other non-current assets | 3.3 | 3.5 | |||||
Total Assets | $1,085.2 | $1,275.3 | |||||
LIABILITIES AND SHAREHOLDERS’ EQUITY | |||||||
Current Liabilities | |||||||
Accounts payable | $69.3 | $160.6 | |||||
Salaries, wages and benefits | 13.9 | 36.8 | |||||
Accrued pension and postretirement costs | 3.0 | 3.0 | |||||
Current operating lease liabilities | 6.2 | — | |||||
Other current liabilities | 19.9 | 20.4 | |||||
Total Current Liabilities | 112.3 | 220.8 | |||||
Convertible notes, net | 78.6 | 74.1 | |||||
Credit Agreement | 90.0 | 115.0 | |||||
Non-current operating lease liabilities | 8.2 | — | |||||
Accrued pension and postretirement costs | 222.1 | 240.0 | |||||
Deferred income taxes | 0.9 | 0.8 | |||||
Other non-current liabilities | 10.0 | 11.7 | |||||
Total Liabilities | 522.1 | 662.4 | |||||
Shareholders’ Equity | |||||||
Preferred shares, without par value; authorized 10.0 million shares, none issued | — | — | |||||
Common shares, without par value; authorized 200.0 million shares; issued 2019 and 2018 - 45.7 million shares | — | — | |||||
Additional paid-in capital | 844.8 | 846.3 | |||||
Retained deficit | (301.5 | ) | (191.5 | ) | |||
Treasury shares - 2019 - 0.9 million; 2018 - 1.1 million | (24.9 | ) | (33.0 | ) | |||
Accumulated other comprehensive income (loss) | 44.7 | (8.9 | ) | ||||
Total Shareholders’ Equity | 563.1 | 612.9 | |||||
Total Liabilities and Shareholders’ Equity | $1,085.2 | $1,275.3 | |||||
See accompanying Notes to the Consolidated Financial Statements.
41
TimkenSteel Corporation
Consolidated Statements of Shareholders’ Equity
(Dollars in millions) | Common Shares Outstanding | Additional Paid-in Capital | Retained Deficit | Treasury Shares | Accumulated Other Comprehensive Income (Loss) | Total | ||||||||||||||||
Balance as of December 31, 2016 | 44,228,213 | $845.6 | ($193.9 | ) | ($44.9 | ) | ($9.4 | ) | $597.4 | |||||||||||||
Cumulative effect of change in accounting principle (Note 1) | — | — | 43.5 | — | — | 43.5 | ||||||||||||||||
Net income (loss) | — | — | (31.3 | ) | — | — | (31.3 | ) | ||||||||||||||
Other comprehensive income (loss) | — | — | — | — | 1.8 | 1.8 | ||||||||||||||||
Stock-based compensation expense | — | 6.5 | — | — | — | 6.5 | ||||||||||||||||
Stock option activity | — | 0.2 | — | — | — | 0.2 | ||||||||||||||||
Issuance of treasury shares | 300,130 | (8.6 | ) | (0.3 | ) | 8.9 | — | — | ||||||||||||||
Shares surrendered for taxes | (82,596 | ) | — | — | (1.4 | ) | — | (1.4 | ) | |||||||||||||
Balance as of December 31, 2017 ADJUSTED | 44,445,747 | $843.7 | ($182.0 | ) | ($37.4 | ) | ($7.6 | ) | $616.7 | |||||||||||||
Net income (loss) | — | — | (10.0 | ) | — | — | (10.0 | ) | ||||||||||||||
Other comprehensive income (loss) | — | — | — | — | (1.3 | ) | (1.3 | ) | ||||||||||||||
Adoption of new accounting standard (Note 2) | — | — | 0.7 | — | — | 0.7 | ||||||||||||||||
Stock-based compensation expense | — | 7.3 | — | — | — | 7.3 | ||||||||||||||||
Stock option activity | — | 0.2 | — | — | — | 0.2 | ||||||||||||||||
Issuance of treasury shares | 176,454 | (4.9 | ) | (0.2 | ) | 5.1 | — | — | ||||||||||||||
Shares surrendered for taxes | (37,533 | ) | — | — | (0.7 | ) | — | (0.7 | ) | |||||||||||||
Balance as of December 31, 2018 ADJUSTED | 44,584,668 | $846.3 | ($191.5 | ) | ($33.0 | ) | ($8.9 | ) | $612.9 | |||||||||||||
Net income (loss) | — | — | (110.0 | ) | — | — | (110.0 | ) | ||||||||||||||
Other comprehensive income (loss) | — | — | — | — | 53.6 | 53.6 | ||||||||||||||||
Stock-based compensation expense | — | 7.4 | — | — | — | 7.4 | ||||||||||||||||
Stock option activity | — | 0.2 | — | — | — | 0.2 | ||||||||||||||||
Issuance of treasury shares | 321,739 | (9.1 | ) | — | 9.1 | — | — | |||||||||||||||
Shares surrendered for taxes | (86,254 | ) | — | — | (1.0 | ) | — | (1.0 | ) | |||||||||||||
Balance at December 31, 2019 | 44,820,153 | $844.8 | ($301.5 | ) | ($24.9 | ) | $44.7 | $563.1 | ||||||||||||||
See accompanying Notes to the Consolidated Financial Statements.
42
TimkenSteel Corporation
Consolidated Statements of Cash Flows
Year Ended December 31, | |||||||||||
2019 | 2018 ADJUSTED | 2017 ADJUSTED | |||||||||
(Dollars in millions) | |||||||||||
CASH PROVIDED (USED) | |||||||||||
Operating Activities | |||||||||||
Net income (loss) | ($110.0 | ) | ($10.0 | ) | ($31.3 | ) | |||||
Adjustments to reconcile net loss to net cash provided (used) by operating activities: | |||||||||||
Depreciation and amortization | 73.5 | 73.0 | 74.9 | ||||||||
Amortization of deferred financing fees and debt discount | 5.1 | 5.5 | 4.0 | ||||||||
Impairment charges and loss on sale or disposal of assets | 9.3 | 0.9 | 1.6 | ||||||||
Deferred income taxes | (16.6 | ) | 0.8 | (0.3 | ) | ||||||
Stock-based compensation expense | 7.4 | 7.3 | 6.5 | ||||||||
Pension and postretirement expense (benefit), net | 41.6 | 37.4 | 24.7 | ||||||||
Pension and postretirement contributions and payments | (3.8 | ) | (13.1 | ) | (4.3 | ) | |||||
Changes in operating assets and liabilities: | |||||||||||
Accounts receivable, net | 85.9 | (13.6 | ) | (58.2 | ) | ||||||
Inventories, net | 92.6 | (94.5 | ) | (72.3 | ) | ||||||
Accounts payable | (87.7 | ) | 24.4 | 45.7 | |||||||
Other accrued expenses | (26.0 | ) | (3.8 | ) | 18.3 | ||||||
Deferred charges and prepaid expenses | 0.2 | 0.4 | (0.5 | ) | |||||||
Other, net | (1.2 | ) | 3.8 | (0.7 | ) | ||||||
Net Cash Provided (Used) by Operating Activities | 70.3 | 18.5 | 8.1 | ||||||||
Investing Activities | |||||||||||
Capital expenditures | (38.0 | ) | (40.0 | ) | (33.0 | ) | |||||
Proceeds from disposals of property, plant and equipment | — | 1.0 | — | ||||||||
Net Cash Provided (Used) by Investing Activities | (38.0 | ) | (39.0 | ) | (33.0 | ) | |||||
Financing Activities | |||||||||||
Proceeds from exercise of stock options | 0.2 | 0.2 | 0.2 | ||||||||
Shares surrendered for employee taxes on stock compensation | (1.0 | ) | (0.7 | ) | (1.4 | ) | |||||
Refunding Bonds repayments | — | (30.2 | ) | — | |||||||
Repayments on credit agreements | (65.0 | ) | (105.0 | ) | (5.0 | ) | |||||
Borrowings on credit agreements | 40.0 | 155.0 | 30.0 | ||||||||
Debt issuance costs | (1.0 | ) | (1.7 | ) | — | ||||||
Net Cash Provided (Used) by Financing Activities | (26.8 | ) | 17.6 | 23.8 | |||||||
Increase (Decrease) in Cash and Cash Equivalents | 5.5 | (2.9 | ) | (1.1 | ) | ||||||
Cash and cash equivalents at beginning of period | 21.6 | 24.5 | 25.6 | ||||||||
Cash and Cash Equivalents at End of Period | $27.1 | $21.6 | $24.5 | ||||||||
See accompanying Notes to the Consolidated Financial Statements.
43
TimkenSteel Corporation
Notes to Consolidated Financial Statements
(dollars in millions, except per share data)
Note 1 - Basis of Presentation
TimkenSteel Corporation (the Company or TimkenSteel) manufactures alloy steel, as well as carbon and micro-alloy steel, with an annual melt capacity of approximately 2 million tons and shipment capacity of 1.5 million tons. TimkenSteel’s portfolio includes special bar quality (SBQ) bars, seamless mechanical tubing (tubes), value-added solutions such as precision steel components, and billets. In addition, TimkenSteel supplies machining and thermal treatment services and manages raw material recycling programs, which are used as a feeder system for the Company’s melt operations. The Company’s products and services are used in a diverse range of demanding applications in the following market sectors: automotive; oil and gas; industrial equipment; mining; construction; rail; defense; heavy truck; agriculture; power generation; and oil country tubular goods (OCTG);.
The SBQ bar, tube, and billet production processes take place at the Company’s Canton, Ohio manufacturing location. This location accounts for all of the SBQ bars, seamless mechanical tubes and billets the Company produces and includes three manufacturing facilities: the Faircrest, Harrison, and Gambrinus facilities. TimkenSteel’s value-added solutions production processes take place at three downstream manufacturing facilities: TimkenSteel Material Services (Houston, Texas), Tryon Peak (Columbus, North Carolina), and St. Clair (Eaton, Ohio). Many of the production processes are integrated, and the manufacturing facilities produce products that are sold in all of the Company’s market sectors. As a result, investments in the Company’s facilities and resource allocation decisions affecting the Company’s operations are designed to benefit the overall business, not any specific aspect of the business. In the fourth quarter of 2019, our Board of Directors approved a plan to close our TimkenSteel Material Services facility during the first quarter of 2020.
Basis of Consolidation:
The Consolidated Financial Statements include the consolidated assets, liabilities, revenues and expenses related to TimkenSteel as of December 31, 2019, 2018 and 2017. All significant intercompany accounts and transactions within TimkenSteel have been eliminated in the preparation of the Consolidated Financial Statements.
Use of Estimates:
The preparation of these Consolidated Financial Statements in conformity with accounting principles generally accepted in the United States requires management to make estimates and assumptions that affect the amounts reported in the Consolidated Financial Statements and accompanying notes. These estimates and assumptions are reviewed and updated regularly to reflect recent experience.
Presentation:
Certain items previously reported in specific financial statement captions have been reclassified to conform to the fiscal 2019 presentation.
Change in Accounting Principle:
During the fourth quarter of 2019, TimkenSteel elected to change its method for valuing its inventories that previously used the last-in, first-out (LIFO) method to the first-in, first-out (FIFO) method. Total inventories accounted for under the LIFO method represented approximately 70% of the Company's total inventories prior to this change in method. The Company believes that the FIFO method is preferable as it improves comparability with our peers, more closely resembles the physical flow of our inventory, and aligns with how the Company internally manages the business.
The effects of the change in accounting principle from LIFO to FIFO have been retrospectively applied to all periods presented. As a result of the retrospective application of the change in accounting principle, certain financial statement line items in the Company’s consolidated balance sheets as of December 31, 2018 and the consolidated statements of operations, comprehensive income (loss), shareholders’ equity and cash flows for the years ended December 31, 2018 and 2017 were adjusted as necessary.
The following table reflects the effect of the change in the accounting principle on the 2019 Consolidated Financial Statements (dollars in million, except per share data):
44
For the Year Ended December 31, 2019 | As Computed under LIFO | As Reported under FIFO | Effect of Change | ||||||
Statement of Operations | |||||||||
Cost of products sold | $1,160.5 | $1,186.2 | $25.7 | ||||||
Gross profit | 48.3 | 22.6 | (25.7 | ) | |||||
Income (loss) before income taxes | (100.4 | ) | (126.1 | ) | (25.7 | ) | |||
Net income (loss) | (84.3 | ) | (110.0 | ) | (25.7 | ) | |||
Per Share Data: | |||||||||
Basic earnings (loss) per share | (1.89 | ) | (2.46 | ) | (0.57 | ) | |||
Diluted earnings (loss) per share | (1.89 | ) | (2.46 | ) | (0.57 | ) | |||
For the Year Ended December 31, 2019 | As Computed under LIFO | As Reported under FIFO | Effect of Change | ||||||
Statement of Comprehensive Income (Loss) | |||||||||
Net (loss) income | ($84.3 | ) | ($110.0 | ) | ($25.7 | ) | |||
Comprehensive income (loss), net of tax | (30.7 | ) | (56.4 | ) | (25.7 | ) | |||
As of December 31, 2019 | As Computed under LIFO | As Reported under FIFO | Effect of Change | ||||||
Balance Sheet | |||||||||
Inventories, net | $229.8 | $281.9 | $52.1 | ||||||
Retained deficit | (249.4 | ) | (301.5 | ) | (52.1 | ) | |||
For the Year Ended December 31, 2019 | As Computed under LIFO | As Reported under FIFO | Effect of Change | ||||||
Statement of Cash Flows | |||||||||
Net (loss) income | ($84.3 | ) | ($110.0 | ) | ($25.7 | ) | |||
Changes in operating assets and liabilities: | |||||||||
Inventories, net | 66.9 | 92.6 | 25.7 | ||||||
The following tables reflect the impact to the financial statement line items as a result of the change in accounting principle for the prior periods presented in the accompanying financial statements (dollars in millions, except per share data):
Consolidated Statement of Operations | 2018 | 2017 | ||||||||||||||||||
As Reported | Adjustments | As Adjusted | As Reported | Adjustments | As Adjusted | |||||||||||||||
Cost of products sold | $ | 1,505.7 | $ | (21.7 | ) | $ | 1,484.0 | $ | 1,261.4 | $ | (12.5 | ) | $ | 1,248.9 | ||||||
Gross profit | 104.9 | 21.7 | 126.6 | 67.8 | 12.5 | 80.3 | ||||||||||||||
Income (loss) before income taxes | (29.9 | ) | 21.7 | (8.2 | ) | (42.3 | ) | 12.5 | (29.8 | ) | ||||||||||
Net income (loss) | (31.7 | ) | 21.7 | (10.0 | ) | (43.8 | ) | 12.5 | (31.3 | ) | ||||||||||
Per Share Data: | ||||||||||||||||||||
Basic earnings (loss) per share | $ | (0.71 | ) | $ | 0.49 | $ | (0.22 | ) | $ | (0.99 | ) | $ | 0.29 | $ | (0.70 | ) | ||||
Diluted earnings (loss) per share | $ | (0.71 | ) | $ | 0.49 | $ | (0.22 | ) | $ | (0.99 | ) | $ | 0.29 | $ | (0.70 | ) | ||||
45
Consolidated Statement of Comprehensive Income (Loss) | 2018 | 2017 | ||||||||||||||||||
As Reported | Adjustments | As Adjusted | As Reported | Adjustments | As Adjusted | |||||||||||||||
Net income (loss) | $ | (31.7 | ) | $ | 21.7 | $ | (10.0 | ) | $ | (43.8 | ) | $ | 12.5 | $ | (31.3 | ) | ||||
Comprehensive income (loss), net of tax | (33.0 | ) | 21.7 | (11.3 | ) | (42.0 | ) | 12.5 | (29.5 | ) | ||||||||||
Consolidated Balance Sheet | 2018 | ||||||||
As Reported | Adjustments | As Adjusted | |||||||
Inventories, net | $ | 296.8 | $ | 77.7 | $ | 374.5 | |||
Retained deficit (1) | (269.2 | ) | 77.7 | (191.5 | ) | ||||
(1) As a result of the accounting change, retained deficit as of January 1, 2017 decreased from $193.9 million, as originally reported using the LIFO method, to $150.4 million using the FIFO method. The change of $43.5 million is reflected as a cumulative change in accounting principle in the Consolidated Statements of Shareholders’ Equity.
Consolidated Statement of Cash Flows | 2018 | 2017 | ||||||||||||||||||
As Reported | Adjustments | As Adjusted | As Reported | Adjustments | As Adjusted | |||||||||||||||
Net income (loss) | $ | (31.7 | ) | $ | 21.7 | $ | (10.0 | ) | $ | (43.8 | ) | $ | 12.5 | $ | (31.3 | ) | ||||
Changes in operating assets and liabilities: | ||||||||||||||||||||
Inventories, net | (72.8 | ) | (21.7 | ) | (94.5 | ) | (59.8 | ) | (12.5 | ) | (72.3 | ) | ||||||||
Note 2 - Significant Accounting Policies
Revenue Recognition:
TimkenSteel recognizes revenue from contracts at a point in time when it has satisfied its performance obligation and the customer obtains control of the goods, at the amount that reflects the consideration the Company expects to receive for those goods. The Company receives and acknowledges purchase orders from its customers, which define the quantity, pricing, payment and other applicable terms and conditions. In some cases, the Company receives a blanket purchase order from its customer, which includes pricing, payment and other terms and conditions, with quantities defined at the time the customer issues periodic releases from the blanket purchase order. Certain contracts contain variable consideration, which primarily consists of rebates that are accounted for in net sales and accrued based on the estimated probability of the requirements being met.
Cash Equivalents:
TimkenSteel considers all highly liquid investments with a maturity of three months or less when purchased to be cash equivalents.
Allowance for Doubtful Accounts:
TimkenSteel maintains an allowance for doubtful accounts, which represents an estimate of losses expected from the accounts receivable portfolio, to reduce accounts receivable to their net realizable value. The allowance is based upon historical trends in collections and write-offs, management’s judgment of the probability of collecting accounts and management’s evaluation of business risk. TimkenSteel extends credit to customers satisfying pre-defined credit criteria. TimkenSteel believes it has limited concentration of credit risk due to the diversity of its customer base.
Inventories, Net:
At December 31, 2019, inventories were stated at the lower of cost or net realizable value. During the fourth quarter of 2019, the Company elected to change its method for valuing its inventories that previously used the LIFO method to the FIFO method. The Company believes that the FIFO method is preferable as it improves comparability with our peers, more closely resembles the physical flow of our inventory, and aligns with how the Company internally manages the business. The remaining
46
inventories, including raw materials, manufacturing supplies inventory as well as international (outside the U.S.) inventories, will continue to be valued using the FIFO or average cost method.
The effects of the change in accounting principle from LIFO to FIFO have been retrospectively applied to all periods presented. Refer to “Note 1 - Basis of Presentation” for more information.
Property, Plant and Equipment, Net:
Property, plant and equipment, net are valued at cost less accumulated depreciation. Maintenance and repairs are charged to expense as incurred. The provision for depreciation is computed principally by the straight-line method based upon the estimated useful lives of the assets. The useful lives are approximately 30 years for buildings and three to 20 years for machinery and equipment.
Intangible Assets, Net:
Intangible assets subject to amortization are amortized on a straight-line method over their legal or estimated useful lives, with useful lives ranging from three to 15 years.
In accordance with Financial Accounting Standards Board (FASB) Accounting Standards Codification (ASC) Topic 350-40, “Internal-Use Software,” (ASC 350-40), TimkenSteel capitalizes certain costs incurred for computer software developed or obtained for internal use. TimkenSteel capitalizes substantially all external costs and qualifying internal costs related to the purchase and implementation of software projects used for business operations. Capitalized software costs primarily include purchased software and external consulting fees. Capitalized software projects are amortized over the estimated useful lives of the software.
Long-lived Assets:
Long-lived assets (including tangible assets and intangible assets subject to amortization) are reviewed for impairment when events or changes in circumstances have occurred indicating that the carrying value of the assets may not be recoverable.
TimkenSteel tests recoverability of long-lived assets at the lowest level for which there are identifiable cash flows that are independent from the cash flows of other assets. Assets and asset groups held and used are measured for recoverability by comparing the carrying amount of the asset or asset group to the sum of future undiscounted net cash flows expected to be generated by the asset or asset group.
Assumptions and estimates about future values and remaining useful lives of TimkenSteel’s long-lived assets are complex and subjective. They can be affected by a variety of factors, including external factors such as industry and economic trends and internal factors such as changes in TimkenSteel’s business strategy and internal forecasts.
If an asset or asset group is considered to be impaired, the impairment loss that would be recognized is the amount by which the carrying amount of the assets exceeds the fair value of the assets. To determine fair value, TimkenSteel uses internal cash flow estimates discounted at an appropriate interest rate, third party appraisals, as appropriate, and/or market prices of similar assets, when available.
Refer to “Note 6 - Disposition of Non-Core Assets” and “Note 11 - Property, Plant and Equipment” for additional information.
Product Warranties:
TimkenSteel accrues liabilities for warranties based upon specific claim incidents in accordance with accounting rules relating to contingent liabilities. Should TimkenSteel become aware of a specific potential warranty claim for which liability is probable and reasonably estimable, a specific charge is recorded and accounted for accordingly. TimkenSteel had no significant warranty claims for the years ended December 31, 2019, 2018 or 2017.
Income Taxes:
Deferred tax assets and liabilities are recorded for the future tax consequences attributable to differences between financial statement carrying amounts of existing assets and liabilities and their respective tax bases, as well as net operating loss and tax credit carryforwards. TimkenSteel accounts for income taxes under the asset and liability method, which requires the recognition of deferred tax assets and liabilities for the expected future tax consequences of events that have been included in the financial statements. Under this method, deferred tax assets and liabilities are determined on the basis of the differences between the financial
47
statement and tax bases of assets and liabilities using enacted tax rates in effect for the year in which the differences are expected to reverse. The effect of a change in tax rates on deferred tax assets and liabilities is recognized in income in the period that includes the enactment date. TimkenSteel recognizes deferred tax assets to the extent TimkenSteel believes these assets are more likely than not to be realized. In making such a determination, TimkenSteel considers all available positive and negative evidence, including future reversals of existing taxable temporary differences, projected future taxable income, tax-planning strategies, and results of recent operations. If TimkenSteel determines that it would be able to realize deferred tax assets in the future in excess of their net recorded amount, TimkenSteel would make an adjustment to the deferred tax asset valuation allowance, which would reduce the provision for income taxes.
TimkenSteel records uncertain tax positions in accordance with FASB ASC Topic 740, “Income Taxes” (ASC 740), on the basis of a two-step process whereby (1) TimkenSteel determines whether it is more likely than not that the tax positions will be sustained on the basis of the technical merits of the position, and (2) for those tax positions that meet the more-likely-than-not recognition threshold, TimkenSteel recognizes the largest amount of tax benefit that is more than 50 percent likely to be realized upon ultimate settlement with the related tax authority.
TimkenSteel recognizes interest and penalties related to unrecognized tax benefits within the provision (benefit) for income taxes line in the accompanying Consolidated Statements of Operations. Accrued interest and penalties are included within the related tax liability line in the Consolidated Balance Sheets.
During the year ended December 31, 2018, the Company made the accounting policy election to treat taxes related to Global Intangible Low-Taxed Income (GILTI) as a current period expense when incurred.
Foreign Currency:
Assets and liabilities of subsidiaries are translated at the rate of exchange in effect on the balance sheet date. Income and expenses are translated at the average rates of exchange prevailing during the year. The related translation adjustments are reflected as a separate component of accumulated other comprehensive loss. Gains and losses resulting from foreign currency transactions are included in other expense, net in the Consolidated Statements of Operations. TimkenSteel realized a foreign currency exchange loss of $0.2 million in 2018 and a gain of $0.3 million in 2017. There were no foreign currency exchange gains or losses in 2019.
Pension and Other Postretirement Benefits:
TimkenSteel recognizes an overfunded status or underfunded status (e.g., the difference between the fair value of plan assets and the benefit obligations) as either an asset or a liability for its defined benefit pension and other postretirement benefit plans on the Consolidated Balance Sheets. The Company recognizes actuarial gains and losses immediately through net periodic benefit cost in the Consolidated Statements of Operations upon the annual remeasurement at December 31, or on an interim basis as triggering events warrant remeasurement. In addition, the Company uses fair value to account for the value of plan assets.
Stock-Based Compensation:
TimkenSteel recognizes stock-based compensation expense based on the grant date fair value of the stock-based awards over their required vesting period on a straight-line basis, whether the awards were granted with graded or cliff vesting. Stock options are issued with an exercise price equal to the closing market price of TimkenSteel common shares on the date of grant. The fair value of stock options is determined using a Black-Scholes option pricing model, which incorporates assumptions regarding the expected volatility, the expected option life, the risk-free interest rate and the expected dividend yield. The fair value of stock-based awards that will settle in TimkenSteel common shares, other than stock options, is based on the closing market price of TimkenSteel common shares on the grant date. The fair values of stock-based awards that will settle in cash are remeasured at each reporting period until settlement of the awards.
TimkenSteel recognizes all excess tax benefits and tax deficiencies as income tax expense or benefit in the Consolidated Statements of Operations. The excess tax benefits and tax deficiencies are considered discrete items in the reporting period they occur and are not included in the estimate of an entity’s annual effective tax rate.
Research and Development:
Expenditures for TimkenSteel research and development amounted to $4.1 million for the year ended December 31, 2019, $8.1 million for the year ended December 31, 2018 and $8.0 million for the years ended December 31, 2017, and were recorded as a component of selling, general and administrative expenses in the Consolidated Statements of Operations. These expenditures may fluctuate from year to year depending on special projects and the needs of TimkenSteel and its customers.
48
Adoption of New Accounting Standards:
The Company adopted the following Accounting Standard Updates (ASU) in the first quarter of 2019, all of which were effective as of January 1, 2019. The adoption of these standards had no impact on the Consolidated Financial Statements or the related Notes to the Consolidated Financial Statements.
Standards Adopted | Description |
ASU 2018-07, Compensation - Stock Compensation (Topic 718): Improvements to Nonemployee Share-Based Payment Accounting | The standard provides an expanded scope of Topic 718, to include share-based payment transactions for acquiring goods and services from nonemployees. |
ASU 2018-02, Reporting Comprehensive Income: Reclassification of Certain Tax Effects from Accumulated Other Comprehensive Income | The standard permits entities to reclassify tax effects stranded in accumulated other comprehensive income as a result of tax reform to retained earnings. |
ASU 2017-11, Distinguishing Liabilities from Equity; Derivatives and Hedging | The standard eliminates the requirement to consider “down round” features when determining whether certain equity-linked financial instruments or embedded features are indexed to an entity’s own stock. |
On January 1, 2019, the Company adopted ASU 2016-02, “Leases (Topics 842),” which requires lessees to recognize lease liabilities and right-of-use assets on the balance sheet for not only finance (previously capital) leases but also operating leases. The standard also requires additional quantitative and qualitative disclosures. The Company adopted the standard using the modified retrospective transition approach without adjusting comparative periods.
The Company elected certain of the practical expedients permitted under the transition guidance within the new standard as follows:
• | A package of practical expedients to not reassess: |
◦ | Whether a contract is or contains a lease |
◦ | Lease classification |
◦ | Initial direct costs |
• | A practical expedient to not reassess certain land easements |
The Company has implemented internal controls and lease accounting software to enable the quantification of the expected impact on the Consolidated Balance Sheets and to facilitate the calculations of the related accounting entries and disclosures. Adoption of the lease standard resulted in recognition of right-to-use assets and lease liabilities of $16.0 million as of January 1, 2019. Adoption of the lease standard had no impact on the Company’s debt covenant compliance under its current agreements. Also, the standard did not materially affect the Company’s results of operations or its cash flows. Refer to “Note 13 - Leases” for additional information.
49
Accounting Standards Issued But Not Yet Adopted
The Company has considered the recent ASUs issued by the Financial Accounting Standards Board summarized below:
Standard Pending Adoption | Description | Effective Date | Anticipated Impact |
ASU 2018-15, Intangibles - Goodwill and Other - Internal-Use Software (Subtopic 350-40) | The standard aligns the requirements for capitalizing implementation costs in cloud computing software arrangements with the requirements for capitalizing implementation costs incurred to develop or obtain internal-use software. | January 1, 2020 | The Company evaluated the impact of the adoption of this ASU on its results of operations and financial condition and determined that the impact is immaterial. |
ASU 2018-14, Compensation - Retirement Benefits - Defined Benefit Plans - General (Subtopic 715-20) | The standard eliminates, modifies and adds disclosure requirements for employers that sponsor defined benefit pension or other postretirement plans. | January 1, 2021 | The Company is currently evaluating the impact of the adoption of this ASU on its results of operations and financial condition. |
ASU 2018-13, Fair Value Measurement (Topic 820) | The standard eliminates, modifies and adds disclosure requirements for fair value measurements. | January 1, 2020 | The Company evaluated the impact of the adoption of this ASU on its results of operations and financial condition and determined that the impact is immaterial. |
ASU 2016-13, Measurement of Credit Losses on Financial Instruments | The standard changes how entities will measure credit losses for most financial assets, including trade and other receivables and replaces the current incurred loss approach with an expected loss model. | January 1, 2020 | The Company evaluated the impact of the adoption of this ASU on its results of operations and financial condition and determined that the impact is immaterial. |
ASU 2019-12, Income Taxes (Topic 740) | The standard simplifies the accounting for income taxes by removing various exceptions. | January 1, 2021 | The Company is currently evaluating the impact of the adoption of this ASU on its results of operations and financial condition. |
50
Note 3 - Segment Information
We conduct our business activities and report financial results as one business segment. The presentation of financial results as one reportable segment is consistent with the way the Company operates its business and is consistent with the manner in which the Chief Operating Decision Maker (CODM) evaluates performance and makes resource and operating decisions for the business as described above. Furthermore, the Company notes that monitoring financial results as one reportable segment helps the CODM manage costs on a consolidated basis, consistent with the integrated nature of the operations.
Geographic Information
Net sales by geographic area are reported by the country in which the customer is domiciled. Long-lived assets include property, plant and equipment and intangible assets subject to amortization. Long-lived assets by geographic area are reported by the location of the TimkenSteel operations to which the asset is attributed.
Year Ended December 31, | |||||||||||
2019 | 2018 | 2017 | |||||||||
Net Sales: | |||||||||||
United States | $1,096.8 | $1,456.2 | $1,207.7 | ||||||||
Foreign | 112.0 | 154.4 | 121.5 | ||||||||
$1,208.8 | $1,610.6 | $1,329.2 | |||||||||
December 31, | |||||||
2019 | 2018 | ||||||
Long-lived Assets, net: | |||||||
United States | $654.8 | $692.0 | |||||
Foreign | 0.2 | 0.2 | |||||
$655.0 | $692.2 | ||||||
Note 4 - Revenue Recognition
The following table provides the major sources of revenue by end-market sector for the years ended December 31, 2019, 2018 and 2017:
Year Ended December 31, | |||||||||||
2019 | 2018 | 2017 | |||||||||
Mobile | $479.3 | $553.9 | $528.6 | ||||||||
Industrial | 486.3 | 637.5 | 486.4 | ||||||||
Energy | 166.4 | 265.6 | 141.7 | ||||||||
Other(1) | 76.8 | 153.6 | 172.5 | ||||||||
Total Net Sales | $1,208.8 | $1,610.6 | $1,329.2 | ||||||||
(1) “Other” for sales by end market sector includes the Company’s scrap and OCTG billet sales.
The following table provides the major sources of revenue by product type for the years ended December 31, 2019, 2018 and 2017:
Year Ended December 31, | |||||||||||
2019 | 2018 | 2017 | |||||||||
Bar | $783.0 | $1,030.7 | $850.0 | ||||||||
Tube | 151.8 | 254.7 | 176.9 | ||||||||
Value-add | 240.6 | 284.3 | 265.3 | ||||||||
Other(2) | 33.4 | 40.9 | 37.0 | ||||||||
Total Net Sales | $1,208.8 | $1,610.6 | $1,329.2 | ||||||||
51
(2) “Other” for sales by product type includes the Company’s scrap sales.
Note 5 - Restructuring Charges
During 2019, TimkenSteel made organizational changes to enhance profitable and sustainable growth. These company-wide actions included the restructuring of its business support functions, the reduction of management layers throughout the organization, the announced closure of the TimkenSteel Material Services (TMS) facility in Houston, Texas (See “Note 6 - Disposition of Non-Core Assets”), and other actions to further improve the Company’s overall cost structure. Through these restructuring efforts, the Company eliminated approximately 150 salaried positions and recognized restructuring charges of $8.6 million, consisting of severance and employee-related benefits. TimkenSteel recorded reserves for such restructuring charges as other current liabilities on the Consolidated Balance Sheets. The reserve balance at December 31, 2019 is expected to be substantially used in the next twelve months.
The following is a summary of the restructuring reserve for the twelve months ended December 31, 2019:
Balance at December 31, 2018 | $— | ||
Expenses (1) | 8.6 | ||
Payments | (2.6 | ) | |
Balance at December 31, 2019 | $6.0 | ||
(1) Expenses of $8.6 million exclude stock compensation of $0.3 million that was accelerated as a result of the Company’s restructuring activities.
There were no restructuring charges for the years ended December 31, 2018 and 2017.
52
Note 6 - Disposition of Non-Core Assets
During the fourth quarter of 2019, management signed a letter of intent to dispose of the Company’s scrap processing facility in Akron, Ohio for cash consideration of approximately $4.0 million. This letter of intent and cash consideration were for the land, buildings, machinery and equipment associated with this facility.
As a result of the agreement to sell the scrap processing facility, the Company ceased depreciation of the assets and recorded them as assets held for sale on the Consolidated Balance Sheet as of December 31, 2019. This disposal does not represent a discontinued operation. Additionally, the Company recorded an impairment charge of $7.3 million in the fourth quarter of 2019 which represents the cash consideration to be received less cost to sell the assets compared with the $11.3 million carrying value of the assets being sold, including supplies inventory. The sale of the assets was completed in the first quarter of 2020.
Additionally, in the fourth quarter of 2019, the Board of Directors approved a plan to close the Company’s TMS facility in Houston, Texas in the first quarter of 2020. The closure of the facility does not qualify as a discontinued operation. At December 31, 2019, the associated assets did not meet the criteria to be classified as held for sale. As a result of the plan, the Company recorded the following charges in the fourth quarter of 2019:
• | Restructuring charges of approximately $0.7 million, primarily related to severance and other employee termination charges; |
• | Inventory write-downs of $4.8 million, which represents the difference between the expected selling price and carrying value of the related inventory. The expected selling price was based upon the Company’s most recently published price lists related to this inventory; |
• | Accelerated depreciation and amortization on TMS assets of $2.8 million in the fourth quarter of 2019, with an additional $1.6 million of accelerated depreciation to be recorded in the first quarter of 2020. Accelerated depreciation was recorded to reduce the carrying value of the assets to expected liquidation value at the end of the phase-down period in the first quarter of 2020. The liquidation value was based on initial broker estimates of fair value obtained in conjunction with the plan to close this facility. |
Note 7 - Other Income (Expense), net
The following table provides the components of other income (expense), net for the years ended December 31, 2019, 2018 and 2017:
Year Ended December 31, | |||||||||||
2019 | 2018 | 2017 | |||||||||
Pension and postretirement non-service benefit income | $17.5 | $25.2 | $17.5 | ||||||||
Loss from remeasurement of benefit plans | (40.6 | ) | (43.5 | ) | (21.8 | ) | |||||
Foreign currency exchange gain (loss) | — | (0.2 | ) | 0.3 | |||||||
Miscellaneous income (expense) | (0.2 | ) | (0.1 | ) | (0.1 | ) | |||||
Total other income (expense), net | ($23.3 | ) | ($18.6 | ) | ($4.1 | ) | |||||
Non-service benefit income from all years is derived from the Company’s pension and other postretirement plans. The Company has had a favorable return on assets for its benefit plans, resulting in a benefit for all years. The loss from remeasurement of benefit plans is due to the Company performing mark-to-market accounting on its pension and postretirement assets at year-end and upon the occurrence of certain triggering events, partially offset with curtailments of $8.9 million due to the freezing of the salaried pension plan. For more details on the remeasurement and curtailments, refer to “Note 15 - Retirement and Postretirement Plans.”
53
Note 8 - Income Tax Provision
Income (loss) from operations before income taxes, based on geographic location of the operations to which such earnings are attributable, is provided below.
Years Ended December 31, | |||||||||||
2019 | 2018 ADJUSTED | 2017 ADJUSTED | |||||||||
United States | ($130.8 | ) | ($10.1 | ) | ($37.0 | ) | |||||
Non-United States | 4.7 | 1.9 | 7.2 | ||||||||
Loss from operations before income taxes | ($126.1 | ) | ($8.2 | ) | ($29.8 | ) | |||||
The provision (benefit) for income taxes consisted of the following:
Years Ended December 31, | |||||||||||
2019 | 2018 | 2017 | |||||||||
Current: | |||||||||||
Federal | $— | $— | $1.1 | ||||||||
State and local | 0.1 | 0.3 | 0.1 | ||||||||
Foreign | 0.4 | 0.7 | 0.6 | ||||||||
Total current tax expense (benefit) | $0.5 | $1.0 | $1.8 | ||||||||
Deferred: | |||||||||||
Federal | ($14.4 | ) | $0.4 | ($0.4 | ) | ||||||
State and local | (2.0 | ) | — | — | |||||||
Foreign | (0.2 | ) | 0.4 | 0.1 | |||||||
Total deferred tax expense (benefit) | (16.6 | ) | 0.8 | (0.3 | ) | ||||||
Provision (benefit) for incomes taxes | ($16.1 | ) | $1.8 | $1.5 | |||||||
For the year ended December 31, 2019, TimkenSteel made $0.6 million in foreign tax payments, $0.2 million in state tax payments, and no U.S. federal payments, and had no refundable overpayments of state income taxes. For the year ended December 31, 2018, TimkenSteel made $0.6 million in foreign tax payments, $0.2 million in state tax payments, and no U.S. federal payments, and had no refundable overpayments of state income taxes.
54
The reconciliation between TimkenSteel’s effective tax rate on income (loss) from continuing operations and the statutory tax rate is as follows:
Years Ended December 31, | |||||||||||
2019 | 2018 | 2017 | |||||||||
Tax at the U.S. federal statutory rate | ($26.5 | ) | ($6.3 | ) | ($14.8 | ) | |||||
Adjustments: | |||||||||||
State and local income taxes, net of federal tax benefit | (1.3 | ) | (0.5 | ) | (0.7 | ) | |||||
Foreign earnings taxed at different rates | — | 0.2 | (0.2 | ) | |||||||
U.S. research tax credit | 0.2 | (0.2 | ) | (0.2 | ) | ||||||
Valuation allowance | 10.2 | 7.5 | 6.3 | ||||||||
Global intangible low-taxed income | 0.2 | 0.5 | — | ||||||||
Tax reform impact - transition tax and rate change | — | — | 10.2 | ||||||||
Permanent differences | 1.3 | 0.8 | 0.3 | ||||||||
Other items, net | (0.2 | ) | (0.2 | ) | 0.6 | ||||||
Provision (benefit) for income taxes | ($16.1 | ) | $1.8 | $1.5 | |||||||
Effective tax rate | 12.8 | % | (5.9 | )% | (3.7 | )% | |||||
Income tax expense includes U.S. and international income taxes. Except as required under U.S. tax law, U.S. income and foreign withholding taxes have not been recognized on the excess of the amount for financial reporting over the tax basis of investments in foreign subsidiaries that is indefinitely reinvested outside the U.S. This amount becomes taxable upon a repatriation of assets from the subsidiary or a sale or liquidation of the subsidiary. Undistributed earnings of foreign subsidiaries outside of the U.S. were $6.5 million, $5.5 million and $2.9 million at December 31, 2019, 2018 and 2017, respectively. The 2017 cumulative earnings amounts were recognized through the transition tax calculation pursuant to the Tax and Jobs Act enacted on December 22, 2017. The Company has recognized a deferred tax liability in the amount of $0.7 million and $0.6 million at December 31, 2019 and 2018, respectively, for undistributed earnings at its TimkenSteel (Shanghai) Corporation Limited and TimkenSteel de Mexico S. de R.C. de C.V. subsidiaries, as those earnings are not permanently reinvested by the Company.
55
The effect of temporary differences giving rise to deferred tax assets and liabilities at December 31, 2019 and 2018 was as follows:
December 31, | |||||||
2019 | 2018 | ||||||
Deferred tax liabilities: | |||||||
Depreciation | ($98.6 | ) | ($101.4 | ) | |||
Inventory | (24.3 | ) | (9.9 | ) | |||
Convertible debt | (1.7 | ) | (2.6 | ) | |||
Lease liability | (3.4 | ) | — | ||||
Other, net | (0.7 | ) | (0.7 | ) | |||
Deferred tax liabilities | ($128.7 | ) | ($114.6 | ) | |||
Deferred tax assets: | |||||||
Pension and postretirement benefits | $47.9 | $55.2 | |||||
Other employee benefit accruals | 7.2 | 7.1 | |||||
Tax loss carryforwards | 86.0 | 82.0 | |||||
Intangible assets | 1.1 | 1.1 | |||||
Inventory | 5.4 | 1.2 | |||||
State decoupling | 4.5 | 5.1 | |||||
Leases - right-of-use asset | 3.4 | — | |||||
Interest limitation | 6.0 | 3.2 | |||||
Other, net | 1.2 | 2.6 | |||||
Deferred tax assets subtotal | $162.7 | $157.5 | |||||
Valuation allowances | (34.9 | ) | (43.7 | ) | |||
Deferred tax assets | 127.8 | 113.8 | |||||
Net deferred tax assets (liabilities) | ($0.9 | ) | ($0.8 | ) | |||
As of December 31, 2019 and 2018, the Company had a deferred tax liability of $0.9 million and $0.8 million, respectively, on the Consolidated Balance Sheets.
As of December 31, 2019, TimkenSteel had loss carryforwards in the U.S. and various non-U.S. jurisdictions totaling $370.1 million (of which $314.9 relates to the U.S. and $55.2 million relates to the UK jurisdiction), having various expiration dates. TimkenSteel has provided valuation allowances of $34.9 million against these carryforwards. The majority of the non-U.S. loss carryforwards represent local country net operating losses for branches of TimkenSteel or entities treated as branches of TimkenSteel under U.S. tax law. Tax benefits have previously been recorded for these losses in the U.S. The related local country net operating loss carryforwards are offset fully by valuation allowances. As of December 31, 2019, TimkenSteel had a gross deferred tax asset for disallowed business interest in the U.S. of $25.2 million, which carries forward indefinitely.
During the fourth quarter of 2019, TimkenSteel elected to change its method for valuing its inventories that previously used the LIFO method to the FIFO method. For tax purposes, prior to this change, the Company had a LIFO reserve of approximately $130 million. The LIFO reserve will be treated as taxable income over a four year period beginning in 2019. The Company expects this income to be fully offset by our net operating losses resulting in no cash tax liability. A deferred tax liability has been established for the future reversal amount and is included in the inventory line in the table above.
During 2016, operating losses generated in the U.S. resulted in a decrease in the carrying value of the Company’s U.S. deferred tax liability to the point that would result in a net U.S. deferred tax asset at December 31, 2016. In light of TimkenSteel’s operating performance in the U.S. and current industry conditions, the Company assessed, based upon all available evidence, and concluded that it was more likely than not that it would not realize a portion of its U.S. deferred tax assets. The Company recorded a valuation allowance in 2016 and as a result of current year activity, the Company remained in a full valuation allowance position through 2019. Going forward, the need to maintain valuation allowances against deferred tax assets in the U.S. and other affected
56
countries will cause variability in the Company’s effective tax rate. The Company will maintain a valuation allowance against its deferred tax assets in the U.S. and applicable foreign countries until sufficient positive evidence exists to eliminate them.
TimkenSteel records interest and penalties related to uncertain tax positions as a component of provision (benefit) for income taxes. As of December 31, 2019, 2018 and 2017, TimkenSteel had no total gross unrecognized tax benefits, and no amounts which represented unrecognized tax benefits that would favorably impact TimkenSteel’s effective income tax rate in any future periods if such benefits were recognized. As of December 31, 2019, TimkenSteel does not anticipate a change in its unrecognized tax positions during the next 12 months. TimkenSteel had no accrued interest and penalties related to uncertain tax positions as of December 31, 2019, 2018 and 2017.
TimkenSteel does not have any unrecognized tax benefits as of years ended December 31, 2019, 2018, and 2017.
As of December 31, 2019, TimkenSteel is not subject to examination by the IRS. Pursuant to the Tax Sharing Agreement dated June 30, 2014 between TimkenSteel and The Timken Company, TimkenSteel may be subject to results from tax examinations for The Timken Company for federal, state and local and various foreign tax jurisdictions in various open audit periods.
Tax Cuts and Jobs Act Bill
On December 22, 2017, the Tax Cuts and Jobs Act (the Act) was signed into law, which resulted in significant changes to U.S. tax and related laws. Some of the provisions of the Act affecting corporations include, but are not limited to, a reduction in the federal corporate income tax rate from 35% to 21%, expensing the cost of acquired qualified property, the elimination of alternative minimum tax, a modification of the net operating loss deduction, and the creation of global intangible low-taxed income. Further, several changes and limitations to deductions were encompassed in the new law and were effective for TimkenSteel in 2018, including, interest expense, performance-based compensation, meals and entertainment expenses, transportation fringe benefits, and elimination of the domestic production activities deduction. We have evaluated the impact of the new tax law on TimkenSteel’s financial condition and results of operations. We did not experience a significant reduction in our effective income tax rate or our net deferred federal income tax assets as a result of the income tax rate reduction or changes to U.S. tax law.
57
Note 9 - Earnings (Loss) Per Share
Basic loss per share is computed based upon the weighted average number of common shares outstanding. Diluted loss per share is computed based upon the weighted average number of common shares outstanding plus the dilutive effect of common share equivalents calculated using the treasury stock method or if-converted method. For the Convertible Notes, the Company utilizes the if-converted method to calculate diluted loss per share. Under the if-converted method, the Company adjusts net earnings to add back interest expense (including amortization of debt discount) recognized on the Convertible Notes and includes the number of shares potentially issuable related to the Convertible Notes in the weighted average shares outstanding. Treasury stock is excluded from the denominator in calculating both basic and diluted loss per share.
For the years ended December 31, 2019, 2018 and 2017, 3.7 million, 3.3 million, and 3.1 million shares issuable for equity-based awards, respectively, were excluded from the computation of diluted loss per share because the effect of their inclusion would have been anti-dilutive. In periods in which a net loss has occurred, as is the case for years ended December 31, 2019, 2018 and 2017, the dilutive effect of equity-based awards is not recognized and thus not utilized in the calculation of diluted loss per share, because the effect of their inclusion would have been anti-dilutive. The shares potentially issuable of 6.9 million related to the Convertible Notes were also anti-dilutive for the years ended December 31, 2019, 2018 and 2017.
The following table sets forth the reconciliation of the numerator and the denominator of basic and diluted loss per share for the years ended December 31, 2019, 2018 and 2017:
Year Ended December 31, | |||||||||||
2019 | 2018 ADJUSTED | 2017 ADJUSTED | |||||||||
Numerator: | |||||||||||
Net income (loss) | ($110.0 | ) | ($10.0 | ) | ($31.3 | ) | |||||
Denominator: | |||||||||||
Weighted average shares outstanding, basic | 44.8 | 44.6 | 44.4 | ||||||||
Weighted average shares outstanding, diluted | 44.8 | 44.6 | 44.4 | ||||||||
Basic earnings (loss) per share | ($2.46 | ) | ($0.22 | ) | ($0.70 | ) | |||||
Diluted earnings (loss) per share | ($2.46 | ) | ($0.22 | ) | ($0.70 | ) | |||||
Note 10 - Inventories
The components of inventories as of December 31, 2019 and 2018 were as follows:
December 31, | |||||||
2019 | 2018 ADJUSTED | ||||||
Manufacturing supplies | $49.8 | $46.9 | |||||
Raw materials | 26.0 | 35.2 | |||||
Work in process | 123.7 | 155.7 | |||||
Finished products | 93.1 | 142.8 | |||||
Gross inventory | 292.6 | 380.6 | |||||
Allowance for inventory reserves | (10.7 | ) | (6.1 | ) | |||
Total inventories, net | $281.9 | $374.5 | |||||
Previously, the Company utilized the LIFO method to account for a substantial portion of its inventory. As described in Note 1, in the fourth quarter of 2019 the Company elected to change the method of accounting for the inventory under the LIFO method to the FIFO method. The effects of this change in accounting principle have been retrospectively applied to all periods presented. The remaining inventories, including raw materials, manufacturing supplies inventory as well as international inventories, were not impacted by this change in accounting principle and continue to be valued by the average cost or FIFO methods.
58
In connection with the announced closure of TMS, the company recorded an additional reserve against inventory of $4.8 million to state it at the lower of cost or net realizable value. See “Note 6 - Disposition of Non-Core Assets.”
Note 11 - Property, Plant and Equipment
The components of property, plant and equipment, net as of December 31, 2019 and 2018 were as follows:
December 31, | |||||||
2019 | 2018 | ||||||
Land | $13.3 | $14.1 | |||||
Buildings and improvements | 419.0 | 424.4 | |||||
Machinery and equipment | 1,404.6 | 1,404.2 | |||||
Construction in progress | 30.9 | 28.5 | |||||
Subtotal | 1,867.8 | 1,871.2 | |||||
Less allowances for depreciation | (1,241.4 | ) | (1,196.8 | ) | |||
Property, plant and equipment, net | $626.4 | $674.4 | |||||
Total depreciation expense was $67.4 million, $67.5 million, and $68.3 million for the years ended December 31, 2019, 2018, and 2017 respectively. Depreciation expense in 2019 includes $1.9 million of accelerated depreciation related to the announced closure of TMS. See “Note 6 - Disposition of Non-Core Assets” for additional information. For the year ended December 31, 2019, TimkenSteel recorded impairments and loss on disposal of assets of $9.0 million primarily related to the abandonment of certain equipment and the impairment of assets held for sale. For the years ended December 31, 2018 and 2017, TimkenSteel recorded approximately $0.5 million and $0.7 million, respectively, of impairment charges and loss on sale or disposal of assets related to the discontinued use of certain assets.
Note 12 - Intangible Assets
The components of intangible assets, net as of December 31, 2019 and 2018 were as follows:
December 31, 2019 | December 31, 2018 | ||||||||||||||||||||||
Gross Carrying Amount | Accumulated Amortization | Net Carrying Amount | Gross Carrying Amount | Accumulated Amortization | Net Carrying Amount | ||||||||||||||||||
Customer relationships | $6.3 | $5.0 | $1.3 | $6.3 | $4.6 | $1.7 | |||||||||||||||||
Technology use | 9.0 | 8.0 | 1.0 | 9.0 | 6.5 | 2.5 | |||||||||||||||||
Capitalized software | 61.1 | 49.1 | 12.0 | 61.6 | 48.0 | 13.6 | |||||||||||||||||
Total intangible assets | $76.4 | $62.1 | $14.3 | $76.9 | $59.1 | $17.8 | |||||||||||||||||
Intangible assets subject to amortization are amortized on a straight-line method over their legal or estimated useful lives. The weighted average useful lives of the customer relationships, technology use and capitalized software are 15 years, 15 years and 6 years, respectively. The weighted average useful life of total intangible assets is 8 years. Amortization expense for intangible assets for the years ended December 31, 2019, 2018, and 2017 was $6.1 million, $5.5 million and $6.6 million, respectively. Amortization expense in 2019 includes accelerated amortization of $0.9 million related to the announced closure of TMS. See “Note 6 - Disposition of Non-Core Assets” for additional information. During the year ended December 31, 2019, TimkenSteel recorded a loss on disposal of $0.1 million. For the year ended December 31, 2018, TimkenSteel recorded approximately $0.4 million of impairment charges due to the discontinued use of certain capitalized software. No impairment charges were recorded for the year ended December 31, 2017.
Based upon the intangible assets subject to amortization as of December 31, 2019, TimkenSteel’s estimated annual amortization for the five succeeding years is shown below (in millions):
59
Year | Amortization Expense |
2020 | $3.3 |
2021 | 2.0 |
2022 | 1.8 |
2023 | 1.7 |
2024 | 0.8 |
60
Note 13 - Leases
The Company has operating leases for office space, warehouses, land, machinery and equipment, vehicles and certain information technology equipment. These leases have remaining lease terms of less than one year to six years, some of which may include options to extend the leases for one or more years. Certain leases also include options to purchase the leased property. As of December 31, 2019, the Company has no financing leases. The weighted average remaining lease term for our operating leases as of December 31, 2019 was 2.9 years
Leases with an initial term of 12 months or less (short-term leases) are not recorded on the balance sheet; the Company recognizes lease expense for these leases on a straight-line basis over the lease term. For lease agreements entered into after the adoption of ASC 842, the Company combines lease and non-lease components. The Company’s lease agreements do not contain material residual value guarantees or material restrictive covenants.
The Company recorded lease cost for the year ended December 31, 2019 as follows:
Year Ended December 31, 2019 | |||
Operating lease cost | $7.4 | ||
Short-term lease cost | 1.9 | ||
Total lease cost | $9.3 | ||
When available, the rate implicit in the lease is used to discount lease payments to present value; however, the Company’s leases generally do not provide a readily determinable implicit rate. Therefore, the incremental borrowing rate to discount the lease payments is estimated using market-based information available at lease commencement. The weighted average discount rate used to measure our operating lease liabilities as of December 31, 2019 was 4.5%.
Supplemental cash flow information related to leases was as follows:
Year Ended December 31, 2019 | |||
Cash paid for amounts included in the measurement of operating lease liabilities | $7.5 | ||
Right-of-use assets obtained in exchange for operating lease obligations | $4.3 | ||
Future minimum lease payments under non-cancellable leases as of December 31, 2019 were as follows:
2020 | $6.8 | ||
2021 | 4.6 | ||
2022 | 2.2 | ||
2023 | 1.3 | ||
After 2023 | 0.5 | ||
Total future minimum lease payments | 15.4 | ||
Less amount of lease payment representing interest | (1.0 | ) | |
Total present value of lease payments | $14.4 | ||
61
Future minimum lease payments under non-cancellable leases as of December 31, 2018 were as follows:
2019 | $6.3 | ||
2020 | 5.2 | ||
2021 | 3.3 | ||
2022 | 1.0 | ||
2023 | 0.6 | ||
After 2023 | — | ||
Total future minimum lease payments | $16.4 | ||
As of December 31, 2019, we have additional operating leases that have not yet commenced for which the present value of lease payments over the respective lease terms totals approximately $7.6 million. These leases are primarily manufacturing equipment to support the Company’s mobile value-added powertrain component product sales. These operating leases will commence in the first half of 2020 with lease terms of three to four years. Accordingly, these leases are not recorded on the Consolidated Balance Sheet at December 31, 2019.
Note 14 - Financing Arrangements
Credit Agreement
On January 26, 2018, the Company, as borrower, and certain domestic subsidiaries, as subsidiary guarantors, entered into the Second Amended and Restated Credit Agreement (Credit Agreement), with JP Morgan Chase Bank, N.A., as administrative agent, Bank of America, N.A., as syndication agent, and the other lenders party thereto, which amended and restated the Company’s credit agreement dated as of February 26, 2016.
Amended Credit Agreement
On October 15, 2019, the Company, as borrower, and certain domestic subsidiaries of the Company, as subsidiary guarantors, entered into a Third Amended and Restated Credit Agreement (the Amended Credit Agreement), with JP Morgan Chase Bank, N.A., as administrative agent (the Administrative Agent), Bank of America, N.A., as syndication agent, and the other lenders party thereto (collectively, the Lenders), which further amended and restated the Company’s existing Credit Agreement dated as of January 26, 2018.
The Amended Credit Agreement provides for a $400.0 million asset-based revolving credit facility (the Credit Facility), including a $15.0 million sublimit for the issuance of commercial and standby letters of credit and a $40.0 million sublimit for swingline loans. Pursuant to the terms of the Amended Credit Agreement, the Company is entitled, on up to two occasions and subject to the satisfaction of certain conditions, to request increases in the commitments under the Amended Credit Agreement in the aggregate principal amount of up to $100.0 million, to the extent that existing or new lenders agree to provide such additional commitments. In addition to and independent of any increase described in the preceding sentence, the Company is entitled, subject to the satisfaction of certain conditions, to request a separate first-in, last-out (FILO) tranche in an aggregate principal amount of up to $30.0 million with a separate borrowing base and interest rate margins, in each case, to be agreed upon among the Company, the Administrative Agent and the Lenders providing the incremental FILO tranche.
The availability of borrowings under the Credit Facility is subject to a borrowing base calculation based upon a valuation of the eligible accounts receivable, inventory and machinery and equipment of the Company and the subsidiary guarantors, each multiplied by an applicable advance rate. The availability of borrowings may be further modified by reserves established from time to time by the Administrative Agent in its permitted discretion.
The interest rate per annum applicable to loans under the Credit Facility will be, at the Company’s option, equal to either (i) the alternate base rate plus the applicable margin or (ii) the relevant adjusted LIBO rate for an interest period of one, two, three or six months (as selected by the Company) plus the applicable margin. The base rate will be a fluctuating rate per annum equal to the greatest of (i) the prime rate as quoted in The Wall Street Journal, (ii) the effective Federal Reserve Bank of New York rate plus 0.50% and (iii) the adjusted LIBO rate for a one-month interest period on the applicable date, plus 1.00%. The adjusted LIBO rate will be equal to the applicable London interbank offered rate for the selected interest period, as adjusted for statutory reserve requirements for eurocurrency liabilities. The applicable margin will be determined by a pricing grid based on the Company’s average quarterly availability. In addition, the Company will pay a 0.25% per annum commitment fee on the average daily unused
62
amount of the Credit Facility. The interest rate under the Amended Credit Agreement was 3.3% as of December 31, 2019. The amount available under the Amended Credit Agreement as of December 31, 2019 was $203.2 million.
All of the indebtedness under the Credit Facility is guaranteed by the Company’s material domestic subsidiaries, as well as any other domestic subsidiary that the Company elects to make a party to the Amended Credit Agreement, and is secured by substantially all of the personal property of the Company and the subsidiary guarantors.
The Credit Facility matures on October 15, 2024. Prior to the maturity date, amounts outstanding are required to be repaid (without reduction of the commitments thereunder) from mandatory prepayment events from the proceeds of certain asset sales, equity or debt issuances or casualty events.
The Amended Credit Agreement contains certain customary covenants, including covenants that limit the ability of the Company and its subsidiaries to, among other things, (i) incur or suffer to exist certain liens, (ii) make investments, (iii) incur or guaranty additional indebtedness, (iv) enter into consolidations, mergers, acquisitions, sale-leaseback transactions and sales of assets, (v) make distributions and other restricted payments, (vi) change the nature of its business, (vii) engage in transactions with affiliates and (viii) enter into restrictive agreements, including agreements that restrict the ability to incur liens or make distributions.
In addition, the Amended Credit Agreement requires the Company to (i) unless certain conditions are met, maintain certain minimum liquidity as specified in the Amended Credit Agreement during the period commencing on March 1, 2021 and ending on June 1, 2021 and (ii) maintain a minimum specified fixed charge coverage ratio on a springing basis if minimum availability requirements as specified in the Amended Credit Agreement are not maintained.
The Amended Credit Agreement contains certain customary events of default. If any event of default occurs and is continuing, the Lenders would be entitled to take various actions, including the acceleration of amounts due under the Amended Credit Agreement, and exercise other rights and remedies.
Convertible Notes
In May 2016, the Company issued $75.0 million aggregate principal amount of Convertible Senior Notes, and an additional $11.3 million principal amount to cover over-allotments (Convertible Notes). The Indenture for the Convertible Notes dated May 31, 2016, which was filed with the Securities and Exchange Commission as an exhibit to a Form 8-K filed on May 31, 2016, contains a complete description of the terms of the Convertible Notes. The key terms are as follows:
Maturity Date: June 1, 2021 unless repurchased or converted earlier
Interest Rate: 6.0% cash interest per year
Interest Payments Dates: June 1 and December 1 of each year, beginning on December 1, 2016
Initial Conversion Price: Approximately $12.58 per common share of the Company
Initial Conversion Rate: 79.5165 common shares per $1,000 principal amount of Notes
The net proceeds to the Company from the offering were $83.2 million, after deducting the initial underwriters’ discount and fees and the offering expenses payable by the Company. The Company used the net proceeds to repay a portion of the amounts outstanding under its revolving credit agreement.
The components of the Convertible Notes as of December 31, 2019 and December 31, 2018 were as follows:
Year Ended December 31, | |||||||
2019 | 2018 | ||||||
Principal | $86.3 | $86.3 | |||||
Less: Debt issuance costs, net of amortization | (0.7 | ) | (1.2 | ) | |||
Less: Debt discount, net of amortization | (7.0 | ) | (11.0 | ) | |||
Convertible notes, net | $78.6 | $74.1 | |||||
The initial value of the principal amount recorded as a liability at the date of issuance was $66.9 million, using an effective interest rate of 12.0%. The remaining $19.4 million of principal amount was allocated to the conversion feature and recorded as
63
a component of shareholders’ equity at the date of issuance. This amount represents a discount to the debt to be amortized through interest expense using the effective interest method through the maturity of the Convertible Notes.
Transaction costs were allocated to the liability and equity components based on their relative values. Transaction costs attributable to the liability component of $2.4 million are amortized to interest expense over the term of the Convertible Notes, and transaction costs attributable to the equity component of $0.7 million are included in shareholders’ equity.
The following table sets forth total interest expense recognized related to the Convertible Notes:
Year Ended December 31, | |||||||
2019 | 2018 | ||||||
Contractual interest expense | $5.2 | $5.2 | |||||
Amortization of debt issuance costs | 0.4 | 0.4 | |||||
Amortization of debt discount | 4.0 | 3.6 | |||||
Total | $9.6 | $9.2 | |||||
Revenue Refunding Bonds
On January 23, 2018, the Company redeemed in full $12.2 million of Ohio Water Development Revenue Refunding Bonds (originally due on November 1, 2025), $9.5 million of Ohio Air Quality Development Revenue Refunding Bonds (originally due on November 1, 2025) and $8.5 million of Ohio Pollution Control Revenue Refunding Bonds (originally due on June 1, 2033).
Fair Value Measurement
The fair value of the Convertible Notes was approximately $89.3 million as of December 31, 2019. The fair value of the Convertible Notes, which falls within Level 1 of the fair value hierarchy as defined by Accounting Standards Codification (ASC) 820, Fair Value Measurements, is based on the last price traded in December 2019.
TimkenSteel’s Credit Facility is variable-rate debt. As such, the carrying value is a reasonable estimate of fair value as interest rates on these borrowings approximate current market rates. This valuation falls within Level 2 of the fair value hierarchy and is based on quoted prices for similar assets and liabilities in active markets that are observable either directly or indirectly.
Interest Paid
The total cash interest paid for the year ended December 31, 2019 and 2018 was $11.5 million and $11.8 million, respectively.
Note 15 - Retirement and Postretirement Plans
Eligible TimkenSteel employees, including certain employees in foreign countries, participate in the following TimkenSteel-sponsored plans: TimkenSteel Corporation Retirement Plan; TimkenSteel Corporation Bargaining Unit Pension Plan, Supplemental Pension Plan of TimkenSteel Corporation, TimkenSteel U.K. Pension Scheme, TimkenSteel Corporation Bargaining Unit Welfare Benefit Plan for Retirees, and TimkenSteel Corporation Welfare Benefit Plan for Retirees.
During the second quarter of 2019, the Company amended the TimkenSteel Corporation Bargaining Unit Welfare Plan for Retirees relating to moving Medicare-eligible retirees to an individual plan on a Medicare healthcare exchange. The amendment reduced the postretirement liability by $70.2 million, and required the Company to perform a full remeasurement of its obligation and plan assets as of April 30, 2019. The $70.2 million reduction in the APBO was recognized in Other Comprehensive Income (Loss) and is being amortized as an offset to postretirement benefit cost over a period of 12 years (average remaining service period). In addition to the reduction of the APBO, the Company recognized a net remeasurement loss of $4.4 million.
During the fourth quarter of 2019, the Company amended the Supplemental Pension Plan of TimkenSteel Corporation, which provides for the payment of nonqualified supplemental pension benefits to certain salaried participants in the TimkenSteel Corporation Retirement Plan. The amendment provides for the cessation of benefit accruals under the Supplemental Plan, effective as of December 31, 2020. Effective January 1, 2021, there will be no new accruals of benefits, including with respect to service accruals and the final average compensation determination. Certain of the Company’s named executive officers are participants in the plan. Existing benefits under the plan, as of December 31, 2020, will otherwise continue in accordance with the terms of the plan. This amendment reduced the pension liability, resulting in a curtailment gain of $0.8 million. This curtailment gain was recognized in Other Income (Expense) in the Consolidated Statement of Operations.
64
During the fourth quarter of 2019, the Company amended the TimkenSteel Corporation Retirement Plan, which provides payments of tax-qualified pension benefits to certain salaried employees of the Company and its subsidiaries, to cease benefit accruals under the Pension Plan for all remaining active participants, effective as of December 31, 2020. This plan amendment reduced the pension liability, resulting in a curtailment gain of $8.1 million. This curtailment gain was recognized in Other Income (Expense) in the Consolidated Statement of Operations.
During the fourth quarter of 2019, the Company also amended the TimkenSteel Corporation Welfare Benefit Plan for Retirees, under which certain retired salaried employees of the Company and its subsidiaries are eligible to receive a Company contribution for their medical and prescription drug benefits under the retiree welfare plan. The amendment was to eliminate the retiree medical subsidy, effective as of December 31, 2019, for all remaining active salaried participants who retire after December 31, 2019 (provided, however, that participants who are laid off on or before March 31, 2020 and who otherwise qualify for the retiree medical subsidy under the terms of the retiree welfare plan remain entitled to receive the retiree medical subsidy). This plan amendment reduced the pension liability by $2.3 million, was recognized in Other Comprehensive Income (Loss) and is being amortized as an offset to postretirement benefit cost in future periods.
Pension benefits earned are generally based on years of service and compensation during active employment. TimkenSteel’s funding policy is consistent with the funding requirements of applicable laws and regulations. Asset allocations are established in a manner consistent with projected plan liabilities, benefit payments and expected rates of return for the various asset classes. The expected rate of return for the investment portfolio is based on expected rates of return for various asset classes, as well as historical asset class and fund performance.
The following tables set forth the change in benefit obligation, change in plan assets, funded status and amounts recognized on the Consolidated Balance Sheets for the defined benefit pension plans as of December 31, 2019 and 2018:
Pension | Postretirement | ||||||||||||
Change in benefit obligation: | 2019 | 2018 | 2019 | 2018 | |||||||||
Benefit obligation at the beginning of year | $1,178.3 | $1,282.1 | $194.7 | $216.2 | |||||||||
Service cost | 17.4 | 17.2 | 1.1 | 1.6 | |||||||||
Interest cost | 48.9 | 45.6 | 5.9 | 7.6 | |||||||||
Actuarial (gains) losses | 145.7 | (70.4 | ) | 11.4 | (11.7 | ) | |||||||
Benefits paid | (72.3 | ) | (92.4 | ) | (14.4 | ) | (19.0 | ) | |||||
Plan amendment | (0.7 | ) | 0.5 | (72.5 | ) | — | |||||||
Curtailments | (8.9 | ) | — | — | — | ||||||||
Foreign currency translation adjustment | 3.0 | (4.3 | ) | — | — | ||||||||
Benefit obligation at the end of year | $1,311.4 | $1,178.3 | $126.2 | $194.7 | |||||||||
Pension | Postretirement | ||||||||||||
Change in plan assets: | 2019 | 2018 | 2019 | 2018 | |||||||||
Fair value of plan assets at the beginning of year | $1,054.4 | $1,186.6 | $86.1 | $104.0 | |||||||||
Actual return on plan assets | 167.7 | (45.5 | ) | 8.9 | (1.3 | ) | |||||||
Company contributions / payments | 2.0 | 10.6 | 1.7 | 2.4 | |||||||||
Benefits paid | (72.3 | ) | (92.4 | ) | (14.4 | ) | (19.0 | ) | |||||
Foreign currency translation adjustment | 3.6 | (4.9 | ) | — | — | ||||||||
Fair value of plan assets at end of year | $1,155.4 | $1,054.4 | $82.3 | $86.1 | |||||||||
Funded status at end of year | ($156.0 | ) | ($123.9 | ) | ($43.9 | ) | ($108.6 | ) | |||||
The TimkenSteel Corporation Retirement Plan (Salaried Plan) has a provision that permits employees to elect to receive their pension benefits in a lump sum. In the fourth quarter 2018, the cumulative cost of all lump sums exceeded the sum of the service cost and interest cost components of net periodic pension cost for the Salaried Plan. For the year ended December 31, 2018 total settlements were $26.0 million. These settlements are included in benefits paid in the tables above and in the net remeasurement losses (gains) as a component of net periodic benefit cost. The cumulative cost of all lump sums did not exceed service cost and interest cost components of net periodic pension cost for the year ended December 31, 2019.
65
For the years ended December 31, 2019 and 2018, the pension plan had administrative expenses of $3.5 million and $2.2 million, respectively. These expenses are included in benefits paid in the tables above.
The accumulated benefit obligation at December 31, 2019 exceeded the fair value of plan assets for two of the Company’s pension plans. For these plans, the benefit obligation was $998.5 million, the accumulated benefit obligation was $983.6 million and the fair value of plan assets was $817.3 million as of December 31, 2019.
The total pension accumulated benefit obligation for all plans was $1,294.5 million and $1,149.8 million as of December 31, 2019 and 2018, respectively.
Amounts recognized on the balance sheet at December 31, 2019 and 2018, for TimkenSteel’s pension and postretirement benefit plans include:
Pension | Postretirement | ||||||||||||
2019 | 2018 | 2019 | 2018 | ||||||||||
Non-current assets | $25.2 | $10.5 | $— | $— | |||||||||
Current liabilities | (0.6 | ) | (0.6 | ) | (2.4 | ) | (2.4 | ) | |||||
Non-current liabilities | (180.6 | ) | (133.8 | ) | (41.5 | ) | (106.2 | ) | |||||
Total | ($156.0 | ) | ($123.9 | ) | ($43.9 | ) | ($108.6 | ) | |||||
Included in accumulated other comprehensive loss at December 31, 2019 and 2018, were the following before-tax amounts that had not been recognized in net periodic benefit cost:
Pension | Postretirement | ||||||||||||
2019 | 2018 | 2019 | 2018 | ||||||||||
Unrecognized prior service (benefit) cost | $0.5 | $1.6 | ($67.8 | ) | $0.9 | ||||||||
Amounts expected to be amortized from accumulated other comprehensive loss (income) and included in total net periodic benefit cost during the year ended December 31, 2020 are as follows:
Pension | Postretirement | ||||||
Prior service (benefit) cost | $0.3 | ($6.0 | ) | ||||
Pension | Postretirement | ||||||||
Assumptions: | 2019 | 2018 | 2019 | 2018 | |||||
Discount rate | 3.42 | % | 4.30 | % | 3.42 | % | 4.34 | % | |
Future compensation assumption | 2.32 | % | 2.36 | % | n/a | n/a | |||
The weighted average assumptions used in determining benefit cost for the years ended December 31, 2019 and 2018 were as follows:
Pension | Postretirement | ||||||||
Assumptions: | 2019 | 2018 | 2019 | 2018 | |||||
Discount rate(1) | 4.30 | % | 3.68 | % | 4.34% /3.94% | 3.66 | % | ||
Future compensation assumption | 2.36 | % | 2.37 | % | n/a | n/a | |||
Expected long-term return on plan assets | 6.41 | % | 6.45 | % | 5.00 | % | 5.00 | % | |
(1) The discount rate for the postretirement plans was adjusted after the second quarter 2019 amendment. To calculate benefit costs, the discount rate of 4.34% was used for January to April and the discount rate of 3.94% was used for May to December.
66
The discount rate assumption is based on current rates of high-quality long-term corporate bonds over the same period that benefit payments will be required to be made. The expected rate of return on plan assets assumption is based on the weighted-average expected return on the various asset classes in the plans’ portfolios. The asset class return is developed using historical asset return performance as well as current market conditions such as inflation, interest rates and equity market performance.
For measurement purposes, TimkenSteel assumed a weighted-average annual rate of increase in the per capita cost (health care cost trend rate) of 5.75% and 6.00% for 2019 and 2018, respectively. A one percentage point increase in the assumed health care cost trend rate would have increased the 2019 and 2018 postretirement benefit obligation by $0.3 million and $1.1 million, respectively and increased the total service and interest cost components by $0.1 million in both the years ended December 31, 2019 and 2018. A one percentage point decrease would have decreased the 2019 and 2018 postretirement benefit obligation by $0.2 million and $1.0 million, respectively and decreased the total service and interest cost components by $0.1 million in both the years ended December 31, 2019 and 2018.
The components of net periodic benefit cost (income) for the years ended December 31, 2019, 2018 and 2017 were as follows:
Pension | Postretirement | ||||||||||||||||||||||
Years Ended December 31, | Years Ended December 31, | ||||||||||||||||||||||
Components of net periodic benefit cost (income): | 2019 | 2018 | 2017 | 2019 | 2018 | 2017 | |||||||||||||||||
Service cost | $17.4 | $17.2 | $18.2 | $1.1 | $1.6 | $1.6 | |||||||||||||||||
Interest cost | 48.9 | 45.6 | 49.1 | 5.9 | 7.6 | $8.4 | |||||||||||||||||
Expected return on plan assets | (65.0 | ) | (74.0 | ) | (70.7 | ) | (3.9 | ) | (4.8 | ) | (5.2 | ) | |||||||||||
Amortization of prior service cost | 0.4 | 0.5 | 0.5 | (3.8 | ) | 0.2 | 1.0 | ||||||||||||||||
Curtailment | (8.9 | ) | — | — | — | — | — | ||||||||||||||||
Net remeasurement losses (gains) | 43.1 | 49.1 | 12.5 | 6.4 | (5.6 | ) | 9.3 | ||||||||||||||||
Net Periodic Benefit Cost (Income) | $35.9 | $38.4 | $9.6 | $5.7 | ($1.0 | ) | $15.1 | ||||||||||||||||
TimkenSteel recognizes its overall responsibility to ensure that the assets of its various defined benefit pension plans are managed effectively and prudently and in compliance with its policy guidelines and all applicable laws. Preservation of capital is important; however, TimkenSteel also recognizes that appropriate levels of risk are necessary to allow its investment managers to achieve satisfactory long-term results consistent with the objectives and the fiduciary character of the pension funds. Asset allocations are established in a manner consistent with projected plan liabilities, benefit payments and expected rates of return for various asset classes. The expected rate of return for the investment portfolios is based on expected rates of return for various asset classes, as well as historical asset class and fund performance. The target allocations for plan assets are 21% equity securities, 61% debt securities and 18% in all other types of investments.
Fair value is defined as the price that would be received to sell an asset or paid to transfer a liability in an orderly transaction between market participants at the measurement date (exit price). The inputs used to measure fair value are classified into the following hierarchy:
Level 1 - | Unadjusted quoted prices in active markets for identical assets or liabilities. |
Level 2 - | Unadjusted quoted prices in active markets for similar assets or liabilities, or unadjusted quoted prices for identical or similar assets or liabilities in markets that are not active, or inputs other than quoted prices that are observable for the asset or liability. |
Level 3 - | Unobservable inputs for the asset or liability. |
67
The following table presents the fair value hierarchy for those investments of TimkenSteel’s pension assets measured at fair value on a recurring basis as of December 31, 2019:
Total | Level 1 | Level 2 | Level 3 | |||||||||
Assets: | ||||||||||||
Cash and cash equivalents | $12.2 | $0.9 | $11.3 | $— | ||||||||
U.S government and agency securities | 250.3 | 246.1 | 4.2 | — | ||||||||
Corporate bonds | 102.7 | — | 102.7 | — | ||||||||
Equity securities | 49.8 | 49.8 | — | — | ||||||||
Mutual fund - fixed income | 56.4 | 56.4 | — | — | ||||||||
Total Assets in the fair value hierarchy | $471.4 | $353.2 | $118.2 | $— | ||||||||
Assets measured at net asset value (1) | 684.0 | — | — | — | ||||||||
Total Assets | $1,155.4 | $353.2 | $118.2 | $— | ||||||||
(1) Certain assets that are measured at fair value using the net asset value per share (or its equivalent) practical expedient have not been classified in the fair value hierarchy. Such assets include common collective trusts that invest in equity securities and fixed income securities, limited partnerships, real estate partnerships, hedge funds, and risk parity investments. As of December 31, 2019, these assets are redeemable at net asset value within 90 days.
The following table presents the fair value hierarchy for those investments of TimkenSteel’s pension assets measured at fair value on a recurring basis as of December 31, 2018:
Total | Level 1 | Level 2 | Level 3 | |||||||||
Assets: | ||||||||||||
Cash and cash equivalents | $22.5 | $0.6 | $21.9 | $— | ||||||||
U.S government and agency securities | 234.2 | 229.1 | 5.1 | — | ||||||||
Corporate bonds | 97.4 | — | 97.4 | — | ||||||||
Equity securities | 37.1 | 37.1 | — | — | ||||||||
Mutual fund - fixed income | 33.1 | 33.1 | — | — | ||||||||
Mutual fund - real estate | 7.7 | 7.7 | — | — | ||||||||
Total Assets in the fair value hierarchy | $432.0 | $307.6 | $124.4 | $— | ||||||||
Assets measured at net asset value (1) | 622.4 | — | — | — | ||||||||
Total Assets | $1,054.4 | $307.6 | $124.4 | $— | ||||||||
(1) Certain assets that are measured at fair value using the net asset value per share (or its equivalent) practical expedient have not been classified in the fair value hierarchy. Such assets include common collective trusts that invest in equity securities and fixed income securities, limited partnerships, real estate partnerships, and risk parity investments. As of December 31, 2018, these assets were redeemable at net asset value within 90 days.
The following table presents the fair value hierarchy for those investments of TimkenSteel’s postretirement assets measured at fair value on a recurring basis as of December 31, 2019:
Total | Level 1 | Level 2 | Level 3 | |||||||||
Assets: | ||||||||||||
Cash and cash equivalents | $3.0 | $3.0 | $— | $— | ||||||||
Mutual fund - fixed income | 15.8 | 15.8 | — | — | ||||||||
Total Assets in the fair value hierarchy | $18.8 | $18.8 | $— | $— | ||||||||
Assets measured at net asset value (1) | 63.5 | — | — | — | ||||||||
Total Assets | $82.3 | $18.8 | $— | $— | ||||||||
(1) Certain assets that are measured at fair value using the net asset value per share (or its equivalent) practical expedient have not been classified in the fair value hierarchy. Such assets include common collective trusts that invest in equity securities and fixed income securities,
68
limited partnerships, real estate partnerships, hedge funds, and risk parity investments. As of December 31, 2019, these assets are redeemable at net asset value within 90 days.
The following table presents the fair value hierarchy for those investments of TimkenSteel’s postretirement assets measured at fair value on a recurring basis as of December 31, 2018:
Total | Level 1 | Level 2 | Level 3 | |||||||||
Assets: | ||||||||||||
Cash and cash equivalents | $5.6 | $5.6 | $— | $— | ||||||||
Mutual fund - fixed income | 8.9 | 8.9 | — | — | ||||||||
Total Assets in the fair value hierarchy | $14.5 | $14.5 | $— | $— | ||||||||
Assets measured at net asset value (1) | 71.6 | — | — | — | ||||||||
Total Assets | $86.1 | $14.5 | $— | $— | ||||||||
(1) Certain assets that are measured at fair value using the net asset value per share (or its equivalent) practical expedient have not been classified in the fair value hierarchy. Such assets include common collective trusts that invest in equity securities and fixed income securities, limited partnerships, real estate partnerships, and risk parity investments. As of December 31, 2018, these assets were redeemable at net asset value within 90 days.
Future benefit payments are expected to be as follows:
Benefit Payments: | Pension | Postretirement | |||||
2020 | $78.8 | $11.9 | |||||
2021 | 79.2 | 11.0 | |||||
2022 | 85.6 | 10.3 | |||||
2023 | 76.5 | 9.6 | |||||
2024 | 76.0 | 9.0 | |||||
2025-2029 | 374.3 | 39.3 | |||||
The Company expects to make required contributions to its U.K. pension plan in 2020 of approximately $1.3 million.
Defined Contribution Plans
The Company recorded expense primarily related to employer matching and non-discretionary contributions to these defined contribution plans of $7.1 million in 2019, $6.3 million in 2018, and $5.4 million in 2017.
Note 16 - Stock-Based Compensation
Description of the Plan
On April 28, 2016, shareholders of TimkenSteel approved the TimkenSteel Corporation Amended and Restated 2014 Equity and Incentive Compensation Plan (TimkenSteel 2014 Plan), which authorizes the Compensation Committee of the TimkenSteel Board of Directors to grant non-qualified or incentive stock options, stock appreciation rights, stock awards (including restricted shares, restricted share unit awards, performance shares, performance units, deferred shares and common shares) and cash awards to TimkenSteel employees and non-employee directors. No more than 11.05 million TimkenSteel common shares may be delivered under the TimkenSteel 2014 Plan. The TimkenSteel 2014 Plan contains fungible share counting mechanics, which generally means that awards other than stock options and stock appreciation rights will be counted against the aggregate share limit as 2.50 common shares for every one common share that is actually issued or transferred under such awards. The TimkenSteel 2014 Plan authorized up to 3.0 million common shares for use in granting “replacement awards” to current holders of The Timken Company equity awards under The Timken Company’s equity compensation plans at the time of the spinoff.
As of December 31, 2019, approximately 2.4 million shares of TimkenSteel common stock remained available for grants under the TimkenSteel 2014 Plan.
In connection with the spinoff, stock compensation awards granted under The Timken Company Long-Term Incentive Plan (Timken LTIP Plan) and The Timken Company 2011 Long-Term Incentive Plan (Timken 2011 Plan) were adjusted as follows:
69
• | Vested and unvested stock options were adjusted so that the grantee holds options to purchase both The Timken Company and TimkenSteel common shares. |
• | The adjustment to The Timken Company and TimkenSteel stock options, when combined, were intended to generally preserve the intrinsic value of each original option grant and the ratio of the exercise price to the fair market value of The Timken Company common shares on June 30, 2014. |
• | Unvested restricted stock awards were replaced with adjusted, substitute awards for restricted shares or units, as applicable, of The Timken Company and TimkenSteel common shares. The new awards of restricted stock were intended to generally preserve the intrinsic value of the original award determined as of June 30, 2014. |
• | Vesting periods of awards were unaffected by the adjustment and substitution. |
Awards granted in connection with the adjustment of awards originally issued under The Timken Company LTIP Plan and the Timken 2011 Plan are referred to as replacement awards under the TimkenSteel 2014 Plan and, as noted above, reduce the maximum number of TimkenSteel common shares available for delivery under the TimkenSteel 2014 Plan. TimkenSteel recorded compensation expense for both TimkenSteel and The Timken Company common shares for awards held by TimkenSteel employees only.
The following table provides the significant assumptions used to calculate the grant date fair market values of options granted using a Black-Scholes option pricing method:
2019 | 2018 | 2017 | |||
Weighted-average fair value per option | $5.54 | $7.46 | $7.68 | ||
Risk-free interest rate | 2.63% | 2.77% | 2.21% | ||
Dividend yield | —% | —% | —% | ||
Expected stock volatility | 41.36% | 41.67% | 43.23% | ||
Expected life - years | 6 | 6 | 6 | ||
The expected life of stock option awards granted is based on historical data and represents the period of time that options granted are expected to be held prior to exercise. Because of the absence of adequate stock price history of TimkenSteel common stock, expected volatility related to stock option awards granted subsequent to the spinoff is based on the historical volatility of a selected group of peer companies’ stock. Expected annual dividend yield is estimated using the most recent dividend payment per share as of the grant date, of which no dividends were paid in these grant periods. The risk-free rate for periods within the expected life of the option is based on the U.S. Treasury yield curve in effect at the time of the grant.
The following summarizes TimkenSteel stock option activity from January 1, 2019 to December 31, 2019:
Number of Shares | Weighted Average Exercise Price | Weighted Average Remaining Contractual Term | Aggregate Intrinsic Value (millions) | ||||
Outstanding as of December 31, 2018 | 2,532,669 | $21.33 | |||||
Granted | 329,720 | $12.45 | |||||
Exercised | (25,039 | ) | $8.83 | ||||
Canceled, forfeited or expired | (195,780 | ) | $17.33 | ||||
Outstanding as of December 31, 2019 | 2,641,570 | $20.64 | 5.27 | $0.2 | |||
Options expected to vest | 403,774 | $13.43 | 8.30 | $— | |||
Options exercisable | 2,237,796 | $21.94 | 4.73 | $0.2 | |||
Stock options presented in this table represent TimkenSteel awards only, including those held by The Timken Company employees.
For stock options exercised during the period of January 1, 2019 to December 31, 2019, the total intrinsic value was $0.1 million with cash proceeds of $0.2 million. There was no tax benefit associated with these stock option exercises.
70
The following summarizes TimkenSteel stock-settled restricted share award activity from January 1, 2019 to December 31, 2019:
Number of Shares | Weighted Average Grant Date Fair Value | ||||
Outstanding as of December 31, 2018 | 817,884 | $14.15 | |||
Granted | 833,220 | $9.86 | |||
Vested | (365,800 | ) | $10.23 | ||
Canceled, forfeited or expired | (111,635 | ) | $13.79 | ||
Outstanding as of December 31, 2019 | 1,173,669 | $11.94 | |||
Restricted share awards presented in this table represent TimkenSteel awards only, including those held by The Timken Company employees.
TimkenSteel recognized stock-based compensation expense of $7.4 million, $7.3 million and $6.5 million for the years ended December 31, 2019, 2018 and 2017, respectively, related to stock option awards and stock-settled restricted share awards.
Outstanding restricted share awards include restricted stock units, performance-based restricted stock units and deferred shares that will settle in common shares. Outstanding restricted stock units generally cliff-vest after three years or vest in 25% increments annually beginning on the first anniversary of the date of grant. Performance-based restricted stock units vest based on achievement of specified performance objectives.
As of December 31, 2019, unrecognized compensation cost related to stock option awards and stock-settled restricted stock units was $7.3 million, which is expected to be recognized over a weighted average period of 1.4 years. The calculations of unamortized expense and weighted-average periods include awards based on both TimkenSteel and The Timken Company stock awards held by TimkenSteel employees.
Certain restricted stock units, including performance-based restricted stock units, are settled in cash and were adjusted and substituted as described above. TimkenSteel recognized a liability of $0.1 million and $0.8 million as of December 31, 2019 and 2018, respectively, for these awards which was included in salaries, wages and benefits, and other non-current liabilities on the Consolidated Balance Sheets. TimkenSteel paid $0.1 million for cash-settled restricted stock units during 2018. There were no cash-settled restricted stock units during 2019.
71
Note 17 - Accumulated Other Comprehensive Income (Loss)
Changes in accumulated other comprehensive income (loss) for the years ended December 31, 2019 and 2018 by component were as follows:
Foreign Currency Translation Adjustments | Pension and Postretirement Liability Adjustments | Total | |||||||||
Balance as of December 31, 2018 | ($7.3 | ) | ($1.6 | ) | ($8.9 | ) | |||||
Other comprehensive income before reclassifications, before income tax | 0.5 | — | 0.5 | ||||||||
Amounts reclassified from accumulated other comprehensive income (loss), before income tax | — | (2.4 | ) | (2.4 | ) | ||||||
Amounts deferred to accumulated other comprehensive income (loss), before income tax | — | 72.2 | 72.2 | ||||||||
Tax effect | — | (16.7 | ) | (16.7 | ) | ||||||
Net current period other comprehensive income, net of income taxes | 0.5 | 53.1 | 53.6 | ||||||||
Balance as of December 31, 2019 | ($6.8 | ) | $51.5 | $44.7 | |||||||
Foreign Currency Translation Adjustments | Pension and Postretirement Liability Adjustments | Total | |||||||||
Balance at December 31, 2017 | ($5.9 | ) | ($1.7 | ) | ($7.6 | ) | |||||
Other comprehensive income before reclassifications, before income tax | (1.4 | ) | (0.5 | ) | (1.9 | ) | |||||
Amounts reclassified from accumulated other comprehensive loss, before income tax | — | 0.7 | 0.7 | ||||||||
Tax effect | — | (0.1 | ) | (0.1 | ) | ||||||
Net current period other comprehensive income, net of income taxes | (1.4 | ) | 0.1 | (1.3 | ) | ||||||
Balance as of December 31, 2018 | ($7.3 | ) | ($1.6 | ) | ($8.9 | ) | |||||
The amount reclassified from accumulated other comprehensive income (loss) in the year ended December 31, 2019 for the pension and postretirement liability adjustment was included in other income, net in the Consolidated Statements of Operations. The amount deferred to accumulated other comprehensive income in the year ended December 31, 2019, was a result of a plan amendment to the Company’s postretirement benefit plan. These accumulated other comprehensive income (loss) components are components of net periodic benefit cost. See “Note 15 - Retirement and Postretirement Plans” for additional information.
Note 18 - Contingencies
TimkenSteel has a number of loss exposures incurred in the ordinary course of business, such as environmental claims, product warranty claims, and litigation. Establishing loss reserves for these matters requires management’s estimate and judgment regarding risk exposure and ultimate liability or realization. These loss reserves are reviewed periodically and adjustments are made to reflect the most recent facts and circumstances. Accruals related to environmental claims represent management’s best estimate of the fees and costs associated with these claims. Although it is not possible to predict with certainty the outcome of such claims, management believes that their ultimate dispositions should not have a material adverse effect on our financial position, cash flows or results of operations. As of both December 31, 2019 and 2018, TimkenSteel had a $1.5 million contingency reserve, related to loss exposures incurred in the ordinary course of business.
Note 19 - Relationships with The Timken Company and Related Entities
Prior to the spinoff on June 30, 2014, TimkenSteel was managed and operated in the normal course of business with other affiliates of The Timken Company. Transactions between The Timken Company and TimkenSteel, with the exception of sale and purchase transactions and reimbursements for payments made to third-party service providers by The Timken Company on TimkenSteel’s behalf, are reflected in equity in the Consolidated Balance Sheets as net parent investment and in the Consolidated Statements of Cash Flows as a financing activity in net transfers (to)/from The Timken Company and affiliates.
Transactions with The Timken Company
72
TimkenSteel sold finished goods to The Timken Company. During the years ended December 31, 2019, 2018 and 2017, revenues from related-party sales of products totaled $26.1 million or 2.2% of net sales, $43.2 million, or 2.7% of net sales, and $48.5 million or 3.6% of net sales, respectively.
TimkenSteel did not purchase material from The Timken Company during the years ending December 31, 2019, 2018 or 2017. In addition, certain of TimkenSteel’s third-party service providers were paid by The Timken Company on behalf of TimkenSteel. TimkenSteel would subsequently reimburse The Timken Company in cash for such payments.
Material Agreements Between TimkenSteel and The Timken Company
On June 30, 2014, TimkenSteel entered into a separation and distribution agreement and several other agreements with The Timken Company to effect the spinoff and to provide a framework for the relationship with The Timken Company. These agreements govern the relationship between TimkenSteel and The Timken Company subsequent to the completion of the spinoff and provide for the allocation between TimkenSteel and The Timken Company of assets, liabilities and obligations attributable to periods prior to the spinoff. Because these agreements were entered into in the context of a related party transaction, the terms may not be comparable to terms that would be obtained in a transaction between unaffiliated parties.
Separation and Distribution Agreement — The separation and distribution agreement contains the key provisions relating to the spinoff, including provisions relating to the principal intercompany transactions required to effect the spinoff, the conditions to the spinoff and provisions governing the relationships between TimkenSteel and The Timken Company after the spinoff.
Tax Sharing Agreement — The tax sharing agreement generally governs TimkenSteel’s and The Timken Company’s respective rights, responsibilities and obligations after the spinoff with respect to taxes for any tax period ending on or before the distribution date, as well as tax periods beginning before and ending after the distribution date. Generally, TimkenSteel is liable for all pre-distribution U.S. federal income taxes, foreign income taxes and non-income taxes attributable to TimkenSteel’s business, and all other taxes attributable to TimkenSteel, paid after the distribution. In addition, the tax sharing agreement addresses the allocation of liability for taxes that are incurred as a result of restructuring activities undertaken to effectuate the distribution. The tax sharing agreement also provides that TimkenSteel is liable for taxes incurred by The Timken Company that arise as a result of TimkenSteel’s taking or failing to take, as the case may be, certain actions that result in the distribution failing to meet the requirements of a tax-free distribution under Section 355 of the Internal Revenue Code of 1986, as amended.
Employee Matters Agreement — TimkenSteel entered into an employee matters agreement with The Timken Company, which generally provides that TimkenSteel and The Timken Company each has responsibility for its own employees and compensation plans, subject to certain exceptions as described in the agreement. In general, prior to the spinoff, TimkenSteel employees participated in various retirement, health and welfare, and other employee benefit and compensation plans maintained by The Timken Company. Following the spinoff (or earlier, in the case of the tax-qualified defined benefit plans and retiree medical plans), pursuant to the employee matters agreement, TimkenSteel employees and former employees generally participate in similar plans and arrangements established and maintained by TimkenSteel. The employee matters agreement provides for the bifurcation of equity awards as described in Note 16 - Stock-Based Compensation. Among other things, the employee matters agreement also provides for TimkenSteel’s assumption of certain employment-related contracts that its employees originally entered into with The Timken Company, the allocation of certain employee liabilities and the cooperation between TimkenSteel and The Timken Company in the sharing of employee information.
73
SUPPLEMENTAL DATA
Selected Quarterly Financial Data (Unaudited)
(dollars in millions, except per share data)
The following selected quarterly operating results for each quarter of fiscal 2019 and 2018 have been adjusted to reflect the change in accounting principle as described in “Note 1 - Basis of Presentation”:
Quarters ended | |||||||||||||
December 31, 2019 | September 30. 2019 | ||||||||||||
As Reported | Adjustments | As Adjusted | |||||||||||
Net sales | $226.9 | $274.2 | $— | $274.2 | |||||||||
Gross profit | (18.0 | ) | 13.2 | (15.8 | ) | (2.6 | ) | ||||||
Net income (loss) | (84.6 | ) | (4.6 | ) | (12.4 | ) | (17.0 | ) | |||||
Per share data: | |||||||||||||
Basic earnings (loss) per share | ($1.89 | ) | ($0.10 | ) | ($0.28 | ) | ($0.38 | ) | |||||
Diluted earnings (loss) per share | ($1.89 | ) | ($0.10 | ) | ($0.28 | ) | ($0.38 | ) | |||||
Quarters ended | |||||||||||||||||||
June 30, 2019 | March 31, 2019 | ||||||||||||||||||
As Reported | Adjustments | As Adjusted | As Reported | Adjustments | As Adjusted | ||||||||||||||
Net sales | $336.7 | $— | $336.7 | $371.0 | $— | $371.0 | |||||||||||||
Gross profit | 25.4 | (10.6 | ) | 14.8 | 29.1 | (0.7 | ) | 28.4 | |||||||||||
Net income (loss) | (4.4 | ) | (7.5 | ) | (11.9 | ) | 4.2 | (0.7 | ) | 3.5 | |||||||||
Per share data: | |||||||||||||||||||
Basic earnings (loss) per share | ($0.10 | ) | ($0.17 | ) | ($0.27 | ) | $0.09 | ($0.01 | ) | $0.08 | |||||||||
Diluted earnings (loss) per share | ($0.10 | ) | ($0.17 | ) | ($0.27 | ) | $0.09 | ($0.01 | ) | $0.08 | |||||||||
Quarters ended | |||||||||||||||||||
December 31, 2018 | September 30, 2018 | ||||||||||||||||||
As Reported | Adjustments | As Adjusted | As Reported | Adjustments | As Adjusted | ||||||||||||||
Net sales | $406.4 | $— | $406.4 | $409.9 | $— | $409.9 | |||||||||||||
Gross profit | 27.1 | 10.2 | 37.3 | 24.6 | 3.8 | 28.4 | |||||||||||||
Net income (loss) | (39.6 | ) | 10.2 | (29.4 | ) | 1.4 | 3.8 | 5.2 | |||||||||||
Per share data: | |||||||||||||||||||
Basic earnings (loss) per share | ($0.89 | ) | $0.23 | ($0.66 | ) | $0.03 | $0.09 | $0.12 | |||||||||||
Diluted earnings (loss) per share | ($0.89 | ) | $0.23 | ($0.66 | ) | $0.03 | $0.09 | $0.12 | |||||||||||
74
Quarters ended | |||||||||||||||||||
June 30, 2018 | March 31, 2018 | ||||||||||||||||||
As Reported | Adjustments | As Adjusted | As Reported | Adjustments | As Adjusted | ||||||||||||||
Net sales | $413.5 | $— | $413.5 | $380.8 | $— | $380.8 | |||||||||||||
Gross profit | 32.1 | 6.4 | 38.5 | 21.1 | 1.3 | 22.4 | |||||||||||||
Net income (loss) | 8.4 | 6.4 | 14.8 | (1.9 | ) | 1.3 | (0.6 | ) | |||||||||||
Per share data: | |||||||||||||||||||
Basic earnings (loss) per share | $0.19 | $0.14 | $0.33 | ($0.04 | ) | $0.03 | ($0.01 | ) | |||||||||||
Diluted earnings (loss) per share | $0.19 | $0.14 | $0.33 | ($0.04 | ) | $0.03 | ($0.01 | ) | |||||||||||
75
Item 9. CHANGES IN AND DISAGREEMENTS WITH ACCOUNTANTS ON ACCOUNTING AND FINANCIAL DISCLOSURE
None.
ITEM 9A. CONTROLS AND PROCEDURES
Evaluation of Disclosure Controls and Procedures
As of the end of the period covered by this Annual Report on Form 10-K, our management carried out an evaluation, under the supervision and with the participation of the Company’s principal executive officer and principal financial officer, of the effectiveness of the design and operation of the Company’s disclosure controls and procedures as defined in Exchange Act Rule 13a-15(e). Based upon that evaluation, the principal executive officer and principal financial officer concluded that the Company’s disclosure controls and procedures were effective as of the end of the period covered by this Annual Report on Form 10-K.
Report of Management on Internal Control Over Financial Reporting
The management of TimkenSteel is responsible for establishing and maintaining adequate internal control over financial reporting for the Company. TimkenSteel’s internal control system is designed to provide reasonable assurance regarding the preparation and fair presentation of published financial statements. Because of its inherent limitations, internal control over financial reporting may not prevent or detect misstatements. Also, projections of any evaluation of effectiveness to future periods are subject to the risk that controls may become inadequate because of changes in conditions, or that the degree of compliance with the policies or procedures may deteriorate.
TimkenSteel management assessed the effectiveness of the Company’s internal control over financial reporting as of December 31, 2019. In making this assessment, it used the criteria set forth by the Committee of Sponsoring Organizations of the Treadway Commission (COSO). Based on this assessment under COSO’s “Internal Control-Integrated Framework (2013 framework),” management believes that, as of December 31, 2019, TimkenSteel’s internal control over financial reporting is effective.
Ernst & Young LLP, an independent registered public accounting firm, has issued an audit report on our assessment of TimkenSteel’s internal control over financial reporting as of December 31, 2019. Please refer to Item 8, “Reports of Independent Registered Public Accounting Firm.”
Changes in Internal Controls
There have been no changes during the Company’s fourth quarter of 2019 in our internal control over financial reporting that have materially affected, or are reasonably likely to materially affect, our internal control over financial reporting.
76
ITEM 9B. OTHER INFORMATION
None.
PART III.
ITEM 10. DIRECTORS, EXECUTIVE OFFICERS AND CORPORATE GOVERNANCE
Required information will be set forth under the captions “Proposal 1: Election of directors” in the proxy statement to be filed within 120 days of December 31, 2019 in connection with the annual meeting of shareholders to be held on May 6, 2020, and is incorporated herein by reference. Information regarding the executive officers of the registrant is included in Part I hereof. Information regarding the Company’s Audit Committee and its Audit Committee Financial Expert is set forth under the caption “Board of directors information - Audit committee” in the proxy statement filed in connection with the annual meeting of shareholders to be held on May 6, 2020, and is incorporated herein by reference.
The Company’s Corporate Governance Guidelines and the charters of its Audit Committee, Compensation Committee and Nominating and Corporate Governance Committee are available on the Company’s website at www.timkensteel.com. The information on the Company’s website is not incorporated by reference into this Annual Report on Form 10-K.
The Company has adopted a code of ethics that applies to all of its employees, including its principal executive officer, principal financial officer and principal accounting officer or controller, as well as to its directors. The Company’s code of ethics, the TimkenSteel Code of Conduct, is available on its website at www.timkensteel.com. The Company intends to disclose any amendment to its code of ethics or waiver from its code of ethics that applies to its principal executive officer, principal financial officer, principal accounting officer or controller, or any director, by posting such amendment or waiver, as applicable, on its website at www.timkensteel.com.
ITEM 11. EXECUTIVE COMPENSATION
Required information will be set forth under the captions “Compensation discussion and analysis”; “2019 Summary compensation table”; “2019 Grants of plan-based awards table”; “Outstanding equity awards at 2019 year-end table”; “2019 Option exercises and stock vested table”; “Pension benefits”; “2019 Nonqualified deferred compensation table”; “Potential payments upon termination or change in control”; “Director compensation”; “CEO pay ratio”; “Board of directors information - Compensation committee”; “Board of directors information - Compensation committee interlocks and insider participation”; and “Board of directors information - Compensation committee report” in the proxy statement to be filed within 120 days of December 31, 2019 in connection with the annual meeting of shareholders to be held on May 6, 2020, and is incorporated herein by reference.
ITEM 12. SECURITY OWNERSHIP OF CERTAIN BENEFICIAL OWNERS AND MANAGEMENT AND RELATED STOCKHOLDER MATTERS
Required information, including with respect to institutional investors owning more than 5% of the Company’s common shares, will be set forth under the caption “Beneficial ownership of common stock” in the proxy statement to be filed within 120 days of December 31, 2019 in connection with the annual meeting of shareholders to be held on May 6, 2020, and is incorporated herein by reference. Required information regarding securities authorized for issuance under the Company’s equity compensation plans is included in Item 5 of this Annual Report on Form10-K and is incorporated herein by reference.
ITEM 13. CERTAIN RELATIONSHIPS AND RELATED TRANSACTIONS, AND DIRECTOR INDEPENDENCE
Required information will be set forth under the captions “Corporate governance - Director independence” and “ Corporate governance - Related-party transactions approval policy” in the proxy statement to be filed within 120 days of December 31, 2019 in connection with the annual meeting of shareholders to be held on May 6, 2020, and is incorporated herein by reference.
ITEM 14. PRINCIPAL ACCOUNTING FEES AND SERVICES
Required information regarding fees paid to and services provided by the Company’s independent auditor during the years ended December 31, 2019 and 2018 and the pre-approval policies and procedures of the Audit Committee of the Company’s Board of Directors will be set forth under the captions “ Proposal 2: Ratification of appointment of independent auditors - Services of independent auditor for 2019“ and “Proposal 2: Ratification of appointment of independent auditors - Audit committee pre-approval policies and procedures” in the proxy statement to be filed within 120 days of December 31, 2019 in connection with the annual meeting of shareholders to be held on May 6, 2020, and is incorporated herein by reference.
77
PART IV.
ITEM 15. EXHIBITS, FINANCIAL STATEMENT SCHEDULES
(a)(1) - Financial Statements are included in Part II, Item 8 of the Annual Report on Form 10-K.
(a)(2) - Schedule II - Valuation and Qualifying Accounts is submitted as a separate section of this report. Schedules I, III, IV and V are not applicable to the Company and, therefore, have been omitted.
(a)(3) Listing of Exhibits
Exhibit Number | Exhibit Description | ||
2.1† | |||
3.1 | |||
3.2 | |||
4.1 | |||
4.2 | |||
4.3* | |||
10.1† | |||
10.2† | |||
10.3 | |||
10.4† | |||
10.5 | |||
10.6 | |||
10.7 | |||
10.8 | |||
10.9†† | |||
10.10†† | |||
10.11†† | |||
10.12 | |||
10.13 | |||
10.14 | |||
10.15 | |||
10.16 | |||
10.17 | |||
10.18 | |||
10.19 | |||
10.20 | |||
10.21 | |||
10.22 | |||
10.23 | |||
10.24 | |||
18.1* | |||
21.1* | |||
23.1* | |||
24.1* | |||
31.1* | |||
31.2* | |||
32.1** | |||
101.INS* | XBRL Instance Document. | ||
101.SCH* | XBRL Taxonomy Extension Schema Document. | ||
101.PRE* | XBRL Taxonomy Extension Presentation Linkbase Document. | ||
101.CAL* | XBRL Taxonomy Extension Calculation Linkbase Document. | ||
101.LAB* | XBRL Taxonomy Extension Label Linkbase Document. | ||
101.DEF* | XBRL Taxonomy Extension Definition Linkbase Document. | ||
† | Incorporated by reference to the exhibit filed under the corresponding Exhibit Number of the Company’s Current Report on Form 8-K filed on July 3, 2014, File No. 001-36313. | ||
†† | Incorporated by reference to the exhibit filed under the corresponding Exhibit Number of Amendment No. 3 to the Company’s Registration Statement on Form 10 filed on May 15, 2014, File No. 001-36313. | ||
* | Filed herewith. | ||
** | Furnished herewith. | ||
79
Schedule II-Valuation and Qualifying Accounts
Allowance for uncollectible accounts: | 2019 | 2018 | 2017 | ||||||
Balance at Beginning of Period | $1.7 | $1.4 | $2.1 | ||||||
Additions: | |||||||||
Charged to Costs and Expenses (1) | — | 0.3 | — | ||||||
Deductions (2) | (0.2 | ) | — | (0.7 | ) | ||||
Balance at End of Period | $1.5 | $1.7 | $1.4 | ||||||
Allowance for inventory reserves | 2019 | 2018 Adjusted(8) | 2017 Adjusted(8) | ||||||
Balance at Beginning of Period | $6.1 | $8.9 | $8.1 | ||||||
Additions: | |||||||||
Charged to Costs and Expenses (3) | 9.0 | 1.6 | 2.1 | ||||||
Deductions (4) | (4.4 | ) | (4.4 | ) | (1.3 | ) | |||
Balance at End of Period | $10.7 | $6.1 | $8.9 | ||||||
Valuation allowance on deferred tax assets: | 2019 | 2018 | 2017 | ||||||
Balance at Beginning of Period | $43.7 | $36.6 | $24.4 | ||||||
Additions: | |||||||||
Charged to Costs and Expenses (5) | — | 7.1 | 12.2 | ||||||
Charged to Other Accounts (6) | 16.7 | — | — | ||||||
Deductions (7) | (25.5 | ) | — | — | |||||
Balance at End of Period | $34.9 | $43.7 | $36.6 | ||||||
(1) | Provision for uncollectible accounts included in expenses. |
(2) | Actual accounts written off against the allowance, net of recoveries. |
(3) | Provisions for surplus and obsolete inventory and lower cost or net realizable value included in expenses. |
(4) | Inventory items written off against the allowance. |
(5) | Increase in valuation allowance is recorded as a component of the provision for income taxes. |
(6) | Includes valuation allowances recorded against other comprehensive income/loss. |
(7) | Amount primarily relates to the change in accounting principle from LIFO to FIFO and a net benefit recorded as a component of income tax. |
(8) | As described on Note 1 - Basis of Presentation, the effects of the change in accounting principle from LIFO to FIFO have been retrospectively applied to all periods presented. |
80
SIGNATURES
Pursuant to the requirements of the Securities Exchange Act of 1934, the registrant has duly caused this report to be signed on its behalf by the undersigned thereunto duly authorized.
TIMKENSTEEL CORPORATION | ||
Date: | February 25, 2020 | /s/ Kristopher R. Westbrooks |
Kristopher R. Westbrooks Executive Vice President and Chief Financial Officer (Principal Financial Officer) | ||
81
Pursuant to the requirements of the Securities Exchange Act of 1934, this report has been signed by the following persons on behalf of the registrant and in the capacities and on the dates indicated.
Signature | Title | Date | ||
/s/ Terry L. Dunlap | Interim Chief Executive Officer and President (Principal Executive Officer) | February 25, 2020 | ||
Terry L. Dunlap | ||||
/s/ Kristopher R. Westbrooks | Executive Vice President and Chief Financial Officer (Principal Financial Officer) | February 25, 2020 | ||
Kristopher R. Westbrooks | ||||
/s/ Nicholas A. Yacobozzi | Corporate Controller (Principal Accounting Officer) | February 25, 2020 | ||
Nicholas A. Yacobozzi | ||||
* | Director | February 25, 2020 | ||
Joseph A. Carrabba | ||||
* | Director | February 25, 2020 | ||
Leila L. Vespoli | ||||
* | Director | February 25, 2020 | ||
Diane C. Creel | ||||
* | Director | February 25, 2020 | ||
Randall H. Edwards | ||||
* | Director | February 25, 2020 | ||
Donald T. Misheff | ||||
* | Director | February 25, 2020 | ||
John P. Reilly | ||||
* | Director | February 25, 2020 | ||
Ronald A. Rice | ||||
* | Director | February 25, 2020 | ||
Marvin A. Riley | ||||
* | Director | February 25, 2020 | ||
Randall A. Wotring | ||||
*Signed by the undersigned as attorney-in-fact and agent for the directors indicated. | ||||
/s/ Kristopher R. Westbrooks | Executive Vice President and Chief Financial Officer (Principal Financial Officer) | February 25, 2020 | ||
Kristopher R. Westbrooks | ||||
82