Attached files
| file | filename |
|---|---|
| EX-32.01 - Biglari Holdings Inc. | e619393_32-01.htm |
| EX-31.02 - Biglari Holdings Inc. | e619393_31-02.htm |
| EX-31.01 - Biglari Holdings Inc. | e619393_31-01.htm |
| EX-21.01 - Biglari Holdings Inc. | e619393_21-01.htm |
| EX-4.03 - Biglari Holdings Inc. | e619393_4-03.htm |
UNITED STATES
SECURITIES AND EXCHANGE COMMISSION
Washington, D.C. 20549
FORM 10-K
| ☒ | ANNUAL REPORT PURSUANT TO SECTION 13 OR 15(d) OF THE SECURITIES EXCHANGE ACT OF 1934 |
For the fiscal year ended December 31, 2019
or
| ☐ | TRANSITION REPORT PURSUANT TO SECTION 13 OR 15(d) OF THE SECURITIES EXCHANGE ACT OF 1934 |
For the transition period from ____ to ____
Commission file number 001-38477
BIGLARI HOLDINGS INC.
(Exact name of registrant as specified in its charter)
| INDIANA | 82-3784946 | |
| (State or other jurisdiction of incorporation) | (I.R.S. Employer Identification No.) |
|
17802 IH 10 West, Suite 400 San Antonio, Texas |
78257 | |
| (Address of principal executive offices) | (Zip Code) |
(210) 344-3400
Registrant’s telephone number, including area code
Securities registered pursuant to Section 12(b) of the Act:
| Title of each class | Trading Symbols | Name of each exchange on which registered |
|
Class A Common Stock, no par value Class B Common Stock, no par value |
BH.A BH |
New York Stock Exchange New York Stock Exchange |
Securities registered pursuant to Section 12(g) of the Act:
NONE
Indicate by check mark if the registrant is a well-known seasoned issuer, as defined in Rule 405 of the Securities Act. Yes ☐ No x
Indicate by check mark if the registrant is not required to file reports pursuant to Section 13 or Section 15(d) of the Act. Yes ☐ No x
Indicate by check mark whether the registrant (1) has filed all reports required to be filed by Section 13 or 15(d) of the Securities Exchange Act of 1934 during the preceding 12 months (or for such shorter period that the registrant was required to file such reports), and (2) has been subject to such filing requirements for the past 90 days. Yes x No ☐
Indicate by check mark whether the registrant has submitted electronically every Interactive Data File required to be submitted pursuant to Rule 405 of Regulation S-T (Section 232.405 of this chapter) during the preceding 12 months (or for such shorter period that the registrant was required to submit such files). Yes x No ☐
Indicate by check mark whether the registrant is a large accelerated filer, an accelerated filer, a non-accelerated filer, a smaller reporting company, or an emerging growth company. See the definitions of “large accelerated filer,” “accelerated filer,” “smaller reporting company” and “emerging growth company” in Rule 12b-2 of the Exchange Act. (Check one):
| Large accelerated filer o | Accelerated filer x | Non-accelerated filer o | Smaller reporting company o | Emerging growth company o |
If an emerging growth company, indicate by check mark if the registrant has elected not to use the extended transition period for complying with any new or revised financial accounting standards provided pursuant to Section 13(a) of the Exchange Act. ☐
Indicate by check mark whether the registrant is a shell company (as defined in Rule 12b-2 of the Exchange Act). Yes o No x
The aggregate market value of the voting and non-voting common stock held by non-affiliates of the registrant as of June 30, 2019 was approximately $137,552,014.
Number of shares of common stock outstanding as of February 17, 2020:
| Class A common stock – | 206,864 | |
| Class B common stock – | 2,068,640 |
DOCUMENTS INCORPORATED BY REFERENCE
Portions of the Registrant’s definitive Proxy Statement to be filed for its 2020 Annual Meeting of Shareholders are incorporated by reference into Part III of this Form 10-K.
|
Business |
Biglari Holdings Inc. is a holding company owning subsidiaries engaged in a number of diverse business activities, including property and casualty insurance, media and licensing, restaurants, and oil and gas. The Company’s largest operating subsidiaries are involved in the franchising and operating of restaurants. Biglari Holdings is founded and led by Sardar Biglari, Chairman and Chief Executive Officer of the Company. The Company’s long-term objective is to maximize per-share intrinsic value. All major investment and capital allocation decisions are made for the Company and its subsidiaries by Mr. Biglari.
As of December 31, 2019, Mr. Biglari’s beneficial ownership was approximately 64.4% of the Company’s outstanding Class A common stock and 55.4% of the Company’s outstanding Class B common stock.
Restaurant Operations
The Company’s restaurant operations are conducted through two subsidiaries: Steak n Shake Inc. (“Steak n Shake”) and Western Sizzlin Corporation (“Western Sizzlin”). As of December 31, 2019, Steak n Shake had 368 company-operated restaurants, 29 franchise partner units, and 213 traditional franchise units. As of December 31, 2019, 107 of the company-operated restaurants were temporarily closed. We anticipate re-opening the temporarily closed stores as counter service units. Western Sizzlin had 4 company-operated restaurants and 48 franchise units.
Steak n Shake is engaged in the ownership, operation, and franchising of Steak n Shake restaurants. Founded in 1934 in Normal, Illinois, Steak n Shake is a classic American brand serving premium burgers and milkshakes. Steak n Shake is headquartered in Indianapolis, Indiana.
Western Sizzlin is engaged primarily in the franchising of restaurants. Founded in 1962 in Augusta, Georgia, Western Sizzlin offers signature steak dishes as well as other classic American menu items. Western Sizzlin also operates two other concepts: Great American Steak & Buffet, and Wood Grill Buffet. Western Sizzlin is headquartered in Roanoke, Virginia.
Operations
A typical company-operated restaurant management team consists of a general manager, a restaurant manager and other managers depending on the operating complexity and sales volume of the restaurant. Each restaurant’s general manager has primary responsibility for the day-to-day operations of his or her unit. Restaurant operations obtain food products and supplies from independent national distributors. Purchases are centrally negotiated to ensure uniformity in product quality.
Franchising
Restaurant operations’ traditional franchising program extends the brands to areas in which there are no current development plans for company stores. The expansion plans include seeking qualified new franchisees and expanding relationships with current franchisees. Restaurant operations typically seek franchisees with both the financial resources necessary to fund successful development and significant experience in the restaurant/retail business. Both restaurant chains assist franchisees with the development and ongoing operation of their restaurants. In addition, personnel assist franchisees with site selection, approve restaurant sites, and provide prototype plans, construction support, and specifications. Restaurant operations’ staff provides both on-site and off-site instruction to franchise restaurant management and associates.
In addition to the traditional franchise arrangements described above, Steak n Shake initiated a franchise partner program during 2018 to transition company-operated restaurants to franchise partnerships. The franchise agreement stipulates that the franchisee make an upfront investment totaling $10,000. Steak n Shake, as the franchisor, assesses a fee of up to 15% of sales as well as 50% of profits. Potential franchise partners are screened based on entrepreneurial attitude and ability, but they become franchise partners based on achievement. Each must meet the gold standard in service. Franchise partners are required to be hands-on operators, limited to a single location.
International
We have a corporate office in Monaco and an international organization with personnel in various functions to support our international business. As of December 31, 2019, we operated three company locations in Europe to promote the Steak n Shake brand to prospective franchisees. Similar to our traditional domestic franchise agreements, a typical international franchise development agreement includes development and franchise fees in addition to subsequent royalty fees based on the gross sales of each restaurant. As of December 31, 2019, there were a total of 31 franchise units in Europe and the Middle East.
1
Competition
The restaurant business is one of the most intensely competitive industries. As there are virtually no barriers to entry into the restaurant business, competitors may include national, regional and local establishments. There may be established competitors with financial and other resources that are greater than the Company’s restaurant operations capabilities. Restaurant businesses compete on the basis of price, menu, food quality, location, and customer service. The restaurant business is often affected by changes in consumer tastes and by national, regional, and local economic conditions. The performance of individual restaurants may be impacted by factors such as traffic patterns, demographic trends, weather conditions, and competing restaurants.
Government regulations
The Company is subject to various global, federal, state and local laws affecting its restaurant operations. Each of the restaurants must comply with licensing and regulation by a number of governmental authorities, i.e., health, sanitation, safety and fire agencies in the jurisdiction in which the restaurant is located. Various federal and state labor laws govern our relationship with our employees, e.g., minimum wage, overtime pay, unemployment tax, health insurance, and workers’ compensation. Federal state and local government agencies have established regulations requiring that we disclose nutritional information. To date, none of the Company’s restaurant operations have been materially adversely affected by such laws or been affected by any difficulty, delay or failure to obtain required licenses or approvals.
Trademark and licenses
The name and reputation of Steak n Shake is a material asset and management protects it and other service marks through appropriate registrations.
Insurance Business
Our insurance business is composed of First Guard Insurance Company and its agency, 1st Guard Corporation (collectively “First Guard”). First Guard is a direct underwriter of commercial truck insurance, selling physical damage and nontrucking liability insurance to truckers. First Guard is headquartered in Venice, Florida.
First Guard competes for truck insurance with other companies. The commercial truck insurance business is highly competitive in the areas of price and service. Vigorous competition is provided by large, well-capitalized companies and by small regional insurers. First Guard’s insurance products are marketed primarily through direct response methods via the Internet or by telephone. First Guard’s cost-efficient direct response marketing methods enable it to be a low-cost truck insurer. First Guard uses its own claim staff to manage claims. Seasonal variations in First Guard’s insurance business are not significant. However, extraordinary weather conditions or other factors may have a significant effect upon the frequency or severity of claims.
The insurance business is stringently regulated by state insurance departments. First Guard operates under licenses issued by various insurance authorities. Such supervision and regulation include matters relating to authorized lines of business, capital and surplus requirements, licensing of insurers, investments, the filing of annual and other financial reports prepared on the basis of Statutory Accounting Principles, the filing and form of actuarial reports, dividends, and a variety of other financial and non-financial matters.
Oil and Gas Business
On September 9, 2019, a wholly-owned subsidiary of the Company, Southern Oil Company, acquired the stock of Southern Oil of Louisiana Inc. (collectively “Southern Oil”). Southern Oil primarily operates oil and natural gas properties offshore in the shallow waters of the Gulf of Mexico. Southern Oil is headquartered in Metairie, Louisiana.
The oil and gas industry is fundamentally a commodity business. Southern Oil’s operations and earnings, therefore, may be significantly affected by changes in oil and natural gas prices. Southern Oil competes with fully integrated, major global petroleum companies, as well as independent and national petroleum companies. In addition, the company is subject to a variety of risks inherent in the oil and gas businesses, including a wide range of local, state, and federal regulations.
Media and Licensing Business
Maxim’s business lies principally in media and licensing. Maxim is headquartered in New York City, New York.
Maxim competes for licensing business with other companies. The nature of the licensing business is predicated on projects that materialize with irregularity. In addition, publishing is a highly competitive business. The Company's magazines and related publishing products and services compete with other mass media, including the Internet.
Maxim products are marketed under various registered brand names, including, but not limited to, “MAXIM®” and “Maxim®”.
2
Investments
The Company and its subsidiaries have invested in The Lion Fund, L.P. and The Lion Fund II, L.P. (collectively, “the investment partnerships”). The investment partnerships operate as private investment funds. As of December 31, 2019, the fair value of the investments was $666.1 million. These investments are subject to a rolling five-year lock-up period under the terms of the respective partnership agreements.
Employees
The Company employs 10,906 persons.
Additional information with respect to Biglari Holdings’ businesses
Information related to our reportable segments may be found in Part II, Item 8 of this Form 10-K.
Biglari Holdings maintains a website (www.biglariholdings.com) where its annual reports, press releases, interim shareholder reports and links to its subsidiaries’ websites can be found. Biglari Holdings’ periodic reports filed with the Securities and Exchange Commission (the “SEC”), which include Form 10-K, Form 10-Q, Form 8-K and amendments thereto, may be accessed by the public free of charge from the SEC and through Biglari Holdings’ website. In addition, corporate governance documents such as Corporate Governance Guidelines, Code of Conduct, Compensation Committee Charter and Audit Committee Charter are posted on the Company’s website and are available without charge upon written request. The Company’s website and the information contained therein or connected thereto are not intended to be incorporated into this report on Form 10-K.
|
Risk Factors |
Biglari Holdings and its subsidiaries (referred to herein as “we,” “us,” “our,” or similar expressions) are subject to certain risks and uncertainties in its business operations which are described below. The risks and uncertainties described below are not the only risks we face. Additional risks and uncertainties not presently known or that are currently deemed immaterial may also impair our business operations.
Risks relating to Biglari Holdings
We are dependent on our Chairman and CEO.
Our success depends on the services of Sardar Biglari, Chairman and Chief Executive Officer. All major investment and capital allocation decisions are made for the Company and its subsidiaries by Mr. Biglari. If for any reason the services of Mr. Biglari were to become unavailable, a material adverse effect on our business could occur.
Sardar Biglari, Chairman and CEO, beneficially owns over 50% of our outstanding shares of common stock, enabling Mr. Biglari to exert control over matters requiring shareholder approval.
Mr. Biglari has the ability to control the outcome of matters submitted to our shareholders for approval, including the election or removal of directors, the amendment of our certificate of incorporation or bylaws, along with other significant transactions. In addition, Mr. Biglari has the ability to control the management and affairs of the Company. This control position may conflict with the interests of some or all of the Company’s passive shareholders, and reduce the possibility of a merger proposal, tender offer or proxy contest for the removal of directors.
We are a “controlled company” within the meaning of the New York Stock Exchange rules and thus can rely on exemptions from certain corporate governance requirements.
Because Mr. Biglari beneficially owns more than 50% of the Company’s outstanding voting stock, we are considered a “controlled company” pursuant to New York Stock Exchange rules. As a result, we are not required to comply with certain director independence and board committee requirements. The Company does not have a governance and nominating committee.
Our historical growth rate is not indicative of our future growth.
When evaluating our historical growth and prospects for future growth, it is important to consider that while our business philosophy has remained constant our mix of business has changed and will continue to change. Our business model makes it difficult to assess our prospects for future growth.
3
Biglari Holdings’ access to capital is subject to restrictions that may adversely affect its ability to satisfy its cash requirements or implement its growth strategy.
We are a holding company and are largely dependent upon dividends and other sources of funds from our subsidiaries in order to meet our needs. Steak n Shake’s credit facility contains restrictions on its ability to pay dividends to Biglari Holdings. In addition, the ability of our insurance subsidiaries to pay dividends to Biglari Holdings is regulated by state insurance laws, which limit the amount of, and in certain circumstances may prohibit the payment of, cash dividends. Furthermore, as a result of our substantial investments in The Lion Fund, L.P. and The Lion Fund II, L.P., investment partnerships controlled by Mr. Biglari, our access to capital is restricted by the terms of their respective partnership agreements, as described more fully below. There is also a high likelihood that we will make additional investments in these investment partnerships. Taken together, these restrictions may result in our having insufficient funds to satisfy our cash requirements. As a result, we may need to look to other sources of capital which may be more expensive or may not be available.
Competition.
Each of our operating businesses faces intense competitive pressure within the markets in which they operate. Competition may arise domestically as well as internationally. Accordingly, future operating results will depend to some degree on whether our operating units are successful in protecting or enhancing their competitive advantages. If our operating businesses are unsuccessful in these efforts, our periodic operating results may decline from current levels in the future. We also highlight certain competitive risks in the sections below.
Unfavorable domestic and international economic, societal and political conditions could hurt our operating businesses.
To the extent that the economy worsens for a prolonged period of time, one or more of our significant operations could be materially harmed. In addition, our restaurant operations depend on having access to borrowed funds through the capital markets at reasonable rates. To the extent that access to credit is restricted or the cost of funding increases, our business could be adversely affected.
Our operating businesses face a variety of risks associated with doing business in foreign markets.
There is no assurance that our international operations will remain profitable. Our international operations are subject to all of the risks associated with our domestic operations, as well as a number of additional risks, varying substantially country by country. These include, inter alia, international economic and political conditions, corruption, terrorism, social and ethnic unrest, foreign currency fluctuations, differing cultures and consumer preferences.
In addition, we may become subject to foreign governmental regulations that impact the way we do business with our international franchisees and vendors. These include antitrust and tax requirements, anti-boycott regulations, international trade regulations, the USA Patriot Act, the Foreign Corrupt Practices Act, and applicable local law. Failure to comply with any such legal requirements could subject us to monetary liabilities and other sanctions, which could harm our business and our financial condition.
Potential changes in law or regulations may have a negative impact on our Class A common stock and Class B common stock.
In prior years, bills have been introduced in Congress that, if enacted, would have prohibited the listing of common stock on a national securities exchange if such common stock was part of a class of securities that has no voting rights or carries disproportionate voting rights. Although these bills have not been acted upon by Congress, there can be no assurance that such a bill (or a modified version thereof) will not be introduced in Congress in the future. Legislation or other regulatory developments could make the shares of Class A common stock and Class B common stock ineligible for trading on the NYSE or other national securities exchanges.
We may not be able to adequately protect our intellectual property, which could decrease the value of our brand and products.
The success of our business depends on the continued ability to use the existing trademarks, service marks, and other components of our brand to increase brand awareness and further develop branded products. While we take steps to protect our intellectual property, our rights to our trademarks could be challenged by third parties or our use of these trademarks may result in a liability for trademark infringement, trademark dilution, or unfair competition, adversely affecting our profitability. We may also become subject to these risks in the international markets in which we operate and in which we plan to expand. Any impairment of our intellectual property or brands, including due to changes in U.S. or foreign intellectual property laws or the absence of effective legal protections or enforcement measures, could adversely impact our business, financial condition and results of operations.
Litigation could have a material adverse effect on our financial position, cash flows and results of operations.
We are or may be from time to time a party to various legal actions, investigations and other proceedings brought by employees, consumers, policyholders, suppliers, shareholders, government agencies or other third parties in connection with matters pertaining to our business, including related to our investment activities. The outcome of such matters is often difficult to assess or quantify and the cost to defend future proceedings may be significant. Even if a claim is unsuccessful or is not fully pursued, the negative publicity surrounding any negative allegation regarding our Company, our business or our products could adversely affect our reputation. While we believe that the ultimate outcome of routine legal proceedings individually and in the aggregate will not have a material impact on our financial position, we cannot assure that an adverse outcome on, or reputational damage from, any of these matters would not, in fact, materially impact our business and results of operations for the period when these matters are completed or otherwise resolved.
4
Risks Relating to Our Restaurant Operations
Our restaurant operations face intense competition from a wide range of industry participants.
The restaurant business is one of the most competitive industries. As there are virtually no barriers to entry into the restaurant business, competitors may include national, regional and local establishments. There may be established competitors with financial and other resources that are greater than the Company’s restaurant operations capabilities. Restaurant businesses compete on the basis of price, menu, food quality, location, and customer service. The restaurant business is often affected by changes in consumer tastes and by national, regional, and local economic conditions. The performance of individual restaurants may be impacted by factors such as traffic patterns, demographic trends, weather conditions, and competing restaurants. Additional factors that may adversely affect the restaurant industry include, but are not limited to, food and wage inflation, safety, and food-borne illness.
Changes in economic conditions may have an adverse impact on our restaurant operations.
Our restaurant operations are subject to normal economic cycles affecting the economy in general or the restaurant industry in particular. The restaurant industry has been affected by economic factors, including the deterioration of global, national, regional and local economic conditions, declines in employment levels, and shifts in consumer spending patterns. Declines in consumer restaurant spending could be harmful to our financial position and results of operations. As a result, decreased cash flow generated from our business may adversely affect our financial position and our ability to fund our operations. In addition, macroeconomic disruptions could adversely impact the availability of financing for our franchisees’ expansions and operations.
Steak n Shake’s credit facility matures on March 19, 2021.
The term loan under Steak n Shake’s credit facility matures on March 19, 2021. As of December 31, 2019, $181,498 was outstanding. Biglari Holdings and other affiliates (other than Steak n Shake’s subsidiaries) do not guarantee any of the debt. Steak n Shake may need to seek additional financing, which may not be available on terms commensurate with its current financing arrangement. The inability to refinance the debt would negatively impact our operations and financial condition.
Our cash flows and financial position could be negatively impacted if we are unable to comply with the restrictions and covenants in Steak n Shake’s debt agreements.
Covenants in Steak n Shake’s credit facility include restrictions on, among other things, its ability to incur additional indebtedness and to make distributions to the Company. Steak n Shake’s ability to make payments on its credit facility and to fund operations depends on its ability to generate cash, which is subject to general economic, financial, competitive, regulatory and other factors that are beyond our control. Steak n Shake may not generate sufficient cash flow from operations to service this debt or to fund its other liquidity needs. Steak n Shake’s failure to service its debt could constitute an event of default that, if not cured or waived, could result, among other things, in the acceleration of their indebtedness, which would negatively impact our operations. However, neither the Company nor any of our affiliates (other than Steak n Shake’s subsidiaries) provide any guarantees of Steak n Shake’s indebtedness.
Steak n Shake’s re-opening of temporarily closed stores may not be successful in reversing its declining sales or profitability.
Since 2017, Steak n Shake has experienced declining sales and profitability. As of December 31, 2019, a total of 107 Steak n Shake restaurants were temporarily closed. Steak n Shake is actively working to re-open these stores as counter service units. There are no assurances that Steak n Shake will be able to restore profitability after re-opening closed stores.
Fluctuations in commodity and energy prices and the availability of commodities, including beef and dairy, could affect our restaurant business.
The cost, availability and quality of ingredients restaurant operations use to prepare their food is subject to a range of factors, many of which are beyond their control. A significant component of our restaurant business’ costs is related to food commodities, including beef and dairy products, which can be subject to significant price fluctuations due to seasonal shifts, climate conditions, industry demand, changes in commodity markets, and other factors. If there is a substantial increase in prices for these food commodities, our results of operations may be negatively affected. In addition, our restaurants are dependent upon frequent deliveries of perishable food products that meet certain specifications. Shortages or interruptions in the supply of perishable food products caused by unanticipated demand, problems in production or distribution, disease or food-borne illnesses, inclement weather, or other conditions could adversely affect the availability, quality, and cost of ingredients, which would likely lower revenues, damage our reputation, or otherwise harm our business.
5
Adverse weather conditions or losses due to casualties could negatively impact our operating performance.
Property damage caused by casualties and natural disasters, instances of inclement weather, flooding, hurricanes, fire, and other acts of nature can adversely impact sales in several ways. Many of Steak n Shake’s and Western Sizzlin’s restaurants are located in the Midwest and Southeast portions of the United States. During the first and fourth quarters, restaurants in the Midwest may face harsh winter weather conditions. During the third and fourth quarters, restaurants in the Southeast may experience hurricanes or tropical storms. Our sales and operating results may be negatively affected by these harsh weather conditions, which could make it more difficult for guests to visit our restaurants, necessitate the closure of restaurants, cause physical damage, or lead to a shortage of employees.
We are subject to health, employment, environmental, and other government regulations, and failure to comply with existing or future government regulations could expose us to litigation or penalties, damage our reputation, and lower profits.
We are subject to various global, federal, state, and local laws and regulations affecting our restaurant operations. Changes in existing laws, rules and regulations applicable to us, or increased enforcement by governmental authorities, may require us to incur additional costs and expenses necessary for compliance. If we fail to comply with any of these laws, we may be subject to governmental action or litigation, and our reputation could be accordingly harmed. Injury to our reputation would, in turn, likely reduce revenues and profits.
The development and construction of restaurants is subject to compliance with applicable zoning, land use, and environmental regulations. Difficulties in obtaining, or failure to obtain, the required licenses or approvals could delay or prevent the development of a new restaurant in a particular area.
In recent years, there has been increased legislative, regulatory, and consumer focus on nutrition and advertising practices in the food industry. As a result, restaurant operations have become subject to regulatory initiatives in the area of nutrition disclosure or advertising, such as requirements to provide information about the nutritional content of our food products. The operation of the Steak n Shake and Western Sizzlin franchise system is also subject to franchise laws and regulations enacted by a number of states, and to rules promulgated by the U.S. Federal Trade Commission. Any future legislation regulating franchise relationships may negatively affect our operations, particularly our relationship with franchisees. Failure to comply with new or existing franchise laws and regulations in any jurisdiction or to obtain required government approvals could result in a ban or temporary suspension on future franchise sales. Further national, state and local government initiatives, such as mandatory health insurance coverage, or proposed increases in minimum wage rates could adversely affect our business.
Risks Relating to Our Investment Activities
Our investment activities are conducted primarily through outside investment partnerships, The Lion Fund, L.P. and The Lion Fund II, L.P., which are controlled by Mr. Biglari.
Our investment activities are conducted mainly through these outside investment partnerships. Under the terms of their partnership agreements, each contribution made by the Company to the investment partnerships is subject to a five-year lock-up period, and any distribution upon our withdrawal of funds will be paid out over a two-year period (and may be paid in-kind rather than in cash, thus increasing the difficulty of liquidating these investments). As a result of these provisions and our consequent inability to access this capital for a defined period, our capital invested in the investment partnerships may be subject to an increased risk of loss of all or a significant portion of value, and we may become unable to meet our capital requirements. There is a high likelihood that we will make additional investments in these investment partnerships in the future.
We also have a services agreement with Biglari Capital Corp., the general partner of the investment partnerships (“Biglari Capital”), and Biglari Enterprises LLC (collectively, the “Biglari Entities”), in which the Company pays a fixed fee to the Biglari Entities for business and administrative-related services. The Biglari Entities are owned by Mr. Biglari. There can be no assurance that the fees paid will be commensurate with the benefits received.
The incentive allocation to which Mr. Biglari, as Chairman and Chief Executive Officer of Biglari Capital, is entitled under the terms of the respective partnership agreements is equal to 25% of the net profits allocated to the limited partners in excess of a 6% hurdle rate over the previous high-water mark.
Our investments are unusually concentrated and fair values are subject to a loss in value.
Our investments are predominantly held through the investment partnerships, which generally invest in common stocks. These investments are largely concentrated in the common stock of one investee, Cracker Barrel Old Country Store, Inc. A significant decline in the major values of these investments may produce a large decrease in our consolidated shareholders’ equity and can have a material adverse effect on our consolidated book value per share and earnings.
6
We are subject to the risk of possibly becoming an investment company under the Investment Company Act of 1940.
We run the risk of inadvertently becoming an investment company, which would require us to register under the Investment Company Act of 1940, as amended (the “Investment Company Act”). Registered investment companies are subject to extensive, restrictive and potentially adverse regulations relating to, among other things, operating methods, management, capital structure, dividends and transactions with affiliates. Registered investment companies are not permitted to operate their business in the manner in which we operate our business, nor are registered investment companies permitted to have many of the relationships that we have with our affiliated companies.
To avoid becoming and registering as an investment company under the Investment Company Act, we operate as an ongoing enterprise, with approximately 11,000 employees, along with an asset base from which to pursue acquisitions. Furthermore, Section 3(c)(3) of the Investment Company Act excludes insurance companies from the definition of “investment company”. Because we monitor the value of our investments and structure transactions accordingly, we may structure transactions in a less advantageous manner than if we did not have Investment Company Act concerns, or we may avoid otherwise economically desirable transactions due to those concerns. In addition, adverse developments with respect to our ownership of certain of our operating subsidiaries, including significant appreciation or depreciation in the market value of certain of our publicly traded holdings, could result in our inadvertently becoming an investment company. If it were established that we were an investment company, there would be a risk, among other material adverse consequences, that we could become subject to monetary penalties or injunctive relief, or both, in an action brought by the SEC, that we would be unable to enforce contracts with third parties or that third parties could seek to obtain rescission of transactions with us undertaken during the period it was established that we were an unregistered investment company.
Risks Relating to Our Insurance Business
Our success depends on our ability to underwrite risks accurately and to charge adequate rates to policyholders.
Our results of operations depend on our ability to underwrite and set rates accurately for risks assumed. A primary role of the pricing function is to ensure that rates are adequate to generate sufficient premiums to pay losses, loss adjustment expenses, and underwriting expenses.
Our insurance business is vulnerable to significant catastrophic property loss, which could have an adverse effect on its financial condition and results of operations.
Our insurance business faces a significant risk of loss in the ordinary course of its business for property damage resulting from natural disasters, man-made catastrophes and other catastrophic events. These events typically increase the frequency and severity of commercial property claims. Because catastrophic loss events are by their nature unpredictable, historical results of operations may not be indicative of future results of operations, and the occurrence of claims from catastrophic events may result in significant volatility in our insurance business’ financial condition and results of operations from period to period. We attempt to manage our exposure to these events through reinsurance programs, although there is no assurance we will be successful in doing so.
Our insurance business is subject to extensive existing state, local and foreign governmental regulations that restrict its ability to do business and generate revenues.
Our insurance business is subject to regulation in the jurisdictions in which it operates. These regulations may relate to, among other things, the types of business that can be written, the rates that can be charged for coverage, the level of capital and reserves that must be maintained, and restrictions on the types and size of investments that can be placed. Regulations may also restrict the timing and amount of dividend payments. Accordingly, existing or new regulations related to these or other matters or regulatory actions imposing restrictions on our insurance business may adversely impact its results of operations.
Risks Relating to Our Media and Licensing Business
Our media business faces significant competition from other magazine publishers and other forms of media, including digital media, and as a result our media business may not be able to improve its operating results.
Our media business competes principally with other magazine publishers. The proliferation of choices available to consumers for information and entertainment has resulted in audience fragmentation and has negatively impacted overall consumer demand for print magazines and intensified competition with other magazine publishers for share of print magazine readership. Our media business also competes with digital publishers and other forms of media. This competition has intensified as a result of the proliferation of mobile devices and the shift in consumer preference from print media to digital media for the delivery and consumption of content.
Competition among print magazine and digital publishers for advertising is primarily based on the circulation and readership of magazines and the number of visitors to websites, respectively, and the demographics of customers, advertising rates, plus the effectiveness of advertising sales teams. The proliferation of new platforms available to advertisers, combined with continuing competition from print platforms, has impacted both the amount of advertising our media business is able to sell and the rates it can command.
7
Our pursuit of licensing opportunities for the Maxim brand may prove to be unsuccessful.
Maxim’s success depends to a significant degree upon its ability to develop new licensing agreements to expand its brand. However, these licensing efforts may be unsuccessful. We may be unable to secure favorable terms for future licensing arrangements, which could lead to, among other things, disputes with licensing partners that hinder our ability to grow the Maxim brand. Future licensing partners may also fail to honor their contractual obligations or take other actions that can diminish the value of the Maxim brand. Disputes could also arise that prevent or delay our ability to collect licensing revenues under these arrangements. If any of these developments occur or our licensing efforts are otherwise not successful, the value and recognition of the Maxim brand, as well as the prospects of our media business, could be materially, adversely affected.
Our media business is exposed to risks associated with weak economic conditions.
Because magazines are generally discretionary purchases for consumers, circulation revenues are sensitive to general economic conditions and economic cycles. Certain economic conditions such as general economic downturns, including periods of increased inflation, unemployment levels, interest rates, gasoline and other energy prices, or declining consumer confidence, may negatively impact consumer spending. Reduced consumer spending or a shift in consumer spending patterns away from discretionary items will likely result in reduced demand for our media business’ magazines and may result in decreased revenues.
Risks Relating to Our Oil and Gas Business
Our oil and gas business is exposed to the effects of volatile commodity prices.
The single largest variable that affects Southern Oil’s results of operations is the price of crude oil and natural gas. The price we receive for our oil and natural gas production heavily influences Southern Oil’s revenue and profitability. Extended periods of low prices for crude oil or natural gas can have a material adverse impact on our results of operations.
Our scope of business is concentrated in the shallow waters of the Gulf of Mexico.
Any disruption of its extractive business would adversely affect Southern Oil’s revenues and profitability. Southern Oil’s operations are therefore subject to disruption from natural or human causes beyond its control, including physical risks from hurricanes, severe storms, and other forms of system failures, any of which could result in suspension of operations or harm to people or the natural environment.
Our oil and gas business can be adversely affected by political or regulatory developments affecting our operations.
Southern Oil’s operations can be affected by changing economic, regulatory and political environments. Litigation or changes in national, state, or local environmental regulations or laws, including those designed to stop or impede the development or production of oil and natural gas, could adversely affect Southern Oil’s operations and profitability.
| Item 1B. | Unresolved Staff Comments |
None.
8
| Item 2. | Properties |
Restaurant Properties
As of December 31, 2019, restaurant operations included 662 company-operated and franchise locations. Restaurant operations own the land and building for 152 restaurants. The following table lists the locations of the restaurants, as of December 31, 2019.
| Steak n Shake | Western Sizzlin | |||||||||||||||||||||||
Company Operated | Franchise Partner | Traditional Franchise | Company Operated | Franchise | Total | |||||||||||||||||||
| Domestic: | ||||||||||||||||||||||||
| Alabama | 2 | — | 7 | — | 6 | 15 | ||||||||||||||||||
| Arizona | 1 | — | 1 | — | — | 2 | ||||||||||||||||||
| Arkansas | — | — | 7 | — | 13 | 20 | ||||||||||||||||||
| California | 1 | — | 7 | — | 1 | 9 | ||||||||||||||||||
| Colorado | 1 | — | 2 | — | — | 3 | ||||||||||||||||||
| Delaware | — | — | 1 | — | — | 1 | ||||||||||||||||||
| Florida | 71 | 9 | 7 | — | — | 87 | ||||||||||||||||||
| Georgia | 20 | 1 | 15 | — | 5 | 41 | ||||||||||||||||||
| Illinois | 57 | 2 | 10 | — | — | 69 | ||||||||||||||||||
| Indiana | 61 | 5 | 5 | — | — | 71 | ||||||||||||||||||
| Iowa | 3 | — | — | — | — | 3 | ||||||||||||||||||
| Kansas | — | — | 4 | — | — | 4 | ||||||||||||||||||
| Kentucky | 12 | 2 | 12 | — | — | 26 | ||||||||||||||||||
| Louisiana | — | — | 2 | — | — | 2 | ||||||||||||||||||
| Maryland | — | — | 1 | — | 1 | 2 | ||||||||||||||||||
| Michigan | 19 | — | — | — | — | 19 | ||||||||||||||||||
| Mississippi | — | — | 6 | — | 1 | 7 | ||||||||||||||||||
| Missouri | 31 | 2 | 23 | — | — | 56 | ||||||||||||||||||
| Nebraska | — | — | 1 | — | — | 1 | ||||||||||||||||||
| Nevada | — | — | 6 | — | — | 6 | ||||||||||||||||||
| North Carolina | 5 | 1 | 9 | — | 6 | 21 | ||||||||||||||||||
| Ohio | 55 | 2 | 3 | — | 1 | 61 | ||||||||||||||||||
| Oklahoma | — | — | 3 | — | 5 | 8 | ||||||||||||||||||
| Pennsylvania | 7 | — | 4 | — | — | 11 | ||||||||||||||||||
| South Carolina | 1 | — | 3 | — | 2 | 6 | ||||||||||||||||||
| Tennessee | 7 | 2 | 17 | — | 3 | 29 | ||||||||||||||||||
| Texas | 11 | 3 | 19 | — | 1 | 34 | ||||||||||||||||||
| Virginia | — | — | 2 | 3 | 3 | 8 | ||||||||||||||||||
| Washington | — | — | 1 | — | — | 1 | ||||||||||||||||||
| Washington DC | — | — | 1 | — | — | 1 | ||||||||||||||||||
| West Virginia | — | — | 3 | 1 | — | 4 | ||||||||||||||||||
| International: | ||||||||||||||||||||||||
| France | 2 | — | 23 | — | — | 25 | ||||||||||||||||||
| Italy | — | — | 1 | — | — | 1 | ||||||||||||||||||
| Portugal | — | — | 4 | — | — | 4 | ||||||||||||||||||
| Qatar | — | — | 1 | — | — | 1 | ||||||||||||||||||
| Saudi Arabia | — | — | 1 | — | — | 1 | ||||||||||||||||||
| Spain | 1 | — | 1 | — | — | 2 | ||||||||||||||||||
| Total | 368 | 29 | 213 | 4 | 48 | 662 | ||||||||||||||||||
As of December 31, 2019, 107 of the 368 Steak n Shake company-operated stores were temporarily closed. We anticipate re-opening the temporarily closed stores as counter service units.
Oil and Gas Properties
Southern Oil operates oil and natural gas wells in Texas and Louisiana. It’s operations are primarily offshore in the shallow waters of the Gulf of Mexico.
9
|
Legal Proceedings |
We are involved in various legal proceedings and have certain unresolved claims pending. We believe, based on examination of these matters and experiences to date, that the ultimate liability, if any, in excess of amounts already provided in our consolidated financial statements is not likely to have a material effect on our results of operations, financial position or cash flow.
On January 29, 2018, a shareholder of the Company filed a purported class action complaint against the Company and the members of our Board of Directors in the Superior Court of Hamilton County, Indiana. The shareholder generally alleges claims of breach of fiduciary duty by the members of our Board of Directors and unjust enrichment to Mr. Biglari as a result of the dual class structure.
On March 26, 2018, a shareholder of the Company filed a purported class action complaint against the Company and the members of our Board of Directors in the Superior Court of Hamilton County, Indiana. This shareholder generally alleges claims of breach of fiduciary duty by the members of our Board of Directors. This shareholder sought to enjoin the shareholder vote on April 26, 2018 to approve the dual class structure. On April 16, 2018, the shareholder withdrew their motion to enjoin the shareholder vote on April 26, 2018.
On May 17, 2018, the shareholders who filed the January 29, 2018 complaint and the March 26, 2018 complaint filed a new, consolidated complaint against the Company and the members of our Board of Directors in the Superior Court of Hamilton County, Indiana. The shareholders generally allege claims of breach of fiduciary duty by the members of our Board of Directors and unjust enrichment to Mr. Biglari arising out of the dual class structure. The shareholders seek, for themselves and on behalf of all other shareholders as a class, a declaration that the defendants breached their duty to the shareholders and the class, and to recover unspecified damages, pre-judgment and post-judgment interest, and an award of their attorneys’ fees and other costs.
On December 14, 2018, the judge of the Superior Court of Hamilton County, Indiana issued an order granting the Company’s motion to dismiss the shareholders’ lawsuits. On January 11, 2019, the shareholders filed an appeal of the judge’s order dismissing the lawsuits. On December 4, 2019, the Indiana Court of Appeals issued a unanimous decision affirming the trial court’s decision to dismiss the shareholder litigation. On January 20, 2020, the shareholders filed a petition to transfer with the Indiana Supreme Court seeking review of the decision of the Court of Appeals. The Company opposed the petition. The Indiana Supreme Court has not ruled upon the petition to transfer.
On September 8, 2014, two former restaurant manager employees filed a purported class action lawsuit against Steak n Shake (Drake v. Steak n Shake). On January 30, 2017, a former restaurant manager employee filed a purported class action lawsuit against Steak n Shake (Clendenen v. Steak n Shake). The plaintiffs generally allege claims that Steak n Shake improperly classified its managerial employees as exempt. On July 26, 2019, the Company agreed to settle both cases for $8,350 and the Court approved the terms of the settlement. The settlement is reflected in selling, general and administrative expenses in the consolidated statement of earnings.
|
Mine Safety Disclosures |
Not applicable.
|
Market for Registrant’s Common Equity, Related Stockholder Matters and Issuer Purchases of Equity Securities |
Market Information
Biglari Holdings’ Class A common stock and Class B common stock are listed for trading on the NYSE, trading symbol: BH.A and BH, respectively.
Shareholders
Biglari Holdings had 2,630 beneficial shareholders of its Class A common stock and 5,314 beneficial shareholders of its Class B common stock as of February 10, 2020.
Dividends
Biglari Holdings has never declared a dividend.
10
Issuer Purchases of Equity Securities
From November 5, 2019 through November 26, 2019, Sardar Biglari purchased 7,699 shares of Class A common stock at an average price paid per share of $557.33. Mr. Biglari may be deemed to be an “affiliated purchaser” as defined in Rule 10b-18(a)(3) under the Securities Exchange Act of 1934, as amended. The purchases were made through open market transactions.
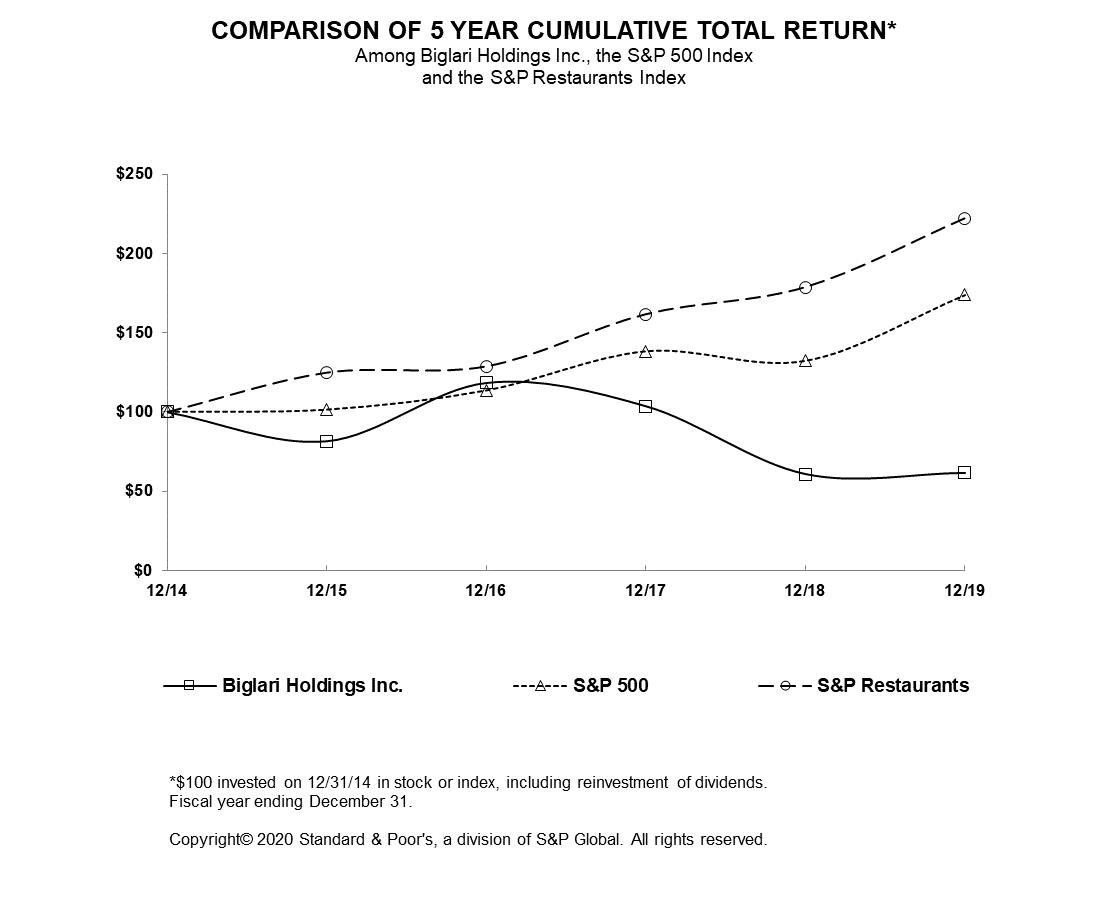
Performance Graph
The graph below matches Biglari Holdings Inc.'s cumulative 5-year total shareholder return on its Class A common stock and Class B common stock with the cumulative total returns of the S&P 500 Index and the S&P Restaurants Index. The graph tracks the performance of a $100 investment in our common stock and in each index (with the reinvestment of all dividends) from December 31, 2014 to December 31, 2019.
The preceding stock price performance graph and related information shall not be deemed “soliciting material” or to be “filed” with the SEC, nor shall such information be incorporated by reference into any future filings under the Securities Exchange Act of 1934, as amended, or the Securities Act of 1933, as amended, except to the extent that we specifically incorporate it by reference into such filings.
Securities Authorized for Issuance Under Equity Compensation Plans
Biglari Holdings does not have any equity compensation plans.
11
| Item 6. | Selected Financial Data |
(dollars in thousands except per share data)
| 2019 | 2018 | 2017 | 2016 | 2015 | ||||||||||||||||
| Revenue: | ||||||||||||||||||||
| Total revenues | $ | 668,838 | $ | 809,894 | $ | 839,804 | $ | 850,076 | $ | 861,452 | ||||||||||
| Earnings: | ||||||||||||||||||||
| Net earnings (loss) | $ | 45,380 | $ | 19,392 | $ | 50,071 | $ | 99,451 | $ | (15,843 | ) | |||||||||
| Net earnings (loss) per equivalent Class A share | $ | 131.64 | $ | 55.71 | $ | 136.01 | $ | 271.22 | $ | (33.94 | ) | |||||||||
| Year-end data: | ||||||||||||||||||||
| Total assets | $ | 1,139,309 | $ | 1,029,493 | $ | 1,063,584 | $ | 1,096,967 | $ | 987,079 | ||||||||||
| Long-term notes payable and other borrowings | $ | 263,182 | $ | 240,001 | $ | 256,994 | $ | 281,555 | $ | 296,062 | ||||||||||
| Biglari Holdings Inc. shareholders’ equity | $ | 616,298 | $ | 570,455 | $ | 571,328 | $ | 531,940 | $ | 451,372 | ||||||||||
Earnings per share of common stock is based on the weighted average number of shares outstanding during the period. The issuance of dual class common stock on April 30, 2018 is applied to years 2015 through 2017 on a retrospective basis for the calculation of earnings per share. The Company has applied the “two-class method” of computing earnings per share as prescribed in Accounting Standards Codification 260, “Earnings Per Share.”
For total assets, periods prior to 2016 were adjusted for the reclassifications of debt issuance costs and deferred taxes. For long-term notes payable and other borrowings, periods prior to 2016 were adjusted for the reclassification of debt issuance.
As of January 1, 2018, franchise royalties and fees are composed of royalties and fees from Steak n Shake and Western Sizzlin franchisees. Royalties are based upon a percentage of sales of the franchise restaurant and are recognized as earned. Franchise royalties are billed on a monthly basis. Initial franchise fees when a new restaurant opens or at the start of a new franchise term are recorded as deferred revenue when received and recognized as revenue over the term of the franchise agreement. This represents a change in methodology under the January 1, 2018 adoption of Accounting Standards Codification 606 for we have historically recognized initial franchise fees upon the opening of a franchise restaurant. Comparative prior periods have not been adjusted.
12
| Item 7. | Management’s Discussion and Analysis of Financial Condition and Results of Operations |
(dollars in thousands except per share data)
Biglari Holdings Inc. is a holding company owning subsidiaries engaged in a number of diverse business activities, including property and casualty insurance, media and licensing, restaurants, and oil and gas. The Company’s largest operating subsidiaries are involved in the franchising and operating of restaurants. Biglari Holdings is founded and led by Sardar Biglari, Chairman and Chief Executive Officer of Biglari Holdings. The Company’s long-term objective is to maximize per-share intrinsic value. All major investment and capital allocation decisions are made for the Company and its subsidiaries by Mr. Biglari.
As of December 31, 2019, Mr. Biglari’s beneficial ownership was approximately 64.4% of the Company’s outstanding Class A common stock and 55.4% of the Company’s outstanding Class B common stock.
Business Acquisition
On September 9, 2019, a wholly-owned subsidiary of the Company, Southern Oil Company, acquired the stock of Southern Oil of Louisiana Inc. (collectively “Southern Oil”) for $51,505 in cash. Southern Oil primarily operates oil and natural gas properties offshore in the shallow waters of the Gulf of Mexico. The Company’s financial results include the results of Southern Oil from the acquisition date to the end of the year.
Net earnings attributable to Biglari Holdings shareholders are disaggregated in the table that follows. Amounts are recorded after deducting income taxes.
| 2019 | 2018 | 2017 | ||||||||||
| Operating businesses: | ||||||||||||
| Restaurant | $ | (10,734 | ) | $ | (2,613 | ) | $ | 9,725 | ||||
| Insurance | 5,584 | 4,915 | 3,097 | |||||||||
| Oil and gas | 5,921 | — | — | |||||||||
| Media | 572 | 796 | 435 | |||||||||
| Other | 742 | 472 | 506 | |||||||||
| Total operating businesses | 2,085 | 3,570 | 13,763 | |||||||||
| Corporate | (8,661 | ) | (8,661 | ) | 32,072 | |||||||
| Investment partnership gains | 60,773 | 33,240 | 11,080 | |||||||||
| Interest expense on notes payable | (8,817 | ) | (8,757 | ) | (6,844 | ) | ||||||
| $ | 45,380 | $ | 19,392 | $ | 50,071 | |||||||
The following discussion should be read in conjunction with Item 1, Business and our Consolidated Financial Statements and the notes thereto included in this Form 10-K. The following discussion should also be read in conjunction with the “Cautionary Note Regarding Forward-Looking Statements” and the risks and uncertainties described in Item 1A, Risk Factors set forth above.
Our Management Discussion and Analysis generally discusses 2019 and 2018 items and year-to-year comparisons between 2019 and 2018. Discussions of 2017 items and year-to-year comparisons between 2018 and 2017 can be found in “Management’s Discussion and Analysis of Financial Condition and Results of Operations” in Part II, Item 7 of our Annual Report on Form 10-K for the year ended December 31, 2018 filed with the SEC on February 25, 2019.
13
Management’s Discussion and Analysis (continued)
Restaurants
Our restaurant businesses, which include Steak n Shake and Western Sizzlin, comprise 662 company-operated and franchise restaurants as of December 31, 2019.
| Steak n Shake | Western Sizzlin | |||||||||||||||||||||||
Company- operated | Franchise | Traditional | Company- operated | Franchise | Total | |||||||||||||||||||
| Total stores as of December 31, 2016 | 417 | — | 173 | 3 | 64 | 657 | ||||||||||||||||||
| Net restaurants opened (closed) | (2 | ) | — | 27 | 1 | (6 | ) | 20 | ||||||||||||||||
| Total stores as of December 31, 2017 | 415 | — | 200 | 4 | 58 | 677 | ||||||||||||||||||
| Net restaurants opened (closed) | (2 | ) | — | 13 | — | (3 | ) | 8 | ||||||||||||||||
| Total stores as of December 31, 2018 | 413 | — | 213 | 4 | 55 | 685 | ||||||||||||||||||
| Corporate stores transitioned | (29 | ) | 29 | — | ||||||||||||||||||||
| Net restaurants opened (closed) | (16 | ) | — | — | — | (7 | ) | (23 | ) | |||||||||||||||
| Total stores as of December 31, 2019 | 368 | 29 | 213 | 4 | 48 | 662 | ||||||||||||||||||
As of December 31, 2019, 107 of the 368 Steak n Shake company-operated stores were temporarily closed. We anticipate re-opening the temporarily closed stores as franchise partner or company-operated counter service units. The term “same-store sales” refers to the sales of company-operated units that have been open at least 18 months at the beginning of the current period and have remained open through the end of the period. Same-store traffic measures the number of patrons who walk through the same units.
Restaurant operations for 2019, 2018 and 2017 are summarized below.
| 2019 | 2018 | 2017 | |||||||||||||||||
| Revenue | |||||||||||||||||||
| Net sales | $ | 578,164 | $ | 740,922 | $ | 781,856 | |||||||||||||
| Franchise royalties and fees | 27,189 | 30,998 | 20,773 | ||||||||||||||||
| Other revenue | 4,867 | 3,770 | 4,524 | ||||||||||||||||
| Total revenue | 610,220 | 775,690 | 807,153 | ||||||||||||||||
| Restaurant cost of sales | |||||||||||||||||||
| Cost of food | 176,346 | 30.5 | % | 223,273 | 30.1 | % | 238,143 | 30.5 | % | ||||||||||
| Restaurant operating costs | 307,337 | 53.2 | % | 393,348 | 53.1 | % | 404,373 | 51.7 | % | ||||||||||
| Rent | 17,266 | 3.0 | % | 19,835 | 2.7 | % | 18,514 | 2.4 | % | ||||||||||
| Total cost of sales | 500,949 | 636,456 | 661,030 | ||||||||||||||||
| Selling, general and administrative | |||||||||||||||||||
| General and administrative | 47,685 | 7.8 | % | 57,684 | 7.4 | % | 60,527 | 7.5 | % | ||||||||||
| Marketing | 39,476 | 6.5 | % | 55,063 | 7.1 | % | 49,589 | 6.1 | % | ||||||||||
| Other expenses | 1,753 | 0.3 | % | 2,383 | 0.3 | % | 2,222 | 0.3 | % | ||||||||||
| Total selling, general and administrative | 88,914 | 14.6 | % | 115,130 | 14.8 | % | 112,338 | 13.9 | % | ||||||||||
| Impairments | 8,186 | 1.3 | % | 5,677 | 0.7 | % | 1,789 | 0.2 | % | ||||||||||
| Depreciation and amortization | 21,174 | 3.5 | % | 18,831 | 2.4 | % | 20,623 | 2.6 | % | ||||||||||
| Interest on finance leases and obligations | 7,816 | 8,207 | 9,082 | ||||||||||||||||
| Earnings (loss) before income taxes | (16,819 | ) | (8,611 | ) | 2,291 | ||||||||||||||
| Income tax expense (benefit) | (6,085 | ) | (5,998 | ) | (7,434 | ) | |||||||||||||
| Contributions to net earnings | $ | (10,734 | ) | $ | (2,613 | ) | $ | 9,725 | |||||||||||
Cost of food, restaurant operating costs and rent expense are expressed as a percentage of net sales.
General and administrative, marketing, other expenses, impairments and depreciation and amortization are expressed as a percentage of total revenue.
14
Management’s Discussion and Analysis (continued)
Net sales during 2019 were $578,164 representing a decrease of $162,758 when compared to 2018. The decreased performance of our restaurant operations in 2019 was driven by a decline in Steak n Shake’s same-store sales of $35,250 and the balance of the decrease was attributable to the closure of stores. Same-store sales decreased 6.9% whereas customer traffic decreased by 11.2%.
Franchise royalties and fees in 2019 were $27,189 compared to $30,998 in 2018. The decrease in franchise royalties and fees during 2019 compared to 2018 was attributable to decreases in marketing fees of $1,858 and forfeited development fees of $1,698. During 2019, Steak n Shake opened 29 franchise units and closed 29. Western Sizzlin did not open any new franchise units and closed seven.
The cost of food in 2019 was $176,346 or 30.5% of net sales, compared with $223,273 or 30.1% of net sales in 2018. Restaurant operating costs during 2019 were $307,337 or 53.2% of net sales, compared to $393,348 or 53.1% of net sales in 2018. The decrease in cost of food and restaurant operating costs during 2019 compared to 2018 was attributable to lower net sales resulting from store closures and decreased same-store sales.
Selling, general and administrative expenses during 2019 were $88,914 or 14.6% of total revenues compared to $115,130 or 14.8% of total revenues during 2018. General and administrative expenses decreased by $9,999 during 2019 compared to 2018, primarily because of decreased personnel costs of $17,918, offset by settlements of class action complaints of $8,350. Marketing expense decreased by $15,587 in 2019 compared to 2018 primarily driven by a reduction in television and print advertising.
Asset impairments increased $2,509 during 2019 compared to 2018 primarily due to store closures. Depreciation and amortization expense increased $2,343 during 2019 compared to 2018 primarily as a result of the depreciation of finance lease assets.
Interest on obligations under leases was $7,816 during 2019, versus $8,207 during 2018. The year-over-year decrease in interest expense is primarily attributable to the maturity and retirement of lease obligations. The total obligations under leases outstanding on December 31, 2019 were $78,749 compared to $64,200 on December 31, 2018.
Insurance
First Guard is a direct underwriter of commercial truck insurance, selling physical damage and nontrucking liability insurance to truckers. Earnings of our insurance business are summarized below.
| 2019 | 2018 | 2017 | ||||||||||
| Premiums written | $ | 28,746 | $ | 26,465 | $ | 24,242 | ||||||
| Insurance losses | 16,924 | 15,457 | 14,959 | |||||||||
| Underwriting expenses | 5,345 | 5,374 | 4,765 | |||||||||
| Pre-tax underwriting gain | 6,477 | 5,634 | 4,518 | |||||||||
| Other income and expenses | ||||||||||||
| Investment income and commissions | 1,337 | 1,163 | 701 | |||||||||
| Other income (expense) | (711 | ) | (582 | ) | (449 | ) | ||||||
| Total other income | 626 | 581 | 252 | |||||||||
| Earnings before income taxes | 7,103 | 6,215 | 4,770 | |||||||||
| Income tax expense | 1,519 | 1,300 | 1,673 | |||||||||
| Contribution to net earnings | $ | 5,584 | $ | 4,915 | $ | 3,097 | ||||||
First Guard’s insurance products are marketed primarily through direct response methods via the Internet or by telephone. First Guard’s cost-efficient direct response marketing methods enable it to be a low-cost trucking insurer.
15
Management’s Discussion and Analysis (continued)
In 2019, premiums earned increased $2,281 or 8.6% compared to 2018. Pre-tax underwriting gain during 2019 was $6,477, an increase of $843 or 15.0% compared to 2018.
Insurance premiums and other on the consolidated statement of earnings includes premiums written, investment income and commissions. In the preceding table, investment income and commissions are included in other income.
Oil and Gas
Southern Oil primarily operates oil and natural gas properties offshore in the shallow waters of the Gulf of Mexico. Southern Oil was acquired on September 9, 2019. The financial results for Southern Oil from the acquisition date to the end of the year are summarized below.
| 2019 | ||||
| Oil and gas revenue | $ | 24,436 | ||
| Oil and gas production costs | 7,259 | |||
| Depreciation, depletion and accretion | 8,218 | |||
| General and administrative expenses | 927 | |||
| Earnings before income taxes | 8,032 | |||
| Income tax expense | 2,111 | |||
| Contribution to net earnings | $ | 5,921 | ||
Media and Licensing
Maxim’s business lies principally in media and licensing. Earnings of our media and licensing operations are summarized below.
| 2019 | 2018 | 2017 | ||||||||||
| Media and licensing revenue | $ | 4,099 | $ | 6,576 | $ | 7,708 | ||||||
| Media and licensing cost | 3,181 | 4,152 | 6,527 | |||||||||
| General and administrative expenses | 176 | 1,329 | 1,570 | |||||||||
| Depreciation and amortization | — | 27 | 50 | |||||||||
| Earnings (loss) before income taxes | 742 | 1,068 | (439 | ) | ||||||||
| Income tax expense (benefit) | 170 | 272 | (874 | ) | ||||||||
| Contribution to net earnings | $ | 572 | $ | 796 | $ | 435 | ||||||
We acquired Maxim with the idea of transforming its business model. The magazine developed the Maxim brand, a franchise we are utilizing to generate nonmagazine revenue, notably through licensing, a cash-generating business related to consumer products, services, and events.
Investment Partnership Gains
Earnings from our investments in partnerships are summarized below.
| 2019 | 2018 | 2017 | ||||||||||
| Investment partnership gains | $ | 78,133 | $ | 40,411 | $ | 6,965 | ||||||
| Tax expense (benefit) | 17,360 | 7,171 | (4,115 | ) | ||||||||
| Contribution to net earnings | $ | 60,773 | $ | 33,240 | $ | 11,080 | ||||||
Investment partnership gains include gains and losses from changes in the market values of underlying investments and dividends earned by the partnerships. Dividend income has a lower effective tax rate than income from changes in market values. Changes in the market values of investments can be highly volatile. The investments held by the investment partnerships are largely concentrated in the common stock of one investee, Cracker Barrel Old Country Store, Inc.
16
Management’s Discussion and Analysis (continued)
The investment partnerships hold the Company’s common stock as investments. The Company’s pro-rata share of its common stock held by the investment partnerships is recorded as treasury stock even though these shares are legally outstanding. Gains and losses on Company common stock included in the earnings of the partnerships are eliminated.
Interest Expense
The Company’s interest expense is summarized below.
| 2019 | 2018 | 2017 | ||||||||||
| Interest expense on notes payable and other borrowings | $ | (12,442 | ) | $ | (11,677 | ) | $ | (11,040 | ) | |||
| Tax benefit | (3,625 | ) | (2,920 | ) | (4,196 | ) | ||||||
| Interest expense net of tax | $ | (8,817 | ) | $ | (8,757 | ) | $ | (6,844 | ) | |||
Interest expense during 2019 increased by $765 compared to 2018 primarily due to higher average interest rates during 2019.
Income Taxes
Consolidated income tax expense was $9,761 in 2019 versus a benefit of $2,637 in 2018. Income tax expense increased by $12,398 during 2019 compared to 2018, primarily due to an increase in tax expense for investment partnership gains of $10,189.
Corporate
Corporate expenses exclude the activities in the restaurant, insurance, media and licensing, oil and gas, and other companies. Corporate net losses of $8,661 during 2019 remained flat compared to 2018.
Financial Condition
Our consolidated shareholders’ equity on December 31, 2019 was $616,298, an increase of $45,843 compared to the December 31, 2018 balance. The increase was primarily due to net income of $45,380.
Consolidated cash and investments are summarized below.
| December 31, | ||||||||
| 2019 | 2018 | |||||||
| Cash and cash equivalents | $ | 67,772 | $ | 48,557 | ||||
| Investments | 44,856 | 33,860 | ||||||
| Investments reported in other current assets | — | 4,463 | ||||||
| Fair value of interest in investment partnerships | 666,123 | 715,102 | ||||||
| Total cash and investments | 778,751 | 801,982 | ||||||
| Less: portion of Company stock held by investment partnerships | (160,581 | ) | (157,622 | ) | ||||
| Carrying value of cash and investments on balance sheet | $ | 618,170 | $ | 644,360 | ||||
Unrealized gains/losses of Biglari Holdings’ stock held by the investment partnerships are eliminated in the Company’s consolidated financial results.
Liquidity
Our balance sheet continues to maintain significant liquidity. Consolidated cash flow activities are summarized below.
| 2019 | 2018 | 2017 | ||||||||||
| Net cash provided by operating activities | $ | 93,683 | $ | 20,678 | $ | 25,780 | ||||||
| Net cash used in investing activities | (69,982 | ) | (25,290 | ) | (11,548 | ) | ||||||
| Net cash used in financing activities | (8,010 | ) | (7,530 | ) | (23,000 | ) | ||||||
| Effect of exchange rate changes on cash | (5 | ) | (78 | ) | 165 | |||||||
| Increase (decrease) in cash, cash equivalents and restricted cash | $ | 15,686 | $ | (12,220 | ) | $ | (8,603 | ) | ||||
In 2019, cash from operating activities increased by $73,005 compared to 2018, primarily because of increased distributions from investment partnerships. Distributions from investment partnerships were $129,329 and $29,660 during 2019 and 2018, respectively. Distributions to partners were higher during 2019 primarily because of tax liabilities from capital gains in the partnerships. Changes in working capital accounts decreased by $2,131 and $12,043 during 2019 and 2018, respectively. The decrease of working capital accounts during 2018 was primarily tied to the payment of the 2017 CEO incentive fee of $7,353. No incentive fees were accrued during 2019 and 2018.
17
Management’s Discussion and Analysis (continued)
Net cash used in investing activities increased during 2019 by $44,692 compared to 2018. The purchase price of Southern Oil during 2019, net of cash acquired was $51,062. Capital expenditures during 2019 were $2,386 higher than capital expenditures during 2018. The increase during 2019 compared to 2018 was primarily because of $7,594 in capitalized development costs by Southern Oil, which was offset by decreased capital expenditures by our restaurant businesses of $5,020. Purchases of investments, net of redemptions of fixed maturity securities were $5,818 during 2019 compared to $10,084 during 2018. Distributions from investment partnerships of $40,000 during 2019 and $39,040 during 2018 were reinvested into the investment partnerships in each year.
During 2019 and 2018 we incurred debt payments of $8,010 and $7,579, respectively.
We intend to meet the working capital needs of our operating subsidiaries principally through anticipated cash flows generated from operations, cash on hand, existing credit facilities, and the sale of excess properties. We continually review available financing alternatives.
Steak n Shake Credit Facility
On March 19, 2014, Steak n Shake and its subsidiaries entered into a credit agreement which provided for a senior secured term loan facility in an aggregate principal amount of $220,000. The term loan is scheduled to mature on March 19, 2021. As of December 31, 2019, $181,498 was outstanding. The Company is evaluating refinancing options although alternatives may not be available on terms commensurate with its current financing arrangement. Biglari Holdings is not a guarantor under the credit facility.
The term loan amortizes in equal quarterly installments at an annual rate of 1.0% of the original principal amount of the term loan, subject to mandatory prepayments from excess cash flow, asset sales and other events described in the credit agreement. The balance will be due at maturity.
Borrowings bear interest at a rate per annum equal to a base rate or a Eurodollar rate (minimum of 1%) plus an applicable margin. Interest on the term loan is based on a Eurodollar rate plus an applicable margin of 3.75% or on the prime rate plus an applicable margin of 2.75%. The interest rate on the term loan was 5.55% and 6.28% as of December 31, 2019 and 2018, respectively.
The credit agreement includes customary affirmative and negative covenants and events of default. As of December 31, 2019, we were in compliance with all covenants. Steak n Shake’s credit facility contains restrictions on its ability to pay dividends to Biglari Holdings.
The term loan is secured by first priority security interests in substantially all the assets of Steak n Shake. Disruptions in debt capital markets that restrict access to funding when needed could adversely affect the results of operations, liquidity and capital resources of Steak n Shake.
Western Sizzlin Revolver
As of December 31, 2019 and 2018, Western Sizzlin had no debt outstanding under its revolver.
Critical Accounting Policies
Certain accounting policies require us to make estimates and judgments in determining the amounts reflected in the consolidated financial statements. Such estimates and judgments necessarily involve varying, and possibly significant, degrees of uncertainty. Accordingly, certain amounts currently recorded in the financial statements will likely be adjusted in the future based on new available information and changes in other facts and circumstances. A discussion of our principal accounting policies that required the application of significant judgments as of December 31, 2019 follows.
Consolidation
The consolidated financial statements include the accounts of Biglari Holdings Inc. and the wholly owned subsidiaries of Biglari Holdings Inc. We consolidate limited partnership entities if we are the general partner of such entities and for which no substantive removal rights exist. The analysis as to whether to consolidate an entity is subject to a significant amount of judgment. All intercompany accounts and transactions are eliminated in consolidation.
18
Management’s Discussion and Analysis (continued)
Our interests in the investment partnerships are accounted for as equity method investments because of our retained limited partner interest in the investment partnerships. The Company records gains from investment partnerships (inclusive of the investment partnerships’ unrealized gains and losses on their securities) in the consolidated statement of earnings based on our proportional ownership interest in the investment partnerships.
Impairment of Restaurant Long-lived Assets
We review company-operated restaurants for impairment on a restaurant-by-restaurant basis when events or circumstances indicate a possible impairment. Assets included in the impairment assessment generally consist of property, equipment and leasehold improvements directly associated with an individual restaurant as well as any related finance or operating lease assets. We test for impairment by comparing the carrying value of the asset to the undiscounted future cash flows expected to be generated by the asset. If the total estimated future cash flows are less than the carrying amount of the asset, the carrying value is written down to the estimated fair value, and a loss is recognized in earnings. The future cash flows expected to be generated by an asset requires significant judgment regarding future performance of the asset, fair market value if the asset were to be sold, and other financial and economic assumptions.
Oil and Natural Gas Reserves
The estimation of proved reserves, which is based on the requirement of reasonable certainty, is an ongoing process based on rigorous technical evaluations, commercial and market assessments and detailed analysis of well and reservoir information such as flow rates and reservoir pressures. Although we are reasonably confident that proved reserves will be produced, the timing and amount recovered can be affected by a number of factors including, reservoir performance, government policies, and significant changes in long-term oil and natural gas price levels. In addition, proved reserves could be affected by an extended period of low prices which could reduce the level of our partners’ capacity to fund their share of joint projects. Accordingly, reserve estimates are generally different from the quantities of natural gas and oil that are ultimately recovered. We cannot predict the amounts or timing of future reserve revisions.
Income Taxes
We record deferred tax assets or liabilities based on differences between financial reporting and the tax basis of assets and liabilities using currently enacted rates and laws that will be in effect when the differences are expected to reverse. We record deferred tax assets to the extent we believe there will be sufficient future taxable income to utilize those assets prior to their expiration. To the extent deferred tax assets would be unable to be utilized; we would record a valuation allowance against the unrealizable amount and record that amount as a charge against earnings. Due to changing tax laws and state income tax rates, significant judgment is required to estimate the effective tax rate expected to apply to tax differences that are expected to reverse in the future. We must also make estimates about the sufficiency of taxable income in future periods to offset any deductions related to deferred tax assets currently recorded.
Goodwill and Other Intangible Assets
We evaluate goodwill and any indefinite-lived intangible assets for impairment annually, or more frequently if circumstances indicate impairment may have occurred. Goodwill impairment occurs when the estimated fair value of goodwill is less than its carrying value. The valuation methodology and underlying financial information included in our determination of fair value require significant management judgments. We use both market and income approaches to derive fair value. The judgments in these two approaches include, but are not limited to, comparable market multiples, long-term projections of future financial performance, and the selection of appropriate discount rates used to determine the present value of future cash flows.
Leases
We determine whether a contract is or contains a lease at contract inception based on the presence of identified assets and our right to obtain substantially all of the economic benefit from or to direct the use of such assets. When we determine a lease exists, we record a right-of-use asset and corresponding lease liability on our consolidated balance sheets. Right-of-use assets represent our right to use an underlying asset for the lease term. Lease liabilities represent our obligation to make lease payments arising from the lease. Right-of-use assets are recognized at commencement date at the value of the lease liability and are adjusted for any prepayments, lease incentives received, and initial direct costs incurred. Lease liabilities are recognized at the lease commencement date based on the present value of remaining lease payments over the lease term. As the discount rate implicit in the lease is not readily determinable in most of our leases, we use our incremental borrowing rate based on the information available at commencement date in determining the present value of lease payments. Our lease terms include options to extend or terminate the lease when it is reasonably certain that we will exercise that option. We do not record lease contracts with a term of 12 months or less on our consolidated balance sheets. We recognize fixed lease expense for operating leases on a straight-line basis over the lease term. For finance leases, we recognize amortization expense on the right-of-use asset and interest expense on the lease liability over the lease term.
19
Management’s Discussion and Analysis (continued)
Contractual Obligations
Our significant contractual obligations and commitments as of December 31, 2019 are shown in the following table.
| Payments due by period | |||||||||||||||||||||
| Less than | More than | ||||||||||||||||||||
| Contractual Obligations | 1 year | 1 – 3 years | 3 – 5 years | 5 years | Total | ||||||||||||||||
| Long-term debt (1) | $ | 11,859 | $ | 181,703 | $ | — | $ | — | $ | 193,562 | |||||||||||
| Finance obligations and finance lease liabilities (1) | 13,266 | 23,338 | 17,674 | 16,254 | 70,532 | ||||||||||||||||
| Operating leases (2) | 15,584 | 27,381 | 19,473 | 18,577 | 81,015 | ||||||||||||||||
| Purchase commitments (3) | 12,399 | 6,553 | — | — | 18,952 | ||||||||||||||||
| Other long-term liabilities (4) | — | — | — | 2,174 | 2,174 | ||||||||||||||||
| Total | $ | 53,108 | $ | 238,975 | $ | 37,147 | $ | 37,005 | $ | 366,235 | |||||||||||
________________
| (1) | Includes principal and interest and assumes payoff of indebtedness at maturity date. |
| (2) | Excludes amounts to be paid for contingent rents. Includes amounts to be paid for subleased properties. |
| (3) | Includes agreements to purchase goods or services that are enforceable and legally binding on us and that specify all significant terms. Excludes agreements that are cancelable without penalty. |
| (4) | Includes liabilities for Non-Qualified Deferred Compensation Plan. Excludes our unrecognized tax benefits of $348 as of December 31, 2019 because we cannot make a reliable estimate of the timing of cash payments. |
Off-Balance Sheet Arrangements
We have no off-balance sheet arrangements.
Recently Issued Accounting Pronouncements
For detailed information regarding recently issued accounting pronouncements and the expected impact on our consolidated financial statements, see Note 1, “Summary of Significant Accounting Policies” in the accompanying notes to consolidated financial statements included in Part II, Item 8 of this report on Form 10-K.
Cautionary Note Regarding Forward-Looking Statements
This report includes forward-looking statements within the meaning of the Private Securities Litigation Reform Act of 1995. In general, forward-looking statements include estimates of future revenues, cash flows, capital expenditures, or other financial items, and assumptions underlying any of the foregoing. Forward-looking statements reflect management’s current expectations regarding future events and use words such as “anticipate,” “believe,” “expect,” “may,” and other similar terminology. A forward-looking statement is neither a prediction nor a guarantee of future events or circumstances, and those future events or circumstances may not occur. Investors should not place undue reliance on the forward-looking statements, which speak only as of the date of this report. These forward-looking statements are all based on currently available operating, financial, and competitive information and are subject to various risks and uncertainties. Our actual future results and trends may differ materially depending on a variety of factors, many beyond our control, including, but not limited to, the risks and uncertainties described in Item 1A, Risk Factors set forth above. We undertake no obligation to publicly update or revise them, except as may be required by law.
20
| Item 7A. | Quantitative and Qualitative Disclosures About Market Risk |
The majority of our investments are conducted through investment partnerships, which generally hold common stocks. We also hold marketable securities directly. Through investments in the investment partnerships we hold a concentrated position in the common stock of Cracker Barrel Old Country Store, Inc. A significant decline in the general stock market or in the prices of major investments may produce a large net loss and decrease in our consolidated shareholders’ equity. Decreases in values of equity investments can have a materially adverse effect on our earnings and on consolidated shareholders’ equity.
We prefer to hold equity investments for very long periods of time so we are not troubled by short-term price volatility with respect to our investments. Our interests in the investment partnerships are committed on a rolling 5-year basis, and any distributions upon our withdrawal of funds will be paid out over two years (and may be paid in kind rather than in cash). Market prices for equity securities are subject to fluctuation. Consequently, the amount realized in the subsequent sale of an investment may significantly differ from the reported market value. A hypothetical 10% increase or decrease in the market price of our investments would result in a respective increase or decrease in the fair market value of our investments of $55,040, along with a corresponding change in shareholders’ equity of approximately 7%.
Borrowings on Steak n Shake’s credit facility bear interest at a rate per annum equal to a base rate or a Eurodollar rate (minimum of 1%) plus an applicable margin. Interest on the term loan is based on a Eurodollar rate plus an applicable margin of 3.75% or on the prime rate plus an applicable margin of 2.75%. A hypothetical 100 basis point increase in interest rates to the debt outstanding on December 31, 2019 would have an impact of approximately $1,400 on our net earnings.
We have had minimal exposure to foreign currency exchange rate fluctuations in 2019, 2018 and 2017.
Southern Oil’s business is fundamentally a commodity business. This means Southern Oil’s operations and earnings may be significantly affected by changes in oil and gas prices. Such commodity prices depend on local, regional and global events or conditions that affect supply and demand for oil and gas. Any material decline in crude oil or natural gas prices could have a material adverse effect on Southern Oil’s operations.
21
|
Financial Statements and Supplementary Data |
REPORT OF INDEPENDENT REGISTERED PUBLIC ACCOUNTING FIRM
To Shareholders and the Board of Directors of Biglari Holdings Inc.
Opinion on the Financial Statements
We have audited the accompanying consolidated balance sheets of Biglari Holdings Inc. and subsidiaries (the "Company") as of December 31, 2019 and 2018, the related consolidated statements of earnings, comprehensive income, changes in shareholders’ equity, and cash flows for each of the three years in the period ended December 31, 2019, and the related notes (collectively referred to as the "financial statements"). In our opinion, the financial statements present fairly, in all material respects, the financial position of the Company as of December 31, 2019 and 2018, and the results of its operations and its cash flows for each of the three years in the period ended December 31, 2019, in conformity with accounting principles generally accepted in the United States of America.
We have also audited, in accordance with the standards of the Public Company Accounting Oversight Board (United States) (PCAOB), the Company's internal control over financial reporting as of December 31, 2019, based on criteria established in Internal Control — Integrated Framework (2013) issued by the Committee of Sponsoring Organizations of the Treadway Commission and our report dated February 22, 2020, expressed an unqualified opinion on the Company's internal control over financial reporting.
Change in Accounting Principle
As discussed in Note 1 and Note 12 to the financial statements, the Company adopted the provisions of Accounting Standards Codification Topic 842, Leases, effective January 1, 2019 using the Comparatives Under ASC 840 approach.
Basis for Opinion
These financial statements are the responsibility of the Company's management. Our responsibility is to express an opinion on the Company's financial statements based on our audits. We are a public accounting firm registered with the PCAOB and are required to be independent with respect to the Company in accordance with the U.S. federal securities laws and the applicable rules and regulations of the Securities and Exchange Commission and the PCAOB.
We conducted our audits in accordance with the standards of the PCAOB. Those standards require that we plan and perform the audit to obtain reasonable assurance about whether the financial statements are free of material misstatement, whether due to error or fraud. Our audits included performing procedures to assess the risks of material misstatement of the financial statements, whether due to error or fraud, and performing procedures that respond to those risks. Such procedures included examining, on a test basis, evidence regarding the amounts and disclosures in the financial statements. Our audits also included evaluating the accounting principles used and significant estimates made by management, as well as evaluating the overall presentation of the financial statements. We believe that our audits provide a reasonable basis for our opinion.
Emphasis of a Matter
As discussed in Note 3 and Note 13 to the financial statements, the Company and its subsidiaries have invested in investment partnerships in the form of limited partnership interests. These investment partnerships represent related parties, and such investments are subject to a rolling five-year lock up period under the terms of the respective partnership agreements. The value of these investments reported in the Company’s consolidated balance sheets as of December 31, 2019 and 2018 totals $505,542,000 and $557,480,000, respectively. Our opinion is not modified with respect to this matter.
/s/ DELOITTE & TOUCHE LLP
Indianapolis, Indiana
February 22, 2020
We have served as the Company's auditor since 2003.
22
REPORT OF INDEPENDENT REGISTERED PUBLIC ACCOUNTING FIRM
To the Shareholders and the Board of Directors of Biglari Holdings Inc.
Opinion on Internal Control over Financial Reporting
We have audited the internal control over financial reporting of Biglari Holdings Inc. and subsidiaries (the “Company”) as of December 31, 2019, based on criteria established in Internal Control — Integrated Framework (2013) issued by the Committee of Sponsoring Organizations of the Treadway Commission (COSO). In our opinion, the Company maintained, in all material respects, effective internal control over financial reporting as of December 31, 2019, based on criteria established in Internal Control — Integrated Framework (2013) issued by COSO.
We have also audited, in accordance with the standards of the Public Company Accounting Oversight Board (United States) (PCAOB), the consolidated financial statements as of and for the year ended December 31, 2019, of the Company, and our report dated February 22, 2020, expressed an unqualified opinion on those financial statements and included an explanatory paragraph relating to the Company’s adoption of the provisions of Accounting Standards Codification Topic 842, Leases, and an emphasis of a matter paragraph relating to the Company’s investment in related party investment partnerships.
As described in Management’s Report on Internal Control Over Financial Reporting, management excluded from its assessment the internal control over financial reporting at Southern Oil Company and its related subsidiaries which was acquired on September 9, 2019, and whose financial statements constitute approximately 7.2% of total assets, 3.7% of revenues and 13.0% of net earnings of the consolidated financial statement amounts as of and for the year ended December 31, 2019. Accordingly, our audit did not include the internal control over financial reporting at Southern Oil.
Basis for Opinion
The Company’s management is responsible for maintaining effective internal control over financial reporting and for its assessment of the effectiveness of internal control over financial reporting, included in the accompanying Management’s Report on Internal Control Over Financial Reporting. Our responsibility is to express an opinion on the Company’s internal control over financial reporting based on our audit. We are a public accounting firm registered with the PCAOB and are required to be independent with respect to the Company in accordance with the U.S. federal securities laws and the applicable rules and regulations of the Securities and Exchange Commission and the PCAOB.
We conducted our audit in accordance with the standards of the PCAOB. Those standards require that we plan and perform the audit to obtain reasonable assurance about whether effective internal control over financial reporting was maintained in all material respects. Our audit included obtaining an understanding of internal control over financial reporting, assessing the risk that a material weakness exists, testing and evaluating the design and operating effectiveness of internal control based on the assessed risk, and performing such other procedures as we considered necessary in the circumstances. We believe that our audit provides a reasonable basis for our opinion.
Definition and Limitations of Internal Control over Financial Reporting
A company’s internal control over financial reporting is a process designed to provide reasonable assurance regarding the reliability of financial reporting and the preparation of financial statements for external purposes in accordance with generally accepted accounting principles. A company’s internal control over financial reporting includes those policies and procedures that (1) pertain to the maintenance of records that, in reasonable detail, accurately and fairly reflect the transactions and dispositions of the assets of the company; (2) provide reasonable assurance that transactions are recorded as necessary to permit preparation of financial statements in accordance with generally accepted accounting principles, and that receipts and expenditures of the company are being made only in accordance with authorizations of management and directors of the company; and (3) provide reasonable assurance regarding prevention or timely detection of unauthorized acquisition, use, or disposition of the company’s assets that could have a material effect on the financial statements.
Because of its inherent limitations, internal control over financial reporting may not prevent or detect misstatements. Also, projections of any evaluation of effectiveness to future periods are subject to the risk that controls may become inadequate because of changes in conditions, or that the degree of compliance with the policies or procedures may deteriorate.
/s/ DELOITTE & TOUCHE LLP
Indianapolis, Indiana
February 22, 2020
23
BIGLARI HOLDINGS INC.
(dollars in thousands)
| December 31, | ||||||||
| 2019 | 2018 | |||||||
| Assets | ||||||||
| Current assets: | ||||||||
| Cash and cash equivalents | $ | 67,772 | $ | 48,557 | ||||
| Investments | 44,856 | 33,860 | ||||||
| Receivables | 21,640 | 15,743 | ||||||
| Inventories | 4,674 | 7,537 | ||||||
| Other current assets | 6,449 | 9,236 | ||||||
| Total current assets | 145,391 | 114,933 | ||||||
| Property and equipment | 350,627 | 274,716 | ||||||
| Operating lease assets | 59,719 | — | ||||||
| Goodwill | 40,040 | 40,052 | ||||||
| Other intangible assets | 27,349 | 28,114 | ||||||
| Investment partnerships | 505,542 | 557,480 | ||||||
| Other assets | 10,641 | 14,198 | ||||||
| Total assets | $ | 1,139,309 | $ | 1,029,493 | ||||
| Liabilities and shareholders’ equity | ||||||||
| Liabilities | ||||||||
| Current liabilities: | ||||||||
| Accounts payable and accrued expenses | $ | 121,079 | $ | 117,265 | ||||
| Current portion of operating lease liabilities | 11,635 | — | ||||||
| Current portion of notes payable and other borrowings | 7,103 | 5,720 | ||||||
| Total current liabilities | 139,817 | 122,985 | ||||||
| Long-term notes payable and other borrowings | 263,182 | 240,001 | ||||||
| Operating lease liabilities | 53,271 | — | ||||||
| Deferred taxes | 54,230 | 86,871 | ||||||
| Asset retirement obligations | 10,447 | — | ||||||
| Other liabilities | 2,064 | 9,181 | ||||||
| Total liabilities | 523,011 | 459,038 | ||||||
| Shareholders’ equity | ||||||||
| Common stock | 1,138 | 1,138 | ||||||
| Additional paid-in capital | 381,788 | 381,904 | ||||||
| Retained earnings | 611,039 | 564,160 | ||||||
| Accumulated other comprehensive loss | (2,810 | ) | (2,516 | ) | ||||
| Treasury stock, at cost | (374,857 | ) | (374,231 | ) | ||||
| Biglari Holdings Inc. shareholders’ equity | 616,298 | 570,455 | ||||||
| Total liabilities and shareholders’ equity | $ | 1,139,309 | $ | 1,029,493 | ||||
See accompanying Notes to Consolidated Financial Statements.
24
BIGLARI HOLDINGS INC.
CONSOLIDATED STATEMENTS OF EARNINGS
(dollars in thousands except per-share amounts)
| Year Ended December 31, | ||||||||||||
| 2019 | 2018 | 2017 | ||||||||||
| Revenues | ||||||||||||
| Restaurant operations | $ | 610,220 | $ | 775,690 | $ | 807,153 | ||||||
| Insurance premiums and other | 30,083 | 27,628 | 24,943 | |||||||||
| Oil and gas | 24,436 | — | — | |||||||||
| Media and licensing | 4,099 | 6,576 | 7,708 | |||||||||
| 668,838 | 809,894 | 839,804 | ||||||||||
| Cost and expenses | ||||||||||||
| Restaurant cost of sales | 500,949 | 636,456 | 661,030 | |||||||||
| Insurance losses and underwriting expenses | 22,269 | 20,831 | 19,724 | |||||||||
| Oil and gas production costs | 7,259 | — | — | |||||||||
| Media and licensing cost | 3,181 | 4,152 | 6,527 | |||||||||
| Selling, general and administrative | 100,150 | 127,232 | 129,019 | |||||||||
| Impairments | 8,186 | 5,677 | 1,789 | |||||||||
| Depreciation and amortization | 29,578 | 19,318 | 21,448 | |||||||||
| 671,572 | 813,666 | 839,537 | ||||||||||
| Other income (expenses) | ||||||||||||
| Interest expense | (12,442 | ) | (11,677 | ) | (11,040 | ) | ||||||
| Interest on finance leases and obligations | (7,816 | ) | (8,207 | ) | (9,082 | ) | ||||||
| Investment partnership gains | 78,133 | 40,411 | 6,965 | |||||||||
| Total other income (expenses) | 57,875 | 20,527 | (13,157 | ) | ||||||||
| Earnings (loss) before income taxes | 55,141 | 16,755 | (12,890 | ) | ||||||||
| Income tax expense (benefit) | 9,761 | (2,637 | ) | (62,961 | ) | |||||||
| Net earnings | $ | 45,380 | $ | 19,392 | $ | 50,071 | ||||||
| Earnings per share | ||||||||||||
| Net earnings per equivalent Class A share * | $ | 131.64 | $ | 55.71 | $ | 136.01 | ||||||
* Net earnings per equivalent Class B share outstanding are one-fifth of the equivalent Class A share or $26.33 for 2019, $11.14 for 2018 and $27.20 for 2017.
CONSOLIDATED STATEMENTS OF COMPREHENSIVE INCOME
(dollars in thousands)
| Year Ended December 31, | ||||||||||||
| 2019 | 2018 | 2017 | ||||||||||
| Net earnings | $ | 45,380 | $ | 19,392 | $ | 50,071 | ||||||
| Other comprehensive income: | ||||||||||||
| Reclassification to earnings | — | (73 | ) | — | ||||||||
| Applicable income taxes | — | 15 | — | |||||||||
| Net change in unrealized gains on investments | — | — | 284 | |||||||||
| Applicable income taxes | — | — | (89 | ) | ||||||||
| Foreign currency translation | (294 | ) | (1,054 | ) | 1,985 | |||||||
| Other comprehensive income (loss), net | (294 | ) | (1,112 | ) | 2,180 | |||||||
| Total comprehensive income | $ | 45,086 | $ | 18,280 | $ | 52,251 | ||||||
See accompanying Notes to Consolidated Financial Statements.
25
BIGLARI HOLDINGS INC.
CONSOLIDATED STATEMENTS OF CASH FLOWS
(dollars in thousands)
| Year Ended December 31, | ||||||||||||
| 2019 | 2018 | 2017 | ||||||||||
| Operating activities | ||||||||||||
| Net earnings | $ | 45,380 | $ | 19,392 | $ | 50,071 | ||||||
| Adjustments to reconcile net earnings to operating cash flows: | ||||||||||||
| Depreciation and amortization | 29,578 | 19,318 | 21,448 | |||||||||
| Provision for deferred income taxes | (38,545 | ) | (2,153 | ) | (64,321 | ) | ||||||
| Asset impairments and other non-cash expenses | 9,113 | 6,481 | 3,860 | |||||||||
| (Gains) losses on disposal of assets | 264 | 993 | (777 | ) | ||||||||
| Investment (gains) losses | (1,172 | ) | (559 | ) | — | |||||||
| Investment partnership gains | (78,133 | ) | (40,411 | ) | (6,965 | ) | ||||||
| Distributions from investment partnerships | 129,329 | 29,660 | 9,395 | |||||||||
| Changes in receivables and inventories | 3,669 | (359 | ) | (2,235 | ) | |||||||
| Changes in other assets | 10,450 | 536 | 268 | |||||||||
| Changes in accounts payable and accrued expenses | (16,250 | ) | (12,220 | ) | 15,036 | |||||||
| Net cash provided by operating activities | 93,683 | 20,678 | 25,780 | |||||||||
| Investing activities | ||||||||||||
| Capital expenditures | (17,679 | ) | (15,293 | ) | (8,034 | ) | ||||||
| Purchases of perpetual lease rights | — | (2,503 | ) | — | ||||||||
| Proceeds from property and equipment disposals | 4,577 | 2,590 | 1,004 | |||||||||
| Acquisition of business, net of cash acquired | (51,062 | ) | — | — | ||||||||
| Distributions from investment partnerships | 40,000 | 39,040 | — | |||||||||
| Purchases of limited partner interests | (40,000 | ) | (39,040 | ) | (3,707 | ) | ||||||
| Purchases of investments | (154,848 | ) | (58,642 | ) | (42,648 | ) | ||||||
| Redemptions of fixed maturity securities | 149,030 | 48,558 | 41,837 | |||||||||
| Net cash used in investing activities | (69,982 | ) | (25,290 | ) | (11,548 | ) | ||||||
| Financing activities | ||||||||||||
| Payments on revolving credit facility | — | (175 | ) | (202 | ) | |||||||
| Principal payments on long-term debt | (2,200 | ) | (2,200 | ) | (17,200 | ) | ||||||
| Principal payments on direct financing lease obligations | (5,810 | ) | (5,204 | ) | (5,628 | ) | ||||||
| Proceeds for exercise of stock options | — | 49 | 30 | |||||||||
| Net cash used in financing activities | (8,010 | ) | (7,530 | ) | (23,000 | ) | ||||||
| Effect of exchange rate changes on cash | (5 | ) | (78 | ) | 165 | |||||||
| Increase (decrease) in cash, cash equivalents and restricted cash | 15,686 | (12,220 | ) | (8,603 | ) | |||||||
| Cash, cash equivalents and restricted cash at beginning of period | 55,010 | 67,230 | 75,833 | |||||||||
| Cash, cash equivalents and restricted cash at end of period | $ | 70,696 | $ | 55,010 | $ | 67,230 | ||||||
See accompanying Notes to Consolidated Financial Statements.
26
BIGLARI HOLDINGS INC.
CONSOLIDATED STATEMENTS OF CHANGES IN SHAREHOLDERS’ EQUITY
(dollars in thousands)
| Common Stock | Additional Paid-In Capital | Retained Earnings | Accumulated Other Comprehensive Income (Loss) | Treasury Stock | Total | |||||||||||||||||||
| Balance at December 31, 2016 | $ | 1,071 | $ | 381,906 | $ | 515,433 | $ | (3,584 | ) | $ | (362,886 | ) | $ | 531,940 | ||||||||||
| Net earnings | 50,071 | 50,071 | ||||||||||||||||||||||
| Other comprehensive income, net | 2,180 | 2,180 | ||||||||||||||||||||||
| Adjustment to treasury stock for | ||||||||||||||||||||||||
| holdings in investment partnerships | 116 | (13,009 | ) | (12,893 | ) | |||||||||||||||||||
| Exercise of stock options | (8 | ) | 38 | 30 | ||||||||||||||||||||
| Balance at December 31, 2017 | $ | 1,071 | $ | 382,014 | $ | 565,504 | $ | (1,404 | ) | $ | (375,857 | ) | $ | 571,328 | ||||||||||
| Net earnings | 19,392 | 19,392 | ||||||||||||||||||||||
| Adoption of accounting standards | 90 | 90 | ||||||||||||||||||||||
| Other comprehensive income, net | (1,112 | ) | (1,112 | ) | ||||||||||||||||||||
| Conversion of common stock | 67 | (67 | ) | (20,826 | ) | 20,826 | — | |||||||||||||||||
| Adjustment to treasury stock for | ||||||||||||||||||||||||
| holdings in investment partnerships | (19,292 | ) | (19,292 | ) | ||||||||||||||||||||
| Exercise of stock options | (43 | ) | 92 | 49 | ||||||||||||||||||||
| Balance at December 31, 2018 | $ | 1,138 | $ | 381,904 | $ | 564,160 | $ | (2,516 | ) | $ | (374,231 | ) | $ | 570,455 | ||||||||||
| Net earnings | 45,380 | 45,380 | ||||||||||||||||||||||
| Adoption of accounting standards | 1,499 | 1,499 | ||||||||||||||||||||||
| Other comprehensive income, net | (294 | ) | (294 | ) | ||||||||||||||||||||
| Adjustment to treasury stock for | ||||||||||||||||||||||||
| holdings in investment partnerships | (116 | ) | (626 | ) | (742 | ) | ||||||||||||||||||
| Balance at December 31, 2019 | $ | 1,138 | $ | 381,788 | $ | 611,039 | $ | (2,810 | ) | $ | (374,857 | ) | $ | 616,298 | ||||||||||
See accompanying Notes to Consolidated Financial Statements.
27
BIGLARI HOLDINGS INC.
NOTES TO CONSOLIDATED FINANCIAL STATEMENTS
(Years Ended December 31, 2019, 2018 and 2017)
(dollars in thousands, except share and per-share data)
| Note 1. | Summary of Significant Accounting Policies |
Description of Business
Biglari Holdings Inc. is a holding company owning subsidiaries engaged in a number of diverse business activities, including property and casualty insurance, media and licensing, restaurants, and oil and gas. The Company’s largest operating subsidiaries are involved in the franchising and operating of restaurants. Biglari Holdings is founded and led by Sardar Biglari, Chairman and Chief Executive Officer of the Company. The Company’s long-term objective is to maximize per-share intrinsic value. All major investment and capital allocation decisions are made for the Company and its subsidiaries by Mr. Biglari.
As of December 31, 2019, Mr. Biglari’s beneficial ownership was approximately 64.4% of the Company’s outstanding Class A common stock and 55.4% of the Company’s outstanding Class B common stock.
Business Acquisition
On September 9, 2019, a wholly-owned subsidiary of the Company, Southern Oil Company, acquired the stock of Southern Oil of Louisiana Inc. (collectively “Southern Oil”) for $51,505 in cash. Southern Oil primarily operates oil and natural gas properties offshore in the shallow waters of the Gulf of Mexico. The Company’s financial results include the results of Southern Oil from the acquisition date to the end of the year.
Acquired assets included oil and gas properties of $69,881 and accounts receivable of $6,735. Acquired liabilities included asset retirement obligations of $10,542, income taxes payable of $4,302, deferred tax liabilities of $5,671 and accounts payable of $3,949. Acquisition related expenses were recorded as general and administrative expenses.
Principles of Consolidation
The consolidated financial statements include the accounts of the Company and its wholly-owned subsidiaries including Steak n Shake Inc. (“Steak n Shake”), Western Sizzlin Corporation (“Western Sizzlin”), Maxim Inc. (“Maxim”), First Guard Insurance Company and its agency, 1st Guard Corporation (collectively “First Guard”), and Southern Oil. Intercompany accounts and transactions have been eliminated in consolidation.
Cash, Cash Equivalents and Restricted Cash
Cash equivalents primarily consist of U.S. Government securities and money market accounts, all of which have original maturities of three months or less. Cash equivalents are carried at fair value. The statement of cash flows includes restricted cash with cash and cash equivalents.
Cash as reported on the statements of cash flows consists of the following.
| December 31, | ||||||||||||
| 2019 | 2018 | 2017 | ||||||||||
| Cash and cash equivalents | $ | 67,772 | $ | 48,557 | $ | 58,577 | ||||||
| Restricted cash included in other long-term assets | 2,924 | 6,453 | 8,653 | |||||||||
| Cash, cash equivalents and restricted cash | $ | 70,696 | $ | 55,010 | $ | 67,230 | ||||||
Investments
Our investments are carried at fair value with net unrealized gains or losses reported in the statements of earnings. Realized gains and losses on disposals of investments are determined by the specific identification of cost of investments sold.
28
| Note 1. | Summary of Significant Accounting Policies (continued) |
Investment Partnerships
The Company holds a limited interest in The Lion Fund, L.P. and The Lion Fund II, L.P. (collectively the “investment partnerships”). Biglari Capital Corp. (“Biglari Capital”), an entity solely owned by Mr. Biglari, is the general partner of the investment partnerships. Our interests in the investment partnerships are accounted as equity method investments because of our retained limited partner interests. The Company records investment partnership gains (inclusive of the investment partnerships’ unrealized gains and losses on their securities) as a component of other income based on our proportional ownership interest in the partnerships. The investment partnerships are, for purposes of generally accepted accounting principles (“GAAP”), investment companies under the AICPA Audit and Accounting Guide Investment Companies.
Concentration of Equity Price Risk
The majority of our investments are conducted through investment partnerships which generally hold common stocks. We also hold marketable securities directly. Through the investment partnerships we hold a concentrated position in the common stock of Cracker Barrel Old Country Store, Inc. A significant decline in the general stock market or in the prices of major investments may have a materially adverse effect on our earnings and on consolidated shareholders’ equity.
Receivables
Our accounts receivable balance consists primarily of franchisee, customer, and other receivables. We carry our accounts receivable at cost less an allowance for doubtful accounts, which is based on a history of past write-offs and collections and current credit conditions. Allowance for doubtful accounts was $4,857 and $3,901 at December 31, 2019 and 2018, respectively.
Inventories
Inventories are valued at the lower of cost (first-in, first-out method) or market, and consist primarily of restaurant food items and supply inventory.
Property and Equipment
Restaurants
Property and equipment are stated at cost less accumulated depreciation and amortization. Depreciation and amortization are recognized on the straight-line method over the estimated useful lives of the assets (10 to 30 years for buildings and land improvements, and 3 to 10 years for equipment). Leasehold improvements are amortized on the straight-line method over the shorter of the estimated useful lives of the improvements or the term of the related leases. Interest costs associated with the construction of new restaurants are capitalized. Major improvements are also capitalized while repairs and maintenance are expensed as incurred. We review our long-lived restaurant assets whenever events or changes in circumstances indicate that their carrying amounts may not be recoverable. For purposes of this assessment, assets are evaluated at the lowest level for which there are identifiable cash flows which is generally at the individual restaurant level. Assets included in the impairment assessment generally consist of property, equipment and leasehold improvements directly associated with an individual restaurant as well as any related finance or operating lease assets. If the future undiscounted cash flows of an asset are less than the recorded value, an impairment is recorded for the difference between the carrying value and the estimated fair value of the asset.
Oil and Gas Properties
The successful efforts method is used for crude oil and natural gas exploration and production activities. All costs for development wells, related plant and equipment, proved mineral interests in crude oil and natural gas properties, and related asset retirement obligation assets are capitalized. Costs of exploratory wells are capitalized pending determination of whether the wells found proved reserves. Costs of wells that are assigned proved reserves remain capitalized. Costs also are capitalized for exploratory wells that have found crude oil and natural gas reserves even if the reserves cannot be classified as proved when the drilling is completed, provided the exploratory well has found a sufficient quantity of reserves to justify its completion as a producing well and the company is making sufficient progress assessing the reserves and the economic and operating viability of the project. All other exploratory wells and costs are expensed. There were no capitalized costs for exploratory activities during 2019.
The Company continues to capitalize exploratory well costs after the completion of drilling when (a) the well has found a sufficient quantity of reserves to justify completion as a producing well, and (b) sufficient progress has been made in assessing the reserves and the economic and operating viability of the project. If either condition is not met or if the Company obtains information that raises substantial doubt about the economic or operational viability of the project, the exploratory well would be assumed to be impaired, and its costs, net of any salvage value, would be charged to expense.
Asset retirement obligations
Asset retirement obligations relate to future costs associated with the plugging and abandonment of oil and gas wells, the removal of equipment and facilities from leased acreage, and the return of such land to its original condition. The Company determines its asset retirement obligation amounts by calculating the present value of the estimated future cash outflows associated with its plug and abandonment obligations. The fair value of a liability for an asset retirement obligation is recorded in the period in which it is incurred, and the cost of such liability increases the carrying amount of the related long-lived asset by the same amount. The liability is accreted each period through charges to depreciation, depletion and amortization expense, and the capitalized cost is depleted on a unit-of-production basis over the proved developed reserves of the related asset. If an asset retirement obligation is settled for an amount other than the recorded amount, a gain or loss is recognized.
29
| Note 1. | Summary of Significant Accounting Policies (continued) |
Goodwill and Other Intangible Assets
Goodwill and indefinite life intangible assets are not amortized, but are tested for potential impairment on an annual basis, or more often if events or circumstances change that could cause goodwill or indefinite life intangible assets to become impaired. Other purchased intangible assets are amortized over their estimated useful lives, generally on a straight-line basis. We perform reviews for impairment of intangible assets whenever events or changes in circumstances indicate that the carrying value of an asset may not be recoverable. An impairment loss is recognized when estimated future cash flows expected to result from the use of the asset and its eventual disposition are less than its carrying value. When an impairment is identified, we reduce the carrying value of the asset to its estimated fair value. No impairments were recorded on goodwill or intangible assets during 2019, 2018 or 2017. Refer to Note 7 for information regarding our goodwill and other intangible assets.
Dual Class Common Stock
Beginning in 2018, the Company has two classes of common stock, designated Class A common stock and Class B common stock. Each Class A common share is entitled to one vote. Class B common stock possesses economic rights equal to one-fifth (1/5th) of such rights of Class A common stock; however, Class B common stock has no voting rights.
The following table presents shares authorized, issued and outstanding.
| December 31, 2019 | December 31, 2018 | |||||||||||||||||||
| Class A | Class B | Class A | Class B | December 31, 2017 | ||||||||||||||||
| Common stock authorized | 500,000 | 10,000,000 | 500,000 | 10,000,000 | 2,500,000 | |||||||||||||||
| Common stock issued | 206,864 | 2,068,640 | 206,864 | 2,068,640 | 2,142,202 | |||||||||||||||
| Treasury stock held by the Company | — | — | — | — | (74,589 | ) | ||||||||||||||
| Outstanding shares | 206,864 | 2,068,640 | 206,864 | 2,068,640 | 2,067,613 | |||||||||||||||
On an equivalent Class A common stock basis, there were 620,592 shares outstanding as of December 31, 2019 and 2018, and 620,284 shares outstanding as of December 31, 2017.
Earnings Per Share
Earnings per share of common stock is based on the weighted average number of shares outstanding during the year. The shares of Company stock attributable to our limited partner interest in the investment partnerships — based on our proportional ownership during this period — are considered treasury stock on the consolidated balance sheet and thereby deemed not to be included in the calculation of weighted average common shares outstanding. However, these shares are legally outstanding.
The Company has applied the “two-class method” of computing earnings per share as prescribed in Accounting Standards Codification (“ASC”) 260, “Earnings Per Share.” The equivalent Class A common stock applied for computing earnings per share excludes the proportional shares of Biglari Holdings’ stock held by the investment partnerships. The equivalent Class A common stock for the earnings per share calculation was 344,736, 348,108 and 368,150 for 2019, 2018 and 2017, respectively. There are no dilutive securities outstanding.
Revenue Recognition
In May 2014, the Financial Accounting Standards Board (“FASB”) issued Accounting Standards Update (“ASU”) 2014-09, Revenue from Contracts with Customers (Topic 606). On January 1, 2018, we adopted Accounting Standards Codification Topic 606 (“ASC 606”). In accordance with ASC 606, we changed certain characteristics of our revenue recognition accounting policy as described below. ASC 606 was applied using the modified retrospective method, where the cumulative effect of the initial application is recognized as an adjustment to opening retained earnings at January 1, 2018. Comparative prior periods have not been adjusted.
30
| Note 1. | Summary of Significant Accounting Policies (continued) |
The impact of ASC 606 on the Company’s balance sheet as of December 31, 2018 was not material. The cumulative change in retained earnings as of January 1, 2018 was $90. Upon adoption of ASC 606, the Company changed its restaurant operations accounting policies for the recognition of franchise fees, recording of advertising arrangements, and recognition of gift card revenue. The adoption of ASC 606 did not have any significant impact on our insurance or media/licensing businesses.
Restaurant operations
Restaurant operations revenues were disaggregated as follows.
| 2019 | 2018 | 2017 | ||||||||||
| Net sales | $ | 578,164 | $ | 740,922 | $ | 781,856 | ||||||
| Franchise royalties and fees | 27,189 | 30,998 | 20,773 | |||||||||
| Other | 4,867 | 3,770 | 4,524 | |||||||||
| $ | 610,220 | $ | 775,690 | $ | 807,153 | |||||||
Net sales are composed of retail sales of food through company-operated stores. Company-operated store revenues are recognized, net of discounts and sales taxes, when our obligation to perform is satisfied at the point of sale. Sales taxes related to these sales are collected from customers and remitted to the appropriate taxing authority and are not reflected in the Company’s consolidated statements of earnings as revenue.
Franchise royalties and fees are composed of royalties and fees from Steak n Shake and Western Sizzlin franchisees. Royalties are based upon a percentage of sales of the franchise restaurant and are recognized as earned. Franchise royalties are billed on a monthly basis. Initial franchise fees when a new restaurant opens or at the start of a new franchise term are recorded as deferred revenue when received and recognized as revenue over the term of the franchise agreement.
During the years ended December 31, 2019 and 2018, restaurant operations recognized $1,725 and $3,096, respectively, in revenue related to initial franchise fees. As of December 31, 2019 and 2018, restaurant operations had deferred revenue recorded in accrued expenses related to franchise fees of $7,976 and $9,075, respectively. Restaurant operations expects to recognize approximately $928 in 2020 and the balance in the years 2021 through 2040.
Our advertising arrangements with franchisees are reported in franchise royalties and fees. During the years ended December 31, 2019 and 2018, restaurant operations recognized $7,815 and $9,675, respectively, in revenue related to franchisee advertising fees. As of December 31, 2019 and 2018, restaurant operations had deferred revenue recorded in accrued expenses related to franchisee advertising fees of $3,043 and $2,255, respectively. Restaurant operations expects to recognize approximately $1,522 of deferred revenue during 2020 and the balance in 2021.
Restaurant operations sells gift cards to customers which can be redeemed for retail food sales within our stores. Gift cards are recorded as deferred revenue when issued and are subsequently recorded as net sales upon redemption. Restaurant operations estimates breakage related to gift cards when the likelihood of redemption is remote. This estimate utilizes historical trends based on the vintage of the gift card. Breakage on gift cards is recorded as other revenue in proportion to the rate of gift card redemptions by vintage.
For the years ended December 31, 2019 and 2018, restaurant operations recognized $22,869 and $27,081, respectively, of revenue from gift card redemptions. As of December 31, 2019 and 2018, restaurant operations had deferred revenue recorded in accrued expenses related to unredeemed gift cards of $20,730 and $22,685, respectively. The Company expects to recognize approximately $15,931 in 2020 and the balance in the years 2021 through 2023.
Insurance premiums and commissions
Insurance premiums are earned over the terms of the related policies. Expenses incurred in connection with acquiring new insurance business, including acquisition costs, are charged to operations as incurred. Premiums earned are stated net of amounts ceded to reinsurer.
Oil and gas
Revenues are derived from the sale of produced oil and natural gas. Revenue is recognized when the performance obligation is satisfied, which typically occurs at the point in time when control of the product transfers to the customer. Payment is due within 30 days of delivery.
31
| Note 1. | Summary of Significant Accounting Policies (continued) |
Media advertising and other
Magazine subscription and advertising revenues are recognized at the magazine cover date. The unearned portion of magazine subscriptions is deferred until the magazine’s cover date, at which time a proportionate share of the gross subscription price is recognized as revenues, net of any commissions paid to subscription agents. Also included in subscription revenues are revenues generated from single-copy sales of magazines through retail outlets such as newsstands, supermarkets, convenience stores and drugstores and on certain digital devices, which may or may not result in future subscription sales. Revenues from retail outlet sales are recognized based on gross sales less a provision for estimated returns. License revenue is recognized when earned. We derive value and revenues from intellectual property assets through a range of licensing and business activities, including licensing and syndication of our trademarks and copyrights in the United States and internationally.
Restaurant Cost of Sales
Cost of sales includes the cost of food, restaurant operating costs and restaurant rent expense. Cost of sales excludes depreciation and amortization, which is presented as a separate line item on the consolidated statement of earnings.
Insurance Losses and Underwriting Expenses
Liabilities for estimated unpaid losses and loss adjustment expenses with respect to claims occurring on or before the balance sheet date are established under insurance contracts issued by our insurance subsidiaries. Such estimates include provisions for reported claims or case estimates, provisions for incurred but not reported claims and legal and administrative costs to settle claims. The estimates of unpaid losses and amounts recoverable under reinsurance are established and continually reviewed by using a variety of actuarial, statistical and analytical techniques. Reinsurance contracts do not relieve the ceding company of its obligations to indemnify policyholders with respect to the underlying insurance contracts. Liabilities for insurance losses of $3,211 and $1,891 are included in accrued expenses in the consolidated balance sheet as of December 31, 2019 and 2018, respectively.
Oil and Gas Production Costs
Oil and gas production costs are composed of lease operating expenses and production taxes.
Marketing Expense
Advertising costs are charged to expense at the later of the date the expenditure is incurred or the date the promotional item is first communicated. Marketing expense is included in selling, general and administrative expenses in the consolidated statement of earnings.
Insurance Reserves
We self-insure a significant portion of expected losses under our workers’ compensation, general liability, auto, directors and officers liability, and medical liability insurance programs, and record a reserve for our estimated losses on all unresolved open claims and our estimated incurred but not reported claims at the anticipated cost to us. Insurance reserves are recorded in accrued expenses in the consolidated balance sheet.
Savings Plans
Several of our subsidiaries also sponsor deferred compensation and defined contribution retirement plans, such as 401(k) or profit sharing plans. Employee contributions to the plans are subject to regulatory limitations and the specific plan provisions. Some of the plans allow for discretionary contributions as determined by management. Employer contributions expensed with respect to these plans were not material.
Foreign Currency Translation
The Company has certain subsidiaries located in foreign jurisdictions. For subsidiaries whose functional currency is other than the U.S. dollar, the translation of functional currency statements to U.S. dollar statements uses end-of-period exchange rates for assets and liabilities, weighted average exchange rates for revenue and expenses, and historical rates for equity. The resulting currency translation adjustment is recorded in accumulated other comprehensive income, as a component of equity.
Use of Estimates
Preparation of the consolidated financial statements in accordance with GAAP requires management to make estimates and assumptions that affect the amounts reported in the consolidated financial statements and accompanying notes. Actual results could differ from the estimates.
New Accounting Standards
In June 2016, the FASB issued ASU 2016-13, Financial Instruments—Credit Losses: Measurement of Credit Losses on Financial Instruments. ASU 2016-13 amends guidance on reporting credit losses for assets held at amortized cost basis and available for sale debt securities. For available for sale debt securities, credit losses should be measured in a manner similar to current GAAP; however, ASU 2016-13 will require that credit losses be presented as an allowance rather than as a write-down. The amendments in this update are effective for financial statements issued for fiscal years beginning after December 15, 2019, and interim periods within those fiscal years. The Company is currently evaluating the impact the adoption of ASU 2016-13 will have on its consolidated financial statements and related disclosures.
32
| Note 1. | Summary of Significant Accounting Policies (continued) |
In February 2016, the FASB issued ASU 2016-02, Leases. In July 2018, the FASB issued ASU 2018-11, Leases (Topic 842). We adopted ASC 842 “Leases” on January 1, 2019. Most significantly, ASC 842 requires a lessee to recognize a liability to make lease payments and an asset with respect to its right to use the underlying asset for the lease term. We applied ASC 840 to all comparative periods which included a cumulative-effect adjustment of $1,499 to retained earnings on January 1, 2019. Adoption of ASC 842 also resulted in an increase to total assets and liabilities due to the recording of operating lease assets of $63,261 and operating lease liabilities of $69,671 as of January 1, 2019 and due to the recording of finance lease assets of $11,638 and finance lease liabilities of $11,784. The difference between the asset and liability amounts primarily relates to previously recorded deferred/prepaid rent. The standard had a material impact on our consolidated balance sheets but did not have a material impact on our consolidated statements of earnings and statements of cash flow. The most significant impact was the recognition of right-of-use assets and lease liabilities for operating leases.
In adopting and applying ASC 842, we elected the package of practical expedients permitted under the transition guidance within the new standard which, among other things, allows us to carry forward the historical lease classification. In addition, we elected certain practical expedients and accounting policies, including an accounting policy election to keep leases with an initial term of 12 months or less from the balance sheet. We recognize those lease payments in the consolidated statements of earnings on a straight-line basis over the lease term.
| Note 2. | Investments |
Investments were $44,856 and $33,860 as of December 31, 2019 and 2018, respectively. Investments in equity securities and a related derivative position of $4,463 are included in other current assets as of December 31, 2018. The investments are recorded at fair value.
| Note 3. | Investment Partnerships |
The Company reports on the limited partnership interests in investment partnerships under the equity method of accounting. We record our proportional share of equity in the investment partnerships but exclude Company common stock held by said partnerships. The Company’s pro-rata share of its common stock held by the investment partnerships is recorded as treasury stock even though they are legally outstanding. The Company records gains/losses from investment partnerships (inclusive of the investment partnerships’ unrealized gains and losses on their securities) in the consolidated statements of earnings based on our carrying value of these partnerships. The fair value is calculated net of the general partner’s accrued incentive fees. Gains and losses on Company common stock included in the earnings of these partnerships are eliminated because they are recorded as treasury stock.
Biglari Capital is the general partner of the investment partnerships and is an entity solely owned by Mr. Biglari.
33
| Note 3. | Investment Partnerships (continued) |
The fair value and adjustment for Company common stock held by the investment partnerships to determine carrying value of our partnership interest is presented below.
| Fair Value | Company Common Stock | Carrying Value | ||||||||||
| Partnership interest at December 31, 2016 | $ | 972,707 | $ | 395,070 | $ | 577,637 | ||||||
| Investment partnership gains (losses) | (41,740 | ) | (48,705 | ) | 6,965 | |||||||
| Distributions (net of contributions of $3,707) | (5,688 | ) | (5,688 | ) | ||||||||
| Increase in proportionate share of Company stock held | 12,893 | (12,893 | ) | |||||||||
| Partnership interest at December 31, 2017 | $ | 925,279 | $ | 359,258 | $ | 566,021 | ||||||
| Investment partnership gains (losses) | (180,517 | ) | (220,928 | ) | 40,411 | |||||||
| Distributions (net of reinvestments of $39,040) | (29,660 | ) | (29,660 | ) | ||||||||
| Increase in proportionate share of Company stock held | 19,292 | (19,292 | ) | |||||||||
| Partnership interest at December 31, 2018 | $ | 715,102 | $ | 157,622 | $ | 557,480 | ||||||
| Investment partnership gains (losses) | 80,350 | 2,217 | 78,133 | |||||||||
| Distributions (net of reinvestments of $40,000) | (129,329 | ) | (129,329 | ) | ||||||||
| Increase in proportionate share of Company stock held | 742 | (742 | ) | |||||||||
| Partnership interest at December 31, 2019 | $ | 666,123 | $ | 160,581 | $ | 505,542 | ||||||
The carrying value of the investment partnerships net of deferred taxes is presented below.
| December 31, | ||||||||
| 2019 | 2018 | |||||||
| Carrying value of investment partnerships | $ | 505,542 | $ | 557,480 | ||||
| Deferred tax liability related to investment partnerships | (56,518 | ) | (92,703 | ) | ||||
| Carrying value of investment partnerships net of deferred taxes | $ | 449,024 | $ | 464,777 | ||||
The Company’s proportionate share of Company stock held by investment partnerships at cost is $374,857 and $374,231 at December 31, 2019 and 2018, respectively, and is recorded as treasury stock.
The carrying value of the partnership interest approximates fair value adjusted by the value of held Company stock. Fair value is according to our proportional ownership interest of the fair value of investments held by the investment partnerships. The fair value measurement is classified as level 3 within the fair value hierarchy.
Gains/losses from investment partnerships recorded in the Company’s consolidated statements of earnings are presented below.
| 2019 | 2018 | 2017 | ||||||||||
| Gains from investment partnerships | $ | 78,133 | $ | 40,411 | $ | 6,965 | ||||||
| Tax expense (benefit) | 17,360 | 7,171 | (4,115 | ) | ||||||||
| Contribution to net earnings | $ | 60,773 | $ | 33,240 | $ | 11,080 | ||||||
On December 31 of each year, the general partner of the investment partnerships, Biglari Capital, will earn an incentive reallocation fee for the Company’s investments equal to 25% of the net profits above an annual hurdle rate of 6% over the previous high-water mark. Our policy is to accrue an estimated incentive fee throughout the year. The total incentive reallocation from Biglari Holdings to Biglari Capital includes gains on the Company’s common stock. Gains and losses on the Company’s common stock and the related incentive reallocations are eliminated in our financial statements. Our investments in these partnerships are committed on a rolling 5-year basis.
There were no incentive reallocations from Biglari Holdings to Biglari Capital during 2019, 2018 and 2017.
34
| Note 3. | Investment Partnerships (continued) |
Summarized financial information for The Lion Fund, L.P. and The Lion Fund II, L.P. is presented below.
| Equity in Investment Partnerships | ||||||||
| Lion Fund | Lion Fund II | |||||||
| Total assets as of December 31, 2019 | $ | 117,135 | $ | 758,663 | ||||
| Total liabilities as of December 31, 2019 | $ | 158 | $ | 114,639 | ||||
| Revenue for the year ended December 31, 2019 | $ | 10,637 | $ | 85,831 | ||||
| Earnings for the year ended December 31, 2019 | $ | 10,567 | $ | 78,604 | ||||
| Biglari Holdings’ ownership interest | 66.1 | % | 92.9 | % | ||||
| Total assets as of December 31, 2018 | $ | 107,207 | $ | 901,750 | ||||
| Total liabilities as of December 31, 2018 | $ | 447 | $ | 202,770 | ||||
| Revenue for the year ended December 31, 2018 | $ | (92,093 | ) | $ | (120,431 | ) | ||
| Earnings for the year ended December 31, 2018 | $ | (92,159 | ) | $ | (130,193 | ) | ||
| Biglari Holdings’ ownership interest | 65.9 | % | 92.2 | % | ||||
| Total assets as of December 31, 2017 | $ | 203,560 | $ | 1,060,737 | ||||
| Total liabilities as of December 31, 2017 | $ | 157 | $ | 199,974 | ||||
| Revenue for the year ended December 31, 2017 | $ | (13,322 | ) | $ | (25,283 | ) | ||
| Earnings for the year ended December 31, 2017 | $ | (13,383 | ) | $ | (35,740 | ) | ||
| Biglari Holdings’ ownership interest | 64.3 | % | 92.3 | % | ||||
Revenue in the above summarized financial information of the investment partnerships includes investment income and unrealized gains and losses on investments.
| Note 4. | Other Current Assets |
Other current assets include the following.
| December 31, | ||||||||
| 2019 | 2018 | |||||||
| Deferred commissions on gift cards sold by third parties | $ | 3,379 | $ | 3,218 | ||||
| Prepaid contractual obligations | 3,070 | 1,555 | ||||||
| Investment in equity security and related derivative position | — | 4,463 | ||||||
| Other current assets | $ | 6,449 | $ | 9,236 | ||||
| Note 5. | Property and Equipment |
Property and equipment is composed of the following.
| December 31, | ||||||||
| 2019 | 2018 | |||||||
| Land | $ | 150,147 | $ | 146,015 | ||||
| Buildings | 144,243 | 142,658 | ||||||
| Land and leasehold improvements | 157,141 | 158,938 | ||||||
| Equipment | 196,264 | 201,738 | ||||||
| Oil and gas properties | 77,475 | — | ||||||
| Construction in progress | 3,789 | 1,703 | ||||||
| 729,059 | 651,052 | |||||||
| Less accumulated depreciation and amortization | (378,432 | ) | (376,336 | ) | ||||
| Property and equipment, net | $ | 350,627 | $ | 274,716 | ||||
Depreciation and amortization expense for property and equipment for 2019, 2018 and 2017 was $18,881, $18,646 and $20,706, respectively. Depletion expense related to oil and gas properties was $8,077 during 2019 and is included in depreciation and amortization within the consolidated statement of earnings.
The Company recorded an impairment to restaurant long-lived assets of $8,186, $5,677 and $1,789 during 2019, 2018 and 2017, respectively. The fair value of the long-lived assets was determined based on Level 3 inputs using a discounted cash flow model and quoted prices for the properties. The fair value of the assets impaired was not material for any of the applicable periods.
The property and equipment cost related to finance obligations as of December 31, 2019 is as follows: $59,104 of buildings, $49,891 of land, $26,924 of land and leasehold improvements, and $52,240 of accumulated depreciation.
35
| Note 6. | Asset Retirement Obligations |
A reconciliation of the ending aggregate carrying amount of asset retirement obligations is as follows.
| December 31, | ||||
| 2019 | ||||
| Acquired balance | $ | 10,542 | ||
| Liabilities settled | (88 | ) | ||
| Accretion expense | 177 | |||
| Asset retirement obligation | $ | 10,631 | ||
As of December 31, 2019, $184 is classified as current and is included in accounts payable and accrued expenses in the consolidated balance sheets.
| Note 7. | Goodwill and Other Intangible Assets |
Goodwill
Goodwill consists of the excess of the purchase price over the fair value of the net assets acquired in connection with business acquisitions. No goodwill was recorded with the acquisition of Southern Oil.
A reconciliation of the change in the carrying value of goodwill is as follows.
| Restaurants | Other | Total | ||||||||||
| Goodwill at December 31, 2016 | $ | 28,090 | $ | 11,913 | $ | 40,003 | ||||||
| Change in foreign exchange rates during 2017 | 78 | — | 78 | |||||||||
| Goodwill at December 31, 2017 | $ | 28,168 | $ | 11,913 | $ | 40,081 | ||||||
| Change in foreign exchange rates during 2018 | (29 | ) | — | (29 | ) | |||||||
| Goodwill at December 31, 2018 | $ | 28,139 | $ | 11,913 | $ | 40,052 | ||||||
| Change in foreign exchange rates during 2019 | (12 | ) | — | (12 | ) | |||||||
| Goodwill at December 31, 2019 | $ | 28,127 | $ | 11,913 | $ | 40,040 | ||||||
We evaluate goodwill and any indefinite-lived intangible assets for impairment annually, or more frequently if circumstances indicate impairment may have occurred. Goodwill impairment occurs when the estimated fair value of goodwill is less than its carrying value. The valuation methodology and underlying financial information included in our determination of fair value require significant management judgments. We use both market and income approaches to derive fair value. The judgments in these two approaches include, but are not limited to, comparable market multiples, long-term projections of future financial performance, and the selection of appropriate discount rates used to determine the present value of future cash flows. Changes in such estimates or the application of alternative assumptions could produce significantly different results. No impairment charges for goodwill were recorded in 2019, 2018 or 2017.
36
| Note 7. | Goodwill and Other Intangible Assets (continued) |
Other Intangible Assets
Other intangible assets are composed of the following.
| December 31, | ||||||||||||||||||||||||
| 2019 | 2018 | |||||||||||||||||||||||
| Gross carrying amount | Accumulated amortization | Total | Gross carrying amount | Accumulated amortization | Total | |||||||||||||||||||
| Franchise agreement | $ | 5,310 | $ | (5,178 | ) | $ | 132 | $ | 5,310 | $ | (4,647 | ) | $ | 663 | ||||||||||
| Other | 810 | (792 | ) | 18 | 810 | (774 | ) | 36 | ||||||||||||||||
| Total | 6,120 | (5,970 | ) | 150 | 6,120 | (5,421 | ) | 699 | ||||||||||||||||
| Intangible assets with indefinite lives: | ||||||||||||||||||||||||
| Trade names | 15,876 | — | 15,876 | 15,876 | — | 15,876 | ||||||||||||||||||
| Other assets with indefinite lives | 11,323 | — | 11,323 | 11,539 | — | 11,539 | ||||||||||||||||||
| Total intangible assets | $ | 33,319 | $ | (5,970 | ) | $ | 27,349 | $ | 33,535 | $ | (5,421 | ) | $ | 28,114 | ||||||||||
Intangible assets subject to amortization consist of franchise agreements connected with the purchase of Western Sizzlin as well as rights to favorable leases related to prior acquisitions. These intangible assets are being amortized over their estimated weighted average of useful lives ranging from eight to twelve years.
Amortization expense for 2019, 2018 and 2017 was $549, $562 and $567, respectively. The Company’s intangible assets with definite lives will fully amortize in 2020.
During 2018, the Company purchased lease rights totaling $2,503.
| Note 8. | Accounts Payable and Accrued Expenses |
Accounts payable and accrued expenses include the following.
| December 31, | ||||||||
| 2019 | 2018 | |||||||
| Accounts payable | $ | 32,626 | $ | 41,967 | ||||
| Gift card liability | 20,745 | 22,685 | ||||||
| Salaries, wages, and vacation | 10,667 | 13,107 | ||||||
| Deferred revenue | 10,454 | 11,681 | ||||||
| Taxes payable | 29,275 | 11,214 | ||||||
| Self-insurance accruals | 11,070 | 8,394 | ||||||
| Other | 6,242 | 8,217 | ||||||
| Accounts payable and accrued expenses | $ | 121,079 | $ | 117,265 | ||||
| Note 9. | Other Liabilities |
Other liabilities include the following.
| December 31, | ||||||||
| 2019 | 2018 | |||||||
| Non qualified deferred compensation | $ | 1,716 | $ | 1,801 | ||||
| Other | 348 | 912 | ||||||
| Deferred rent expense | — | 6,468 | ||||||
| Other liabilities | $ | 2,064 | $ | 9,181 | ||||
37
| Note 10. | Income Taxes |
The components of the provision for income taxes consist of the following.
| 2019 | 2018 | 2017 | ||||||||||
| Current: | ||||||||||||
| Federal | $ | 41,005 | $ | (1,688 | ) | $ | 544 | |||||
| State | 7,301 | 1,204 | 816 | |||||||||
| Deferred | (38,545 | ) | (2,153 | ) | (64,321 | ) | ||||||
| Inome tax expense (benefit) | $ | 9,761 | $ | (2,637 | ) | $ | (62,961 | ) | ||||
| Reconciliation of effective income tax: | ||||||||||||
| Tax at U.S. statutory rates | $ | 11,579 | $ | 3,519 | $ | (4,512 | ) | |||||
| State income taxes, net of federal benefit | 1,573 | 741 | 259 | |||||||||
| Tax rate changes | — | (1,342 | ) | (51,707 | ) | |||||||
| Federal income tax credits | (3,004 | ) | (4,587 | ) | (3,158 | ) | ||||||
| Dividends received deduction | (955 | ) | (2,142 | ) | (6,304 | ) | ||||||
| Valuation allowance | 441 | 658 | 742 | |||||||||
| Foreign tax rate differences | 116 | 349 | 1,598 | |||||||||
| Other | 11 | 167 | 121 | |||||||||
| Inome tax expense (benefit) | $ | 9,761 | $ | (2,637 | ) | $ | (62,961 | ) | ||||
On December 22, 2017, new federal income tax legislation, the Tax Cuts and Jobs Act (“Act”), was signed into law. Effective January 1, 2018, the U.S. corporate federal statutory income tax rate was reduced from 35.0% to 21.0% and required re-measurement of deferred balances to the new statutory rates as of December 31, 2017.
The Act also imposed a mandatory one-time transition tax on undistributed international earnings. We do not expect to have any additional tax liability related to a transition tax. The Company did not have a net tax expense or benefit on income from international operations. Earnings (losses) before income taxes derived from domestic operations during 2019, 2018 and 2017 were $57,877, $21,700 and $(6,230), respectively. Losses before income taxes derived from international operations during 2019, 2018 and 2017 were $2,736, $4,945, and $6,660, respectively.
As of December 31, 2019, we had $348 of unrecognized tax benefits, including $62 of interest and penalties, which are included in other long-term liabilities in the consolidated balance sheet. As of December 31, 2018, we had $341 of unrecognized tax benefits, including $43 of interest and penalties, which are included in other long-term liabilities in the consolidated balance sheet. Our continuing practice is to recognize interest expense and penalties related to income tax matters in income tax expense. The unrecognized tax benefits of $348 would impact the effective income tax rate if recognized. Adjustments to the Company’s unrecognized tax benefit for gross increases for the current period tax position, gross decreases for prior period tax positions and the lapse of statute of limitations during 2019, 2018 and 2017 were not significant.
We file income tax returns which are periodically audited by various foreign, federal, state, and local jurisdictions. With few exceptions, we are no longer subject to federal, state, and local tax examinations for fiscal years prior to 2016. We believe we have certain state income tax exposures related to fiscal years 2015 through 2019. Because of the expiration of the various state statutes of limitations for these fiscal years, it is possible that the total amount of unrecognized tax benefits will decrease by approximately $157 within 12 months.
Deferred tax assets and liabilities are determined based on differences between financial reporting and tax basis of assets and liabilities and are measured using the currently enacted tax rates and laws that will be in effect when the differences are expected to reverse.
38
| Note 10. | Income Taxes (continued) |
Our deferred tax assets and liabilities consist of the following.
| December 31, | ||||||||
| 2019 | 2018 | |||||||
| Deferred tax assets: | ||||||||
| Insurance reserves | $ | 1,304 | $ | 1,816 | ||||
| Compensation accruals | 438 | 677 | ||||||
| Gift card accruals | 3,280 | 2,515 | ||||||
| Net operating loss credit carryforward | 6,017 | 5,547 | ||||||
| Valuation allowance on net operating losses | (5,419 | ) | (4,978 | ) | ||||
| Fixed assets and depletable assets basis difference | 4,776 | — | ||||||
| Income tax credit carryforward | 6,300 | 4,965 | ||||||
| Other | (36 | ) | 953 | |||||
| Total deferred tax assets | 16,660 | 11,495 | ||||||
| Deferred tax liabilities: | ||||||||
| Investments | 56,519 | 92,743 | ||||||
| Fixed asset basis difference | — | 934 | ||||||
| Goodwill and intangibles | 14,371 | 4,689 | ||||||
| Total deferred tax liabilities | 70,890 | 98,366 | ||||||
| Net deferred tax liability | $ | (54,230 | ) | $ | (86,871 | ) | ||
Accrued expenses on the balance sheet include income taxes payable of $17,767 as of December 31, 2019. Receivables on the balance sheet include income taxes receivable of $2,022 as of December 31, 2018. Income taxes paid during 2019, 2018 and 2017 were $30,375, $810 and $3,211, respectively. Income tax refunds during 2019, 2018 and 2017 were $1,546, $8 and $0, respectively.
| Note 11. | Notes Payable and Other Borrowings |
Notes payable and other borrowings include the following.
| December 31, | ||||||||
| 2019 | 2018 | |||||||
| Current portion of notes payable and other borrowings | ||||||||
| Notes payable | $ | 2,200 | $ | 2,200 | ||||
| Unamortized original issue discount | (348 | ) | (334 | ) | ||||
| Unamortized debt issuance costs | (634 | ) | (609 | ) | ||||
| Finance obligations | 4,252 | 4,463 | ||||||
| Finance lease liabilities | 1,633 | — | ||||||
| Total current portion of notes payable and other borrowings | $ | 7,103 | $ | 5,720 | ||||
| Long-term notes payable and other borrowings | ||||||||
| Notes payable | $ | 179,298 | $ | 181,498 | ||||
| Unamortized original issue discount | (89 | ) | (438 | ) | ||||
| Unamortized debt issuance costs | (163 | ) | (796 | ) | ||||
| Finance obligations | 74,497 | 59,737 | ||||||
| Finance lease liabilities | 9,639 | — | ||||||
| Total long-term notes payable and other borrowings | $ | 263,182 | $ | 240,001 | ||||
39
| Note 11. | Notes Payable and Other Borrowings (continued) |
Steak n Shake Credit Facility
On March 19, 2014, Steak n Shake and its subsidiaries entered into a credit agreement which provided for a senior secured term loan facility in an aggregate principal amount of $220,000. The term loan is scheduled to mature on March 19, 2021. As of December 31, 2019, $181,498 was outstanding. The Company is evaluating refinancing options. Alternative financing may not be available on terms commensurate with its current financing arrangement. Biglari Holdings is not a guarantor under the credit facility.
The term loan amortizes in equal quarterly installments at an annual rate of 1.0% of the original principal amount of the term loan, subject to mandatory prepayments from excess cash flow, asset sales and other events described in the credit agreement. The balance will be due at maturity.
Borrowings bear interest at a rate per annum equal to a base rate or a Eurodollar rate (minimum of 1%) plus an applicable margin. Interest on the term loan is based on a Eurodollar rate plus an applicable margin of 3.75% or on the prime rate plus an applicable margin of 2.75%. The interest rate on the term loan was 5.55% as of December 31, 2019.
The credit agreement includes customary affirmative and negative covenants and events of default. Steak n Shake’s credit facility contains restrictions on its ability to pay dividends to Biglari Holdings.
The term loan is secured by first priority security interests in substantially all the assets of Steak n Shake. Disruptions in debt capital markets that restrict access to funding when needed could adversely affect the results of operations, liquidity and capital resources of Steak n Shake.
Expected principal payments for notes payable as of December 31, 2019, are as follows.
| 2020 | 2,200 | |||
| 2021 | 179,298 | |||
| Total | $ | 181,498 |
The fair value of long-term debt, excluding capitalized lease obligations, was approximately $145,000 at December 31, 2019. The fair value of our debt was estimated based on quoted market prices. The fair value was determined to be a Level 3 fair value measurement.
Western Sizzlin Revolver
As of December 31, 2019 and 2018, Western Sizzlin had no debt outstanding under its revolver.
Interest
Interest paid on debt and obligations under leases are as follows.
| 2019 | 2018 | 2017 | ||||||||||
| Interest paid on debt | $ | 11,273 | $ | 10,655 | $ | 9,969 | ||||||
| Interest paid on obligations under leases | $ | 7,816 | $ | 8,207 | $ | 9,132 | ||||||
| Note 12. | Leased Assets and Lease Commitments |
The Company adopted ASC 842 on January 1, 2019, as discussed in Note 1. Under ASC 842, leases are generally classified as either operating right-of-use assets or finance lease assets. Right-of-use assets represent the Company's right to use an underlying asset during the lease term. Right-of-use liabilities represent the Company's obligation to make lease payments arising from the lease. These assets and liabilities are calculated by using the net present value of fixed lease payments over the lease term. The Company's lease terms include options to extend or terminate the lease when it is reasonably certain that the option will be exercised. The Company applied an incremental borrowing rate to determine the present value of lease payments. Finance lease agreements include an interest rate that is used to determine the present value of future lease payments.
40
| Note 12. | Leased Assets and Lease Commitments (continued) |
A significant portion of our operating and finance lease portfolio includes restaurant locations. The Company’s operating leases with a term of 12 months or greater were recognized as operating right-of-use assets and liabilities and recorded as operating lease assets and operating lease liabilities. Historical capital leases and certain historical build-to-suit leases were reclassified from obligations under leases to finance lease assets and liabilities. Finance lease assets are recorded in property and equipment and finance lease liabilities are recorded in notes payable and other borrowings. Historical sale-and-leaseback transactions in which the Company is deemed to have a continued interest in the leased asset are recorded as property and equipment and as finance obligations. Finance obligations are recorded in notes payable and other borrowings.
Operating lease expense and finance lease depreciation expense are recognized on a straight-line basis over the lease term.
Total lease cost consists of the following.
| 2019 | ||||
| Finance lease costs: | ||||
| Amortization of right-of-use assets | $ | 1,952 | ||
| Interest on lease liabilities | 828 | |||
| Operating lease costs * | 16,483 | |||
| Total lease costs | $ | 19,263 | ||
*Includes short-term leases, variable lease costs and sublease income, which are immaterial.
Supplemental cash flow information related to leases is as follows.
| Year Ended December 31, 2019 | ||||
| Cash paid for amounts included in the measurement of lease liabilities: | ||||
| Financing cash flows from finance leases | $ | 1,610 | ||
| Operating cash flows from finance leases | $ | 828 | ||
| Operating cash flows from operating leases | $ | 16,863 | ||
| Right-of-use assets obtained in exchange for lease obligations: | ||||
| Finance lease liabilities | $ | 1,097 | ||
| Operating lease liabilities | $ | 11,069 | ||
Supplemental balance sheet information related to leases is as follows.
| December 31, 2019 | ||||
| Finance leases: | ||||
| Property and equipment, net | $ | 10,783 | ||
| Current portion of notes payable and other borrowings | $ | 1,633 | ||
| Long-term notes payable and other borrowings | 9,639 | |||
| Total finance lease liablities | $ | 11,272 | ||
Weighted-average lease terms and discount rates are as follows.
| 2019 | ||||
| Weighted-average remaining lease terms: | ||||
| Finance leases | 8.4 years | |||
| Operating leases | 6.4 years | |||
| Weighted-average discount rates: | ||||
| Finance leases | 7.1% | |||
| Operating leases | 6.9% | |||
41
| Note 12. | Leased Assets and Lease Commitments (continued) |
Maturities of lease liabilities as of December 31, 2019 are as follows.
| Year | Operating Leases | Finance Leases |
||||||
| 2020 | $ | 15,584 | $ | 2,377 | ||||
| 2021 | 14,759 | 2,358 | ||||||
| 2022 | 12,622 | 1,869 | ||||||
| 2023 | 10,794 | 1,669 | ||||||
| 2024 | 8,680 | 1,633 | ||||||
| After 2024 | 18,576 | 5,170 | ||||||
| Total lease payments | 81,015 | 15,076 | ||||||
| Less interest | 16,109 | 3,804 | ||||||
| Total lease liabilities | $ | 64,906 | $ | 11,272 | ||||
On December 31, 2018, obligations under non-cancelable finance obligations, capital leases, and operating leases (excluding real estate taxes, insurance and maintenance costs) require the following minimum future rental payments.
| Operating Leases | ||||||||||||||||||||
| Year | Finance Obligations | Capital Leases | Total | Operating Property | Non-Operating Property | |||||||||||||||
| 2019 | $ | 11,114 | $ | 55 | $ | 11,169 | $ | 17,914 | $ | 483 | ||||||||||
| 2020 | 8,040 | 55 | 8,095 | 16,691 | 554 | |||||||||||||||
| 2021 | 5,925 | 55 | 5,980 | 16,787 | 578 | |||||||||||||||
| 2022 | 2,951 | 5 | 2,956 | 15,603 | 599 | |||||||||||||||
| 2023 | 1,587 | — | 1,587 | 14,071 | 539 | |||||||||||||||
| After 2023 | 1,673 | — | 1,673 | 36,709 | 1,790 | |||||||||||||||
| Total minimum future rental payments | 31,290 | 170 | 31,460 | $ | 117,775 | $ | 4,543 | |||||||||||||
| Less amount representing interest | 18,004 | 60 | 18,064 | |||||||||||||||||
| Total principal obligations under leases | 13,286 | 110 | 13,396 | |||||||||||||||||
| Less current portion | 4,433 | 30 | 4,463 | |||||||||||||||||
| Non-current principal obligations under leases | 8,853 | 80 | 8,933 | |||||||||||||||||
| Residual value at end of lease term | 50,744 | 60 | 50,804 | |||||||||||||||||
| Obligations under leases | $ | 59,597 | $ | 140 | $ | 59,737 | ||||||||||||||
Rent expense is presented below.
| 2019 | 2018 | 2017 | ||||||||||
| Minimum rent | $ | 17,968 | $ | 20,158 | $ | 18,157 | ||||||
| Contingent rent | 1,050 | 1,470 | 1,839 | |||||||||
| Rent expense | $ | 19,018 | $ | 21,628 | $ | 19,996 | ||||||
| Note 13. | Related Party Transactions |
Services Agreement
During 2017, the Company entered into a services agreement with Biglari Enterprises LLC and Biglari Capital Corp. (collectively, the “Biglari Entities”) under which the Biglari Entities provide business and administrative related services to the Company. The Biglari Entities are owned by Mr. Biglari. The services agreement has a five-year term, effective on October 1, 2017. The fixed fee is $700 per month for the first year with adjustments in years two through five. The monthly fee remained at $700 during 2019. The Company paid Biglari Enterprises $8,400 in service fees during 2019 and 2018. The services agreement does not alter the hurdle rate connected with the incentive reallocation paid to Biglari Capital Corp. by the Company.
Investments in The Lion Fund, L.P. and
The Lion Fund II, L.P.
As of December 31, 2019, the Company’s investments in The Lion Fund, L.P. and The Lion Fund II, L.P. had a fair value
of $666,123.
42
| Note 13. | Related Party Transactions (continued) |
Contributions to and distributions from The Lion Fund, L.P. and The Lion Fund II, L.P. were as follows.
| 2019 | 2018 | 2017 | ||||||||||
| Contributions of cash | $ | 40,000 | $ | 39,040 | $ | 3,707 | ||||||
| Distributions of cash | (169,329 | ) | (68,700 | ) | (9,395 | ) | ||||||
| $ | (129,329 | ) | $ | (29,660 | ) | $ | (5,688 | ) | ||||
As the general partner of the investment partnerships, Biglari Capital on December 31 of each year will earn an incentive reallocation fee for the Company’s investments equal to 25% of the net profits above a hurdle rate of 6% over the previous high-water mark. Our policy is to accrue an estimated incentive fee throughout the year. In 2019, 2018 and 2017, no incentive reallocation was earned.
License Agreement
During 2013, the Company entered into a Trademark License Agreement (the “License Agreement”) with Mr. Biglari. The Company and its subsidiaries paid no royalties to Mr. Biglari under the License Agreement during its term. The License Agreement was terminated on March 26, 2019.
Incentive Agreement Amendment
The Incentive Agreement was amended on March 26, 2019 to remove the annual limitation on Mr. Biglari’s incentive compensation, as well as the requirement of Mr. Biglari to use 30% of his incentive payments to purchase shares of the Company. In connection with the amendment, the change of control and severance provisions contained in the Incentive Agreement were eliminated and the License Agreement was terminated. The amendment was effective in 2019.
| Note 14. | Commitments and Contingencies |
We are involved in various legal proceedings and have certain unresolved claims pending. We believe, based on examination of these matters and experiences to date, that the ultimate liability, if any, in excess of amounts already provided in our consolidated financial statements is not likely to have a material effect on our results of operations, financial position or cash flow.
On January 29, 2018, a shareholder of the Company filed a purported class action complaint against the Company and the members of our Board of Directors in the Superior Court of Hamilton County, Indiana. The shareholder generally alleges claims of breach of fiduciary duty by the members of our Board of Directors and unjust enrichment to Mr. Biglari as a result of the dual class structure.
On March 26, 2018, a shareholder of the Company filed a purported class action complaint against the Company and the members of our Board of Directors in the Superior Court of Hamilton County, Indiana. This shareholder generally alleges claims of breach of fiduciary duty by the members of our Board of Directors. This shareholder sought to enjoin the shareholder vote on April 26, 2018 to approve the dual class structure. On April 16, 2018, the shareholder withdrew their motion to enjoin the shareholder vote on April 26, 2018.
43
| Note 14. | Commitments and Contingencies (continued) |
On May 17, 2018, the shareholders who filed the January 29, 2018 complaint and the March 26, 2018 complaint filed a new, consolidated complaint against the Company and the members of our Board of Directors in the Superior Court of Hamilton County, Indiana. The shareholders generally allege claims of breach of fiduciary duty by the members of our Board of Directors and unjust enrichment to Mr. Biglari arising out of the dual class structure. The shareholders seek, for themselves and on behalf of all other shareholders as a class, a declaration that the defendants breached their duty to the shareholders and the class, and to recover unspecified damages, pre-judgment and post-judgment interest, and an award of their attorneys’ fees and other costs.
On December 14, 2018, the judge of the Superior Court of Hamilton County, Indiana issued an order granting the Company’s motion to dismiss the shareholders’ lawsuits. On January 11, 2019, the shareholders filed an appeal of the judge’s order dismissing the lawsuits. On December 4, 2019, the Indiana Court of Appeals issued a unanimous decision affirming the trial court’s decision to dismiss the shareholder litigation. On January 20, 2020, the shareholders filed a petition to transfer with the Indiana Supreme Court seeking review of the decision of the Court of Appeals. The Company opposed the petition. The Indiana Supreme Court has not ruled upon the petition to transfer.
On September 8, 2014, two former restaurant manager employees filed a purported class action lawsuit against Steak n Shake (Drake v. Steak n Shake). On January 30, 2017, a former restaurant manager employee filed a purported class action lawsuit against Steak n Shake (Clendenen v. Steak n Shake). The plaintiffs generally allege claims that Steak n Shake improperly classified its managerial employees as exempt. On July 26, 2019, the Company agreed to settle both cases for $8,350 and the Court approved the terms of the settlement. The settlement is reflected in selling, general and administrative expenses in the consolidated statement of earnings.
| Note 15. | Fair Value of Financial Assets |
The fair values of substantially all of our financial instruments were measured using market or income approaches. Considerable judgment may be required in interpreting market data used to develop the estimates of fair value. Accordingly, the fair values presented are not necessarily indicative of the amounts that could be realized in an actual current market exchange. The use of alternative market assumptions and/or estimation methodologies may have a material effect on the estimated fair value.
The hierarchy for measuring fair value consists of Levels 1 through 3, which are described below.
| · | Level 1 – Inputs represent unadjusted quoted prices for identical assets or liabilities exchanged in active markets. |
| · | Level 2 – Inputs include directly or indirectly observable inputs (other than Level 1 inputs) such as quoted prices for similar assets or liabilities exchanged in active or inactive markets; quoted prices for identical assets or liabilities exchanged in inactive markets; other inputs that may be considered in fair value determinations of the assets or liabilities, such as interest rates and yield curves, volatilities, prepayment speeds, loss severities, credit risks and default rates; and inputs that are derived principally from or corroborated by observable market data by correlation or other means. Pricing evaluations generally reflect discounted expected future cash flows, which incorporate yield curves for instruments with similar characteristics, such as credit ratings, estimated durations and yields for other instruments of the issuer or entities in the same industry sector. |
| · | Level 3 – Inputs include unobservable inputs used in the measurement of assets and liabilities. Management is required to use its own assumptions regarding unobservable inputs because there is little, if any, market activity in the assets or liabilities and we may be unable to corroborate the related observable inputs. Unobservable inputs require management to make certain projections and assumptions about the information that would be used by market participants in pricing assets or liabilities. |
The following methods and assumptions were used to determine the fair value of each class of the following assets recorded at fair value in the consolidated balance sheet:
Cash equivalents: Cash equivalents primarily consist of money market funds which are classified within Level 1 of the fair value hierarchy.
Equity securities: The Company’s investments in equity securities are classified within Level 1 of the fair value hierarchy.
Bonds: The Company’s investments in bonds are classified within Level 1 of the fair value hierarchy.
44
| Note 15. | Fair Value of Financial Assets (continued) |
Non-qualified deferred compensation plan investments: The assets of the non-qualified plan are set up in a rabbi trust. They represent mutual funds and publicly traded securities, each of which are classified within Level 1 of the fair value hierarchy.
Derivative instruments: Options related to equity securities are marked to market each reporting period and are classified within Level 1 or 2 of the fair value hierarchy depending on the instrument.
As of December 31, 2019 and 2018 the fair values of financial assets were as follows.
| December 31, | ||||||||||||||||||||||||||||||||
| 2019 | 2018 | |||||||||||||||||||||||||||||||
| Level 1 | Level 2 | Level 3 | Total | Level 1 | Level 2 | Level 3 | Total | |||||||||||||||||||||||||
| Assets | ||||||||||||||||||||||||||||||||
| Cash equivalents | $ | 43,095 | $ | — | $ | — | $ | 43,095 | $ | 21,448 | $ | — | $ | — | $ | 21,448 | ||||||||||||||||
| Equity securities: | ||||||||||||||||||||||||||||||||
| Consumer goods | — | 6,397 | — | 6,397 | 1,708 | 4,100 | — | 5,808 | ||||||||||||||||||||||||
| Insurance | 25 | — | 25 | — | — | — | — | |||||||||||||||||||||||||
| Bonds | 38,911 | — | — | 38,911 | 32,404 | — | — | 32,404 | ||||||||||||||||||||||||
| Options on equity securities | — | 2,166 | — | 2,166 | — | 2,755 | — | 2,755 | ||||||||||||||||||||||||
| Non-qualified deferred | ||||||||||||||||||||||||||||||||
| compensation plan investments | 2,175 | — | — | 2,175 | 2,149 | — | — | 2,149 | ||||||||||||||||||||||||
| Total assets at fair value | $ | 84,206 | $ | 8,563 | $ | — | $ | 92,769 | $ | 57,709 | $ | 6,855 | $ | — | $ | 64,564 | ||||||||||||||||
There were no changes in our valuation techniques used to measure fair values on a recurring basis.
| Note 16. | Accumulated Other Comprehensive Income |
Changes in the balances of each component of accumulated other comprehensive income (loss), net of tax, were as follows.
| 2019 | 2018 | |||||||||||||||||||||||
Foreign Currency Translation Adjustments |
Investment Gain (Loss) |
Accumulated Other Comprehensive Loss |
Foreign Currency Translation Adjustments |
Investment Gain (Loss) |
Accumulated Other Comprehensive Loss | |||||||||||||||||||
| Beginning Balance | $ | (2,516 | ) | $ | — | $ | (2,516 | ) | $ | (1,462 | ) | $ | 58 | $ | (1,404 | ) | ||||||||
| Reclassification to (earnings) loss | — | (58 | ) | (58 | ) | |||||||||||||||||||
| Foreign currency translation | (294 | ) | (294 | ) | (1,054 | ) | (1,054 | ) | ||||||||||||||||
| Ending Balance | $ | (2,810 | ) | $ | — | $ | (2,810 | ) | $ | (2,516 | ) | $ | — | $ | (2,516 | ) | ||||||||
| 2017 | ||||||||||||
| Foreign Currency Translation Adjustments | Investment Gain (Loss) | Accumulated Other Comprehensive Loss | ||||||||||
| Beginning Balance | $ | (3,447 | ) | $ | (137 | ) | $ | (3,584 | ) | |||
| Other comprehensive income (loss) | ||||||||||||
| before reclassifications | 195 | 195 | ||||||||||
| Foreign currency translation | 1,985 | 1,985 | ||||||||||
| Ending Balance | $ | (1,462 | ) | $ | 58 | $ | (1,404 | ) | ||||
There were no reclassifications from accumulated other comprehensive income to earnings during 2019 and 2017. Reclassifications made from accumulated other comprehensive income to the statement of earnings were $58 of income to earnings during 2018.
45
| Note 17. | Business Segment Reporting |
Our reportable business segments are organized in a manner that reflects how management views those business activities. Our restaurant operations include Steak n Shake and Western Sizzlin. The Company also reports segment information for First Guard, Southern Oil and Maxim. Other business activities not specifically identified with reportable business segments are presented in “other” within total operating businesses. We report our earnings from investment partnerships separate from our corporate expenses. We assess and measure segment operating results based on segment earnings as disclosed below. Segment earnings from operations are neither necessarily indicative of cash available to fund cash requirements, nor synonymous with cash flow from operations. The tabular information that follows shows data of our reportable segments reconciled to amounts reflected in the consolidated financial statements.
A disaggregation of our consolidated data for each of the three most recent years is presented in the tables which follow.
| Revenue | ||||||||||||
| 2019 | 2018 | 2017 | ||||||||||
| Operating Businesses: | ||||||||||||
| Restaurant Operations: | ||||||||||||
| Steak n Shake | $ | 595,004 | $ | 760,565 | $ | 792,827 | ||||||
| Western | 15,216 | 15,125 | 14,326 | |||||||||
| Total Restaurant Operations | 610,220 | 775,690 | 807,153 | |||||||||
| First Guard | 30,083 | 27,628 | 24,943 | |||||||||
| Southern Oil | 24,436 | — | — | |||||||||
| Maxim | 4,099 | 6,576 | 7,708 | |||||||||
| $ | 668,838 | $ | 809,894 | $ | 839,804 | |||||||
| Earnings (Loss) Before Income Taxes | ||||||||||||
| 2019 | 2018 | 2017 | ||||||||||
| Operating Businesses: | ||||||||||||
| Restaurant Operations: | ||||||||||||
| Steak n Shake | $ | (18,575 | ) | $ | (10,657 | ) | $ | 431 | ||||
| Western | 1,756 | 2,046 | 1,860 | |||||||||
| Total Restaurant Operations | (16,819 | ) | (8,611 | ) | 2,291 | |||||||
| First Guard | 7,103 | 6,215 | 4,770 | |||||||||
| Southern Oil | 8,032 | — | — | |||||||||
| Maxim | 742 | 1,068 | (439 | ) | ||||||||
| Other | 994 | 635 | 669 | |||||||||
| Total Operating Businesses | 52 | (693 | ) | 7,291 | ||||||||
| Corporate and investments: | ||||||||||||
| Corporate | (10,602 | ) | (11,286 | ) | (16,106 | ) | ||||||
| Investment partnership gains | 78,133 | 40,411 | 6,965 | |||||||||
| Total corporate | 67,531 | 29,125 | (9,141 | ) | ||||||||
| Interest expense on notes | ||||||||||||
| payable and other borrowings | (12,442 | ) | (11,677 | ) | (11,040 | ) | ||||||
| $ | 55,141 | $ | 16,755 | $ | (12,890 | ) | ||||||
46
| Note 17. | Business Segment Reporting (continued) |
| Capital Expenditures | ||||||||||||
| 2019 | 2018 | 2017 | ||||||||||
| Operating Businesses: | ||||||||||||
| Restaurant Operations: | ||||||||||||
| Steak n Shake | $ | 9,951 | $ | 14,982 | $ | 7,565 | ||||||
| Western | 72 | 61 | 410 | |||||||||
| Total Restaurant Operations | 10,023 | 15,043 | 7,975 | |||||||||
| First Guard | 43 | 236 | 43 | |||||||||
| Southern Oil | 7,594 | — | — | |||||||||
| Maxim | — | — | — | |||||||||
| Other | 19 | 14 | 16 | |||||||||
| Total Operating Businesses | 17,679 | 15,293 | 8,034 | |||||||||
| Corporate | — | — | — | |||||||||
| Consolidated results | $ | 17,679 | $ | 15,293 | $ | 8,034 | ||||||
| Depreciation and Amortization | ||||||||||||
| 2019 | 2018 | 2017 | ||||||||||
| Operating Businesses: | ||||||||||||
| Restaurant Operations: | ||||||||||||
| Steak n Shake | $ | 20,533 | $ | 18,180 | $ | 19,987 | ||||||
| Western | 641 | 651 | 636 | |||||||||
| Total Restaurant Operations | 21,174 | 18,831 | 20,623 | |||||||||
| First Guard | 85 | 76 | 56 | |||||||||
| Southern Oil (includes depletion expense of $8,077) | 8,218 | — | — | |||||||||
| Maxim | — | 27 | 50 | |||||||||
| Other | 66 | 287 | 287 | |||||||||
| Total Operating Businesses | 29,543 | 19,221 | 21,016 | |||||||||
| Corporate | 35 | 97 | 432 | |||||||||
| Consolidated results | $ | 29,578 | $ | 19,318 | $ | 21,448 | ||||||
47
| Note 17. | Business Segment Reporting (continued) |
A disaggregation of our consolidated assets is presented in the table that follows.
| Identifiable Assets | ||||||||
| December 31, | ||||||||
| 2019 | 2018 | |||||||
| Reportable segments: | ||||||||
| Restaurant Operations: | ||||||||
| Steak n Shake | $ | 385,259 | $ | 330,100 | ||||
| Western | 18,322 | 16,444 | ||||||
| Total Restaurant Operations | 403,581 | 346,544 | ||||||
| First Guard | 58,808 | 51,565 | ||||||
| Southern Oil | 82,257 | — | ||||||
| Maxim | 16,549 | 18,143 | ||||||
| Other | 20,732 | 19,774 | ||||||
| Corporate | 51,840 | 35,987 | ||||||
| Investment partnerships | 505,542 | 557,480 | ||||||
| Total assets | $ | 1,139,309 | $ | 1,029,493 | ||||
| Note 18. | Quarterly Financial Data (Unaudited) |
| 1st Quarter | 2nd Quarter | 3rd Quarter | 4th Quarter | |||||||||||||
| For the year ended December 31, 2019 | ||||||||||||||||
| Total revenues | $ | 181,859 | $ | 168,343 | $ | 160,216 | $ | 158,420 | ||||||||
| Gross profit | 22,837 | 30,454 | 38,467 | 43,307 | ||||||||||||
| Costs and expenses | 199,384 | 169,518 | 157,272 | 145,398 | ||||||||||||
| Earnings (loss) before income taxes | 11,562 | 27,870 | (631 | ) | 16,340 | |||||||||||
| Net earnings (loss) | 9,818 | 21,974 | (17 | ) | 13,605 | |||||||||||
| Net earnings (loss) per equivalent Class A share | $ | 28.36 | $ | 63.50 | $ | (0.05 | ) | $ | 39.64 | |||||||
| For the year ended December 31, 2018 | ||||||||||||||||
| Total revenues | $ | 202,225 | $ | 208,739 | $ | 203,582 | $ | 195,348 | ||||||||
| Gross profit | 36,430 | 42,727 | 36,153 | 33,145 | ||||||||||||
| Costs and expenses | 203,391 | 203,778 | 204,518 | 201,979 | ||||||||||||
| Earnings (loss) before income taxes | (2,611 | ) | (8,429 | ) | (24,902 | ) | 52,697 | |||||||||
| Net earnings (loss) | (1,814 | ) | (7,539 | ) | (13,703 | ) | 42,448 | |||||||||
| Net earnings (loss) per equivalent Class A share | $ | (5.15 | ) | $ | (21.73 | ) | $ | (39.50 | ) | $ | 122.53 | |||||
We define gross profit as net revenue less restaurant cost of sales, media cost of sales, oil and natural gas production costs and insurance losses and underwriting expenses, which excludes depreciation and amortization.
| Note 19. | Supplemental Disclosures of Cash Flow Information |
Capital expenditures in accounts payable at December 31, 2019, 2018 and 2017 were $339, $1,776 and $1,036, respectively.
In 2019, we had new finance lease obligations of $5,026 and retirements of $940. In 2018, we had new capital lease obligations of $1,000 and lease retirements of $11,557. During 2017, we had new capital lease obligations of $1,952 and lease retirements of $5,030.
48
| Item 9. | Changes in and Disagreements with Accountants on Accounting and Financial Disclosure |
Not applicable.
|
Controls and Procedures |
Based on an evaluation of our disclosure controls and procedures (as defined in Exchange Act Rules 13a-15(e) and 15d-15(e)), our Chief Executive Officer and Controller have concluded that our disclosure controls and procedures were effective as of December 31, 2019.
On September 9, 2019, we completed our acquisition of Southern Oil. We have excluded Southern Oil from management’s assessment of the effectiveness of disclosure controls and procedures as of December 31, 2019.
Changes in Internal Control over Financial Reporting
There have been no changes in our internal control over financial reporting that occurred during the quarter ended December 31, 2019 that have materially affected, or that are reasonably likely to materially affect, our internal control over financial reporting. We excluded the evaluation of internal controls over financial reporting for Southern Oil during the quarter ended December 31, 2019.
Management’s Report on Internal Control Over Financial Reporting
Management of Biglari Holdings Inc. is responsible for establishing and maintaining adequate internal control over financial reporting, as such term is defined in the Securities Exchange Act of 1934 Rule 13a-15(f). Under the supervision of our principal executive officer and principal financial officer, we conducted an evaluation of the effectiveness of the Company’s internal control over financial reporting as of December 31, 2019 as required by the Securities Exchange Act of 1934 Rule 13a-15(c). In making this assessment, we used the criteria set forth in the framework in Internal Control—Integrated Framework (2013) issued by the Committee of Sponsoring Organizations of the Treadway Commission. Based on our evaluation under the framework in Internal Control—Integrated Framework (2013), our management concluded that our internal control over financial reporting was effective as of December 31, 2019.
We are in the process of evaluating the existing controls and procedures of Southern Oil and integrating Southern Oil into our internal control over financial reporting. In accordance with Securities and Exchange Commission guidance, we have excluded Southern Oil from management’s assessment of the effectiveness of internal control over financial reporting as of December 31, 2019.
The effectiveness of our internal control over financial reporting as of December 31, 2019 has been audited by Deloitte & Touche LLP, an independent registered public accounting firm, as stated in their report which is included herein.
Biglari Holdings Inc.
February 22, 2020
|
Other Information |
None.
49
| Item 10. | Directors, Executive Officers and Corporate Governance |
| Item 11. | Executive Compensation |
| Item 12. | Security Ownership of Certain Beneficial Owners and Management and Related Stockholder Matters |
| Item 13. | Certain Relationships and Related Transactions, and Director Independence |
| Item 14. | Principal Accountant Fees and Services |
The information required by Part III Items 10, 11, 12, 13 and 14 will be contained in the Company’s definitive proxy statement for its 2020 Annual Meeting of Shareholders, to be filed on or before April 23, 2020, and such information is incorporated herein by reference.
50
| Item 15. | Exhibits and Financial Statement Schedules |
(a) 1. Financial Statements
The following Consolidated Financial Statements, as well as the Reports of Independent Registered Public Accounting Firm, are included in Part II, Item 8 of this report:
| PAGE | |
| Reports of Independent Registered Public Accounting Firm | 22-23 |
| Consolidated Balance Sheets | 24 |
| Consolidated Statements of Earnings | 25 |
| Consolidated Statements of Comprehensive Income | 25 |
| Consolidated Statements of Cash Flows | 26 |
| Consolidated Statements of Changes in Shareholders’ Equity | 27 |
| Notes to Consolidated Financial Statements | 28 |
| Management’s Report on Internal Control over Financial Reporting | 49 |
2. Financial Statement Schedule
Schedules have been omitted for the reason that they are not required, are not applicable, or the required information is set forth in the financial statements or notes thereto.
| (b) Exhibits |
51
| Item 16. | Form 10-K Summary |
Not applicable.
52
Pursuant to the requirements of Section 13 or 15(d) of the Securities Exchange Act of 1934, the registrant has duly caused this report to be signed on its behalf by the undersigned, thereunto duly authorized, on February 22, 2020.
| Biglari Holdings inc. | ||||
| By: | /s/ Bruce Lewis | |||
| Bruce Lewis Controller | ||||
Pursuant to the requirements of the Securities Exchange Act of 1934, this report has been signed below by the following persons on behalf of the registrant and in the capacities indicated, on February 22, 2020.
| Signature | Title | |
| /s/ Sardar Biglari | Chairman of the Board and Chief Executive Officer (Principal Executive Officer) | |
| Sardar Biglari | ||
| /s/ Bruce Lewis | Controller (Principal Financial and Accounting Officer) | |
| Bruce Lewis | ||
| /s/ Philip Cooley | Director | |
| Philip Cooley | ||
| /s/ Ruth J. Person | Director | |
| Ruth J. Person | ||
| /s/ Kenneth R. Cooper | Director | |
| Kenneth R. Cooper | ||
| /s/ James P. Mastrian | Director | |
| James P. Mastrian | ||
| /s/ John G. Cardwell | Director | |
| John G. Cardwell |
53