Attached files
| file | filename |
|---|---|
| EX-99.1 - EX-99.1 - Emerald Holding, Inc. | eex-ex991_6.htm |
| 8-K - 8-K - Emerald Holding, Inc. | eex-8k_20200213.htm |

Emerald Expositions FY 2019 Earnings Call supplemental Materials February 13, 2020 Exhibit 99.2

Notes Forward-Looking Statements This document contains certain forward-looking statements regarding Emerald Expositions Events, Inc.’s (the “Company”) future event schedule. These statements are based on management’s expectations that, although they are believed to be reasonable, are inherently uncertain. These statements involve risks and uncertainties, including, but not limited to, climate, epidemiological, economic, competitive, and governmental factors outside of the Company’s control that may cause its event schedule to differ materially. See “Risk Factors” and “Cautionary Note Regarding Forward-Looking Statements” in the Company’s most recently filed periodic reports on Form 10-K and Form 10-Q and subsequent filings. The Company undertakes no obligation to update or revise any of the forward-looking statements contained herein, whether as a result of new information, future events or otherwise. Non-GAAP Financial Information This presentation presents Adjusted EBITDA, a “non-GAAP” financial measure. The components of Adjusted EBITDA are computed by using amounts that are determined in accordance with accounting principles generally accepted in the United States of America (“GAAP”). For a discussion of Adjusted EBITDA, see below under the heading Appendix I. Other companies may compute Adjusted EBITDA differently. No non-GAAP measure, including Adjusted EBITDA, should be considered as an alternative to any other measure derived in accordance with GAAP. 2 EMERALD

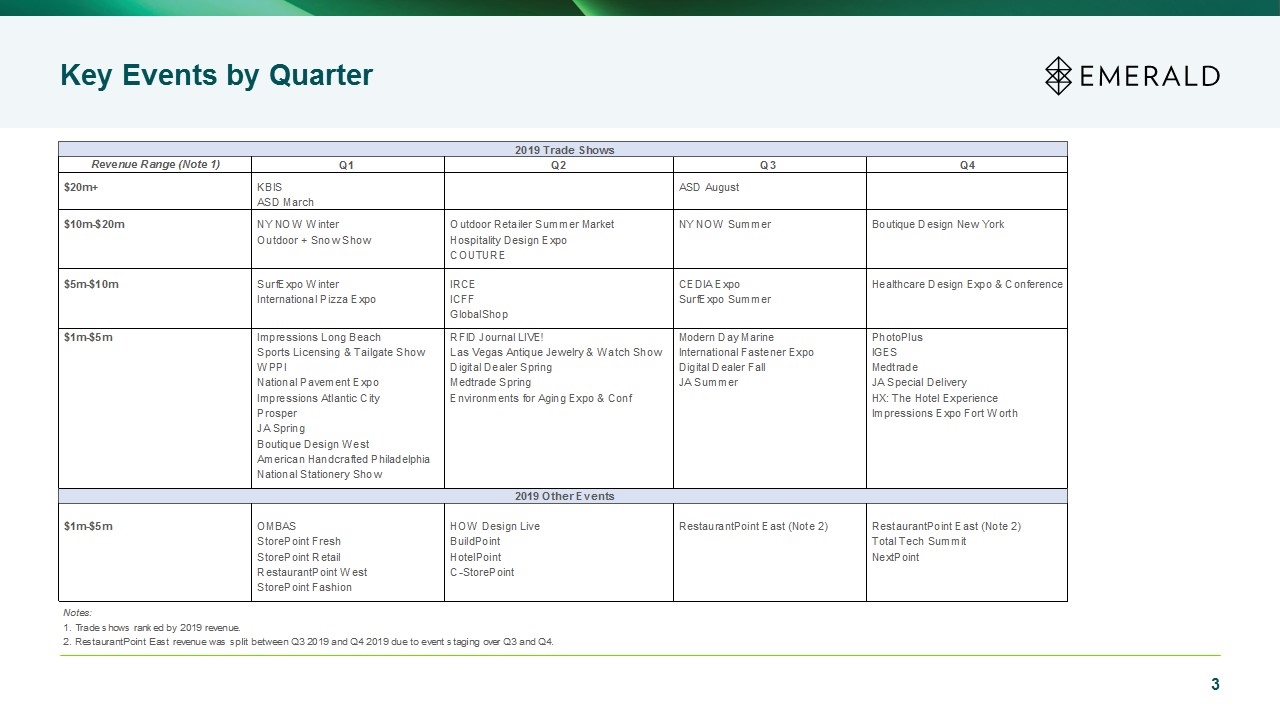
Key Events by Quarter EMERALD 2019 Trade Shows Revenue Range (Note 1) Q1 Q2 Q3 Q4 20m+ KBIS ASD August ASD March $10m-$20m NY NOW Winter Outdoor Retailer Summer Market NY NOW Summer Boutique Design New York Outdoor + Snow Show Hospitality Design Expo COUTURE $5m-$10m SurfExpo Winter IRCE CEDIA Expo Healthcare Design Expo & Conference International Pizza Expo ICFF SurfExpo Summer GlobalShop $1m-$5m Impressions Long Beach RFID Journal LIVE! Modern Day Marine PhotoPlus Sports Licensing & Tailgate Show Las Vegas Antique Jewelry & Watch Show International Fastener Expo IGES WPPI Digital Dealer Spring Digital Dealer Fall Medtrade National Pavement Expo Medtrade Spring JA Summer JA Special Delivery Impressions Atlantic City Environments for Aging Expo & Conf HX: The Hotel Experience Prosper Impressions Expo Fort Worth JA Spring Boutique Design West American Handcrafted Philadelphia National Stationery Show 2019 Other Events $1m-$5m OMBAS HOW Design Live RestaurantPoint East (Note 2) RestaurantPoint East (Note 2) StorePoint Fresh BuildPoint Total Tech Summit StorePoint Retail HotelPoint NextPoint RestaurantPoint West C-StorePoint StorePoint Fashion Notes: 1. Trade shows ranked by 2019 revenue. 2. RestaurantPoint East revenue was split between Q3 2019 and Q4 2019 due to event staging over Q3 and Q4. 3

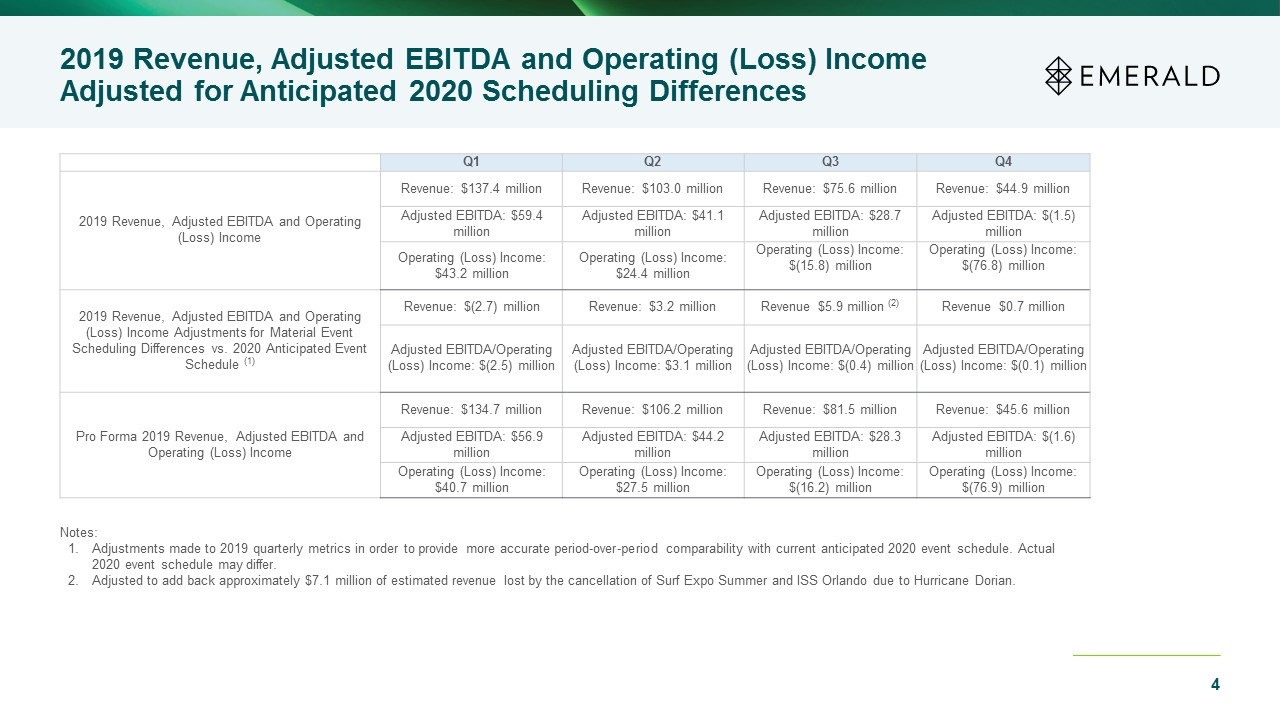
2019 Revenue, Adjusted EBITDA and Operating (Loss) Income Adjusted for Anticipated 2020 Scheduling Differences Q1 Q2 Q3 Q4 2019 Revenue, Adjusted EBITDA and Operating (Loss) Income Revenue: $137.4 million Revenue: $103.0 million Revenue: $75.6 million Revenue: $44.9 million Adjusted EBITDA: $59.4 million Adjusted EBITDA: $41.1 million Adjusted EBITDA: $28.7 million Adjusted EBITDA: $(1.5) million Operating (Loss) Income: $43.2 million Operating (Loss) Income: $24.4 million Operating (Loss) Income: $(15.8) million Operating (Loss) Income: $(76.8) million 2019 Revenue, Adjusted EBITDA and Operating (Loss) Income Adjustments for Material Event Scheduling Differences vs. 2020 Anticipated Event Schedule (1) Revenue: $(2.7) million Revenue: $3.2 million Revenue $5.9 million (2) Revenue $0.7 million Adjusted EBITDA/Operating (Loss) Income: $(2.5) million Adjusted EBITDA/Operating (Loss) Income: $3.1 million Adjusted EBITDA/Operating (Loss) Income: $(0.4) million Adjusted EBITDA/Operating (Loss) Income: $(0.1) million Pro Forma 2019 Revenue, Adjusted EBITDA and Operating (Loss) Income Revenue: $134.7 million Revenue: $106.2 million Revenue: $81.5 million Revenue: $45.6 million Adjusted EBITDA: $56.9 million Adjusted EBITDA: $44.2 million Adjusted EBITDA: $28.3 million Adjusted EBITDA: $(1.6) million Operating (Loss) Income: $40.7 million Operating (Loss) Income: $27.5 million Operating (Loss) Income: $(16.2) million Operating (Loss) Income: $(76.9) million Notes: Adjustments made to 2019 quarterly metrics in order to provide more accurate period-over-period comparability with current anticipated 2020 event schedule. Actual 2020 event schedule may differ. Adjusted to add back approximately $7.1 million of estimated revenue lost by the cancellation of Surf Expo Summer and ISS Orlando due to Hurricane Dorian. 4 EMERALD

Appendix I We use Adjusted EBITDA because we believe it assists investors and analysts in comparing Emerald’s operating performance across reporting periods on a consistent basis by excluding items that we do not believe are indicative of our core operating performance. Management and Emerald’s board of directors use Adjusted EBITDA to assess our financial performance and believe it is helpful in highlighting trends because it excludes the results of decisions that are outside the control of management, while other measures can differ significantly depending on long-term strategic decisions regarding capital structure, the tax jurisdictions in which we operate, and capital investments. Adjusted EBITDA should not be considered as an alternative to net income as a measure of financial performance or to cash flows from operations as a liquidity measure. We define Adjusted EBITDA as net income before (i) interest expense (including unrealized loss on interest rate swap and floor, net for periods prior to the expiration of our interest rate swap), (ii) income tax expense, (iii) depreciation and amortization, (iv) stock-based compensation, (v) deferred revenue adjustment, and (vi) other items that management believes are not part of our core operations. 5 EMERALD
