Attached files
| file | filename |
|---|---|
| EX-32.1 - EX-32.1 - Emerald Holding, Inc. | eex-ex321_7.htm |
| EX-31.2 - EX-31.2 - Emerald Holding, Inc. | eex-ex312_6.htm |
| EX-31.1 - EX-31.1 - Emerald Holding, Inc. | eex-ex311_9.htm |
| EX-23.1 - EX-23.1 - Emerald Holding, Inc. | eex-ex231_534.htm |
| EX-21.1 - EX-21.1 - Emerald Holding, Inc. | eex-ex211_353.htm |
UNITED STATES
SECURITIES AND EXCHANGE COMMISSION
Washington, D.C. 20549
FORM 10-K
(Mark One)
|
☒ |
ANNUAL REPORT PURSUANT TO SECTION 13 OR 15(d) OF THE SECURITIES EXCHANGE ACT OF 1934 |
For the fiscal year ended December 31, 2017
OR
|
☐ |
TRANSITION REPORT PURSUANT TO SECTION 13 OR 15(d) OF THE SECURITIES EXCHANGE ACT OF 1934 FOR THE TRANSITION PERIOD FROM TO |
Commission File Number 001-38076
Emerald Expositions Events, Inc.
(Exact name of Registrant as specified in its Charter)
|
Delaware |
42-1775077 |
|
(State or other jurisdiction of incorporation or organization) |
(I.R.S. Employer Identification No.) |
|
|
|
|
31910 Del Obispo Street, Suite 200 San Juan Capistrano, CA |
92675 |
|
(Address of principal executive offices) |
(Zip Code) |
Registrant’s telephone number, including area code: (949) 226-5700
Securities registered pursuant to Section 12(b) of the Act:
|
Title of each class |
Name of each exchange on which registered |
|
Common Stock, Par Value $0.01 Per Share |
New York Stock Exchange |
Securities registered pursuant to Section 12(g) of the Act: None
Indicate by check mark if the Registrant is a well-known seasoned issuer, as defined in Rule 405 of the Securities Act. YES ☐ NO ☒
Indicate by check mark if the Registrant is not required to file reports pursuant to Section 13 or 15(d) of the Act. YES ☐ NO ☒
Indicate by check mark whether the Registrant: (1) has filed all reports required to be filed by Section 13 or 15(d) of the Securities Exchange Act of 1934 during the preceding 12 months (or for such shorter period that the Registrant was required to file such reports), and (2) has been subject to such filing requirements for the past 90 days. YES ☒ NO ☐
Indicate by check mark whether the Registrant has submitted electronically and posted on its corporate Web site, if any, every Interactive Data File required to be submitted and posted pursuant to Rule 405 of Regulation S-T (§232.405 of this chapter) during the preceding 12 months (or for such shorter period that the Registrant was required to submit and post such files). YES ☒ NO ☐
Indicate by check mark if disclosure of delinquent filers pursuant to Item 405 of Regulation S-K (§229.405) is not contained herein, and will not be contained, to the best of Registrant’s knowledge, in definitive proxy or information statements incorporated by reference in Part III of this Form 10-K or any amendment to this Form 10-K. ☐
Indicate by check mark whether the registrant is a large accelerated filer, an accelerated filer, a non-accelerated filer, smaller reporting company, or an emerging growth company. See the definitions of “large accelerated filer,” “accelerated filer,” “smaller reporting company,” and “emerging growth company” in Rule 12b-2 of the Exchange Act.
|
Large accelerated filer |
|
☐ |
|
Accelerated filer |
|
☐ |
|
|
|
|
|
|||
|
Non-accelerated filer |
|
☒ (Do not check if a smaller reporting company) |
|
Smaller reporting company |
|
☐ |
|
|
|
|
|
|
|
|
|
Emerging growth company |
☒ |
|
|
|
|
|
If an emerging growth company, indicate by check mark if the registrant has elected not to use the extended transition period for complying with any new or revised financial accounting standards provided pursuant to Section 13(a) of the Exchange Act. ☒
Indicate by check mark whether the Registrant is a shell company (as defined in Rule 12b-2 of the Exchange Act). YES ☐ NO ☒
The aggregate market value of the voting stock held by non-affiliates of the Registrant, based on the closing price of the shares of common stock on The New York Stock Exchange on June 30, 2017, the last business day of the Registrant’s most recently completed second quarter, was $392,872,312.50.
Shares of the registrant's voting stock held by each executive officer and director and by each entity or person that, to the registrant's knowledge, owned 10% or more of the registrant's outstanding common stock as of June 30, 2017 have been excluded from this number in that these persons may be deemed affiliates of the registrant. This determination of possible affiliate status is not necessarily a conclusive determination for other purposes.
The number of shares of Registrant’s Common Stock outstanding as of February 19, 2018 was 72,779,195.
DOCUMENTS INCORPORATED BY REFERENCE
Portions of the Registrant’s Definitive Proxy Statement relating to the 2018 Annual Meeting of Shareholders, are incorporated by reference into Part III of this Report. The Registrant’s Definitive Proxy Statement will be filed with the Securities and Exchange Commission within 120 days of the registrant’s fiscal year ended December 31, 2017.
|
|
|
Page |
|
PART I |
|
|
|
Item 1. |
2 |
|
|
Item 1A. |
16 |
|
|
Item 1B. |
32 |
|
|
Item 2. |
32 |
|
|
Item 3. |
32 |
|
|
Item 4. |
32 |
|
|
|
|
|
|
PART II |
|
|
|
Item 5. |
33 |
|
|
Item 6. |
34 |
|
|
Item 7. |
Management’s Discussion and Analysis of Financial Condition and Results of Operations |
38 |
|
Item 7A. |
66 |
|
|
Item 8. |
67 |
|
|
Item 9. |
Changes in and Disagreements With Accountants on Accounting and Financial Disclosure |
106 |
|
Item 9A. |
106 |
|
|
Item 9B. |
106 |
|
|
|
|
|
|
PART III |
|
|
|
Item 10. |
107 |
|
|
Item 11. |
107 |
|
|
Item 12. |
Security Ownership of Certain Beneficial Owners and Management and Related Stockholder Matters |
107 |
|
Item 13. |
Certain Relationships and Related Transactions, and Director Independence |
107 |
|
Item 14. |
107 |
|
|
|
|
|
|
PART IV |
|
|
|
Item 15. |
107 |
|
|
Item 16. |
107 |
i
CAUTIONARY NOTE REGARDING FORWARD-LOOKING STATEMENTS
This Annual Report on Form 10-K contains forward-looking statements within the meaning of the U.S. Private Securities Litigation Reform Act of 1995. You can generally identify forward-looking statements by our use of forward-looking terminology such as “anticipate,” “believe,” “continue,” “could,” “estimate,” “expect” “intend,” “may,” “might,” “plan,” “potential” “predict,” “seek” or “should,” or the negative thereof or other variations thereon or comparable terminology. In particular, statements about the markets in which we operate, including growth of our various markets, and our expectations, beliefs, plans, strategies, objectives, prospects, assumptions or future events or performance contained in this report are forward-looking statements.
We have based these forward-looking statements on our current expectations, assumptions, estimates and projections. While we believe these expectations, assumptions, estimates and projections are reasonable, such forward-looking statements are only predictions and involve known and unknown risks and uncertainties, many of which are beyond our control. These and other important factors, including those discussed in this report under the heading “Management’s Discussion and Analysis of Financial Condition and Results of Operations,” may cause our actual results, performance or achievements to differ materially from any future results, performance or achievements expressed or implied by these forward-looking statements, or could affect the trading price of our common stock on the New York Stock Exchange. Some of the factors that could cause actual results to differ materially from those expressed or implied by the forward-looking statements include, but are not limited to, those discussed in Part I, Item 1A of this Form 10-K under the heading “Risk Factors,” which are incorporated herein by reference.
Given these risks and uncertainties, you are cautioned not to place undue reliance on such forward-looking statements. The forward-looking statements contained in this report are not guarantees of future performance and our actual results of operations, financial condition and liquidity, and the development of the industry in which we operate, may differ materially from the forward-looking statements contained in this report. In addition, even if our results of operations, financial condition and liquidity, and events in the industry in which we operate, are consistent with the forward-looking statements contained in this report, they may not be predictive of results or developments in future periods.
Any forward-looking statement that we make in this Annual Report on Form 10-K speaks only as of the date of such statement. Except as required by law, we do not undertake any obligation to update or revise, or to publicly announce any update or revision to, any of the forward-looking statements, whether as a result of new information, future events or otherwise, after the date of this report.
Except where the context requires otherwise, references in this Annual Report on Form 10-K to “Emerald Expositions”, “Emerald”, “the Company”, “we”, “us”, and “our” refer to Emerald Expositions Events, Inc., formerly known as Expo Event Holdco, Inc., together with its consolidated subsidiaries. In this Annual Report on Form 10-K, when we refer to our fiscal years, we refer to the year number, as in “2017,” which refers to our fiscal year ended December 31, 2017.
1
BUSINESS
Our Company
We are a leading operator of business-to-business trade shows in the United States. We currently operate more than 55 trade shows, as well as numerous other face-to-face events. In 2017, Emerald’s events connected over 500,000 global attendees and exhibitors and occupied more than 6.9 million net square feet (“NSF”) of exhibition space. We have been recognized with many awards and accolades that reflect our industry leadership as well as the importance of our shows to the exhibitors and attendees we serve.
All of our trade show franchises typically hold market-leading positions within their respective industry verticals, with significant brand value established over a long period of time. Each of our trade shows is held at least annually, with certain franchises offering multiple trade shows per year. As our shows are frequently the largest and most well attended in their respective industry verticals, we are able to attract high-quality attendees, including those who have the authority to make purchasing decisions on the spot or subsequent to the show. The participation of these attendees makes our trade shows “must-attend” events for our exhibitors, further reinforcing the leading positions of our trade shows within their respective industry verticals. Our attendees use our shows to fulfill procurement needs, source new suppliers, reconnect with existing suppliers, identify trends, learn about new products and network with industry peers, which we believe are factors that make our shows difficult to replace with non-face-to-face events. Our portfolio of trade shows is well-balanced and diversified across both industry sectors and customers. The scale and “must-attend” nature of our trade shows translates into an exceptional value proposition for participants, resulting in a self-reinforcing “network effect” whereby the participation of high-value attendees and exhibitors drives high participant loyalty and predictable, recurring revenue streams.
We generated 93% of our revenue for the year ended December 31, 2017 through the live events that we operate. The remaining 7% of our revenue for the year ended December 31, 2017 was generated from other marketing services, including digital media and print publications that complement our event properties in the industry sectors we serve. Each of our other marketing services products allows us to remain in close contact with, and market to, our existing event audiences throughout the year.
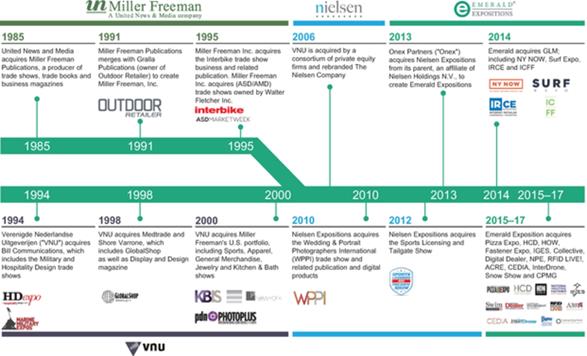
Our History
Our current portfolio of trade shows has come together as a result of many acquisitions completed over the last few decades. In 1994, one of our predecessor companies, Verenigde Nederlandse Uitgeverijen (“VNU”), acquired Bill Communications, adding the Military and Hospitality Design trade shows to its pre-existing portfolio of events. This was followed by the acquisitions of Medtrade and GlobalShop in 1998. In 2000, VNU acquired Miller Freeman’s U.S. events portfolio, which significantly expanded our business into the Sports, Apparel, General Merchandise, Jewelry and Kitchen and Bath categories.
In 2006, VNU was purchased by a consortium of private equity firms and rebranded The Nielsen Company (“Nielsen”). The trade show operations, which became known as Nielsen Expositions, operated autonomously from the rest of Nielsen, except with respect to corporate shared services. Under Nielsen’s ownership, capital allocated to the exhibitions division for acquisition was limited and we therefore expanded our portfolio only modestly by acquiring the Wedding & Portrait Photographers International trade show in 2010 and the Sports Licensing & Tailgate Show in 2012.
In June 2013, Nielsen Expositions was acquired by Onex (the “Onex Acquisition”). Rebranded Emerald Expositions, we have since focused on expanding our portfolio of leading events organically, complemented by an increased focus on acquisitions. Since the Onex Acquisition, we have acquired 15 industry-leading, high-quality events of various sizes for aggregate consideration of approximately $590 million.
2
In January 2014, we acquired George Little Management (“GLM”) for $335 million. At the time, GLM operated more than 20 trade shows, including four of the largest 100 trade shows in the United States. GLM significantly expanded our presence within a number of industry sectors, including Gift, Home & General Merchandise and Sports, and added new sectors such as Technology.
In 2015, we completed four acquisitions. In February, we acquired the Healthcare Media division of Vendome Group, which included leading events such as the Healthcare Design Conference and Expo, Healthcare Design Magazine, Environments for Aging and Construction SuperConference (collectively, “HCD Group”). In March, we acquired the International Pizza Expo (“Pizza Expo” and together with the trade magazine Pizza Today, “Pizza Group”), the largest trade show for independent pizzerias in the world. In October, we acquired HOW Design Live and the HOW Interactive Design Conference Sense (“HOW”), the largest graphic design conference and expo in the nation. In November, we acquired the National Industrial Fastener and Mill Supply Expo (“Fastener Expo,” together with HCD Group, Pizza Group and HOW, the “2015 Acquisitions”), the world’s largest industrial fastener trade show.
In 2016, we completed six acquisitions. In August, we acquired International Gift Exposition in the Smokies and The Super Souvenir Show (“IGES”), the largest dedicated gathering of wholesale souvenir, resort, and gift buyers in the United States. Also in August, we acquired the Swim Collective and Active Collective trade shows (“Collective”), which include the first trade show focused entirely on activewear and the leading swimwear trade show on the West Coast. In October, we acquired the Digital Dealer Conference and Expo (“Digital Dealer”), the leading trade show series focused on the retail automotive industry’s digital strategy and operations. Also in October, we acquired the National Pavement Expo (“Pavement”), adding to our portfolio the largest U.S. trade show focused on paving and pavement maintenance. In November, we acquired RFID Journal LIVE! (“RFID LIVE!”), the largest trade show focused on radio frequency identification technologies used to identify, track, and manage corporate assets and inventory across a wide range of industries. In December, we acquired American Craft Retailers Expo (“ACRE,” together with IGES, Collective, Digital Dealer, Pavement and RFID LIVE!, the “2016 Acquisitions”), a wholesale craft exposition consisting of two shows.
In 2017, we completed four acquisitions. In January, we acquired CEDIA Expo (“CEDIA”), the largest trade show in the home technology market. In March, we acquired the International Drone Conference & Exposition (“InterDrone”), the leading trade show in the U.S. commercial drone market. In May, we acquired the SnowSports Industries America Snow Show (“Snow Show”), which at the time of its acquisition was the largest snow sports industry event in North America. In November, we acquired Connected Point Marketing Group (“CPMG,” together with CEDIA, InterDrone and Snow Show, the “2017 Acquisitions”), a producer of best in class hosted-buyer model trade events focused on innovation for the hospitality, restaurant, healthcare, grocery and retail industries.
3
On May 3, 2017, we completed our IPO of 17,825,000 shares of our common stock at a price of $17.00 per share. We sold 10,333,333 shares, resulting in net proceeds to us after underwriting discounts and expenses of $159.1 million, and funds managed by Onex sold 7,491,667 shares from which we did not receive any proceeds. We used all of the net proceeds from the offering plus cash on hand, to prepay $159.2 million of borrowings outstanding under our Term Loan Facility (as defined herein).
Products and Services
We operate leading trade shows in multiple attractive, fragmented industry sectors that represent significant portions of the U.S. economy and serve a large and diverse set of global exhibitors and attendees. This fragmentation of exhibitors and attendees is an especially important characteristic of the trade show industry. In markets characterized by diffuse buyers and sellers, trade shows offer a great opportunity for interaction between large numbers of participants on both sides of a potential transaction (a “many-to-many” environment) within a short period of time, thus enhancing the value delivered to all trade show participants. Further, the highly fragmented nature of our markets enhances the stability of our entire platform as the loss of any single exhibitor or attendee is unlikely to cause other exhibitors or attendees to derive less value from and cease participating in a show.
We generated 93% of our revenue for the year ended December 31, 2017 through the live events that we operate. The remaining 7% of our revenue for the year ended December 31, 2017 was generated from other marketing services, including digital media and print publications that complement our event properties in the industry sectors we serve. Each of our other marketing services products allows us to remain in close contact with, and market to, our existing event audiences throughout the year.
4
The following is a summary of our trade shows by sector and a discussion of our complementary products.
Gift, Home & General Merchandise
We currently operate 13 trade shows in the Gift, Home & General Merchandise sector focused on a broad range of consumer goods used in and around the home. Our events are primarily order-writing shows where exhibitors, whose product assortment is always evolving, generate sales during the shows themselves. The base of exhibitors and attendees across these trade shows is highly fragmented, which mitigates the importance of any single exhibitor.
|
• |
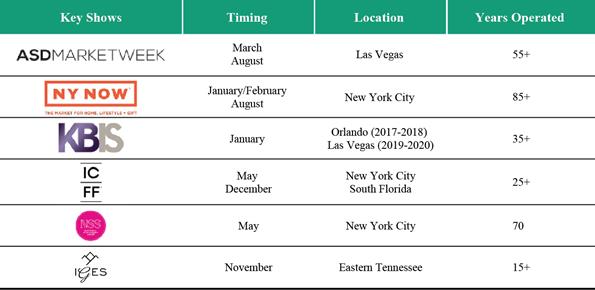
ASD Market Week — Founded over 55 years ago and held in Las Vegas twice a year in March and August, ASD Market Week is the largest and most comprehensive value-oriented general merchandise trade show in the industry. Each ASD Market Week trade show features nine shows in a single location and covers the following categories: gift and home accents; jewelry; general store products; fashion and accessories; beauty and fragrance products; toys and novelty products; convenience store products; cultural products; and direct sourcing (which allows buyers to purchase certain products directly from the factory as opposed to from distributors), largely offered at a value-oriented price point. The population of exhibitors tend to be highly fragmented and include small importers, manufacturers, and distributors of low- to mid-priced goods. Attendees include domestic and international chains, mass merchants, kiosks, dollar stores, specialty retail stores, close-out and liquidation retailers, resorts, convenience stores, gift stores, amusement and theme park operators, and online retailers from over 110 countries. Given the size and breadth of the trade show, ASD Market Week enables attendees to source a wide variety of products for their stores in a single location in a short period of time. These are order-writing shows that exhibitors rely on to generate a material portion of their annual revenue. We estimate that 98% of attendees at ASD Market Week are primary decision-makers responsible for purchasing, and that the average attendee spends over $80,000 on products as a result of the show. ASD Market Week’s two annual events are designed to address different buying cycles for attendees. |
5
|
distributors of products from close to 70 countries across the categories listed above. Attendees include international chains and department stores, specialty retail stores, gift stores, online retailers, museums, designers, distributors, importers, and wholesalers from over 90 countries. Given the size and breadth of the show, NY NOW enables attendees to source a wide variety of products for their stores in a single location in a short period of time. We believe that approximately 50% of attendees at NY NOW do not shop at any other trade show, and that more than 85% of attendees consider NY NOW to be a “must-attend” event. As with ASD Market Week, NY NOW is primarily an order-writing show with sales executed on the show floor. Given its size and prominence, NY NOW receives significant media coverage from over 400 domestic and international media outlets. |
|
• |
Kitchen & Bath Industry Show (“KBIS”) — Founded over 35 years ago and held annually in January typically either in Orlando or Las Vegas, KBIS is the world’s largest kitchen and bath design trade show specifically serving residential kitchen and bath dealers, designers, architects, remodelers, wholesalers and custom builders who consider KBIS to be a “must-attend” event. Emerald Expositions has been operating the show on behalf of the National Kitchen and Bath Association since 1987 and has a contract to continue doing so through 2028. Exhibitors include manufacturers, distributors, and importers of residential kitchen and bath products, and attendees include architects, remodelers, designers, hardware professionals, and dealers from over 55 countries. The show has been co-located with the International Builders’ Show (owned by the National Association of Home Builders) since 2014, a partnership that has been beneficial to both shows given their exhibitor and attendee overlap. |
|
• |
International Contemporary Furniture Fair (“ICFF”) — Founded over 25 years ago and held in New York City each May and in South Florida each December, ICFF is North America’s leading trade show for high-end contemporary furniture and interior design. Exhibitors include manufacturers and sellers of contemporary furniture, seating, carpet and flooring, lighting, outdoor furniture, materials, wall coverings, accessories, textiles, and kitchen and bath products for residential and commercial interiors, while attendees include interior designers, architects, retailers, distributors, facility managers, developers, store designers, and visual merchandisers who attend from around 80 countries. |
|
• |
National Stationery Show (“NSS”) — Founded over 70 years ago and held in New York City each year in May, NSS is the only North American trade show for global buyers and sellers of stationery and specialty paper products. Exhibitors include manufacturers and designers of stationery and paper products while attendees include stationery, card and gift shops; bookstores; bridal shops; party stores; department, chain and specialty stores; large chains and “big box” mass retailers; and online retailers and mail order catalog distributors; as well as special event planners, corporate buyers, importers, and distributors. |
|
• |
International Gift Exposition in the Smokies and The Super Souvenir Show (“IGES”) — Founded over 15 years ago and held in eastern Tennessee each year in November, IGES is the largest dedicated gathering of wholesale souvenir, resort and gift buyers in the United States. Exhibitors include manufacturers and distributors of apparel, gifts, souvenirs, games, toys, personal care products, licensed items, novelties, kiosk items, promotional goods, jewelry, Made-in-America products, handicrafts, and more. Attendees include wholesale resort, souvenir and gift merchandisers, and retailers. |
|
• |
American Craft Retailers Expo (“ACRE”) — ACRE, founded in 2006, is the premier wholesale craft exposition in North America, taking place annually in Philadelphia, Pennsylvania. ACRE connects wholesale American and Canadian makers of handmade products with national and international buyers from art & fine craft galleries, modern gift & home stores, independent retailers, guilds & arts institutions, e-retailers, national retail chains, museums and other key influencers in the home, gift and lifestyle marketplace. |
6
We currently operate 19 trade shows within the Sports industry sector focused on sporting goods and related apparel and accessories for various active outdoor pursuits ranging from camping, hiking, climbing, skiing, bicycling and paddle sports. We believe that several of our trade shows in this sector have iconic status in the markets they serve, and offer a many-to-many environment where, for example, thousands of specialty sports retailers from across the country interact with hundreds of specialty equipment and apparel manufacturers. The Sports sector is highly fragmented where the sports enthusiast clientele is well-served by independent specialized retailers.

|
• |
Outdoor Retailer (“OR”) — Founded over 35 years ago, OR is the largest outdoor sports and lifestyle trade show brand in the United States. In recent years, OR held a winter and a summer show in Salt Lake City. In May 2017, Emerald acquired Snow Show from Snow Sports Industries America. At the time of its acquisition, Snow Show was the largest snow sports industry event in North America. In January 2018, Snow Show staged with OR for the first time as a combined show, referred to as Outdoor Retailer + Snow Show, endorsed and sponsored by SnowSports Industries America and OIA. In addition to this January show, OR will produce a summer event in June/July and an early winter season show in November, all three of which will be staged in Denver, Colorado. Partnering with OIA since 1992, OR has earned loyalty from high-end specialty brands and has solidified itself as a destination event for specialty retailers selling to outdoor enthusiasts. OR is organized across categories such as accessories, footwear, hard goods, apparel, and gear serving lifestyle sports such as camping, climbing, hiking, paddle sports, back-country and cross-country skiing, snowboarding and snow shoeing. Exhibitors include manufacturers, suppliers, importers, and licensees and distributors of sports gear from 30 countries. Attendees include independent, chain, and online retailers of active lifestyle sporting goods and media and licensing agents from 55 countries; however, the focus is on independent, high-end, specialty outdoor retailers, whose enthusiast clientele is not served by the mass-market products sold through major retail channels. The products at this trade show are technical and performance-oriented, so buyers want to touch and test the products in person in order to make good purchasing decisions which they can then communicate to their end-customer. For this reason, this is an important trade show for exhibitors and attendees who attend loyally each year. There is no major general outdoor sporting goods show that competes directly with OR. The events receive considerable media attention with coverage from approximately 275 media outlets. |
7
|
for action water and board sports as well as resort-oriented merchandise that one would typically find at a beach or resort store. Surf Expo is also unique in that it is the only show focused exclusively on the water sports and resort sectors covering both hard goods and soft goods. Held in partnership with the Association of Wind and Water Sports Industries, the Board Retailers Association, the Water Sports Industry Association, and the Stand Up Paddle Industry Association, exhibitors include manufacturers serving the surf, skate, stand-up paddling, wakeboarding, windsurfing, kayaking, swim, resort, and coastal giftware markets from close to 30 countries, while attendees include retail buyers from specialty stores, big box stores, cruise lines, hotels, and theme parks from over 70 countries. Trade shows are well-suited for the surf and water sports industry, in particular in the hard-goods side of the market where products are performance-oriented and there is a desire by buyers to touch and test products in person in order to make good purchasing decisions. For example, Surf Expo has a “board demo day” at the Orlando Watersports Complex that gives buyers a chance to try the products out before the core trade show begins. |
|
• |
Interbike — Founded over 35 years ago, Interbike is the largest bicycle trade event in North America, offered in partnership with the National Bicycle Dealers Association, People for Bikes, and the Bicycle Products Suppliers Association. Through 2017, Interbike included a two-day biking event on dirt trails and roads, followed by a three-day trade show in Las Vegas, Nevada. In 2018, Interbike Marketweek will take place in the Reno/Tahoe region, beginning with a new consumer demo and festival, followed by two days of outdoor events and demonstrations for retailers, and closing with a three-day Interbike Expo in Reno, Nevada. Exhibitors include manufacturers of bikes for road, mountain, triathlon, and electric use, and manufacturers of accessories and related products including apparel, safety, power, nutrition, and more from 35 countries, while attendees include specialty bicycle retailers, importers, and distributors from over 60 countries. Much like OR and Surf Expo, Interbike trade shows are well suited for the biking industry as the products are highly performance-oriented and there is a desire from buyers to touch and test products in person and experience new product innovation in order to make good purchasing decisions. In October 2016, we launched Fall CycloFest, a hybrid B2B/B2C event under the Interbike brand. |
|
• |
Imprinted Sportswear Shows (“ISS”) — Founded over 35 years ago and held five times a year in different markets in the United States (most recently in Long Beach, Atlantic City, Fort Worth, Nashville, and Orlando), the ISS shows are the leaders of the decorated apparel industry and allow industry professionals to see the latest sportswear imprinting equipment, supplies, industry trends, and techniques. Exhibitors include providers of blank apparel, ink, design technology, screen printing, and embroidery equipment, while attendees include independent and chain retailers serving school teams, recreational leagues, and community groups from close to 15 countries. The industry is particularly well-suited for trade shows as, short of having a national salesforce, trade shows are the only way for these exhibitors to access customers (including many small buyers) in all corners of the country. |
|
• |
Sports Licensing & Tailgate Show — Founded over ten years ago and held in Las Vegas each January, the Sports Licensing & Tailgate Show attracts, as exhibitors, manufacturers that hold licenses for any professional or collegiate sports teams with respect to products, including accessories, apparel, collectibles, footwear, gifts and novelty items, headwear, home furnishings, imprinted items, picnic or tailgating products, sports equipment, stationery and school supplies, or toys and games. Attendees include retailers from independent and chain sporting stores, suppliers, mass market retailers, general merchandise and specialty stores, and fan shops. This is primarily an order-writing show with sales generated directly on the show floor. |
|
• |
Swim Collective and Active Collective Shows — Founded in 2010, the Swim Collective and Active Collective shows present swimwear, resort, and active wear collections to an audience of swimwear specialty retailers, active athleisure sport specialty retailers, swim and surf specialty retailers, gift and department stores, as well as luxury resorts, boutiques and cruise retailers. Swim Collective is the leading swimwear trade show on the West Coast, while Active Collective is a more recently-launched, fast-growing show focused on activewear. In January 2017, we launched an Active Collective event in New York. |
Design & Construction
We currently operate 5 trade shows in the Design & Construction industry sector catering to the construction, hospitality, and interior design sectors serving the hotel, resort, retail, healthcare facilities, restaurant, bar, spa, and in-store marketing categories. Targeted attendees include interior designers, architects, owners and operators,
8
developers, and specifiers and purchasers working within these industries. This sector is well-suited for trade shows because design and construction are highly visual and tactile processes, requiring the in-person experience and interaction provided by trade shows. These trade shows enable designers and contractors to stay current with trends in product styles and techniques, which tend to change from year-to-year. Upcoming renovation and new-build construction projects are often discussed at these shows, making it important for both exhibitors and attendees to attend in order to stay close to the pipeline of future business. By aggregating a wide range of products under one roof, these trade shows save time and expense for designers and other attendees who would otherwise have to independently visit hundreds of showrooms that may be located in different cities. These shows are mostly lead-generating, enabling designers to see the latest trends and product offerings, and develop design ideas.
|
• |
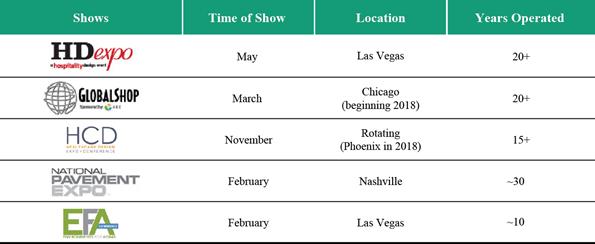
Hospitality Design Expo (“HD Expo”) — Founded over 20 years ago and held in Las Vegas each May, HD Expo is the largest trade show for the hospitality design industry serving the hotel, resort, restaurant, bar and cruise categories. Run in partnership with the American Society of Interior Designers, the Boutique & Lifestyle Lodging Association, the International Interior Design Association, the International Society of Hospitality Purchasers, and the Hospitality Industry Network, HD Expo includes a hospitality conference with accredited conference sessions where continuing educational credentials and learning unit credentials can be earned. Exhibitors include manufacturers and marketers of flooring, seating, fabric, case goods and lighting from over 20 countries, while attendees include interior designers, architects, planners and builders from over 55 countries. |
|
• |
GlobalShop — Founded over 20 years ago and held in Chicago beginning in March 2018, GlobalShop is the largest trade show and conference dedicated to store design, visual merchandising, and shopper marketing. GlobalShop is organized into five categories: the Store Fixturing Show, Visual Merchandising Show, Store Design & Operations, Digital Store and At-Retail Marketplace. Exhibitors include manufacturers and marketers of fixtures, lighting, flooring, and retail displays as well as contractors, while attendees include retailers, brands, procurement agencies, contract architects and designers from over 50 countries. |
|
• |
Healthcare Design Expo & Conference — Founded over 15 years ago and held annually in November in rotating cities (Phoenix in 2018), the Healthcare Design Expo & Conference is the industry’s best attended trade show and conference primarily focused on evidence-based design for healthcare facilities. Exhibitors include manufacturers of healthcare facility related products, including fixtures, materials, furniture, and equipment. Attendees include architects, interior designers, healthcare facility administrators, contractors, engineers, educators, nurses, project managers and purchasing executives involved in the design of healthcare facilities. |
|
• |
National Pavement Expo (“Pavement”) — Founded approximately 30 years ago, Pavement is the largest U.S. trade show specifically designed for paving and pavement maintenance professionals, bringing vendors and suppliers together with contractors who make their living from asphalt and concrete paving, infrared pavement repair, sealcoating, striping, sweeping, crack repair, pavement repair and snow removal. The trade show also includes a conference and seminar component serving as a source of education to the industry. |
9
Technology
We currently operate 6 trade shows in the technology industry sector, a sector we entered in 2014 through the GLM acquisition.
|
• |
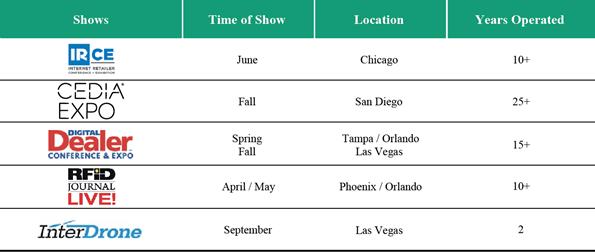
Internet Retailer Conference & Exhibition (“IRCE”) — Founded over ten years ago and held in Chicago each June, IRCE is the largest conference and exhibition for the eCommerce industry, primarily targeting senior executives and owners of eCommerce businesses looking for ways to optimize and improve their offerings. Exhibitors include solution and service providers for analytics, eCommerce consulting, content management, customer satisfaction measurement, data services, delivery services, digital marketing, eCommerce platforms, and e-mail marketing from over 25 countries, while attendees include branded consumer product manufacturers, catalogers, consumer service providers, financial service providers, store retailers and shopping portals from over 40 countries. This trade show and conference serves an industry that is constantly evolving and, as such, the knowledge-sharing enabled by this annual event is highly valued by exhibitors and attendees. The significant paid conference component features high-profile guest speakers and workshops. |
|
• |
CEDIA Expo (“CEDIA”) — Founded over 25 years ago, CEDIA is the largest trade show in the home technology market, serving industry professionals that manufacture, design and integrate goods and services for the connected home. The trade show features five days of networking, brand exposure and product launches, and is the annual connecting point for manufacturers, home technology professionals, media and industry partners within the “smart home” industry. CEDIA features industry leading educational content including training sessions, industry talks and panel sessions. The Custom Electronic Design & Installation Association officially endorses CEDIA and retains control and ownership of all educational programming, while we own and operate the trade show. |
|
• |
Digital Dealer Conference and Expo (“Digital Dealer”) — Founded approximately 20 years ago and held twice annually in the spring and fall in Tampa/Orlando and Las Vegas, respectively, Digital Dealer is the leading exhibition and conference series focused on digital marketing for franchised automotive dealerships. Attendees include automotive dealership executives and employees, while exhibitors and presenters include providers of eCommerce solutions for the industry, including auction tools, data and analytics, email marketing, inventory management, lead generation and tracking, mobile marketing and applications, sales training and tools providers. |
10
|
• |
The International Drone Conference & Exposition (“InterDrone”) — Founded in 2015 and held annually in September, InterDrone is the leading commercial drone-focused show in the United States. The event attracts exhibitors and attendees from a wide variety of commercial applications, including aerial photography, surveying & terrain mapping, construction & building inspection, agriculture, real estate, cinematography and more. |
Jewelry
We currently operate 5 trade shows in the Jewelry industry sector targeting high-end and mid-range segments of the jewelry market.

|
• |
COUTURE — Founded over 20 years ago and held in Las Vegas each June, COUTURE is the number one trade show in the high-end luxury jewelry and timepiece market. Known as the definitive annual event for upscale retailers, exhibitors include designers and manufacturers of fine jewelry and timepieces from top international brands as well as the industry’s rising stars from close to 25 countries. Attendees include top-tier buyers representing highly distinguished independent, boutique and chain retailers from close to 70 countries. |
|
• |
JA New York — Founded over 110 years ago and held three times a year in New York City (JA New York Spring in March, JA New York Summer in July, and JA Special Delivery in November), the JA New York franchise is the leading trade show on the East Coast for the mid-tier jewelry market. Held in partnership with Jewelers of America since 1992, these trade shows are geared towards order writing and their timing allows retailers to restock during the winter, summer, and pre-holiday buying seasons with approximately 80% of attendees placing orders at the show. With a large number of jewelry wholesalers and jewelry retailers based in the Northeast, New York City is a well-suited location for this show. Exhibitors include manufacturers, distributors, designers, dealers, and importers of jewelry and loose stones, while attendees are independent, boutique, chain and online jewelry and antique retailers from close to 80 countries. |
|
• |
The Las Vegas Antique Jewelry & Watch Show — Founded over 20 years ago, the annual Las Vegas Antique Jewelry & Watch Show is the largest trade event serving the antique and estate jewelry and watch category. The show brings nearly 300 exhibitors to Las Vegas each summer to meet with independent, boutique, chain, and online jewelry and antique retailers. The show is primarily an order-writing show. |
11
Our Other Trade Shows include 10 trade shows across the Photography, Food, Healthcare, Industrials, and Military sectors.
|
• |
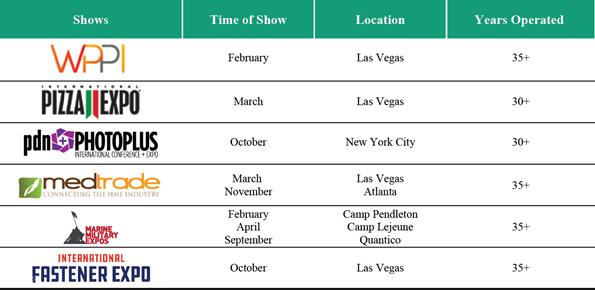
Wedding & Portrait Photographers International (“WPPI”) — Founded over 35 years ago and held in Las Vegas each February, WPPI is the largest trade show and conference for wedding and portrait photographers and filmmakers. Exhibitors include manufacturers and distributors of cameras, printers, and other photography tools, while attendees include commercial, professional and “prosumer” (i.e., professional consumer) photographers from close to 60 countries. |
|
• |
International Pizza Expo (“Pizza Expo”) — Founded over 30 years ago and held in Las Vegas each March, Pizza Expo is the world’s largest trade show for pizzeria owners and operators. Featuring educational workshops from the School of Pizzeria Management, exhibitors include manufacturers and exhibitors of ingredients, equipment, and ancillary products to the pizza industry, while attendees include independent and chain pizzeria owners and operators. Pizza Expo’s unique positioning as the only global trade show focused on the pizza industry makes it a must-attend event for accessing high quality buyers, generating leads, and maintaining brand presence. In October 2017, we successfully launched the related Pizza & Pasta Northeast trade show, which delivered a one-stop shop exhibit hall for Italian and pizza-concept restaurant owners to meet face-to-face with leading national and regional industry suppliers. |
|
• |
PhotoPlus Expo — Founded over 30 years ago and held in New York City each October, the PhotoPlus Expo is the largest photography and imaging show in North America. Featuring educational seminars such as Photo Walks and Master Classes, which are of high interest to attendees, the show’s exhibitors include manufacturers and distributors of cameras, printers, and other photography tools and accessories, while attendees include professional photographers, photography enthusiasts, videographers, students and educators from 65 countries. |
|
• |
Medtrade — Founded over 35 years ago and held twice each year (March in Las Vegas and November in Atlanta), Medtrade is the largest U.S. home medical equipment trade show. Exhibitors include manufacturers and distributors of respiratory systems, rehabilitation home aid products, oxygen systems, wheelchairs, scooters, braces, canes, and home diabetic supplies, while attendees include home medical equipment providers, pharmacy and drug store owners, rehab therapists, respiratory therapists, home health agencies, home health nurses, hospitals, occupational therapists and physical therapists. |
12
|
interface with procurement experts in the U.S. Marine Corps in addition to meeting soldiers back from tour. Exhibitors include providers of combat equipment and technology, and they display soft goods such as bulletproof vests as well as larger mission-critical items, including infantry combat equipment, combat vehicles, and aviation equipment. Attendees include Department of Defense-related personnel, uniformed Marines and civilians from the U.S. Marine Corps command and procurement officers. |
|
• |
National Industrial Fastener & Mill Supply Expo (“Fastener Expo”) — Founded over 35 years ago and held annually in October at Las Vegas, Fastener Expo is the world’s largest exposition for fasteners and brings the manufacturers and master distributors of industrial fasteners, precision formed parts, fastener machinery and tooling and other related products and services together with distributors and sales agents in the distribution chain. |
Other Events
We currently operate more than 70 additional events across a wide variety of forums including B2B conferences, hosted buyer events, B2C events, summits, awards and luxury private sales. We hold luxury private sale events through our Soiffer Haskin brand and hosted buyer events under our CPMG brand. Through our HD Expo, ICFF, HCD and GlobalShop brands, we host close to 20 annual networking sessions called CityScenes. These networking events bring together both up-and-coming and seasoned industry professionals and are very well received within their respective industries.
|
• |
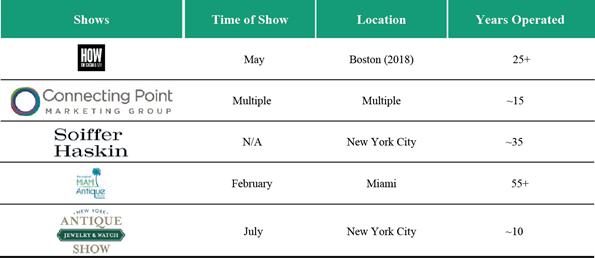
HOW Design Live (“HOW”) — Founded over 25 years ago and held annually in May in rotating cities (Boston in 2018), HOW is the largest graphic design trade show and conference in the United States. HOW represents a marquee event for the industry it serves, where creative professionals in all disciplines and all levels of experience come to learn from peers in the creative industry and designers discover new ideas, sources of inspiration and skills, and to develop new connections with other creative professionals. Exhibitors include paper suppliers, printer services and companies that provide design and workflow software. Attendees include graphic designers from in-house creative services departments, designers who work for or own small design firms and other marketing professionals. |
|
• |
CPMG— Founded almost 15 years ago, CPMG organizes and hosts nine senior executive level business-intensive trade events focused on innovation for the hospitality, restaurant, healthcare, grocery and retail industries. These four-day events are highly-curated, invitation-only forums that bring together leaders in each vertical market. |
|
• |
Soiffer Haskin — Founded almost 35 years ago, Soiffer Haskin conducts approximately 40 exclusive and discreet B2C sale events in its New York City showroom for luxury apparel, personal accessory and jewelry brands seeking to sell surplus inventory at discounted prices. |
13
|
• |
New York Antique Jewelry & Watch Show (“NY AJWS”) — Founded ten years ago, NY AJWS has established itself as a must-attend antique and estate jewelry event that provides access to historical and premium merchandise directly to customers. Categories of jewelry featured include cameos, tennis bracelets, rings, decorative necklaces, brooches, gemstones and pendants. |
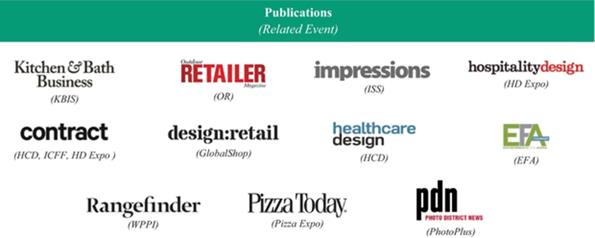
Other Marketing Services
Other Marketing Services consist of print publications and digital media products that complement our trade show properties, and generated 7% of our revenues for the year ended December 31, 2017. These print and digital media products are closely aligned with several of our events, and allow us to remain in close contact with, and market to, our existing event audiences throughout the year.
Competition
The trade show industry is highly fragmented, with approximately 9,400 B2B trade shows held per year in the United States according to the Center for Exhibition Industry Research, of which a majority are owned by industry associations, according to Advanced Market Research. Individual trade shows typically compete for attendees and exhibitors only against the other trade shows that are relevant to their industry vertical. The level of competition each of our trade shows faces therefore varies by industry vertical.
Other well-established for-profit companies competing in the U.S. trade show industry include Reed Exhibitions, UBM and Informa Exhibitions.
Seasonality
As is typical for the trade show industry, our business is seasonal, with revenue recognized from trade shows typically reaching its highest levels during the first and third quarters of each calendar year, and its trough during the fourth quarter, largely due to the timing of our trade shows. In 2017, 41%, 21%, 31% and 7% of our trade show revenue was generated from trade shows during the first, second, third and fourth quarters, respectively.
Intellectual Property
Our intellectual property and proprietary rights are important to our business. We undertake to strategically and proactively develop our intellectual property portfolio by registering our trademarks. We currently rely
14
primarily on trademark laws to protect our intellectual property rights. We do not own, but have a license to use, certain trademarks belonging to an industry association in connection with our Kitchen & Bath Industry Show and CEDIA Expo. The KBIS license runs through 2028 and the CEDIA Expo license continues in perpetuity.
Employees
As of December 31, 2017, we had approximately 427 employees. We are not involved in any disputes with our employees and believe that relations with our employees are good. None of our employees are subject to collective bargaining agreements with unions. However, some facilities where we hold our trade shows require our decorators to use unionized labor.
Insurance
We maintain insurance policies to cover the principal risks associated with our business, including event cancellation, business interruption, workers’ compensation, directors’ and officers’ liability, product liability, auto, property, and umbrella and excess liability insurance. All of our insurance policies are with third-party carriers and syndicates with financial ratings of A or better. We believe the premiums, deductibles, coverage limits and scope of coverage under such policies are reasonable and appropriate for our business. Event cancellation insurance provides coverage that allows us to refund a proportionate share, relative to the compromised enforced attendance reduction or show closure, of the deposits and booth and sponsorship fees paid to us by exhibitors in the event that we are forced to cancel a trade show or other event for reasons covered by the policies, such as natural disasters, communicable disease, terrorism, or venue closures. Business interruption insurance provides further coverage for our office property leases in cases where we are not able to conduct ongoing business, including sales and event planning. The continued availability of appropriate insurance policies on commercially reasonable terms is important to our ability to operate our business and to maintain our reputation.
Our event cancellation insurance, currently bound through the end of 2019, provides 100% indemnity for all of our events’ and conferences’ gross revenues individually and 50% in the aggregate. The coverage has no deductible and covers cancellation, curtailment, postponement, removal to alternative premises, or abandonment, of the event as well as enforced reduced attendance. In addition, coverage extends to include additional promotional and marketing expenses necessarily incurred by us should a covered loss occur. This insurance also extends to cover losses resulting from an outbreak of communicable disease as well as a terrorism endorsement covering an act of terrorism and/or threat of terrorism directed at the insured event or within the United States or its territories.
Available Information
Our Annual Reports on Form 10-K, Quarterly Reports on Form 10-Q, Current Reports on Form 8-K, and amendments to reports filed pursuant to Sections 13(a) and 15(d) of the Exchange Act, are filed with the SEC. We are subject to the informational requirements of the Exchange Act and file or furnish reports, proxy statements and other information with the SEC. Such reports and other information filed by us with the SEC are available free of charge on our website at investor.emeraldexpositions.com when such reports are made available on the SEC’s website. The public may read and copy any materials filed by us with the SEC at the SEC’s Public Reference Room at 100 F Street, NE, Room 1580, Washington, DC 20549. The public may obtain information on the operation of the Public Reference Room by calling the SEC at 1-800-SEC-0330. The SEC maintains an Internet site that contains reports, proxy and information statements and other information regarding issuers that file electronically with the SEC at www.sec.gov. The contents of these websites are not incorporated into this filing. Further, our references to the URLs for these websites are intended to be inactive textual references only.
15
Investing in our common stock involves a high degree of risk. You should carefully consider the following factors, as well as other information contained in this Annual Report on Form 10-K, in evaluating our Company and business. If any of the following risks occur, our business, results of operations, and financial condition may be materially adversely affected.
Risks Relating to Our Business and Industry
At any given point in time, general economic conditions may have an adverse impact on the industry sectors in which our trade shows and conferences operate, and therefore may negatively affect demand for exhibition space and attendance at our trade shows and conferences.
Our results are influenced by domestic as well as global general economic conditions because we draw exhibitors and attendees from around the world. However, we are affected to a larger degree by conditions within the individual industry sectors in which our trade shows operate. For example, the downturn in the domestic housing market that began in 2007 had a negative impact on the performance of KBIS during the period from 2008 to 2013. The longer a recession or economic downturn continues, the more likely it becomes that our customers may reduce their marketing and advertising or procurement budgets. Any material decrease in marketing or procurement budgets could reduce the demand for exhibition space or reduce attendance at our trade shows, which could have a material adverse effect on our business, financial condition, cash flows and results of operations.
The success of each of our trade shows depends on the reputation of that show’s brand.
Our exhibitors and attendees primarily know us by the names of our trade shows that operate in their specific industry sector rather than by our corporate brand name, Emerald Expositions. In addition, a single brand name is sometimes used for shows that occur more than once a year; for example, the brand name “ASD Market Week” is used at our ASD Market Week March and ASD Market Week August shows, and the brand name Outdoor Retailer is used for both the OR Summer Market and OR Winter Market versions of the show. If the image or reputation of one or more of these shows is tarnished, it could impact the number of exhibitors and attendees attending that show or shows. A decline in one of our larger shows could have a material adverse effect on our business, financial condition, cash flows and results of operations.
The dates and location of a trade show can impact its profitability and prospects.
The demand for desirable dates and locations is high. Consistent with industry practice, we typically maintain multi-year non-binding reservations for dates at our trade show venues. Aside from a nominal deposit in some cases, we do not pay for these reservations, and, while they almost always entitle us to a last look before the venue is rented to someone else during the reservation period, these reservations are not binding on the facility owners until we execute a definitive contract with the owner. We typically sign contracts that guarantee the right to specific dates at venues only one or two years in advance. Therefore, our multi-year reservations may not lead to binding contracts with facility owners. Consistency in location and all other aspects of our trade shows is important to maintaining a high retention rate from year to year, and we rely on our highly loyal customer base for the success of our shows. Moving major shows to new cities, such as the planned move of Interbike from Las Vegas, Nevada to Reno, Nevada in September 2018 and the move of OR from Salt Lake City, Utah to Denver, Colorado in January 2018, can adversely affect customer behavior. Similarly, significant timing changes, such as the acceleration of OR Winter Market from January 2019 to November 2018, can also result in unanticipated customer reactions. External factors such as legislation and government policies at the local or state level, including policy related to social issues, may depress the desire of exhibitors and attendees to attend our trade shows held in certain locations. For example, our organic revenue growth in 2017 was modestly adversely impacted by certain political issues in Utah that affected exhibitor participation at our 2017 OR Summer Market show. Our inability to secure or retain desirable dates and locations for our trade shows could have a material effect on our business, financial condition, cash flows and results of operations.
16
Attendance at our shows could decline as a result of disruptions in global or local travel conditions, such as congestion at airports, the risk of or an actual terrorist action, adverse weather or fear of communicable diseases.
The number of attendees and exhibitors at our trade shows may be affected by a variety of factors that are outside our control. Because many attendees and exhibitors travel to our trade shows via airplane, factors that depress the ability or desire of attendees and exhibitors to travel to our trade shows, including, but not limited to, an increased frequency of flight delays or accidents, outbreaks of contagious disease or the potential for infection, increased costs associated with air travel, actual or threatened terrorist attacks, the imposition of heightened security standards or bans on visitors from particular countries outside the United States, or acts of nature, such as earthquakes, storms and other natural disasters, could have a material adverse effect on our business, financial condition, cash flows and results of operations. For example, during the third quarter of 2017, we experienced disruptions to ISS Orlando, Surf Expo and ICFF South Florida as a result of the impact of Hurricane Irma, and we may be forced to cancel or re-locate future trade shows in the event of natural or man-made disasters. While we are generally insured against direct losses, one or more of the factors described above could cause a long-term reduction in the willingness of exhibitors and attendees to travel to attend our trade shows, which could have a material adverse effect on our business, financial condition, cash flows and results of operations.
We may fail to accurately monitor or respond to changing market trends and adapt our trade show portfolio accordingly.
Our success depends in part upon our ability to monitor changing market trends and to adapt our trade shows, acquire existing trade shows or launch new trade shows to meet the evolving needs of existing and emerging target audiences. The process of researching, developing, launching and establishing profitability for a new trade show may lead to initial operating losses. In 2017, we launched six new events. Our efforts to adapt our trade shows, or to introduce new trade shows into our portfolio, in response to our perception of changing market trends, may not succeed, which could have a material adverse effect on our business, financial condition, cash flows and results of operations.
If we fail to attract leading brands as exhibitors in, or high-quality attendees to, our trade shows, we may lose the benefit of the self-reinforcing “network effect” we enjoy today.
The leading brands represented by our exhibitors attract attendees who, in many cases, have authority to make purchasing decisions, or who offer other benefits (such as publicity or press coverage) by virtue of their attendance. The presence of these exhibitors and attendees creates the self-reinforcing “network effect” that benefits our business; however, if representatives of leading brands decide for any reason not to participate in our trade shows, the number and quality of attendees could decline, which could lead to a rapid decline in the results of one or more trade shows and have an adverse effect on our business, financial condition, cash flows and results of operations.
We may face increased competition from existing trade show operators or new competitors.
Although the trade show market is highly fragmented, we currently face competition in certain of our industry sectors. Further, our high profit margins and low start-up costs could encourage new operators to enter the trade show business. Both existing and new competitors present an alternative to our product offerings, and if competition increases or others are successful in attracting away our exhibitors and attendees, it could have a material adverse effect on our business, financial condition, cash flows and results of operations.
A significant portion of our revenue is generated by our top five trade shows.
We depend on our top five trade shows to generate a significant portion of our revenues. For the year ended December 31, 2017, our top five shows were ASD Market Week March, ASD Market Week August, NY NOW Summer, NY NOW Winter and KBIS. For the year ended December 31, 2017, these shows represented 33% of our total revenues. Notwithstanding the fact that ASD Market Week and NY NOW represent multiple product categories and that all of our shows are highly diversified by customer, a significant decline in the performance or prospects of any one of these significant trade shows could have a material adverse effect on our business, financial condition, results of operations and cash flows.
17
We intend to continue to be highly acquisitive, and our acquisition growth strategy entails risk.
Our acquisition growth strategy entails various risks, including, among others:
|
• |
the risks inherent in identifying desirable acquisition candidates, including management time spent away from running our core business and external costs associated with identifying such acquisition candidates; |
|
• |
the risk that we turn out to be wrong with respect to selecting and consummating what we had believed to be accretive acquisitions; |
|
• |
the risk of overpaying for a particular acquisition; |
|
• |
the risks of successfully integrating an acquisition and retaining the key employees and/or customers of acquired businesses; |
|
• |
the risks relating to potential unknown liabilities of acquired businesses; |
|
• |
the cultural, execution, currency, tax and other risks associated with any future international expansion; and |
|
• |
the risks associated with financing an acquisition, which may involve diluting our existing stockholders, reducing our liquidity or incurring additional debt, which in turn could result in increased debt service costs and/or a requirement to comply with certain financial or other covenants. |
In furtherance of our strategy of growth through acquisitions, we routinely review and conduct investigations of potential acquisitions, some of which may be material. When we believe a favorable opportunity exists, we seek to enter into discussions with target shows or sellers regarding the possibility of such acquisitions. At any given time, we may be in discussions with one or more counterparties. There can be no assurances that any such negotiations will lead to definitive agreements, or if such agreements are reached, that any transactions would be consummated.
Our exhibitors may choose to use an increasing portion of their marketing and advertising budgets to fund online initiatives or otherwise reduce the amount of money they have available to spend in connection with our trade shows.
Our trade shows have high NSF renewal rates, and we expect to continue to derive the substantial majority of our revenues from selling booth space to exhibitors. Although we have not observed a decline in demand for our trade shows as a result of the increasing use of the internet and social media for advertising and marketing, the increasing influence of online marketing and any resulting reductions of the budgets our participants allocate to our trade shows could have a material adverse effect on our business, financial condition, cash flows and results of operations.
We may lose the services of members of our senior management team or of certain of our key full time employees and we may not be able to replace them adequately.
We benefit substantially from the leadership and experience of members of our senior management team and we depend on their continued services to successfully implement our business strategy. The loss of any member of our senior management team or other key employee could materially and adversely affect our financial condition and results of operations. We currently maintain key man insurance only for our CEO. We cannot be certain that we will continue to retain our executives’ services, or the services of other key personnel, many of whom have significant industry experience and/or institutional knowledge. Moreover, we may not be able to attract and retain other qualified personnel. The loss of the services of senior management or other key full-time employees, or our inability to attract and retain other qualified personnel, could have a material adverse effect on our business, financial condition, cash flows and results of operations.
We use third-party agents whom we do not control to sell space at our trade shows, particularly to international exhibitors.
We supplement our sales employees with third-party agents, who often have deeper connections in international markets than we could have on our own. We do not have full control over these agents, and they have the potential to expose us to reputational and legal risks either through representing our company poorly, selling exhibition space at our trade shows to low quality or otherwise inappropriate exhibitors or violating certain laws or
18
regulations including the U.S. Foreign Corrupt Practices Act and other applicable anti-bribery laws in contravention of our policies and procedures. Our relationships with these agents are not always exclusive, and any of a number of factors could lead to a reduction or cessation of their efforts to sell exhibit space at our trade shows, potentially reducing participation at our trade shows and having a material adverse effect on our business, financial condition, cash flows and results of operations.
Changes in legislation, regulation and government policy, including as a result of U.S. presidential and congressional elections, may have a material adverse effect on our business in the future.
The presidential and congressional elections in the United States could result in significant changes in, and uncertainty with respect to, legislation, regulation and government policy. While it is not possible to predict whether and when any such changes will occur, changes at the local, state or federal level could significantly impact our business. Specific legislative and regulatory proposals discussed during and after the election that could have a material impact on us include, but are not limited to, infrastructure renewal programs; changes to immigration policy; modifications to international trade policy, including withdrawing from trade agreements; and changes to financial legislation and public company reporting requirements. In particular, changes to immigration policy could make it more difficult for some exhibitors and attendees to attend our events.
We are currently unable to predict whether policy change discussions will meaningfully change existing legislative and regulatory environments relevant for our business. To the extent that such changes have a negative impact on us, including as a result of related uncertainty, these changes may materially and adversely impact our business, financial condition, cash flows and results of operations.
Recently enacted changes to the U.S. tax laws may have a material impact on us.
On December 20, 2017, the U.S. House of Representatives and the U.S. Senate each voted to approve H.R. 1 (commonly referred to as the “Tax Cuts and Jobs Act”) and, on December 22, 2017, the President signed the Tax Cuts and Jobs Act into law. The Tax Cuts and Jobs Act makes extensive changes to the U.S. tax laws and includes provisions that, among other things, reduce the U.S. corporate income tax rate, introduce a capital investment deduction, limit the interest deduction, limit the use of net operating losses to offset future taxable income, and make extensive changes to the U.S. international tax system, including the taxation of foreign earnings of U.S. multinational corporations. In addition, the Tax Cuts and Jobs Act modifies the deductibility of certain executive officer compensation, which may limit our ability to deduct performance-based compensation, including compensation related to the exercise of options by certain executive officers. The Tax Cuts and Jobs Act is complex and far-reaching and we cannot predict with certainty the resulting impact its enactment will have on us.
A loss or disruption of the services from one or more of the limited number of outside contractors who specialize in decoration, facility set-up and other services in connection with our trade shows could harm our business.
We, and to a greater extent, our exhibitors, use a limited number of outside contractors for decoration, facility set-up and other services in connection with our trade shows, and we and our exhibitors rely on the availability, capability and willingness of these contractors to provide services on a timely basis and on favorable economic and other terms. Notwithstanding our long-term contracts with these contractors, many factors outside our control could harm these relationships and the availability, capability or willingness of these contractors to provide these services on acceptable terms. The partial or complete loss of these contractors, or a significant adverse change in our or our exhibitors’ relationships with any of these contractors, could result in service delays, reputational damage and/or added costs that could harm our business and customer relationships to the extent we or our exhibitors are unable to replace them in a timely or cost-effective fashion, which could have a material adverse effect on our business, financial condition, cash flows and results of operations.
Some facilities where we hold our trade shows require decorators, facility set-up and other service providers to use unionized labor. Any union strikes or work stoppages could result in delays in launching or running our trade shows, reputational damage and/or added costs, which could have a material adverse effect on our business, financial condition, cash flows and results of operations.
19
The industry associations that sponsor and market our trade shows could cease to do so effectively, or could be replaced or supplemented by new industry associations who do not sponsor or market our trade shows.
We often enter into long-term sponsorship agreements with industry associations whereby the industry association endorses and markets our trade show to its members, typically in exchange for a percentage of the trade show’s revenue. Our success depends, in part, on our continued relationships with these industry associations and our ability to enter into similar relationships with other industry associations. Although we frequently enter into long-term agreements with these counterparties, these relationships remain subject to various risks, including, among others:
|
• |
failure of an industry trade association to renew a sponsorship agreement upon its expiration; |
|
• |
termination of a sponsorship agreement by an industry trade association in specified circumstances; |
|
• |
the willingness, ability and effectiveness of an industry trade association to market our trade shows to its members; |
|
• |
dissolution of an industry trade association and/or the failure of a new industry trade association to support us; and |
|
• |
the ability on the part of an industry trade association to organize a trade show itself. |
Any disruptions or impediments in these existing relationships, or the inability to establish a new relationship, could have a material adverse effect on our business, financial condition, cash flows and results of operations.
Our launch of new trade shows or new initiatives with respect to current trade shows may be unsuccessful and consume significant management and financial resources.
From time to time, we launch new trade shows or new initiatives with respect to current trade shows. In 2017, we launched six new events. We may expend significant management time and start-up expenses during the development and launch of new trade shows or initiatives, and if such trade shows or initiatives are not successful or fall short of expectations, we may be adversely affected. Because we have limited resources, we must effectively manage and properly allocate and prioritize our efforts. There can be no assurance that we will be successful or, even if successful, that any resulting new trade shows or new initiatives with respect to current trade shows will achieve customer acceptance.
We do not own certain of the trade shows that we operate or certain trademarks associated with some of our shows.
Risks associated with our relationships with industry trade associations or other third-party sponsors of our events are particularly applicable in the cases of KBIS and CEDIA, which are trade shows owned by industry associations, and in the case of the JA New York trade shows and our Military trade shows, which are the trade shows in our portfolio where the show trademarks are owned by an industry association or other third party and not by us. Any material disruption to our relationship with these third parties could have a material adverse impact on the revenue stream from these trade shows.
The infringement or invalidation of proprietary rights could have an adverse effect on our business.
We rely on trademark, trade secret and copyright laws in the United States and on company policies and confidentiality agreements with our employees, consultants, advisors and collaborators to protect our proprietary rights, including with respect to the names of our trade shows, our exhibitor and attendee contact databases and other intellectual property rights. Our confidentiality agreements may not provide adequate protection of our proprietary rights in the event of unauthorized use or disclosure of our proprietary information or if our proprietary information otherwise becomes known, or is independently developed, by competitors. Failure to obtain or maintain adequate protection of our intellectual property rights for any reason could have a material adverse effect on our business. We rely on our trademarks, trade names and brand names to distinguish our trade shows from those of our competitors, and have registered and applied to register many of these trademarks. We cannot assure you that our trademark applications will be approved or that our federal registrations will be upheld if challenged. Third parties may oppose our applications or otherwise challenge our use of our trademarks through administrative processes or litigation. In the event that our trademarks are successfully challenged, we could be forced to rebrand our products
20
and/or services, which could result in the loss of brand recognition and could require us to devote resources to advertising and marketing new brands. Further, we cannot assure you that competitors will not infringe our trademarks, or that we will identify all such infringements or have adequate resources to properly enforce our trademarks.
In addition, our business activities could infringe upon the proprietary rights of others, who could assert infringement claims against us. If we are forced to defend against any such claims, whether they are with or without merit or are determined in our favor, then we may face reputational damage, costly and time-consuming litigation, diversion of management’s attention and resources or other adverse effects on our products and services. As a result of such a dispute, we may have to rebrand our products or services, or enter into royalty or licensing agreements in order to obtain the right to use a third party’s intellectual property. Such royalty or licensing agreements, if required, may be unavailable on terms acceptable to us, or at all. If there is a successful claim of infringement against us, we could be required to pay significant damages, enter into costly royalty or licensing agreements, or discontinue certain of our brands, any of which could adversely affect our business.
Our information technology systems, including our ERP business management system, could be disrupted.
The efficient operation of our business depends on our information technology systems. Since the Onex Acquisition, we have implemented an ERP business management system, and we recently implemented applications, including Hyperion planning software and a new customer relationship management tool. We also recently completed the transfer of our data storage functions to a new cloud storage services provider. We rely on our information technology systems and certain third-party providers to effectively manage our business data, communications, supply chain, order entry and fulfillment and other business and financial processes. Our failure to properly and efficiently implement our information technology systems, or the failure of our information technology systems to perform as we anticipate, could disrupt our business and could result in transaction errors, processing inefficiencies and the loss of revenue and customers, causing our business and results of operations to suffer. In addition, our information technology systems may be vulnerable to damage or interruption from circumstances beyond our control, including fire, natural disasters, power outages, systems failures and viruses. While we maintain disaster recovery plans, any such damage or interruption could have a material adverse effect on our business.
We could fail to protect certain employee or customer data.
We collect and retain certain employee and customer data, including personally identifiable information, and, in some cases, credit card data. Our various information technology systems enter, process, summarize and report such data. The integrity and protection of such data is critical to our business, and our customers and employees have an expectation that we will adequately protect their personal information. Public attention regarding the use of personal information and data transfer has increased in recent years, and the regulatory environment governing information, security and privacy laws, as well as the requirements imposed on us by the credit card industry, are increasingly demanding and continue to evolve rapidly. The changing nature of privacy laws in the U.S., the European Union and elsewhere could impact our processing of personal and sensitive information of our employees, vendors and customers. For instance, the European Union adopted a comprehensive General Data Privacy Regulation (“GDPR”) in May 2016 that will replace the current EU Data Protection Directive and related country-specific legislation in May 2018. Maintaining compliance with applicable information security and privacy regulations could increase our operating costs and require significant management time and attention. Failure to comply with such regulations may subject us to negative publicity, government scrutiny or remedies that may harm our business, including fines or demands that we modify or cease existing business practices. We rely on third-party vendors to host our websites, customer databases and billing system. Any errors, failures, interruptions or delays experienced in connection with these third-party technologies and information services or our own systems could negatively impact our relationships with customers, adversely affect our brands and business and expose us to third-party liabilities. We exercise limited control over these third-party vendors, which increases our vulnerability to problems with services they provide. Furthermore, a compromised data system or the intentional, inadvertent or negligent release or disclosure of data by us or our third-party providers could result in theft, loss, or fraudulent or unlawful use of customer, employee or company data, any of which could harm our reputation and/or result in costs, fines or lawsuits, which could materially adversely affect our financial condition and operating results.
21
We face risks associated with event cancellations or other interruptions to our business, which the insurance we maintain may not fully cover.
We maintain business interruption, event cancellation, casualty, general commercial and umbrella and excess liability insurance, as well as policies relating to workers’ compensation, director and officer insurance and property and product liability insurance. Our insurance policies may not cover all risks associated with the operation of our business and may not be sufficient to offset the costs of all losses, lost sales or increased costs experienced during business interruptions or event cancellations. For example, during the third quarter of 2017, we experienced disruptions to ISS Orlando, Surf Expo and ICFF South Florida as a result of the impact of Hurricane Irma, and we may be forced to cancel future trade shows in the event of natural or man-made disasters. In addition, many of our trade shows are held in government-owned facilities, including three that are held on military bases operated by the U.S. government. These governmental entities may have the right to exclude us from the venues, or may not give us executed venue contracts until immediately prior to a scheduled trade show. While we are insured against losses arising from event cancellations, we are not reimbursed for any property that is discarded or destroyed or that we are required to replace because our existing assets are temporarily inaccessible. Such losses could have a negative impact on our business.
Certain events can also lead to reputational harm which could have a long-term negative impact on a trade show that would not be mitigated by insurance coverage. For some risks, we may not obtain insurance if we believe the cost of available insurance is excessive relative to the risks presented. As a result of market conditions, premiums and deductibles for certain insurance policies can increase substantially and, in some instances, certain insurance policies may become unavailable or available only for reduced amounts of coverage. As a result, we may not be able to renew our insurance policies or procure other desirable insurance on commercially reasonable terms, if at all. Losses and liabilities from uninsured or underinsured events and delay in the payment of insurance proceeds could have a material adverse effect on our financial condition and results of operations.
We may face material litigation.
Although we are not currently subject to any litigation that we believe would have a material adverse effect on our business, financial condition, cash flows or results of operations, we may in the future become subject to litigation or claims that arise in the ordinary course of business, including from, among other things, breach of contract, defamation, libel, fraud or negligence or intellectual property infringement, as well as employment-related litigation, including claims of age discrimination, sexual harassment, gender discrimination, immigration violations, and other local, state and federal labor law violations. Litigation can be expensive, time-consuming and disruptive to normal business operations, including to our management team due to the increased time and resources required to respond to and address the litigation. An unfavorable outcome with respect to any particular matter or costs related to the settlement of any such matter could have a material adverse effect on our business, financial condition, cash flows and results of operations.
We may be unable to fully utilize the benefits associated with our favorable tax attributes.
Our favorable tax attributes include amortization of intangibles resulting primarily from our historical acquisitions. If we generate taxable income in the future, we may be able to utilize our amortization expense to offset future federal income tax liabilities. We expect amortization expense relating to recent acquisitions will be available to offset cash taxes on an aggregate of approximately $503.6 million of income over the next 15 years. To the extent possible, we will structure our operating activities to minimize our income tax liabilities. However, there can be no assurance we will be able to reduce it to a specified level.
Risks Relating to our Indebtedness
Our substantial indebtedness could adversely affect our financial condition and limit our ability to raise additional capital to fund our operations.
We have a significant amount of indebtedness. As of December 31, 2017, we had $562.2 million of borrowings outstanding under the Amended and Restated Term Loan Facility, with $149.1 million in additional borrowing capacity under the Amended and Restated Revolving Credit Facility (as defined below) (after giving effect to $0.9 million of outstanding letters of credit).
22
Our high level of indebtedness could have important consequences to us, including:
|
• |
making it more difficult for us to satisfy our obligations with respect to our debt; |
|
• |
limiting our ability to obtain additional financing to fund future working capital, capital expenditures, investments or acquisitions or other general corporate requirements; |
|
• |
requiring a substantial portion of our cash flows to be dedicated to debt service payments instead of other purposes, thereby reducing the amount of cash flows available for working capital, capital expenditures, investments or acquisitions or other general corporate purposes; |
|
• |
increasing our vulnerability to adverse changes in general economic, industry and competitive conditions; |
|
• |
exposing us to the risk of increased interest rates as borrowings under our Amended and Restated Senior Secured Credit Facilities (to the extent not hedged) bear interest at variable rates, which could further adversely impact our cash flows; |
|
• |
limiting our flexibility in planning for and reacting to changes in our business and the industry in which we compete; |
|
• |
restricting us from making strategic acquisitions or causing us to make non-strategic divestitures; |
|
• |
impairing our ability to obtain additional financing in the future; |
|
• |
placing us at a disadvantage compared to other, less leveraged competitors; and |
|
• |
increasing our cost of borrowing. |
Any one of these limitations could have a material effect on our business, financial condition, cash flows, results of operations and ability to satisfy our obligations in respect of our outstanding debt.
Despite our current debt levels, we may incur substantially more indebtedness, which could further exacerbate the risks associated with our substantial leverage.
We and our subsidiaries may be able to incur additional indebtedness in the future, which may be secured. While our Amended and Restated Senior Secured Credit Facilities limit our ability and the ability of our subsidiaries to incur additional indebtedness, these restrictions are subject to a number of qualifications and exceptions and thus, notwithstanding these restrictions, we may still be able to incur substantially more debt. In addition, provided that no default or event of default (as defined in the Amended and Restated Senior Secured Credit Facilities) has occurred and is continuing, we have the option to add one or more incremental term loan or revolving credit facilities or increase commitments under the Amended and Restated Revolving Credit Facility by an aggregate amount of the sum of (X) (i) if the incremental loans are first lien loans, an amount such that the first lien net leverage ratio does not exceed 4.00:1.00, (ii) if the incremental loans are junior lien loans, an amount such that the secured net leverage ratio does not exceed 4.00:1.00, (iii) if the incremental loans are unsecured, either the total net leverage ratio does not exceed 5.00:1.00 or the fixed charge coverage ratio is not less than 2.00:1.00, or, in each case, if the incremental loans are incurred with a permitted acquisition, an amount such that the applicable leverage ratio will not increase as a result of the permitted acquisition (on a pro forma basis giving effect to the incremental loans); plus (Y) an amount equal to certain prior voluntary prepayments, loan buybacks and commitment reductions of loans under the Amended and Restated Senior Secured Credit Facilities, plus (Z) an amount equal to the greater of $160 million and 100% of Consolidated EBITDA (as defined in the Amended and Restated Senior Secured Credit Facilities). As of December 31, 2017, we had $562.2 million of borrowings outstanding under the Amended and Restated Term Loan Facility, with $149.1 million in additional borrowing capacity under the Amended and Restated Revolving Credit Facility (after giving effect to $0.9 million of outstanding letters of credit). To the extent that we incur additional indebtedness, the risks that we now face related to our substantial indebtedness could increase.
To service our indebtedness, we require a significant amount of cash, which depends on many factors beyond our control.
Based on our current level of operations, we believe our cash flow from operations, available cash and available borrowings under our Amended and Restated Senior Secured Credit Facilities will be adequate to meet our liquidity needs for the next twelve months. We cannot assure you, however, that our business will generate
23
sufficient cash flow from operations, or that future borrowings will be available to us under our Amended and Restated Senior Secured Credit Facilities in amounts sufficient to enable us to fund our liquidity needs.
If we do not generate sufficient cash flow from operations to satisfy our debt obligations, we may have to undertake alternative financing plans, such as:
|
• |
refinancing or restructuring our debt; |
|
• |
selling assets; or |
|
• |
seeking to raise additional capital. |
We cannot assure you that we would be able to enter into these alternative financing plans on commercially reasonable terms or at all. Moreover, any alternative financing plans that we may be required to undertake would still not guarantee that we would be able to meet our debt obligations. Our inability to generate sufficient cash flow to satisfy our debt obligations, or to obtain alternative financing, could materially and adversely affect our business, results of operations, financial condition and business prospects. See “Management’s Discussion and Analysis of Financial Condition and Results of Operations—Liquidity and Capital Resources.”
We will need to repay or refinance borrowings under our Amended and Restated Senior Secured Credit Facilities.
The Amended and Restated Term Loan Facility and the Amended and Restated Revolving Credit Facility are scheduled to mature in May 2024 and May 2022, respectively. As of December 31, 2017, we had $562.2 million of borrowings outstanding under the Amended and Restated Term Loan Facility, with $149.1 million in additional borrowing capacity under the Amended and Restated Revolving Credit Facility (after giving effect to $0.9 million of outstanding letters of credit).
Our ability to repay, refinance, replace or extend these facilities by their maturity dates will be dependent on, among other things, business conditions, our financial performance and the general condition of the financial markets. If a financial disruption were to occur at the time that we are required to repay indebtedness outstanding under our Amended and Restated Senior Secured Credit Facilities, we could be forced to undertake alternate financings, negotiate for an extension of the maturity of our Amended and Restated Senior Secured Credit Facilities or sell assets and delay capital expenditures in order to generate proceeds that could be used to repay indebtedness under our Amended and Restated Senior Secured Credit Facilities. We cannot assure you that we will be able to consummate any such transaction on terms that are commercially reasonable, on terms acceptable to us or at all.
Our variable rate indebtedness subjects us to interest rate risk, which could cause our debt service obligations to increase significantly.
Borrowings under our Amended and Restated Senior Secured Credit Facilities are at variable rates of interest and expose us to interest rate risk. Interest rates are still low on a historical basis and are projected to rise in the future. If interest rates rise, our debt service obligations on the variable rate indebtedness will increase even though the amount borrowed may remain the same, and our net income and cash flows will correspondingly decrease. Assuming no prepayments of the Amended and Restated Term Loan Facility (under which we had $562.2 million of borrowings outstanding as of December 31, 2017) and that the $150.0 million Amended and Restated Revolving Credit Facility is fully drawn (and to the extent that LIBOR is in excess of the floor rate of our Amended and Restated Senior Secured Credit Facilities), each 0.125% change in interest rates would result in a $1.4 million change in annual interest expense on the indebtedness under our Amended and Restated Senior Secured Credit Facilities.
In March 2014, we entered into forward interest rate swap and floor contracts effectively converting the interest ratio on $100.0 million of borrowings under the Amended and Restated Senior Secured Credit Facilities from a floating to a fixed rate in order to reduce interest rate volatility. The contracts have effective dates of December 31, 2015. Any swaps we enter into have costs associated with them and may not fully or effectively mitigate our interest rate risk. See “Management’s Discussion and Analysis of Financial Condition and Results of Operations—Liquidity and Capital Resources—Interest Rate Swap and Floor” in this Annual Report on Form 10-K for additional details regarding these instruments.
24
The covenants in our Amended and Restated Senior Secured Credit Facilities impose restrictions that may limit our operating and financial flexibility.
Our Amended and Restated Senior Secured Credit Facilities contain a number of significant restrictions and covenants that limit our ability, among other things, to:
|
• |
incur additional indebtedness; |
|
• |
pay dividends or distributions on our capital stock or repurchase or redeem our capital stock; |
|
• |
prepay, redeem or repurchase specified indebtedness; |
|
• |
create certain liens; |
|
• |
sell, transfer or otherwise convey certain assets; |
|
• |
make certain investments; |
|
• |
create dividend or other payment restrictions affecting subsidiaries; |
|
• |
engage in transactions with affiliates; |
|
• |
create unrestricted subsidiaries; |
|
• |
consolidate, merge or transfer all or substantially all of our assets or the assets of our subsidiaries; |
|
• |
enter into agreements containing certain prohibitions affecting us or our subsidiaries; and |
|
• |
enter into new lines of business. |
In addition, the Amended and Restated Revolving Credit Facility contains a financial covenant requiring us to comply with a 5.50 to 1.00 total first lien net secured leverage ratio test. This financial covenant is tested quarterly if the aggregate amount of revolving loans, swingline loans and letters of credit outstanding under the Amended and Restated Revolving Credit Facility (net of up to $10.0 million of outstanding letters of credit) exceeds 35% of the total commitments thereunder.
These covenants could materially and adversely affect our ability to finance our future operations or capital needs. Furthermore, they may restrict our ability to expand and pursue our business strategies and otherwise conduct our business. Our ability to comply with these covenants may be affected by circumstances and events beyond our control, such as prevailing economic conditions and changes in regulations, and we cannot assure you that we will be able to comply with such covenants. These restrictions also limit our ability to obtain future financings to withstand a future downturn in our business or the economy in general. In addition, complying with these covenants may also cause us to take actions that may make it more difficult for us to successfully execute our business strategy and compete against companies that are not subject to such restrictions.
A breach of any covenant in our Amended and Restated Senior Secured Credit Facilities or the agreements and indentures governing any other indebtedness that we may have outstanding from time to time would result in a default under that agreement or indenture after any applicable grace periods. A default, if not waived, could result in acceleration of the debt outstanding under the agreement and in a default with respect to, and an acceleration of, the debt outstanding under other debt agreements. If that occurs, we may not be able to make all of the required payments or borrow sufficient funds to refinance such debt. Even if new financing were available at that time, it may not be on terms that are acceptable to us or terms as favorable as our current agreements. If our debt is in default for any reason, our business, results of operations and financial condition could be materially and adversely affected.
Risks Relating to Ownership of Our Common Stock
The market price of our common stock may be highly volatile, and you may not be able to resell your shares at or above the price you paid.
Our common stock has only been listed for public trading on the New York Stock Exchange since April 28, 2017. The trading price of our common stock may be volatile. Securities markets worldwide experience significant price and volume fluctuations. This market volatility, as well as other general economic, market or political
25
conditions, could reduce the market price of our common shares in spite of our operating performance. The following factors, in addition to other factors described in this “Risk Factors” section and elsewhere in this Annual Report on Form 10-K, may have a significant impact on the market price of our common stock:
|
• |
negative trends in global economic conditions and/or activity levels in our industry sectors; |
|
• |
changes in consumer needs, expectations or trends; |
|
• |
our ability to implement our business strategy; |
|
• |
our ability to complete and integrate new acquisitions; |
|
• |
actual or anticipated fluctuations in our quarterly or annual operating results; |
|
• |
trading volume of our common stock; |
|
• |
sales of our common stock by us, our executive officers and directors or our stockholders (including certain affiliates of Onex) in the future; and |
|
• |
general economic and market conditions and overall fluctuations in the U.S. equity markets. |
In addition, broad market and industry factors may negatively affect the market price of our common stock, regardless of our actual operating performance, and factors beyond our control may cause our stock price to decline rapidly and unexpectedly. We are exposed to the impact of any global or domestic economic disruption, including any potential impact of the vote by the United Kingdom to exit the European Union, commonly referred to as “Brexit.” Furthermore, the stock market has experienced extreme volatility that, in some cases, has been unrelated or disproportionate to the operating performance of particular companies.
We may be subject to securities litigation, which is expensive and could divert management attention.
Our share price may be volatile and, in the past, companies that have experienced volatility in the market price of their stock have been subject to securities class action litigation. We may be the target of this type of litigation in the future. Litigation of this type could result in substantial costs and diversion of management’s attention and resources, which could have a material adverse effect on our business, financial condition and results of operations. Any adverse determination in litigation could also subject us to significant liabilities.
Because Onex controls the majority of our common stock, it may control all major corporate decisions and its interests may conflict with the interests of other holders of our common stock.
As of December 31, 2017, Onex beneficially owned approximately 53.8 million shares of our common stock, representing approximately 74% of our outstanding common stock. Accordingly, for so long as Onex continues to hold the majority of our common stock, Onex will exercise a controlling influence over our business and affairs and will have the power to determine all matters submitted to a vote of our stockholders, including the election of directors and approval of significant corporate transactions such as amendments to our certificate of incorporation, mergers and the sale of all or substantially all of our assets. Onex could cause corporate actions to be taken that conflict with the interests of our other stockholders. This concentration of ownership could have the effect of deterring or preventing a change in control transaction that might otherwise be beneficial to our stockholders. In addition, Onex may in the future own businesses that directly compete with ours.
Our directors who have relationships with Onex may have conflicts of interest with respect to matters involving us.
Two of our seven directors are affiliated with Onex. These persons have fiduciary duties to both us and Onex. As a result, they may have real or apparent conflicts of interest on matters affecting both us and Onex, which in some circumstances may have interests adverse to ours. Onex is in the business of making or advising on investments in companies and may hold, and may from time to time in the future acquire, interests in, or provide advice to, businesses that directly or indirectly compete with certain portions of our business or that are suppliers or customers of ours. In addition, as a result of Onex’ ownership interest, conflicts of interest could arise with respect to transactions involving business dealings between us and Onex including potential acquisitions of businesses or properties, the issuance of additional securities, the payment of dividends by us and other matters. In January 2018,
26
Onex completed its acquisition of SMG Holdings Inc. (“SMG”), a leading global manager of convention centers, stadiums, arenas, theaters, performing arts centers and other venues. Certain of our events are staged in SMG managed venues and one of our directors affiliated with Onex is also a director of SMG.
In addition, our amended and restated certificate of incorporation provides that the doctrine of “corporate opportunity” does not apply with respect to us, to Onex or certain related parties or any of our directors who are employees of Onex or its affiliates such that Onex and its affiliates are permitted to invest in competing businesses or do business with our customers. Under the amended and restated certificate of incorporation, subject to the limitations set forth therein, Onex is not required to tell us about a corporate opportunity, may pursue that opportunity for itself or it may direct that opportunity to another person without liability to our stockholders. To the extent they invest in such other businesses, Onex may have differing interests than our other stockholders.
We are a “controlled company” within the meaning of the rules of the New York Stock Exchange and, as a result, rely on exemptions from certain corporate governance requirements.
Onex owns the majority of our outstanding common stock. As a result, we are a “controlled company” within the meaning of the New York Stock Exchange corporate governance standards. A company of which more than 50% of the combined voting power is held by an individual, a group or another company is a “controlled company” within the meaning of the rules of the New York Stock Exchange and may elect not to comply with certain corporate governance requirements of the New York Stock Exchange, including:
|
• |
the requirement that a majority of our board consist of independent directors; |
|
• |
the requirement that we have a nominating and corporate governance committee that is composed entirely of independent directors; |
|
• |
the requirement that we have a compensation committee that is composed entirely of independent directors; and |
|
• |
the requirement for an annual performance evaluation of the nominating and corporate governance committee and compensation committee. |
We currently rely on certain of the exemptions listed above. Accordingly, while we currently have a majority of independent directors, our nominating and corporate governance and compensation committees do not consist entirely of independent directors. The independence standards are intended to ensure that directors who meet those standards are free of any conflicting interest that could influence their actions as directors. Accordingly, our shareholders will not have the same protections afforded to stockholders of companies that are subject to all of the corporate governance requirements of the New York Stock Exchange. In addition, Rule 10C-1 under the Securities Exchange Act of 1934, as amended (the “Exchange Act”), as adopted by the national securities exchanges, requires, among other things, that:
|
• |
compensation committees be composed of fully independent directors, as determined pursuant to new and existing independence requirements; |
|
• |
compensation committees be explicitly charged with hiring and overseeing compensation consultants, legal counsel and other committee advisers; and |
|
• |
compensation committees are required to consider, when engaging compensation consultants, legal counsel or other advisers, certain independence factors, including factors that examine the relationship between the consultant or adviser’s employer and us. |
As a “controlled company”, we are not subject to these compensation committee independence requirements, and accordingly, our shareholders will not have the same protections afforded to stockholders of companies that are subject to these compensation committee independence requirements.
27
Taking advantage of the reduced disclosure requirements applicable to “emerging growth companies” may make our common stock less attractive to investors.
The Jumpstart Our Business Startups Act of 2012 (the “JOBS Act”) provides that, so long as a company qualifies as an “emerging growth company,” it will, among other things:
|
• |
be exempt from the provisions of Section 404(b) of the Sarbanes-Oxley Act requiring that its independent registered public accounting firm provide an attestation report on the effectiveness of its internal control over financial reporting; |
|
• |
be exempt from the “say on pay” and “say on golden parachute” advisory vote requirements of the Dodd-Frank Wall Street Reform and Customer Protection Act (the “Dodd-Frank Act”); |
|
• |
be exempt from certain disclosure requirements of the Dodd-Frank Act relating to compensation of its executive officers and be permitted to omit the detailed compensation discussion and analysis from proxy statements and reports filed under the Exchange Act; and |
|
• |
be exempt from any rules that may be adopted by the Public Company Accounting Oversight Board requiring mandatory audit firm rotations or a supplement to the auditor’s report on the financial statements. |
We intend to continue to take advantage of each of the exemptions described above. We have irrevocably elected not to take advantage of the extension of time to comply with new or revised financial accounting standards available under Section 107(b) of the JOBS Act. We could be an emerging growth company for up to five years after the IPO. We cannot predict if investors will find our common stock less attractive if we elect to rely on these exemptions, or if taking advantage of these exemptions will result in less active trading or more volatility in the price of our common stock.
We have incurred and will continue to incur increased costs as a result of becoming a public company and in the administration of our organizational structure.
As a newly public company, we have incurred and will continue to incur significant legal, accounting, insurance and other expenses that we did not incur as a private company, including costs associated with public company reporting requirements. We also have incurred and will incur costs associated with the Sarbanes-Oxley Act and related rules implemented by the SEC. We have incurred and will continue to incur ongoing periodic expenses in connection with the administration of our organizational structure. The expenses incurred by public companies generally for reporting and corporate governance purposes have been increasing. We expect these rules and regulations to increase our expenses related to insurance, legal, accounting, financial and compliance activities, as well as other expenses, and to make some activities more time-consuming and costly, although we are currently unable to estimate these costs with any degree of certainty. These laws and regulations could also make it more difficult or costly for us to obtain certain types of insurance, including director and officer liability insurance, and we may be forced to accept reduced policy limits and coverage or incur substantially higher costs to obtain the same or similar coverage. These laws and regulations could also make it more difficult for us to attract and retain qualified persons to serve on our board of directors, our board committees or as our executive officers. Furthermore, if we are unable to satisfy our obligations as a public company, we could be subject to delisting of our common stock, fines, sanctions and other regulatory action and potentially civil litigation.
We previously identified a material weakness in our internal control over financial reporting. If we experience additional material weaknesses in the future or otherwise fail to maintain an effective system of internal controls over financial reporting in the future, our ability to prevent or detect a material misstatement in our financial statements could be adversely affected.
A “material weakness” is a deficiency, or a combination of deficiencies, in internal control over financial reporting such that there is a reasonable possibility that a material misstatement of a company’s annual or interim financial statements will not be prevented or detected on a timely basis. In the period ended June 30, 2014, our management identified a material weakness related to the calculation of deferred tax liabilities. This material weakness was remediated in 2015.
While we believe that this previously identified material weakness has been remediated, if other material weaknesses or other deficiencies arise in the future, there may be a reasonable possibility that a material
28
misstatement of the Company’s annual or interim financial statements will not be prevented or detected on a timely basis, which could cause our reported financial results to be materially misstated and require restatement.
Failure to establish and maintain effective internal controls in accordance with Section 404 of the Sarbanes- Oxley Act could have a material adverse effect on our business and stock price.
We are required to comply with the SEC’s rules implementing Sections 302 and 404 of the Sarbanes-Oxley Act, which require management to certify financial and other information in our quarterly and annual reports and provide an annual management report on the effectiveness of controls over financial reporting. Though we are required to disclose changes made in our internal controls and procedures on a quarterly basis, we will not be required to make our first annual assessment of our internal control over financial reporting pursuant to Section 404 until the fiscal year ended December 31, 2018. However, as an emerging growth company, our independent registered public accounting firm will not be required to attest to the effectiveness of our internal control over financial reporting pursuant to Section 404 until the earlier of the fiscal year ended December 31, 2022 or the date we are no longer an emerging growth company. At such time, our independent registered public accounting firm may issue a report that is adverse in the event it is not satisfied with the level at which our controls are documented, designed or operating.
To comply with the requirements of becoming a public company, we have undertaken various actions, and will need to take additional actions, such as implementing numerous internal controls and procedures and hiring additional accounting or internal audit staff or consultants. We have hired a third-party service provider to assist us with implementation of our internal audit function. Testing and maintaining internal control can divert our management’s attention from other matters that are important to the operation of our business. Additionally, when evaluating our internal control over financial reporting, we may identify material weaknesses that we may not be able to remediate in time to meet the applicable deadline imposed upon us for compliance with the requirements of Section 404. If we identify any material weaknesses in our internal control over financial reporting or are unable to comply with the requirements of Section 404 in a timely manner or assert that our internal control over financial reporting is effective, or if our independent registered public accounting firm is unable to express an opinion as to the effectiveness of our internal control over financial reporting once we are no longer an emerging growth company, investors may lose confidence in the accuracy and completeness of our financial reports and the market price of our common stock could be negatively affected, and we could become subject to investigations by the New York Stock Exchange, the SEC or other regulatory authorities, which could require additional financial and management resources. In addition, if we fail to remedy any material weakness, our financial statements could be inaccurate and we could face restricted access to capital markets.
Future sales, or the perception of the potential for future sales, of the shares of our common stock in the public market by us or our existing stockholders could cause our stock price to fall.
As of December 31, 2017, we had 72,603,826 shares of common stock outstanding. Of these securities, approximately 18.3 million shares of common stock are freely tradable without restriction or further registration under federal securities laws. The approximately 54.3 million shares of common stock owned by our officers, directors and affiliates, as that term is defined in the Securities Act of 1933, as amended (the “Securities Act”), are “restricted securities” under the Securities Act. Restricted securities may not be sold in the public market unless the sale is registered under the Securities Act or an exemption from registration is available.
Our employees, officers and directors may elect to sell shares of our common stock in the market. Sales of a substantial number of shares of our common stock in the public market could depress the market price of our common stock and impair our ability to raise capital through the sale of additional equity securities.
In the future, we may issue securities to raise cash for acquisitions or otherwise. We may also acquire interests in other companies by using a combination of cash and our common stock or just our common stock. We may also issue securities convertible into our common stock. Any of these events may dilute your ownership interest in our company and have an adverse impact on the price of our common stock.
29
If securities or industry analysts cease publishing research or reports about us, our business, or our market, or if they adversely change their recommendations or publish negative reports regarding our business or our stock, our stock price and trading volume could decline.
The trading market for our common stock will be influenced by the research and reports that industry or securities analysts may publish about us, our business, our market, or our competitors. We do not have any control over these analysts and we cannot provide any assurance that analysts will cover us or provide favorable coverage. If any of the analysts who may cover us adversely change their recommendation regarding our stock, or provide more favorable relative recommendations about our competitors, our stock price could decline. If any analyst who may cover us were to cease coverage of our company or fail to regularly publish reports on us, we could lose visibility in the financial markets, which in turn could cause our stock price or trading volume to decline.
We cannot assure you that we will continue to pay dividends on our common stock, and our indebtedness could limit our ability to pay dividends on our common stock.
We paid a dividend of $0.07 per share in the second, third and fourth quarters of 2017. On January 26, 2018, our board of directors approved the payment of a cash dividend of $0.07 per share for the quarter ending March 31, 2018 to holders of record of the Company’s common stock. The dividend is expected to be paid on or about February 23, 2018 to holders of record of our common stock as of February 9, 2018. The payment of cash dividends in future quarters is subject to the discretion of our board of directors and our compliance with applicable law, and depending on, among other things, our results of operations, capital requirements, financial condition, contractual restrictions, restrictions in our debt agreements and in any equity securities, business prospects and other factors that our board of directors may deem relevant. Because we are a holding company and have no direct operations, we expect to pay dividends, if any, only from funds we receive from our subsidiaries, which may further restrict our ability to pay dividends as a result of the laws of their jurisdiction of organization, agreements of our subsidiaries or covenants under any existing and future outstanding indebtedness we or our subsidiaries incur. Our Amended and Restated Senior Secured Credit Facilities restrict our ability to pay dividends on our common stock. We expect that any future agreements governing indebtedness will contain similar restrictions. For more information, see “Management’s Discussion and Analysis of Financial Condition and Results of Operations—Liquidity and Capital Resources—Dividend Policy” and “Management’s Discussion and Analysis of Financial Condition and Results of Operations—Long-Term Debt.”
Our dividend policy entails certain risks and limitations, particularly with respect to our liquidity. By paying cash dividends rather than investing that cash in our business or repaying debt, we risk, among other things, slowing the pace of our growth and having insufficient cash to fund our operations or unanticipated capital expenditures or limiting our ability to incur additional borrowings.
Although we expect to continue to pay dividends according to our dividend policy, we may not pay dividends according to our policy, or at all, if, among other things, we do not have the cash necessary to pay our intended dividends. The declaration and payment of dividends will be determined at the discretion of our board of directors, acting in compliance with applicable law and contractual restrictions.
Some provisions of our charter documents and Delaware law may have anti-takeover effects that could discourage an acquisition of us by others, even if an acquisition would be beneficial to our stockholders, and may prevent attempts by our stockholders to replace or remove our current management.
Provisions in our amended and restated certificate of incorporation and our amended and restated bylaws, as well as provisions of the Delaware General Corporation Law (the “DGCL”), could make it more difficult for a third party to acquire us or increase the cost of acquiring us, even if doing so would benefit our stockholders, including in transactions in which stockholders might otherwise receive a premium for their shares. Among other things, our amended and restated certificate of incorporation and amended and restated bylaws:
|
• |
authorize the issuance of blank check preferred stock that our board of directors could issue in order to increase the number of outstanding shares and discourage a takeover attempt; |
|
• |
divide our board of directors into three classes with staggered three-year terms; |
|
• |
limit the ability of stockholders to remove directors to permit removals only “for cause” once Onex ceases to own more than 50% of all our outstanding common stock; |
30
|
• |
prohibit our stockholders from calling a special meeting of stockholders once Onex ceases to own more than 50% of all our outstanding common stock; |
|
• |
prohibit stockholder action by written consent once Onex ceases to own more than 50% of all our outstanding common stock, which will require that all stockholder actions be taken at a duly called meeting of our stockholders; |
|
• |
provide that our board of directors is expressly authorized to adopt, alter, or repeal our amended and restated bylaws; |
|
• |
establish advance notice requirements for nominations for election to our board of directors or for proposing matters that can be acted upon by stockholders at stockholder meetings; and |
|
• |
require the approval of holders of at least two-thirds of the outstanding shares of common stock to amend our amended and restated bylaws and certain provisions of our amended and restated certificate of incorporation if Onex ceases to own more than 50% of all our outstanding common stock. |
These anti-takeover defenses could discourage, delay or prevent a transaction involving a change in control of our company. These provisions could also discourage proxy contests and make it more difficult for you and other stockholders to elect directors of your choosing and cause us to take corporate actions other than those you desire.
Our amended and restated certificate of incorporation provides, subject to limited exceptions, that the Court of Chancery of the State of Delaware will be the exclusive forum for substantially all disputes between us and our stockholders, which could limit our stockholders’ ability to obtain a favorable judicial forum for disputes with us or our directors, officers or employees.
Our amended and restated certificate of incorporation provides, subject to limited exceptions, unless we consent to an alternative forum, that the Court of Chancery of the State of Delaware shall be the sole and exclusive forum for (i) any derivative action or proceeding brought on our behalf, (ii) any action asserting a claim of breach of a fiduciary duty owed by any director, officer, stockholder, employee or agent of the Company to us or our stockholders, (iii) any action asserting a claim against us, or our directors, officers or other employees, arising pursuant to any provision of the DGCL, our amended and restated certificate of incorporation or our amended and restated bylaws, or (iv) any action asserting a claim against us, or our directors, officers, stockholders or other employees, governed by the internal affairs doctrine. The choice of forum provision may limit a stockholder’s ability to bring a claim in a judicial forum that it finds favorable for disputes with us or our directors, officers or other employees, which may discourage such lawsuits against us and our directors, officers and other employees. Alternatively, if a court were to find the choice of forum provision contained in our amended and restated certificate of incorporation to be inapplicable or unenforceable in an action, we may incur additional costs associated with resolving such action in other jurisdictions, which could adversely affect our business and financial condition.
Because we are a holding company with no operations of our own, we rely on dividends, distributions, and transfers of funds from our subsidiaries.
We are a holding company that conducts all of our operations through subsidiaries. Consequently, we rely on dividends or advances from our subsidiaries. The ability of such subsidiaries to pay dividends to us is subject to applicable local law and may be limited due to terms of other contractual arrangements, including our indebtedness. See “Management’s Discussion and Analysis of Financial Condition and Results of Operations—Long-Term Debt.” Such laws and restrictions would restrict our ability to continue operations. In addition, Delaware law may impose requirements that may restrict our ability to pay dividends to holders of our common stock.
31
Item 1B. Unresolved Staff Comments.
None.
We have four key offices located in San Juan Capistrano, California; Alpharetta, Georgia; New York, New York; and Culver City, California. We also have several other smaller locations throughout the United States, including in White Plains, New York; Chicago, Illinois; Toledo, Ohio; Rye, New Hampshire; and Louisville, Kentucky. We lease our offices from third parties on market terms and, in some cases following an acquisition, through transition services agreements with the applicable seller.
From time to time, we may be involved in general legal disputes arising in the ordinary course of our business. We are not currently involved in legal proceedings that could reasonably be expected to have a material adverse effect on our business, financial condition or results of operations.
Item 4. Mine Safety Disclosures.
None.
32
Item 5. Market for Registrant’s Common Equity, Related Stockholder Matters and Issuer Purchases of Equity Securities.
Market Information for Common Stock, Holders of Record and Dividends
On May 3, 2017, we closed our IPO at an initial offering price of $17.00 per share. Prior to that time, there was no public market for our stock. Our common stock is listed on the New York Stock Exchange and trades under the symbol "EEX". The approximate number of record holders of our common stock on February 19, 2018 was 25. Because many of our shares of common stock are held by brokers and other institutions on behalf of stockholders, we are unable to estimate the total number of stockholders represented by these record holders. High and low stock prices for each quarterly period where there was a public market for our stock in the last two years were as follows:
|
|
|
2017 |
|
|
|||||
|
|
|
High |
|
|
Low |
|
|
||
|
Quarter ended June 30 (beginning on April 28, 2017) |
|
$ |
23.37 |
|
|
$ |
18.67 |
|
|
|
Quarter ended September 30, |
|
$ |
23.43 |
|
|
$ |
20.99 |
|
|
|
Quarter ended December 31, |
|
$ |
24.56 |
|
|
$ |
19.75 |
|
|
We declared and paid three quarterly cash dividends of $0.07 per share in each of the second, third and fourth quarters of 2017, totaling $15.2 million for the year ended December 31, 2017. We intend to pay quarterly cash dividends on our common stock. The payment of dividends in future quarters is subject to the discretion of our board of directors and depending upon results of operations, cash requirements, financial conditions, contractual restrictions imposed by applicable laws and other factors that our board of directors may deem relevant. Based on the 72,603,826 shares of common stock outstanding as of December 31, 2017, this dividend policy implies a quarterly cash requirement of approximately $5.1 million (or an annual cash requirement of approximately $20.3 million), which amount may be changed or terminated in the future at any time and for any reason without advance notice.
33
The following performance graph and related information shall not be deemed “soliciting material” or “filed” with the SEC, nor shall such information be incorporated by reference into any future filing under the Securities Act of 1933, or the Securities Exchange Act of 1934, each as amended, except to the extent that it is specifically incorporated by reference into such filing.
The following graph compares the yearly percentage change in the cumulative total stockholder return on our common stock with corresponding changes in the cumulative total returns of the Russell 2000 Index and the Dow Jones Business Support Services Index for the period from April 28, 2017, the first day our stock began trading on the New York Stock Exchange, through December 31, 2017. The comparison assumes an initial investment of $100 at the close of business on April 28, 2017 in our stock and in each of the indices and also assumes the reinvestment of dividends where applicable. This historical performance is not necessarily indicative of future performance.
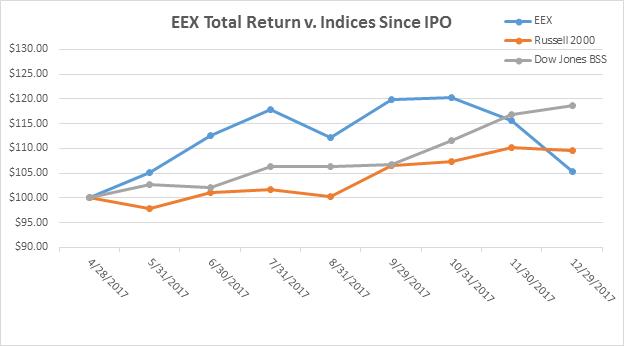
Item 6. Selected Financial Data.
The following table presents selected consolidated financial data for the periods and at the dates indicated. The selected consolidated financial data as of December 31, 2017, 2016 and 2015, and for the years ended December 31, 2017, 2016, 2015 and 2014, have been derived from our audited consolidated financial statements. This financial data should be read in conjunction with the consolidated financial statements, related notes, “Management’s Discussion and Analysis of Financial Condition and Results of Operations” and other financial information appearing elsewhere in this Annual Report on Form 10-K.
34
The following information should be read in conjunction with “Management’s Discussion and Analysis of Financial Condition and Results of Operations”, “Business” and our consolidated financial statements and related accompanying notes included elsewhere in this Annual Report on Form 10-K.
|
|
|
Year Ended December 31, |
|
|||||||||||||
|
|
|
2017(1) |
|
|
2016(1) |
|
|
2015(1) |
|
|
2014(1) |
|
||||
|
|
(dollars in millions, except per share data) |
|
||||||||||||||
|
Statement of income (loss) and comprehensive income (loss) data: |
|
|
|
|
|
|
|
|
|
|
|
|
|
|
|
|
|
Revenue |
|
$ |
341.7 |
|
|
$ |
323.7 |
|
|
$ |
306.4 |
|
|
$ |
273.5 |
|
|
Other income |
|
|
6.5 |
|
|
|
— |
|
|
|
— |
|
|
|
— |
|
|
Cost of revenues |
|
|
95.0 |
|
|
|
84.4 |
|
|
|
83.4 |
|
|
|
82.2 |
|
|
Selling, general and administrative expenses(2) |
|
|
121.9 |
|
|
|
98.9 |
|
|
|
93.1 |
|
|
|
90.8 |
|
|
Depreciation and amortization expense |
|
|
43.2 |
|
|
|
40.0 |
|
|
|
39.1 |
|
|
|
37.5 |
|
|
Intangible asset impairment charge(3) |
|
|
— |
|
|
|
— |
|
|
|
8.9 |
|
|
|
— |
|
|
Operating income |
|
|
88.1 |
|
|
|
100.4 |
|
|
|
81.9 |
|
|
|
63.0 |
|
|
Interest expense |
|
|
38.3 |
|
|
|
51.4 |
|
|
|
52.0 |
|
|
|
56.0 |
|
|
Loss on extinguishment of debt(4) |
|
|
3.0 |
|
|
|
12.8 |
|
|
|
— |
|
|
|
1.9 |
|
|
Income before income taxes |
|
|
46.8 |
|
|
|
36.2 |
|
|
|
29.9 |
|
|
|
5.1 |
|
|
(Benefit from) provision for income taxes |
|
|
(35.0 |
) |
|
|
14.0 |
|
|
|
10.3 |
|
|
|
12.7 |
|
|
Net income (loss) and comprehensive income (loss) |
|
$ |
81.8 |
|
|
$ |
22.2 |
|
|
$ |
19.6 |
|
|
$ |
(7.6 |
) |
|
|
|
|
|
|
|
|
|
|
|
|
|
|
|
|
|
|
|
Net income (loss) per share attributable to common stockholders(5) |
|
|
|
|
|
|
|
|
|
|
|
|
|
|
|
|
|
Basic |
|
$ |
1.19 |
|
|
$ |
0.36 |
|
|
$ |
0.32 |
|
|
$ |
(0.12 |
) |
|
Diluted |
|
$ |
1.13 |
|
|
$ |
0.35 |
|
|
$ |
0.31 |
|
|
$ |
(0.12 |
) |
|
Weighted average common shares outstanding(5) |
|
|
|
|
|
|
|
|
|
|
|
|
|
|
|
|
|
Basic |
|
|
68,912 |
|
|
|
61,859 |
|
|
|
61,847 |
|
|
|
60,978 |
|
|
Diluted |
|
|
72,116 |
|
|
|
63,294 |
|
|
|
62,516 |
|
|
|
60,978 |
|
|
Dividends declared per common share |
|
$ |
0.21 |
|
|
|
— |
|
|
|
— |
|
|
|
— |
|
|
|
|
|
|
|
|
|
|
|
|
|
|
|
|
|
|
|
|
Statement of cash flows data: |
|
|
|
|
|
|
|
|
|
|
|
|
|
|
|
|
|
Net cash provided by operating activities |
|
$ |
110.8 |
|
|
$ |
93.0 |
|
|
$ |
87.8 |
|
|
$ |
72.7 |
|
|
Net cash used in investing activities |
|
$ |
(95.5 |
) |
|
$ |
(51.9 |
) |
|
$ |
(87.0 |
) |
|
$ |
(335.7 |
) |
|
Net cash (used in) provided by financing activities |
|
$ |
(19.3 |
) |
|
$ |
(42.5 |
) |
|
$ |
(26.3 |
) |
|
$ |
282.5 |
|
|
|
|
As of December 31, |
|
|||||||||
|
|
|
2017 |
|
|
2016 |
|
|
2015 |
|
|||
|
|
|
(dollars in millions) |
|
|||||||||
|
Balance sheet data: |
|
|
|
|
|
|
|
|
|
|
|
|
|
Cash and cash equivalents |
|
$ |
10.9 |
|
|
$ |
14.9 |
|
|
$ |
16.3 |
|
|
Total assets(6) |
|
$ |
1,637.9 |
|
|
$ |
1,572.5 |
|
|
$ |
1,538.1 |
|
|
Total debt(7) |
|
$ |
554.2 |
|
|
$ |
702.1 |
|
|
$ |
731.6 |
|
|
Total liabilities |
|
$ |
876.6 |
|
|
$ |
1,044.8 |
|
|
$ |
1,035.6 |
|
35
|
acquisition on August 8, 2016, Digital Dealer since its acquisition on October 11, 2016, Pavement since its acquisition on October 18, 2016, RFID LIVE! since its acquisition on November 15, 2016 and ACRE since its acquisition on December 13, 2016. Financial data for the year ended December 31, 2015 includes the results of HCD Group since their acquisition on February 27, 2015, Pizza Group since their acquisition on March 3, 2015, HOW since its acquisition on October 14, 2015 and Fastener Expo since its acquisition on November 12, 2015. Financial data for the year ended December 31, 2014 includes the results of GLM since its acquisition on January 15, 2014. |
|
(2) |
Selling, general and administrative expenses for the years ended December 31, 2017, 2016, 2015 and 2014 included $23.4 million, $7.6 million, $5.1 million and $12.0 million, respectively, in acquisition-related transaction, transition and integration costs, including legal and advisory fees. Also included in selling, general and administrative expenses for the years ended December 31, 2017, 2016, 2015 and 2014 were stock-based compensation expenses of $2.4 million, $3.0 million, $5.1 million and $6.4 million, respectively. |
|
(3) |
The intangible asset impairment charge for the year ended December 31, 2015 was recorded to align the carrying value of indefinite-lived intangible assets with their implied fair value. No other impairment charges were recorded in 2015 including in connection with our annual test of goodwill for the year ended December 31, 2015. |
|
(4) |
On May 8, 2017, using the net proceeds to us from our IPO, we prepaid $159.2 million of borrowings under our term loan facility (as then in effect). On May 22, 2017, we refinanced our Senior Secured Credit Facilities with the Amended and Restated Senior Secured Credit Facility. In conjunction with the refinancing of our Senior Secured Credit Facilities, certain debtholders’ balances were fully extinguished. As a result, we wrote off unamortized deferred financing fees and original issuance discount of $1.4 million and $1.6 million, respectively, which were included in loss on extinguishment of debt in the consolidated statements of income and comprehensive income. |
On October 28, 2016, in connection with the Third Amendment to our Senior Secured Credit Facilities (the “Third Amendment”), we redeemed all of our $200.0 million aggregate principal amount 9.00% Senior Notes due 2021 (the “Senior Notes”) at a redemption price of 104.5%. The $9.0 million redemption premium was included in loss on extinguishment of debt in the consolidated statements of income and comprehensive income. Due to the extinguishment of the Senior Notes, we also wrote off $3.8 million of outstanding deferred financing fees which were included in loss on extinguishment of debt in the consolidated statements of income and comprehensive income.
On July 21, 2014, we entered into the Second Amendment to the Senior Secured Credit Facilities (the “Second Amendment”) which re-priced the facility by lowering the interest rate and LIBOR floor rate. We applied debt modification accounting guidance and determined the modification was significant for several lenders in the term facility syndicate. Therefore, $1.9 million of deferred financing fees and original issue discount was written off in the third quarter of 2014.
|
(5) |
Reflects the 125-for-one stock split of our common stock that occurred on April 10, 2017. |
|
(6) |
As of December 31, 2017, total assets included goodwill of $993.7 million and other intangible assets, net, of $545.0 million. As of December 31, 2016, total assets included goodwill of $930.3 million and other intangible assets, net, of $541.2 million. As of December 31, 2015, total assets included goodwill of $890.3 million and other intangible assets, net, of $559.4 million. |
|
(7) |
As of December 31, 2017, total debt of $554.2 million consisted of $562.2 million of borrowings outstanding under the Amended and Restated Term Loan Facility, net of unamortized deferred financing fees of $4.4 million and unamortized original issue discount of $3.6 million. As of December 31, 2016, total debt of $702.1 million consisted of $713.3 million of borrowings outstanding under our term loan facility (as then in effect), net of unamortized deferred financing fees of $5.2 million and unamortized original issue discount of $6.0 million. As of December 31, 2015, total debt of $731.6 million consisted of $550.3 million of borrowings outstanding under our term loan facility (as then in effect), net of unamortized deferred financing fees of $7.1 million and unamortized original issue discount of $7.2 million, and $195.7 million in aggregate principal amount of the Senior Notes, net of unamortized deferred financing fees of $4.3 million. |
36
Quarterly Results of Operations (Unaudited)
The following table sets forth our unaudited quarterly consolidated statements of operations data for each of the eight quarterly periods ended December 31, 2017. The information for each of these quarters has been prepared on the same basis as the audited annual consolidated financial statements included elsewhere in this Annual Report on Form 10-K and, in our opinion, includes all adjustments, consisting only of normal recurring adjustments, necessary for the fair statement of the results of operations for these periods. This information should be read in conjunction with our consolidated financial statements and related notes included elsewhere in this Annual Report on Form 10-K. These quarterly results are not necessarily indicative of our operating results for a full year or any future period.
|
|
|
Quarter Ended |
|
|
|||||||||||||||||||||||||||||
|
|
|
Dec. 31, 2017 |
|
|
Sept. 30, 2017 |
|
|
Jun. 30, 2017 |
|
|
Mar. 31, 2017 |
|
|
Dec. 31, 2016 |
|
|
Sept. 30, 2016 |
|
|
Jun. 30, 2016 |
|
|
Mar. 31, 2016 |
|
|
||||||||
|
|
|
|
|
|
|
(unaudited) |
|||||||||||||||||||||||||||
|
|
|
|
|
|
|
(dollars in millions) |
|||||||||||||||||||||||||||
|
Statement of income (loss) and comprehensive income (loss) data: |
|
|
|
|
|
|
|
|
|
|
|
|
|
|
|
|
|
|
|
|
|
|
|
|
|
|
|
|
|
|
|
|
|
|
Revenues |
|
$ |
31.5 |
|
|
$ |
100.4 |
|
|
$ |
74.1 |
|
|
$ |
135.7 |
|
|
$ |
30.4 |
|
|
$ |
100.5 |
|
|
$ |
65.0 |
|
|
$ |
127.8 |
|
|
|
Other income |
|
|
— |
|
|
|
6.5 |
|
|
|
— |
|
|
|
— |
|
|
|
— |
|
|
|
— |
|
|
|
— |
|
|
|
— |
|
|
|
Cost of revenues |
|
|
9.6 |
|
|
|
27.2 |
|
|
|
21.6 |
|
|
|
36.6 |
|
|
|
9.3 |
|
|
|
23.6 |
|
|
|
19.6 |
|
|
|
31.8 |
|
|
|
Selling, general and administrative expenses |
|
|
26.0 |
|
|
|
29.4 |
|
|
|
34.5 |
|
|
|
32.0 |
|
|
|
24.7 |
|
|
|
25.0 |
|
|
|
22.8 |
|
|
|
26.4 |
|
|
|
Depreciation and amortization expense |
|
|
10.9 |
|
|
|
10.9 |
|
|
|
10.8 |
|
|
|
10.6 |
|
|
|
10.2 |
|
|
|
10.0 |
|
|
|
9.9 |
|
|
|
9.9 |
|
|
|
Operating (loss) income |
|
|
(15.0 |
) |
|
|
39.4 |
|
|
|
7.2 |
|
|
|
56.5 |
|
|
|
(13.8 |
) |
|
|
41.9 |
|
|
|
12.7 |
|
|
|
59.7 |
|
|
|
Interest expense |
|
|
7.4 |
|
|
|
6.7 |
|
|
|
14.6 |
|
|
|
9.6 |
|
|
|
13.2 |
|
|
|
11.9 |
|
|
|
13.3 |
|
|
|
13.0 |
|
|
|
Loss on extinguishment of debt (1) |
|
|
— |
|
|
|
— |
|
|
|
3.0 |
|
|
|
— |
|
|
|
12.8 |
|
|
|
— |
|
|
|
— |
|
|
|
— |
|
|
|
(Loss) income before income taxes |
|
|
(22.4 |
) |
|
|
32.7 |
|
|
|
(10.4 |
) |
|
|
46.9 |
|
|
|
(39.8 |
) |
|
|
30.0 |
|
|
|
(0.6 |
) |
|
|
46.7 |
|
|
|
(Benefit from) provision for income taxes |
|
|
(62.7 |
) |
|
|
13.5 |
|
|
|
(4.3 |
) |
|
|
18.5 |
|
|
|
(15.7 |
) |
|
|
11.6 |
|
|
|
(0.2 |
) |
|
|
18.4 |
|
|
|
Net income (loss) and comprehensive income (loss) |
|
$ |
40.3 |
|
|
$ |
19.2 |
|
|
$ |
(6.1 |
) |
|
$ |
28.4 |
|
|
$ |
(24.1 |
) |
|
$ |
18.4 |
|
|
$ |
(0.4 |
) |
|
$ |
28.3 |
|
|
|
(1) |
During the fourth quarter of 2017, we identified a classification error related to certain debt extinguishment costs incurred as part of our debt refinancing in May 2017. Management considered both quantitative and qualitative factors in assessing the materiality of the classification error individually, and in the aggregate, and determined that the classification error was not material to interim periods. As such, we will revise the consolidated statements of income and comprehensive income for the interim periods ended June 30, 2017 and September 30, 2017 in the Company’s 2018 Quarterly Reports on Form 10-Q, to reflect a decrease to interest expense of $2.3 million and an increase to loss on extinguishment of debt of $2.8 million. The consolidated income statement for the three months ended June 30, 2017 in the table above as well as our audited consolidated statement of income and comprehensive income for the year ended December 31, 2017 appropriately reflect this classification. |
37
Item 7. Management’s Discussion and Analysis of Financial Condition and Results of Operations.
MANAGEMENT’S DISCUSSION AND ANALYSIS OF
FINANCIAL CONDITION AND RESULTS OF OPERATIONS
This discussion and analysis of the financial condition and results of our operations should be read in conjunction with “Item 6. Selected Financial and Operating Data” and our consolidated financial statements and related notes of Emerald Expositions Events, Inc. included in Item 15 of this Annual Report on Form 10-K. You should review “Item 1A. Risk Factors” section of this filing for a discussion of important factors that could cause actual results to differ materially from the results described in or implied by any forward-looking statements contained in the following discussion and analysis.
Recent Events
IPO
On May 3, 2017, we completed an initial public offering (the “IPO”) of 17,825,000 shares of our common stock at a price of $17.00 per share. We sold 10,333,333 shares of common stock in the IPO, resulting in net proceeds to us after underwriting discounts and expenses of $159.1 million, and funds managed by Onex sold 7,491,667 shares, from which we did not receive any proceeds. We used all of the net proceeds to us from the offering plus cash on hand, to prepay $159.2 million of borrowings outstanding under the Term Loan Facility (as defined below).
Refinancing
On May 22, 2017, our wholly owned subsidiary, Emerald Expositions Holding, Inc. (“EEH”), entered into an amendment and restatement of its senior secured credit facilities. The amended and restated senior secured credit facilities (the “Amended and Restated Senior Secured Credit Facilities”), which were entered into with a syndicate of lenders and Bank of America, N.A., as administrative agent, consist of (i) a seven-year $565.0 million senior secured term loan facility (the “Amended and Restated Term Loan Facility”), scheduled to mature on May 22, 2024 and (ii) a $150.0 million senior secured revolving credit facility (the “Amended and Restated Revolving Credit Facility”), scheduled to mature on May 23, 2022. On November 27, 2017, EEH entered into the Refinancing Agreement and First Amendment to Amended and Restated Credit Agreement to reduce the interest rate applicable to term loans under the Amended and Restated Term Loan Facility and on November 29, 2017, EEH entered into the Repricing Agreement and Second Amendment to Amended and Restated Credit Agreement to reduce the interest rate applicable to revolving loans under the Amended and Restated Revolving Credit Agreement. See “—Long-Term Debt.”
Cash Dividend
In connection with our IPO, we adopted a policy of paying quarterly cash dividends on our common stock. We paid a dividend of $0.07 per share in each of the second, third and fourth quarters of 2017. On January 26, 2018, our board of directors approved the payment of a cash dividend of $0.07 per share for the quarter ending March 31, 2018 to holders of record of our common stock. The dividend is expected to be paid on or about February 23, 2018 to holders of record of our common stock as of February 9, 2018.
Overview and Background
We are a leading operator of business-to-business trade shows in the United States. We currently operate more than 55 trade shows, as well as numerous other face-to-face events. In 2017, Emerald’s events connected over 500,000 global attendees and exhibitors and occupied more than 6.9 million net square feet of exhibition space. We have been recognized with many awards and accolades that reflect our industry leadership as well as the importance of our shows to the exhibitors and attendees we serve.
Our mission is to deliver value to our exhibitors and attendees by producing highly-relevant, industry-leading events that enhance the productivity of an industry’s participants and facilitate interaction between its most
38
influential stakeholders on a regular, scheduled basis. We currently operate trade shows within several diverse industry sectors including Gift, Home & General Merchandise; Sports; Design & Construction; Technology; Jewelry; and others including Photography, Food, Healthcare, Industrials and Military.
Acquisitions
We are focused on growing our national footprint through the acquisition of high-quality events that are leaders in their specific industry verticals. Since the Onex Acquisition in June 2013, we have completed 15 strategic acquisitions, with purchase prices, excluding the $335.0 million acquisition of GLM, ranging from approximately $5.0 million to approximately $36.0 million, and revenues ranging from approximately $1.3 million to approximately $15.1 million. Historically, we have completed acquisitions at EBITDA purchase multiples that are typically in the mid-to-high single digits. Our acquisitions have historically been structured as asset deals that have resulted in the generation of long-lived tax assets, which in turn have reduced our purchase multiples when incorporating the value of the created tax assets. In the future, we intend to look for acquisitions with similarly attractive valuation multiples. The 15 acquisitions we have completed are described as follows:
|
• |
GLM — Prior to its acquisition by Emerald Expositions in January 2014, GLM operated approximately 20 trade shows, including four of the largest 100 trade shows in the United States according to TSE. These trade shows serve industries as diverse as home furnishings, home textiles, stationery and paper products, giftware, tabletop, gourmet housewares, contemporary furniture and interiors, art & design, antiques & jewelry, fashion, board sports & resort lifestyle and eCommerce, and include the well-known NY NOW and Surf Expo brands. The acquisition of GLM substantially increased the scale and breadth of Emerald Expositions’ trade show portfolio. |
|
• |
Healthcare Design Conference and Expo, Healthcare Design Magazine, Environments for Aging and Construction SuperConference (collectively, “HCD Group”) — On February 27, 2015, we acquired these brands, which were previously operated by the Healthcare Media division of Vendome Group. Healthcare Design Conference and Expo is the industry’s best attended and most respected trade show/conference primarily focused on evidence-based design for healthcare facilities. In addition to the annual trade show and conference, the brand has a complementary magazine, Healthcare Design Magazine, education and sponsored events and an online presence that together engage the industry all year round. Environments for Aging is a complementary niche event within the broader healthcare vertical, focused on creating functional and attractive living environments that meet the needs of the aging population. Construction SuperConference is an event for lawyers providing services in commercial construction markets. |
|
• |
International Pizza Expo and Pizza Today magazine (“Pizza Group”) — On March 3, 2015, we acquired the International Pizza Expo, which was previously operated by Macfadden Communications Group. The International Pizza Expo is the largest trade show for independent pizzeria owners and operators in the United States, and Pizza Today is the partner magazine and leading publication in this industry. Operating in the $40 billion pizza restaurant industry, the International Pizza Expo ranks in the top 250 largest trade shows in the United States according to Trade Show News Network (“TSNN”). |
|
• |
HOW Design Live (“HOW”) — On October 14, 2015, we acquired HOW, which was previously operated by F+W Media, Inc. HOW is the largest graphic design conference and expo in the nation, combining seven separate conferences into a single event focused on creativity, business and inspiration for graphic designers. |
|
• |
The National Industrial Fastener & Mill Supply Expo (“Fastener Expo”) — On November 12, 2015, we acquired Fastener Expo from the show’s co-founders. Fastener Expo brings together manufacturers and master distributors of industrial fasteners, precision formed parts, fastener machinery and tooling and other related products and services with distributors and sales agents in the distribution chain. |
|
• |
The International Gift Exposition in the Smokies and the Souvenir Super Show (“IGES”) — On August 1, 2016, we acquired IGES from M&M Gift Shows, LLC. IGES is the largest dedicated gathering of wholesale souvenir, resort and gift buyers in the United States. |
39
|
West Coast. In January 2017, we launched an Active Collective event in New York. Active Collective is recognized as the first activewear-only trade show and is a leader in this fast-growing industry vertical. |
|
• |
Digital Dealer Conference & Expo (“Digital Dealer”) — On October 11, 2016, we acquired Digital Dealer from its founder. As the leading semi-annual trade show focused on the retail automotive industry’s digital strategy and operations, Digital Dealer is the premier venue to explore the implementation of digital components by auto dealers to engage their automotive consumer. In conjunction with the acquisition, we also acquired Dealer Magazine, a complementary magazine for automotive dealerships and franchises. |
|
• |
National Pavement Expo (“NPE”) — On October 18, 2016, we acquired NPE, which was previously operated by AC Business Media. NPE is the largest trade show focused on paving and pavement maintenance. |
|
• |
RFID Journal LIVE! (“RFID LIVE!”) — On November 15, 2016, we acquired RFID LIVE! from its founder. RFID LIVE! is the largest trade show that focuses on RFID technologies used to identify, track and manage corporate assets and inventory across a wide range of industries. |
|
• |
American Craft Retailers Expo (“ACRE”) — On December 13, 2016, we acquired ACRE from its founder. ACRE is a wholesale craft exposition, consisting of two shows that take place annually in Las Vegas and Philadelphia. |
|
• |
CEDIA Expo (“CEDIA”) — On January 25, 2017, we acquired the trade show CEDIA from its namesake association, Custom Electronic Design & Installation Association. CEDIA is the largest trade show in the home technology market, serving industry professionals that manufacture, design and integrate goods and services for the connected home. |
|
• |
The International Drone Conference & Exposition (“InterDrone”) — On March 10, 2017, we acquired the trade show InterDrone from BZ Media LLC. InterDrone is the leading commercial drone-focused show in the United States. |
|
• |
Snow Show — On May 24, 2017, we acquired the trade show Snow Show from SnowSports Industries America. When acquired, Snow Show was the largest snow sports industry event in North America and was ranked 67th in the TSNN Top 250 trade shows in the United States in 2016. Starting in January 2018, Snow Show will merge with OR to become Outdoor Retailer + Snow Show, endorsed and sponsored by SnowSports Industries America and OIA. |
|
• |
Connected Point Marketing Group (“CPMG”) – On November 29, 2017, we acquired CPMG from Corridor Capital, LLC, mezzanine investor Aldine Capital Partners and management. CPMG organizes and hosts nine senior executive level business-intensive trade events focused on innovation for the hospitality, restaurant, healthcare, grocery and retail industries. These four-day events are highly-curated, invitation-only forums that bring together leaders in each vertical market. |
Organic Growth Drivers
We are also focused on generating organic growth by understanding and leveraging the drivers for increased exhibitor and attendee participation at trade shows. Creating new opportunities for exhibitors to influence their market, engage with significant buyers, generate incremental sales and expand their brand’s awareness in their industry builds further demand for exhibit space and strengthens the value proposition of a trade show, generally allowing us to modestly increase booth space pricing annually across our portfolio. At the same time, our trade shows provide attendees with the opportunity to enhance their industry connectivity, develop relationships with targeted suppliers and distributors, discover new products, learn about new industry developments, celebrate their industry’s achievements and, in certain cases, obtain continuing professional education credits, which we believe increases their propensity to return and, consequently, drives high recurring participation among our exhibitors. By investing in and promoting these tangible and return-on-investment linked outcomes, we believe we will be able to continue to enhance the value proposition for our exhibitors and attendees alike, thereby driving strong demand and premium pricing for exhibit space, sponsorship opportunities and attendee registration.
40
Trends and Other Factors Affecting Our Business
There are a number of existing and developing factors and trends which impact the performance of our business, and the comparability of our results from year to year and from quarter to quarter, including:
|
• |
Market Fragmentation — The trade show industry is highly fragmented with the four largest companies, including us, comprising only 9% of the wider U.S. market according to AMR. This has afforded us the opportunity to acquire other trade show businesses, a growth opportunity we expect to continue pursuing. These acquisitions may affect our growth trends, impacting the comparability of our financial results on a year-over-year basis. |
|
• |
Overall Economic Environment and Industry Sector Cyclicality — Our results of operations are correlated, in part, with the economic performance of the industry sectors that our trade shows serve, as well as the state of the overall economy. |
|
• |
Lag Time — As the majority of our exhibit space is sold during the year prior to each trade show, there is often a timing difference between changes in the economic conditions of an industry sector vertical and their effect on our results of operations. This lag time can result in a counter-cyclical impact on our results of operations. |
|
• |
Variability in Quarterly Results — Our business is seasonal, with trade show revenues typically reaching their highest levels during the first and third quarters of each calendar year, and their lowest level during the fourth quarter, entirely due to the timing of our trade shows. This seasonality is typical within the trade show industry. Since event revenue is recognized when a particular event is held, we may also experience fluctuations in quarterly revenue and cash flows based on the movement of annual trade show dates from one quarter to another. Our presentation of Adjusted EBITDA accounts for these quarterly movements and the timing of shows, where applicable and material. |
|
• |
Utilization of NOLs — As of December 31, 2017, we have utilized substantially all of the $59.9 million of the NOLs that we had carried over from the year ended December 31, 2016. As a result, our cash taxes will likely increase in future years. |
How We Assess the Performance of Our Business
In assessing the performance of our business, we consider a variety of performance and financial measures. The key indicators of the financial condition and operating performance of our business are revenues, cost of revenues, selling, general and administrative expenses, interest expense, depreciation and amortization, income taxes, Adjusted EBITDA, Adjusted Net Income and Free Cash Flow.
Revenues
We generate revenues primarily from selling trade show exhibit space to exhibitors on a per square foot basis. Other trade show revenue streams include sponsorship, fees for ancillary exhibition services and attendee registration fees. Additionally, we generate revenue through conferences, digital media and print publications that complement our trade shows. We also engage third-party sales agents to support our marketing efforts. More than 95% of our sales are made by our employees, with less than 5% made by third-party sales agents. These agents, who are mainly based in Asia and Europe, are paid a percentage commission on sales.
41
|
• |
Decorating Expenses. We work with general service contractors to both set up communal areas of our trade shows and provide services to our exhibitors, who primarily contract directly with the general service contractors. We typically select a single general service contractor for an entire show, although occasionally it is more practicable to bid out packages of work within a single show on a piecemeal basis to different task-specific specialists. Decorating expenses represented 21%, 23% and 24% of our cost of revenues for the years ended December 31, 2017, 2016 and 2015, respectively, and 6% of our total revenues for each of the years ended December 31, 2017, 2016 and 2015. |
|
• |
Sponsorship Costs. We often enter into long-term sponsorship agreements with industry trade associations whereby the industry trade association endorses and markets the show to its members in exchange for a percentage of the show’s revenue. Sponsorship costs represented 20%, 21% and 19% of our cost of revenues for the years ended December 31, 2017, 2016 and 2015, respectively, 6% of our total revenues for the year ended December 31, 2017 and 5% of our total revenues for each of the years ended December 31, 2016 and 2015. |
|
• |
Venue Costs. Venue costs represent rental costs for the venues, usually convention centers or hotels, where we host our trade shows. Given that convention centers are typically owned by local governments who have a vested interest in stimulating business activity in and attracting tourism to their cities, venue costs typically represent a small percentage of our cost of revenues. Venue costs represented 15% of our total cost of revenues for each of the years ended December 31, 2017 and 2016, 16% of our cost of revenues for the year ended December 31, 2015 and 4% of our total revenues for each of the years ended December 31, 2017, 2016 and 2015. |
|
• |
Costs of Other Marketing Services. Costs of other marketing services represent paper, printing, postage, contributor and other costs related to digital media and print publications. Costs of other marketing services represented 6% of our cost of revenues and 2% of our total revenues for each of the years ended December 31, 2017, 2016 and 2015. |
|
• |
Other Event-Related Expenses. Other event-related costs include temporary labor for services such as security, shuttle buses, speaker fees, food and beverage expenses and event cancellation insurance. Other event-related expenses represented 38% of our cost of revenues and 11% of our total revenues for the year ended December 31, 2017, and 35% of our cost of revenues and 9% of our total revenues for each of the years ended December 31, 2016 and 2015. |
Selling, General and Administrative Expenses
|
• |
Labor Costs. Labor costs represent the cost of employees who are involved in sales, marketing, planning and administrative activities. The actual on-site set-up of the events is contracted out to third-party vendors and is included in cost of revenues. Labor costs represented 51%, 59% and 60% of our selling, general and administrative expenses for the years ended December 31, 2017, 2016 and 2015, respectively, and 18% of our total revenues for each of the years ended December 31, 2017, 2016 and 2015. |
|
• |
Miscellaneous Expenses. Miscellaneous expenses are comprised of a variety of other expenses, including advertising and marketing costs, promotion costs, credit card fees, travel expenses, printing costs, office supplies and office rental expense. Direct trade show costs are recorded in cost of revenues. All other costs are recorded in selling, general and administrative expenses. Miscellaneous expenses represented 36%, 40% and 39% of our selling, general and administrative expenses, 13% of our total revenues for the year ended December 31, 2017, and 12% of our total revenues for each of the years ended December 31, 2016 and 2015. |
|
• |
Management Fee. Following the Onex Acquisition, we paid a $0.8 million annual management fee under the services agreement between Onex and the Company (the “Services Agreement”). The Services Agreement with Onex was terminated in connection with the IPO for no consideration. |
Interest Expense
Interest expense represents interest payments and refinancing fees paid to our lenders. During 2016, we paid interest to the lenders under our senior secured credit facilities (as in effect prior to the 2017 Refinancing (as defined
42
below)) and to the holders of $200.0 million in aggregate principal amount of our 9.00% Senior Notes due 2021 (the “Senior Notes”) prior to their redemption as described below. On October 28, 2016, we borrowed $200.0 million of incremental term loans, and we fully redeemed all $200.0 million in aggregate principal amount of the Senior Notes with the proceeds of incremental term loans, cash on hand and proceeds of an $8.0 million borrowing under our revolving credit facility. On May 22, 2017, we refinanced our senior secured credit facilities with the Amended and Restated Senior Secured Credit Facilities (the “2017 Refinancing”). As a result, interest expense for the year ended December 31, 2017 principally represents interest paid in respect of our former senior secured credit facilities, as well as interest paid in respect of the Amended and Restated Senior Secured Credit Facilities. We further amended the Amended and Restated Senior Secured Credit Facilities in November 2017 to reduce the applicable interest rates.
Because we refinanced our outstanding indebtedness in October 2016 and again in May 2017 (including reducing our total amount of indebtedness outstanding using proceeds from the IPO during the second quarter of 2017) and also re-priced the Amended and Restated Term Loan Facility in November 2017, interest expense for the periods presented in this Annual Report on Form 10-K may not be comparable to each other or to interest expense for future periods.
Depreciation and Amortization
We have historically grown our business through acquisitions and, in doing so, have acquired significant intangible assets, the value of some of which is amortized over time. These acquired intangible assets, unless determined to be indefinite-lived, are amortized over extended periods of seven to ten years from the date of each acquisition for reporting under accounting principles generally accepted in the United States of America (“GAAP”) purposes, or fifteen years for tax purposes. This amortization expense reduces our taxable income. Depreciation expense relates to property and equipment and represented less than 1% of our total revenues for each of the years ended December 31, 2017, 2016, and 2015.
Income Taxes
Income tax expense consists of federal, state and local taxes based on income in the jurisdictions in which we operate.
As a result of our federal NOL carryforwards, we did not incur significant cash obligations for federal income taxes in 2017. We used substantially all of our federal NOL carryforwards during 2017, and therefore expect our provision for income taxes to increase for future periods. We also record deferred tax charges or benefits primarily associated with our utilization or generation of net operating loss carryforwards and book-to-tax difference related to amortization of goodwill, amortization of intangibles assets, depreciation, stock-based compensation charges and deferred financing costs.
On December 22, 2017, the Tax Cuts and Jobs Act was enacted. The Tax Cuts and Jobs Act significantly revises the U.S. corporate income tax law by, among other things, decreasing the federal corporate income tax rate from 35% to 21% effective January 1, 2018. As a result of the reduction in the tax rate, we are required to revalue our U.S. net deferred tax liabilities at December 31, 2017. We estimate the impact of the revaluation will be a one-time benefit to income tax of approximately $52.1 million for the fourth quarter of fiscal year 2017. Also as a result of the reduction in the tax rate, we estimate our effective tax rate in 2018 will range between 26% to 28%.
Cash Flow Model
We have favorable cash flow characteristics, as described below (see “—Liquidity and Capital Resources—Cash Flows”), as a result of our high profit margins, substantial favorable tax attributes, low capital expenditures and consistently negative working capital. Our working capital is negative as our current assets are consistently lower than our current liabilities. Current assets primarily include accounts receivable and prepaid expenses, while current liabilities primarily include accounts payable and deferred revenues. Cash received prior to an event is recorded as deferred revenue on our balance sheet and recognized in revenue upon completion of each trade show.
43
The implication of having negative working capital is that changes in working capital represent a source of cash as our business grows.
The primary driver for our negative working capital is the sales cycle for a trade show, which typically begins during the prior show. In the interim period between the current show and the following show, we continue to sell to new and past exhibitors and collect payments on contracted exhibit space. We require exhibitors to pay in full in advance of each trade show, whereas the bulk of expenses are paid close to or after the show. Cash deposits start to be received as early as twelve months prior to a show taking place and virtually 100% of booth space revenues are typically received in cash one month prior to a show taking place. This highly efficient cash flow model, where revenue is received in advance of expenses to be paid, creates a working capital benefit.
Free Cash Flow
In addition to net cash provided by operating activities presented in accordance with GAAP, we present Free Cash Flow because we believe it is a useful indicator of liquidity that provides information to management and investors about the amount of cash generated from our core operations that, after capital expenditures, can be used for the repayment of indebtedness and strategic initiatives, including investing in our business, paying dividends, making strategic acquisitions and strengthening our balance sheet.
Free Cash Flow is a supplemental non-GAAP financial measure of liquidity and is not based on any standardized methodology prescribed by GAAP. Free Cash Flow should not be considered in isolation or as an alternative to net cash provided by operating activities or other measures determined in accordance with GAAP. Also, Free Cash Flow is not necessarily comparable to similarly titled measures used by other companies.
The most directly comparable GAAP measure to Free Cash Flow is net cash provided by operating activities. For a reconciliation of Free Cash Flow to net cash provided by operating activities, see footnote 4 to the table under the heading “Results of Operations - Comparison of the Year Ended December 31, 2017 to the Year Ended December 31, 2016”.
Adjusted EBITDA
Adjusted EBITDA is a key measure of our performance. Adjusted EBITDA is defined as net income before interest expense, loss on extinguishment of debt, income tax expense, depreciation and amortization, stock-based compensation, deferred revenue adjustment, intangible asset impairment charge, the Onex management fee (for periods prior to our IPO), contract termination costs and other items that management believes are not part of our core operations. We present Adjusted EBITDA because we believe it assists investors and analysts in comparing our operating performance across reporting periods on a consistent basis by excluding items that we do not believe are indicative of our core operating performance. Management and our board of directors use Adjusted EBITDA to assess our financial performance and believe it is helpful in highlighting trends because it excludes the results of decisions that are outside the control of management, while other performance metrics can differ significantly depending on long-term strategic decisions regarding capital structure, the tax jurisdictions in which we operate and capital investments.
Adjusted EBITDA is not defined under GAAP, and is subject to important limitations, including that Adjusted EBITDA excludes certain normal recurring expenses and one-time cash adjustments that we consider to not be indicative of our ongoing operating performance. Because not all companies use identical calculations, our presentation of Adjusted EBITDA may not be comparable to other similarly titled measures used by other companies.
The most directly comparable GAAP measure to Adjusted EBITDA is net income. For a reconciliation of Adjusted EBITDA to net income, see footnote 2 to the table under the heading “Results of Operations - Comparison of the Year Ended December 31, 2017 to the Year Ended December 31, 2016”.
44
Adjusted Net Income is defined as net income before refinancing charges, loss on extinguishment of debt; stock-based compensation; deferred revenue adjustment; intangible asset impairment charge; the Onex management fee (for periods prior to our IPO); contract termination costs; other items that management believes are not part of our core operations; amortization of deferred financing fees and discount; amortization of (acquired) intangible assets; and tax adjustments related to non-GAAP adjustments.
We use Adjusted Net Income as a supplemental metric to evaluate our business’s performance in a way that also considers our ability to generate profit without the impact of certain items. For example, it is useful to exclude stock-based compensation expenses because the amount of such expenses in any specific period may not directly correlate to the underlying performance of our business, and these expenses can vary significantly across periods due to timing of new stock-based awards. We also exclude the amortization of intangible assets and certain discrete costs, including deferred revenue adjustments, impairment charges and transaction costs (including professional fees and other expenses associated with acquisition activity and debt refinancings) in order to facilitate a period-over-period comparison of our financial performance. Each of the normal recurring adjustments and other adjustments described in this paragraph help management with a measure of our operating performance over time by removing items that are not related to day-to-day operations.
Adjusted Net Income is not defined under GAAP and is subject to important limitations. We have included the calculation of Adjusted Net Income for the periods presented. Because not all companies use identical calculations, our presentation of Adjusted Net Income may not be comparable to other similarly titled measures used by other companies.
The most directly comparable GAAP measure to Adjusted Net Income is net income. For a reconciliation of Adjusted Net Income to net income, see footnote 3 to the table under the heading “Results of Operations—Comparison of the Year Ended December 31, 2017 to the Year Ended December 31, 2016”.
Results of Operations
Comparison of the Year Ended December 31, 2017 to the Year Ended December 31, 2016
The tables in this section summarize key components of our results of operations for the periods indicated.
|
|
|
Year Ended December 31, |
|
|
|
|
|
|
|
|
|
|||||
|
|
|
2017 |
|
|
2016 |
|
|
Variance $ |
|
|
Variance % |
|
||||
|
|
|
(dollars in millions) |
|
|||||||||||||
|
Statement of income and comprehensive income data: |
|
|
|
|
|
|
|
|
|
|
|
|
|
|
|
|
|
Revenues |
|
$ |
341.7 |
|
|
$ |
323.7 |
|
|
$ |
18.0 |
|
|
|
5.6 |
% |
|
Other income |
|
|
6.5 |
|
|
|
— |
|
|
|
6.5 |
|
|
|
- |
|
|
Cost of revenues |
|
|
95.0 |
|
|
|
84.4 |
|
|
|
10.6 |
|
|
|
12.6 |
% |
|
Selling, general and administrative expenses(1) |
|
|
121.9 |
|
|
|
98.9 |
|
|
|
23.0 |
|
|
|
23.3 |
% |
|
Depreciation and amortization expense |
|
|
43.2 |
|
|
|
40.0 |
|
|
|
3.2 |
|
|
|
8.0 |
% |
|
Operating income |
|
|
88.1 |
|
|
|
100.4 |
|
|
|
(12.3 |
) |
|
|
(12.3 |
)% |
|
Interest expense |
|
|
38.3 |
|
|
|
51.4 |
|
|
|
(13.1 |
) |
|
|
(25.5 |
)% |
|
Loss on extinguishment of debt |
|
|
3.0 |
|
|
|
12.8 |
|
|
|
(9.8 |
) |
|
|
(76.6 |
)% |
|
Income before income taxes |
|
|
46.8 |
|
|
|
36.2 |
|
|
|
10.6 |
|
|
|
29.3 |
% |
|
(Benefit from) provision for income taxes |
|
|
(35.0 |
) |
|
|
14.0 |
|
|
|
(49.0 |
) |
|
|
(350.0 |
)% |
|
Net income and comprehensive income |
|
$ |
81.8 |
|
|
$ |
22.2 |
|
|
$ |
59.6 |
|
|
|
268.5 |
% |
|
|
|
|
|
|
|
|
|
|
|
|
|
|
|
|
|
|
|
Other financial data (unaudited): |
|
|
|
|
|
|
|
|
|
|
|
|
|
|
|
|
|
Adjusted EBITDA(2) |
|
$ |
157.9 |
|
|
$ |
152.9 |
|
|
$ |
5.0 |
|
|
|
3.3 |
% |
|
Adjusted Net Income(3) |
|
$ |
80.3 |
|
|
$ |
63.7 |
|
|
$ |
16.6 |
|
|
|
26.0 |
% |
|
Free Cash Flow(4) |
|
$ |
107.8 |
|
|
$ |
89.6 |
|
|
$ |
18.2 |
|
|
|
20.3 |
% |
45
|
(1) |
Selling, general and administrative expenses for the years ended December 31, 2017 and 2016 included $23.5 million and $7.7 million, respectively, in contract termination, acquisition-related transaction, transition and integration costs, including legal and advisory fees. Also included in selling, general and administrative expenses for each of the years ended December 31, 2017 and 2016 were stock-based compensation expenses of $2.4 million and $2.9 million, respectively. |
|
(2) |
In addition to net income presented in accordance with GAAP, we use Adjusted EBITDA to measure our financial performance. Adjusted EBITDA is a supplemental non-GAAP financial measure of operating performance and is not based on any standardized methodology prescribed by GAAP. Adjusted EBITDA should not be considered in isolation or as alternatives to net income, cash flows from operating activities or other measures determined in accordance with GAAP. Also, Adjusted EBITDA is not necessarily comparable to similarly titled measures presented by other companies. |
We define Adjusted EBITDA as net income before (i) interest expense, (ii) loss on extinguishment of debt, (iii) income tax expense, (iv) depreciation and amortization, (v) stock-based compensation, (vi) deferred revenue adjustment, (vii) intangible asset impairment charge, (viii) the Onex management fee (for periods prior to our IPO), (ix) contract termination costs and (x) other items that management believes are not part of our core operations. We present Adjusted EBITDA because we believe it assists investors and analysts in comparing our operating performance across reporting periods on a consistent basis by excluding items that we do not believe are indicative of our core operating performance. Management and our board of directors use Adjusted EBITDA to assess our financial performance and believe they are helpful in highlighting trends because it excludes the results of decisions that are outside the control of management, while other performance metrics can differ significantly depending on long-term strategic decisions regarding capital structure, the tax jurisdictions in which we operate and capital investments. We reference Adjusted EBITDA frequently in our decision-making because it provides supplemental information that facilitates internal comparisons to the historical operating performance of prior periods. Adjusted EBITDA has limitations as an analytical tool, and you should not consider such measure either in isolation or as a substitute for analyzing our results as reported under GAAP. Some of these limitations include that Adjusted EBITDA excludes certain normal recurring expenses and one-time cash adjustments that we consider not to be indicative of our ongoing operating performance.
|
|
|
Year Ended December 31, |
|
|||||
|
|
|
2017 |
|
|
2016 |
|
||
|
|
|
(unaudited) |
|
|||||
|
|
|
(dollars in millions) |
|
|||||
|
Net income |
|
$ |
81.8 |
|
|
$ |
22.2 |
|
|
Add (Deduct): |
|
|
|
|
|
|
|
|
|
Interest expense |
|
|
33.8 |
|
|
|
51.4 |
|
|
Refinancing and repricing fees |
|
|
4.5 |
|
|
|
- |
|
|
Loss on extinguishment of debt(a) |
|
|
3.0 |
|
|
|
12.8 |
|
|
(Benefit from) provision for income taxes |
|
|
(35.0 |
) |
|
|
14.0 |
|
|
Depreciation and amortization expense |
|
|
43.2 |
|
|
|
40.0 |
|
|
Stock-based compensation expense(b) |
|
|
2.4 |
|
|
|
2.9 |
|
|
Deferred revenue adjustment(c) |
|
|
0.5 |
|
|
|
0.3 |
|
|
Management fee(d) |
|
|
0.2 |
|
|
|
0.8 |
|
|
Contract termination costs (e) |
|
|
10.0 |
|
|
|
- |
|
|
Other items(f) |
|
|
13.5 |
|
|
|
7.7 |
|
|
Adjusted EBITDA |
|
$ |
157.9 |
|
|
$ |
152.1 |
|
|
|
(a) |
On May 8, 2017, using the net proceeds to us from our IPO, we prepaid $159.2 million of borrowings under our term loan facility (as then in effect). On May 22, 2017, we refinanced our Senior Secured Credit Facilities with the Amended and Restated Senior Secured Credit Facility. In conjunction with the refinancing of our Senior Secured Credit Facilities, certain debt holders’ balances were fully extinguished. As a result, we wrote off unamortized deferred financing fees and original issuance discount of $1.4 million and $1.6 million, respectively, which were included in loss on extinguishment of debt in the consolidated statements of income and comprehensive income. |
On October 28, 2016, in connection with the Third Amendment, we redeemed all of our $200.0 million aggregate principal amount 9.00% Senior Notes due 2021 (the “Senior Notes”) at a redemption price of
46
104.5%. The $9.0 million redemption premium was included in loss on extinguishment of debt in the consolidated statements of income and comprehensive income. Due to the extinguishment of the Senior Notes, we also wrote off $3.8 million of outstanding deferred financing fees which were included in loss on extinguishment of debt in the consolidated statements of income and comprehensive income.
|
|
(b) |
Represents costs related to stock-based compensation associated with certain employees’ participation in the 2013 Plan and the 2017 Plan. |
|
|
(c) |
Deferred revenue balances in each of the opening balance sheets of acquired assets and liabilities for Pavement, ACRE and IGES, reflected the fair value of the assumed deferred revenue performance obligations at the respective acquisition dates. If the businesses had been continuously owned by us throughout the years presented, the fair value adjustments of $0.5 million and $0.3 million, respectively, would not have been required and the revenues for the years ended December 31, 2017 and 2016 would have increased by $0.5 million and $0.3 million, respectively. |
|
|
(d) |
Represents the annual management fee of $0.8 million payable to an affiliate of Onex under the Services Agreement. In connection with the IPO, the Services Agreement was terminated and the management fee will no longer be paid. |
|
|
(e) |
Represents contract termination costs incurred in connection with the relocation of the Outdoor Retailer show from Salt Lake City to Denver. |
|
|
(f) |
Other items include amounts management believes are not representative of our core operations. For the year ended December 31, 2017, the $13.5 million included: (i) $5.7 million in transaction costs in connection with certain acquisition transactions that were completed or pending in 2017, (ii) $4.6 million in legal, audit and consulting fees related to the IPO and other related activities and (iii) $3.2 million in transition costs. For the year ended December 31, 2016 the $7.7 million included: (i) $4.0 million in transaction costs incurred in connection with certain acquisition transactions that were completed or pending and those that were pursued but not completed during 2016, (ii) $1.3 million in legal and consulting fees related to the IPO and (iii) $2.4 million in transition costs, primarily related to information technology and facility rental charges for terminated leases. |
|
(3) |
In addition to net income presented in accordance with GAAP, we present Adjusted Net Income because we believe it assists investors and analysts in comparing our operating performance across reporting periods on a consistent basis by excluding items that we do not believe are indicative of our core operating performance. Our presentation of Adjusted Net Income adjusts net income for (i) refinancing charges, (ii) loss on extinguishment of debt, (iii) stock-based compensation, (iv) deferred revenue adjustment, (v) intangible asset impairment charge, (vi) the Onex management fee (for periods prior to our IPO), (vii) contract termination costs (viii) other items that management believes are not part of our core operations, (ix) amortization of deferred financing fees and discount, (x) amortization of (acquired) intangible assets and (xi) tax adjustments related to non-GAAP adjustments. |
We use Adjusted Net Income as a supplemental metric to evaluate our business’s performance in a way that also considers our ability to generate profit without the impact of certain items.
For example, it is useful to exclude stock-based compensation expenses because the amount of such expenses in any specific period may not directly correlate to the underlying performance of our business, and these expenses can vary significantly across periods due to timing of new stock-based awards. We also exclude the amortization of intangible assets and certain discrete costs, including deferred revenue adjustments, impairment charges and transaction costs (including professional fees and other expenses associated with acquisition activity) in order to facilitate a period-over-period comparison of our financial performance. This measure also reflects an adjustment for the difference between cash amounts paid in respect of taxes and the amount of tax recorded in accordance with GAAP. Each of the normal recurring adjustments and other adjustments described in this paragraph help to provide management with a measure of our operating performance over time by removing items that are not related to day-to-day operations or are noncash expenses.
47
Adjusted Net Income is a supplemental non-GAAP financial measure of operating performance and is not based on any standardized methodology prescribed by GAAP. Adjusted Net Income should not be considered in isolation or as an alternative to net income, cash flows from operating activities or other measures determined in accordance with GAAP. Also, Adjusted Net Income is not necessarily comparable to similarly titled measures presented by other companies.
|
|
|
Year ended December 31 |
|
|||||
|
|
|
2017 |
|
|
2016 |
|
||
|
|
|
(unaudited) |
|
|||||
|
|
|
(dollars in millions) |
|
|||||
|
Net income |
|
$ |
81.8 |
|
|
$ |
22.2 |
|
|
Add (Deduct): |
|
|
|
|
|
|
|
|
|
Refinancing charges |
|
|
4.5 |
|
|
|
- |
|
|
Loss on extinguishment of debt(a) |
|
|
3.0 |
|
|
|
12.8 |
|
|
Stock-based compensation expense(b) |
|
|
2.4 |
|
|
|
2.9 |
|
|
Deferred revenue adjustment(c) |
|
|
0.5 |
|
|
|
0.3 |
|
|
Management fee(d) |
|
|
0.2 |
|
|
|
0.8 |
|
|
Contract termination costs(e) |
|
|
10.0 |
|
|
|
- |
|
|
Other items(f) |
|
|
13.5 |
|
|
|
7.7 |
|
|
Amortization of deferred financing fees and discount |
|
|
4.6 |
|
|
|
5.3 |
|
|
Amortization of (acquired) intangible assets(g) |
|
|
41.3 |
|
|
|
38.3 |
|
|
Deferred tax adjustment(h) |
|
|
(52.1 |
) |
|
|
- |
|
|
Tax adjustments related to non-GAAP adjustments(i) |
|
|
(29.4 |
) |
|
|
(26.6 |
) |
|
Adjusted Net Income |
|
$ |
80.3 |
|
|
$ |
63.7 |
|
|
|
(a) |
Represents loss on extinguishment of debt as described in Note (2)(a) above. |
|
|
(b) |
Represents costs related to stock-based compensation associated with certain employees’ participation in the 2013 Plan and the 2017 Plan. |
|
|
(c) |
Represents the acquired deferred revenue fair value adjustments described in Note 2(b) above. |
|
|
(d) |
Represents the annual management fee described in Note 2(d) above. |
|
|
(e) |
Represents the contract termination costs described in Note 2(e) above. |
|
|
(f) |
Represents other items described in Note 2(e) above. |
|
|
(g) |
We have historically grown our business through acquisitions and have therefore acquired significant intangible assets the value of which are amortized over time. These acquired intangible assets are amortized over an extended period ranging from seven to ten years from the date of each acquisition. |
|
|
(h) |
Represents the impact of revaluing our net deferred tax liabilities from the previously applicable corporate tax rate of 35% to the newly enacted U.S. corporate tax rate of 21% as a result of the Tax Cuts and Jobs Act enacted on December 22, 2017. |
|
|
(i) |
Reflects application of U.S. federal and state enterprise tax rates of 36.5% and 39.1% in the years ended December 31, 2017 and 2016, respectively. |
|
(4) |
In addition to net cash provided by operating activities presented in accordance with GAAP, we present Free Cash Flow because we believe it is a useful indicator of liquidity that provides information to management and investors about the amount of cash generated from our core operations that, after capital expenditures, can be used for the repayment of indebtedness and strategic initiatives, including investing in our business, payment of dividends, making strategic acquisitions and strengthening our balance sheet. |
48
Free Cash Flow is a supplemental non-GAAP financial measure of liquidity and is not based on any standardized methodology prescribed by GAAP. Free Cash Flow should not be considered in isolation or as an alternative to cash flows from operating activities or other measures determined in accordance with GAAP. Also, Free Cash Flow is not necessarily comparable to similarly titled measures used by other companies.
|
|
|
Year Ended December 31, |
|
|||||
|
|
|
2017 |
|
|
2016 |
|
||
|
|
|
(unaudited) |
|
|||||
|
|
|
(dollars in millions) |
|
|||||
|
Net Cash Provided by Operating Activities |
|
$ |
110.8 |
|
|
$ |
93.0 |
|
|
Less: |
|
|
|
|
|
|
|
|
|
Capital expenditures |
|
|
3.0 |
|
|
|
3.4 |
|
|
Free Cash Flow |
|
$ |
107.8 |
|
|
$ |
89.6 |
|
Revenues
Revenues of $341.7 million for the year ended December 31, 2017 increased $18.0 million, or 5.6%, from $323.7 million for the year ended December 31, 2016. The increase in revenue reflected acquisition-driven growth of $24.3 million, or 7.5%, and organic growth of $0.6 million, or 0.2%. This growth was partly offset by the impact of Hurricane Irma, which reduced revenue by $6.6 million, or 2.0%, although this impact was fully reimbursed by insurance proceeds reported as Other Income (net of cost savings achieved), and also due to discontinued activities of $0.3 million, or 0.1%. Incremental contributions from acquisitions of $24.3 million related to the 2017 acquisitions of CEDIA and InterDrone, where the shows took place in 2017, as well as the incremental revenues contributed by Pavement, ACRE, Collective, RFID LIVE! and Digital Dealer which were businesses we acquired in 2016 after the respective shows for that year had staged.
The organic revenue increase of $0.6 million, or 0.2%, reflected slight growth in trade shows and other events, partly offset by a mid-single digit decline in Other Marketing Services. Trade show organic growth of 0.6% included low-to mid-single digit percentage growth in our largest sector, Gift, Home & General Merchandise, and mid to high single digit growth in Other Trade Shows, offset by a mid to high single digit percentage decline in the Sports sector. In Gift, Home & General Merchandise, KBIS and ICFF continued to be notable drivers of growth, while our two largest franchises, ASD Market Week and NY NOW, both reported slightly lower revenues than in 2016. In Other Trade Shows we saw strong growth from Pizza Expo and its new regional launch, Pizza & Pasta North East. The Sports sector decline was mainly attributable to a significant decline in revenues from our Interbike show, reflecting underlying market weakness, and by a high single digit percentage decline in our Outdoor Retailer Summer Market show, held in Salt Lake City, that was impacted by a partial boycott of our show by exhibitors protesting the state of Utah’s position on certain federally protected lands. The revenues of our Jewelry and Technology sectors were relatively flat.
Other Income
On September 7, 2017, as a result of Hurricane Irma, our Surf Expo and ISS Orlando trade shows were forced to close two days early. The Company carries cancellation insurance to mitigate losses caused by natural disasters, and during the fourth quarter of 2017 received a settlement of $6.5 million to offset substantially all of the lost revenues from the affected shows. As a result, we recorded Other Income of $6.5 million in the consolidated statements of income and comprehensive income for the year ended December 31, 2017 to recognize the amount recovered from our event insurance company.
Cost of Revenues
Cost of revenues of $95.0 million for the year ended December 31, 2017 increased $10.6 million, or 12.6%, from $84.4 million for the year ended December 31, 2016. Incremental costs from acquisitions contributed $7.0 million and the remaining $3.6 million increase included $1.5 million related to launches, $0.3 million of savings on discontinued events, and $2.5 million of other cost increases, the latter mainly driven by the revenue growth of the KBIS and ICFF shows.
49
Selling, General and Administrative Expenses
Selling, general and administrative expenses of $121.9 million for the year ended December 31, 2017 increased $23.0 million, or 23.0%, from $98.9 million for the year ended December 31, 2016. Incremental costs from 2017 and 2016 acquisitions contributed $5.9 million to selling, general and administrative expense. In addition, we incurred $10.1 million in one-time contract termination costs in connection with the relocation of the Outdoor Retailer show from Salt Lake City to Denver. Legal, accounting and consulting fees related to our IPO and other transaction related activities were $4.5 million during the year ended December 31, 2017, a $3.2 million increase from the prior year. Furthermore, we expensed $8.6 million in transition and transaction costs during the year ended December 31, 2017, mainly related to our recent acquisitions, which was a $2.2 million increase from the prior year. The remaining $1.6 million increase in selling, general and administrative expenses was driven mainly by additional costs associated with operating as a public company of approximately $1.5 million and other net cost increases of $0.2 million, partly offset by a $0.5 million decrease in stock-based compensation.
Depreciation and Amortization Expense
Depreciation and amortization expense of $43.2 million for the year ended December 31, 2017 increased $3.2 million, or 8.0%, from $40.0 million for the year ended December 31, 2016. The increase was comprised of $3.0 million in additional intangible asset amortization related to intangible assets acquired in the 2017 and 2016 acquisitions and a $0.2 million increase in depreciation expense.
Interest Expense
Interest expense of $38.3 million for the year ended December 31, 2017 decreased $13.1 million, or 25.5%, from $51.4 million for the year ended December 31, 2016. The decrease was primarily due to a $12.2 million decrease in interest expense resulting from $14.2 million in savings following the October 2016 redemption of the 9.00% Senior Notes, which were repaid using $200.0 million in incremental term loan borrowings under the Senior Secured Credit facilities, which bore interest at a lower rate, as well as the interest savings attributable to the reduction in the principal amount of our indebtedness during the year ended December 31, 2017. These savings were partly offset by a $2.0 million increase in third party costs related to the refinancing of our Senior Secured Credit Facilities in May 2017 and the repricing of the Senior Secured Credit Facilities in November 2017 compared to the fees incurred on the $200.0 million in incremental term loan borrowings which occurred in October 2016. The remaining $0.9 million decrease in interest expense was primarily attributable to a lower loss on interest rate swap and floor contracts.
Loss on Extinguishment of Debt
Loss on extinguishment of debt was $3.0 million and $12.8 million for the years ended December 31, 2017 and 2016, respectively. In conjunction with the refinancing of our Senior Secured Credit Facilities in May 2017, certain debt holders’ balances were fully extinguished. As a result, we wrote off unamortized deferred financing fees and original issuance discount of $1.4 million and $1.6 million, respectively. On October 28, 2016, we redeemed all $200.0 million of our 9.00% Senior Notes at a redemption price of 104.5%. In addition to the $9.0 million redemption premium, we wrote off unamortized deferred financing fees of $3.8 million as a result of the extinguishment.
(Benefit from) Provision for Income Taxes
For the years ended December 31, 2017 and 2016, we recorded a benefit from income taxes of $35.0 million and a provision for income taxes of $14.0 million, respectively. As a result of the Tax Cuts and Jobs Act enacted on December 22, 2017, we recognized a $52.1 million tax benefit due to the impact of revaluing our net deferred tax liabilities from 35% to the newly enacted U.S. corporate tax rate of 21%. Excluding the effect of this one-time adjustment, the Company’s effective tax rate for the year ended December 31, 2017 was 36.7% compared to 38.9% for the year ended December 31, 2016. The decrease in the effective tax rate for the year ended December 31, 2017 was primarily attributable to excess tax deductions recognized by the Company on the exercise of stock options and the release of certain uncertain tax position reserves due to the lapse in their related statutes of limitations.
50
Net Income; Adjusted EBITDA; Adjusted Net Income
Net income of $81.8 million for the year ended December 31, 2017 increased $59.6 million, or 268.5%, from $22.2 million for the year ended December 31, 2016. The increase was primarily attributable to the $52.1 million tax benefit due to the impact of revaluing our net deferred tax liabilities from 35.0% to 21.0% as a result of the Tax Cuts and Jobs Act. In addition, contributions from acquisitions during 2017 and 2016 and lower interest expense as a result of the redemption of $200.0 million of the Senior Notes in October 2016 and the reduction in the principal amount of our indebtedness as a result of the refinancing and repricing transactions during 2017 drove higher net income. These gains were offset by higher non-recurring contract termination expenses, audit, legal and consulting costs associated with the IPO, other acquisitions costs and refinancing and repricing fees. Adjusted EBITDA of $157.9 million for the year ended December 31, 2017 increased $5.8 million, or 3.8%, from $152.1 million for the year ended December 31, 2016. The reasons for the increase in Adjusted EBITDA were the same as for the increases in net income, excluding the $49.1 million increase in benefit from income taxes. Adjusted EBITDA benefited from the exclusion of the $15.8 million increase in one-time contract termination costs, legal, audit and consulting fees associated with the IPO and other related activities, and transaction and transition costs and $3.3 million of higher depreciation and amortization expense in the year ended December 31, 2017 versus the prior year. These benefits were offset by $24.0 million of combined reductions from lower interest expense, refinancing and repricing fees, loss on extinguishment of debt, stock-based compensation costs and management fees. Adjusted Net Income for the year ended December 31, 2017 of $80.3 million increased $16.6 million, or 26.1%, from $63.7 million for the year ended December 31, 2016. The reasons for the increase in Adjusted Net Income were the same as the reasons for the increase in Adjusted EBITDA. In addition, Adjusted Net Income benefited from the absence of a $16.9 million decrease in interest expense and amortization of deferred financing fees and discount add-backs, offset by a $5.7 million increase related to the deferred tax adjustment and tax effect of non-GAAP adjustments deductions.
Adjusted EBITDA and Adjusted Net Income are financial measures that are not calculated in accordance with GAAP. For a discussion of our presentation of Adjusted EBITDA, see footnote 2 to the table under the heading to the table under the heading “Comparison of the Year Ended December 31, 2017 to the Year Ended December 31, 2016”. For a discussion of our presentation of Adjusted Net Income, see footnote 3 to the table under the heading “Results of Operations - Comparison of the Year Ended December 31, 2017 to the Year Ended December 31, 2016.”
Comparison of the Year Ended December 31, 2016 to the Year Ended December 31, 2015
|
|
|
Year Ended December 31, |
|
|
|
|
|
|
|
|
|
|||||
|
|
|
2016 |
|
|
2015 |
|
|
Variance $ |
|
|
Variance % |
|
||||
|
|
|
(dollars in millions) |
|
|||||||||||||
|
Statement of income and comprehensive income data: |
|
|
|
|
|
|
|
|
|
|
|
|
|
|
|
|
|
Revenues |
|
$ |
323.7 |
|
|
$ |
306.4 |
|
|
$ |
17.3 |
|
|
|
5.6 |
% |
|
Cost of revenues |
|
|
84.4 |
|
|
|
83.4 |
|
|
|
1.0 |
|
|
|
1.2 |
% |
|
Selling, general and administrative expenses(1) |
|
|
98.9 |
|
|
|
93.1 |
|
|
|
5.8 |
|
|
|
6.2 |
% |
|
Depreciation and amortization expense |
|
|
40.0 |
|
|
|
39.1 |
|
|
|
0.9 |
|
|
|
2.3 |
% |
|
Intangible asset impairment charge |
|
|
— |
|
|
|
8.9 |
|
|
|
(8.9 |
) |
|
|
— |
|
|
Operating income |
|
|
100.4 |
|
|
|
81.9 |
|
|
|
18.5 |
|
|
|
22.6 |
% |
|
Interest expense |
|
|
51.4 |
|
|
|
52.0 |
|
|
|
(0.6 |
) |
|
|
(1.2 |
)% |
|
Loss on extinguishment of debt |
|
|
12.8 |
|
|
|
— |
|
|
|
12.8 |
|
|
|
— |
|
|
Income before income taxes |
|
|
36.2 |
|
|
|
29.9 |
|
|
|
6.3 |
|
|
|
21.1 |
% |
|
Provision for income taxes |
|
|
14.0 |
|
|
|
10.3 |
|
|
|
3.7 |
|
|
|
35.9 |
% |
|
Net income and comprehensive income |
|
$ |
22.2 |
|
|
$ |
19.6 |
|
|
$ |
2.6 |
|
|
|
13.3 |
% |
|
|
|
|
|
|
|
|
|
|
|
|
|
|
|
|
|
|
|
Other financial data (unaudited): |
|
|
|
|
|
|
|
|
|
|
|
|
|
|
|
|
|
Adjusted EBITDA(2) |
|
$ |
152.1 |
|
|
$ |
142.8 |
|
|
$ |
9.3 |
|
|
|
6.5 |
% |
|
Adjusted Net Income(3) |
|
$ |
63.7 |
|
|
$ |
58.1 |
|
|
$ |
5.6 |
|
|
|
9.6 |
% |
|
Free Cash Flow(4) |
|
$ |
89.6 |
|
|
$ |
85.0 |
|
|
$ |
4.6 |
|
|
|
5.4 |
% |
51
|
|
(1) |
Selling, general and administrative expenses for the years ended December 31, 2016 and 2015 included $7.7 million and $5.1 million, respectively, in acquisition related transaction, transition and integration costs, including legal and advisory fees. Also included in selling, general and administrative expense for the years ended December 31, 2016 and 2015 were stock-based compensation expense of $3.0 million and $5.1 million, respectively. |
|
|
(2) |
For a definition of Adjusted EBITDA and the reasons management uses this metric, see footnote 2 to the table under the heading “Comparison of the Year Ended December 31, 2017 to the Year Ended December 31, 2016”. |
|
|
|
Year Ended December 31, |
|
|||||
|
|
|
2016 |
|
|
2015 |
|
||
|
|
|
(unaudited) |
|
|||||
|
|
|
(dollars in millions) |
|
|||||
|
Net income |
|
$ |
22.2 |
|
|
$ |
19.6 |
|
|
Add: |
|
|
|
|
|
|
|
|
|
Interest expense |
|
|
51.4 |
|
|
|
51.9 |
|
|
Loss on extinguishment of debt(a) |
|
|
12.8 |
|
|
|
- |
|
|
Provision for income taxes |
|
|
14.1 |
|
|
|
10.3 |
|
|
Depreciation and amortization expense |
|
|
39.9 |
|
|
|
39.1 |
|
|
Stock-based compensation expense(b) |
|
|
2.9 |
|
|
|
5.0 |
|
|
Deferred revenue adjustment(c) |
|
|
0.3 |
|
|
|
1.9 |
|
|
Intangible asset impairment charge(d) |
|
|
- |
|
|
|
9.0 |
|
|
Management fee(e) |
|
|
0.8 |
|
|
|
0.8 |
|
|
Other items(f) |
|
|
7.7 |
|
|
|
5.2 |
|
|
Adjusted EBITDA |
|
$ |
152.1 |
|
|
$ |
142.8 |
|
|
|
(a) |
On October 28, 2016, in connection with the Third Amendment to our Senior Secured Credit Facilities (the “Third Amendment”), we redeemed all of our $200.0 million aggregate principal amount of our 9.00% Senior Notes due 2021 (the “Senior Notes”) at a redemption price of 104.5%. The $9.0 million redemption premium was included in loss on extinguishment of debt in the consolidated statements of income and comprehensive income. In connection with the extinguishment of the Senior Notes, we also wrote off $3.8 million of outstanding deferred financing fees which were included in loss on extinguishment of debt in the consolidated statements of income and comprehensive income. |
|
|
(b) |
Represents costs related to stock-based compensation associated with certain employees’ participation in the 2013 Plan and the 2017 Plan. |
|
|
(c) |
Deferred revenue balances in each of the opening balance sheets of acquired assets and liabilities for IGES and the 2015 Acquisitions, reflected the fair value of the assumed deferred revenue performance obligations at the respective acquisition dates. If the businesses had been continuously owned by us throughout the years presented, the fair value adjustments of $0.3 million and $1.9 million, respectively, would not have been required and the revenues for the years ended December 31, 2016 and 2015 would have increased by $0.3 million and $1.9 million, respectively. |
|
|
(d) |
The intangible asset impairment charge for the year ended December 31, 2015 was recorded to align the carrying value of indefinite-lived intangibles assets with their implied fair value. No other impairment charges were recorded in 2015 including in connection with our annual test of goodwill for the year ended December 31, 2015. |
|
|
(e) |
Represents the annual management fee of $0.8 million payable to an affiliate of Onex under the Services Agreement. In connection with the IPO, the Services Agreement was terminated and the management fee will no longer be paid. |
52
|
|
related to transition and integration costs related to the 2015 Acquisitions and (iii) $0.9 million for transition and integration costs related to the GLM acquisition. |
|
|
(3) |
For a definition of Adjusted Net Income and the reasons management uses this metric, see footnote 3 to the table under the heading “Comparison of the Year Ended December 31, 2017 to the Year Ended December 31, 2016”. |
|
|
|
Year ended December 31 |
|
|||||
|
|
|
2016 |
|
|
2015 |
|
||
|
|
|
(unaudited) |
|
|||||
|
|
|
(dollars in millions) |
|
|||||
|
Net income |
|
$ |
22.2 |
|
|
$ |
19.6 |
|
|
Add (Deduct): |
|
|
|
|
|
|
|
|
|
Loss on extinguishment of debt(a) |
|
|
12.8 |
|
|
|
- |
|
|
Stock-based compensation expense(b) |
|
|
2.9 |
|
|
|
5.0 |
|
|
Deferred revenue adjustment(c) |
|
|
0.3 |
|
|
|
1.9 |
|
|
Intangible asset impairment charge(d) |
|
|
- |
|
|
|
9.0 |
|
|
Management fee(e) |
|
|
0.8 |
|
|
|
0.8 |
|
|
Other items(f) |
|
|
7.7 |
|
|
|
5.2 |
|
|
Amortization of deferred financing fees and discount |
|
|
5.3 |
|
|
|
4.7 |
|
|
Amortization of (acquired) intangible assets(g) |
|
|
38.3 |
|
|
|
36.8 |
|
|
Tax adjustments related to non-GAAP adjustments(h) |
|
|
(26.6 |
) |
|
|
(24.9 |
) |
|
Adjusted Net Income |
|
$ |
63.7 |
|
|
$ |
58.1 |
|
|
|
(a) |
Represents loss on extinguishment of debt as described in Note 2(a) above. |
|
|
(b) |
Represents costs related to stock-based compensation associated with certain employees’ participation in the 2013 Plan and the 2017 Plan. |
|
|
(c) |
Represents deferred revenue charge as described in Note 2(c) above. |
|
|
(d) |
Represents the intangible asset impairment charge as described in Note 2(d) above. |
|
|
(e) |
Represents the annual management fee described in Note 2(e) above. |
|
|
(f) |
Represents other items described in Note 2(f) above. |
|
|
(g) |
We have historically grown our business through acquisitions and have therefore acquired significant intangible assets the value of which is amortized over time. These acquired intangible assets are amortized over an extended period ranging from seven to ten years from the date of each acquisition. |
|
|
(h) |
Reflects application of U.S. federal and state enterprise tax rate of 39.0% and 39.3% in 2016 and 2015, respectively. |
|
|
(4) |
Free Cash Flow is a financial measure that is not calculated in accordance with GAAP. For a discussion of our presentation of Free Cash Flow, see footnote 4 to the table under the heading “Comparison of the Year Ended December 31, 2017 to the Year Ended December 31, 2016”. |
|
|
|
Year Ended December 31, |
|
|||||
|
|
|
2016 |
|
|
2015 |
|
||
|
|
|
(unaudited) |
|
|||||
|
|
|
(dollars in millions) |
|
|||||
|
Net Cash Provided by Operating Activities |
|
$ |
93.0 |
|
|
$ |
87.8 |
|
|
Less: |
|
|
|
|
|
|
|
|
|
Capital expenditures |
|
|
3.4 |
|
|
|
2.8 |
|
|
Free Cash Flow |
|
$ |
89.6 |
|
|
$ |
85.0 |
|
Revenues
Revenues of $323.7 million for the year ended December 31, 2016 increased $17.3 million, or 5.7%, from $306.4 million for the year ended December 31, 2015. The increase in revenues reflected organic growth of 3.5%, acquisition-driven growth of 3.1% and a 0.9% decrease attributable to several small discontinued events. The incremental contributions from acquisitions of $9.6 million largely related to HOW and Fastener Expo, which we
53
acquired in 2015 after the respective shows were staged, and IGES, which we acquired in 2016. Organic growth of $10.6 million reflected low-to mid-single digit percentage growth across all our industry sectors, with the majority of the growth contributed by our largest industry sectors, Gift, Home & General Merchandise and Sports. In Gift, Home & General Merchandise, KBIS continued its strong momentum, and we successfully added a new regional ICFF event in Miami. Our major franchises, ASD Market Week and NY NOW, were both stable. In the Sports sector, the launch of new events in the outdoor and bicycle markets and continued strong performance by OR contributed to the sector’s growth. Elsewhere across our portfolio we experienced particularly robust growth in the Hospitality Design (Design & Construction), COUTURE (Jewelry) and Pizza Expo (Other Trade Shows) events, and also in Other Events, mitigated by modest declines in GlobalShop (Design & Construction), JA New York (Jewelry) and in our two photography shows.
Cost of Revenues
Cost of revenues of $84.4 million for the year ended December 31, 2016 increased $0.9 million, or 1.1%, from $83.4 million for the year ended December 31, 2015. Incremental costs from acquisitions contributed $2.1 million to cost of revenues, which was offset by savings of $1.9 million from discontinued events. The remaining increase of $0.7 million was mainly the result of several smaller event launches in 2016.
Selling, General and Administrative Expenses
Selling, general and administrative expenses of $98.9 million for the year ended December 31, 2016 increased $5.8 million, or 6.3%, from $93.1 million for the year ended December 31, 2015. Incremental costs from acquisitions added $3.0 million, which was partly offset by savings of $0.5 million from discontinued events. Stock-based compensation decreased by $2.1 million due to the graded vesting structure of the grants. We expensed $7.7 million of transaction and transition costs during 2016, mainly related to our six 2016 acquisitions, which was an increase of $1.2 million over 2015. In addition, we incurred $1.3 million of legal and consulting fees related to our IPO. The remaining $3.0 million increase was driven mainly by $2.3 million in higher salary costs and a $0.6 million increase in attendee marketing and other promotional expenses.
Depreciation and Amortization Expense
Depreciation and amortization expense of $40.0 million for the year ended December 31, 2016 increased $1.0 million, or 2.5%, from $39.1 million for the year ended December 31, 2015. The increase was comprised of $1.5 million in additional intangible asset amortization related to intangible assets acquired in the 2015 and 2016 acquisitions offset by depreciation and software amortization decreases of $0.4 million and $0.1 million, respectively.
Intangible Asset Impairment Charge
No impairment charge was recorded as a result of the annual impairment assessment of indefinite-lived intangible assets for the year ended December 31, 2015. As a result of the annual impairment assessment of indefinite-lived intangible assets, we recorded a $8.9 million impairment charge related to our trade name intangible assets for the year ended December 31, 2015. The main drivers of the impairment charge were a slight decrease in the royalty rate assumption used in the valuation calculation and a modest increase in the weighted average cost of capital assumption.
Interest Expense
Interest expense of $51.4 million for the year ended December 31, 2016 decreased $0.5 million, or 1.0%, from $51.9 million for the year ended December 31, 2015. The decrease was primarily due to a $3.2 million decrease in interest expense associated with the full redemption of the $200.0 million of Senior Notes in October 2016, offset by third party fees of $2.5 million incurred in connection with the borrowing of $200.0 million in incremental term loans under the Term Loan Facility, $0.6 million of additional deferred financing fees and original issue discount amortization related to a prior year optional term loan prepayment and a $0.3 million increase in interest expense on the Term Loan Facility due to a slightly higher average debt balance for the period as a result of the incremental
54
borrowing in October 2016. In addition, there was a $0.7 million decrease in realized and unrealized loss on interest rate swap and floor, net.
Loss on Extinguishment of Debt
Loss on extinguishment of debt was $12.8 million for the year ended December 31, 2016. On October 28, 2016, we redeemed all $200.0 million of our 9.00% Senior Notes at a redemption price of 104.5%. In addition to the $9.0 million redemption premium, we wrote off unamortized deferred financing fees of $3.8 million as a result of the extinguishment. We did not incur any loss on extinguishment of debt during the year ended December 31, 2015.
Provision for Income Taxes
For the years ended December 31, 2016 and 2015, we recorded provisions for income taxes of $14.0 million and $10.3 million, respectively, which resulted in effective tax rates of 38.9% and 34.5%. The differences between the effective tax rates and the U.S. federal statutory rates are primarily attributable to changes in our state apportionment factors. The year-over-year increase in our provision for income taxes of $3.8 million was primarily attributable to increases in our pre-tax income.
Net Income; Adjusted EBITDA; Adjusted Net Income
Net income of $22.2 million for the year ended December 31, 2016 increased $2.5 million, or 13.0%, from $19.6 million for the year ended December 31, 2015. The increase was attributable to contributions from acquisitions during 2015 and 2016 and the elimination of certain losses associated with discontinued events, as well as solid organic growth in our overall business, partly offset by the $12.8 million loss on extinguishment of debt incurred on the redemption of our $200.0 million of Senior Notes during 2016. Adjusted EBITDA of $152.1 million for the year ended December 31, 2016 increased $9.4 million, or 6.6%, from $142.8 million for the year ended December 31, 2015. The reasons for the increase in Adjusted EBITDA were the same as for the increases in net income. In addition, Adjusted EBITDA benefited from the exclusion of the $12.8 million loss on extinguishment of debt, a $2.5 million increase in transaction and transition costs, $1.0 million of higher depreciation and amortization expense and $3.8 million of higher income tax expense in the year ended December 31, 2016 versus the prior year. These benefits were partly offset by the absence of the prior year $8.9 million intangible asset impairment charge add-back and $4.9 million of combined reductions from lower stock-based compensation costs, lower interest expense and deferred revenue adjustments. Adjusted Net Income for the year ended December 31, 2016 of $63.7 million increased $5.6 million, or 9.6%, from $58.1 million for the year ended December 31, 2015. The reasons for the increase in Adjusted Net Income were the same as the reasons for the increase in Adjusted EBITDA offset by the absence of the $3.8 million add-back for increase in income tax expense.
Adjusted EBITDA and Adjusted Net Income are financial measures that are not calculated in accordance with GAAP. For a discussion of our presentation of Adjusted EBITDA, see footnote 2 to the table under the heading to the table under the heading “Comparison of the Year Ended December 31, 2017 to the Year Ended December 31, 2016”. For a discussion of our presentation of Adjusted Net Income, see footnote 3 to the table under the heading “Comparison of the Year Ended December 31, 2017 to the Year Ended December 31, 2016.”
Liquidity and Capital Resources
Liquidity describes the ability of a company to generate sufficient cash flows to meet the cash requirements of its business operations, including working capital needs, debt service, acquisitions, other commitments and contractual obligations. We consider liquidity in terms of cash flows from operations and their sufficiency to fund our operating and investing activities.
We expect to continue to finance our liquidity requirements through internally generated funds and borrowings under our Amended and Restated Revolving Credit Facility. We believe that our projected cash flows generated from operations, together with borrowings under our Amended and Restated Revolving Credit Facility are sufficient to fund our principal debt payments, interest expense, working capital needs and expected capital
55
expenditures for the next twelve months. We may draw on our Amended and Restated Revolving Credit Facility from time to time to fund or partially fund an acquisition.
As of December 31, 2017, we had $554.2 million of borrowings outstanding under the Amended and Restated Term Loan Facility, which included unamortized deferred financing fees of $4.4 million and unamortized original issue discount of $3.6 million, with an additional $149.1 million available to borrow (after giving effect to $0.9 million letters of credit outstanding) under the Amended and Restated Revolving Credit Facility. See “--Long-Term Debt-Amended and Restated Senior Secured Credit Facilities” below for more detail regarding the terms of our Amended and Restated Senior Secured Credit Facilities.
Dividend Policy
We paid a dividend of $0.07 per share in each of the second, third and fourth quarters of 2017. On January 26, 2018, our board of directors approved the payment of a cash dividend of $0.07 (or $5.1 million in the aggregate) per share for the quarter ending March 31, 2018 to holders of record of the Company’s common stock. The dividend is expected to be paid on or about February 23, 2018 to holders of record of our common stock as of February 9, 2018. The payment of any such dividend in future quarters is subject to the discretion of our board of directors and depending upon our results of operations, cash requirements, financial condition, contractual restrictions, restrictions imposed by applicable laws and other factors that our board of directors may deem relevant, and the amount of any future dividend payment may be changed or terminated in the future at any time and for any reason without advance notice.
Our business is conducted through our subsidiaries. Dividends, distributions and other payments from, and cash generated by, our subsidiaries will be our principal sources of cash to repay indebtedness, fund operations and pay dividends. Accordingly, our ability to pay dividends to our stockholders is dependent on the earnings and distributions of funds from our subsidiaries. In addition, the covenants in the agreements governing our existing indebtedness, including the Amended and Restated Senior Secured Credit Facilities, significantly restrict the ability of our subsidiaries to pay dividends or otherwise transfer assets to us. See “—Long-Term Debt”, “Risk Factors—Risks Relating to Ownership of Our Common Stock—Because we are a holding company with no operations of our own, we rely on dividends, distributions, and transfers of funds from our subsidiaries” and “Risk Factors—Risks Relating to Ownership of Our Common Stock—We cannot assure you that we will continue to pay dividends on our common stock, and our indebtedness could limit our ability to pay dividends on our common stock.”
We did not declare or pay any dividends on our common stock in 2015 or 2016.
Cash Flows
The following table summarizes the changes to our cash flows for the periods presented:
|
|
|
Year Ended December 31, |
|
|||||||||
|
|
|
2017 |
|
|
2016 |
|
|
2015 |
|
|||
|
Statement of Cash Flows Data |
|
(dollars in millions) |
|
|||||||||
|
Net cash provided by operating activities |
|
$ |
110.8 |
|
|
$ |
93.0 |
|
|
$ |
87.8 |
|
|
Net cash used in investing activities |
|
$ |
(95.5 |
) |
|
$ |
(51.9 |
) |
|
$ |
(87.0 |
) |
|
Net cash used in financing activities |
|
$ |
(19.3 |
) |
|
$ |
(42.4 |
) |
|
$ |
(26.3 |
) |
Operating Activities
Operating activities consist primarily of net income adjusted for noncash items that include depreciation and amortization, deferred income taxes, amortization of deferred financing fees and debt discount, share-based compensation and intangible asset impairment charges, plus the effect of changes during the period in our working capital.
56
Net cash provided by operating activities for the year ended December 31, 2017 increased $17.8 million, or 19.1%, to $110.8 million from $93.0 million during the year ended December 31, 2016. The increase was primarily due to a $59.6 million increase in net income and a $7.6 million increase in cash generated by working capital. These increases were offset by a $50.8 million increase in non-cash outflows which were primarily related to the revaluation of our deferred tax liabilities as a result of the Tax Cuts and Jobs Act. Net cash provided by operating activities for the year ended December 31, 2016 increased $5.2 million, or 5.9%, to $93.0 million from $87.8 million during the year ended December 31, 2015. The increase was primarily due to the $2.5 million increase in net income and a $7.3 million increase in cash generated from working capital, offset by a $4.6 million decrease in adjustments to net income primarily due to the prior year intangible asset impairment charge adjustment. Net income plus noncash items provided operating cash flows of $94.7 million, $84.7 million and $86.9 million for the years ended December 31, 2017, 2016 and 2015, respectively. Changes in working capital generated cash of $16.1 million, $8.3 million and $0.9 million for the years ended December 31, 2017, 2016 and 2015, respectively.
Investing Activities
Investing activities consist of business acquisitions and purchases of other productive assets, investments in information technology and capital expenditures to furnish or upgrade our offices.
Net cash used in investing activities for the year ended December 31, 2017 increased $43.6 million, or 84.0%, to $95.5 million from $51.9 million in the year ended December 31, 2016. The increase was due to more cash being used for acquisitions during the year ended December 31, 2017 than in the prior year. In the year ended December 31, 2017 we completed four acquisitions for an aggregate cash consideration of $92.5 million, while six relatively smaller acquisitions were completed in the prior year for aggregate cash consideration of $48.4 million. Net cash used in investing activities for the year ended December 31, 2016 decreased $35.1 million, or 40.3%, to $51.9 million from $87.0 million in the year ended December 31, 2015. In 2016, our primary investing cash outflows consisted of $16.5 million for two acquisitions and of $2.2 million for capital expenditures and intangible assets. In the year ended December 31, 2015, we completed four acquisitions for an aggregate cash consideration of $84.3 million. In 2016, our primary investing cash outflows consisted of $48.4 million for six acquisitions. See Note 3 in the notes to the audited consolidated financial statements included elsewhere in this Annual Report on Form 10-K for additional information with respect to the acquisitions. We have minimal capital expenditure requirements. Capital expenditures totaled $3.0, $3.4 million and $2.8 million in the years ended December 31, 2017, 2016 and 2015, respectively.
Financing Activities
Financing activities primarily consist of borrowing and repayments on our debt to fund business acquisitions and our operations.
Net cash used in financing activities for the year ended December 31, 2017 was $19.3 million, comprised of net proceeds from the issuance of common stock in conjunction with our IPO of $159.1 million and net proceeds from the issuance of term loans under the Amended and Restated Senior Secured Credit Facilities of $13.0 million. These sources of cash were offset by the use of $159.2 million to prepay our Term Loan Facility, the payment of $12.6 million in contingent consideration related to the 2016 Acquisitions and the 2017 Acquisitions, $15.2 million in quarterly dividend payments, $4.7 million in debt issuance costs and $5.0 million in scheduled quarterly principal payments on the Term Loan Facility. Net cash used in financing activities for the year ended December 31, 2016 was $42.4 million, comprised of the redemption of our $200.0 million Senior Notes, the incurrence of incremental term loans in the amount of $200.0 million, net of a $1.0 million original issue discount, a $30.0 million optional term loan prepayment; $6.9 million in scheduled quarterly principal payments on the Term Loan Facility; the payment of $4.5 million related to the Fastener Expo acquisition, which closed in the fourth quarter of 2015; and a minor cash payment for repurchase of common stock, partially offset by proceeds from the sale of common stock to a new director. Net cash used in financing activities for the year ended December 31, 2015 consisted of an optional term loan prepayment of $20.0 million and $6.3 million related to scheduled quarterly principal payments on the Term Loan Facility.
57
Free Cash Flow of $107.4 million for the year ended December 31, 2017 increased $17.8 million, or 19.9% from $89.6 million for the year ended December 31, 2016. Free Cash Flow of $89.6 million for the year ended December 31, 2016 increased $4.6 million, or 5.4%, from $85.0 million for the year ended December 31, 2015.
Free Cash Flow is a financial measure that is not calculated in accordance with GAAP. For a discussion of our presentation of Free Cash Flow, see footnote 4 to the table under the heading “Results of Operations - Comparison of the Year Ended December 31, 2017 to the Year Ended December 31, 2016”.
Interest Rate Swap and Floor
In March 2014, we entered into forward interest rate swap and floor contracts with the Royal Bank of Canada, which modify our exposure to interest rate risk by effectively converting $100.0 million of floating-rate borrowings under our Term Loan Facility to a fixed rate basis, thus reducing the impact of interest rate changes on future interest expense. The swap agreement involves the receipt of floating rate amounts at three-month LIBOR in exchange for fixed rate interest payments at 2.705% over the life of the agreement without an exchange of the underlying principal amount of $100.0 million. When the three-month LIBOR rate drops below 1.25%, the interest rate floor contract requires us to make variable payments based on an underlying principal amount of $100.0 million and the differential between the three-month LIBOR rate and 1.25%. The interest rate swap and floor have an effective date of December 31, 2015 and are settled on the last business day of each month of March, June, September and December, beginning March 31, 2016 through December 31, 2018.
The interest rate swap and floor have not been designated as effective hedges for accounting purposes. Accordingly, we mark to market the interest rate swap and floor quarterly with the unrealized gain or loss recognized in unrealized net loss on interest swap and floor in our consolidated statements of income and comprehensive income, and the net liability included in accounts payable and other current liabilities and other noncurrent liabilities in the consolidated balance sheets.
For the year ended December 31, 2017 we recorded an unrealized net gain of $1.4 million and a realized loss of $1.4 million on our interest rate swap and floor agreement in the consolidated statement of income and comprehensive income. For the year ended December 31, 2016 we recorded an unrealized net gain of $0.7 million and a realized loss of $1.5 million on our interest rate swap and floor agreement in the consolidated statement of income and comprehensive income. For the year ended December 31, 2015, we recorded an unrealized net loss of $1.5 million on our interest rate swap and floor in the consolidated statement of income and comprehensive income. The impact of the gains and losses on the interest rate swap and floor agreement is recorded in interest expense. The interest rate swap and floor contracts have been designated as Level 2 financial instruments. At December 31, 2017, $0.8 million of the interest rate swap and floor liability was included in accounts payable and other current liabilities on the consolidated balance sheet. At December 31, 2016, $1.5 million of the interest rate swap and floor liability was included in accounts payable and other current liabilities and $0.8 million was included in other noncurrent liabilities on the consolidated balance sheet.
Off-Balance Sheet Commitments
We are not party to, and do not typically enter into any, off-balance sheet arrangements.
Long-Term Debt
Amended and Restated Senior Secured Credit Facilities
On October 28, 2016, EEH entered into a third amendment to our then-existing senior secured credit facilities to (i) borrow an additional $200.0 million of term loans under the term loan facility to fund the redemption of $200.0 million in aggregate principal amount of the Company’s 9.000% Senior Notes and (ii) increase commitments under the revolving credit facility by $10.0 million to a total of $100.0 million. On May 8, 2017, using the net proceeds to us from the IPO, we prepaid $159.2 million of borrowings outstanding under the then-existing term loan facility.
58
On May 22, 2017, EEH amended and restated our then-existing senior secured credit facilities; the Amended and Restated Senior Secured Credit Facilities now consist of (i) the Amended and Restated Term Loan Facility, a seven-year $565.0 million senior secured term loan facility, scheduled to mature on May 22, 2024 (the “Amended and Restated Term Loan Facility”) and (ii) the Amended and Restated Revolving Credit Facility, a $150.0 million senior secured revolving credit facility, scheduled to mature on May 23, 2022 (the “Amended and Restated Revolving Credit Facility” and, together with the Amended and Restated Term Loan Facility, the “Amended and Restated Senior Secured Credit Facilities”). On November 27, 2017, EEH entered into the Refinancing Agreement and First Amendment to our Amended and Restated Credit Facilities to reduce the interest rate applicable to term loans under the Amended and Restated Term Loan Facility by 0.25% and on November 29, 2017, EEH entered into the Repricing Agreement and Second Amendment to Amended and Restated Credit Agreement to reduce the interest rate applicable to revolving loans under the Amended and Restated Revolving Credit Agreement by 0.25%.
Following the November 2017 repricing, loans under the Amended and Restated Senior Secured Credit Facilities bear interest at a rate equal to, at EEH’s option, either:
|
(a) |
a base rate equal to the greatest of: (i) the administrative agent’s prime rate; (ii) the federal funds effective rate plus 50 basis points and (iii) one month LIBOR plus 1.00%; in each case plus 1.75%, or |
|
(b) |
LIBOR plus 2.75%; |
in each case, subject to one step-down of 0.25% upon achievement of a Total First Lien Net Leverage Ratio (as defined in the Amended and Restated Senior Secured Credit Facilities) of 2.75 to 1.00 and, with respect to the Amended and Restated Revolving Credit Facility only, one additional step-down of 0.25% upon achievement of a Total First Lien Net Leverage Ratio of 2.50 to 1.00.
The Amended and Restated Senior Secured Credit Facilities also include an uncommitted incremental facility which, subject to certain conditions, provides for additional term loans in the sum of:
|
(X) |
(i) if the incremental loans are first lien loans, an amount such that the Total First Lien Net Leverage ratio does not exceed 4.00:1.00, |
|
(ii) |
if the incremental loans are junior lien loans, an amount such that the Total Net Secured Leverage Ratio (as defined in the Amended and Restated Senior Secured Credit Facilities) does not exceed 4.00:1.00, |
|
(iii) |
if the incremental loans are unsecured, an amount such that either the Total Net Leverage Ratio does not exceed 5.00:1.00 or the Fixed Charge Coverage Ratio (as defined in the Amended and Restated Senior Secured Credit Facilities) is not less than 2.00:1.00, or, in each case, if the incremental loans are incurred with a permitted acquisition, an amount such that the applicable leverage ratio will not increase as a result of the permitted acquisition (on a pro forma basis giving effect to the incremental loans); plus |
|
(Y) |
an amount equal to certain prior voluntary prepayments, loan buybacks and commitment reductions of loans under the Amended and Restated Senior Secured Credit Facilities, plus |
|
(Z) |
an amount equal to the greater of $160 million and 100% of Acquisition Adjusted EBITDA (which is defined as “Consolidated EBITDA” in the credit agreement governing the Amended and Restated Senior Secured Credit Facilities and presented below). |
The Amended and Restated Revolving Credit Facility is subject to payment of a commitment fee of 0.50% per annum, calculated on the unused portion of the facility, which may be reduced to 0.375% upon achievement of a Total First Lien Net Leverage Ratio of 3.50 to 1.00. Upon the issuance of letters of credit under the Amended and Restated Senior Secured Credit Facilities, EEH is required to pay fronting fees, customary issuance and administration fees and a letter of credit fee equal to the then-applicable margin (as determined by reference to LIBOR) for the Amended and Restated Revolving Credit Facility.
The Amended and Restated Term Loan Facility requires scheduled quarterly payments, each equal to 0.25% of the original principal amount of the loans made under the Amended and Restated Term Loan Facility on May 22, 2017.
59
The Amended and Restated Senior Secured Credit Facilities requires certain mandatory prepayments of outstanding loans under the Amended and Restated Term Loan Facility, subject to certain exceptions, based on (i) a percentage of net cash proceeds of certain asset sales and casualty and condemnation events in excess of certain thresholds (subject to certain reinvestment rights), (ii) net cash proceeds of any issuance of debt, excluding permitted debt issuances and (iii) a percentage of Excess Cash Flow (as defined in the Amended and Restated Senior Secured Credit Facilities) in excess of certain thresholds during a fiscal year.
Subject to certain customary exceptions and limitations, all obligations under the Amended and Restated Senior Secured Credit Facilities are guaranteed by Expo Event Midco, Inc. (“EEM”) and all of EEH’s direct and indirect wholly-owned domestic subsidiaries, and such obligations and the related guarantees are secured by a perfected first priority security interest in substantially all tangible and intangible assets owned by EEH or by any guarantor.
The Amended and Restated Senior Secured Credit Facilities contain a number of customary incurrence-based covenants imposing certain restrictions on our business, including limitations on indebtedness; limitations on liens; limitations on certain fundamental changes (including, without limitation, mergers, consolidations, liquidations and dissolutions); limitations on asset sales; limitations on dividends and other restricted payments; limitations on investments, loans and advances; limitations on certain repayments of subordinated indebtedness; limitations on transactions with affiliates; limitations on changes in fiscal periods; limitations on agreements restricting liens and/or dividends; and limitations on changes in lines of business.
Certain of these incurrence-based covenants restrict, subject to various exceptions, our ability to take certain actions (such as incurring additional secured and unsecured indebtedness, making certain investments and paying certain dividends) unless we meet certain minimum Fixed Charge Coverage Ratio or maximum Total First Lien Net Leverage Ratio and/or Total Net Secured Leverage Ratio standards. These ratios are calculated on the basis of our Acquisition Adjusted EBITDA (which is defined as “Consolidated EBITDA” in the credit agreement governing the Amended and Restated Senior Secured Credit Facilities), calculated on a trailing four-quarter basis.
Acquisition Adjusted EBITDA is defined as net income before interest expense, loss on extinguishment of debt, income tax expense, depreciation and amortization, stock-based compensation, deferred revenue adjustment, intangible asset impairment charge, unrealized loss on interest rate swap and floor, net, the Onex management fee (prior to our IPO), other items that management believes are not part of our core operations and the results of shows associated with acquisitions made during the period presented and for timing differences with respect to annual trade shows. Acquisition Adjusted EBITDA is not defined under GAAP, and is subject to important limitations, including that it excludes certain normal recurring expenses and one-time cash adjustments that we consider to not be indicative of our ongoing operating performance. Because not all companies use identical calculations, our presentation of Acquisition Adjusted EBITDA may not be comparable to other similarly titled measures used by other companies.
60
For the year ended December 31, 2017, our Acquisition Adjusted EBITDA was $161.9 million. A reconciliation of Acquisition Adjusted EBITDA to net income is presented below:
|
|
|
(unaudited) |
|||
|
|
|
(dollars in millions) |
|||
|
Net income |
|
$ |
81.8 |
|
|
|
Add (Deduct): |
|
|
|
|
|
|
Interest expense |
|
|
33.8 |
|
|
|
Refinancing and repricing fees |
|
|
4.5 |
|
|
|
Loss on extinguishment of debt(a) |
|
|
3.0 |
|
|
|
(Benefit from) provision for income taxes |
|
|
(35.0 |
) |
|
|
Depreciation and amortization expense |
|
|
43.2 |
|
|
|
Stock-based compensation expense(b) |
|
|
2.4 |
|
|
|
Deferred revenue adjustment(c) |
|
|
0.5 |
|
|
|
Management fee(d) |
|
|
0.2 |
|
|
|
Contract termination costs (e) |
|
|
10.0 |
|
|
|
Other items(f) |
|
|
13.5 |
|
|
|
Adjusted EBITDA |
|
$ |
157.9 |
|
|
|
Add: |
|
|
|
|
|
|
Acquisitions (g) |
|
|
4.0 |
|
|
|
Acquisition Adjusted EBITDA |
|
$ |
161.9 |
|
|
|
|
|
|
|
|
|
|
|
(a) |
Represents loss on extinguishment of debt as described in Note 2(a) above. |
|
|
(b) |
Represents costs related to stock-based compensation associated with certain employees’ participation in the 2013 Plan and the 2017 Plan. |
|
|
(c) |
Represents deferred revenue charge as described in Note 2(c) above. |
|
|
(d) |
Represents the annual management fee described in Note 2(e) above. |
|
|
(e) |
Represents the contract termination costs described in Note 2(f) above. |
|
|
(f) |
Represents other items described in Note 2(f) above. |
|
|
(g) |
Represents the Adjusted EBITDA of acquisitions completed in 2017, with the exception of SIA Snow Show, where the results of such acquisitions have not been captured in our consolidated financial statements for the year ended December 31, 2017. |
In addition, the Amended and Restated Revolving Credit Facility contains a financial maintenance covenant (the “Financial Covenant”) requiring EEH to comply with a 5.50 to 1.00 Total First Lien Net Leverage Ratio, which is defined as the ratio of Consolidated Total Debt (as defined in the Amended and Restated Senior Secured Credit Facilities) secured on a first lien basis, net of unrestricted cash and cash equivalents (“Total First Lien Net Debt”) to Acquisition Adjusted EBITDA. This financial covenant is tested quarterly only if the aggregate amount of revolving loans, swingline loans and letters of credit outstanding under the Amended and Restated Revolving Credit Facility (net of up to $10.0 million of outstanding letters of credit) exceeds 35% of the total commitments thereunder. We were not required to test the Financial Covenant at December 31, 2017.
Events of default under the Amended and Restated Senior Secured Credit Facilities include, among others, nonpayment of principal when due; nonpayment of interest, fees or other amounts; cross-defaults; covenant defaults; material inaccuracy of representations and warranties; certain bankruptcy and insolvency events; material unsatisfied or unstayed judgments; certain ERISA events; change of control; or actual or asserted invalidity of any guarantee or security document.
As of December 31, 2017, we were in compliance with the terms of the Amended and Restated Senior Secured Credit Facilities.
61
Modifications to our Debt Agreements
We may, from time to time, repurchase or otherwise retire or extend our debt and/or take other steps to reduce our debt, lower our interest payments or otherwise improve our financial position. These actions may include open market debt repurchases, negotiated repurchases, other retirements of outstanding debt and/or opportunistic refinancing, amendment or repricing of debt. The amount of debt that may be repurchased or otherwise retired or refinanced, if any, will depend on market conditions, trading levels of our debt, our cash position, compliance with debt covenants and other considerations. Our affiliates may also purchase our debt from time to time, through open market purchases or other transactions. In such cases, our debt may not be retired, in which case we would continue to pay interest in accordance with the terms of the debt, and we would continue to reflect the debt as outstanding in our consolidated balance sheets.
Contractual Obligations and Commercial Commitments
The table below summarizes our contractual obligations as of December 31, 2017. The table assumes only the 2018 mandatory prepayment pursuant to the Term Loan Facility’s excess cash flow sweep.
|
|
|
Payments Due By Period |
|
|||||||||||||||||
|
|
|
Total |
|
|
Less Than 1 Year |
|
|
1-3 Years |
|
|
3-5 Years |
|
|
More Than 5 Years |
|
|||||
|
|
|
(dollars in thousands) |
|
|||||||||||||||||
|
Contractual obligations(1) |
|
$ |
70.0 |
|
|
$ |
39.7 |
|
|
$ |
30.0 |
|
|
$ |
0.3 |
|
|
|
— |
|
|
Long-term debt obligations(2) |
|
|
562.7 |
|
|
|
5.7 |
|
|
|
17.0 |
|
|
|
540.0 |
|
|
|
— |
|
|
Operating lease obligations(3) |
|
|
32.4 |
|
|
|
5.9 |
|
|
|
12.8 |
|
|
|
8.4 |
|
|
|
5.3 |
|
|
Interest on long-term debt obligations(4) |
|
|
156.2 |
|
|
|
25.1 |
|
|
|
73.9 |
|
|
|
57.2 |
|
|
|
— |
|
|
Totals: |
|
$ |
821.3 |
|
|
$ |
76.4 |
|
|
$ |
133.7 |
|
|
$ |
605.9 |
|
|
$ |
5.3 |
|
|
(1) |
We have entered into certain contractual obligations to secure trade show venues. These agreements are not unilaterally cancelable by us, are legally enforceable and specify fixed or minimum amounts or quantities of goods or services at fixed or minimum prices. |
|
(2) |
Represents principal obligations with respect to borrowings under the Amended and Restated Term Loan Facility. |
|
(3) |
We have entered into certain operating leases for real estate facilities. These agreements are not unilaterally cancellable by us, are legally enforceable and specify fixed or minimum amounts of rents payable at fixed or minimum prices. |
|
(4) |
Represents interest expense on borrowings under the Amended and Restated Term Loan Facility using the interest rates in effect at December 31, 2017. Actual cash flows may differ significantly due to changes in underlying estimates. |
Critical Accounting Policies and Estimates
The preparation of financial statements in conformity with accounting principles generally accepted in the United States requires the appropriate application of certain accounting policies, some of which require us to make estimates and assumptions about future events and their impact on amounts reported in our consolidated financial statements. Since future events and their impact cannot be determined with absolute certainty, the actual results will inevitably differ from our estimates.
We believe the application of our accounting policies, and the estimates inherently required therein, are reasonable. Our accounting policies and estimates are reevaluated on an ongoing basis and adjustments are made when facts and circumstances dictate a change.
The policies and estimates discussed below involve the selection or application of alternative accounting policies that are material to our consolidated financial statements. With respect to critical accounting policies, even a relatively minor variance between actual and expected experience can potentially have a materially favorable or
62
unfavorable impact on subsequent results of operations. For instance, in 2015 a relatively minor change in our weighted average cost of capital and assumed royalty rate was the primary driver of an $8.9 million intangible asset impairment charge.
Our accounting policies are more fully described in Note 1, “Description of Business, Basis of Presentation and Significant Accounting Policies” in the notes to our audited consolidated financial statements included elsewhere in this Annual Report on Form 10-K. Management has discussed the selection of these critical accounting policies and estimates with members of our board of directors.
We have certain accounting policies that require more significant management judgment and estimates than others. These include our accounting policies with respect to revenue recognition, goodwill and indefinite-lived intangibles, definite-lived intangibles, share-based compensation and accounting for income taxes, which are more fully described below.
Revenue Recognition, Deferred Revenue and Allowance for Doubtful Accounts
A significant portion of our annual revenue is generated from the production of trade shows and other events, including booth space sales, registration fees and sponsorship fees. Revenues from trade shows and other events represented approximately 93%, 92% and 92% of our total revenues for the years ended December 31, 2017, 2016 and 2015, respectively. Exhibitors contract for their booth space and sponsorships up to a year in advance of the trade show. Fees are typically invoiced and collected in-full prior to the trade show or event and deferred until the event takes place and the revenue earnings process is substantially complete. Similarly, attendees register and are typically qualified for attendance prior to the show staging. Attendee registration revenues are also collected prior to the show and deferred until the show stages. Because we collect our booth space, sponsorship and attendee registration revenue prior to the trade show staging, we do not incur substantial bad debt expense with relation to these revenue streams. Any trade show related receivables outstanding 60 days following the month in which a trade show stages are fully reserved for in the allowance for doubtful accounts.
The remaining portion of our revenues primarily consist of advertising sales for industry publications, which are recognized in the period in which the publications are issued. Typically, the fees we charge are collected after the publications are issued.
Management records an allowance for doubtful accounts based on historical experience and a detailed assessment of the collectability of our accounts receivable related to advertising sales.
Goodwill and Trade Name Intangibles
Goodwill is recorded as the difference, if any, between the aggregate consideration paid for an acquisition and the fair value of the assets acquired and liabilities assumed resulting from acquisitions. Goodwill and indefinite-lived intangible assets are not amortized but instead tested for impairment at least annually or more frequently should an event or circumstances indicate that a reduction in fair value of the reporting unit may have occurred. We test for impairment on October 31 of each year, or more frequently if events and circumstances warrant. Such events and circumstances may be a significant change in our business climate, economic and industry trends, legal factors, negative operating performance indicators, significant competition or changes in strategy. We perform our goodwill and indefinite-lived intangible assets impairment test at the reporting unit level and asset grouping level, respectively, and have determined we operate under one reporting unit and asset grouping.
In testing goodwill for impairment, we first assess qualitative factors to determine whether the existence of events or circumstances leads to a determination that it is more likely than not that the fair value of a reporting unit is less than its carrying amount. If, after assessing the totality of events or circumstances, we determine it is not more likely than not that the fair value of a reporting unit is less than its carrying amount, then additional impairment testing is not required. If the carrying amount of goodwill exceeds the fair value, an impairment loss is recognized in an amount equal to the excess of the carrying amount over the fair value.
63
The annual evaluation for impairment of indefinite lived intangible assets is a two-step process. The first step is to perform a qualitative impairment assessment. If this qualitative assessment indicates that, more likely than not, the indefinite lived intangible assets are not impaired, then no further testing is performed. If the qualitative assessment indicates that, more likely than not, the indefinite lived intangible assets are impaired, then the fair value of the indefinite lived intangible assets must be calculated. If the carrying value exceeds the fair value, an impairment loss is recorded for that excess.
Determining the fair value of a reporting unit or an indefinite-lived intangible asset is judgmental in nature and involves the use of significant estimates and assumptions. These estimates and assumptions include revenue growth rates, weighted average cost of capital and royalty rates. We base our fair value estimates on assumptions we believe to be reasonable but which are unpredictable and inherently uncertain. Actual future results may differ from the estimates.
In the course of performing the annual qualitative assessment of our indefinite-lived intangible assets for the year ended December 31, 2015, an increase in our weighted average cost of capital and a decrease in our royalty rate assumptions used in calculating the fair value of indefinite-lived intangibles were determined sufficient to represent impairment indicators which qualified as a triggering event to move to step two of the impairment test. Management engaged a third-party valuation specialist to perform the relief from royalty calculation to assist in the determination of the implied fair value of our indefinite-lived intangible assets. As a result of this calculation, the implied fair value of the indefinite-lived intangible assets was deemed to be lower than the carrying value. An impairment charge of $8.9 million was recorded in intangible asset impairment charge in the consolidated statements of income and comprehensive income to align the carrying value of our indefinite-lived intangible assets with their implied fair value. No impairment was identified as a result of our annual qualitative assessment of our indefinite-lived intangible assets for the years ended December 31, 2017 and 2016.
No impairment was identified as a result of the analysis performed in connection with our annual test of goodwill for the years ended December 31, 2017, 2016 and 2015, as the estimated fair value of goodwill as of the impairment testing date significantly exceeded its carrying value.
Customer-Related Intangibles and Other Amortized Intangible Assets
Intangible assets with finite lives are stated at cost, less accumulated amortization and impairment losses, if any. These intangible assets are amortized on a straight-line basis over the following estimated useful lives, which are reviewed annually:
|
|
|
2017 |
|
|||
|
|
|
Estimated Useful Life |
|
Weighted Average |
|
|
|
Customer-related intangibles |
|
7-10 years |
|
|
9 |
|
|
Computer software |
|
3-7 years |
|
|
6 |
|
With respect to business acquisitions, the fair values of acquired customer-related intangibles are estimated using a discounted cash flow analysis. Input assumptions regarding future cash flows, growth rates, discount rates and tax rates used in developing the present value of future cash flow projections are the basis of the fair value calculations.
Stock-Based Compensation
Following the IPO, the fair value per share of our common stock for purposes of determining share-based compensation is the closing price of our common stock as reported on the New York Stock Exchange on the applicable grant date.
Prior to the IPO, certain of our officers, non-employee directors, consultants and employees received stock-based compensation pursuant to our 2013 Option Plan. We calculate stock-based compensation expense for each vesting tranche of stock options using the Black-Scholes option pricing model and recognize such costs, net of forfeitures, within the consolidated statements of income and comprehensive income; however, no expense is
64
recognized for awards that do not ultimately vest. The determination of the grant date fair value of stock options using an option-pricing model is affected by a number of assumptions, such as the fair value of the underlying stock, our expected stock price volatility over the expected term of the options, stock option forfeiture behaviors, risk-free interest rates and expected dividends, which we estimated as follows:
|
• |
Fair Value of our Common Stock — Due to the absence of an active market for our common stock prior to the IPO, the fair value for purposes of determining the exercise price for pre-IPO stock option grants and the fair value at grant date was determined utilizing commonly accepted valuation practices. The exercise price was set at least equal to the fair value of our common stock on the date of grant. The key assumptions used in our valuations to determine the fair value of our common stock included our historical and projected operating and financial performance; observed market multiples for comparable businesses; the uncertainty in our business associated with economic conditions; the fact that equity incentive grants relate to illiquid securities in a private company that had no liquid trading market; and the likelihood of achieving a liquidity event, such as an initial public offering or sale of our company. Each of these assumptions involves highly complex and subjective estimates. |
|
• |
Expected Term — For pre and post IPO stock option grants, the expected option term represents the period of time the option is expected to be outstanding. The simplified method is used to estimate the term since we do not have sufficient exercise history to calculate the expected term of stock options. |
|
• |
Volatility — For pre and post IPO stock option grants, we determine the expected volatility based on historical average volatilities of similar publicly traded companies corresponding to the expected term of the awards. |
|
• |
Risk-Free Rate — For pre and post IPO stock options, the risk-free rate is based on the yields of United States Treasury securities with maturities similar to the expected term of stock option for each stock option grant. |
|
• |
Forfeiture Rate — For pre and post IPO stock options, our estimates of pre-vesting forfeitures, or forfeiture rates, were based on our internal analysis, which primarily considers the award recipients’ position within the company. |
|
• |
Dividend Yield — Prior to the IPO, we had never declared or paid any cash dividends and had no intention to pay cash dividends. Consequently, we used an expected dividend yield of zero with respect to pre-IPO options. In connection with our IPO, we adopted a policy of paying quarterly cash dividends on our common stock. Our post-IPO stock option grants include an expected dividend yield which is commensurate with the annual dividends we have been paying since the IPO. |
See Note 9 in the notes to the consolidated financial statements included elsewhere in this Annual Report on Form 10-K for additional information with respect to stock-based compensation.
Income Taxes
We provide for income taxes utilizing the asset and liability method of accounting. Under this method, deferred income taxes are recorded to reflect the tax consequences in future years of differences between the tax bases of assets and liabilities and their financial reporting amounts at each balance sheet date, based on enacted tax laws and statutory tax rates applicable to the periods in which the differences are expected to affect taxable income. If it is determined that it is more likely than not that future tax benefits associated with a deferred tax asset will not be realized, a valuation allowance is provided. The effect on deferred tax assets and liabilities of a change in the tax rates is recognized in the consolidated statements of income and comprehensive income as an adjustment to income tax expense in the period that includes the enactment date.
We record a liability for unrecognized tax benefits resulting from uncertain tax positions taken or expected to be taken in a tax return. We recognize interest and penalties, if any, related to unrecognized tax benefits in income tax expense. See Note 12 “Income Taxes” in the notes to our audited consolidated financial statements included elsewhere in this Annual Report on Form 10-K.
65
Item 7A. Quantitative and Qualitative Disclosures About Market Risk.
Market risk is the potential loss arising from adverse changes in market rates and prices. Our primary exposure to market risk is interest rate risk associated with the unhedged portion of our Amended and Restated Senior Secured Credit Facilities. See “Management’s Discussion and Analysis of Financial Condition and Results of Operations—Long-Term Debt—Amended and Restated Senior Secured Credit Facilities” for further description of our Amended and Restated Senior Secured Credit Facilities. As of December 31, 2017, we had $562.2 million of variable rate borrowings outstanding under our Amended and Restated Senior Secured Credit Facilities with respect to which we are exposed to interest rate risk. Holding other variables constant and assuming no interest rate hedging, a 0.25% increase in the average interest rate on our variable rate indebtedness would have resulted in a $1.4 million increase in annual interest expense based on the amount of borrowings outstanding as of December 31, 2017.
In March 2014, we entered into forward interest rate swap and floor contracts with the Royal Bank of Canada, which modify our exposure to interest rate risk by effectively converting $100.0 million of floating-rate borrowings under our Term Loan Facility to a fixed rate basis, thus reducing the impact of interest-rate changes on future interest expense. The swap agreement involves the receipt of floating rate amounts at three-month LIBOR in exchange for fixed rate interest payments at 2.705% over the life of the agreement without an exchange of the underlying principal amount of $100.0 million. When the three-month LIBOR rate drops below 1.25%, the interest rate floor contract requires us to make variable payments based on an underlying principal amount of $100.0 million and the differential between the three-month LIBOR rate and 1.25%. The interest rate swap and floor have an effective date of December 31, 2015 and are settled on the last business day of each month of March, June, September and December, beginning March 31, 2016 through December 31, 2018.
The interest rate swap and floor have not been designated as effective hedges for accounting purposes. Accordingly, in 2017, 2016 and 2015 we marked to market the interest rate swap and floor quarterly with the unrealized and realized gain or loss recognized in interest expense, in the consolidated statements of income and comprehensive income and the net liability included in other current liabilities and other noncurrent liabilities in the consolidated balance sheets.
For the year ended December 31, 2017 we recorded an unrealized net gain of $1.4 million and a realized loss of $1.4 million on our interest rate swap and floor agreement in the consolidated statement of income and comprehensive income. For the year ended December 31, 2016 we recorded an unrealized net gain of $0.7 million and a realized loss of $1.5 million on our interest rate swap and floor agreement in the consolidated statement of income and comprehensive income. For the year ended December 31, 2015, we recorded an unrealized net loss of $1.5 million on our interest rate swap and floor in the consolidated statement of income and comprehensive income. The impact of the gains and losses on the interest rate swap and floor agreement is recorded in interest expense. The interest rate swap and floor contracts have been designated as Level 2 financial instruments. At December 31, 2017 and 2016 the liability related to the swap and floor financial instruments was $0.8 million and $2.3 million, respectively. At December 31, 2017, $0.8 million of the interest rate swap and floor liability is included in accounts payable and other current liabilities in the consolidated balance sheet. At December 31, 2016, $1.5 million of the interest rate swap and floor liability is included in accounts payable and other current liabilities and $0.8 million is included in other noncurrent liabilities on the consolidated balance sheet.
Inflation rates may impact the financial statements and operating results in several areas. Inflation influences interest rates, which in turn impact the fair value of our investments and yields on new investments. Operating expenses, including payrolls, are impacted to a certain degree by the inflation rate. We do not believe that inflation has had a material effect on our results of operations for the periods presented.
66
Item 8. Financial Statements and Supplementary Data.
INDEX TO CONSOLIDATED FINANCIAL STATEMENTS
67
Report of Independent Registered Public Accounting Firm
To the Board of Directors and Shareholders of Emerald Expositions Events, Inc.
Opinion on the Financial Statements
We have audited the accompanying consolidated balance sheets of Emerald Expositions Events, Inc. and its subsidiaries as of December 31, 2017 and 2016, and the related consolidated statements of income and comprehensive income, of changes in shareholders’ equity and of cash flows for each of the three years in the period ended December 31, 2017, including the related notes and financial statement schedules listed in the accompanying index (collectively referred to as the “consolidated financial statements”). In our opinion, the consolidated financial statements present fairly, in all material respects, the financial position of the Company as of December 31, 2017 and 2016, and the results of their operations and their cash flows for each of the three years in the period ended December 31, 2017 in conformity with accounting principles generally accepted in the United States of America.
Basis for Opinion
These consolidated financial statements are the responsibility of the Company's management. Our responsibility is to express an opinion on the Company’s consolidated financial statements based on our audits. We are a public accounting firm registered with the Public Company Accounting Oversight Board (United States) (“PCAOB”) and are required to be independent with respect to the Company in accordance with the U.S. federal securities laws and the applicable rules and regulations of the Securities and Exchange Commission and the PCAOB.
We conducted our audits of these consolidated financial statements in accordance with the standards of the PCAOB. Those standards require that we plan and perform the audit to obtain reasonable assurance about whether the consolidated financial statements are free of material misstatement, whether due to error or fraud.
Our audits included performing procedures to assess the risks of material misstatement of the consolidated financial statements, whether due to error or fraud, and performing procedures that respond to those risks. Such procedures included examining, on a test basis, evidence regarding the amounts and disclosures in the consolidated financial statements. Our audits also included evaluating the accounting principles used and significant estimates made by management, as well as evaluating the overall presentation of the consolidated financial statements. We believe that our audits provide a reasonable basis for our opinion.
/s/ PricewaterhouseCoopers LLP
Irvine, California
February 22, 2018
We have served as the Company's auditor since 2015.
68
Emerald Expositions Events, Inc.
December 31, 2017 and 2016
|
|
|
2017 |
|
|
2016 |
|
||
|
(dollars in millions, share data in thousands except par value) |
|
|
|
|
|
|
|
|
|
Assets |
|
|
|
|
|
|
|
|
|
Current assets |
|
|
|
|
|
|
|
|
|
Cash and cash equivalents |
|
$ |
10.9 |
|
|
$ |
14.9 |
|
|
Trade and other receivables, net of allowance for doubtful accounts of $0.8 and $0.7 as of December 31, 2017 and 2016, respectively |
|
|
62.7 |
|
|
|
57.6 |
|
|
Prepaid expenses |
|
|
19.9 |
|
|
|
23.0 |
|
|
Total current assets |
|
|
93.5 |
|
|
|
95.5 |
|
|
Noncurrent assets |
|
|
|
|
|
|
|
|
|
Property and equipment, net |
|
|
3.8 |
|
|
|
3.8 |
|
|
Goodwill |
|
|
993.7 |
|
|
|
930.3 |
|
|
Other intangible assets, net |
|
|
545.0 |
|
|
|
541.2 |
|
|
Other noncurrent assets |
|
|
1.9 |
|
|
|
1.7 |
|
|
Total assets |
|
$ |
1,637.9 |
|
|
$ |
1,572.5 |
|
|
Liabilities and Shareholders’ Equity |
|
|
|
|
|
|
|
|
|
Current liabilities |
|
|
|
|
|
|
|
|
|
Accounts payable and other current liabilities |
|
$ |
25.0 |
|
|
$ |
28.2 |
|
|
Deferred revenues |
|
|
192.6 |
|
|
|
171.6 |
|
|
Term loan, current portion |
|
|
5.7 |
|
|
|
8.8 |
|
|
Total current liabilities |
|
|
223.3 |
|
|
|
208.6 |
|
|
Noncurrent liabilities |
|
|
|
|
|
|
|
|
|
Term loan, net of discount and deferred financing fees |
|
|
548.5 |
|
|
|
693.3 |
|
|
Deferred tax liabilities, net |
|
|
100.2 |
|
|
|
140.1 |
|
|
Other noncurrent liabilities |
|
|
4.7 |
|
|
|
2.8 |
|
|
Total liabilities |
|
|
876.7 |
|
|
|
1,044.8 |
|
|
Commitments and contingencies (Note 13) |
|
|
|
|
|
|
|
|
|
Shareholders’ equity |
|
|
|
|
|
|
|
|
|
Preferred stock, $0.01 par value; authorized shares at December 31, 2017: 80,000; no shares issued and outstanding at December 31, 2017 |
|
|
- |
|
|
|
- |
|
|
Common stock, $0.01 par value; authorized shares: 800,000; issued and outstanding shares: 72,604 and 61,860 at December 31, 2017 and 2016, respectively(1) |
|
|
0.7 |
|
|
|
0.6 |
|
|
Additional paid-in capital(1) |
|
|
677.1 |
|
|
|
510.3 |
|
|
Retained earnings |
|
|
83.4 |
|
|
|
16.8 |
|
|
Total shareholders’ equity |
|
|
761.2 |
|
|
|
527.7 |
|
|
Total liabilities and shareholders’ equity |
|
$ |
1,637.9 |
|
|
$ |
1,572.5 |
|
|
(1) |
Adjusted to reflect the 125-for-one stock split. See Note 10. |
The accompanying notes are an integral part of these consolidated financial statements.
69
Emerald Expositions Events, Inc.
Consolidated Statements of Income and Comprehensive Income
Years Ended December 31, 2017, 2016 and 2015
|
(dollars in millions, share data in thousands except earnings per share) |
|
2017 |
|
|
2016 |
|
|
2015 |
|
|||
|
Revenues |
|
$ |
341.7 |
|
|
$ |
323.7 |
|
|
$ |
306.4 |
|
|
Other income |
|
|
6.5 |
|
|
|
- |
|
|
|
- |
|
|
Cost of revenues |
|
|
95.0 |
|
|
|
84.4 |
|
|
|
83.4 |
|
|
Selling, general and administrative expense |
|
|
121.9 |
|
|
|
98.9 |
|
|
|
93.1 |
|
|
Depreciation and amortization expense |
|
|
43.2 |
|
|
|
40.0 |
|
|
|
39.1 |
|
|
Intangible asset impairment charge |
|
|
- |
|
|
|
- |
|
|
|
8.9 |
|
|
Operating income |
|
|
88.1 |
|
|
|
100.4 |
|
|
|
81.9 |
|
|
Interest expense |
|
|
38.3 |
|
|
|
51.4 |
|
|
|
52.0 |
|
|
Loss on extinguishment of debt |
|
|
3.0 |
|
|
|
12.8 |
|
|
|
- |
|
|
Income before income taxes |
|
|
46.8 |
|
|
|
36.2 |
|
|
|
29.9 |
|
|
(Benefit from) provision for income taxes |
|
|
(35.0 |
) |
|
|
14.0 |
|
|
|
10.3 |
|
|
Net income and comprehensive income |
|
$ |
81.8 |
|
|
$ |
22.2 |
|
|
$ |
19.6 |
|
|
|
|
|
|
|
|
|
|
|
|
|
|
|
|
Basic earnings per share(1) |
|
$ |
1.19 |
|
|
$ |
0.36 |
|
|
$ |
0.32 |
|
|
Diluted earnings per share(1) |
|
$ |
1.13 |
|
|
$ |
0.35 |
|
|
$ |
0.31 |
|
|
Basic weighted average common shares outstanding(1) |
|
|
68,912 |
|
|
|
61,859 |
|
|
|
61,847 |
|
|
Diluted weighted average common shares outstanding(1) |
|
|
72,116 |
|
|
|
63,294 |
|
|
|
62,516 |
|
|
|
|
|
|
|
|
|
|
|
|
|
|
|
|
|
|
|
|
|
|
|
|
|
|
|
|
|
|
(1) |
Adjusted to reflect the 125-for-one stock split. See Note 10. |
The accompanying notes are an integral part of these consolidated financial statements.
70
Emerald Expositions Events, Inc.
Consolidated Statements of Shareholders’ Equity
Years Ended December 31, 2017, 2016 and 2015
|
|
|
Common Stock(1) |
|
|
Additional Paid-in |
|
|
(Accumulated Deficit) Retained |
|
|
Total Shareholders’ |
|
||||||||
|
(shares in thousands; dollars in millions) |
|
Shares |
|
|
Amount |
|
|
Capital(1) |
|
|
Earnings |
|
|
Equity |
|
|||||
|
Balances at December 31, 2014 |
|
|
61,843 |
|
|
$ |
0.6 |
|
|
$ |
502.2 |
|
|
$ |
(25.0 |
) |
|
$ |
477.8 |
|
|
Stock-based compensation |
|
|
4.4 |
|
|
|
- |
|
|
|
5.1 |
|
|
|
- |
|
|
|
5.1 |
|
|
Net income and comprehensive income |
|
|
- |
|
|
|
- |
|
|
|
- |
|
|
|
19.6 |
|
|
|
19.6 |
|
|
Balances at December 31, 2015 |
|
|
61,847 |
|
|
$ |
0.6 |
|
|
$ |
507.3 |
|
|
$ |
(5.4 |
) |
|
$ |
502.5 |
|
|
Stock-based compensation |
|
|
11.6 |
|
|
|
- |
|
|
|
3.0 |
|
|
|
- |
|
|
|
3.0 |
|
|
Issuance of common stock |
|
|
7.7 |
|
|
|
- |
|
|
|
0.1 |
|
|
|
- |
|
|
|
0.1 |
|
|
Repurchase of common stock |
|
|
(6.3 |
) |
|
|
- |
|
|
|
(0.1 |
) |
|
|
- |
|
|
|
(0.1 |
) |
|
Net income and comprehensive income |
|
|
- |
|
|
|
- |
|
|
|
- |
|
|
|
22.2 |
|
|
|
22.2 |
|
|
Balances at December 31, 2016 |
|
|
61,860 |
|
|
$ |
0.6 |
|
|
$ |
510.3 |
|
|
$ |
16.8 |
|
|
$ |
527.7 |
|
|
Stock-based compensation |
|
|
9 |
|
|
|
- |
|
|
|
2.6 |
|
|
|
- |
|
|
|
2.6 |
|
|
Dividends on common stock |
|
|
- |
|
|
|
- |
|
|
|
- |
|
|
|
(15.2 |
) |
|
|
(15.2 |
) |
|
Issuance of common stock |
|
|
10,735 |
|
|
|
0.1 |
|
|
|
164.2 |
|
|
|
- |
|
|
|
164.3 |
|
|
Net income and comprehensive income |
|
|
- |
|
|
|
- |
|
|
|
- |
|
|
|
81.8 |
|
|
|
81.8 |
|
|
Balances at December 31, 2017 |
|
|
72,604 |
|
|
$ |
0.7 |
|
|
$ |
677.1 |
|
|
$ |
83.4 |
|
|
$ |
761.2 |
|
|
(1) |
Adjusted to reflect the 125-for-one stock split. See Note 10. |
The accompanying notes are an integral part of these consolidated financial statements.
71
Emerald Expositions Events, Inc.
Consolidated Statements of Cash Flows
Years Ended December 31, 2017, 2016 and 2015
|
(in millions) |
|
2017 |
|
|
2016 |
|
|
2015 |
|
|||
|
Operating activities |
|
|
|
|
|
|
|
|
|
|
|
|
|
Net income |
|
$ |
81.8 |
|
|
|
22.2 |
|
|
$ |
19.6 |
|
|
Adjustments to reconcile net income to net cash provided by operating activities: |
|
|
|
|
|
|
|
|
|
|
|
|
|
Stock-based compensation expense |
|
|
2.6 |
|
|
|
3.0 |
|
|
|
5.1 |
|
|
Provision for doubtful accounts |
|
|
0.5 |
|
|
|
0.7 |
|
|
|
0.1 |
|
|
Depreciation and amortization |
|
|
43.2 |
|
|
|
40.0 |
|
|
|
39.1 |
|
|
Intangible asset impairment charge |
|
|
- |
|
|
|
- |
|
|
|
8.9 |
|
|
Amortization of deferred financing fees and debt discount |
|
|
4.6 |
|
|
|
5.2 |
|
|
|
4.7 |
|
|
Unrealized (gain) loss on interest rate swap and floor |
|
|
(1.4 |
) |
|
|
(0.7 |
) |
|
|
1.5 |
|
|
Deferred income taxes |
|
|
(39.9 |
) |
|
|
10.4 |
|
|
|
7.9 |
|
|
Loss on extinguishment of debt |
|
|
3.0 |
|
|
|
3.7 |
|
|
|
- |
|
|
Other |
|
|
0.3 |
|
|
|
0.2 |
|
|
|
- |
|
|
Changes in operating assets and liabilities, net of effect of businesses acquired: |
|
|
|
|
|
|
|
|
|
|
|
|
|
Trade and other receivables |
|
|
(0.7 |
) |
|
|
(10.6 |
) |
|
|
4.4 |
|
|
Prepaid expenses |
|
|
4.5 |
|
|
|
(1.7 |
) |
|
|
(0.3 |
) |
|
Other noncurrent assets |
|
|
0.1 |
|
|
|
(0.6 |
) |
|
|
- |
|
|
Accounts payable and other current liabilities |
|
|
3.3 |
|
|
|
2.4 |
|
|
|
(2.2 |
) |
|
Deferred revenues |
|
|
5.4 |
|
|
|
18.4 |
|
|
|
(1.1 |
) |
|
Other noncurrent liabilities |
|
|
3.5 |
|
|
|
0.4 |
|
|
|
0.1 |
|
|
Net cash provided by operating activities |
|
|
110.8 |
|
|
|
93.0 |
|
|
|
87.8 |
|
|
Investing activities |
|
|
|
|
|
|
|
|
|
|
|
|
|
Acquisition of businesses, net of cash acquired |
|
|
(92.5 |
) |
|
|
(48.5 |
) |
|
|
(84.2 |
) |
|
Purchases of property and equipment |
|
|
(0.9 |
) |
|
|
(2.4 |
) |
|
|
(1.0 |
) |
|
Purchases of intangible assets |
|
|
(2.1 |
) |
|
|
(1.0 |
) |
|
|
(1.8 |
) |
|
Net cash used in investing activities |
|
|
(95.5 |
) |
|
|
(51.9 |
) |
|
|
(87.0 |
) |
|
Financing activities |
|
|
|
|
|
|
|
|
|
|
|
|
|
Payment of contingent consideration |
|
|
(12.6 |
) |
|
|
(4.6 |
) |
|
|
- |
|
|
Proceeds from borrowings on revolving credit facility |
|
|
43.0 |
|
|
|
8.0 |
|
|
|
12.0 |
|
|
Repayment of revolving credit facility |
|
|
(43.0 |
) |
|
|
(8.0 |
) |
|
|
(12.0 |
) |
|
Proceeds from borrowings on term loan |
|
|
13.0 |
|
|
|
200.0 |
|
|
|
- |
|
|
Repayment of senior notes |
|
|
- |
|
|
|
(200.0 |
) |
|
|
- |
|
|
Repayment of principal on term loan |
|
|
(164.2 |
) |
|
|
(37.0 |
) |
|
|
(26.3 |
) |
|
Fees paid for debt issuance |
|
|
(4.7 |
) |
|
|
(1.0 |
) |
|
|
- |
|
|
Cash dividends paid |
|
|
(15.2 |
) |
|
|
- |
|
|
|
- |
|
|
Payment of costs related to the initial public offering |
|
|
(6.4 |
) |
|
|
- |
|
|
|
- |
|
|
Proceeds from common stock issuance |
|
|
170.8 |
|
|
|
0.1 |
|
|
|
- |
|
|
Net cash used in financing activities |
|
|
(19.3 |
) |
|
|
(42.5 |
) |
|
|
(26.3 |
) |
|
Net decrease in cash and cash equivalents |
|
|
(4.0 |
) |
|
|
(1.4 |
) |
|
|
(25.5 |
) |
|
Cash and cash equivalents |
|
|
|
|
|
|
|
|
|
|
|
|
|
Beginning of year |
|
|
14.9 |
|
|
|
16.3 |
|
|
|
41.8 |
|
|
End of year |
|
$ |
10.9 |
|
|
$ |
14.9 |
|
|
$ |
16.3 |
|
|
Supplemental disclosures of cash flow information |
|
|
|
|
|
|
|
|
|
|
|
|
|
Cash paid for income taxes |
|
$ |
3.9 |
|
|
$ |
3.7 |
|
|
$ |
1.2 |
|
|
Cash paid for interest |
|
|
34.7 |
|
|
|
45.9 |
|
|
|
49.9 |
|
|
|
|
|
|
|
|
|
|
|
|
|
|
|
|
Supplemental schedule of non-cash investing and financing activities |
|
|
|
|
|
|
|
|
|
|
|
|
|
Contingent consideration related to 2015 acquisitions |
|
$ |
- |
|
|
$ |
- |
|
|
$ |
4.5 |
|
|
Contingent consideration related to 2016 acquisitions |
|
$ |
- |
|
|
$ |
8.5 |
|
|
$ |
- |
|
|
Contingent consideration related to 2017 acquisitions |
|
$ |
1.6 |
|
|
$ |
- |
|
|
$ |
- |
|
The accompanying notes are an integral part of these consolidated financial statements.
72
Note 1. Description of Business and Summary of Significant Accounting Policies
Emerald Expositions Events, Inc. (“Emerald” or “the Company”) is a corporation formed on April 26, 2013, under the laws of the State of Delaware. Emerald is majority owned by investment funds managed by an affiliate of Onex Partners Manager LP (“Onex Partners”).
The Company, headquartered in San Juan Capistrano, California, is a leading operator of large business-to-business trade shows in the United States (“U.S.”). The Company operates in a number of broadly-defined industry sectors: Gift, Home & General Merchandise; Sports; Design & Construction; Technology; Jewelry; and other trade shows. Each of the Company’s exhibitions are held at least once per year, and provide a venue for exhibitors to launch new products, develop sales leads and promote their brands.
In addition to organizing trade shows and conferences (collectively, “Events”), the Company also operates websites and related digital products, and produces publications, each of which is aligned with a specific sector for which it organizes a trade show. These complementary products allow the Company to better connect and communicate with its preexisting trade show audience.
Initial Public Offering
On April 28, 2017, the Company’s stock began trading on the New York Stock Exchange under the symbol “EEX”. On May 3, 2017, the Company completed the initial public offering of its common stock. The Company sold a total of 10,333,333 shares of common stock, for total net proceeds to the Company of approximately $159.1 million after deducting underwriting discounts and commissions and expenses associated with the offering of $16.5 million. The Company used all of its proceeds from the offering plus cash on hand to prepay $159.2 million of borrowings outstanding under the Term Loan Facility (as defined below).
Basis of Presentation
The consolidated financial statements include the operations of the Company and its wholly-owned subsidiaries. These consolidated financial statements are presented in conformity with accounting principles generally accepted in the United States of America (“U.S. GAAP”). All significant intercompany transactions, accounts and profits, if any, have been eliminated in the consolidated financial statements.
The Company had no items of other comprehensive income; as such, its comprehensive income is the same as net income for all periods presented.
Onex Partners Fees
Emerald Expositions Holding, Inc. (“EEH”), an intermediate holding company of Emerald, entered into a Services Agreement, dated June 17, 2013, with Onex Partners (the “Services Agreement”) to provide expertise and advisory services, including financial and structural analysis, due diligence investigations, and other advice and negotiation assistance. The management fee for these services was payable quarterly, in arrears. In connection with the IPO, the Services Agreement was terminated and the management fee is no longer paid.
Revision of Prior Period Financial Statements
During the fourth quarter of 2017, the Company identified a classification error related to certain debt extinguishment costs incurred as part of the Company’s debt refinancing in May 2017. The Company considered both quantitative and qualitative factors in assessing the materiality of the classification error individually, and in the aggregate, and determined that the classification error was not material to interim periods. As such, the Company will revise the consolidated statements of income and comprehensive income for the interim periods ended June 30, 2017 and September 30, 2017 in the Company’s 2018 Quarterly Reports on Form 10-Q, to reflect a decrease to interest expense of $2.3 million and an increase to loss on extinguishment of debt of $2.8 million. The accompanying consolidated statement of income and comprehensive income for the year ended December 31, 2017 appropriately reflects this classification.
73
The preparation of financial statements in conformity with U.S. GAAP requires management to make estimates and assumptions that affect the reported amounts of assets and liabilities, the disclosure of contingent assets and liabilities at the date of the financial statements and the reported amount of revenues and expenses during the reporting periods. Significant estimates include, but are not limited to, allowances for doubtful accounts, useful lives of depreciable assets and intangible assets, long-lived asset impairments, goodwill and purchased intangible asset valuations and assumptions used in valuing the Company’s allocation of purchase price, including acquired deferred revenues, intangible assets and goodwill, deferred taxes, the fair value of the Company’s common stock issued prior to the IPO and stock-based compensation expense. Actual results could differ from those estimates.
Cash and Cash Equivalents
The Company maintains its cash in bank deposit accounts, which at times may exceed federally insured limits. The Company considers cash deposits in banks as cash and investments with original maturities at purchase of three months or less as cash equivalents. At December 31, 2017 and 2016 amounts receivable from credit card processors, totaling $0.8 million and $1.1 million, respectively, are considered cash equivalents because they are short-term, highly liquid in nature and they are typically converted to cash within three days of the sales transaction.
Fair Value of Financial Instruments
Fair value is the price that would be received to sell an asset or paid to transfer a liability in an orderly transaction between market participants at the measurement date and sets out a fair value hierarchy. The fair value hierarchy gives the highest priority to quoted prices in active markets for identical assets or liabilities (Level 1) and the lowest priority to unobservable inputs (Level 3). Inputs are broadly defined as assumptions market participants would use in pricing an asset or liability.
The Company’s assets and liabilities are carried at fair value and are classified and disclosed in one of the following three categories: Level 1 – quoted market prices in active markets for identical assets and liabilities; Level 2 – observable market-based inputs that are corroborated by market data; and Level 3 – unobservable inputs that are not corroborated by market data. The inputs to the determination of fair value are based upon the best information in the circumstances and may require significant management judgment or estimation. A significant adjustment to a Level 2 input could result in the Level 2 measurement becoming a Level 3 measurement. As of December 31, 2017 and 2016, the Company had contingent consideration liabilities that were Level 3 liabilities with the related fair values based on the significant unobservable inputs and probability weightings in using the income approach.
Financial Instruments
Cash and cash equivalents, accounts receivable, accounts payable and certain accrued liabilities are carried at cost, which management believes approximates fair value because of the short-term maturity of these instruments. The financial instruments also include long-term debt with third party financial institutions.
Cash and cash equivalents and long-term debt financial instruments potentially subject the Company to concentrations of credit risk. To minimize the risk of credit loss, these financial instruments are primarily held with large, reputable financial institutions. At December 31, 2017 and December 31, 2016, the Company’s uninsured balances totaled $10.6 million, and $14.7 million, respectively.
74
As of December 31, 2017 and 2016, the carrying value and fair value of the Company’s debt is summarized in the following table:
|
|
|
December 31, 2017 |
|
|||||
|
(in millions) |
|
Fair Value |
|
|
Carrying Value |
|
||
|
Amended and Restated Term Loan Facility, with interest at LIBOR plus 2.75% (equal to 4.42%) at period end, including short-term portion |
|
$ |
565.0 |
|
|
$ |
558.5 |
|
|
Total |
|
$ |
565.0 |
|
|
$ |
558.5 |
|
|
|
|
December 31, 2016 |
|
|||||
|
(in millions) |
|
Fair Value |
|
|
Carrying Value |
|
||
|
Term Loan Facility, with interest at LIBOR plus 3.75% (equal to 4.75%) at period end, including short-term portion |
|
$ |
710.8 |
|
|
$ |
707.3 |
|
|
Total |
|
$ |
710.8 |
|
|
$ |
707.3 |
|
The difference between the carrying value and fair value of the Company’s variable-rate term loan is due to the difference between the period-end market interest rates and the projected market interest rates over the term of the loan, as well as the financial performance of the Company since the issuance of the debt. In addition, the carrying value is net of discounts. The Company estimated the fair value of its variable-rate debt using quoted market prices (Level 2 inputs).
Derivative Instruments
In March 2014, the Company, through EEH, entered into forward interest rate contracts to manage and reduce its interest rate risk. The interest rate swap and floor have an effective date of December 31, 2015 and are settled on the last business day of each month of March, June, September and December, beginning March 31, 2016 through December 31, 2018. The Company made payments of $1.4 million during the year ended December 31, 2017, representing the differential between the three-month LIBOR rate 1.33% and 2.705% on the principal amount of $100.0 million. The Company made payments of $1.5 million during the year ended December 31, 2016, representing the differential between the three-month LIBOR rate 0.838% and 2.705% on the principal amount of $100.0 million. The Company marks-to-market its interest rate contracts quarterly with the unrealized and realized gains or losses included in interest expense in the consolidated statements of income and comprehensive income. The liability is included in accounts payable and other current liabilities and other noncurrent liabilities in the consolidated balance sheets. See Note 6 – “Long-Term Debt” for additional discussion of the Company’s interest rate swap and floor arrangements.
Trade and other receivables
The Company extends non-interest bearing trade credit to its customers in the ordinary course of business which is not collateralized. Accounts receivable are shown on the face of the consolidated balance sheets, net of an allowance for doubtful accounts. In determining the allowance for doubtful accounts, the Company analyzes the aging of accounts receivable, historical bad debts, customer creditworthiness and current economic trends.
Prepaid Expenses
Prepaid expenses is primarily comprised of prepaid event costs. The Company pays certain direct event costs, such as facility rentals and insurance costs, in advance of the event. Such costs are deferred in prepaid expense on the consolidated balance sheets when paid and recognized as cost of revenues upon the staging of the event.
75
Goodwill and Trade Name Intangibles
Goodwill is recorded as the difference, if any, between the aggregate consideration paid for an acquisition and the fair value of the assets acquired and liabilities assumed resulting from acquisitions. Goodwill and indefinite-lived intangible assets are not amortized but instead tested for impairment annually or more frequently should an event or circumstances indicate that a reduction in fair value of the reporting unit may have occurred. The Company tests for impairment on October 31 of each year, or more frequently if events and circumstances warrant. Such events and circumstances may be a significant change in business climate, economic and industry trends, legal factors, negative operating performance indicators, significant competition or changes in strategy. The Company performs its goodwill or indefinite-lived intangible assets impairment test at the reporting unit level and asset grouping level, respectively, and has determined it operates under one reporting unit and asset grouping.
In testing goodwill for impairment, the Company first assesses qualitative factors to determine whether the existence of events or circumstances leads to a determination that it is more likely than not that the fair value of a reporting unit is less than its carrying amount, which is commonly referred to as “Step 0”. If, after assessing the totality of events or circumstances, an entity determines it is not more likely than not that the fair value of a reporting unit is less than its carrying amount, then additional impairment testing is not required. If the carrying amount of goodwill exceeds the fair value, an impairment loss is recognized in an amount equal to the excess of the carrying amount over the fair value.
The annual evaluation for impairment of indefinite-lived intangible assets is a two-step process. The first step is to perform a qualitative impairment assessment. If this qualitative assessment indicates that, more likely than not, the indefinite-lived intangible assets are not impaired, then no further testing is performed. If the qualitative assessment indicates that, more likely than not, the indefinite-lived intangible assets are impaired, then the fair value of the indefinite-lived intangible assets must be calculated. If the carrying value exceeds the fair value, an impairment loss is recorded for that excess.
Determining the fair value of a reporting unit or an indefinite-lived intangible asset is judgmental in nature and involves the use of significant estimates and assumptions. These estimates and assumptions include revenue growth rates, weighted average cost of capital and royalty rates. The Company bases its fair value estimates on assumptions it believes to be reasonable but which are unpredictable and inherently uncertain. Actual future results may differ from the estimates.
In the course of performing the annual qualitative assessment of the Company’s indefinite-lived intangible assets for the year ended December 31, 2015, an increase in the Company’s weighted average cost of capital and a decrease in the royalty rate assumptions used in calculating the fair value of indefinite-lived intangibles were determined sufficient to represent impairment indicators which qualified as a triggering event to move to step two of the impairment test. In the process of determining the implied fair value of the Company’s indefinite-lived intangible assets, management utilized, among other inputs, a relief from royalty calculation prepared by a third-party consultant. As a result of this calculation, the implied fair value of the indefinite-lived intangible assets was deemed to be lower than the carrying value. An impairment charge of $8.9 million was recorded in intangible asset impairment charge in the consolidated statement of income and comprehensive income to align the carrying value of the Company’s indefinite-lived intangible assets with their implied fair value. No impairment indicators were identified as a result of the Company’s annual qualitative assessment of the Company’s indefinite-lived intangible assets for the years ended December 31, 2017 and 2016.
No impairment was identified as a result of the Step 0 qualitative analysis performed in 2017 and the step 1 quantitative analysis performed in 2016 and 2015 in connection with the Company’s annual test of goodwill, as the estimated fair value of goodwill as of each impairment testing date exceeded its carrying value.
76
Customer-Related Intangibles and Other Amortized Intangible Assets
Intangible assets with finite lives are stated at cost, less accumulated amortization and impairment losses. These intangible assets are amortized on a straight-line basis over the following estimated useful lives, which are reviewed annually:
|
|
|
Estimated Useful Life |
|
Weighted Average |
|
|
|
Customer-related intangibles |
|
7-10 years |
|
|
9 |
|
|
Computer software |
|
3-7 years |
|
|
6 |
|
As it relates to business acquisitions, the fair values of acquired customer-related intangibles are estimated using a discounted cash flow analysis. Input assumptions regarding future cash flows, growth rates, discount rates, and tax rates used in developing the present value of future cash flow projections are the basis of the fair value calculation.
Contingent Consideration
Some of the Company’s acquisition agreements include contingent consideration arrangements, which are generally based on the achievement of future performance thresholds. For each transaction, the Company estimates the fair value of contingent consideration payments as part of the initial purchase price and records the estimated fair value of contingent consideration as a liability.
The Company considers several factors when determining that contingent consideration liabilities are part of the purchase price, including the following: (1) the valuation of its acquisitions is not supported solely by the initial consideration paid, (2) the former shareholders of acquired companies that remain as key employees receive compensation other than contingent consideration payments at a reasonable level compared with the compensation of the Company’s other key employees and (3) contingent consideration payments are not affected by employment termination.
The Company reviews and assesses the estimated fair value of contingent consideration on a quarterly basis, and the updated fair value could differ materially from the initial estimates. Adjustments to the estimated fair value of contingent consideration are reported in sales, general and administrative expense in the consolidated statements of income and comprehensive income.
Property and Equipment
Property and equipment is carried at cost less accumulated depreciation and impairment losses, if any. Property and equipment is depreciated on a straight-line basis over the estimated useful lives of 1 to 6 years (shorter of economic useful life or lease term) for leasehold improvements and 1 to 10 years for equipment, which includes computer hardware and office furniture.
Impairment of Long-Lived Assets Other than Goodwill and Indefinite-Lived Intangible Assets
Long-lived assets other than goodwill and trade name intangible assets, held and used by the Company, including property and equipment and amortized intangible assets, are reviewed for impairment whenever events or changes in circumstances indicate that the carrying amount of the assets may not be recoverable. The Company evaluates recoverability of assets to be held and used by comparing the carrying amount of an asset to the future net undiscounted cash flows to be generated by the asset. If such asset is considered to be impaired, the impairment loss is measured as the amount by which the carrying amount of the asset exceeds its fair value.
There were no long-lived asset impairments noted for the years ended December 31, 2017, 2016 or 2015.
Revenue Recognition and Deferred Revenue
Revenue is recognized when persuasive evidence of an arrangement exists, services have been rendered, the fee is fixed or determinable and the collectability of the related revenue is reasonably assured.
77
A significant portion of the Company’s annual revenue is generated from the production of trade shows and conference events, including booth space sales, registration fees and sponsorship fees. The Company recognizes revenue upon completion of each trade show or conference event. The trade show and conference revenues represented approximately 93%, 92% and 92% of the total revenues for the years ended December 31, 2017, 2016 and 2015, respectively. Amounts invoiced prior to the completion of the trade show or conference event are recorded as deferred revenues in the consolidated balance sheets until the completion of the event. As of December 31, 2017 and 2016, the Company had deferred revenues of $192.6 million and $171.6 million, respectively, of which, $49.3 million and $49.9 million, are included in accounts receivable on the consolidated balance sheets as of December 31, 2017 and 2016, respectively.
Other revenues, primarily consisting of advertising sales for industry publications, are recognized in the period in which the publications are issued.
Other Income
During the third quarter of 2017, as a result of Hurricane Irma, the Company’s Surf Expo and Imprinted Sportswear Show - Orlando (“ISS Orlando”) were forced to close two days early. The Company carries cancellation insurance to mitigate losses caused by natural disasters and received a payment of $6.5 million from its insurance carrier to offset the lost revenues of the affected trade shows. As a result, during the year ended December 31, 2017, the Company recorded Other Income of $6.5 million to recognize the amount that was recovered from the insurance company in the consolidated statements of income and comprehensive income.
Deferred Financing Fees and Debt Discount
Costs relating to debt issuance have been deferred and are amortized over the terms of the underlying debt instruments, using the effective interest method for the Amended and Restated Term Loan Facility and the straight-line method for the Amended and Restated Revolving Credit Facility. Debt discount is recorded as a contra-liability and is amortized over the term of the underlying debt instrument, using the effective interest method.
Segment Reporting
Operating segments are components of an enterprise for which discrete financial reporting information is available that is evaluated regularly by the chief operating decision maker (“CODM”) in deciding how to allocate resources and in assessing performance. As the Company’s sole function is the operation and management of trade shows and their interdependent trade show related marketing activities, the CODM views the Company’s operations and manages the businesses as one operating segment. In addition, all of the Company’s assets and trade shows are held in the U.S. Utilizing these criteria, the Company is managed on the basis of one reportable operating segment.
Advertising and Marketing Costs
Advertising and marketing costs are expensed as incurred and are reflected as selling, general and administrative expenses in the consolidated statements of income and comprehensive income. These costs include all brand advertising, telemarketing, direct mail and other sales promotion associated with the Company’s trade shows, conference events and publications. Advertising and marketing costs totaled $12.9 million, $11.7 million and $11.5 million, for the years ended December 31, 2017, 2016 and 2015, respectively.
Stock-Based Compensation
Prior to the IPO, certain of the Company’s officers, non-employee directors, consultants and employees received stock-based awards pursuant to our 2013 Option Plan. Stock-based compensation expense is calculated for each vesting tranche of stock options using the Black-Scholes option pricing model. The expense is recognized, net of forfeitures, within the consolidated statements of income and comprehensive income; however, no expense is recognized for awards that do not ultimately vest. The determination of the grant date fair value of stock options using an option-pricing model is affected by a number of assumptions, such as the fair value of the underlying stock,
78
Emerald’s expected stock price volatility over the expected term of the options, stock option forfeiture behaviors, risk-free interest rates and expected dividends, which is estimated as follows:
|
• |
Fair Value of our Common Stock — Due to the absence of an active market for the Company’s common stock prior to the IPO, the fair value for purposes of determining the underlying stock price for pre-IPO stock option grants was determined utilizing commonly accepted valuation practices. The exercise price was set at least equal to the fair value of Emerald’s common stock on the date of grant. The key assumptions used in the valuations to determine the fair value of Emerald’s pre-IPO common stock included its historical and projected operating and financial performance; observed market multiples for comparable businesses; the uncertainty in the business associated with economic conditions; the fact that equity incentive grants relate to illiquid securities in a private company that had no liquid trading market; and the likelihood of achieving a liquidity event, such as an initial public offering or sale of the company. Each of these assumptions involves highly complex and subjective estimates. Following the IPO, the fair value per share of our common stock for purposes of determining share-based compensation is the closing price of the Company’s common stock as reported on the New York Stock Exchange on the applicable grant date. |
|
• |
Expected Term — For pre-IPO and post-IPO stock option grants, the expected option term represents the period of time the option is expected to be outstanding. The simplified method is used to estimate the term since the Company does not have sufficient exercise history to calculate the expected term of stock options. |
|
• |
Volatility — For pre-IPO and post-IPO stock option grants, management determines the expected volatility based on historical average volatilities of similar publicly traded companies corresponding to the expected term of the awards. |
|
• |
Risk-Free Rate — For pre-IPO and post-IPO stock options, the risk-free rate is based on the yields of United States Treasury securities with maturities similar to the expected term of stock option for each stock option grant. |
|
• |
Forfeiture Rate — For pre-IPO and post-IPO stock options, estimates of pre-vesting forfeitures, or forfeiture rates, were based on our internal analysis, which primarily considers the award recipients’ position within the company. |
|
• |
Dividend Yield — Prior to the IPO, the Company had never declared or paid any cash dividends and had no intention to pay cash dividends. Consequently, an expected dividend yield of zero was used with respect to pre-IPO options. In connection with the IPO, the Company adopted a policy of paying quarterly cash dividends on our common stock. Our post-IPO stock option grants include an expected dividend yield which is commensurate with the annual dividends the Company has been declaring and paying since the IPO. |
In 2017, the Company granted Restricted Stock Units, “RSUs”, that contain service and, in certain instances, performance conditions to certain executives and employees. The Company recognizes cumulative stock-based compensation expense for the portion of the awards for which the service period and performance conditions, as applicable, are probable of being satisfied. The grant date fair value of stock-based awards is recognized as expense over the requisite service period on the graded-vesting method.
Income Taxes
The Company provides for income taxes utilizing the asset and liability method of accounting. Under this method, deferred income taxes are recorded to reflect the tax consequences in future years of differences between the tax basis of assets and liabilities and their financial reporting amounts at each balance sheet date, based on enacted tax laws and statutory tax rates applicable to the periods in which the differences are expected to affect taxable income. If it is determined that it is more likely than not that future tax benefits associated with a deferred tax asset will not be realized, a valuation allowance is provided. The effect on deferred tax assets and liabilities of a change in the tax rates is recognized in the consolidated statements of income and comprehensive income as an adjustment to income tax expense in the period that includes the enactment date.
The Company records a liability for unrecognized tax benefits resulting from uncertain tax positions taken or expected to be taken in a tax return. The Company recognizes interest and penalties, if any, related to unrecognized tax benefits in income tax expense.
79
Note 2. Recently Adopted Accounting Pronouncements
In January 2017, the Financial Accounting Standards Board (“FASB”) issued Accounting Standards Update (“ASU”) 2017-04, Intangibles – Goodwill and Other (Topic 350): Simplifying the Accounting for Goodwill Impairment. The guidance removes Step 2 of the goodwill impairment test, which requires a hypothetical purchase price allocation. A goodwill impairment will now be the amount by which a reporting unit’s carrying value exceeds its fair value, not to exceed the carrying amount of goodwill. The revised guidance is applied prospectively and is effective for calendar year-end filers in 2020, with early adoption permitted. Adoption of ASU 2017-04 did not have a significant impact on the Company’s consolidated financial statements.
In January 2017, the FASB issued ASU 2017-01, Clarifying the Definition of a Business, to assist companies with evaluating whether transactions should be accounted for as acquisitions of assets or businesses. The new guidance requires a company to evaluate if substantially all of the fair value of the gross assets acquired (or disposed of) is concentrated in a single identifiable asset or a group of similar identifiable assets; if so, the set of assets and activities is not a business. The guidance also requires a business to include at least one substantive process and narrows the definition of outputs by more closely aligning it with how outputs are described in the guidance for revenue from contracts with customers. The guidance should be applied prospectively to any transactions occurring within the period of adoption. Management elected to early adopt the new guidance during the fourth quarter of 2017. Adoption of ASU 2017-01 did not have a significant impact on the Company’s consolidated financial statements.
In November 2016, the FASB issued ASU 2016-18, Statement of Cash Flows: Restricted Cash, which provides new guidance on restricted cash in the statement of cash flows. The new guidance requires the classification and presentation of changes in restricted cash and cash equivalents in the statement of cash flows. Therefore, amounts generally described as restricted cash and restricted cash equivalents should be included with cash and cash equivalents when reconciling the beginning and ending balances shown in the statement of cash flows. The new standard is effective for fiscal years, and interim periods within those fiscal years, beginning after December 15, 2017, with early adoption permitted. The guidance is applied retrospectively after adoption. Adoption of ASU 2016-18 did not have a significant impact on the Company’s consolidated financial statements.
In August 2016, the FASB issued ASU 2016-15, Statement of Cash Flows (Topic 230): Classification of Certain Cash Receipts and Cash Payments (ASU 2016-15). ASU 2016-15 clarifies how certain cash receipts and payments should be presented in the statement of cash flows. This standard is effective for fiscal years beginning after December 15, 2016. Adoption of ASU 2016-15 did not have a significant impact on the Company’s consolidated financial statements.
In March 2016, the FASB issued ASU 2016-09, Compensation – Stock Compensation (Topic 718). ASU 2016-09 identifies areas for simplification involving several aspects of accounting for share-based payment transactions, including the income tax consequences, classification of awards as either equity or liabilities, an option to recognize gross stock compensation expense with actual forfeitures recognized as they occur, as well as certain classifications on the statement of cash flows. This standard is effective for fiscal years beginning after December 15, 2016. Adoption of ASU 2016-09 did not have a significant impact on the Company’s consolidated financial statements.
In January 2016, the FASB issued ASU 2016-01, Financial Instruments - Overall (Subtopic 825-10: Recognition and Measurement of Financial Assets and Financial Liabilities), which revised entities’ accounting related to: (i) the classification and measurement of investments in equity securities; and (ii) the presentation of certain fair value changes for financial liabilities measured at fair value. The ASU also amends certain disclosure requirements associated with the fair value of financial instruments. The new guidance is effective for the Company in annual periods ending after December 15, 2017 and requires a modified retrospective approach to adoption. Early adoption is only permitted for the provision related to instrument-specific credit risk. Adoption of ASU 2016-01 related to instrument-specific credit risk did not have a significant impact on the Company’s consolidated financial statements.
Recently Issued Accounting Pronouncements
In February 2016, the FASB issued ASU 2016-02, Leases (Topic 842), which will require lessees to recognize most leases on their balance sheets as a right-of-use asset with a corresponding lease liability, and lessors to recognize a
80
net lease investment. Additional qualitative and quantitative disclosures will also be required. This standard is effective for fiscal years beginning after December 15, 2018. Management is currently assessing the impact that adopting this new accounting standard will have on the Company’s consolidated financial statements.
In May 2014, the FASB issued ASU 2014-09, Revenue from Contracts with Customers, which requires an entity to recognize the amount of revenue to which it expects to be entitled for the transfer of promised goods or services to customers. ASU 2014-09 will replace most existing revenue recognition guidance in U.S. GAAP when it becomes effective. In August 2015, the FASB issued ASU 2015-14 to defer the effective date for annual reporting to periods beginning after December 15, 2017, including interim periods within that reporting period. Early adoption is permitted as of the original effective date in ASU 2014-09, which is annual reporting periods beginning after December 15, 2016, however, the Company will not early adopt. In December 2016, the FASB issued ASU 2016-20, Technical Corrections and Improvements to Topic 606, Revenue from Contracts with Customers which affect narrow aspects of the guidance issued in ASU 2014-09. In May 2016, the FASB issued ASU 2016-12, Narrow Scope Improvements and Practical Expedients, which amends and clarifies certain aspects in ASU 2014-09 that include collectibility, presentation of sales and other taxes collected from customers, noncash consideration, contract modifications and completed contracts at transition. In April 2016, the FASB issued ASU 2016-10, Identifying Performance Obligations and Licensing, which amends the guidance in ASU 2014-09 on accounting for licenses of intellectual property and identifying performance obligations. In March 2016, the FASB issued ASU 2016-08, Principal versus Agent Considerations (Reporting Revenue Gross versus Net), which amends the principal versus agent guidance in ASU 2014-09. The standards are to be applied retrospectively and the Company has elected to utilize the full retrospective method. Management has completed its evaluation and aside from the new footnote disclosure requirements, does not believe these standards will have a material effect on the Company’s consolidated financial statements.
There have been no other new accounting pronouncements that are expected to have a significant impact on the Company’s consolidated financial statements or notes thereto.
Note 3. Business Acquisitions
In line with the Company’s strategic growth initiatives, Emerald acquired the assets and assumed the liabilities of several companies during 2017 (collectively, the “2017 acquisitions”), 2016 (collectively, the “2016 acquisitions”) and 2015 (collectively, the “2015 acquisitions”), as described below. Each transaction qualified as an acquisition of a business and was accounted for as a business combination.
2017 Acquisitions
CEDIA
The Company acquired the assets and assumed the liabilities associated with CEDIA Expo on January 25, 2017, for a total purchase price of $34.8 million, which included a negative working capital adjustment of approximately $1.2 million. The acquisition was financed with cash from operations and a draw on the Company’s revolving credit facility.
All of the external acquisition costs of $0.2 million were expensed as incurred and included in selling, general and administrative expenses in the consolidated statements of income and comprehensive income. The revenue and net income generated from this acquisition during the 2017 post-acquisition period was $7.0 million and $1.5 million, respectively. The measurement period was closed during the fourth quarter of 2017.
81
The following table summarizes the fair value of the assets and liabilities at the date of acquisition:
|
(in millions) |
|
January 25, 2017 |
|
|
|
Prepaid expenses |
|
$ |
0.3 |
|
|
Goodwill |
|
|
24.9 |
|
|
Other intangible assets |
|
|
11.1 |
|
|
Deferred revenues |
|
|
(1.5 |
) |
|
Purchase price, including working capital adjustment |
|
$ |
34.8 |
|
InterDrone
The Company acquired the assets and assumed the liabilities associated with the International Drone Conference and Exposition on March 10, 2017, for a purchase price of $8.2 million, which included a negative working capital adjustment of approximately $0.2 million and estimated contingent consideration of $3.8 million. The $4.4 million closing purchase payment was financed with cash from operations. The contingent consideration was primarily based upon performance thresholds around revenue and earnings. The liability was re-measured to fair value each reporting period using the Company’s most recent internal operational budgets. As a result of the Company’s review during the fourth quarter of 2017, the contingent consideration liability was re-measured to fair value which resulted in a $0.3 million increase in the fair value of the contingent consideration and is included in selling, general and administrative expense in the consolidated statements of income and comprehensive income. The $4.1 million contingent payment was settled in the fourth quarter of 2017. The measurement period was closed during the fourth quarter of 2017.
All of the external acquisition costs of $0.4 million were expensed as incurred and included in selling, general and administrative expenses in the consolidated statements of income and comprehensive income. The revenue and net income generated from this acquisition during the 2017 post-acquisition period was $1.7 million and $0.5 million, respectively. The measurement period was closed during the fourth quarter of 2017.
The following table summarizes the fair value of the assets and liabilities at the date of acquisition:
|
(in millions) |
|
March 10, 2017 |
|
|
|
Goodwill |
|
$ |
5.5 |
|
|
Other intangible assets |
|
|
2.9 |
|
|
Deferred revenues |
|
|
(0.2 |
) |
|
Purchase price, including working capital adjustment |
|
$ |
8.2 |
|
Snow Show
The Company acquired the assets and assumed the liabilities associated with the SnowSports Industries America Snow Show on May 24, 2017, for a total purchase price of $16.8 million, which included a negative working capital adjustment of approximately $0.3 million and a deferred payment of $0.4 million. At the date of acquisition, the company entered into a sponsorship agreement for a non-exclusive right to use to the Snow Sports Industries mark. As a result of the sponsorship agreement, the company recorded a $0.4 million deferred payment that will be paid over the next ten years. The $0.4 million deferred payment is included in accounts payable and other current liabilities and other noncurrent liabilities in the consolidated balance sheets. The acquisition was financed with cash from operations.
All of the external acquisition costs of $0.3 million were expensed as incurred and included in selling, general and administrative expenses in the consolidated statements of income and comprehensive income. The revenue and net income generated from this acquisition during the 2017 post-acquisition period was immaterial. The measurement period was closed during the fourth quarter of 2017.
82
The following table summarizes the fair value of the assets and liabilities at the date of acquisition:
|
(in millions) |
|
May 24, 2017 |
|
|
|
Goodwill |
|
$ |
11.3 |
|
|
Other intangible assets |
|
|
5.8 |
|
|
Deferred revenues |
|
|
(0.3 |
) |
|
Purchase price, including working capital adjustment |
|
$ |
16.8 |
|
CPMG
The Company acquired Connecting Point Marketing Group on November 29, 2017, for a total purchase price of $36.6 million, which included a working capital adjustment of approximately $1.4 million. The acquisition was financed with cash from operations and a draw from the Company’s revolving credit facility.
All of the external acquisition costs of $0.3 million were expensed as incurred and included in selling, general and administrative expenses in the consolidated statements of income and comprehensive income. The revenue and net income generated from this acquisition during the 2017 post-acquisition period was immaterial. The measurement period is expected to be closed during the first quarter of 2018.
The following table summarizes the fair value of the assets and liabilities at the date of acquisition:
|
(in millions) |
|
November 29, 2017 |
|
|
|
Cash |
|
$ |
0.6 |
|
|
Trade and other receivables |
|
|
5.1 |
|
|
Prepaid expenses |
|
|
0.5 |
|
|
Goodwill |
|
|
21.7 |
|
|
Other intangible assets |
|
|
22.4 |
|
|
Accounts payable and other current liabilities |
|
|
(0.8 |
) |
|
Deferred revenues |
|
|
(12.9 |
) |
|
Purchase price, including working capital adjustment |
|
$ |
36.6 |
|
The Company recorded goodwill of $63.4 million and $40.0 million in the years ended December 31, 2017 and 2016, respectively. In the view of management, the goodwill recorded reflects the future cash flow expectations for the acquired businesses’ market positions in their respective trade show industries, synergies and assembled workforce. Substantially all of the goodwill recorded is expected to be deductible for income tax purposes.
2016 Acquisitions
IGES
On August 1, 2016, the Company acquired the assets and assumed the liabilities associated with the International Gift Exposition in the Smokies and the Souvenir Super Show for a total purchase price cash consideration of $3.7 million, which included a negative working capital adjustment of $1.3 million. The revenue and net income generated from this acquisition during the 2016 post-acquisition period was $2.5 million and $1.1 million, respectively. The measurement period was closed during the fourth quarter of 2016.
All of the external acquisition costs of $0.3 million were expensed as incurred and included in selling, general and administrative expenses in the consolidated statements of income and comprehensive income.
83
The following table summarizes the fair value of the assets and liabilities at the date of acquisition:
|
(in millions) |
|
August 1, 2016 |
|
|
|
Prepaid expenses |
|
$ |
0.1 |
|
|
Goodwill |
|
|
2.9 |
|
|
Other intangible assets |
|
|
1.8 |
|
|
Deferred revenue |
|
|
(1.1 |
) |
|
Purchase price, including working capital adjustment |
|
$ |
3.7 |
|
Collective
On August 8, 2016, the Company acquired the assets and assumed the liabilities associated with the Swim Collective Trade Show and the Active Collective Trade Show for a purchase price of $14.2 million, which reflects the contingent consideration payment of $1.3 million that was settled during the year ended December 31, 2017. The contingent consideration was primarily based upon performance thresholds around revenue and earnings. The liability was re-measured to fair value each reporting period using the Company’s most recent internal operational budgets. During 2017, the Company recorded a $0.1 million decrease in the fair value of the contingent consideration liability which is included in selling, general and administrative expense in the consolidated statements of income and comprehensive income. The revenue and net income generated from this acquisition during the 2016 post-acquisition period was immaterial. The measurement period was closed during the second quarter of 2017.
All of the external acquisition costs of $0.3 million were expensed as incurred and included in selling, general and administrative expenses in the consolidated statements of income and comprehensive income.
The following table summarizes the fair value of the assets and liabilities at the date of acquisition:
|
(in millions) |
|
August 8, 2016 |
|
|
|
Prepaid expenses |
|
$ |
0.1 |
|
|
Goodwill |
|
|
9.0 |
|
|
Other intangible assets |
|
|
5.2 |
|
|
Deferred revenue |
|
|
(0.1 |
) |
|
Purchase price, including working capital adjustment |
|
$ |
14.2 |
|
Digital Dealer
On October 11, 2016, the Company acquired the assets and assumed the liabilities associated with the Digital Dealer Conference & Expo, for a purchase price of $20.5 million. The Company paid $4.7 million of contingent consideration during the second quarter of 2017. The remaining $0.2 million contingent consideration was settled in the fourth quarter of 2017. The contingent consideration was primarily based upon performance thresholds around revenue and earnings. The liability was re-measured to fair value each reporting period using the Company’s most recent internal operational budgets. During 2017, the Company recorded a $0.8 million decrease in the fair value of the contingent consideration liability which is included in selling, general and administrative expense in the consolidated statements of income and comprehensive income. The contingent consideration liability is included in accounts payable and other accrued liabilities in the consolidated balance sheet at December 31, 2016. In conjunction with the acquisition, there is a $1.0 million contingent compensation payment that was settled in January 2018. Payment of this contingent amount is primarily based upon achievement of certain performance thresholds as well as the continued engagement of the seller. As such, the $1.0 million was determined to be compensation and is being ratably expensed during the requisite service period. For the year ended December 31, 2017, $0.8 million of the contingent compensation expense was included in selling, general and administrative expense in the consolidated statements of income and comprehensive income. As of December 31, 2017, $1.0
84
million is included in accounts payable and other accrued liabilities. As of December 31, 2016, $0.2 million is included in other noncurrent liabilities in the consolidated balance sheets. The revenue and net income generated from this acquisition during the 2016 post-acquisition period was immaterial. The measurement period for this acquisition was closed in the third quarter of 2017.
All of the external acquisition costs of $0.5 million were expensed as incurred and included in selling, general and administrative expenses in the consolidated statements of income and comprehensive income.
The following table summarizes the fair value of the assets and liabilities at the date of acquisition:
|
(in millions) |
|
October 11, 2016 |
|
|
|
Prepaid expenses |
|
$ |
0.3 |
|
|
Goodwill |
|
|
14.7 |
|
|
Other intangible assets |
|
|
5.9 |
|
|
Deferred revenue |
|
|
(0.4 |
) |
|
Purchase price, including working capital adjustment |
|
$ |
20.5 |
|
Pavement
On October 18, 2016, the Company acquired the assets and assumed the liabilities associated with the National Pavement Expo for a purchase price of $7.8 million. The Company paid $2.3 million of contingent consideration during the second quarter of 2017. The contingent consideration was primarily based upon performance thresholds around revenue and earnings. The liability was re-measured to fair value each reporting period using the Company’s most recent internal operational budgets. During 2017, the Company recorded a $0.9 million increase in the fair value of the contingent consideration liability which is included in selling, general and administrative expense in the consolidated statements of income and comprehensive income. The revenue and net income generated from this acquisition during the 2016 post-acquisition period was immaterial. The measurement period for this acquisition was closed in the second quarter of 2017.
All of the external acquisition costs of $0.5 million were expensed as incurred and included in selling, general and administrative expenses in the consolidated statements of income and comprehensive income.
The following table summarizes the fair value of the assets and liabilities at the date of acquisition:
|
(in millions) |
|
October 18, 2016 |
|
|
|
Prepaid expenses |
|
$ |
0.1 |
|
|
Goodwill |
|
|
5.3 |
|
|
Other intangible assets |
|
|
2.8 |
|
|
Deferred revenue |
|
|
(0.4 |
) |
|
Purchase price, including working capital adjustment |
|
$ |
7.8 |
|
RFID
On November 15, 2016, the Company acquired the assets and assumed the liabilities associated with RFID Journal LIVE! for a purchase price of $5.7 million. In conjunction with the acquisition, there are contingent compensation payments of $2.5 million scheduled to be settled during the first quarter of 2018 and 2019, which are primarily contingent upon achievement of certain performance thresholds and the continued employment of the seller. As such, the $2.5 million was determined to be compensation and is being ratably expensed during the requisite service period. For the year ended December 31, 2017, $1.7 million of the contingent compensation expense was included in selling, general and administrative expense in the consolidated statements of income and comprehensive income. As of December 31, 2017, $1.2 million and $0.7 is included in accounts payable and other accrued liabilities and
85
other noncurrent liabilities, respectively, in the consolidated balance sheets. As of December 31, 2016, $0.2 million is included in other noncurrent liabilities. The revenue and net income generated from this acquisition during the 2016 post-acquisition period was immaterial. The measurement period for this acquisition was closed in the third quarter of 2017.
All of the external acquisition costs of $0.3 million were expensed as incurred and included in selling, general and administrative expenses in the consolidated statements of income and comprehensive income.
The following table summarizes the fair value of the assets and liabilities at the date of acquisition:
|
(in millions) |
|
November 15, 2016 |
|
|
|
Prepaid expenses |
|
$ |
0.1 |
|
|
Goodwill |
|
|
4.2 |
|
|
Other intangible assets |
|
|
2.3 |
|
|
Deferred revenue |
|
|
(0.9 |
) |
|
Purchase price, including working capital adjustment |
|
$ |
5.7 |
|
ACRE
On December 13, 2016, the Company acquired the assets and assumed the liabilities associated with the American Craft Retailers Expo for a purchase price of $5.0 million, which includes a negative working capital adjustment of $1.1 million. The revenue and net income generated from this acquisition during the 2016 post-acquisition period was immaterial.
All of the external acquisition costs of $0.3 million were expensed as incurred and included in selling, general and administrative expenses in the consolidated statements of income and comprehensive income.
The following table summarizes the fair value of the assets and liabilities at the date of acquisition:
|
(in millions) |
|
December 13, 2016 |
|
|
|
Prepaid expenses |
|
$ |
0.1 |
|
|
Goodwill |
|
|
3.8 |
|
|
Other intangible assets |
|
|
2.1 |
|
|
Deferred revenue |
|
|
(1.0 |
) |
|
Purchase price, including working capital adjustment |
|
$ |
5.0 |
|
2015 Acquisitions
HCD
Emerald acquired the assets and assumed the liabilities associated with Healthcare Design Conference and Expo, Healthcare Design Magazine, Environments for Aging and Construction Super Conference on February 27, 2015, for a total purchase price consideration of $22.5 million. The acquisition was financed with cash from operations.
All of the external acquisition costs of $0.7 million were expensed as incurred and included in selling, general and administrative expenses in the consolidated statements of income and comprehensive income. The revenue and net income generated from this acquisition during the 2015 post-acquisition period was $7.8 million and $0.9 million, respectively.
86
The following table summarizes the estimated fair value of the assets and liabilities at the date of the acquisition:
|
(in millions) |
|
February 27, 2015 |
|
|
|
Trade and other receivables |
|
$ |
1.1 |
|
|
Prepaid expenses |
|
|
0.2 |
|
|
Goodwill |
|
|
13.1 |
|
|
Other intangible assets |
|
|
10.6 |
|
|
Accounts payable and other current liabilities |
|
|
(0.3 |
) |
|
Deferred revenues |
|
|
(2.2 |
) |
|
Purchase price, including working capital adjustment |
|
$ |
22.5 |
|
Pizza Group
The Company acquired all of the outstanding interests of Macfadden Protech, LLC, a Delaware limited liability company, which holds the assets and assumed the liabilities associated with International Pizza Expo, and the trade magazine Pizza Today on March 3, 2015, for a total purchase price consideration of $27.9 million, comprised of base consideration of $27.0 million, $0.9 million related to estimated net revenues generated in March 2015 when the Pizza Expo show staged and $0.1 million for estimated working capital received. The acquisition was financed with cash from operations. The revenue and net income generated from this acquisition during the 2015 post-acquisition period was $6.0 million and $0.6 million, respectively.
All of the external acquisition costs of $0.6 million were expensed as incurred during the first quarter of 2015 and included in selling, general and administrative expenses in the consolidated statements of income and comprehensive income.
The following table summarizes the estimated fair value of the assets and liabilities at the date of the acquisition:
|
(in millions) |
|
March 3, 2015 |
|
|
|
Trade and other receivables |
|
$ |
0.4 |
|
|
Event net revenue receivable |
|
|
0.9 |
|
|
Prepaid expenses |
|
|
1.0 |
|
|
Goodwill |
|
|
17.3 |
|
|
Other intangible assets |
|
|
11.6 |
|
|
Accounts payable and other current liabilities |
|
|
(0.1 |
) |
|
Deferred revenues |
|
|
(3.2 |
) |
|
Purchase price, including working capital adjustment |
|
$ |
27.9 |
|
HOW
The Company acquired all of the assets and assumed the liabilities of HOW Design Live and the HOW Interactive Design Conference Sense from F+W Media, Inc. on October 14, 2015 for a purchase price of $27.6 million which includes a negative working capital adjustment of $0.5 million. The acquisition was financed with cash from operations and a draw from the Company’s revolving credit facility. The revenue and net income generated from this acquisition during the 2015 post-acquisition period was immaterial.
All of the external acquisition costs of $0.6 million were expensed as incurred and are included in selling, general and administrative expenses in the consolidated statements of income and comprehensive income.
87
The following table summarizes the estimated fair value of the assets and liabilities at the date of the acquisition:
|
(in millions) |
|
October 14, 2015 |
|
|
|
Prepaid expenses |
|
$ |
0.3 |
|
|
Goodwill |
|
|
20.5 |
|
|
Other intangible assets |
|
|
7.2 |
|
|
Deferred revenues |
|
|
(0.4 |
) |
|
Purchase price, including working capital adjustment |
|
$ |
27.6 |
|
Fastener Expo
Emerald acquired all of the assets and assumed the liabilities of National Industrial Fastener and Mill Supply Expo from the show’s co-owners on November 12, 2015 for a purchase price of $10.8 million which included a positive working capital adjustment of $0.1 million. The acquisition was financed with $6.2 million of cash from operations and the assumption of a $4.5 million note payable from the seller. The note was paid in full in January 2016. The revenue and net income generated from this acquisition during the 2015 post-acquisition period was immaterial.
All of the external acquisition costs of $0.5 million were expensed as incurred during the second half of 2015 and are included in selling, general and administrative expenses in the consolidated statements of income and comprehensive income.
The following table summarizes the estimated fair value of the assets and liabilities at the date of the acquisition:
|
(in millions) |
|
November 12, 2015 |
|
|
|
Prepaid expenses |
|
$ |
0.1 |
|
|
Goodwill |
|
|
6.8 |
|
|
Other intangible assets |
|
|
3.9 |
|
|
Purchase price, including working capital adjustment |
|
$ |
10.8 |
|
Pro-forma financial information
The following table represents the unaudited pro-forma revenue and net income for the years ended December 31, 2017, 2016 and 2015 as if each acquisition had occurred on the first day of the fiscal year preceding the actual transaction date and after giving effect to certain pro-forma adjustments primarily related to the amortization of acquired intangible assets and interest expense. The supplemental unaudited pro-forma financial information is presented for information purposes only. It is not necessarily indicative of what the Company’s financial position or results of operations actually would have been had the Company completed the acquisitions at the dates indicated, nor is it intended to project the future financial position or operating results of the combined company.
|
|
|
Year ended December 31, |
|
|||||||||
|
(in millions) |
|
2017 |
|
|
2016 |
|
|
2015 |
|
|||
|
|
|
(Unaudited) |
|
|||||||||
|
Pro-forma revenues |
|
$ |
360.7 |
|
|
$ |
364.1 |
|
|
$ |
331.7 |
|
|
Pro-forma net income |
|
$ |
90.6 |
|
|
$ |
28.5 |
|
|
$ |
23.9 |
|
The unaudited pro-forma supplemental information is based on estimates and assumptions that the Company believes are reasonable and reflects amortization of intangible assets as a result of the acquisitions. This supplemental pro-forma information has been prepared for comparative purposes and does not purport to be indicative of what would have occurred had the acquisitions been made at the beginning of the year prior to the year in which the acquisitions closed, nor is it indicative of any future results. Further, the supplemental pro-forma information has not been adjusted for show timing differences or discontinued events.
88
Note 4. Goodwill and Other Intangible Assets
Goodwill
The table below summarizes the changes in the carrying amount of goodwill:
|
(in millions) |
|
|
|
|
|
Balance at December 31, 2015 |
|
|
890.3 |
|
|
HOW adjustment |
|
|
0.1 |
|
|
2016 acquisitions |
|
|
39.9 |
|
|
Balance at December 31, 2016 |
|
$ |
930.3 |
|
|
2017 acquisitions |
|
|
63.4 |
|
|
Balance at December 31, 2017 |
|
$ |
993.7 |
|
Other Intangible Assets
Other intangible assets consisted of the following:
|
(in millions) |
|
December 31, 2016 |
|
|
Additions |
|
|
Disposals |
|
|
Transfers |
|
|
December 31, 2017 |
|
|||||
|
Indefinite-lived intangible assets |
|
|
|
|
|
|
|
|
|
|
|
|
|
|
|
|
|
|
|
|
|
Trade names |
|
$ |
278.8 |
|
|
$ |
19.7 |
|
|
$ |
- |
|
|
$ |
- |
|
|
$ |
298.5 |
|
|
Amortizable intangibles |
|
|
|
|
|
|
|
|
|
|
|
|
|
|
|
|
|
|
|
|
|
Customer-related intangibles |
|
|
382.8 |
|
|
|
26.0 |
|
|
|
- |
|
|
|
- |
|
|
|
408.8 |
|
|
Computer software |
|
|
8.0 |
|
|
|
- |
|
|
|
- |
|
|
|
0.4 |
|
|
|
8.4 |
|
|
|
|
|
669.6 |
|
|
|
45.7 |
|
|
|
- |
|
|
|
0.4 |
|
|
|
715.7 |
|
|
Accumulated amortization |
|
|
|
|
|
|
|
|
|
|
|
|
|
|
|
|
|
|
|
|
|
Customer-related intangibles |
|
|
(124.4 |
) |
|
|
(41.3 |
) |
|
|
- |
|
|
|
- |
|
|
|
(165.7 |
) |
|
Computer software |
|
|
(4.4 |
) |
|
|
(1.0 |
) |
|
|
- |
|
|
|
- |
|
|
|
(5.4 |
) |
|
|
|
|
(128.8 |
) |
|
|
(42.3 |
) |
|
|
- |
|
|
|
- |
|
|
|
(171.1 |
) |
|
Capitalized software in progress |
|
|
0.4 |
|
|
|
0.4 |
|
|
|
- |
|
|
|
(0.4 |
) |
|
|
0.4 |
|
|
Total other intangibles, net |
|
$ |
541.2 |
|
|
$ |
3.8 |
|
|
$ |
- |
|
|
$ |
- |
|
|
$ |
545.0 |
|
|
(in millions) |
|
December 31, 2015 |
|
|
Additions |
|
|
Disposals |
|
|
Transfers |
|
|
December 31, 2016 |
|
|||||
|
Indefinite-lived intangible assets |
|
|
|
|
|
|
|
|
|
|
|
|
|
|
|
|
|
|
|
|
|
Trade names |
|
$ |
270.4 |
|
|
$ |
8.4 |
|
|
$ |
- |
|
|
$ |
- |
|
|
$ |
278.8 |
|
|
Amortizable intangibles |
|
|
|
|
|
|
|
|
|
|
|
|
|
|
|
|
|
|
|
|
|
Customer-related intangibles |
|
|
371.0 |
|
|
|
11.8 |
|
|
|
- |
|
|
|
- |
|
|
|
382.8 |
|
|
Computer software |
|
|
7.3 |
|
|
|
- |
|
|
|
- |
|
|
|
0.7 |
|
|
|
8.0 |
|
|
|
|
|
648.7 |
|
|
|
20.2 |
|
|
|
- |
|
|
|
0.7 |
|
|
|
669.6 |
|
|
Accumulated amortization |
|
|
|
|
|
|
|
|
|
|
|
|
|
|
|
|
|
|
|
|
|
Customer-related intangibles |
|
|
(86.0 |
) |
|
|
(38.4 |
) |
|
|
- |
|
|
|
- |
|
|
|
(124.4 |
) |
|
Computer software |
|
|
(3.4 |
) |
|
|
(1.0 |
) |
|
|
- |
|
|
|
- |
|
|
|
(4.4 |
) |
|
|
|
|
(89.4 |
) |
|
|
(39.4 |
) |
|
|
- |
|
|
|
- |
|
|
|
(128.8 |
) |
|
Capitalized software in progress |
|
|
0.1 |
|
|
|
1.0 |
|
|
|
- |
|
|
|
(0.7 |
) |
|
|
0.4 |
|
|
Total other intangibles, net |
|
$ |
559.4 |
|
|
$ |
(18.2 |
) |
|
$ |
- |
|
|
|
- |
|
|
$ |
541.2 |
|
Amortization expense for the years ended December 31, 2017, 2016 and 2015 was $42.3 million, $39.3 million and $37.9 million, respectively.
89
Future amortization expense is estimated to be as follows for each of the five following years and thereafter ending December 31:
|
(in millions) |
|
|
|
|
|
2018 |
|
$ |
44.3 |
|
|
2019 |
|
|
44.3 |
|
|
2020 |
|
|
44.2 |
|
|
2021 |
|
|
43.7 |
|
|
2022 |
|
|
41.7 |
|
|
Thereafter |
|
|
28.3 |
|
|
|
|
$ |
246.5 |
|
Note 5. Property and Equipment
Property and equipment, net, consisted of the following:
|
|
|
December 31, |
|
|||||
|
(in millions) |
|
2017 |
|
|
2016 |
|
||
|
Leasehold improvements |
|
$ |
2.1 |
|
|
$ |
1.8 |
|
|
Furniture, equipment and other |
|
|
5.3 |
|
|
|
4.7 |
|
|
|
|
$ |
7.4 |
|
|
|
6.5 |
|
|
Less: Accumulated depreciation |
|
|
(3.6 |
) |
|
|
(2.7 |
) |
|
Property and equipment, net |
|
$ |
3.8 |
|
|
$ |
3.8 |
|
Depreciation expense related to property and equipment for the years ended December 31, 2017, 2016 and 2015 was $0.9 million, $0.7 million and $1.1 million, respectively.
Note 6. Long-Term Debt
Long-term debt is comprised of the following indebtedness to various lenders:
|
(in millions) |
|
December 31, 2017 |
|
|
December 31, 2016 |
|
||
|
Term Loan Facility, with interest at LIBOR plus 3.75% (equal to 4.75%) due 2020, net(a) |
|
$ |
- |
|
|
$ |
702.1 |
|
|
Amended and Restated Term Loan Facility, with interest at LIBOR plus 2.75% (equal to 4.42%) due 2024, net(b) |
|
|
554.2 |
|
|
|
- |
|
|
Less: Current maturities |
|
|
5.7 |
|
|
|
8.8 |
|
|
Long-term debt, net of current maturities, debt discount and deferred financing fees |
|
$ |
548.5 |
|
|
$ |
693.3 |
|
|
(a) |
Term Loan Facility as of December 31, 2016 is recorded net of unamortized discount of $6.0 million and net of unamortized deferred financing fees $5.2 million. |
|
(b) |
Amended and Restated Term Loan Facility as of December 31, 2017 is recorded net of unamortized discount of $3.6 million and net of unamortized deferred financing fees of $4.4 million. |
Amended and Restated Senior Secured Credit Facilities
Prior to October 2016, the senior secured credit facilities consisted of (a) a seven-year $430.0 million senior secured term loan facility (the “Term Loan Facility”) and (b) a $90.0 million senior secured revolving credit facility (the “Revolving Credit Facility” and, together the “Senior Secured Credit Facilities”). On October 28, 2016, Emerald Expositions Holding, Inc., “EEH”, entered into a third amendment to the Senior Secured Credit Facilities to (i) borrow an additional $200.0 million of term loans under the Term Loan Facility to fund the redemption of the
90
9.000% Senior Notes due 2021 and (ii) increase commitments under the Revolving Credit Facility by $10.0 million to a total of $100.0 million.
On May 8, 2017, using the net proceeds from the initial public offering, the Company prepaid $159.2 million of borrowings outstanding under the Term Loan Facility. On May 22, 2017, EEH amended and restated the Senior Secured Credit Facilities (the “Amended and Restated Senior Secured Credit Facilities”), which consist of (i) a seven-year $565.0 million senior secured term loan facility (the “Amended and Restated Term Loan Facility”), scheduled to mature on May 22, 2024 and (ii) a $150.0 million senior secured revolving credit facility (the “Amended and Restated Revolving Credit Facility” and, together with the Amended and Restated Term Loan Facility, the “Amended and Restated Senior Secured Credit Facilities”), scheduled to mature on May 23, 2022. On November 27, 2017, (the “Effective Date”), EEH entered into the Refinancing Agreement and First Amendment to the Amended and Restated Senior Secured Credit Facilities to reduce the interest rate applicable to term loans under the Amended and Restated Term Loan Facility, by 25 basis points, and on November 29, 2017, EEH entered into the Repricing Agreement and Second Amendment to the Amended and Restated Credit Agreement to reduce the interest rate applicable to revolving loans under the Amended and Restated Revolving Credit Agreement by 25 basis points.
The Amended and Restated Term Loan Facility proceeds of $563.6 million (net of a $1.4 million original issuance discount) were used to repay the outstanding principal and interest under the Term Loan Facility, pay third party fees of $6.4 million and pay $0.8 million in financing fees related to the increase in commitments under the Amended and Restated Revolving Credit Facility. An additional $1.5 million in third party fees were paid with cash from operations. Of the $6.4 million in third party fees, $3.8 million were recognized as interest expense. The remaining $2.6 million, together with the $1.5 million in third party fees that were paid with cash from operations, were recorded as deferred financing fees. The $1.4 million original issuance discount and the $2.6 million in deferred financing fees will be amortized over the life of the Amended and Restated Term Loan Facility using the effective interest method. The $0.8 million in deferred financing fees related to the Amended and Restated Revolving Credit Facility will be amortized over the life of the facility using the straight-line method.
In connection with the November 2017 repricings, third party fees of $0.7 million, were recognized as interest expense.
The Amended and Restated Senior Secured Credit Facilities allow for EEH to choose from the following two interest rate options:
|
- |
Alternate Base Rate (“ABR”) loans bear interest at a rate equal to a spread, or applicable margin, above the greatest of (i) the administrative agent’s prime rate, (ii) the Federal Funds Rate plus 50 basis points, and (iii) the one month London Interbank Offered Rate (“LIBOR”) plus 1.00%. |
or
|
- |
LIBOR loans bear interest at a rate equal to a spread, or applicable margin, over the LIBOR rate. |
From May 22, 2017 through the Effective Date, the spread, or applicable margin, was 2.00% for ABR loans and 3.00% for LIBOR loans. After the Effective Date, the spread, or applicable margin, was 1.75% for ABR loans and 2.75% for LIBOR loans. Following the first fiscal quarter after the Effective Date, (i) the applicable margin will step down by 0.25% if EEH’s Total First Lien Net Leverage Ratio (as defined in the Amended and Restated Senior Secured Credit Facilities) is lower than 2.75 to 1.00 and (ii) the applicable margin under the Amended and Restated Revolving Credit Facility (but not the Amended and Restated Term Loan Facility) will step down by an additional 0.25% if EEH’s Total First Lien Net Leverage Ratio is less than 2.50 to 1.00.
EEH is required to pay a quarterly commitment fee in respect of the unutilized commitments under the Amended and Restated Revolving Credit Facility in an amount equal to 0.50% per annum, calculated on the unused portion of the facility, which may be reduced to 0.375% upon achievement of a Total First Lien Ratio of 3.50 to 1.50. Upon the issuance of letters of credit under the Amended and Restated Revolving Credit Facility, EEH is required to pay fronting fees, customary issuance and administration fees and a letter of credit fee equal to the then-applicable margin (as determined by reference to LIBOR) for the Amended and Restated Revolving Credit Facility.
91
EEH had zero borrowings under its Amended and Restated Revolving Credit Facility as of December 31, 2017 and 2016. EEH had $0.9 million and $0.6 million in stand-by letters of credit issuances under its Amended and Restated Revolving Credit Facility and its Revolving Credit Facility as of December 31, 2017 and December 31, 2016, respectively.
Payments and Commitment Reductions
The Amended and Restated Term Loan Facility requires repayment in equal quarterly installments of 0.25% of the $565.0 million (the principal amount outstanding on May 22, 2017), with the balance due at maturity. Installment payments on the Amended and Restated Term Loan Facility are due on the last business day of each quarter, commencing on September 29, 2017.
Subject to the certain customary exceptions and limitations, EEH is required to prepay amounts outstanding under the Amended and Restated Term Loan Facility under specified circumstances, including 50.0% of Excess Cash Flow (“ECF”), subject to step-downs to 25% and 0% of excess cash flow at certain leverage based thresholds, and with 100% of the net cash proceeds of asset sales and casualty events in excess of certain thresholds (subject to certain reinvestment rights).
EEH may prepay the loans in whole or part without premium or penalty.
Guarantees; Collateral; Covenants; Events of Default
All obligations under the Amended and Restated Senior Secured Facility are guaranteed by EEH’s direct parent company and, subject to certain exceptions, by all of EEH’s direct and indirect wholly owned domestic subsidiaries. As of December 31, 2017, all of EEH’s subsidiaries and EEH’s direct parent have provided guarantees.
Subject to certain limitations, the obligations under the Amended and Restated Senior Secured Credit Facilities are secured by a perfected first priority security interest in substantially all tangible and intangible assets owned by EEH or by any guarantor.
The Amended and Restated Senior Secured Credit Facilities contain customary incurrence-based negative covenants, including limitations on indebtedness; limitations on liens; limitations on certain fundamental changes (including, without limitation, mergers, consolidations, liquidations and dissolutions); limitations on asset sales; limitations on dividends and other restricted payments; limitations on investments, loans and advances; limitations on repayments of subordinated indebtedness; limitations on transactions with affiliates; limitations on changes in fiscal periods; limitations on agreements restricting liens and/or dividends; and limitations on changes in lines of business. In addition, the Amended and Restated Revolving Credit Facility contains a financial covenant requiring EEH to comply with a 5.50 to 1.00 total first lien net secured leverage ratio test. This financial covenant is tested quarterly only if the aggregate amount of revolving loans, swingline loans and letters of credit outstanding under the Amended and Restated Revolving Credit Facility (net of up to $10.0 million of outstanding letters of credit) exceeds 35% of the total commitments thereunder. As of December 31, 2017, this financial covenant has not been triggered and EEH was in compliance with all covenants under the Amended and Restated Senior Secured Credit Facilities.
Events of default under the Amended and Restated Senior Secured Credit Facilities include, among others, nonpayment of principal when due; nonpayment of interest, fees or other amounts; cross-defaults; covenant defaults; material inaccuracy of representations and warranties; certain bankruptcy and insolvency events; material unsatisfied or unstated judgments; certain ERISA events; change of control; or actual or asserted invalidity of any guarantee or security document. There were no events of default under the Amended and Restated Senior Secured Credit Facilities as of December 31, 2017.
During the year ended December 31, 2017, EEH made borrowings of $43.0 million and repayments of $43.0 million on the Amended and Restated Revolving Credit Facility. During the year ended December 31, 2016, EEH made borrowings and repayments of $8.0 million on the Revolving Credit Facility. EEH had $0.9 million and $0.6 million in stand-by letter of credit issuances under the Amended and Restated Revolving Credit Facility and the Revolving Credit Facility as of December 31, 2017 and December 31, 2016, respectively.
92
Interest expense reported in the consolidated statements of income and comprehensive income consist of the following:
|
|
|
Year ended December 31, |
|
|||||||||
|
(in millions) |
|
2017 |
|
|
2016 |
|
|
2015 |
|
|||
|
Senior secured term loan |
|
$ |
32.6 |
|
|
$ |
29.9 |
|
|
$ |
27.2 |
|
|
9.00% Senior notes |
|
|
- |
|
|
|
14.9 |
|
|
|
18.1 |
|
|
Noncash interest for amortization of debt discount and debt issuance costs |
|
|
4.6 |
|
|
|
5.2 |
|
|
|
4.7 |
|
|
Realized and unrealized loss on interest rate swap and floor, net |
|
|
- |
|
|
|
0.8 |
|
|
|
1.5 |
|
|
Revolving credit facility commitment fees |
|
|
1.1 |
|
|
|
0.6 |
|
|
|
0.5 |
|
|
|
|
$ |
38.3 |
|
|
$ |
51.4 |
|
|
$ |
52.0 |
|
Interest Rate Swap and Floor
In March 2014, the Company entered into forward interest rate swap and floor contracts to manage and reduce its interest rate risk. The Company’s interest rate swap and floor have an effective date of December 31, 2015 and are settled on the last business day of each month of March, June, September and December, beginning March 31, 2016 through December 31, 2018. The Company made payments and recognized a realized loss of $1.4 million and $1.5 million during the year ended December 31, 2017 and 2016, respectively, representing the differential between the three-month LIBOR rate 2.705%, on the principal amount of $100.0 million. The Company marks-to-market its interest rate contracts quarterly with the unrealized and realized gains and losses included in interest expense in the consolidated statements of income and comprehensive income. For the years ended December 31, 2017 and 2016, the Company recorded an unrealized gain of $1.4 million and $0.7 million, respectively. The liability is included in accounts payable and other current liabilities and noncurrent liabilities in the consolidated balance sheets.
Note 7. Fair Value Measurements
As of December 31, 2017 and 2016, the Company’s assets and liabilities measured at fair value on a recurring basis are categorized in the tables below:
|
|
|
December 31, 2017 |
|
|||||||||||||
|
|
|
Total |
|
|
Level 1 |
|
|
Level 2 |
|
|
Level 3 |
|
||||
|
Assets |
|
|
|
|
|
|
|
|
|
|
|
|
|
|
|
|
|
Cash and cash equivalents |
|
$ |
10.9 |
|
|
$ |
10.9 |
|
|
$ |
- |
|
|
$ |
- |
|
|
Total assets at fair value |
|
$ |
10.9 |
|
|
$ |
10.9 |
|
|
$ |
- |
|
|
$ |
- |
|
|
|
|
|
|
|
|
|
|
|
|
|
|
|
|
|
|
|
|
Liabilities |
|
|
|
|
|
|
|
|
|
|
|
|
|
|
|
|
|
Interest rate swap and floor(a) |
|
$ |
0.8 |
|
|
$ |
- |
|
|
$ |
0.8 |
|
|
$ |
- |
|
|
Contingent consideration(a) |
|
|
1.6 |
|
|
|
- |
|
|
|
- |
|
|
|
1.6 |
|
|
Total liabilities at fair value |
|
$ |
2.4 |
|
|
$ |
- |
|
|
$ |
0.8 |
|
|
$ |
1.6 |
|
|
(a) |
Included in accounts payable and other current liabilities in the consolidated balance sheets. |
93
|
|
December 31, 2016 |
|
||||||||||||||
|
|
|
Total |
|
|
Level 1 |
|
|
Level 2 |
|
|
Level 3 |
|
||||
|
Assets |
|
|
|
|
|
|
|
|
|
|
|
|
|
|
|
|
|
Cash and cash equivalents |
|
$ |
14.9 |
|
|
$ |
14.9 |
|
|
$ |
- |
|
|
$ |
- |
|
|
Total assets at fair value |
|
$ |
14.9 |
|
|
$ |
14.9 |
|
|
$ |
- |
|
|
$ |
- |
|
|
|
|
|
|
|
|
|
|
|
|
|
|
|
|
|
|
|
|
Liabilities |
|
|
|
|
|
|
|
|
|
|
|
|
|
|
|
|
|
Interest rate swap and floor(a) |
|
$ |
2.3 |
|
|
$ |
- |
|
|
$ |
2.3 |
|
|
$ |
- |
|
|
Contingent consideration(b) |
|
|
8.5 |
|
|
|
- |
|
|
|
- |
|
|
|
8.5 |
|
|
Total liabilities at fair value |
|
$ |
10.8 |
|
|
$ |
- |
|
|
$ |
2.3 |
|
|
$ |
8.5 |
|
|
(a) |
Included in accounts payable and other current liabilities and other noncurrent liabilities in the consolidated balance sheets. |
|
(b) |
Included in accounts payable and other current liabilities in the consolidated balance sheets. |
The following table sets forth a summary of changes in the fair value of the Company’s Level 3 fair value measurements for the years ended December 31, 2016 and 2017.
|
(in millions) |
|
December 31, 2015 |
|
|
Additions |
|
|
December 31, 2016 |
|
|
Loss recognized in earnings from changes in fair value |
|
|
Payments |
|
|
Additions |
|
|
December 31, 2017 |
|
|||||||
|
Contingent consideration |
|
$ |
- |
|
|
$ |
8.5 |
|
|
$ |
8.5 |
|
|
$ |
0.3 |
|
|
$ |
(12.6 |
) |
|
$ |
5.4 |
|
|
$ |
1.6 |
|
The contingent consideration liability of $1.6 million as of December 31, 2017 is expected to be settled in 2018. The unobservable inputs used in calculating contingent consideration include probability weighted estimates regarding the likelihood of achieving revenue and EBITDA targets for the respective show acquired. The liability is re-measured to fair value each reporting period using the Company’s most recent internal operational budget. The determination of the fair value of the contingent consideration liabilities could change in future periods based upon the Company’s ongoing evaluation of the changes in the probability of achieving the revenue or EBITDA targets. Any such changes in fair value will be recorded in selling, general and administrative expense in the consolidated statements of income and comprehensive income.
The contingent consideration liabilities of $8.5 million as of December 31, 2016 were settled in 2017. These liabilities were re-measured to fair value each reporting period using the Company’s most recent internal operational budgets. There were no remeasurement adjustments or payments of earn out liabilities between the acquisition dates and December 31, 2016. During our internal reviews in 2017, the Company recorded a $0.3 million increase in fair value which is included in selling, general and administrative expense in the consolidated statements of income and comprehensive income.
Note 8. Related-Party and Former Parent Transactions
Emerald entered into a Services Agreement, dated June 17, 2013, with Onex Partners. Under the Services Agreement, Onex Partners provided expertise and advisory services, including, financial and structural analysis, due diligence investigations, and other advice and negotiation assistance. The fee for these services was payable quarterly. In conjunction with the Company’s initial public offering, the Service Agreement was terminated. The Onex Partners service expense was $0.2 million, $0.8 million and $0.8 million for the years ended December 31, 2017, 2016 and 2015, respectively, and is included in selling, general and administrative expenses in the consolidated statements of income and comprehensive income.
94
Note 9. Shareholder’s Equity and Stock-Based Compensation
Emerald Expositions Events, Inc. Common Stock Issuances
In the first quarter of 2017, 2016 and 2015, the Board of Directors approved and granted 8,625, 11,625 and 4,375 shares, respectively, of the Company’s common stock to the Company’s independent directors as part of their Board compensation.
On April 28, 2017, the Company’s stock began trading on the New York Stock Exchange under the symbol “EEX”. On May 3, 2017, the Company completed the initial public offering of its common stock. The Company sold a total of 10,333,333 shares of common stock.
On May 24, 2017, the Board of Directors declared and approved a dividend on each share of common stock outstanding on the record date (June 7, 2017), payable to the Company’s common stock holders on June 21, 2017. The dividend payment was $0.07 per share and resulted in an aggregate dividend payment of $5.1 million.
On August 1, 2017, the Board of Directors declared and approved a dividend on each share of common stock outstanding on the record date (August 17, 2017), payable to the Company’s common stock holders on August 31, 2017. The dividend payment was $0.07 per share and resulted in an aggregate dividend payment of $5.1 million.
On October 27, 2017, the Board of Directors declared and approved a dividend on each share of common stock outstanding on the record date (November 16, 2017), payable to the Company’s common stock holders on November 30, 2017. The dividend payment was $0.07 per share and resulted in an aggregate dividend payment of $5.1 million.
Emerald Expositions Events, Inc. 2013 Stock Option Plan (“the 2013 Plan”) and 2017 Omnibus Equity Plan (“the 2017 Plan”)
Effective June 17, 2013 the Company’s Board of Directors approved the adoption of the Expo Event Holdco, Inc. 2013 Stock Option Plan (“the 2013 Plan”) and reserved 4,963,875 shares for awards to be issued under the 2013 Plan. The 2013 Plan was amended effective July 19, 2013 to increase the shares reserved to be issued under the plan to 5,227,750 shares. Primarily as a result of the acquisition of GLM in January 2014 and the 17,500,000 additional common stock shares issued to partially fund that acquisition, the 2013 Plan was amended effective April 22, 2014 to reserve an additional 2,177,000 shares for issuance. Following the Company’s IPO, the 2013 Plan will no longer be used for future grants.
In April 2017, the Company adopted the 2017 Omnibus Equity Plan (the “2017 Plan”). The Company’s stockholders approved the 2017 Plan and it became effective in connection with the Company’s initial public offering. Under the 2017 Plan, the Company may grant incentive stock options, non-statutory stock options, restricted stock, restricted stock units (“RSUs”) and stock appreciation rights, dividend equivalent rights, share awards and performance-based awards to employees, directors or consultants. The Company has initially reserved 5,000,000 shares of its common stock for issuance under the 2017 Plan. A total of 4,851,591 shares were available for future grant under the 2017 Plan at December 31, 2017.
The Board of Directors determines eligibility, vesting schedules and exercise prices for award grants. Option grants have a contractual term of 10 years from the date of grant. Under the 2013 Plan, the options were granted in two or three tranches with varying exercise prices with Tranche 1 exercise price being equal to the fair market value the Company’s common stock at the date of grant. Tranche 1: 50% or 75% option shares at exercise price at fair market value of common stock (varied); Tranche 2: 25% option shares at exercise price above fair market value and Tranche 3: 0% - 25% option shares at exercise price above fair market value. Under the 2017 Plan, the options have been granted in one tranche with the exercise price being equal to the fair market value of the Company’s common stock at the date of grant.
Vesting of all option grants begins at the first anniversary of the date of grant. Options granted under the 2013 Plan vest 20% per year over five years. Options granted under the 2017 Plan vest 25% per year over four years.
95
The fair value of stock options is estimated on the grant date using the Black-Scholes option pricing model using the following assumptions:
|
|
|
Year Ended December 31, 2015 |
|
|||||
|
|
|
Range |
|
|
Weighted-Average |
|
||
|
Expected volatility |
|
26.14% to 35.55% |
|
|
|
|
|
|
|
Dividend yield |
|
0.00% |
|
|
|
|
|
|
|
Risk-free interest rate |
|
1.49% to 2.14% |
|
|
|
|
|
|
|
Expected term (in years) |
|
5.50 to 7.50 |
|
|
|
|
|
|
|
Weighted-average fair value at grant date |
|
|
|
|
|
$ |
3.57 |
|
|
|
|
Year Ended December 31, 2016 |
|
|||||
|
|
|
Range |
|
|
Weighted-Average |
|
||
|
Expected volatility |
|
25.68% to 33.88% |
|
|
|
|
|
|
|
Dividend yield |
|
0.00% |
|
|
|
|
|
|
|
Risk-free interest rate |
|
1.15% to 1.65% |
|
|
|
|
|
|
|
Expected term (in years) |
|
5.50 to 7.50 |
|
|
|
|
|
|
|
Weighted-average fair value at grant date |
|
|
|
|
|
$ |
3.56 |
|
|
|
|
|
|
|
|
|
|
|
|
|
|
Year Ended December 31, 2017 |
|
|||||
|
|
|
Range |
|
|
Weighted-Average |
|
||
|
Expected volatility |
|
24.12% to 26.04% |
|
|
|
|
|
|
|
Dividend yield |
|
1.30% |
|
|
|
|
|
|
|
Risk-free interest rate |
|
1.91% to 2.04% |
|
|
|
|
|
|
|
Expected term (in years) |
|
5.25 to 7.00 |
|
|
|
|
|
|
|
Weighted-average fair value at grant date |
|
|
|
|
|
$ |
5.53 |
|
Stock option activity for the year ended December 31, 2017, was as follows:
|
|
|
|
|
|
|
Weighted-Average |
|
|
|
|
|
|||||
|
|
|
Number of Options |
|
|
Exercise Price per Option |
|
|
Remaining Contractual Term |
|
|
Aggregate Intrinsic Value |
|
||||
|
(share data in thousands) |
|
|
|
|
|
|
|
|
|
(years) |
|
|
(millions) |
|
||
|
Outstanding at December 31, 2016 |
|
|
7,157 |
|
|
$ |
10.91 |
|
|
|
|
|
|
|
|
|
|
Granted |
|
|
45 |
|
|
|
22.66 |
|
|
|
|
|
|
|
|
|
|
Exercised |
|
|
(402 |
) |
|
|
13.15 |
|
|
|
|
|
|
|
|
|
|
Forfeited |
|
|
(247 |
) |
|
|
12.04 |
|
|
|
|
|
|
|
|
|
|
Outstanding at December 31, 2017 |
|
|
6,553 |
|
|
$ |
10.82 |
|
|
|
5.91 |
|
|
$ |
62.5 |
|
|
Exercisable at December 31, 2017 |
|
|
4,686 |
|
|
$ |
10.64 |
|
|
|
5.80 |
|
|
$ |
45.5 |
|
96
Information regarding fully vested and expected to vest stock options as of December 31, 2017 is as follows:
|
Weighted Average Exercise Price |
|
Number of Options |
|
|
Weighted Average Remaining Contractual Life |
|
||
|
$8.00 |
|
|
3,309 |
|
|
|
5.78 |
|
|
$10.40 |
|
|
240 |
|
|
|
6.92 |
|
|
$12.00 |
|
|
1,602 |
|
|
|
5.89 |
|
|
$13.03 |
|
|
8 |
|
|
|
8.12 |
|
|
$16.00 |
|
|
1,342 |
|
|
|
5.93 |
|
|
$22.66 |
|
|
44 |
|
|
|
9.73 |
|
|
$10.82 |
|
|
6,545 |
|
|
|
5.91 |
|
The aggregate intrinsic value is the amount by which the fair value of our common stock exceeded the exercise price of the options at December 31, 2017, for those options for which the market price was in excess of the exercise price.
The Company recorded stock-based compensation expense for the stock option grants for the years ended December 31, 2017, 2016 and 2015 of $1.7 million, $3.0 million and $5.1 million, respectively, which is included in selling, general and administrative expenses on the consolidated statements of income and comprehensive income. The related deferred tax benefit for stock-based compensation recognized was $0.6 million, $1.1 million and $2.0 million for the years ended December 31, 2017, 2016, and 2015, respectively.
There were 4,685,974 stock options vested and exercisable at December 31, 2017. The total fair value of shares vested during the years ended December 31, 2017, 2016 and 2015 based on weighted average grant date fair value was $3.7 million, $3.7 million, and $3.8 million, respectively.
Restricted Stock Units
In 2017, the Company granted RSUs that contain service and, in certain instances, performance conditions to certain executives and employees. The Company recognizes cumulative stock-based compensation expense for the portion of the awards for which the service period and performance conditions, as applicable, are probable of being satisfied. Stock-based compensation expense recognized in the year ended December 31, 2017 was $0.7 million.
The Company’s summary of RSU activity under the 2017 Plan was as follows:
|
|
|
Number of RSUs |
|
|
Weighted Average Grant Date Fair Value per Share |
|
||
|
Unvested balance, December 31, 2016 |
|
|
- |
|
|
$ |
- |
|
|
Granted |
|
|
105 |
|
|
|
22.02 |
|
|
Forfeited |
|
|
(2 |
) |
|
|
21.32 |
|
|
Unvested balance, December 31, 2017 |
|
|
103 |
|
|
$ |
22.03 |
|
There was a total of $1.2 million unrecognized stock-based compensation expense at December 31, 2017 related to unvested stock options and RSUs expected to be recognized over a weighted-average period of 0.9 years.
Note 10. Earnings Per Share
Basic earnings per share is computed using the weighted-average number of common shares outstanding during the period. Diluted earnings per share is computed using the weighted-average number of common shares outstanding during the period, plus the dilutive effect of outstanding options, using the treasury stock method and the average market price of the Company's common stock during the applicable period. Certain shares related to some of the
97
Company's outstanding stock options were excluded from the computation of diluted earnings per share because they were antidilutive in the periods presented, but could be dilutive in the future.
On April 10, 2017, the Company effected a 125-for-one stock split of the Company’s issued and outstanding common shares and increased its authorized shares of common stock to 800,000,000 shares. The par value of the common stock was not adjusted as a result of the stock split. All issued and outstanding share and per share amounts included in the consolidated financial statements have been retroactively restated to reflect the stock split. Fractional shares resulting from the stock split were rounded down to the nearest whole share.
The details of the computation of basic and diluted earnings per common share are as follows:
|
|
|
Year Ended December 31, |
|
|||||||||
|
(dollars in millions, share data in thousands except earnings per share) |
|
2017 |
|
|
2016 |
|
|
2015 |
|
|||
|
Net income |
|
$ |
81.8 |
|
|
$ |
22.2 |
|
|
$ |
19.6 |
|
|
Weighted average common shares outstanding |
|
|
68,912 |
|
|
|
61,859 |
|
|
|
61,847 |
|
|
Basic earnings per share |
|
$ |
1.19 |
|
|
$ |
0.36 |
|
|
$ |
0.32 |
|
|
Net income |
|
$ |
81.8 |
|
|
$ |
22.2 |
|
|
$ |
19.6 |
|
|
Weighted average common shares outstanding |
|
|
68,912 |
|
|
|
61,859 |
|
|
|
61,847 |
|
|
Diluted effect of stock options |
|
|
3,204 |
|
|
|
1,435 |
|
|
|
669 |
|
|
Diluted weighted average common shares outstanding |
|
|
72,116 |
|
|
|
63,294 |
|
|
|
62,516 |
|
|
Diluted earnings per share |
|
$ |
1.13 |
|
|
$ |
0.35 |
|
|
$ |
0.31 |
|
|
Anti-dilutive shares excluded from diluted earnings per share calculation |
|
|
63 |
|
|
|
1,691 |
|
|
|
3,666 |
|
Note 11. Defined Contribution Plans
On January 1, 2014, the Company established the Emerald Expositions, Inc. 401(k) Savings Plan (the “Emerald Plan”). The Company matches 50% of up to 6% of an eligible plan participant’s compensation for the contribution period. For each of the years ended December 31, 2017, 2016 and 2015 the Company recorded compensation expense of $0.9 million for the employer matching contribution. On January 1, 2015 the Emerald Plan’s name changed to the Emerald Expositions, LLC 401(k) Savings Plan.
Beginning on January 15, 2014, Emerald acquired as part of the GLM acquisition, the George Little Management, LLC 401(k) and Profit Sharing Plan (the “GLM Plan”). The GLM Plan was a self-administered defined contribution plan. On January 1, 2015 the GLM Plan was merged into the Emerald Plan.
Note 12. Income Taxes
The (benefit from) provision for income taxes attributable to income before income taxes consisted of:
|
|
|
December 31, |
|
|||||||||
|
(in millions) |
|
2017 |
|
|
2016 |
|
|
2015 |
|
|||
|
Current |
|
|
|
|
|
|
|
|
|
|
|
|
|
Federal |
|
$ |
0.6 |
|
|
$ |
1.0 |
|
|
$ |
0.8 |
|
|
State and local |
|
|
4.3 |
|
|
|
2.6 |
|
|
|
1.6 |
|
|
|
|
|
4.9 |
|
|
|
3.6 |
|
|
|
2.4 |
|
|
Deferred |
|
|
|
|
|
|
|
|
|
|
|
|
|
Federal |
|
|
(38.9 |
) |
|
|
11.3 |
|
|
|
9.8 |
|
|
State and local |
|
|
(1.0 |
) |
|
|
(0.9 |
) |
|
|
(1.9 |
) |
|
|
|
|
(39.9 |
) |
|
|
10.4 |
|
|
|
7.9 |
|
|
Total (benefit from) provision for income taxes |
|
$ |
(35.0 |
) |
|
$ |
14.0 |
|
|
$ |
10.3 |
|
98
The Company’s provision for income taxes was different from the amount computed by applying the statutory federal income tax rate of 35% to the underlying income before income taxes as a result of the following:
|
|
|
December 31, |
|
|||||||||
|
(in millions) |
|
2017 |
|
|
2016 |
|
|
2015 |
|
|||
|
Income before income taxes |
|
$ |
46.8 |
|
|
$ |
36.2 |
|
|
$ |
29.9 |
|
|
U.S. statutory tax rate |
|
|
35.0 |
% |
|
|
35.0 |
% |
|
|
35.0 |
% |
|
Taxes at the U.S. statutory rate |
|
|
16.4 |
|
|
|
12.7 |
|
|
|
10.5 |
|
|
Tax effected differences |
|
|
|
|
|
|
|
|
|
|
|
|
|
State and local taxes, net of federal benefit |
|
|
1.9 |
|
|
|
1.5 |
|
|
|
1.3 |
|
|
Excess tax deductions on share-based payments |
|
|
(1.0 |
) |
|
|
- |
|
|
|
- |
|
|
Change in valuation allowance |
|
|
- |
|
|
|
- |
|
|
|
(0.1 |
) |
|
Change in tax rates |
|
|
(52.1 |
) |
|
|
(0.4 |
) |
|
|
(1.7 |
) |
|
Change in uncertain tax positions |
|
|
(0.4 |
) |
|
|
- |
|
|
|
- |
|
|
Other, net |
|
|
0.2 |
|
|
|
0.2 |
|
|
|
0.3 |
|
|
Total (benefit from) provision for income taxes |
|
$ |
(35.0 |
) |
|
$ |
14.0 |
|
|
$ |
10.3 |
|
The change in tax rates is primarily a result of the Tax Cuts and Jobs Act, which reduced the Federal Statutory rate from 35% to 21% beginning January 1, 2018. Changes in the relative mix of revenue derived, wages paid and property locations by state, impact the Company’s apportionment factors and blended state tax rates which are applied in measuring its deferred tax assets and liabilities.
Deferred taxes consisted of the following:
|
|
|
December 31, |
|
|||||
|
(in millions) |
|
2017 |
|
|
2016 |
|
||
|
Deferred tax assets |
|
|
|
|
|
|
|
|
|
Net operating loss carryforwards |
|
$ |
0.3 |
|
|
$ |
21.3 |
|
|
Deferred compensation |
|
|
1.4 |
|
|
|
0.1 |
|
|
Stock-based compensation |
|
|
4.5 |
|
|
|
6.2 |
|
|
Fixed asset depreciation |
|
|
0.4 |
|
|
|
0.8 |
|
|
Accrued expenses |
|
|
0.3 |
|
|
|
0.4 |
|
|
Credits |
|
|
2.8 |
|
|
|
3.3 |
|
|
Other assets |
|
|
1.1 |
|
|
|
2.0 |
|
|
Deferred tax assets |
|
|
10.8 |
|
|
|
34.1 |
|
|
Valuation allowance |
|
|
(0.3 |
) |
|
|
(0.3 |
) |
|
Net deferred tax assets |
|
|
10.5 |
|
|
|
33.8 |
|
|
Deferred tax liabilities |
|
|
|
|
|
|
|
|
|
Goodwill and intangible assets |
|
|
(110.7 |
) |
|
|
(173.9 |
) |
|
Net deferred tax liability |
|
$ |
(100.2 |
) |
|
$ |
(140.1 |
) |
|
Recognized as |
|
|
|
|
|
|
|
|
|
Deferred income taxes, noncurrent |
|
$ |
(100.2 |
) |
|
$ |
(140.1 |
) |
|
|
|
$ |
(100.2 |
) |
|
$ |
(140.1 |
) |
The Tax Cuts and Jobs Act was enacted on December 22, 2017, and permanently reduces the U.S. federal corporate tax rate from 35% to 21%. Accounting Standard Codification ("ASC") 740 requires filers to record the effect of tax law changes in the period enacted. However, the SEC issued Staff Accounting Bulletin No. 118 ("SAB 118"), that permits filers to record provisional amounts during a measurement period ending no later than one year from the date of the Tax Cuts and Jobs Act enactment.
99
As of December 31, 2017, the Company has not completed its accounting for the tax effects of enactment of the Tax Cuts and Jobs Act. However, the Company has recorded a provisional tax benefit of $52.1 million for the remeasurement of certain deferred tax liabilities in the U.S. from 35% to 21%. This provisional amount is included as a component of (benefit from) provision for income taxes as reported in the consolidated statements of operations and comprehensive income.
Additionally, the Company has not recorded provisional amounts for other aspects of the Tax Cuts and Jobs Act, including the potential impact of items effective January 1, 2018 and continue to account for those items based on its existing accounting under ASC 740 and the provisions of the tax laws that were in effect immediately prior to enactment. Further, the Company anticipates the Department of the Treasury, FASB and other regulators to release additional guidance and authority that could affect the accounting for the tax effects of enactment of the Tax Cuts and Jobs Act.
At December 31, 2017 and 2016, the Company had federal net operating loss carryforwards of approximately zero and $59.9 million, respectively. At December 31, 2017 and 2016, the Company had federal alternative minimum tax (“AMT”) credit carryforwards of approximately $2.8 million and $3.3 million, respectively, and the AMT credits have an indefinite carryover period.
The following table reflects changes in the gross unrecognized tax benefits:
|
|
|
December 31, |
|
|||||||||
|
(in millions) |
|
2017 |
|
|
2016 |
|
|
2015 |
|
|||
|
Gross unrecognized tax benefits-beginning of period |
|
$ |
0.4 |
|
|
$ |
0.4 |
|
|
$ |
0.5 |
|
|
Decreases related to prior year tax positions |
|
|
(0.4 |
) |
|
|
- |
|
|
|
(0.1 |
) |
|
Increases related to current year tax provisions |
|
|
1.7 |
|
|
|
- |
|
|
|
- |
|
|
Gross unrecognized tax benefits-end of period |
|
$ |
1.7 |
|
|
$ |
0.4 |
|
|
$ |
0.4 |
|
During all years presented, the Company recognized interest and penalties related to unrecognized tax benefits within the provision for income taxes in the consolidated statements of operations and comprehensive income. The amount of interest and penalties accrued as of December 31, 2017 and 2016 were not material.
If the balance of gross unrecognized tax benefits of $1.7 million as of December 31, 2017 were realized in a future period, this would result in a tax benefit of $0.5 million within the provision for income taxes at such time.
Note 13. Commitments and Contingencies
Leases and Other Contractual Arrangements
The Company has entered into operating leases and other contractual obligations to secure real estate facilities and trade show venues. These agreements are not unilaterally cancelable by the Company, are legally enforceable and specify fixed or minimum amounts or quantities of goods or services at fixed or minimum prices.
The amounts presented below represent the minimum annual payments under the Company’s purchase obligations that have initial or remaining non-cancelable terms in excess of one year.
|
|
|
Years Ending December 31, |
|
|||||||||||||||||||||||||
|
(in millions) |
|
2018 |
|
|
2019 |
|
|
2020 |
|
|
2021 |
|
|
2022 |
|
|
There-after |
|
|
Total |
|
|||||||
|
Operating leases |
|
$ |
3.9 |
|
|
$ |
3.8 |
|
|
$ |
3.9 |
|
|
$ |
3.3 |
|
|
$ |
3.0 |
|
|
$ |
10.8 |
|
|
$ |
28.7 |
|
|
Other contractual obligations |
|
|
41.7 |
|
|
|
18.2 |
|
|
|
12.6 |
|
|
|
1.0 |
|
|
|
0.3 |
|
|
|
- |
|
|
|
73.8 |
|
|
|
|
$ |
45.6 |
|
|
$ |
22.0 |
|
|
$ |
16.5 |
|
|
$ |
4.3 |
|
|
$ |
3.3 |
|
|
$ |
10.8 |
|
|
$ |
102.5 |
|
100
Total expenses incurred under operating leases were $4.3 million, $2.6 million and $3.3 million for the years ended December 31, 2017, 2016 and 2015, respectively.
Other Contingent Commitments
Legal Proceedings and Contingencies
The Company is subject to litigation and other claims in the ordinary course of business. In the opinion of management, the Company’s liability, if any, arising from regulatory matters and legal proceedings related to these matters is not expected to have a material adverse impact on the Company’s consolidated balance sheet, results of operations or cash flows.
In the opinion of management, there are no claims, commitments or guarantees pending to which the Company is party that would have a material adverse effect on the consolidated financial statements.
Note 14. Accounts payable and other current liabilities
Accounts payable and other current liabilities consisted of the following:
|
|
|
December 31, |
|
|||||
|
(in millions) |
|
2017 |
|
|
2016 |
|
||
|
Accrued personnel costs |
|
$ |
7.6 |
|
|
$ |
7.0 |
|
|
Other current liabilities |
|
|
6.4 |
|
|
|
5.2 |
|
|
Contingent consideration |
|
|
1.6 |
|
|
|
8.5 |
|
|
Accrued event costs |
|
|
3.6 |
|
|
|
3.6 |
|
|
Trade payables |
|
|
5.3 |
|
|
|
3.8 |
|
|
Accrued interest |
|
|
0.5 |
|
|
|
0.1 |
|
|
Total accounts payable and other current liabilities |
|
$ |
25.0 |
|
|
$ |
28.2 |
|
Other current liabilities is primarily comprised of corporate accruals and the current portion of the liability related to the interest rate swap and floor.
Note 15. Subsequent Event
On January 26, 2018, the Company’s Board of Directors approved, and the Company subsequently declared, the payment of a cash dividend of $0.07 per share for the quarter ending March 31, 2018 to holders of record of the Company’s common stock as of February 9, 2018.
101
Emerald Expositions Events, Inc. (parent company only)
Schedule I – Condensed Financial Information of Registrant
Condensed Balance Sheets
December 31, 2017 and 2016
|
(dollars in millions, share data in thousands except par value) |
|
2017 |
|
|
2016 |
|
||
|
Assets |
|
|
|
|
|
|
|
|
|
Current assets |
|
|
|
|
|
|
|
|
|
Receivable from related parties |
|
$ |
- |
|
|
$ |
- |
|
|
Total current assets |
|
|
- |
|
|
|
- |
|
|
Noncurrent assets |
|
|
|
|
|
|
|
|
|
Long term receivable from related parties |
|
|
- |
|
|
|
- |
|
|
Investment in subsidiaries |
|
|
761.2 |
|
|
|
527.7 |
|
|
Total assets |
|
$ |
761.2 |
|
|
$ |
527.7 |
|
|
Liabilities and Shareholders' Equity |
|
|
|
|
|
|
|
|
|
Current liabilities |
|
|
|
|
|
|
|
|
|
Payable to subsidiary |
|
$ |
- |
|
|
$ |
- |
|
|
Total current liabilities |
|
|
- |
|
|
|
- |
|
|
Noncurrent liabilities |
|
|
|
|
|
|
|
|
|
Long term payable to subsidiary |
|
|
- |
|
|
|
- |
|
|
Total liabilities |
|
$ |
- |
|
|
$ |
- |
|
|
|
|
|
|
|
|
|
|
|
|
Shareholders' equity |
|
|
|
|
|
|
|
|
|
Preferred stock, $0.01 par value; authorized shares at December 31, 2017: 80,000; no shares issued and outstanding at December 31, 2017 |
|
|
- |
|
|
|
- |
|
|
Common stock, $0.01 par value; authorized shares: 800,000; |
|
|
|
|
|
|
|
|
|
Issued and outstanding shares: 72,604 and 61,860 at December 31, 2017 and 2016, respectively |
|
|
0.7 |
|
|
|
0.6 |
|
|
Additional paid-in capital |
|
|
677.1 |
|
|
|
510.3 |
|
|
Retained earnings |
|
|
83.4 |
|
|
|
16.8 |
|
|
Total shareholders' equity |
|
$ |
761.2 |
|
|
$ |
527.7 |
|
|
Total liabilities and shareholders' equity |
|
$ |
761.2 |
|
|
$ |
527.7 |
|
102
Emerald Expositions Events, Inc. (parent company only)
Schedule I – Condensed Financial Information of Registrant
Condensed Statements of Income and Comprehensive Income
December 31, 2017, 2016 and 2015
|
(dollars in millions) |
|
2017 |
|
|
2016 |
|
|
2015 |
|
|||
|
Revenues |
|
$ |
- |
|
|
$ |
- |
|
|
$ |
- |
|
|
Other income |
|
|
- |
|
|
|
- |
|
|
|
- |
|
|
Cost of revenues |
|
|
- |
|
|
|
- |
|
|
|
- |
|
|
Selling, general and administrative expense |
|
|
- |
|
|
|
- |
|
|
|
- |
|
|
Depreciation and amortization expense |
|
|
- |
|
|
|
- |
|
|
|
- |
|
|
Intangible asset impairment charge |
|
|
- |
|
|
|
- |
|
|
|
- |
|
|
Operating income |
|
|
- |
|
|
|
- |
|
|
|
- |
|
|
Interest expense |
|
|
- |
|
|
|
- |
|
|
|
- |
|
|
Loss on extinguishment of debt |
|
|
- |
|
|
|
- |
|
|
|
- |
|
|
Income before income taxes |
|
|
- |
|
|
|
- |
|
|
|
- |
|
|
(Benefit from) provision for income taxes |
|
|
- |
|
|
|
- |
|
|
|
- |
|
|
Earnings before equity in net income and comprehensive income of subsidiaries |
|
|
- |
|
|
|
- |
|
|
|
- |
|
|
Equity in net income and comprehensive income of subsidiaries |
|
|
81.8 |
|
|
|
22.2 |
|
|
|
19.6 |
|
|
Net income and comprehensive income |
|
$ |
81.8 |
|
|
$ |
22.2 |
|
|
$ |
19.6 |
|
103
Emerald Expositions Events, Inc. (parent company only)
Schedule I – Condensed Financial Information of Registrant
Notes to Condensed Financial Statements
December 31, 2017, 2016 and 2015
1. Basis of Presentation
In the parent-company-only financial statement, Emerald Expositions Events, Inc.’s investment in subsidiaries is stated at cost plus equity in undistributed earnings of subsidiaries since the date of acquisition. The parent-company-only financial statements should be read in conjunction with the Company’s consolidated financial statements. A condensed statement of cash flows was not presented because Emerald Expositions Events, Inc.’s net operating activities have no cash impact and there were no investing or financing cash flow activities during the fiscal years ended December 31, 2017, 2016 and 2015.
Income taxes and non-cash stock-based compensation have been allocated to the Company’s subsidiaries for the fiscal years ended December 31, 2017, 2016 and 2015.
2. Guarantees and Restrictions
On May 22, 2017, EEH entered into the Amended and Restated Senior Secured Credit Facilities, by and among Expo Event Midco, Inc. (“EEM”), EEH and EEH’s subsidiaries as guarantors, various lenders from time to time party thereto and Bank of America, N.A., as administrative agent. The Amended and Restated Senior Secured Credit Facilities include restrictions on the ability of EEH and its restricted subsidiaries to incur additional liens and indebtedness, make investments and dispositions, pay dividends and make intercompany loans and advances or enter into other transactions, among other restrictions, in each case subject to certain exceptions. Under the Amended and Restated Senior Secured Credit Facilities, EEH is permitted to pay dividends so long as immediately after giving effect thereto, no default or event of default had occurred and was continuing, (a) up to an amount equal to, (i) a basket that builds based on 50% of EEH’s Consolidated Net Income (as defined in the Amended and Restated Credit Facilities) and certain other amounts, subject to various conditions including compliance with a fixed charge coverage ratio of 2.0 to 1.0 and (b) in certain additional limited amounts, subject to certain exceptions set forth in the Senior Secured Credit Facilities.
Since the restricted net assets of EEH and its subsidiaries exceed 25% of the consolidated net assets of the Company and its subsidiaries, the accompanying condensed parent company financial statements have been prepared in accordance with Rule 12-04, Schedule 1 of Regulation S-X. This information should be read in conjunction with the accompanying consolidated financial statements.
104
Emerald Expositions Events, Inc.
Schedule II – Valuation and Qualifying Accounts
|
|
|
|
|
|
|
|
|
Additions |
|
|
|
|
|
|
|
|
|
|||||
|
|
|
Balance at Beginning of Period |
|
Charged to Costs & Expenses |
|
|
Charged to Other Accounts |
|
|
Deductions |
|
|
Balance at End of Period |
|
||||||||
|
Description |
|
(in millions) |
|
|||||||||||||||||||
|
Year Ended December 31, 2017: |
|
|
|
|
|
|
|
|
|
|
|
|
|
|
|
|
|
|
|
|
|
|
|
Allowance for doubtful accounts |
|
$ |
0.7 |
|
|
|
|
|
0.5 |
|
|
|
- |
|
|
|
(0.4 |
) |
|
$ |
0.8 |
|
|
Deferred tax asset valuation allowance |
|
$ |
0.3 |
|
|
|
|
|
- |
|
|
|
- |
|
|
|
- |
|
|
$ |
0.3 |
|
|
|
|
|
|
|
|
|
|
|
|
|
|
|
|
|
|
|
|
|
|
|
|
|
|
Year Ended December 31, 2016: |
|
|
|
|
|
|
|
|
|
|
|
|
|
|
|
|
|
|
|
|
|
|
|
Allowance for doubtful accounts |
|
$ |
1.9 |
|
|
|
|
|
0.7 |
|
|
|
- |
|
|
|
(1.9 |
) |
|
$ |
0.7 |
|
|
Deferred tax asset valuation allowance |
|
$ |
0.3 |
|
|
|
|
|
- |
|
|
|
- |
|
|
|
- |
|
|
$ |
0.3 |
|
|
|
|
|
|
|
|
|
|
|
|
|
|
|
|
|
|
|
|
|
|
|
|
|
|
Year Ended December 31, 2015: |
|
|
|
|
|
|
|
|
|
|
|
|
|
|
|
|
|
|
|
|
|
|
|
Allowance for doubtful accounts |
|
$ |
1.8 |
|
|
|
|
|
0.7 |
|
|
|
- |
|
|
|
(0.6 |
) |
|
$ |
1.9 |
|
|
Deferred tax asset valuation allowance |
|
$ |
0.4 |
|
|
|
|
|
- |
|
|
|
- |
|
|
|
(0.1 |
) |
|
$ |
0.3 |
|
105
Item 9. Changes in and Disagreements With Accountants on Accounting and Financial Disclosure.
None.
Item 9A. Controls and Procedures.
Evaluation of Disclosure Controls and Procedures
Our management, with the participation of our Chief Executive Officer and Chief Financial Officer, has evaluated the effectiveness of our disclosure controls and procedures (as defined in Exchange Act Rules 13a-15(e) and 15(d)-15(e)), as of the end of the period covered by this report. Based upon the evaluation, the Chief Executive Officer and Chief Financial Officer concluded that, as of the end of the period covered by this report, the disclosure controls and procedures were effective to provide reasonable assurance that information required to be disclosed in the reports we file and submit under the Exchange Act is (i) recorded, processed, summarized and reported within the time periods specified in the SEC’s rules and forms and (ii) accumulated and communicated to our management, including our Chief Executive Officer and Chief Financial Officer, as appropriate to allow timely decisions regarding required disclosure. In designing and evaluating our disclosure controls and procedures, management recognizes that any controls and procedures, no matter how well designed and operated, can provide only reasonable assurance of achieving their objectives, and management necessarily applies its judgment in evaluating the benefits of possible controls and procedures relative to their costs.
Changes in Internal Control
There were no changes in our internal control over financial reporting identified in management's evaluation pursuant to Rules 13a-15(d) or 15d-15(d) of the Exchange Act during the period covered by this Annual Report on Form 10-K that materially affected, or are reasonably likely to materially affect, our internal control over financial reporting.
Management’s Report on Internal Control over Financial Reporting
This Annual Report on Form 10-K does not include a report of management’s assessment regarding our internal control over financial reporting (as defined in Rule 13a-15(f) under the Exchange Act) or an attestation report of our independent registered accounting firm due to a transition period established by rules of the Securities and Exchange Commission for newly public companies. Additionally, our independent registered public accounting firm will not be required to opine on the effectiveness of our internal control over financial reporting pursuant to Section 404 until we are no longer an “emerging growth company” as defined in the JOBS Act.
None.
106
Item 10. Directors, Executive Officers and Corporate Governance.
The information required by this item will be included in our definitive proxy statement for the 2018 Annual Meeting of Shareholders and is incorporated herein by reference. We will file such definitive proxy statement with the SEC pursuant to Regulation 14A within 120 days after our fiscal year ended December 31, 2017.
Item 11. Executive Compensation.
The information required by this item will be included in our definitive proxy statement for the 2018 Annual Meeting of Shareholders and is incorporated herein by reference. We will file such definitive proxy statement with the SEC pursuant to Regulation 14A within 120 days after our fiscal year ended December 31, 2017.
Item 12. Security Ownership of Certain Beneficial Owners and Management and Related Stockholder Matters.
The information required by this item will be included in our definitive proxy statement for the 2018 Annual Meeting of Shareholders and is incorporated herein by reference. We will file such definitive proxy statement with the SEC pursuant to Regulation 14A within 120 days after our fiscal year ended December 31, 2017.
Item 13. Certain Relationships and Related Transactions, and Director Independence.
The information required by this item will be included in our definitive proxy statement for the 2018 Annual Meeting of Shareholders and is incorporated herein by reference. We will file such definitive proxy statement with the SEC pursuant to Regulation 14A within 120 days after our fiscal year ended December 31, 2017.
Item 14. Principal Accountant Fees and Services
The information required by this item will be included in our definitive proxy statement for the 2018 Annual Meeting of Shareholders and is incorporated herein by reference. We will file such definitive proxy statement with the SEC pursuant to Regulation 14A within 120 days after our fiscal year ended December 31, 2017.
Item 15. Exhibits, Financial Statement Schedules.
The following documents are filed as part of this Annual Report on Form 10-K:
|
(a)(1) and (a)(2) |
The financial statements set forth in the Index to Consolidated Financial Statements and the Consolidated Financial Statement Schedule are filed as part of this Annual Report on Form 10-K included in Item 8. |
|
(a)(3) and (b) |
The exhibits listed in the accompanying Exhibit Index are filed as part of this Annual Report on Form 10-K and either filed herewith or incorporated by reference herein, as applicable. |
None.
107
|
Exhibit Number |
|
Description |
|
3.1 |
|
|
|
3.2 |
|
|
|
4.1 |
|
|
|
4.2 |
|
|
|
10.1 |
|
|
|
10.2 |
|
|
|
10.3 |
|
|
|
10.4+ |
|
|
|
10.5 |
|
|
|
10.6 |
|
|
|
10.7+ |
|
|
|
10.8+ |
|
|
|
10.9+ |
|
108
|
|
||
|
10.11 |
|
|
|
10.12+ |
|
|
|
10.12.1+ |
|
|
|
10.13+ |
|
|
|
10.13.1+ |
|
|
|
10.14+ |
|
|
|
10.15+ |
|
|
|
10.16+ |
|
|
|
10.17+ |
|
|
|
10.18+ |
|
|
|
21.1* |
|
|
|
23.1* |
|
|
|
31.1* |
|
|
|
31.2* |
|
|
|
32.1* |
|
|
|
101.INS |
|
XBRL Instance Document |
|
101.SCH |
|
XBRL Taxonomy Extension Schema Document |
|
101.CAL |
|
XBRL Taxonomy Extension Calculation Linkbase Document |
|
101.DEF |
|
XBRL Taxonomy Extension Definition Linkbase Document |
|
101.LAB |
|
XBRL Taxonomy Extension Label Linkbase Document |
109
|
* |
Filed herewith. |
|
+ |
Management compensatory plan or arrangement. |
110
Pursuant to the requirements of Section 13 or 15(d) of the Securities Exchange Act of 1934, as amended, the Registrant has duly caused this Annual Report on Form 10-K to be signed on its behalf by the undersigned, thereunto duly authorized.
|
|
|
EMERALD EXPOSITIONS EVENTS, INC. |
|
|
|
|
|
|
|
Date: February 22, 2018 |
|
By: |
/s/ Philip T. Evans |
|
|
|
|
Philip T. Evans |
|
|
|
|
Chief Financial Officer and Treasurer (Principal Financial Officer and Principal Accounting Officer) |
POWER OF ATTORNEY
KNOW ALL MEN BY THESE PRESENTS, that each of the undersigned directors and officers of Emerald Expositions Events, Inc. constitutes and appoints each of Philip Evans and David Gosling, or either of them, each acting alone, his true and lawful attorney-in-fact and agent, with full powers of substitution and resubstitution, for him and in his name, place and stead, in any and all capacities, to sign any or all amendments to this Annual Report on Form 10-K and to file the same, with exhibits thereto and other documents in connection therewith, with the Securities and Exchange Commission, granting unto said attorneys-in-fact and agents, and each of them, acting alone, full power and authority to do and perform each and every act and thing requisite and necessary to be done in and about the premises, as fully to all intents and purposes as he might or could do in person, and hereby ratifying and confirming all that either of the said attorneys-in-fact and agents, or his substitute or substitutes, may lawfully do or cause to be done by virtue hereof.
Pursuant to the requirements of the Securities Exchange Act of 1934, as amended, this Annual Report on Form 10-K has been signed below by the following persons on behalf of the Registrant in the capacities and on the dates indicated.
|
Name |
|
Title |
|
Date |
|
|
|
|
|
|
|
/s/ David Loechner |
|
Chief Executive Officer, President and Director (Principal Executive Officer) |
|
February 22, 2018 |
|
David Loechner |
|
|
|
|
|
|
|
|
|
|
|
/s/ Philip T. Evans |
|
Chief Financial Officer and Treasurer (Principal Financial Officer and Principal Accounting Officer) |
|
February 22, 2018 |
|
Philip T. Evans |
|
|
|
|
|
|
|
|
|
|
|
/s/ Konstantin Gilis |
|
Chairman of the Board and Director |
|
February 22, 2018 |
|
Konstantin Gilis |
|
|
|
|
|
|
|
|
|
|
|
/s/ Michael Alicea |
|
Director |
|
February 22, 2018 |
|
Michael Alicea |
|
|
|
|
|
|
|
|
|
|
|
/s/ Todd Hyatt |
|
Director |
|
February 22, 2018 |
|
Todd Hyatt |
|
|
|
|
|
|
|
|
|
|
|
/s/ Amir Motamedi |
|
Director |
|
February 22, 2018 |
|
Amir Motamedi |
|
|
|
|
|
|
|
|
|
|
111
|
|
Director |
|
February 22, 2018 |
|
|
Jeffrey Naylor |
|
|
|
|
|
|
|
|
|
|
|
/s/ Emmanuelle Skala |
|
Director |
|
February 22, 2018 |
|
Emmanuelle Skala |
|
|
|
|
|
|
|
|
|
|
112