Attached files
| file | filename |
|---|---|
| EX-99.1 - EX-99.1 - Trinseo S.A. | ex-99d1.htm |
| 8-K - 8-K - Trinseo S.A. | tse-20200206x8kddc7436.htm |
Exhibit 99.2
| 1 ™ Trademark of Trinseo S.A. or its affiliates ™ Trademark of Trinseo S.A. or its affiliates February 6, 2020 Fourth Quarter 2019 Financial Results |
| 2 Disclosure Rules Cautionary Note on Forward-Looking Statements. This presentation contains forward-looking statements including, without limitation, statements concerning plans, objectives, goals, projections, strategies, future events or performance, and underlying assumptions and other statements, which are not statements of historical facts or guarantees or assurances of future performance. Forward-looking statements may be identified by the use of words like “expect,” “anticipate,” “intend,” “forecast,” “outlook,” “will,” “may,” “might,” “see,” “tend,” “assume,” “potential,” “likely,” “target,” “plan,” “contemplate,” “seek,” “attempt,” “should,” “could,” “would” or expressions of similar meaning. Forward-looking statements reflect management’s evaluation of information currently available and are based on our current expectations and assumptions regarding our business, the economy and other future conditions. Because forward-looking statements relate to the future, they are subject to inherent uncertainties, risks and changes in circumstances that are difficult to predict. Factors that might cause such a difference include, but are not limited to, those discussed in our Annual Report on Form 10-K, under Part I, Item 1A —“Risk Factors” and elsewhere in our other reports filed with the U.S. Securities and Exchange Commission. As a result of these or other factors, our actual results may differ materially from those contemplated by the forward-looking statements. Therefore, we caution you against relying on any of these forward-looking statements. The forward-looking statements included in this presentation are made only as of the date hereof. We undertake no obligation to publicly update or revise any forward-looking statement as a result of new information, future events or otherwise, except as otherwise required by law. This presentation contains financial measures that are not in accordance with generally accepted accounting principles in the US (“GAAP”) including EBITDA, Adjusted EBITDA, Adjusted Net Income, Adjusted EPS and Free Cash Flow. We believe these measures provide relevant and meaningful information to investors and lenders about the ongoing operating results of the Company. Such measures when referenced herein should not be viewed as an alternative to GAAP measures of performance or liquidity, as applicable. We have provided a reconciliation of these measures to the most comparable GAAP metric alongside of the respective measure or otherwise in the Appendix section of this presentation. Introductions • Frank Bozich, President & CEO • David Stasse, Executive Vice President & CFO • Andy Myers, Director of Investor Relations Introductions & Disclosure Rules |

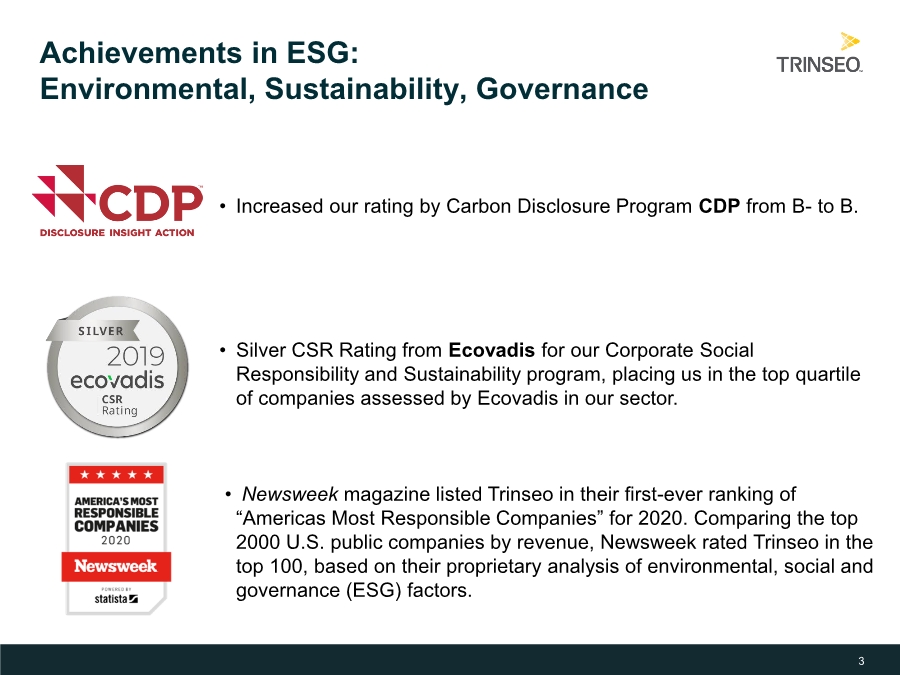
| 3 Achievements in ESG: Environmental, Sustainability, Governance • Increased our rating by Carbon Disclosure Program CDP from B- to B. • Silver CSR Rating from Ecovadis for our Corporate Social Responsibility and Sustainability program, placing us in the top quartile of companies assessed by Ecovadis in our sector. • Newsweek magazine listed Trinseo in their first-ever ranking of “Americas Most Responsible Companies” for 2020. Comparing the top 2000 U.S. public companies by revenue, Newsweek rated Trinseo in the top 100, based on their proprietary analysis of environmental, social and governance (ESG) factors. |
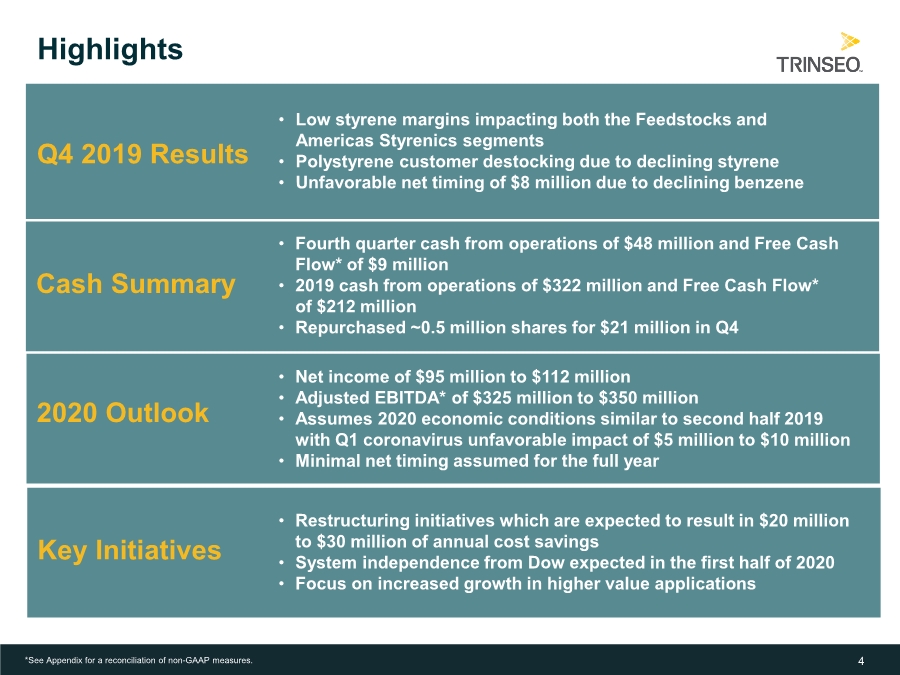
| 4 *See Appendix for a reconciliation of non-GAAP measures. Highlights • Low styrene margins impacting both the Feedstocks and Americas Styrenics segments • Polystyrene customer destocking due to declining styrene • Unfavorable net timing of $8 million due to declining benzene 2020 Outlook Q4 2019 Results • Fourth quarter cash from operations of $48 million and Free Cash Flow* of $9 million • 2019 cash from operations of $322 million and Free Cash Flow* of $212 million • Repurchased ~0.5 million shares for $21 million in Q4 Cash Summary • Net income of $95 million to $112 million • Adjusted EBITDA* of $325 million to $350 million • Assumes 2020 economic conditions similar to second half 2019 with Q1 coronavirus unfavorable impact of $5 million to $10 million • Minimal net timing assumed for the full year • Restructuring initiatives which are expected to result in $20 million to $30 million of annual cost savings • System independence from Dow expected in the first half of 2020 • Focus on increased growth in higher value applications Key Initiatives |
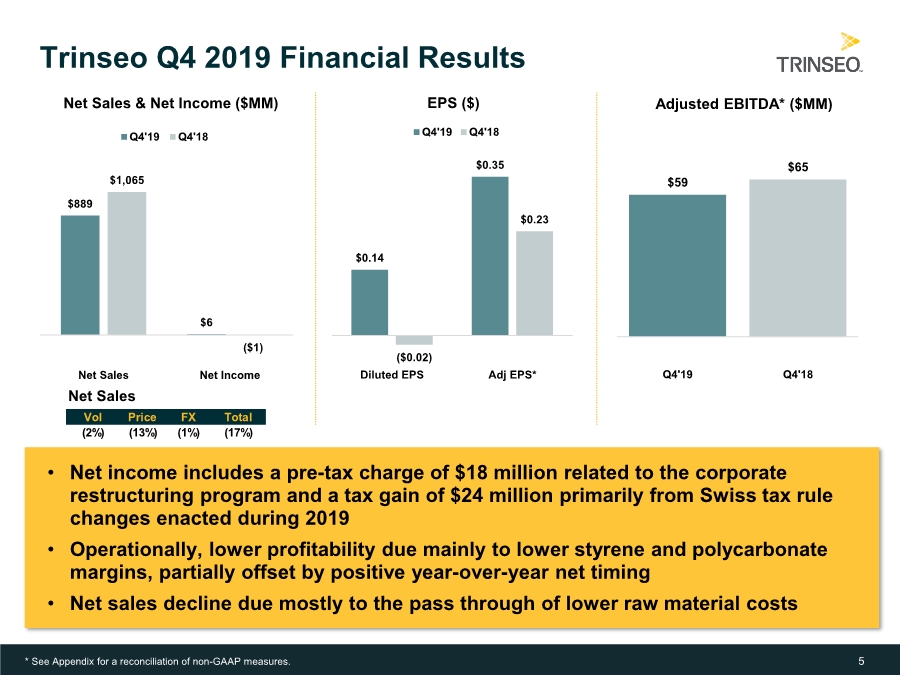
| 5 • Net income includes a pre-tax charge of $18 million related to the corporate restructuring program and a tax gain of $24 million primarily from Swiss tax rule changes enacted during 2019 • Operationally, lower profitability due mainly to lower styrene and polycarbonate margins, partially offset by positive year-over-year net timing • Net sales decline due mostly to the pass through of lower raw material costs Trinseo Q4 2019 Financial Results $0.14 $0.35 ($0.02) $0.23 Diluted EPS Adj EPS* EPS ($) Q4'19 Q4'18 $889 $6 $1,065 ($1) Net Sales Net Income Net Sales & Net Income ($MM) Q4'19 Q4'18 $59 $65 Q4'19 Q4'18 Adjusted EBITDA* ($MM) * See Appendix for a reconciliation of non-GAAP measures. Net Sales Vol Price FX Total (2%) (13%) (1%) (17%) |
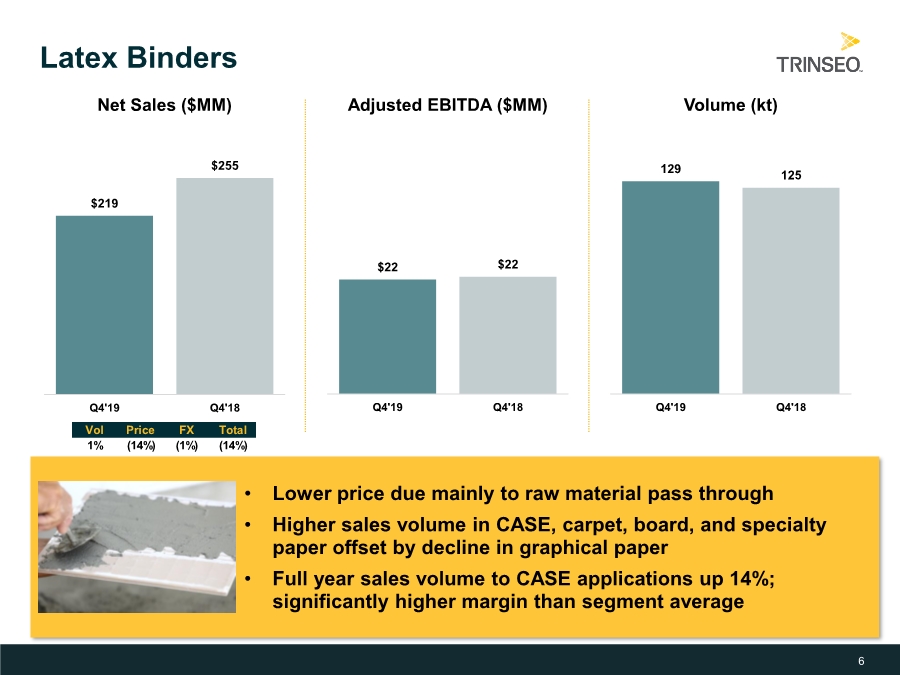
| 6 • Lower price due mainly to raw material pass through • Higher sales volume in CASE, carpet, board, and specialty paper offset by decline in graphical paper • Full year sales volume to CASE applications up 14%; significantly higher margin than segment average Latex Binders $219 $255 Q4'19 Q4'18 Net Sales ($MM) $22 $22 Q4'19 Q4'18 Adjusted EBITDA ($MM) 129 125 Q4'19 Q4'18 Volume (kt) Vol Price FX Total 1% (14%) (1%) (14%) |
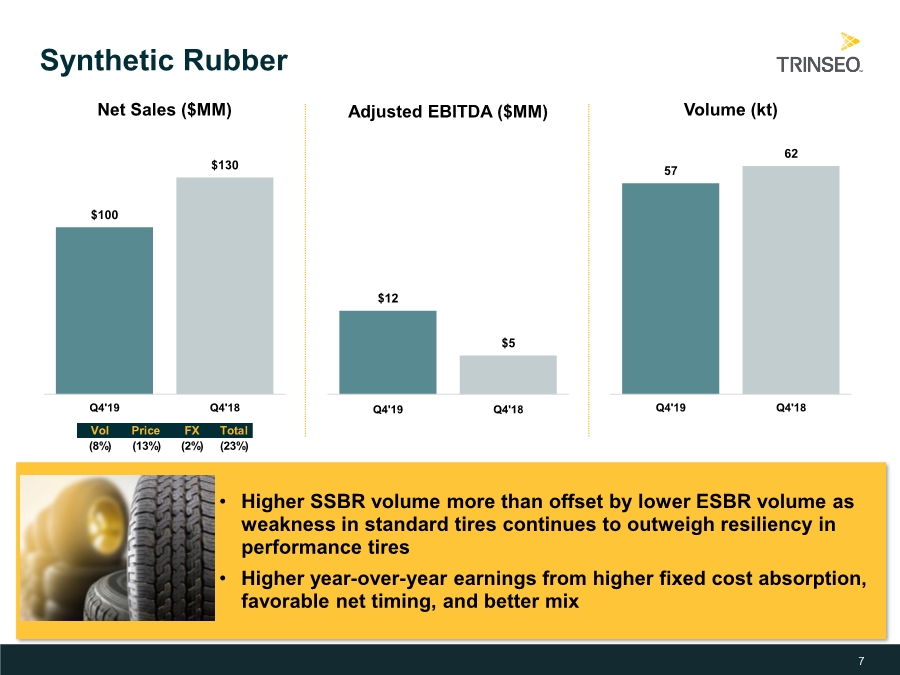
| 7 • Higher SSBR volume more than offset by lower ESBR volume as weakness in standard tires continues to outweigh resiliency in performance tires • Higher year-over-year earnings from higher fixed cost absorption, favorable net timing, and better mix Synthetic Rubber $100 $130 Q4'19 Q4'18 Net Sales ($MM) $12 $5 Q4'19 Q4'18 Adjusted EBITDA ($MM) 57 62 Q4'19 Q4'18 Volume (kt) Vol Price FX Total (8%) (13%) (2%) (23%) |
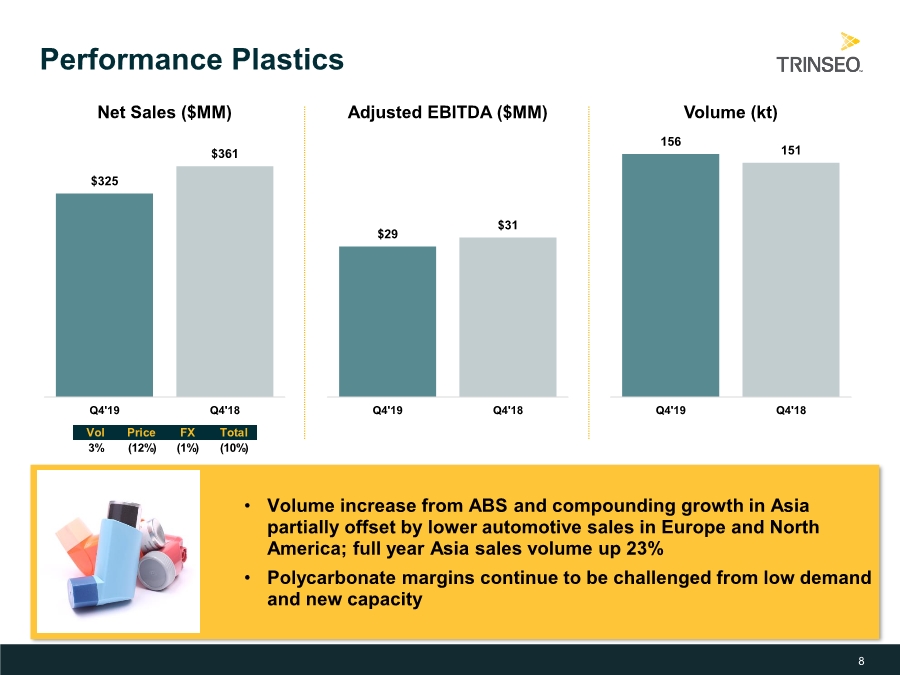
| 8 • Volume increase from ABS and compounding growth in Asia partially offset by lower automotive sales in Europe and North America; full year Asia sales volume up 23% • Polycarbonate margins continue to be challenged from low demand and new capacity Performance Plastics $325 $361 Q4'19 Q4'18 Net Sales ($MM) $29 $31 Q4'19 Q4'18 Adjusted EBITDA ($MM) 156 151 Q4'19 Q4'18 Volume (kt) Vol Price FX Total 3% (12%) (1%) (10%) |
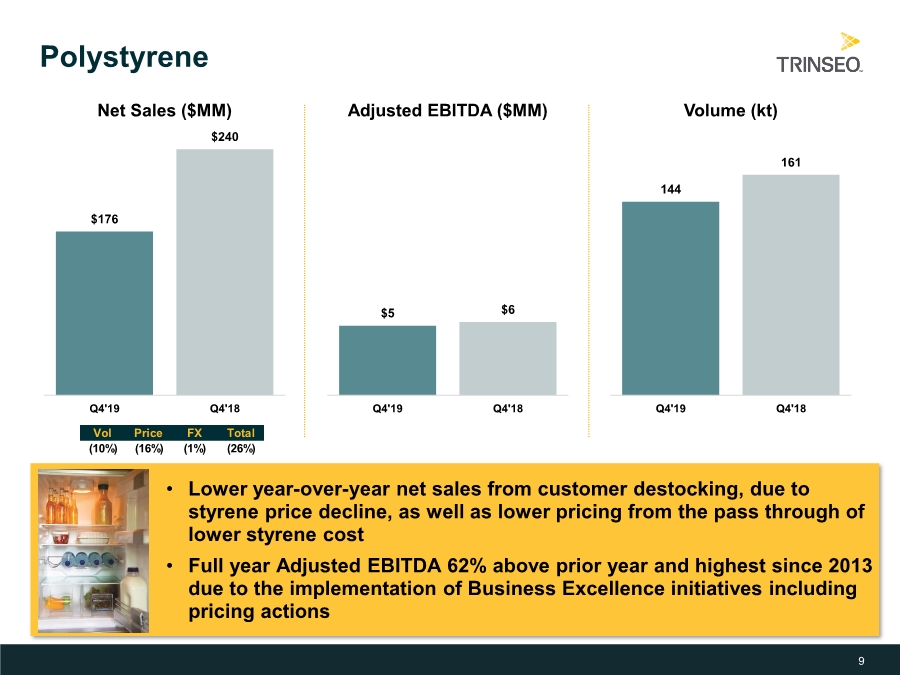
| 9 • Lower year-over-year net sales from customer destocking, due to styrene price decline, as well as lower pricing from the pass through of lower styrene cost • Full year Adjusted EBITDA 62% above prior year and highest since 2013 due to the implementation of Business Excellence initiatives including pricing actions Polystyrene $176 $240 Q4'19 Q4'18 Net Sales ($MM) $5 $6 Q4'19 Q4'18 Adjusted EBITDA ($MM) 144 161 Q4'19 Q4'18 Volume (kt) Vol Price FX Total (10%) (16%) (1%) (26%) |
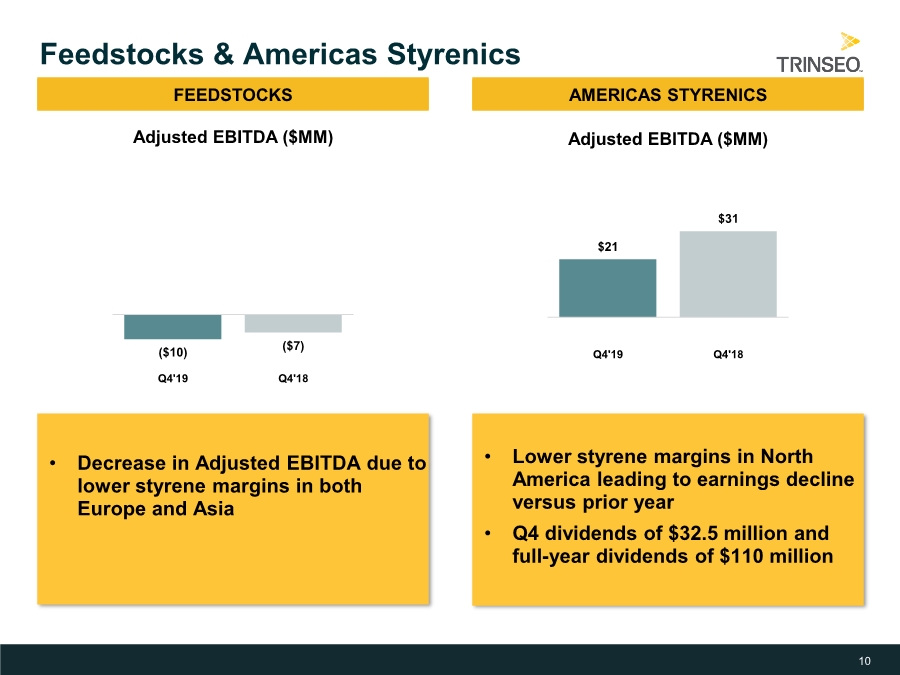
| 10 • Decrease in Adjusted EBITDA due to lower styrene margins in both Europe and Asia Feedstocks & Americas Styrenics ($10) ($7) Q4'19 Q4'18 Adjusted EBITDA ($MM) FEEDSTOCKS • Lower styrene margins in North America leading to earnings decline versus prior year • Q4 dividends of $32.5 million and full-year dividends of $110 million AMERICAS STYRENICS $21 $31 Q4'19 Q4'18 Adjusted EBITDA ($MM) |
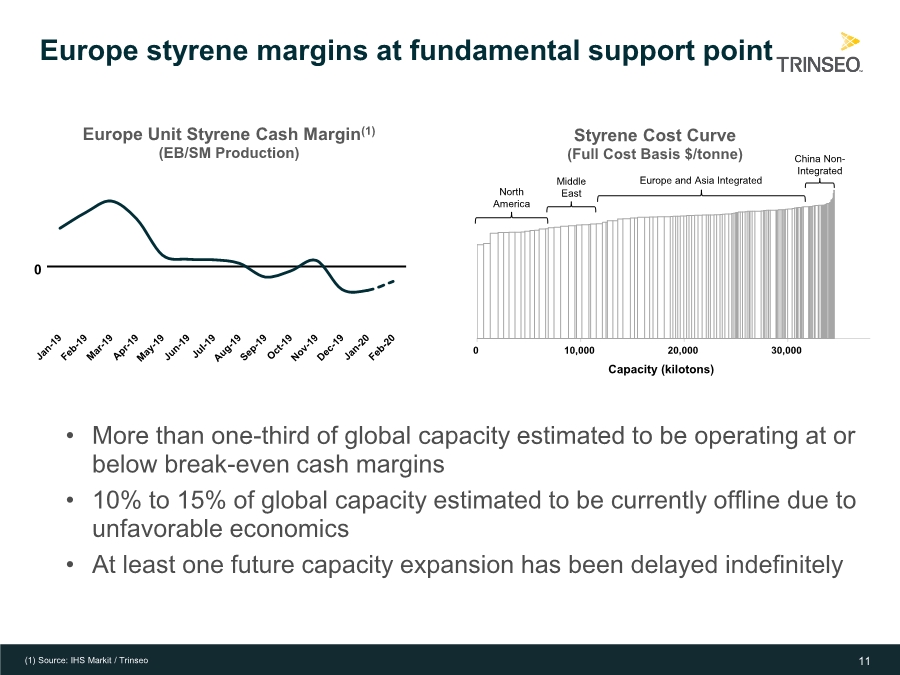
| 11 Europe styrene margins at fundamental support point • More than one-third of global capacity estimated to be operating at or below break-even cash margins • 10% to 15% of global capacity estimated to be currently offline due to unfavorable economics • At least one future capacity expansion has been delayed indefinitely 0 Europe Unit Styrene Cash Margin(1) (EB/SM Production) (1) Source: IHS Markit / Trinseo 0 10,000 20,000 30,000 Capacity (kilotons) Styrene Cost Curve (Full Cost Basis $/tonne) North America Middle East China Non- Integrated Europe and Asia Integrated |
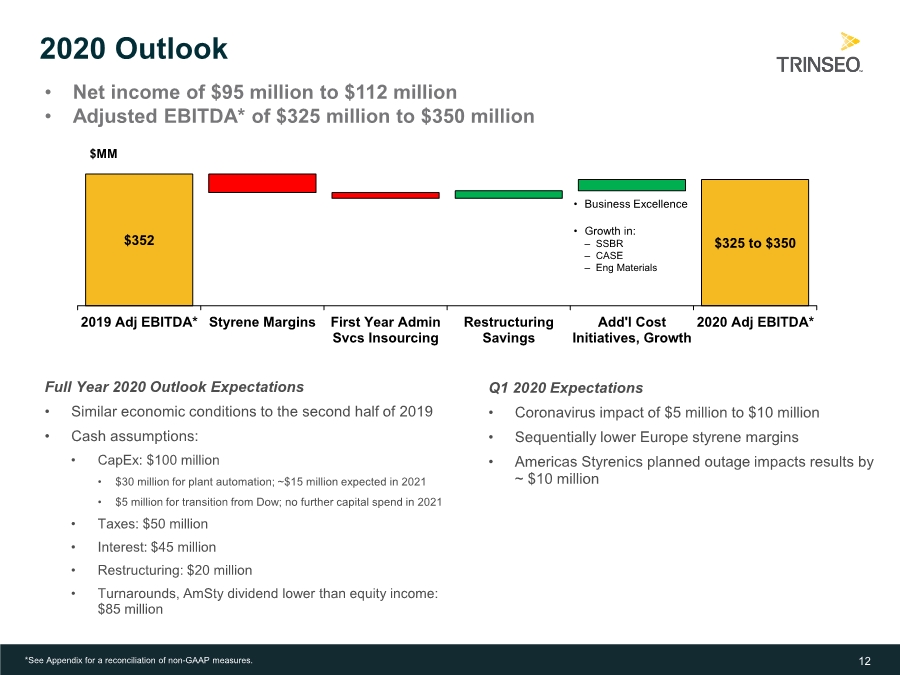
| 12 2020 Outlook Q1 2020 Expectations • Coronavirus impact of $5 million to $10 million • Sequentially lower Europe styrene margins • Americas Styrenics planned outage impacts results by ~ $10 million *See Appendix for a reconciliation of non-GAAP measures. • Business Excellence • Growth in: – SSBR – CASE – Eng Materials $MM Full Year 2020 Outlook Expectations • Similar economic conditions to the second half of 2019 • Cash assumptions: • CapEx: $100 million • $30 million for plant automation; ~$15 million expected in 2021 • $5 million for transition from Dow; no further capital spend in 2021 • Taxes: $50 million • Interest: $45 million • Restructuring: $20 million • Turnarounds, AmSty dividend lower than equity income: $85 million • Net income of $95 million to $112 million • Adjusted EBITDA* of $325 million to $350 million $325 to $350 $352 2019 Adj EBITDA* Styrene Margins First Year Admin Svcs Insourcing Restructuring Savings Add'l Cost Initiatives, Growth 2020 Adj EBITDA* |
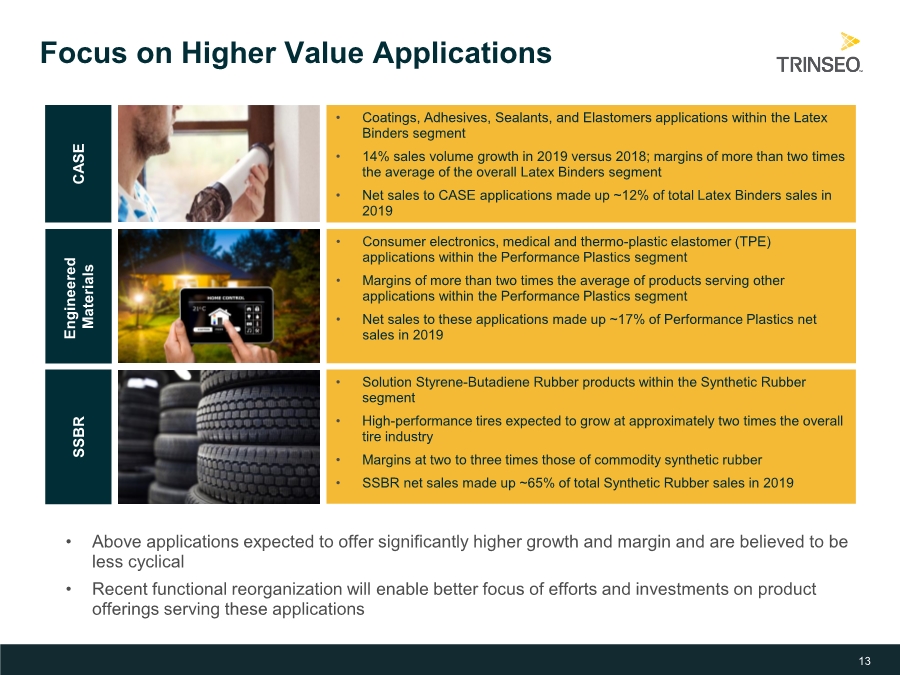
| 13 Focus on Higher Value Applications • Above applications expected to offer significantly higher growth and margin and are believed to be less cyclical • Recent functional reorganization will enable better focus of efforts and investments on product offerings serving these applications CASE SSBR Engineered Materials • Coatings, Adhesives, Sealants, and Elastomers applications within the Latex Binders segment • 14% sales volume growth in 2019 versus 2018; margins of more than two times the average of the overall Latex Binders segment • Net sales to CASE applications made up ~12% of total Latex Binders sales in 2019 • Solution Styrene-Butadiene Rubber products within the Synthetic Rubber segment • High-performance tires expected to grow at approximately two times the overall tire industry • Margins at two to three times those of commodity synthetic rubber • SSBR net sales made up ~65% of total Synthetic Rubber sales in 2019 • Consumer electronics, medical and thermo-plastic elastomer (TPE) applications within the Performance Plastics segment • Margins of more than two times the average of products serving other applications within the Performance Plastics segment • Net sales to these applications made up ~17% of Performance Plastics net sales in 2019 |
| 14 14 Appendix |

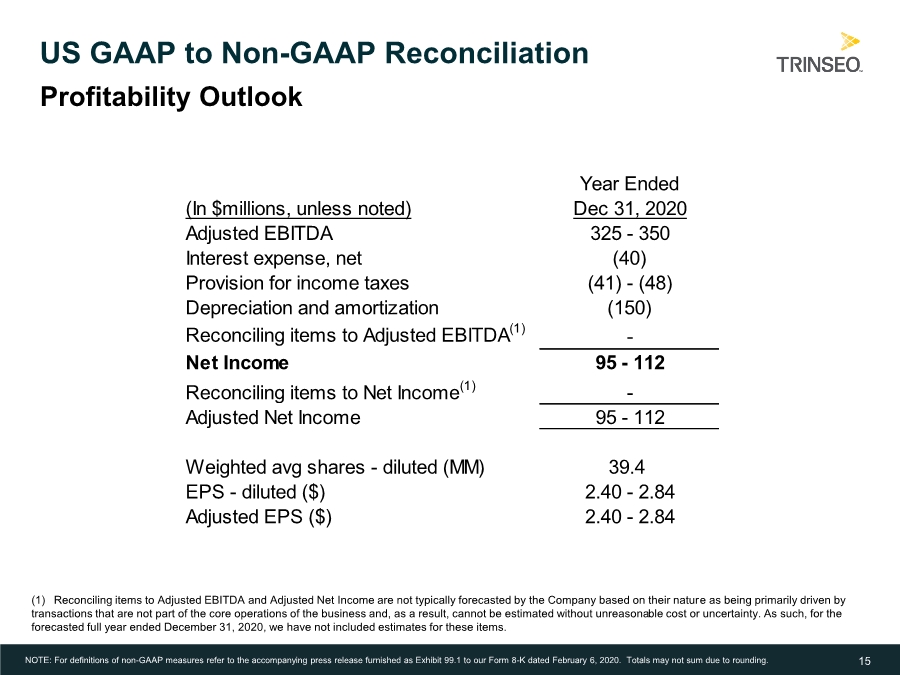
| 15 US GAAP to Non-GAAP Reconciliation NOTE: For definitions of non-GAAP measures refer to the accompanying press release furnished as Exhibit 99.1 to our Form 8-K dated February 6, 2020. Totals may not sum due to rounding. Profitability Outlook Year Ended (In $millions, unless noted) Dec 31, 2020 Adjusted EBITDA 325 - 350 Interest expense, net (40) Provision for income taxes (41) - (48) Depreciation and amortization (150) Reconciling items to Adjusted EBITDA(1) - Net Income 95 - 112 Reconciling items to Net Income(1) - Adjusted Net Income 95 - 112 Weighted avg shares - diluted (MM) 39.4 EPS - diluted ($) 2.40 - 2.84 Adjusted EPS ($) 2.40 - 2.84 (1) Reconciling items to Adjusted EBITDA and Adjusted Net Income are not typically forecasted by the Company based on their nature as being primarily driven by transactions that are not part of the core operations of the business and, as a result, cannot be estimated without unreasonable cost or uncertainty. As such, for the forecasted full year ended December 31, 2020, we have not included estimates for these items. |
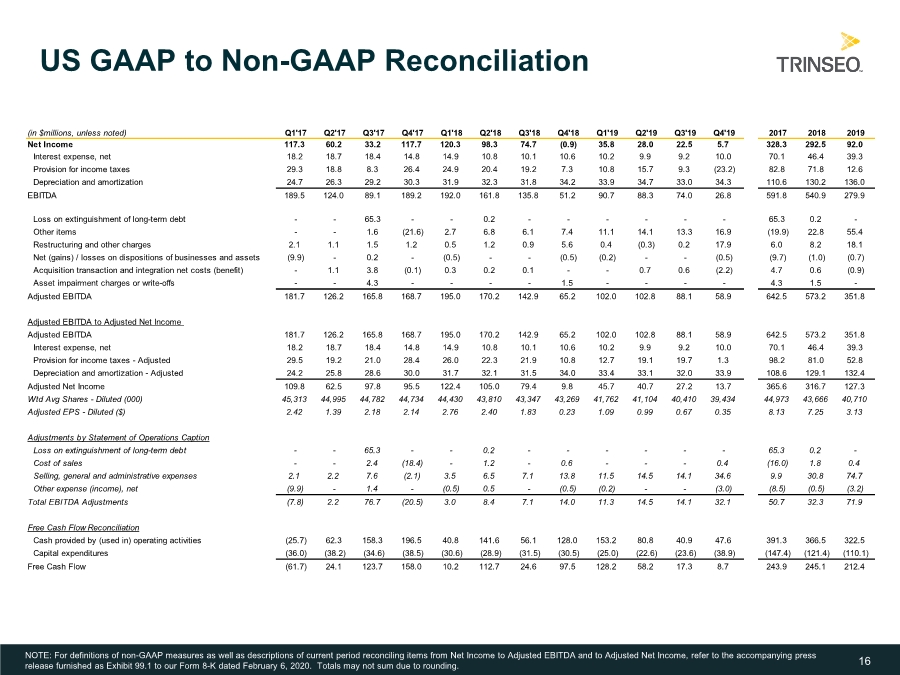
| 16 US GAAP to Non-GAAP Reconciliation NOTE: For definitions of non-GAAP measures as well as descriptions of current period reconciling items from Net Income to Adjusted EBITDA and to Adjusted Net Income, refer to the accompanying press release furnished as Exhibit 99.1 to our Form 8-K dated February 6, 2020. Totals may not sum due to rounding. (in $millions, unless noted) Q1'17 Q2'17 Q3'17 Q4'17 Q1'18 Q2'18 Q3'18 Q4'18 Q1'19 Q2'19 Q3'19 Q4'19 2017 2018 2019 Net Income 117.3 60.2 33.2 117.7 120.3 98.3 74.7 (0.9) 35.8 28.0 22.5 5.7 328.3 292.5 92.0 Interest expense, net 18.2 18.7 18.4 14.8 14.9 10.8 10.1 10.6 10.2 9.9 9.2 10.0 70.1 46.4 39.3 Provision for income taxes 29.3 18.8 8.3 26.4 24.9 20.4 19.2 7.3 10.8 15.7 9.3 (23.2) 82.8 71.8 12.6 Depreciation and amortization 24.7 26.3 29.2 30.3 31.9 32.3 31.8 34.2 33.9 34.7 33.0 34.3 110.6 130.2 136.0 EBITDA 189.5 124.0 89.1 189.2 192.0 161.8 135.8 51.2 90.7 88.3 74.0 26.8 591.8 540.9 279.9 Loss on extinguishment of long-term debt -- 65.3 -- 0.2 ------ 65.3 0.2 - Other items -- 1.6 (21.6) 2.7 6.8 6.1 7.4 11.1 14.1 13.3 16.9 (19.9) 22.8 55.4 Restructuring and other charges 2.1 1.1 1.5 1.2 0.5 1.2 0.9 5.6 0.4 (0.3) 0.2 17.9 6.0 8.2 18.1 Net (gains) / losses on dispositions of businesses and assets (9.9) - 0.2 -(0.5) --(0.5) (0.2) --(0.5) (9.7) (1.0) (0.7) Acquisition transaction and integration net costs (benefit) - 1.1 3.8 (0.1) 0.3 0.2 0.1 -- 0.7 0.6 (2.2) 4.7 0.6 (0.9) Asset impairment charges or write-offs -- 4.3 ---- 1.5 ---- 4.3 1.5 - Adjusted EBITDA 181.7 126.2 165.8 168.7 195.0 170.2 142.9 65.2 102.0 102.8 88.1 58.9 642.5 573.2 351.8 Adjusted EBITDA to Adjusted Net Income Adjusted EBITDA 181.7 126.2 165.8 168.7 195.0 170.2 142.9 65.2 102.0 102.8 88.1 58.9 642.5 573.2 351.8 Interest expense, net 18.2 18.7 18.4 14.8 14.9 10.8 10.1 10.6 10.2 9.9 9.2 10.0 70.1 46.4 39.3 Provision for income taxes - Adjusted 29.5 19.2 21.0 28.4 26.0 22.3 21.9 10.8 12.7 19.1 19.7 1.3 98.2 81.0 52.8 Depreciation and amortization - Adjusted 24.2 25.8 28.6 30.0 31.7 32.1 31.5 34.0 33.4 33.1 32.0 33.9 108.6 129.1 132.4 Adjusted Net Income 109.8 62.5 97.8 95.5 122.4 105.0 79.4 9.8 45.7 40.7 27.2 13.7 365.6 316.7 127.3 Wtd Avg Shares - Diluted (000) 45,313 44,995 44,782 44,734 44,430 43,810 43,347 43,269 41,762 41,104 40,410 39,434 44,973 43,666 40,710 Adjusted EPS - Diluted ($) 2.42 1.39 2.18 2.14 2.76 2.40 1.83 0.23 1.09 0.99 0.67 0.35 8.13 7.25 3.13 Adjustments by Statement of Operations Caption Loss on extinguishment of long-term debt -- 65.3 -- 0.2 ------ 65.3 0.2 - Cost of sales -- 2.4 (18.4) - 1.2 - 0.6 --- 0.4 (16.0) 1.8 0.4 Selling, general and administrative expenses 2.1 2.2 7.6 (2.1) 3.5 6.5 7.1 13.8 11.5 14.5 14.1 34.6 9.9 30.8 74.7 Other expense (income), net (9.9) - 1.4 -(0.5) 0.5 -(0.5) (0.2) --(3.0) (8.5) (0.5) (3.2) Total EBITDA Adjustments (7.8) 2.2 76.7 (20.5) 3.0 8.4 7.1 14.0 11.3 14.5 14.1 32.1 50.7 32.3 71.9 Free Cash Flow Reconciliation Cash provided by (used in) operating activities (25.7) 62.3 158.3 196.5 40.8 141.6 56.1 128.0 153.2 80.8 40.9 47.6 391.3 366.5 322.5 Capital expenditures (36.0) (38.2) (34.6) (38.5) (30.6) (28.9) (31.5) (30.5) (25.0) (22.6) (23.6) (38.9) (147.4) (121.4) (110.1) Free Cash Flow (61.7) 24.1 123.7 158.0 10.2 112.7 24.6 97.5 128.2 58.2 17.3 8.7 243.9 245.1 212.4 |
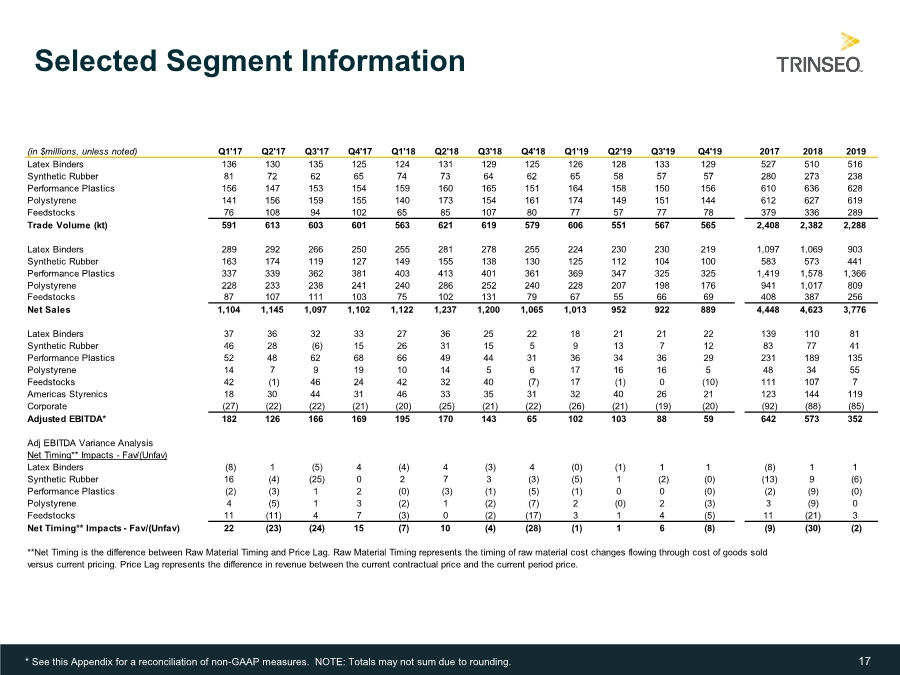
| 17 Selected Segment Information * See this Appendix for a reconciliation of non-GAAP measures. NOTE: Totals may not sum due to rounding. (in $millions, unless noted) Q1'17 Q2'17 Q3'17 Q4'17 Q1'18 Q2'18 Q3'18 Q4'18 Q1'19 Q2'19 Q3'19 Q4'19 2017 2018 2019 Latex Binders 136 130 135 125 124 131 129 125 126 128 133 129 527 510 516 Synthetic Rubber 81 72 62 65 74 73 64 62 65 58 57 57 280 273 238 Performance Plastics 156 147 153 154 159 160 165 151 164 158 150 156 610 636 628 Polystyrene 141 156 159 155 140 173 154 161 174 149 151 144 612 627 619 Feedstocks 76 108 94 102 65 85 107 80 77 57 77 78 379 336 289 Trade Volume (kt) 591 613 603 601 563 621 619 579 606 551 567 565 2,408 2,382 2,288 Latex Binders 289 292 266 250 255 281 278 255 224 230 230 219 1,097 1,069 903 Synthetic Rubber 163 174 119 127 149 155 138 130 125 112 104 100 583 573 441 Performance Plastics 337 339 362 381 403 413 401 361 369 347 325 325 1,419 1,578 1,366 Polystyrene 228 233 238 241 240 286 252 240 228 207 198 176 941 1,017 809 Feedstocks 87 107 111 103 75 102 131 79 67 55 66 69 408 387 256 Net Sales 1,104 1,145 1,097 1,102 1,122 1,237 1,200 1,065 1,013 952 922 889 4,448 4,623 3,776 Latex Binders 37 36 32 33 27 36 25 22 18 21 21 22 139 110 81 Synthetic Rubber 46 28 (6) 15 26 31 15 5 9 13 7 12 83 77 41 Performance Plastics 52 48 62 68 66 49 44 31 36 34 36 29 231 189 135 Polystyrene 14 7 9 19 10 14 5 6 17 16 16 5 48 34 55 Feedstocks 42 (1) 46 24 42 32 40 (7) 17 (1) 0 (10) 111 107 7 Americas Styrenics 18 30 44 31 46 33 35 31 32 40 26 21 123 144 119 Corporate (27) (22) (22) (21) (20) (25) (21) (22) (26) (21) (19) (20) (92) (88) (85) Adjusted EBITDA* 182 126 166 169 195 170 143 65 102 103 88 59 642 573 352 Adj EBITDA Variance Analysis Net Timing** Impacts - Fav/(Unfav) Latex Binders (8) 1 (5) 4 (4) 4 (3) 4 (0) (1) 1 1 (8) 1 1 Synthetic Rubber 16 (4) (25) 0 2 7 3 (3) (5) 1 (2) (0) (13) 9 (6) Performance Plastics (2) (3) 1 2 (0) (3) (1) (5) (1) 0 0 (0) (2) (9) (0) Polystyrene 4 (5) 1 3 (2) 1 (2) (7) 2 (0) 2 (3) 3 (9) 0 Feedstocks 11 (11) 4 7 (3) 0 (2) (17) 3 1 4 (5) 11 (21) 3 Net Timing** Impacts - Fav/(Unfav) 22 (23) (24) 15 (7) 10 (4) (28) (1) 1 6 (8) (9) (30) (2) **Net Timing is the difference between Raw Material Timing and Price Lag. Raw Material Timing represents the timing of raw material cost changes flowing through cost of goods sold versus current pricing. Price Lag represents the difference in revenue between the current contractual price and the current period price. |