Attached files
| file | filename |
|---|---|
| EX-32.1 - EX-32.1 - Trinseo S.A. | tse-20150930ex321abdc86.htm |
| EX-31.1 - EX-31.1 - Trinseo S.A. | tse-20150930ex3112e5838.htm |
| EX-32.2 - EX-32.2 - Trinseo S.A. | tse-20150930ex322a147c0.htm |
| EX-31.2 - EX-31.2 - Trinseo S.A. | tse-20150930ex312b10e76.htm |
UNITED STATES
SECURITIES AND EXCHANGE COMMISSION
Washington, D.C. 20549
FORM 10-Q
(Mark One)
☒QUARTERLY REPORT PURSUANT TO SECTION 13 OR 15(d) OF THE SECURITIES
EXCHANGE ACT OF 1934
For the quarterly period ended September 30, 2015
or
◻TRANSITION REPORT PURSUANT TO SECTION 13 OR 15(d) OF THE SECURITIES
EXCHANGE ACT OF 1934
For the transition period from to
Commission File Number: 001-36473
Trinseo S.A.
(Exact name of registrant as specified in its charter)
|
Luxembourg |
N/A |
|
(State or other jurisdiction of incorporation or organization) |
(I.R.S. Employer Identification Number) |
1000 Chesterbrook Boulevard
Suite 300
Berwyn, PA 19312
(Address of Principal Executive Offices)
(610) 240-3200
(Registrant’s telephone number)
Indicate by check mark whether the registrant (1) has filed all reports required to be filed by Section 13 or 15(d) of the Securities Exchange Act of 1934 during the preceding 12 months (or for such shorter period that the registrant was required to file such reports), and (2) has been subject to such filing requirements for the past 90 days. Yes ☒ No ◻
Indicate by check mark whether the registrant has submitted electronically and posted on its corporate Web site, if any, every Interactive Data File required to be submitted and posted pursuant to Rule 405 of Regulation S-T (§232.405 of this chapter) during the preceding 12 months (or for such shorter period that the registrant was required to submit and post such files). Yes ☒ No ◻
Indicate by check mark whether the Company is a large accelerated filer, an accelerated filer, a non-accelerated filer, or a smaller reporting company. See definitions of “large accelerated filer,” “accelerated filer,” and “smaller reporting company” in Rule 12b-2 of the Exchange Act. (Check one):
|
|
|
|
|
|
Large accelerated filer |
◻ |
Accelerated filer |
◻ |
|
Non-accelerated filer |
☒ (Do not check if a smaller reporting company) |
Smaller reporting company |
◻ |
Indicate by a check mark whether the registrant is a shell company (as defined in Rule 12b-2 of the Exchange Act). Yes ◻ No ☒
As of November 5, 2015, there were 48,777,934 shares of the registrant’s ordinary shares outstanding.
2
Trinseo S.A.
Quarterly Report on Form 10-Q
For the quarterly period ended September 30, 2015
Unless otherwise indicated or required by context, as used in this Quarterly Report on Form 10-Q (“Quarterly Report”), the term “Trinseo” refers to Trinseo S.A. (NYSE: TSE), a public limited liability company (société anonyme) existing under the laws of Luxembourg, and not its subsidiaries. The terms “Company,” “we,” “us” and “our” refer to Trinseo and its consolidated subsidiaries, taken as a consolidated entity and as required by context, may also include our business as owned by our predecessor, The Dow Chemical Company, for any dates prior to June 17, 2010. The terms “Trinseo Materials Operating S.C.A.” and “Trinseo Materials Finance, Inc.” refer to Trinseo’s indirect subsidiaries, Trinseo Materials Operating S.C.A., a Luxembourg partnership limited by shares incorporated under the laws of Luxembourg, and Trinseo Materials Finance, Inc., a Delaware corporation, and not their subsidiaries. All financial data provided in this Quarterly Report is the financial data of the Company, unless otherwise indicated.
Prior to our formation, our business was wholly owned by The Dow Chemical Company. We refer to our predecessor business as “the Styron business.” On June 17, 2010, investment funds advised or managed by affiliates of Bain Capital Partners, LLC (“Bain Capital”) acquired the Styron business and Dow Europe Holding B.V., which we refer to as “Dow Europe,” or, together with other affiliates of The Dow Chemical Company, “Dow,” retained an ownership interest in the Styron business through an indirect ownership interest in us. We refer to our acquisition by Bain Capital as the “Acquisition.”
In the first quarter of 2015, we completed a rebranding process to change our operating name and legal entities from “Styron” to “Trinseo,” a name that we believe reflects our breadth as a company with broad global reach and a diverse portfolio of materials and technologies.
Cautionary Note on Forward-Looking Statements
This Quarterly Report contains forward-looking statements including, without limitation, statements concerning plans, objectives, goals, projections, strategies, future events or performance, and underlying assumptions and other statements, which are not statements of historical facts. Forward-looking statements may be identified by the use of words like “expect,” “anticipate,” “intend,” “forecast,” “outlook,” “will,” “may,” “might,” “potential,” “likely,” “target,” “plan,” “contemplate,” “seek,” “attempt,” “should,” “could,” “would” or expressions of similar meaning. Forward-looking statements reflect management’s evaluation of information currently available and are based on our current expectations and assumptions regarding our business, the economy and other future conditions. Because forward-looking statements relate to the future, they are subject to inherent uncertainties, risks and changes in circumstances that are difficult to predict. Specific factors that may impact performance or other predictions of future actions have, in many but not all cases, been identified in connection with specific forward-looking statements. Factors that might cause such a difference include, but are not limited to, those discussed in our Annual Report on Form 10-K for the year ended December 31, 2014 (“Annual Report”) filed with the Securities and Exchange Commission (“SEC”) on March 10, 2015 under Part I, Item IA— “Risk Factors”, and elsewhere within this Quarterly Report.
As a result of these or other factors, our actual results may differ materially from those contemplated by the forward-looking statements. They are neither statements of historical fact nor guarantees or assurances of future performance. Therefore, we caution you against relying on these forward-looking statements. The forward-looking statements included in this Quarterly Report are made only as of the date hereof. We undertake no obligation to publicly update or revise any forward-looking statement as a result of new information, future events or otherwise, except as otherwise required by law.
Where You Can Find Additional Information
Our website is www.trinseo.com. Information contained on our website is not part of this Quarterly Report. Information that we file with or furnish to the SEC, including our Annual Reports on Form 10-K, Quarterly Reports on Form 10-Q, Current Reports on Form 8-K and any amendments to or exhibits included in these reports are available for download, free of charge, on our website soon after such reports are filed with or furnished to the SEC. These reports and other information, including exhibits filed or furnished therewith, are also available at the SEC’s website at www.sec.gov. You may also obtain and copy any document we file with or furnish to the SEC at the SEC’s public reference room at 100 F Street, NE, Washington, D.C. 20549. You may obtain information on the operation of the SEC’s public reference facilities by calling the SEC at 1-800-SEC-0330. You may request copies of these documents, upon payment of a duplicating fee, by writing to the SEC at its principal office at 100 F Street, NE, Washington, D.C. 20549.
3
TRINSEO S.A.
Condensed Consolidated Balance Sheets
(In thousands, except per share data)
(Unaudited)
|
|
|
September 30, |
|
December 31, |
|
||
|
|
|
2015 |
|
2014 |
|
||
|
Assets |
|
|
|
|
|
|
|
|
Current assets |
|
|
|
|
|
|
|
|
Cash and cash equivalents |
|
$ |
320,771 |
|
$ |
220,786 |
|
|
Accounts receivable, net of allowance for doubtful accounts (September 30, 2015 -- $2,339; December 31, 2014 -- $6,268) |
|
|
550,006 |
|
|
601,066 |
|
|
Inventories |
|
|
391,247 |
|
|
473,861 |
|
|
Deferred income tax assets |
|
|
10,198 |
|
|
11,786 |
|
|
Other current assets |
|
|
19,749 |
|
|
15,164 |
|
|
Total current assets |
|
|
1,291,971 |
|
|
1,322,663 |
|
|
Investments in unconsolidated affiliates |
|
|
191,194 |
|
|
167,658 |
|
|
Property, plant and equipment, net of accumulated depreciation (September 30, 2015 -- $358,415; December 31, 2014 -- $324,383) |
|
|
522,213 |
|
|
556,697 |
|
|
Other assets |
|
|
|
|
|
|
|
|
Goodwill |
|
|
31,917 |
|
|
34,574 |
|
|
Other intangible assets, net |
|
|
155,194 |
|
|
165,358 |
|
|
Deferred income tax assets—noncurrent |
|
|
62,269 |
|
|
46,812 |
|
|
Deferred charges and other assets |
|
|
57,381 |
|
|
62,354 |
|
|
Total other assets |
|
|
306,761 |
|
|
309,098 |
|
|
Total assets |
|
$ |
2,312,139 |
|
$ |
2,356,116 |
|
|
Liabilities and shareholders’ equity |
|
|
|
|
|
|
|
|
Current liabilities |
|
|
|
|
|
|
|
|
Short-term borrowings and current portion of long-term debt |
|
$ |
5,627 |
|
$ |
7,559 |
|
|
Accounts payable |
|
|
337,759 |
|
|
434,692 |
|
|
Income taxes payable |
|
|
36,007 |
|
|
9,413 |
|
|
Deferred income tax liabilities |
|
|
834 |
|
|
1,413 |
|
|
Accrued expenses and other current liabilities |
|
|
109,164 |
|
|
120,928 |
|
|
Total current liabilities |
|
|
489,391 |
|
|
574,005 |
|
|
Noncurrent liabilities |
|
|
|
|
|
|
|
|
Long-term debt |
|
|
1,215,334 |
|
|
1,194,648 |
|
|
Deferred income tax liabilities—noncurrent |
|
|
29,571 |
|
|
27,311 |
|
|
Other noncurrent obligations |
|
|
232,592 |
|
|
239,287 |
|
|
Total noncurrent liabilities |
|
|
1,477,497 |
|
|
1,461,246 |
|
|
Commitments and contingencies (Note 10) |
|
|
|
|
|
|
|
|
Shareholders’ equity |
|
|
|
|
|
|
|
|
Common stock, $0.01 nominal value, 50,000,000 shares authorized at September 30, 2015 and December 31, 2014, 48,778 and 48,770 shares issued and outstanding at September 30, 2015 and December 31, 2014, respectively |
|
|
488 |
|
|
488 |
|
|
Additional paid-in-capital |
|
|
556,964 |
|
|
547,530 |
|
|
Accumulated deficit |
|
|
(61,421) |
|
|
(151,936) |
|
|
Accumulated other comprehensive loss |
|
|
(150,780) |
|
|
(75,217) |
|
|
Total shareholders’ equity |
|
|
345,251 |
|
|
320,865 |
|
|
Total liabilities and shareholders’ equity |
|
$ |
2,312,139 |
|
$ |
2,356,116 |
|
The accompanying notes are an integral part of these condensed consolidated financial statements.
4
TRINSEO S.A.
Condensed Consolidated Statements of Operations
(In thousands, except per share data)
(Unaudited)
|
|
|
Three Months Ended |
|
Nine Months Ended |
|
||||||||
|
|
|
September 30, |
|
September 30, |
|
||||||||
|
|
|
2015 |
|
2014 |
|
2015 |
|
2014 |
|
||||
|
Net sales |
|
$ |
1,027,952 |
|
$ |
1,305,493 |
|
$ |
3,074,890 |
|
$ |
4,005,560 |
|
|
Cost of sales |
916,390 | 1,237,257 | 2,718,112 | 3,746,285 | |||||||||
|
Gross profit |
|
|
111,562 |
|
|
68,236 |
|
|
356,778 |
|
|
259,275 |
|
|
Selling, general and administrative expenses |
|
|
51,093 |
|
|
48,113 |
|
|
153,607 |
|
|
172,351 |
|
|
Equity in earnings of unconsolidated affiliates |
|
|
33,489 |
|
|
9,267 |
|
|
111,037 |
|
|
29,595 |
|
|
Operating income |
|
|
93,958 |
|
|
29,390 |
|
|
314,208 |
|
|
116,519 |
|
|
Interest expense, net |
|
|
19,489 |
|
|
30,098 |
|
|
73,945 |
|
|
95,518 |
|
|
Loss on extinguishment of long-term debt |
|
|
— |
|
|
7,390 |
|
|
95,150 |
|
|
7,390 |
|
|
Other expense (income), net |
|
|
1,214 |
|
|
(1,638) |
|
|
7,998 |
|
|
29,406 |
|
|
Income (loss) before income taxes |
|
|
73,255 |
|
|
(6,460) |
|
|
137,115 |
|
|
(15,795) |
|
|
Provision for income taxes |
|
|
21,200 |
|
|
3,650 |
|
|
46,600 |
|
|
21,850 |
|
|
Net income (loss) |
|
$ |
52,055 |
|
$ |
(10,110) |
|
$ |
90,515 |
|
$ |
(37,645) |
|
|
Weighted average shares- basic |
|
|
48,778 |
|
|
48,770 |
|
|
48,773 |
|
|
41,693 |
|
|
Net income (loss) per share- basic |
|
$ |
1.07 |
|
$ |
(0.21) |
|
$ |
1.86 |
|
$ |
(0.90) |
|
|
Weighted average shares- diluted |
|
|
48,989 |
|
|
48,770 |
|
|
48,936 |
|
|
41,693 |
|
|
Net income (loss) per share- diluted |
|
$ |
1.06 |
|
$ |
(0.21) |
|
$ |
1.85 |
|
$ |
(0.90) |
|
The accompanying notes are an integral part of these condensed consolidated financial statements.
5
TRINSEO S.A.
Condensed Consolidated Statements of Comprehensive Income (Loss)
(In thousands, unless otherwise stated)
(Unaudited)
|
|
|
|
|
|
|
|
|
|
|
|
|
|
|
|
|
|
Three Months Ended |
|
Nine Months Ended |
|
||||||||
|
|
|
September 30, |
|
September 30, |
|
||||||||
|
|
|
2015 |
|
2014 |
|
2015 |
|
2014 |
|
||||
|
Net income (loss) |
|
$ |
52,055 |
|
$ |
(10,110) |
|
$ |
90,515 |
|
$ |
(37,645) |
|
|
Other comprehensive income (loss), net of tax (tax amounts shown in millions below for the three and nine months ended September 30, 2015 and 2014, respectively): |
|
|
|
|
|
|
|
|
|
|
|
|
|
|
Cumulative translation adjustments |
|
|
1,234 |
|
|
(84,868) |
|
|
(77,680) |
|
|
(95,220) |
|
|
Net gain (loss) on foreign exchange cash flow hedges |
|
|
97 |
|
|
— |
|
|
(308) |
|
|
— |
|
|
Pension and other postretirement benefit plans (net of tax of: 2015—$0.3 and $1.0; 2014—$0.2 and $0.5) |
|
|
797 |
|
|
286 |
|
|
2,425 |
|
|
866 |
|
|
Total other comprehensive income (loss), net of tax |
|
|
2,128 |
|
|
(84,582) |
|
|
(75,563) |
|
|
(94,354) |
|
|
Comprehensive income (loss) |
|
$ |
54,183 |
|
$ |
(94,692) |
|
$ |
14,952 |
|
$ |
(131,999) |
|
The accompanying notes are an integral part of these condensed consolidated financial statements.
6
TRINSEO S.A.
Condensed Consolidated Statements of Shareholders’ Equity
(In thousands)
(Unaudited)
|
|
|
|
|
|
|
|
|
|
|
Accumulated |
|
|
|
|
|
|
|
|
|
|
|
|
|
|
|
|
Additional |
|
Other |
|
|
|
|
|
|
|
||
|
|
|
Common Stock |
|
Paid-In |
|
Comprehensive |
|
Accumulated |
|
|
|
|
||||||
|
|
|
Shares |
|
Amount |
|
Capital |
|
Income (Loss) |
|
Deficit |
|
Total |
|
|||||
|
Balance at December 31, 2014 |
|
48,770 |
|
$ |
488 |
|
$ |
547,530 |
|
$ |
(75,217) |
|
$ |
(151,936) |
|
$ |
320,865 |
|
|
Net income |
|
— |
|
|
— |
|
|
— |
|
|
— |
|
|
90,515 |
|
|
90,515 |
|
|
Other comprehensive loss |
|
— |
|
|
— |
|
|
— |
|
|
(75,563) |
|
|
— |
|
|
(75,563) |
|
|
Stock-based compensation |
|
8 |
|
|
— |
|
|
9,434 |
|
|
— |
|
|
— |
|
|
9,434 |
|
|
Balance at September 30, 2015 |
|
48,778 |
|
$ |
488 |
|
$ |
556,964 |
|
$ |
(150,780) |
|
$ |
(61,421) |
|
$ |
345,251 |
|
|
Balance at December 31, 2013 |
|
37,270 |
|
$ |
373 |
|
$ |
339,055 |
|
$ |
88,378 |
|
$ |
(84,604) |
|
$ |
343,202 |
|
|
Issuance of common stock |
|
11,500 |
|
|
115 |
|
|
197,974 |
|
|
— |
|
|
— |
|
|
198,089 |
|
|
Net loss |
|
— |
|
|
— |
|
|
— |
|
|
— |
|
|
(37,645) |
|
|
(37,645) |
|
|
Other comprehensive loss |
|
— |
|
|
— |
|
|
— |
|
|
(94,354) |
|
|
— |
|
|
(94,354) |
|
|
Stock-based compensation |
|
— |
|
|
— |
|
|
7,779 |
|
|
— |
|
|
— |
|
|
7,779 |
|
|
Balance at September 30, 2014 |
|
48,770 |
|
$ |
488 |
|
$ |
544,808 |
|
$ |
(5,976) |
|
$ |
(122,249) |
|
$ |
417,071 |
|
The accompanying notes are an integral part of these condensed consolidated financial statements.
7
TRINSEO S.A.
Condensed Consolidated Statements of Cash Flows
(In thousands)
(Unaudited)
|
|
|
Nine Months Ended |
|
||||
|
|
|
September 30, |
|
||||
|
|
|
2015 |
|
2014 |
|
||
|
Cash flows from operating activities |
|
|
|
|
|
|
|
|
Net income (loss) |
|
$ |
90,515 |
|
$ |
(37,645) |
|
|
Adjustments to reconcile net income (loss) to net cash provided by operating activities |
|
|
|
|
|
|
|
|
Depreciation and amortization |
|
|
67,287 |
|
|
78,798 |
|
|
Amortization of deferred financing costs and issuance discount |
|
|
6,075 |
|
|
7,495 |
|
|
Deferred income tax |
|
|
(13,815) |
|
|
4,716 |
|
|
Stock-based compensation |
|
|
9,434 |
|
|
7,779 |
|
|
Earnings of unconsolidated affiliates, net of dividends |
|
|
(23,540) |
|
|
(9,596) |
|
|
Unrealized net losses (gains) on foreign exchange forward contracts |
|
|
(4,435) |
|
|
13,324 |
|
|
Loss on extinguishment of debt |
|
|
95,150 |
|
|
7,390 |
|
|
Prepayment penalty on long-term debt |
|
|
(68,603) |
|
|
(3,975) |
|
|
Loss (gain) on sale of businesses and other assets |
|
|
— |
|
|
(116) |
|
|
Changes in assets and liabilities |
|
|
|
|
|
|
|
|
Accounts receivable |
|
|
11,726 |
|
|
(42,015) |
|
|
Inventories |
|
|
63,117 |
|
|
(1,360) |
|
|
Accounts payable and other current liabilities |
|
|
(47,861) |
|
|
1,535 |
|
|
Income taxes payable |
|
|
26,780 |
|
|
764 |
|
|
Other assets, net |
|
|
(7,119) |
|
|
(6,254) |
|
|
Other liabilities, net |
|
|
994 |
|
|
(19,179) |
|
|
Cash provided by operating activities |
|
|
205,705 |
|
|
1,661 |
|
|
Cash flows from investing activities |
|
|
|
|
|
|
|
|
Capital expenditures |
|
|
(79,088) |
|
|
(69,269) |
|
|
Proceeds from capital expenditures subsidy |
|
|
2,191 |
|
|
— |
|
|
Proceeds from the sale of businesses and other assets |
|
|
689 |
|
|
6,257 |
|
|
Payment for working capital adjustment from sale of business |
|
|
— |
|
|
(700) |
|
|
Distributions from unconsolidated affiliates |
|
|
— |
|
|
978 |
|
|
Increase in restricted cash |
|
|
(413) |
|
|
— |
|
|
Cash used in investing activities |
|
|
(76,621) |
|
|
(62,734) |
|
|
Cash flows from financing activities |
|
|
|
|
|
|
|
|
Proceeds from initial public offering, net of offering costs |
|
|
— |
|
|
198,087 |
|
|
Deferred financing fees |
|
|
(28,033) |
|
|
— |
|
|
Short term borrowings, net |
|
|
(17,703) |
|
|
(43,430) |
|
|
Repayments of Term Loans |
|
|
(1,250) |
|
|
— |
|
|
Net proceeds from issuance of Term Loan B |
|
|
498,750 |
|
|
— |
|
|
Net proceeds from issuance of 2022 Senior Notes |
|
|
716,625 |
|
|
— |
|
|
Repayments of 2019 Senior Notes |
|
|
(1,192,500) |
|
|
(132,500) |
|
|
Proceeds from Accounts Receivable Securitization Facility |
|
|
25,000 |
|
|
283,292 |
|
|
Repayments of Accounts Receivable Securitization Facility |
|
|
(25,000) |
|
|
(283,859) |
|
|
Cash provided by (used in) financing activities |
|
|
(24,111) |
|
|
21,590 |
|
|
Effect of exchange rates on cash |
|
|
(4,988) |
|
|
(4,893) |
|
|
Net change in cash and cash equivalents |
|
|
99,985 |
|
|
(44,376) |
|
|
Cash and cash equivalents—beginning of period |
|
|
220,786 |
|
|
196,503 |
|
|
Cash and cash equivalents—end of period |
|
$ |
320,771 |
|
$ |
152,127 |
|
The accompanying notes are an integral part of these condensed consolidated financial statements.
8
TRINSEO S.A.
Notes to Condensed Consolidated Financial Statements
(Dollars in thousands, unless otherwise stated)
(Unaudited)
NOTE 1—BASIS OF PRESENTATION
The unaudited interim condensed consolidated financial statements of Trinseo S.A. and its subsidiaries (the “Company”) as of and for the periods ended September 30, 2015 and 2014 were prepared in accordance with accounting principles generally accepted in the United States of America (“GAAP”) and reflect all adjustments, consisting only of normal recurring adjustments, which, in the opinion of management, are considered necessary for the fair statement of the results for the periods presented. Because they cover interim periods, the statements and related notes to the financial statements do not include all disclosures normally provided in annual financial statements and, therefore, these statements should be read in conjunction with the 2014 audited consolidated financial statements included within the Company’s Annual Report on Form 10-K (“Annual Report”) filed with the Securities and Exchange Commission (“SEC”) on March 10, 2015.
The December 31, 2014 condensed consolidated balance sheet data presented herein was derived from the Company’s December 31, 2014 audited consolidated financial statements, but does not include all disclosures required by GAAP for annual periods.
Reverse Stock Split and Initial Public Offering
On May 30, 2014, the Company amended its Articles of Association to effect a 1-for-436.69219 reverse stock split of its issued and outstanding common stock (“reverse split”) and to increase its authorized shares to 50.0 billion. On June 17, 2014, the Company completed an initial public offering (the “IPO”) of 11,500,000 ordinary shares at a price of $19.00 per share, which included 1,500,000 of shares sold pursuant to the underwriters’ exercise of their over-allotment option. The Company received cash proceeds of $203.2 million from this transaction, net of underwriting discounts.
Company Realignment
Until January 1, 2015, the chief executive officer, who is the Company’s chief operating decision maker, managed the Company’s operations under two divisions, Emulsion Polymers and Plastics, which included the following four reporting segments: Latex, Synthetic Rubber, Styrenics, and Engineered Polymers. Effective January 1, 2015, the Company was reorganized under two new divisions called Performance Materials and Basic Plastics & Feedstocks. The Performance Materials division now includes the following reporting segments: Synthetic Rubber, Latex, and Performance Plastics. The Basic Plastics & Feedstocks division represents a separate segment for financial reporting purposes. These condensed consolidated financial statements and related notes thereto have been recast to reflect this change in reporting segments. See Note 14 for more information.
NOTE 2—RECENT ACCOUNTING GUIDANCE
In April 2014, the Financial Accounting Standards Board (“FASB”) issued amendments to guidance for reporting discontinued operations and disposals of components of an entity. The amended guidance requires that a disposal representing a strategic shift that has (or will have) a major effect on an entity’s financial results or a business activity classified as held for sale should be reported as discontinued operations. The amendments also expand the disclosure requirements for discontinued operations and add new disclosures for individually significant dispositions that do not qualify as discontinued operations. The Company adopted this guidance effective January 1, 2015, and the adoption did not have a significant impact on the Company’s financial position, results of operations, or disclosures.
In May 2014, the FASB and the International Accounting Standards Board (“IASB”) jointly issued new guidance which clarifies the principles for recognizing revenue and develops a common revenue standard for GAAP and International Financial Reporting Standards (“IFRS”). The core principle of the guidance is that an entity should recognize revenue to depict the transfer of promised goods or services to customers in an amount that reflects the consideration to which the entity expects to be entitled in exchange for those goods or services. This guidance is effective for public entities for annual and interim periods beginning after December 15, 2017. The Company is
9
currently assessing the impact of adopting this guidance on its financial position and results of operations.
In January 2015, the FASB issued guidance to simplify income statement classification by removing the concept of extraordinary items from GAAP. The Company adopted this guidance effective January 1, 2015, and the adoption did not have an impact on the Company’s financial position or results of operations.
In April 2015, the FASB issued guidance that requires debt issuance costs related to a recognized debt liability be presented in the balance sheet as a direct deduction from the carrying value of that debt liability, consistent with debt discounts. The recognition and measurement guidance for debt issuance costs are not affected. This new guidance, which is to be applied on a retrospective basis, is effective for public companies for annual and interim periods beginning after December 15, 2015, with early adoption permitted. The Company will adopt this guidance effective January 1, 2016, which we do not expect to have a significant impact on the Company’s financial position or results of operations.
In July 2015, the FASB issued guidance which simplifies the subsequent measurement of inventory by replacing the lower of cost or market test with a lower of cost or net realizable value (“NRV”) test. NRV is calculated as the estimated selling price less reasonably predictable costs of completion, disposal and transportation. This pronouncement is effective for fiscal years, and for interim periods within those fiscal years, beginning after December 15, 2016, and prospective adoption is required. The Company is currently assessing the impact of adopting this guidance on its financial position and results of operations.
NOTE 3—INVESTMENTS IN UNCONSOLIDATED AFFILIATES
The Company is supplemented by two strategic joint ventures, the results of which are included within the Basic Plastics & Feedstocks reporting segment: Americas Styrenics LLC (“Americas Styrenics”, a polystyrene joint venture with Chevron Phillips Chemical Company LP) and Sumika Styron Polycarbonate Limited (“Sumika Styron Polycarbonate”, a polycarbonate joint venture with Sumitomo Chemical Company, Limited). Investments held in the unconsolidated affiliates are accounted for by the equity method.
As of September 30, 2015 and December 31, 2014, respectively, the Company’s investment in Americas Styrenics was $154.1 million and $133.5 million, which was $97.2 million and $108.4 million less than the Company’s 50% share of the underlying net assets of Americas Styrenics. This amount represents the difference between the book value of assets contributed to the joint venture at the time of formation (May 1, 2008) and the Company’s 50% share of the total recorded value of the joint venture’s assets and certain adjustments to conform with the Company’s accounting policies. This difference is being amortized over a weighted average remaining useful life of the contributed assets of approximately 5.0 years as of September 30, 2015. The Company received dividends from Americas Styrenics of $42.5 million and $87.5 million during the three and nine months ended September 30, 2015, respectively, compared to dividends of $7.5 million and $20.0 million during the three and nine months ended September 30, 2014, respectively.
As of September 30, 2015 and December 31, 2014, respectively, the Company’s investment in Sumika Styron Polycarbonate was $37.1 million and $34.1 million, which was $20.2 million and $21.3 million greater than the Company’s 50% share of the underlying net assets of Sumika Styron Polycarbonate. This amount represents the fair value of certain identifiable assets which have not been recorded on the historical financial statements of Sumika Styron Polycarbonate. This difference is being amortized over the remaining useful life of the contributed assets of 10.0 years as of September 30, 2015. The Company received no dividends from Sumika Styron Polycarbonate during the three and nine months ended September 30, 2015, respectively, compared to dividends of zero and $1.0 million during the three and nine months ended September 30, 2014, respectively.
10
Both of the unconsolidated affiliates are privately held companies; therefore, quoted market prices for their stock are not available. The summarized financial information of the Company’s unconsolidated affiliates is shown below:
|
|
|
|
|
|
|
|
|
|
|
|
|
|
|
|
|
|
Three Months Ended |
|
Nine Months Ended |
|
||||||||
|
|
|
September 30, |
|
September 30, |
|
||||||||
|
|
|
2015 |
|
2014 |
|
2015 |
|
2014 |
|
||||
|
Sales |
|
$ |
447,712 |
|
$ |
577,519 |
|
$ |
1,388,085 |
|
$ |
1,682,571 |
|
|
Gross profit |
|
$ |
79,972 |
|
$ |
29,743 |
|
$ |
249,334 |
|
$ |
65,222 |
|
|
Net income |
|
$ |
61,018 |
|
$ |
13,667 |
|
$ |
201,498 |
|
$ |
24,161 |
|
NOTE 4—INVENTORIES
Inventories consisted of the following:
|
|
|
September 30, |
|
December 31, |
|
||
|
|
|
2015 |
|
2014 |
|
||
|
Finished goods |
|
$ |
186,568 |
|
$ |
235,949 |
|
|
Raw materials and semi-finished goods |
|
|
172,866 |
|
|
205,061 |
|
|
Supplies |
|
|
31,813 |
|
|
32,851 |
|
|
Total |
|
$ |
391,247 |
|
$ |
473,861 |
|
NOTE 5—GOODWILL AND INTANGIBLE ASSETS
Goodwill
The following table shows changes in the carrying amount of goodwill by segment from December 31, 2014 to September 30, 2015:
|
|
|
|
|
|
|
|
|
|
|
|
|
|
|
|
|
|
|
|
|
Performance Materials |
|
|
|
|
|
|
|
|||||||
|
|
|
|
|
|
Synthetic |
|
Performance |
|
Basic Plastics |
|
|
|
|
|||
|
|
|
Latex |
|
Rubber |
|
Plastics |
|
& Feedstocks |
|
Total |
|
|||||
|
Balance at December 31, 2014 |
|
$ |
13,815 |
|
$ |
9,461 |
|
$ |
3,243 |
|
$ |
8,055 |
|
$ |
34,574 |
|
|
Foreign currency impact |
|
|
(1,062) |
|
|
(727) |
|
|
(249) |
|
|
(619) |
|
|
(2,657) |
|
|
Balance at September 30, 2015 |
|
$ |
12,753 |
|
$ |
8,734 |
|
$ |
2,994 |
|
$ |
7,436 |
|
$ |
31,917 |
|
11
Other Intangible Assets
The following table provides information regarding the Company’s other intangible assets as of September 30, 2015 and December 31, 2014, respectively:
|
|
|
|
|
September 30, 2015 |
|
December 31, 2014 |
|
||||||||||||||
|
|
|
Estimated |
|
Gross |
|
|
|
|
|
|
|
Gross |
|
|
|
|
|
|
|
||
|
|
|
Useful Life |
|
Carrying |
|
Accumulated |
|
|
|
|
Carrying |
|
Accumulated |
|
|
|
|
||||
|
|
|
(Years) |
|
Amount |
|
Amortization |
|
Net |
|
Amount |
|
Amortization |
|
Net |
|
||||||
|
Developed technology |
|
15 |
|
$ |
177,481 |
|
$ |
(61,497) |
|
$ |
115,984 |
|
$ |
188,854 |
|
$ |
(56,782) |
|
$ |
132,072 |
|
|
Manufacturing Capacity Rights |
|
6 |
|
|
21,320 |
|
|
(5,186) |
|
|
16,134 |
|
|
23,095 |
|
|
(2,809) |
|
|
20,286 |
|
|
Software |
|
5 |
|
|
17,703 |
|
|
(8,603) |
|
|
9,100 |
|
|
13,177 |
|
|
(6,441) |
|
|
6,736 |
|
|
Software in development |
|
N/A |
|
|
13,976 |
|
|
— |
|
|
13,976 |
|
|
6,000 |
|
|
— |
|
|
6,000 |
|
|
Other |
|
N/A |
|
|
— |
|
|
— |
|
|
— |
|
|
264 |
|
|
— |
|
|
264 |
|
|
Total |
|
|
|
$ |
230,480 |
|
$ |
(75,286) |
|
$ |
155,194 |
|
$ |
231,390 |
|
$ |
(66,032) |
|
$ |
165,358 |
|
Amortization expense on other intangible assets totaled $4.8 million and $13.7 million for the three and nine months ended September 30, 2015, respectively, and $5.4 million and $14.6 million for the three and nine months ended September 30, 2014, respectively.
The following table details the Company’s estimated amortization expense for the next five years, excluding any amortization expense related to software currently in development:
|
|
|
|
|
|
|
Estimated Amortization Expense for the Next Five Years |
|
|||
|
Remainder of 2015 |
|
$ |
4,871 |
|
|
2016 |
|
|
18,931 |
|
|
2017 |
|
|
18,096 |
|
|
2018 |
|
|
17,405 |
|
|
2019 |
|
|
17,158 |
|
|
2020 |
|
|
13,465 |
|
NOTE 6—DEBT
Debt consisted of the following:
|
|
|
September 30, |
|
December 31, |
|
||
|
|
|
2015 |
|
2014 |
|
||
|
Senior Credit Facility |
|
|
|
|
|
|
|
|
2020 Revolving Facility |
|
$ |
— |
|
$ |
— |
|
|
2021 Term Loan B |
|
|
497,571 |
|
|
— |
|
|
2022 Senior Notes |
|
|
|
|
|
|
|
|
USD Notes |
|
|
300,000 |
|
|
— |
|
|
Euro Notes |
|
|
420,788 |
|
|
— |
|
|
2019 Senior Notes |
|
|
— |
|
|
1,192,500 |
|
|
Accounts Receivable Securitization Facility |
|
|
— |
|
|
— |
|
|
Other indebtedness |
|
|
2,602 |
|
|
9,707 |
|
|
Total debt |
|
|
1,220,961 |
|
|
1,202,207 |
|
|
Less: current portion |
|
|
(5,627) |
|
|
(7,559) |
|
|
Total long-term debt |
|
$ |
1,215,334 |
|
$ |
1,194,648 |
|
12
2018 Senior Secured Credit Facility
On June 17, 2010, the Company entered into a credit agreement, which was subsequently amended on February 2, 2011, July 28, 2011, February 13, 2012, August 9, 2012, January 19, 2013, and December 3, 2013 which was to mature in January 2018 (“2018 Senior Secured Credit Facility”). The 2018 Senior Secured Credit Facility included a revolving credit facility (“2018 Revolving Facility”), which, as a result of the amendment in January 2013, included a borrowing capacity of $300.0 million. As of December 31, 2014, the Company had no amounts outstanding under the 2018 Revolving Facility.
In May 2015, upon completion of the refinancing transactions discussed below, the Company terminated the 2018 Senior Secured Credit Facility. Immediately prior to this termination, the Company had no outstanding borrowings under the 2018 Revolving Facility. As a result of this termination, the Company recognized a $0.7 million loss on extinguishment of long-term debt, comprised entirely of the write-off of a portion of the existing unamortized deferred financing fees related to the 2018 Revolving Facility. The remaining unamortized deferred financing fees under the 2018 Revolving Facility totaled $7.2 million, which remained capitalized and is being amortized along with new deferred financing fees over the life of the new revolving credit facility, discussed in further detail below.
Senior Credit Facility
On May 5, 2015, Trinseo Materials Operating S.C.A. and Trinseo Materials Finance, Inc. (together, the “Issuers” or the “Borrowers”), both wholly-owned subsidiaries of the Company, entered into a senior secured credit agreement (the “Credit Agreement”), which provides senior secured financing of up to $825.0 million (the “Senior Credit Facility”). The Senior Credit Facility provides for senior secured financing consisting of a (i) $325.0 revolving credit facility, with a $25.0 million swingline subfacility and a $35.0 million letter of credit subfacility (the “2020 Revolving Facility”) maturing in May 2020 and (ii) $500.0 million senior secured term loan B facility maturing in November 2021 (the “2021 Term Loan B”). Amounts under the 2020 Revolving Facility are available in U.S. dollars and euros.
The 2021 Term Loan B bears an interest rate of LIBOR plus 3.25%, subject to a 1.00% LIBOR floor, and was issued at a 0.25% original issue discount. Further, the 2021 Term Loan B requires scheduled quarterly payments in amounts equal to 0.25% of the original principal amount of the 2021 Term Loan B, with the balance to be paid at maturity. As of September 30, 2015, $5.0 million of these scheduled future payments were classified as current debt on the Company’s condensed consolidated balance sheet.
Loans under the 2020 Revolving Facility, at the Borrowers’ option, may be maintained as (a) LIBO rate loans, which bear interest at a rate per annum equal to the LIBO rate plus the applicable margin (as defined in the Credit Agreement), if applicable, or (b) base rate loans which shall bear interest at a rate per annum equal to the base rate plus the applicable margin (as defined in the Credit Agreement). The Borrowers will be required to pay a quarterly commitment fee in respect of any unused commitments under the 2020 Revolving Facility equal to 0.50% per annum.
As of September 30, 2015, the Company had no outstanding borrowings, and had $313.0 million (net of $12.0 million outstanding letters of credit) of funds available for borrowing under the 2020 Revolving Facility.
The Senior Credit Facility is collateralized by a security interest in substantially all of the assets of Trinseo Materials Operating S.C.A., as lead borrower, Trinseo Materials Finance, Inc., as co-borrower, and the guarantors thereunder including Trinseo Materials S.à r.l., certain U.S. subsidiaries and certain foreign subsidiaries organized in Luxembourg, The Netherlands, Hong Kong, Singapore, Ireland, Germany and Switzerland.
The Senior Credit Facility requires the Borrowers and their restricted subsidiaries to comply with customary affirmative and negative covenants, including limitations on their abilities to incur liens; make certain loans and investments; incur additional debt; merge, consolidate liquidate or dissolve; transfer or sell assets; pay dividends and other distributions to shareholders or make certain other restricted payments; enter into transactions with affiliates; restrict any restricted subsidiary from paying dividends or making other distributions or agree to certain negative pledge clauses; materially alter the business they conduct; prepay certain other indebtedness; amend certain material documents; and change our fiscal year.
The 2020 Revolving Facility contains a financial covenant that requires compliance with a springing first lien net leverage ratio test. If the outstanding balance under the 2020 Revolving Facility exceeds 30% of the $325.0 million borrowing capacity (excluding undrawn letters of credit up to $10.0 million and cash collateralized letters of credit) at a
13
quarter-end, then the Company’s first lien net leverage ratio may not exceed 2.00 to 1.00. As of September 30, 2015, the Company was in compliance with all debt covenant requirements under the Senior Credit Facility.
Fees and expenses incurred in connection with the issuance of the 2021 Term Loan B and the 2020 Revolving Facility were $12.0 million and $0.3 million, respectively, which were capitalized and recorded in “Deferred charges and other assets” in the condensed consolidated balance sheets.
For the 2021 Term Loan B, deferred financing fees and the 0.25% debt discount are being amortized over its 6.5 year term using the effective interest method. For the 2020 Revolving Facility, deferred financing fees (along with an additional $7.2 million of unamortized deferred financing fees from the 2018 Revolving Facility) are being amortized over its 5.0 year term using the straight-line method. Amortization of deferred financing fees and debt discounts are recorded in “Interest expense, net” in the condensed consolidated statements of operations.
2019 Senior Notes
In January 2013, the Company issued $1,325.0 million 8.750% senior notes due to mature on February 1, 2019 (the “2019 Senior Notes”). In July 2014, using proceeds from the Company’s IPO (see Note 1), the Company redeemed $132.5 million in aggregate principal amount of the 2019 Senior Notes.
On May 13, 2015, using the net proceeds from the issuance of the 2021 Term Loan B, together with the net proceeds from the issuance of the 2022 Senior Notes (defined and discussed below) and available cash, the Company redeemed all outstanding borrowings under the 2019 Senior Notes, totaling $1,192.5 million in principal, together with a call premium of $68.6 million (with a redemption price of 103% on the first $132.5 million and 106.097% on the remaining balance) and accrued and unpaid interest thereon of $29.6 million.
As a result of this redemption, during the nine months ended September 30, 2015, the Company recorded a loss on extinguishment of long-term debt of $94.5 million, which includes the above $68.6 million call premium and a $25.9 million write-off of unamortized deferred financing fees related to the 2019 Senior Notes.
2022 Senior Notes
On May 5, 2015, the Issuers executed an indenture (the “Indenture”) pursuant to which they issued $300.0 million aggregate principal amount of 6.750% senior notes due May 1, 2022 (the “USD Notes”) and €375.0 million aggregate principal amount of 6.375% senior notes due May 1, 2022 (the “Euro Notes”, and together with the USD Notes, the “2022 Senior Notes”). Interest on the 2022 Senior Notes is payable semi-annually on May 1 and November 1 of each year, commencing on November 1, 2015.
At any time prior to May 1, 2018, the Issuers may redeem the Euro Notes and/or the USD Notes in whole or in part, at their option at a redemption price equal to 100% of the principal amount of such notes plus the relevant applicable premium as of, and accrued and unpaid interest to, but not including, the redemption date. At any time and from time to time after May 1, 2018, the Issuers may redeem the Euro Notes and/or the USD Notes, in whole or in part, at a redemption price equal to the percentage of principal amount set forth below plus accrued and unpaid interest, if any, on the notes redeemed to, but not including, the redemption date:
|
|
|
Euro Notes |
|
|
USD Notes |
|
|
12-month period commencing May 1 in Year |
|
Percentage |
|
|
Percentage |
|
|
2018 |
103.188 |
% |
103.375 |
% |
||
|
2019 |
|
101.594 |
% |
|
101.688 |
% |
|
2020 and thereafter |
|
100.000 |
% |
|
100.000 |
% |
In addition, at any time prior to May 1, 2018, the Issuers may redeem up to 40% of the aggregate principal amount of each of the USD Notes and the Euro Notes, either together or separately, at a redemption price equal to 106.750% of the principal amount thereof for the USD Notes and 106.375% of the principal amount thereof for the Euro Notes plus, in each case, accrued and unpaid interest to, but not including, the redemption date, in an amount equal to the aggregate gross proceeds from certain equity offerings.
The 2022 Senior Notes are the Issuers’ senior unsecured obligations and rank equally in right of payment with all of the Issuers’ existing and future indebtedness that is not expressly subordinated in right of payment thereto. The 2022
14
Senior Notes will be senior in right of payment to any future indebtedness that is expressly subordinated in right of payment thereto and effectively junior to (a) the Issuers’ existing and future secured indebtedness, including the Company’s accounts receivable facility and the Issuers’ Senior Credit Facility (discussed above), to the extent of the value of the collateral securing such indebtedness and (b) all existing and future liabilities of the Issuers’ non-guarantor subsidiaries.
The Indenture contains customary covenants that, among other things, limit the Issuers’ and certain of their subsidiaries’ ability to incur additional indebtedness and guarantee indebtedness, pay dividends or make other distributions, make investments, or prepay certain indebtedness, each subject to a number of exceptions and qualifications. Certain of these covenants, will be suspended during any period of time that (1) the 2022 Notes have investment grade ratings (as defined in the Indenture) and (2) no default has occurred and is continuing under the Indenture. In the event that the 2022 Senior Notes are downgraded to below an investment grade rating, the Issuers and certain subsidiaries will again be subject to the suspended covenants with respect to future events. As of September 30, 2015, the Company was in compliance with all debt covenant requirements under the Indenture.
Fees and expenses incurred in connection with the issuance of the 2022 Senior Notes were $16.0 million, which were capitalized and recorded in “Deferred charges and other assets” in the condensed consolidated balance sheets, and are being amortized into “Interest expense, net” in the condensed consolidated statements of operations over their 7.0 year term using the effective interest method.
Accounts Receivable Securitization Facility
In May 2013, the Company amended its existing accounts receivable securitization facility (“Accounts Receivable Securitization Facility”) which increased its borrowing capacity from $160.0 million to $200.0 million, extended the maturity date to May 2016 and allows for the expansion of the pool of eligible accounts receivable to include previously excluded U.S. and Netherlands subsidiaries.
The Accounts Receivable Securitization Facility is subject to interest charges against the amount of outstanding borrowings as well as the amount of available, but undrawn borrowings. As a result of the amendment to the Accounts Receivable Securitization Facility, in regards to outstanding borrowings, fixed interest charges decreased from 3.25% plus commercial paper rates to 2.60% plus variable commercial paper rates. In regards to available, but undrawn borrowings, fixed interest charges decreased from 1.50% to 1.40%.
As of September 30, 2015 and December 31, 2014, there were no amounts outstanding under the Accounts Receivable Securitization Facility, with approximately $153.0 million and $136.1 million, respectively, of accounts receivable available to support this facility, based on the pool of eligible accounts receivable.
NOTE 7—DERIVATIVE INSTRUMENTS
The Company’s ongoing business operations expose it to various risks, including fluctuating foreign exchange rates. To manage these risks, the Company periodically enters into derivative financial instruments such as foreign exchange forward contracts. The Company does not hold or enter into financial instruments for trading or speculative purposes. All derivatives are recorded on the condensed consolidated balance sheets at fair value.
Foreign Exchange Forward Contracts
Certain subsidiaries have assets and liabilities denominated in currencies other than their respective functional currencies, which creates foreign exchange risk. The Company’s principal strategy in managing its exposure to changes in foreign currency exchange rates is to naturally hedge the foreign currency-denominated liabilities on our balance sheet against corresponding assets of the same currency such that any changes in liabilities due to fluctuations in exchange rates are offset by changes in their corresponding foreign currency assets. In order to further reduce its exposure, the Company also uses foreign exchange forward contracts to economically hedge the impact of the variability in exchange rates on our assets and liabilities denominated in certain foreign currencies. These derivative contracts are not designated for hedge accounting treatment.
As of September 30, 2015, the Company had open foreign exchange forward contracts with a notional U.S. dollar equivalent absolute value of $370.4 million. The following table displays the notional amounts of the most significant
15
net foreign exchange hedge positions outstanding as of September 30, 2015.
|
|
|
September 30, |
|
||
|
Buy / (Sell) |
|
2015 |
|
||
|
Chinese Yuan |
|
$ |
(158,543) |
|
|
|
Euro |
|
$ |
94,637 |
|
|
|
Indonesian Rupiah |
|
$ |
(52,218) |
|
|
|
Swiss Franc |
|
$ |
40,835 |
|
|
|
Japanese Yen |
|
$ |
(8,919) |
|
|
Foreign Exchange Cash Flow Hedges
The Company also enters into forward contracts with the objective of managing the currency risk associated with forecasted U.S. dollar-denominated raw materials purchases by one of its subsidiaries whose functional currency is the euro. By entering into these forward contracts, which are designated as cash flow hedges, the Company buys a designated amount of U.S. dollars and sells euros at the prevailing market rate to mitigate the risk associated with the fluctuations in the euro-to-U.S. dollar foreign currency exchange rates. The qualifying hedge contracts are marked-to-market at each reporting date and any unrealized gains or losses are included in accumulated other comprehensive income (AOCI) to the extent effective, and reclassified to cost of sales in the period during which the transaction affects earnings or it becomes probable that the forecasted transaction will not occur.
Open foreign exchange cash flow hedges as of September 30, 2015 have maturities occurring over a period of 15 months, and have a net notional U.S. dollar equivalent of $135.0 million.
Net Investment Hedge
The Company’s outstanding debt includes €375.0 million of Euro Notes (see Note 6 for details). As of September 30, 2015, the Company has designated a portion (€150.0 million) of the principal amount of these Euro Notes as a hedge of the foreign currency exposure of the Issuers’ net investment in certain European subsidiaries. As this debt was deemed to be a highly effective hedge, changes in the Euro Notes’ carrying value resulting from fluctuations in the euro exchange rate were recorded as cumulative foreign currency translation loss of $4.1 million within accumulated other comprehensive loss as of September 30, 2015.
Summary of Derivative Instruments
Information regarding changes in the fair value of the Company’s derivative instruments, including those not designated for hedge accounting treatment, is as follows:
|
|
|
Gain (Loss) Recognized in |
|
Gain (Loss) Recognized in |
|
|
||||||||
|
|
|
AOCI on Balance Sheet |
|
Statement of Operations |
|
|
||||||||
|
|
|
Three Months Ended September 30, |
|
Statement of Operations |
||||||||||
|
|
|
2015 |
|
2014 |
|
2015 |
|
2014 |
|
Classification |
||||
|
Designated as Cash Flow Hedges |
|
|
|
|
|
|
|
|
|
|
|
|
|
|
|
Foreign exchange cash flow hedges |
|
$ |
97 |
|
$ |
— |
|
$ |
(17) |
|
$ |
— |
|
Cost of sales |
|
Total |
|
$ |
97 |
|
$ |
— |
|
$ |
(17) |
|
$ |
— |
|
|
|
Net Investment Hedges |
|
|
|
|
|
|
|
|
|
|
|
|
|
|
|
Euro Notes |
|
$ |
(1,635) |
|
$ |
— |
|
$ |
— |
|
$ |
— |
|
Other expenses, net |
|
Total |
|
$ |
(1,635) |
|
$ |
— |
|
$ |
— |
|
$ |
— |
|
|
|
Not Designated as Cash Flow Hedges |
|
|
|
|
|
|
|
|
|
|
|
|
|
|
|
Foreign exchange forward contracts |
|
$ |
— |
|
$ |
— |
|
$ |
4,452 |
|
$ |
(19,524) |
|
Other expenses, net |
|
Total |
|
$ |
— |
|
$ |
— |
|
$ |
4,452 |
|
$ |
(19,524) |
|
|
16
|
|
|
Gain (Loss) Recognized in |
|
Gain (Loss) Recognized in |
|
|
||||||||
|
|
|
AOCI on Balance Sheet |
|
Statement of Operations |
|
|
||||||||
|
|
|
Nine Months Ended September 30, |
|
Statement of Operations |
||||||||||
|
|
|
2015 |
|
2014 |
|
2015 |
|
2014 |
|
Classification |
||||
|
Designated as Cash Flow Hedges |
|
|
|
|
|
|
|
|
|
|
|
|
|
|
|
Foreign exchange cash flow hedges |
|
$ |
(308) |
|
$ |
— |
|
$ |
59 |
|
$ |
— |
|
Cost of sales |
|
Total |
|
$ |
(308) |
|
$ |
— |
|
$ |
59 |
|
$ |
— |
|
|
|
Net Investment Hedges |
|
|
|
|
|
|
|
|
|
|
|
|
|
|
|
Euro Notes |
|
$ |
(4,073) |
|
$ |
— |
|
$ |
— |
|
$ |
— |
|
Other expenses, net |
|
Total |
|
$ |
(4,073) |
|
$ |
— |
|
$ |
— |
|
$ |
— |
|
|
|
Not Designated as Cash Flow Hedges |
|
|
|
|
|
|
|
|
|
|
|
|
|
|
|
Foreign exchange forward contracts |
|
$ |
— |
|
$ |
— |
|
$ |
(9,246) |
|
$ |
(19,524) |
|
Other expenses, net |
|
Total |
|
$ |
— |
|
$ |
— |
|
$ |
(9,246) |
|
$ |
(19,524) |
|
|
The Company recorded gains of $4.5 million and losses of $9.2 million during the three and nine months ended September 30, 2015 and losses of $19.5 million during the three and nine months ended September 30, 2014 from settlements and changes in the fair value of outstanding forward contracts (not designated as hedges). The gains and losses from these forward contracts offset net foreign exchange transaction losses of $6.7 million and gains of $0.9 million during the three and nine months ended September 30, 2015, respectively, and gains of $21.8 million and $23.4 million during the three and nine months ended September 30, 2014, respectively, which resulted from the remeasurement of the Company’s foreign currency denominated assets and liabilities. The cash settlements of these foreign exchange forward contracts are included within operating activities in the condensed consolidated statement of cash flows.
As of September 30, 2015, the Company has no ineffectiveness related to its foreign exchange cash flow hedges. Further, the Company expects to reclassify in the next twelve months an approximate $1.0 million net loss from other comprehensive income (loss) into earnings related to the Company’s outstanding cash flow hedges as of September 30, 2015 based on current foreign exchange rates.
The following table summarizes the net unrealized gains and losses and balance sheet classification of outstanding derivatives recorded in the condensed consolidated balance sheets:
|
|
|
September 30, 2015 |
|
December 31, 2014 |
|
||||||||||||||
|
|
|
Foreign |
|
Foreign |
|
|
|
Foreign |
|
Foreign |
|
|
|
||||||
|
|
|
Forward |
|
Cash Flow |
|
|
|
Forward |
|
Cash Flow |
|
|
|
||||||
|
Balance Sheet Classification |
|
Contracts |
|
Hedges |
|
Total |
|
Contracts |
|
Hedges |
|
Total |
|
||||||
|
Asset Derivatives: |
|
|
|
|
|
|
|
|
|
|
|
|
|
|
|
|
|
|
|
|
Accounts receivable, net of allowance |
|
$ |
736 |
|
$ |
707 |
|
$ |
1,443 |
|
$ |
298 |
|
$ |
— |
|
$ |
298 |
|
|
Deferred charges and other assets |
|
|
— |
|
|
436 |
|
|
436 |
|
|
— |
|
|
— |
|
|
— |
|
|
Total asset derivatives |
|
$ |
736 |
|
$ |
1,143 |
|
$ |
1,879 |
|
$ |
298 |
|
$ |
— |
|
$ |
298 |
|
|
Liability Derivatives: |
|
|
|
|
|
|
|
|
|
|
|
|
|
|
|
|
|
|
|
|
Accounts payable |
|
$ |
855 |
|
$ |
1,694 |
|
$ |
2,549 |
|
$ |
4,850 |
|
$ |
— |
|
$ |
4,850 |
|
|
Other noncurrent obligations |
|
|
— |
|
|
— |
|
|
— |
|
|
— |
|
|
— |
|
|
— |
|
|
Total liability derivatives |
|
$ |
855 |
|
$ |
1,694 |
|
$ |
2,549 |
|
$ |
4,850 |
|
$ |
— |
|
$ |
4,850 |
|
Forward contracts are entered into with a limited number of counterparties, each of which allows for net settlement of all contracts through a single payment in a single currency in the event of a default on or termination of any one contract. As such, in accordance with the Company’s accounting policy, we record these foreign exchange forward contracts on a net basis by counterparty within the condensed consolidated balance sheet. Information regarding the
17
gross amounts of the Company’s derivative instruments and the amounts offset in the condensed consolidated balance sheets is as follows:
|
|
|
Gross Amounts |
|
Gross Amounts |
|
Net Amounts |
|
|||
|
|
|
Recognized in the |
|
Offset in the |
|
Presented in the |
|
|||
|
|
|
Balance Sheet |
|
Balance Sheet |
|
Balance Sheet |
|
|||
|
Balance at September 30, 2015 |
|
|
|
|
|
|
|
|
|
|
|
Derivative assets |
|
$ |
2,656 |
|
$ |
(777) |
|
$ |
1,879 |
|
|
Derivative liabilities |
|
|
3,326 |
|
|
(777) |
|
|
2,549 |
|
|
|
|
|
|
|
|
|
|
|
|
|
|
Balance at December 31, 2014 |
|
|
|
|
|
|
|
|
|
|
|
Derivative assets |
|
$ |
2,037 |
|
$ |
(1,739) |
|
$ |
298 |
|
|
Derivative liabilities |
|
|
6,589 |
|
|
(1,739) |
|
|
4,850 |
|
Refer to Notes 8 and 17 of the condensed consolidated financial statements for further information regarding the fair value of the Company’s derivative instruments and the related changes in accumulated other comprehensive income.
NOTE 8—FAIR VALUE MEASUREMENTS
Fair value is defined as the price that would be received to sell an asset or paid to transfer a liability in an orderly transaction between market participants at the measurement date. Assets and liabilities measured at fair value are classified using the following hierarchy, which is based upon the transparency of inputs to the valuation as of the measurement date.
Level 1—Valuation is based upon quoted prices (unadjusted) for identical assets or liabilities in active markets.
Level 2—Valuation is based upon quoted prices for similar assets and liabilities in active markets, or other inputs that are observable for the asset or liability, either directly or indirectly, for substantially the full term of the financial instrument.
Level 3—Valuation is based upon other unobservable inputs that are significant to the fair value measurement.
The following table summarizes the basis used to measure certain assets and liabilities at fair value on a recurring basis in the condensed consolidated balance sheets as of September 30, 2015 and December 31, 2014.
|
|
|
September 30, 2015 |
|
||||||||||
|
|
|
Quoted Prices in |
|
Significant |
|
Significant |
|
|
|
|
|||
|
|
|
Active Markets for |
|
Other Observable |
|
Unobservable |
|
|
|
|
|||
|
|
|
Identical Items |
|
Inputs |
|
Inputs |
|
|
|
|
|||
|
Assets (Liabilities) at Fair Value |
|
(Level 1) |
|
(Level 2) |
|
(Level 3) |
|
Total |
|
||||
|
Foreign exchange forward contracts—Assets |
|
$ |
— |
|
$ |
736 |
|
$ |
— |
|
$ |
736 |
|
|
Foreign exchange forward contracts—(Liabilities) |
|
|
— |
|
|
(855) |
|
|
— |
|
|
(855) |
|
|
Foreign exchange cash flow hedges—Assets |
|
|
— |
|
|
1,143 |
|
|
— |
|
|
1,143 |
|
|
Foreign exchange cash flow hedges—(Liabilities) |
|
|
— |
|
|
(1,694) |
|
|
— |
|
|
(1,694) |
|
|
Total fair value |
|
$ |
— |
|
$ |
(670) |
|
$ |
— |
|
$ |
(670) |
|
18
|
|
|
December 31, 2014 |
|
||||||||||
|
|
|
Quoted Prices in |
|
Significant |
|
Significant |
|
|
|
|
|||
|
|
|
Active Markets for |
|
Other Observable |
|
Unobservable |
|
|
|
|
|||
|
|
|
Identical Items |
|
Inputs |
|
Inputs |
|
|
|
|
|||
|
Assets (Liabilities) at Fair Value |
|
(Level 1) |
|
(Level 2) |
|
(Level 3) |
|
Total |
|
||||
|
Foreign exchange forward contracts—Assets |
|
$ |
— |
|
$ |
298 |
|
$ |
— |
|
$ |
298 |
|
|
Foreign exchange forward contracts—(Liabilities) |
|
|
— |
|
|
(4,850) |
|
|
— |
|
|
(4,850) |
|
|
Total fair value |
|
$ |
— |
|
$ |
(4,552) |
|
$ |
— |
|
$ |
(4,552) |
|
The Company uses an income approach to value its derivative instruments, utilizing discounted cash flow techniques, considering the terms of the contract and observable market information available as of the reporting date. Significant inputs to the valuation for foreign exchange forward contracts and foreign exchange cash flow hedges are obtained from broker quotations or from listed or over-the-counter market data, and are classified as Level 2 in the fair value hierarchy.
Fair Value of Debt Instruments
The following table presents the estimated fair value of the Company’s outstanding debt not carried at fair value as of September 30, 2015 and December 31, 2014, respectively:
|
|
|
As of |
|
As of |
|
||
|
|
|
September 30, 2015 |
|
December 31, 2014 |
|
||
|
2019 Senior Notes |
|
$ |
— |
|
$ |
1,212,045 |
|
|
2022 Senior Notes |
|
|
|
|
|
|
|
|
USD Notes |
|
|
289,500 |
|
|
— |
|
|
Euro Notes |
|
|
405,008 |
|
|
— |
|
|
2021 Term Loan B |
|
|
496,880 |
|
|
— |
|
|
Total fair value |
|
$ |
1,191,388 |
|
$ |
1,212,045 |
|
The fair value of the Company’s Term Loan B, USD Notes, Euro Notes, and 2019 Senior Notes (each Level 2 securities) is determined using over-the-counter market quotes and benchmark yields received from independent vendors.
There were no other significant financial instruments outstanding as of September 30, 2015 and December 31, 2014.
NOTE 9—PROVISION FOR INCOME TAXES
|
|
|
Three Months Ended |
|
Nine Months Ended |
|
||||||||
|
|
|
September 30, |
|
September 30, |
|
||||||||
|
|
|
2015 |
|
2014 |
|
2015 |
|
2014 |
|
||||
|
Effective income tax rate |
|
|
28.9 |
% |
|
(56.5) |
% |
|
34.0 |
% |
|
(138.3) |
% |
Provision for income taxes for the three and nine months ended September 30, 2015 were $21.2 million, resulting in an effective tax rate of 28.9%, and $46.6 million, resulting in an effective tax rate of 34.0%, respectively. Provision for income taxes for the three and nine months ended September 30, 2014 were $3.7 million, resulting in a negative effective tax rate of 56.5%, and $21.9 million, resulting in a negative effective tax rate of 138.3%, respectively.
19
The effective income tax rate is impacted by losses primarily within our holding companies incorporated in Luxembourg, which are not anticipated to provide a tax benefit to the Company in the future. For the three and nine months ended September 30, 2015, these losses totaled approximately $12.9 million and $73.5 million, respectively. These losses included non-deductible interest and stock-based compensation expense. Additionally, during the nine months ended September 30, 2015, these losses included $18.6 million related to a portion of the fees associated with the call premium paid to retire the Company’s 2019 Senior Notes and $5.6 million related to the write off of the related unamortized deferred financing fees (both incurred in the second quarter; see Note 6 for further discussion). These non-deductible expenses unfavorably impacted the effective tax rate during the three and nine months ended September 30, 2015.
For the three and nine months ended September 30, 2014, losses primarily within our holding companies incorporated in Luxembourg, which are not anticipated to provide a tax benefit to the Company in the future, were approximately $22.6 million and $119.8 million during these respective periods. These losses included non-deductible interest and stock-based compensation expense. Additionally, during the nine months ended September 30, 2014, these losses included payments of $32.5 million related to an agreement with Dow to terminate the Latex JV Option Agreement and a portion of the fees related to the termination of the Advisory Agreement with Bain Capital of approximately $18.6 million (both incurred in the second quarter of 2014; see Note 13 for further discussion). These non-deductible expenses unfavorably impacted the effective tax rate during the three and nine months ended September 30, 2014.
Partially offsetting this unfavorable impact to the effective tax rate during the nine months ended September 30, 2014 was a tax benefit during the period, as the Company effectively settled its 2010 and 2011 audits with the IRS and received a refund of $3.2 million in July 2014. As a result, the Company recorded a previously unrecognized tax benefit in the amount of $2.7 million, including penalties and interest, relating to its 2011 tax return filing. No similar benefits were recorded in the nine months ended September 30, 2015.
As of September 30, 2015, the Company has a net deferred tax asset of approximately $7.0 million in one of its China subsidiaries. This net deferred tax asset primarily consists of the future benefit from net operating loss carryforwards which, if not utilized, will expire in varying amounts by 2018 and 2020. It is possible that some or all of these loss carryforwards may expire unused if we are not able to generate sufficient taxable income from our operations or through tax planning strategies in this jurisdiction. If the Company concludes in the future that it cannot assert it is more likely than not it will realize this net deferred tax asset, a valuation allowance will be established. If recorded, this will affect the Company’s financial position and results of operations in the period it is recognized.
NOTE 10—COMMITMENTS AND CONTINGENCIES
Environmental Matters
Accruals for environmental matters are recorded when it is probable that a liability has been incurred and the amount of the liability can be reasonably estimated, based on current law, existing technologies and other information. As of September 30, 2015 and December 31, 2014, the Company had no accrued obligations for environmental remediation and restoration costs. Pursuant to the terms of the sales and purchase agreement for the Styron business, the pre-closing environmental conditions were retained by Dow and the Company has been indemnified by Dow from and against all environmental liabilities incurred or relating to the predecessor periods. There are several properties which the Company now owns on which Dow has been conducting investigation, monitoring or remediation to address historical contamination. Those properties include Allyn’s Point, Connecticut; Dalton, Georgia; and Livorno, Italy. There are other properties with historical contamination that are owned by Dow that the Company leases for its operations, including its facilities in Midland, Michigan; Schkopau, Germany; Terneuzen, The Netherlands; and Guaruja, Brazil. No environmental claims have been asserted or threatened against the Company, and the Company is not a potentially responsible party at any Superfund Sites.
Inherent uncertainties exist in the Company’s potential environmental liabilities primarily due to unknown conditions, whether future claims may fall outside the scope of the indemnity, changing governmental regulations and legal standards regarding liability, and evolving technologies for handling site remediation and restoration. In connection with the Company’s existing indemnification, the possibility is considered remote that environmental remediation costs will have a material adverse impact on the condensed consolidated financial statements.
20
Purchase Commitments
In the normal course of business, the Company has certain raw material purchase contracts where it is required to purchase certain minimum volumes at current market prices. These commitments range from 1 to 6 years. In certain raw material purchase contracts, the Company has the right to purchase less than the required minimums and pay a liquidated damages fee, or, in case of a permanent plant shutdown, to terminate the contracts. In such cases, these obligations would be less than the annual commitment as disclosed in the consolidated financial statements included in the 2014 Annual Report.
Litigation Matters
From time to time, the Company may be subject to various legal claims and proceedings incidental to the normal conduct of business, relating to such matters as product liability, antitrust/competition, past waste disposal practices and release of chemicals into the environment. While it is impossible at this time to determine with certainty the ultimate outcome of these routine claims, the Company does not believe that the ultimate resolution of these claims will have a material adverse effect on the Company’s results of operations, financial condition or cash flow. Legal costs, including those legal costs expected to be incurred in connection with a loss contingency, are expensed as incurred.
NOTE 11—PENSION PLANS AND OTHER POSTRETIREMENT BENEFITS
The components of net periodic benefit costs for all significant plans were as follows:
|
|
|
Three Months Ended |
|
Nine Months Ended |
|
||||||||
|
|
|
September 30, |
|
September 30, |
|
||||||||
|
|
|
2015 |
|
2014 |
|
2015 |
|
2014 |
|
||||
|
Defined Benefit Pension Plans |
|
|
|
|
|
|
|
|
|
|
|
|
|
|
Service cost |
|
$ |
4,127 |
|
$ |
3,454 |
|
$ |
12,503 |
|
$ |
10,498 |
|
|
Interest cost |
|
|
1,302 |
|
|
1,902 |
|
|
3,949 |
|
|
5,778 |
|
|
Expected return on plan assets |
|
|
(404) |
|
|
(611) |
|
|
(1,224) |
|
|
(1,856) |
|
|
Amortization of prior service credit |
|
|
(405) |
|
|
(252) |
|
|
(1,230) |
|
|
(765) |
|
|
Amortization of net loss |
|
|
1,325 |
|
|
520 |
|
|
4,014 |
|
|
1,585 |
|
|
Net periodic benefit cost |
|
$ |
5,945 |
|
$ |
5,013 |
|
$ |
18,012 |
|
$ |
15,240 |
|
|
|
|
Three Months Ended |
|
Nine Months Ended |
|
||||||||
|
|
|
September 30, |
|
September 30, |
|
||||||||
|
|
|
2015 |
|
2014 |
|
2015 |
|
2014 |
|
||||
|
Other Postretirement Plans |
|
|
|
|
|
|
|
|
|
|
|
|
|
|
Service cost |
|
$ |
84 |
|
$ |
74 |
|
$ |
258 |
|
$ |
224 |
|
|
Interest cost |
|
|
128 |
|
|
78 |
|
|
401 |
|
|
234 |
|
|
Amortization of prior service cost |
|
|
26 |
|
|
26 |
|
|
78 |
|
|
78 |
|
|
Amortization of net gain |
|
|
— |
|
|
(37) |
|
|
— |
|
|
(111) |
|
|
Net periodic benefit cost |
|
$ |
238 |
|
$ |
141 |
|
$ |
737 |
|
$ |
425 |
|
As of September 30, 2015 and December 31, 2014, the Company’s benefit obligations included primarily in “Other noncurrent obligations” in the condensed consolidated balance sheets were $189.0 million and $196.6 million, respectively. The net periodic benefit costs are recognized in the condensed consolidated statement of operations as “Cost of sales” and “Selling, general and administrative expenses.”
The Company made cash contributions of approximately $1.9 million and $9.5 million during the three and nine months ended September 30, 2015, respectively. The Company expects to make additional cash contributions, including benefit payments to unfunded plans, of approximately $8.3 million to its defined benefit plans for the remainder of 2015.
21
NOTE 12—STOCK-BASED COMPENSATION
Restricted Stock Awards issued by the Parent
On June 17, 2010, Bain Capital Everest Manager Holding SCA (“the Parent”), an affiliate of Bain Capital, authorized the issuance of up to 750,000 shares in time-based and performance-based restricted stock to certain key members of management. Any related compensation associated with these awards is allocated to the Company from the Parent. With the adoption of the Company’s 2014 Omnibus Incentive Plan (see discussion below), no further restricted stock awards will be issued by the Parent on behalf of the Company.
Time-based Restricted Stock Awards
For the nine month period ended September 30, 2015, there were no grants of time-based restricted stock awards. Total compensation expense for time-based restricted stock awards was $0.6 million and $1.1 million for the three months ended September 30, 2015 and 2014, respectively, and $2.7 million and $5.8 million for the nine months ended September 30, 2015 and 2014, respectively. As of September 30, 2015, there was $2.4 million of total unrecognized compensation cost related to time-based restricted stock awards, which is expected to be recognized over a weighted-average period of 1.8 years.
Modified Time-based Restricted Stock Awards
For the nine month period ended September 30, 2015, there were no grants of modified time-based restricted stock awards. Total compensation expense recognized for modified time-based restricted stock awards was $0.9 million and $1.3 million for the three months ended September 30, 2015 and 2014, respectively, and $2.7 million and $1.3 million for the nine months ended September 30, 2015 and 2014, respectively. As of September 30, 2015, there was $6.4 million of total unrecognized compensation cost related to the modified time-based restricted stock awards, which is expected to be recognized over a weighted-average period of 1.8 years.
Management Retention Awards
During the year ended December 31, 2012, the Parent agreed to retention awards with certain officers. These awards generally vest over one to four years, and are payable upon vesting subject to the participant’s continued employment with the Company on the vesting date. Compensation expense related to these retention awards is equivalent to the value of the award, and is being recognized ratably over the applicable service period. Total compensation expense for these retention awards was $0.1 million and $0.2 million for the three months ended September 30, 2015 and 2014, respectively, and $0.3 million and $0.7 million for the nine months ended September 30, 2015 and 2014, respectively. As of September 30, 2015, there was $0.1 million in unrecognized compensation cost related to these retention awards. This cost is expected to be recognized over a period of 0.3 years.
2014 Omnibus Incentive Plan
In connection with the IPO, the Company’s Board of Directors approved the Trinseo S.A. 2014 Omnibus Incentive Plan (“2014 Omnibus Plan”), adopted on May 28, 2014, under which the maximum number of shares of common stock that may be delivered upon satisfaction of awards granted under such plan is 4.5 million shares. During the nine months ended September 30, 2015, the Board of Directors of the Company approved equity award grants for certain directors, executives, and employees, comprised of restricted share units (or RSUs) and options to purchase shares.
The RSUs granted to executives and employees vest in full on the third anniversary of the date of grant, generally subject to the employee remaining continuously employed by the Company on the vesting date. RSUs granted to directors of the Company vest in full on the first anniversary of the date of grant. Upon a termination of employment due to the employee’s death or retirement or a termination of employment by the Company without cause in connection with a restructuring or redundancy or due to the employee’s disability prior to the vesting date, the RSUs will vest in full or in part, depending on the type of termination. In the event employment is terminated for cause, all unvested RSUs will be forfeited. Dividends and dividend equivalents will not accumulate on unvested RSUs. Compensation costs for the RSUs are measured at the grant date based on the fair value of the award and are recognized ratably as expense over the applicable vesting term.
22
The option awards, which contain an exercise term of nine years from the date of grant, vest in three equal annual installments beginning on the first anniversary of the date of grant, generally subject to the employee remaining continuously employed on the applicable vesting date. Upon a termination of employment due to the employee’s death or retirement or a termination of employment by the Company without cause in connection with a restructuring or redundancy or due to the employee’s disability prior to a vesting date, the options will vest in full or will continue to vest on the original vesting schedule, depending on the type of termination. In the event employment is terminated for cause, all vested and unvested options will be forfeited. Compensation cost for the option awards is measured at the grant date based on the fair value of the award and is recognized as expense over the appropriate service period utilizing graded vesting.
The fair value of RSUs is equal to the fair market value of the Company’s common shares based on the closing price on the date of grant. During the three months ended September 30, 2015, the Company granted no RSUs. During the nine months ended September 30, 2015, the Company granted 436,323 RSUs at a weighted-average grant date fair value of $18.67 per unit. Total compensation expense recognized for the RSUs was $0.7 million and $1.4 million for the three and nine months ended September 30, 2015, respectively. As of September 30, 2015, there was $6.4 million of total unrecognized compensation cost related to the RSUs, which is expected to be recognized over a weighted-average period of 2.3 years.
The fair value for option awards is computed using the Black-Scholes pricing model, whose significant inputs and assumptions are determined as of the date of grant. Determining the fair value of the option awards requires considerable judgment, including estimating the expected term of stock options and the expected volatility of the Company’s stock price. During the three months ended September 30, 2015, the Company granted no option awards. During the nine months ended September 30, 2015, the Company granted 607,382 option awards to purchase common shares at a weighted-average grant date fair value of $7.82 per option award.
Since the Company’s equity interests were privately held prior to the IPO in June 2014, there is limited publicly traded stock history, and as a result the expected volatility used in the Black-Scholes pricing model is based on the historical volatility of similar companies’ stock that are publicly traded as well as the Company’s debt-to-equity ratio. Until such time that the Company has enough publicly traded stock history to determine expected volatility based solely on its stock, estimated volatility of options granted will be based on a combination of our historical volatility and similar companies’ stock that are publicly traded. The expected term of options represents the period of time that options granted are expected to be outstanding. For the grants presented herein, the simplified method was used to calculate the expected term of options, given the Company’s limited historical exercise data. The risk-free interest rate for the periods within the expected term of the option is based on the U.S. Treasury yield curve in effect at the time of grant. The dividend yield is assumed to be zero based on historical and expected dividend activity.
The following are the weighted-average assumptions used within the Black-Scholes pricing model for grants during the nine months ended September 30, 2015:
|
|
|
|
|
|
|
|
Nine Months Ended September 30, |
|
|
|
|
2015 |
|
|
Expected term (in years) |
|
5.50 |
|
|
Expected volatility |
|
45.00 |
% |
|
Risk-free interest rate |
|
1.65 |
% |
|
Dividend yield |
|
0.00 |
% |
Total compensation expense for the option awards was $0.9 million and $2.3 million for the three and nine months ended September 30, 2015, respectively. As of September 30, 2015, there was $2.4 million of total unrecognized compensation cost related to the option awards, which is expected to be recognized over a weighted-average period of 2.4 years.
NOTE 13—RELATED PARTY TRANSACTIONS AND DOW TRANSACTIONS
In connection with the Acquisition, the Company entered into a ten year initial term advisory agreement with Bain Capital (the “Advisory Agreement”) wherein Bain Capital provides management and consulting services and financial and other advisory services to the Company. The Advisory Agreement terminated upon consummation of the Company’s IPO in June 2014 and pursuant to the terms of the Advisory Agreement, the Company paid $23.3 million of
23
termination fees representing acceleration of the advisory fees for the remainder of the original term. The termination fee was paid in June 2014 using the proceeds from the IPO, and was recorded as an expense within “Selling, general and administrative expenses” in the condensed consolidated statement of operations for the nine months ended September 30, 2014. Bain Capital will continue to provide an immaterial level of ad hoc advisory services for the Company going forward. In conjunction with the above, we incurred Bain Capital fees (including out-of-pocket expenses) of zero and $0.1 million for the three months ended September 30, 2015 and 2014, respectively, and $0.1 million and $2.2 million for the nine months ended September 30, 2015 and 2014, respectively (excluding the termination fees noted above).
Bain Capital also provided advice pursuant to a 10-year transaction services agreement with fees payable equaling 1% of the transaction value of each financing, acquisition or similar transaction. In connection with the IPO, Bain Capital received $2.2 million of transaction fees, which were recorded within “Additional paid-in-capital” on the condensed consolidated balance sheet as of September 30, 2015 and December 31, 2014. This transaction services agreement also terminated upon consummation of the Company’s IPO in June 2014.
In connection with the Acquisition in 2010, certain of the Company’s affiliates entered into a latex joint venture option agreement (the “Latex JV Option Agreement”) with Dow, pursuant to which Dow was granted an irrevocable option to purchase 50% of the issued and outstanding interests in a joint venture to be formed by Dow and the Company’s affiliates with respect to the SB Latex business in Asia, Latin America, the Middle East, Africa, Eastern Europe, Russia and India. On May 30, 2014, the Company’s affiliates entered into an agreement with Dow to terminate the Latex JV Option Agreement, Dow’s rights to the option, and all other obligations thereunder, in exchange for a termination payment of $32.5 million. This termination payment was made on May 30, 2014, and the termination of the Latex JV Option Agreement became effective as of such date. This termination payment was recorded as an expense within “Other expense, net” in the condensed consolidated statements of operations for the nine months ended September 30, 2014.
NOTE 14—SEGMENTS
Until January 1, 2015, the chief executive officer, who is the Company’s chief operating decision maker, managed the Company’s operations under two divisions, Emulsion Polymers and Plastics, which included the following four reporting segments: Latex, Synthetic Rubber, Styrenics, and Engineered Polymers.
Effective January 1, 2015, the Company was reorganized under two new divisions called Performance Materials and Basic Plastics & Feedstocks. The Performance Materials division now includes the following reporting segments: Synthetic Rubber, Latex, and Performance Plastics. The Basic Plastics & Feedstocks division represents a separate segment for financial reporting purposes. This new organizational structure better reflects the nature of the Company by grouping together segments with similar strategies, business drivers and operating characteristics.
The information below for the three and nine months ended September 30, 2014 has been recast to reflect this change in reporting segments.
The Latex segment produces SB latex primarily for coated paper and packaging board, carpet and artificial turf backings, as well as a number of performance latex applications. The Synthetic Rubber segment produces synthetic rubber products used predominantly in tires, with additional applications in polymer modification and technical rubber goods, including conveyer and fan belts, hoses, seals and gaskets. The Performance Plastics segment produces highly engineered compounds and blends for automotive end markets, as well as consumer electronics, medical, and lighting, collectively consumer essential markets, or CEM. The Basic Plastics & Feedstocks segment includes styrenic polymers, polycarbonate, or PC, and styrene monomer, and also includes the results of the Company’s two 50%-owned joint
24
ventures, Americas Styrenics and Sumika Styron Polycarbonate.
|
|
|
Performance Materials |
|
|
|
|
|
|
|
|
|
|
|||||||
|
|
|
|
|
|
Synthetic |
|
Performance |
|
Basic Plastics |
|
Corporate |
|
|
|
|
||||
|
Three Months Ended |
|
Latex |
|
Rubber |
|
Plastics |
|
& Feedstocks |
|
Unallocated |
|
Total |
|
||||||
|
September 30, 2015 |
|
|
|
|
|
|
|
|
|
|
|
|
|
|
|
|
|
|
|
|
Sales to external customers |
|
$ |
254,938 |
|
$ |
125,956 |
|
$ |
179,861 |
|
$ |
467,197 |
|
$ |
— |
|
$ |
1,027,952 |
|
|
Equity in earnings (losses) of unconsolidated affiliates |
|
|
— |
|
|
— |
|
|
— |
|
|
33,489 |
|
|
— |
|
|
33,489 |
|
|
EBITDA(1) |
|
|
24,295 |
|
|
27,397 |
|
|
14,540 |
|
|
70,225 |
|
|
|
|
|
|
|
|
Investment in unconsolidated affiliates |
|
|
— |
|
|
— |
|
|
— |
|
|
191,194 |
|
|
— |
|
|
191,194 |
|
|
Depreciation and amortization |
|
|
7,033 |
|
|
7,619 |
|
|
1,387 |
|
|
6,225 |
|
|
742 |
|
|
23,006 |
|
|
September 30, 2014 |
|
|
|
|
|
|
|
|
|
|
|
|
|
|
|
|
|
|
|
|
Sales to external customers |
|
$ |
328,394 |
|
$ |
155,452 |
|
$ |
207,612 |
|
$ |
614,035 |
|
$ |
— |
|
$ |
1,305,493 |
|
|
Equity in earnings (losses) of unconsolidated affiliates |
|
|
— |
|
|
— |
|
|
— |
|
|
9,267 |
|
|
— |
|
|
9,267 |
|
|
EBITDA(1) |
|
|
25,389 |
|
|
26,590 |
|
|
19,173 |
|
|
4,293 |
|
|
|
|
|
|
|
|
Investment in unconsolidated affiliates |
|
|
— |
|
|
— |
|
|
— |
|
|
164,504 |
|
|
— |
|
|
164,504 |
|
|
Depreciation and amortization |
|
|
6,456 |
|
|
8,653 |
|
|
1,441 |
|
|
9,694 |
|
|
1,613 |
|
|
27,857 |
|
|
|
|
Performance Materials |
|
|
|
|
|
|
|
|
|
|
|||||||
|
|
|
|
|
|
Synthetic |
|
Performance |
|
Basic Plastics |
|
Corporate |
|
|
|
|
||||
|
Nine Months Ended |
|
Latex |
|
Rubber |
|
Plastics |
|
& Feedstocks |
|
Unallocated |
|
Total |
|
||||||
|
September 30, 2015 |
|
|
|
|
|
|
|
|
|
|
|
|
|
|
|
|
|
|
|
|
Sales to external customers |
|
$ |
740,706 |
|
$ |
370,730 |
|
$ |
562,109 |
|
$ |
1,401,345 |
|
$ |
— |
|
$ |
3,074,890 |
|
|
Equity in earnings (losses) of unconsolidated affiliates |
|
|
— |
|
|
— |
|
|
— |
|
|
111,037 |
|
|
— |
|
|
111,037 |
|
|
EBITDA(1) |
|
|
60,658 |
|
|
72,035 |
|
|
60,893 |
|
|
251,392 |
|
|
|
|
|
|
|
|
Investment in unconsolidated affiliates |
|
|
— |
|
|
— |
|
|
— |
|
|
191,194 |
|
|
— |
|
|
191,194 |
|
|
Depreciation and amortization |
|
|
19,599 |
|
|
22,787 |
|
|
4,173 |
|
|
18,470 |
|
|
2,258 |
|
|
67,287 |
|
|
September 30, 2014 |
|
|
|
|
|
|
|
|
|
|
|
|
|
|
|
|
|
|
|
|
Sales to external customers |
|
$ |
975,382 |
|
$ |
497,091 |
|
$ |
619,463 |
|
$ |
1,913,624 |
|
$ |
— |
|
$ |
4,005,560 |
|
|
Equity in earnings (losses) of unconsolidated affiliates |
|
|
— |
|
|
— |
|
|
— |
|
|
29,595 |
|
|
— |
|
|
29,595 |
|
|
EBITDA(1) |
|
|
75,717 |
|
|
106,722 |
|
|
53,348 |
|
|
42,303 |
|
|
|
|
|
|
|
|
Investment in unconsolidated affiliates |
|
|
— |
|
|
— |
|
|
— |
|
|
164,504 |
|
|
— |
|
|
164,504 |
|
|
Depreciation and amortization |
|
|
20,095 |
|
|
24,298 |
|
|
4,101 |
|
|
26,723 |
|
|
3,581 |
|
|
78,798 |
|
|
(1) |
Reconciliation of EBITDA to net income (loss) is as follows: |
|
|
|
|
|
|
|
|
|
|
|
|
|
|
|
|
|
|
Three Months Ended |
|
Nine Months Ended |
|
||||||||
|
|
|
September 30, |
|
September 30, |
|
||||||||
|
|
|
2015 |
|
2014 |
|
2015 |
|
2014 |
|
||||
|
Total segment EBITDA |
|
$ |
136,457 |
|
$ |
75,445 |
|
$ |
444,978 |
|
$ |
278,090 |
|
|
Corporate unallocated |
|
|
(20,707) |
|
|
(23,950) |
|
|
(166,631) |
|
|
(119,569) |
|
|
Less: Interest expense, net |
|
|
19,489 |
|
|
30,098 |
|
|
73,945 |
|
|
95,518 |
|
|
Less: Provision for income taxes |
|
|
21,200 |
|
|
3,650 |
|
|
46,600 |
|
|
21,850 |
|
|
Less: Depreciation and amortization |
|
|
23,006 |
|
|
27,857 |
|
|
67,287 |
|
|
78,798 |
|
|
Net income (loss) |
|
$ |
52,055 |
|
$ |
(10,110) |
|
$ |
90,515 |
|
$ |
(37,645) |
|
25
Corporate unallocated includes corporate overhead costs and certain other income and expenses, as well as loss on extinguishment of long-term debt.
The primary measure of segment operating performance is EBITDA, which is defined as net income (loss) before interest, income taxes, depreciation and amortization. EBITDA is a key metric that is used by management to evaluate business performance in comparison to budgets, forecasts, and prior year financial results, providing a measure that management believes reflects the Company’s core operating performance. EBITDA is useful for analytical purposes; however, it should not be considered an alternative to the Company’s reported GAAP results, as there are limitations in using such financial measures. Other companies in the industry may define EBITDA differently than the Company, and as a result, it may be difficult to use EBITDA, or similarly-named financial measures, that other companies may use to compare the performance of those companies to the Company’s performance.
Asset and capital expenditure information is not accounted for at the segment level and consequently is not reviewed or included with the Company’s internal management reporting. Therefore, the Company has not disclosed asset and capital expenditure information for each reportable segment.
NOTE 15—DIVESTITURES
EPS Divestiture
In June 2013, the Company’s Board of Directors approved the sale of its expandable polystyrene (“EPS”) business within the Company’s Basic Plastics & Feedstocks segment, under a sale and purchase agreement which was signed in July 2013. The sale closed on September 30, 2013, subject to a $0.7 million working capital adjustment, which was paid by the Company during the first quarter of 2014 and is reflected within investing activities in the condensed consolidated statement of cash flows for the nine months ended September 30, 2014.
Further, under the terms of the sale and purchase agreement, should the divested EPS business record EBITDA (as defined therein) greater than zero for fiscal year 2014, the Company would receive an incremental payment of €0.5 million. The EBITDA threshold was met for fiscal year 2014 and the Company received the €0.5 million payment (approximately $0.6 million based upon the applicable foreign exchange rate in the period the payment was received) during the first quarter of 2015, which is reflected within cash flows used in investing activities in the condensed consolidated statement of cash flows for the nine months ended September 30, 2015.
Livorno Land Sale
In April 2014, the Company completed the sale of a portion of land at its manufacturing site in Livorno, Italy for a purchase price of €4.95 million (approximately $6.8 million based upon the applicable foreign exchange rate in the period the payment was received). As a result, the Company recognized a gain on sale of $0.1 million within “Other expense (income), net” in the condensed consolidated statement of operations for the nine months ended September 30, 2014.
26
NOTE 16—RESTRUCTURING
Allyn’s Point Plant Shutdown
In September 2015, the Company approved the plan to close its Allyn’s Point latex manufacturing facility in Gales Ferry, Connecticut. This restructuring plan was a strategic business decision to improve the results of the overall Latex segment due to continuing declines in the coated paper industry in North America. Production at the facility is expected to cease at the end of 2015, followed by decommissioning and demolition in 2016.
For the three and nine months ended September 30, 2015, the Company recorded restructuring charges of $0.8 million relating to the accelerated depreciation of the related assets at the Allyn’s Point facility and $0.1 million of employee termination benefit charges, which are included within “Selling, general and administrative expenses” in the condensed consolidated statements of operations and were allocated entirely to the Latex segment. The employee termination benefit charges remained accrued in “Accrued expenses and other current liabilities” in the condensed consolidated balance sheet as of September 30, 2015.
The Company expects to incur approximately $6.0 million of incremental accelerated depreciation charges during the fourth quarter of 2015 and $1.0 million of incremental employee termination benefits charges during the fourth quarter of 2015 and first half of 2016 related to this restructuring. The majority of the employee termination benefit charges are expected to be paid by December 31, 2016. Lastly, the Company expects to incur decommissioning and demolition costs associated with this plant shutdown in 2016, the cost of which will be expensed as incurred, within the Latex segment. However, these costs cannot be reasonably estimated at this time.
Restructuring in Polycarbonate
During the second quarter of 2014, the Company announced a restructuring within its Basic Plastics & Feedstocks segment to exit the commodity market for polycarbonate in North America and to terminate existing arrangements with Dow regarding manufacturing services for the Company at Dow’s Freeport, Texas facility (the “Freeport facility”). The Company also entered into a new long-term supply contract with a third party to supply polycarbonate in North America. These revised arrangements became operational in the fourth quarter of 2014. In addition, the Company executed revised supply contracts for certain raw materials that were processed at its polycarbonate manufacturing facility in Stade, Germany, which took effect January 1, 2015. These revised agreements are expected to facilitate improvements in future results of operations for the Basic Plastics & Feedstocks segment. Production at the Freeport facility ceased as of September 30, 2014, and decommissioning and demolition began thereafter, with completion in the first quarter of 2015.
The Company recorded certain restructuring charges during the year ended December 31, 2014 primarily relating to the reimbursement of decommissioning and demolition costs incurred by Dow. For the three and nine months ended September 30, 2014, the Company recorded restructuring charges of $2.0 million and $3.5 million relating to the accelerated depreciation of the related assets at Dow’s Freeport, Texas facility and other charges. Of the additional charges incurred during the remainder of 2014, $4.2 million remained accrued within “Accounts payable” in the condensed consolidated balance sheet as of December 31, 2014. For the nine months ended September 30, 2015, the Company recorded the remainder of the expected restructuring charges of $0.5 million related to the reimbursement of decommissioning and demolition costs incurred by Dow, noting no charges were recorded during the three months ended September 30, 2015. These charges were included in “Selling, general and administrative expenses” in the condensed consolidated statements of operations, and were allocated entirely to the Basic Plastics & Feedstocks segment. There were no remaining amounts accrued in the condensed consolidated balance sheet as of September 30, 2015.
Altona Plant Shutdown
In July 2013, the Company’s Board of Directors approved the plan to close the Company’s latex manufacturing facility in Altona, Australia. This restructuring plan was a strategic business decision to improve the results of the overall Latex segment. The facility manufactured SB latex used in the carpet and paper markets. Production at the facility ceased in the third quarter of 2013, followed by decommissioning, with demolition throughout most of 2014.
For the year ended December 31, 2014, the Company recorded additional net restructuring charges of approximately $2.8 million, related primarily to incremental employee termination benefit charges, contract termination charges, and decommissioning costs (of which $0.7 million and $2.8 million were recorded during the three and nine
27
months ended September 30, 2014, respectively). These charges were included in “Selling, general and administrative expenses” in the condensed consolidated statements of operations, and were allocated entirely to the Latex segment. There were no additional restructuring charges recorded related to the Altona plant shutdown during the three and nine months ended September 30, 2015. Of the remaining balances as of September 30, 2015 and December 31, 2014, $1.0 million and $1.2 million, respectively, are recorded in “Accrued expenses and other current liabilities” and $0.1 million and $0.9 million, respectively, were recorded in “Other noncurrent liabilities” in the condensed consolidated balance sheet.
The following table provides a rollforward of the liability balances associated with the Altona plant shutdown for the nine months ended September 30, 2015:
|
|
|
|
|
|
|
|
|
|
|
|
|
|
|
|
|
|
Balance at |
|
|
|
|
|
|
|
Balance at |
|
||
|
|
|
December 31, 2014 |
|
Expenses |
|
Deductions(1) |
|
September 30, 2015 |
|
||||
|
Contract termination charges |
|
$ |
2,128 |
|
$ |
(42) |
|
$ |
(1,005) |
|
$ |
1,081 |
|
|
Total |
|
$ |
2,128 |
|
$ |
(42) |
|
$ |
(1,005) |
|
$ |
1,081 |
|
|
(1) |
Includes primarily payments made against existing accruals, as well as immaterial impacts of foreign currency remeasurement. |
NOTE 17—ACCUMULATED OTHER COMPREHENSIVE INCOME (LOSS)
The components of accumulated other comprehensive income (AOCI), net of income taxes, consisted of:
|
|
|
Currency |
|
Pension & Other |
|
|
Foreign Exchange |
|
|
|
|
|
||
|
|
|
Translation |
|
Postretirement Benefit |
|
|
Cash Flow |
|
|
|
|
|
||
|
Three Months Ended September 30, 2015 and 2014 |
|
Adjustments |
|
Plans, Net |
|
|
Hedges, Net |
|
|
Total |
|
|||
|
Balance at June 30, 2015 |
|
$ |
(96,669) |
|
$ |
(55,834) |
|
$ |
(405) |
|
|
$ |
(152,908) |
|
|
Other comprehensive income (loss) |
|
|
1,234 |
|
|
— |
|
|
114 |
|
|
|
1,348 |
|
|
Amounts reclassified from AOCI to net income (1) |
|
|
— |
|
|
797 |
|
|
(17) |
|
|
|
780 |
|
|
Balance at September 30, 2015 |
|
$ |
(95,435) |
|
$ |
(55,037) |
|
$ |
(308) |
|
|
$ |
(150,780) |
|
|
|
|
|
|
|
|
|
|
|
|
|
|
|
|
|
|
Balance at June 30, 2014 |
|
$ |
105,794 |
|
$ |
(27,188) |
|
$ |
— |
|
|
$ |
78,606 |
|
|
Other comprehensive income (loss) |
|
|
(84,868) |
|
|
— |
|
|
— |
|
|
|
(84,868) |
|
|
Amounts reclassified from AOCI to net income (1) |
|
|
— |
|
|
286 |
|
|
— |
|
|
|
286 |
|
|
Balance at September 30, 2014 |
|
$ |
20,926 |
|
$ |
(26,902) |
|
$ |
— |
|
|
$ |
(5,976) |
|
|
|
|
|
|
|
|
|
|
|
|
|
|
|
|
|
28
|
|
|
Currency |
|
Pension & Other |
|
|
Foreign Exchange |
|
|
|
|
|
||
|
|
|
Translation |
|
Postretirement Benefit |
|
|
Cash Flow |
|
|
|
|
|
||
|
Nine Months Ended September 30, 2015 and 2014 |
|
Adjustments |
|
Plans, Net |
|
|
Hedges, Net |
|
|
Total |
|
|||
|
Balance at December 31, 2014 |
|
$ |
(17,755) |
|
$ |
(57,462) |
|
$ |
— |
|
|
$ |
(75,217) |
|
|
Other comprehensive income (loss) |
|
|
(77,680) |
|
|
— |
|
|
(367) |
|
|
|
(78,047) |
|
|
Amounts reclassified from AOCI to net income (1) |
|
|
— |
|
|
2,425 |
|
|
59 |
|
|
|
2,484 |
|
|
Balance at September 30, 2015 |
|
$ |
(95,435) |
|
$ |
(55,037) |
|
$ |
(308) |
|
|
$ |
(150,780) |
|
|
|
|
|
|
|
|
|
|
|
|
|
|
|
|
|
|
Balance at December 31, 2013 |
|
$ |
116,146 |
|
$ |
(27,768) |
|
$ |
— |
|
|
$ |
88,378 |
|
|
Other comprehensive income (loss) |
|
|
(95,220) |
|
|
— |
|
|
— |
|
|
|
(95,220) |
|
|
Amounts reclassified from AOCI to net income (1) |
|
|
— |
|
|
866 |
|
|
— |
|
|
|
866 |
|
|
Balance at September 30, 2014 |
|
$ |
20,926 |
|
$ |
(26,902) |
|
$ |
— |
|
|
$ |
(5,976) |
|
____________
|
(1) |
The following is a summary of amounts reclassified from AOCI to net income for the three and nine months ended September 30, 2015 and 2014, respectively: |
|
|
|
Amount Reclassified from AOCI |
|
Amount Reclassified from AOCI |
|
|
|
||||||||
|
AOCI Components |
|
Three Months Ended September 30, |
|
Nine Months Ended September 30, |
|
Statement of Operations |
|
||||||||
|
|
|
2015 |
|
2014 |
|
2015 |
|
2014 |
|
Classification |
|
||||
|
Cash flow hedging items |
|
|
|
|
|
|
|
|
|
|
|
|
|
|
|
|
Foreign exchange cash flow hedges |
|
$ |
(17) |
|
$ |
— |
|
$ |
59 |
|
$ |
— |
|
Cost of sales |
|
|
Total before tax |
|
|
(17) |
|
|
— |
|
|
59 |
|
|
— |
|
|
|
|
Tax effect |
|
|
— |
|
|
— |
|
|
— |
|
|
— |
|
Provision for income taxes |
|
|
Total, net of tax |
|
$ |
(17) |
|
$ |
— |
|
$ |
59 |
|
$ |
— |
|
|
|
|
|
|
|
|
|
|
|
|
|
|
|
|
|
|
|
|
|
Amortization of pension and other postretirement benefit plan items |
|
|
|
|
|
|
|
|
|
|
|
|
|
|
|
|
Prior service credit |
|
$ |
(380) |
|
$ |
(227) |
|
$ |
(1,153) |
|
$ |
(689) |
|
(a) |
|
|
Net actuarial loss |
|
|
1,530 |
|
|
663 |
|
|
4,627 |
|
|
2,012 |
|
(a) |
|
|
Total before tax |
|
|
1,150 |
|
|
436 |
|
|
3,474 |
|
|
1,323 |
|
|
|
|
Tax effect |
|
|
(353) |
|
|
(150) |
|
|
(1,049) |
|
|
(457) |
|
Provision for income taxes |
|
|
Total, net of tax |
|
$ |
797 |
|
$ |
286 |
|
$ |
2,425 |
|
$ |
866 |
|
|
|
____________
|
(a) |
These AOCI components are included in the computation of net periodic benefit costs (see Note 11). |
NOTE 18—EARNINGS (LOSS) PER SHARE
Basic earnings (loss) per share (“basic EPS”) is computed by dividing net income (loss) available to common shareholders by the weighted average number of the Company’s common shares outstanding for the applicable period. Diluted earnings (loss) per share (“diluted EPS”) is calculated using net income (loss) available to common shareholders divided by diluted weighted-average shares of common shares outstanding during each period, which includes unvested RSUs and stock option awards. Diluted EPS considers the impact of potentially dilutive securities except in periods in which there is a loss because the inclusion of the potential common shares would have an anti-dilutive effect.
29
The following table presents basic EPS and diluted EPS for the three and nine months ended September 30, 2015 and 2014, respectively.
|
|
|
Three Months Ended |
|
Nine Months Ended |
|
||||||||
|
|
|
September 30, |
|
September 30, |
|
||||||||
|
(in thousands, except per share data) |
|
2015 |
|
2014 |
|
2015 |
|
2014 |
|
||||
|
Earnings (losses): |
|
|
|
|
|
|
|
|
|
|
|
|
|
|
Net income (loss) |
|
$ |
52,055 |
|
$ |
(10,110) |
|
$ |
90,515 |
|
$ |
(37,645) |
|
|
Shares: |
|
|
|
|
|
|
|
|
|
|
|
|
|
|
Weighted-average common shares outstanding |
|
|
48,778 |
|
|
48,770 |
|
|
48,773 |
|
|
41,693 |
|
|
Dilutive effect of RSUs and option awards* |
|
|
211 |
|
|
— |
|
|
163 |
|
|
— |
|
|
Diluted weighted-average shares outstanding |
|
|
48,989 |
|
|
48,770 |
|
|
48,936 |
|
|
41,693 |
|
|
Income (loss) per share: |
|
|
|
|
|
|
|
|
|
|
|
|
|
|
Income (loss) per share—basic |
|
$ |
1.07 |
|
$ |
(0.21) |
|
$ |
1.86 |
|
$ |
(0.90) |
|
|
Income (loss) per share—diluted |
|
$ |
1.06 |
|
$ |
(0.21) |
|
$ |
1.85 |
|
$ |
(0.90) |
|
* Refer to Note 12 for discussion of RSUs and option awards granted to certain Company directors and employees. As net loss was reported for the three and nine months ended September 30, 2014, potentially dilutive awards were not included within the calculation of diluted EPS for those periods, as they would have an anti-dilutive effect.
30
Item 2. Management’s Discussion and Analysis of Financial Condition and Results of Operations
Overview
We are a leading global materials company engaged in the manufacture and marketing of synthetic rubber, latex, and plastics, including various specialty and technologically differentiated products. We have leading market positions in many of the markets in which we compete. We believe we have developed these strong market positions due to our technological differentiation, diverse global manufacturing base, long-standing customer relationships, commitment to sustainable solutions and competitive cost positions. We believe that growth in overall consumer spending and construction activity, increased demand in the automotive industry for higher fuel efficiency and lighter-weight materials, and improving living standards in emerging markets will result in growth in the global markets in which we compete. In addition, we believe our increasing business presence in developing regions such as China, Southeast Asia, and Eastern Europe further enhances our prospects.
We develop synthetic rubber, latex, and plastics products that are incorporated into a wide range of our customers’ products throughout the world, including tires and other products for automotive applications, carpet and artificial turf backing, coated paper and packaging board, food service packaging, appliances, medical devices, consumer electronics and construction applications, among others. We seek to regularly develop new and improved products and processes, supported by our intellectual property portfolio, designed to enhance our customers’ product offerings. We have long-standing relationships with a diverse base of global customers, many of whom are leaders in their markets and rely on us for formulation, technological differentiation, and compounding expertise to find sustainable solutions for their businesses. Many of our products represent only a small portion of a finished product’s production costs, but provide critical functionality to the finished product and are often specifically developed to customer specifications. We believe these product traits result in substantial customer loyalty for our products.
Until January 1, 2015, we operated in four reporting segments: Latex, Synthetic Rubber, Styrenics and Engineered Polymers. Effective January 1, 2015, we reorganized our business under two new divisions called Performance Materials and Basic Plastics & Feedstocks. The Performance Materials division now includes the following reporting segments: Synthetic Rubber, Latex, and Performance Plastics. The Basic Plastics & Feedstocks division represents a separate segment for financial reporting purposes and includes styrenic polymers, polycarbonate, or PC, and styrene monomer. In addition, the Basic Plastics & Feedstocks division includes the results of our two 50%-owned joint ventures, Americas Styrenics LLC, or Americas Styrenics, and Sumika Styron Polycarbonate Limited, or Sumika Styron Polycarbonate. The following chart provides an overview of our new organizational structure.
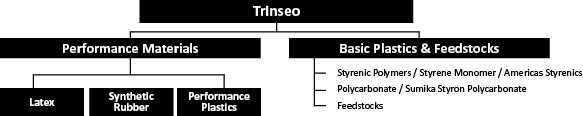
We believe that this new organizational structure better reflects the nature of our Company by grouping together segments with similar strategies, business drivers and operating characteristics. Our two new divisions are of similar size in terms of sales, but have different margin profiles, different strategic focus, different value drivers and different operating requirements. By organizing the Company in this way, we believe that we can manage and operate more effectively in order to accelerate the growth of our Performance Materials division and improve the profitability of our Basic Plastics & Feedstocks division. We also believe that this new organizational structure allows our investors to better understand the drivers of our business.
Prior period financial information included within this Quarterly Report has been recast from its previous presentation to reflect the Company’s new organizational structure.
Our major products include: styrene-butadiene latex, or SB latex, and styrene-acrylate latex, or SA latex, in our Latex segment; solution styrene-butadiene rubber, or SSBR, lithium polybutadiene rubber, or Li-PBR, emulsion styrene-
31
butadiene rubber, or ESBR, and nickel polybutadiene rubber, or Ni-PBR, in our Synthetic Rubber segment; highly engineered compounds and blends products for automotive end markets, as well as consumer electronics, medical, and lighting, which we collectively call consumer essential markets (CEM) in our Performance Plastics segment; and PC, polystyrene, acrylonitrile-butadiene styrene, or ABS, and styrene-acrylonitrile, or SAN, in our Basic Plastics & Feedstocks segment.
2015 Year-to-Date Highlights
Name Change and Rebranding
In the first quarter of 2015, we completed a rebranding process to change our operating name and legal entities from “Styron” to “Trinseo.” We believe that this new name reflects our breadth as a company with broad global reach and a diverse portfolio of materials and technologies. We believe Trinseo captures our commitment to deliver innovative and sustainable materials that provide value to our customers’ products.
Debt Refinancing
On May 5, 2015, the Issuers executed an indenture pursuant to which it issued $300.0 million aggregate principal amount of 6.750% senior notes due May 1, 2022 and €375.0 million aggregate principal amount of 6.375% senior notes due May 1, 2022.
Also on May 5, 2015, the Borrowers entered into a senior secured credit agreement, which provides senior secured financing of up to $825.0 million. This facility provides for senior secured financing consisting of a (i) $325.0 revolving credit facility, with a $25.0 million swingline subfacility and a $35.0 million letter of credit subfacility maturing in May 2020 and (ii) $500.0 million senior secured term loan B facility maturing in November 2021. The term loan B bears an interest rate of LIBOR plus 3.25%, subject to a 1.00% LIBOR floor, and was issued at a 0.25% original issue discount.
On May 13, 2015, the net proceeds from these borrowings and available cash were used to repay all outstanding indebtedness under the Issuers’ 2019 Senior Notes totaling $1,192.5 million, together with a call premium of $68.6 million and accrued and unpaid interest thereon of $29.6 million.
This new capital structure is expected to reduce the Company’s annual interest expense by approximately $37.0 million.
Allyn’s Point Plant Shutdown
In September 2015, the Company announced its plan to close its Allyn’s Point latex manufacturing facility in Gales Ferry, Connecticut, due to continuing declines in the coated paper industry in North America. This plan is part of a program to reduce costs in the business by a $5.0 million run rate in 2016. Production at the facility is expected to cease at the end of 2015, followed by decommissioning and demolition in 2016.
Leadership Changes
In October 2015, the Company announced that Martin Pugh, Senior Vice President and Business President for Performance Materials, has been named Executive Vice President and Chief Operating Officer of Trinseo effective November 1, 2015. The Company also announced that Tim Stedman will join Trinseo as Senior Vice President and Business President, Basic Plastics and Feedstocks and Hayati Yarkadas will join Trinseo as Senior Vice President and Business President, Performance Materials, both effective November 1, 2015.
32
Results of Operations
Results of Operations for the Three and Nine Months Ended September 30, 2015 and 2014
The tables below set forth our historical results of operations, and these results as a percentage of net sales for the periods indicated:
|
|
|
|
|
|
|
|
|
|
|
|
|
|
|
|
|
|
|
Three Months Ended |
|
Nine Months Ended |
|
|
||||||||
|
|
|
September 30, |
|
September 30, |
|
|
||||||||
|
(in millions) |
|
2015 |
|
2014 |
|
2015 |
|
2014 |
|
|
||||
|
Net sales |
|
$ |
1,028.0 |
|
$ |
1,305.5 |
|
$ |
3,074.9 |
|
$ |
4,005.6 |
|
|
|
Cost of sales |
|
|
916.4 |
|
|
1,237.3 |
|
|
2,718.1 |
|
|
3,746.3 |
|
|
|
Gross profit |
|
|
111.6 |
|
|
68.2 |
|
|
356.8 |
|
|
259.3 |
|
|
|
Selling, general and administrative expenses |
|
|
51.1 |
|
|
48.1 |
|
|
153.6 |
|
|
172.4 |
|
|
|
Equity in earnings of unconsolidated affiliates |
|
|
33.5 |
|
|
9.3 |
|
|
111.0 |
|
|
29.6 |
|
|
|
Operating income |
|
|
94.0 |
|
|
29.4 |
|
|
314.2 |
|
|
116.5 |
|
|
|
Interest expense, net |
|
|
19.5 |
|
|
30.1 |
|
|
73.9 |
|
|
95.5 |
|
|
|
Loss on extinguishment of long-term debt |
|
|
— |
|
|
7.4 |
|
|
95.2 |
|
|
7.4 |
|
|
|
Other expense (income), net |
|
|
1.2 |
|
|
(1.7) |
|
|
8.0 |
|
|
29.3 |
|
|
|
Income (loss) before income taxes |
|
|
73.3 |
|
|
(6.4) |
|
|
137.1 |
|
|
(15.7) |
|
|
|
Provision for income taxes |
|
|
21.2 |
|
|
3.7 |
|
|
46.6 |
|
|
21.9 |
|
|
|
Net income (loss) |
|
$ |
52.1 |
|
$ |
(10.1) |
|
$ |
90.5 |
|
$ |
(37.6) |
|
|
|
|
|
|
|
|
|
|
|
|
|
|
|
|
|
|
|
|
|
|
Three Months Ended |
|
|
Nine Months Ended |
|
|
||||||
|
|
|
|
September 30, |
|
|
September 30, |
|
|
||||||
|
|
|
|
2015 |
|
|
2014 |
|
|
2015 |
|
|
2014 |
|
|
|
Net sales |
|
|
100.0 |
% |
|
100.0 |
% |
|
100.0 |
% |
|
100.0 |
% |
|
|
Cost of sales |
|
|
89.1 |
% |
|
94.8 |
% |
|
88.4 |
% |
|
93.5 |
% |
|
|
Gross profit |
|
|
10.9 |
% |
|
5.2 |
% |
|
11.6 |
% |
|
6.5 |
% |
|
|
Selling, general and administrative expenses |
|
|
5.0 |
% |
|
3.7 |
% |
|
5.0 |
% |
|
4.3 |
% |
|
|
Equity in earnings of unconsolidated affiliates |
|
|
3.3 |
% |
|
0.7 |
% |
|
3.6 |
% |
|
0.7 |
% |
|
|
Operating income |
|
|
9.2 |
% |
|
2.2 |
% |
|
10.2 |
% |
|
2.9 |
% |
|
|
Interest expense, net |
|
|
1.9 |
% |
|
2.3 |
% |
|
2.4 |
% |
|
2.4 |
% |
|
|
Loss on extinguishment of long-term debt |
|
|
— |
% |
|
0.6 |
% |
|
3.1 |
% |
|
0.2 |
% |
|
|
Other expense (income), net |
|
|
0.1 |
% |
|
(0.1) |
% |
|
0.3 |
% |
|
0.7 |
% |
|
|
Income (loss) before income taxes |
|
|
7.2 |
% |
|
(0.6) |
% |
|
4.4 |
% |
|
(0.4) |
% |
|
|
Provision for income taxes |
|
|
2.1 |
% |
|
0.3 |
% |
|
1.5 |
% |
|
0.5 |
% |
|
|
Net income (loss) |
|
|
5.1 |
% |
|
(0.9) |
% |
|
2.9 |
% |
|
(0.9) |
% |
|
Three Months Ended September 30, 2015 Compared to the Three Months Ended September 30, 2014
Net Sales
Net sales for the three months ended September 30, 2015 decreased by $277.5 million, or 21.3%, to $1,028.0 million from $1,305.5 million for the three months ended September 30, 2014. Of the 21.3% decrease, 13.5% was due to lower selling prices primarily due to the pass through of lower butadiene costs to our customers in Latex and Synthetic Rubber and lower styrene monomer costs to our customers in Latex and Basic Plastics & Feedstocks. In addition, 8.2% of the decrease was related to an unfavorable currency impact across our segments, as the U.S. dollar strengthened compared to the euro. Partially offsetting these decreases was a 0.5% increase in sales volume. This increase was
33
primarily due to higher sales volumes in Synthetic Rubber, partially offset by unfavorable volume impacts across our remaining segments.
Cost of Sales
Cost of sales for the three months ended September 30, 2015 decreased by $320.9 million, or 25.9%, to $916.4 million from $1,237.3 million for the three months ended September 30, 2014. Of the 25.9% decrease, 18.2% was attributable to lower prices for raw materials, primarily butadiene and styrene monomer, while an additional 7.6% of the decrease was due to a favorable currency impact across our segments, as the U.S. dollar strengthened compared to the euro. In addition, 0.2% of the decrease was due to sales volume mix.
Gross Profit
Gross profit for the three months ended September 30, 2015 increased by $43.4 million, or 63.6%, to $111.6 million from $68.2 million for the three months ended September 30, 2014. The increase was primarily attributable to higher styrene monomer margins as well as higher polycarbonate margins due to our restructuring efforts and improved market dynamics. In addition, sales volumes were higher in Synthetic Rubber, partially offset by unfavorable volume impacts across our remaining segments. These impacts were partially offset by an unfavorable currency impact, as the U.S. dollar strengthened compared to the euro.
Selling, General and Administrative Expenses
SG&A expenses for the three months ended September 30, 2015 increased by $3.0 million, or 6.2%, to $51.1 million from $48.1 million for the three months ended September 30, 2014. The increase in SG&A expenses was primarily related higher employee benefit costs, partially offset by a $1.7 million decrease in costs related to the process of changing our corporate name from Styron to Trinseo, as well as a $2.0 million decrease in restructuring charges. Refer to Note 16 in the condensed consolidated financial statements for further details regarding these restructuring charges.
Equity in Earnings of Unconsolidated Affiliates
Equity in earnings of unconsolidated affiliates for the three months ended September 30, 2015 was $33.5 million compared to equity in earnings of $9.3 million for the three months ended September 30, 2014. The majority of this increase was attributable to Americas Styrenics, the equity earnings from which increased to $32.2 million from $10.9 million, driven by higher styrene and polystyrene margins. Sumika Styron Polycarbonate noted equity earnings of $1.3 million for the period compared to equity losses of $1.6 million in the prior year, noting improved polycarbonate market conditions.
Interest Expense, Net
Interest expense, net for the three months ended September 30, 2015 was $19.5 million compared to $30.1 million for the three months ended September 30, 2014. This decrease in interest expense was primarily attributable to the impact of the debt refinancing executed in May 2015. Refer to Note 6 in the condensed consolidated financial statements for further details of this refinancing.
Loss on Extinguishment of Long-Term Debt
There was no loss on extinguishment of long-term debt for the three months ended September 30, 2015; whereas, loss on extinguishment of long-term debt was $7.4 million for the three months ended September 30, 2014 related to the redemption of $132.5 million in aggregate principal amount of the Senior Notes in July 2014, using the proceeds from the Company’s IPO. This loss was comprised of a $4.0 million call premium and a $3.4 million write-off of related unamortized debt issuance costs.
Other Expense (Income), net
Other expense, net for the three months ended September 30, 2015 was $1.2 million, which consisted primarily of net foreign exchange transaction losses of approximately $2.2 million, partially offset by other miscellaneous income.
34
During the third quarter of 2015, the Company recorded foreign exchange transaction losses of $6.7 million primarily driven by the remeasurement of our euro denominated payables due to the relative changes in rates between the U.S. dollar and the euro during the quarter. Separately, the Company entered into foreign exchange forward contracts, which recorded related gains of approximately $4.5 million, largely offsetting the above described losses.
Other income, net for the three months ended September 30, 2014 was $1.7 million, which consisted primarily of $2.2 million of net foreign exchange transaction gains, partially offset by other expenses. During the third quarter of 2014, the Company recorded foreign exchange transaction gains of $21.8 million primarily driven by the remeasurement of our euro denominated payables due to the strengthening of the U.S. dollar against the euro during the quarter. Separately, beginning in the third quarter, the Company entered into foreign exchange forward contracts and recorded related losses of approximately $19.5 million, largely offsetting the above described gains.
Provision for Income Taxes
Provision for income taxes for the three months ended September 30, 2015 was $21.2 million, resulting in an effective tax rate of 28.9%. Provision for income taxes for the three months ended September 30, 2014 was $3.7 million, resulting in a negative effective tax rate of 56.5%.
The increase in provision for income taxes was primarily driven by the $79.7 million increase in income before income taxes, from a loss of $6.5 million for the three months ended September 30, 2014 to $73.3 million of income for the three months ended September 30, 2015.
This increase in the provision for income taxes was offset by a reduction of losses generated within our holding companies incorporated in Luxembourg, which are not anticipated to provide a tax benefit to the Company in the future. For the three months ended September 30, 2015, these losses totaled approximately $12.9 million, primarily composed of non-deductible interest and stock-based compensation expense.
Comparatively, for the three months ended September 30, 2014, losses primarily within our holding companies incorporated in Luxembourg, which are not anticipated to provide a tax benefit to the Company in the future, were approximately $22.6 million, also primarily composed of non-deductible interest and stock-based compensation expense. The decrease from 2014 to 2015 in these expenses is attributable primarily to our May 2015 debt refinancing, which resulted in a reduction of interest expense in 2015 (see Note 6 in the condensed consolidated financial statements for further discussion).
Nine Months September 30, 2015 Compared to the Nine Months Ended September 30, 2014
Net Sales
Net sales for the nine months ended September 30, 2015 decreased by $930.7 million, or 23.2%, to $3,074.9 million from $4,005.6 million for the nine months ended September 30, 2014. Of the 23.2% decrease, 17.0% was due to lower selling prices primarily due to the pass through of lower butadiene costs to our customers in Latex and Synthetic Rubber and lower styrene monomer costs to our customers in Latex and Basic Plastics & Feedstocks. In addition, 8.1% of the decrease was related to an unfavorable currency impact across our segments, as the U.S. dollar strengthened compared to the euro. Partially offsetting these decreases was a 1.9% increase due to higher sales volumes across our Latex, Synthetic Rubber and Performance Plastics segments.
Cost of Sales
Cost of sales for the nine months ended September 30, 2015 decreased by $1,028.2 million, or 27.4%, to $2,718.1 million from $3,746.3 million for the nine months ended September 30, 2014. Of the 27.4% decrease, 21.3% was attributable to lower prices for raw materials, primarily butadiene and styrene monomer, while an additional 7.6% of the decrease was due to a favorable currency impact across our segments, as the U.S. dollar strengthened compared to the euro. Partially offsetting these decreases was a 1.5% increase due to higher sales volumes across our Latex, Synthetic Rubber and Performance plastics segments.
35
Gross Profit
Gross profit for the nine months ended September 30, 2015 increased by $97.5 million, or 37.6%, to $356.8 million from $259.3 million for the nine months ended September 30, 2014. The increase was primarily attributable to higher styrene monomer margins as well as higher polycarbonate margins due to our restructuring efforts and improved market dynamics. These impacts were partially offset by an unfavorable currency impact, as the U.S. dollar strengthened compared to the euro.
Selling, General and Administrative Expenses
SG&A expenses for the nine months ended September 30, 2015 decreased by $18.8 million, or 10.9%, to $153.6 million from $172.4 million for the nine months ended September 30, 2014. The decrease in SG&A expenses was primarily related to $23.3 million in termination fees incurred in the second quarter of 2014 related to the Advisory Agreement with Bain which we terminated upon consummation of the IPO in June 2014. In addition, the Company incurred lower restructuring charges for the nine months ended September 30, 2015 of $1.9 million, compared to charges of $7.2 million for the nine months ended September 30, 2014. Refer to Note 16 in the condensed consolidated financial statements for further details. These decreases were partially offset by increased costs related to other employee benefit costs.
Equity in Earnings of Unconsolidated Affiliates
Equity in earnings of unconsolidated affiliates for the nine months ended September 30, 2015 was $111.0 million compared to equity in earnings of $29.6 million for the nine months ended September 30, 2014. The majority of this increase was attributable to Americas Styrenics, the equity earnings from which increased to $108.0 million from $33.2 million, driven by higher styrene and polystyrene margins, and from higher volumes of styrene monomer sold. Sumika Styron Polycarbonate had equity earnings of $3.0 million for the period compared to equity losses of $3.6 million in the prior year, noting improved polycarbonate market conditions.
Interest Expense, Net
Interest expense, net for the nine months ended September 30, 2015 was $73.9 million compared to $95.5 million for the nine months ended September 30, 2014. This decrease in interest expense was primarily attributable to the impact of the debt refinancing in May 2015 as well as the redemption of $132.5 million in aggregate principal amount of the Senior Notes in July 2014. Refer to Note 6 in the condensed consolidated financial statements for further details.
Loss on Extinguishment of Long-Term Debt
Loss on extinguishment of long-term debt was $95.2 million for the nine months ended September 30, 2015, related to the debt refinancing in May 2015. This amount was comprised of a $68.6 million call premium paid to retire the Company’s 8.750% Senior Secured Notes due 2019 and a $25.9 million write-off of unamortized deferred financing fees related to these notes, as well as the write-off of $0.7 million of unamortized deferred financing fees related to the termination of the Company’s revolving facility.
Loss on extinguishment of long-term debt was $7.4 million for the nine months ended September 30, 2014, related to the redemption of $132.5 million in aggregate principal amount of the Senior Notes in July 2014, using proceeds from the Company’s IPO. This loss was comprised of a $4.0 million call premium and a $3.4 million write-off of related unamortized debt issuance costs.
Other Expense (Income), net
Other expense, net for the nine months ended September 30, 2015 was $8.0 million, which consisted primarily of net foreign exchange transaction losses of approximately $8.3 million, partially offset by other miscellaneous income of $0.3 million. Through the third quarter of 2015, the Company recorded foreign exchange transaction gains of $0.9 million primarily driven by the remeasurement of our euro denominated payables due to the strengthening of the U.S. dollar against the euro during the period. Separately, the Company entered into foreign exchange forward contracts, which recorded related losses of approximately $9.2 million during the period, offsetting the above described gains.
36
Other expense, net in the nine months ended September 30, 2014 was $29.3 million, which included a $32.5 million termination payment made to Dow in connection with the termination of the Latex JV Option Agreement as discussed in Note 13 in the condensed consolidated financial statements, slightly offset by net foreign exchange transaction gains of $3.9 million. Through the third quarter of 2014, the Company recorded foreign exchange transaction gains of $23.4 million primarily driven by the remeasurement of our euro denominated payables due to the strengthening of the U.S. dollar against the euro during the period. Separately, the Company entered into foreign exchange forward contracts, which recorded related losses of approximately $19.5 million during the period, largely offsetting the above described gains.
Provision for Income Taxes
Provision for income taxes for the nine months ended September 30, 2015 was $46.6 million, resulting in an effective tax rate of 34.0%. Provision for income taxes for the nine months ended September 30, 2014 was $21.9 million, resulting in a negative effective tax rate of 138.3%.
The increase in provision for income taxes was primarily driven by the $152.9 million increase in income before income taxes, from a loss of $15.8 million for the nine months ended September 30, 2014 to $137.1 million of income for the nine months ended September 30, 2015.
This increase in the provision for income taxes was offset by a reduction of losses generated within our holding companies incorporated in Luxembourg, which are not anticipated to provide a tax benefit to the Company in the future. For the nine months ended September 30, 2015, these losses totaled approximately $73.5 million. Included in these losses were payments made during the nine months ended September 30, 2015 of $18.6 million related to a portion of the fees associated with the call premium paid to retire the Company’s 2019 Senior Notes and $5.6 million related to the write off of the related unamortized deferred financing fees (see Note 6 in the condensed consolidated financial statements for further discussion). Also included in these losses was non-deductible interest and stock-based compensation expense.
For the nine months ended September 30, 2014, losses primarily within our holding companies incorporated in Luxembourg, which are not anticipated to provide a tax benefit to the Company in the future, were approximately $119.8 million. Included in these losses were payments made during the nine months ended September 30, 2014 of $32.5 million related to an agreement with Dow to terminate the Latex JV Option Agreement and a portion of the fees related to the termination of the Advisory Agreement with Bain Capital of approximately $18.6 million (see Note 13 in the condensed consolidated financial statements for further discussion). Also included in these losses was non-deductible interest and stock-based compensation expense.
Selected Segment Information
The following tables present net sales and EBITDA by segment and as a percentage of total net sales and net sales
37
by segment, respectively, for the following periods:
|
|
|
Three Months Ended |
|
Nine Months Ended |
|||||||||
|
|
|
September 30, |
|
September 30, |
|||||||||
|
(in millions) |
|
2015 |
|
2014 |
|
2015 |
|
2014 |
|
||||
|
Net sales(1) |
|
|
|
|
|
|
|
|
|
|
|
|
|
|
Latex segment |
|
$ |
254.9 |
|
$ |
328.4 |
|
$ |
740.7 |
|
$ |
975.4 |
|
|
Synthetic Rubber segment |
|
|
126.0 |
|
|
155.5 |
|
|
370.7 |
|
|
497.1 |
|
|
Performance Plastics segment |
|
|
179.9 |
|
|
207.6 |
|
|
562.1 |
|
|
619.5 |
|
|
Basic Plastics & Feedstocks segment |
|
|
467.2 |
|
|
614.0 |
|
|
1,401.4 |
|
|
1,913.6 |
|
|
Corporate unallocated(2) |
|
|
— |
|
|
— |
|
|
— |
|
|
— |
|
|
Total |
|
$ |
1,028.0 |
|
$ |
1,305.5 |
|
$ |
3,074.9 |
|
$ |
4,005.6 |
|
|
EBITDA(3) |
|
|
|
|
|
|
|
|
|
|
|
|
|
|
Latex segment |
|
$ |
24.3 |
|
$ |
25.4 |
|
$ |
60.7 |
|
$ |
75.7 |
|
|
Synthetic Rubber segment |
|
|
27.4 |
|
|
26.6 |
|
|
72.0 |
|
|
106.7 |
|
|
Performance Plastics segment |
|
|
14.5 |
|
|
19.2 |
|
|
60.9 |
|
|
53.3 |
|
|
Basic Plastics & Feedstocks segment |
|
|
70.2 |
|
|
4.2 |
|
|
251.4 |
|
|
42.4 |
|
|
Corporate unallocated(2) |
|
|
(20.6) |
|
|
(23.9) |
|
|
(166.7) |
|
|
(119.6) |
|
|
Total |
|
$ |
115.8 |
|
$ |
51.5 |
|
$ |
278.3 |
|
$ |
158.5 |
|
|
|
|
|
Three Months Ended |
|
|
Nine Months Ended |
|||||||
|
|
|
|
September 30, |
|
|
September 30, |
|||||||
|
|
|
|
2015 |
|
|
2014 |
|
|
2015 |
|
|
2014 |
|
|
Net sales(1) |
|
|
|
|
|
|
|
|
|
|
|
|
|
|
Latex segment |
|
|
24.8 |
% |
|
25.2 |
% |
|
24.1 |
% |
|
24.4 |
% |
|
Synthetic Rubber segment |
|
|
12.3 |
% |
|
11.9 |
% |
|
12.1 |
% |
|
12.4 |
% |
|
Performance Plastics segment |
|
|
17.5 |
% |
|
15.9 |
% |
|
18.3 |
% |
|
15.5 |
% |
|
Basic Plastics & Feedstocks segment |
|
|
45.4 |
% |
|
47.0 |
% |
|
45.5 |
% |
|
47.7 |
% |
|
Corporate unallocated(2) |
|
|
— |
% |
|
— |
% |
|
— |
% |
|
— |
% |
|
Total |
|
|
100.0 |
% |
|
100.0 |
% |
|
100.0 |
% |
|
100.0 |
% |
|
EBITDA(3) |
|
|
|
|
|
|
|
|
|
|
|
|
|
|
Latex segment |
|
|
9.5 |
% |
|
7.7 |
% |
|
8.2 |
% |
|
7.8 |
% |
|
Synthetic Rubber segment |
|
|
21.7 |
% |
|
17.1 |
% |
|
19.4 |
% |
|
21.5 |
% |
|
Performance Plastics segment |
|
|
8.1 |
% |
|
9.2 |
% |
|
10.8 |
% |
|
8.6 |
% |
|
Basic Plastics & Feedstocks segment |
|
|
15.0 |
% |
|
0.7 |
% |
|
17.9 |
% |
|
2.2 |
% |
|
Corporate unallocated(2) |
|
|
(2.0) |
% |
|
(1.8) |
% |
|
(5.4) |
% |
|
(3.0) |
% |
|
Total |
|
|
11.3 |
% |
|
3.9 |
% |
|
9.1 |
% |
|
4.0 |
% |
|
(1) |
Inter-segment sales have been eliminated. |
|
(2) |
Corporate unallocated includes corporate overhead costs, loss on extinguishment of long-term debt, and certain other income and expenses. Percentages for corporate unallocated are based on total sales. |
|
(3) |
EBITDA is a non-GAAP financial measure that we refer to in making operating decisions because we believe it provides meaningful supplemental information regarding our operational performance. We present EBITDA because we believe that it is useful for investors to analyze disclosures of our operating results on the same basis as those used by our management. We believe the use of EBITDA as a metric assists our Board of Directors, management and investors in comparing our operating performance on a consistent basis because it removes the impact of our capital structure (such as interest expense), asset base (such as depreciation and amortization) and tax structure. See a reconciliation of net income (loss) to EBITDA below: |
38
|
|
|
Three Months Ended |
|
Nine Months Ended |
|
||||||||
|
|
|
September 30, |
|
September 30, |
|
||||||||
|
(in millions) |
|
2015 |
|
2014 |
|
2015 |
|
2014 |
|
||||
|
Net income (loss) |
|
$ |
52.1 |
|
$ |
(10.1) |
|
$ |
90.5 |
|
$ |
(37.6) |
|
|
Interest expense, net |
|
|
19.5 |
|
|
30.1 |
|
|
73.9 |
|
|
95.5 |
|
|
Provision for income taxes |
|
|
21.2 |
|
|
3.7 |
|
|
46.6 |
|
|
21.9 |
|
|
Depreciation and amortization |
|
|
23.0 |
|
|
27.8 |
|
|
67.3 |
|
|
78.7 |
|
|
EBITDA |
|
$ |
115.8 |
|
$ |
51.5 |
|
$ |
278.3 |
|
$ |
158.5 |
|
There are limitations to using financial measures such as EBITDA. Other companies in our industry may define EBITDA differently than we do. As a result, it may be difficult to use EBITDA, or similarly-named financial measures that other companies may use, to compare the performance of those companies to our performance. We compensate for these limitations by providing reconciliations of our EBITDA results to our net income (loss), which is determined in accordance with GAAP.
Latex Segment
We are a global leader in SB latex, holding a strong market position across the geographies and applications in which we compete, including the #1 position in SB latex in Europe and the #2 position in North America. We produce SB latex primarily for coated paper used in advertising and magazines, packaging board coatings, carpet and artificial turf backings, as well as a number of performance latex applications. For the nine months ended September 30, 2015, approximately half of our Latex segment’s net sales were generated in Europe, approximately 25% were generated in the United States and the majority of the remaining sales were generated in Asia.
Three Months Ended September 30, 2015 Compared to the Three Months Ended September 30, 2014
Net sales for the three months ended September 30, 2015 decreased by $73.5 million, or 22.4%, to $254.9 million from $328.4 million for the three months ended September 30, 2014. Of the 22.4% decrease in net sales, 15.6% was due to lower selling prices primarily due to the pass through of lower butadiene and styrene costs to our customers and 6.0% was due to an unfavorable currency impact as the U.S. dollar strengthened compared to the euro. In addition, 0.7% of the decrease was due to decreased sales volume.
EBITDA for the three months ended September 30, 2015 decreased by $1.1 million, or 4.3%, to $24.3 million from $25.4 million for the three months ended September 30, 2014. Of this 4.3% decrease, 6.1% was driven by increased fixed costs and 5.5% was driven by an unfavorable currency impact as the U.S. dollar strengthened compared to the euro. In addition, 2.2% of the decrease was due to decreased sales volume, driven by lower sales in North America and Asia. Partially offsetting these decreases was a 10.2% increase from higher margins, due primarily to decreasing raw material costs.
Nine Months Ended September 30, 2015 Compared to the Nine Months Ended September 30, 2014
Net sales for the nine months ended September 30, 2015 decreased by $234.7 million, or 24.1%, to $740.7 million from $975.4 million for the nine months ended September 30, 2014. Of the 24.1% decrease in net sales, 20.4% was due lower selling prices primarily due to the pass through of lower butadiene and styrene costs to our customers and 5.9% was due to an unfavorable currency impact as the U.S. dollar strengthened compared to the euro. These decreases were slightly offset by a 2.3% increase from higher sales volume driven by higher sales to the Europe paper and carpet markets.
EBITDA for the nine months ended September 30, 2015 decreased by $15.0 million, or 19.8%, to $60.7 million from $75.7 million for the nine months ended September 30, 2014. Of this 19.8% decrease, 17.8% was driven by lower margins, primarily in Europe, and 3.7% was driven by unfavorable currency impact as the U.S. dollar strengthened compared to the euro. In addition, 3.4% of the decrease was due to increased fixed costs. Partially offsetting these decreases was a 5.4% increase in sales volume primarily related to increased sales to the Europe paper and carpet markets.
39
Synthetic Rubber Segment
We are a significant producer of styrene-butadiene and polybutadiene-based rubber products and we have a leading European market position in SSBR. While 100% of our sales were generated in Europe for the nine months ended September 30, 2015, approximately 19% of these net sales were exported to Asia, 7% to Latin America and 9% to North America.
We have a broad synthetic rubber technology and product portfolio, focusing on specialty products, such as SSBR and Li-PBR, while also producing core products, such as ESBR and Ni-PBR. Our synthetic rubber products are extensively used in tires, with approximately 85% of our net sales from this segment in 2014 attributable to the tire market. We estimate that three quarters of these sales relate to replacement tires. We have strong relationships with many of the top global tire manufacturers and believe we have remained a supplier of choice as a result of our broad rubber portfolio and ability to offer technologically differentiated product and product customization capabilities. Other applications for our synthetic rubber products include polymer modification and technical rubber goods.
Three Months Ended September 30, 2015 Compared to the Three Months Ended September 30, 2014
Net sales for the three months ended September 30, 2015 decreased by $29.5 million, or 19.0%, to $126.0 million from $155.5 million for the three months ended September 30, 2014. Of the 19.0% decrease in net sales, 18.5% was due to lower selling prices primarily resulting from the pass through of lower butadiene and styrene costs to customers and 13.1% was due to an unfavorable currency impact as the U.S. dollar strengthened compared to the euro. These decreases were slightly offset by a 12.6% increase from higher sales volume resulting from higher sales of SSBR to tire producers.
EBITDA for the three months ended September 30, 2015 increased by $0.8 million, or 3.0%, to $27.4 million from $26.6 million for the three months ended September 30, 2014. Of this increase, 36.1% was driven by higher sales volume, mostly SSBR, and 6.2% of the increase was due to a reduction in fixed costs. Partially offsetting these increases was a 26.3% decrease driven by lower margins and a 12.8% decrease due to unfavorable currency impact as the U.S. dollar strengthened compared to the euro.
Nine Months Ended September 30, 2015 Compared to the Nine Months Ended September 30, 2014
Net sales for the nine months ended September 30, 2015 decreased by $126.4 million, or 25.4%, to $370.7 million from $497.1 million for the nine months ended September 30, 2014. Of the 25.4% decrease in net sales, 21.2% was due to lower selling prices primarily resulting from the pass through of lower butadiene and styrene costs to customers and 12.4% was due to an unfavorable currency impact as the U.S. dollar strengthened compared to the euro. These decreases were slightly offset by an 8.2% increase from higher sales volume resulting from higher sales of SSBR to tire producers.
EBITDA for the nine months ended September 30, 2015 decreased by $34.7 million, or 32.5%, to $72.0 million from $106.7 million for the nine months ended September 30, 2014. Of this decrease, 31.0% was driven by lower margins primarily related to the timing of raw material costs and an unfavorable currency impact of approximately 8.2% as the U.S. dollar strengthened compared to the euro. In addition, 6.4% of the decrease was driven by higher fixed costs due primarily to higher planned maintenance expense in the current year as well as higher employee benefit costs. Partially offsetting these decreases was a 13.1% increase due to sales volume driven by higher SSBR sales.
Performance Plastics Segment
Our Performance Plastics segment produces highly engineered compounds and blends for automotive end markets, as well as consumer electronics, medical, and lighting, which we collectively call consumer essential markets, or CEM. Our strategy in this segment focuses on developing differentiated compounds and blends in line with key industry trends, such as light-weighting and improved aesthetics in automotive, increased recycled material content and a push toward LED lighting in CEM. Our history of innovation has contributed to long-standing relationships with customers who are recognized leaders in their respective end-markets. We have established a strong market presence in the global automotive and electronics sector, targeting both component suppliers and final product manufacturers.
In automotive end applications, we aim to maintain and develop sustainable, long-standing relationships with industry leaders, taking advantage of our production capacity located across Europe, Asia, North America, and Latin America to drive original equipment manufacturer, or OEM, platform design wins. We believe that the strategic
40
locations of these facilities combined with close customer collaboration to develop offerings tailored to their needs offers us a strategic advantage in serving our customers.
Three Months Ended September 30, 2015 Compared to the Three Months Ended September 30, 2014
Net sales for the three months ended September 30, 2015 decreased by $27.7 million, or 13.3%, to $179.9 million from $207.6 million for the three months ended September 30, 2014. Of the 13.3% decrease in net sales, 7.2% was due to lower selling prices primarily related to the pass through of lower raw material costs to our customers and 5.6% was due to an unfavorable currency impact as the U.S. dollar strengthened compared to the euro. In addition, 0.6% of the decrease was due to decreased sales volume.
EBITDA for the three months ended September 30, 2015 decreased by $4.7 million, or 24.5%, to $14.5 million from $19.2 million for the three months ended September 30, 2014. Of the 24.5% decrease, 22.4% was due to increased fixed costs and 4.1% was due to a decrease in sales volume. Partially offsetting these decreases was a 0.3% increase due to higher margins.
Nine Months Ended September 30, 2015 Compared to the Nine Months Ended September 30, 2014
Net sales for the nine months ended September 30, 2015 decreased by $57.4 million, or 9.3%, to $562.1 million from $619.5 million for the nine months ended September 30, 2014. Of the 9.3% decrease in net sales, 5.8% was due to lower selling prices primarily related to the pass through of lower raw material costs to our customers and 6.0% was due to an unfavorable currency impact as the U.S. dollar strengthened compared to the euro. These decreases were partially offset by a 2.6% increase in sales volume, primarily to the consumer electronics market in Asia.
EBITDA for the nine months ended September 30, 2015 increased by $7.6 million, or 14.3%, to $60.9 million from $53.3 million for the nine months ended September 30, 2014. The EBITDA increase was driven by an increase in sales volume, primarily to the consumer electronics market in Asia, as well as higher margins due to lower raw material costs, which contributed to 31.6% of the increase. Slightly offsetting this increase was a 15.7% decrease due to increased fixed costs.
Basic Plastics & Feedstocks Segment
Our Basic Plastics & Feedstocks segment consists of styrenic polymers, including polystyrene, ABS, and SAN products, as well as PC and styrene monomer, which includes our internal production and sourcing of styrene, a raw material common in SB latex, synthetic rubber and styrenic polymers products. We are a leading producer of polystyrene and mass ABS, or mABS, where we focus our efforts on differentiated applications such as the liners and encasements of appliances and consumer electronics including smartphones and tablets. Within these applications, we have worked collaboratively with customers to develop more advanced grades of plastics such as our high impact polystyrene, or HIPS, and mABS products. These products offer superior properties, such as rigidity, insulation and colorability, and, in some cases, an improved environmental footprint compared to general purpose polystyrene or emulsion ABS. Through this segment we also serve the packaging and construction end-markets, where we have launched a new general purpose polystyrene product for improved performance in foam insulation applications.
PC has high levels of clarity, impact resistance and temperature resistance. PC can be used in its neat form (prior to any compounding or blending) for markets such as construction sheet, optical media and LED lighting. Additionally, PC can be compounded or blended with other polymers, such as ABS, which imparts specific performance attributes tailored to the product’s end-use. A significant portion of our PC is consumed in our Performance Plastics segment for the manufacture of our compounds and blends products. We continue to drive improvements in profitability of PC as a result of savings from our restructuring activities, as well as from improvements in industry supply and demand.
This segment also includes the results of our two 50%-owned joint ventures, Americas Styrenics and Sumika Styron Polycarbonate. We do not anticipate investing for significant growth initiatives in this segment in the near term. Rather, our strategy for this segment is focused on operational enhancements, margin improvement, and cash generation.
41
Three Months Ended September 30, 2015 Compared to the Three Months Ended September 30, 2014
Net sales for the three months ended September 30, 2015 decreased by $146.8 million, or 23.9%, to $467.2 million from $614.0 million for the three months ended September 30, 2014. Of the 23.9% decrease in net sales, 13.2% was driven by decreases in selling prices due to the pass through of lower styrene costs to customers and 9.1% was due to unfavorable currency impact as the U.S. dollar strengthened compared to the euro. In addition, a decrease in sales volume, primarily related to lower sales of polystyrene in Asia, decreased revenue by 1.6%.
EBITDA for the three months ended September 30, 2015 increased by $66.0 million, or 1571.4%, to $70.2 million from $4.2 million for the three months ended September 30, 2014. The EBITDA increase was due primarily to higher margins, particularly in styrene monomer, as well as in polycarbonate as a result of our restructuring efforts and improved market conditions. In addition, increased equity earnings from our two joint ventures, primarily Americas Styrenics, contributed to $24.2 million of the increase, or 569.1%. Increased equity earnings from Americas Styrenics was driven by higher styrene and polystyrene margins. Partially offsetting these increases was a decrease in sales volume, contributing to a 95.0% decrease, a 77.9% decrease due to increased fixed costs, and a 224.4% unfavorable currency impact as the U.S. dollar strengthened compared to the euro.
Nine Months Ended September 30, 2015 Compared to the Nine Months Ended September 30, 2014
Net sales for the nine months ended September 30, 2015 decreased by $512.2 million, or 26.8%, to $1,401.4 million from $1,913.6 million for the nine months ended September 30, 2014. Of the 26.8% decrease in net sales, 17.8% was driven by decreases in selling prices due primarily to the pass through of lower styrene costs to customers and 8.7% was due to unfavorable currency impact as the U.S. dollar strengthened compared to the euro.
EBITDA for the nine months ended September 30, 2015 increased by $209.0 million, or 492.9%, to $251.4 million from $42.4 million for the nine months ended September 30, 2014. The EBITDA increase was due primarily to higher margins, particularly in styrene monomer, as well as in polycarbonate as a result of our restructuring efforts and improved market conditions. In addition, increased equity earnings from our two joint ventures, primarily Americas Styrenics, contributed to $81.4 million of the increase, or 192.9%. Increased equity earnings from Americas Styrenics was driven by higher styrene and polystyrene margins as well as higher volumes of styrene monomer sold. Partially offsetting these increases was a 60.4% unfavorable currency impact as the U.S. dollar strengthened compared to the euro.
Other Important Performance Measures
We believe that the presentation of Adjusted EBITDA and Adjusted EBITDA excluding inventory revaluation provides investors with a useful analytical indicator of our performance and of our ability to service our indebtedness.
We define Adjusted EBITDA as income (loss) from continuing operations before interest expense, net; income tax provision; depreciation and amortization expense; loss on extinguishment of long-term debt; asset impairment charges; advisory fees paid to affiliates of Bain Capital; gains or losses on the dispositions of businesses and assets; restructuring and other non-recurring items. We describe these other costs in more detail below.
We present Adjusted EBITDA excluding inventory revaluation in order to facilitate the comparability of results from period to period by adjusting cost of sales to reflect the cost of raw material during the period, which is often referred to as the replacement cost method of inventory valuation. We believe this measure minimizes the impact of raw material purchase price volatility in evaluating our performance. Our approach to calculating inventory revaluation is intended to represent the difference between the results under the FIFO and the replacement cost methods. However, our calculation could differ from the replacement cost method if the monthly raw material standards are different from the actual raw material prices during the month and production and purchase volumes differ from sales volumes during the month. These factors could have a significant impact on the inventory revaluation calculation.
There are limitations to using financial measures such as Adjusted EBITDA and Adjusted EBITDA excluding inventory revaluation. These performance measures are not intended to represent cash flow from operations as defined by GAAP and should not be used as alternatives to net income (loss) as indicators of operating performance or to cash flow as measures of liquidity. Other companies in our industry may define Adjusted EBITDA and Adjusted EBITDA excluding inventory revaluation differently than we do. As a result, it may be difficult to use these or similarly-named financial measures that other companies may use, to compare the performance of those companies to our performance.
42
We compensate for these limitations by providing reconciliations of these performance measures to our net income (loss), which is determined in accordance with GAAP.
Adjusted EBITDA and Adjusted EBITDA excluding inventory revaluation are calculated as follows for the three and nine months ended September 30, 2015 and 2014, respectively:
|
|
|
Three Months Ended |
|
Nine Months Ended |
|
||||||||
|
|
|
September 30, |
|
September 30, |
|
||||||||
|
(in millions) |
|
2015 |
|
2014 |
|
2015 |
|
2014 |
|
||||
|
Net income (loss) |
|
$ |
52.1 |
|
$ |
(10.1) |
|
$ |
90.5 |
|
$ |
(37.6) |
|
|
Interest expense, net |
|
|
19.5 |
|
|
30.1 |
|
|
73.9 |
|
|
95.5 |
|
|
Provision for income taxes |
|
|
21.2 |
|
|
3.7 |
|
|
46.6 |
|
|
21.9 |
|
|
Depreciation and amortization |
|
|
23.0 |
|
|
27.8 |
|
|
67.3 |
|
|
78.7 |
|
|
EBITDA(a) |
|
$ |
115.8 |
|
$ |
51.5 |
|
$ |
278.3 |
|
$ |
158.5 |
|
|
Loss on extinguishment of long-term debt |
|
|
— |
|
|
7.4 |
|
|
95.2 |
|
|
7.4 |
|
|
Restructuring and other charges(b) |
|
|
0.1 |
|
|
0.8 |
|
|
0.5 |
|
|
3.5 |
|
|
Fees paid pursuant to advisory agreement(c) |
|
|
— |
|
|
— |
|
|
— |
|
|
25.4 |
|
|
Other non-recurring items(d) |
|
|
0.3 |
|
|
1.9 |
|
|
2.3 |
|
|
34.4 |
|
|
Adjusted EBITDA |
|
$ |
116.2 |
|
$ |
61.6 |
|
$ |
376.3 |
|
$ |
229.2 |
|
|
Inventory revaluation |
|
|
28.3 |
|
|
0.8 |
|
|
41.1 |
|
|
(7.4) |
|
|
Adjusted EBITDA, excluding inventory revaluation(e) |
|
$ |
144.5 |
|
$ |
62.4 |
|
$ |
417.4 |
|
$ |
221.8 |
|
|
(a) |
We refer to EBITDA in making operating decisions because we believe it provides meaningful supplemental information regarding our operational performance. Other companies in our industry may define EBITDA differently than we do. As a result, it may be difficult to use EBITDA, or similarly-named financial measures that other companies may use, to compare the performance of those companies to our performance. We compensate for these limitations by providing reconciliations of our EBITDA results to our net income (loss), which is determined in accordance with GAAP. See “—Selected Segment Information” for further detail. |
|
(b) |
Restructuring and other charges for the nine months ended September 30, 2015 relate primarily to the polycarbonate restructuring within our Basic Plastics & Feedstocks segment for the reimbursement of decommissioning and demolition charges to Dow in connection with the shutdown of their Freeport, Texas facility. Restructuring and other charges for the three and nine months ended September 30, 2014 were incurred primarily in connection with the shutdown of our latex manufacturing plant in Altona, Australia. Note that the accelerated depreciation charges incurred as a part of these restructurings, as well as the Allyn’s Point Plant shutdown announced in September 2015, are included within the depreciation caption above and are therefore not included as a separate adjustment within this caption as these charges are already excluded from EBITDA. Refer to Note 16 in the condensed consolidated financial statements for further discussion. |
|
(c) |
Represents fees paid under the terms of our Advisory Agreement with Bain Capital. For the nine months ended September 30, 2014, this includes a charge of $23.3 million for fees incurred in connection with the termination of the Advisory Agreement, pursuant to its terms, upon consummation of the Company’s IPO in June 2014. Refer to Note 13 in the condensed consolidated financial statements for further discussion. |
|
(d) |
Other non-recurring items incurred for the periods presented above primarily consist of costs related to the process of changing our corporate name from Styron to Trinseo. For the nine months ended September 30, 2014, these costs also include a one-time $32.5 million termination payment made to Dow in connection with the termination of our Latex JV Option Agreement. See Note 13 in the condensed consolidated financial statements for further discussion of our termination of this agreement. |
|
(e) |
See the discussion above this table for a description of Adjusted EBITDA, excluding inventory revaluation. |
43
Liquidity and Capital Resources
Cash Flows
The table below summarizes our primary sources and uses of cash for the nine months ended September 30, 2015 and 2014, respectively. We have derived the summarized cash flow information from our unaudited financial statements.
|
|
|
Nine Months Ended |
|
||||
|
|
|
September 30, |
|
||||
|
(in millions) |
|
2015 |
|
2014 |
|
||
|
Net cash provided by (used in): |
|
|
|
|
|
|
|
|
Operating activities |
|
$ |
205.7 |
|
$ |
1.7 |
|
|
Investing activities |
|
|
(76.6) |
|
|
(62.7) |
|
|
Financing activities |
|
|
(24.1) |
|
|
21.6 |
|
|
Effect of exchange rates on cash |
|
|
(5.0) |
|
|
(5.0) |
|
|
Net change in cash and cash equivalents |
|
$ |
100.0 |
|
$ |
(44.4) |
|
Operating Activities
Net cash provided by operating activities during the nine months ended September 30, 2015 totaled $205.7 million, driven by the overall strong earnings for the period. Also driving the strong positive cash from operating activities for the period was $87.5 million in dividends from our 50%-owned joint venture, Americas Styrenics. These increases were noted despite several significant decreases to operating cash flows, which included $81.7 million in interest payments made on our 2019 Senior Notes prior to their May 2015 retirement as well as a $68.6 million call premium paid to retire those notes. Refer to Note 6 in the condensed consolidated financial statements for further details.
Net cash provided by operating assets and liabilities for the nine months ended September 30, 2015 totaled $47.6 million, the most significant components of which were decreases in inventories of $63.1 million and increases in income taxes payable of $26.8 million, offset by a decrease in accounts payables and other current liabilities of $47.9 million. Inventory decreased due to higher volume sold during the third quarter of 2015 when compared to the fourth quarter of 2014, as well as significant decreases in raw materials prices when comparing the periods. The increase in income taxes payable is driven primarily by the Company’s significant improvement in earnings before taxes compared to the prior year, particularly in our 50%-owned joint venture, Americas Styrenics. The decrease in accounts payable and other current liabilities is primarily due to timing of payments as well as decreases in prices for raw materials purchases.
Net cash provided by operating activities during the nine months ended September 30, 2014 totaled $1.7 million, with net cash used in operating assets and liabilities totaling $66.5 million. The most significant components of the changes in operating assets and liabilities for the nine months ended September 30, 2014 of $66.5 million was an increase in accounts receivable of $42.0 million, and a decrease in other liabilities of $19.2 million. The increase in accounts receivable is primarily due to higher sales during the third quarter of 2014, compared to the fourth quarter of 2013. Our other liabilities decreased mainly due to reductions in normal operating costs. Our operating cash flow for the nine months ended September 30, 2014 was negatively impacted by two significant one-time cash payments in the second quarter of 2014 totaling approximately $55.8 million related to the termination of our Latex JV Option Agreement with Dow and our Advisory Agreement with Bain Capital. Refer to Note 13 of the condensed consolidated financial statements for further details.
Investing Activities
Net cash used in investing activities for the nine months ended September 30, 2015 totaled $76.6 million, consisting primarily of capital expenditures of $76.9 million during the period, net of proceeds received from a government subsidy of $2.2 million related to our capital expansion project at our rubber facility in Schkopau, Germany.
44
Net cash used in investing activities for the nine months ended September 30, 2014 totaled $62.7 million consisting primarily of capital expenditures of $69.3 million, of which approximately $26.1 million (€19.0 million) was related to the Company’s acquisition of production capacity rights from JSR Corporation Tokyo at its rubber production facility in Schkopau, Germany. These investing activities were partially offset by cash proceeds of $6.3 million from the sale of a portion of land at our manufacturing site in Livorno, Italy.
Financing Activities
Net cash used in financing activities during the nine months ended September 30, 2015 totaled $24.1 million. The most significant activity during the period related to the May 2015 debt refinancing, which included net proceeds of $1,215.4 million from the issuance of our 2021 Term Loan B and our 2022 Senior Notes, offset by the retirement of our existing 2019 Senior Notes totaling $1,192.5 million and deferred financing fees paid in conjunction with the refinancing of $28.0 million. Also during the period, we had net repayments of short-term borrowings of $17.7 million, which largely consisted of borrowings under our short-term revolving credit facility through our subsidiary in China. We also continued to utilize our Accounts Receivable Securitization Facility to fund our working capital requirements. For the nine months ended September 30, 2015, we had borrowings from and repayments of our Accounts Receivable Securitization Facility of $25.0 million, respectively.
Net cash provided by financing activities during the nine months ended September 30, 2014 totaled $21.6 million. During the period, the Company completed the IPO of 11,500,000 ordinary shares at a price of $19.00 per share. As a result, the Company received net cash proceeds from the issuance of common stock of $198.1 million, which is net of underwriting discounts as well as advisory, accounting, and legal expenses directly related to the offering. In July 2014, using proceeds from the Company’s IPO, the Company redeemed $132.5 million in aggregate principal amount of the 2019 Senior Notes. In addition, we had net repayments of short-term borrowings of $43.4 million, which largely consisted of borrowings under our short-term revolving credit facility through our subsidiary in China. We also utilized our Accounts Receivable Securitization Facility to fund our working capital requirements. For the nine months ended September 30, 2014, we had borrowings from our Accounts Receivable Securitization Facility of $283.3 million and repayments of $283.9 million, resulting in net repayments of $0.6 million due to changes in foreign currency exchange rates, as a portion of our borrowings under the Accounts Receivable Securitization Facility originate in euros.
Indebtedness and Liquidity
The following table outlines our outstanding indebtedness as of September 30, 2015 and December 31, 2014 and the associated interest expense, including amortization of deferred financing fees, and effective interest rates for such borrowings as of September 30, 2015 and December 31, 2014. Note that the effective interest rates below exclude the impact of deferred financing fee amortization.
45
|
|
|
As of and for the Nine Months Ended |
|
As of and for the Year Ended |
|
||||||||||||
|
|
|
September 30, 2015 |
|
December 31, 2014 |
|
||||||||||||
|
|
|
|
|
|
Effective |
|
|
|
|
|
|
|
Effective |
|
|
|
|
|
|
|
|
|
|
Interest |
|
Interest |
|
|
|
|
Interest |
|
Interest |
|
||
|
(dollars in millions) |
|
Balance |
|
Rate |
|
Expense |
|
Balance |
|
Rate |
|
Expense |
|
||||
|
2018 Senior Secured Credit Facility |
|
|
|
|
|
|
|
|
|
|
|
|
|
|
|
|
|
|
2018 Revolving Facility |
|
$ |
— |
|
— |
|
$ |
1.6 |
|
$ |
— |
|
— |
|
$ |
4.7 |
|
|
Senior Credit Facility |
|
|
|
|
|
|
|
|
|
|
|
|
|
|
|
|
|
|
2021 Term Loan B |
|
|
497.6 |
|
4.3 |
% |
|
9.5 |
|
|
— |
|
— |
|
|
— |
|
|
2020 Revolving Facility |
|
|
— |
|
— |
|
|
1.4 |
|
|
— |
|
— |
|
|
— |
|
|
2019 Senior Notes |
|
|
— |
|
8.8 |
% |
|
40.4 |
|
|
1,192.5 |
|
8.8 |
% |
|
116.2 |
|
|
2022 Senior Notes |
|
|
|
|
|
|
|
|
|
|
|
|
|
|
|
|
|
|
USD Notes |
|
|
300.0 |
|
6.8 |
% |
|
8.5 |
|
|
— |
|
— |
|
|
— |
|
|
Euro Notes |
|
|
420.8 |
|
6.4 |
% |
|
11.1 |
|
|
— |
|
— |
|
|
— |
|
|
Accounts Receivable Securitization Facility |
|
|
— |
|
2.7 |
% |
|
3.1 |
|
|
— |
|
2.7 |
% |
|
4.3 |
|
|
Other indebtedness |
|
|
2.6 |
|
2.2 |
% |
|
0.1 |
|
|
9.7 |
|
1.1 |
% |
|
0.1 |
|
|
Total |
|
$ |
1,221.0 |
|
|
|
$ |
75.7 |
|
$ |
1,202.2 |
|
|
|
$ |
125.3 |
|
2018 Senior Secured Credit Facility
On June 17, 2010, the Company entered into the 2018 Senior Secured Credit Facility. All term loan borrowings under the 2018 Senior Secured Credit Facility were repaid in conjunction with the January 2013 amendment. Under this agreement, the Company entered into the 2018 Revolving Facility, which, as a result of the amendment in January 2013, included a borrowing capacity of $300.0 million. As of December 31, 2014, the Company had no amounts outstanding under the 2018 Revolving Facility.
In May 2015, upon completion of the refinancing transactions discussed below, the Company terminated the 2018 Senior Secured Credit Facility. Prior to this termination, the Company had no outstanding borrowings under the 2018 Revolving Facility.
Senior Credit Facility
On May 5, 2015, the Borrowers, entered into the Credit Agreement, which provides senior secured financing of up to $825.0 million, defined as the Senior Credit Facility. The Senior Credit Facility provides for senior secured financing consisting of the (i) 2020 Revolving Facility including a $325.0 revolving credit facility, with a $25.0 million swingline subfacility and a $35.0 million letter of credit subfacility maturing in May 2020 and (ii) $500.0 million senior secured 2021 Term Loan B (maturing in November 2021). Amounts under the 2020 Revolving Facility are available in U.S. dollars and euros.
The 2021 Term Loan B bears an interest rate of LIBOR plus 3.25%, subject to a 1.00% LIBOR floor, and was issued at a 0.25% original issue discount. Further, the 2021 Term Loan B requires scheduled quarterly payments in amounts equal to 0.25% of the original principal amount of the 2021 Term Loan B, with the balance to be paid at maturity. As of September 30, 2015, $5.0 million of these scheduled future payments were classified as current debt on the Company’s condensed consolidated balance sheet.
Loans under the 2020 Revolving Facility, at the Borrowers’ option, may be maintained as (a) LIBO rate loans, which bear interest at a rate per annum equal to the LIBO rate plus the applicable margin (as defined in the Credit Agreement), if applicable, or (b) base rate loans which shall bear interest at a rate per annum equal to the base rate plus the applicable margin (as defined in the Credit Agreement). The Borrowers will be required to pay a quarterly commitment fee in respect of any unused commitments under the 2020 Revolving Facility equal to 0.50% per annum.
As of September 30, 2015, the Company had no outstanding borrowings, and had $313.0 million (net of $12.0 million outstanding letters of credit) of funds available for borrowings under the 2020 Revolving Facility.
46
The Senior Credit Facility is collateralized by a security interest in substantially all of the assets of Trinseo Materials Operating S.C.A., as lead borrower, Trinseo Materials Finance, Inc., as co-borrower, and the guarantors thereunder including Trinseo Materials S.à r.l., certain U.S. subsidiaries and certain foreign subsidiaries organized in Luxembourg, The Netherlands, Hong Kong, Singapore, Ireland, Germany and Switzerland.
The Senior Credit Facility requires the Borrowers and their restricted subsidiaries to comply with customary affirmative and negative covenants, including limitations on their abilities to incur liens; make certain loans and investments; incur additional debt; merge, consolidate liquidate or dissolve; transfer or sell assets; pay dividends and other distributions to shareholders or make certain other restricted payments; enter into transactions with affiliates; restrict any restricted subsidiary from paying dividends or making other distributions or agree to certain negative pledge clauses; materially alter the business they conduct; prepay certain other indebtedness; amend certain material documents; and change our fiscal year.
The 2020 Revolving Facility contains a financial covenant that requires compliance with a springing first lien net leverage ratio test. If the outstanding balance under the 2020 Revolving Facility exceeds 30% of the $325.0 million borrowing capacity (excluding undrawn letters of credit up to $10.0 million and cash collateralized letters of credit) at a quarter-end, then the Company’s first lien net leverage ratio may not exceed 2.00 to 1.00. As of September 30, 2015, the Company was in compliance with all debt covenant requirements under the Senior Credit Facility.
2019 Senior Notes
In January 2013, the Company issued $1,325.0 million 8.750% 2019 Senior Notes due to mature on February 1, 2019. In July 2014, using proceeds from the Company’s IPO (see Note 1 of the condensed consolidated financial statements), the Company redeemed $132.5 million in aggregate principal amount of the 2019 Senior Notes.
On May 13, 2015, using the net proceeds from the issuance of the 2021 Term Loan B, together with the net proceeds from the issuance of the 2022 Senior Notes (defined and discussed below) and available cash, the Company redeemed all outstanding borrowings under the 2019 Senior Notes, totaling $1,192.5 million in principal, together with a call premium of $68.6 million (with a redemption price of 103% on the first $132.5 million and 106.097% on the remaining balance) and accrued and unpaid interest thereon of $29.6 million.
2022 Senior Notes
On May 5, 2015, the Issuers executed the Indenture pursuant to which they issued $300.0 million aggregate principal amount of 6.750% USD Notes due May 1, 2022 and €375.0 million aggregate principal amount of 6.375% Euro Notes due May 1, 2022 (together with the USD Notes, the 2022 Senior Notes). Interest on the 2022 Senior Notes is payable semi-annually on May 1 and November 1 of each year, commencing on November 1, 2015.
At any time prior to May 1, 2018, the Issuers may redeem the Euro Notes and/or the USD Notes in whole or in part, at their option at a redemption price equal to 100% of the principal amount of such notes plus the relevant applicable premium as of, and accrued and unpaid interest to, but not including, the redemption date. At any time and from time to time after May 1, 2018, the Issuers may redeem the Euro Notes and/or the USD Notes, in whole or in part, at a redemption price equal to the percentage of principal amount set forth below plus accrued and unpaid interest, if any, on the notes redeemed to, but not including, the redemption date:
|
|
|
Euro Notes |
|
USD Notes |
|
|
12-month period commencing May 1 in Year |
|
Percentage |
|
Percentage |
|
|
2018 |
|
103.188 |
% |
103.375 |
% |
|
2019 |
|
101.594 |
% |
101.688 |
% |
|
2020 and thereafter |
|
100.000 |
% |
100.000 |
% |
In addition, at any time prior to May 1, 2018, the Issuers may redeem up to 40% of the aggregate principal amount of each of the USD Notes and the Euro Notes, either together or separately, at a redemption price equal to 106.750% of the principal amount thereof for the USD Notes and 106.375% of the principal amount thereof for the Euro Notes plus, in each case, accrued and unpaid interest to, but not including, the redemption date, in an amount equal to the aggregate gross proceeds from certain equity offerings.
The 2022 Senior Notes are the Issuers’ senior unsecured obligations and rank equally in right of payment with all of the Issuers’ existing and future indebtedness that is not expressly subordinated in right of payment thereto. The 2022
47
Senior Notes will be senior in right of payment to any future indebtedness that is expressly subordinated in right of payment thereto and effectively junior to (a) the Issuers’ existing and future secured indebtedness, including the Company’s accounts receivable facility and the Issuers’ Senior Credit Facility (discussed above), to the extent of the value of the collateral securing such indebtedness and (b) all existing and future liabilities of the Issuers’ non-guarantor subsidiaries.
The Indenture contains customary covenants that, among other things, limit the Issuers’ and certain of their subsidiaries’ ability to incur additional indebtedness and guarantee indebtedness, pay dividends or make other distributions, make investments, or prepay certain indebtedness, each subject to a number of exceptions and qualifications. Certain of these covenants, will be suspended during any period of time that (1) the 2022 Notes have investment grade ratings (as defined in the Indenture) and (2) no default has occurred and is continuing under the Indenture. In the event that the 2022 Senior Notes are downgraded to below an investment grade rating, the Issuers and certain subsidiaries will again be subject to the suspended covenants with respect to future events. As of September 30, 2015, the Company was in compliance with all debt covenant requirements under the Indenture.
Accounts Receivable Securitization Facility
In May 2013, the Company amended its existing Accounts Receivable Securitization Facility, which increased its borrowing capacity from $160.0 million to $200.0 million, extended the maturity date to May 2016 and allows for the expansion of the pool of eligible accounts receivable to include previously excluded U.S. and Netherlands subsidiaries. The Accounts Receivable Securitization Facility is subject to interest charges against the amount of outstanding borrowings as well as the amount of available, but undrawn borrowings. As a result of the amendment to our Accounts Receivable Securitization Facility, in regards to outstanding borrowings, fixed interest charges decreased from 3.25% plus commercial paper rates to 2.60% plus variable commercial paper rates. In regards to available, but undrawn borrowings, fixed interest charges decreased from 1.50% to 1.40%.
As of September 30, 2015, there were no amounts outstanding under the Accounts Receivable Securitization Facility, with approximately $153.0 million of accounts receivable available to support this facility, based on the pool of eligible accounts receivable.
Other Indebtedness
As of September 30, 2015, we had $0.6 million of outstanding borrowings under our short-term revolving credit facility through our subsidiary in China that provides uncommitted funds available for borrowing, subject to the availability of collateral. The facility is subject to annual renewal.
Capital Resources and Liquidity
Our sources of liquidity include cash on hand, cash flow from operations and amounts available under the Senior Credit Facility and the Accounts Receivable Securitization Facility. We believe, based on our current level of operations, that these sources of liquidity will be sufficient to fund our operations, capital expenditures and debt service for at least the next twelve months.
Our liquidity requirements are significant due to our highly leveraged nature, as well as our working capital requirements. As of September 30, 2015, we had $1,221.0 million in outstanding indebtedness and $802.6 million in working capital. As of December 31, 2014, we had $1,202.2 million in outstanding indebtedness and $748.7 million in working capital. As of September 30, 2015 and December 31, 2014, we had $107.0 million and $94.7 million of foreign cash and cash equivalents on our balance sheet, respectively, all of which is readily convertible into other foreign currencies, including the U.S. dollar. Our intention is not to permanently reinvest our foreign cash and cash equivalents. Accordingly, we record deferred income tax liabilities related to the unremitted earnings of our subsidiaries.
As discussed above, in May 2015, we terminated our existing 2018 Senior Secured Credit Facility, which included a $300.0 million revolving credit facility set to mature in 2018, and entered into the new Senior Credit Facility, which increased the borrowing capacity under our new revolving facility to $325.0 million and extended the maturity to May 2020. Also as a part of this refinancing, we redeemed our existing 2019 Senior Notes totaling $1,192.5 million, replacing those borrowings with a $500.0 million Term Loan B due November 2021, $300.0 million in USD Notes and €375.0 million in Euro Notes, both due May 2022. We also continue to maintain our Accounts Receivable Securitization
48
Facility set to mature in May 2016, under which our borrowing capacity is $200.0 million.
Our ability to raise additional financing and our borrowing costs may be impacted by short and long-term debt ratings assigned by independent rating agencies, which are based, in significant part, on our performance as measured by certain credit metrics such as interest coverage and leverage ratios.
We and our subsidiaries, affiliates or significant direct or indirect shareholders may from time to time seek to retire or purchase our outstanding debt through cash purchases in the open market, privately negotiated transactions, exchange transactions or otherwise. Such repurchases or exchanges, if any, will depend on prevailing market conditions, our liquidity requirements, contractual restrictions and other factors. The amounts involved may be material.
Trinseo Materials Operating S.C.A. and Trinseo Materials Finance, Inc. (the “Issuers” of our 2022 Senior Notes and “Borrowers” under our Senior Credit Facility) are dependent upon the cash generation and receipt of distributions and dividends or other payments from our subsidiaries and joint ventures in order to satisfy their debt obligations. There are no known significant restrictions by third parties on the ability of subsidiaries of the Company to disburse or dividend funds to the Issuers in order to satisfy these obligations. However, as the Company’s subsidiaries are located in a variety of jurisdictions, the Company can give no assurances that its subsidiaries will not face transfer restrictions in the future due to regulatory or other reasons beyond our control.
Further, we cannot make assurances that our business will generate sufficient cash flow from operations or that future borrowings will be available to us under the Senior Credit Facility in an amount sufficient to enable us to pay our indebtedness, or to fund our other liquidity needs. In addition, our highly leveraged nature may limit our ability to procure additional financing in the future. As of September 30, 2015 and December 31, 2014, we were in compliance with all the covenants and default provisions under our credit arrangements.
Our Senior Credit Facility and Indenture also include limitations on our abilities to pay dividends and other distributions to shareholders and to make certain other restricted payments.
We believe that funds provided by operations, our existing cash and cash equivalent balances, borrowings available under our 2020 Revolving Facility and borrowings available under our Accounts Receivable Securitization Facility will be adequate to meet planned operating and capital expenditures for at least the next 12 months under current operating conditions. However, if we were to undertake any significant acquisitions or investments, it may be necessary for us to obtain additional debt or equity financings. We may not be able to obtain such financing on reasonable terms, or at all.
Contractual Obligations and Commercial Commitments
Other than the impact of the May 2015 refinancing of our debt, which included the issuance of our 2022 Senior Notes and 2021 Term Loan B, accompanied by the retirement of our 2019 Senior Notes (discussed in Note 6 to the condensed consolidated financial statements), there have been no material revisions outside the ordinary course of business to our contractual obligations as described within “Management’s Discussion and Analysis of Financial Condition and Results of Operations – Contractual Obligations and Commercial Commitments” within our Annual Report.
Critical Accounting Policies and Estimates
Our unaudited interim condensed consolidated financial statements are based on the selection and application of significant accounting policies. The preparation of unaudited interim condensed consolidated financial statements in conformity with GAAP requires management to make estimates and assumptions that affect the reported amounts of assets and liabilities and revenues and expenses at the date of and during the reporting period. Actual results could differ from those estimates. However, we are not currently aware of any reasonably likely events or circumstances that would result in materially different results.
We describe our significant accounting policies in Note 2, Basis of Presentation and Summary of Significant Accounting Policies, of the Notes to Consolidated Financial Statements included in our Annual Report, while we discuss our critical accounting policies and estimates in “Management’s Discussion and Analysis of Financial Condition and Results of Operations” within our Annual Report.
There have been no material revisions to the critical accounting policies as filed in our Annual Report.
49
Off-balance Sheet Arrangements
We do not have any off-balance sheet arrangements.
Recent Accounting Pronouncements
We describe the impact of recent accounting pronouncements in Note 2 to our condensed consolidated financial statements, included elsewhere within this Quarterly Report.
Item 3. Quantitative and Qualitative Disclosures about Market Risk
As discussed in “Management’s Discussion and Analysis of Financial Condition and Results of Operations” within our Annual Report, we are exposed to changes in interest rates and foreign currency exchange rates as well as changes in the prices of certain commodities that we use in production. There have been no material changes in our exposure to market risks from the information provided within our Annual Report.
Item 4. Controls and Procedures
Evaluation of Disclosure Controls and Procedures
Our management is responsible for establishing and maintaining internal controls designed to provide reasonable assurance that information required to be disclosed by us in our reports that we file or submit under the Exchange Act (as defined in Rules 13a-15(e) and 15d-15(e) of the Securities Exchange Act of 1934, as amended) is recorded, processed, summarized and reported within the time periods specified in the SEC’s rules and forms, and that such information is accumulated and communicated to our management, with the participation of our Chief Executive Officer and Chief Financial Officer, as appropriate, to allow timely decisions regarding required disclosures. Based on that evaluation, the Chief Executive Officer and Chief Financial Officer concluded that our disclosure controls and procedures as of the end of the period covered by this Quarterly Report were effective.
Changes in Internal Control over Financial Reporting
There was no change in our internal control over financial reporting (as defined in Rules 13a-15(f) and 15d-15(f) of the Exchange Act) that occurred during the quarter ended September 30, 2015 that has materially affected, or is reasonably likely to materially affect, our internal control over financial reporting.
From time to time we may be subject to various legal claims and proceedings incidental to the normal conduct of business, relating to such matters as product liability, antitrust, competition, waste disposal practices, release of chemicals into the environment and other matters that may arise in the ordinary course of our business. We currently believe that there is no litigation pending that is likely to have a material adverse effect on our business. Regardless of the outcome, legal proceedings can have an adverse impact on us because of defense and settlement costs, diversion of management resources and other factors.
Our business faces various risks. Certain important factors may have a material adverse effect on our business prospects, financial condition and results of operations, and you should carefully consider them. Accordingly, in evaluating our business, we encourage you to consider the risk factors related to our ordinary shares as well those risk factors related to our business and industry which have been previously disclosed in Item 1A of our Annual Report for the year ended December 31, 2014, for which there have been no material changes. We encourage you to consider these risks, in their entirety, in addition to other information contained in or incorporated by reference into this Quarterly
50
Report and our other public filings with the SEC. Other events that we do not currently anticipate or that we currently deem immaterial may also affect our business, prospects, financial condition and results of operations.
Item 2. Unregistered Sales of Equity Securities and Use of Proceeds
(a)Recent sales of unregistered securities
None.
(b)Use of Proceeds from registered securities
None.
(c)Purchases of Equity Securities by the Issuer and Affiliated Purchasers
None.
Item 3. Defaults Upon Senior Securities
None.
Item 4. Mine Safety Disclosures
Not applicable.
None.
See Exhibit Index.
51
Pursuant to the requirements of the Securities Exchange Act of 1934, the Registrant has duly caused this report to be signed on its behalf by the undersigned, duly authorized.
Date: November 9, 2015
|
|
TRINSEO S.A. |
|
|
|
By: |
/s/ Christopher D. Pappas |
|
|
Name: |
Christopher D. Pappas |
|
|
Title: |
President and Chief Executive Officer (Principal Executive Officer) |
|
|
By: |
/s/ John A. Feenan |
|
|
Name: |
John A. Feenan |
|
|
Title: |
Executive Vice President and Chief Financial Officer (Principal Financial Officer and Principal Accounting Officer) |
|
Exhibit No. |
Description |
|
|
|
3.1 |
Amended and Restated Articles of Association of Trinseo S.A. (incorporated herein by reference to Exhibit 3.1 to the 2014 Annual Report filed on Form 10-K, File No. 001-36473, filed March 10, 2015) |
||
|
|
|
||
|
4.1 |
Form of Specimen Share Certificate of Trinseo S.A. (incorporated herein by reference to Exhibit 4.1 to Amendment No. 3 to the Registration Statement filed on Form S-1, File No. 333-194561, filed May 16, 2014) |
||
|
|
|
||
|
4.2 |
Indenture among Trinseo Materials Operating S.C.A., Trinseo Materials Finance, Inc. and The Bank of New York Mellon, as Trustee, dated as of May 5, 2015 (incorporated herein by reference to Exhibit 4.1 to the Current Report filed on Form 8-K, File No. 001-36473, filed May 11, 2015) |
||
|
|
|
||
|
10.1 |
Credit Agreement, dated as of May 5, 2015, among Trinseo Materials Operating S.C.A., Trinseo Materials Finance, Inc. together with Trinseo Holdings S.à r.l., and Trinseo Materials S.à r.l. Deutsche Bank AG New York Branch, as administrative agent, collateral agent L/C issuer and swing line lender, Citigroup Global Markets Inc., as syndication agent, and the lenders from time to time party thereto (incorporated herein by reference to Exhibit 10.1 to the Current Report filed on Form 8-K, No. 001-36473, filed May 11, 2015) |
||
|
|
|
||
|
|
|
||
|
|
|
||
|
|
|
||
|
|
|
||
|
|
|
||
|
31.1† |
Certification of Chief Executive Officer Pursuant to Section 302 of the Sarbanes-Oxley Act of 2002 |
||
|
|
|
||
|
31.2† |
Certification of Chief Financial Officer Pursuant to Section 302 of the Sarbanes-Oxley Act of 2002 |
||
|
|
|
||
|
32.1†† |
Certification of Chief Executive Officer Pursuant to 18 U.S.C. Section 1350, as adopted pursuant to Section 906 of the Sarbanes-Oxley Act of 2002 |
||
|
|
|
||
|
32.2†† |
Certification of Chief Financial Officer Pursuant to 18 U.S.C. Section 1350, as adopted pursuant to Section 906 of the Sarbanes-Oxley Act of 2002 |
||
|
|
|
||
|
101* |
INS — XBRL Instance Document |
||
|
|
|
||
|
101* |
SCH — XBRL Taxonomy Extension Schema Document |
||
|
|
|
||
|
101* |
CAL — XBRL Taxonomy Extension Calculation Linkbase Document |
||
|
|
|
||
|
101* |
DEF — XBRL Taxonomy Extension Definition Linkbase Document |
||
|
|
|
||
|
101* |
LAB — XBRL Taxonomy Extension Label Linkbase Document |
||
|
|
|
||
|
101* |
PRE — XBRL Taxonomy Extension Presentation Linkbase Document |
||
† Filed herewith.
†† Furnished herewith.
* Pursuant to Regulation S-T, this interactive data file is deemed not filed or part of a registration statement or prospectus for purposes of Sections 11 or 12 of the Securities Act of 1933, is deemed not filed for purposes of Section 18 of the Securities Exchange Act of 1934, and otherwise is not subject to liability under these sections.