Attached files
| file | filename |
|---|---|
| 8-K - 8-K - Telenav, Inc. | tnav123120198-k.htm |
| EX-99.1 - EXHIBIT 99.1 - Telenav, Inc. | tnavex991fy20q2earning.htm |

February 6, 2020 Announcement Telenav Q2 FY20Earnings © 2019
carefullyandthe with understanding thatactualfuture results may be materiallydifferent from whatTelenav expect. forward availableatSEC’sthe website at elsewherein Formits 10 macroeconomic andpolitical conditions in U.S. the abroad,and in particularChina.Telenav discussesthese risks in greater reporting;the impact on revenuerecognition andotherreporting financial due toamendment the of contracts or changesin ac to realizedeferredits tax assetsandmay haveto takea reserveagainst them;Telenav’s reliance on automobileits manufact Telenav’stoability perform underinitiativesits Amazon with Microsoftand andbenefit from those initiatives;the potentia automotive customers, inventoryincluding procurementandfulfillment; possible warranty claims, impactandthe on consumer p participantswho may provide comparableto services subscriberswithout charge; timing theof new productreleases vehicland with customers for awards andcontracts on productsand inwhich services Telenavhas expended resources developing; competit expectations;Telenav’s toability acquire certification for automobile SPICEand othercontractual obligations with customer in capabilitiestheirvehicles such as Apple CarPlay, GAS andAndroid Auto; Telenav’scontinued reporting of losses andoper toability produce vehicles; reductionsin demand for automobiles;potential impacts of automobile manufacturersandone tier manufacturersandones tier for substantiala portion of revenue its impactandthe of labor stoppageson those automobile ma financialreporting disclosures,and as it includingmay relateto our recognition of adoption byvehicle purchasers of Scout GPS Link, ones, tierFord particularly andGM; Telenav’s abilityto achieve wins designtheadditionaldatesand delivery of automobile other markets;Telenav’s success inextending contractsits for currentnewand generation of products withexisting its auto regardingtheelimination of various sedansinNorth America over thenear term; impactthe of tariffs on sales of automobile theircustomers; the impact of GM’s recentannouncement regarding its partnership Google with Automotive Services Ford’sand undercustomer engagements, of information currentlyavailable tomanagement. its supplementalThis investor presentationcontains forward Forward Looking risks uncertainties.and potentialThese risks anduncertainties include,among others: - looking looking statementsrepresent management’s beliefs as only of and assumptions thedate made. You review should thecompan - K for the fiscal year endedJune30, 2019 and otherfilingsthe with U.S. Securities andExchange Commi Telenav’s www.sec.gov Statements abilityto developandimplement products for Ford, GM andToyota andto supportFord, GM andToyota and . uncertainties,youGiven these relianceplaceundue not on forward should these VIVID Actual eventsActual or results may differ materiallyfrom those describedin this andTelenav’s in - looking statementsthatare on Telenav based management’s beliefs a and - car commerce offerings; revenue; Telenav’s Telenav’s Telenav’s abilityto achievefuture revenue currently estimated dependenceon a limitednumber of automobile ability toability demonstrate internalcontrols over det l t l s i mob s; ati ure hatTelenav may not be able s i s ncluding Telenav’sncluding products; failure to reachagreement documentdue to ail in “Risk in “Risk Factors”ail and ngexpenses in excess of n Unitedthe States and s i nuf rsfor volume androyalty cou - e p ile manufacturersile and ssion (“SEC”), whichare ssion (“SEC”), looking statements. Also, rec ncludingcompetitive erc ion acturers’andtier ones’ roductionby Telenav’s ntingstandards; and entannouncement ssumptions andon eption of eptionof brand;its from othermarket y’s SEC filings a number © 2019

unreasonable effort.unreasonable provision reconciliations oftax (benefit). and share Accordingly, diluted per income/loss value as well of fair future asmarket the costs, stock forward presentation, investorIn this supplemental by its busi of cash (usedin) amount generatedthe about investorsand providesthat management usefulto information measure cash flow is Free a non as manner same in the results our operating evaluating and understanding forperiod provide a useful measure short to and develop annual budget our approve and prepare ofa profitability, is EBITDA loss. measure a measurewhile also Adjusted a key EBITDA, generally can representAdjusted disputes in which contingencies and settlements Legalconsultants. directors, and its to employees, granted awards incentive equity to relates a and mergerand contingencies and as such applicable legalother settlementsand itemsprovision fortaxes, (benefit)income Adjusted EBITDAGAAP measuresincome/loss net for adjusted discontinued impact of operations and excluding the stock with calculated in accordance revenuebillingsto limitations specific how relateand by providing they information regarding difficult. Ac companies more similar financial report making comparisons betweencompanies that measures,from peer different additional period content customers, for and, support certain customer provisioning monitoring, ashosting, ofsuch services brought certain billings to related example,For periods. service contracted overprovided GAAP. with have that n First, billings calculated accordance amounts ofin include billings userevenue the related to versus Telenav of componentsitsso results, operating company As fees the are earned. engineering customized solutions softwarewhereby customized costs costs primarily include deferred Such costs. deferred in related the similarhas a change provided the of presentation applicable the of p end the to beginning the fromrevenue in deferred plus change the Billingsrecognized GAAP equals revenue GAAP historical the to resultsnon To reconcile non to, alternative GAAPthese or and an with, accordance are helpful understanding in non believestheseaddition GAAP to financial management because results are differe cash flowinvestorfree in and this presentation included supplemental EBITDA,adjusted costs, deferred in change Telenav Use ofNon - considers billings to be a useful metric for management and investors because billings drive revenue and deferred revenue, wh revenue, deferredbillingsand revenue becauseinvestorsdriveand for billings a management be considersusefulto metric GAAP. or States, United the principles for accounting accepted with generally itsin financial accordance prepares statements looking looking non - based compensation and tax provision (benefit), which are components of these non these of components which provision aretax (benefit), and compensation based Telenav - GAAP financial measures to the corresponding GAAP measures due to the high variability variability high difficulty the and to GAAPmeasuresdue GAAP in corresponding mak financial the to measures - GAAP financial measure is a party or the indemnitor of a party. M&A transaction expenses relate primarily primarily suc associatedto with relatecoststransactions, expenses transaction of a M&A party. is party indemnitor the a or Telenav’s - to - - underlying operating results. These non Theseresults. operating underlying period period comparisons of Telenav Telenav’s GAAP Financial Measures Telenav - GAAP financial metrics, please refer to the reconciliations in the financial financial reconciliations GAAPin to the tab the financial please refermetrics, Telenav believes these metrics arebelieves usefulmetrics in theseevaluating cash flows. common stock, all of which is difficult to predict and subject to constant change. The actual willitemsactual amounts hav of these The change. all constant common stock, of to issubject and which difficult predict to has provided guidance for the third quarter of fiscal 2020 on a a non on of fiscal quarter 2020 third the for provided has guidance defines as net cash provided by (used in) operating activities, less purchases of property and equipment. and lesspurchases property of operating activities,(usedas by in) defines cash provided net - GAAP measures may not be comparable to information provided by c other by provided information GAAP to be comparable not measuresmay - Telenav’s and long and - term operational operational plans. term core business. Accordingly, Accordingly, core business. Telenav - GAAP measures help provide a consistent basisGAAP a provide consistenthelp forcompa measures - GAAP measures are some of measures GAAP primary the are some measures does. Telenav’s - in in solutions be fully recogniz cannot In particular, In particular, - GAAP financial measures. enters into enters forward Telenav - looking looking non believes that adjusted EBITDA generally may provide useful information to investors and in and may investorsprovide usefulto information others generally EBITDA adjusted that believes Telenav more hybrid and brought and hybrid more believes that the exclusion of the expenses we eliminate when calculating adjusted EBITDA can can calculating EBITDAadjusted eliminate when we expensesexclusion of the the that believes - - GAAP basis forbillings EBITDA.adjusted and GAAP financial measures to the corresponding GAAP measures are not available are not GAAP GAAPwithout corresponding measures financial to the measures Telenav - based compe ot ass les included presentation. les in investor included this supplemental In particular, particular, stockIn rep GA and nt nt yet been recognized as revenue or cost and may require additional costs be additional servicesor require to may costand or as revenue been recognized yet ed as revenue ed cqu itsassociated with costs developmentcertain and content party third with ociated eri AP. from those otherwise presented under GAAP. under presented those otherwisefrom resent settlements, offers made to settle, or loss accruals relating to litigation loss or or litigation settle,to other offers relating madeaccruals to settlements, resent uses to understand and evaluate our core operating performance and trends, to to trends, and performance operating our core evaluateand uses understand to associated technology costs. Second, we may may billings calculate is wethat in manner Second, a costs. associated technology cor nes isition, or M&A, transaction expenses, net of Stock tax. isition, net expenses,M&A, transaction or od. In connection with its presentation of the change in deferred revenue, in deferredchange of itsthe presentation with In connection od. Telenav’s ing accurate forecasts and projections with respect to deferred revenue, deferred revenue, to deferred respect with projections and forecasts accurate ing dingly, when dingly, s after purchases of property and equipment. and purchases property of s after T rison between periods that are not influenced by certain items and, therefore, and, itemscertain not by influenced are that periods rison between ompanies. he non he - ic nsation expense, depreciation and depreciation and income net, expense,(expense)nsation amortization, other in navigation programs, deferred revenue and deferred costs become larger become costs and deferredrevenue in deferrednavigation programs, h is an important indicator ofare indicator h isits business. an important There in in a given management uses for planning and forecasting. These measures are not arein not measures for usesand These planning forecasting. management - - GAAP revenue, financial asbillings, such in deferredchange measures based Telenav h compensation is impacted by future hiring and needs, hiring retention and future by is impacted compensation period due to requirements for ongoing map updates and and updates for map ongoing requirements to due period as the uses this measure, it attempts to compensate forthese compensate to it attempts this usesmeasure, inMarket Telenav Telenav Transaction and the Grab Transaction. Transaction. Transaction Grab the and considers free cash flow to be a liquidity cash a be liquidity flowto considers free does not of doesprovide reconciliations not these Telenav e a significant impact on a on impact significant has provided these measures in in measures provided has these - based compensation expense compensation based a number of a number Telenav’s limitations Telenav net © 2019

2 1 4 3 Key Messages Delivered another solid quarter & remained focused& remained on Deliveredexecuting quarter solid another strategyour connected car forgrowth sustainable andvalue - Please Please refer to the financial tables at the back of this presentation and Continued to execute to capitalize on our strategy connectedon the platform car$500B connected market car Approx. $129M cash positionfive represents Solid financial results ✓ ✓ ✓ ✓ ✓ ✓ ❑ ❑ ❑ Cash position and equity investments represents approx. equity represents investments and Cash position Equityinvestments Strategic relationship Strategic with relationship Growing at our share $8M $6 Closed Closed Grab Transaction &now Partnering with intheIn progress Solid ✓ ✓ 7 $1B in non M innon Invested in Synq3 to get access to thousands of restaurants & further build ICC our Invested ecosystem restaurants & Synq3 further in to get access of thousands to WonfirstIn in revenue,in up - GAAP adjustedEBITDA; GAAP also a - Motion AutoMotion GAAP backlogGAAP - Car Commerce (ICC) dealCommerce (ICC)with aJapaneseCar OEM made in multiple companies companies made multiple in I Q2 FY20 GM 34% - Car Commerce spaceCar &powering GM’s Ford Y/Y; Telenav’s on as the preferred as preferred the Nav. supplier insurance solutionsinsurance exploring similar opportunities withrideother exploring similaropportunities a five Investor Relations website for the latest filings SEC from existingfrom customer engagements - year high even - year highyear next generation five of of - year high year approximately after & equity $4Mrepurchases in share investments in the quarter 65% of TNAV’s of 65% Cap Market marquee marquee fornext gen.NA, Sync in $20M launch of theCadillac Escalade launchof - hailing companieshailingacrossthe world at end of quarter the of end at i ncluding highncludingvolumeline F150 flagship creation © 2019

Connected Car PlatformConnectedCar Strategy Building strategy ourflywheel Building via momentum focuslaser with three on Margin Expansion Higher with I Build, AcquirePartner& I Build, M R O F T A L P R A C D E T C E N N O C » » V A N E L E T Quality Service Big Data +BigAI Intelligence (LBI) Location Based pillars pillars to capitalize to capitalize a on +$500B TAM v v ©— 2019Proprietary and Confidential © 2019
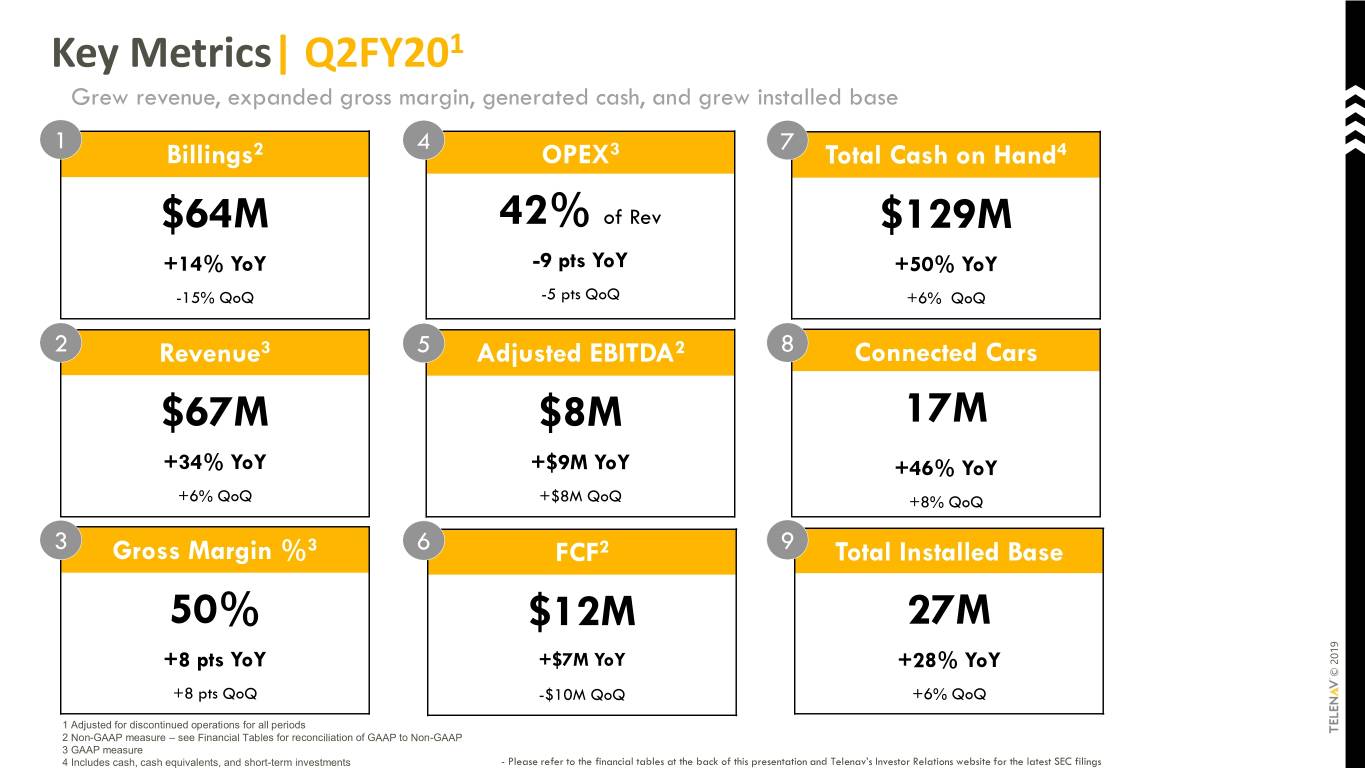
Key Metrics 3 2 1 4 Includes cash, cash equivalents, and short and cash, 4 Includes equivalents, cash 3 2 Non all periods for operations discontinued for 1 Adjusted GAAP GAAP measure Grew revenue, expanded gross generated margin, cash, and grew base installed - GAAP measure GAAP Gross Margin % Gross Margin Revenue $67M $64M +14% YoY +14% +8 pts YoY pts +8 YoY+34% Billings 50% – +8 +8 ptsQoQ - +6% QoQ see Financial Tables for reconciliation of GAAP to Non reconciliation for Tables Financial see 15%QoQ 2 3 - term investments term | Q2FY20 3 6 5 4 - GAAP 1 Adjusted EBITDAAdjusted 42% - Please Please refer to the financial tables at the back of this presentation and $12M +$9M YoY+$9M - $8M +$7M YoY - +$8M 9 pts YoY9 pts - OPEX $10M 5 FCF pts QoQ QoQ QoQ 2 of Rev of 3 2 9 8 7 TotalCash on Hand Telenav’s TotalInstalledBase ConnectedCars Investor Relations website for the latest filings SEC $ +46% YoY+46% YoY +50% +28% YoY+28% 17M 129 +6% 27M +8% +6% QoQ QoQ QoQ M 4 © 2019

Services $ Revenue Product $ Revenue Telenav Grew revenue both product and services Performance Overview Breakdown 1 Adjusted for discontinued operations for all periodsall for operations 1 discontinuedfor Adjusted GAAP areabove measuresAll $12.0 Revenue +34% y/y, +6% q/q +31% y/y, +2% q/q +54% y/y, +25% q/q 55.4 67.3 million million Total Company million Gross profit of 50% revenue,+7.6 pts y/y, +7.9 pts q/q $ Gross profit 52% of 52% revenue,+11.3 pts y/y, +11.4 pts q/q $ 39% of 39% revenue, $4.7 Gross profit 28.9 33.6 - 10.7 10.7 pts y/y, million million million - 10.0 pts 10.0 q/q - Please Please refer to the financial tables at the back of this presentation and Key Highlights Revenue Mix ➢ ➢ ➢ ➢ ➢ | FY20 Q2 Services the business 18% represented overall of Services revenue mix 10.7pts Y/Y revenue Y/Y; $12.0M 54% up of Services down39% GM% of 11.3pts Y/Y Product revenueY/Y; 31% $55.4M, up of 52% up GM% of 7.6pts Y/Y Total 34% revenueup Y/Y; $67.3M, of 50% up GM% of margins while expanding arecord revenueDelivered quarter gross 1 Services Telenav’s 18% Investor Relations website for the latest filings SEC 82% Product © 2019

Five Key Financial Metrics Q2 FY19 Q2 FY19 - $50.2 year revenue, high in significant with growth across reflected financial metrics all $85.9 Q1 FY20 Q1 FY20 $121.8 $63.6 Q2 FY20 Q2 FY20 $129.0 $67.3 Total Cash on Hand ($m) Revenue ($m) - investments term - - Telenav’s - Adjusted for discontinued operations periods for all operations for discontinued Adjusted refer to the latest 10Q for details for 10Q latestthe to refer - - - - Total Cash on Hand includes cash, cash equivalents, and and short equivalents, Cash cash on Hand Total cash, includes Non charts Both represent Please Please refer to the financial tables at the back of this presentation and Revenue Revenue Adjusted non isa Billings a GAAPis Revenue measure Investor Relations website for the latest filings SEC and Billings reflect adjustments made in made Q1 adjustments reflectand Billings for discontinued operations for all operations for discontinued | YoY, - GAAP measure - GAAP measures QoQ periods FY20; - Q2 FY19 Q2 FY19 $56.6 $5.2 Q1 FY20 Q1 FY20 $75.7 $21.7 Q2 FY20 Q2 FY20 $64.4 $11.7 Billings ($m) cash collection associated with Grab licensingGrab with associated collectioncash - Free Cash FlowFree ($m) Q1 FY20 benefits from from $ benefits FY20Q1 12.5M one - 8 time © 2019

Providesof sightline into sustainable revenue streams Backlog From Existing Customer Engagements Expect to convert Expect approx.into throughof backlogfrom FY23H2FY20 revenue 75% - - - - Management Management estimatesFebruary as of 6, 2020 Estimates do include not new programs customers,with existing new programs new with customers nor new products or business m Backlog are subject to several factors, and including number the to, but limited of not vehicles timing our customers ship wi figuresBacklog are Non - GAAP , and are based upon management estimates of future vehicle shipments Telenav with solutions for current contracted programs ~ $1B th th Telenav Telenav solutions, potential terminations or changes scope in of our customer relationships and several macro and micro econo ode ls such ICC or any as VIVID, aftermarket offerings bei ng ng delivered or contracted for future delivery to our customers ➢ ➢ ➢ ➢ ➢ such as auto insurance such Any new business models playaftermarket including offerings VIVID In existingwithin OEMs wallet share Increase in of pipeline the Any new OEMs that are in - Car Commerce Car Does Does not include mic factors © 2019

Q3 FY20Outlook © 2019
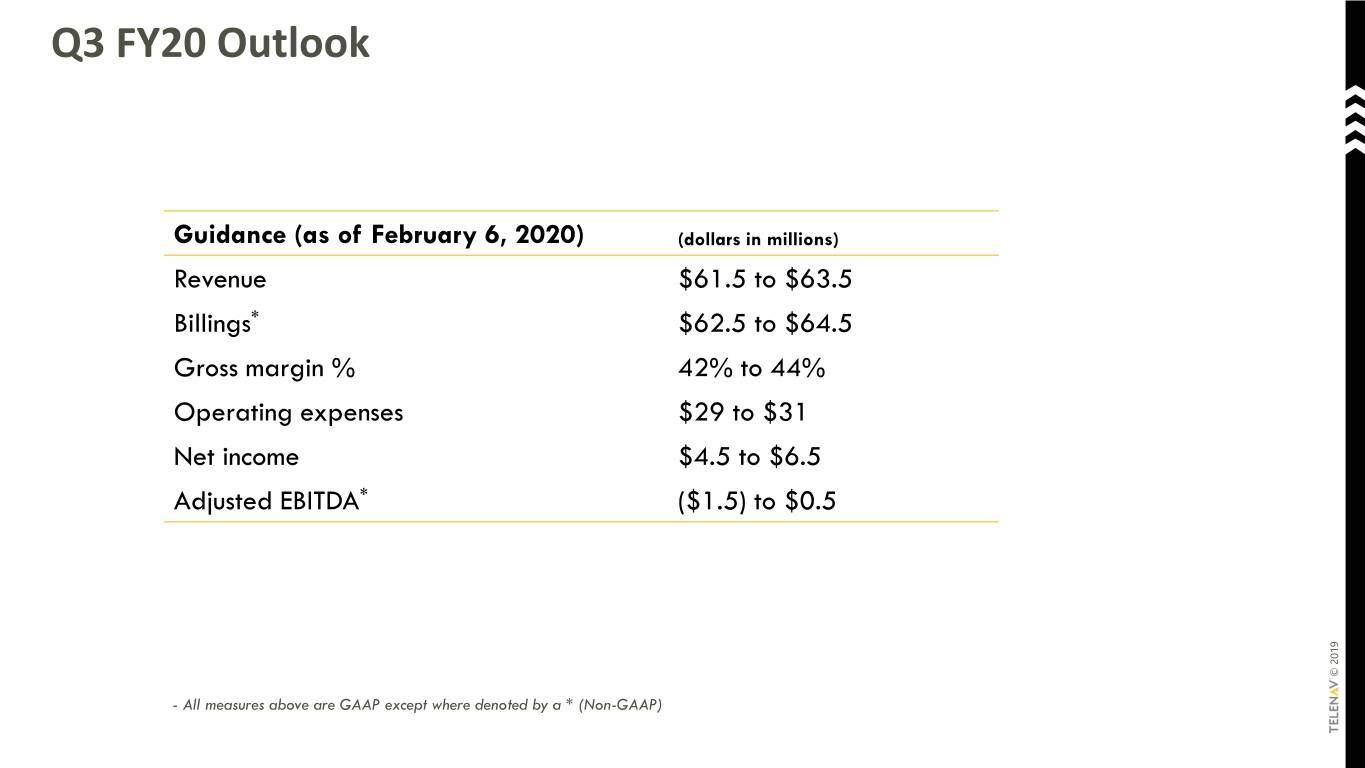
Q3 FY20Outlook - Adjusted Adjusted EBITDA Net income Operating expenses Gross margin % Billings Revenue 6,2020) February Guidance (as of All measures measures All above are GAAPexcept denoted by where a * (Non * * - GAAP) ($ $4.5 $29 to $31 42% to 44% $ $ (dollars in millions) 62.5 61.5 1.5) to to to $ to $ $6.5 $0.5 64.5 63.5 © 2019

Financial Financial Tables © 2019

Assets Current assets: Property andProperty equipment, net Operating lease right-of-use assets Operating right-of-use lease Deferred income taxes, income non-current Deferred Goodwill and intangible net assets, Deferred costs, non-current costs, Deferred Other Other assets Assets of discontinuednon-current of operations, Assets Cash and cash equivalents Short-term investmentsShort-term Accounts receivable, net of allowances of $7 and $7 at December 31, 2019 Accountsand receivable, andallowances net of $7 2019 Juneof 31, at 30, December $7 2019, respectively 2019, Restricted cash Restricted Deferred costs Deferred Prepaid andexpenses assets current other Assets of discontinuednon-current of operations, Assets Total assets current Total assets $ $ $ $ December 31, December 2019 102,603 211,281 311,842 26,347 44,463 33,117 15,265 48,646 21,285 1,520 3,231 5,215 8,749 1,401 - - $ $ $ $ June 30, Condensed Consolidated Balance Sheets Balance Condensed Consolidated 2019 (in thousands,(in par except value) 200,075 297,015 27,275 72,203 69,781 18,752 15,701 61,050 12,194 1,950 3,784 6,330 5,583 1,414 998 - Telenav, Inc. (unaudited) Liabilities and stockholders’ equity and stockholders’ Liabilities Current liabilities: Deferred rent, non-current Deferred Operating lease liabilities, Operatingnon-current liabilities, lease Deferred revenue,Deferred non-current Other long-term liabilities Other long-term Liabilities of discontinuednon-current of operations, Liabilities Commitments andCommitments contingencies Stockholders’ Stockholders’ equity: Trade accounts payable Accrued expenses Operating liabilities lease Deferred revenueDeferred Income taxes payable Liabilities of discontinued of operations Liabilities Preferred stock, $0.001 par value:authorized;shares $0.001 stock, outstanding 50,000 no or issued shares Preferred Common stock, $0.001 par authorized; shares andshares value:Common $0.001 stock, 48,151 46,911 600,000 issued andissued andoutstanding respectively 2019 June31, at2019, 30, December Additional paid-in capital Accumulated comprehensive loss other Accumulated deficit Total equity stockholders’ Total liabilities current Total liabilities Totaland liabilities equity stockholders’ $ $ $ $ December 31, December 2019 114,011 190,593 311,842 (92,164) 57,856 50,582 93,755 96,939 (1,538) 1,113 3,532 6,459 928 678 - - - - 48 $ $ $ $ June 30, 2019 100,403 103,865 182,349 297,015 (90,279) 16,061 48,899 31,270 90,640 (1,477) 3,373 1,266 800 811 - - - - 30 47 © 2019
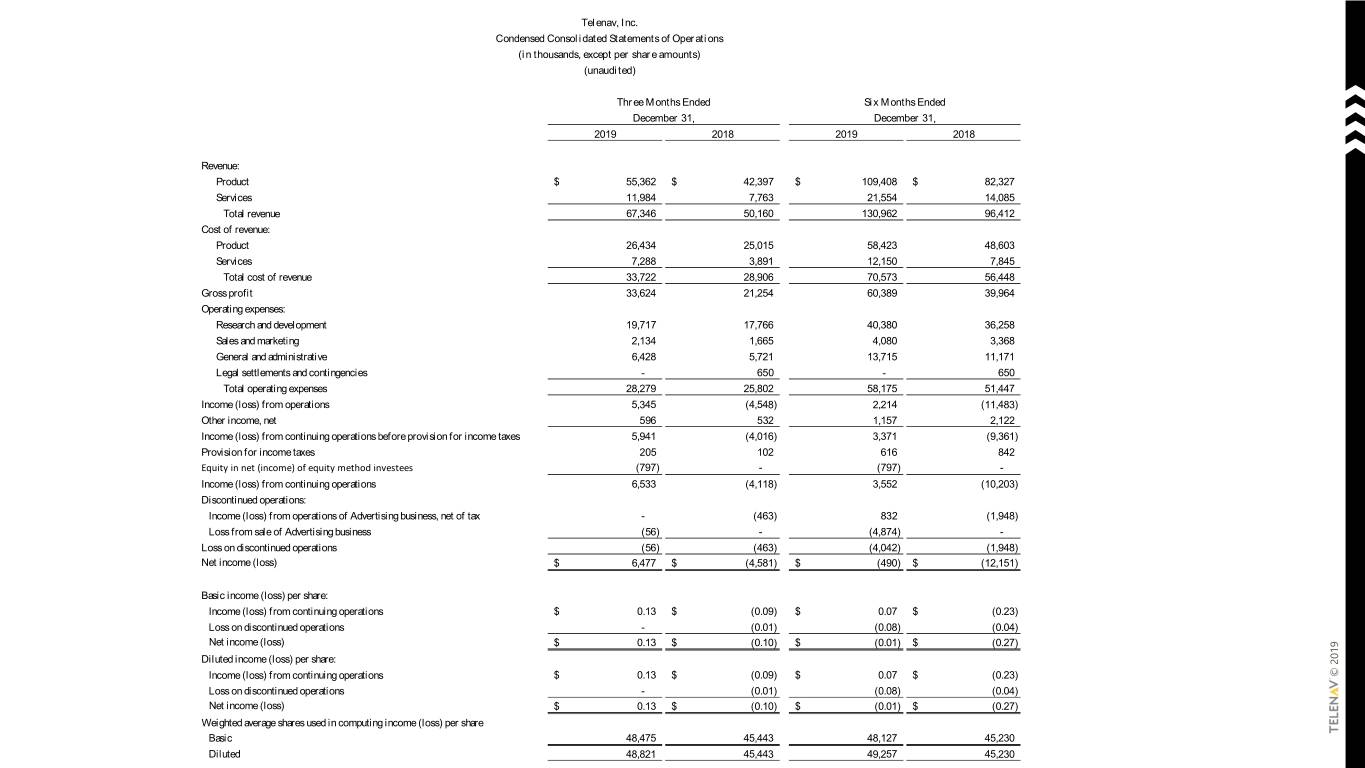
Revenue: Cost of revenue: of Cost Gross profit Gross Operating expenses: Income (loss) from operations from Income (loss) Other income, net Other income, Income (loss) from continuing operations before provision for income taxes income provision for continuingbefore from operations Income (loss) Provision for income taxes income for Provision Equity in net (income) of equity method investees method (income)net ofequity in Equity Income (loss) from continuing from operations Income (loss) Discontinued Discontinued operations: Loss on discontinued operations Loss Net income (loss) income Net Basic income (loss) per share: per (loss) Basic income Diluted income (loss) per share: per (loss) Diluted income Weighted average shareper used shares in computing (loss) income Income (loss) from operations of Advertising of operations from tax business, net of Income (loss) Loss from sale of Advertising of sale from Loss business Income (loss) from continuing from operations Income (loss) Loss on discontinued operations Loss Net income (loss) income Net Income (loss) from continuing from operations Income (loss) Loss on discontinued operations Loss Net income (loss) income Net Basic Diluted Product Services Product Services Research andResearch development Sales Sales and marketing General General and administrative Legal settlements andLegal contingencies settlements Total revenue Total cost of revenue of Total cost Total operating expenses Condensed Consolidated Statements of Statements Operations Condensed Consolidated (in thousands, amounts)share per (in except $ $ $ $ $ $ $ $ $ $ $ $ Telenav, Inc. (unaudited) 2019 Three Months Ended 55,362 11,984 67,346 26,434 33,722 33,624 19,717 28,279 48,475 48,821 7,288 2,134 6,428 5,345 5,941 6,533 6,477 December 31, December (797) 0.13 0.13 0.13 0.13 596 205 - - (56) (56) - - $ $ $ $ $ $ $ $ $ $ $ $ 2018 42,397 50,160 25,015 28,906 21,254 17,766 25,802 45,443 45,443 (4,548) (4,016) (4,118) (4,581) 7,763 3,891 1,665 5,721 (0.09) (0.01) (0.10) (0.09) (0.01) (0.10) (463) (463) 650 532 102 - - $ $ $ $ $ $ $ $ $ $ $ $ 2019 109,408 130,962 Six Months EndedSix 21,554 58,423 12,150 70,573 60,389 40,380 13,715 58,175 48,127 49,257 (4,874) (4,042) 4,080 2,214 1,157 3,371 3,552 December 31, December (0.08) (0.01) (0.08) (0.01) (797) (490) 0.07 0.07 616 832 - $ $ $ $ $ $ $ $ $ $ $ $ 2018 (11,483) (10,203) (12,151) 82,327 14,085 96,412 48,603 56,448 39,964 36,258 11,171 51,447 45,230 45,230 (9,361) (1,948) (1,948) 7,845 3,368 2,122 (0.23) (0.04) (0.27) (0.23) (0.04) (0.27) 650 842 - - © 2019

Operating activities Operating Net loss Net Loss on discontinued operations Loss Income (loss) from continuing from operations Income (loss) Adjustments to reconcile net loss to net cash to provided net loss byAdjustments operating reconcile activities: to Stock-based compensation Stock-based expensecompensation Depreciation andDepreciation amortization Operating accretion amortization net of lease Accretion of net premium on short-term investments net premium of on short-term Accretion Unrealized gain on non-marketable equity investments Equity equity of inmethod investeenet income Other Changes inand operating assets liabilities: Accounts receivable Deferred income taxes income Deferred Deferred costs Deferred Prepaid expenses and Prepaid expenses assets current other Other Other assets Trade payableaccounts Accrued and expenses liabilities other Income taxes payable Deferred rent Deferred Operating liabilities lease Deferred revenueDeferred Net cashNet provided by operating activities $ $ 2019 (15,054) Six Months EndedSix 25,835 34,513 (1,961) (1,754) 4,042 3,552 3,230 1,856 1,321 1,710 7,619 9,202 December 31, December (490) (797) (409) 130 (62) - 75 21 (1) $ $ Condensed Consolidated Statements of Statements Cash Flows Condensed Consolidated 2018 (12,151) (10,203) 13,234 (1,259) (7,040) (9,575) 1,948 3,923 2,016 3,390 9,812 4,959 (116) 445 216 - - - (14) - 39 91 (in thousands) (in Telenav, Inc. (unaudited) Investing activities Investing Financing activities Financing Supplemental disclosure of cash flow information of cash flow disclosure Supplemental Reconciliation of cash, cash equivalents and restricted cash to the condensed condensed the cash to ofand cash, cash equivalents restricted Reconciliation consolidated balance sheets consolidated Purchases of property andproperty of Purchases equipment Purchases of short-term investments short-term of Purchases Purchases of long-term investments long-term of Purchases Proceeds from sales and maturities of short-term investments and short-term sales of from maturities Proceeds Proceeds from exercise of stock options stock of exercise from Proceeds Tax withholdings related to net share settlements of restricted stock units stock Tax restricted of withholdings net share settlements to related Repurchase of common stock Repurchasecommon of Effect of exchange of changesrate Effect on cash, cash equivalents cash and restricted Net increase in cash, increase Net cash equivalents cash, andcontinuing operations restricted Net cashNet used in discontinued operations Cash, cash equivalents cash, andbeginning restricted period of Cash, cash equivalents cash, andend period of restricted Income taxes paid, net Non-cash investing: Investment in LLC acquired in Advertisingexchange of sale for business Cash discontinued flowoperations: from Cash and cash equivalents Restricted cash Restricted Total cash, cash equivalents cash and restricted Net cashNet used in operating activities Net cashNet used in financing activities Net cash transferred from continuing from operations cashNet transferred Net changeNet in cash and cash equivalent discontinued operation from Cash and cash equivalent beginning discontinued operations, of period of Cash and cash equivalent end period discontinued operations, of of Net cashNet provided by (used in) investing activities Net cashNet provided by (used in) financing activities $ $ $ $ $ $ $ $ $ $ $ $ $ $ 2019 (54,439) (34,950) Six Months EndedSix 24,067 29,225 27,867 15,600 26,347 27,867 (1,078) (3,500) (1,148) (4,019) (3,975) (3,569) 8,306 3,139 2,617 1,279 3,975 1,520 December 31, December (406) (85) - - - $ $ $ $ $ $ $ $ $ $ $ $ $ $ 2018 (15,862) 20,342 20,099 24,881 22,405 24,881 (1,559) (1,533) (2,319) (2,319) 4,035 7,101 2,319 2,476 (445) (360) 586 - - - - - - - 26 © 2019
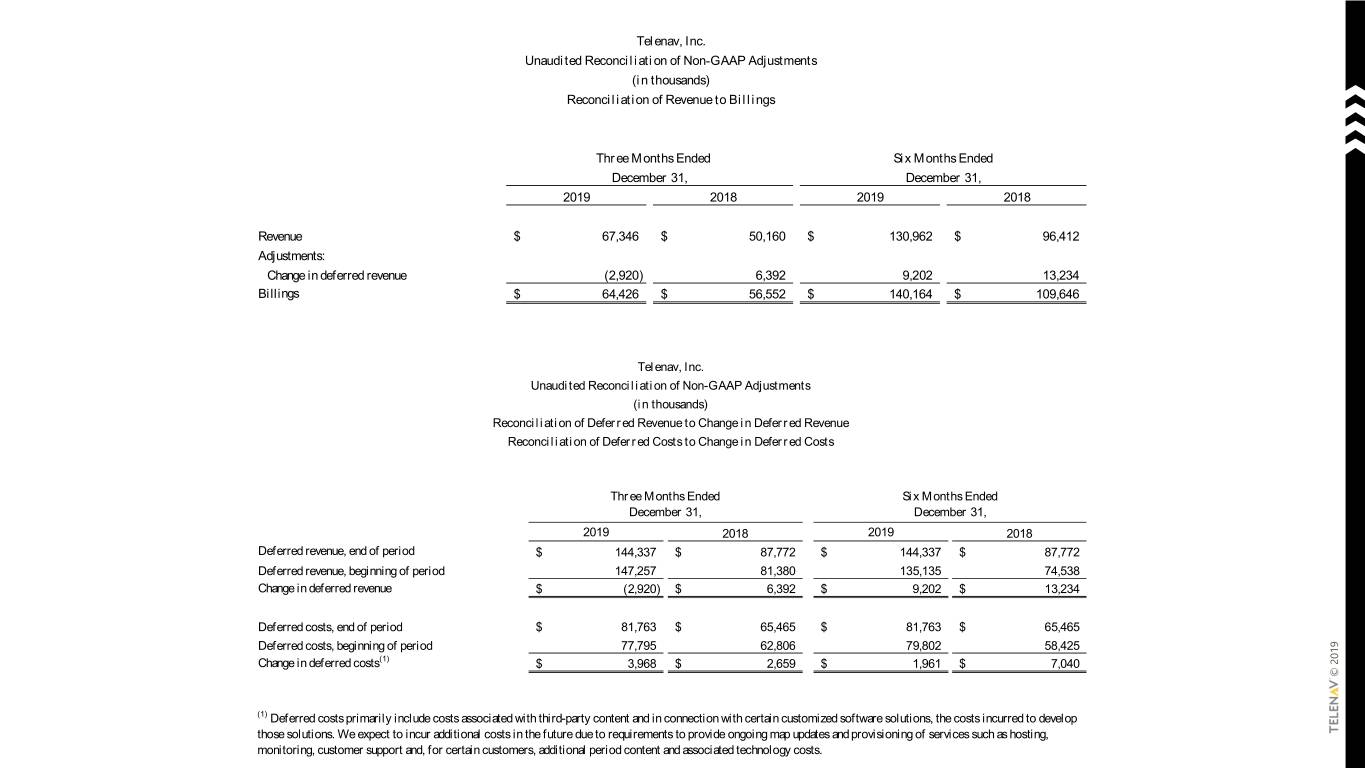
(1) those solutions. We expect to incur inadditional to provideexpect We the to future due solutions. requirements costs ongoingto those map updates and provisioning such asservices hosting,of monitoring, customer support additionaland,monitoring, customer and customers, content certain period for technology costs. associated Deferred revenue,Deferred end period of Deferred revenue,Deferred beginning period of Change revenue in deferred Deferred costs, end period of costs, Deferred Deferred costs, beginning costs, period Deferred of Change costs in deferred Revenue Adjustments: Billings Change revenue in deferred Deferred costs primarily include costs associated with associated primarily includethird-party costs costs and content develop incurred Deferred to with in the connection costs customized software solutions, certain (1) Reconciliation ofRevenue ChangeDeferred Revenue to Deferred in Reconciliation Reconciliation of Deferred Costs to Change Costs to Deferred in ofCosts Deferred Reconciliation $ $ $ $ Unaudited Reconciliation of Non-GAAP Adjustments Unaudited Reconciliation Unaudited Reconciliation of Non-GAAP Adjustments Unaudited Reconciliation $ $ $ $ $ $ $ $ 2019 Reconciliation of Revenue Billings to Reconciliation 2019 Three Months Ended 67,346 64,426 (2,920) Three Months Ended December 31, December 144,337 147,257 81,763 77,795 (2,920) 3,968 December 31, December (in thousands)(in (in thousands)(in Telenav, Inc. Telenav, Inc. $ $ $ $ $ $ $ $ $ $ $ $ 2018 2018 50,160 56,552 6,392 87,772 81,380 65,465 62,806 6,392 2,659 $ $ $ $ $ $ $ $ $ $ $ $ 2019 2019 130,962 140,164 Six Six Months Ended 144,337 135,135 Six Six Months Ended 9,202 December 31, December 81,763 79,802 9,202 1,961 December 31, December $ $ $ $ $ $ $ $ $ $ $ $ 2018 2018 109,646 96,412 13,234 87,772 74,538 13,234 65,465 58,425 7,040 © 2019

Net income (loss) income Net Loss on discontinuedLoss operations Income (loss) from continuing from operations Income (loss) Adjustments: Legal settlement andLegal settlement contingencies Adjusted EBITDA Stock-based compensation expense Depreciation andDepreciation amortization expense Other income, netOther income, Provision for income taxes income for Provision Equity equity inof net methodincome investees Reconciliation of Net Income (Loss) to Adjusted to of Income Net (Loss) EBITDA Reconciliation Unaudited Reconciliation of Non-GAAP Adjustments Unaudited Reconciliation $ $ $ $ 2019 Three Months Ended 6,477 6,533 1,478 7,757 December 31, December (596) (797) 934 205 (in thousands)(in - Telenav, Inc. 56 $ $ $ $ 2018 (4,581) (4,118) (1,017) 1,875 1,006 (532) 463 650 102 - $ $ $ $ 2019 Six Six Months Ended (1,157) 4,042 3,552 3,230 1,856 7,300 December 31, December (490) (797) 616 - $ $ $ $ 2018 (12,151) (10,203) (2,122) (4,894) 1,948 3,923 2,016 650 842 - © 2019
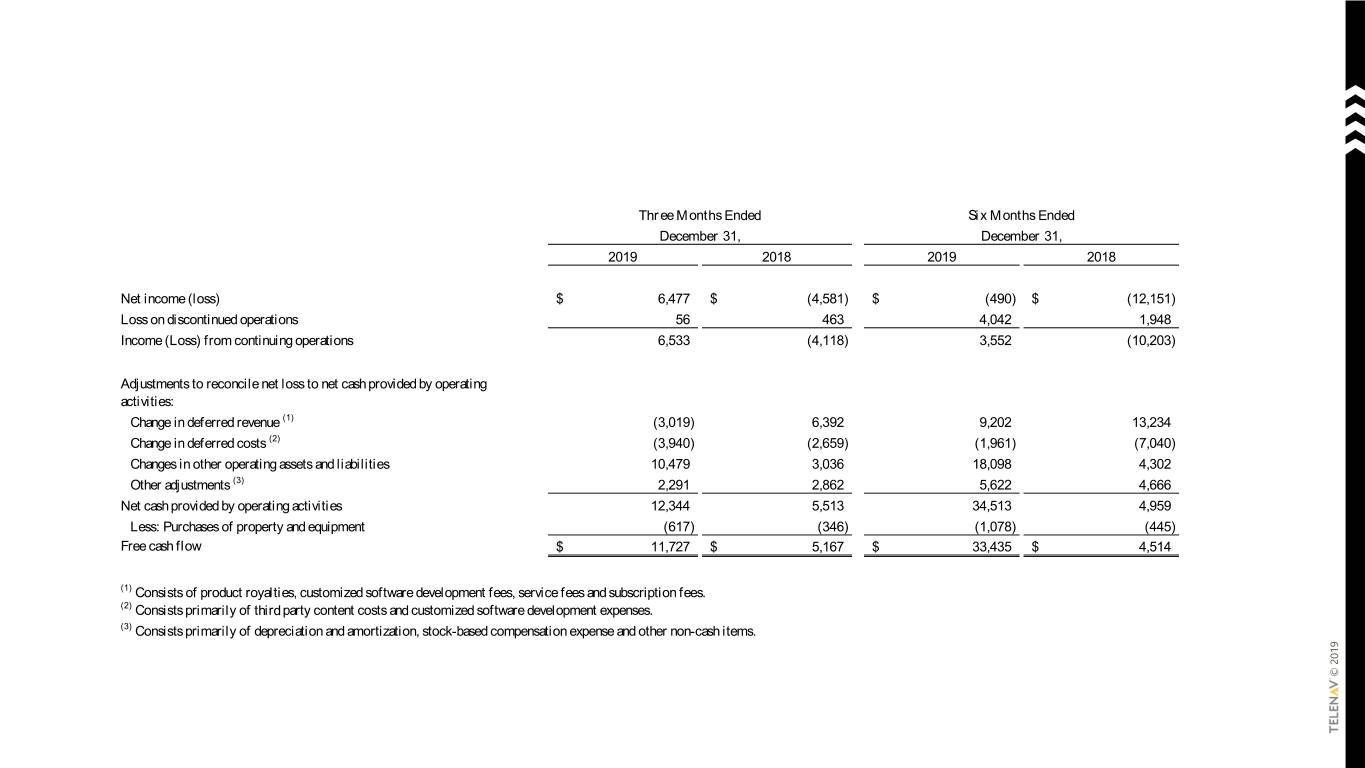
Net income (loss) income Net Loss on discontinuedLoss operations Income (Loss) from continuing from Incomeoperations (Loss) Adjustments to reconcile net loss to net cash to provided net loss Adjustmentsby reconcile operatingto activities: Net cashNet provided by operating activities Free cash Free flow (1) (2) (3) Change revenue in deferred Change costs in deferred Changes andoperatingin other assets liabilities Other Other adjustments Less: Purchases of property and of Purchases Less: equipment Consists of product royalties, customized software development fees, service fees and customized software developmentfees product service fees. royalties, of subscription fees, Consists Consists primarily andthird of partyConsists costs customized software developmentcontent expenses. Consists primarily of depreciation andprimarily depreciation of Consists amortization, compensation expense stock-based and non-cash other items. (3) (2) (1) $ $ $ $ 2019 Three Months Ended 10,479 12,344 11,727 (3,019) (3,940) 6,477 6,533 2,291 December 31, December (617) 56 $ $ $ $ 2018 (4,581) (4,118) (2,659) 6,392 3,036 2,862 5,513 5,167 (346) 463 $ $ $ $ 2019 Six Six Months Ended 18,098 34,513 33,435 (1,961) (1,078) 4,042 3,552 9,202 5,622 December 31, December (490) $ $ $ $ 2018 (12,151) (10,203) 13,234 (7,040) 1,948 4,302 4,666 4,959 4,514 (445) © 2019
